QUARTERLY REPORT PURSUANT TO SECTION 13 OR 15(d) OF THE SECURITIES EXCHANGE ACT OF 1934.
For the quarterly period ended March 31, 2026
or
☐
TRANSITION REPORT PURSUANT TO SECTION 13 OR 15(d) OF THE SECURITIES EXCHANGE ACT OF 1934.
For the transition period from to
Commission File Number: 001-34139
Federal Home Loan Mortgage Corporation
(Exact name of registrant as specified in its charter)
Federally chartered
52-0904874
8200 Jones Branch Drive
22102-3110
(703)
903-2003
corporation
McLean,
Virginia
(State or other jurisdiction of incorporation or organization)
(I.R.S. Employer
Identification No.)
(Address of principal executive offices)
(Zip Code)
(Registrant's telephone number, including area code)
Securities registered pursuant to Section 12(b) of the Act:
Title of each class
Trading Symbol(s)
Name of each exchange on which registered
None
N/A
N/A
Indicate by check mark whether the registrant: (1) has filed all reports required to be filed by Section 13 or 15(d) of the Securities Exchange Act of 1934 during the preceding 12 months (or for such shorter period that the registrant was required to file such reports), and (2) has been subject to such filing requirements for the past 90 days. ☒Yes☐No
Indicate by check mark whether the registrant has submitted electronically every Interactive Data File required to be submitted pursuant to Rule 405 of Regulation S-T (§232.405 of this chapter) during the preceding 12 months (or for such shorter period that the registrant was required to submit such files).☒Yes☐No
Indicate by check mark whether the registrant is a large accelerated filer, an accelerated filer, a non-accelerated filer, a smaller reporting company, or an emerging growth company. See the definitions of "large accelerated filer," "accelerated filer," "smaller reporting company," and "emerging growth company" in Rule 12b-2 of the Exchange Act.
Large accelerated filer
☒
Accelerated filer
☐
Non-accelerated filer
☐
Smaller reporting company
☐
Emerging growth company
☐
If an emerging growth company, indicate by check mark if the registrant has elected not to use the extended transition period for complying with any new or revised financial accounting standards provided pursuant to Section 13(a) of the Exchange Act.☐
Indicate by check mark whether the registrant is a shell company (as defined in Rule 12b-2 of the Exchange Act). Yes☐ No☒
As of April 7, 2026, there were 650,059,553 shares of the registrant's common stock outstanding.
Table of Contents
Table of Contents
Page
MANAGEMENT'S DISCUSSION AND ANALYSIS OF FINANCIAL CONDITION AND RESULTS OF OPERATIONS
Management's Discussion and Analysis of Financial Condition and Results of Operations
This Quarterly Report on Form 10-Q includes forward-looking statements that are based on current expectations and that are subject to significant risks and uncertainties. These forward-looking statements are made as of the date of this Form 10-Q. We undertake no obligation to update any forward-looking statement to reflect events or circumstances after the date of this Form 10-Q. Actual results might differ significantly from those described in or implied by such statements due to various factors and uncertainties, including those described in the MD&A - Forward-Looking Statements section of this Form 10-Q and the Introduction and Risk Factors sections of our Annual Report on Form 10-K for the year ended December 31, 2025, or 2025 Annual Report.
Throughout this Form 10-Q, we use certain acronyms and terms that are defined in the Glossary of our 2025 Annual Report.
You should read the following MD&A in conjunction with our 2025 Annual Report and our condensed consolidated financial statements and accompanying notes for the three months ended March 31, 2026 included in Financial Statements.
INTRODUCTION
Freddie Mac is a GSE chartered by Congress in 1970, with a mission to provide liquidity, stability, and affordability to the U.S. housing market. We do this primarily by purchasing single-family and multifamily residential mortgage loans originated by lenders. In most instances, we package these loans into guaranteed mortgage-related securities, which are sold in the global capital markets, and transfer interest-rate and liquidity risks to third-party investors. In addition, we transfer a portion of our mortgage credit risk exposure to third-party investors through our credit risk transfer programs, which include securities- and insurance-based offerings. We also invest in mortgage loans, mortgage-related securities, and other types of assets. We do not originate mortgage loans or lend money directly to mortgage borrowers.
We support the U.S. housing market and the overall economy by enabling America's families to access mortgage loan funding with better terms and by providing consistent liquidity to the single-family and multifamily mortgage markets. We have helped many distressed borrowers keep their homes or avoid foreclosure and have helped many distressed renters avoid eviction.
Since September 2008, we have been operating in conservatorship, with FHFA as our Conservator. The conservatorship and related matters significantly affect our management, business activities, financial condition, and results of operations. Our future is uncertain, and the conservatorship has no specified termination date. We do not know what changes may occur to our business model during or following conservatorship, including whether we will continue to exist. In connection with our entry into conservatorship, we entered into the Purchase Agreement with Treasury under which we issued Treasury both senior preferred stock and a warrant to purchase common stock. The Purchase Agreement with Treasury is critical to keeping us solvent and avoiding the appointment of a receiver by FHFA under statutory mandatory receivership provisions. We believe the support provided by Treasury pursuant to the Purchase Agreement currently enables us to have adequate liquidity to conduct normal business activities. For additional information on the conservatorship and related matters and the Purchase Agreement, see our 2025 Annual Report.
Freddie Mac 1Q 2026 Form 10-Q
1
Management's Discussion and Analysis
Introduction
Business Results
Consolidated Financial Results
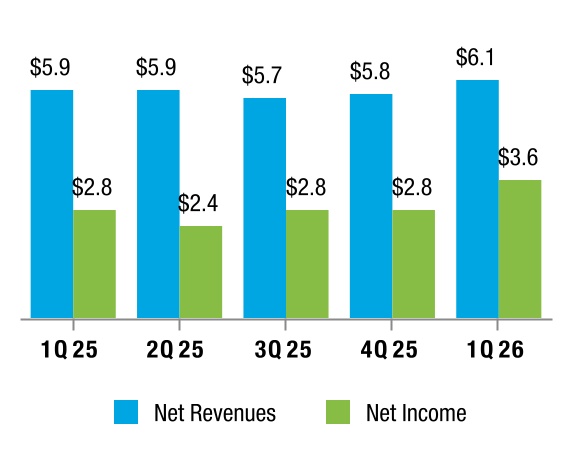
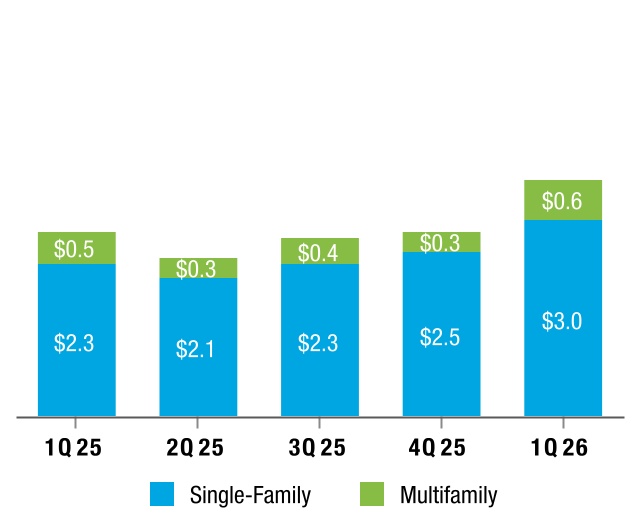
Net Revenues and Net Income
(In billions)
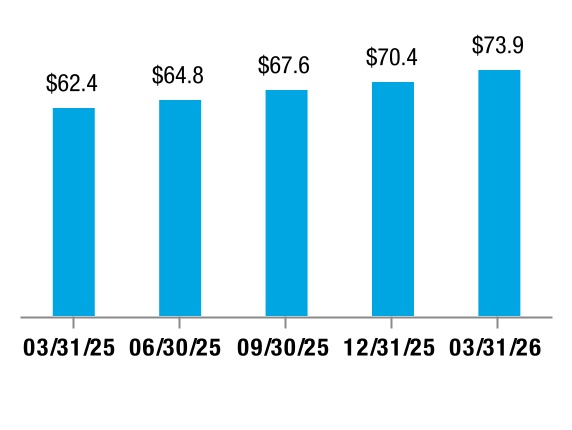
Net Worth
(In billions)
Key Drivers:
nNet income was $3.6 billion, up 27% from 1Q 2025, primarily driven by higher net revenues and a credit reserve release in 1Q 2026 compared to a credit reserve build in 1Q 2025.
nNet revenues were $6.1 billion, an increase of 5% year-over-year, primarily driven by higher net interest income, partially offset by lower non-interest income.
nNet worth was $73.9 billion as of March 31, 2026, up from $62.4 billion as of March 31, 2025. The quarterly increases in net worth have been, or will be, added to the aggregate liquidation preference of the senior preferred stock. The liquidation preference of the senior preferred stock was $143.0 billion on March 31, 2026, and will increase to $146.6 billion on June 30, 2026 based on the increase in net worth in 1Q 2026.
Market Liquidity
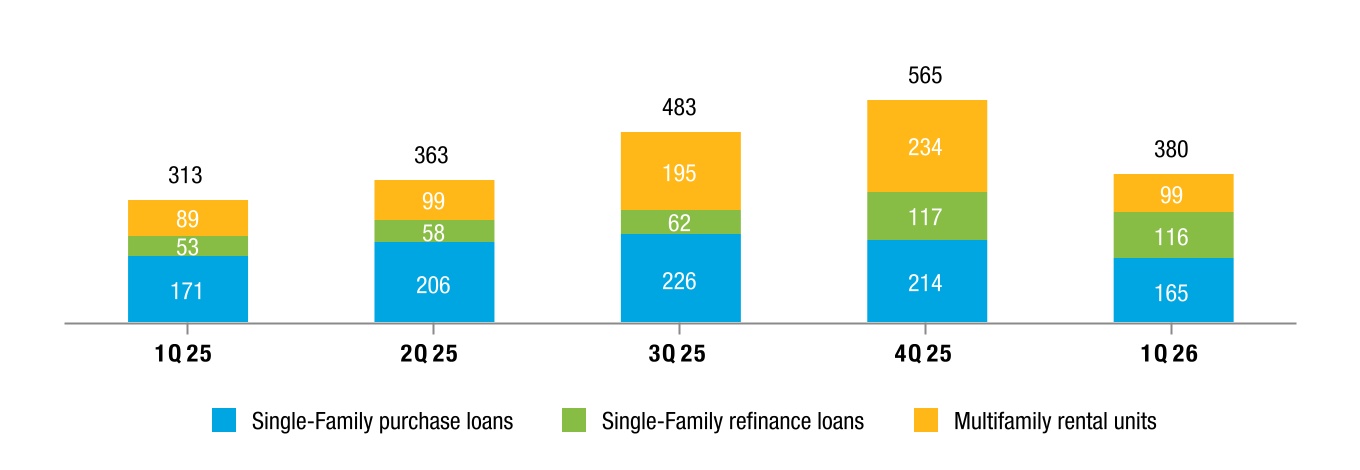
Market Liquidity
(In thousands)
We support the U.S. housing market by executing our mission to provide liquidity and help maintain credit availability for new and refinanced single-family mortgages as well as for rental housing. We provided $116 billion in liquidity to the mortgage market in 1Q 2026, which enabled the financing of 380,000 home purchases, refinancings, and rental units.
Freddie Mac 1Q 2026 Form 10-Q
2
Management's Discussion and Analysis
Introduction
Mortgage Portfolio Balances
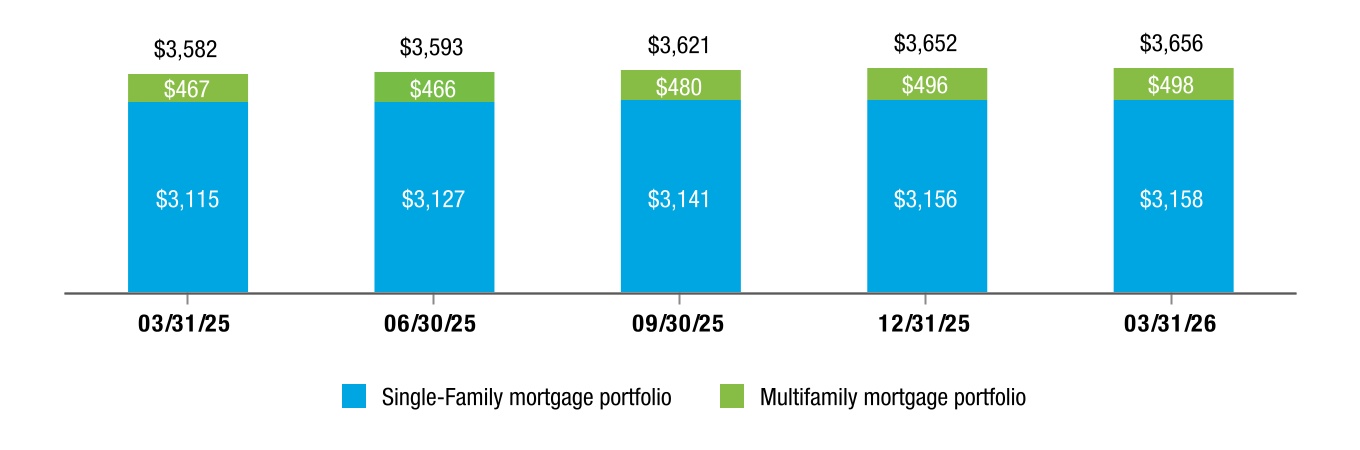
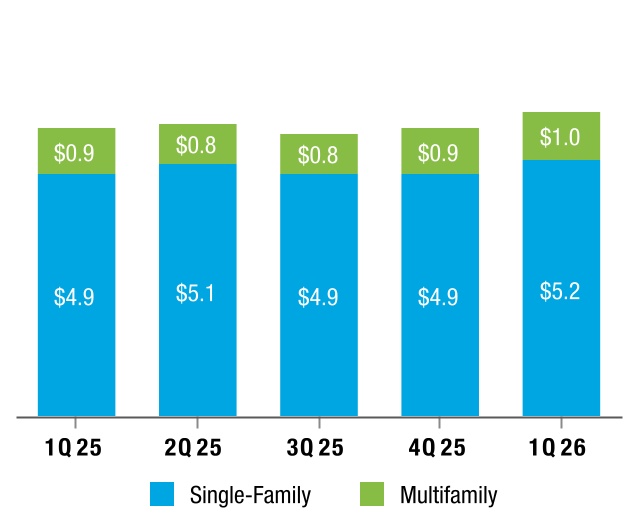
Mortgage Portfolio
(UPB in billions)
Key Drivers:
nOur mortgage portfolio increased 2% year-over-year to $3.7 trillion at March 31, 2026, continuing to grow at a moderate pace.
lOur Single-Family mortgage portfolio was $3.2 trillion at March 31, 2026, up 1% year-over-year.
lOur Multifamily mortgage portfolio was $498 billion at March 31, 2026, up 7% year-over-year.
Freddie Mac 1Q 2026 Form 10-Q
3
Management's Discussion and Analysis
Consolidated Results of Operations
CONSOLIDATED RESULTS OF OPERATIONS
The discussion of our consolidated results of operations should be read in conjunction with our condensed consolidated financial statements and accompanying notes.
The table below compares our summarized consolidated results of operations.
Table 1 - Summary of Consolidated Statements of Income and Comprehensive Income
Change
(Dollars in millions)
1Q 2026
1Q 2025
$
%
Net interest income
$5,619
$5,102
$517
10
%
Non-interest income
514
750
(236)
(31)
Net revenues
6,133
5,852
281
5
(Provision) benefit for credit losses
320
(280)
600
NM
Non-interest expense
(2,022)
(2,088)
66
3
Income before income tax expense
4,431
3,484
947
27
Income tax expense
(873)
(690)
(183)
(27)
Net income
3,558
2,794
764
27
Other comprehensive income (loss), net of taxes and reclassification adjustments
(20)
34
(54)
NM
Comprehensive income
$3,538
$2,828
$710
25
%
Net Revenues
Net Interest Income
The table below presents the components of net interest income.
Table 2 - Components of Net Interest Income
Change
(Dollars in millions)
1Q 2026
1Q 2025
$
%
Guarantee net interest income:
Contractual net interest income
$4,142
$3,981
$161
4
%
Deferred fee income
219
190
29
15
Total guarantee net interest income
4,361
4,171
190
5
Investments net interest income
1,357
1,297
60
5
Impact on net interest income from hedge accounting
(99)
(366)
267
73
Net interest income
$5,619
$5,102
$517
10
%
Key Drivers:
nGuarantee net interest income
l1Q 2026 vs. 1Q 2025 - Increased primarily due to an increase in the balance of fully guaranteed securitizations in the Multifamily mortgage portfolio due to the change in our Multifamily business strategy and continued mortgage portfolio growth in Single-Family.
nInvestments net interest income
l1Q 2026 vs. 1Q 2025 - Increased primarily due to growth in the mortgage-related investments portfolio.
nImpact on net interest income from hedge accounting
l1Q 2026 vs. 1Q 2025 - Decreased due to lower expense related to debt in hedge accounting relationships.
Freddie Mac 1Q 2026 Form 10-Q
4
Management's Discussion and Analysis
Consolidated Results of Operations
Net Interest Yield Analysis
The table below presents a yield analysis of interest-earning assets and interest-bearing liabilities.
Table 3 - Analysis of Net Interest Yield
1Q 2026
1Q 2025
(Dollars in millions)
Average
Balance
Interest
Income
(Expense)
Average
Rate
Average
Balance
Interest
Income
(Expense)
Average
Rate
Interest-earning assets:
Cash and cash equivalents
$8,363
$52
2.51
%
$9,355
$79
3.38
%
Securities purchased under agreements to resell
84,924
798
3.76
111,687
1,240
4.44
Investment securities
76,752
833
4.34
55,955
620
4.43
Mortgage loans held by consolidated trusts(1)
3,216,438
30,966
3.85
3,129,811
28,591
3.65
Mortgage loans held by Freddie Mac(1)
86,808
966
4.45
70,429
804
4.57
Other assets
3,100
35
4.48
2,055
31
5.98
Total interest-earning assets
3,476,385
33,650
3.87
3,379,292
31,365
3.71
Interest-bearing liabilities:
Debt issued by consolidated trusts
3,189,597
(26,001)
(3.26)
3,125,203
(24,059)
(3.08)
Short-term debt
30,089
(275)
(3.66)
14,822
(161)
(4.36)
Long-term debt
169,973
(1,702)
(4.00)
170,573
(2,000)
(4.69)
Securities sold under agreements to repurchase
5,949
(53)
(3.57)
3,999
(43)
(4.25)
Total interest-bearing liabilities
3,395,608
(28,031)
(3.30)
3,314,597
(26,263)
(3.17)
Net interest income/yield
$5,619
0.65
%
$5,102
0.60
%
(1)Loan fees included in interest income were $0.4 billion and $0.3 billion for mortgage loans held by consolidated trusts in 1Q 2026 and 1Q 2025, respectively. Loan fees for mortgage loans held by Freddie Mac were not material in 1Q 2026 or 1Q 2025 .
Non-Interest Income
The table below presents the components of non-interest income.
Table 4 - Components of Non-Interest Income
Change
(Dollars in millions)
1Q 2026
1Q 2025
$
%
Guarantee income
$320
$440
($120)
(27)
%
Investment gains (losses), net
42
192
(150)
(78)
Other income
152
118
34
29
Non-interest income
$514
$750
($236)
(31)
%
Key Drivers:
nGuarantee income
l1Q 2026 vs. 1Q 2025- Decreased primarily due to fair value losses as a result of increases in medium-term interest rates during 1Q 2026, coupled with lower revenues from a declining off-balance sheet financial guarantee portfolio.
nInvestment gains (losses), net
l1Q 2026 vs. 1Q 2025- Decreased primarily due to a lower volume of loan sale activities as we shifted the Multifamily business model to primarily issue fully guaranteed securities, as well as losses from debt extinguishments in 1Q 2026.
Freddie Mac 1Q 2026 Form 10-Q
5
Management's Discussion and Analysis
Consolidated Results of Operations
(Provision) Benefit for Credit Losses
The table below presents the components of provision for credit losses.
Table 5 - (Provision) Benefit for Credit Losses
Change
(Dollars in millions)
1Q 2026
1Q 2025
$
%
Single-Family
$311
($228)
$539
NM
Multifamily
9
(52)
61
NM
(Provision) benefit for credit losses
$320
($280)
$600
NM
Key Drivers:
n1Q 2026 vs. 1Q 2025 - The benefit for credit losses for 1Q 2026 was driven by a credit reserve release in Single-Family primarily attributable to changes in our views of forecasted house price growth rates. The provision for credit losses for 1Q 2025 was primarily driven by a credit reserve build in Single-Family attributable to new acquisitions.
Non-Interest Expense
The table below presents the components of non-interest expense.
Table 6 - Components of Non-Interest Expense
Change
(Dollars in millions)
1Q 2026
1Q 2025
$
%
Salaries and employee benefits
($376)
($423)
$47
11
%
Professional services, technology, and occupancy
(250)
(253)
3
1
Credit enhancement expense
(441)
(540)
99
18
Legislative and regulatory assessments:
Legislated guarantee fees expense
(757)
(744)
(13)
(2)
Affordable housing funds allocation
(48)
(37)
(11)
(30)
Regulatory assessment
(27)
(36)
9
25
Total legislative and regulatory assessments
(832)
(817)
(15)
(2)
Other expense
(123)
(55)
(68)
(124)
Non-interest expense
($2,022)
($2,088)
$66
3
%
Key Drivers:
nSalaries and employee benefits
l1Q 2026 vs. 1Q 2025 - Decreased primarily due to lower employee headcount.
nCredit enhancement expense
l1Q 2026 vs. 1Q 2025 - Decreased primarily due to a lower UPB of Single-Family CRT transactions outstanding, retention of higher levels of initial losses on recent CRT transactions, and lower losses on STACR Trust note repurchases.
Freddie Mac 1Q 2026 Form 10-Q
6
Management's Discussion and Analysis
Consolidated Balance Sheets Analysis
CONSOLIDATED BALANCE SHEETS ANALYSIS
The table below compares our summarized condensed consolidated balance sheets.
As of March 31, 2026 compared to December 31, 2025:
nInvestment securities decreased primarily due to net sales of U.S. Treasury securities.
nMortgage loans held-for-investment and debt issued by consolidated trusts increased primarily due togrowth in our mortgage portfolio.
nShort-term debt decreased primarily due to lower funding needs.
Freddie Mac 1Q 2026 Form 10-Q
7
Management's Discussion and Analysis
Our Portfolios
OUR PORTFOLIOS
Mortgage Portfolio
The table below presents the UPB of our mortgage portfolio by segment.
Table 8 - Mortgage Portfolio
March 31, 2026
December 31, 2025
(In millions)
Single-Family
Multifamily
Total
Single-Family
Multifamily
Total
Mortgage loans held-for-investment:
By consolidated trusts
$3,065,699
$137,404
$3,203,103
$3,063,232
$115,354
$3,178,586
By Freddie Mac
54,261
26,864
81,125
54,713
37,770
92,483
Total mortgage loans held-for-investment
3,119,960
164,268
3,284,228
3,117,945
153,124
3,271,069
Mortgage loans held-for-sale
1,449
2
1,451
1,108
136
1,244
Total mortgage loans
3,121,409
164,270
3,285,679
3,119,053
153,260
3,272,313
Mortgage-related guarantees:
Mortgage loans held by nonconsolidated trusts
29,528
324,122
353,650
30,025
332,572
362,597
Other mortgage-related guarantees
7,044
9,940
16,984
7,212
10,003
17,215
Total mortgage-related guarantees
36,572
334,062
370,634
37,237
342,575
379,812
Total mortgage portfolio
$3,157,981
$498,332
$3,656,313
$3,156,290
$495,835
$3,652,125
Guaranteed mortgage-related securities:
Issued by consolidated trusts
$3,092,678
$137,421
$3,230,099
$3,084,668
$115,610
$3,200,278
Issued by non-consolidated trusts
24,180
292,245
316,425
24,604
299,507
324,111
Total guaranteed mortgage-related securities
$3,116,858
$429,666
$3,546,524
$3,109,272
$415,117
$3,524,389
Investments Portfolio
Our investments portfolio consists of our mortgage-related investments portfolio and other investments portfolio.
Mortgage-Related Investments Portfolio
The Purchase Agreement limits the size of our mortgage-related investments portfolio to a maximum amount of $225 billion. We primarily use our mortgage-related investments portfolio to provide liquidity to the mortgage market by purchasing loans for our securitization pipeline and by purchasing delinquent and modified loans from securitization trusts. We also invest in agency mortgage-related securities.
The calculation of mortgage assets subject to the Purchase Agreement cap includes the UPB of mortgage assets and 10% of the notional value of interest-only securities. We are permitted to increase our agency MBS investments, provided that our total mortgage assets do not exceed the $225 billion cap under the terms of our senior preferred stock purchase agreement with Treasury, with CMO securities capped at $5 billion as part of agency MBS investments. We are also subject to additional limitations on the size and composition of our mortgage-related investments portfolio pursuant to FHFA guidance. For additional information on the restrictions on our mortgage-related investments portfolio, see the MD&A - Conservatorship and Related Matters section in our 2025 Annual Report.
Freddie Mac 1Q 2026 Form 10-Q
8
Management's Discussion and Analysis
Our Portfolios
The table below presents the details of our mortgage-related investments portfolio.
Table 9 - Mortgage-Related Investments Portfolio
March 31, 2026
December 31, 2025
(In millions)
Single-Family
Multifamily
Total
Single-Family
Multifamily
Total
Unsecuritized mortgage loans(1)
$55,710
$26,866
$82,576
$55,821
$37,906
$93,727
Mortgage-related securities:
Investment securities
5,241
3,207
8,448
4,438
3,891
8,329
Debt issued by consolidated trusts
47,109
1,628
48,737
35,758
1,413
37,171
Total mortgage-related securities
52,350
4,835
57,185
40,196
5,304
45,500
Mortgage-related investments portfolio
$108,060
$31,701
$139,761
$96,017
$43,210
$139,227
10% of notional amount of interest-only securities
$21,691
$21,995
Mortgage-related investments portfolio for purposes of Purchase Agreement cap
161,452
161,222
(1)Includes $37.9 billion and $35.9 billion of single-family loans that we have purchased from securitization trusts as of March 31, 2026 and December 31, 2025, respectively.
Other Investments Portfolio
The table below presents the details of the carrying value of our other investments portfolio.
Table 10 - Other Investments Portfolio
March 31, 2026
December 31, 2025
(In millions)
Liquidity and Contingency Operating Portfolio
Custodial Account
Other
Total Other Investments Portfolio
Liquidity and Contingency Operating Portfolio
Custodial Account
Other
Total Other Investments Portfolio
Cash and cash equivalents
$3,169
$1,202
$98
$4,469
$4,092
$1,136
$99
$5,327
Securities purchased under
agreements to resell
54,678
22,262
2,188
79,128
57,181
19,107
2,090
78,378
Non-mortgage related securities(1)
55,817
—
5,983
61,800
65,088
—
6,076
71,164
Other assets(2)
—
—
8,501
8,501
—
—
7,776
7,776
Other investments portfolio
$113,664
$23,464
$16,770
$153,898
$126,361
$20,243
$16,041
$162,645
(1)Primarily consists of U.S. Treasury securities.
(2)Primarily includes LIHTC investments and advances to lenders.
Freddie Mac 1Q 2026 Form 10-Q
9
Management's Discussion and Analysis
Our Business Segments
OUR BUSINESS SEGMENTS
As shown in the table below, we have two reportable segments, which are based on the way we manage our business.
Segment
Description
Single-Family
Reflects results from our purchase, securitization, and guarantee of single-family loans, our investments in single-family loans and mortgage-related securities, the management of Single-Family mortgage credit risk and market risk, and any results of our treasury function that are not allocated to each segment.
Multifamily
Reflects results from our purchase, securitization, and guarantee of multifamily loans, our investments in multifamily loans and mortgage-related securities, and the management of Multifamily mortgage credit risk and market risk.
Segment Net Revenues and Net Income
The charts below show our net revenues and net income by segment.
Segment Net Revenues
(In billions)
Segment Net Income
(In billions)
Freddie Mac 1Q 2026 Form 10-Q
10
Management's Discussion and Analysis
Our Business Segments | Single-Family
Single-Family
Housing and Mortgage Market Metrics
The table below presents certain single-family housing and mortgage market indicators that can significantly affect our business and financial results. Certain market and macroeconomic prior period data have been updated to reflect revised historical data.
Table 11 - Single-Family Housing and Mortgage Market Metrics(1)
(Mortgage amounts in billions, units in thousands)
1Q 2026
4Q 2025
3Q 2025
2Q 2025
1Q 2025
Home sales (in units):
Total home sales (annualized seasonally adjusted amount)
4,630
4,866
4,735
4,678
4,742
Sales of existing homes
4,043
4,157
4,047
4,013
4,087
Sales of new homes(2)
587
709
688
665
655
Mortgage originations (estimated)
$533
$581
$502
$506
$371
Mortgage debt outstanding(3)
N/A
14,770
14,666
14,541
14,417
Quarterly house price growth rate (seasonally adjusted rate)
0.1
%
0.4
%
0.3
%
(0.1)
%
0.3
%
30-year PMMS rate at period end
6.38
%
6.15
%
6.30
%
6.77
%
6.65
%
(1) Sources: Home sales - National Association of Realtors and U.S Census Bureau; Mortgage originations - Fannie Mae; Mortgage debt outstanding - Federal Reserve Financial Accounts of the United States of America; House price growth rate and 30-year PMMS rate - Freddie Mac.
(2) For 1Q 2026, the sales of new homes amount is based on annualized seasonally adjusted data through January 31, 2026 (the latest available information).
(3) For 1Q 2026, the mortgage debt outstanding balance is not yet available.
Business Results
The table and related discussion below present selected business results of our Single-Family segment.
Table 12 - Single-Family Segment Business Results
Change
(UPB in millions, loan count in thousands)
1Q 2026
1Q 2025
Amount
%
New business activity:
UPB:
Total UPB
$102,513
$77,646
$24,867
32
%
Home purchase
59,964
61,921
(1,957)
(3)
Refinance
42,549
15,725
26,824
171
Number of loans:
Total number of loans
281
224
57
25
Home purchase
165
171
(6)
(4)
Refinance
116
53
63
119
Average estimated guarantee fee rate (bps)(1)
54
54
Mortgage portfolio at period end:
UPB
$3,157,981
$3,115,180
$42,801
1
Average estimated guarantee fee rate (bps)(1)(2)
50
49
(1) Estimated guarantee fee rate calculations exclude the legislated guarantee fees and include deferred fees recognized over the estimated life of the related loans based on month-end market rates for the month of acquisition.
(2) Estimated guarantee fee rate calculations for the Single-Family mortgage portfolio exclude certain loans, the majority of which are held by VIEs that we do not consolidate. The UPB of these excluded loans was $38 billion and $40 billion as of March 31, 2026 and March 31, 2025, respectively.
nOur loan purchase and guarantee activity increased in 1Q 2026 compared to 1Q 2025 primarily driven by an increase in refinance activity due to lower mortgage interest rates.
nOur Single-Family mortgage portfolio was $3.2 trillion at March 31, 2026, up 1% year-over-year. The mortgage portfolio continued to grow at a moderate pace.
Freddie Mac 1Q 2026 Form 10-Q
11
Management's Discussion and Analysis
Our Business Segments | Single-Family
Financial Results
The table below presents the results of operations for our Single-Family segment. See Note 11 for additional information about segment financial results.
Other comprehensive income (loss), net of taxes and reclassification adjustments
(13)
8
(21)
NM
Comprehensive income
$2,963
$2,269
$694
31
%
Key Drivers:
n 1Q 2026 vs. 1Q 2025
lNet income of $3.0 billion, up 32% year-over-year.
–Net revenues were $5.2 billion, up 5% year-over-year.
◦Net interest income was $5.1 billion, up 8% year-over-year, primarily driven by continued mortgage portfolio growth and growth in the mortgage-related investments portfolio.
–The benefit for credit losses was $0.3 billion for 1Q 2026, driven by a credit reserve release primarily attributable to changes in our views of forecasted house price growth rates. The provision for credit losses of $0.2 billion for 1Q 2025 was primarily driven by a credit reserve build attributable to new acquisitions.
–Non-interest expense was $1.8 billion for 1Q 2026, down 5% year-over-year, primarily driven by a decrease in salaries and employee benefits and lower credit enhancement expense.
Freddie Mac 1Q 2026 Form 10-Q
12
Management's Discussion and Analysis
Our Business Segments |Multifamily
Multifamily
Housing and Mortgage Market Metrics
The table below presents certain multifamily housing and mortgage market indicators that can significantly affect our business and financial results. For example, vacancy rates provide insight into the balance between supply and demand. Meanwhile, effective rent growth, which accounts for concessions and discounts offered by landlords, represents the actual change in average rental income over time. Certain market and macroeconomic prior period data have been updated to reflect revised historical data.
Table 14 - Multifamily Housing and Mortgage Market Metrics(1)
(UPB in billions)
1Q 2026
4Q 2025
3Q 2025
2Q 2025
1Q 2025
Apartment vacancy rates
6.8
%
6.7
%
6.6
%
6.6
%
6.5
%
Quarterly change in effective rents
0.6
%
(0.8)
%
(0.1)
%
0.8
%
0.2
%
Mortgage debt outstanding(2)
N/A
$2,447
$2,393
$2,352
$2,330
Quarterly property price growth rate
0.3
%
0.4
%
(0.1)
%
(0.6)
%
0.1
%
(1) Sources: Apartment vacancy rates and change in effective rents - Moody's Analytics; Mortgage debt outstanding - Federal Reserve Financial Accounts of the United States of America; Property price growth rate - Real Capital Analytics Commercial Property Price Index (RCA CPPI).
(2) The 1Q 2026 U.S. multifamily mortgage debt outstanding balance is not yet available.
Business Results
The table and related discussion below present selected business results of our Multifamily segment.
Table 15 - Multifamily Segment Business Results
Change
(UPB in millions, units in thousands)
1Q 2026
1Q 2025
Amount
%
New business activity:
UPB(1)
$12,847
$10,276
$2,571
25
%
Total units financed(2)
99
89
10
11
Mission-driven affordable housing percentage
66
%
65
%
Outstanding index lock agreements and commitments(3)
$22,788
$16,179
$6,609
41
New securitization activity(4):
Total UPB
$23,433
$16,113
$7,320
45
Senior subordinate securitizations
666
7,273
(6,607)
(91)
Fully guaranteed securitizations
22,767
8,840
13,927
158
Mortgage portfolio at period end:
UPB
$498,332
$466,500
$31,832
7
Fixed-rate percentage
85
%
83
%
Average guarantee fees rate charged (bps)(5)
58
52
(1) Excludes new LIHTC investments of $0.2 billion for 1Q 2026. New LIHTC investments in 1Q 2025 were not material.
(2) Includes rental units financed by supplemental loans.
(3) At period end.
(4) Excludes resecuritizations.
(5) Based on guarantee exposure of $440 billion and $407 billion for 1Q 2026 and 1Q 2025, respectively, which includes guaranteed mortgage related securities that are consolidated on our condensed consolidated balance sheet where income from guarantees is recognized in net interest income.
nOur new business activity was $12.8 billion in 1Q 2026, up 25% year-over-year, primarily driven by a larger new business activity pipeline entering 1Q 2026 due to a larger multifamily mortgage originations market. Approximately 66% of our 1Q 2026 new business activity, based on UPB, was mission-driven, affordable housing, exceeding FHFA's annual minimum requirement of 50%.
nTotal securitization issuance UPB was $23.4 billion in 1Q 2026, up 45% year-over-year, driven by a larger average securitization pipeline. The larger percentage of fully guaranteed securitizations was due to the Multifamily business
Freddie Mac 1Q 2026 Form 10-Q
13
Management's Discussion and Analysis
Our Business Segments |Multifamily
strategy change.
nOur Multifamily mortgage portfolio was $498 billion as of March 31, 2026, up 7% year-over-year, primarily driven by our new business activity.
nThe average guarantee fee rate on our guarantee exposures increased year-over-year, primarily due to continued growth of fully guaranteed securitization issuances for which we charge higher guarantee fee rates.
Financial Results
The table below presents the results of operations for our Multifamily segment. See Note 11 for additional information about segment financial results.
Table 16 - Multifamily Segment Financial Results
Change
(Dollars in millions)
1Q 2026
1Q 2025
$
%
Net interest income
$499
$349
$150
43
%
Non-interest income
459
585
(126)
(22)
Net revenues
958
934
24
3
(Provision) benefit for credit losses
9
(52)
61
NM
Non-interest expense
(242)
(217)
(25)
(12)
Income before income tax expense
725
665
60
9
Income tax expense
(143)
(132)
(11)
(8)
Net income
582
533
49
9
Other comprehensive income (loss), net of taxes and reclassification adjustments
(7)
26
(33)
NM
Comprehensive income
$575
$559
$16
3
%
Key Drivers:
n1Q 2026 vs. 1Q 2025
lNet income of $0.6 billion, up 9% year-over-year.
–Net revenues were $1.0 billion, up 3% year-over-year.
◦Net interest income was $0.5 billion, up 43% year-over-year, primarily driven by an increase in the balance of fully guaranteed securitizations in the Multifamily mortgage portfolio due to the change in Multifamily business strategy.
◦Non-interest income was $0.5 billion, down 22% year-over-year, primarily driven by a lower volume of loan sale activities, as we shifted the Multifamily business model to primarily issue fully guaranteed securitizations.
Freddie Mac 1Q 2026 Form 10-Q
14
Management's Discussion and Analysis
Risk Management
RISK MANAGEMENT
To achieve our mission, we take risks as an integral part of our business activities. We are exposed to the following key types of risk: credit risk, market risk, liquidity risk, operational risk, compliance risk, legal risk, strategic risk, and reputation risk.
Credit Risk
Allowance for Credit Losses
The tables below present a summary of the changes in our allowance for credit losses and key allowance for credit losses ratios.
Table 17 - Allowance for Credit Losses Activity
1Q 2026
1Q 2025
(Dollars in millions)
Single-Family
Multifamily
Total
Single-Family
Multifamily
Total
Allowance for credit losses:
Beginning balance
$7,549
$956
$8,505
$6,691
$548
$7,239
Provision (benefit) for credit losses
(311)
(9)
(320)
228
52
280
Charge-offs
(178)
(64)
(242)
(191)
(1)
(192)
Recoveries collected
60
1
61
27
1
28
Net charge-offs
(118)
(63)
(181)
(164)
—
(164)
Other(1)
108
1
109
96
—
96
Ending balance
$7,228
$885
$8,113
$6,851
$600
$7,451
Average loans outstanding during the period(2)
$3,148,567
$151,752
$3,300,319
$3,101,599
$86,445
$3,188,044
Net charge-offs to average loans outstanding
—
%
0.04
%
0.01
%
0.01
%
—
%
0.01
%
(1)Primarily includes capitalization of past due interest related to non-accrual loans that received payment deferral plans and loan modifications.
(2)Based on amortized cost basis of mortgage loans held-for-investment for which we have not elected the fair value option.
Table 18 - Allowance for Credit Losses Ratios
March 31, 2026
December 31, 2025
(Dollars in millions)
Single-Family
Multifamily
Total
Single-Family
Multifamily
Total
Allowance for credit losses ratios:
Allowance for credit losses(1) to total loans outstanding
0.22
%
0.42
%
0.23
%
0.23
%
0.46
%
0.24
%
Non-accrual loans to total loans outstanding
0.56
0.03
0.54
0.55
0.16
0.54
Allowance for credit losses to non-accrual loans
39.46
1,321.79
43.11
41.84
295.59
45.10
Balances:
Allowance for credit losses on mortgage loans held-for-investment
$6,977
$666
$7,643
$7,297
$671
$7,968
Total loans outstanding(2)
3,146,251
156,792
3,303,043
3,145,436
145,593
3,291,029
Non-accrual loans(2)
17,681
50
17,731
17,442
227
17,669
(1)Represents allowance for credit losses on mortgage loans held-for-investment.
(2)Based on amortized cost basis of mortgage loans held-for-investment for which we have not elected the fair value option.
nMarch 31, 2026 vs. December 31, 2025 - The balance of non-accrual loans increased by $62 million due to a $239 million increase in the balance of non-accrual loans in Single-Family, partially offset by a $177 million decrease in the balance of non-accrual loans in Multifamily. The decrease in Multifamily was primarily due to loan dispositions and borrower re-performance.
Freddie Mac 1Q 2026 Form 10-Q
15
Management's Discussion and Analysis
Risk Management
Single-Family Mortgage Credit Risk
Credit Quality of New Business Activity
Loan Purchase Credit Characteristics
We monitor and evaluate market conditions that could affect the credit quality of our single-family loan purchases. See MD&A - Our Business Segments - Single-Family - Housing and Mortgage Market Metrics for additional information on market conditions. Additionally, when managing our new acquisitions, we consider our risk limits and guidance from FHFA and capital requirements under the ERCF. This may affect the volume and characteristics of our loan acquisitions. See MD&A - Regulation and Supervision - Federal Housing Finance Agency in our 2025 Annual Report for additional information on guidance from FHFA.
The charts below show the credit profile of the single-family loans we purchased.
Weighted Average Original LTV Ratio
Weighted Average Original Credit Score
Weighted Average Original DTI Ratio
Freddie Mac 1Q 2026 Form 10-Q
16
Management's Discussion and Analysis
Risk Management
The table below contains additional information about the single-family loans we purchased.
Table 19 - Single-Family New Business Activity
1Q 2026
1Q 2025
(Dollars in millions, except average loan UPB)
Amount
% of Total
Amount
% of Total
20- and 30-year, amortizing fixed-rate
$91,587
90
%
$72,772
93
%
15-year or less, amortizing fixed-rate
7,521
7
4,434
6
Adjustable-rate
3,405
3
440
1
Total
$102,513
100
%
$77,646
100
%
Average loan UPB (in thousands)
$365
$347
Percentage of purchases
DTI ratio > 45%
24
%
30
%
Original LTV ratio > 90%
19
23
Transaction type:
Guarantor swap
63
71
Cash window
37
29
Property type:
Detached single-family houses and townhouses
93
92
Condominium or co-op
7
8
Occupancy type:
Primary residence
94
93
Second home
2
2
Investment property
4
5
Loan purpose:
Purchase
58
79
Cash-out refinance
10
11
Other refinance
32
10
Credit Enhancements
We engage in various credit enhancement arrangements to reduce our credit risk exposure on our single-family loans.
The table below provides the UPB of the mortgage loans acquired during the periods presented that were covered by primary mortgage insurance, the UPB of the mortgage loans covered by CRT transactions we entered into during the periods presented, and maximum coverage related to these newly acquired credit enhancements. In recent periods, we have changed our business strategy and revised our CRT transactions by retaining higher levels of initial losses. As a result, the benefits provided by these revised CRT transactions may be lower than those provided by the earlier CRT transactions even if the maximum coverage provided by the more recent CRT transactions is similar to that provided by the earlier CRT transactions.
(1) The primary mortgage insurance and CRT transactions presented in this table are not mutually exclusive as a single loan may be covered by both primary mortgage insurance and CRT transactions.
(2) The credit risk positions to which the maximum coverage applies may vary on a transaction-by-transaction basis.
(1) The credit risk positions to which the maximum coverage applies may vary on a transaction-by-transaction basis.
(2) Amounts exclude certain loans for which we do not control servicing, as the coverage information for these loans is not readily available to us.
(3) Other reconciling items primarily include timing differences in reporting cycles between the UPB of certain CRT transactions and the UPB of the underlying loans.
Freddie Mac 1Q 2026 Form 10-Q
18
Management's Discussion and Analysis
Risk Management
Credit Enhancement Coverage Characteristics
The table below provides the serious delinquency rates for the credit-enhanced and non-credit-enhanced loans in our Single-Family mortgage portfolio. The credit-enhanced categories are not mutually exclusive as a single loan may be covered by both primary mortgage insurance and other credit enhancements.
Table 22 - Serious Delinquency Rates for Credit-Enhanced and Non-Credit-Enhanced Loans in Our Single-Family Mortgage Portfolio
March 31, 2026
December 31, 2025
(% of portfolio based on UPB)(1)
% of Portfolio(2)
SDQ Rate
% of Portfolio(2)
SDQ Rate
Credit-enhanced:
Primary mortgage insurance
22
%
1.23
%
22
%
1.19
%
CRT and other
53
0.70
52
0.68
Non-credit-enhanced
38
0.41
39
0.40
Total
N/A
0.60
N/A
0.59
(1)Excludes loans underlying certain securitization products for which loan-level data is not available.
(2)Percentages do not total to 100% as a single loan may be included in multiple line items.
Credit Enhancement Recoveries
Our expected recovery receivable from freestanding credit enhancements was $0.1 billion as of both March 31, 2026 and December 31, 2025.
Monitoring Loan Performance and Characteristics
We review loan performance, including delinquency statistics and related loan characteristics, in conjunction with housing market and economic conditions, to assess credit risk when estimating our allowance for credit losses.
Loan Credit Characteristics
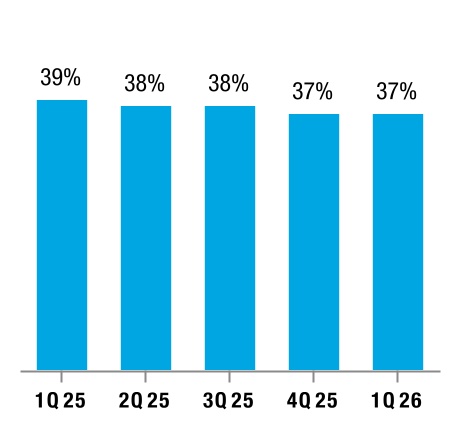
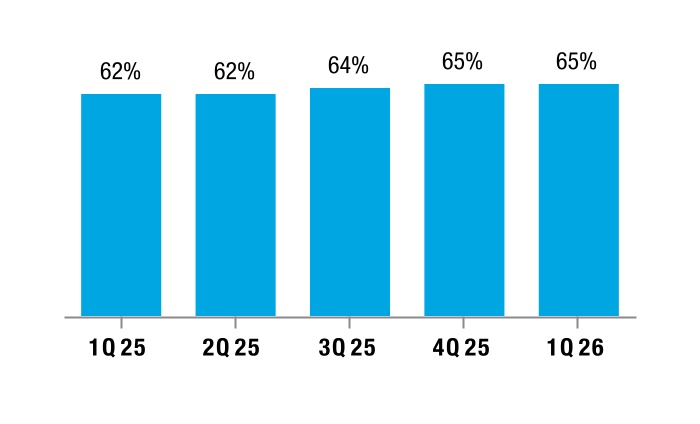
The table below contains selected credit characteristics of the loans in our Single-Family mortgage portfolio.
Single-Family mortgage portfolio year of origination:
2026
$64,135
759
759
75
%
76
%
0.00
%
33
%
2025
352,457
756
752
77
76
0.11
48
2024
272,367
753
749
78
74
0.69
72
2023
199,315
750
741
79
71
1.19
76
2022
356,008
746
740
76
63
1.03
69
2021 and prior
1,913,699
751
757
72
42
0.55
61
Total
$3,157,981
751
753
74
53
0.60
62
Loan count(in thousands)
13,922
Average loan UPB (in thousands)
$227
Freddie Mac 1Q 2026 Form 10-Q
19
Management's Discussion and Analysis
Risk Management
December 31, 2025
(Dollars in millions, except average loan UPB)
Amount
Original Credit Score
Current Credit Score
Original LTV Ratio
Current LTV Ratio
SDQ Rate
% of UPB with Credit Enhancement
Single-Family mortgage portfolio year of origination:
2025
$333,409
757
753
77
%
76
%
0.06
%
38
%
2024
291,738
753
752
78
74
0.56
68
2023
211,793
750
743
79
71
1.06
76
2022
364,361
746
741
76
63
1.01
69
2021
841,701
752
755
71
49
0.44
64
2020 and prior
1,113,288
750
761
73
37
0.60
58
Total
$3,156,290
751
754
74
53
0.59
61
Loan count(in thousands)
13,933
Average loan UPB (in thousands)
$227
(1)Excludes certain credit quality characteristics and serious delinquency rate information on loans underlying certain securitization products for which data was not available.
The table below presents the combination of credit score and CLTV ratio attributes of loans in our Single-Family mortgage portfolio.
(1) Excludes loans underlying certain securitization products for which current credit score is not available.
Geographic Concentrations
We purchase mortgage loans from across the U.S. but do not purchase an equal number of loans from each geographic area, leading to concentrations of credit risk in certain geographic areas. Local economic and other conditions can affect the borrower's ability to repay and the value of the underlying collateral. Property insurance markets in certain geographic areas, including areas with high risk of natural disaster events, have observed increases in property insurance premiums and reduction in the availability of coverage in recent years. In addition, certain states and municipalities have passed or may pass laws that limit our ability to foreclose or evict and make it more difficult and costly to manage our risk.
See Note 12 for additional information about the geographic distribution of our Single-Family mortgage portfolio.
Freddie Mac 1Q 2026 Form 10-Q
20
Management's Discussion and Analysis
Risk Management
Delinquency Rates
We report Single-Family delinquency rates based on the number of loans in our Single-Family mortgage portfolio that are past due as reported to us by our servicers as a percentage of the total number of loans in our Single-Family mortgage portfolio.
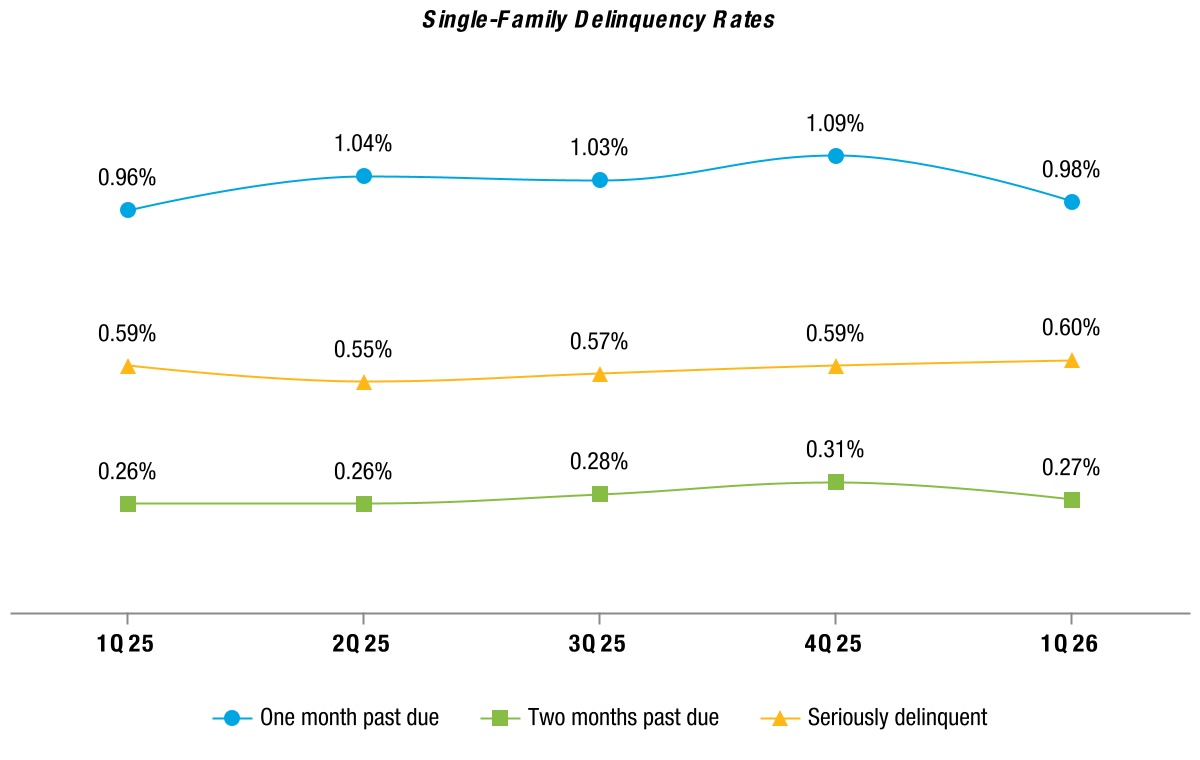
The chart below presents the delinquency rates of mortgage loans in our Single-Family mortgage portfolio.
The percentage of loans that were one month past due and the percentage of loans that were two months past due both increased as of March 31, 2026 compared to March 31, 2025. The percentage of loans one month past due can be volatile due to seasonality, whether the last day of the period falls on a weekend, and other factors that may not be indicative of default. As a result, the percentage of loans two months past due tends to be a better early performance indicator than the percentage of loans one month past due.
Our Single-Family serious delinquency rate increased to 0.60% as of March 31, 2026, compared to 0.59% as of March 31, 2025. See Note 3 for additional information on the payment status of our single-family mortgage loans.
Loss Mitigation Activities
We offer a variety of borrower assistance programs.For purposes of the disclosure below related to loss mitigation activities, we generally exclude loans for which we do not control servicing. See Note 3 for additional information on our loss mitigation activities. For information on our refinance programs, see the MD&A - Risk Management -Credit Risk - Single-Family Mortgage Credit Risk section in our 2025 Annual Report.
Loan Workout Activities
We continue to help families retain their homes or otherwise avoid foreclosure through loan workouts. The table below provides details about the single-family loan workout activities that were completed during the periods presented.
(1) The forbearance data is limited to loans in forbearance that are past due based on the loans' original contractual terms and excludes loans included in certain legacy transactions, as the forbearance data for such loans is either not reported to us by the servicers or is otherwise not readily available to us. Other includes repayment plans and foreclosure alternatives.
Completed loan workout activity includes forbearance plans where borrowers fully reinstated the loan to current status during or at the end of the forbearance period, finalized payment deferral plans, settled loan modifications, successfully completed repayment plans, short sales, and deeds in lieu of foreclosure. Completed loan workout activity excludes active loss mitigation activity that was ongoing and had not been completed as of the end of the period, such as forbearance plans and repayment plans that had been initiated but not completed and trial period modifications. As of March 31, 2026, there were approximately 16,000 loans in active forbearance plans, approximately 16,000 loans on trial period modifications, and approximately 4,000 loans in active repayment plans.
Multifamily Mortgage Credit Risk
Credit Quality of New Business Activity
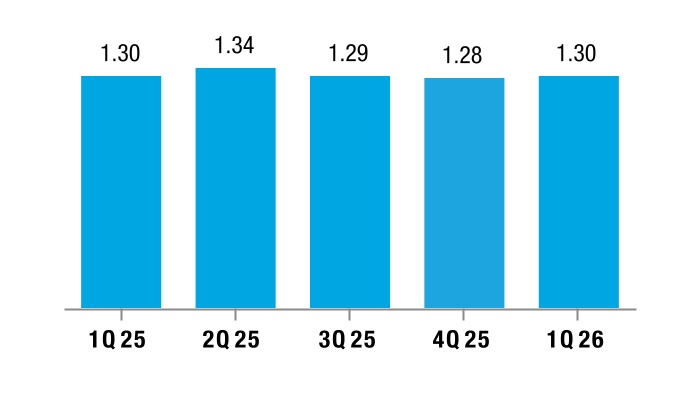
Our underwriting standards focus on the LTV ratio and DSCR, which estimates the value of the collateral and a borrower's ability to repay the loan using the secured property's cash flows, after expenses. The charts below provide the weighted average original LTV ratio and original DSCR for our new business activity.
Weighted Average Original LTV Ratio
Weighted Average Original DSCR(1)
(1) Assumes monthly payments that reflect amortization of principal.
Credit Enhancements
In connection with the acquisition, guarantee, and/or securitization of a loan or group of loans, we may obtain various forms of credit protection that reduce our credit risk exposure to the underlying mortgage borrower and our required capital. We evaluate and update our risk transfer strategy as needed depending on our business strategy, market conditions, and regulatory requirements.
Multifamily Mortgage Portfolio CRT Issuance
The table below provides the UPB of the multifamily mortgage loans covered by CRT transactions issued during the periods presented as well as the maximum coverage provided by those transactions upon issuance. In recent periods, we have primarily obtained credit enhancement coverage through MCIP and MSCR notes transactions due to our business strategy change. We typically retain higher levels of initial losses in these transactions compared to senior subordinate securitization transactions. As a result, the benefits provided by MCIP and MSCR notes may be lower than those provided by senior subordinate securitization transactions.
While subordination continues to be the primary form of credit enhancement coverage on our mortgage portfolio, our use of MCIP and MSCR notes transactions has grown in recent periods as a result of our business strategy change.
The table below presents the UPB and delinquency rates for both credit-enhanced and non-credit-enhanced loans underlying our Multifamily mortgage portfolio.
(1) As of March 31, 2026 and December 31, 2025, our maximum coverage outstanding provided by subordination in nonconsolidated VIEs was $31.9 billion and $33.2 billion, respectively.
The Multifamily delinquency rate was 0.43% at March 31, 2026. As of March 31, 2026, 94% of the delinquent loans in the Multifamily mortgage portfolio have credit enhancement coverage.
Credit Enhancement Recoveries
Our expected recovery receivable from freestanding credit enhancements was $0.1 billion as of both March 31, 2026 and December 31, 2025.
Seller Provided Indemnifications
Sellers are required to make certain representations and warranties regarding the loans they sell to us. In the event of a breach, sellers are obligated to either repurchase the affected loans or indemnify us for any losses incurred. Instead of demanding immediate repurchase, we may enter into forbearance and indemnification agreements with sellers. These agreements, among other provisions, delay the repurchase obligation for a specified period and fully transfer the risk of loss associated with the loan from us to the seller. Typically, as part of such agreements, we require sellers to provide cash or other collateral to secure potential future indemnification losses, although we remain subject to counterparty risk. While there has been an increase in the volume of seller repurchase and indemnification activities attributable to breaches of seller representation and warranties, these activities have remained limited. However, the volume of these activities may increase in the future.
Market Risk
Overview
Our business segments have embedded exposure to market risk, which is the economic risk associated with adverse changes in interest rates, volatility, and spreads. Market risk can adversely affect future cash flows, or economic value, as well as earnings and net worth. The primary sources of interest-rate risk are from our investments in mortgage-related assets, non-mortgage assets (including U.S. Treasury securities), the debt we issue to fund these assets, and our Single-Family guarantees.
Freddie Mac 1Q 2026 Form 10-Q
23
Management's Discussion and Analysis
Risk Management
Interest-Rate Risk
The tables below provide our duration gap, estimated point-in-time, and minimum and maximum PVS-L and PVS-YC results, and an average of the daily values and standard deviation. The table below also provides PVS-L estimated present value (gains) losses assuming an immediate 100 bps shift in the yield curve. The interest-rate sensitivity of a mortgage portfolio varies across a wide range of interest rates.
Table 28 - Duration Gap and PVS-YC and PVS-L Results Assuming Shifts of the Yield Curve
March 31, 2026
December 31, 2025
Duration Gap
PVS-YC(1)
PVS-L(1)
Duration Gap
PVS-YC(1)
PVS-L(1)
(Dollars in millions,duration gap in months)
25 bps
50 bps
100 bps
25 bps
50 bps
100 bps
Interest-rate risk related to:
Financial instruments primarily funded by debt
0.4
$2
$12
($29)
0.4
$5
$26
$18
All other financial instruments(2)
47.4
75
1,617
3,417
29.5
82
1,009
2,137
All financial instruments
11.6
77
1,629
3,388
7.3
76
1,035
2,154
PVS
77
1,629
3,388
76
1,035
2,154
(1)Positive amounts indicate the associated shift in the yield curve results in estimated present value losses. Negative amounts indicate the associated shift in the yield curve results in estimated present value gains.
(2)The UPB was $79.2 billion as of March 31, 2026 and $75.7 billion as of December 31, 2025.
Table 29 - Duration Gap and PVS Results
1Q 2026
1Q 2025
(Dollars in millions,duration gap in months)
Duration
Gap
PVS-YC
25 bps
PVS-L
50 bps
Duration Gap
PVS-YC 25 bps
PVS-L 50 bps
Average
9.3
$65
$1,324
0.8
$9
$86
Minimum
7.8
32
1,053
—
1
—
Maximum
12.0
88
1,666
2.0
24
228
Standard deviation
1.3
16
171
0.6
7
81
Derivatives enable us to reduce our economic interest-rate risk exposure as we continue to align our derivatives portfolio with the changing duration of our economically hedged assets and liabilities. The table below shows that the PVS-L risk levels, assuming a 50 bps shift in the yield curve for the periods presented, would have been higher if we had not used derivatives.
Table 30 - PVS-L Results Before Derivatives and After Derivatives
(In millions)
March 31, 2026
December 31, 2025
PVS-L (50 bps):
Before derivatives
$3,440
$3,364
After derivatives
1,629
1,035
Effect of derivatives
(1,811)
(2,329)
When managing interest-rate risk related to financial instruments not funded primarily by debt, we also consider the sensitivity of coupon income (interest income based on the stated or reinvestment rates) attributable to these instruments, which we believe is an appropriate measure as we are targeting duration to reduce our income volatility. We estimate the impact of a parallel 100 basis point increase and decrease in interest rates on coupon income attributable to these instruments over the next 12 months relative to the baseline scenario, assuming the total balance of these instruments stays constant. Unlike our economic risk measures (such as PVS and duration gap), which estimate changes to portfolio value, this analysis reflects only the coupon income sensitivity of our reported results to interest rate changes over a specific timeframe.
At March 31, 2026 and 2025, we estimate that a parallel 100 basis point increase in interest rates would result in an increase of $263 million and $489 million, respectively, and a parallel 100 basis point decrease would result in a decrease of $343 million and $492 million, respectively, in coupon income for financial instruments not primarily funded by debt, relative to the baseline.
Freddie Mac 1Q 2026 Form 10-Q
24
Management's Discussion and Analysis
Liquidity and Capital Resources
LIQUIDITY AND CAPITAL RESOURCES
Our business activities require that we maintain adequate liquidity to meet our financial obligations as they come due and meet the needs of customers in a timely and cost-efficient manner. We also must maintain adequate capital resources to avoid being placed into receivership by FHFA.
Liquidity
Primary Sources of Liquidity
Our primary sources of liquidity include both our other investments portfolio and our mortgage-related investments portfolio. See MD&A - Our Portfolios for additional information about our other investments portfolio and mortgage-related investments portfolio.
Our other investments portfolio is important to our cash flow, collateral management, asset and liability management, and ability to provide liquidity and stability to the mortgage market. Our liquidity and contingency operating portfolio primarily includes securities purchased under agreements to resell and non-mortgage-related securities. Our non-mortgage-related securities consist of U.S. Treasury securities and other investments that we could sell to provide us with an additional source of liquidity to fund our business operations. We also maintain non-interest-bearing deposits at the Federal Reserve Bank of New York and interest-bearing deposits at commercial banks. Our interest-bearing deposits at commercial banks totaled $4.0 billion as of March 31, 2026 and $4.8 billion as of December 31, 2025.
The primary source of liquidity from our mortgage-related investments portfolio is our holdings of agency securities. In addition, we hold certain single-family loans and multifamily loans that could be securitized and would then be available for sale or for use as collateral for repurchase agreements.
Primary Sources of Funding
We fund our business using short-term and long-term debt, securities sold under agreements to repurchase, and debt issued by consolidated trusts. Competition for funding can vary with economic, financial market, and regulatory environments. The amount, type, and term of our funding sources is based on a variety of factors and is designed to meet our ongoing cash needs and to comply with our Liquidity Management Framework.
Short-term and Long-term Debt
We issue debt to fund our operations. These instruments are unsecured general corporate obligations and consist of both short-term debt, which are instruments with original maturities of one year or less, and long-term debt, which are instruments with original maturities of more than one year.
As of March 31, 2026, our aggregate indebtedness pursuant to the Purchase Agreement was $198.0 billion, which was below the current $270.0 billion debt cap limit. Our aggregate indebtedness calculation primarily includes the par value of short- and long-term debt.
The table below summarizes the par value and the average rate of short-term and long-term debt securities we issued or paid off, including regularly scheduled principal payments, payments resulting from calls, and payments for repurchases. We call, exchange, or repurchase our outstanding debt securities from time to time for a variety of reasons, including managing our funding composition and supporting the liquidity of our debt securities.
Freddie Mac 1Q 2026 Form 10-Q
25
Management's Discussion and Analysis
Liquidity and Capital Resources
Table 31 - Short-term and Long-term Debt Activity
1Q 2026
1Q 2025
(Dollars in millions)
Par Value
Average Rate(1)
Par Value
Average Rate(1)
Short-term Debt:
Beginning balance
$37,867
3.82
%
$14,716
4.59
%
Issuances
31,365
3.64
38,793
4.31
Repayments
(1,480)
3.86
—
—
Maturities
(43,194)
3.78
(39,052)
4.42
Total short-term debt
24,558
3.66
14,457
4.29
Long-term Debt:
Beginning balance
172,693
4.15
172,942
3.65
Issuances
34,244
3.99
22,195
4.88
Repayments
(22,750)
4.41
(18,106)
5.10
Maturities
(10,721)
5.07
(6,824)
2.16
Total long-term debt
173,466
4.03
170,207
3.72
Total short-term and long-term debt, net
$198,024
3.98
%
$184,664
3.76
%
(1)Average rate is weighted based on par value.
Our callable debt provides us with the option to repay the outstanding principal balance of the debt prior to its contractual maturity date. As of March 31, 2026, $80.5 billion of the outstanding $98.7 billion of callable debt may be called within one year, not including callable debt due to contractually mature within one year.
Maturity and Redemption Dates
The table below presents the par value of total short-term and long-term debt by contractual maturity date and earliest redemption date. The earliest redemption date refers to the earliest call date for callable debt, and the contractual maturity date for all other short-term and long-term debt.
Table 32 - Maturity and Redemption Dates
As of March 31, 2026
As of December 31, 2025
(In millions)
Contractual Maturity Date
Earliest Redemption Date
Contractual Maturity Date
Earliest Redemption Date
Short-term debt
$24,558
$24,558
$37,867
$37,867
Long-term debt:
1 year or less
44,246
124,760
45,515
120,398
1 year through 2 years
40,497
31,258
43,860
34,849
2 years through 3 years
24,880
5,660
22,474
5,615
3 years through 4 years
9,814
2,070
9,806
2,055
4 years through 5 years
40,002
2,978
33,871
—
Thereafter
13,539
6,252
16,622
9,231
STACR and SCR debt(1)
488
488
546
546
Total short-term and long-term debt
$198,024
$198,024
$210,561
$210,561
(1)STACR debt notes and SCR debt notes are subject to prepayment risk as their payments are based upon the performance of a reference pool of mortgage assets that may be prepaid by the related mortgage borrowers at any time generally without penalty and are, therefore, included as a separate category in the table.
Debt Issued by Consolidated Trusts
Debt issued by consolidated trusts relates to securitization transactions that we consolidate for accounting purposes. We primarily issue this type of debt by securitizing mortgage loans to finance our guarantee activities. When we consolidate securitization trusts, we recognize on our condensed consolidated balance sheets the assets held by the trusts, the majority of which are mortgage loans, and the debt issued by the trusts.
Freddie Mac 1Q 2026 Form 10-Q
26
Management's Discussion and Analysis
Liquidity and Capital Resources
The table below shows the issuance and extinguishment activity for the debt issued by consolidated trusts.
Table 33 - Debt Issued by Consolidated Trusts
(In millions)
1Q 2026
1Q 2025
Beginning balance
$3,163,684
$3,085,981
Issuances
165,358
120,942
Repayments and extinguishments
(147,061)
(97,496)
Ending balance
3,181,981
3,109,427
Unamortized premiums and discounts
33,014
35,821
Debt issued by consolidated trusts
$3,214,995
$3,145,248
Off-Balance Sheet Arrangements
We enter into certain business arrangements that are not recorded on our condensed consolidated balance sheets or that may be recorded in amounts that differ from the full contractual or notional amount of the transaction that affect our short- and long-term liquidity needs. These off-balance sheet arrangements primarily consist of guarantees and commitments. Certain of these arrangements present credit risk exposure. SeeNote 2 and Note 4 for additional information on these transactions. SeeMD&A - Risk Management - Credit Riskfor additional information on our credit risk exposure on off-balance sheet arrangements.
Cash Flows
Cash and cash equivalents (including restricted cash and cash equivalents) decreased slightly from $4.8 billion as of March 31, 2025 to $4.5 billion as of March 31, 2026.
Capital Resources
The table below presents activity related to our net worth.
Table 34 - Net Worth Activity
(In millions)
1Q 2026
1Q 2025
Beginning balance
$70,384
$59,575
Comprehensive income
3,538
2,828
Capital draw from Treasury
—
—
Senior preferred stock dividends declared
—
—
Total equity / net worth
$73,922
$62,403
Remaining Treasury funding commitment
$140,162
$140,162
Aggregate draws under Purchase Agreement
71,648
71,648
Aggregate cash dividends paid to Treasury
119,680
119,680
Liquidation preference of the senior preferred stock
143,032
132,223
Freddie Mac 1Q 2026 Form 10-Q
27
Management's Discussion and Analysis
Liquidity and Capital Resources
ERCF
For a description of our capital requirements under the ERCF, including the amended provisions, see the MD&A - Regulation and Supervision section in our 2025 Annual Report.
Capital Metrics
The table below presents the components of our regulatory capital.
Table 35 - Regulatory Capital Components
(In millions)
March 31, 2026
December 31, 2025
Total equity
$73,922
$70,384
Less:
Senior preferred stock
72,648
72,648
Preferred stock
14,109
14,109
Common equity
(12,835)
(16,373)
Less: Deferred tax assets arising from temporary differences that exceed 10% of CET1 capital and other regulatory adjustments
4,886
5,169
Common equity Tier 1 capital
(17,721)
(21,542)
Add: Preferred stock
14,109
14,109
Tier 1 capital
(3,612)
(7,433)
Tier 2 capital adjustments
—
—
Adjusted total capital
($3,612)
($7,433)
The table below presents the components of our statutory capital.
Table 36 - Statutory Capital Components
(In millions)
March 31, 2026
December 31, 2025
Total equity
$73,922
$70,384
Less:
Senior preferred stock
72,648
72,648
AOCI, net of taxes
31
51
Core capital
1,243
(2,315)
General allowance for foreclosure losses(1)
8,113
8,505
Total capital
$9,356
$6,190
(1)Represents our allowance for credit losses.
Freddie Mac 1Q 2026 Form 10-Q
28
Management's Discussion and Analysis
Liquidity and Capital Resources
The table below presents our capital metrics under the ERCF.
Table 37 - Capital Metrics Under ERCF
(In billions)
March 31, 2026
December 31, 2025
Adjusted total assets
$3,903
$3,905
Risk-weighted assets (standardized approach):
Credit risk
1,112
1,091
Market risk
74
67
Operational risk
73
73
Total risk-weighted assets
$1,259
$1,231
(In billions)
March 31, 2026
December 31, 2025
Stress capital buffer
$29
$29
Stability capital buffer
31
30
Countercyclical capital buffer amount
—
—
PCCBA
$60
$59
PLBA
$15
$15
March 31, 2026
(Dollars in billions)
Minimum Capital Requirement
Applicable Buffer
Capital
Requirement
(Including Buffer(1))
Available Capital (Deficit)
Capital Shortfall
Risk-based capital amounts:
Total capital
$101
N/A
$101
$9
($92)
CET1 capital
57
$60
117
(18)
(135)
Tier 1 capital
76
60
136
(4)
(140)
Adjusted total capital
101
60
161
(4)
(165)
Risk-based capital ratios(2):
Total capital
8.0
%
N/A
8.0
%
0.7
%
(7.3)
%
CET1 capital
4.5
4.8
%
9.3
(1.4)
(10.7)
Tier 1 capital
6.0
4.8
10.8
(0.3)
(11.1)
Adjusted total capital
8.0
4.8
12.8
(0.3)
(13.1)
Leverage capital amounts:
Core capital
$98
N/A
$98
$1
($97)
Tier 1 capital
98
$15
113
(4)
(117)
Leverage capital ratios(3):
Core capital
2.5
%
N/A
2.5
%
—
%
(2.5)
%
Tier 1 capital
2.5
0.4
%
2.9
(0.1)
(3.0)
Freddie Mac 1Q 2026 Form 10-Q
29
Management's Discussion and Analysis
Liquidity and Capital Resources
December 31, 2025
(Dollars in billions)
Minimum Capital Requirement
Applicable Buffer
Capital
Requirement
(Including Buffer(1))
Available Capital (Deficit)
Capital Shortfall
Risk-based capital amounts:
Total capital
$99
N/A
$99
$6
($93)
CET1 capital
55
$59
114
(22)
(136)
Tier 1 capital
74
59
133
(7)
(140)
Adjusted total capital
99
59
158
(7)
(165)
Risk-based capital ratios(2):
Total capital
8.0
%
N/A
8.0
%
0.5
%
(7.5)
%
CET1 capital
4.5
4.8
%
9.3
(1.8)
(11.1)
Tier 1 capital
6.0
4.8
10.8
(0.6)
(11.4)
Adjusted total capital
8.0
4.8
12.8
(0.6)
(13.4)
Leverage capital amounts:
Core capital
$98
N/A
$98
($2)
($100)
Tier 1 capital
98
$15
113
(7)
(120)
Leverage capital ratios(3):
Core capital
2.5
%
N/A
2.5
%
(0.1)
%
(2.6)
%
Tier 1 capital
2.5
0.4
%
2.9
(0.2)
(3.1)
(1)PCCBA for risk-based capital and PLBA for leverage capital.
(2)As a percentage of RWA.
(3)As a percentage of ATA.
At March 31, 2026, our maximum payout ratio under the ERCF was 0.0%.
See Note 15 for additional information on our capital amounts and ratios under the ERCF.
Freddie Mac 1Q 2026 Form 10-Q
30
Management's Discussion and Analysis
Critical Accounting Estimates
CRITICAL ACCOUNTING ESTIMATES
Our critical accounting estimates and policies relate to the Single-Family allowance for credit losses. For additional information about our critical accounting estimates and significant accounting policies, see Note 1 and MD&A - Critical Accounting Estimates in our 2025 Annual Report.
Single-Family Allowance for Credit Losses
The Single-Family allowance for credit losses represents our estimate of expected credit losses over the contractual term of the mortgage loans. The Single-Family allowance for credit losses pertains to all single-family loans classified as held-for-investment on our condensed consolidated balance sheets.
Determining the appropriateness of the Single-Family allowance for credit losses is a complex process that is subject to numerous estimates and assumptions requiring significant management judgment about matters that involve a high degree of subjectivity. This process involves the use of models that require us to make judgments about matters that are difficult to predict.
Changes in forecasted house price growth rates can have a significant effect on our allowance for credit losses estimates. The table below shows our nationwide forecasted house price growth rates that were used in determining our allowance for credit losses. See Note 5 for additional information regarding our current period provision for credit losses.
Table 38 - Forecasted House Price Growth Rates
March 31, 2026
December 31, 2025
12-Month Forward
2.3
%
0.5
%
13- to 24-Month Forward
2.4
1.4
Freddie Mac 1Q 2026 Form 10-Q
31
Management's Discussion and Analysis
Regulation and Supervision
REGULATION AND SUPERVISION
In addition to FHFA’s oversight as our Conservator, we are subject to regulation and supervision by FHFA under our Charter and the GSE Act, and regulation by certain other government agencies. FHFA has the authority to direct changes to our processes and require us to take or refrain from actions that may affect our business. Additionally, regulatory activities by other government agencies can indirectly impact us, even if we are not directly subject to their regulation or oversight. For example, changes in regulations affecting the purchase or servicing of mortgages can impact our operations.
The Administration has made comments regarding a number of potential transactions involving us and Fannie Mae, including a public offering of our equity securities while in conservatorship or outside of conservatorship, and the potential for our exit from conservatorship. We cannot predict whether or when any of these transactions could take place or on what terms. While we continue to monitor regulatory and policy developments, we cannot predict the accuracy, timing, or impact of such statements or any related policy actions.
Federal Housing Finance Agency
From time to time, FHFA in its power both as our Conservator and regulator has rescinded or modified certain guidance, directives, and other requirements affecting the Enterprises. FHFA may continue modifying, rescinding, or withdrawing, or changing its approach to implementation and enforcement of, guidance, directives, and other requirements relating to the Enterprises. The impact of these and any similar future actions taken by FHFA are uncertain at this time.
FICO Score 10T and VantageScore 4.0
On April 22, 2026, we announced a limited rollout to accept loans scored with VantageScore® 4.0 (VS4) from approved sellers. We also announced we expect similar implementation efforts for FICO® Score 10T at a later date.
Freddie Mac 1Q 2026 Form 10-Q
32
Management's Discussion and Analysis
Forward-Looking Statements
FORWARD-LOOKING STATEMENTS
We regularly communicate information concerning our business activities to investors, the news media, securities analysts, and others as part of our normal operations. Some of these communications, including this Form 10-Q, contain "forward-looking statements." Examples of forward-looking statements include, but are not limited to, statements pertaining to our conservatorship, our current expectations and objectives for our Single-Family and Multifamily segments, our efforts to assist the housing market, liquidity and capital management, and the effects of economic and market conditions and trends including changes in house prices and house price forecasts, our market coverage, the effect of legislative, judicial, and regulatory developments and new accounting guidance, the credit quality of loans the company owns or guarantees, the costs and benefits of the company’s CRT transactions, the impact of banking crises or failures, and the effects of wars, terrorist incidents, public policy and political developments, cybersecurity incidents, natural disasters or catastrophic events and actions taken in response thereto. Forward-looking statements involve known and unknown risks and uncertainties beyond our control. Forward-looking statements are often accompanied by, and identified with, terms such as "could," "may," "will," "believe," "expect," "anticipate," "forecast," "can," "risk," "would," "design," "option," "continue," and similar phrases. These statements are not historical facts, but rather represent our expectations based on current information, plans, judgments, assumptions, estimates, and projections. Actual results may differ significantly from those described in or implied by such forward-looking statements due to various factors and uncertainties, including those described in the Risk Factors section in our 2025 Annual Report, and including, without limitation, the following:
nThe actions the federal government (including FHFA, Treasury, the executive branch, and Congress) and state governments may take, require us to take, or restrict us from taking, including actions regarding our operations, conservatorship, access to affordable and sustainable housing, such as programs to implement the expectations in FHFA's Conservatorship Scorecards, and other objectives for us;
nThe impacts of a transaction involving us and Fannie Mae, including a public offering of our equity securities while in conservatorship or outside of conservatorship, and the potential for our exit from conservatorship;
nChanges in economic and market conditions, including trade laws or policies such as tariffs, geopolitical instability and conflicts (including in the Middle East), volatility in the financial services industry, changes in employment rates, immigration policy, inflation, interest rates, spreads, and house prices;
nChanges in the fiscal and monetary policies of the Federal Reserve, including changes in target interest rates and in the amount of agency MBS and agency CMBS held by the Federal Reserve;
nThe effect of the restrictions on our business due to the conservatorship and the Purchase Agreement, including any amendments thereto;
nThe impact of any changes in our credit ratings or those of the U.S. government;
nChanges in our Charter, applicable legislative or regulatory requirements (including any legislative or executive action affecting the future status of our company), or the Purchase Agreement;
nChanges to our capital requirements and potential effects of such changes on our business strategies;
nChanges in tax laws;
nChanges in privacy and cybersecurity laws and regulations;
nChanges in accounting policies, practices, standards, or guidance;
nChanges in the U.S. mortgage market, including the supply of houses available for sale, the supply of multifamily rental housing, and changes in the supply and type of loan products;
nThe success of our efforts to mitigate our losses;
nThe success of our strategy to transfer mortgage credit risk;
nOur ability to maintain adequate liquidity to fund our operations;
nOur ability to maintain the security and resiliency of our operational systems and infrastructure, including against cybersecurity incidents or other security incidents, whether due to insider error or malfeasance or system errors or vulnerabilities in our or our third parties' systems;
nOur ability to effectively execute our business strategies, implement significant changes, and improve efficiency;
nThe adequacy of our risk management framework, including the adequacy of our regulatory capital framework prescribed by FHFA and internal models for measuring risk;
nOur ability to manage mortgage credit risk, including the effect of changes in underwriting and servicing practices;
nChanges in credit reporting at the credit reporting bureaus due to regulatory and legal developments, as well as lender practices;
nOur ability to limit or manage our economic exposure and GAAP earnings exposure to interest-rate volatility and spread volatility, including the availability of derivative financial instruments needed for interest-rate and spread risk management purposes and our ability to apply hedge accounting;
Freddie Mac 1Q 2026 Form 10-Q
33
Management's Discussion and Analysis
Forward-Looking Statements
nOur operational ability to issue new securities, make timely and correct payments on securities, and provide initial and ongoing disclosures;
nOur reliance on U.S. FinTech and the mortgage securitization platform for the operation of the majority of our Single-Family securitization activities, limits on our influence over U.S. FinTech Board decisions, and any additional changes FHFA may require in our relationship with, or support of, U.S. FinTech;
nPerformance of and changes in the methodologies, models, assumptions, and estimates we use to prepare our financial statements, make business decisions, and manage risks;
nChanges in investor demand for our debt or mortgage-related securities;
nOur ability to maintain market acceptance of the UMBS, including our ability to maintain alignment of the prepayment speeds and pricing performance of our and Fannie Mae's respective UMBS;
nChanges in the practices or performance of loan originators, servicers, property managers, investors, insurers, and other participants in the secondary mortgage market including changes as a result of the use and/or regulation of AI technologies or other emerging technologies;
n Opportunities and risks presented by our use of AI and other emerging technologies;
nCompetition from other market participants, which could affect the pricing we offer for and the performance of our mortgage-related products, the credit characteristics of the loans we purchase, and our ability to meet our affordable housing goals and other mandated activities;
nThe availability of critical third parties, or their vendors and other business partners, to deliver products or services, or to manage risks, including cybersecurity risk, effectively;
nThe occurrence of a catastrophic event or natural disaster in areas in which our offices, significant portions of our total mortgage portfolio, or the offices of critical third parties are located, and for which we may be uninsured or significantly underinsured; and
nOther factors and assumptions described in this Form 10-Q and our 2025 Annual Report, including in the MD&A section.
Forward-looking statements are made only as of the date of this Form 10-Q, and we undertake no obligation to update any forward-looking statements we make to reflect events or circumstances occurring after the date of this Form 10-Q.
Freddie Mac 1Q 2026 Form 10-Q
34
Financial Statements
Financial Statements
Freddie Mac 1Q 2026 Form 10-Q
35
Financial Statements
Condensed Consolidated Statements of Income and Comprehensive Income
FREDDIE MAC
Condensed Consolidated Statements of Income and Comprehensive Income (Unaudited)
(In millions, except share-related amounts)
1Q 2026
1Q 2025
Net interest income
Interest income
$33,650
$31,365
Interest expense
(28,031)
(26,263)
Net interest income
5,619
5,102
Non-interest income
Guarantee income
320
440
Investment gains (losses), net
42
192
Other income
152
118
Non-interest income
514
750
Net revenues
6,133
5,852
(Provision) benefit for credit losses
320
(280)
Non-interest expense
Salaries and employee benefits
(376)
(423)
Professional services, technology, and occupancy
(250)
(253)
Credit enhancement expense
(441)
(540)
Legislative and regulatory assessments
(832)
(817)
Other expense
(123)
(55)
Non-interest expense
(2,022)
(2,088)
Income before income tax expense
4,431
3,484
Income tax expense
(873)
(690)
Net income
3,558
2,794
Other comprehensive income (loss), net of taxes and reclassification adjustments
(20)
34
Comprehensive income
$3,538
$2,828
Net income
$3,558
$2,794
Amounts attributable to senior preferred stock
(3,538)
(2,828)
Net income (loss) attributable to common stockholders
$20
($34)
Net income (loss) per common share
$0.01
($0.01)
Weighted average common shares (in millions)
3,234
3,234
The accompanying notes are an integral part of these condensed consolidated financial statements.
Freddie Mac 1Q 2026 Form 10-Q
36
Financial Statements
Condensed Consolidated Balance Sheets
FREDDIE MAC
Condensed Consolidated Balance Sheets (Unaudited)
March 31,
December 31,
(In millions, except share-related amounts)
2026
2025
Assets
Cash and cash equivalents (includes $1,299 and $1,234 of restricted cash and cash equivalents)
$4,469
$5,327
Securities purchased under agreements to resell
74,804
71,919
Investment securities, at fair value
75,939
85,412
Mortgage loans held-for-sale
1,225
1,014
Mortgage loans held-for-investment (net of allowance for credit losses of $7,643 and $7,968 and includes $6,906 and $7,005 at fair value)
3,302,306
3,290,066
Accrued interest receivable
12,207
12,254
Deferred tax assets, net
4,740
5,040
Other assets (includes $6,294 and $6,421 at fair value)
29,628
26,566
Total assets
$3,505,318
$3,497,598
Liabilities and equity
Liabilities
Accrued interest payable
$10,556
$10,597
Debt issued by consolidated trusts (includes $5,971 and $5,841 at fair value)
3,214,995
3,198,008
Short-term debt
24,408
37,718
Long-term debt (includes $189 and $195 at fair value)
169,850
169,296
Other liabilities (includes $983 and $781 at fair value)
11,587
11,595
Total liabilities
3,431,396
3,427,214
Commitments and contingencies
Equity
Senior preferred stock (liquidation preference of $143,032 and $140,248)
72,648
72,648
Preferred stock, at redemption value
14,109
14,109
Common stock, $0.00 par value, 4,000,000,000 shares authorized, 725,863,886 shares issued and 650,059,553 shares outstanding
—
—
Retained earnings
(8,981)
(12,539)
AOCI, net of taxes
31
51
Treasury stock, at cost, 75,804,333 shares
(3,885)
(3,885)
Total equity
73,922
70,384
Total liabilities and equity
$3,505,318
$3,497,598
The table below presents the carrying value and classification of the assets and liabilities related to consolidated VIEs on our condensed consolidated balance sheets.
March 31,
December 31,
(In millions)
2026
2025
Assets
Cash and cash equivalents (includes $1,202 and $1,136 of restricted cash and cash equivalents)
$1,202
$1,136
Securities purchased under agreements to resell
22,262
19,107
Investment securities, at fair value
446
34
Mortgage loans held-for-investment
3,222,541
3,198,847
Accrued interest receivable
10,970
10,825
Other assets
10,879
8,573
Total assets of consolidated VIEs
$3,268,300
$3,238,522
Liabilities
Accrued interest payable
$9,441
$9,312
Debt issued by consolidated trusts
3,214,995
3,198,008
Total liabilities of consolidated VIEs
$3,224,436
$3,207,320
The accompanying notes are an integral part of these condensed consolidated financial statements.
Freddie Mac 1Q 2026 Form 10-Q
37
Financial Statements
Condensed Consolidated Statements of Equity
FREDDIE MAC
Condensed Consolidated Statements of Equity (Unaudited)
Three Months Ended March 31,
(In millions)
2026
2025
Senior preferred stock
Balance at beginning of period and March 31
$72,648
$72,648
Preferred stock, at redemption value
Balance at beginning of period and March 31
14,109
14,109
Common stock, at par value
Balance at beginning of period and March 31
—
—
Retained earnings
Balance at beginning of period
(12,539)
(23,270)
Net income
3,558
2,794
Balance at March 31
(8,981)
(20,476)
AOCI, net of tax
Balance at beginning of period
51
(27)
Other comprehensive income (loss), net of taxes of $5 million and, $9 million, respectively
(20)
34
Balance at March 31
31
7
Treasury stock, at cost
Balance at beginning of period and March 31
(3,885)
(3,885)
Total equity
$73,922
$62,403
The accompanying notes are an integral part of these condensed consolidated financial statements.
Freddie Mac 1Q 2026 Form 10-Q
38
Financial Statements
Condensed Consolidated Statements of Cash Flows
FREDDIE MAC
Condensed Consolidated Statements of Cash Flows (Unaudited)
(In millions)
1Q 2026
1Q 2025
Net cash provided by (used in) operating activities
$3,868
$3,572
Cash flows from investing activities
Investment securities:
Purchases
(18,278)
(14,755)
Proceeds from sales
22,518
9,652
Proceeds from maturities and repayments
4,603
1,230
Mortgage loans acquired held-for-investment:
Purchases
(47,973)
(25,925)
Proceeds from sales
443
946
Proceeds from repayments
98,902
65,573
Advances under secured lending arrangements
(38,303)
(27,899)
Net (increase) decrease in securities purchased under agreements to resell
(750)
(968)
Cash flows related to derivatives
387
(1,182)
Other, net
(108)
(183)
Net cash provided by (used in) investing activities
21,441
6,489
Cash flows from financing activities
Debt issued by consolidated trusts:
Proceeds from issuance
100,854
65,596
Repayments and redemptions
(112,410)
(69,476)
Borrowings with original maturity of more than three months:
Proceeds from issuance
48,476
24,257
Repayments
(48,693)
(34,845)
Net increase (decrease) in:
Borrowings with original maturity of three months or less
(12,258)
7,648
Securities sold under agreements to repurchase
(2,135)
(3,984)
Other, net
(1)
(1)
Net cash provided by (used in) financing activities
(26,167)
(10,805)
Net increase (decrease) in cash and cash equivalents (includes restricted cash and cash equivalents)
(858)
(744)
Cash and cash equivalents (includes restricted cash and cash equivalents) at the beginning of year
5,327
5,534
Cash and cash equivalents (includes restricted cash and cash equivalents) at end of period
$4,469
$4,790
Supplemental cash flow information
Cash paid for:
Debt interest
$29,832
$27,348
Income taxes (net of refunds received)
—
—
Non-cash investing and financing activities (Note 3)
The accompanying notes are an integral part of these condensed consolidated financial statements.
Freddie Mac 1Q 2026 Form 10-Q
39
Financial Statements
Notes to the Condensed Consolidated Financial Statements| Note 1
Notes to Condensed Consolidated Financial Statements
NOTE 1
Summary of Significant Accounting Policies
Freddie Mac is a GSE chartered by Congress in 1970, with a mission to provide liquidity, stability, and affordability to the U.S. housing market. We are regulated by FHFA, the SEC, HUD, and Treasury, and are currently operating under the conservatorship of FHFA. The conservatorship and related matters significantly affect our management, business activities, financial condition, and results of operations. In connection with our entry into conservatorship, we entered into the Purchase Agreement with Treasury, under which we issued Treasury both senior preferred stock and a warrant to purchase common stock. Our Purchase Agreement with Treasury is critical to keeping us solvent and avoiding the appointment of a receiver by FHFA under statutory mandatory receivership provisions. We believe the support provided by Treasury pursuant to the Purchase Agreement currently enables us to have adequate liquidity to conduct normal business activities. For more information on the conservatorship, the roles of FHFA and Treasury, and the Purchase Agreement, see our 2025 Annual Report. Throughout our unaudited condensed consolidated financial statements and related notes, we use certain acronyms and terms which are defined in the Glossary of our 2025 Annual Report.
The accompanying unaudited condensed consolidated financial statements should be read in conjunction with the audited consolidated financial statements and related notes in our 2025 Annual Report.
Basis of Presentation
The accompanying unaudited condensed consolidated financial statements have been prepared in accordance with GAAP and include our accounts as well as the accounts of other entities in which we have a controlling financial interest. All intercompany balances and transactions have been eliminated.
We have reclassified certain amounts reported in our prior period condensed consolidated financial statements to conform to the current period presentation.
We are operating under the basis that we will realize assets and satisfy liabilities in the normal course of business as a going concern and in accordance with the authority provided by FHFA to our Board of Directors to oversee management's conduct of our business operations. In the opinion of management, our unaudited condensed consolidated financial statements contain all adjustments, which include only normal recurring adjustments, necessary for a fair statement of our results.
Use of Estimates
The preparation of our condensed consolidated financial statements requires management to make estimates and assumptions that affect the reported amounts of assets and liabilities, revenues and expenses, and disclosure of contingent assets and liabilities at the date of the financial statements. Management has made significant estimates to report the allowance for credit losses on single-family mortgage loans. Actual results could be different from these estimates.
Freddie Mac 1Q 2026 Form 10-Q
40
Financial Statements
Notes to the Condensed Consolidated Financial Statements| Note 1
Recently Issued Accounting Guidance
Recently Adopted Accounting Guidance
Standard
Description
Date of Adoption
Effect on Consolidated Financial Statements
ASU 2025-09, Derivatives and Hedging (Topic 815): Hedge Accounting Improvements
The amendments in this Update clarify certain aspects of the guidance on hedge accounting and address several incremental hedging issues arising from the global reference rate reform initiative.
January 1, 2026
The adoption of these amendments did not have a material effect on our consolidated financial statements.
Recently Issued Accounting Guidance, Not Yet Adopted Within Our Consolidated Financial Statements
Standard
Description
Date of Adoption
Effect on Consolidated Financial Statements
ASU 2024-03, Income Statement - Reporting Comprehensive Income - Expense Disaggregation Disclosures (Subtopic 220-40): Disaggregation of Income Statement Expenses
The amendments in this Update require disaggregated disclosures for certain expense categories.
December 31, 2027
We do not expect the adoption of these amendments to have a material effect on our consolidated financial statements.
The amendments in this Update expand the population of acquired financial assets subject to the gross-up approach in Topic 326.
January 1, 2027
We do not expect the adoption of these amendments to have a material effect on our consolidated financial statements.
Freddie Mac 1Q 2026 Form 10-Q
41
Financial Statements
Notes to the Condensed Consolidated Financial Statements|Note 2
NOTE 2
Securitization and Consolidation
Nonconsolidated VIEs
The table below presents the carrying amounts and classification of the assets and liabilities recorded on our condensed consolidated balance sheets that relate to our variable interests in VIEs for which we are not the primary beneficiary and with which we were involved in the design and creation and have a significant continuing involvement, our maximum exposure to loss as a result of our involvement with such VIEs, and the total assets of the VIEs. Our involvement with such VIEs primarily consists of guarantees that we have issued to the VIE, some of which are accounted for as derivative instruments, and investments in debt securities issued by the VIE. See Note 4 for additional information on our guarantees to nonconsolidated VIEs.
Total assets shown in the table below represents the remaining UPB of the mortgage loans or other noncash financial assets held by the VIE and excludes cash and nonfinancial assets held by the VIE. Maximum exposure to loss shown in the table below is primarily based on the remaining UPB of the guaranteed securities issued by the VIE and represents the contractual amounts that could be lost if the assets of the VIE (including the assets in the related reference pool for CRT products) became worthless at the balance sheet date, without consideration of proceeds from related collateral liquidation and possible recoveries under credit enhancements. We do not believe the maximum exposure to loss from our involvement with nonconsolidated VIEs is representative of the actual loss we are likely to incur based on our historical loss experience and after consideration of proceeds from related collateral liquidation and available credit enhancements.
Table 2.1 - Nonconsolidated VIEs
March 31, 2026
Carrying Amounts of the Assets and Liabilities on the Condensed Consolidated Balance Sheets
Total Assets
Maximum Exposure to Loss
(In millions)
Investment Securities
Accrued Interest Receivable and Other Assets(1)
Liabilities(1)
Single-Family:
Securitization products
$1,416
$157
$491
$29,528
$24,180
Resecuritization products(2)
5,139
81
710
97,155
97,525
CRT products(3)
—
100
108
24,614
5
Total Single-Family
6,555
338
1,309
151,297
121,710
Multifamily:
Securitization products(4)
4,255
4,656
3,661
324,122
292,245
CRT products(3)
—
34
20
2,759
16
Total Multifamily
4,255
4,690
3,681
326,881
292,261
Other
—
6
—
61
14
Total
$10,810
$5,034
$4,990
$478,239
$413,985
Freddie Mac 1Q 2026 Form 10-Q
42
Financial Statements
Notes to the Condensed Consolidated Financial Statements|Note 2
December 31, 2025
Carrying Amounts of the Assets and Liabilities on the Condensed Consolidated Balance Sheets
Total Assets
Maximum Exposure to Loss
(In millions)
Investment Securities
Accrued Interest Receivable and Other Assets(1)
Liabilities(1)
Single-Family:
Securitization products
$1,451
$162
$498
$30,025
$24,604
Resecuritization products(2)
5,503
74
675
98,370
98,754
CRT products(3)
—
97
134
24,437
6
Total Single-Family
6,954
333
1,307
152,832
123,364
Multifamily:
Securitization products(4)
5,052
4,886
3,792
332,572
299,507
CRT products(3)
—
31
21
2,446
16
Total Multifamily
5,052
4,917
3,813
335,018
299,523
Other
—
7
—
64
15
Total
$12,006
$5,257
$5,120
$487,914
$422,902
(1) Other assets primarily include our guarantee assets. Liabilities primarily include our guarantee obligations.
(2) Total assets and maximum exposure to loss are primarily based on the UPB of Fannie Mae securities underlying commingled Freddie Mac resecuritization trusts. We exclude noncommingled resecuritization trusts from these amounts as we have already guaranteed the underlying collateral and therefore noncommingled resecuritizations do not involve any incremental assets or create any incremental exposure to credit risk.
(3) Maximum exposure to loss is based on our expected recovery receivables and excludes our obligations to make certain payments to the VIE to support payment of the interest due on the notes issued by the VIE, which we account for as derivative instruments. The notional value of these derivative instruments is equal to the total assets of the VIE.
(4) Maximum exposure to loss excludes the exposure related to advances made by us as guarantor or master servicer. The outstanding balance of guarantor advances were $0.3 billion and $0.4 billion as of March 31, 2026 and December 31, 2025, respectively. The outstanding balance of master servicer advances were not material for the periods presented.
Investments in Low Income Housing Tax Credits
We invest in LIHTC partnerships to support and preserve the supply of affordable housing. These investments do not provide us with a controlling financial interest in the underlying partnerships and we therefore do not consolidate these entities. We have elected to account for these investments using the proportional amortization method when applicable. The carrying amount of our investments in LIHTC partnerships is presented in other assets on our condensed consolidated balance sheets and totaled $5.3 billion as of March 31, 2026 and $5.2 billion as of December 31, 2025.
Freddie Mac 1Q 2026 Form 10-Q
43
Financial Statements
Notes to the Condensed Consolidated Financial Statements | Note 3
NOTE 3
Mortgage Loans
The table below provides details of the loans on our condensed consolidated balance sheets.
Table 3.1 - Mortgage Loans
March 31, 2026
December 31, 2025
(In millions)
Single-Family
Multifamily
Total
Single-Family
Multifamily
Total
Held-for-sale UPB
$1,449
$2
$1,451
$1,108
$136
$1,244
Cost basis and fair value adjustments, net
(225)
(1)
(226)
(216)
(14)
(230)
Total held-for-sale loans, net
1,224
1
1,225
892
122
1,014
Held-for-investment UPB
3,119,960
164,268
3,284,228
3,117,945
153,124
3,271,069
Cost basis and fair value adjustments, net(1)
26,291
(570)
25,721
27,491
(526)
26,965
Allowance for credit losses
(6,977)
(666)
(7,643)
(7,297)
(671)
(7,968)
Total held-for-investment loans, net(2)
3,139,274
163,032
3,302,306
3,138,139
151,927
3,290,066
Total mortgage loans, net
$3,140,498
$163,033
$3,303,531
$3,139,031
$152,049
$3,291,080
(1)Includes ($0.4) billion and ($0.3) billion of basis adjustments maintained on a closed portfolio basis related to existing portfolio layer method fair value hedge relationships as of March 31, 2026 and December 31, 2025, respectively.
(2)Includes $6.9 billion and $7.0 billion of multifamily held-for-investment loans for which we have elected the fair value option as of March 31, 2026 and December 31, 2025, respectively.
The table below provides details of the UPB of loans we purchased and sold during the periods presented.
Table 3.2 - Loans Purchased and Sold
(In millions)
1Q 2026
1Q 2025
Single-Family:
Purchases:
Held-for-investment loans
$102,513
$77,646
Sales of held-for-sale loans(1)
—
759
Multifamily:
Purchases:
Held-for-investment loans
12,700
3,914
Held-for-sale loans
96
5,431
Sales of held-for-sale loans(2)
671
6,604
(1)Our sales of single-family loans reflect the sale of single-family seasoned loans.
(2)Our sales of multifamily loans occur primarily through the issuance of Multifamily K Certificates.
Freddie Mac 1Q 2026 Form 10-Q
44
Financial Statements
Notes to the Condensed Consolidated Financial Statements | Note 3
Reclassifications
The table below presents the allowance for credit losses or valuation allowance that was reversed or established due to loan reclassifications between held-for-investment and held-for-sale during the periods presented.
Table 3.3 - Loan Reclassifications(1)
1Q 2026
1Q 2025
(In millions)
UPB
Allowance for Credit Losses Reversed or (Established)
Valuation Allowance (Established) or Reversed
UPB
Allowance for Credit Losses Reversed or (Established)
Valuation Allowance (Established) or Reversed
Single-Family reclassifications from:
Held-for-investment to held-for-sale
$542
$22
$—
$689
$7
$—
Held-for-sale to held-for-investment(2)
146
9
12
258
21
13
Multifamily reclassifications from:
Held-for-investment to held-for-sale
442
1
(20)
527
1
(27)
Held-for-sale to held-for-investment(2)
—
—
—
190
(1)
5
(1)Amounts exclude reclassifications related to loans for which we have elected the fair value option.
(2)Allowance for credit losses established upon loan reclassifications from held-for-sale to held-for-investment to reflect the net amount we expect to collect on the loan. Loans with prior charge-offs may have a negative allowance for credit losses established upon reclassification.
Interest Income
The table below presents the amortized cost basis of non-accrual loans as of the beginning and the end of the periods presented, including the interest income recognized for the period that is related to the loans on non-accrual status as of the period end.
Table 3.4 - Amortized Cost Basis of Held-for-Investment Loans on Non-Accrual(1)
Non-Accrual Amortized Cost Basis
Interest Income Recognized(2)
(In millions)
March 31, 2026
December 31, 2025
1Q 2026
Single-Family:
20- and 30-year or more, amortizing fixed-rate
$17,002
$16,739
$48
15-year or less, amortizing fixed-rate
462
482
1
Adjustable-rate and other
217
221
—
Total Single-Family
17,681
17,442
49
Total Multifamily
50
227
—
Total Single-Family and Multifamily
$17,731
$17,669
$49
Non-Accrual Amortized Cost Basis
Interest Income Recognized(2)
(In millions)
March 31, 2025
December 31, 2024
1Q 2025
Single-Family:
20- and 30-year or more, amortizing fixed-rate
$15,724
$15,157
$43
15-year or less, amortizing fixed-rate
487
511
1
Adjustable-rate and other
256
240
1
Total Single-Family
16,467
15,908
45
Total Multifamily
207
125
1
Total Single-Family and Multifamily
$16,674
$16,033
$46
(1)Excludes amounts related to loans for which we have elected the fair value option.
(2)Represents the amount of payments received during the period, including those received while the loans were on accrual status, for the held-for-investment loans on non-accrual status as of period end.
Freddie Mac 1Q 2026 Form 10-Q
45
Financial Statements
Notes to the Condensed Consolidated Financial Statements | Note 3
The table below provides the amount of accrued interest receivable presented on our condensed consolidated balance sheets and the amount of accrued interest receivable related to loans on non-accrual status at the end of the periods that was charged off.
Table 3.5 - Accrued Interest Receivable and Related Charge-Offs
Accrued Interest Receivable
Accrued Interest Receivable Related Charge-Offs
(In millions)
March 31, 2026
December 31, 2025
1Q 2026
1Q 2025
Single-Family loans
$10,598
$10,547
($73)
($64)
Multifamily loans
708
663
—
(3)
Credit Quality
Single-Family
The current LTV ratio is a key factor we consider when estimating our allowance for credit losses for single-family loans. As current LTV ratios increase, the borrower's equity in the home decreases, which may negatively affect the borrower's ability to refinance or to sell the property for an amount at or above the balance of the outstanding loan.
The table below presents the amortized cost basis of single-family held-for-investment loans by current LTV ratio and charge-offs related to these loans. Our current LTV ratios are estimates based on available data through the end of each period presented.
Freddie Mac 1Q 2026 Form 10-Q
46
Financial Statements
Notes to the Condensed Consolidated Financial Statements | Note 3
Table 3.6 - Amortized Cost Basis of Single-Family Held-for-Investment Loans by Current LTV Ratio and Vintage
March 31, 2026
Year of Origination
Total
(In millions)
2026
2025
2024
2023
2022
Prior
Current LTV ratio:
20- and 30-year or more, amortizing fixed-rate
≤ 60
$8,698
$50,304
$44,393
$37,527
$114,041
$1,473,337
$1,728,300
> 60 to 80
24,341
121,494
103,454
89,654
157,726
208,915
705,584
> 80 to 90
11,704
66,473
62,480
46,818
41,470
9,799
238,744
> 90 to 100
12,397
82,702
47,792
14,915
9,725
1,533
169,064
> 100
67
738
2,323
1,889
1,830
244
7,091
Total 20- and 30-year or more, amortizing fixed-rate
57,207
321,711
260,442
190,803
324,792
1,693,828
2,848,783
Current-year gross charge-offs
—
2
17
28
36
41
124
15-year or less, amortizing fixed-rate
≤ 60
1,921
10,706
5,535
3,824
19,373
198,169
239,528
> 60 to 80
2,222
9,611
3,903
1,636
1,513
235
19,120
> 80 to 90
609
2,013
545
83
44
1
3,295
> 90 to 100
262
955
68
10
7
—
1,302
> 100
3
8
1
—
—
—
12
Total 15-year or less, amortizing fixed-rate
5,017
23,293
10,052
5,553
20,937
198,405
263,257
Current-year gross charge-offs
—
—
—
—
1
1
2
Adjustable-rate and other
≤ 60
367
1,937
337
401
1,723
13,138
17,903
> 60 to 80
976
4,578
886
1,125
2,055
603
10,223
> 80 to 90
386
2,046
495
562
556
26
4,071
> 90 to 100
269
1,577
209
145
128
5
2,333
> 100
—
4
3
16
23
1
47
Total adjustable-rate and other
1,998
10,142
1,930
2,249
4,485
13,773
34,577
Current-year gross charge-offs
—
—
—
—
—
—
—
Total for all loan product types by current LTV ratio:
≤ 60
10,986
62,947
50,265
41,752
135,137
1,684,644
1,985,731
> 60 to 80
27,539
135,683
108,243
92,415
161,294
209,753
734,927
> 80 to 90
12,699
70,532
63,520
47,463
42,070
9,826
246,110
> 90 to 100
12,928
85,234
48,069
15,070
9,860
1,538
172,699
> 100
70
750
2,327
1,905
1,853
245
7,150
Total Single-Family loans
$64,222
$355,146
$272,424
$198,605
$350,214
$1,906,006
$3,146,617
Total current-year gross charge-offs
$—
$2
$17
$28
$37
$42
$126
Freddie Mac 1Q 2026 Form 10-Q
47
Financial Statements
Notes to the Condensed Consolidated Financial Statements | Note 3
December 31, 2025
Year of Origination
Total
(In millions)
2025
2024
2023
2022
2021
Prior
Current LTV ratio:
20- and 30-year or more, amortizing fixed-rate
≤ 60
$47,112
$47,188
$39,388
$114,149
$557,834
$936,838
$1,742,509
> 60 to 80
118,639
110,794
95,194
162,477
179,033
40,311
706,448
> 80 to 90
60,372
67,451
50,223
43,480
9,002
1,135
231,663
> 90 to 100
77,814
51,196
16,197
10,399
1,386
292
157,284
> 100
557
2,426
1,822
1,663
156
84
6,708
Total 20- and 30-year or more, amortizing fixed-rate
304,494
279,055
202,824
332,168
747,411
978,660
2,844,612
Full-year gross charge-offs
1
22
44
73
54
172
366
15-year or less, amortizing fixed-rate
≤ 60
9,953
5,816
3,987
19,872
96,005
111,387
247,020
> 60 to 80
9,450
4,281
1,879
1,833
286
17
17,746
> 80 to 90
1,967
639
105
57
3
—
2,771
> 90 to 100
1,007
104
15
7
—
—
1,133
> 100
8
2
1
—
—
—
11
Total 15-year or less, amortizing fixed-rate
22,385
10,842
5,987
21,769
96,294
111,404
268,681
Full-year gross charge-offs
—
—
—
1
1
1
3
Adjustable-rate and other
≤ 60
1,797
358
412
1,753
3,121
10,469
17,910
> 60 to 80
4,321
923
1,184
2,138
489
155
9,210
> 80 to 90
1,783
522
581
574
19
9
3,488
> 90 to 100
1,312
226
153
132
3
2
1,828
> 100
2
2
12
19
—
2
37
Total adjustable-rate and other
9,215
2,031
2,342
4,616
3,632
10,637
32,473
Full-year gross charge-offs
—
—
—
1
—
1
2
Total for all loan product types by current LTV ratio:
≤ 60
58,862
53,362
43,787
135,774
656,960
1,058,694
2,007,439
> 60 to 80
132,410
115,998
98,257
166,448
179,808
40,483
733,404
> 80 to 90
64,122
68,612
50,909
44,111
9,024
1,144
237,922
> 90 to 100
80,133
51,526
16,365
10,538
1,389
294
160,245
> 100
567
2,430
1,835
1,682
156
86
6,756
Total Single-Family loans
$336,094
$291,928
$211,153
$358,553
$847,337
$1,100,701
$3,145,766
Total full-year gross charge-offs
$1
$22
$44
$75
$55
$174
$371
Multifamily
The table below presents the amortized cost basis of our multifamily held-for-investment loans, for which we have not elected the fair value option, by credit quality indicator, and charge-offs related to these loans. These indicators are based on available data through the end of each period presented, involve significant management judgment, and are defined as follows:
n"Pass" is current and adequately protected by the borrower's current financial strength and debt service capacity;
n"Special mention" has administrative issues that may affect future repayment prospects but does not have current credit weaknesses. In addition, this category generally includes loans in forbearance;
n"Substandard" has a weakness that jeopardizes the timely full repayment; and
n"Doubtful" has a weakness that makes collection or liquidation in full highly questionable and improbable based on existing conditions.
Freddie Mac 1Q 2026 Form 10-Q
48
Financial Statements
Notes to the Condensed Consolidated Financial Statements | Note 3
Table 3.7 - Amortized Cost Basis of Multifamily Held-for-Investment Loans by Credit Quality Indicator and Vintage
March 31, 2026
Year of Origination
Total
(In millions)
2026
2025
2024
2023
2022
Prior
Revolving Loans
Category:
Pass
$8,783
$66,396
$28,076
$12,949
$15,233
$20,258
$1,626
$153,321
Special mention
—
236
313
139
274
739
—
1,701
Substandard
—
—
254
419
662
435
—
1,770
Doubtful
—
—
—
—
—
—
—
—
Total
$8,783
$66,632
$28,643
$13,507
$16,169
$21,432
$1,626
$156,792
Current-year gross charge-offs
$—
$—
$—
$—
$—
$50
$—
$50
December 31, 2025
Year of Origination
Total
(In millions)
2025
2024
2023
2022
2021
Prior
Revolving Loans
Category:
Pass
$63,205
$28,613
$13,374
$15,732
$7,238
$12,947
$1,851
$142,960
Special mention
—
49
173
177
96
670
—
1,165
Substandard
—
163
266
581
233
225
—
1,468
Doubtful
—
—
—
—
—
—
—
—
Total
$63,205
$28,825
$13,813
$16,490
$7,567
$13,842
$1,851
$145,593
Full-year gross charge-offs
$—
$—
$—
$11
$—
$115
$—
$126
Past Due Status
The table below presents the amortized cost basis of our single-family and multifamily held-for-investment loans, for which we have not elected the fair value option, by payment status.
Table 3.8 - Amortized Cost Basis of Held-for-Investment Loans by Payment Status(1)
March 31, 2026
(In millions)
Current
One
Month
Past Due
Two
Months
Past Due
Three Months or
More Past Due,
or in Foreclosure(2)
Total
Non-Accrual With No Allowance(3)
Single-Family:
20- and 30-year or more, amortizing fixed-rate
$2,800,859
$24,719
$6,726
$16,479
$2,848,783
$755
15-year or less, amortizing fixed-rate
261,508
1,079
220
450
263,257
7
Adjustable-rate and other
34,024
270
72
211
34,577
33
Total Single-Family
3,096,391
26,068
7,018
17,140
3,146,617
795
Total Multifamily
156,629
28
38
97
156,792
40
Total Single-Family and Multifamily
$3,253,020
$26,096
$7,056
$17,237
$3,303,409
$835
Freddie Mac 1Q 2026 Form 10-Q
49
Financial Statements
Notes to the Condensed Consolidated Financial Statements | Note 3
December 31, 2025
(In millions)
Current
One Month Past Due
Two Months Past Due
Three Months or More Past Due, or in Foreclosure(2)
Total
Non-Accrual with No Allowance(3)
Single-Family:
20- and 30-year or more, amortizing fixed-rate
$2,793,168
$27,286
$7,892
$16,266
$2,844,612
$662
15-year or less, amortizing fixed-rate
266,741
1,196
276
468
268,681
7
Adjustable-rate and other
31,880
291
87
215
32,473
31
Total Single-Family
3,091,789
28,773
8,255
16,949
3,145,766
700
Total Multifamily
145,344
57
2
190
145,593
132
Total Single-Family and Multifamily
$3,237,133
$28,830
$8,257
$17,139
$3,291,359
$832
(1)The amount of held-for-investment loans three months or more past due and accruing interest was not material as of March 31, 2026. There were no held-for-investment loans that were three months or more past due and accruing interest as of December 31, 2025.
(2)Includes $4.1 billion and $4.0 billion of single-family loans that were in the process of foreclosure as of March 31, 2026 and December 31, 2025, respectively.
(3)Loans with no allowance for loan losses primarily represent loans that were previously charged off and for which the amount we expect to collect is sufficiently in excess of the amortized cost to result in recovery of the entire amortized cost basis if the property were foreclosed upon or otherwise subject to disposition. We exclude the amounts of allowance for credit losses on advances of pre-foreclosure costs when determining whether a loan has an allowance for credit losses.
Loan Restructurings
Single-Family Loan Restructurings
We offer several types of restructurings to single-family borrowers that may result in a payment delay, interest rate reduction, term extension, or combination thereof. We do not offer principal forgiveness.
For purposes of the disclosure related to single-family loan restructurings involving borrowers experiencing financial difficulty, we exclude loans that were held-for-sale either at the time of restructuring or at the period end. The table below presents the period-end amortized cost basis of single-family held-for-investment loan restructurings involving borrowers experiencing financial difficulty that we entered into during the periods presented.
Payment Delay, Term Extension, and Interest Rate Reduction
Total
Total as % of Class of Financing Receivable(3)
Single-Family:
20- and 30-year or more, amortizing fixed-rate
$6,079
$1,886
$419
$8,384
0.3
%
15-year or less, amortizing fixed-rate
189
2
—
191
0.1
Adjustable-rate and other
54
2
—
56
0.2
Total Single-Family loan restructurings
$6,322
$1,890
$419
$8,631
0.3
1Q 2025
(Dollars in millions)
Payment Delay(2)
Payment Delay and Term Extension
Payment Delay, Term Extension, and Interest Rate Reduction
Total
Total as % of Class of Financing Receivable(3)
Single-Family:
20- and 30-year or more, amortizing fixed-rate
$7,308
$1,675
$121
$9,104
0.3
%
15-year or less, amortizing fixed-rate
255
—
—
255
0.1
Adjustable-rate and other
67
4
1
72
0.3
Total Single-Family loan restructurings
$7,630
$1,679
$122
$9,431
0.3
Freddie Mac 1Q 2026 Form 10-Q
50
Financial Statements
Notes to the Condensed Consolidated Financial Statements | Note 3
(1) Type of loan restructurings reflects the cumulative effects of the loan restructurings received during the period. Includes loan modifications in the period in which the borrower completes the trial period and the loan is permanently modified. The amortized cost basis of loans in the trial period modification plans was $4.1 billion and $2.9 billion as of March 31, 2026 and March 31, 2025, respectively. Most of these loans are 20- and 30-year or more, amortizing fixed-rate loans.
(2) Includes $2.3 billion and $2.8 billion related to payment deferral plans for 1Q 2026 and 1Q 2025, respectively. Also includes forbearance plans, repayment plans, and loan modifications that only involve payment delays.
(3) Based on the amortized cost basis as of period end, divided by the total period-end amortized cost basis of the corresponding financing receivable class of single-family held-for-investment loans.
The table below shows the financial effect of single-family held-for-investment loan restructurings involving borrowers experiencing financial difficulty that we entered into during the periods presented.
Weighted-Average Payment Deferral or Principal Forbearance(2)
Single-Family:
20- and 30-year or more, amortizing fixed-rate
0.7
%
144
$26
15-year or less, amortizing fixed-rate
—
33
11
Adjustable-rate and other
NM
157
15
1Q 2025
(Dollars in thousands)
Weighted-Average Interest Rate Reduction
Weighted-Average Months of Term Extension
Weighted-Average Payment Deferral or Principal Forbearance(2)
Single-Family:
20- and 30-year or more, amortizing fixed-rate
0.6
%
166
$15
15-year or less, amortizing fixed-rate
—
NM
10
Adjustable-rate and other
0.6
224
11
(1) Averages are based on payment deferral plans and loan modifications completed during the periods presented. The financial effects of forbearance plans and repayment plans consist of a payment delay of between one and twelve months. In addition, the financial effect of a forbearance plan is included at the time the forbearance plan is completed if the borrower exits forbearance by entering into a payment deferral plan or loan modification.
(2) Primarily related to payment deferral plans. Amounts are based on non-interest-bearing principal balances on the restructured loans.
The table below provides the amortized cost basis of single-family held-for-investment loans that had a payment default (i.e., loans that became two months delinquent) during the periods presented and had been restructured within the previous 12 months preceding the payment default, when the borrower was experiencing financial difficulty at the time of the restructuring.
Payment Delay, Term Extension, and Interest Rate Reduction
Total
Single-Family:
20- and 30-year or more, amortizing fixed-rate
$1,056
$982
$136
$2,174
15-year or less, amortizing fixed-rate
24
—
—
24
Adjustable-rate and other
11
1
—
12
Total Single-Family
$1,091
$983
$136
$2,210
Freddie Mac 1Q 2026 Form 10-Q
51
Financial Statements
Notes to the Condensed Consolidated Financial Statements | Note 3
1Q 2025
(In millions)
Payment Delay
Payment Delay and Term Extension
Payment Delay, Term Extension, and Interest Rate Reduction
Total
Single-Family:
20- and 30-year or more, amortizing fixed-rate
$975
$606
$9
$1,590
15-year or less, amortizing fixed-rate
35
—
—
35
Adjustable-rate and other
11
1
—
12
Total Single-Family
$1,021
$607
$9
$1,637
(1) Excludes forbearance plans and repayment plans as borrowers are typically past due based on the loan's original contractual terms at the time the borrowers enter into these plans.
The table below provides the single-family held-for-investment loan performance in the 12 months after a restructuring involving borrowers experiencing financial difficulty. While a single-family loan is in a forbearance plan or repayment plan, payments continue to be due based on the loan’s original contractual terms because the loan has not been permanently modified. As a result, we report single-family loans in forbearance plans and repayment plans as delinquent to the extent that payments are past due based on the loan’s original contractual terms. Loans that have been restructured by entering into a payment deferral plan or loan modification are reported as delinquent to the extent that payments are past due based on the loan's restructured terms.
Table 3.12 - Amortized Cost Basis of Single-Family Restructured Loans Involving Borrowers Experiencing Financial Difficulty by Payment Status
March 31, 2026
(In millions)
Current
One Month Past Due
Two Months Past Due
Three Months or More Past Due
Total
Single-Family:
20- and 30-year or more, amortizing fixed-rate
$15,192
$3,506
$2,029
$7,008
$27,735
15-year or less, amortizing fixed-rate
309
86
50
162
607
Adjustable-rate and other
91
25
13
61
190
Total Single-Family
$15,592
$3,617
$2,092
$7,231
$28,532
March 31, 2025
(In millions)
Current
One Month Past Due
Two Months Past Due
Three Months or More Past Due
Total
Single-Family:
20- and 30-year or more, amortizing fixed-rate
$12,733
$3,159
$2,000
$7,249
$25,141
15-year or less, amortizing fixed-rate
347
97
66
208
718
Adjustable-rate and other
80
17
18
77
192
Total Single-Family
$13,160
$3,273
$2,084
$7,534
$26,051
Non-Cash Investing and Financing Activities
During 1Q 2026 and 1Q 2025, we acquired $64.9 billion and $55.7 billion, respectively, of loans held-for-investment in exchange for the issuance of debt issued by consolidated trusts in guarantor swap transactions. We received approximately $37.6 billion and $27.6 billion of loans held-for-investment from sellers during 1Q 2026 and 1Q 2025, respectively, to satisfy advances to lenders that were recorded in other assets on our condensed consolidated balance sheets.
Freddie Mac 1Q 2026 Form 10-Q
52
Financial Statements
Notes to the Condensed Consolidated Financial Statements |Note 4
NOTE 4
Guarantees and Other Off-Balance Sheet Credit Exposures
Guarantee Activities
The table below presents information about our mortgage-related guarantees and guarantees of Fannie Mae securities, including the UPB of the loans or securities underlying the guarantee, the maximum potential amount of future payments that we could be required to make under the guarantee, the liability we have recognized on our condensed consolidated balance sheets for the guarantee, and the maximum remaining term of the guarantee. This table does not include our unrecognized guarantees, such as guarantees to consolidated VIEs or to resecuritization trusts that do not expose us to incremental credit risk. We do not believe the potential amount of future payments we could be required to make is representative of the actual payments we will be required to make, or the actual loss we are likely to incur, based on our historical loss experience and after consideration of proceeds from related collateral liquidation, including possible recoveries under credit enhancements.
Table 4.1 - Financial Guarantees
March 31, 2026
(Dollars in millions, terms in years)
UPB
Maximum Exposure
Recognized Liability(1)
Maximum Remaining Term
Single-Family mortgage-related guarantees:
Nonconsolidated securitization products(2)
$29,528
$24,180
$446
39
Other mortgage-related guarantees
7,044
7,044
89
26
Total Single-Family mortgage-related guarantees
36,572
31,224
535
Multifamily mortgage-related guarantees:
Nonconsolidated securitization products(2)(3)
324,122
292,245
3,426
34
Other mortgage-related guarantees
9,940
9,929
319
33
Total Multifamily mortgage-related guarantees
334,062
302,174
3,745
Guarantees of Fannie Mae securities
97,155
97,155
—
36
Other
61
384
—
29
December 31, 2025
(Dollars in millions, terms in years)
UPB
Maximum Exposure
Recognized Liability(1)
Maximum Remaining Term
Single-Family mortgage-related guarantees:
Nonconsolidated securitization products(2)
$30,025
$24,604
$453
40
Other mortgage-related guarantees
7,212
7,212
96
26
Total Single-Family mortgage-related guarantees
37,237
31,816
549
Multifamily mortgage-related guarantees:
Nonconsolidated securitization products(2)(3)
332,572
299,507
3,629
34
Other mortgage-related guarantees
10,003
9,992
332
33
Total Multifamily mortgage-related guarantees
342,575
309,499
3,961
Guarantees of Fannie Mae securities
98,370
98,370
—
36
Other
64
399
—
30
(1) Excludes allowance for credit losses on off-balance sheet credit exposures. See Note 5 for additional information on our allowance for credit losses on off-balance sheet credit exposures.
(2) Maximum exposure is based on remaining UPB of the guaranteed securities issued by the VIE.
(3) Maximum exposure to loss excludes the exposure related to advances made by us as guarantor. The outstanding balance of guarantor advances were $0.3 billion and $0.4 billion as of March 31, 2026 and December 31, 2025, respectively.
Freddie Mac 1Q 2026 Form 10-Q
53
Financial Statements
Notes to the Condensed Consolidated Financial Statements |Note 4
The table below presents the payment status of the mortgage loans underlying our mortgage-related guarantees.
Table 4.2 – UPB of Loans Underlying Our Mortgage-Related Guarantees by Payment Status
March 31, 2026
(In millions)
Current
One
Month
Past Due
Two
Months
Past Due
Three Months or
More Past Due,
or in Foreclosure
Total
Single-Family
$32,234
$2,082
$831
$1,425
$36,572
Multifamily
331,758
380
191
1,733
334,062
Total
$363,992
$2,462
$1,022
$3,158
$370,634
December 31, 2025
(In millions)
Current
One
Month
Past Due
Two
Months
Past Due
Three Months or
More Past Due,
or in Foreclosure
Total
Single-Family
$32,713
$2,234
$860
$1,430
$37,237
Multifamily
340,501
141
218
1,715
342,575
Total
$373,214
$2,375
$1,078
$3,145
$379,812
Other Off-Balance Sheet Credit Exposures
In addition to our guarantees, we enter into other agreements that expose us to off-balance sheet credit risk. These agreements may require us to transfer cash before or upon settlement of our contractual obligation. We recognize an allowance for credit losses for those agreements not measured at fair value or otherwise recognized in the financial statements. Most of these commitments expire in less than one year. See Note 5 for additional discussion of our allowance for credit losses on our off-balance sheet credit exposures.
The table below presents our other off-balance sheet credit exposures.
Table 4.3 – Other Off-Balance Sheet Credit Exposures
(In millions)
March 31, 2026
December 31, 2025
Mortgage loan purchase commitments(1)
$18,776
$14,010
Unsettled securities purchased under agreements to resell, net(2)
32,284
27,811
Other commitments(3)
3,772
3,788
Total
$54,832
$45,609
(1)Excludes mortgage loan purchase commitments accounted for as derivative instruments. See Note 8 for additional information on commitments accounted for as derivative instruments.
(2)Net of $0.7 billion and $1.9 billion of unsettled securities sold under agreements to repurchase as of March 31, 2026 and December 31, 2025.
(3)Consists of unfunded portion of revolving lines of credit, liquidity guarantees, and other commitments.
Freddie Mac 1Q 2026 Form 10-Q
54
Financial Statements
Notes to the Condensed Consolidated Financial Statements | Note 5
NOTE 5
Allowance for Credit Losses
The table below summarizes changes in our allowance for credit losses.
Table 5.1 - Details of the Allowance for Credit Losses
1Q 2026
1Q 2025
(In millions)
Single-Family
Multifamily
Total
Single-Family
Multifamily
Total
Beginning balance
$7,549
$956
$8,505
$6,691
$548
$7,239
Provision (benefit) for credit losses
(311)
(9)
(320)
228
52
280
Charge-offs
(178)
(64)
(242)
(191)
(1)
(192)
Recoveries collected
60
1
61
27
1
28
Other(1)
108
1
109
96
—
96
Ending balance
$7,228
$885
$8,113
$6,851
$600
$7,451
Components of the ending balance of the allowance for credit losses:
Mortgage loans held-for-investment
$6,977
$666
$7,643
$6,543
$431
$6,974
Other(2)
251
219
470
308
169
477
Total ending balance
$7,228
$885
$8,113
$6,851
$600
$7,451
(1)Primarily includes capitalization of past due interest related to non-accrual loans that received payment deferral plans and loan modifications.
(2)Includes allowance for credit losses related to advances of pre-foreclosure costs and off-balance sheet credit exposures.
n1Q 2026 vs. 1Q 2025 - The benefit for credit losses for 1Q 2026 was driven by a credit reserve release in Single-Family primarily attributable to changes in our views of forecasted house price growth rates. The provision for credit losses for 1Q 2025 was primarily driven by a credit reserve build in Single-Family attributable to new acquisitions.
Freddie Mac 1Q 2026 Form 10-Q
55
Financial Statements
Notes to the Condensed Consolidated Financial Statements | Note 6
NOTE 6
Investment Securities
The table below summarizes the fair values of our investments in debt securities by classification.
Table 6.1 - Investment Securities
(In millions)
March 31, 2026
December 31, 2025
Trading securities
$73,027
$82,096
Available-for-sale securities
2,912
3,316
Total fair value of investment securities
$75,939
$85,412
Trading Securities
The table below presents the fair values of our trading securities by major security type. Our non-mortgage-related securities primarily consist of investments in U.S. Treasury securities.
Table 6.2 - Trading Securities
(In millions)
March 31, 2026
December 31, 2025
Mortgage-related securities
$11,227
$10,932
Non-mortgage-related securities
61,800
71,164
Total fair value of trading securities
$73,027
$82,096
The table below provides details of our net trading gains (losses) recognized during the periods presented.
Table 6.3 - Net Trading Gains (Losses)
(In millions)
1Q 2026
1Q 2025
Net trading gains (losses)
($431)
$361
Less: Net trading gains (losses) on securities sold
(30)
18
Net trading gains (losses) related to securities still held at period end
($401)
$343
Available-for-Sale Securities
At both March 31, 2026 and December 31, 2025, all available-for-sale securities were mortgage-related securities.
The table below provides details of the securities classified as available-for-sale on our condensed consolidated balance sheets.
Table 6.4 - Available-for-Sale Securities
March 31, 2026
Amortized Cost Basis
Gross Unrealized Gains in Other Comprehensive Income
Gross Unrealized Losses in Other Comprehensive Income
Fair Value
Accrued Interest Receivable
(In millions)
Agency mortgage-related securities
$2,371
$12
($45)
$2,338
$5
Other mortgage-related securities
405
188
(19)
574
6
Total available-for-sale securities
$2,776
$200
($64)
$2,912
$11
December 31, 2025
Amortized Cost Basis
Gross Unrealized Gains in Other Comprehensive Income
Gross Unrealized Losses in Other Comprehensive Income
Fair Value
Accrued Interest Receivable
(In millions)
Agency mortgage-related securities
$2,726
$16
($40)
$2,702
$6
Other mortgage-related securities
423
209
(18)
614
7
Total available-for-sale securities
$3,149
$225
($58)
$3,316
$13
Freddie Mac 1Q 2026 Form 10-Q
56
Financial Statements
Notes to the Condensed Consolidated Financial Statements | Note 6
The fair value of our available-for-sale securities held at March 31, 2026 scheduled to contractually mature after five years through ten years was $0.7 billion, with an additional $1.3 billion scheduled to contractually mature after ten years.
The table below presents available-for-sale securities in a gross unrealized loss position and whether such securities have been in an unrealized loss position for less than 12 months, or 12 months or greater.
Table 6.5 - Available-for-Sale Securities in a Gross Unrealized Loss Position
March 31, 2026
Less than 12 Months
12 Months or Greater
(In millions)
Fair Value
Gross Unrealized Losses
Fair Value
Gross Unrealized Losses
Agency mortgage-related securities
$136
($1)
$1,423
($44)
Other mortgage-related securities
65
—
20
(19)
Total available-for-sale securities in a gross unrealized loss position
$201
($1)
$1,443
($63)
December 31, 2025
Less than 12 Months
12 Months or Greater
(In millions)
Fair Value
Gross Unrealized Losses
Fair Value
Gross Unrealized Losses
Agency mortgage-related securities
$178
$—
$1,713
($40)
Other mortgage-related securities
43
—
22
(18)
Total available-for-sale securities in a gross unrealized loss position
$221
$—
$1,735
($58)
At March 31, 2026, the gross unrealized losses in the table above relate to 114 securities.
The table below summarizes the total proceeds, gross realized gains, and gross realized losses from sales of available-for-sale securities.
Table 6.6 - Total Proceeds, Gross Realized Gains, and Gross Realized Losses from Sales of Available-for-Sale Securities(1)
(In millions)
1Q 2026
Gross realized gains
$—
Gross realized losses
(1)
Net realized gains (losses)
($1)
Total proceeds
$281
(1)There were no sales of available-for-sale securities during the quarter ended March 31, 2025.
Freddie Mac 1Q 2026 Form 10-Q
57
Financial Statements
Notes to the Condensed Consolidated Financial Statements|Note 7
NOTE 7
Short-term and Long-term Debt
Short-term Debt
The table below summarizes the balances and effective interest rates for our short-term debt (debt with original maturities of one year or less).
Table 7.1 - Short-term Debt(1)
(Dollars in millions)
March 31, 2026
December 31, 2025
Par value
$24,558
$37,867
Carrying amount
24,408
37,718
Weighted average effective rate
3.66
%
3.82
%
(1)Includes $3.1 billion and $3.0 billion of callable debt as of March 31, 2026 and December 31, 2025, respectively.
Long-term Debt
The table below summarizes our long-term debt (debt with original maturities of more than one year).
Table 7.2 - Long-term Debt
March 31, 2026
December 31, 2025
(Dollars in millions)
Contractual Maturity
Par Value
Carrying Amount(1)
Weighted
Average
Effective Rate(2)
Contractual Maturity
Par Value
Carrying Amount(1)
Weighted
Average
Effective Rate(2)
Fixed-rate(3)
2026 - 2056
$102,753
$100,373
3.59
%
2026 - 2054
$92,236
$90,104
3.62
%
Variable-rate(4)
2026 - 2036
66,321
66,301
4.64
2026 - 2035
76,008
75,991
4.74
Zero-coupon
2027 - 2039
3,904
2,640
4.74
2026 - 2039
3,904
2,610
4.73
Other(5)
2028 - 2053
488
536
8.12
2028 - 2053
546
591
8.95
Total long-term debt
$173,466
$169,850
4.03
$172,694
$169,296
4.15
(1)Represents par value, net of associated discounts or premiums and issuance costs. Includes $0.2 billion at both March 31, 2026 and December 31, 2025, of long-term debt that represents the fair value of debt for which the fair value option was elected. Includes hedge-related basis adjustments.
(2)Based on carrying amount. Excludes hedge-related basis adjustments.
(3)Includes $94.9 billion and $84.4 billion of callable debt as of March 31, 2026 and December 31, 2025, respectively.
(4)Includes $0.6 billion and $0.7 billion of callable debt as of March 31, 2026 and December 31, 2025, respectively.
(5)Includes STACR debt notes, SCR debt notes, and IO debt.
A portion of our long-term debt is callable. Callable debt gives us the option to redeem the debt security at par on one or more specified call dates or at any time on or after a specified call date.
The table below summarizes contractual maturities of long-term debt securities at March 31, 2026.
Table 7.3 - Contractual Maturities of Long-term Debt(1)
(In millions)
Par Value
2026
$33,795
2027
46,896
2028
19,975
2029
17,418
2030
24,760
Thereafter
30,134
Total
$172,978
(1)Excludes $0.5 billion of STACR debt notes and SCR debt notes. Contractual maturities of these debt securities are not presented because they are subject to prepayment risk, as their payments are based upon the performance of a pool of mortgage assets that may be prepaid by the related mortgage borrowers at any time generally without penalty.
Freddie Mac 1Q 2026 Form 10-Q
58
Financial Statements
Notes to the Condensed Consolidated Financial Statements |Note 8
NOTE 8
Derivatives
Derivative Assets and Liabilities at Fair Value
The table below presents the notional value and fair value of derivatives reported on our condensed consolidated balance sheets.
Table 8.1 - Derivative Assets and Liabilities at Fair Value
March 31, 2026
December 31, 2025
Notional or Contractual Amount
Derivative Assets
Derivative Liabilities
Notional or Contractual Amount
Derivative Assets
Derivative Liabilities
(In millions)
Not designated as hedges
Interest-rate risk management derivatives:
Swaps
$621,581
$1,098
($308)
$557,848
$1,148
($306)
Written options
47,380
—
(1,434)
40,480
—
(1,459)
Purchased options(1)
111,866
4,020
—
108,030
3,893
—
Futures
78,860
—
—
87,007
—
—
Total interest-rate risk management derivatives
859,687
5,118
(1,742)
793,365
5,041
(1,765)
Mortgage commitment derivatives
94,829
48
(98)
57,170
28
(15)
CRT-related derivatives(2)
27,373
—
(128)
26,883
—
(155)
Other
34,192
61
(662)
31,096
73
(601)
Total derivatives not designated as hedges
1,016,081
5,227
(2,630)
908,514
5,142
(2,536)
Designated as fair value hedges
Interest-rate risk management derivatives:
Swaps
119,551
107
(2,348)
125,908
198
(2,224)
Total derivatives designated as fair value hedges
119,551
107
(2,348)
125,908
198
(2,224)
Receivables (payables)
1
(196)
107
—
Netting adjustments(3)
(3,774)
4,191
(3,981)
3,979
Total derivatives portfolio, net
$1,135,632
$1,561
($983)
$1,034,422
$1,466
($781)
(1)Includes swaptions on credit indices with a notional amount of $2.4 billion and $6.4 billion at March 31, 2026 and December 31, 2025, respectively, and a fair value of $1.0 million at both March 31, 2026 and December 31, 2025.
(2)Includes derivative instruments related to CRT transactions that are considered freestanding credit enhancements.
(3)Represents counterparty netting and cash collateral netting.
Freddie Mac 1Q 2026 Form 10-Q
59
Financial Statements
Notes to the Condensed Consolidated Financial Statements |Note 8
Derivatives Counterparty Credit Risk
The table below presents offsetting and collateral information related to derivatives which are subject to enforceable master netting agreements or similar arrangements.
Table 8.2 - Offsetting of Derivatives
March 31, 2026
December 31, 2025
Derivative Assets
Derivative Liabilities
Derivative Assets
Derivative Liabilities
(In millions)
OTC derivatives
$5,195
($4,127)
$5,247
($3,989)
Cleared and exchange-traded derivatives
31
(103)
77
—
Mortgage commitment derivatives
48
(155)
50
(15)
Other
61
(789)
73
(756)
Total derivatives
5,335
(5,174)
5,447
(4,760)
Counterparty netting
(3,077)
3,077
(2,998)
2,998
Cash collateral netting(1)
(697)
1,114
(983)
981
Net amount presented in the condensed consolidated balance sheets
1,561
(983)
1,466
(781)
Gross amount not offset in the condensed consolidated balance sheets(2)
(1,370)
34
(1,155)
—
Net amount
$191
($949)
$311
($781)
(1)Excess cash collateral held is presented as a derivative liability, while excess cash collateral posted is presented as a derivative asset.
(2)Does not include the fair value amount of non-cash collateral posted or held that exceeds the associated net asset or liability, netted by counterparty, presented on the condensed consolidated balance sheets.
Gains and Losses on Derivatives
The table below presents the gains and losses on derivatives not designated in qualifying hedge relationships. These amounts are reported on our condensed consolidated statements of income as investment gains, net.
Table 8.3 - Gains and Losses on Derivatives
(In millions)
1Q 2026
1Q 2025
Interest-rate risk management derivatives:
Swaps
$303
($317)
Written options
(6)
126
Purchased options
15
(216)
Futures
71
(166)
Total interest-rate risk management derivatives fair value gains (losses)
383
(573)
Mortgage commitment derivatives
222
(108)
CRT-related derivatives(1)
32
44
Other
(83)
111
Total derivatives not designated as hedges fair value gains (losses)
$554
($526)
(1)Includes derivative instruments related to CRT transactions that are considered freestanding credit enhancements.
Freddie Mac 1Q 2026 Form 10-Q
60
Financial Statements
Notes to the Condensed Consolidated Financial Statements |Note 8
Hedge Accounting
The table below presents the effects of fair value hedge accounting by condensed consolidated statements of income line item, including the gains and losses on derivatives and hedged items designated in qualifying hedge relationships and other components due to the application of hedge accounting.
Table 8.4 - Gains and Losses on Fair Value Hedges
1Q 2026
1Q 2025
(In millions)
Interest Income
Interest Expense
Interest Income
Interest Expense
Total amounts of income and expense line items presented in our condensed consolidated statements of income in which the effects of fair value hedges are recorded:
$33,650
($28,031)
$31,365
($26,263)
Interest contracts on mortgage loans held-for-investment:
Gain (loss) on fair value hedging relationships:
Hedged items
(171)
—
695
—
Derivatives designated as hedging instruments
73
—
(772)
—
Interest accruals on hedging instruments
56
—
129
—
Discontinued hedge related basis adjustments amortization
53
—
66
—
Interest contracts on debt(1):
Gain (loss) on fair value hedging relationships:
Hedged items
—
240
—
(801)
Derivatives designated as hedging instruments
—
(231)
—
811
Interest accruals on hedging instruments
—
(115)
—
(478)
Discontinued hedge related basis adjustment amortization
—
1
—
(11)
Total impact of fair value hedge accounting
$11
($105)
$118
($479)
(1)Represents amounts primarily related to long-term debt on our condensed consolidated balance sheets.
The table below presents the cumulative basis adjustments and the carrying amounts of the hedged item by its respective balance sheet line item.
Table 8.5 - Cumulative Basis Adjustments Due to Fair Value Hedging
March 31, 2026
Carrying Amount Assets / (Liabilities)
Cumulative Amount of Fair Value Hedging Basis Adjustment Included in the Carrying Amount
Closed Portfolio Under the Portfolio Layer Method
(In millions)
Total
Under the Portfolio Layer Method
Discontinued - Hedge Related
Total Amount by Amortized Cost Basis
Designated Amount by UPB
Mortgage loans held-for-investment
$1,068,573
($2,887)
($366)
($2,521)
$43,397
$8,585
Debt(1)
(77,412)
2,316
—
16
—
—
December 31, 2025
Carrying Amount Assets / (Liabilities)
Cumulative Amount of Fair Value Hedging Basis Adjustment Included in the Carrying Amount
Closed Portfolio Under the Portfolio Layer Method
(In millions)
Total
Under the Portfolio Layer Method
Discontinued - Hedge Related
Total Amount by Amortized Cost Basis
Designated Amount by UPB
Mortgage loans held-for-investment
$1,084,479
($2,768)
($330)
($2,438)
$44,826
$8,585
Debt(1)
(68,285)
2,054
—
15
—
—
(1)Represents amounts primarily related to long-term debt on our condensed consolidated balance sheets.
Freddie Mac 1Q 2026 Form 10-Q
61
Financial Statements
Notes to the Condensed Consolidated Financial Statements |Note 9
NOTE 9
Collateralized Agreements
Securities Purchased Under Agreements to Resell and Securities Sold Under Agreements to Repurchase
The table below presents offsetting and collateral information related to securities purchased under agreements to resell, and securities sold under agreements to repurchase, which are subject to enforceable master netting agreements or similar arrangements.
Table 9.1 - Offsetting and Collateral Information of Certain Financial Assets and Liabilities
March 31, 2026
December 31, 2025
(In millions)
Securities Purchased Under Agreements to Resell
Securities Sold Under Agreements to Repurchase
Securities Purchased Under Agreements to Resell
Securities Sold Under Agreements to Repurchase
Gross amount recognized
$79,128
($4,324)
$78,378
($6,459)
Amount offset in the condensed consolidated balance sheets
(4,324)
4,324
(6,459)
6,459
Net amount presented in the condensed consolidated balance sheets
74,804
—
71,919
—
Gross amount not offset in the condensed consolidated balance sheets(1)
(74,804)
—
(71,919)
—
Net amount
$—
$—
$—
$—
(1)For securities purchased under agreements to resell, includes $64.2 billion and $78.3 billion of collateral that we had the right to repledge as of March 31, 2026 and December 31, 2025, respectively. We did not repledge collateral as of March 31, 2026 or December 31, 2025.
The table below presents the remaining contractual maturity of our gross obligations for our securities sold under agreements to repurchase. The collateral for such obligations consisted primarily of U.S. Treasury securities.
Table 9.2 - Remaining Contractual Maturity
(In millions)
March 31, 2026
December 31, 2025
Overnight and continuous
$4,324
$—
30 days or less
—
6,459
After 30 days through 90 days
—
—
Greater than 90 days
—
—
Total
$4,324
$6,459
Collateral Pledged
The table below summarizes the fair value of the securities pledged as collateral by us for derivatives and collateralized borrowing transactions, including securities that the secured party may repledge, and for regulatory requirements.
Table 9.3 - Collateral in the Form of Securities Pledged
(In millions)
March 31, 2026
December 31, 2025
Trading securities
$8,433
$11,159
Freddie Mac 1Q 2026 Form 10-Q
62
Financial Statements
Notes to the Condensed Consolidated Financial Statements|Note 10
NOTE 10
Net Interest Income
The table below presents the components of net interest income per our condensed consolidated statements of income.
Table 10.1 - Components of Net Interest Income
(In millions)
1Q 2026
1Q 2025
Interest income
Mortgage loans
$31,932
$29,395
Investment securities
833
620
Securities purchased under agreements to resell
798
1,240
Other
87
110
Total interest income
33,650
31,365
Interest expense
Debt issued by consolidated trusts
(26,001)
(24,059)
Short-term debt
(275)
(161)
Long-term debt
(1,702)
(2,000)
Securities sold under agreements to repurchase
(53)
(43)
Total interest expense
(28,031)
(26,263)
Net interest income
5,619
5,102
(Provision) benefit for credit losses
320
(280)
Net interest income after (provision) benefit for credit losses
$5,939
$4,822
Freddie Mac 1Q 2026 Form 10-Q
63
Financial Statements
Notes to the Condensed Consolidated Financial Statements|Note 11
NOTE 11
Segment Reporting
As shown in the table below, we have two reportable segments, Single-Family and Multifamily.
Segment
Description
Single-Family
Reflects results from our purchase, securitization, and guarantee of single-family loans, our investments in single-family loans and mortgage-related securities, the management of Single-Family mortgage credit risk and market risk, and any results of our treasury function that are not allocated to each segment.
Multifamily
Reflects results from our purchase, securitization, and guarantee of multifamily loans, our investments in multifamily loans and mortgage-related securities, and the management of Multifamily mortgage credit risk and market risk.
Segment Results
The table below presents the financial results for our Single-Family and Multifamily segments.
Table 11.1 - Segment Financial Results
1Q 2026
1Q 2025
(In millions)
Single-Family
Multifamily
Total
Single-Family
Multifamily
Total
Net interest income
Interest income
$31,570
$2,080
$33,650
$30,046
$1,319
$31,365
Interest expense
(26,450)
(1,581)
(28,031)
(25,293)
(970)
(26,263)
Net interest income
5,120
499
5,619
4,753
349
5,102
Non-interest income
Guarantee income
20
300
320
23
417
440
Investment gains (losses), net
(66)
108
42
61
131
192
Other income
101
51
152
81
37
118
Non-interest income
55
459
514
165
585
750
Net revenues
5,175
958
6,133
4,918
934
5,852
(Provision) benefit for credit losses
311
9
320
(228)
(52)
(280)
Non-interest expense
Administrative expense(1)
(482)
(144)
(626)
(523)
(153)
(676)
Credit enhancement expense
(386)
(55)
(441)
(491)
(49)
(540)
Legislative and regulatory assessments
(821)
(11)
(832)
(807)
(10)
(817)
Other expense
(91)
(32)
(123)
(50)
(5)
(55)
Non-interest expense
(1,780)
(242)
(2,022)
(1,871)
(217)
(2,088)
Income before income tax expense
3,706
725
4,431
2,819
665
3,484
Income tax expense
(730)
(143)
(873)
(558)
(132)
(690)
Net income
2,976
582
3,558
2,261
533
2,794
Other comprehensive income (loss), net of taxes and reclassification adjustments
(13)
(7)
(20)
8
26
34
Comprehensive income
$2,963
$575
$3,538
$2,269
$559
$2,828
(1)Includes salaries and employee benefits and professional services, technology, and occupancy.
Freddie Mac 1Q 2026 Form 10-Q
64
Financial Statements
Notes to the Condensed Consolidated Financial Statements|Note 11
The table below presents total assets for our Single-Family and Multifamily segments.
Table 11.2 - Segment Assets
(In millions)
March 31, 2026
December 31, 2025
Single-Family
$3,157,981
$3,156,290
Multifamily
498,332
495,835
Total segment assets
3,656,313
3,652,125
Reconciling items(1)
(150,995)
(154,527)
Total assets per condensed consolidated balance sheets
$3,505,318
$3,497,598
(1)Reconciling items include (1) assets in our mortgage portfolio that are not recognized on our condensed consolidated balance sheets and (2) assets recognized on our condensed consolidated balance sheets that are not allocated to the reportable segments.
Freddie Mac 1Q 2026 Form 10-Q
65
Financial Statements
Notes to the Condensed Consolidated Financial Statements|Note 12
NOTE 12
Concentration of Credit and Other Risks
Single-Family Mortgage Portfolio
The table below summarizes the concentration by geographic area of our Single-Family mortgage portfolio. See Note 2, Note 3, Note 4, and Note 5 for additional information about credit risk associated with single-family loans that we hold or guarantee.
Table 12.1 - Concentration of Credit Risk of Our Single-Family Mortgage Portfolio
March 31, 2026
(Dollars in millions)
Portfolio UPB(1)
% of Portfolio
SDQ Rate
Region:(2)
West
$919,994
29
%
0.47
%
Northeast
729,486
23
0.63
Southeast
565,501
18
0.68
Southwest
479,012
15
0.65
North Central
463,683
15
0.59
Total
$3,157,676
100
%
0.60
State:
California
$507,586
16
%
0.46
%
Texas
229,802
7
0.74
Florida
213,829
7
0.81
New York
138,886
4
0.82
Illinois
117,944
4
0.71
All other
1,949,629
62
0.56
Total
$3,157,676
100
%
0.60
(1)Excludes UPB of loans underlying certain securitization products for which data was not available.
(2)Region designation: West (AK, AS, AZ, CA, GU, HI, ID, MP, MT, NV, OR, UT, WA); Northeast (CT, DE, DC, MA, ME, MD, NH, NJ, NY, PA, RI, VT, VA, WV); Southeast (AL, FL, GA, KY, MS, NC, PR, SC, TN, U.S. VI); Southwest (AR, CO, KS, LA, MO, NE, NM, OK, TX, WY); North Central (IL, IN, IA, MI, MN, ND, OH, SD, WI).
Freddie Mac 1Q 2026 Form 10-Q
66
Financial Statements
Notes to the Condensed Consolidated Financial Statements | Note 12
Multifamily Mortgage Portfolio
The table below summarizes the concentration by geographic area of our Multifamily mortgage portfolio. See Note 2, Note 3, Note 4, and Note 5 for additional information about credit risk associated with multifamily loans that we hold or guarantee.
Table 12.2 - Concentration of Credit Risk of Our Multifamily Mortgage Portfolio
March 31, 2026
(Dollars in millions)
Portfolio UPB
% of Portfolio
Delinquency Rate(1)
Region(2)(3):
Northeast
$128,093
26
%
0.87
%
West
115,386
23
0.21
Southeast
105,307
21
0.10
Southwest
96,813
19
0.52
North Central
52,733
11
0.35
Total
$498,332
100
%
0.43
State(3):
California
$61,347
12
%
0.31
Texas
60,929
12
0.48
Florida
45,405
9
0.10
New York
39,756
8
2.10
Georgia
21,746
4
0.06
All other
269,149
55
0.28
Total
$498,332
100
%
0.43
(1)Based on loans two monthly payments or more delinquent or in foreclosure.
(2)Region designation: Northeast (CT, DE, DC, MA, ME, MD, NH, NJ, NY, PA, RI, VT, VA, WV); West (AK, AS, AZ, CA, GU, HI, ID, MP, MT, NV, OR, UT, WA); Southeast (AL, FL, GA, KY, MS, NC, PR, SC, TN, U.S. VI); Southwest (AR, CO, KS, LA, MO, NE, NM, OK, TX, WY); North Central (IL, IN, IA, MI, MN, ND, OH, SD, WI).
(3)Loans collateralized by properties located in multiple regions or states are reported entirely in the region or state with the largest UPB as of origination.
Freddie Mac 1Q 2026 Form 10-Q
67
Financial Statements
Notes to the Condensed Consolidated Financial Statements|Note 13
NOTE 13
Fair Value Disclosures
We use fair value measurements for the initial recording of certain assets and liabilities and periodic remeasurement of certain assets and liabilities on a recurring or non-recurring basis.
Assets and Liabilities Measured at Fair Value on a Recurring Basis
The table below presents our assets and liabilities measured on our condensed consolidated balance sheets at fair value on a recurring basis subsequent to initial recognition, including instruments where we have elected the fair value option.
Table 13.1 - Assets and Liabilities Measured at Fair Value on a Recurring Basis
March 31, 2026
(In millions)
Level 1
Level 2
Level 3
Netting Adjustments(1)
Total
Assets:
Investment securities:
Available-for-sale
$—
$2,263
$649
$—
$2,912
Trading:
Mortgage-related securities
—
8,551
2,676
—
11,227
Non-mortgage-related securities
61,551
249
—
—
61,800
Total trading securities
61,551
8,800
2,676
—
73,027
Total investment securities
61,551
11,063
3,325
—
75,939
Mortgage loans held-for-investment
—
6,190
716
—
6,906
Other assets:
Guarantee assets
—
—
4,495
—
4,495
Derivative assets, net
31
5,243
60
(3,773)
1,561
Other assets
—
—
238
—
238
Total other assets
31
5,243
4,793
(3,773)
6,294
Total assets carried at fair value on a recurring basis
$61,582
$22,496
$8,834
($3,773)
$89,139
Liabilities:
Debt issued by consolidated trusts
$—
$5,936
$35
$—
$5,971
Long-term debt
—
122
67
—
189
Other liabilities:
Derivative liabilities, net
3
4,879
96
(3,995)
983
Total liabilities carried at fair value on a recurring basis
$3
$10,937
$198
($3,995)
$7,143
Freddie Mac 1Q 2026 Form 10-Q
68
Financial Statements
Notes to the Condensed Consolidated Financial Statements|Note 13
December 31, 2025
(In millions)
Level 1
Level 2
Level 3
Netting Adjustments(1)
Total
Assets:
Investment securities:
Available-for-sale
$—
$2,616
$700
$—
$3,316
Trading:
Mortgage-related securities
—
8,146
2,786
—
10,932
Non-mortgage-related securities
70,916
248
—
—
71,164
Total trading securities
70,916
8,394
2,786
—
82,096
Total investment securities
70,916
11,010
3,486
—
85,412
Mortgage loans held-for-investment
—
5,587
1,418
—
7,005
Other assets:
Guarantee assets
—
—
4,728
—
4,728
Derivative assets, net
5
5,261
74
(3,874)
1,466
Other assets
—
—
227
—
227
Total other assets
5
5,261
5,029
(3,874)
6,421
Total assets carried at fair value on a recurring basis
$70,921
$21,858
$9,933
($3,874)
$98,838
Liabilities:
Debt issued by consolidated trusts
$—
$5,808
$33
$—
$5,841
Long-term debt
—
125
70
—
195
Other liabilities:
Derivative liabilities, net
—
4,708
52
(3,979)
781
Total liabilities carried at fair value on a recurring basis
$—
$10,641
$155
($3,979)
$6,817
(1) Represents counterparty netting and cash collateral netting, and includes accrued interest receivable and payable.
Freddie Mac 1Q 2026 Form 10-Q
69
Financial Statements
Notes to the Condensed Consolidated Financial Statements|Note 13
Level 3 Fair Value Measurements
The table below presents a reconciliation of all assets and liabilities measured on our condensed consolidated balance sheets at fair value on a recurring basis using significant unobservable inputs (Level 3), including transfers into and out of Level 3. The table also presents gains and losses due to changes in fair value, including both realized and unrealized gains and losses, recognized on our condensed consolidated statements of income for Level 3 assets and liabilities.
Table 13.2 - Fair Value Measurements of Assets and Liabilities Using Significant Unobservable Inputs
1Q 2026
(In millions)
Investment Securities
Mortgage Loans Held-for-Investment
Other Assets
Total Liabilities
Balance at January 1, 2026
$3,486
$1,418
$5,029
$155
Total realized/unrealized gains/losses(1)
Included in earnings
(84)
(6)
(27)
24
Included in other comprehensive income
(22)
—
—
—
Purchases
21
—
(11)
—
Issues
—
—
20
21
Sales
—
—
—
—
Settlements, net
(76)
(57)
(218)
(2)
Transfers into Level 3
—
39
—
—
Transfers out of Level 3
—
(678)
—
—
Balance at March 31, 2026
$3,325
$716
$4,793
$198
Change in unrealized gains/losses(1) included in net income related to assets and liabilities still held as of March 31, 2026(2)
($19)
($11)
($28)
$14
Change in unrealized gains/losses(1), net of tax, included in OCI related to assets and liabilities still held as of March 31, 2026
(18)
—
—
—
1Q 2025
(In millions)
Investment Securities
Mortgage Loans Held-for-Sale
Mortgage Loans Held-for-Investment
Other Assets
Total Liabilities
Balance at January 1, 2025
$3,610
$1,295
$841
$5,439
$241
Total realized/unrealized gains/losses(1)
Included in earnings
(17)
3
10
79
(36)
Included in other comprehensive income
5
—
—
—
—
Purchases
88
32
—
—
—
Issues
—
—
—
153
3
Sales
—
—
—
(6)
—
Settlements, net
(42)
—
(55)
(274)
(3)
Transfers into Level 3
—
—
31
—
17
Transfers out of Level 3
—
(1,175)
(90)
—
(18)
Balance at March 31, 2025
$3,644
$155
$737
$5,391
$204
Change in unrealized gains/losses(1) included in net income related to assets and liabilities still held as of March 31, 2025(2)
$109
$3
$6
$79
($36)
Change in unrealized gains/losses(1), net of tax, included in OCI related to assets and liabilities still held as of March 31, 2025
4
—
—
—
—
(1)For assets, increase and decrease in earnings and other comprehensive income is shown as gains and (losses), respectively. For liabilities, increase and decrease in earnings and comprehensive income is shown as (gains) and losses, respectively.
(2)Represents the amount of total gains or losses for the period, included in earnings, attributable to the change in unrealized gains and losses related to assets and liabilities classified as Level 3 that were still held at March 31, 2026 and March 31, 2025, respectively.
Freddie Mac 1Q 2026 Form 10-Q
70
Financial Statements
Notes to the Condensed Consolidated Financial Statements|Note 13
The table below provides the valuation technique, range, and weighted average of significant unobservable inputs for Level 3 assets and liabilities measured on our condensed consolidated balance sheets at fair value on a recurring basis.
Table 13.3 - Quantitative Information about Recurring Level 3 Fair Value Measurements
March 31, 2026
Level 3
Fair
Value
Predominant
Valuation
Technique(s)
Unobservable Inputs
(Dollars in millions, except for certain unobservable inputs as shown)
Type
Range
Weighted
Average(1)
Assets
Investment securities
$2,402
External pricing sources
Price
$0.0 - $3,138.1
$77.2
923
Other
Mortgage loans held-for-investment
716
External pricing sources
Price
$25.3 - $104.9
$83.2
Other assets
4,197
Discounted cash flows
OAS
20 - 840 bps
49 bps
596
Other
Total Level 3 assets
$8,834
Liabilities
Total Level 3 liabilities
$198
December 31, 2025
Level 3 Fair Value
Predominant Valuation Technique(s)
Unobservable Inputs
(Dollars in millions, except for certain unobservable inputs as shown)
Type
Range
Weighted
Average(1)
Assets
Investment securities
$2,532
External pricing sources
Price
$0.0 - $3,520.6
$82.1
954
Other
Mortgage loans held-for-investment
1,418
External pricing sources
Price
$48.4 - $105.8
$89.0
Other assets
4,424
Discounted cash flows
OAS
17 - 8,850 bps
50 bps
605
Other
Total Level 3 assets
$9,933
Liabilities
Total Level 3 liabilities
$155
(1) Unobservable inputs were weighted primarily by the relative fair value of the financial instruments.
Assets Measured at Fair Value on a Non-Recurring Basis
We may be required, from time to time, to measure certain assets at fair value on a non-recurring basis. These adjustments usually result from the application of lower-of-cost-or-fair-value accounting or an allowance for credit losses based on the fair value of the underlying collateral.
The table below presents assets measured on our condensed consolidated balance sheets at fair value on a non-recurring basis.
Table 13.4 - Assets Measured at Fair Value on a Non-Recurring Basis
(In millions)
March 31, 2026
December 31, 2025
Mortgage loans held-for-investment:(1)
Level 2
—
109
Level 3(2)
754
508
Total
$754
$617
(1)Includes loans that are classified as held-for-investment where we recognize credit losses, either through an allowance for credit losses or charge-off, based on the fair value of the underlying collateral and held-for-sale loans where the fair value is below cost. The valuation date for certain items may occur during the period and not at period end.
(2)The predominant valuation technique used for Level 3 non-recurring fair value measurement at both March 31, 2026 and December 31, 2025 was external pricing sources. The unobservable inputs included a range of $77.2 - $104.5 and weighted average of $87.9 at March 31, 2026 and a range of $24.0 - $104.3 and weighted average of $85.7 at December 31, 2025.
Freddie Mac 1Q 2026 Form 10-Q
71
Financial Statements
Notes to the Condensed Consolidated Financial Statements|Note 13
Fair Value of Financial Instruments
The table below presents the carrying value and estimated fair value of our financial instruments. For certain types of financial instruments, such as cash and cash equivalents, securities purchased under agreements to resell, secured lending, and certain debt, the carrying value on our condensed consolidated balance sheets approximates fair value, as these assets and liabilities are short-term in nature and have limited fair value volatility.
Table 13.5 - Fair Value of Financial Instruments
March 31, 2026
GAAP Measurement Category(1)
Carrying Amount(2)
Fair Value
(In millions)
Level 1
Level 2
Level 3
Netting
Adjustments(3)
Total
Financial assets
Cash and cash equivalents
Amortized cost
$4,469
$4,469
$—
$—
$—
$4,469
Securities purchased under agreements to resell
Amortized cost
74,804
—
79,128
—
(4,324)
74,804
Investment securities:
Available-for-sale
FV - OCI
2,912
—
2,263
649
—
2,912
Trading
FV - NI
73,027
61,551
8,800
2,676
—
73,027
Total investment securities
75,939
61,551
11,063
3,325
—
75,939
Mortgage loans held-for-sale
Lower-of-cost-or fair -value
1,225
—
19
1,272
—
1,291
Mortgage loans held-for-investment, net of allowance for credit losses
Various(4)
3,302,306
—
2,614,200
390,594
—
3,004,794
Other assets:
Guarantee assets
FV - NI
4,495
—
—
4,497
—
4,497
Derivative assets, net
FV - NI
1,561
31
5,243
60
(3,773)
1,561
Other assets(5)
Various(6)
3,356
—
504
3,073
—
3,577
Total other assets
9,412
31
5,747
7,630
(3,773)
9,635
Total financial assets
$3,468,155
$66,051
$2,710,157
$402,821
($8,097)
$3,170,932
Financial liabilities
Debt issued by consolidated trusts
Various(7)
$3,214,995
$—
$2,914,620
$376
$—
$2,914,996
Short-term debt
Amortized cost
24,408
—
24,405
—
—
24,405
Long-term debt
Various(8)
169,850
—
167,673
2,669
—
170,342
Securities sold under agreements to repurchase
Amortized cost
—
—
4,324
—
(4,324)
—
Other liabilities:
Guarantee obligations
Amortized cost
4,258
—
91
5,799
—
5,890
Derivative liabilities, net
FV - NI
983
3
4,879
96
(3,995)
983
Other liabilities(5)
FV - NI
—
—
291
54
—
345
Total other liabilities
5,241
3
5,261
5,949
(3,995)
7,218
Total financial liabilities
$3,414,494
$3
$3,116,283
$8,994
($8,319)
$3,116,961
Freddie Mac 1Q 2026 Form 10-Q
72
Financial Statements
Notes to the Condensed Consolidated Financial Statements|Note 13
December 31, 2025
GAAP Measurement Category(1)
Carrying Amount(2)
Fair Value
(In millions)
Level 1
Level 2
Level 3
Netting Adjustments(3)
Total
Financial assets
Cash and cash equivalents
Amortized cost
$5,327
$5,327
$—
$—
$—
$5,327
Securities purchased under agreements to resell
Amortized cost
71,919
—
78,378
—
(6,459)
71,919
Investment securities:
Available-for-sale
FV - OCI
3,316
—
2,616
700
—
3,316
Trading
FV - NI
82,096
70,916
8,394
2,786
—
82,096
Total investment securities
85,412
70,916
11,010
3,486
—
85,412
Mortgage loans held-for-sale
Lower-of-cost-or fair -value
1,014
—
139
939
—
1,078
Mortgage loans held-for-investment, net of allowance for credit losses
Various(4)
3,290,066
—
2,626,057
382,754
—
3,008,811
Other assets:
Guarantee assets
FV - NI
4,728
—
—
4,730
—
4,730
Derivative assets, net
FV - NI
1,466
5
5,261
74
(3,874)
1,466
Other assets(5)
Various(6)
2,607
—
445
2,442
—
2,887
Total other assets
8,801
5
5,706
7,246
(3,874)
9,083
Total financial assets
$3,462,539
$76,248
$2,721,290
$394,425
($10,333)
$3,181,630
Financial liabilities
Debt issued by consolidated trusts
Various(7)
$3,198,008
$—
$2,913,353
$434
$—
$2,913,787
Short-term debt
Amortized cost
37,718
—
37,727
—
—
37,727
Long-term debt
Various(8)
169,296
—
167,440
2,674
—
170,114
Securities sold under agreements to repurchase
Amortized cost
—
—
6,459
—
(6,459)
—
Other liabilities:
Guarantee obligations
Amortized cost
4,494
—
92
6,104
—
6,196
Derivative liabilities, net
FV - NI
781
—
4,708
52
(3,979)
781
Other liabilities(5)
FV - NI
—
—
184
78
—
262
Total other liabilities
5,275
—
4,984
6,234
(3,979)
7,239
Total financial liabilities
$3,410,297
$—
$3,129,963
$9,342
($10,438)
$3,128,867
(1)FV - NI denotes fair value through net income. FV - OCI denotes fair value through other comprehensive income.
(2)Excludes allowance for credit losses on off-balance sheet credit exposure.
(3)Represents counterparty netting and cash collateral netting, and includes accrued interest receivable and payable.
(4)The GAAP carrying amounts measured at amortized cost and FV - NI were $3.3 trillion and $6.9 billion as of March 31, 2026, respectively, and $3.3 trillion and $7.0 billion as of December 31, 2025, respectively.
(5)For other assets, includes advances to lenders, secured lending, and loan commitments. For other liabilities, includes loan commitments.
(6)The GAAP carrying amounts measured at amortized cost and FV - NI were $3.1 billion and $0.2 billion as of March 31, 2026, respectively, and $2.4 billion and $0.2 billion as of December 31, 2025, respectively.
(7)The GAAP carrying amounts measured at amortized cost and FV - NI were $3.2 trillionand $6.0 billion as of March 31, 2026, respectively, and $3.2 trillion and $5.8 billion as of December 31, 2025, respectively.
(8)The GAAP carrying amounts measured at amortized cost and FV - NI were $0.2 trillion and $0.2 billion as of March 31, 2026, respectively, and $0.2 trillion and $0.2 billion as of December 31, 2025, respectively.
Freddie Mac 1Q 2026 Form 10-Q
73
Financial Statements
Notes to the Condensed Consolidated Financial Statements|Note 13
Fair Value Option
We elected the fair value option for certain mortgage loans and loan commitments and certain debt issuances.
The table below presents the fair value and UPB related to items for which we have elected the fair value option.
Table 13.6 - Difference Between Fair Value and UPB for Certain Financial Instruments with Fair Value Option Elected(1)
March 31, 2026
December 31, 2025
(In millions)
Fair Value
UPB
Difference
Fair Value
UPB
Difference
Mortgage loans held-for-investment
6,906
7,073
(167)
7,005
7,148
(143)
Long-term debt
49
46
3
51
48
3
Debt issued by consolidated trusts
5,441
5,526
(85)
5,387
5,445
($58)
(1) Excludes interest-only securities related to debt issued by consolidated trusts and long-term debt with a fair value of $0.7 billion as of March 31, 2026 and $0.6 billion as of December 31, 2025.
The table below presents the changes in fair value related to items for which we have elected the fair value option. These amounts are included in investment gains, net, on our condensed consolidated statements of income.
Table 13.7 - Changes in Fair Value Under the Fair Value Option Election
1Q 2026
1Q 2025
(In millions)
Gains (Losses)
Mortgage loans held-for-sale
$—
$227
Mortgage loans held-for-investment
(24)
48
Long-term debt
3
11
Debt issued by consolidated trusts
34
(47)
Other assets/other liabilities
—
100
Changes in fair value attributable to instrument-specific credit risk were not material for the periods presented for assets or liabilities for which we elected the fair value option.
Freddie Mac 1Q 2026 Form 10-Q
74
Financial Statements
Notes to the Condensed Consolidated Financial Statements|Note 14
NOTE 14
Legal Contingencies
We are involved, directly or indirectly, in a variety of legal and regulatory proceedings arising from time to time in the ordinary course of business (including, among other things, contractual disputes, personal injury claims, employment-related litigation, and other legal proceedings incidental to our business) and in connection with the conservatorship and Purchase Agreement. We are frequently involved, directly or indirectly, in litigation involving mortgage foreclosures. From time to time, we are also involved in proceedings arising from our termination of a seller's or servicer's eligibility to sell loans to, and/or service loans for, us. In these cases, the former seller or servicer sometimes seeks damages against us for wrongful termination under a variety of legal theories. In addition, we are sometimes sued in connection with the origination or servicing of loans. These suits typically involve claims alleging wrongful actions of sellers and servicers. Our contracts with our sellers and servicers generally provide for indemnification of Freddie Mac against liability arising from sellers' and servicers' wrongful actions with respect to loans sold to or serviced for Freddie Mac.
Litigation claims and proceedings of all types are subject to many uncertainties (including appeals and procedural filings), and there can be no assurance as to the ultimate outcome of those actions (including the matters described below). In accordance with the accounting guidance for contingencies, we reserve for litigation claims and assessments asserted or threatened against us when a loss is probable (as defined in such guidance) and the amount of the loss can be reasonably estimated. The actual costs of resolving legal actions may be substantially higher or lower than the amounts accrued for those actions.
It is not possible for us to predict the actions the U.S. government (including Treasury and FHFA) might take in connection with any of these lawsuits or any future lawsuits. However, it is possible that we could be adversely affected by these actions, including, for example, by changes to the Purchase Agreement, or any resulting actual or perceived changes in the level of U.S. government support for our business.
Putative Securities Class Action Lawsuit: Ohio Public Employees Retirement System v. Freddie Mac, Syron, et al.
This putative securities class action lawsuit was filed against Freddie Mac and certain former officers on January 18, 2008 in the U.S. District Court for the Northern District of Ohio purportedly on behalf of a class of purchasers of Freddie Mac stock from August 1, 2006 through November 20, 2007. FHFA later intervened as Conservator, and the plaintiff amended its complaint on several occasions. The plaintiff alleged, among other things, that the defendants violated federal securities laws by making false and misleading statements concerning our business, risk management, and the procedures we put into place to protect the company from problems in the mortgage industry. The plaintiff seeks unspecified damages and interest, and reasonable costs and expenses, including attorney and expert fees.
In August 2018, the District Court denied the plaintiff's motion for class certification. On April 6, 2023, the U.S. Court of Appeals for the Sixth Circuit reversed the District Court's September 17, 2020 ruling, which had granted the plaintiff's request for summary judgment and entered final judgment in favor of Freddie Mac and other defendants, and remanded the case to the District Court for further proceedings. On August 29, 2025, the District Court granted defendants' motions for summary judgment and final judgment was entered for all defendants. The plaintiff has appealed the District Court's decision to the U.S. Court of Appeals for the Sixth Circuit.
Litigation Concerning the Purchase Agreement in the U.S. District Court for the District of Columbia
In re Fannie Mae/Freddie Mac Senior Preferred Stock Purchase Agreement Class Action Litigations. This is a consolidated class action lawsuit filed by private individual and institutional investors (collectively, "Class Plaintiffs") against FHFA, Fannie Mae, and Freddie Mac.
Fairholme Funds, Inc., et al. v. FHFA, et al. This is an individual plaintiffs’ lawsuit by certain institutional investors (“Individual Plaintiffs”) against FHFA, Fannie Mae, and Freddie Mac.
The Class Plaintiffs and Individual Plaintiffs (collectively "Plaintiffs") in the District of Columbia lawsuits filed an amended complaint on November 1, 2017 alleging claims for breach of contract, breach of the implied covenant of good faith and fair dealing, breach of fiduciary duties, and violation of Delaware and Virginia corporate law. Additionally, the Class Plaintiffs brought derivative claims against FHFA for breach of fiduciary duties and the Individual Plaintiffs brought claims under the Administrative Procedure Act. Both sets of claims are generally based on allegations that the net worth sweep dividend provisions of the senior preferred stock that were implemented pursuant to the August 2012 amendments nullified certain of the shareholders’ rights, including the rights to receive dividends and a liquidation preference. On September 28, 2018, the District
Freddie Mac 1Q 2026 Form 10-Q
75
Financial Statements
Notes to the Condensed Consolidated Financial Statements|Note 14
Court dismissed all of the claims except those for breach of the implied covenant of good faith and fair dealing. The cases were consolidated for trial.
Court rulings limited the Plaintiffs’ damages theories to those based on the decline in Freddie Mac’s and Fannie Mae’s share value immediately after the Third Amendment. The Plaintiffs asserted losses based on the decline in value of Freddie Mac’s common and junior preferred stock from August 16 to August 17, 2012. During the trial in October and early November 2022, the Plaintiffs requested that the jury award $832 million plus pre-judgment interest as damages against Freddie Mac. The jury in that trial was not able to reach a unanimous verdict and on November 7, 2022 the judge declared a mistrial. The retrial started on July 24, 2023. On August 14, 2023, the jury returned a verdict against FHFA, Fannie Mae, and Freddie Mac awarding compensatory damages of $282 million to Freddie Mac junior preferred shareholders and $31 million to Freddie Mac common shareholders. The jury declined to award the Freddie Mac shareholders prejudgment interest. In 2023, we recorded a $313 million accrual for the adverse judgment. On March 20, 2024, the District Court entered final judgment. On April 17, 2024, the defendants filed a renewed motion for judgment as a matter of law, notwithstanding the jury verdict, which was denied on March 14, 2025. The defendants filed a notice of appeal to the U.S. Court of Appeals for the D.C. Circuit on April 11, 2025. On April 25, 2025, the individual plaintiffs and the class plaintiffs filed their own appeals to the U.S. Court of Appeals for the D.C. Circuit. Oral argument was held before the U.S. Court of Appeals for the D.C. Circuit on April 21, 2026, and a decision is pending.
Freddie Mac 1Q 2026 Form 10-Q
76
Financial Statements
Notes to the Condensed Consolidated Financial Statements|Note 15
NOTE 15
Regulatory Capital
ERCF
The table below presents our capital metrics under the ERCF.
Table 15.1 - ERCF Available Capital and Capital Requirements
(In billions)
March 31, 2026
December 31, 2025
Adjusted total assets
$3,903
$3,905
Risk-weighted assets (standardized approach)
1,259
1,231
March 31, 2026
Amounts
Ratios
(Dollars in billions)
Available Capital (Deficit)
Minimum Capital Requirement
Capital
Requirement
(Including Buffer(1))
Available Capital (Deficit) Ratio(2)
Minimum Capital Requirement Ratio(2)
Capital
Requirement Ratio(2)
(Including Buffer(1))
Risk-based capital:
Total capital
$9
$101
$101
0.7
%
8.0
%
8.0
%
CET1 capital
(18)
57
117
(1.4)
4.5
9.3
Tier 1 capital
(4)
76
136
(0.3)
6.0
10.8
Adjusted total capital
(4)
101
161
(0.3)
8.0
12.8
Leverage capital:
Core capital
1
98
98
—
2.5
2.5
Tier 1 capital
(4)
98
113
(0.1)
2.5
2.9
December 31, 2025
Amounts
Ratios
(Dollars in billions)
Available Capital (Deficit)
Minimum Capital Requirement
Capital
Requirement
(Including Buffer(1))
Available Capital (Deficit) Ratio(2)
Minimum Capital Requirement Ratio(2)
Capital
Requirement Ratio(2)
(Including Buffer(1))
Risk-based capital:
Total capital
$6
$99
$99
0.5
%
8.0
%
8.0
%
CET1 capital
(22)
55
114
(1.8)
4.5
9.3
Tier 1 capital
(7)
74
133
(0.6)
6.0
10.8
Adjusted total capital
(7)
99
158
(0.6)
8.0
12.8
Leverage capital:
Core capital
(2)
98
98
(0.1)
2.5
2.5
Tier 1 capital
(7)
98
113
(0.2)
2.5
2.9
(1)PCCBA for risk-based capital and PLBA for leverage capital.
(2)As a percentage of RWA for risk-based capital and ATA for leverage capital.
END OF CONDENSED CONSOLIDATED FINANCIAL STATEMENTS AND ACCOMPANYING NOTES
Freddie Mac 1Q 2026 Form 10-Q
77
Other Information
Other Information
LEGAL PROCEEDINGS
We are involved, directly or indirectly, in a variety of legal proceedings arising from time to time in the ordinary course of business and in connection with the conservatorship and Purchase Agreement. See Note 14for additional information regarding our involvement as a party to various legal proceedings, including those in connection with the conservatorship and Purchase Agreement.
Over the last several years, numerous lawsuits have been filed against the U.S. government and, in some cases, the Secretary of the Treasury and the Director of FHFA, challenging certain government actions related to the conservatorship (including actions taken in connection with the imposition of conservatorship) and the Purchase Agreement. Two of these cases remain pending and Freddie Mac is not a party to either. One of those lawsuits seeks to void the net worth sweep dividend provisions of the senior preferred stock, which were implemented pursuant to the August 2012 amendment to the Purchase Agreement. The other pending lawsuit challenges the constitutionality of the structure of FHFA.
Another case was filed in the U.S. Court of Federal Claims as a derivative lawsuit, purportedly on behalf of Freddie Mac as a “nominal” defendant: Reid and Fisher v. United States of America and Federal Home Loan Mortgage Corporation. This case was filed on February 26, 2014. The complaint alleges, among other items, that the net worth sweep dividend provisions of the senior preferred stock constitute an unlawful taking of private property for public use without just compensation. The plaintiffs ask that Freddie Mac be awarded just compensation for the U.S. government's alleged taking of its property, attorneys' fees, costs, and other expenses. The Court of Federal Claims dismissed the case with prejudice on September 1, 2023 and entered judgment for the defendants. On October 31, 2023, the plaintiffs filed a notice of appeal to the U.S. Court of Appeals for the Federal Circuit. On August 12, 2025, the Federal Circuit affirmed the dismissal of the plaintiffs' case. The plaintiffs did not file a petition with the Supreme Court seeking further review; therefore the Federal Circuit's affirmation of the dismissal is final.
RISK FACTORS
This Form 10-Q should be read together with theRisk Factors section in our 2025 Annual Report, which describes various risks and uncertainties to which we are or may become subject. These risks and uncertainties could, directly or indirectly, adversely affect our business, financial condition, results of operations, cash flows, strategies, and/or prospects.
UNREGISTERED SALES OF EQUITY SECURITIES AND USE OF PROCEEDS
Recent Sales of Unregistered Securities
The securities we issue are "exempted securities" under the Securities Act of 1933, as amended. As a result, we do not file registration statements with the SEC with respect to offerings of our securities.
Following our entry into conservatorship, we suspended the operation of, and ceased making grants under, equity compensation plans. Previously, we had provided equity compensation under those plans to employees and members of the Board of Directors. Under the Purchase Agreement, we cannot issue any new options, rights to purchase, participations, or other equity interests without Treasury's prior approval.
Information About Certain Securities Issuances by Freddie Mac
We make available, free of charge through our website atwww.freddiemac.com/investors, our annual reports on Form 10-K, quarterly reports on Form 10-Q, current reports on Form 8-K, and all other SEC reports and amendments to those reports as soon as reasonably practicable after we electronically file the material with the SEC. The SEC also maintains a website (www.sec.gov) that contains reports, proxy and information statements, and other information regarding companies that file electronically with the SEC.
We provide information on the ERCF on our website at www.freddiemac.com/investors.
We provide disclosure about our debt securities on our website at capitalmarkets.freddiemac.com/debt. From this address, investors can access the offering circular and issuance information for debt securities offerings under Freddie Mac's global debt facility, including any required pricing supplements for individual issuances of debt securities. Similar information about
Freddie Mac 1Q 2026 Form 10-Q
78
Other Information
our STACR transactions and MSCR transactions is available at capitalmarkets.freddiemac.com/crt and mf.freddiemac.com/investors, respectively.
We provide disclosure about our mortgage-related securities, some of which are off-balance sheet obligations (e.g., K Certificates), on our website at www.freddiemac.com/mbs and mf.freddiemac.com/investors. From these addresses, investors can access information and documents, including offering circulars and offering circular supplements, for mortgage-related securities offerings.
We provide additional information, including product descriptions, investor presentations, securities issuance calendars, transaction volumes and details, redemption notices, Freddie Mac research, and material developments or other events that may be important to investors, in each case as applicable, on the websites for our business divisions, which can be found at sf.freddiemac.com, mf.freddiemac.com, and capitalmarkets.freddiemac.com/capital-markets.
OTHER INFORMATION
Insider Trading Arrangements and Policies
No executive officer or director adopted or terminated any contract, instruction, or written plan for the purchase or sale of, or any other such trading arrangement for, our securities during 1Q 2026. For additional information on executive officer and director compensation and security ownership by our executive officers and directors, see Directors, Corporate Governance, and Executive Officers, Executive Compensation, and Security Ownership of Certain Beneficial Owners and Management and Related Stockholder Matters in our 2025 Annual Report.
EXHIBITS
The exhibits are listed in the Exhibit Index of this Form 10-Q.
Freddie Mac 1Q 2026 Form 10-Q
79
Controls and Procedures
Controls and Procedures
EVALUATION OF DISCLOSURE CONTROLS AND PROCEDURES
Disclosure controls and procedures include, without limitation, controls and procedures designed to ensure that the information we are required to disclose in reports that we file or submit under the Exchange Act is recorded, processed, summarized, and reported within the time periods specified by the SEC's rules and forms and that such information is accumulated and communicated to management of the company, including the company's CEO and CFO, as appropriate, to allow timely decisions regarding required disclosure. In designing our disclosure controls and procedures, we recognize that any controls and procedures, no matter how well designed and operated, can provide only reasonable assurance of achieving the desired control objectives, and we must apply judgment in implementing possible controls and procedures.
Management, including the company's CEO and CFO, conducted an evaluation of the effectiveness of our disclosure controls and procedures as of March 31, 2026. As a result of management's evaluation, our CEO and CFO concluded that our disclosure controls and procedures were not effective as of March 31, 2026, at a reasonable level of assurance, because we have not been able to update our disclosure controls and procedures to provide reasonable assurance that information known by FHFA on an ongoing basis is communicated from FHFA to Freddie Mac's management in a manner that allows for timely decisions regarding our required disclosure under the federal securities laws. We consider this situation to be a material weakness in our internal control over financial reporting. Based on discussions with FHFA and the structural nature of this continuing weakness, we believe it is likely that we will not remediate this material weakness while we are under conservatorship.
CHANGES IN INTERNAL CONTROL OVER FINANCIAL REPORTING DURING 1Q 2026
We evaluated the changes in our internal control over financial reporting that occurred during 1Q 2026 and concluded that there were no changes that materially affected, or are reasonably likely to materially affect, our internal control over financial reporting.
MITIGATING ACTIONS RELATED TO THE MATERIAL WEAKNESS IN INTERNAL CONTROL OVER FINANCIAL REPORTING
As described above under Evaluation of Disclosure Controls and Procedures, we have one material weakness in internal control over financial reporting as of March 31, 2026 that we have not remediated.
Given the structural nature of this material weakness, we believe it is likely that we will not remediate it while we are under conservatorship. However, both we and FHFA have continued to engage in activities and employ procedures and practices intended to permit accumulation and communication to management of information needed to meet our disclosure obligations under the federal securities laws. These include the following:
nFHFA has established a process to facilitate operation of the company under the oversight of the Conservator.
nWe provide drafts of our SEC filings to FHFA personnel for their review and comment prior to filing. We also provide drafts of certain external press releases and statements to FHFA personnel for their review and comment prior to release.
nFHFA personnel, including senior officials, review our SEC filings prior to filing, including this Form 10-Q, and engage in discussions with us regarding issues associated with the information contained in those filings. Prior to filing this Form 10-Q, FHFA provided us with a written acknowledgment that it had reviewed the Form 10-Q, was not aware of any material misstatements or omissions in the Form 10-Q, and had no objection to our filing the Form 10-Q.
nOur senior management meets regularly with senior leadership at FHFA, including, but not limited to, the Director.
nFHFA representatives attend meetings frequently with various groups within the company to enhance the flow of information and to provide oversight on a variety of matters, including accounting, credit and capital markets management, external communications, and legal matters.
nSenior officials within FHFA's accounting group meet frequently with our senior financial executives regarding our accounting policies, practices, and procedures.
Freddie Mac 1Q 2026 Form 10-Q
80
Controls and Procedures
Although we and FHFA have attempted to design and implement disclosure policies and procedures to account for the conservatorship and accomplish the same objectives as disclosure controls and procedures for a typical reporting company, there are inherent structural limitations on our ability to design, implement, test, or operate effective disclosure controls and procedures under the circumstances of conservatorship. Despite our material weakness, we believe that our condensed consolidated financial statements for 1Q 2026 have been prepared in conformity with GAAP.
XBRL Instance Document - the instance document does not appear in the Interactive Data File because its XBRL tags are embedded within the Inline XBRL document
101.SCH
XBRL Taxonomy Extension Schema
101. CAL
XBRL Taxonomy Extension Calculation
101.DEF
XBRL Taxonomy Extension Definition
101.LAB
XBRL Taxonomy Label
101. PRE
XBRL Taxonomy Extension Presentation
104
Cover Page Interactive Data File - the cover page interactive data file does not appear in the Interactive Data File because its XBRL tags are embedded within the Inline XBRL document
*
The SEC file number for the Registrant's Registration Statement on Form 10, Annual Reports on Form 10-K, Quarterly Reports on Form 10-Q, and Current Reports on Form 8-K is 001-34139.
Freddie Mac 1Q 2026 Form 10-Q
82
Signatures
Signatures
Pursuant to the requirements of the Securities Exchange Act of 1934, the registrant has duly caused this report to be signed on its behalf by the undersigned thereunto duly authorized.
Federal Home Loan Mortgage Corporation
By:
/s/ Kenny M. Smith
Kenny M. Smith
Chief Executive Officer
(Principal Executive Officer)
Date: April 30, 2026
By:
/s/ James Whitlinger
James Whitlinger
Executive Vice President and Chief Financial Officer