Freddie Mac Reports Net Income of $3.6 Billion for First Quarter 2026
Making Home Possible for 380,000 Households in First Quarter 2026
•Financed 281,000 mortgages, with 52% of eligible loans affordable to low- to moderate-income families.
•First-time homebuyers represented 52% of new single-family home purchase loans.
•Financed 99,000 rental units, with 93% of eligible units affordable to low- to moderate-income families.
First Quarter 2026 Financial Results
During First Quarter 2026
As of March 31, 2026
Market Liquidity Provided -
$116 Billion
Homes and Rental Units Financed -
380,000
Net Worth -
$74 Billion
Total Mortgage
Portfolio -
$3.7 Trillion
Consolidated
•Net income of $3.6 billion, up 27% year-over-year, primarily driven by higher net revenues and a credit reserve release in the current period compared to a credit reserve build in the first quarter of 2025.
•Net revenues of $6.1 billion, an increase of 5% year-over-year, primarily driven by higher net interest income, partially offset by lower non-interest income.
•Benefit for credit losses of $0.3 billion, primarily driven by a credit reserve release in Single-Family.
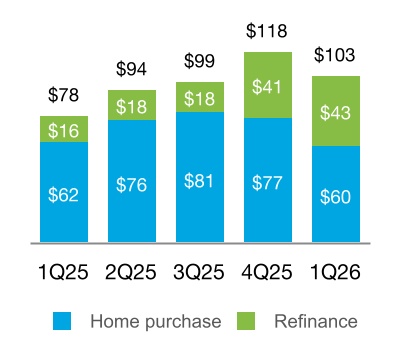
•New business activity of $103 billion, up from $78 billion in the first quarter of 2025, driven by an increase in refinance activity.
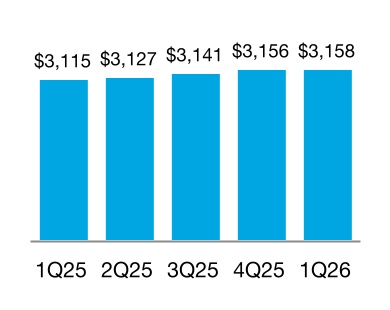
•Mortgage portfolio of $3.2 trillion, up 1% year-over-year.
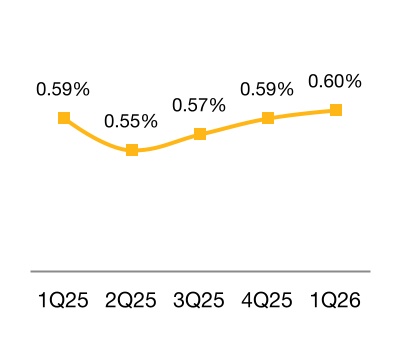
•Serious delinquency rate of 0.60%, up from 0.59% at both December 31, 2025 and March 31, 2025.
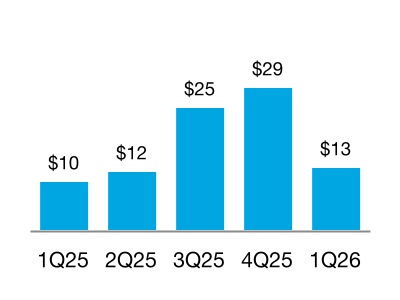
•New business activity of $13 billion, up from $10 billion in the first quarter of 2025.
•Mortgage portfolio of $498 billion, up 7% year-over-year.
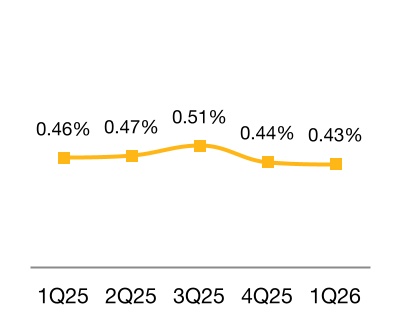
•Delinquency rate of 0.43%, down from 0.44% at December 31, 2025 and from 0.46% at March 31, 2025.
"Freddie Mac’s strong first quarter performance reflects progress under the guidance of U.S. Federal Housing to build a company that can help more Americans achieve the dream of homeownership or find the right rental home for their family. That means supporting first-time homebuyers and working families, expanding the supply of affordable rental housing, and strengthening risk management. It also means reducing regulations so market participants can innovate and compete to deliver better outcomes for families across the housing cycle."
William J. Pulte,
Director, U.S. Federal Housing
and Chair of the Board of
Directors, Freddie Mac
"We delivered strong first quarter results, with net income of $3.6 billion and net revenues of $6.1 billion. During the quarter, we provided $116 billion of liquidity to the housing market and our net worth continues to grow, ending at $74 billion. These results reflect the Freddie Mac team working in close partnership with our lenders, servicers, and housing finance stakeholders, with a focus on execution and risk management."
Kenny Smith,
CEO of Freddie Mac
Net Revenues
$6.1 Billion
Net Income
$3.6 Billion
Comprehensive
Income
$3.5 Billion
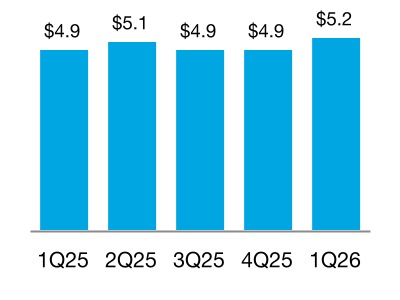
Single-Family
Net Revenues
$5.2 Billion
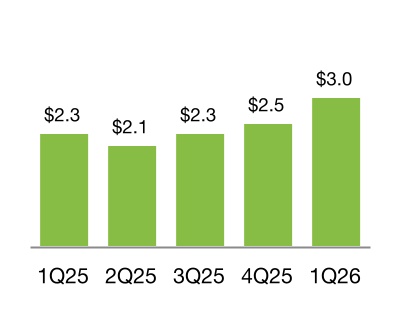
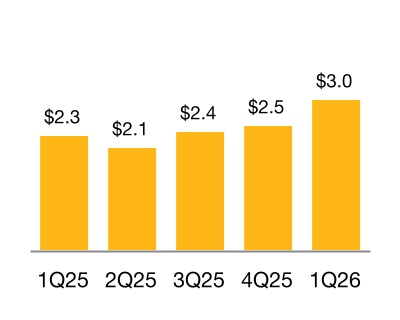
Net Income
$3.0 Billion
Comprehensive
Income
$3.0 Billion
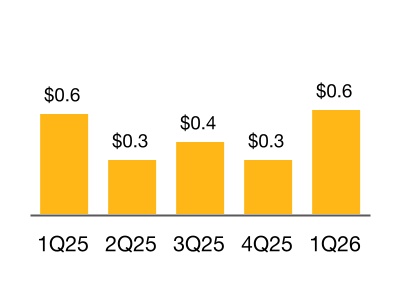
Multifamily
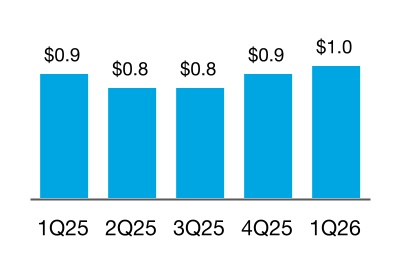
Net Revenues
$1.0 Billion
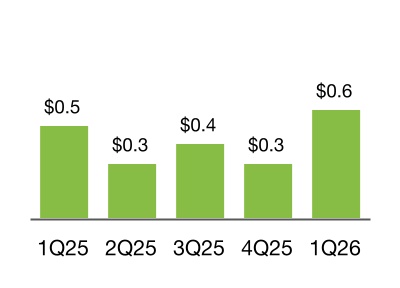
Net Income
$0.6 Billion
Comprehensive
Income
$0.6 Billion
Freddie Mac First Quarter 2026 Financial Results
April 30, 2026
Page 2
McLean, VA — Freddie Mac (OTCQB: FMCC) today reported net income of $3.6 billion for the first quarter of 2026, up 27% from the first quarter of 2025, primarily driven by higher net revenues and a credit reserve release in the current period compared to a credit reserve build in the first quarter of 2025.
Net revenues were $6.1 billion for the first quarter of 2026, up 5% year-over-year, primarily driven by higher net interest income, partially offset by lower non-interest income. Net interest income for the first quarter of 2026 was $5.6 billion, up 10% year-over-year, primarily driven by an increase in the balance of fully guaranteed securitizations in the Multifamily mortgage portfolio due to the change in Multifamily business strategy, continued mortgage portfolio growth in Single-Family, and growth in the mortgage-related investments portfolio. Non-interest income for the first quarter of 2026 was $0.5 billion, down 31% year-over-year, primarily driven by lower guarantee income and lower net investment gains.
The benefit for credit losses was $0.3 billion for the first quarter of 2026, driven by a credit reserve release in Single-Family primarily attributable to changes in the company's views of forecasted house price growth rates. The provision for credit losses of $0.3 billion for the first quarter of 2025 was primarily driven by a credit reserve build in Single-Family attributable to new acquisitions.
Non-interest expense was $2.0 billion for the first quarter of 2026, down 3% year-over-year, primarily driven by a decrease in salaries and employee benefits and lower credit enhancement expense.
Summary of Consolidated Statements of Income and Comprehensive Income
(Dollars in millions)
1Q 2026
4Q 2025
Change
1Q 2025
Change
Net interest income
$5,619
$5,547
$72
$5,102
$517
Non-interest income
514
217
297
750
(236)
Net revenues
6,133
5,764
369
5,852
281
(Provision) benefit for credit losses
320
(52)
372
(280)
600
Non-interest expense
(2,022)
(2,258)
236
(2,088)
66
Income before income tax expense
4,431
3,454
977
3,484
947
Income tax expense
(873)
(677)
(196)
(690)
(183)
Net income
3,558
2,777
781
2,794
764
Other comprehensive income (loss), net of taxes and reclassification adjustments
(20)
7
(27)
34
(54)
Comprehensive income
$3,538
$2,784
$754
$2,828
$710
Conservatorship metrics (in millions)
Net worth
$73,922
$70,384
$3,538
$62,403
$11,519
Senior preferred stock liquidation preference
143,032
140,248
2,784
132,223
10,809
Remaining Treasury funding commitment
140,162
140,162
—
140,162
—
Cumulative dividend payments to Treasury
119,680
119,680
—
119,680
—
Cumulative draws from Treasury
71,648
71,648
—
71,648
—
Freddie Mac First Quarter 2026 Financial Results
April 30, 2026
Page 3
Single-Family Segment
Financial Results
Net Revenues
(In billions)
Net Income
(In billions)
Comprehensive Income
(In billions)
(Dollars in millions)
1Q 2026
4Q 2025
Change
1Q 2025
Change
Net interest income
$5,120
$5,080
$40
$4,753
$367
Non-interest income (loss)
55
(178)
233
165
(110)
Net revenues
5,175
4,902
273
4,918
257
(Provision) benefit for credit losses
311
210
101
(228)
539
Non-interest expense
(1,780)
(2,005)
225
(1,871)
91
Income before income tax expense
3,706
3,107
599
2,819
887
Income tax expense
(730)
(609)
(121)
(558)
(172)
Net income
2,976
2,498
478
2,261
715
Other comprehensive income (loss), net of taxes and reclassification adjustments
(13)
(1)
(12)
8
(21)
Comprehensive income
$2,963
$2,497
$466
$2,269
$694
First Quarter 2026
Net income of $3.0 billion, up 32% year-over-year.
•Net revenues were $5.2 billion, up 5% year-over year.
◦Net interest income was $5.1 billion, up 8% year-over-year, primarily driven by continued mortgage portfolio growth and growth in the mortgage-related investments portfolio.
•The benefit for credit losses was $0.3 billion for the first quarter of 2026, driven by a credit reserve release primarily attributable to changes in the company's views of forecasted house price growth rates. The provision for credit losses of $0.2 billion for the first quarter of 2025 was primarily driven by a credit reserve build attributable to new acquisitions.
•Non-interest expense was $1.8 billion for the first quarter of 2026, down 5% year-over-year, primarily driven by a decrease in salaries and employee benefits and lower credit enhancement expense.
Freddie Mac First Quarter 2026 Financial Results
April 30, 2026
Page 4
Single-Family Segment
Business Results
New Business Activity
(UPB in billions)
Mortgage Portfolio
(UPB in billions)
Serious Delinquency Rate
1Q 2026
4Q 2025
Change
1Q 2025
Change
New Business Statistics:
Single-Family homes funded (in thousands)
281
331
(50)
224
57
Purchase borrowers (in thousands)
165
214
(49)
171
(6)
Refinance borrowers (in thousands)
116
117
(1)
53
63
Affordable to low- to moderate-income families (%)(1)
52
53
(1)
53
(1)
First-time homebuyers (%)(2)
52
50
2
52
—
Average estimated guarantee fee rate (bps)
54
54
—
54
—
Weighted average original loan-to-value (LTV) (%)
75
76
(1)
77
(2)
Weighted average original credit score
758
758
—
756
2
Portfolio Statistics:
Average estimated guarantee fee rate (bps)
50
50
—
49
1
Weighted average current LTV (%)
53
53
—
52
1
Weighted average current credit score
753
754
(1)
754
(1)
Loan count (in millions)
13.9
13.9
—
13.9
—
Credit-Related Statistics:
Loan workout activity (in thousands)
24
23
1
25
(1)
Allowance for credit losses to total loans outstanding (%)(3)
0.22
0.23
(0.01)
0.21
0.01
Credit enhancement coverage (%)
62
61
1
62
—
(1) Eligible loans acquired affordable to families earning at or below 120% of area median income (AMI).
(2) Calculated as a percentage of purchase borrowers with loans secured by primary residences.
(3) Calculated as the allowance for credit losses on mortgage loans held-for-investment divided by the amortized cost basis of mortgage loans held-for-investment for which the fair value option has not been elected.
Business Highlights
•New business activity of $103 billion, up from $78 billion in the first quarter of 2025, primarily driven by an increase in refinance activity. Financed 281,000 mortgages and enabled 79,000 first-time homebuyers to purchase a home.
Freddie Mac First Quarter 2026 Financial Results
April 30, 2026
Page 5
Multifamily Segment
Financial Results
Net Revenues
(In billions)
Net Income
(In billions)
Comprehensive Income
(In billions)
(Dollars in millions)
1Q 2026
4Q 2025
Change
1Q 2025
Change
Net interest income
$499
$467
$32
$349
$150
Non-interest income
459
395
64
585
(126)
Net revenues
958
862
96
934
24
(Provision) benefit for credit losses
9
(262)
271
(52)
61
Non-interest expense
(242)
(253)
11
(217)
(25)
Income before income tax expense
725
347
378
665
60
Income tax expense
(143)
(68)
(75)
(132)
(11)
Net income
582
279
303
533
49
Other comprehensive income (loss), net of taxes and reclassification adjustments
(7)
8
(15)
26
(33)
Comprehensive income
$575
$287
$288
$559
$16
First Quarter 2026
Net income of $0.6 billion, up 9% year-over-year.
•Net revenues were $1.0 billion, up 3% year-over-year.
◦Net interest income was $0.5 billion, up 43% year-over-year, primarily driven by an increase in the balance of fully guaranteed securitizations in the Multifamily mortgage portfolio due to the change in Multifamily business strategy.
◦Non-interest income was $0.5 billion, down 22% year-over-year, primarily driven by a lower volume of loan sale activities, as the company shifted the Multifamily business model to primarily issue fully guaranteed securitizations.
Freddie Mac First Quarter 2026 Financial Results
April 30, 2026
Page 6
Multifamily Segment
Business Results
New Business Activity
(UPB in billions)
Mortgage Portfolio
(UPB in billions)
Delinquency Rate
1Q 2026
4Q 2025
Change
1Q 2025
Change
New Business Statistics:
Number of rental units financed (in thousands)(1)
99
234
(135)
89
10
Affordable to low-income families (%)(2)(4)
72
68
4
75
(3)
Affordable to low- to moderate-income families (%)(3)(4)
93
92
1
94
(1)
Weighted average original LTV (%)
65
65
—
62
3
Weighted average original debt service coverage ratio(5)
1.30
1.28
0.02
1.30
—
Securitization Statistics:
Securitization issuance (UPB in billions)
$24
$23
$1
$16
$8
Senior subordinate
1
1
—
7
(6)
Fully guaranteed
23
22
1
9
14
Portfolio Statistics:
Average guarantee fee rate charged (bps) at period end
58
56
2
52
6
Credit-Related Statistics:
Allowance for credit losses to total loans outstanding (%)(6)
0.42
0.46
(0.04)
0.49
(0.07)
Credit enhancement coverage (%)
91
89
2
93
(2)
(1) Includes rental units financed by supplemental loans.
(2) Eligible units acquired affordable to families earning at or below 80% of AMI.
(3) Eligible units acquired affordable to families earning at or below 120% of AMI.
(4) First quarter 2026 results are based on 2025 AMI data provided by FHFA.
(5) Assumes monthly payments that reflect amortization of principal.
(6) Calculated as the allowance for credit losses on mortgage loans held-for-investment divided by the amortized cost basis of mortgage loans held-for-investment for which the fair value option has not been elected.
Business Highlights
•Provided financing for 99,000 multifamily rental units in the first quarter of 2026. 72% of the eligible multifamily rental units financed in the first quarter of 2026 were affordable to low-income families.
•Securitization issuance UPB increased year-over-year driven by a larger average securitization pipeline. The larger percentage of fully guaranteed securitizations was due to the Multifamily business strategy change.
Freddie Mac First Quarter 2026 Financial Results
April 30, 2026
Page 7
About Freddie Mac’s Conservatorship
Since September 2008, Freddie Mac has been operating under conservatorship with FHFA as Conservator. The support provided by Treasury pursuant to the Purchase Agreement enables the company to maintain access to the debt markets and have adequate liquidity to conduct its normal business operations. The amount of funding available to Freddie Mac under the Purchase Agreement was $140.2 billion at March 31, 2026.
Pursuant to the Purchase Agreement, Freddie Mac will not be required to pay a dividend to Treasury on the senior preferred stock until it has built sufficient capital to meet the capital requirements and buffers set forth in the Enterprise Regulatory Capital Framework. As a result, the company was not required to pay a dividend to Treasury on the senior preferred stock in March 2026. As the company builds capital during this period, the quarterly increases in its Net Worth Amount have been, or will be, added to the aggregate liquidation preference of the senior preferred stock. The liquidation preference of the senior preferred stock increased to $143.0 billion on March 31, 2026 based on the increase in the Net Worth Amount during the fourth quarter of 2025, and will increase to $146.6 billion on June 30, 2026 based on the increase in the Net Worth Amount during the first quarter of 2026.
Additional Information
For more information, including information related to Freddie Mac’s financial results, conservatorship, and related matters, see the company’s Annual Report on Form 10-K for 2025, Quarterly Report on Form 10-Q for the quarter ended March 31, 2026 and First Quarter 2026 Earnings Presentation and First Quarter 2026 Financial Supplement. These documents are available on the Investor Relations page of the company’s website at www.FreddieMac.com.
Additional information about these matters and other information about Freddie Mac and its business is also set forth in the company’s other filings with the SEC, which are available on the Investor Relations page of the company’s website at www.FreddieMac.com and the SEC’s website at www.sec.gov. Freddie Mac encourages all investors and interested members of the public to review these materials for a more complete understanding of the company’s financial results and related disclosures.
Webcast Announcement
Management will host a conference call at 9 a.m. Eastern Time on April 30, 2026 to share the company’s results and other information about the company (which may include forward-looking information). The conference call will be concurrently webcast. To access the audio webcast, use the following link: https://edge.media-server.com/mmc/p/c8eotgbs. The replay will be available on the company’s website at www.FreddieMac.com for approximately 30 days. All materials related to the call will be available on the Investor Relations page of the company’s website at www.FreddieMac.com.
Media Contact: Frederick Solomon (703) 903-3861
Investor Contact: Mahesh Lal (571) 382-4732
* * * *
This press release contains forward-looking statements using terms such as will, expect, forecast, and others that do not refer solely to past periods. These may include statements pertaining to the conservatorship, the company’s current expectations and objectives for its Single-Family and Multifamily segments, its efforts to assist the housing market, liquidity and capital management, and the effects of economic and market conditions and trends including changes in house prices and house price forecasts, its market coverage, the effect of legislative and regulatory developments and new accounting guidance, the credit quality of loans the company owns or guarantees, the costs and benefits of the company’s credit risk transfer (CRT) transactions, the impact of banking crises or failures, and the effects of wars, terrorist incidents, public policy and political developments, cybersecurity incidents, natural disasters or catastrophic events and actions taken in response thereto. Forward-looking statements involve known and unknown risks and uncertainties beyond the company’s control. Management’s expectations necessarily involve assumptions, judgments, and estimates. Various factors could cause actual results to differ materially from those expectations, including changes in economic and market conditions, liquidity, mortgage spreads, credit outlook, actions by the U.S. government (including FHFA, Treasury, the executive branch, and Congress) and state and local governments, changes in the fiscal and monetary policies of the Federal Reserve, the impact of any downgrade in the company's credit ratings or those of the U.S. government, and the impacts of legislation or regulations and new or amended accounting guidance. These
Freddie Mac First Quarter 2026 Financial Results
April 30, 2026
Page 8
assumptions, judgments, estimates, and factors are discussed in the company’s Annual Report on Form 10-K for the year ended December 31, 2025 and our subsequent SEC filings, which are available on the Investor Relations page of the company’s website at www.FreddieMac.com and the SEC’s website at www.sec.gov. The company has no obligation to update forward-looking statements to reflect subsequent events or circumstances.
Freddie Mac's mission is to make home possible for families across the nation. Freddie Mac promotes liquidity, stability, affordability and equity in the housing market throughout all economic cycles. Since 1970, Freddie Mac has helped tens of millions of families buy, rent or keep their home.
Freddie Mac First Quarter 2026 Financial Results
April 30, 2026
Page 9
FREDDIE MAC
Condensed Consolidated Statements of Income and Comprehensive Income (Unaudited)
(In millions, except share-related amounts)
1Q 2026
4Q 2025
1Q 2025
Net interest income
Interest income
$33,650
$33,432
$31,365
Interest expense
(28,031)
(27,885)
(26,263)
Net interest income
5,619
5,547
5,102
Non-interest income
Guarantee income
320
377
440
Investment gains (losses), net
42
(283)
192
Other income
152
123
118
Non-interest income
514
217
750
Net revenues
6,133
5,764
5,852
(Provision) benefit for credit losses
320
(52)
(280)
Non-interest expense
Salaries and employee benefits
(376)
(412)
(423)
Professional services, technology, and occupancy
(250)
(334)
(253)
Credit enhancement expense
(441)
(542)
(540)
Legislative and regulatory assessments
(832)
(842)
(817)
Other expense
(123)
(128)
(55)
Non-interest expense
(2,022)
(2,258)
(2,088)
Income before income tax expense
4,431
3,454
3,484
Income tax expense
(873)
(677)
(690)
Net income
3,558
2,777
2,794
Other comprehensive income (loss), net of taxes and reclassification adjustments
(20)
7
34
Comprehensive income
$3,538
$2,784
$2,828
Net income
$3,558
$2,777
$2,794
Amounts attributable to senior preferred stock
(3,538)
(2,784)
(2,828)
Net income (loss) attributable to common stockholders
$20
($7)
($34)
Net income (loss) per common share
$0.01
$0.00
($0.01)
Weighted average common shares (in millions)
3,234
3,234
3,234
Freddie Mac First Quarter 2026 Financial Results
April 30, 2026
Page 10
FREDDIE MAC
Condensed Consolidated Balance Sheets (Unaudited)
March 31,
December 31,
(In millions, except share-related amounts)
2026
2025
Assets
Cash and cash equivalents (includes $1,299 and $1,234 of restricted cash and cash equivalents)
$4,469
$5,327
Securities purchased under agreements to resell
74,804
71,919
Investment securities, at fair value
75,939
85,412
Mortgage loans held-for-sale
1,225
1,014
Mortgage loans held-for-investment (net of allowance for credit losses of $7,643 and $7,968 and includes $6,906 and $7,005 at fair value)
3,302,306
3,290,066
Accrued interest receivable
12,207
12,254
Deferred tax assets, net
4,740
5,040
Other assets (includes $6,294 and $6,421 at fair value)
29,628
26,566
Total assets
$3,505,318
$3,497,598
Liabilities and equity
Liabilities
Accrued interest payable
$10,556
$10,597
Debt issued by consolidated trusts (includes $5,971 and $5,841 at fair value)
3,214,995
3,198,008
Short-term debt
24,408
37,718
Long-term debt (includes $189 and $195 at fair value)
169,850
169,296
Other liabilities (includes $983 and $781 at fair value)
11,587
11,595
Total liabilities
3,431,396
3,427,214
Commitments and contingencies
Equity
Senior preferred stock (liquidation preference of $143,032 and $140,248)
72,648
72,648
Preferred stock, at redemption value
14,109
14,109
Common stock, $0.00 par value, 4,000,000,000 shares authorized, 725,863,886 shares issued and 650,059,553 shares outstanding
—
—
Retained earnings
(8,981)
(12,539)
AOCI, net of taxes
31
51
Treasury stock, at cost, 75,804,333 shares
(3,885)
(3,885)
Total equity
73,922
70,384
Total liabilities and equity
$3,505,318
$3,497,598
The table below presents the carrying value and classification of the assets and liabilities related to consolidated variable interest entities (VIEs) on the company's condensed consolidated balance sheets.
March 31,
December 31,
(In millions)
2026
2025
Assets
Cash and cash equivalents (includes $1,202 and $1,136 of restricted cash and cash equivalents)