Second Quarter 2026 Earnings Presentation July 30, 2026 .2
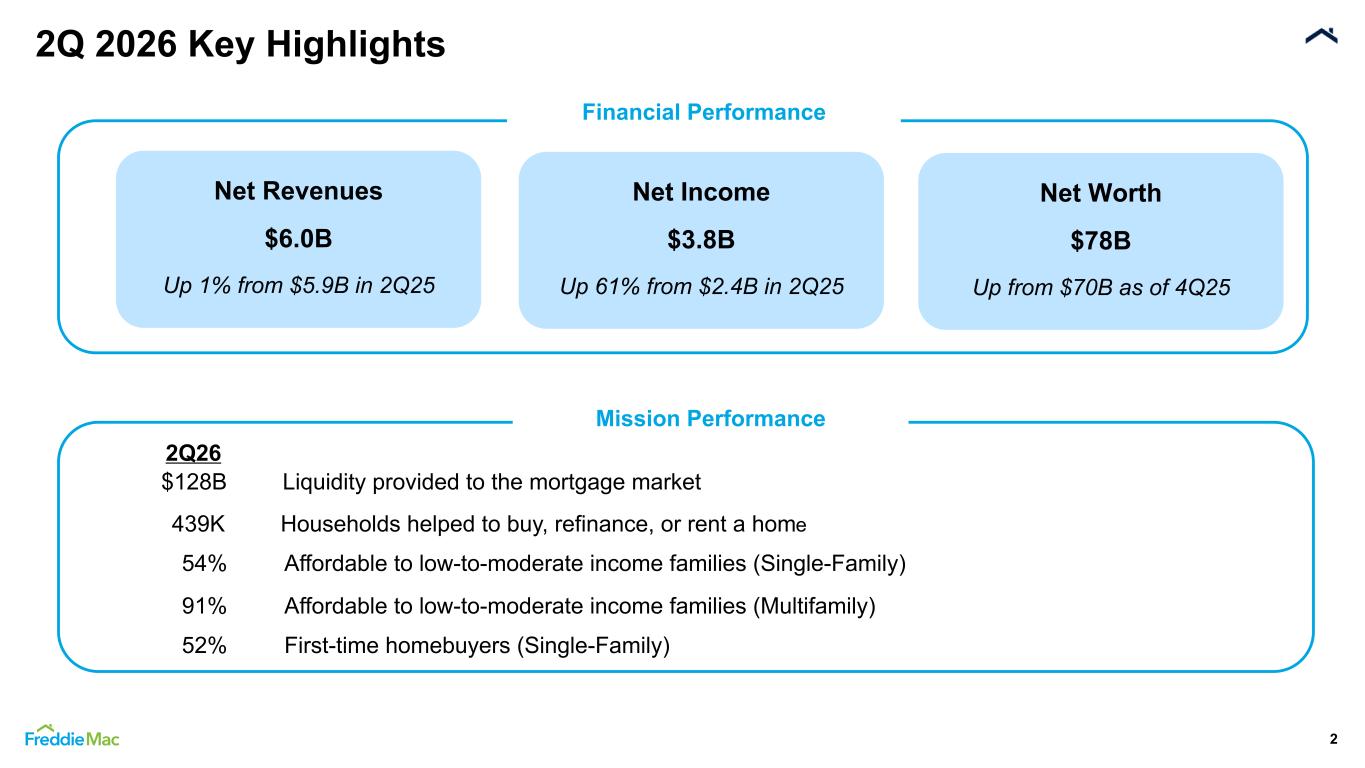
2 2Q 2026 Key Highlights Net Revenues $6.0B Up 1% from $5.9B in 2Q25 Financial Performance 2Q26 Mission Performance 52% First-time homebuyers (Single-Family) $128B Liquidity provided to the mortgage market 439K Households helped to buy, refinance, or rent a home 91% Affordable to low-to-moderate income families (Multifamily) 54% Affordable to low-to-moderate income families (Single-Family) Net Income $3.8B Up 61% from $2.4B in 2Q25 Net Worth $78B Up from $70B as of 4Q25
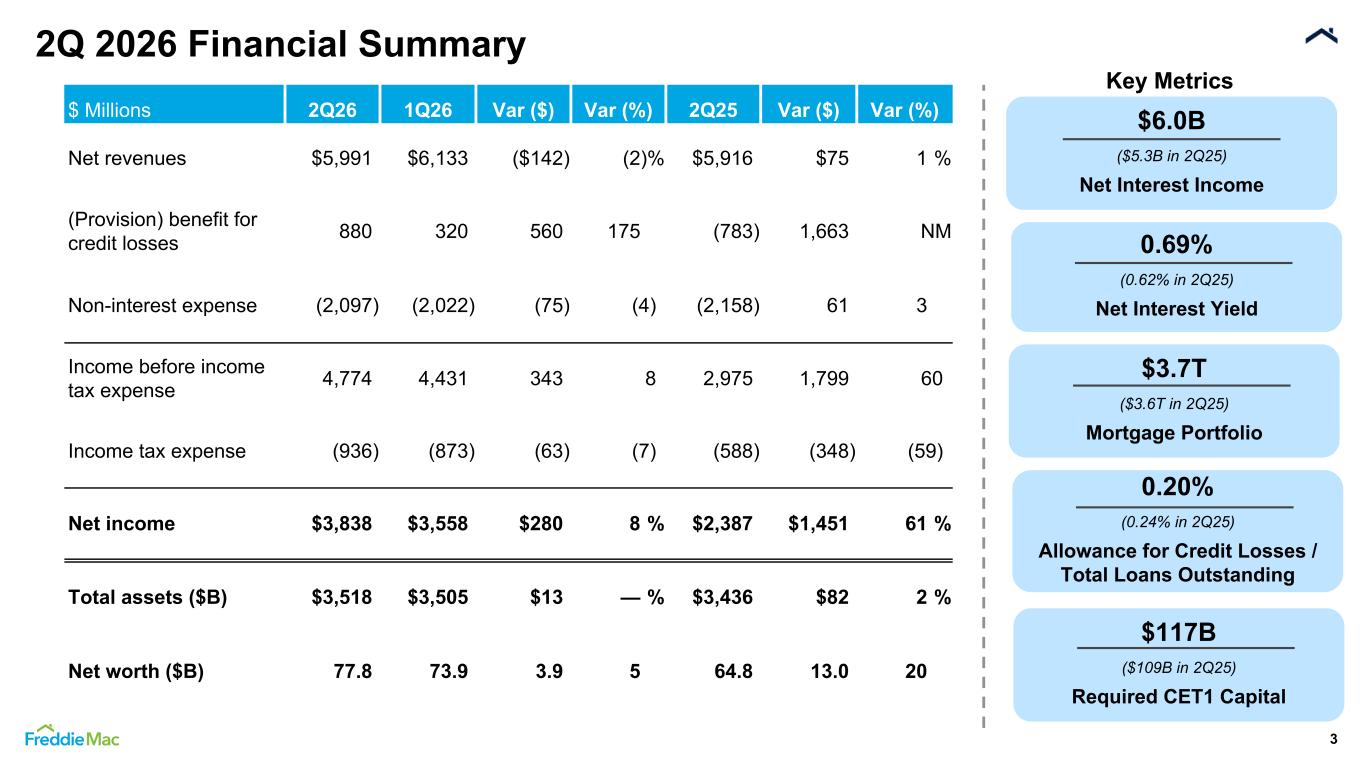
$3.7T ($3.6T in 2Q25) Mortgage Portfolio 3 2Q 2026 Financial Summary $ Millions 2Q26 1Q26 Var ($) Var (%) 2Q25 Var ($) Var (%) Net revenues $5,991 $6,133 ($142) (2) % $5,916 $75 1 % (Provision) benefit for credit losses 880 320 560 175 (783) 1,663 NM Non-interest expense (2,097) (2,022) (75) (4) (2,158) 61 3 Income before income tax expense 4,774 4,431 343 8 2,975 1,799 60 Income tax expense (936) (873) (63) (7) (588) (348) (59) Net income $3,838 $3,558 $280 8 % $2,387 $1,451 61 % Total assets ($B) $3,518 $3,505 $13 — % $3,436 $82 2 % Net worth ($B) 77.8 73.9 3.9 5 64.8 13.0 20 $6.0B ($5.3B in 2Q25) Net Interest Income 0.69% (0.62% in 2Q25) Net Interest Yield Key Metrics 0.20% (0.24% in 2Q25) Allowance for Credit Losses / Total Loans Outstanding $117B ($109B in 2Q25) Required CET1 Capital
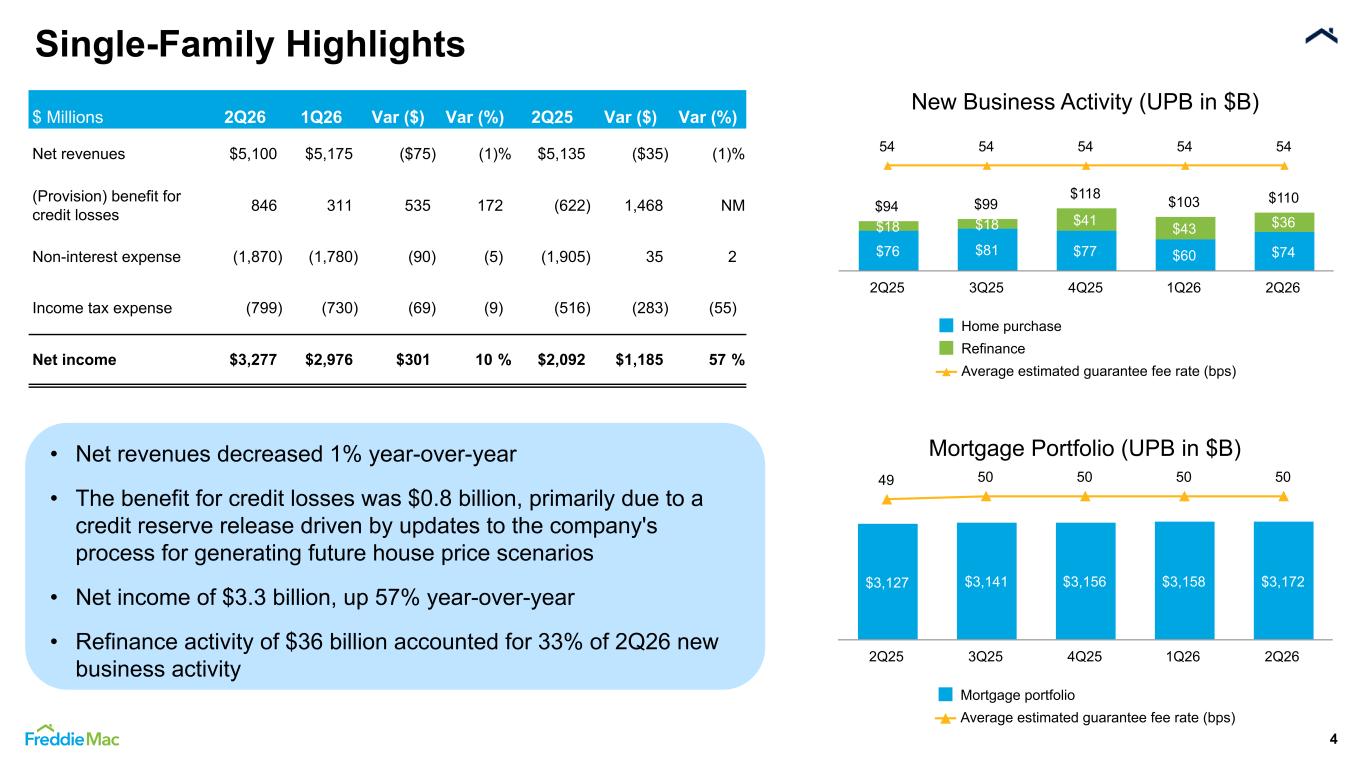
Mortgage Portfolio (UPB in $B) $3,127 $3,141 $3,156 $3,158 $3,172 49 50 50 50 50 Mortgage portfolio Average estimated guarantee fee rate (bps) 2Q25 3Q25 4Q25 1Q26 2Q26 Single-Family Highlights 4 $ Millions 2Q26 1Q26 Var ($) Var (%) 2Q25 Var ($) Var (%) Net revenues $5,100 $5,175 ($75) (1) % $5,135 ($35) (1) % (Provision) benefit for credit losses 846 311 535 172 (622) 1,468 NM Non-interest expense (1,870) (1,780) (90) (5) (1,905) 35 2 Income tax expense (799) (730) (69) (9) (516) (283) (55) Net income $3,277 $2,976 $301 10 % $2,092 $1,185 57 % • Net revenues decreased 1% year-over-year • The benefit for credit losses was $0.8 billion, primarily due to a credit reserve release driven by updates to the company's process for generating future house price scenarios • Net income of $3.3 billion, up 57% year-over-year • Refinance activity of $36 billion accounted for 33% of 2Q26 new business activity New Business Activity (UPB in $B) $94 $99 $118 $103 $110 $76 $81 $77 $60 $74 $18 $18 $41 $43 $36 54 54 54 54 54 Home purchase Refinance Average estimated guarantee fee rate (bps) 2Q25 3Q25 4Q25 1Q26 2Q26
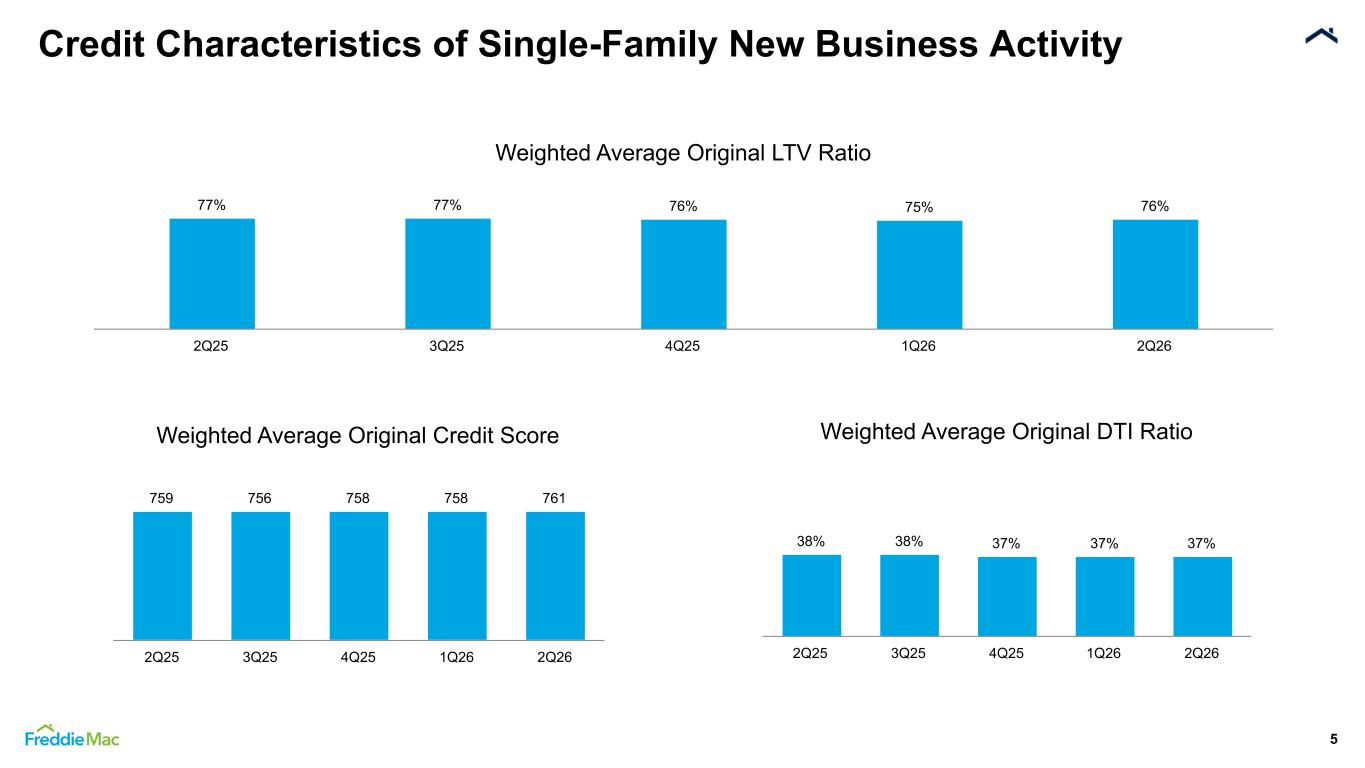
Weighted Average Original LTV Ratio 77% 77% 76% 75% 76% 2Q25 3Q25 4Q25 1Q26 2Q26 5 Weighted Average Original Credit Score 759 756 758 758 761 2Q25 3Q25 4Q25 1Q26 2Q26 Weighted Average Original DTI Ratio 38% 38% 37% 37% 37% 2Q25 3Q25 4Q25 1Q26 2Q26 Credit Characteristics of Single-Family New Business Activity
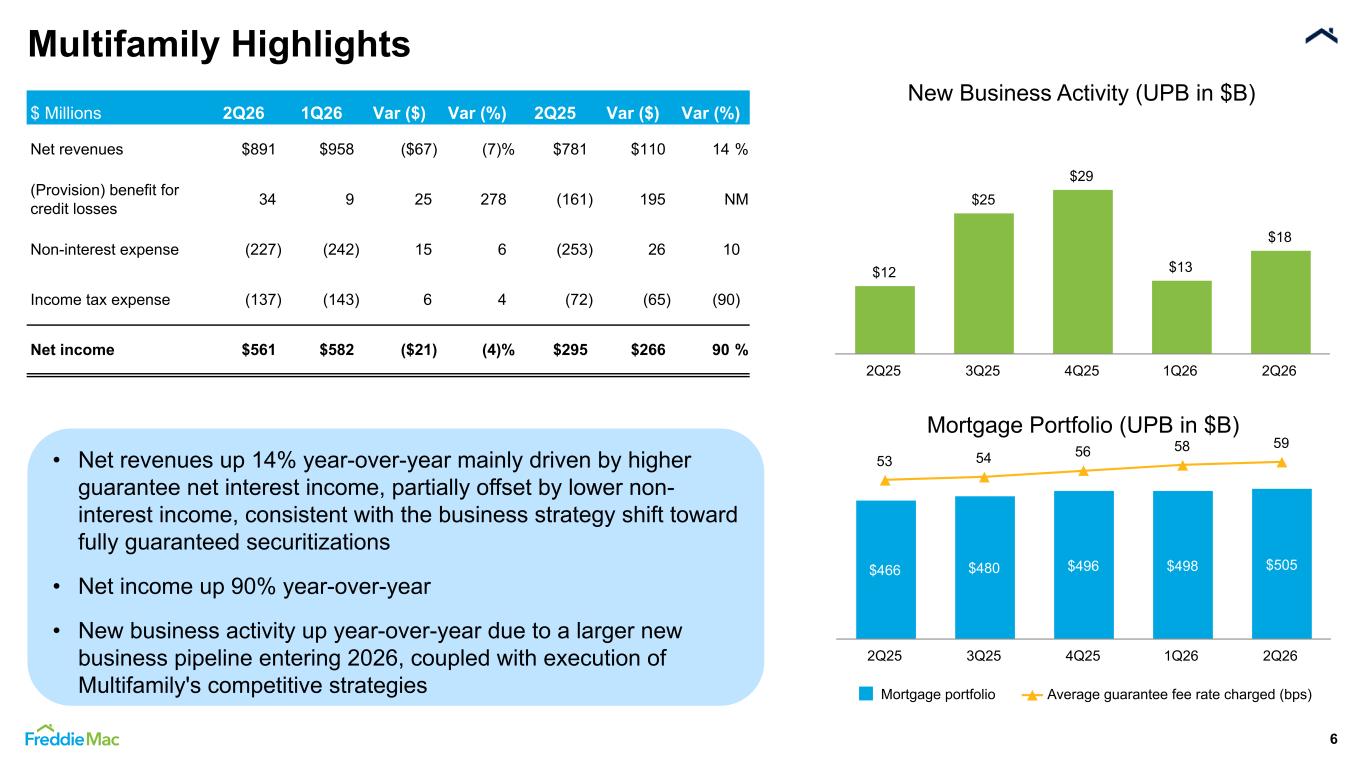
$ Millions 2Q26 1Q26 Var ($) Var (%) 2Q25 Var ($) Var (%) Net revenues $891 $958 ($67) (7) % $781 $110 14 % (Provision) benefit for credit losses 34 9 25 278 (161) 195 NM Non-interest expense (227) (242) 15 6 (253) 26 10 Income tax expense (137) (143) 6 4 (72) (65) (90) Net income $561 $582 ($21) (4) % $295 $266 90 % Mortgage Portfolio (UPB in $B) $466 $480 $496 $498 $505 53 54 56 58 59 Mortgage portfolio Average guarantee fee rate charged (bps) 2Q25 3Q25 4Q25 1Q26 2Q26 Multifamily Highlights 6 • Net revenues up 14% year-over-year mainly driven by higher guarantee net interest income, partially offset by lower non- interest income, consistent with the business strategy shift toward fully guaranteed securitizations • Net income up 90% year-over-year • New business activity up year-over-year due to a larger new business pipeline entering 2026, coupled with execution of Multifamily's competitive strategies New Business Activity (UPB in $B) $12 $25 $29 $13 $18 2Q25 3Q25 4Q25 1Q26 2Q26
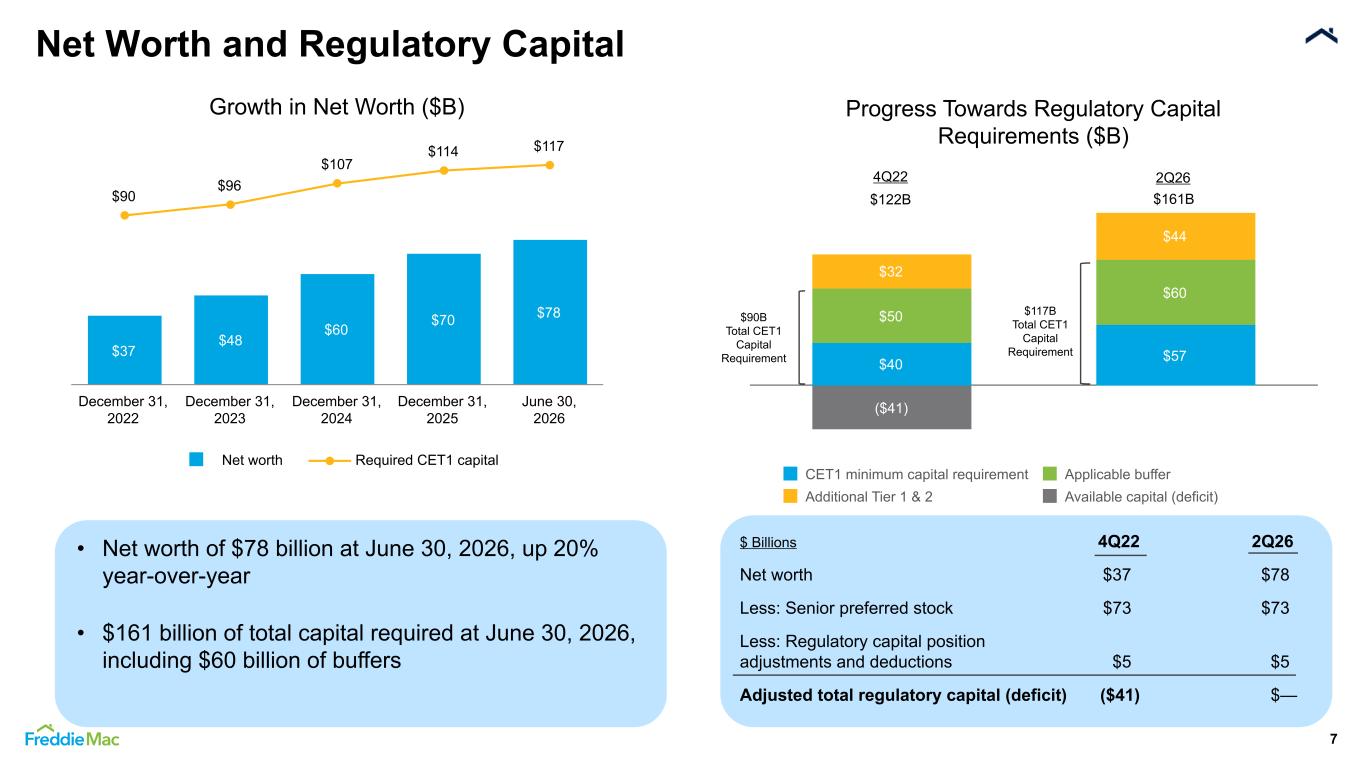
Progress Towards Regulatory Capital Requirements ($B) $40 $57 $50 $60 $32 $44 ($41) CET1 minimum capital requirement Applicable buffer Additional Tier 1 & 2 Available capital (deficit) Growth in Net Worth ($B) $37 $48 $60 $70 $78 $90 $96 $107 $114 $117 Net worth Required CET1 capital December 31, 2022 December 31, 2023 December 31, 2024 December 31, 2025 June 30, 2026 7 Net Worth and Regulatory Capital $161B 2Q26 $117B Total CET1 Capital Requirement • Net worth of $78 billion at June 30, 2026, up 20% year-over-year • $161 billion of total capital required at June 30, 2026, including $60 billion of buffers 4Q22 $122B $90B Total CET1 Capital Requirement $ Billions 4Q22 2Q26 Net worth $37 $78 Less: Senior preferred stock $73 $73 Less: Regulatory capital position adjustments and deductions $5 $5 Adjusted total regulatory capital (deficit) ($41) $—
8 Forward-Looking Statements and Additional Information Forward-looking statements This presentation contains forward-looking statements using terms such as will, expect, forecast, and others that do not refer solely to past periods. These may include statements pertaining to our conservatorship, our current expectations and objectives for our Single-Family and Multifamily segments, our efforts to assist the housing market, liquidity and capital management, and the effects of economic and market conditions and trends on our business, results of operations, and financial condition, including changes in house prices and house price forecasts, our market coverage, the effect of legislative and regulatory developments and new accounting guidance, the credit quality of loans the company owns or guarantees, the costs and benefits of the company’s credit risk transfer (CRT) transactions, the impact of banking crises or failures, and the effects of wars, terrorist incidents, public policy and political developments, cybersecurity incidents, natural disasters or catastrophic events and actions taken in response thereto. Forward-looking statements involve known and unknown risks and uncertainties beyond our control. Our expectations necessarily involve assumptions, judgments, and estimates. Various factors could cause actual results to differ materially from these expectations, including changes in economic and market conditions, liquidity, mortgage spreads, credit outlook, actions by the U.S. government (including FHFA, Treasury, the executive branch, and Congress) and state and local governments, changes in the fiscal and monetary policies of the Federal Reserve, the impact of any downgrade in our credit ratings or those of the U.S. government, and the impacts of legislation or regulations and new or amended accounting guidance. We discuss these assumptions, judgments, estimates and factors in our Annual Report on Form 10-K for the year ended December 31, 2025 and our subsequent SEC filings available on the Investor Relations page of the company’s website at www.freddiemac.com and the SEC’s website at www.sec.gov. We have no obligation to update forward-looking statements to reflect subsequent events or circumstances. Additional Information For more information, including information related to Freddie Mac’s financial results, conservatorship, and related matters, see the company’s Quarterly Report on Form 10-Q for the quarter ended June 30, 2026, Annual Report on Form 10-K for 2025, and Second Quarter 2026 Press Release and Second Quarter 2026 Financial Supplement. These documents are available on the Investor Relations page of the company’s website at www.FreddieMac.com. Additional information about these matters and Freddie Mac and its business is also set forth in the company’s other filings with the SEC, which are available on the Investor Relations page of the company’s website at www.FreddieMac.com and the SEC’s website at www.sec.gov. Freddie Mac encourages all investors and interested members of the public to review these materials for a more complete understanding of the company’s financial results and related disclosures.