
October 28, 2025 2025 INVESTOR & ANALYST DAY
Investor & Analyst Day • October 28, 2025 Cautionary Note Regarding Forward - Looking Statements This presentation contains forward - looking statements, including, without limitation, those related to: strengthening demand in our businesses, demand environment and customer forecasts, our anticipated financial and/or operational results, guidance and outlook, including statements under the headings “Q4 2025 Guidance,” “Q4 2025 Non - GAAP Tax Rate Estimate,” “Q4 2025 End Mark et Revenue Outlook” and “2025 Annual Outlook” and in the sections entitled "Future Ready: Accelerating Market Advancements," "Connectivity & Cloud Solutions," "Advanced Technology Solutions" and "Financial Outlook," market opportunitie s a nd investments in technology platforms and roadmaps, expected research and development (R&D) and other capital expenditures, increased recruiting and operational resources, our intention to launch a new Normal Course Issuer Bid (NCIB) a nd its anticipated terms, developments related to new customer wins, timing of production ramps, deliveries and availabilities of certain key components, anticipated economic conditions, industry and market trends and projections, underlying market gro wth rates, customer demand, our market share and positioning, prospects and opportunities, and strategic initiatives. Such forward - looking statements may, without limitation, be preceded by, followed by, or include words such as "believes," "expects," "anticipates," "estimates," "intends," "plans," "continues," "project," "target," "outlook," "goal," "guidance," "potential," "possible," "contemplate," "seek," or similar expressions, or may employ such future or conditional verbs as "may," "might," "wi ll," "could," "should," or "would," or may otherwise be indicated as forward - looking statements by grammatical construction, phrasing or context. For those statements, we claim the protection of the safe harbor for forward - looking statements contained i n the U.S. Private Securities Litigation Reform Act of 1995, where applicable, and for forward - looking information under applicable Canadian securities laws. Forward - looking statements are provided to assist readers in understanding management's current expectations and plans relating to the future. Forward - looking statements reflect our current estimates, beliefs and assumptions, which are based on management's perception of historic trends, current conditions and expected future developments, as well as other factors it bel ieves are appropriate in the circumstances, including certain assumptions about anticipated CCS and ATS revenue growth; anticipated demand levels across our businesses, including new programs; anticipated technology upgrade cycles; our ability t o r etain programs and customers; program and production ramps to occur as anticipated; continuing operating leverage and improving mix; the impact of anticipated market conditions on our businesses; the reliability of third party market forecasts an d customer indications of future demands, including with respect to data center infrastructure; tax and interest rates; cont inu ed advancement and commercialization of artificial intelligence (AI) technologies and cloud computing; supporting sustained high le vels of capital expenditure investments by leading hyperscaler , AI, and data center customers; our ability develop new capabilities; scaling of our operations to meet the anticipated growth in customer demand; the economy; our customers; our su ppl iers; no material changes to tariffs or trade restrictions compared to what are in effect as of October 27, 2025; that our customers will retain liability for and we will be able to recover substantially all costs from customers relating to product /co mponent tariffs and countermeasures; no material changes in business activities resulting from current macroeconomic trends a nd uncertainties, including evolving global tariff and trade negotiations; our ability to achieve our strategic goals; the avail abi lity of capital resources for, and the permissibility under our credit facility of, repurchases of outstanding Common Shares und er our current NCIB, acceptance of a new NCIB and compliance with applicable laws and regulations pertaining to NCIBs; as well as ot her market, financial and operational assumptions. Readers are cautioned that such information may not be appropriate for other purposes. Readers should not place undue reliance on such forward - looking information. Forward - looking statements are not guarantees of future performance and are subject to risks that could cause actual results to differ materially from those expressed or implied in such forward - looking statements, including, among others, risks related to: customer and segment concentration; reduction in customer revenue; erosion in customer market competitiveness; changing r eve nue mix and margins; uncertain market, industry, political and economic conditions; customer requests to transfer manufacturing of products from one facility to another; changes to policies or legislation; operational challenges such as in ven tory management and materials and supply chain constraints; and program ramps; the cyclical nature and/or volatility of certa in of our businesses; talent management and inefficient employee utilization; risks related to the expansion or consolidation of ou r operations; cash flow, revenue, and operating results, and tax and interest variability; technology and IT disruption; incr eas ing legal, tax and regulatory complexity and uncertainty (including in relation to our or our customers' businesses); integrating an d achieving the anticipated benefits from acquisitions; and the potential adverse impacts of events outside of our control. For more exhaustive information on the foregoing and other material risks, uncertainties and assumptions readers should refer to our public filings at www.sedarplus.ca and www.sec.gov, including in our most recent Management's Discussion and Analysis of Financial Condition and Results of Operations, Annual Report on Form 10 - K, Quarterly Reports on Form 10 - Q, Current R eports on Form 8 - K and other documents filed with, or furnished to, the U.S. Securities and Exchange Commission, and the Canadian Securities Administrators, as applicable. Forward - looking statements speak only as of the date on which they are made, and we disclaim any intention or obligation to upda te or revise any forward - looking statements, whether as a result of new information, future events or otherwise, except as expressly required by applicable law. All forward - looking statements attributable to us are expressly qualified by these cautionary statements. Note Regarding Non - GAAP Financial Measures In addition to disclosing detailed operating results in accordance with Generally Accepted Accounting Principles (GAAP), this pr esentation refers to non - GAAP financial measures (including ratios) to consider in evaluating the Company's operating performance. Management uses adjusted net earnings and other non - GAAP financial measures to assess operating performance, financ ial leverage and the effective use and allocation of resources; to provide more normalized period - to - period comparisons of operating results; to enhance investors' understanding of the core operating results of Celestica's business; and to set management incentive targets. We believe investors use both GAAP and non - GAAP financial measures to assess management's decisions associated with our priorities and capital allocation, as well as to analyze how our business operates in , or responds to, macroeconomic trends or other events that impact our core operations. Non - GAAP financial measures do not have any standardized meaning prescribed by GAAP and may not be comparable to similar measure s presented by other public companies that report under GAAP and use non - GAAP financial measures to describe similar operating metrics. Non - GAAP financial measures are not measures of performance under GAAP and should not be considered in isolation or as a substit ute for any GAAP financial measure. We do not provide reconciliations for forward - looking non - GAAP financial measures, as the items that we exclude from GAAP to calculate the comparable non - GAAP measure are dependent on future events tha t are not able to be reliably predicted by management and are not part of our routine operating activities. We are unable to provide such a reconciliation without unreasonable effort due to the uncertainty and inherent difficulty in predict ing the occurrence, the financial impact and the periods in which the adjustments may be recognized. The occurrence, timing and amount of any of the items excluded from GAAP to calculate non - GAAP could significantly impact our forward - looking GAAP results. Forward - looking non - GAAP financial measures may vary materially from the corresponding GAAP financial measures. Currency Unless otherwise specified, all references to dollars in this presentation are to U.S. dollars. 2
Investor & Analyst Day • October 28, 2025 Agenda Future Ready: Accelerating Market Advancements 1 Financial Outlook 4 Connectivity & Cloud Services ( CCS) 2 Closing Remarks 5 Q&A 6 Advanced Technology Solutions (ATS) 3 3
2025 INVESTOR & ANALYST DAY Future Ready: Accelerating Market Advancements Rob Mionis President and Chief Executive Officer
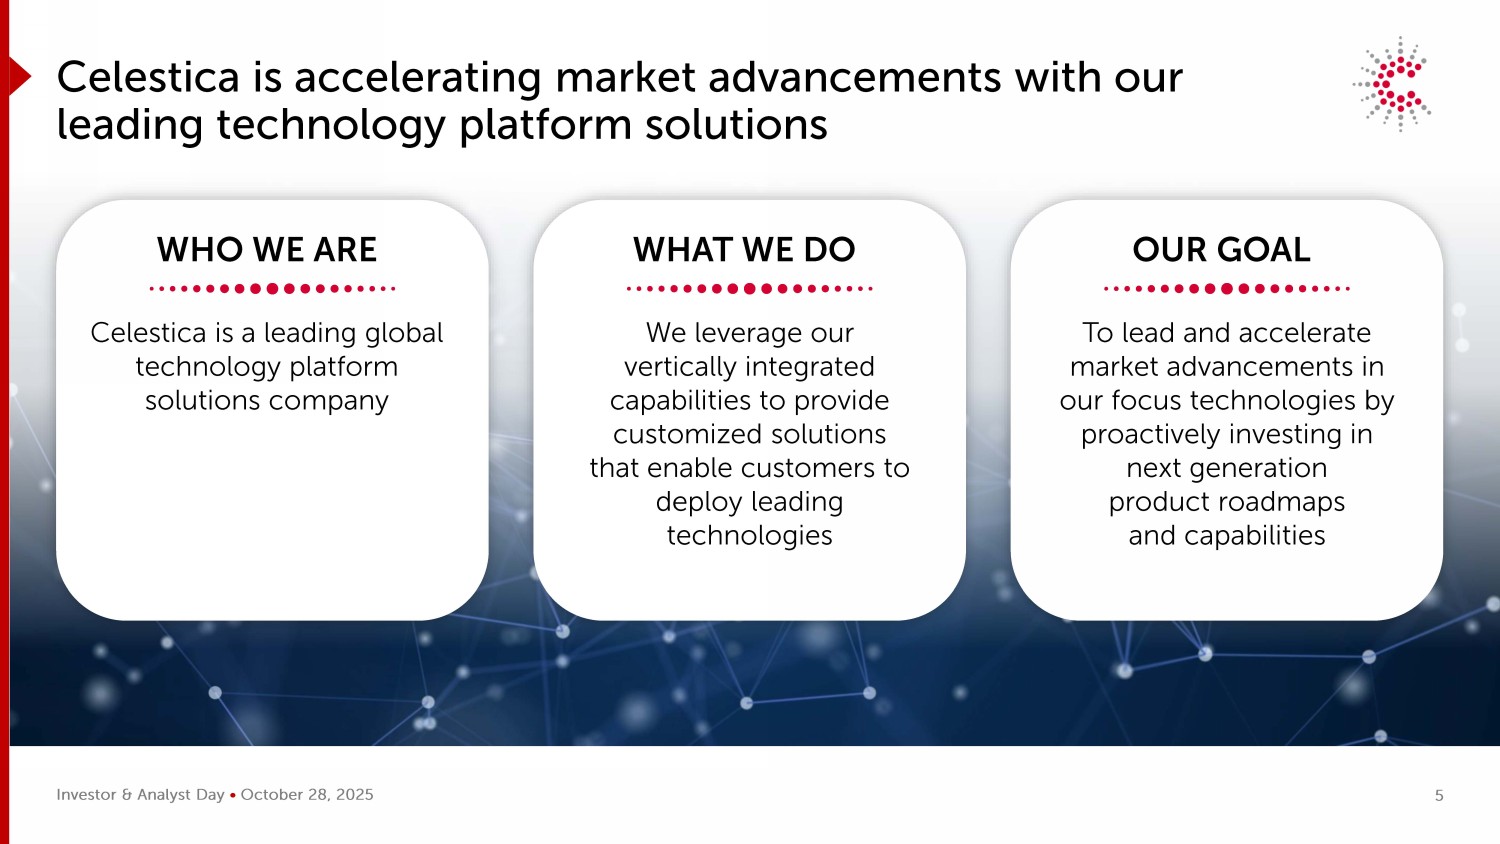
Investor & Analyst Day • October 28, 2025 Celestica is accelerating market advancements with our leading technology platform solutions WHO WE ARE Celestica is a leading global technology platform solutions company We leverage our vertically integrated capabilities to provide customized solutions that enable customers to deploy leading technologies WHAT WE DO To lead and accelerate market advancements in our focus technologies by proactively investing in next generation product roadmaps and capabilities OUR GOAL 5
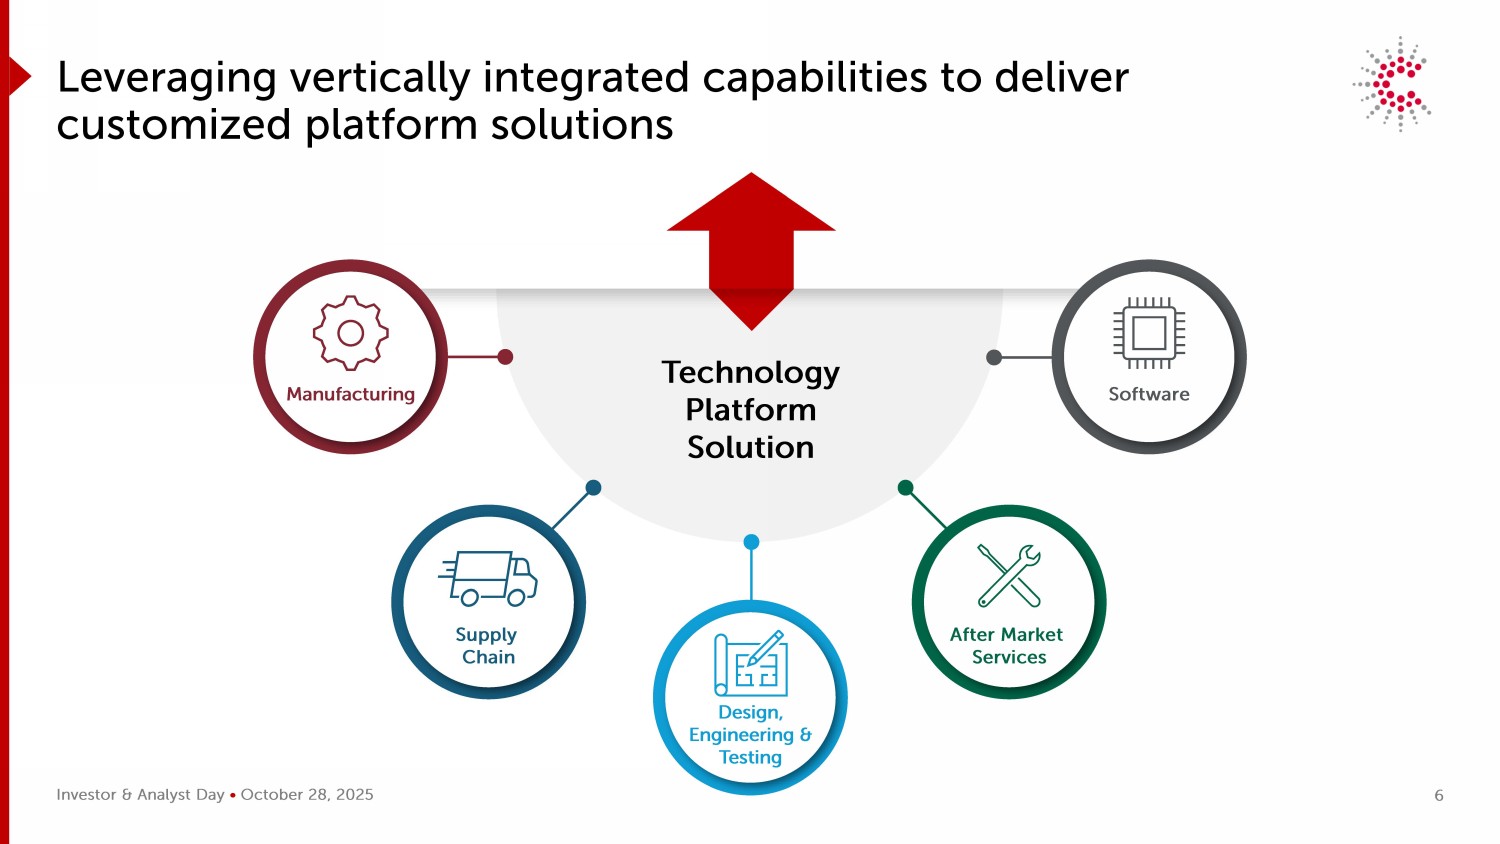
Investor & Analyst Day • October 28, 2025 Leveraging vertically integrated capabilities to deliver customized platform solutions Technology Platform Solution Manufacturing Supply Chain After Market Services Software Design, Engineering & Testing 6
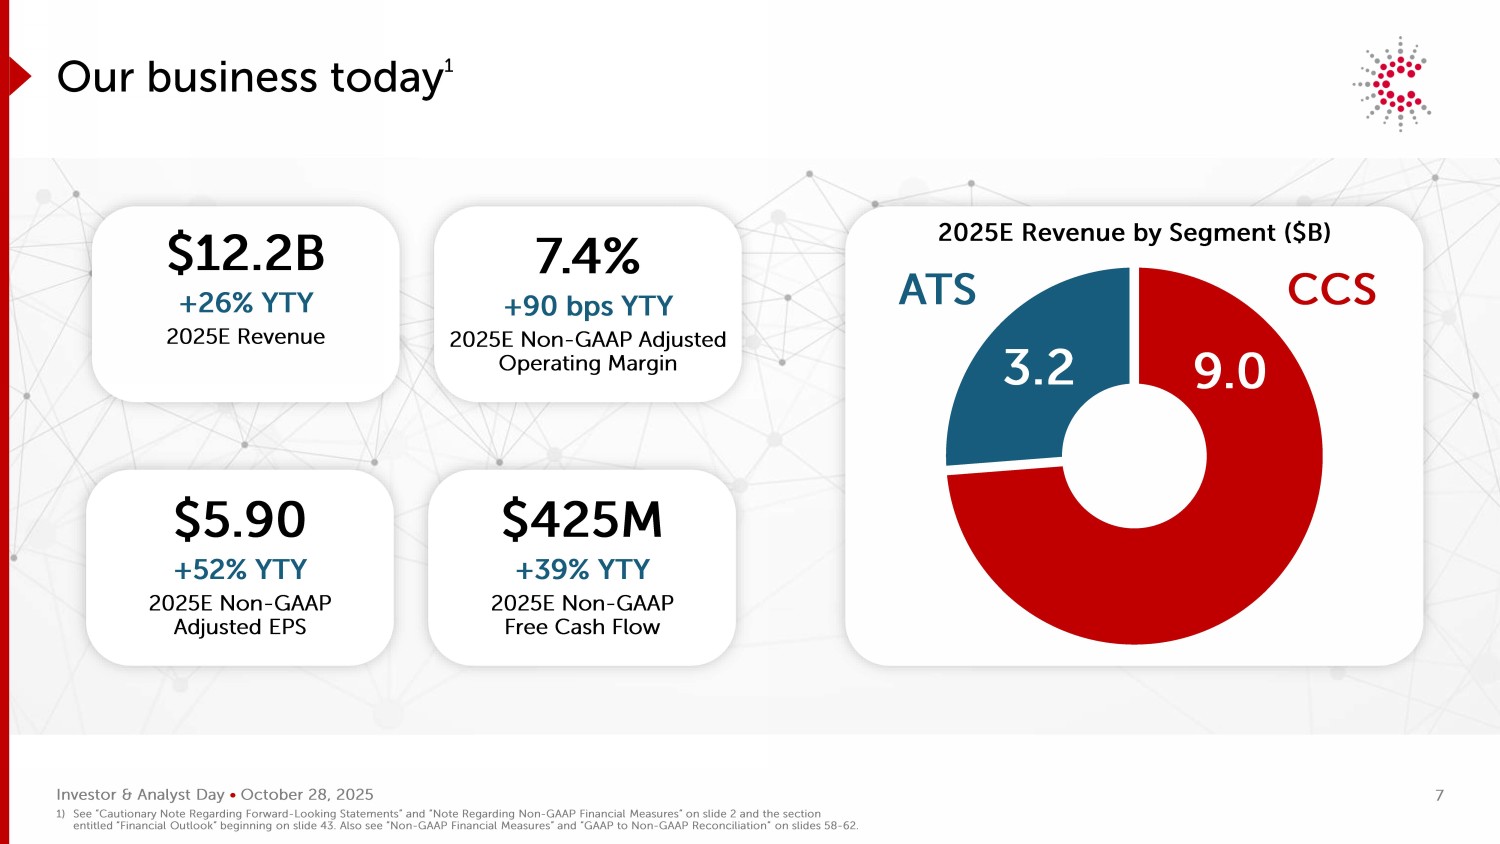
Investor & Analyst Day • October 28, 2025 9.0 3.2 ATS CCS Our business today 1 $12.2B +26% YTY 2025E Revenue $5.90 +52% YTY 2025E Non - GAAP Adjusted EPS $425M +39% YTY 2025E Non - GAAP Free Cash Flow 7.4% +90 bps YTY 2025E Non - GAAP Adjusted Operating Margin 2025E Revenue by Segment ($B) 1) See “Cautionary Note Regarding Forward - Looking Statements” and “Note Regarding Non - GAAP Financial Measures” on slide 2 and the s ection entitled “Financial Outlook” beginning on slide 43. Also see “Non - GAAP Financial Measures” and “GAAP to Non - GAAP Reconciliation” on slides 58 - 62. 7
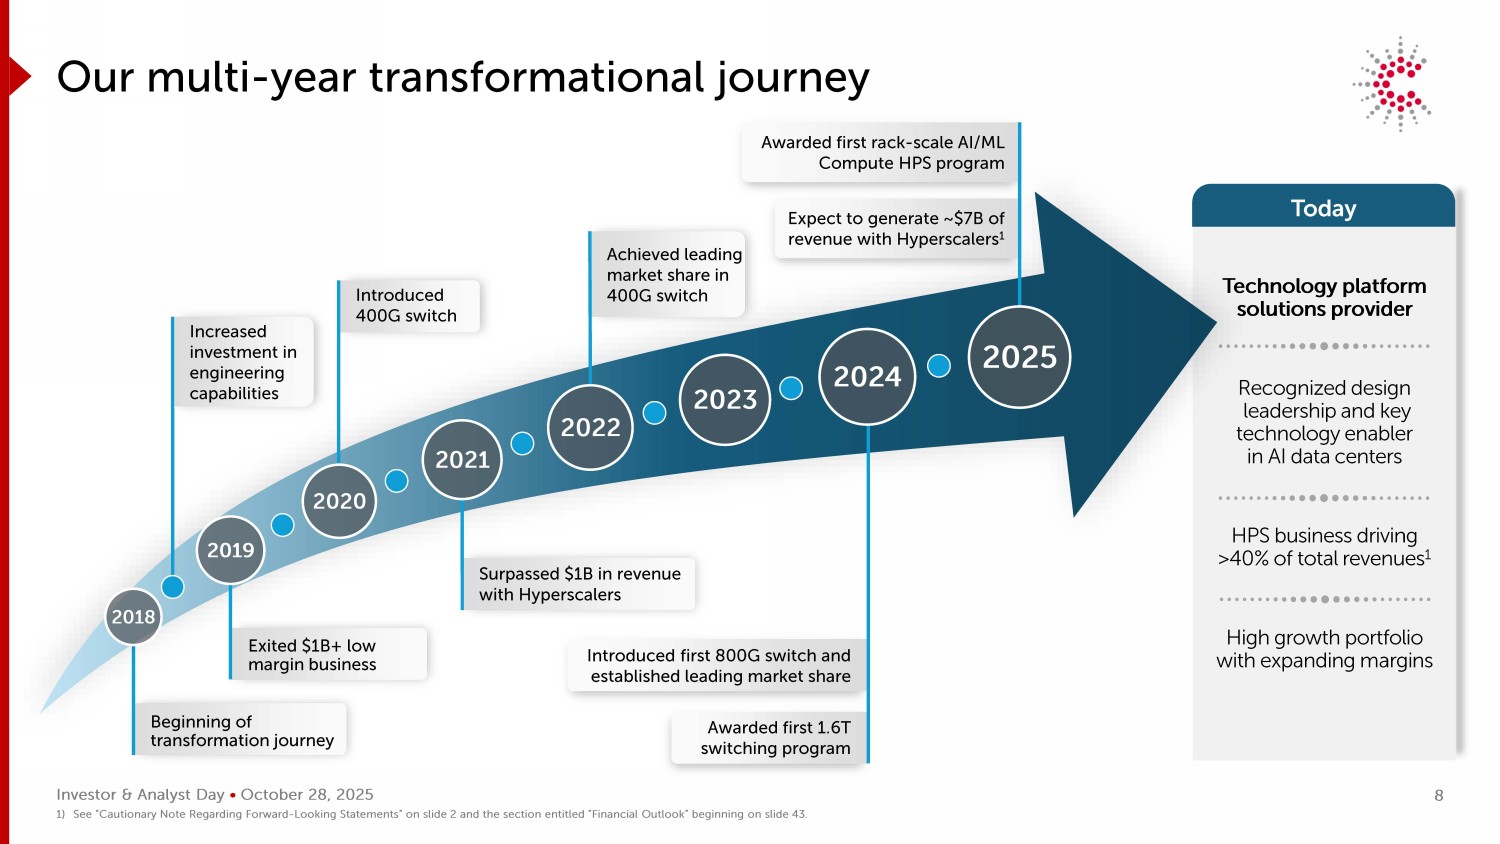
Investor & Analyst Day • October 28, 2025 Technology platform solutions provider Recognized design leadership and key technology enabler in AI data centers HPS business driving >40% of total revenues 1 High growth portfolio with expanding margins Today Beginning of transformation journey Our multi - year transformational journey Increased investment in engineering capabilities Introduced 400G switch Exited $1B+ low margin business Surpassed $1B in revenue with Hyperscalers Achieved leading market share in 400G switch Awarded first 1.6T switching program Introduced first 800G switch and established leading market share Expect to generate ~$7B of revenue with Hyperscalers 1 Awarded first rack - scale AI/ML Compute HPS program 1) See “Cautionary Note Regarding Forward - Looking Statements” on slide 2 and the section entitled “Financial Outlook” beginning on slide 43. 8 2021 2018 2019 2020 2022 2023 2024 2025
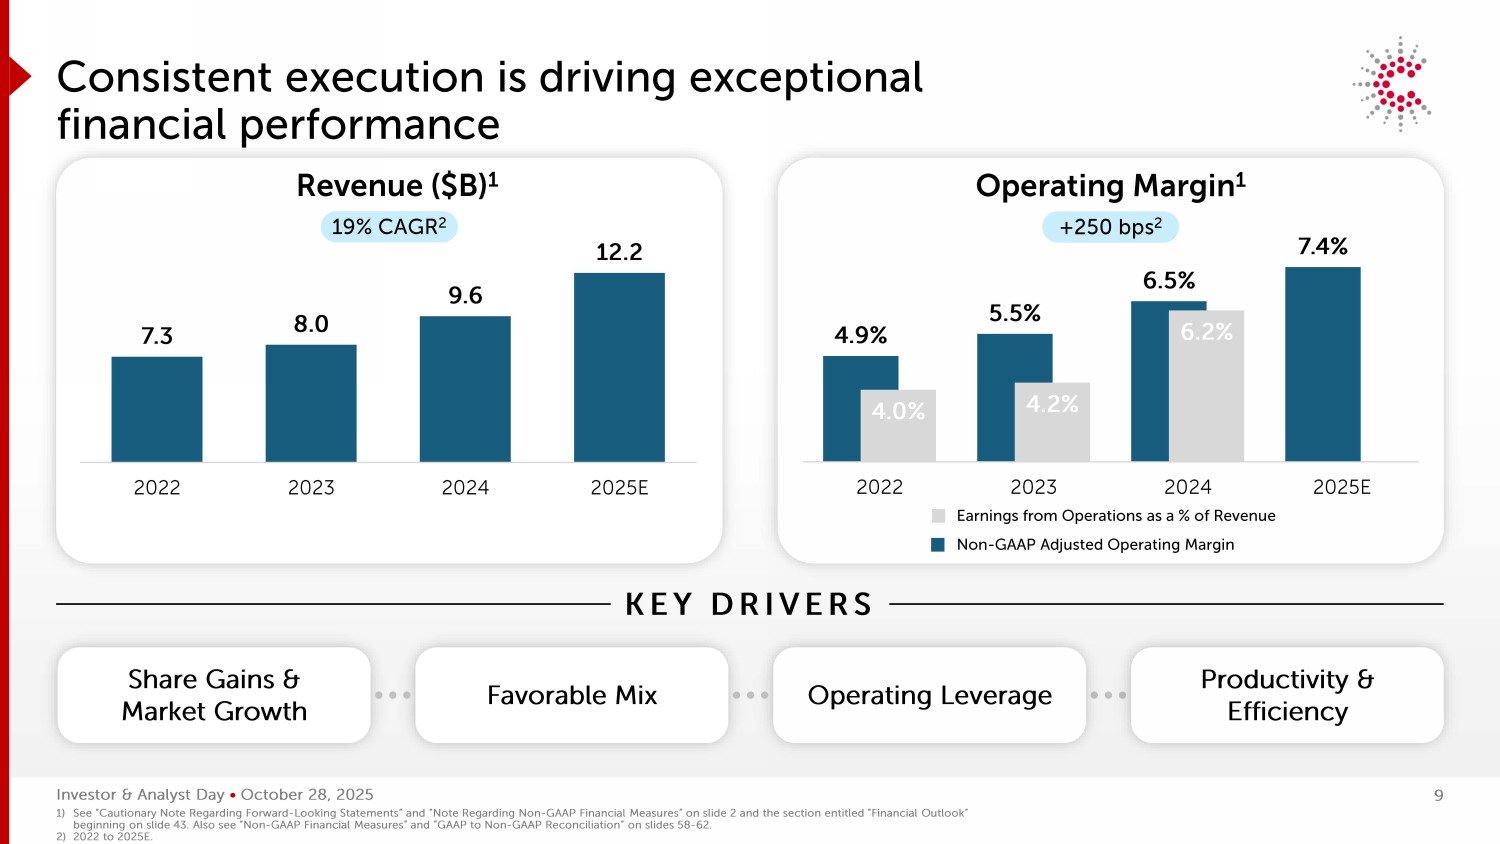
Investor & Analyst Day • October 28, 2025 7.3 8.0 9.6 12.2 2022 2023 2024 2025E Revenue 4.9% 5.5% 6.5% 7.4% 4.0% 4.2% 6.2% 2022 2023 2024 2025E Consistent execution is driving exceptional financial performance KEY DRIVERS Share Gains & Market Growth Productivity & Efficiency Operating Leverage Favorable Mix Revenue ($B) 1 Operating Margin 1 +250 bps 2 19% CAGR 2 Earnings from Operations as a % of Revenue Non - GAAP Adjusted Operating Margin 1) See “Cautionary Note Regarding Forward - Looking Statements” and “Note Regarding Non - GAAP Financial Measures” on slide 2 and the s ection entitled “Financial Outlook” beginning on slide 43. Also see “Non - GAAP Financial Measures” and “GAAP to Non - GAAP Reconciliation” on slides 58 - 62. 2) 2022 to 2025E. 9
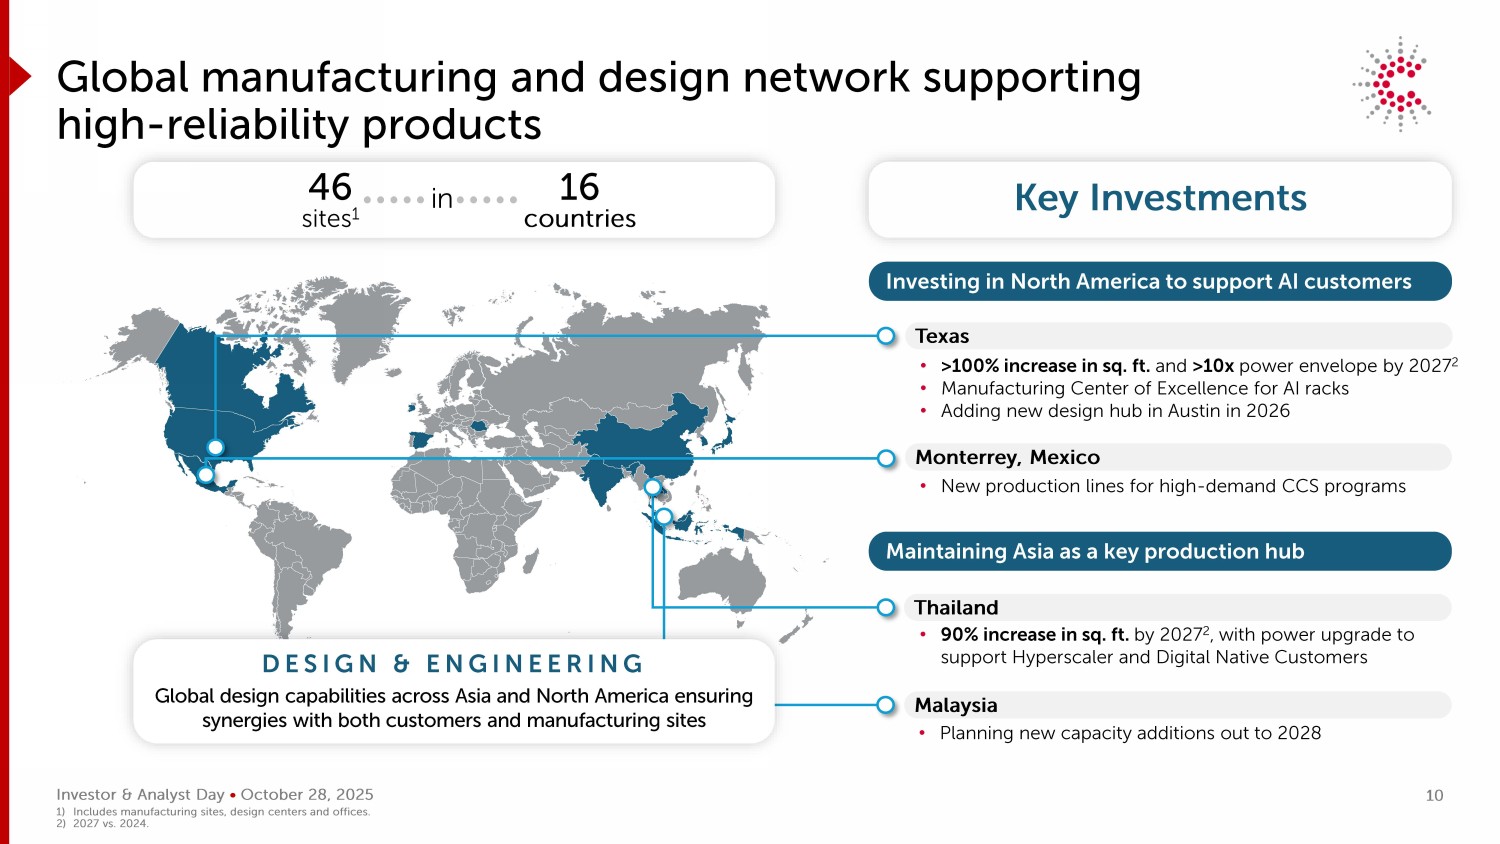
Investor & Analyst Day • October 28, 2025 Key Investments Global manufacturing and design network supporting high - reliability products Investing in North America to support AI customers 46 sites 1 16 countries in • >100% increase in sq. ft. and >10x power envelope by 2027 2 • Manufacturing Center of Excellence for AI racks • Adding new design hub in Austin in 2026 Texas • New production lines for high - demand CCS programs Monterrey, Mexico Maintaining Asia as a key production hub • 90% increase in sq. ft. by 2027 2 , with power upgrade to support Hyperscaler and Digital Native Customers Thailand • Planning new capacity additions out to 2028 Malaysia DESIGN & ENGINEERING Global design capabilities across Asia and North America ensuring synergies with both customers and manufacturing sites 1) Includes manufacturing sites, design centers and offices. 2) 2027 vs. 2024. 10
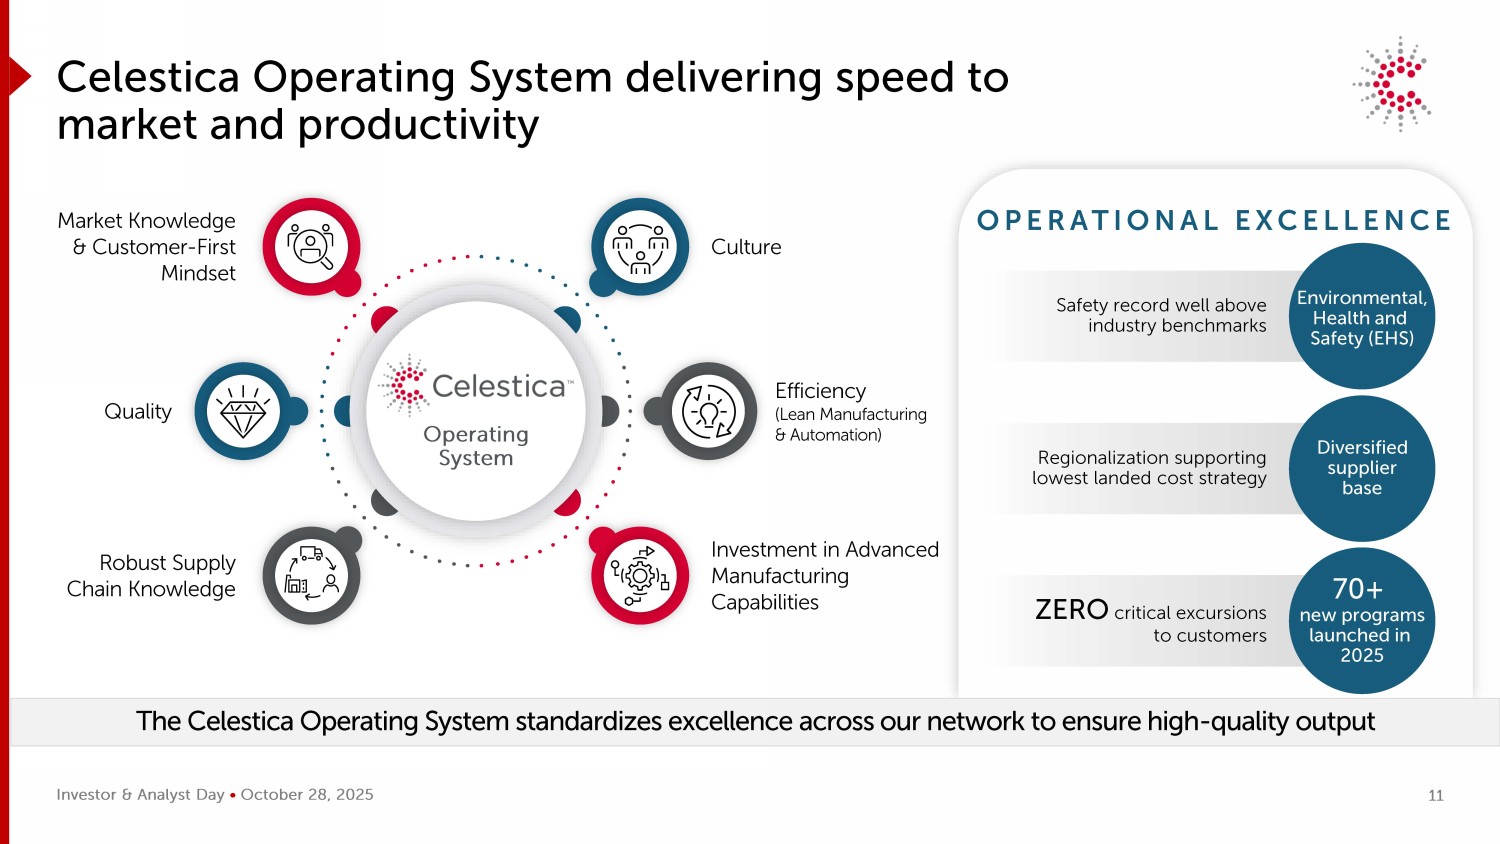
Investor & Analyst Day • October 28, 2025 OPERATIONAL EXCELLENCE Celestica Operating System delivering speed to market and productivity The Celestica Operating System standardizes excellence across our network to ensure high - quality output Operating System Culture Efficiency (Lean Manufacturing & Automation) Investment in Advanced Manufacturing Capabilities Market Knowledge & Customer - First Mindset Quality Robust Supply Chain Knowledge Safety record well above industry benchmarks Environmental, Health and Safety (EHS) ZERO critical excursions to customers 70+ new programs launched in 2025 Regionalization supporting lowest landed cost strategy Diversified supplier base 11
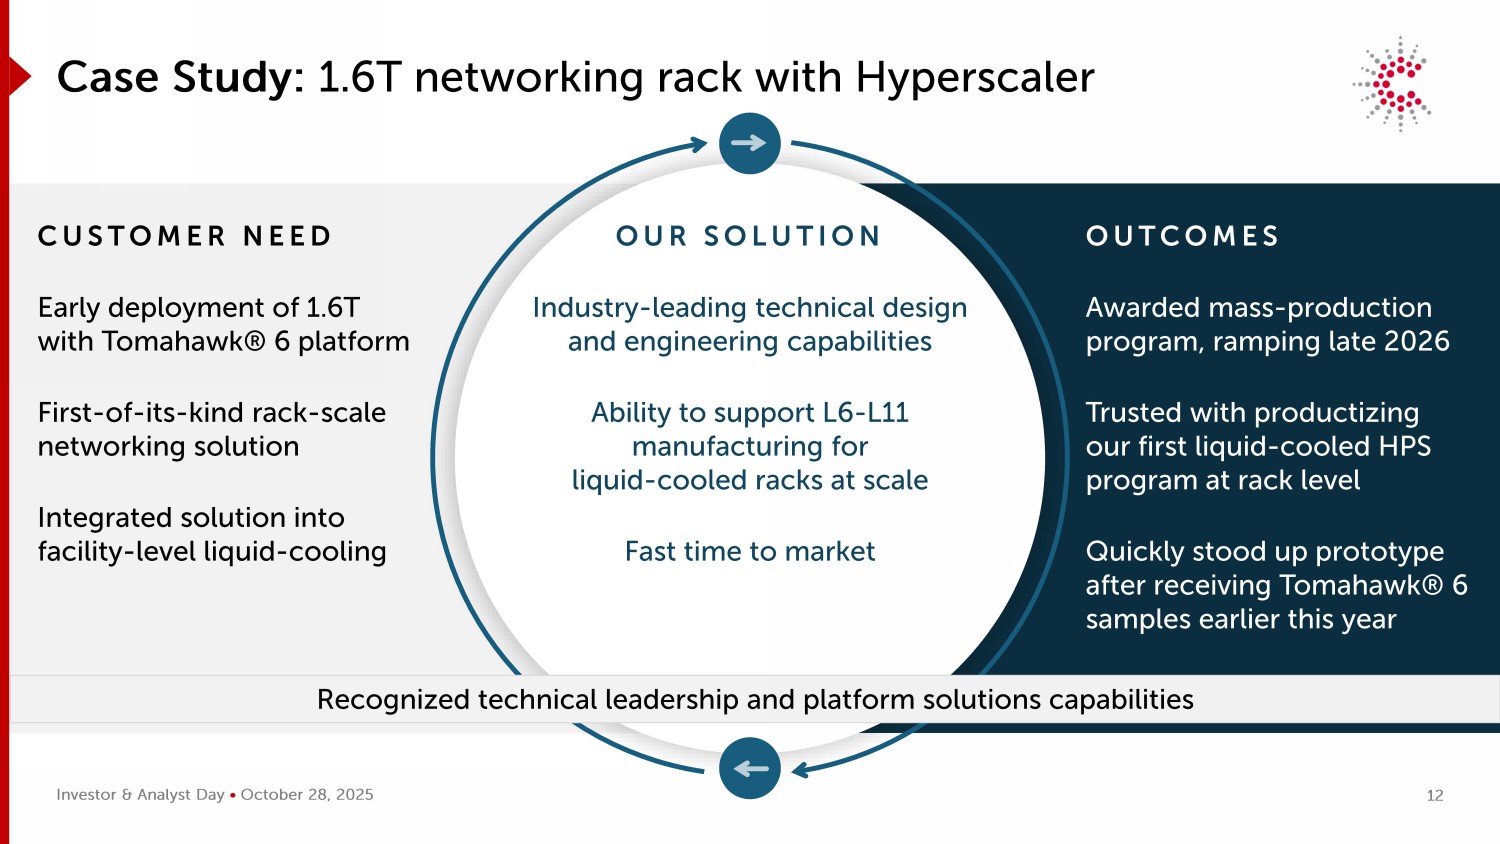
Investor & Analyst Day • October 28, 2025 Case Study: 1.6T networking rack with Hyperscaler CUSTOMER NEED Early deployment of 1.6T with Tomahawk® 6 platform First - of - its - kind rack - scale networking solution Integrated solution into facility - level liquid - cooling OUTCOMES Awarded mass - production program, ramping late 2026 Trusted with productizing our first liquid - cooled HPS program at rack level Quickly stood up prototype after receiving Tomahawk® 6 samples earlier this year OUR SOLUTION Industry - leading technical design and engineering capabilities Ability to support L6 - L11 manufacturing for liquid - cooled racks at scale Fast time to market Recognized technical leadership and platform solutions capabilities 12
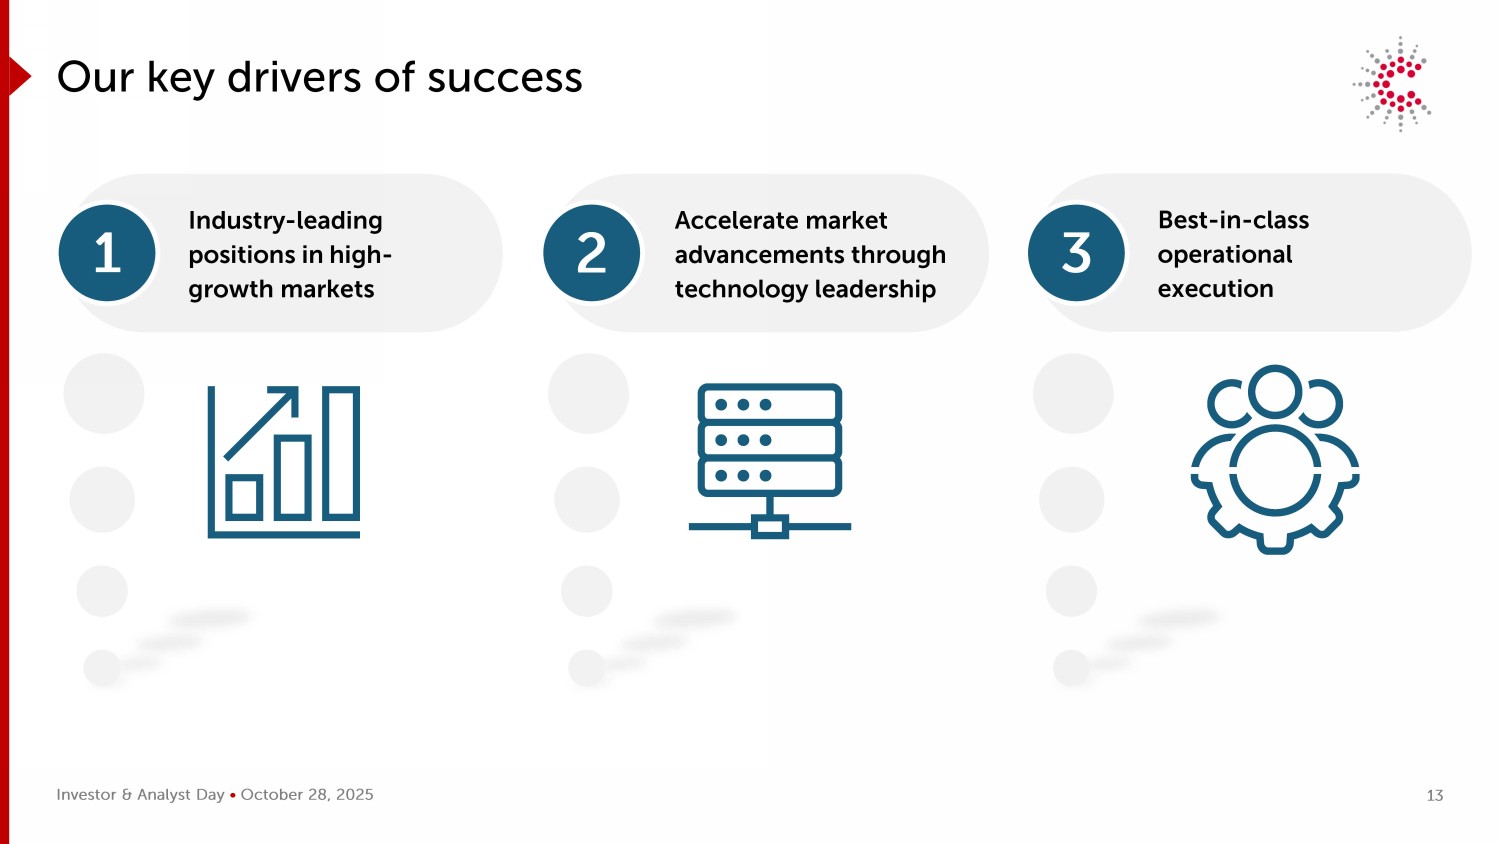
Investor & Analyst Day • October 28, 2025 Our key drivers of success Industry - leading positions in high - growth markets Accelerate market advancements through technology leadership Best - in - class operational execution 1 2 3 13
2025 INVESTOR & ANALYST DAY Connectivity & Cloud Solutions Jason Phillips President, CCS
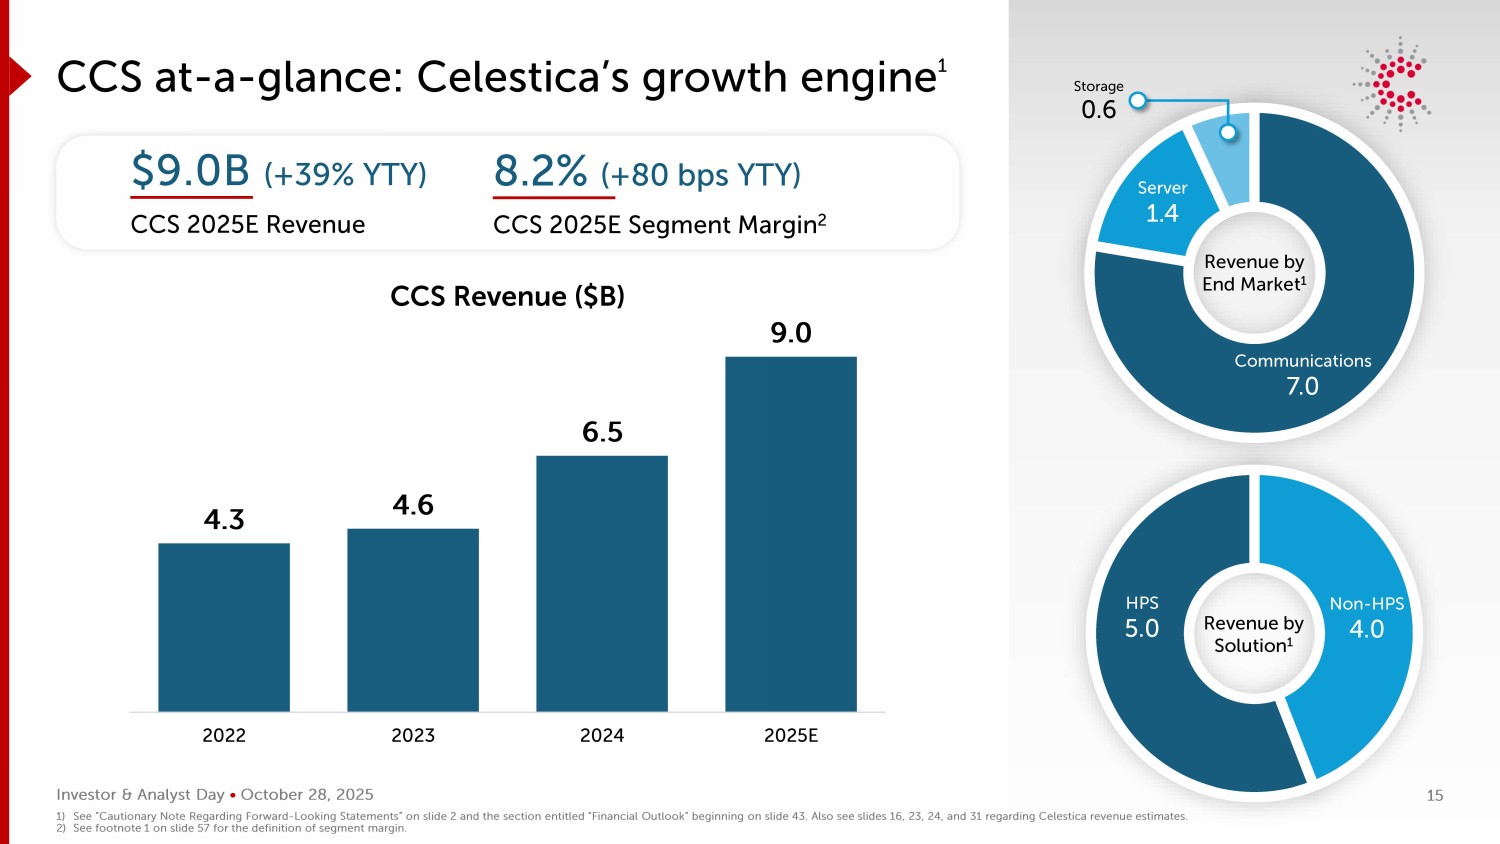
Investor & Analyst Day • October 28, 2025 Non - HPS 4.0 HPS 5.0 Revenue by Solution 1 CCS at - a - glance: Celestica’s growth engine 1 $9.0B (+39% YTY) CCS 2025E Revenue 8.2% (+80 bps YTY) CCS 2025E Segment Margin 2 4.3 4.6 6.5 9.0 2022 2023 2024 2025E Communications 7.0 Server 1.4 Storage 0.6 Revenue by End Market 1 CCS Revenue ($B) 1) See “Cautionary Note Regarding Forward - Looking Statements” on slide 2 and the section entitled “Financial Outlook” beginning on slide 43. Also see slides 16, 23, 24, and 31 regarding Celestica revenue estimates. 2) See footnote 1 on slide 57 for the definition of segment margin. 15
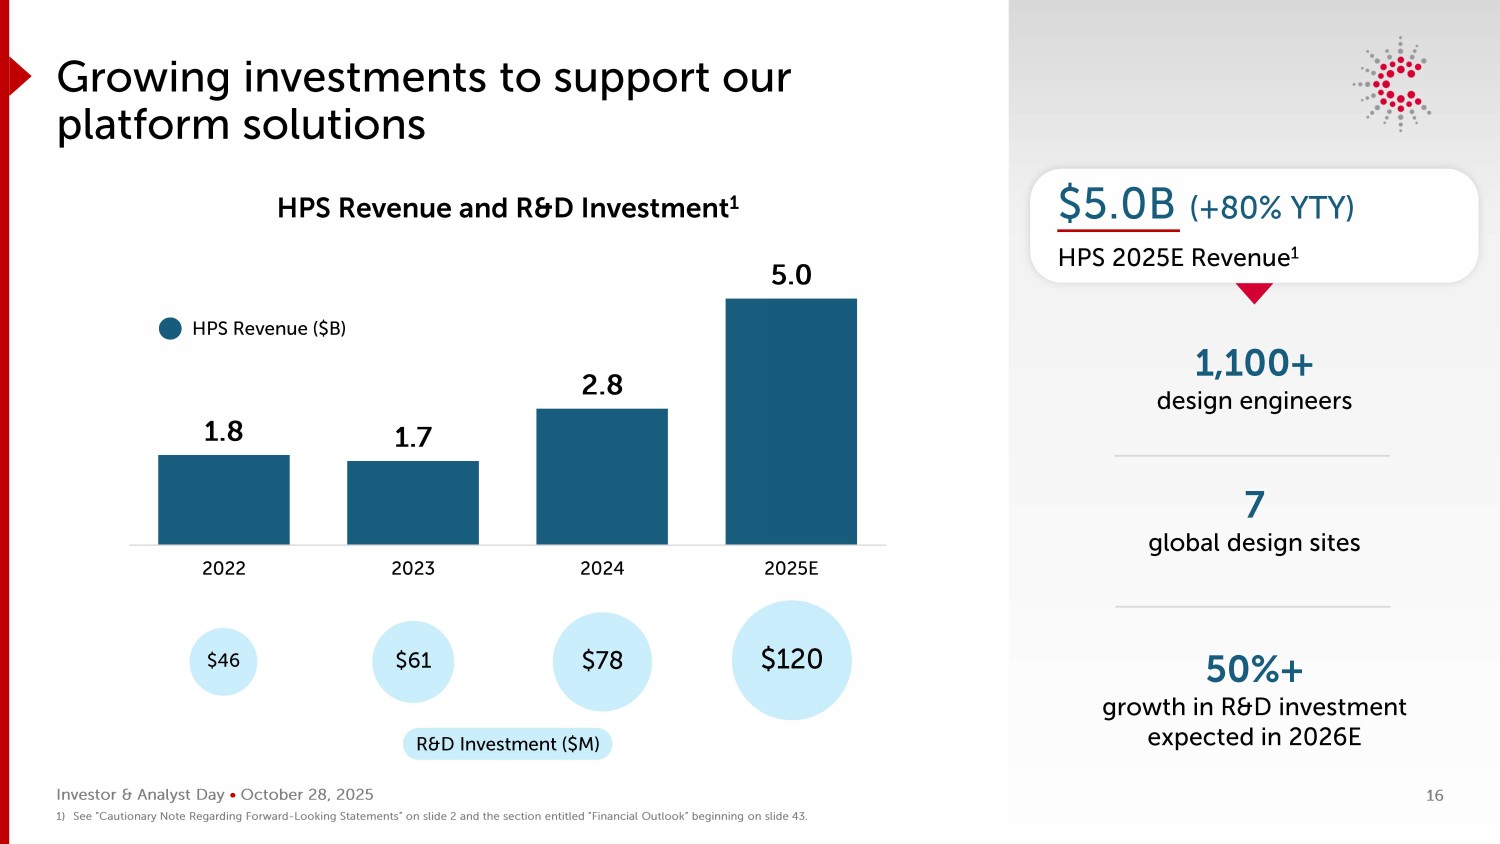
Investor & Analyst Day • October 28, 2025 1.8 1.7 2.8 5.0 2022 2023 2024 2025E Growing investments to support our platform solutions $5.0B (+80% YTY) HPS 2025E Revenue 1 1,100+ design engineers $46 $61 $78 $120 HPS Revenue ($B) HPS Revenue and R&D Investment 1 7 global design sites 50%+ growth in R&D investment expected in 2026E R&D Investment ($M) 1) See “Cautionary Note Regarding Forward - Looking Statements” on slide 2 and the section entitled “Financial Outlook” beginning on slide 43. 16
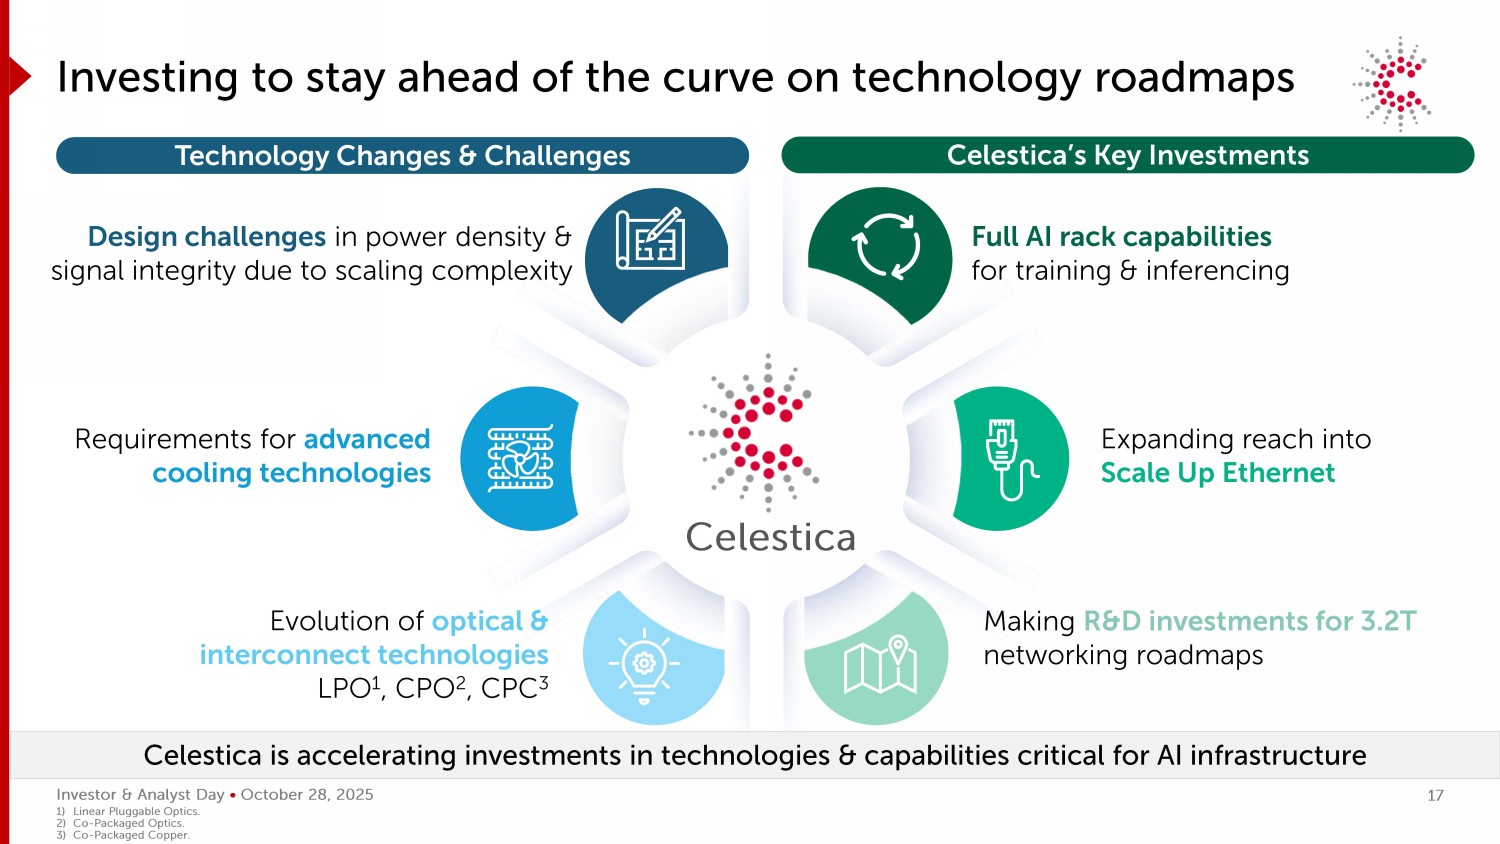
Investor & Analyst Day • October 28, 2025 Investing to stay ahead of the curve on technology roadmaps Celestica Design challenges in power density & signal integrity due to scaling complexity Evolution of optical & interconnect technologies LPO 1 , CPO 2 , CPC 3 Requirements for advanced cooling technologies Full AI rack capabilities for training & inferencing Expanding reach into Scale Up Ethernet Making R&D investments for 3.2T networking roadmaps Celestica is accelerating investments in technologies & capabilities critical for AI infrastructure Technology Changes & Challenges Celestica’s Key Investments 1) Linear Pluggable Optics. 2) Co - Packaged Optics. 3) Co - Packaged Copper. 17
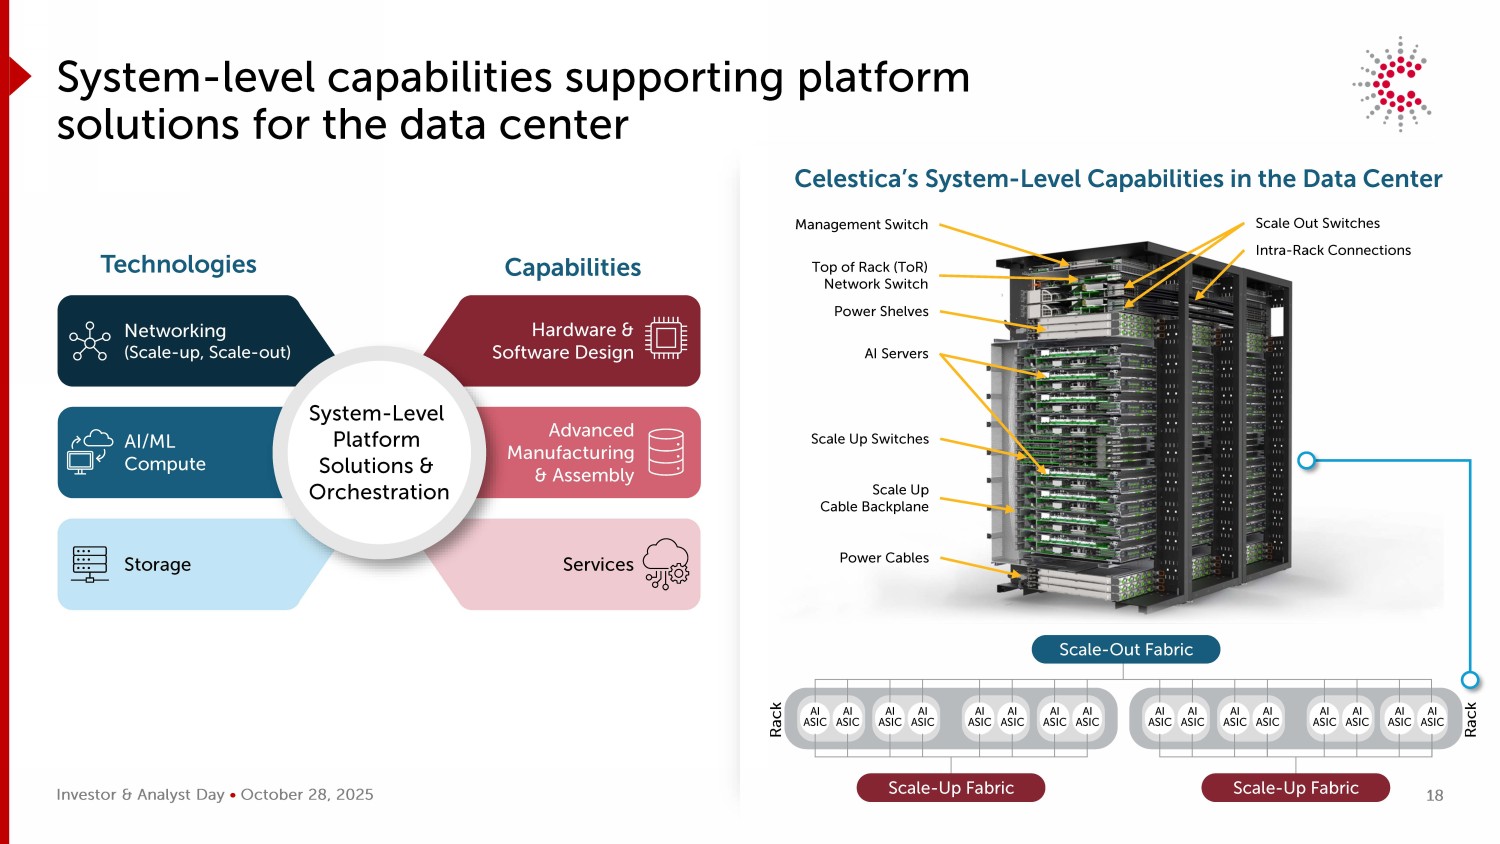
Investor & Analyst Day • October 28, 2025 Scale Up Cable Backplane Management Switch Top of Rack ( ToR ) Network Switch Scale Out Switches Power Shelves Intra - Rack Connections AI Servers Scale Up Switches Power Cables System - level capabilities supporting platform solutions for the data center Celestica’s System - Level Capabilities in the Data Center Advanced Manufacturing & Assembly AI/ML Compute Services Storage Hardware & Software Design Networking (Scale - up, Scale - out) System - Level Platform Solutions & Orchestration Technologies Capabilities AI ASIC AI ASIC AI ASIC AI ASIC AI ASIC AI ASIC AI ASIC AI ASIC AI ASIC AI ASIC AI ASIC AI ASIC AI ASIC AI ASIC AI ASIC AI ASIC Scale - Out Fabric Scale - Up Fabric Scale - Up Fabric Rack Rack 18
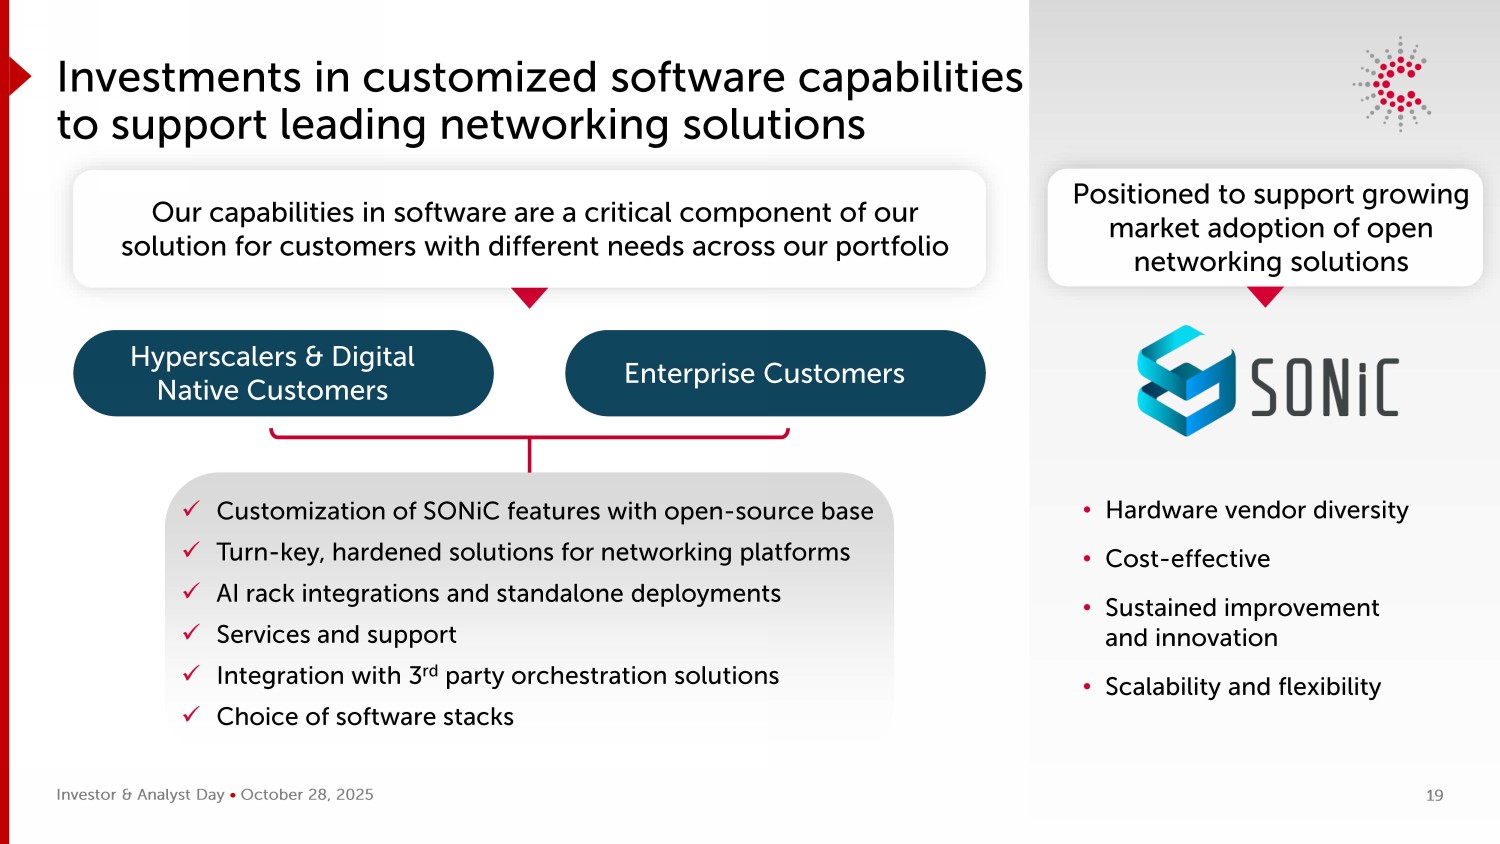
Investor & Analyst Day • October 28, 2025 Enterprise Customers Investments in customized software capabilities to support leading networking solutions Our capabilities in software are a critical component of our solution for customers with different needs across our portfolio • Hardware vendor diversity • Cost - effective • Sustained improvement and innovation • Scalability and flexibility Hyperscalers & Digital Native Customers Positioned to support growing market adoption of open networking solutions x Customization of SONiC features with open - source base x Turn - key, hardened solutions for networking platforms x AI rack integrations and standalone deployments x Services and support x Integration with 3 rd party orchestration solutions x Choice of software stacks 19
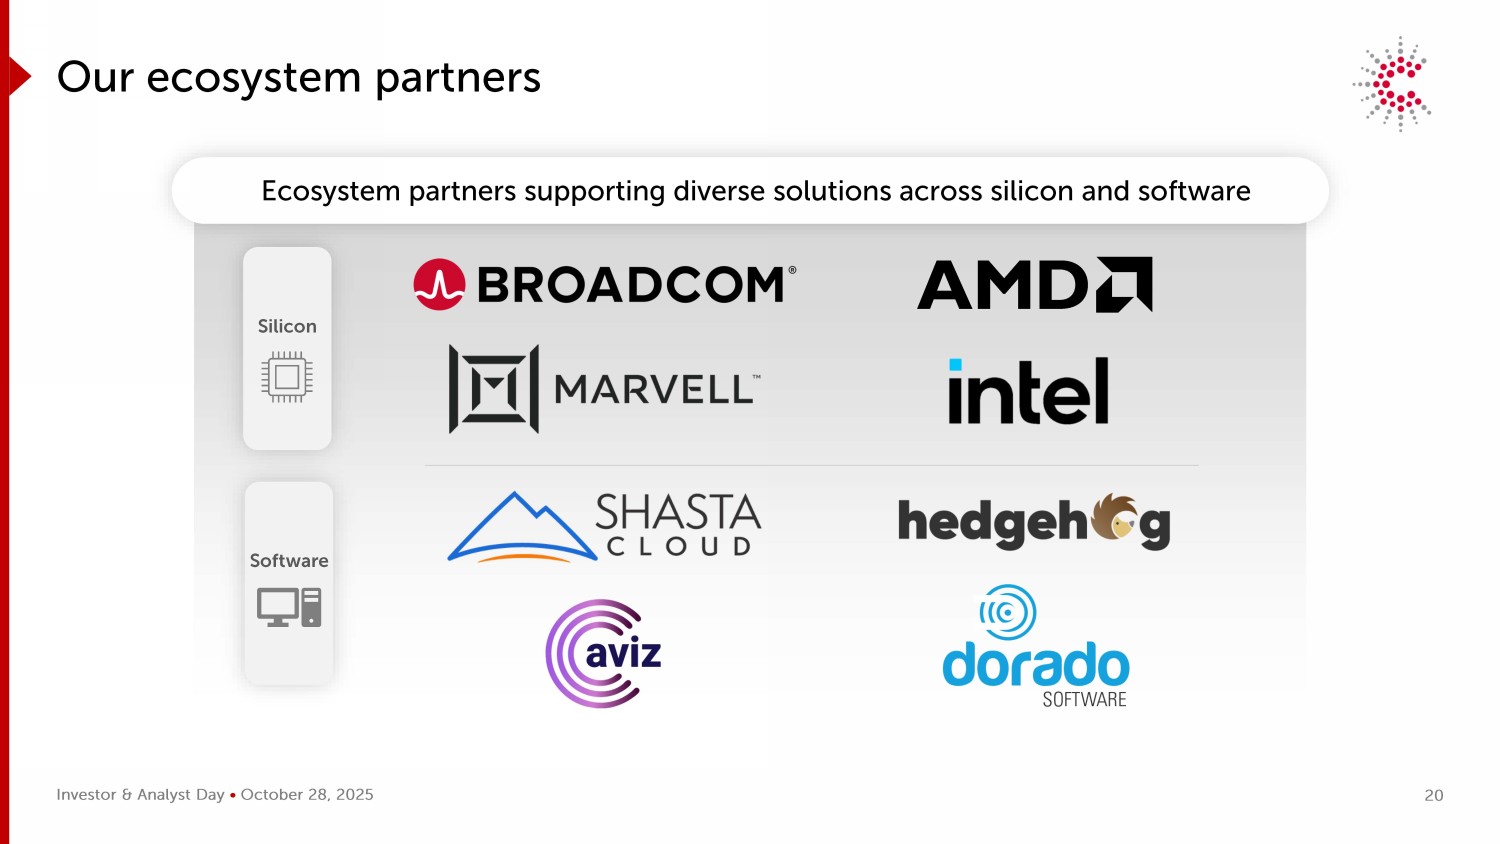
Investor & Analyst Day • October 28, 2025 Our ecosystem partners Silicon Software Ecosystem partners supporting diverse solutions across silicon and software 20
Investor & Analyst Day • October 28, 2025 Recognized as a preferred platform solutions provider 21 Broadcom recognizes Celestica as our preferred provider for our most technically demanding data center platform solutions. Their world - class execution in delivering integrated XPU - based systems and high - performance networking solutions is critical for our customers’ success. – HOCK TAN | PRESIDENT AND CEO, BROADCOM
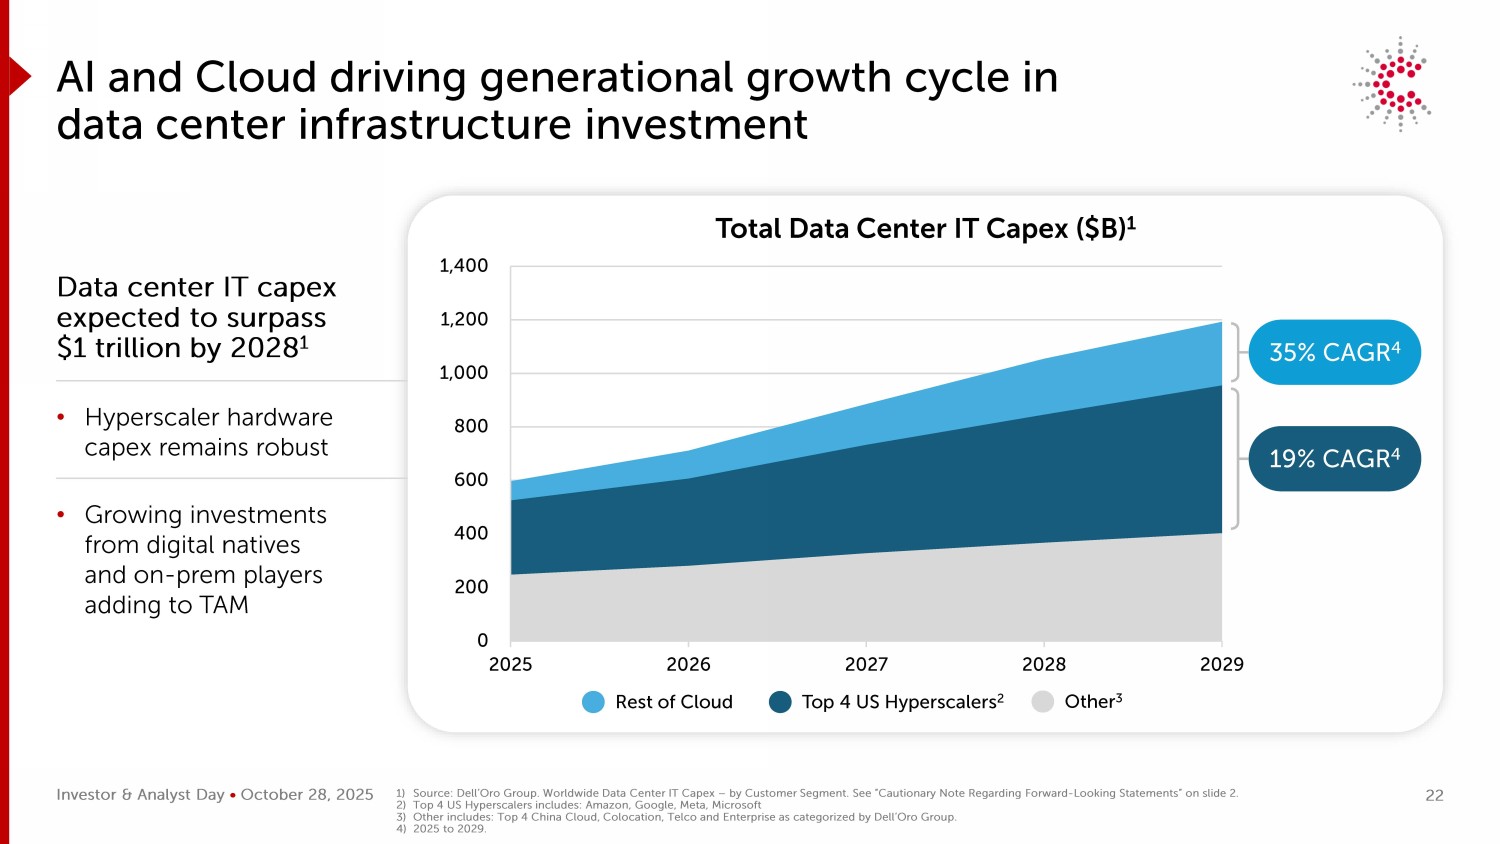
Investor & Analyst Day • October 28, 2025 0 200 400 600 800 1,000 1,200 1,400 2025 2026 2027 2028 2029 AI and Cloud driving generational growth cycle in data center infrastructure investment Data center IT capex expected to surpass $1 trillion by 2028 1 • Hyperscaler hardware capex remains robust • Growing investments from digital natives and on - prem players adding to TAM Total Data Center IT Capex ($B) 1 35 % CAGR 4 Top 4 US Hyperscalers 2 Rest of Cloud Other 3 19 % CAGR 4 1) Source: Dell’Oro Group. Worldwide Data Center IT Capex – by Customer Segment. See “Cautionary Note Regarding Forward - Looking Statements” on slid e 2. 2) Top 4 US Hyperscalers includes: Amazon, Google, Meta, Microsoft 3) Other includes: Top 4 China Cloud, Colocation, Telco and Enterprise as categorized by Dell’Oro Group. 4) 2025 to 2029. 22
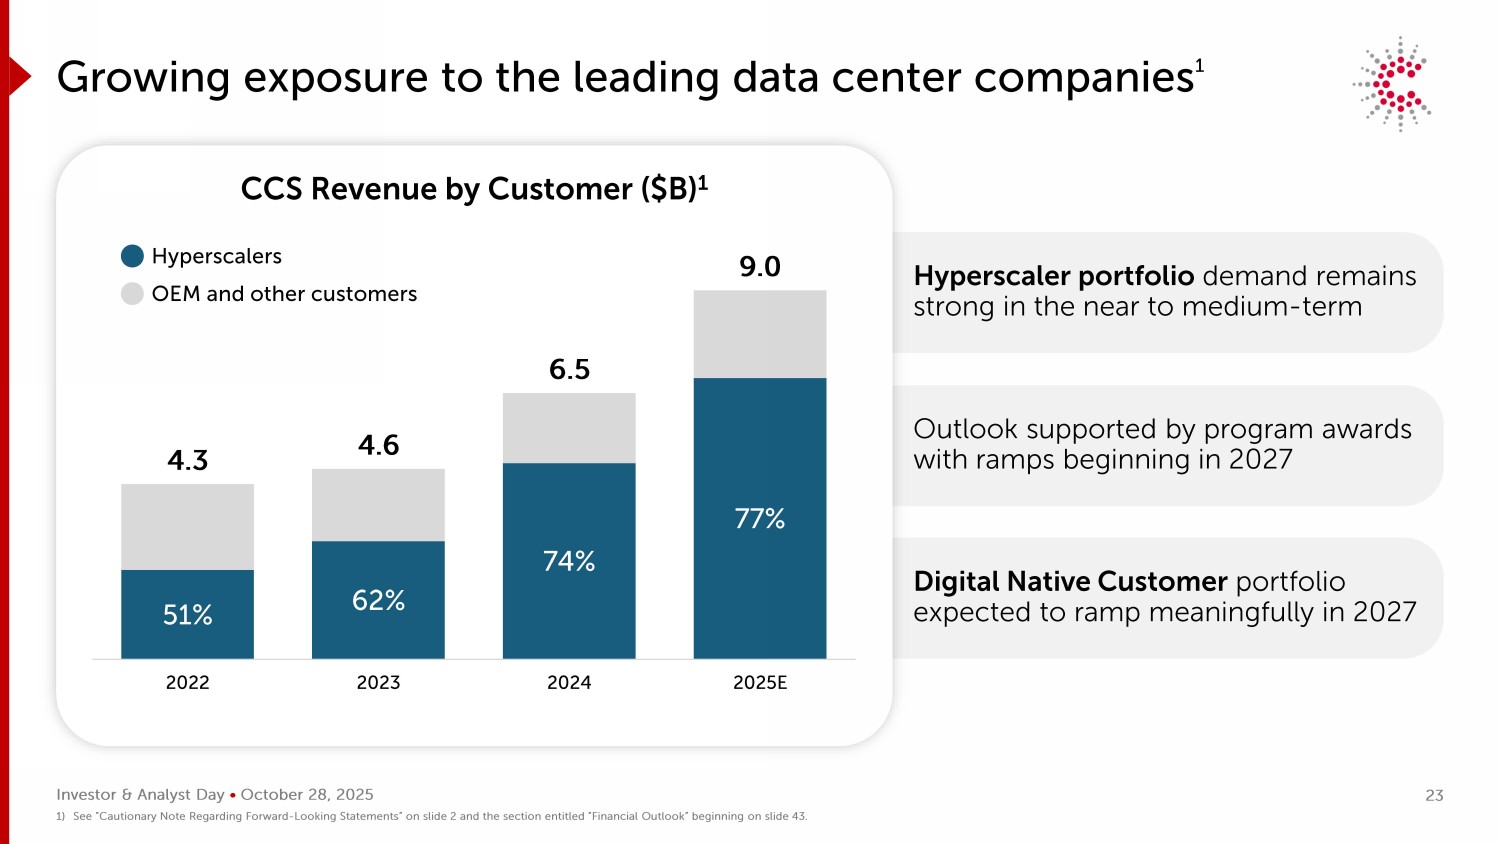
Investor & Analyst Day • October 28, 2025 Hyperscaler portfolio demand remains strong in the near to medium - term Outlook supported by program awards with ramps beginning in 2027 Digital Native Customer portfolio expected to ramp meaningfully in 2027 51% 62% 74% 77% 4.3 4.6 6.5 9.0 2022 2023 2024 2025E Growing exposure to the leading data center companies 1 CCS Revenue by Customer ($B) 1 Hyperscalers OEM and other customers 1) See “Cautionary Note Regarding Forward - Looking Statements” on slide 2 and the section entitled “Financial Outlook” beginning on slide 43. 23
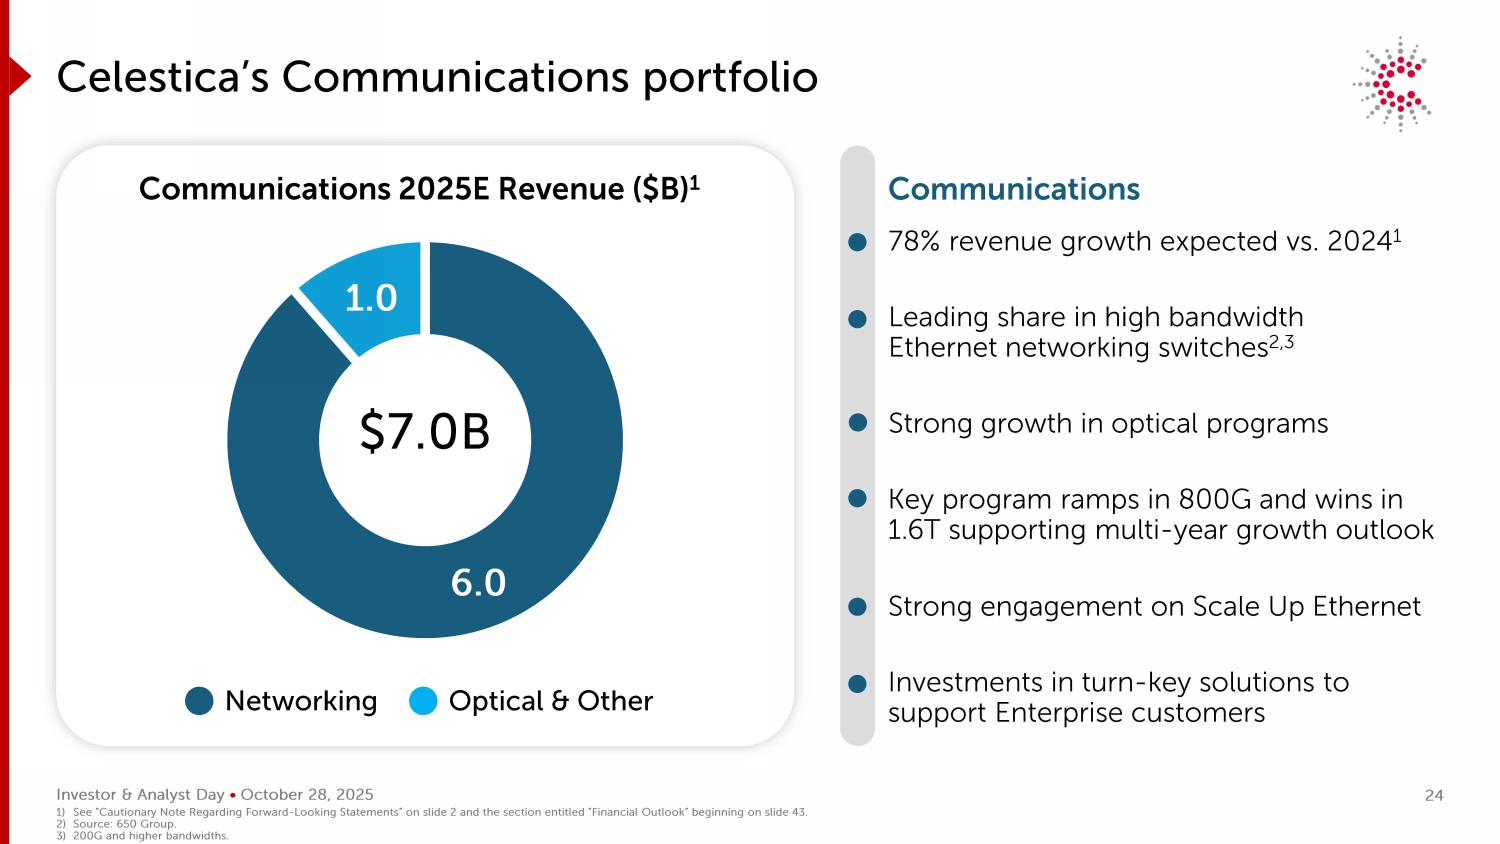
Investor & Analyst Day • October 28, 2025 6.0 1.0 Celestica’s Communications portfolio Communications 2025E Revenue ($B) 1 Networking Optical & Other $7 .0 B Leading share in high bandwidth Ethernet networking switches 2,3 Key program ramps in 800G and wins in 1.6T supporting multi - year growth outlook Strong engagement on Scale Up Ethernet Strong growth in optical programs Investments in turn - key solutions to support Enterprise customers 78% revenue growth expected vs. 2024 1 Communications 1) See “Cautionary Note Regarding Forward - Looking Statements” on slide 2 and the section entitled “Financial Outlook” beginning on slide 43. 2) Source: 650 Group. 3) 200G and higher bandwidths. 24
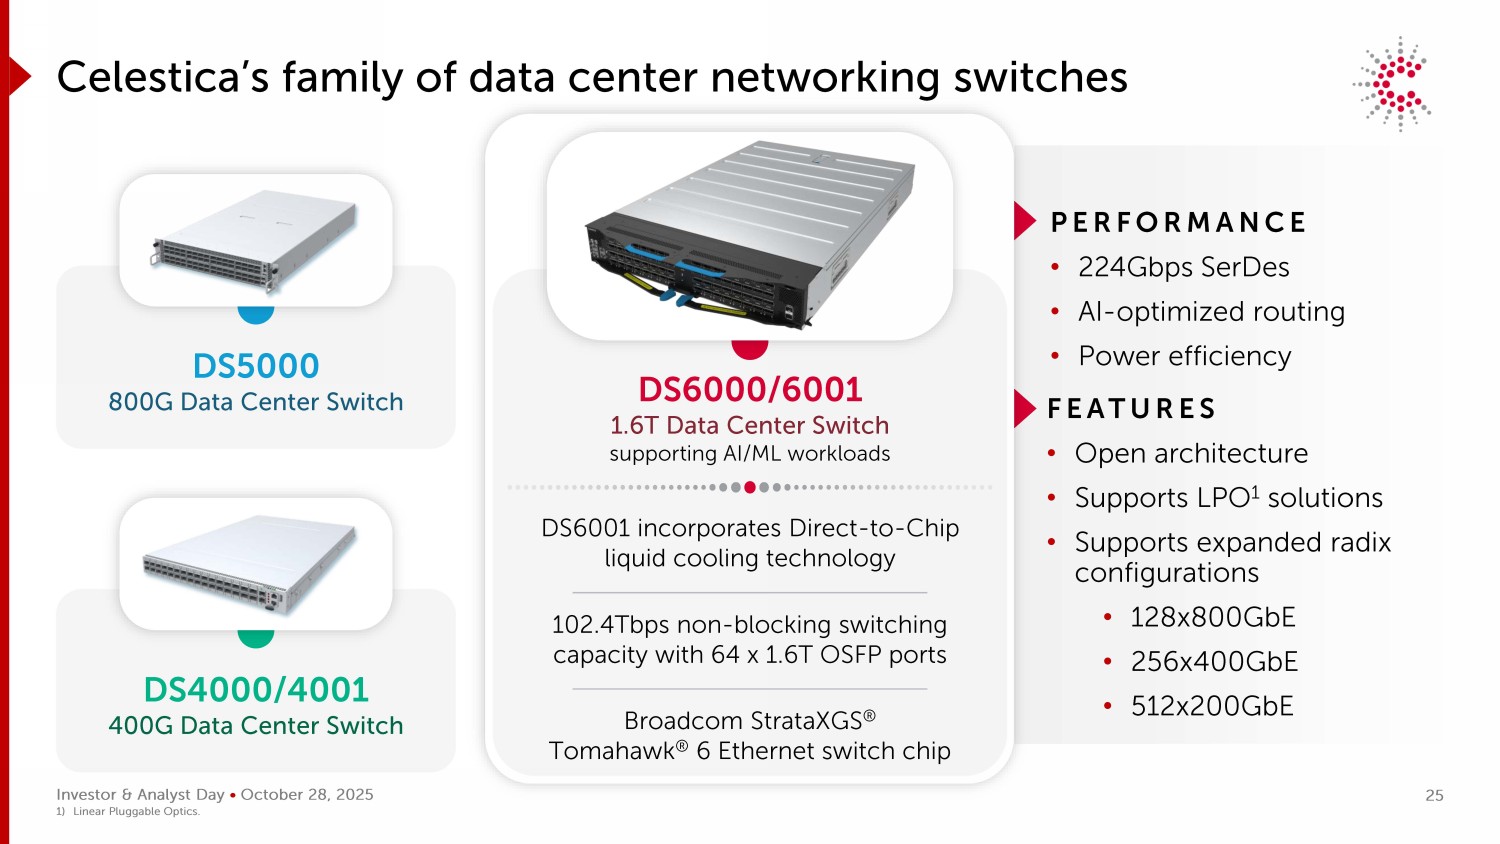
Investor & Analyst Day • October 28, 2025 FEATURES • Open architecture • Supports LPO 1 solutions • Supports expanded radix configurations • 128x800GbE • 256x400GbE • 512x200GbE PERFORMANCE • 224Gbps SerDes • AI - optimized routing • Power efficiency DS6000/6001 1.6T Data Center Switch supporting AI/ML workloads Celestica’s family of data center networking switches DS5000 800G Data Center Switch DS4000/4001 4 00G Data Center Switch DS6001 incorporates Direct - to - Chip liquid cooling technology 102.4Tbps non - blocking switching capacity with 64 x 1.6T OSFP ports Broadcom StrataXGS ® Tomahawk ® 6 Ethernet switch chip 1) Linear Pluggable Optics. 25
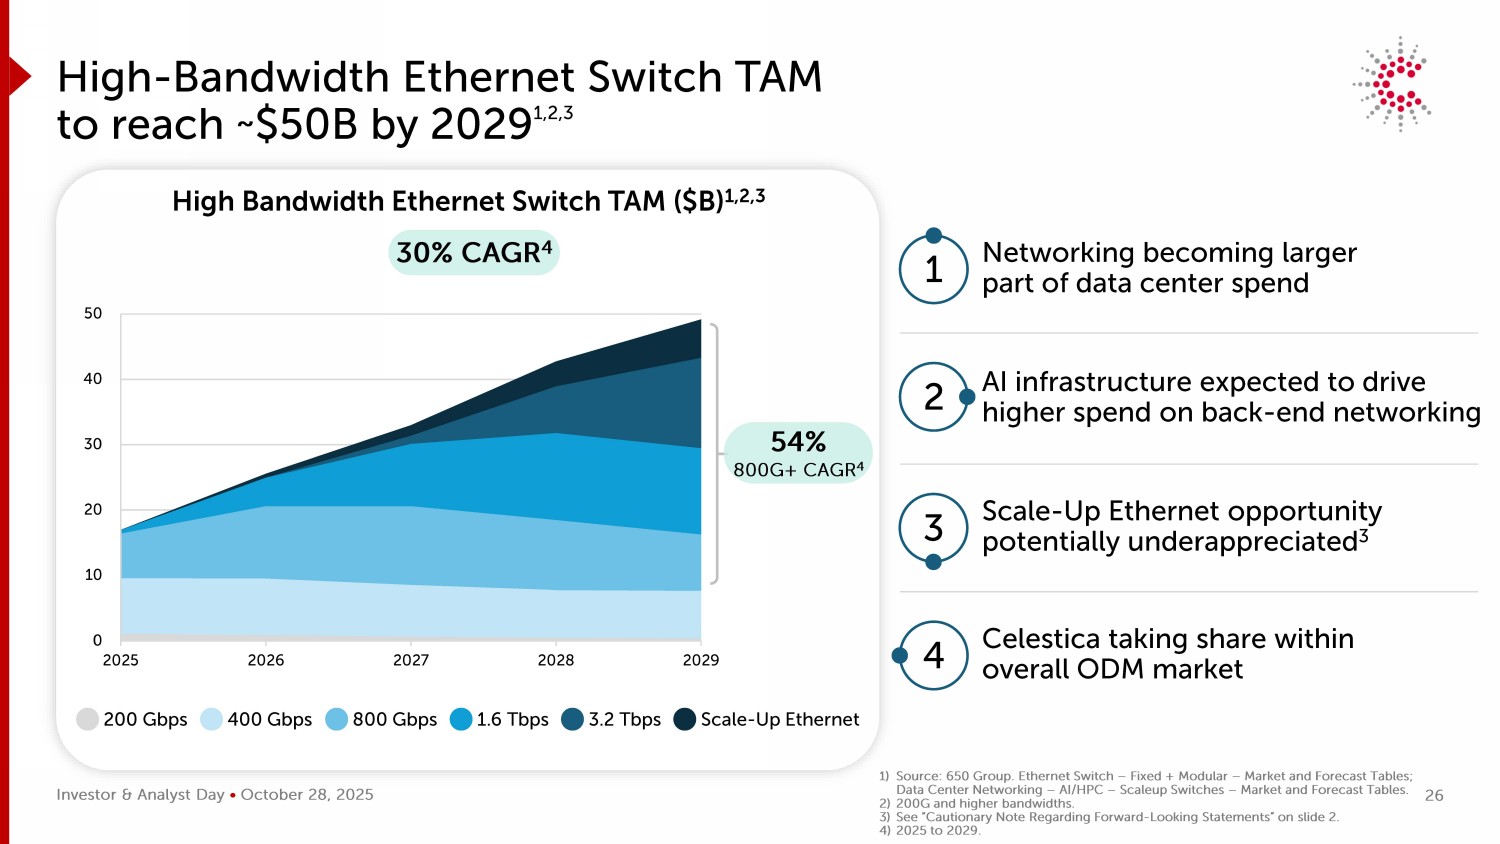
Investor & Analyst Day • October 28, 2025 0 10 20 30 40 50 2025 2026 2027 2028 2029 High - Bandwidth Ethernet Switch TAM to reach ~ $50B by 2029 1,2,3 High Bandwidth Ethernet Switch TAM ($B) 1,2,3 1 Networking becoming larger part of data center spend 2 AI infrastructure expected to drive higher spend on back - end networking 3 Scale - Up Ethernet opportunity potentially underappreciated 3 4 Celestica taking share within overall ODM market 30% CAGR 4 54 % 800G+ CAGR 4 400 Gbps 800 Gbps 1.6 Tbps 3.2 Tbps Scale - Up Ethernet 200 Gbps 1) Source: 650 Group. Ethernet Switch – Fixed + Modular – Market and Forecast Tables; Data Center Networking – AI/HPC – Scaleup Switches – Market and Forecast Tables. 2) 200G and higher bandwidths. 3) See “Cautionary Note Regarding Forward - Looking Statements” on slide 2. 4) 2025 to 2029. 26
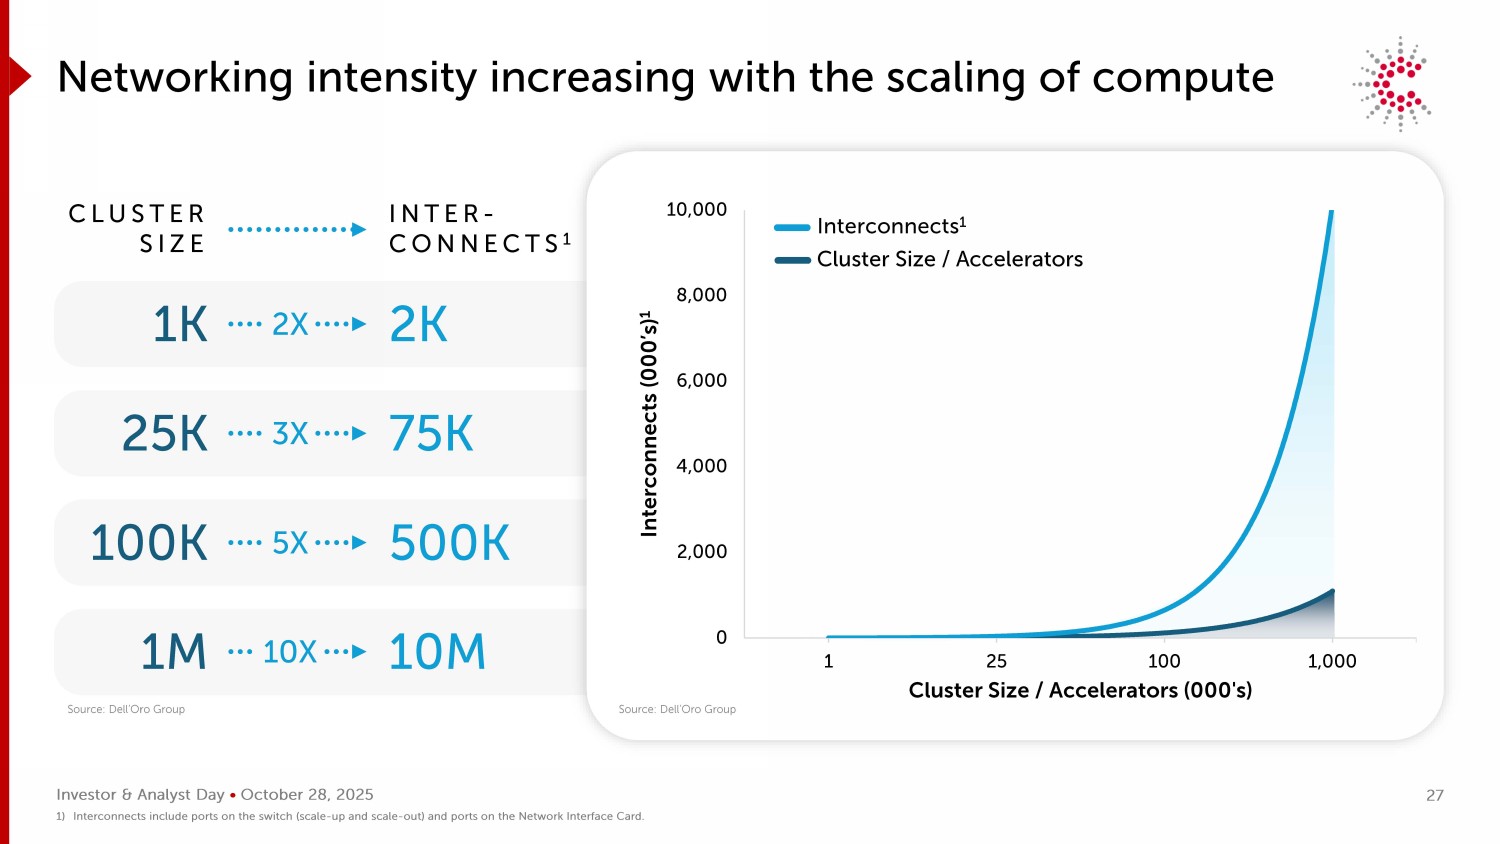
Investor & Analyst Day • October 28, 2025 Networking intensity increasing with the scaling of compute CLUSTER SIZE INTER - CONNECTS 1 1K 2K 25K 75K 100K 500K 2X 3X 5X 10X 1M 10M 0 2,000 4,000 6,000 8,000 10,000 1 25 100 1,000 Interconnects (000’s) 1 Cluster Size / Accelerators (000's) Interconnects 1 Cluster Size / Accelerators 1) Interconnects include ports on the switch (scale - up and scale - out) and ports on the Network Interface Card. Source: Dell’Oro Group Source: Dell’Oro Group 27
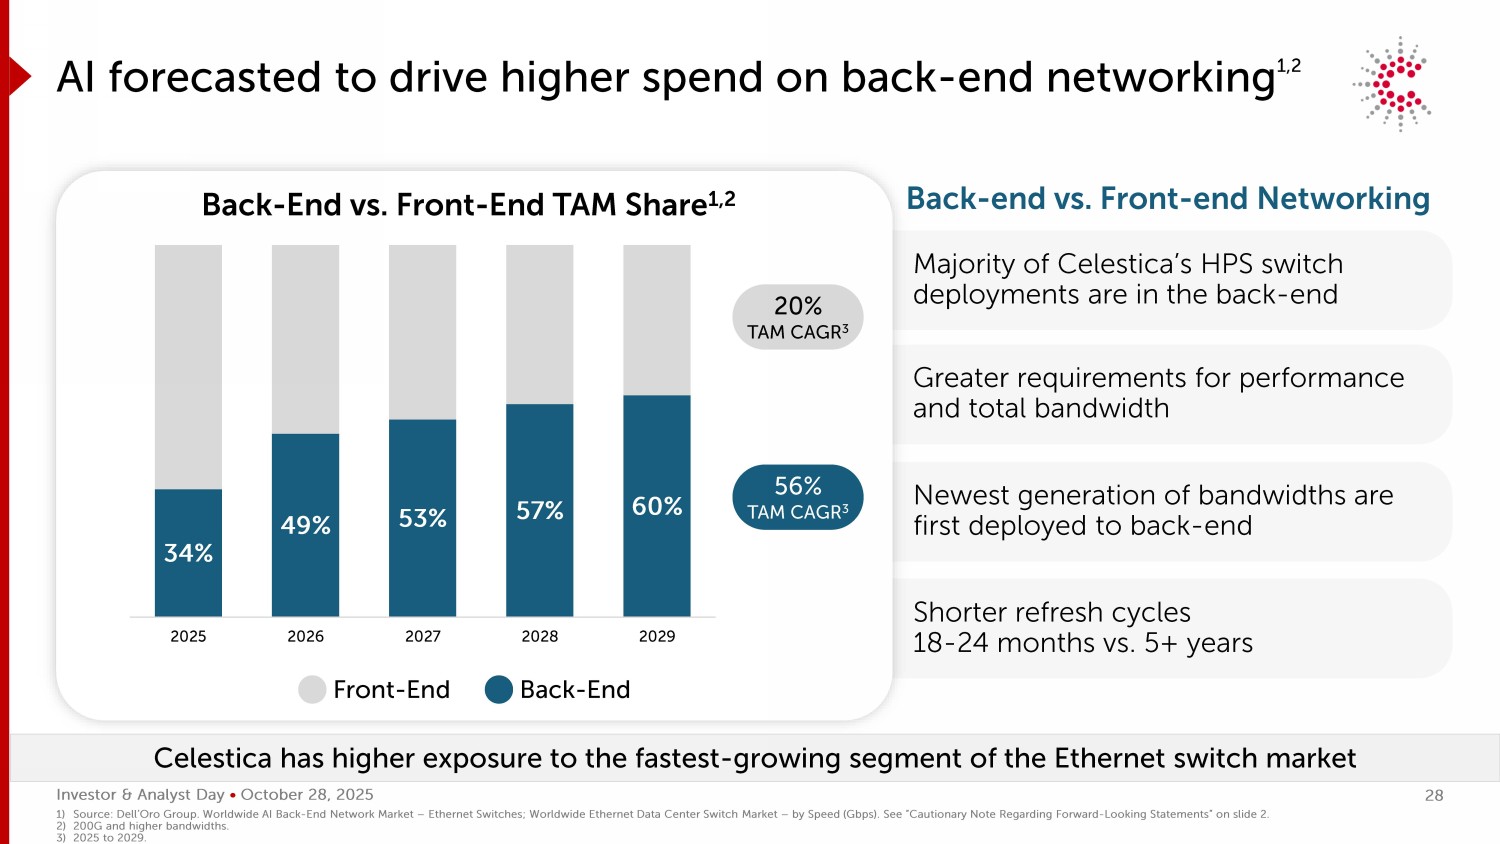
Investor & Analyst Day • October 28, 2025 34% 49% 53% 57% 60% 2025 2026 2027 2028 2029 Back - End vs. Front - End TAM Share 1,2 AI forecasted to drive higher spend on back - end networking 1,2 Front - End Back - End Greater requirements for performance and total bandwidth Majority of Celestica’s HPS switch deployments are in the back - end Newest generation of bandwidths are first deployed to back - end 56% TAM CAGR 3 20% TAM CAGR 3 Celestica has higher exposure to the fastest - growing segment of the Ethernet switch market Shorter refresh cycles 18 - 24 months vs. 5+ years Back - end vs. Front - end Networking 1) Source: Dell’Oro Group. Worldwide AI Back - End Network Market – Ethernet Switches; Worldwide Ethernet Data Center Switch Market – by Speed (Gbps) . See “Cautionary Note Regarding Forward - Looking Statements” on slide 2. 2) 200G and higher bandwidths. 3) 2025 to 2029. 28
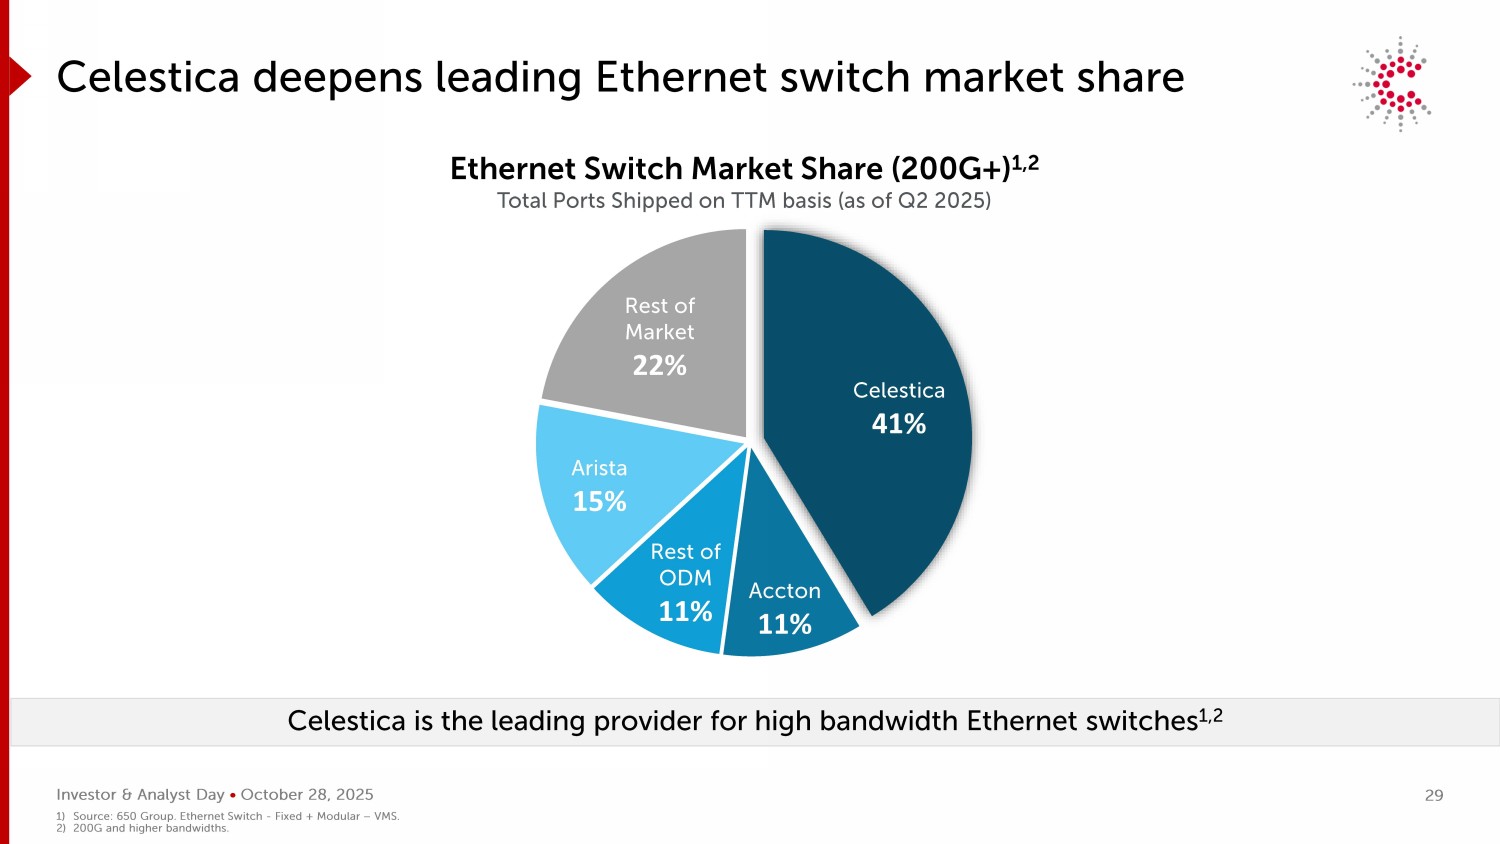
Investor & Analyst Day • October 28, 2025 Celestica deepens leading Ethernet switch market share Celestica is the leading provider for high bandwidth Ethernet switches 1,2 Celestica 41% Accton 11% Rest of ODM 11% Arista 15% Rest of Market 22% Ethernet Switch Market Share (200G+) 1,2 Total Ports Shipped on TTM basis (as of Q2 2025) 1) Source: 650 Group. Ethernet Switch - Fixed + Modular – VMS. 2) 200G and higher bandwidths. 29
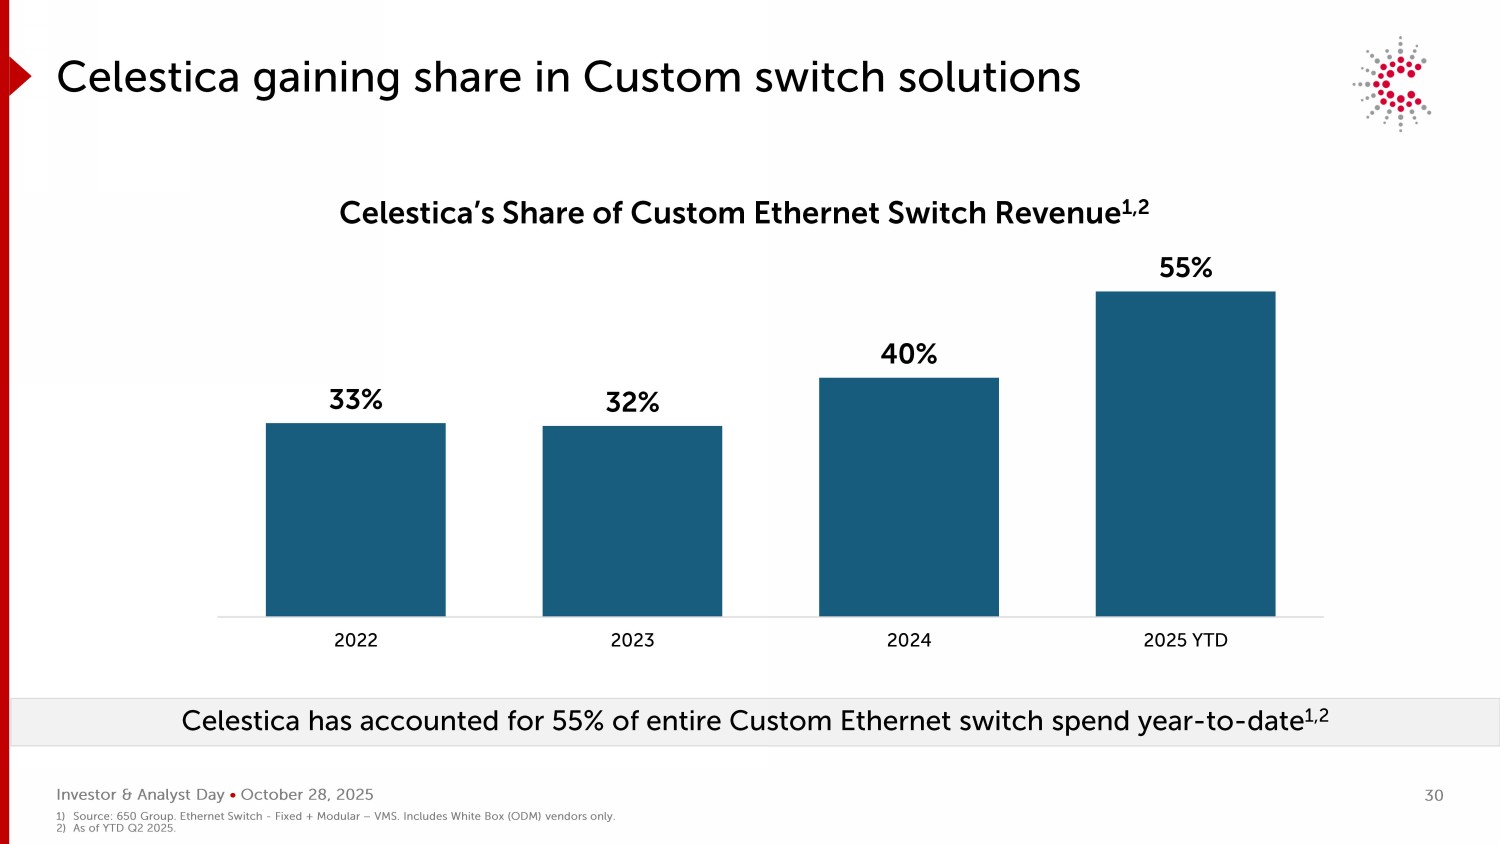
Investor & Analyst Day • October 28, 2025 Celestica gaining share in Custom switch solutions Celestica has accounted for 55% of entire Custom Ethernet switch spend year - to - date 1,2 Celestica’s Share of Custom Ethernet Switch Revenue 1,2 33% 32% 40% 55% 2022 2023 2024 2025 YTD 1) Source: 650 Group. Ethernet Switch - Fixed + Modular – VMS. Includes White Box (ODM) vendors only. 2) As of YTD Q2 2025. 30
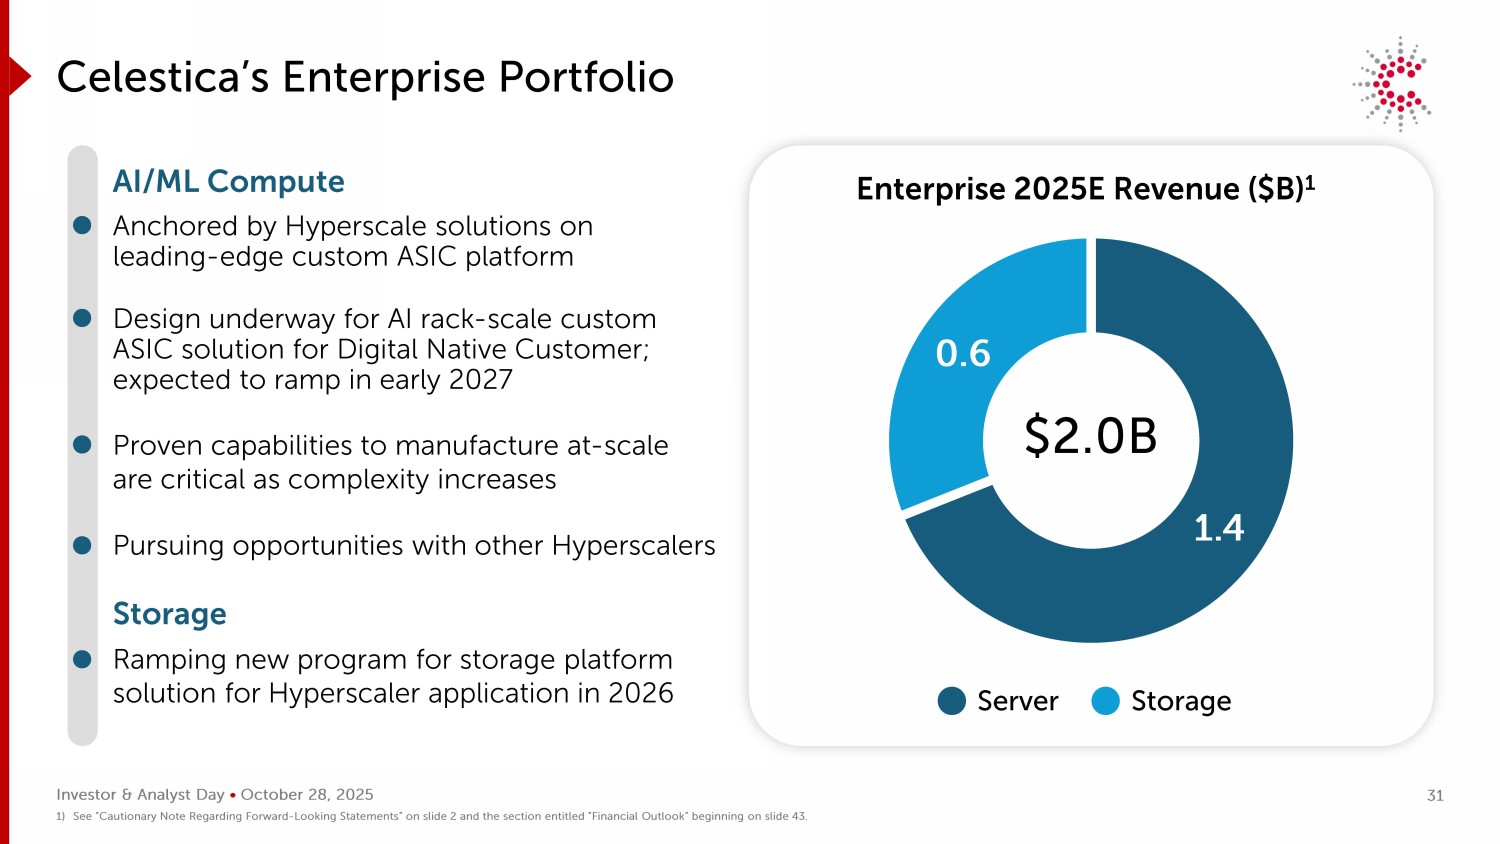
Investor & Analyst Day • October 28, 2025 1.4 0.6 Celestica’s Enterprise Portfolio Anchored by Hyperscale solutions on leading - edge custom ASIC platform Design underway for AI rack - scale custom ASIC solution for Digital Native Customer; expected to ramp in early 2027 Pursuing opportunities with other Hyperscalers Proven capabilities to manufacture at - scale are critical as complexity increases $2.0B Enterprise 2025E Revenue ($B) 1 Server Storage Ramping new program for storage platform solution for Hyperscaler application in 2026 AI/ML Compute Storage 1) See “Cautionary Note Regarding Forward - Looking Statements” on slide 2 and the section entitled “Financial Outlook” beginning on slide 43. 31
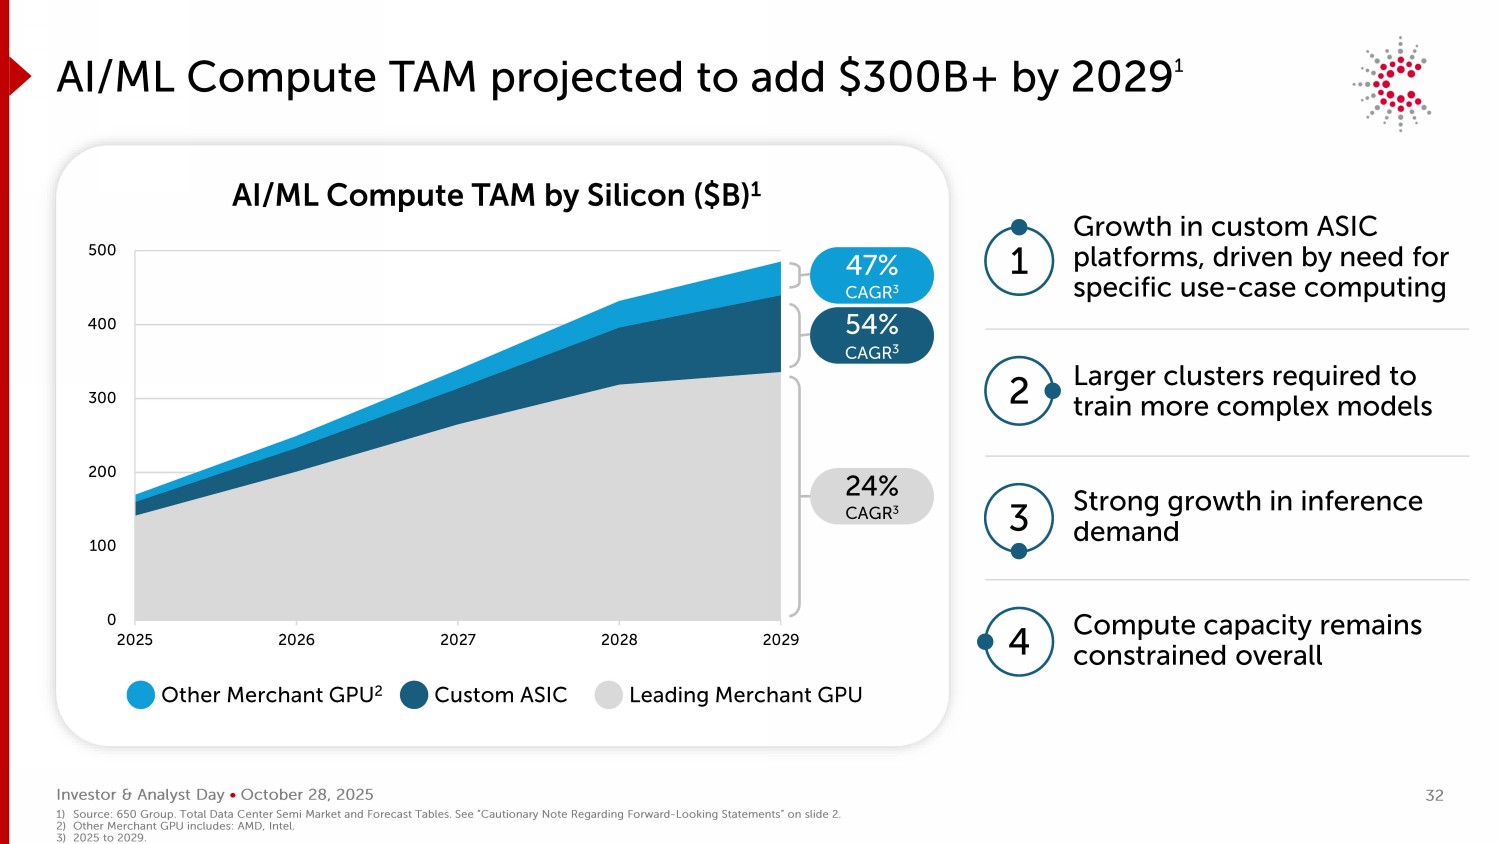
Investor & Analyst Day • October 28, 2025 0 100 200 300 400 500 2025 2026 2027 2028 2029 AI/ML Compute TAM projected to add $300B+ by 2029 1 AI/ML Compute TAM by Silicon ($B) 1 1 Growth in custom ASIC platforms, driven by need for specific use - case computing 2 Larger clusters required to train more complex models 3 Strong growth in inference demand 4 Compute capacity remains constrained overall Other Merchant GPU 2 Custom ASIC Leading Merchant GPU 54% CAGR 3 24% CAGR 3 1) Source: 650 Group. Total Data Center Semi Market and Forecast Tables. See “Cautionary Note Regarding Forward - Looking Statements” on slide 2. 2) Other Merchant GPU includes: AMD, Intel. 3) 2025 to 2029. 47% CAGR 3 32
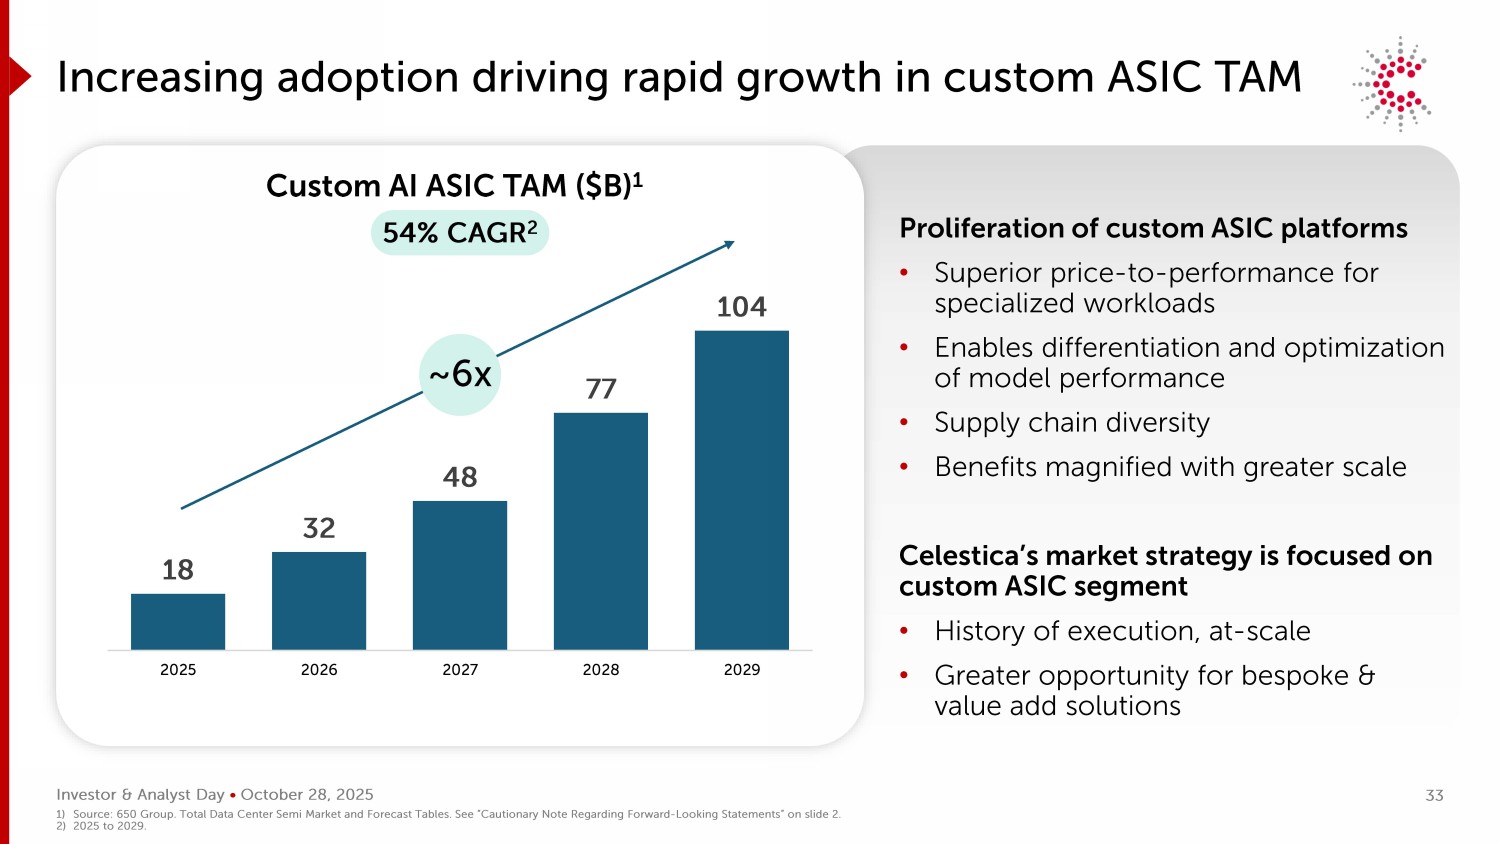
Investor & Analyst Day • October 28, 2025 Increasing adoption driving rapid growth in custom ASIC TAM Proliferation of custom ASIC platforms • Superior price - to - performance for specialized workloads • Enables differentiation and optimization of model performance • Supply chain diversity • Benefits magnified with greater scale Celestica’s market strategy is focused on custom ASIC segment • History of execution, at - scale • Greater opportunity for bespoke & value add solutions Custom AI ASIC TAM ($B) 1 18 32 48 77 104 2025 2026 2027 2028 2029 54% CAGR 2 ~6x 1) Source: 650 Group. Total Data Center Semi Market and Forecast Tables. See “Cautionary Note Regarding Forward - Looking Statements” on slide 2. 2) 2025 to 2029. 33
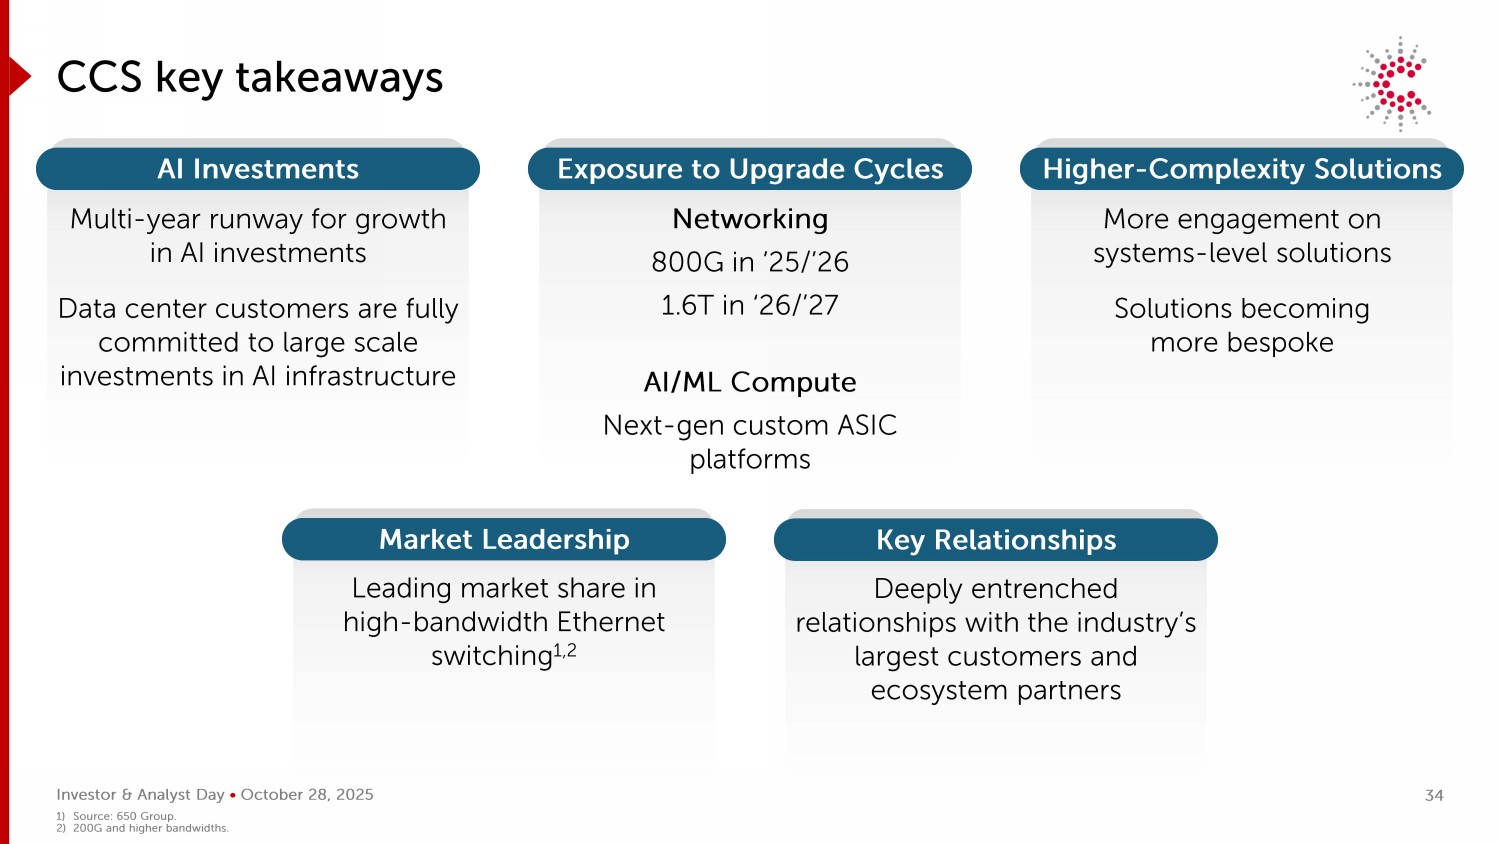
Investor & Analyst Day • October 28, 2025 Leading market share in high - bandwidth Ethernet switching 1,2 Market Leadership Deeply entrenched relationships with the industry’s largest customers and ecosystem partners Key Relationships Multi - year runway for growth in AI investments Data center customers are fully committed to large scale investments in AI infrastructure CCS key takeaways AI Investments Networking 800G in ’25/’26 1.6T in ‘26/’27 AI/ML Compute Next - gen custom ASIC platforms Exposure to Upgrade Cycles More engagement on systems - level solutions Solutions becoming more bespoke Higher - Complexity Solutions 1) Source: 650 Group. 2) 200G and higher bandwidths. 34
2025 INVESTOR & ANALYST DAY Advanced Technology Solutions Todd Cooper President, ATS
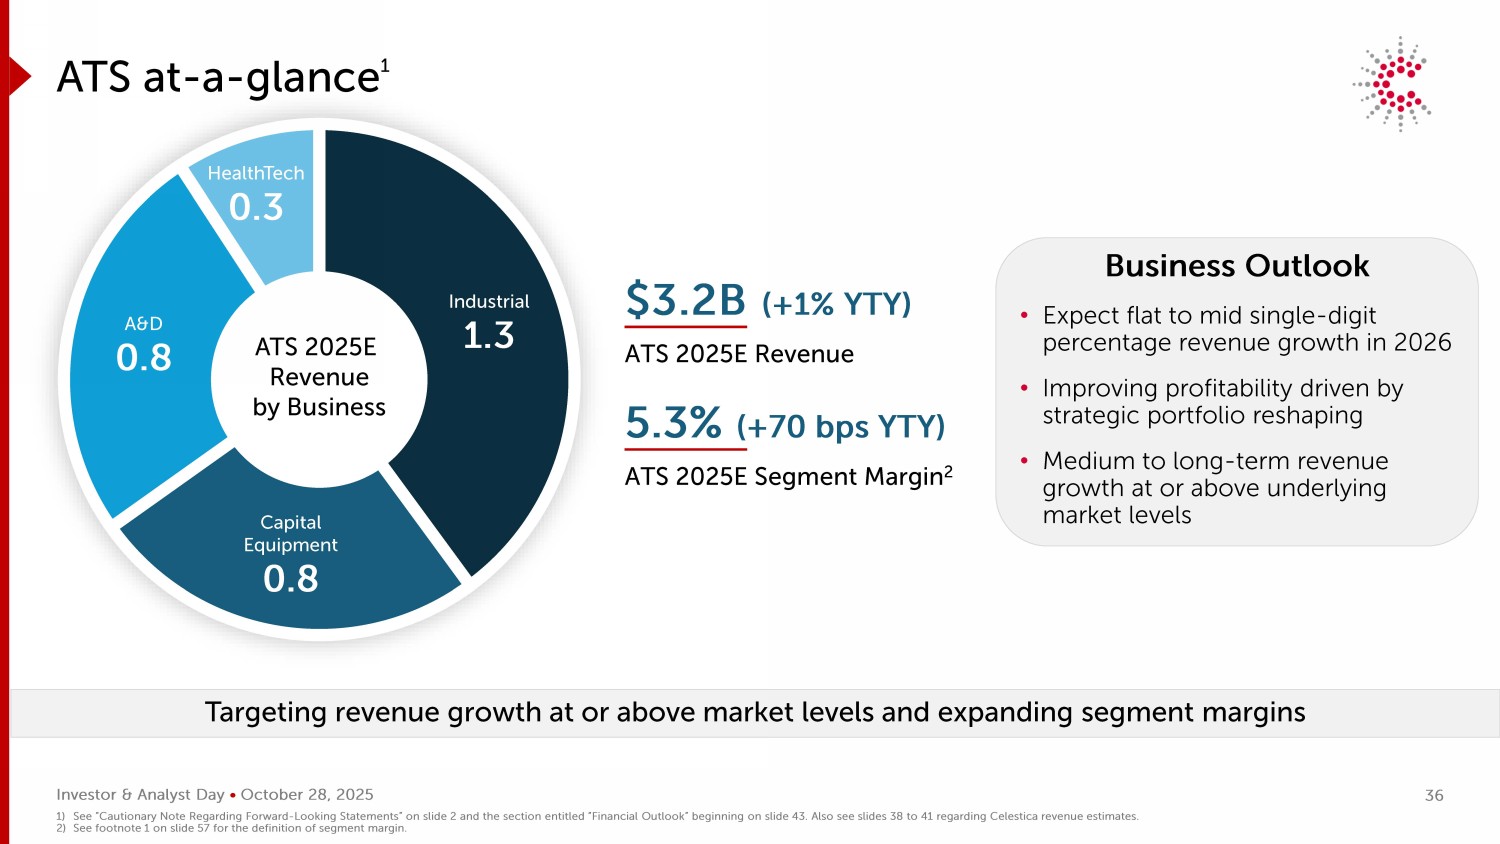
Investor & Analyst Day • October 28, 2025 ATS at - a - glance 1 Targeting revenue growth at or above market levels and expanding segment margins Industrial 1.3 Capital Equipment 0.8 A&D 0.8 HealthTech 0.3 ATS 2025E Revenue by Business $3.2B (+1% YTY) ATS 2025E Revenue 5.3% (+70 bps YTY) ATS 2025E Segment Margin 2 Business Outlook • Expect flat to mid single - digit percentage revenue growth in 2026 • Improving profitability driven by strategic portfolio reshaping • Medium to long - term revenue growth at or above underlying market levels 1) See “Cautionary Note Regarding Forward - Looking Statements” on slide 2 and the section entitled “Financial Outlook” beginning on slide 43. Also see slides 38 to 41 regarding Celestica revenue estimates. 2) See footnote 1 on slide 57 for the definition of segment margin. 36
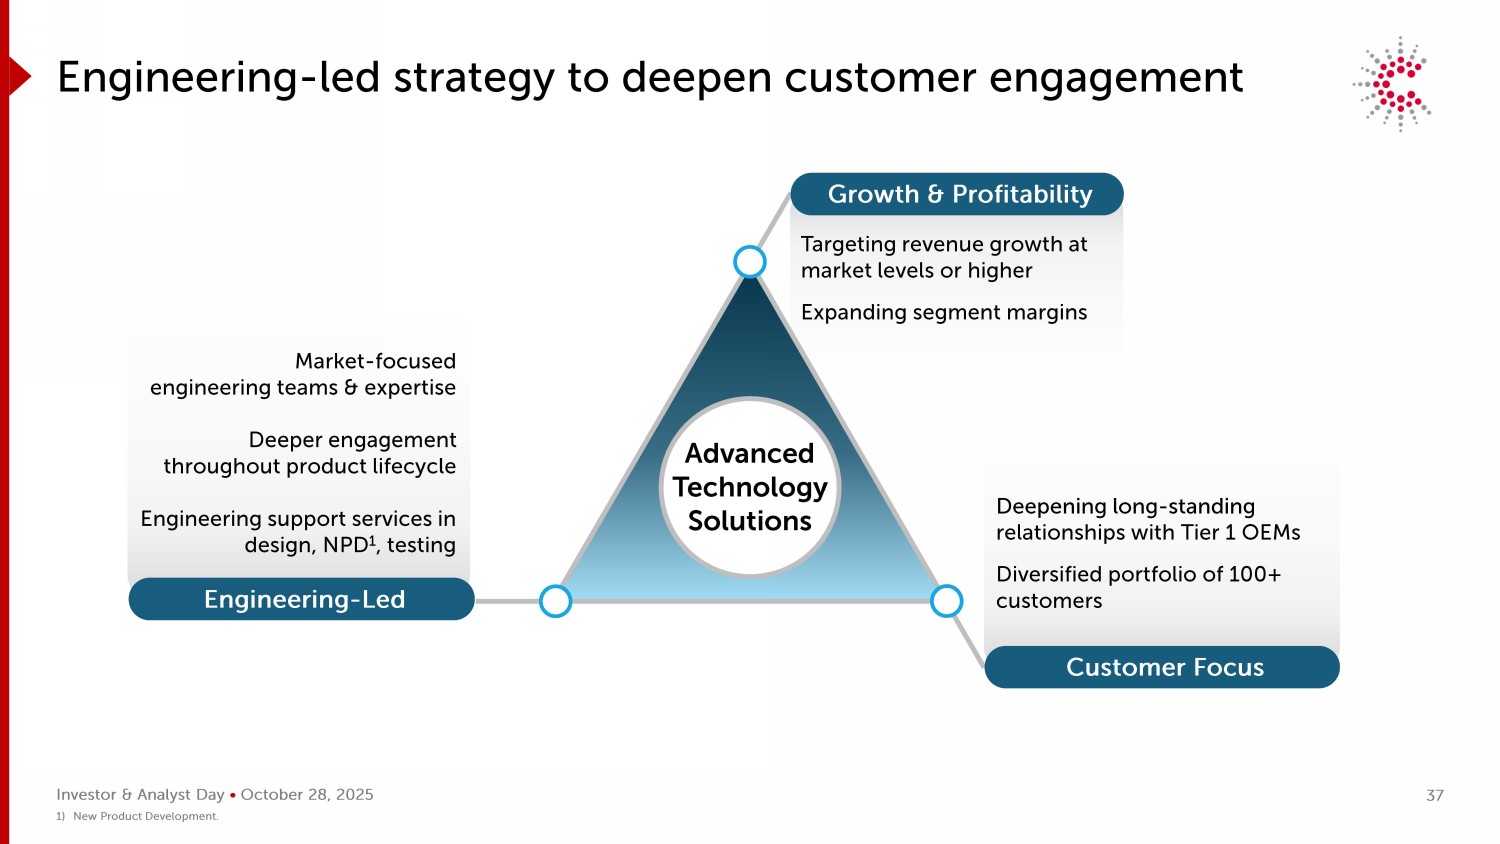
Investor & Analyst Day • October 28, 2025 Targeting revenue growth at market levels or higher Expanding segment margins Deepening long - standing relationships with Tier 1 OEMs Diversified portfolio of 100+ customers Market - focused engineering teams & expertise Deeper engagement throughout product lifecycle Engineering support services in design, NPD 1 , testing Engineering - led strategy to deepen customer engagement Customer Focus Engineering - Led Growth & Profitability Advanced Technology Solutions 1) New Product Development. 37
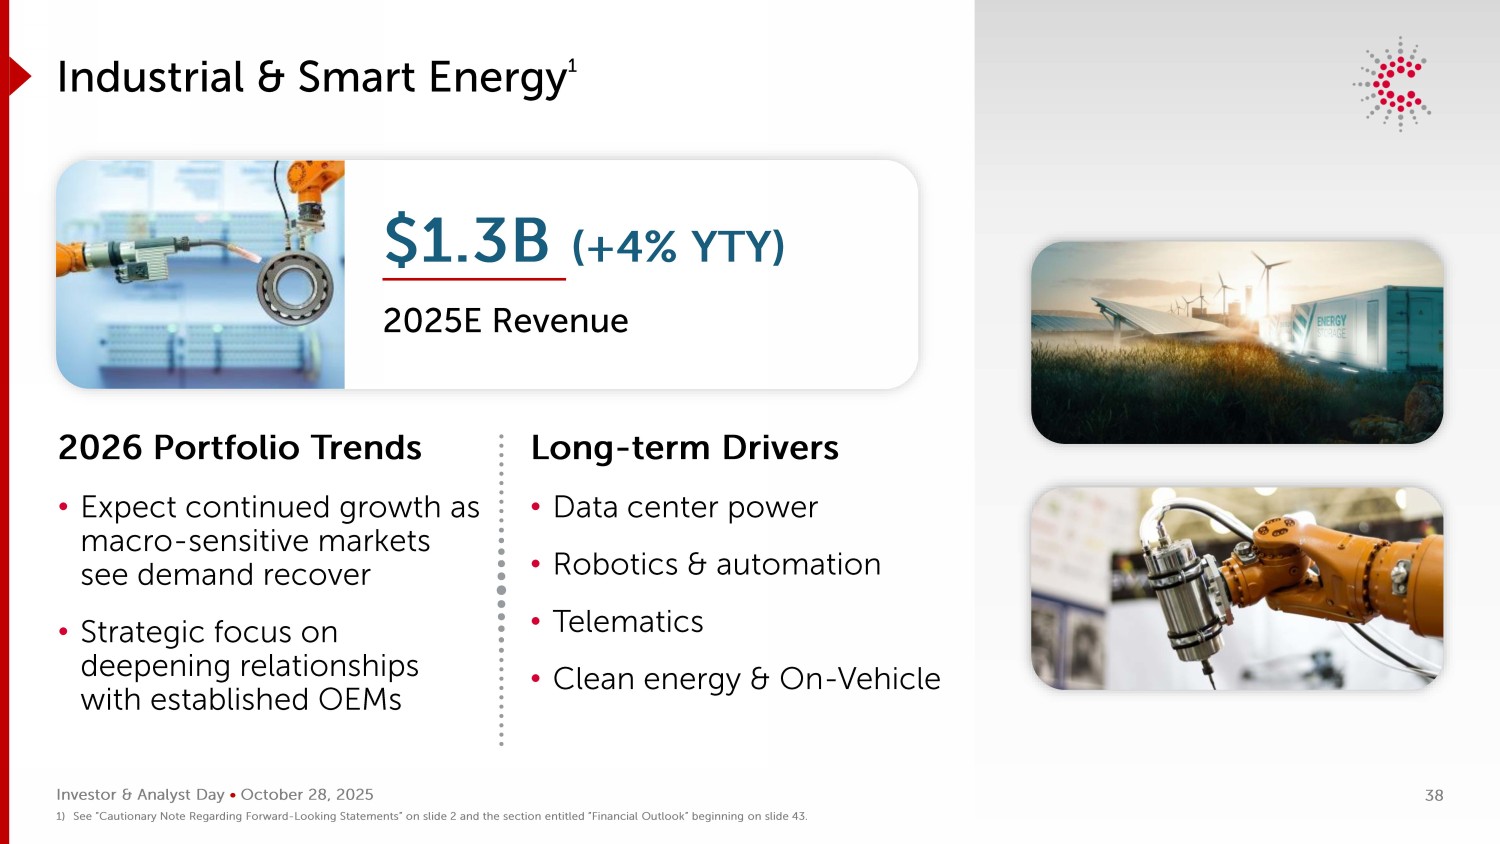
Investor & Analyst Day • October 28, 2025 Industrial & Smart Energy 1 2026 Portfolio Trends • Expect continued growth as macro - sensitive markets see demand recover • Strategic focus on deepening relationships with established OEMs Long - term Drivers • Data center power • Robotics & automation • Telematics • Clean energy & On - Vehicle $1.3B (+ 4 % YTY) 2025E Revenue 1) See “Cautionary Note Regarding Forward - Looking Statements” on slide 2 and the section entitled “Financial Outlook” beginning on slide 43. 38
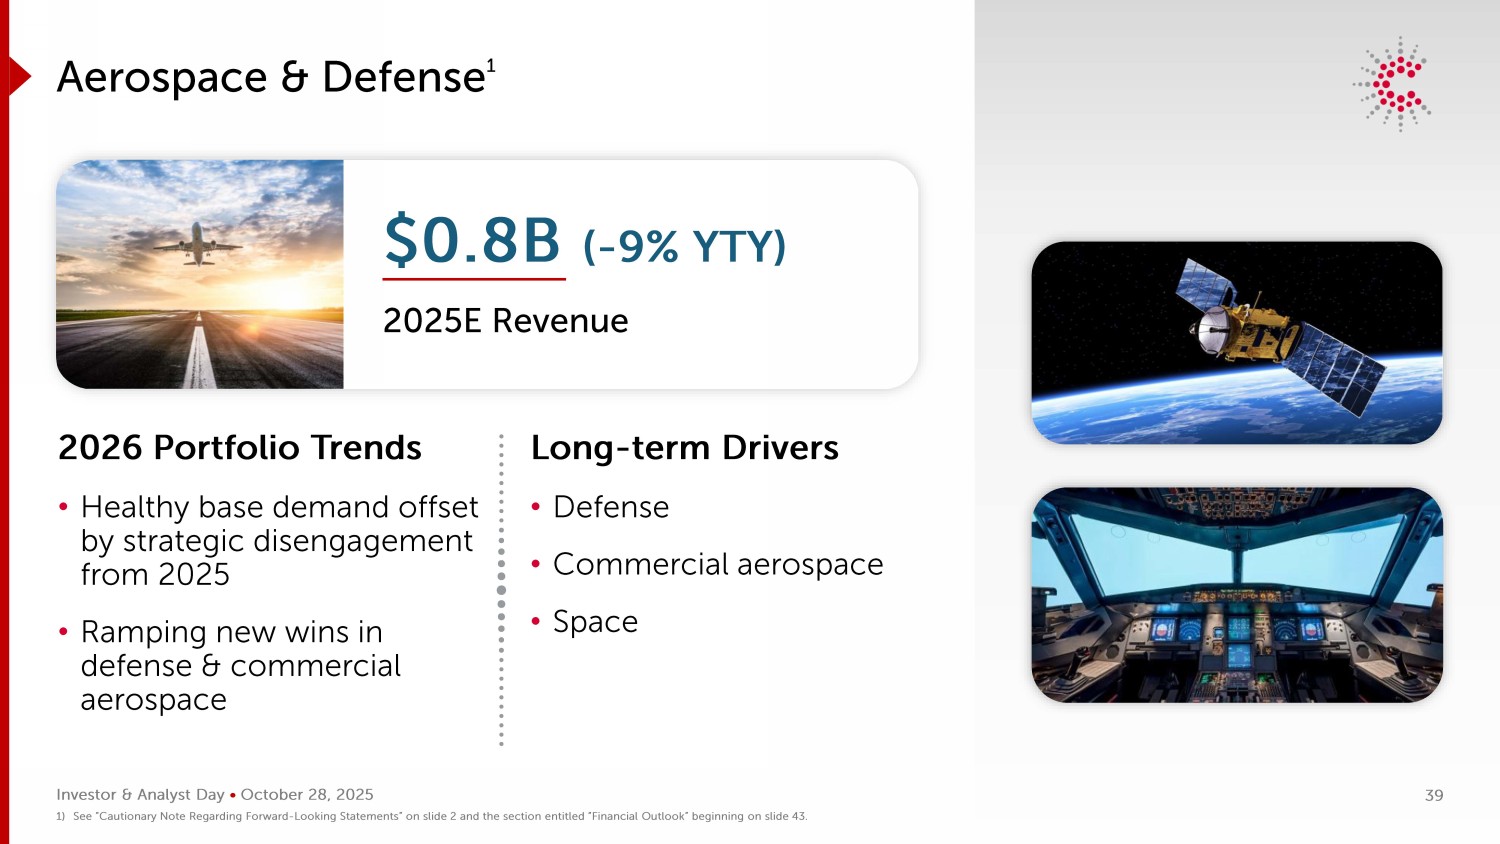
Investor & Analyst Day • October 28, 2025 Aerospace & Defense 1 2026 Portfolio Trends • Healthy base demand offset by strategic disengagement from 2025 • Ramping new wins in defense & commercial aerospace Long - term Drivers • Defense • Commercial aerospace • Space $0.8B ( - 9% YTY) 2025E Revenue 1) See “Cautionary Note Regarding Forward - Looking Statements” on slide 2 and the section entitled “Financial Outlook” beginning on slide 43. 39
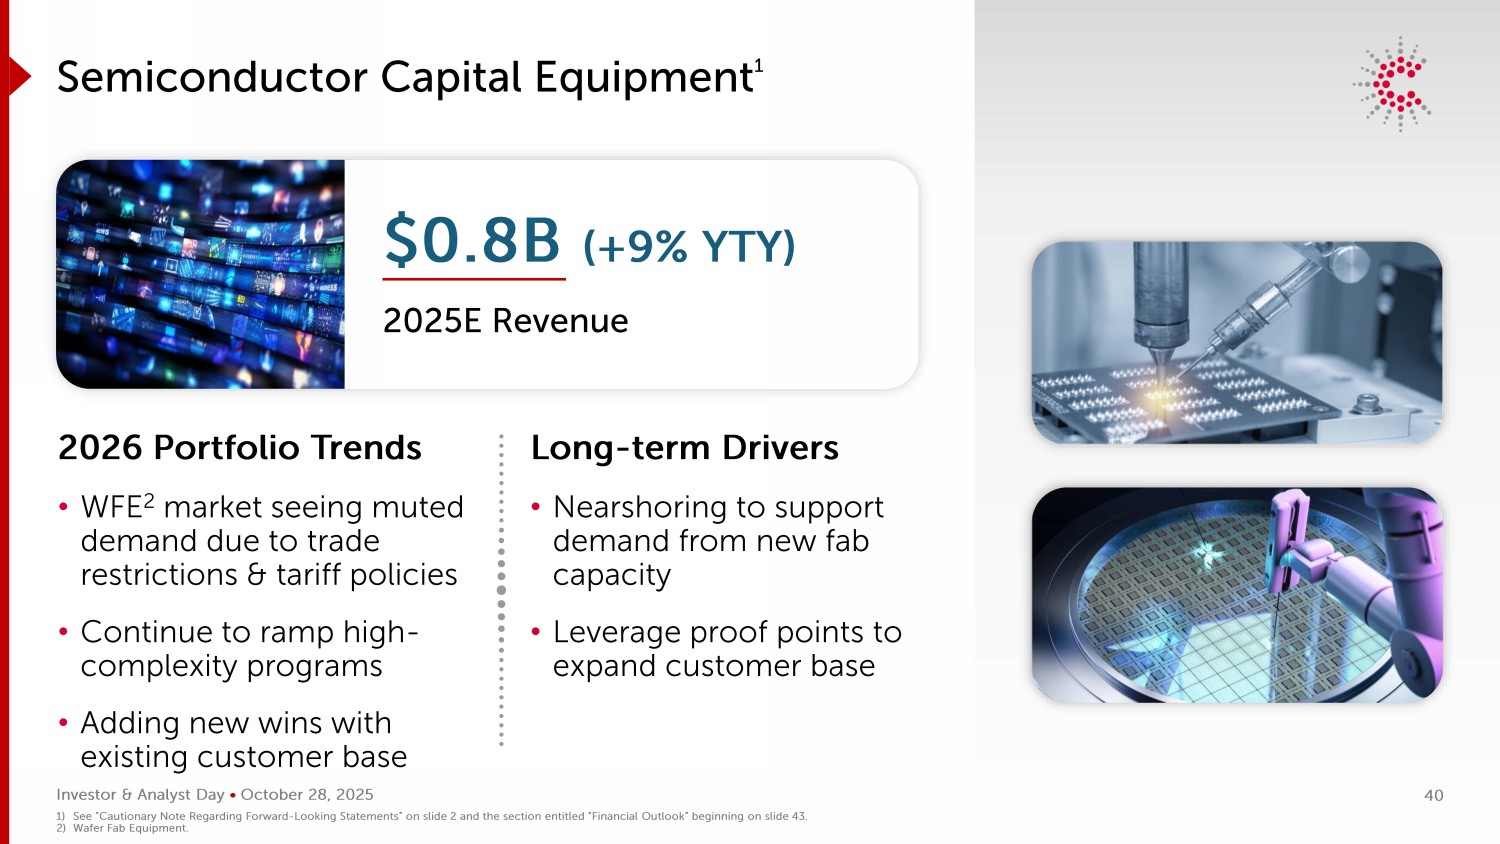
Investor & Analyst Day • October 28, 2025 Semiconductor Capital Equipment 1 2026 Portfolio Trends • WFE 2 market seeing muted demand due to trade restrictions & tariff policies • Continue to ramp high - complexity programs • Adding new wins with existing customer base Long - term Drivers • Nearshoring to support demand from new fab capacity • Leverage proof points to expand customer base $0.8B (+9% YTY) 2025E Revenue 1) See “Cautionary Note Regarding Forward - Looking Statements” on slide 2 and the section entitled “Financial Outlook” beginning on slide 43. 2) Wafer Fab Equipment. 40
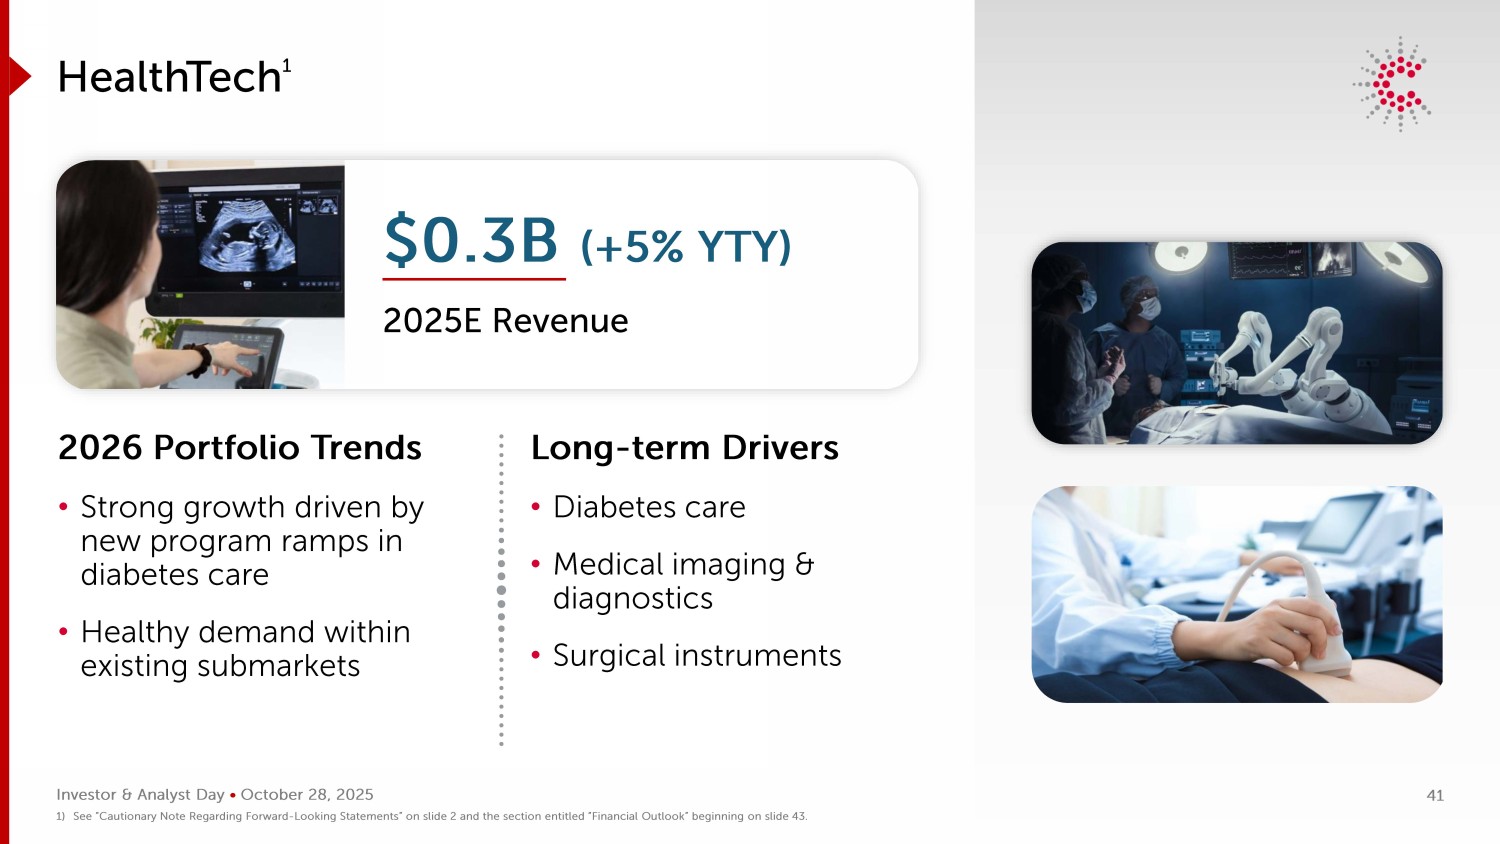
Investor & Analyst Day • October 28, 2025 HealthTech 1 2026 Portfolio Trends • Strong growth driven by new program ramps in diabetes care • Healthy demand within existing submarkets Long - term Drivers • Diabetes care • Medical imaging & diagnostics • Surgical instruments $0.3B (+5% YTY) 2025E Revenue 1) See “Cautionary Note Regarding Forward - Looking Statements” on slide 2 and the section entitled “Financial Outlook” beginning on slide 43. 41
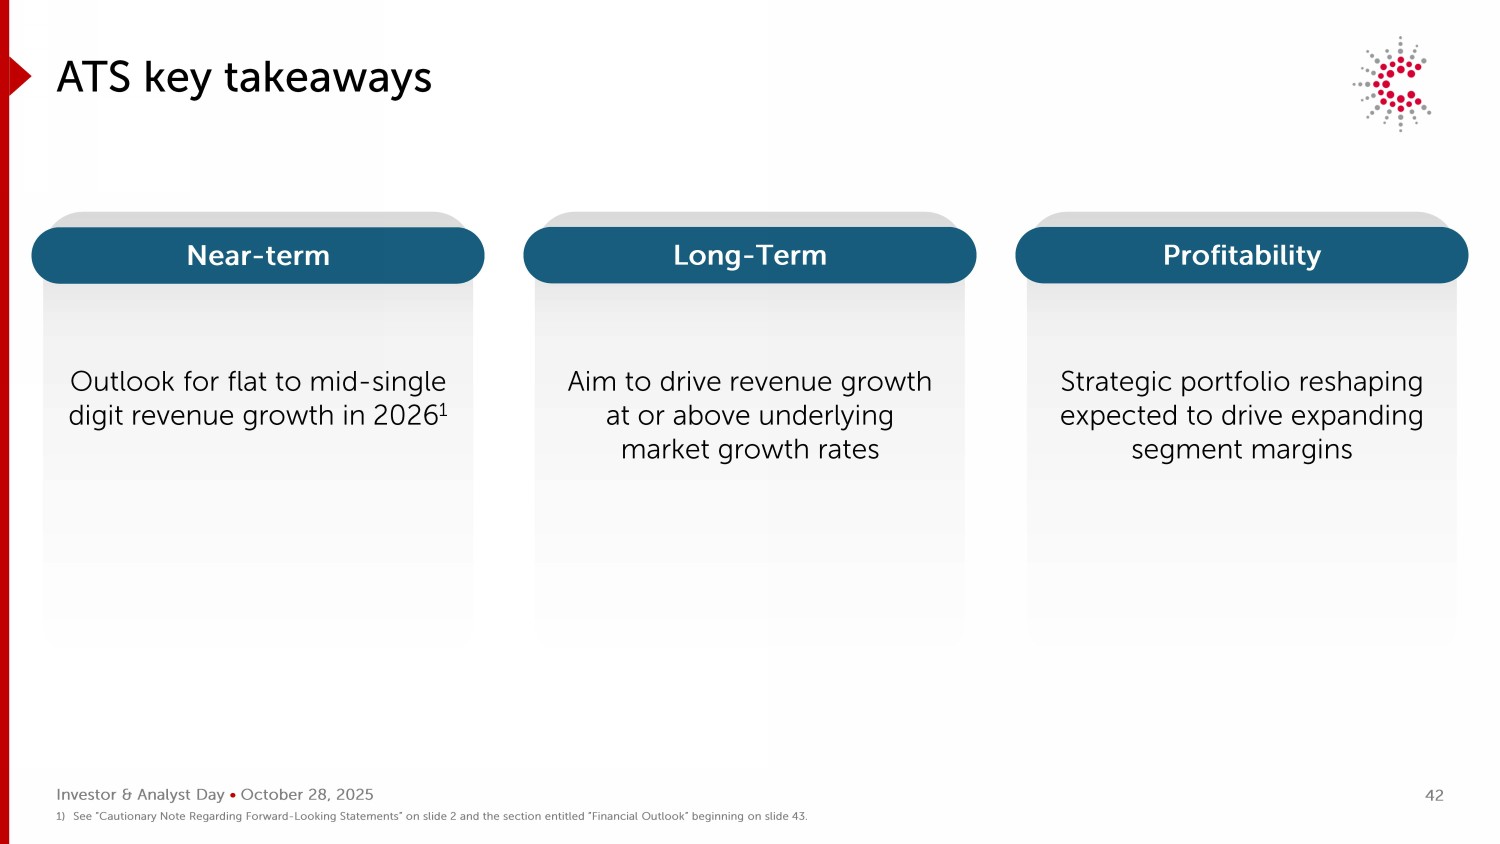
Investor & Analyst Day • October 28, 2025 Strategic portfolio reshaping expected to drive expanding segment margins Aim to drive revenue growth at or above underlying market growth rates Outlook for flat to mid - single digit revenue growth in 2026 1 ATS key takeaways Near - term Long - Term Profitability 1) See “Cautionary Note Regarding Forward - Looking Statements” on slide 2 and the section entitled “Financial Outlook” beginning on slide 43. 42

2025 INVESTOR & ANALYST DAY Financial Outlook Mandeep Chawla Chief Financial Officer
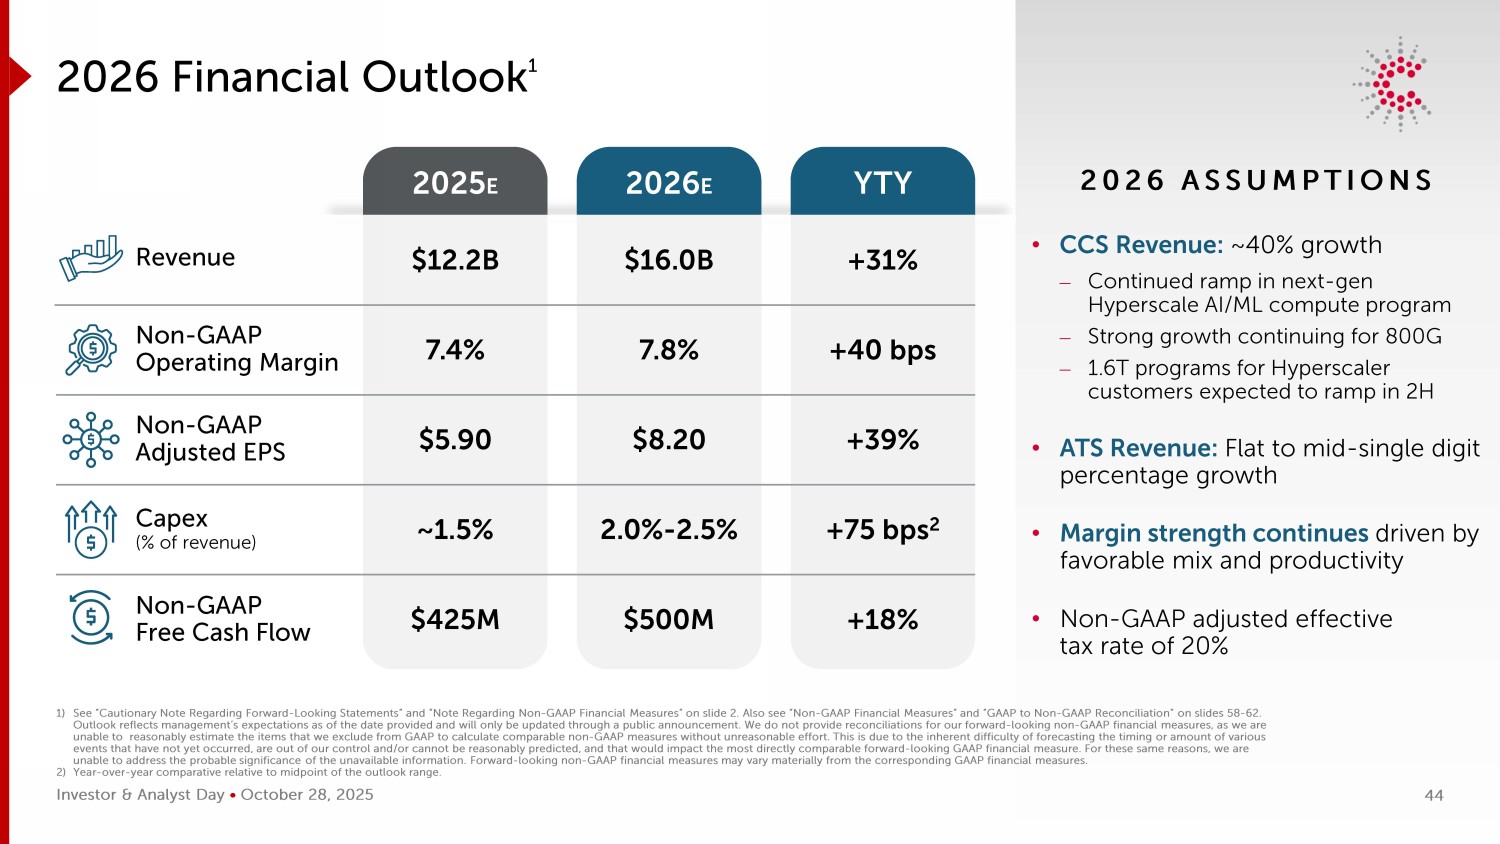
Investor & Analyst Day • October 28, 2025 2026 ASSUMPTIONS • CCS Revenue: ~40% growth ⎼ Continued ramp in next - gen Hyperscale AI/ML compute program ⎼ Strong growth continuing for 800G ⎼ 1.6T programs for Hyperscaler customers expected to ramp in 2H • ATS Revenue: Flat to mid - single digit percentage growth • Margin strength continues driven by favorable mix and productivity • Non - GAAP adjusted effective tax rate of 20% 2026 Financial Outlook 1 2025 E 2026 E YTY $12.2B 7.4% $5.90 ~1.5% $425M $16.0B 7.8% $8.20 2.0% - 2.5% $500M +31% +40 bps +39% +75 bps 2 +18% Revenue Non - GAAP Operating Margin Non - GAAP Adjusted EPS Capex (% of revenue) Non - GAAP Free Cash Flow 1) See “Cautionary Note Regarding Forward - Looking Statements” and “Note Regarding Non - GAAP Financial Measures” on slide 2. Also see “Non - GAAP Financial Measures” and “GAAP to Non - GAAP Reconciliation” on slides 58 - 62. Outlook reflects management’s expectations as of the date provided and will only be updated through a public announcement. We do not provide reconciliations for our forward - looking non - GAAP financial measures, as we are unable to reasonably estimate the items that we exclude from GAAP to calculate comparable non - GAAP measures without unreasonabl e effort. This is due to the inherent difficulty of forecasting the timing or amount of various events that have not yet occurred, are out of our control and/or cannot be reasonably predicted, and that would impact the mo st directly comparable forward - looking GAAP financial measure. For these same reasons, we are unable to address the probable significance of the unavailable information. Forward - looking non - GAAP financial measures may vary materially from the corresponding GAAP financial measures. 2) Year - over - year comparative relative to midpoint of the outlook range. 44
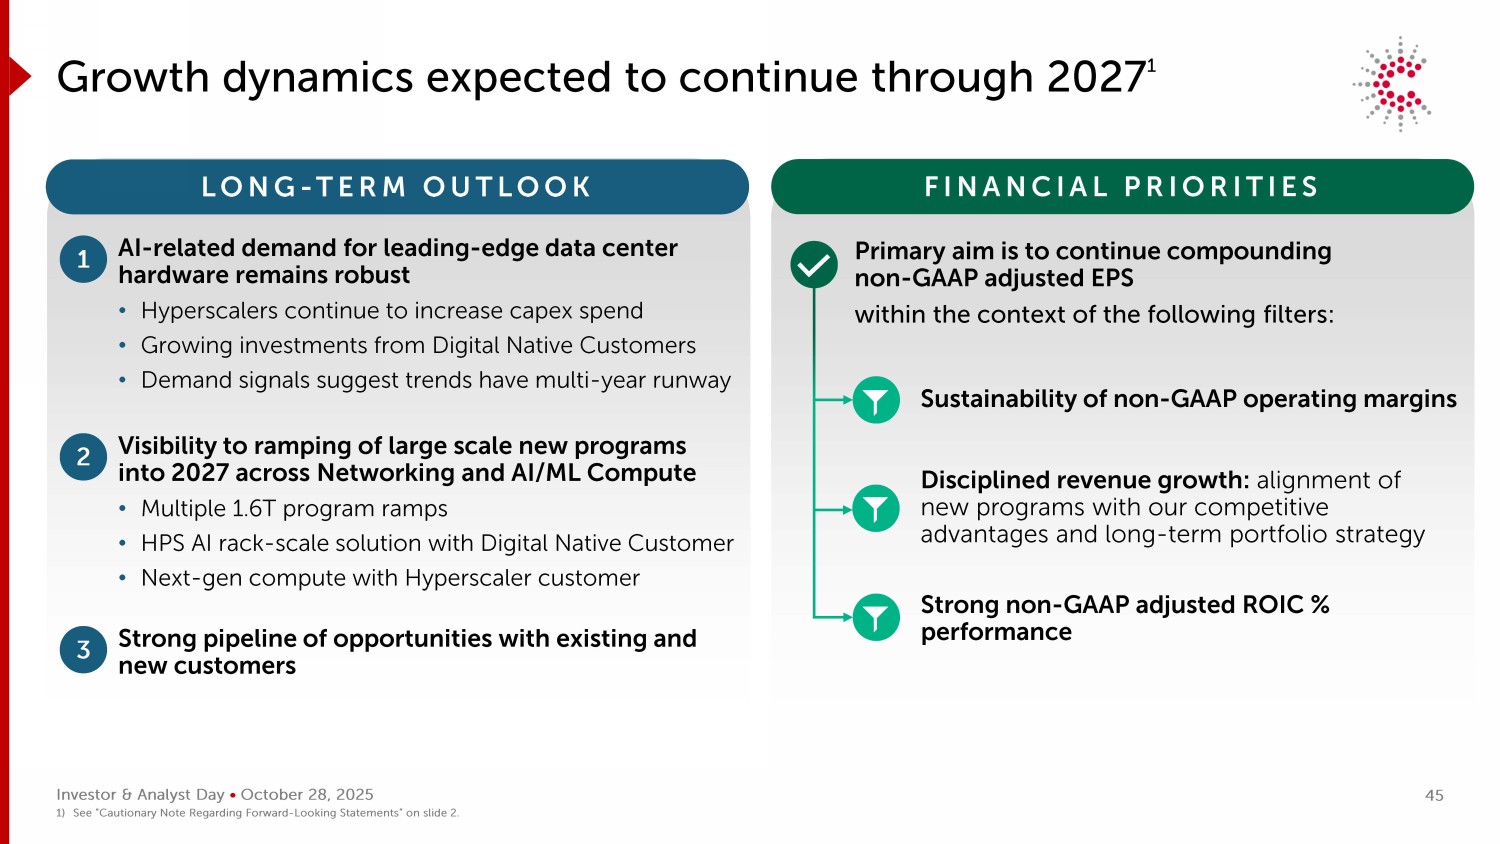
Investor & Analyst Day • October 28, 2025 Growth dynamics expected to continue through 2027 1 LONG - TERM OUTLOOK FINANCIAL PRIORITIES 1 AI - related demand for leading - edge data center hardware remains robust • Hyperscalers continue to increase capex spend • Growing investments from Digital Native Customers • Demand signals suggest trends have multi - year runway 2 Visibility to ramping of large scale new programs into 2027 across Networking and AI/ML Compute • Multiple 1.6T program ramps • HPS AI rack - scale solution with Digital Native Customer • Next - gen compute with Hyperscaler customer 3 Strong pipeline of opportunities with existing and new customers Primary aim is to continue compounding non - GAAP adjusted EPS within the context of the following filters: Sustainability of non - GAAP operating margins Disciplined revenue growth: alignment of new programs with our competitive advantages and long - term portfolio strategy Strong non - GAAP adjusted ROIC % performance 1) See “Cautionary Note Regarding Forward - Looking Statements” on slide 2. 45
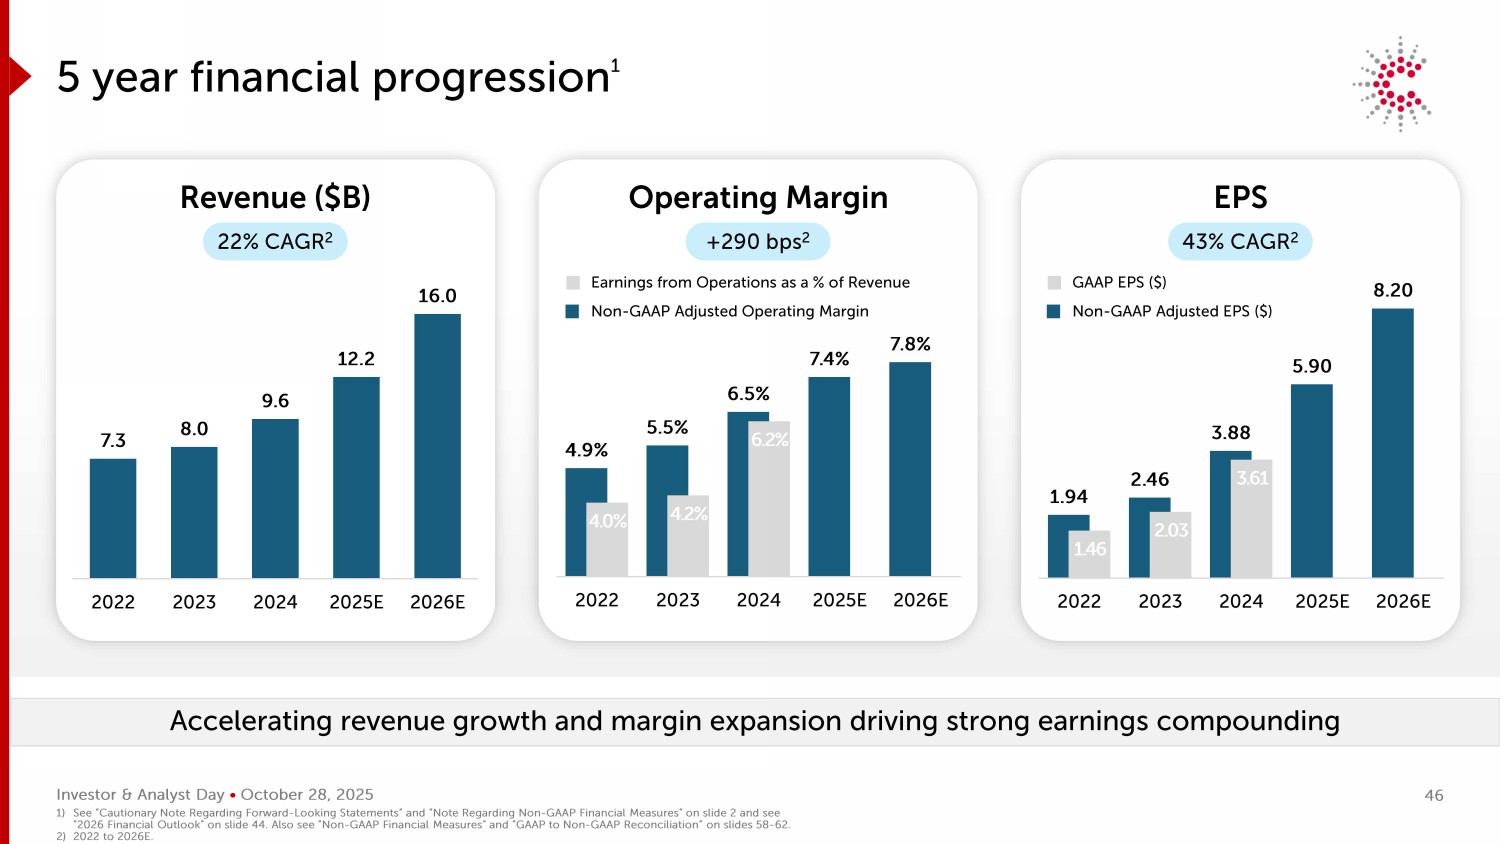
Investor & Analyst Day • October 28, 2025 1.94 2.46 3.88 5.90 8.20 1.46 2.03 3.61 2022 2023 2024 2025E 2026E 7.3 8.0 9.6 12.2 16.0 2022 2023 2024 2025E 2026E 4.9% 5.5% 6.5% 7.4% 7.8% 4.0% 4.2% 6.2% 2022 2023 2024 2025E 2026E 43% CAGR 2 5 year financial progression 1 Accelerating revenue growth and margin expansion driving strong earnings compounding Revenue ($B) Operating Margin EPS Earnings from Operations as a % of Revenue Non - GAAP Adjusted Operating Margin GAAP EPS ($) Non - GAAP Adjusted EPS ($) +290 bps 2 22% CAGR 2 1) See “Cautionary Note Regarding Forward - Looking Statements” and “Note Regarding Non - GAAP Financial Measures” on slide 2 and see “2026 Financial Outlook” on slide 44. Also see “Non - GAAP Financial Measures” and “GAAP to Non - GAAP Reconciliation” on slides 58 - 62. 2) 2022 to 2026E. 46
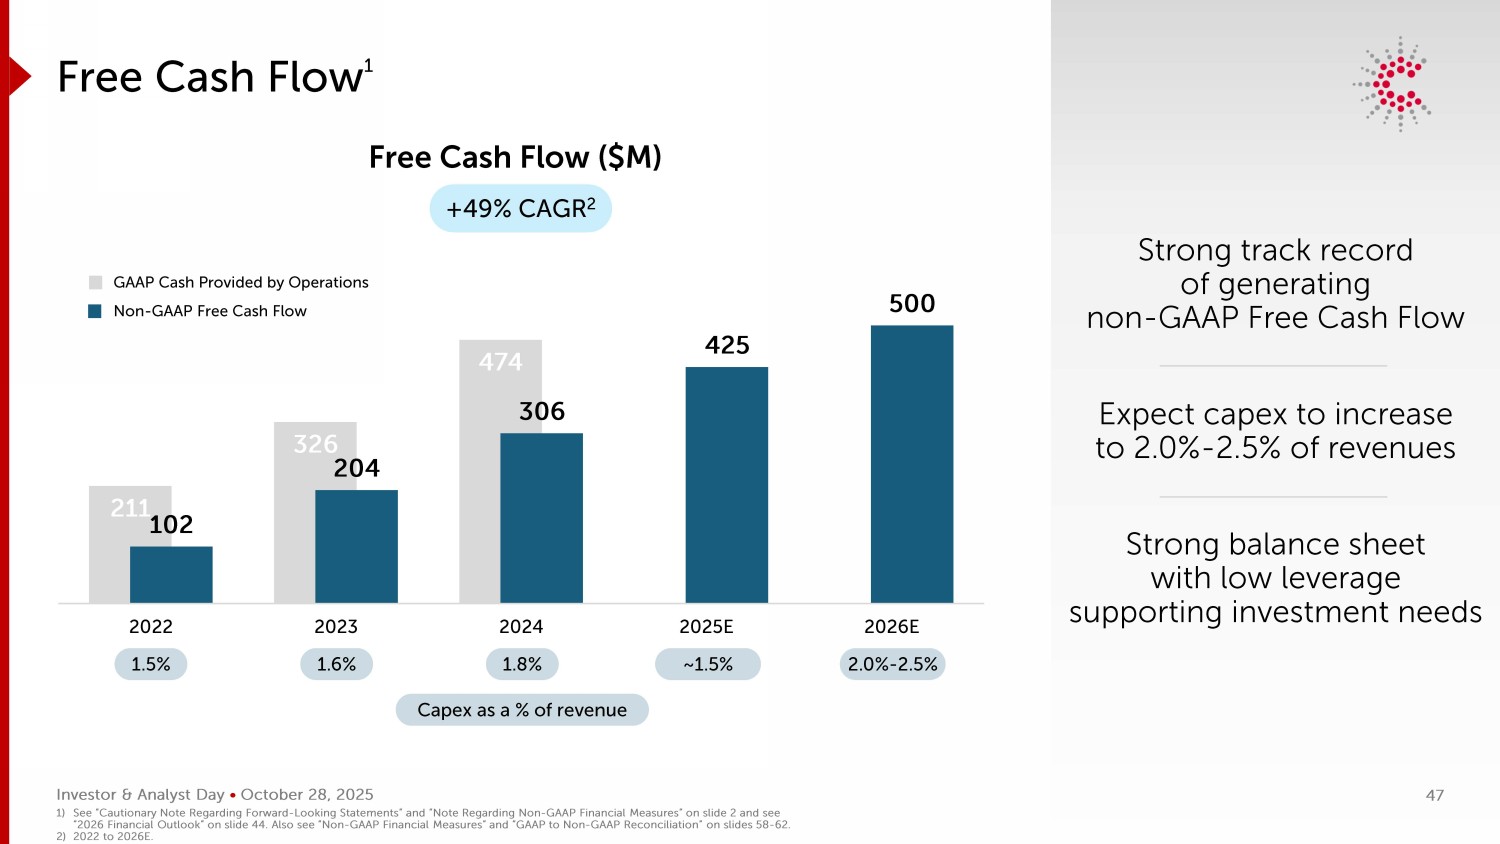
Investor & Analyst Day • October 28, 2025 ~1.5 % 211 326 474 102 204 306 425 500 2022 2023 2024 2025E 2026E Strong track record of generating non - GAAP Free Cash Flow Expect capex to increase to 2.0% - 2.5% of revenues Strong balance sheet with low leverage supporting investment needs Free Cash Flow 1 Free Cash Flow ($M) +49% CAGR 2 1.5% 2.0 % - 2 .5 % 1.8% 1.6% Capex as a % of revenue GAAP Cash Provided by Operations Non - GAAP Free Cash Flow 1) See “Cautionary Note Regarding Forward - Looking Statements” and “Note Regarding Non - GAAP Financial Measures” on slide 2 and see “2026 Financial Outlook” on slide 44. Also see “Non - GAAP Financial Measures” and “GAAP to Non - GAAP Reconciliation” on slides 58 - 62. 2) 2022 to 2026E. 47
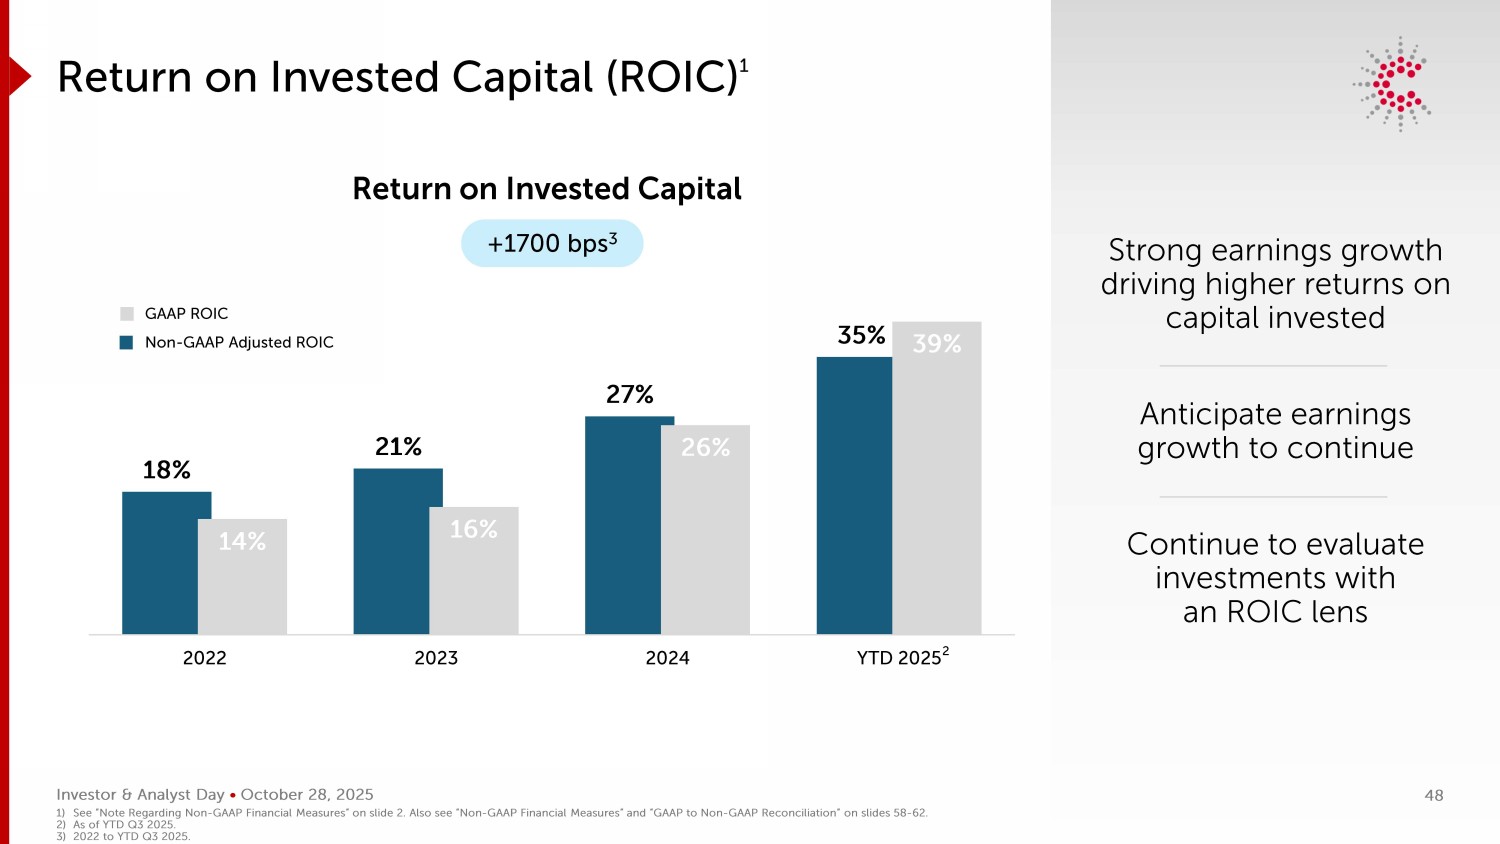
Investor & Analyst Day • October 28, 2025 18% 21% 27% 35% 14% 16% 26% 39% 2022 2023 2024 YTD 2025 Return on Invested Capital (ROIC) 1 Return on Invested Capital +1700 bps 3 GAAP ROIC Non - GAAP Adjusted ROIC 1) See “Note Regarding Non - GAAP Financial Measures” on slide 2. Also see “Non - GAAP Financial Measures” and “GAAP to Non - GAAP Reconc iliation” on slides 58 - 62. 2) As of YTD Q3 2025. 3) 2022 to YTD Q3 2025. 48 Strong earnings growth driving higher returns on capital invested Anticipate earnings growth to continue Continue to evaluate investments with an ROIC lens 2
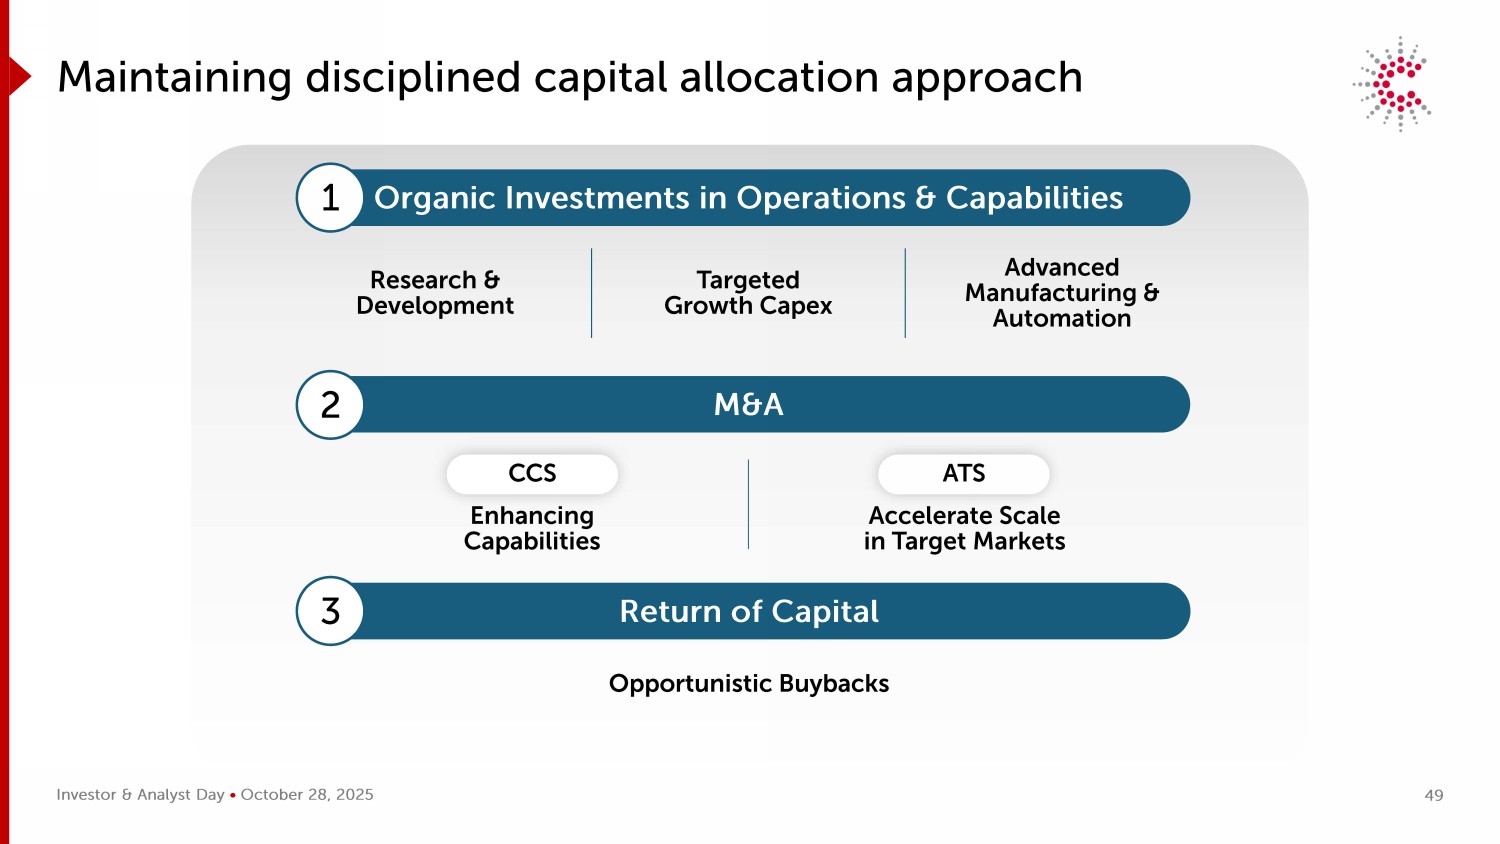
Investor & Analyst Day • October 28, 2025 Maintaining disciplined capital allocation approach Organic Investments in Operations & Capabilities Research & Development Targeted Growth Capex Advanced Manufacturing & Automation M&A Enhancing Capabilities Accelerate Scale in Target Markets Return of Capital Opportunistic Buybacks CCS ATS 1 2 3 49
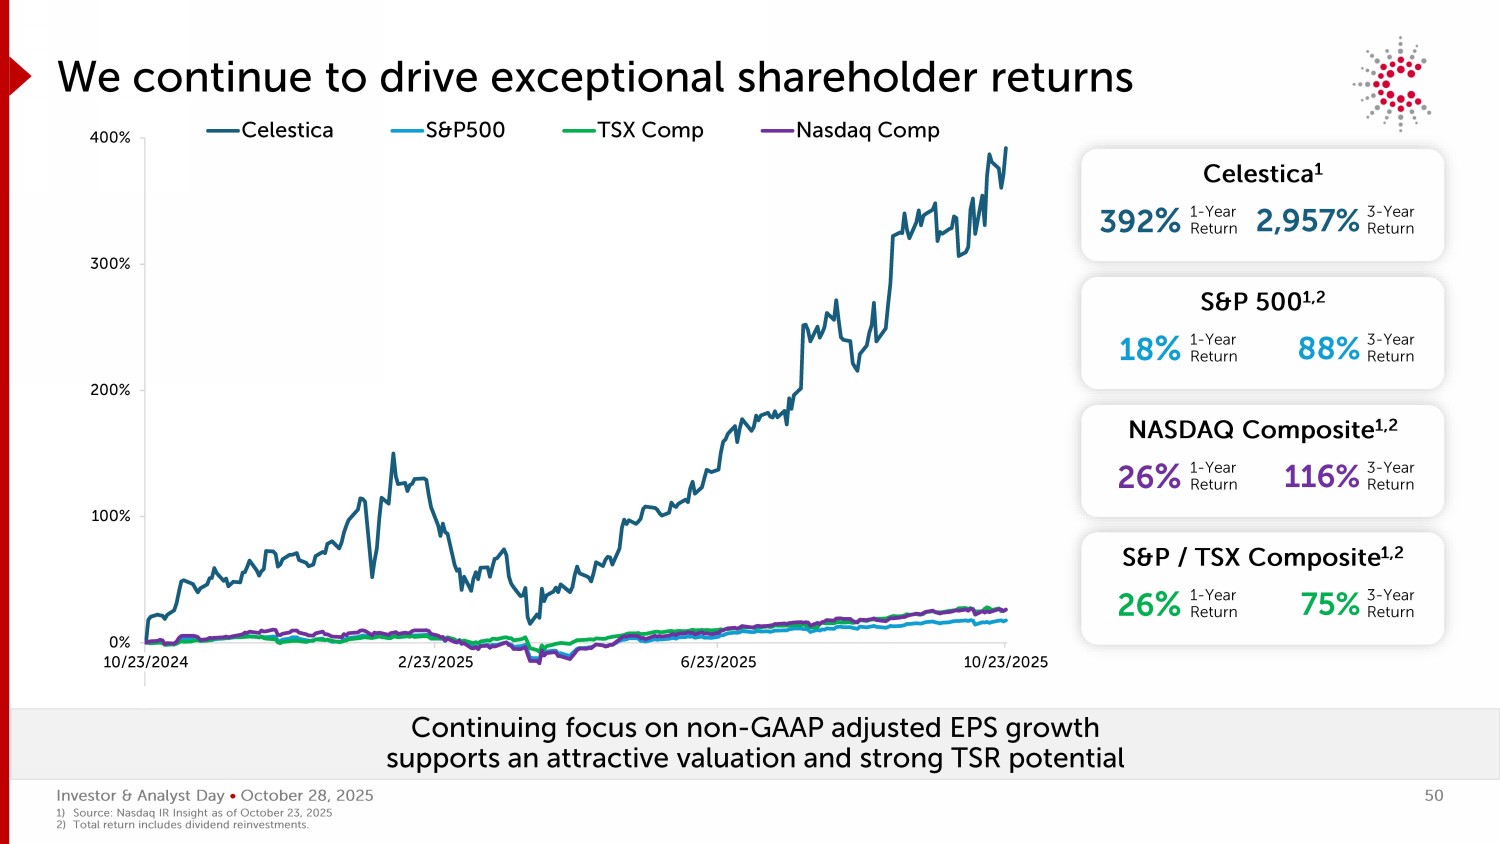
Investor & Analyst Day • October 28, 2025 -100% 0% 100% 200% 300% 400% 10/23/2024 2/23/2025 6/23/2025 10/23/2025 Celestica S&P500 TSX Comp Nasdaq Comp We continue to drive exceptional shareholder returns Celestica 1 392 % 1 - Year Return 2,957% 3 - Year Return S&P 500 1,2 18 % 1 - Year Return 88% 3 - Year Return S&P / TSX Composite 1,2 26 % 1 - Year Return 75% 3 - Year Return NASDAQ Composite 1,2 26 % 1 - Year Return 116% 3 - Year Return Investor & Analyst Day • October 28, 2025 Continuing focus on non - GAAP adjusted EPS growth supports an attractive valuation and strong TSR potential 1) Source: Nasdaq IR Insight as of October 23, 2025 2) Total return includes dividend reinvestments. 50
2025 INVESTOR & ANALYST DAY Closing Remarks Rob Mionis President and Chief Executive Officer

Investor & Analyst Day • October 28, 2025 Our key drivers of success Industry - leading positions in high - growth markets Accelerate market advancements through technology leadership Best - in - class operational execution 1 2 3 52
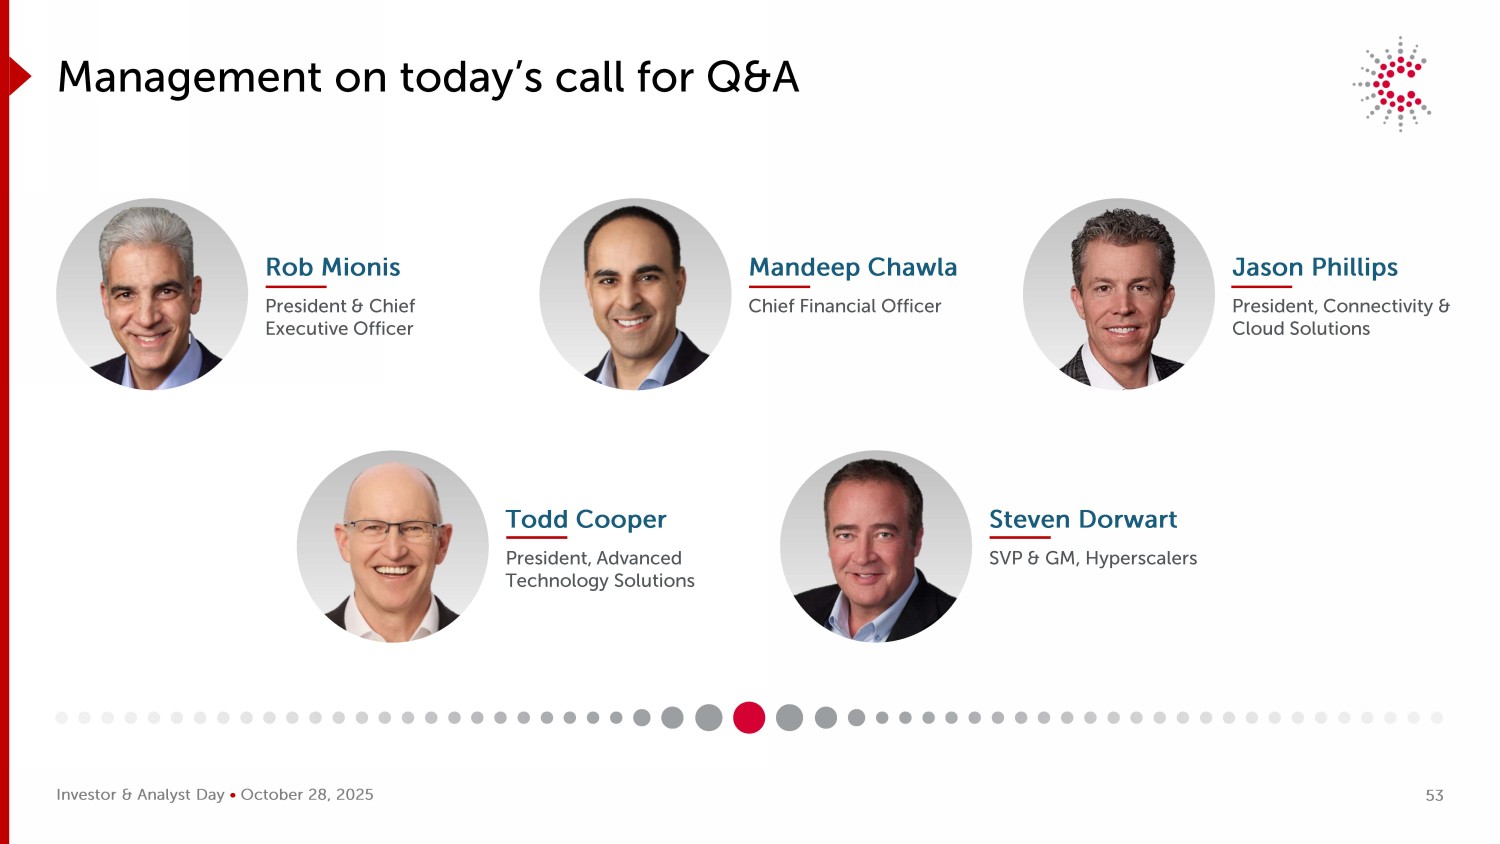
Investor & Analyst Day • October 28, 2025 Management on today’s call for Q&A Rob Mionis President & Chief Executive Officer Mandeep Chawla Chief Financial Officer Jason Phillips President, Connectivity & Cloud Solutions Steven Dorwart SVP & GM, Hyperscalers Todd Cooper President, Advanced Technology Solutions 53

2025 INVESTOR & ANALYST DAY Q&A

October 28, 2025 2025 INVESTOR & ANALYST DAY

2025 INVESTOR & ANALYST DAY Appendix
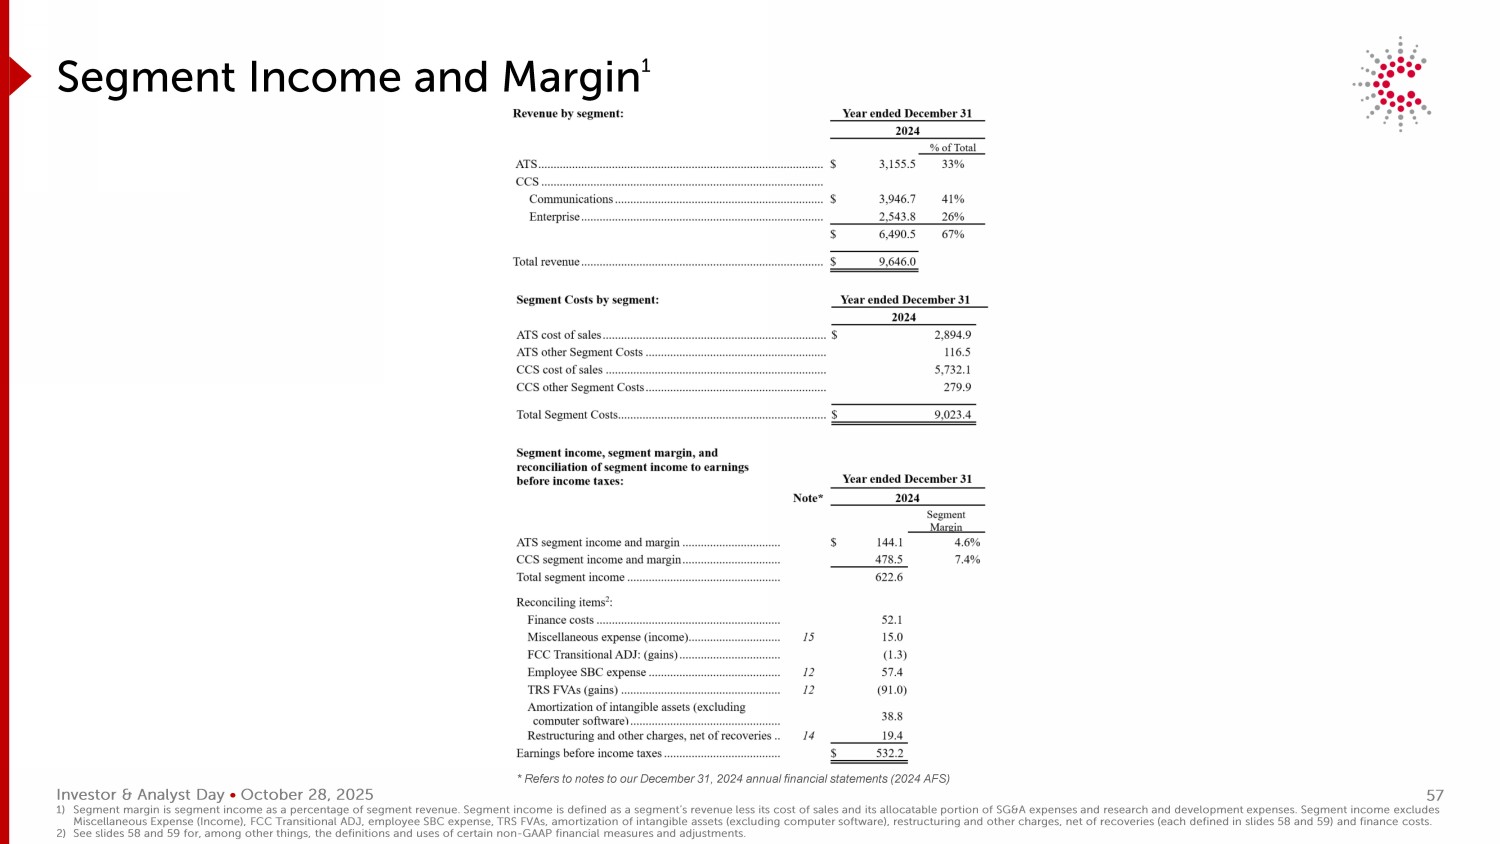
Investor & Analyst Day • October 28, 2025 Segment Income and Margin 1 * Refers to notes to our December 31, 2024 annual financial statements (2024 AFS) 1) Segment margin is segment income as a percentage of segment revenue. Segment income is defined as a segment’s revenue less it s c ost of sales and its allocatable portion of SG&A expenses and research and development expenses. Segment income excludes Miscellaneous Expense (Income), FCC Transitional ADJ, employee SBC expense, TRS FVAs, amortization of intangible assets (excl udi ng computer software), restructuring and other charges, net of recoveries (each defined in slides 58 and 59) and finance cost s. 2) See slides 58 and 59 for, among other things, the definitions and uses of certain non - GAAP financial measures and adjustments. 57
Investor & Analyst Day • October 28, 2025 Non - GAAP Financial Measures The non - GAAP financial measures included in this presentation are: adjusted operating earnings (or adjusted EBIAT), adjusted ope rating margin (adjusted operating earnings or adjusted EBIAT as a percentage of revenue), adjusted net earnings, adjusted earnings per share (EPS), adjusted return on invested capital (adjusted ROIC), free cash flow, adjusted tax expense and adjusted effective tax rate, which are further described in the tables in the following slides. As used herein, "Q1," "Q2," "Q3," and "Q4" followed by a year refers to the first quarter, second quarter, third quarter and fourth quarter of such year, re spectively. The nine - month period ended September 30, 2025 is referred to herein as “YTD 2025.” We believe the non - GAAP financial measures herein enable investors to evaluate and compare our results from operations by exclud ing specific items that we do not consider to be reflective of our core operations, to evaluate cash resources that we generate from our business each period, to analyze operating results using the same measures our chief operating deci sio n maker uses to measure performance, and to help compare our results with those of our competitors. In addition, management believes that the use of adjusted tax expense and adjusted effective tax rate provides additional transp are ncy into the tax effects of our core operations, and are useful to management and investors for historical comparisons and forecasting. These non - GAAP financial measures reflect management’s belief that the excluded items are not indic ative of our core operations. Non - GAAP financial measures do not have any standardized meaning prescribed by GAAP and therefore may not be directly comparable to similar measures presented by other companies. Non - GAAP financial measures are not measures of performance under GAAP and should not be considered in isolation or as a substitute for any GAAP financial measure. Reconcili ati ons of the non - GAAP financial measures to the most directly comparable GAAP financial measures are provided in the following slides. We do not provide reconciliations for our forward - looking non - GAAP financial measures, as we are unable to reasonably estimate t he items that we exclude from GAAP to calculate comparable non - GAAP measures without unreasonable effort. This is due to the inherent difficulty of forecasting the timing or amount of various events that have not yet occurred, are out of our control and/or cannot be reasonably predicted, and that would impact the most directly comparable forward - looking GAAP financial measure. For these same reasons, we are unable to address the probable significance of the unavailable in formation. Forward - looking non - GAAP financial measures may vary materially from the corresponding GAAP financial measures. Our non - GAAP financial measures are calculated by making the following adjustments (as applicable) to our GAAP financial measure s: Employee SBC expense , which represents the estimated fair value of stock options, restricted share units and performance share units granted to e mpl oyees, is excluded because grant activities vary significantly from quarter - to - quarter in both quantity and fair value. We believe excluding this expense allows us to compare core operating results with those of our comp eti tors, who also generally exclude employee SBC expense in assessing operating performance, and may have different granting patterns, equity awards and valuation assumptions. Total return swap fair value adjustments (TRS FVAs) represent mark - to - market adjustments to our TRS Agreement, as the TRS Agreement is re - measured at fair value at each quarter en d. We exclude the impact of these non - cash fair value adjustments (which reflect fluctuations in the market price of our common shares recorded in cost of sales, selling, general and admin expenses (SG&A), or Miscellaneous Expenses (Income)) from period to period as such fluctuations do not represent our ongoing operating performance. In addition, we believe that excluding these non - cash adjustments permits a helpful comparison of our core operating results to our competitors. In accordance with GAAP, TRS FVAs prior to 2024 were recorded in Miscellaneous Expense (Income). Commencing in 2024, the TRS Agreement was treated as an economic hedge with the TRS FVAs recorded in cost of sales and SG&A. Transitional hedge reclassifications and adjustments related to foreign currency forward exchange contracts (FCC Transitional AD J) and interest rate swaps (IRS Transitional ADJ) were both specifically driven by our transition from IFRS to GAAP. For the purpose of determining our non - GAAP measures, FCC Transitional ADJ were made to cost of sales and SG&A and IRS Transitio nal ADJ are made to finance costs. Our foreign currency forward exchange contracts and interest rate swaps that we entered prior to 2024 were accounted for as either cash flow hedges (qualified for hedge accounting) or economic hedg es under IFRS. However, those contracts were not accounted for as such under GAAP until January 1, 2024, resulting in FCC Transitional ADJ and IRS Transitional ADJ. Had we been able to designate those foreign currency forward exch ang e contracts and interest rate swaps under GAAP from their inception, they would have qualified as cash flow or economic hedges under GAAP, and no FCC Transitional ADJ or IRS Transitional ADJ would have been required under GAAP. FCC Tran sit ional ADJ and IRS transitional ADJ do not reflect the on - going operational impacts of our hedging activities and are excluded in assessing operating performance. Amortization of intangible assets (excluding computer software) consist of non - cash charges for intangible assets that are impacted by the timing and magnitude of acquired businesses. Amortiz ation of intangible assets varies among our competitors, and we believe that excluding these charges permits a helpful comparison of core operating results to our compet ito rs who also generally exclude amortization charges in assessing operating performance. 58
Investor & Analyst Day • October 28, 2025 Non - GAAP Financial Measures Restructuring and Other Charges (Recoveries) consist of, when applicable: Restructuring Charges (Recoveries) (defined below); Transition Costs (Recoveries) (defined below ); consulting, transaction and integration costs related to potential and completed acquisitions; legal settlements (recoveries); in 2023, costs associated with the conversion and underwritten public sa le of our shares by Onex Corporation, our then - controlling shareholder, and commencing in Q2 2023, related costs pertaining to our transition as a U.S. domestic filer. We exclude these charges and recoveries because we believe that they a re not directly related to ongoing operating results and do not reflect our expected future operating expenses after completion of the relevant actions. Our competitors may record similar items at different times, and we believe these exclusi ons permit a helpful comparison of our core operating results with those of our competitors who also generally exclude these items in assessing operating performance. Restructuring Charges (Recoveries) , consist of costs or recoveries relating to: employee severance, site closings and consolidations, accelerated depreciation of owned property and equipment which are no longer used and are available for sale, and reductions in infrastructure. Transition Costs (Recoveries) consist of costs and recoveries in connection with: ( i ) the transfer of manufacturing lines from closed sites to other sites within our global network; (ii) the sale of real prope rti es unrelated to restructuring actions; and (iii) specified charges or recoveries related to the Purchaser Lease (defined below). Transition Costs consist of direct relo cat ion and duplicate costs (such as rent expense, utility costs, depreciation charges, and personnel costs) incurred during the transition periods, as well as cease - use and other costs incurred in connection with idle or vacated portions of the relevan t premises that we would not have incurred but for these relocations, transfers and dispositions. As part of our 2019 Toronto real property sale, we entered into a related 10 - year lease for our then - anticipated headquarters (Purchaser Lease). In November 2022, we extended the lease (on a long - term basis) on our current corporate headquarters due to several Purchaser Lease commencement date delays. In Q3 2023 and Q2 2025, we executed sublease agreements for the leased space under the Purchaser Lease. We record charges related to the sublet of the Purchaser Lease (which commenced in June 2024) as Transition Costs. We believe that excluding Transition Costs and Recoveries permits a helpful comparison of our co re operating results from period - to - period, as they do not reflect our ongoing operations once these specified events are complete. Miscellaneous Expense (Income) consists primarily of: ( i ) certain net periodic benefit costs (credits) related to our pension and post - employment benefit plans consisting of interest c osts and expected returns on pension balances, and amortization of actuarial gains or losses; and (ii) gains or losses related to our TRS Agreement and foreign currency forward ex change contracts and interest rate swaps that we entered into prior to 2024. Those derivative instruments were accounted for as either cash flow hedges (qualifying for hedge accounting) or economic hedges under IFRS. However, those cont rac ts were not accounted for as such under GAAP until January 1, 2024. Certain gains and losses related to those contracts were recorded in Miscellaneous Expense (Income). See FCC Transitional ADJ, IRS Transitional ADJ and TRS FVAs above. We exclude such items because we believe they are not directly related to our ongoing operating results. Tax effects of the non - core items, which include our non - GAAP adjustments above, are excluded from GAAP tax expense to calculate adjusted tax expense (non - GAAP), as we do not believe these costs or recoveries reflect our core operating performance and vary significantly among our competitors who also generally exclude such items in assessing operating perform anc e. Our non - GAAP financial measures include the following: Adjusted operating earnings (Adjusted EBIAT) is defined as GAAP earnings from operations excluding the impact of Employee SBC expense, TRS FVAs, FCC Transitional ADJ, Amo rt ization of intangible assets (excluding computer software), and Restructuring and Other Charges (Recoveries). Adjusted operating margin is adjusted operating earnings as a percentage of GAA P r evenue. Management uses adjusted operating earnings (adjusted EBIAT) as a measure to assess performance related to our core operations. Adjusted net earnings is defined as GAAP net earnings excluding the impact of Employee SBC expense, TRS FVAs, FCC Transitional ADJ, amortization of i ntangible assets (excluding computer software), Restructuring and Other Charges (Recoveries), IRS Transitional ADJ, Miscellaneous Expense (Income) and adjustment for taxes. Adjusted EPS is calculated by di vid ing adjusted net earnings by the number of diluted weighted average shares outstanding. Management uses adjusted net earnings as a measure to assess performance related to our core operations. Free cash flow is defined as cash provided by (used in) operations less the purchase of property, plant and equipment (net of proceeds from th e sale of certain surplus equipment and property, when applicable). Free cash flow does not represent residual cash flow available to Celestica for discretionary expenditures. Management uses free cash flow as a measure, in add iti on to GAAP cash provided by (used in) operations, to assess our operational cash flow performance. We believe free cash flow provides another level of transparency to our ability to generate cash from normal business operations. Adjusted ROIC is calculated by dividing annualized adjusted EBIAT by average net invested capital for the period. Net invested capital (cal cu lated in the tables in the following slides) is derived from GAAP financial measures, and is defined as total assets less: cash, right - of - use (ROU) assets (operating and finance leases), accounts payable, accrued and other current liabili ties and provisions (excluding finance and operating lease liabilities) and income taxes payable. Management uses adjusted ROIC as a measure to assess the effectiveness of the invested capital we employ to build products or provide service s t o our customers, by quantifying how well we generate earnings relative to the capital we have invested in our business. 59
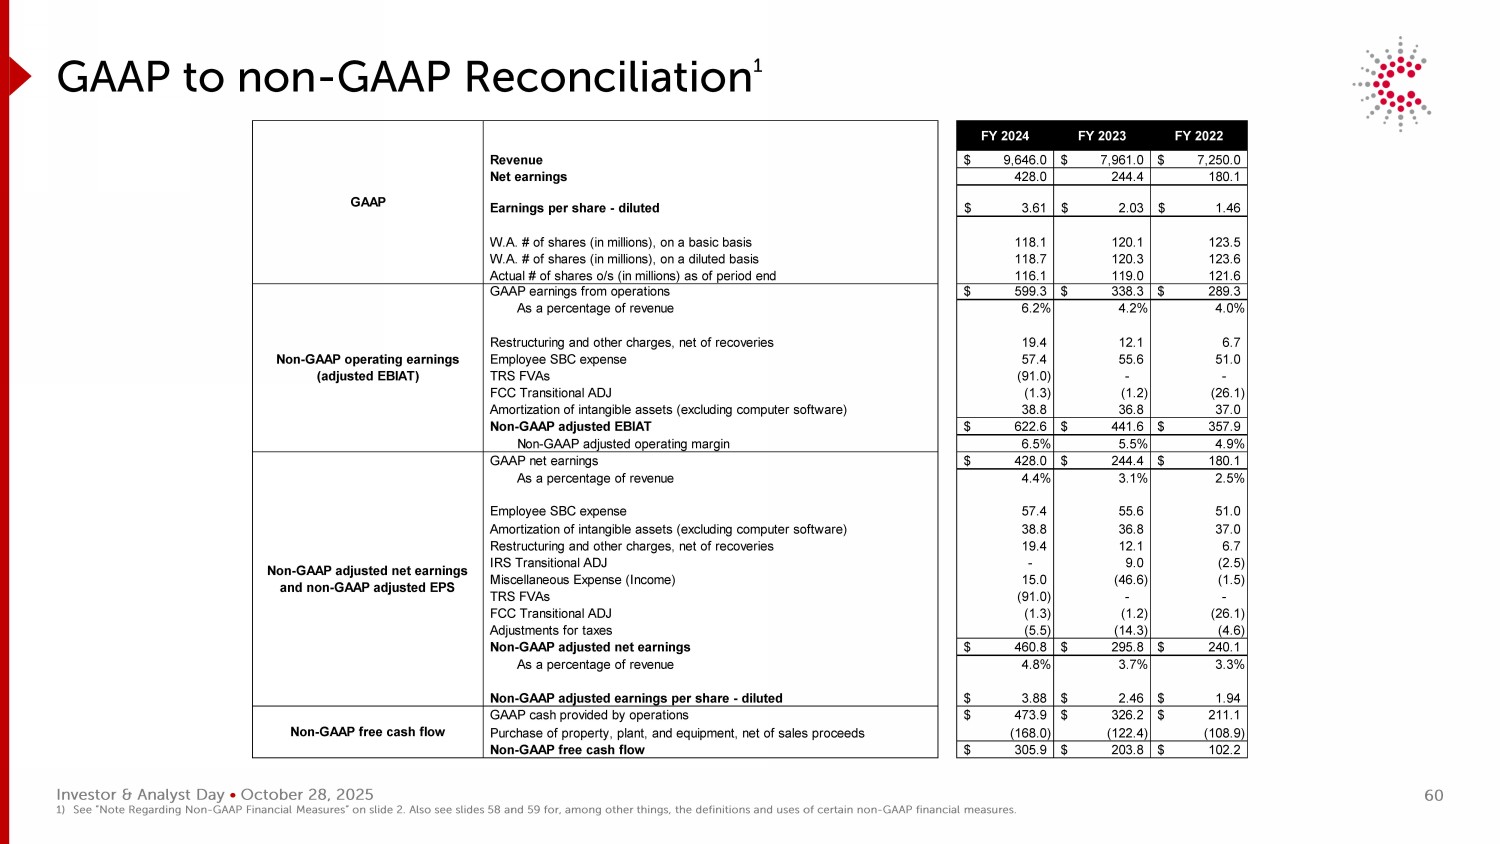
Investor & Analyst Day • October 28, 2025 FY 2024 FY 2023 FY 2022 Revenue 9,646.0$ 7,961.0$ 7,250.0$ Net earnings 428.0 244.4 180.1 Earnings per share - diluted 3.61$ 2.03$ 1.46$ W.A. # of shares (in millions), on a basic basis 118.1 120.1 123.5 W.A. # of shares (in millions), on a diluted basis 118.7 120.3 123.6 Actual # of shares o/s (in millions) as of period end 116.1 119.0 121.6 GAAP earnings from operations 599.3$ 338.3$ 289.3$ As a percentage of revenue 6.2% 4.2% 4.0% Restructuring and other charges, net of recoveries 19.4 12.1 6.7 Employee SBC expense 57.4 55.6 51.0 TRS FVAs (91.0) - - FCC Transitional ADJ (1.3) (1.2) (26.1) Amortization of intangible assets (excluding computer software) 38.8 36.8 37.0 Non-GAAP adjusted EBIAT 622.6$ 441.6$ 357.9$ Non-GAAP adjusted operating margin 6.5% 5.5% 4.9% GAAP net earnings 428.0$ 244.4$ 180.1$ As a percentage of revenue 4.4% 3.1% 2.5% Employee SBC expense 57.4 55.6 51.0 Amortization of intangible assets (excluding computer software) 38.8 36.8 37.0 Restructuring and other charges, net of recoveries 19.4 12.1 6.7 IRS Transitional ADJ - 9.0 (2.5) Miscellaneous Expense (Income) 15.0 (46.6) (1.5) TRS FVAs (91.0) - - FCC Transitional ADJ (1.3) (1.2) (26.1) Adjustments for taxes (5.5) (14.3) (4.6) Non-GAAP adjusted net earnings 460.8$ 295.8$ 240.1$ As a percentage of revenue 4.8% 3.7% 3.3% Non-GAAP adjusted earnings per share - diluted 3.88$ 2.46$ 1.94$ GAAP cash provided by operations 473.9$ 326.2$ 211.1$ Purchase of property, plant, and equipment, net of sales proceeds (168.0) (122.4) (108.9) Non-GAAP free cash flow 305.9$ 203.8$ 102.2$ GAAP Non-GAAP adjusted net earnings and non-GAAP adjusted EPS Non-GAAP free cash flow Non-GAAP operating earnings (adjusted EBIAT) GAAP to non - GAAP Reconciliation 1 1) See “Note Regarding Non - GAAP Financial Measures” on slide 2. Also see slides 58 and 59 for, among other things, the definitions and uses of certain non - GAAP financial measures. 60
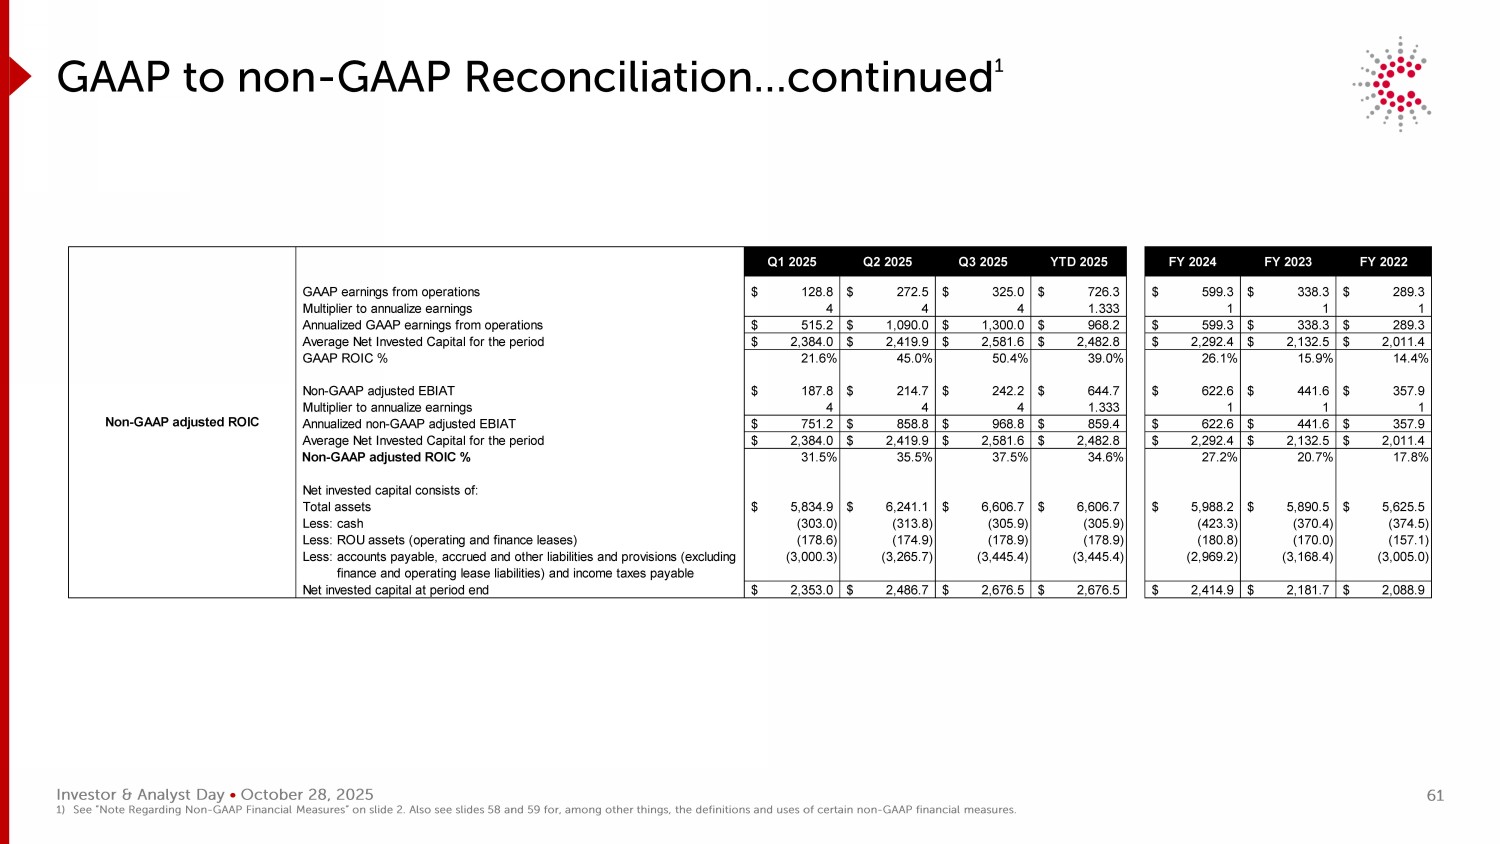
Investor & Analyst Day • October 28, 2025 Q1 2025 Q2 2025 Q3 2025 YTD 2025 FY 2024 FY 2023 FY 2022 GAAP earnings from operations 128.8$ 272.5$ 325.0$ 726.3$ 599.3$ 338.3$ 289.3$ Multiplier to annualize earnings 4 4 4 1.333 1 1 1 Annualized GAAP earnings from operations 515.2$ 1,090.0$ 1,300.0$ 968.2$ 599.3$ 338.3$ 289.3$ Average Net Invested Capital for the period 2,384.0$ 2,419.9$ 2,581.6$ 2,482.8$ 2,292.4$ 2,132.5$ 2,011.4$ GAAP ROIC % 21.6% 45.0% 50.4% 39.0% 26.1% 15.9% 14.4% Non-GAAP adjusted EBIAT 187.8$ 214.7$ 242.2$ 644.7$ 622.6$ 441.6$ 357.9$ Multiplier to annualize earnings 4 4 4 1.333 1 1 1 Annualized non-GAAP adjusted EBIAT 751.2$ 858.8$ 968.8$ 859.4$ 622.6$ 441.6$ 357.9$ Average Net Invested Capital for the period 2,384.0$ 2,419.9$ 2,581.6$ 2,482.8$ 2,292.4$ 2,132.5$ 2,011.4$ Non-GAAP adjusted ROIC % 31.5% 35.5% 37.5% 34.6% 27.2% 20.7% 17.8% Net invested capital consists of: Total assets 5,834.9$ 6,241.1$ 6,606.7$ 6,606.7$ 5,988.2$ 5,890.5$ 5,625.5$ Less: cash (303.0) (313.8) (305.9) (305.9) (423.3) (370.4) (374.5) Less: ROU assets (operating and finance leases) (178.6) (174.9) (178.9) (178.9) (180.8) (170.0) (157.1) Less: accounts payable, accrued and other liabilities and provisions (excluding (3,000.3) (3,265.7) (3,445.4) (3,445.4) (2,969.2) (3,168.4) (3,005.0) finance and operating lease liabilities) and income taxes payable Net invested capital at period end 2,353.0$ 2,486.7$ 2,676.5$ 2,676.5$ 2,414.9$ 2,181.7$ 2,088.9$ Non-GAAP adjusted ROIC GAAP to non - GAAP Reconciliation…continued 1 1) See “Note Regarding Non - GAAP Financial Measures” on slide 2. Also see slides 58 and 59 for, among other things, the definitions and uses of certain non - GAAP financial measures. 61
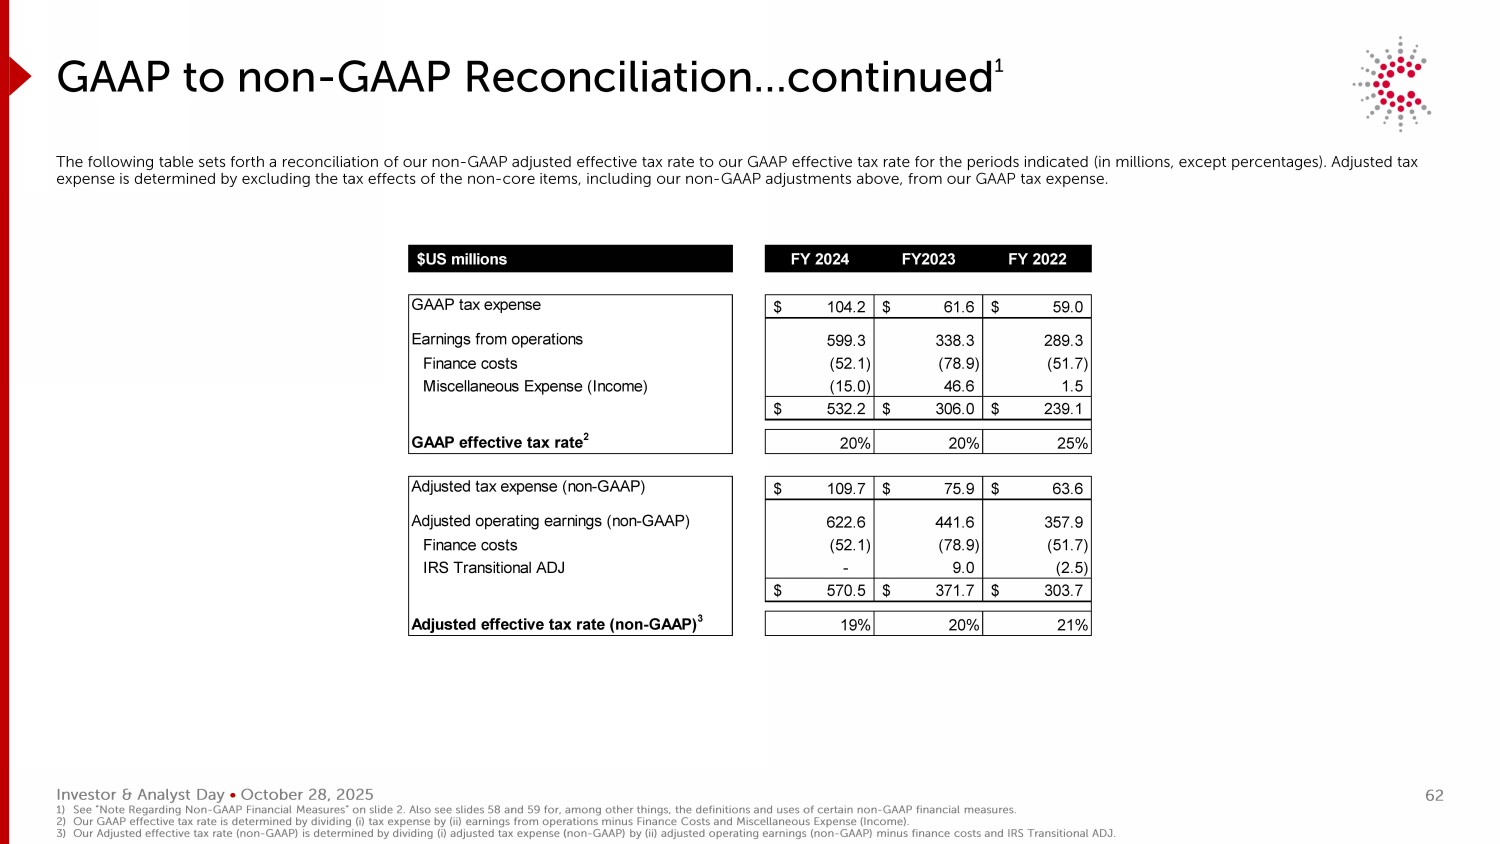
Investor & Analyst Day • October 28, 2025 GAAP to non - GAAP Reconciliation…continued 1 The following table sets forth a reconciliation of our non - GAAP adjusted effective tax rate to our GAAP effective tax rate for t he periods indicated (in millions, except percentages). Adjusted tax expense is determined by excluding the tax effects of the non - core items, including our non - GAAP adjustments above, from our GAA P tax expense. 1) See “Note Regarding Non - GAAP Financial Measures” on slide 2. Also see slides 58 and 59 for, among other things, the definitions and uses of certain non - GAAP financial measures. 2) Our GAAP effective tax rate is determined by dividing ( i ) tax expense by (ii) earnings from operations minus Finance Costs and Miscellaneous Expense (Income). 3) Our Adjusted effective tax rate (non - GAAP) is determined by dividing ( i ) adjusted tax expense (non - GAAP) by (ii) adjusted operating earnings (non - GAAP) minus finance costs and IRS Transitional ADJ. $US millions FY 2024 FY2023 FY 2022 GAAP tax expense 104.2$ 61.6$ 59.0$ Earnings from operations 599.3 338.3 289.3 Finance costs (52.1) (78.9) (51.7) Miscellaneous Expense (Income) (15.0) 46.6 1.5 532.2$ 306.0$ 239.1$ GAAP effective tax rate 2 20% 20% 25% Adjusted tax expense (non-GAAP) 109.7$ 75.9$ 63.6$ Adjusted operating earnings (non-GAAP) 622.6 441.6 357.9 Finance costs (52.1) (78.9) (51.7) IRS Transitional ADJ - 9.0 (2.5) 570.5$ 371.7$ 303.7$ Adjusted effective tax rate (non-GAAP) 3 19% 20% 21% 62

October 28, 2025 2025 INVESTOR & ANALYST DAY