Focused on Our Future 2Q 2025 Strategic & Financial Highlights Published July 30, 2025
Forward-Looking Statements Forward-Looking Statements: This presentation includes forward-looking statements based on information currently available to management and unless the context requires otherwise, references to “we,” “us,” “our” and “FirstEnergy” refers to FirstEnergy Corp. and its subsidiaries. Such statements are subject to certain risks and uncertainties and readers are cautioned not to place undue reliance on these forward-looking statements. These statements include declarations regarding management's intents, beliefs and current expectations. These statements typically contain, but are not limited to, the terms “anticipate,” “potential,” “expect,” "forecast," "target," "will," "intend," “believe,” "project," “estimate," "plan" and similar words. Forward-looking statements involve estimates, assumptions, known and unknown risks, uncertainties and other factors that may cause actual results, performance or achievements to be materially different from any future results, performance or achievements expressed or implied by such forward-looking statements, which may include the following: the potential liabilities, increased costs and unanticipated developments resulting from government investigations and agreements, including those associated with compliance with or failure to comply with the Deferred Prosecution Agreement entered into July 21, 2021 and settlements with the U.S. Attorney’s Office for the Southern District of Ohio and the Securities and Exchange Commission (“SEC”); the risks and uncertainties associated with government investigations and audits regarding Ohio House Bill 6, as passed by Ohio’s 133rd General Assembly (“HB 6”) and related matters, including potential adverse impacts on federal or state regulatory matters, including, but not limited to, matters relating to rates; the risks and uncertainties associated with litigation, arbitration, mediation and similar proceedings, particularly regarding HB 6 related matters; changes in national and regional economic conditions, including recession, volatile interest rates, inflationary pressure, supply chain disruptions, higher fuel costs, and workforce impacts, affecting us and/or our customers and those vendors with which we do business; variations in weather, such as mild seasonal weather variations and severe weather conditions (including events caused, or exacerbated, by climate change, such as wildfires, hurricanes, flooding, droughts, high wind events and extreme heat events) and other natural disasters, which may result in increased storm restoration expenses or material liability and negatively affect future operating results; the potential liabilities and increased costs arising from regulatory actions or outcomes in response to severe weather conditions and other natural disasters; legislative and regulatory developments, and executive orders, including, but not limited to, matters related to rates, energy regulatory policies, compliance and enforcement activity, cyber security, climate change, and equity and inclusion; the ability to access the public securities and other capital and credit markets in accordance with our financial plans, the cost of such capital and overall condition of the capital and credit markets affecting us, including the increasing number of financial institutions evaluating the impact of climate change on their investment decisions, and the loss of FirstEnergy Corp.’s status as a well-known seasoned issuer; the risks associated with physical attacks, such as acts of war, terrorism, sabotage or other acts of violence, and cyber-attacks and other disruptions to our, or our vendors’, information technology system, which may compromise our operations, and data security breaches of sensitive data, intellectual property and proprietary or personally identifiable information; the ability to accomplish or realize anticipated benefits through establishing a culture of continuous improvement and our other strategic and financial goals, including, but not limited to, executing Energize365, our transmission and distribution investment plan, executing on our rate filing strategy, controlling costs, improving credit metrics, maintaining investment grade ratings, strengthening our balance sheet and growing earnings; changing market conditions affecting the measurement of certain liabilities and the value of assets held in our pension trusts may negatively impact our forecasted growth rate, results of operations and may also cause it to make contributions to its pension sooner or in amounts that are larger than currently anticipated; changes in assumptions regarding factors such as economic conditions within our territories, the reliability of our transmission and distribution system, our generation resource planning in West Virginia, or the availability of capital or other resources supporting identified transmission and distribution investment opportunities; human capital management challenges, including among other things, attracting and retaining appropriately trained and qualified employees and labor disruptions by our unionized workforce; mitigating exposure for remedial activities associated with retired and formerly owned electric generation assets, including those sites impacted by the legacy coal combustion residual rules that were finalized during 2024, and the Environmental Protection Agency’s reconsideration of such rule; changes to environmental laws and regulations, including, but not limited to, federal and state rules related to climate change, and potential changes to such laws and regulations as a result of the U.S. presidential administration; changes in customers’ demand for power, including, but not limited to, economic conditions, the impact of climate change, and emerging technology including artificial intelligence, particularly with respect to electrification, energy storage and distributed sources of generation; future actions taken by credit rating agencies that could negatively affect either our access to or terms of financing or our financial condition and liquidity; the potential of non-compliance with debt covenants in our credit facilities; the ability to comply with applicable reliability standards and energy efficiency and peak demand reduction mandates; changes to significant accounting policies; any changes in tax laws or regulations, including, but not limited to, the Inflation Reduction Act of 2022, the One Big Beautiful Bill Act of 2025, as signed into law on July 4, 2025, or adverse tax audit results or rulings and potential changes to such laws and regulations; the ability to meet our publicly-disclosed goals relating to climate- related matters, opportunities, improvements, and efficiencies, including FirstEnergy’s Greenhouse gas reduction goals’ and the risks and other factors discussed from time to time in FirstEnergy Corp.’s SEC filings. Dividends declared from time to time on FirstEnergy Corp.’s common stock during any period may in the aggregate vary from prior periods due to circumstances considered by the FirstEnergy Corp. Board at the time of the actual declarations. A security rating is not a recommendation to buy or hold securities and is subject to revision or withdrawal at any time by the assigning rating agency. Each rating should be evaluated independently of any other rating. These forward-looking statements are also qualified by, and should be read together with, the risk factors included in FirstEnergy Corp.’s Form 10-K, Form 10-Q and in other filings with the SEC. The foregoing review of factors also should not be construed as exhaustive. New factors emerge from time to time, and it is not possible for management to predict all such factors, nor assess the impact of any such factor on FirstEnergy Corp.’s business or the extent to which any factor, or combination of factors, may cause results to differ materially from those contained in any forward-looking statements. FirstEnergy Corp. expressly disclaims any obligation to update or revise, except as required by law, any forward-looking statements contained herein or in the information incorporated by reference as a result of new information, future events or otherwise. Strategic & Financial Highlights - Published July 30, 20252
Non-GAAP Financial Matters Strategic & Financial Highlights - Published July 30, 20253 This presentation contains references to certain financial measures including Baseline O&M and Core Earnings per share (“Core EPS”) as “non-GAAP financial measures,” which are not calculated in accordance with U.S. Generally Accepted Accounting Principles (“GAAP”) and exclude the impact of “special items,” from EPS attributable to FirstEnergy Corp. for Core EPS. Management uses these non-GAAP financial measures to evaluate the company’s and its segments’ performance, and manage its operations and references these non-GAAP financial measures in its decision-making, using them to facilitate historical and ongoing performance comparisons. Management believes that the non-GAAP financial measures of Baseline O&M and Core EPS, including by segment, provide consistent and comparable measures of performance of its businesses on an ongoing basis. Management also believes that such measures are useful to shareholders and other interested parties to understand performance trends and evaluate the company against its peer group by presenting period-over-period operating results, excluding the impacts described above, that may not be consistent or comparable across periods or across the company’s peer group. These non-GAAP financial measures are intended to complement, and are not considered as alternatives to, the most directly comparable GAAP financial measures, which for Baseline O&M is Other Operating Expenses and for Core EPS is EPS attributable to FirstEnergy Corp. Also, such non-GAAP financial measures may not be comparable to similarly titled measures used by other entities. Special items represent charges incurred or benefits realized that management believes are not indicative of, or may obscure, trends useful in evaluating the company’s ongoing core activities and results of operations, or otherwise warrant separate classification. Core EPS is calculated based on the weighted average number of common shares outstanding in the respective period. A reconciliation of forward-looking non-GAAP measures, including 2025 Baseline O&M, 2025 Core EPS, and Core EPS compound annual growth rate projections, to the most directly comparable GAAP measures is not provided because comparable GAAP measures are not available without unreasonable efforts due to the inherent difficulty in forecasting and quantifying measures that would be necessary for such reconciliation. Specifically, management cannot, without unreasonable effort, predict the impact of these special items in the context of Core EPS guidance, or Core EPS growth rate projections because these items, which could be significant, are difficult to predict and may be highly variable. In addition, the Company believes such a reconciliation would imply a degree of precision and certainty that could be confusing to investors. These special items are uncertain, depend on various factors and may have a material impact on our future GAAP results.
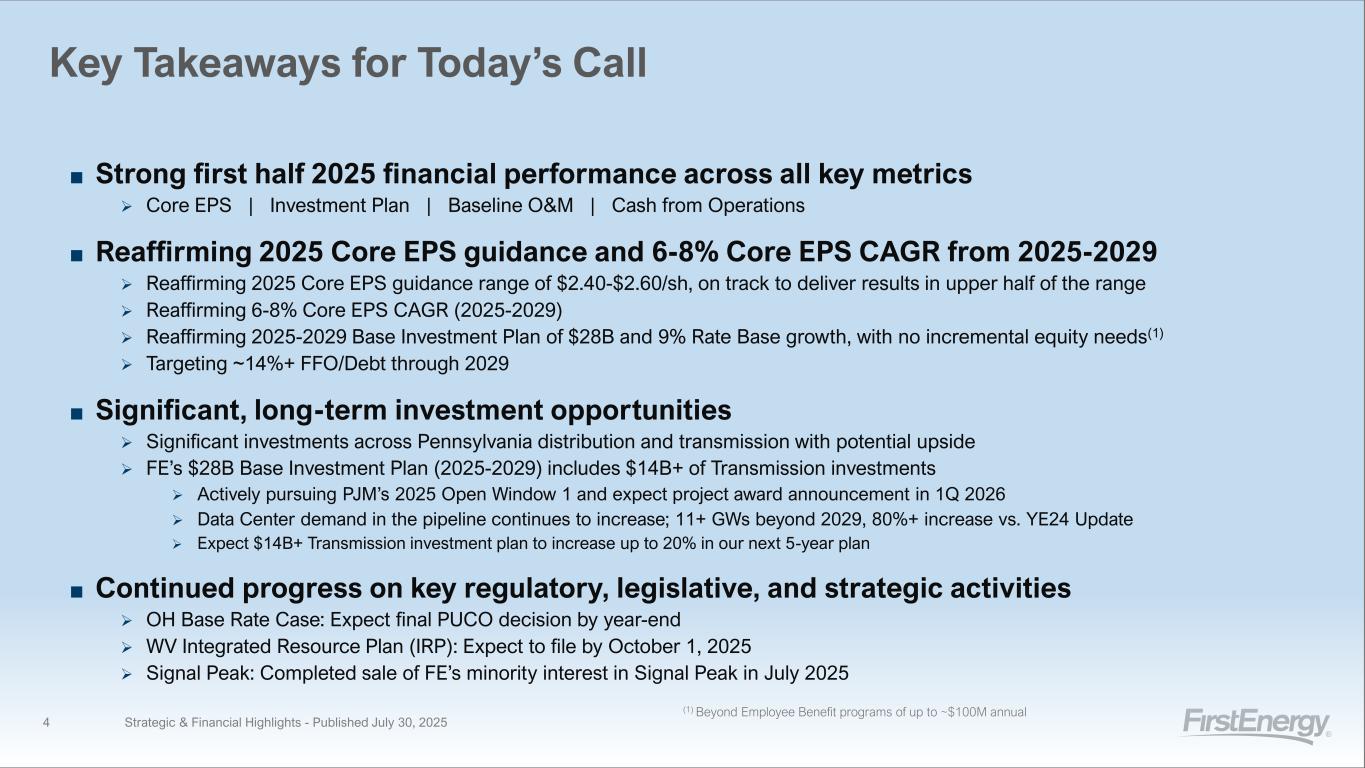
Key Takeaways for Today’s Call Strategic & Financial Highlights - Published July 30, 20254 ■ Strong first half 2025 financial performance across all key metrics ➢ Core EPS | Investment Plan | Baseline O&M | Cash from Operations ■ Reaffirming 2025 Core EPS guidance and 6-8% Core EPS CAGR from 2025-2029 ➢ Reaffirming 2025 Core EPS guidance range of $2.40-$2.60/sh, on track to deliver results in upper half of the range ➢ Reaffirming 6-8% Core EPS CAGR (2025-2029) ➢ Reaffirming 2025-2029 Base Investment Plan of $28B and 9% Rate Base growth, with no incremental equity needs(1) ➢ Targeting ~14%+ FFO/Debt through 2029 ■ Significant, long-term investment opportunities ➢ Significant investments across Pennsylvania distribution and transmission with potential upside ➢ FE’s $28B Base Investment Plan (2025-2029) includes $14B+ of Transmission investments ➢ Actively pursuing PJM’s 2025 Open Window 1 and expect project award announcement in 1Q 2026 ➢ Data Center demand in the pipeline continues to increase; 11+ GWs beyond 2029, 80%+ increase vs. YE24 Update ➢ Expect $14B+ Transmission investment plan to increase up to 20% in our next 5-year plan ■ Continued progress on key regulatory, legislative, and strategic activities ➢ OH Base Rate Case: Expect final PUCO decision by year-end ➢ WV Integrated Resource Plan (IRP): Expect to file by October 1, 2025 ➢ Signal Peak: Completed sale of FE’s minority interest in Signal Peak in July 2025 (1) Beyond Employee Benefit programs of up to ~$100M annual
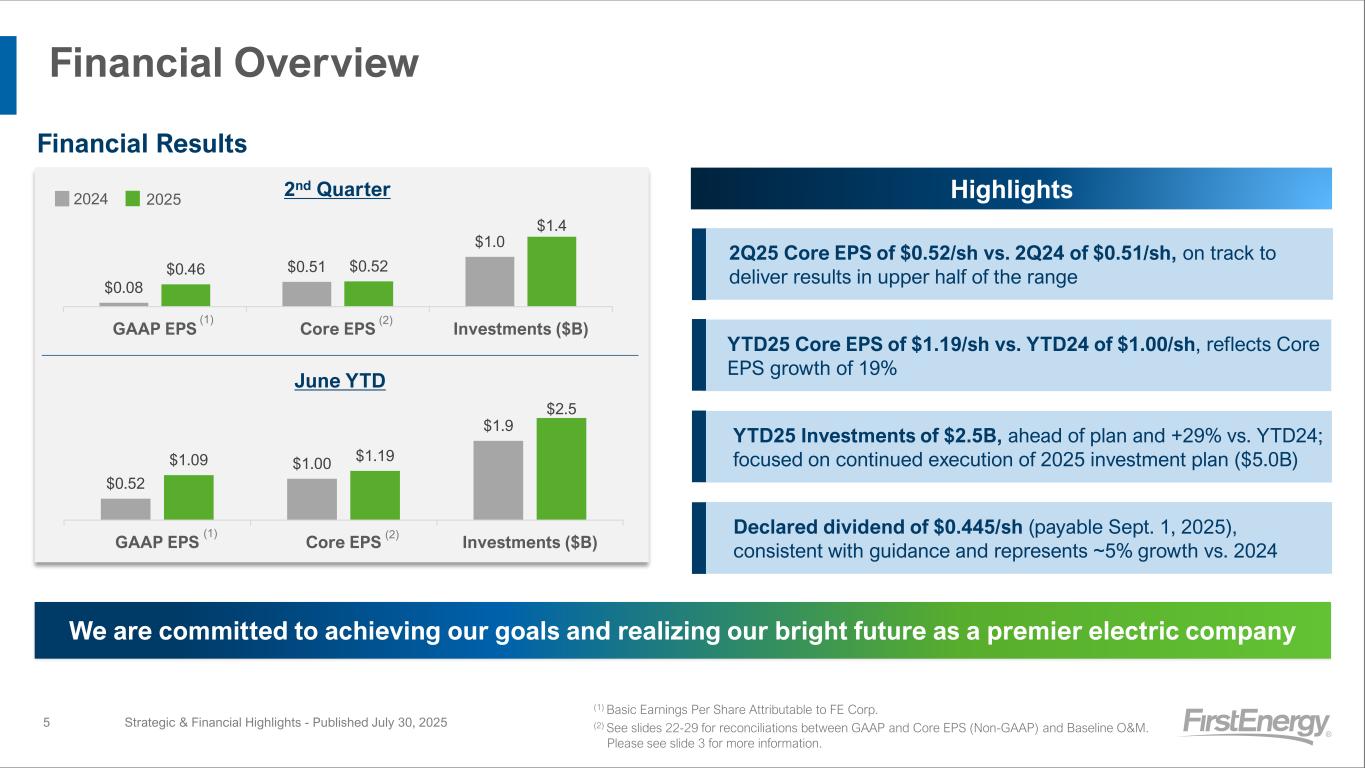
$0.08 $0.51 $1.0 $0.46 $0.52 $1.4 GAAP EPS Core EPS Investments ($B) Financial Overview Strategic & Financial Highlights - Published July 30, 20255 Highlights Financial Results 2Q25 Core EPS of $0.52/sh vs. 2Q24 of $0.51/sh, on track to deliver results in upper half of the range (1) Basic Earnings Per Share Attributable to FE Corp. (2) See slides 22-29 for reconciliations between GAAP and Core EPS (Non-GAAP) and Baseline O&M. Please see slide 3 for more information. (1) We are committed to achieving our goals and realizing our bright future as a premier electric company (2) Declared dividend of $0.445/sh (payable Sept. 1, 2025), consistent with guidance and represents ~5% growth vs. 2024 YTD25 Investments of $2.5B, ahead of plan and +29% vs. YTD24; focused on continued execution of 2025 investment plan ($5.0B) $0.52 $1.00 $1.9 $1.09 $1.19 $2.5 GAAP EPS Core EPS Investments ($B) 2nd Quarter June YTD 2025 (1) (2) 2024 YTD25 Core EPS of $1.19/sh vs. YTD24 of $1.00/sh, reflects Core EPS growth of 19%
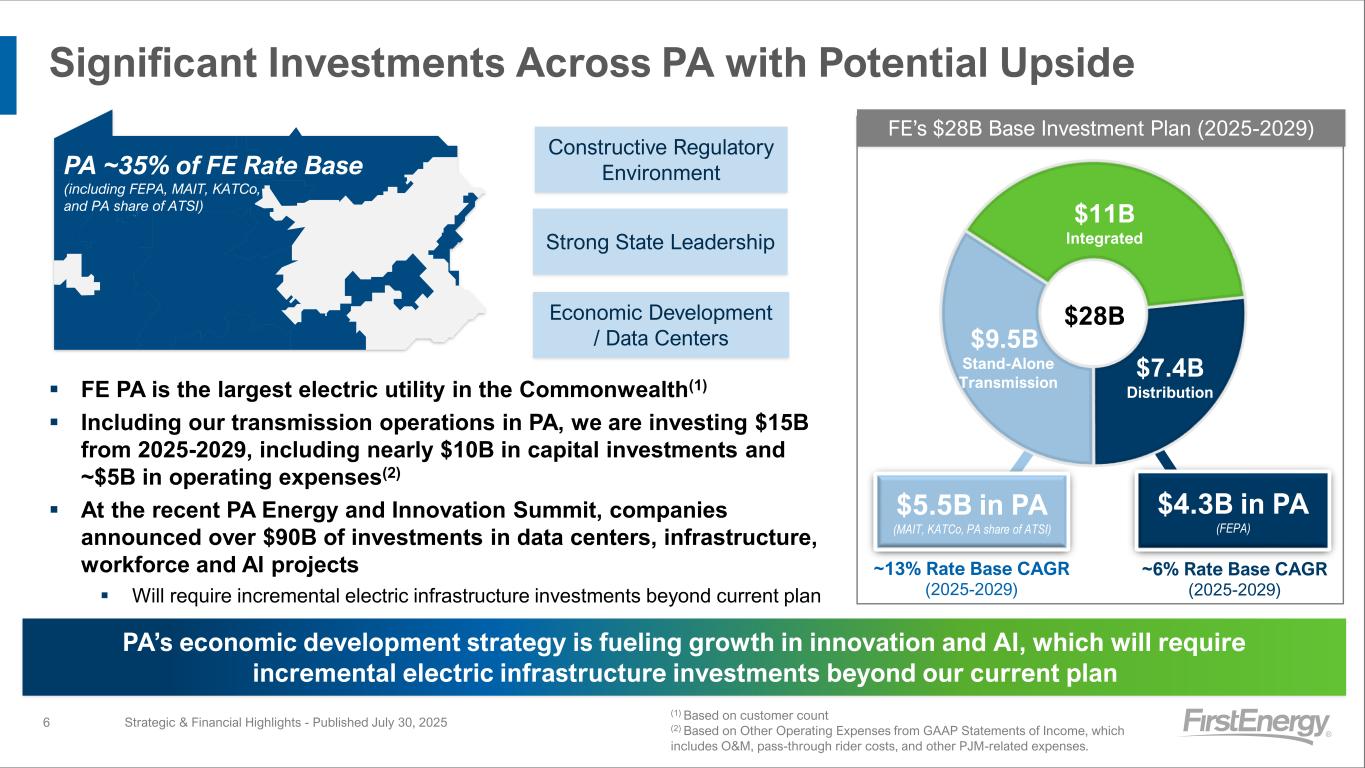
Significant Investments Across PA with Potential Upside Strategic & Financial Highlights - Published July 30, 20256 ▪ FE PA is the largest electric utility in the Commonwealth(1) ▪ Including our transmission operations in PA, we are investing $15B from 2025-2029, including nearly $10B in capital investments and ~$5B in operating expenses(2) ▪ At the recent PA Energy and Innovation Summit, companies announced over $90B of investments in data centers, infrastructure, workforce and AI projects ▪ Will require incremental electric infrastructure investments beyond current plan PA ~35% of FE Rate Base (including FEPA, MAIT, KATCo, and PA share of ATSI) $7.4B Distribution $9.5B Stand-Alone Transmission $11B Integrated Dx Tx Int $28B $5.5B in PA (MAIT, KATCo, PA share of ATSI) $4.3B in PA (FEPA) (1) Based on customer count (2) Based on Other Operating Expenses from GAAP Statements of Income, which includes O&M, pass-through rider costs, and other PJM-related expenses. ~13% Rate Base CAGR (2025-2029) FE’s $28B Base Investment Plan (2025-2029) ~6% Rate Base CAGR (2025-2029) Constructive Regulatory Environment Strong State Leadership Economic Development / Data Centers PA’s economic development strategy is fueling growth in innovation and AI, which will require incremental electric infrastructure investments beyond our current plan
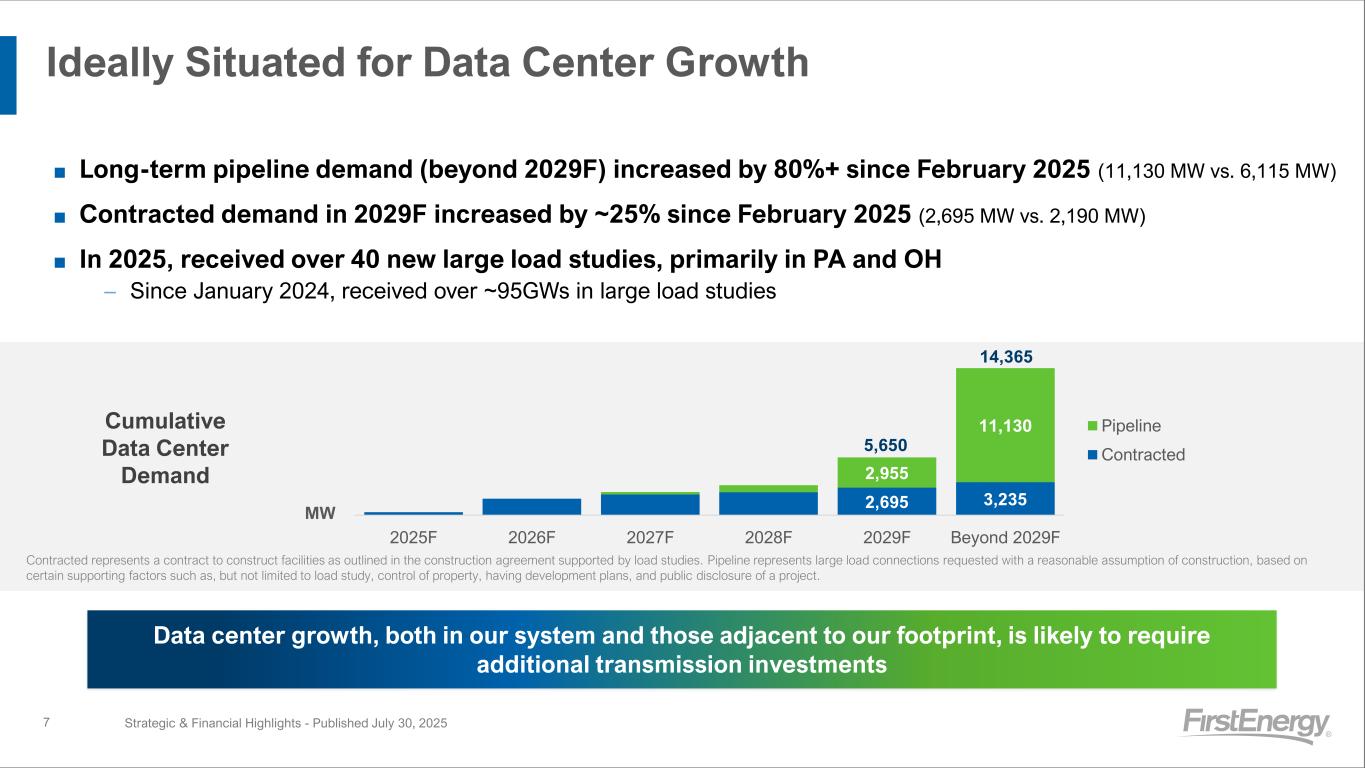
Ideally Situated for Data Center Growth Strategic & Financial Highlights - Published July 30, 20257 2,695 3,235 2,955 11,130 2025F 2026F 2027F 2028F 2029F Beyond 2029F Pipeline Contracted 5,650 14,365 MW Contracted represents a contract to construct facilities as outlined in the construction agreement supported by load studies. Pipeline represents large load connections requested with a reasonable assumption of construction, based on certain supporting factors such as, but not limited to load study, control of property, having development plans, and public disclosure of a project. ■ Long-term pipeline demand (beyond 2029F) increased by 80%+ since February 2025 (11,130 MW vs. 6,115 MW) ■ Contracted demand in 2029F increased by ~25% since February 2025 (2,695 MW vs. 2,190 MW) ■ In 2025, received over 40 new large load studies, primarily in PA and OH – Since January 2024, received over ~95GWs in large load studies Cumulative Data Center Demand Data center growth, both in our system and those adjacent to our footprint, is likely to require additional transmission investments
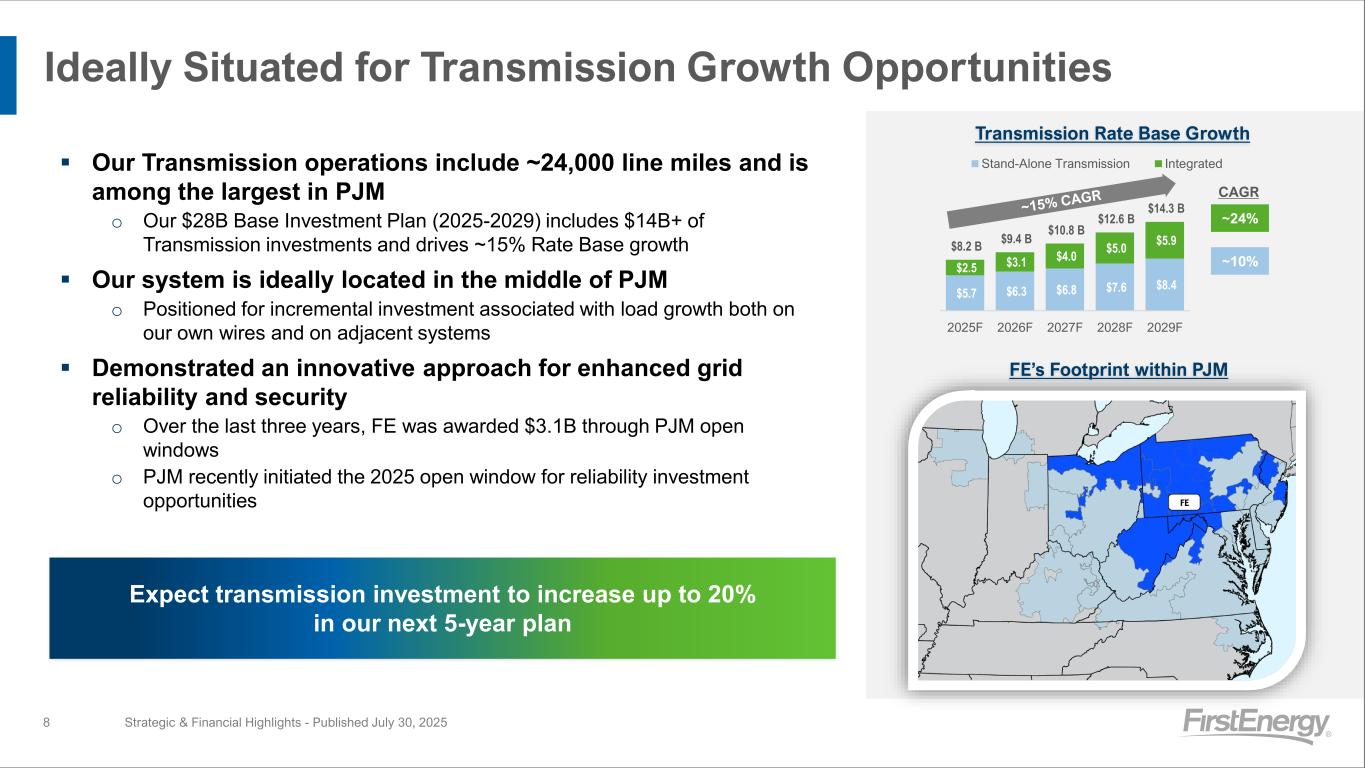
Strategic & Financial Highlights - Published July 30, 20258 ▪ Our Transmission operations include ~24,000 line miles and is among the largest in PJM o Our $28B Base Investment Plan (2025-2029) includes $14B+ of Transmission investments and drives ~15% Rate Base growth ▪ Our system is ideally located in the middle of PJM o Positioned for incremental investment associated with load growth both on our own wires and on adjacent systems ▪ Demonstrated an innovative approach for enhanced grid reliability and security o Over the last three years, FE was awarded $3.1B through PJM open windows o PJM recently initiated the 2025 open window for reliability investment opportunities Expect transmission investment to increase up to 20% in our next 5-year plan Ideally Situated for Transmission Growth Opportunities FE’s Footprint within PJM $5.7 $6.3 $6.8 $7.6 $8.4 $2.5 $3.1 $4.0 $5.0 $5.9 $8.2 B $9.4 B $10.8 B $12.6 B $14.3 B 2025F 2026F 2027F 2028F 2029F Stand-Alone Transmission Integrated ~10% ~24% CAGR Transmission Rate Base Growth
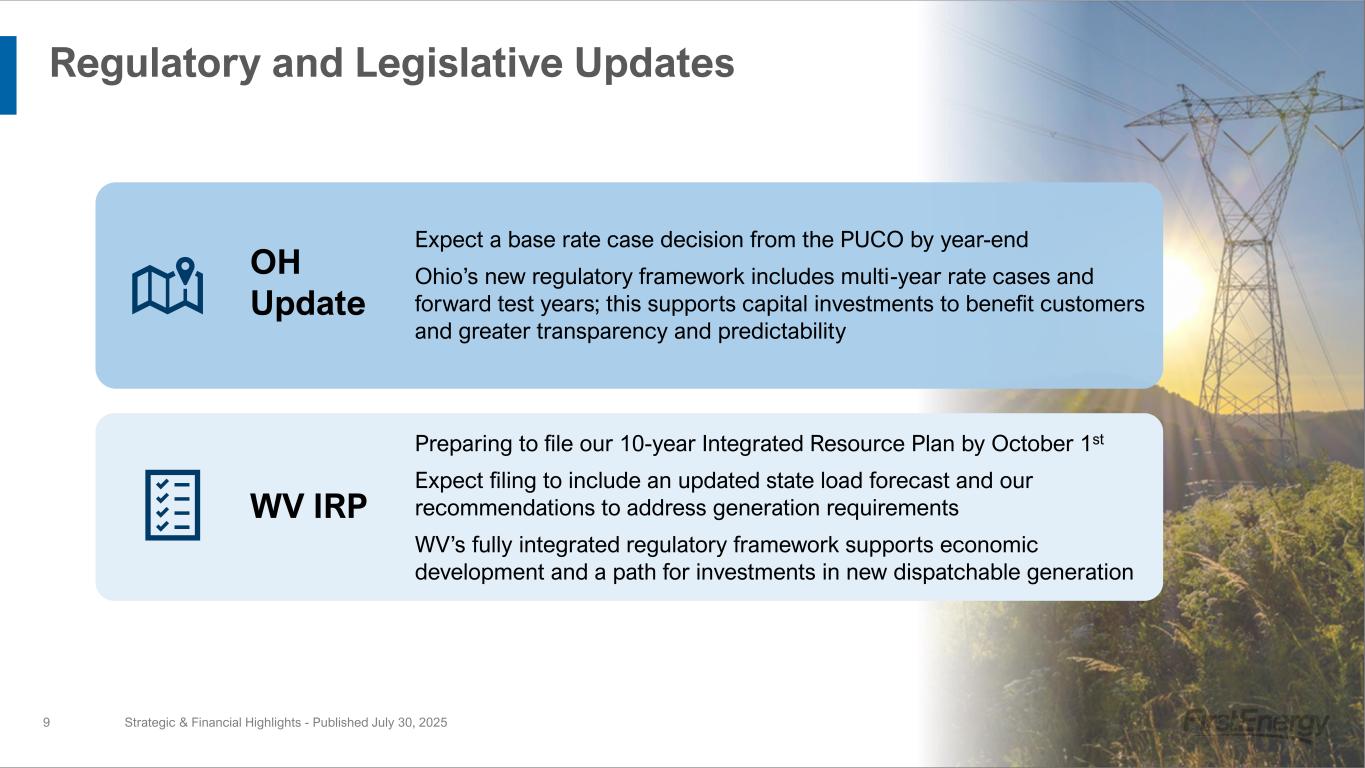
Regulatory and Legislative Updates Strategic & Financial Highlights - Published July 30, 20259 WV IRP Preparing to file our 10-year Integrated Resource Plan by October 1st Expect filing to include an updated state load forecast and our recommendations to address generation requirements WV’s fully integrated regulatory framework supports economic development and a path for investments in new dispatchable generation OH Update Expect a base rate case decision from the PUCO by year-end Ohio’s new regulatory framework includes multi-year rate cases and forward test years; this supports capital investments to benefit customers and greater transparency and predictability
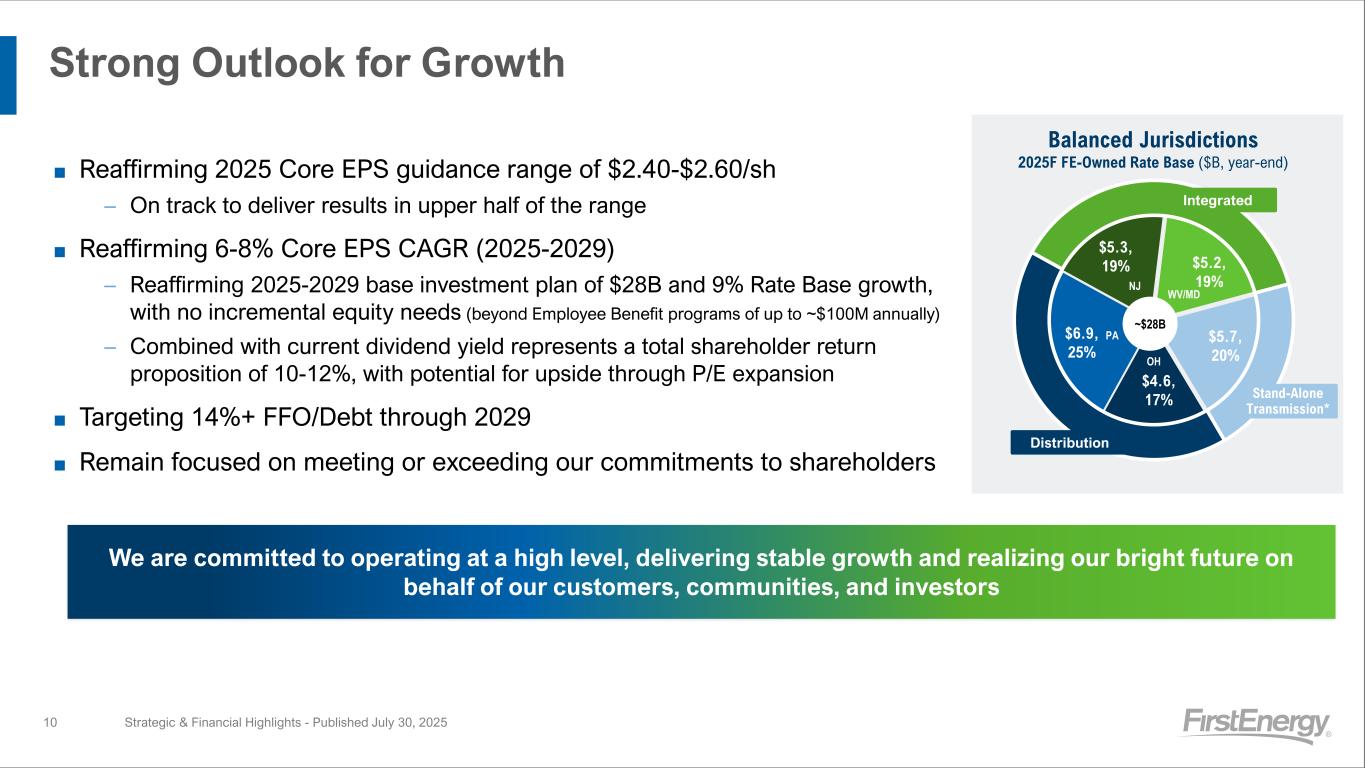
Strong Outlook for Growth ■ Reaffirming 2025 Core EPS guidance range of $2.40-$2.60/sh – On track to deliver results in upper half of the range ■ Reaffirming 6-8% Core EPS CAGR (2025-2029) – Reaffirming 2025-2029 base investment plan of $28B and 9% Rate Base growth, with no incremental equity needs (beyond Employee Benefit programs of up to ~$100M annually) – Combined with current dividend yield represents a total shareholder return proposition of 10-12%, with potential for upside through P/E expansion ■ Targeting 14%+ FFO/Debt through 2029 ■ Remain focused on meeting or exceeding our commitments to shareholders Strategic & Financial Highlights - Published July 30, 202510 $4.6, 17% $6.9, 25% $5.3, 19% $5.2, 19% $5.7, 20%OH PA NJ WV/MD Balanced Jurisdictions 2025F FE-Owned Rate Base ($B, year-end) Stand-Alone Transmission* Integrated Distribution ~$28B We are committed to operating at a high level, delivering stable growth and realizing our bright future on behalf of our customers, communities, and investors
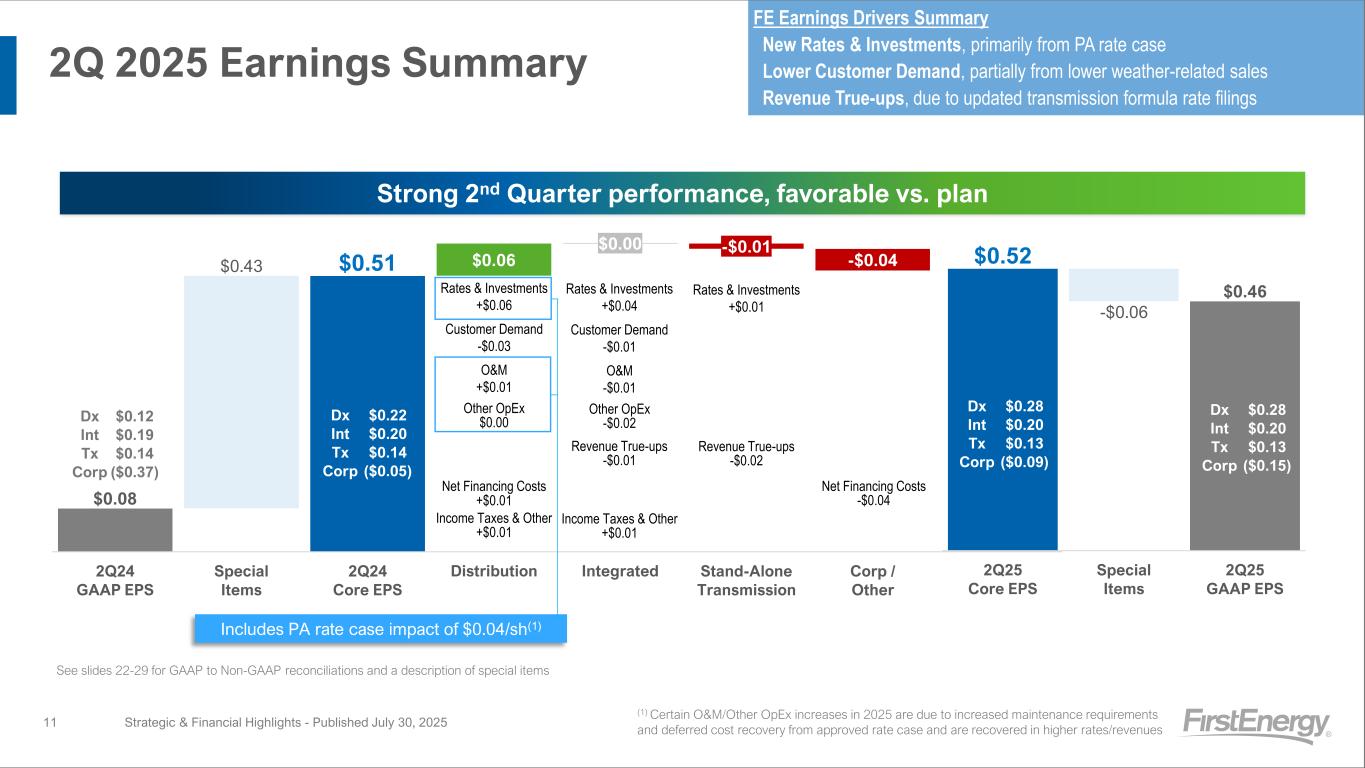
2Q 2025 Earnings Summary Strategic & Financial Highlights - Published July 30, 2025 $0.43 $0.08 $0.51 $0.06 $0.00 -$0.01 -$0.04 2Q24 GAAP EPS Special Items 2Q24 Core EPS Distribution Integrated Stand-Alone Transmission Corp / Other $0.52 -$0.06 $0.46 2Q25 Core EPS Special Items 2Q25 GAAP EPS Dx $0.12 Int $0.19 Tx $0.14 Corp ($0.37) Rates & Investments +$0.01 Revenue True-ups -$0.02 Net Financing Costs -$0.04 Dx $0.22 Int $0.20 Tx $0.14 Corp ($0.05) Dx $0.28 Int $0.20 Tx $0.13 Corp ($0.09) Rates & Investments +$0.06 Customer Demand -$0.03 O&M +$0.01 Other OpEx $0.00 Net Financing Costs +$0.01 Income Taxes & Other +$0.01 Rates & Investments +$0.04 Customer Demand -$0.01 O&M -$0.01 Other OpEx -$0.02 Revenue True-ups -$0.01 Income Taxes & Other +$0.01 See slides 22-29 for GAAP to Non-GAAP reconciliations and a description of special items Dx $0.28 Int $0.20 Tx $0.13 Corp ($0.15) FE Earnings Drivers Summary New Rates & Investments, primarily from PA rate case Lower Customer Demand, partially from lower weather-related sales Revenue True-ups, due to updated transmission formula rate filings Strong 2nd Quarter performance, favorable vs. plan Includes PA rate case impact of $0.04/sh(1) (1) Certain O&M/Other OpEx increases in 2025 are due to increased maintenance requirements and deferred cost recovery from approved rate case and are recovered in higher rates/revenues 11
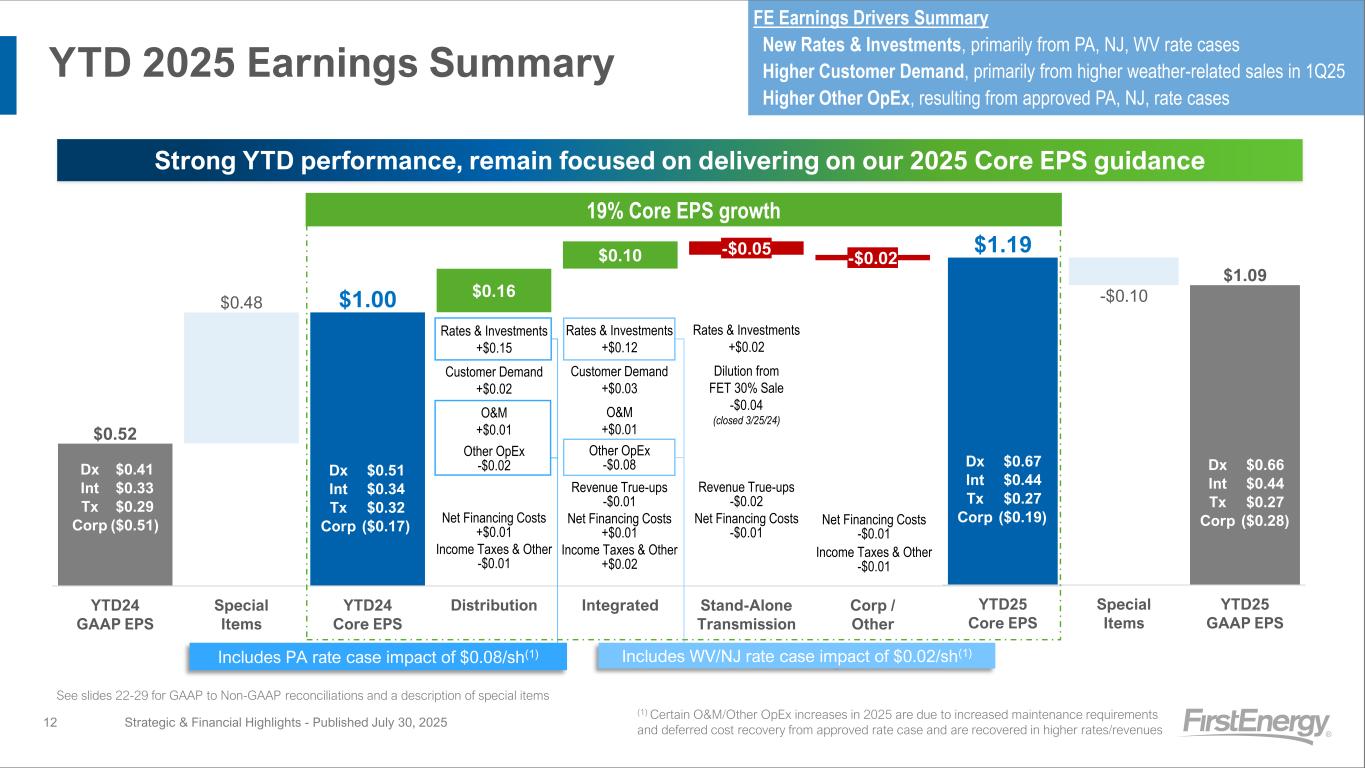
YTD 2025 Earnings Summary Strategic & Financial Highlights - Published July 30, 2025 $0.48 $0.52 $1.00 $0.16 $0.10 -$0.05 -$0.02 YTD24 GAAP EPS Special Items YTD24 Core EPS Distribution Integrated Stand-Alone Transmission Corp / Other $1.19 -$0.10 $1.09 YTD25 Core EPS Special Items YTD25 GAAP EPS Dx $0.41 Int $0.33 Tx $0.29 Corp ($0.51) Rates & Investments +$0.02 Dilution from FET 30% Sale -$0.04 (closed 3/25/24) Revenue True-ups -$0.02 Net Financing Costs -$0.01 Net Financing Costs -$0.01 Income Taxes & Other -$0.01 Dx $0.51 Int $0.34 Tx $0.32 Corp ($0.17) Dx $0.67 Int $0.44 Tx $0.27 Corp ($0.19) 19% Core EPS growth Rates & Investments +$0.15 Customer Demand +$0.02 O&M +$0.01 Other OpEx -$0.02 Net Financing Costs +$0.01 Income Taxes & Other -$0.01 Rates & Investments +$0.12 Customer Demand +$0.03 O&M +$0.01 Other OpEx -$0.08 Revenue True-ups -$0.01 Net Financing Costs +$0.01 Income Taxes & Other +$0.02 Dx $0.66 Int $0.44 Tx $0.27 Corp ($0.28) Strong YTD performance, remain focused on delivering on our 2025 Core EPS guidance Includes PA rate case impact of $0.08/sh(1) Includes WV/NJ rate case impact of $0.02/sh(1) 12 FE Earnings Drivers Summary New Rates & Investments, primarily from PA, NJ, WV rate cases Higher Customer Demand, primarily from higher weather-related sales in 1Q25 Higher Other OpEx, resulting from approved PA, NJ, rate cases See slides 22-29 for GAAP to Non-GAAP reconciliations and a description of special items (1) Certain O&M/Other OpEx increases in 2025 are due to increased maintenance requirements and deferred cost recovery from approved rate case and are recovered in higher rates/revenues
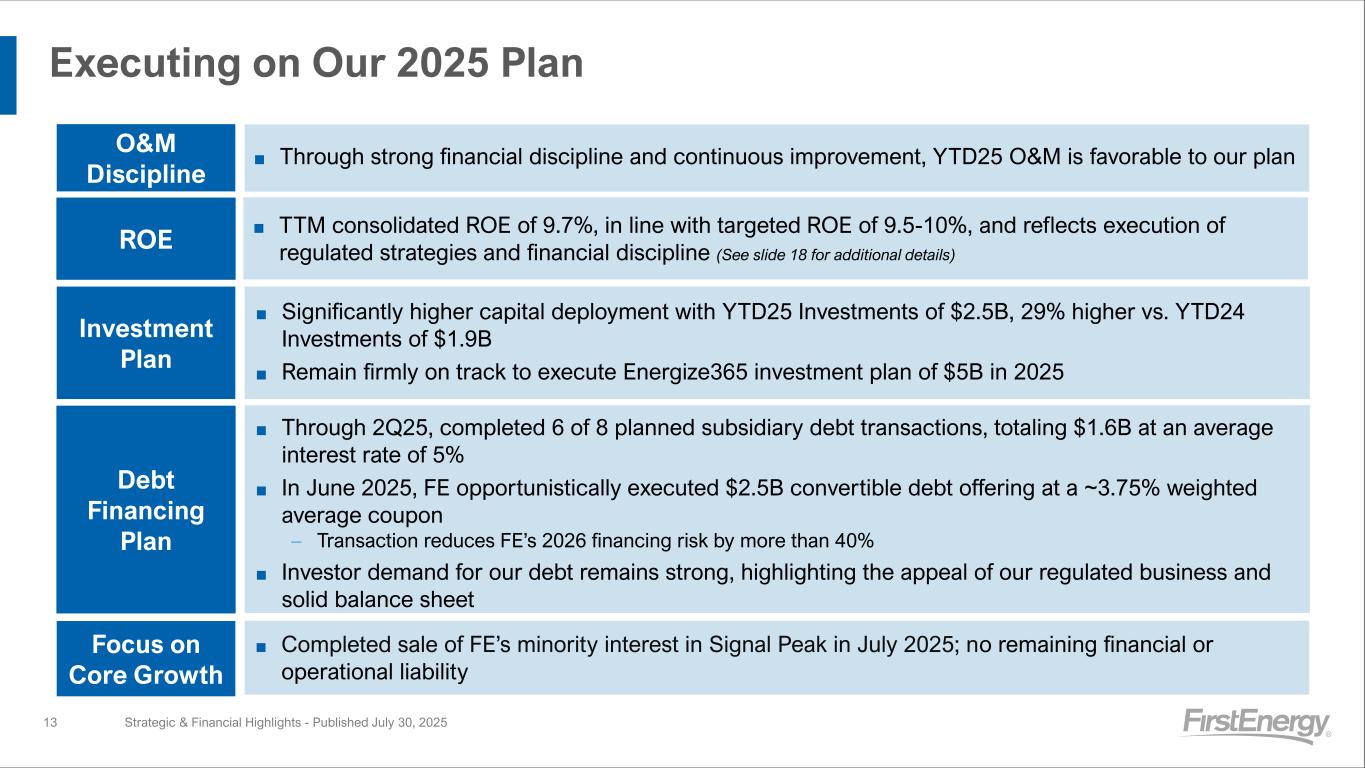
Executing on Our 2025 Plan ■ Through 2Q25, completed 6 of 8 planned subsidiary debt transactions, totaling $1.6B at an average interest rate of 5% ■ In June 2025, FE opportunistically executed $2.5B convertible debt offering at a ~3.75% weighted average coupon – Transaction reduces FE’s 2026 financing risk by more than 40% ■ Investor demand for our debt remains strong, highlighting the appeal of our regulated business and solid balance sheet Strategic & Financial Highlights - Published July 30, 202513 ■ Through strong financial discipline and continuous improvement, YTD25 O&M is favorable to our plan ■ Significantly higher capital deployment with YTD25 Investments of $2.5B, 29% higher vs. YTD24 Investments of $1.9B ■ Remain firmly on track to execute Energize365 investment plan of $5B in 2025 Investment Plan Debt Financing Plan O&M Discipline ROE ■ TTM consolidated ROE of 9.7%, in line with targeted ROE of 9.5-10%, and reflects execution of regulated strategies and financial discipline (See slide 18 for additional details) Focus on Core Growth ■ Completed sale of FE’s minority interest in Signal Peak in July 2025; no remaining financial or operational liability
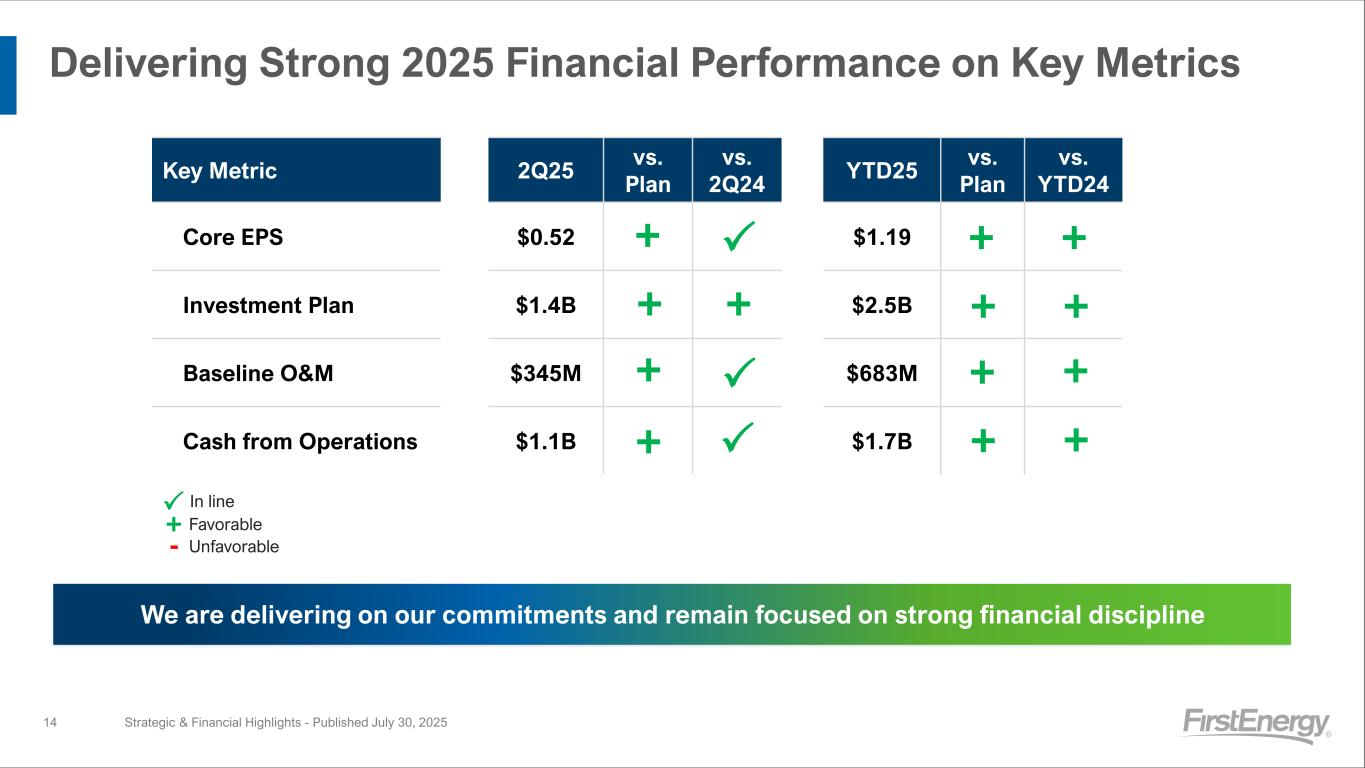
Delivering Strong 2025 Financial Performance on Key Metrics Strategic & Financial Highlights - Published July 30, 2025 We are delivering on our commitments and remain focused on strong financial discipline Key Metric 2Q25 vs. Plan vs. 2Q24 YTD25 vs. Plan vs. YTD24 Core EPS $0.52 $1.19 Investment Plan $1.4B $2.5B Baseline O&M $345M $683M Cash from Operations $1.1B $1.7B + + In line Favorable + + + + + + + + + ++ 14 - Unfavorable +
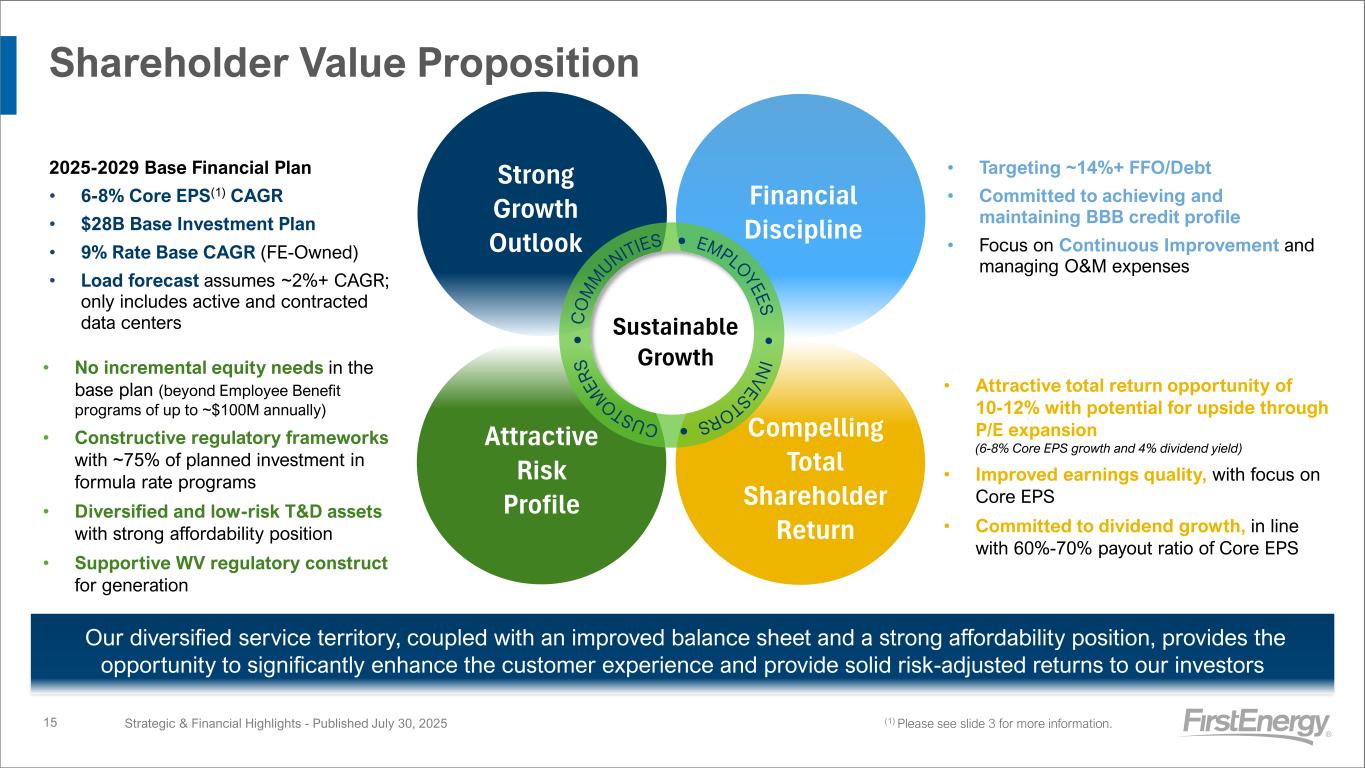
Shareholder Value Proposition Strategic & Financial Highlights - Published July 30, 202515 (1) Please see slide 3 for more information. • Targeting ~14%+ FFO/Debt • Committed to achieving and maintaining BBB credit profile • Focus on Continuous Improvement and managing O&M expenses • Attractive total return opportunity of 10-12% with potential for upside through P/E expansion (6-8% Core EPS growth and 4% dividend yield) • Improved earnings quality, with focus on Core EPS • Committed to dividend growth, in line with 60%-70% payout ratio of Core EPS 2025-2029 Base Financial Plan • 6-8% Core EPS(1) CAGR • $28B Base Investment Plan • 9% Rate Base CAGR (FE-Owned) • Load forecast assumes ~2%+ CAGR; only includes active and contracted data centers • No incremental equity needs in the base plan (beyond Employee Benefit programs of up to ~$100M annually) • Constructive regulatory frameworks with ~75% of planned investment in formula rate programs • Diversified and low-risk T&D assets with strong affordability position • Supportive WV regulatory construct for generation Financial Discipline Compelling Total Shareholder Return Attractive Risk Profile Strong Growth Outlook Sustainable Growth Our diversified service territory, coupled with an improved balance sheet and a strong affordability position, provides the opportunity to significantly enhance the customer experience and provide solid risk-adjusted returns to our investors IN V E STORS•CUSTO M E R S • C O M M U NITIES • EMPLO Y E E S •
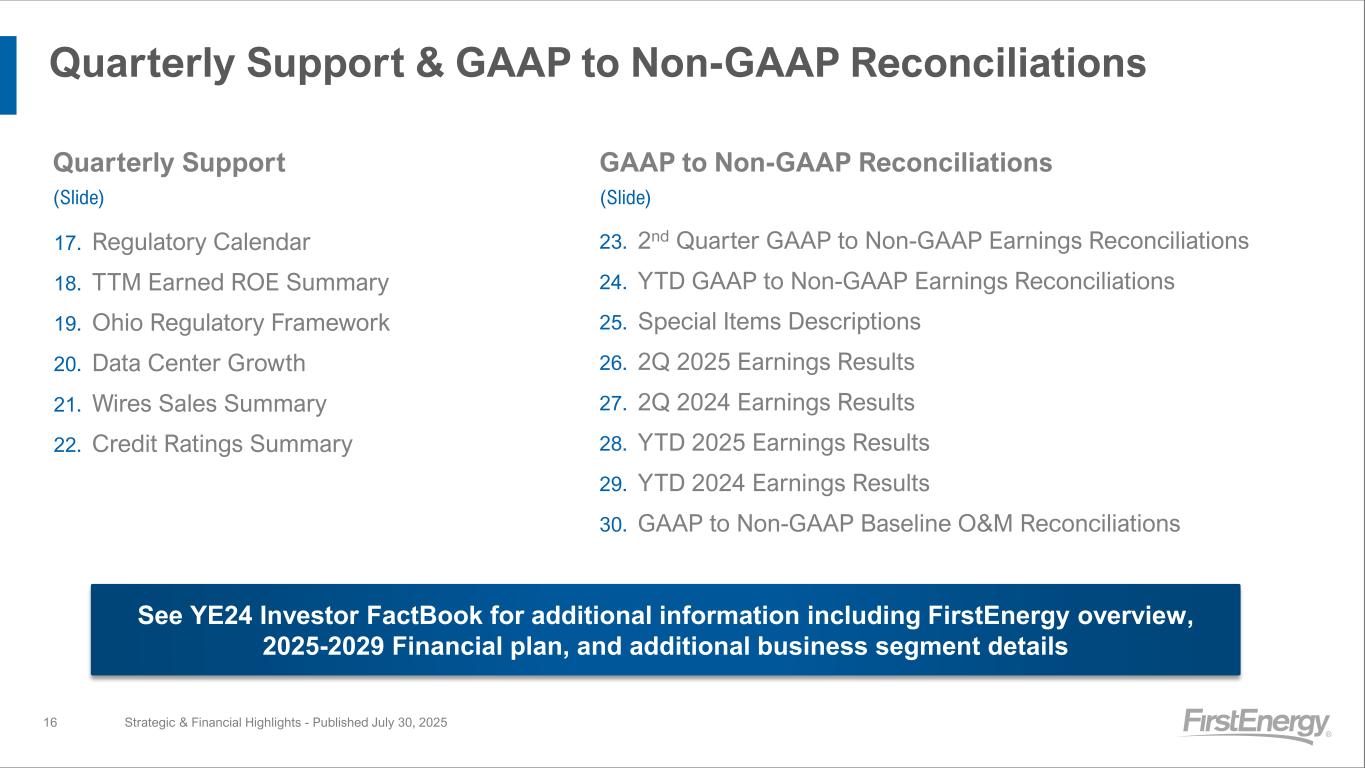
Quarterly Support & GAAP to Non-GAAP Reconciliations Strategic & Financial Highlights - Published July 30, 2025 17. Regulatory Calendar 18. TTM Earned ROE Summary 19. Ohio Regulatory Framework 20. Data Center Growth 21. Wires Sales Summary 22. Credit Ratings Summary Quarterly Support (Slide) 16 See YE24 Investor FactBook for additional information including FirstEnergy overview, 2025-2029 Financial plan, and additional business segment details 23. 2nd Quarter GAAP to Non-GAAP Earnings Reconciliations 24. YTD GAAP to Non-GAAP Earnings Reconciliations 25. Special Items Descriptions 26. 2Q 2025 Earnings Results 27. 2Q 2024 Earnings Results 28. YTD 2025 Earnings Results 29. YTD 2024 Earnings Results 30. GAAP to Non-GAAP Baseline O&M Reconciliations GAAP to Non-GAAP Reconciliations (Slide)
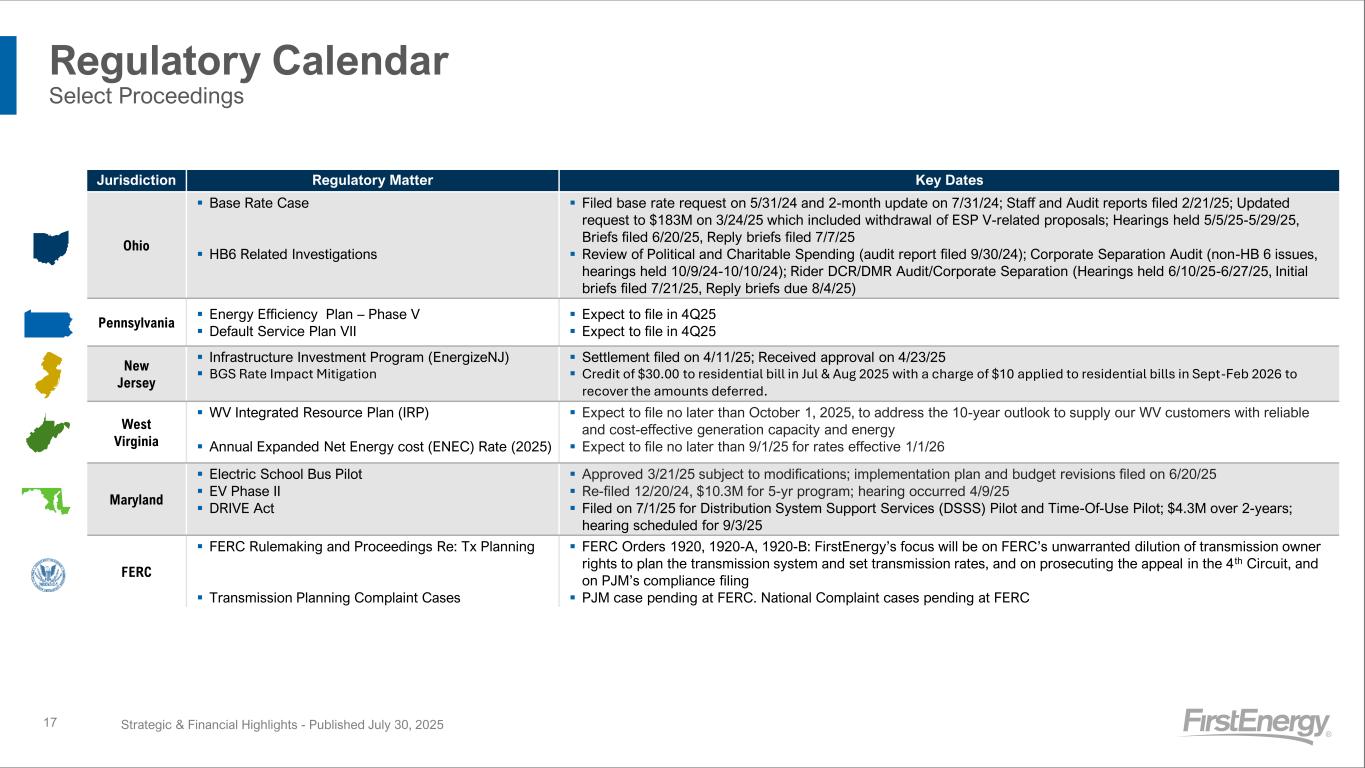
Jurisdiction Regulatory Matter Key Dates Ohio ▪ Base Rate Case ▪ HB6 Related Investigations ▪ Filed base rate request on 5/31/24 and 2-month update on 7/31/24; Staff and Audit reports filed 2/21/25; Updated request to $183M on 3/24/25 which included withdrawal of ESP V-related proposals; Hearings held 5/5/25-5/29/25, Briefs filed 6/20/25, Reply briefs filed 7/7/25 ▪ Review of Political and Charitable Spending (audit report filed 9/30/24); Corporate Separation Audit (non-HB 6 issues, hearings held 10/9/24-10/10/24); Rider DCR/DMR Audit/Corporate Separation (Hearings held 6/10/25-6/27/25, Initial briefs filed 7/21/25, Reply briefs due 8/4/25) Pennsylvania ▪ Energy Efficiency Plan – Phase V ▪ Default Service Plan VII ▪ Expect to file in 4Q25 ▪ Expect to file in 4Q25 New Jersey ▪ Infrastructure Investment Program (EnergizeNJ) ▪ BGS Rate Impact Mitigation ▪ Settlement filed on 4/11/25; Received approval on 4/23/25 ▪ Credit of $30.00 to residential bill in Jul & Aug 2025 with a charge of $10 applied to residential bills in Sept-Feb 2026 to recover the amounts deferred. West Virginia ▪ WV Integrated Resource Plan (IRP) ▪ Annual Expanded Net Energy cost (ENEC) Rate (2025) ▪ Expect to file no later than October 1, 2025, to address the 10-year outlook to supply our WV customers with reliable and cost-effective generation capacity and energy ▪ Expect to file no later than 9/1/25 for rates effective 1/1/26 Maryland ▪ Electric School Bus Pilot ▪ EV Phase II ▪ DRIVE Act ▪ Approved 3/21/25 subject to modifications; implementation plan and budget revisions filed on 6/20/25 ▪ Re-filed 12/20/24, $10.3M for 5-yr program; hearing occurred 4/9/25 ▪ Filed on 7/1/25 for Distribution System Support Services (DSSS) Pilot and Time-Of-Use Pilot; $4.3M over 2-years; hearing scheduled for 9/3/25 FERC ▪ FERC Rulemaking and Proceedings Re: Tx Planning ▪ Transmission Planning Complaint Cases ▪ FERC Orders 1920, 1920-A, 1920-B: FirstEnergy’s focus will be on FERC’s unwarranted dilution of transmission owner rights to plan the transmission system and set transmission rates, and on prosecuting the appeal in the 4th Circuit, and on PJM’s compliance filing ▪ PJM case pending at FERC. National Complaint cases pending at FERC Regulatory Calendar Select Proceedings Strategic & Financial Highlights - Published July 30, 202517
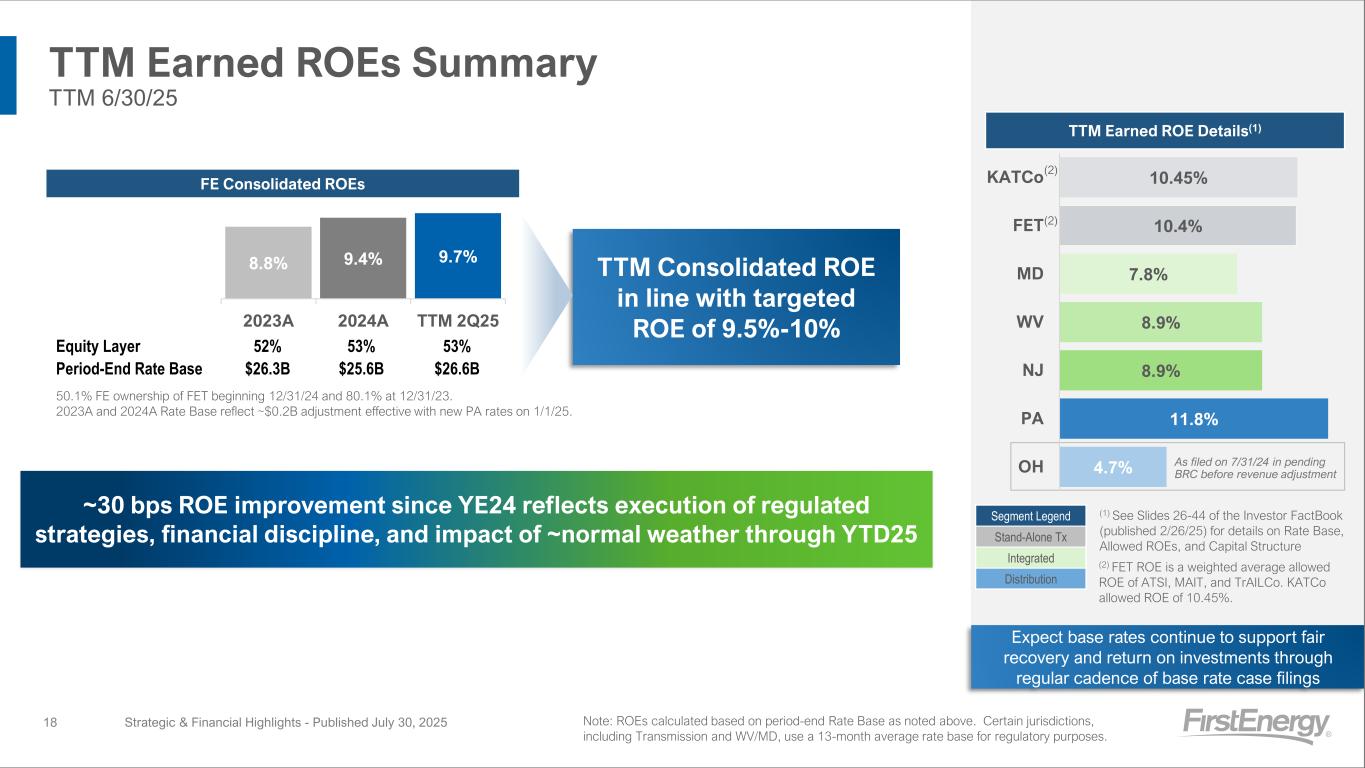
TTM Earned ROEs Summary TTM 6/30/25 Strategic & Financial Highlights - Published July 30, 202518 8.8% 9.4% 9.7% 2023A 2024A TTM 2Q25 TTM Consolidated ROE in line with targeted ROE of 9.5%-10% Segment Legend Stand-Alone Tx Integrated Distribution Equity Layer 52% 53% 53% Period-End Rate Base $26.3B $25.6B $26.6B 4.7% 11.8% 8.9% 8.9% 7.8% 10.4% 10.45% OH PA NJ WV MD FET KATCo As filed on 7/31/24 in pending BRC before revenue adjustment FE Consolidated ROEs TTM Earned ROE Details(1) Expect base rates continue to support fair recovery and return on investments through regular cadence of base rate case filings (1) See Slides 26-44 of the Investor FactBook (published 2/26/25) for details on Rate Base, Allowed ROEs, and Capital Structure (2) FET ROE is a weighted average allowed ROE of ATSI, MAIT, and TrAILCo. KATCo allowed ROE of 10.45%. (2) 50.1% FE ownership of FET beginning 12/31/24 and 80.1% at 12/31/23. 2023A and 2024A Rate Base reflect ~$0.2B adjustment effective with new PA rates on 1/1/25. Note: ROEs calculated based on period-end Rate Base as noted above. Certain jurisdictions, including Transmission and WV/MD, use a 13-month average rate base for regulatory purposes. ~30 bps ROE improvement since YE24 reflects execution of regulated strategies, financial discipline, and impact of ~normal weather through YTD25 (2)
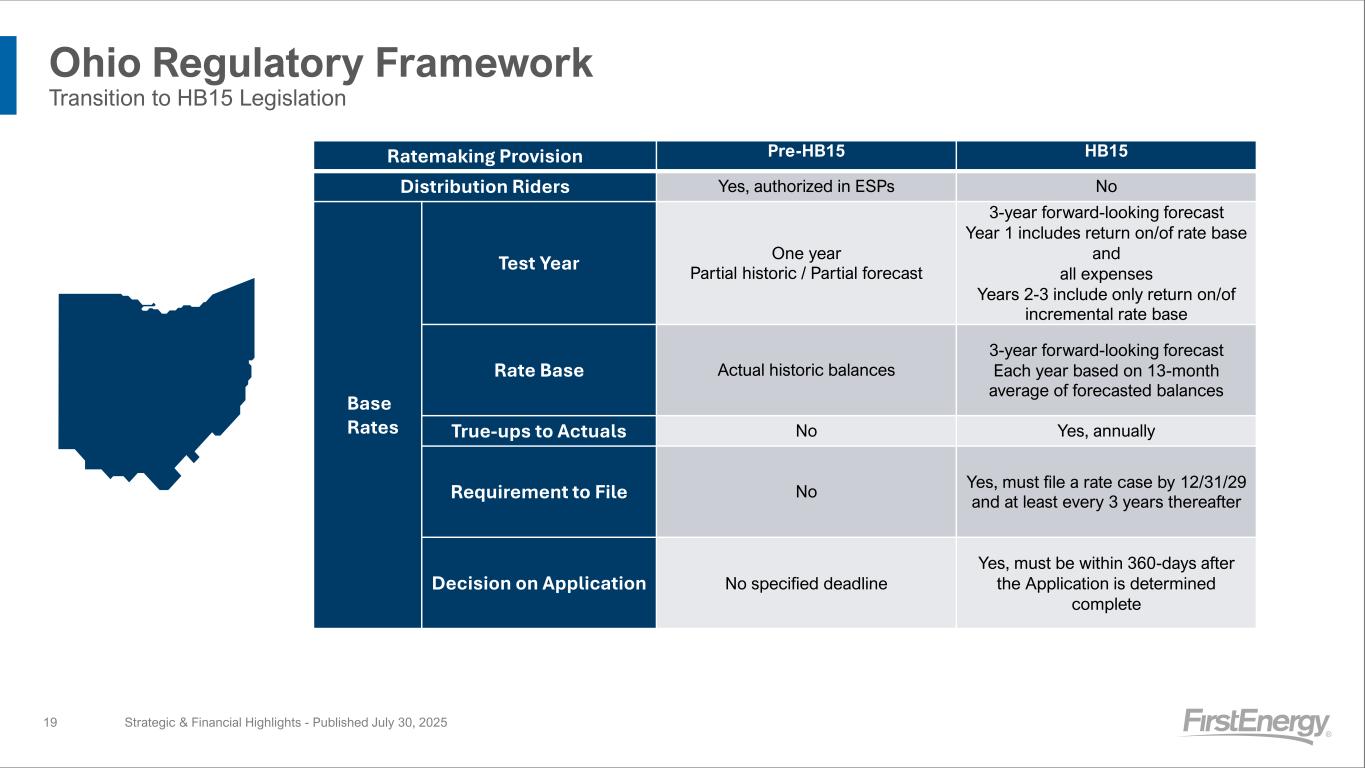
Ohio Regulatory Framework Transition to HB15 Legislation Strategic & Financial Highlights - Published July 30, 202519 Ratemaking Provision Pre-HB15 HB15 Distribution Riders Yes, authorized in ESPs No Base Rates Test Year One year Partial historic / Partial forecast 3-year forward-looking forecast Year 1 includes return on/of rate base and all expenses Years 2-3 include only return on/of incremental rate base Rate Base Actual historic balances 3-year forward-looking forecast Each year based on 13-month average of forecasted balances True-ups to Actuals No Yes, annually Requirement to File No Yes, must file a rate case by 12/31/29 and at least every 3 years thereafter Decision on Application No specified deadline Yes, must be within 360-days after the Application is determined complete
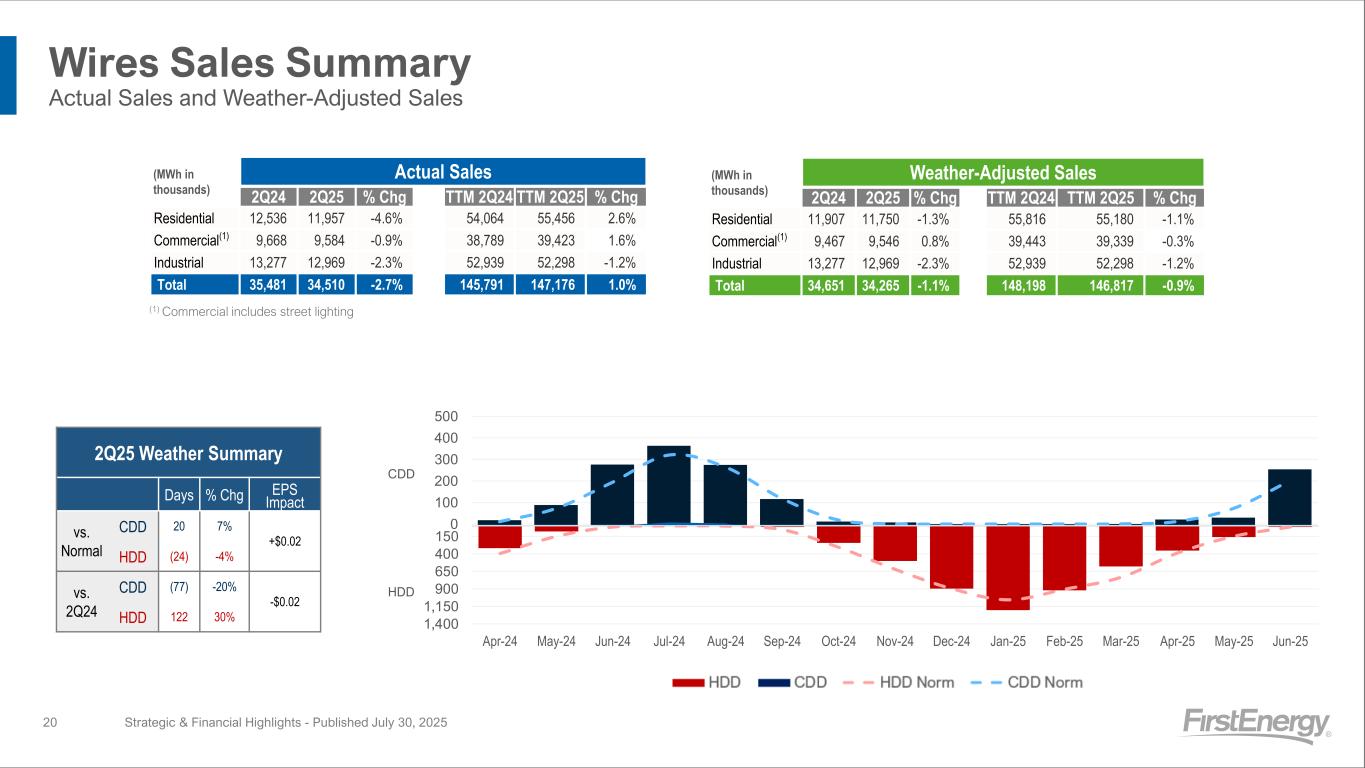
Wires Sales Summary Actual Sales and Weather-Adjusted Sales (1) Commercial includes street lighting Strategic & Financial Highlights - Published July 30, 202520 (MWh in thousands) Actual Sales 2Q24 2Q25 % Chg TTM 2Q24 TTM 2Q25 % Chg Residential 12,536 11,957 -4.6% 54,064 55,456 2.6% Commercial(1) 9,668 9,584 -0.9% 38,789 39,423 1.6% Industrial 13,277 12,969 -2.3% 52,939 52,298 -1.2% Total 35,481 34,510 -2.7% 145,791 147,176 1.0% (MWh in thousands) Weather-Adjusted Sales 2Q24 2Q25 % Chg TTM 2Q24 TTM 2Q25 % Chg Residential 11,907 11,750 -1.3% 55,816 55,180 -1.1% Commercial(1) 9,467 9,546 0.8% 39,443 39,339 -0.3% Industrial 13,277 12,969 -2.3% 52,939 52,298 -1.2% Total 34,651 34,265 -1.1% 148,198 146,817 -0.9% CDD 0 100 200 300 400 500 1,400 1,150 900 650 400 150 Apr-24 May-24 Jun-24 Jul-24 Aug-24 Sep-24 Oct-24 Nov-24 Dec-24 Jan-25 Feb-25 Mar-25 Apr-25 May-25 Jun-25 HDD 2Q25 Weather Summary Days % Chg EPS Impact vs. Normal CDD 20 7% +$0.02 HDD (24) -4% vs. 2Q24 CDD (77) -20% -$0.02 HDD 122 30%
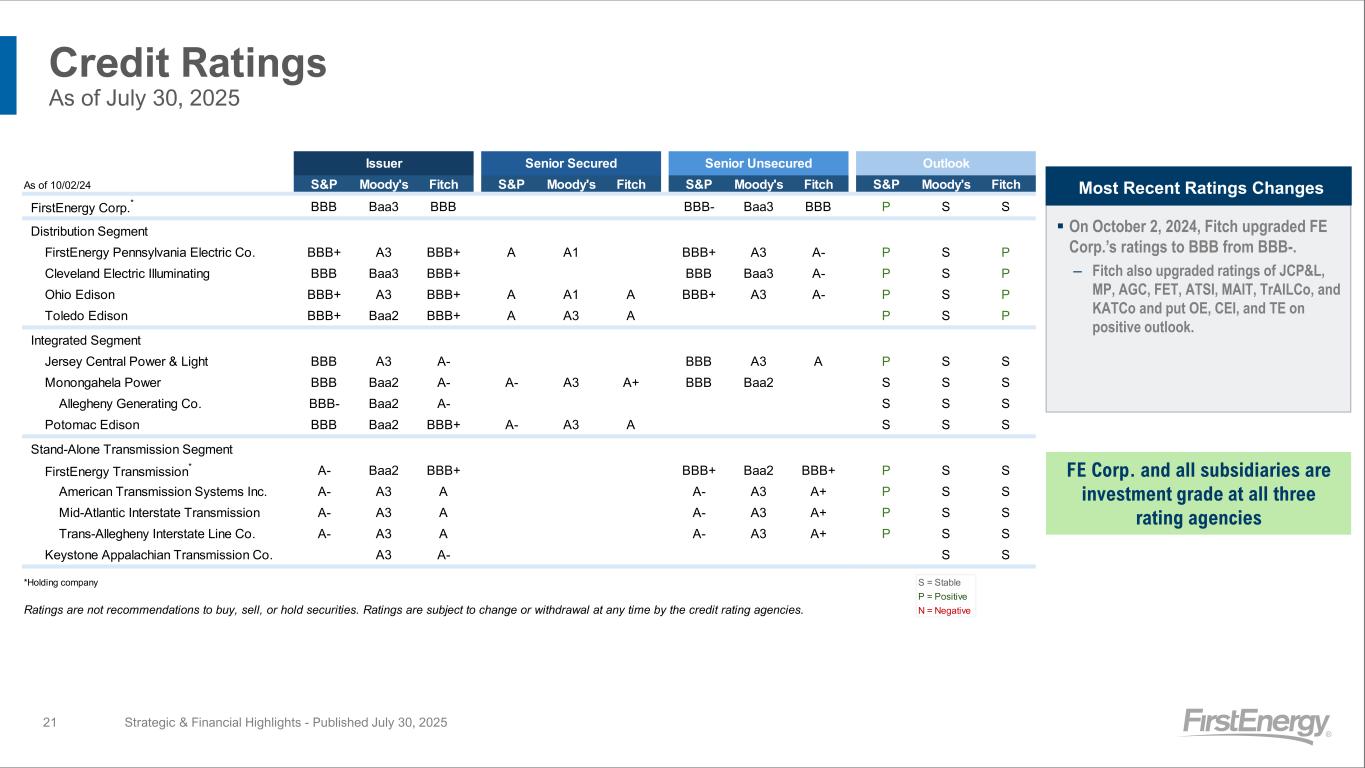
▪ On October 2, 2024, Fitch upgraded FE Corp.’s ratings to BBB from BBB-. ‒ Fitch also upgraded ratings of JCP&L, MP, AGC, FET, ATSI, MAIT, TrAILCo, and KATCo and put OE, CEI, and TE on positive outlook. Credit Ratings As of July 30, 2025 Strategic & Financial Highlights - Published July 30, 2025 Most Recent Ratings Changes FE Corp. and all subsidiaries are investment grade at all three rating agencies 21 As of 10/02/24 S&P Moody's Fitch S&P Moody's Fitch S&P Moody's Fitch S&P Moody's Fitch FirstEnergy Corp. * BBB Baa3 BBB BBB- Baa3 BBB P S S Distribution Segment FirstEnergy Pennsylvania Electric Co. BBB+ A3 BBB+ A A1 BBB+ A3 A- P S P Cleveland Electric Illuminating BBB Baa3 BBB+ BBB Baa3 A- P S P Ohio Edison BBB+ A3 BBB+ A A1 A BBB+ A3 A- P S P Toledo Edison BBB+ Baa2 BBB+ A A3 A P S P Integrated Segment Jersey Central Power & Light BBB A3 A- BBB A3 A P S S Monongahela Power BBB Baa2 A- A- A3 A+ BBB Baa2 S S S Allegheny Generating Co. BBB- Baa2 A- S S S Potomac Edison BBB Baa2 BBB+ A- A3 A S S S Stand-Alone Transmission Segment FirstEnergy Transmission * A- Baa2 BBB+ BBB+ Baa2 BBB+ P S S American Transmission Systems Inc. A- A3 A A- A3 A+ P S S Mid-Atlantic Interstate Transmission A- A3 A A- A3 A+ P S S Trans-Allegheny Interstate Line Co. A- A3 A A- A3 A+ P S S Keystone Appalachian Transmission Co. A3 A- S S *Holding company S = Stable P = Positive Ratings are not recommendations to buy, sell, or hold securities. Ratings are subject to change or withdrawal at any time by the credit rating agencies. N = Negative Issuer Senior Secured Senior Unsecured Outlook
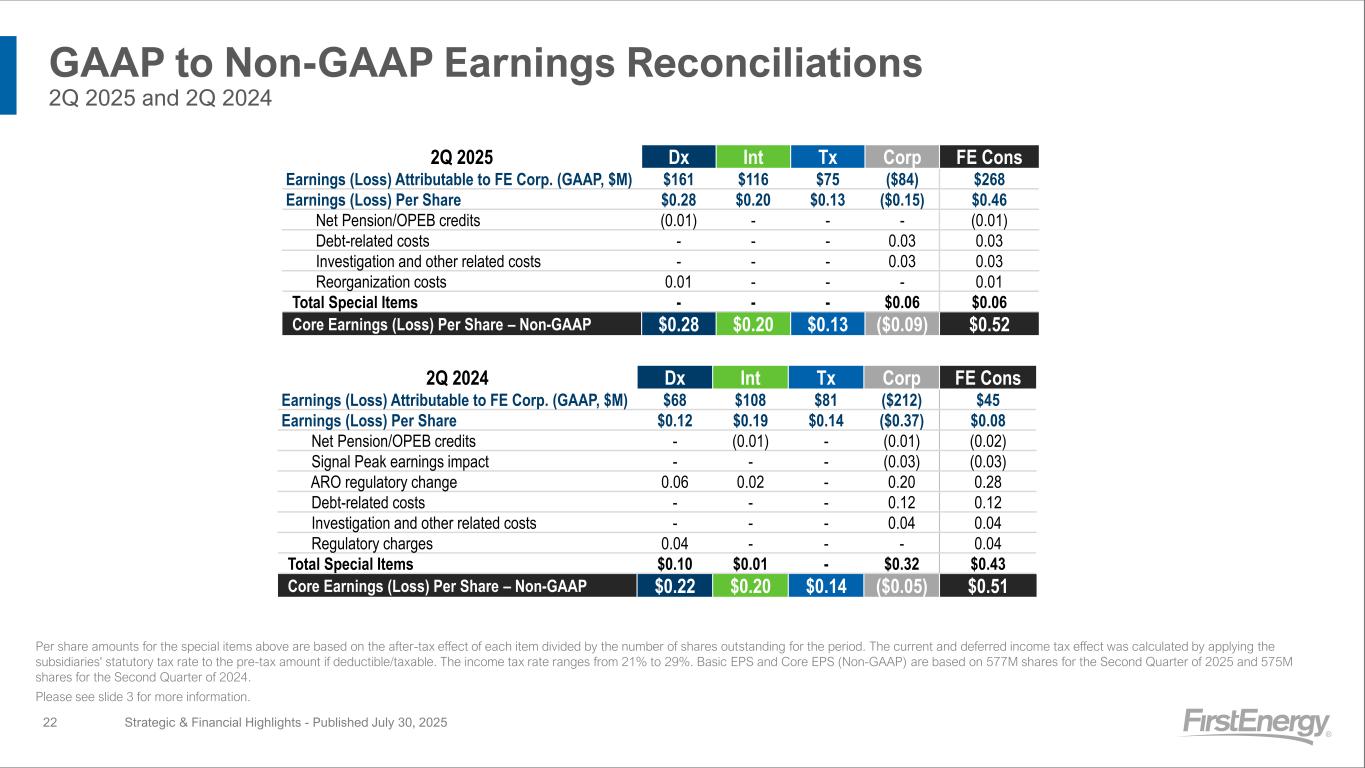
GAAP to Non-GAAP Earnings Reconciliations 2Q 2025 and 2Q 2024 Strategic & Financial Highlights - Published July 30, 2025 Per share amounts for the special items above are based on the after-tax effect of each item divided by the number of shares outstanding for the period. The current and deferred income tax effect was calculated by applying the subsidiaries' statutory tax rate to the pre-tax amount if deductible/taxable. The income tax rate ranges from 21% to 29%. Basic EPS and Core EPS (Non-GAAP) are based on 577M shares for the Second Quarter of 2025 and 575M shares for the Second Quarter of 2024. Please see slide 3 for more information. 2Q 2025 Dx Int Tx Corp FE Cons Earnings (Loss) Attributable to FE Corp. (GAAP, $M) $161 $116 $75 ($84) $268 Earnings (Loss) Per Share $0.28 $0.20 $0.13 ($0.15) $0.46 Net Pension/OPEB credits (0.01) - - - (0.01) Debt-related costs - - - 0.03 0.03 Investigation and other related costs - - - 0.03 0.03 Reorganization costs 0.01 - - - 0.01 Total Special Items - - - $0.06 $0.06 Core Earnings (Loss) Per Share – Non-GAAP $0.28 $0.20 $0.13 ($0.09) $0.52 22 2Q 2024 Dx Int Tx Corp FE Cons Earnings (Loss) Attributable to FE Corp. (GAAP, $M) $68 $108 $81 ($212) $45 Earnings (Loss) Per Share $0.12 $0.19 $0.14 ($0.37) $0.08 Net Pension/OPEB credits - (0.01) - (0.01) (0.02) Signal Peak earnings impact - - - (0.03) (0.03) ARO regulatory change 0.06 0.02 - 0.20 0.28 Debt-related costs - - - 0.12 0.12 Investigation and other related costs - - - 0.04 0.04 Regulatory charges 0.04 - - - 0.04 Total Special Items $0.10 $0.01 - $0.32 $0.43 Core Earnings (Loss) Per Share – Non-GAAP $0.22 $0.20 $0.14 ($0.05) $0.51
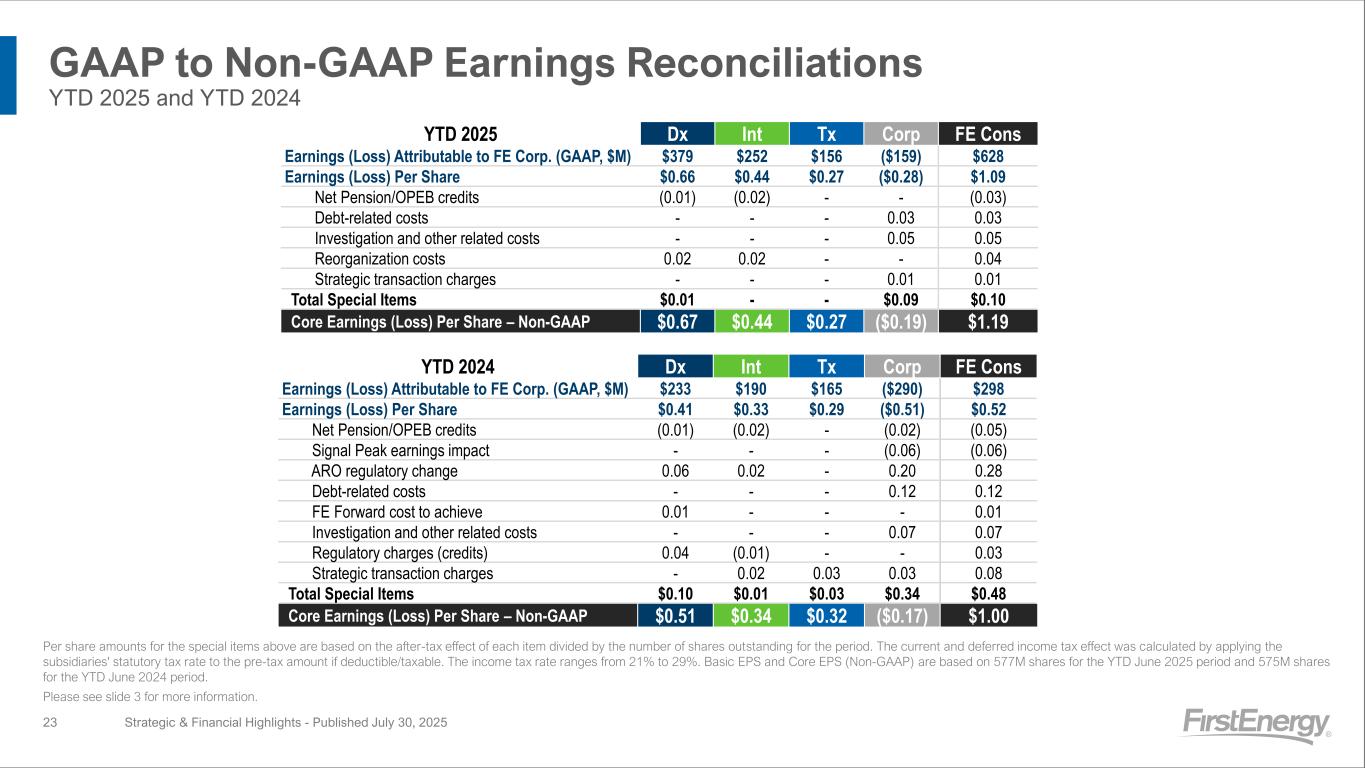
GAAP to Non-GAAP Earnings Reconciliations YTD 2025 and YTD 2024 Strategic & Financial Highlights - Published July 30, 2025 Per share amounts for the special items above are based on the after-tax effect of each item divided by the number of shares outstanding for the period. The current and deferred income tax effect was calculated by applying the subsidiaries' statutory tax rate to the pre-tax amount if deductible/taxable. The income tax rate ranges from 21% to 29%. Basic EPS and Core EPS (Non-GAAP) are based on 577M shares for the YTD June 2025 period and 575M shares for the YTD June 2024 period. Please see slide 3 for more information. 23 YTD 2025 Dx Int Tx Corp FE Cons Earnings (Loss) Attributable to FE Corp. (GAAP, $M) $379 $252 $156 ($159) $628 Earnings (Loss) Per Share $0.66 $0.44 $0.27 ($0.28) $1.09 Net Pension/OPEB credits (0.01) (0.02) - - (0.03) Debt-related costs - - - 0.03 0.03 Investigation and other related costs - - - 0.05 0.05 Reorganization costs 0.02 0.02 - - 0.04 Strategic transaction charges - - - 0.01 0.01 Total Special Items $0.01 - - $0.09 $0.10 Core Earnings (Loss) Per Share – Non-GAAP $0.67 $0.44 $0.27 ($0.19) $1.19 YTD 2024 Dx Int Tx Corp FE Cons Earnings (Loss) Attributable to FE Corp. (GAAP, $M) $233 $190 $165 ($290) $298 Earnings (Loss) Per Share $0.41 $0.33 $0.29 ($0.51) $0.52 Net Pension/OPEB credits (0.01) (0.02) - (0.02) (0.05) Signal Peak earnings impact - - - (0.06) (0.06) ARO regulatory change 0.06 0.02 - 0.20 0.28 Debt-related costs - - - 0.12 0.12 FE Forward cost to achieve 0.01 - - - 0.01 Investigation and other related costs - - - 0.07 0.07 Regulatory charges (credits) 0.04 (0.01) - - 0.03 Strategic transaction charges - 0.02 0.03 0.03 0.08 Total Special Items $0.10 $0.01 $0.03 $0.34 $0.48 Core Earnings (Loss) Per Share – Non-GAAP $0.51 $0.34 $0.32 ($0.17) $1.00
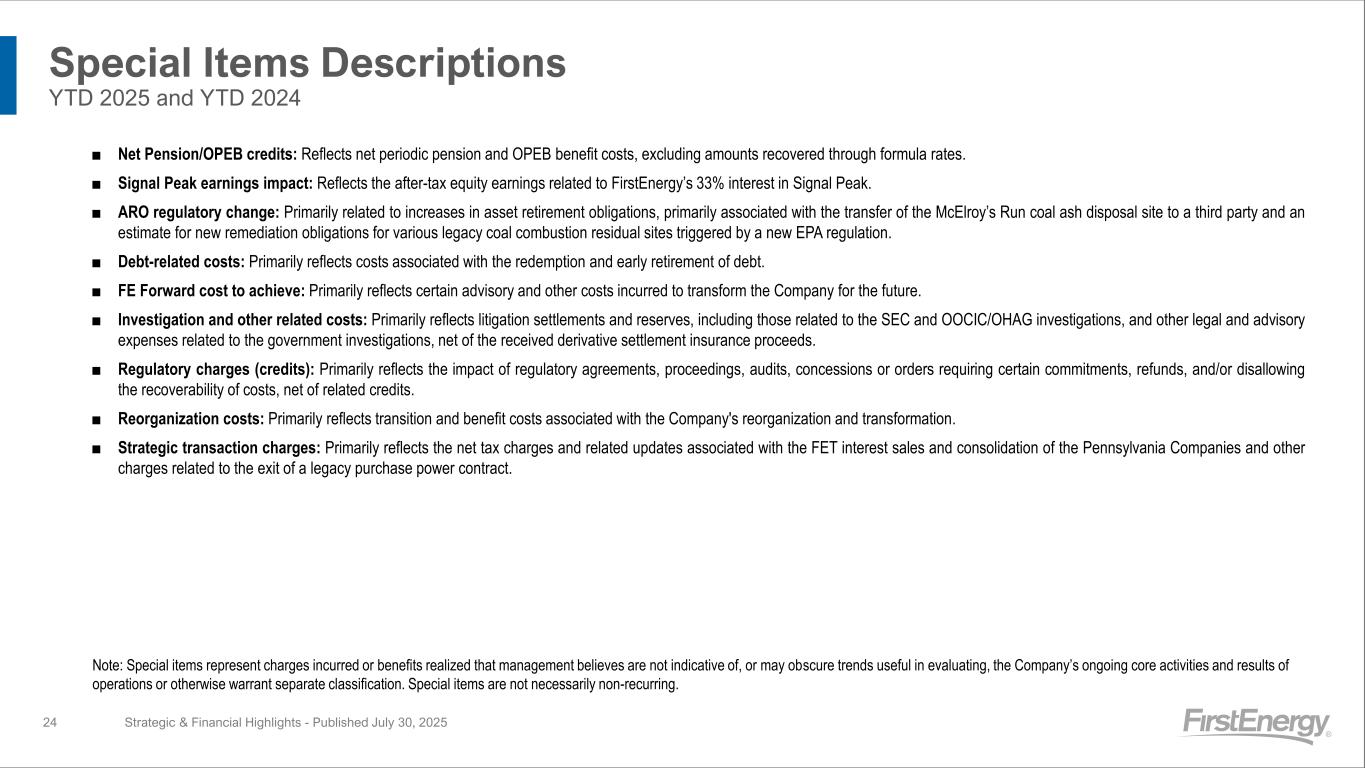
Special Items Descriptions YTD 2025 and YTD 2024 Strategic & Financial Highlights - Published July 30, 2025 ■ Net Pension/OPEB credits: Reflects net periodic pension and OPEB benefit costs, excluding amounts recovered through formula rates. ■ Signal Peak earnings impact: Reflects the after-tax equity earnings related to FirstEnergy’s 33% interest in Signal Peak. ■ ARO regulatory change: Primarily related to increases in asset retirement obligations, primarily associated with the transfer of the McElroy’s Run coal ash disposal site to a third party and an estimate for new remediation obligations for various legacy coal combustion residual sites triggered by a new EPA regulation. ■ Debt-related costs: Primarily reflects costs associated with the redemption and early retirement of debt. ■ FE Forward cost to achieve: Primarily reflects certain advisory and other costs incurred to transform the Company for the future. ■ Investigation and other related costs: Primarily reflects litigation settlements and reserves, including those related to the SEC and OOCIC/OHAG investigations, and other legal and advisory expenses related to the government investigations, net of the received derivative settlement insurance proceeds. ■ Regulatory charges (credits): Primarily reflects the impact of regulatory agreements, proceedings, audits, concessions or orders requiring certain commitments, refunds, and/or disallowing the recoverability of costs, net of related credits. ■ Reorganization costs: Primarily reflects transition and benefit costs associated with the Company's reorganization and transformation. ■ Strategic transaction charges: Primarily reflects the net tax charges and related updates associated with the FET interest sales and consolidation of the Pennsylvania Companies and other charges related to the exit of a legacy purchase power contract. Note: Special items represent charges incurred or benefits realized that management believes are not indicative of, or may obscure trends useful in evaluating, the Company’s ongoing core activities and results of operations or otherwise warrant separate classification. Special items are not necessarily non-recurring. 24
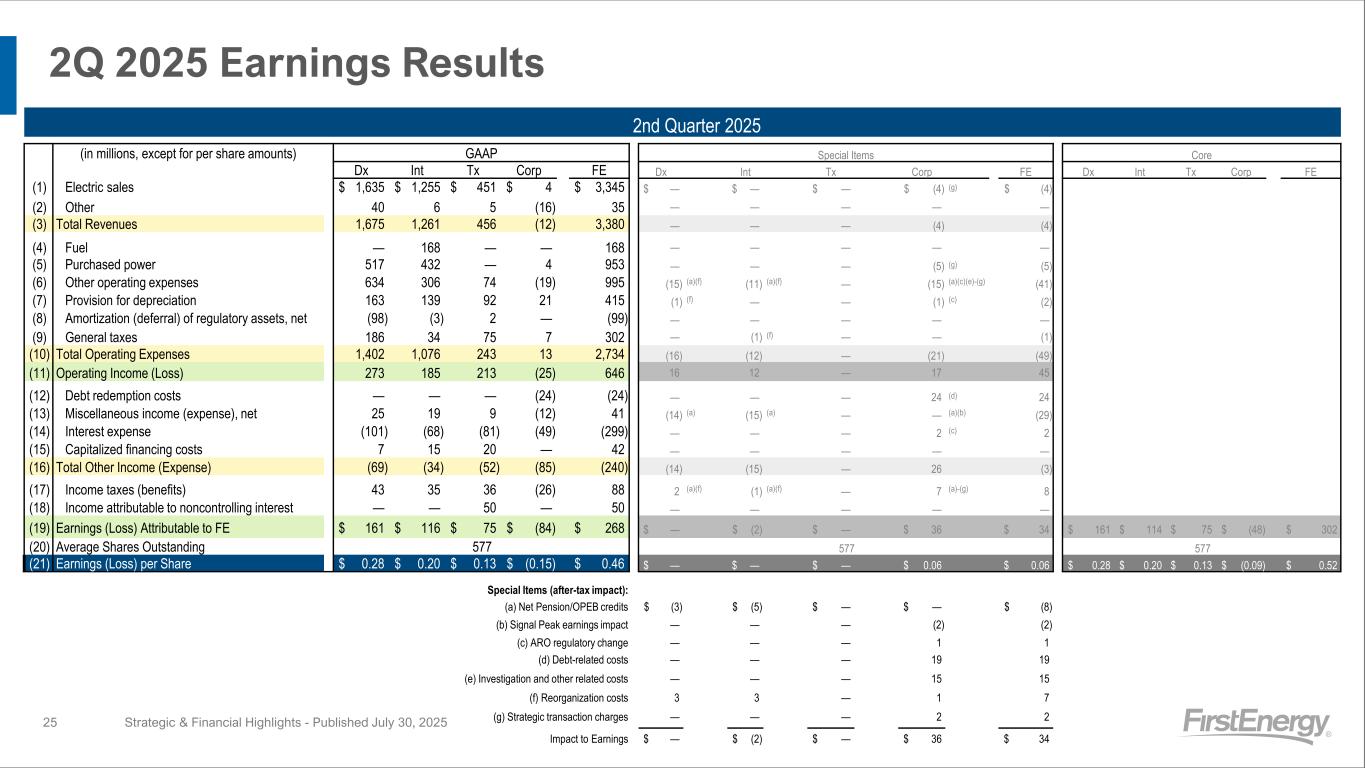
2Q 2025 Earnings Results Strategic & Financial Highlights - Published July 30, 2025 2nd Quarter 2025 (in millions, except for per share amounts) GAAP Special Items Core Dx Int Tx Corp FE Dx Int Tx Corp FE Dx Int Tx Corp FE (1) Electric sales $ 1,635 $ 1,255 $ 451 $ 4 $ 3,345 $ — $ — $ — $ (4) (g) $ (4) (2) Other 40 6 5 (16) 35 — — — — — (3) Total Revenues 1,675 1,261 456 (12) 3,380 — — — (4) (4) (4) Fuel — 168 — — 168 — — — — — (5) Purchased power 517 432 — 4 953 — — — (5) (g) (5) (6) Other operating expenses 634 306 74 (19) 995 (15) (a)(f) (11) (a)(f) — (15) (a)(c)(e)-(g) (41) (7) Provision for depreciation 163 139 92 21 415 (1) (f) — — (1) (c) (2) (8) Amortization (deferral) of regulatory assets, net (98) (3) 2 — (99) — — — — — (9) General taxes 186 34 75 7 302 — (1) (f) — — (1) (10) Total Operating Expenses 1,402 1,076 243 13 2,734 (16) (12) — (21) (49) (11) Operating Income (Loss) 273 185 213 (25) 646 16 12 — 17 45 (12) Debt redemption costs — — — (24) (24) — — — 24 (d) 24 (13) Miscellaneous income (expense), net 25 19 9 (12) 41 (14) (a) (15) (a) — — (a)(b) (29) (14) Interest expense (101) (68) (81) (49) (299) — — — 2 (c) 2 (15) Capitalized financing costs 7 15 20 — 42 — — — — — (16) Total Other Income (Expense) (69) (34) (52) (85) (240) (14) (15) — 26 (3) (17) Income taxes (benefits) 43 35 36 (26) 88 2 (a)(f) (1) (a)(f) — 7 (a)-(g) 8 (18) Income attributable to noncontrolling interest — — 50 — 50 — — — — — (19) Earnings (Loss) Attributable to FE $ 161 $ 116 $ 75 $ (84) $ 268 $ — $ (2) $ — $ 36 $ 34 $ 161 $ 114 $ 75 $ (48) $ 302 (20) Average Shares Outstanding 577 577 577 (21) Earnings (Loss) per Share $ 0.28 $ 0.20 $ 0.13 $ (0.15) $ 0.46 $ — $ — $ — $ 0.06 $ 0.06 $ 0.28 $ 0.20 $ 0.13 $ (0.09) $ 0.52 Special Items (after-tax impact): (a) (a) Net Pension/OPEB credits $ (3) $ (5) $ — $ — $ (8) (b) (b) Signal Peak earnings impact — — — (2) (2) (c) (c) ARO regulatory change — — — 1 1 (d) (d) Debt-related costs — — — 19 19 (e) (e) Investigation and other related costs — — — 15 15 (f) (f) Reorganization costs 3 3 — 1 7 (g) (g) Strategic transaction charges — — — 2 2 Impact to Earnings $ — $ (2) $ — $ 36 $ 34 25
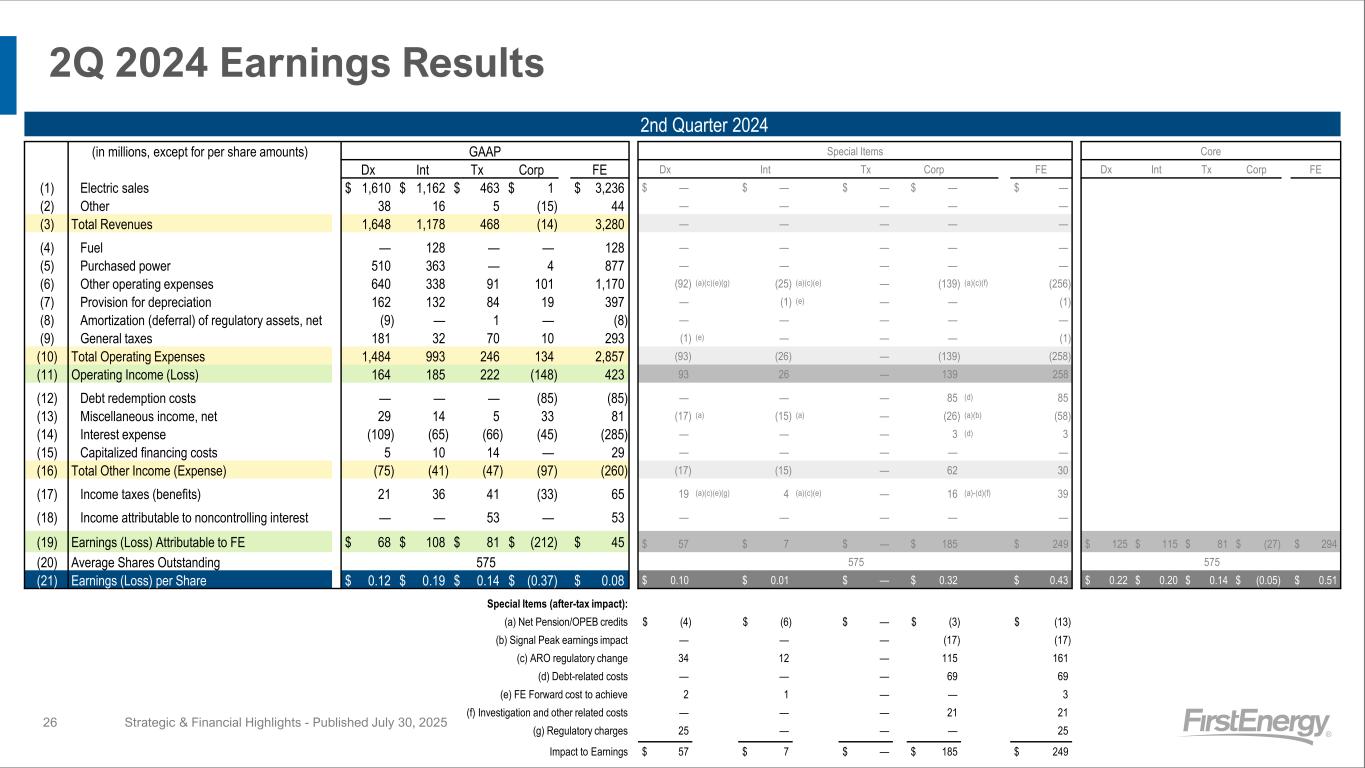
2Q 2024 Earnings Results Strategic & Financial Highlights - Published July 30, 2025 2nd Quarter 2024 (in millions, except for per share amounts) GAAP Special Items Core Dx Int Tx Corp FE Dx Int Tx Corp FE Dx Int Tx Corp FE (1) Electric sales $ 1,610 $ 1,162 $ 463 $ 1 $ 3,236 $ — $ — $ — $ — $ — (2) Other 38 16 5 (15) 44 — — — — — (3) Total Revenues 1,648 1,178 468 (14) 3,280 — — — — — (4) Fuel — 128 — — 128 — — — — — (5) Purchased power 510 363 — 4 877 — — — — — (6) Other operating expenses 640 338 91 101 1,170 (92) (a)(c)(e)(g) (25) (a)(c)(e) — (139) (a)(c)(f) (256) (7) Provision for depreciation 162 132 84 19 397 — (1) (e) — — (1) (8) Amortization (deferral) of regulatory assets, net (9) — 1 — (8) — — — — — (9) General taxes 181 32 70 10 293 (1) (e) — — — (1) (10) Total Operating Expenses 1,484 993 246 134 2,857 (93) (26) — (139) (258) (11) Operating Income (Loss) 164 185 222 (148) 423 93 26 — 139 258 (12) Debt redemption costs — — — (85) (85) — — — 85 (d) 85 (13) Miscellaneous income, net 29 14 5 33 81 (17) (a) (15) (a) — (26) (a)(b) (58) (14) Interest expense (109) (65) (66) (45) (285) — — — 3 (d) 3 (15) Capitalized financing costs 5 10 14 — 29 — — — — — (16) Total Other Income (Expense) (75) (41) (47) (97) (260) (17) (15) — 62 30 (17) Income taxes (benefits) 21 36 41 (33) 65 19 (a)(c)(e)(g) 4 (a)(c)(e) — 16 (a)-(d)(f) 39 (18) Income attributable to noncontrolling interest — — 53 — 53 — — — — — (19) Earnings (Loss) Attributable to FE $ 68 $ 108 $ 81 $ (212) $ 45 $ 57 $ 7 $ — $ 185 $ 249 $ 125 $ 115 $ 81 $ (27) $ 294 (20) Average Shares Outstanding 575 575 575 (21) Earnings (Loss) per Share $ 0.12 $ 0.19 $ 0.14 $ (0.37) $ 0.08 $ 0.10 $ 0.01 $ — $ 0.32 $ 0.43 $ 0.22 $ 0.20 $ 0.14 $ (0.05) $ 0.51 Special Items (after-tax impact): (a) (a) Net Pension/OPEB credits $ (4) $ (6) $ — $ (3) $ (13) (b) (b) Signal Peak earnings impact — — — (17) (17) (c) (c) ARO regulatory change 34 12 — 115 161 (d) (d) Debt-related costs — — — 69 69 (e) (e) FE Forward cost to achieve 2 1 — — 3 (f) (f) Investigation and other related costs — — — 21 21 (g) (g) Regulatory charges 25 — — — 25 Impact to Earnings $ 57 $ 7 $ — $ 185 $ 249 26
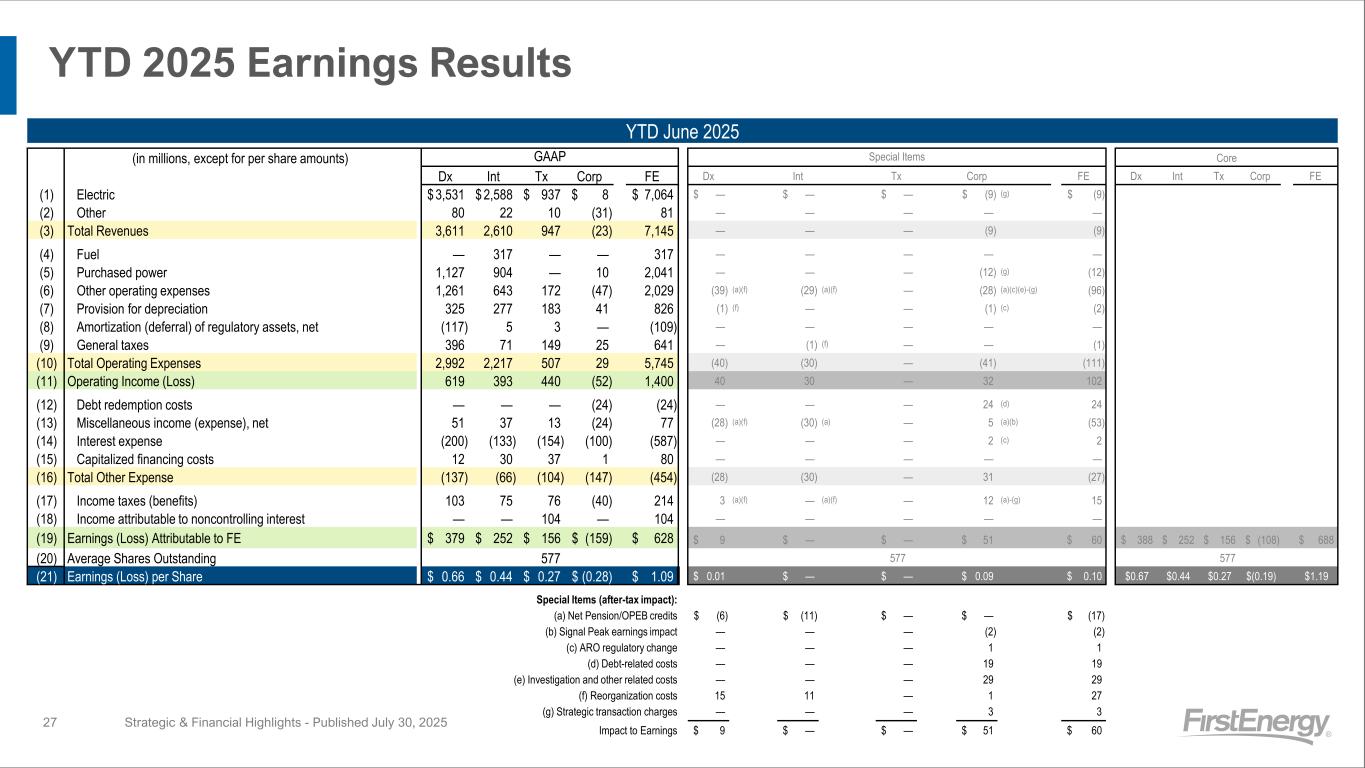
YTD 2025 Earnings Results Strategic & Financial Highlights - Published July 30, 2025 YTD June 2025 (in millions, except for per share amounts) GAAP Special Items Core Dx Int Tx Corp FE Dx Int Tx Corp FE Dx Int Tx Corp FE (1) Electric $ 3,531 $ 2,588 $ 937 $ 8 $ 7,064 $ — $ — $ — $ (9) (g) $ (9) (2) Other 80 22 10 (31) 81 — — — — — (3) Total Revenues 3,611 2,610 947 (23) 7,145 — — — (9) (9) (4) Fuel — 317 — — 317 — — — — — (5) Purchased power 1,127 904 — 10 2,041 — — — (12) (g) (12) (6) Other operating expenses 1,261 643 172 (47) 2,029 (39) (a)(f) (29) (a)(f) — (28) (a)(c)(e)-(g) (96) (7) Provision for depreciation 325 277 183 41 826 (1) (f) — — (1) (c) (2) (8) Amortization (deferral) of regulatory assets, net (117) 5 3 — (109) — — — — — (9) General taxes 396 71 149 25 641 — (1) (f) — — (1) (10) Total Operating Expenses 2,992 2,217 507 29 5,745 (40) (30) — (41) (111) (11) Operating Income (Loss) 619 393 440 (52) 1,400 40 30 — 32 102 (12) Debt redemption costs — — — (24) (24) — — — 24 (d) 24 (13) Miscellaneous income (expense), net 51 37 13 (24) 77 (28) (a)(f) (30) (a) — 5 (a)(b) (53) (14) Interest expense (200) (133) (154) (100) (587) — — — 2 (c) 2 (15) Capitalized financing costs 12 30 37 1 80 — — — — — (16) Total Other Expense (137) (66) (104) (147) (454) (28) (30) — 31 (27) (17) Income taxes (benefits) 103 75 76 (40) 214 3 (a)(f) — (a)(f) — 12 (a)-(g) 15 (18) Income attributable to noncontrolling interest — — 104 — 104 — — — — — (19) Earnings (Loss) Attributable to FE $ 379 $ 252 $ 156 $ (159) $ 628 $ 9 $ — $ — $ 51 $ 60 $ 388 $ 252 $ 156 $ (108) $ 688 (20) Average Shares Outstanding 577 577 577 (21) Earnings (Loss) per Share $ 0.66 $ 0.44 $ 0.27 $ (0.28) $ 1.09 $ 0.01 $ — $ — $ 0.09 $ 0.10 $0.67 $0.44 $0.27 $(0.19) $1.19 Special Items (after-tax impact): (a) (a) Net Pension/OPEB credits $ (6) $ (11) $ — $ — $ (17) (b) (b) Signal Peak earnings impact — — — (2) (2) (c) (c) ARO regulatory change — — — 1 1 (d) (d) Debt-related costs — — — 19 19 (e) (e) Investigation and other related costs — — — 29 29 (f) (f) Reorganization costs 15 11 — 1 27 (g) (g) Strategic transaction charges — — — 3 3 Impact to Earnings $ 9 $ — $ — $ 51 $ 60 27
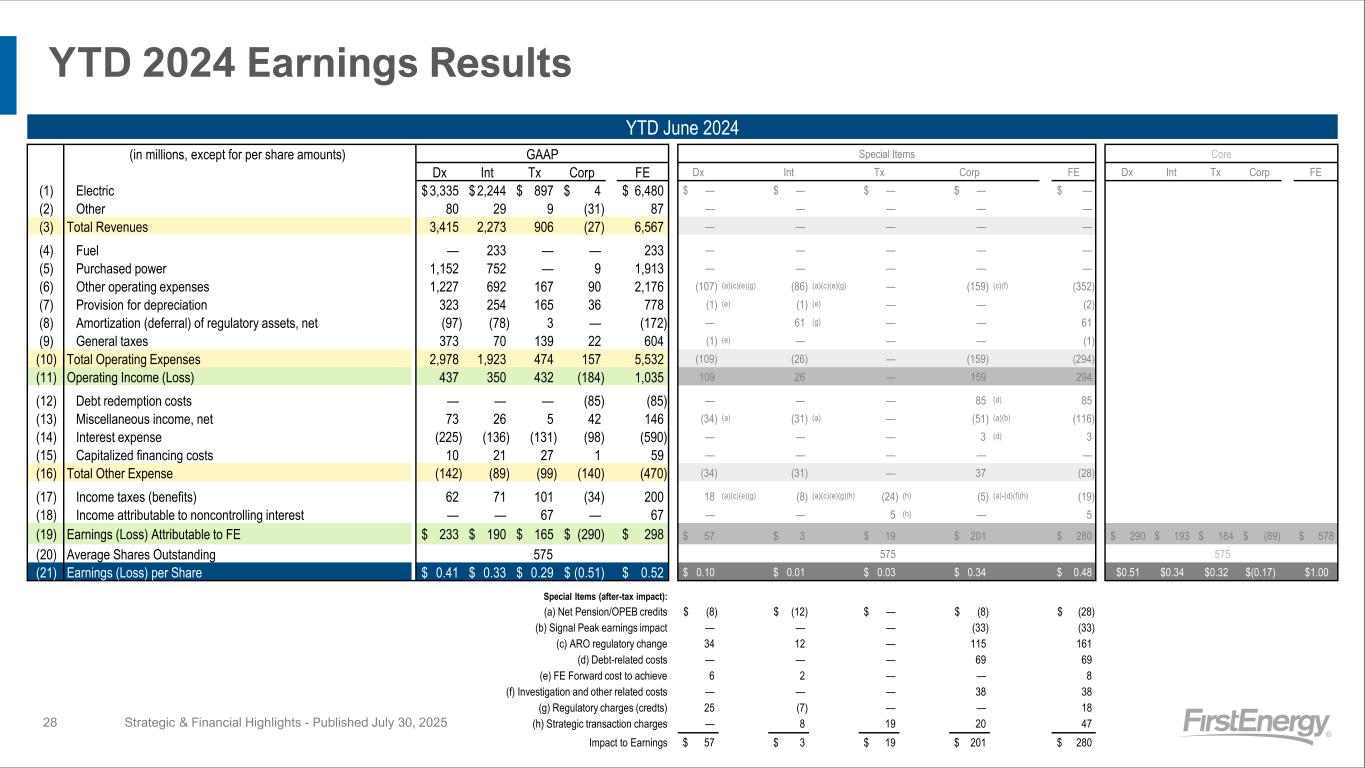
YTD 2024 Earnings Results Strategic & Financial Highlights - Published July 30, 2025 YTD June 2024 (in millions, except for per share amounts) GAAP Special Items Core Dx Int Tx Corp FE Dx Int Tx Corp FE Dx Int Tx Corp FE (1) Electric $ 3,335 $ 2,244 $ 897 $ 4 $ 6,480 $ — $ — $ — $ — $ — (2) Other 80 29 9 (31) 87 — — — — — (3) Total Revenues 3,415 2,273 906 (27) 6,567 — — — — — (4) Fuel — 233 — — 233 — — — — — (5) Purchased power 1,152 752 — 9 1,913 — — — — — (6) Other operating expenses 1,227 692 167 90 2,176 (107) (a)(c)(e)(g) (86) (a)(c)(e)(g) — (159) (c)(f) (352) (7) Provision for depreciation 323 254 165 36 778 (1) (e) (1) (e) — — (2) (8) Amortization (deferral) of regulatory assets, net (97) (78) 3 — (172) — 61 (g) — — 61 (9) General taxes 373 70 139 22 604 (1) (e) — — — (1) (10) Total Operating Expenses 2,978 1,923 474 157 5,532 (109) (26) — (159) (294) (11) Operating Income (Loss) 437 350 432 (184) 1,035 109 26 — 159 294 (12) Debt redemption costs — — — (85) (85) — — — 85 (d) 85 (13) Miscellaneous income, net 73 26 5 42 146 (34) (a) (31) (a) — (51) (a)(b) (116) (14) Interest expense (225) (136) (131) (98) (590) — — — 3 (d) 3 (15) Capitalized financing costs 10 21 27 1 59 — — — — — (16) Total Other Expense (142) (89) (99) (140) (470) (34) (31) — 37 (28) (17) Income taxes (benefits) 62 71 101 (34) 200 18 (a)(c)(e)(g) (8) (a)(c)(e)(g)(h) (24) (h) (5) (a)-(d)(f)(h) (19) (18) Income attributable to noncontrolling interest — — 67 — 67 — — 5 (h) — 5 (19) Earnings (Loss) Attributable to FE $ 233 $ 190 $ 165 $ (290) $ 298 $ 57 $ 3 $ 19 $ 201 $ 280 $ 290 $ 193 $ 184 $ (89) $ 578 (20) Average Shares Outstanding 575 575 575 (21) Earnings (Loss) per Share $ 0.41 $ 0.33 $ 0.29 $ (0.51) $ 0.52 $ 0.10 $ 0.01 $ 0.03 $ 0.34 $ 0.48 $0.51 $0.34 $0.32 $(0.17) $1.00 Special Items (after-tax impact): (a) (a) Net Pension/OPEB credits $ (8) $ (12) $ — $ (8) $ (28) (b) (b) Signal Peak earnings impact — — — (33) (33) (c) (c) ARO regulatory change 34 12 — 115 161 (d) (d) Debt-related costs — — — 69 69 (e) (e) FE Forward cost to achieve 6 2 — — 8 (f) (f) Investigation and other related costs — — — 38 38 (g) (g) Regulatory charges (credts) 25 (7) — — 18 (h) (h) Strategic transaction charges — 8 19 20 47 Impact to Earnings $ 57 $ 3 $ 19 $ 201 $ 280 28
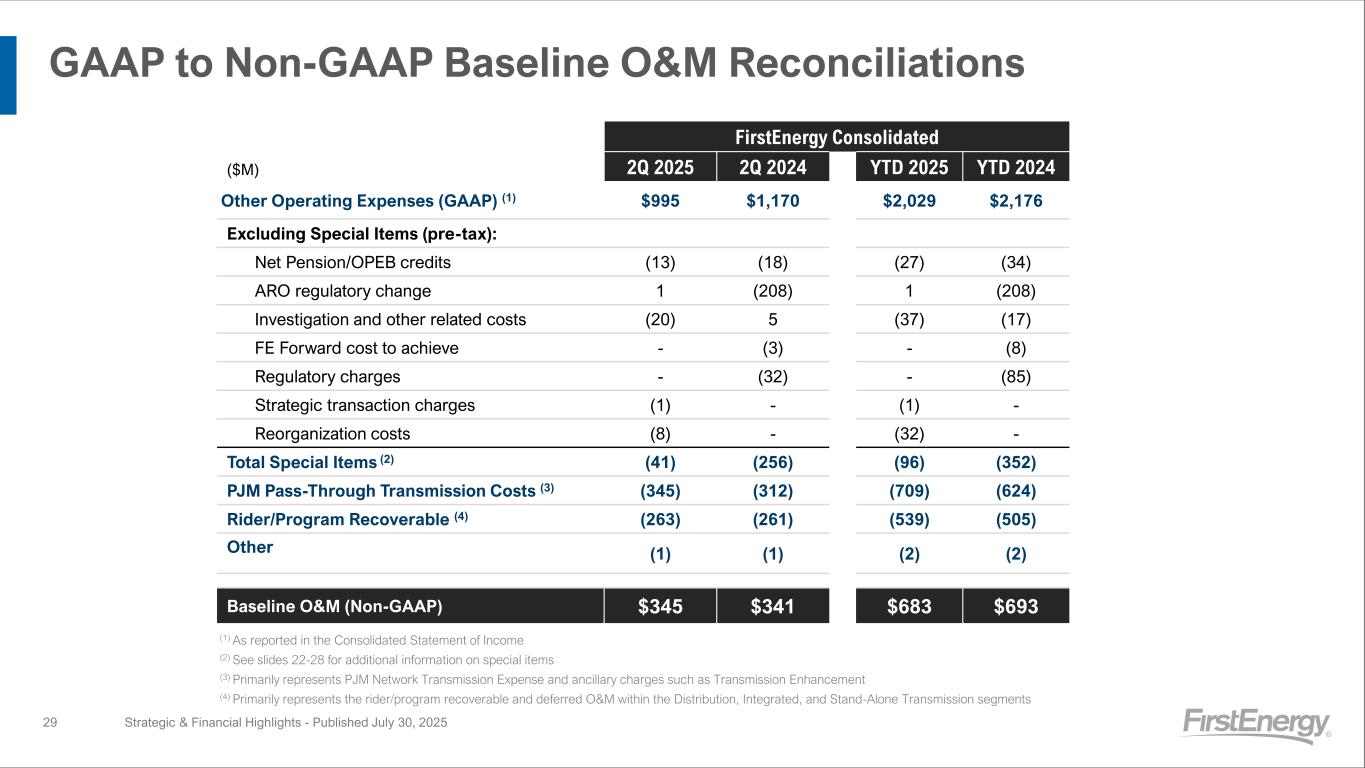
GAAP to Non-GAAP Baseline O&M Reconciliations Strategic & Financial Highlights - Published July 30, 202529 (1) As reported in the Consolidated Statement of Income (2) See slides 22-28 for additional information on special items (3) Primarily represents PJM Network Transmission Expense and ancillary charges such as Transmission Enhancement (4) Primarily represents the rider/program recoverable and deferred O&M within the Distribution, Integrated, and Stand-Alone Transmission segments FirstEnergy Consolidated ($M) 2Q 2025 2Q 2024 YTD 2025 YTD 2024 Other Operating Expenses (GAAP) (1) $995 $1,170 $2,029 $2,176 Excluding Special Items (pre-tax): Net Pension/OPEB credits (13) (18) (27) (34) ARO regulatory change 1 (208) 1 (208) Investigation and other related costs (20) 5 (37) (17) FE Forward cost to achieve - (3) - (8) Regulatory charges - (32) - (85) Strategic transaction charges (1) - (1) - Reorganization costs (8) - (32) - Total Special Items (2) (41) (256) (96) (352) PJM Pass-Through Transmission Costs (3) (345) (312) (709) (624) Rider/Program Recoverable (4) (263) (261) (539) (505) Other (1) (1) (2) (2) Baseline O&M (Non-GAAP) $345 $341 $683 $693