Please wait
0001035443false12/312025Q3http://fasb.org/us-gaap/2025#OtherAssetshttp://fasb.org/us-gaap/2025#RevenueFromContractWithCustomerIncludingAssessedTaxxbrli:sharesiso4217:USDiso4217:USDxbrli:sharesutr:sqftare:Projectare:propertyxbrli:pureare:directFinancingLeaseare:landParcelare:investmentutr:Rateare:transferiso4217:CADare:segment00010354432025-01-012025-09-3000010354432025-10-1500010354432025-09-3000010354432024-12-310001035443are:IncomefromrentalsMember2025-07-012025-09-300001035443are:IncomefromrentalsMember2024-07-012024-09-300001035443are:IncomeFromRentalsMember2025-01-012025-09-300001035443are:IncomeFromRentalsMember2024-01-012024-09-300001035443us-gaap:ProductAndServiceOtherMember2025-07-012025-09-300001035443us-gaap:ProductAndServiceOtherMember2024-07-012024-09-300001035443us-gaap:ProductAndServiceOtherMember2025-01-012025-09-300001035443us-gaap:ProductAndServiceOtherMember2024-01-012024-09-3000010354432025-07-012025-09-3000010354432024-07-012024-09-3000010354432024-01-012024-09-300001035443us-gaap:CommonStockMember2025-06-300001035443us-gaap:AdditionalPaidInCapitalMember2025-06-300001035443us-gaap:RetainedEarningsMember2025-06-300001035443us-gaap:AccumulatedOtherComprehensiveIncomeMember2025-06-300001035443us-gaap:NoncontrollingInterestMember2025-06-3000010354432025-06-300001035443are:RedeemableNoncontrollingInterestsMember2025-06-300001035443us-gaap:RetainedEarningsMember2025-07-012025-09-300001035443us-gaap:NoncontrollingInterestMember2025-07-012025-09-300001035443are:RedeemableNoncontrollingInterestsMember2025-07-012025-09-300001035443us-gaap:AccumulatedOtherComprehensiveIncomeMember2025-07-012025-09-300001035443us-gaap:AdditionalPaidInCapitalMember2025-07-012025-09-300001035443us-gaap:CommonStockMember2025-07-012025-09-300001035443us-gaap:CommonStockMember2025-09-300001035443us-gaap:AdditionalPaidInCapitalMember2025-09-300001035443us-gaap:RetainedEarningsMember2025-09-300001035443us-gaap:AccumulatedOtherComprehensiveIncomeMember2025-09-300001035443us-gaap:NoncontrollingInterestMember2025-09-300001035443are:RedeemableNoncontrollingInterestsMember2025-09-300001035443us-gaap:CommonStockMember2024-06-300001035443us-gaap:AdditionalPaidInCapitalMember2024-06-300001035443us-gaap:RetainedEarningsMember2024-06-300001035443us-gaap:AccumulatedOtherComprehensiveIncomeMember2024-06-300001035443us-gaap:NoncontrollingInterestMember2024-06-3000010354432024-06-300001035443are:RedeemableNoncontrollingInterestsMember2024-06-300001035443us-gaap:RetainedEarningsMember2024-07-012024-09-300001035443us-gaap:NoncontrollingInterestMember2024-07-012024-09-300001035443are:RedeemableNoncontrollingInterestsMember2024-07-012024-09-300001035443us-gaap:AccumulatedOtherComprehensiveIncomeMember2024-07-012024-09-300001035443us-gaap:AdditionalPaidInCapitalMember2024-07-012024-09-300001035443us-gaap:CommonStockMember2024-07-012024-09-300001035443us-gaap:CommonStockMember2024-09-300001035443us-gaap:AdditionalPaidInCapitalMember2024-09-300001035443us-gaap:RetainedEarningsMember2024-09-300001035443us-gaap:AccumulatedOtherComprehensiveIncomeMember2024-09-300001035443us-gaap:NoncontrollingInterestMember2024-09-3000010354432024-09-300001035443are:RedeemableNoncontrollingInterestsMember2024-09-300001035443us-gaap:CommonStockMember2024-12-310001035443us-gaap:AdditionalPaidInCapitalMember2024-12-310001035443us-gaap:RetainedEarningsMember2024-12-310001035443us-gaap:AccumulatedOtherComprehensiveIncomeMember2024-12-310001035443us-gaap:NoncontrollingInterestMember2024-12-310001035443are:RedeemableNoncontrollingInterestsMember2024-12-310001035443us-gaap:RetainedEarningsMember2025-01-012025-09-300001035443us-gaap:NoncontrollingInterestMember2025-01-012025-09-300001035443are:RedeemableNoncontrollingInterestsMember2025-01-012025-09-300001035443us-gaap:AccumulatedOtherComprehensiveIncomeMember2025-01-012025-09-300001035443us-gaap:AdditionalPaidInCapitalMember2025-01-012025-09-300001035443us-gaap:CommonStockMember2025-01-012025-09-300001035443us-gaap:CommonStockMember2023-12-310001035443us-gaap:AdditionalPaidInCapitalMember2023-12-310001035443us-gaap:RetainedEarningsMember2023-12-310001035443us-gaap:AccumulatedOtherComprehensiveIncomeMember2023-12-310001035443us-gaap:NoncontrollingInterestMember2023-12-3100010354432023-12-310001035443are:RedeemableNoncontrollingInterestsMember2023-12-310001035443us-gaap:RetainedEarningsMember2024-01-012024-09-300001035443us-gaap:NoncontrollingInterestMember2024-01-012024-09-300001035443are:RedeemableNoncontrollingInterestsMember2024-01-012024-09-300001035443us-gaap:AccumulatedOtherComprehensiveIncomeMember2024-01-012024-09-300001035443us-gaap:AdditionalPaidInCapitalMember2024-01-012024-09-300001035443us-gaap:CommonStockMember2024-01-012024-09-300001035443are:OperatingPropertiesMembersrt:NorthAmericaMember2025-09-300001035443are:ActiveDevelopmentRedevelopmentMembersrt:NorthAmericaMember2025-09-300001035443srt:MaximumMemberus-gaap:BuildingAndBuildingImprovementsMember2025-09-300001035443srt:MaximumMemberus-gaap:LandImprovementsMember2025-09-300001035443country:CA2025-09-300001035443srt:CumulativeEffectPeriodOfAdoptionAdjustmentMemberare:IncomefromrentalsMember2025-07-012025-09-300001035443srt:CumulativeEffectPeriodOfAdoptionAdjustmentMemberare:IncomefromrentalsMember2024-07-012024-09-300001035443srt:CumulativeEffectPeriodOfAdoptionAdjustmentMemberare:IncomeFromRentalsMember2025-01-012025-09-300001035443srt:CumulativeEffectPeriodOfAdoptionAdjustmentMemberare:IncomeFromRentalsMember2024-01-012024-09-300001035443are:IncomefromrentalsMember2025-01-012025-09-300001035443are:IncomefromrentalsMember2024-01-012024-09-300001035443srt:NorthAmericaMember2025-09-300001035443srt:NorthAmericaMember2024-12-310001035443us-gaap:DisposalGroupHeldForSaleOrDisposedOfBySaleNotDiscontinuedOperationsMember2025-09-300001035443us-gaap:DisposalGroupHeldForSaleOrDisposedOfBySaleNotDiscontinuedOperationsMember2024-12-310001035443us-gaap:DisposalGroupHeldForSaleOrDisposedOfBySaleNotDiscontinuedOperationsMemberare:OperatingPropertiesMember2025-09-300001035443us-gaap:DisposalGroupHeldForSaleOrDisposedOfBySaleNotDiscontinuedOperationsMemberare:FutureDevelopmentProjectsMember2025-09-300001035443are:CostaVerdeAndScrippsScienceParkMember2025-09-300001035443are:CostaVerdeAndScrippsScienceParkMemberare:OperatingPropertiesMember2025-09-300001035443are:CostaVerdeAndScrippsScienceParkMemberare:FutureDevelopmentProjectsMember2025-09-300001035443are:CostaVerdeAndScrippsScienceParkMember2025-01-012025-09-300001035443are:PacificTechnologyParkMemberare:AlexandriaMember2025-09-300001035443are:PacificTechnologyParkMemberare:OperatingPropertiesMember2025-09-300001035443are:PacificTechnologyParkMemberare:FutureDevelopmentProjectsMember2025-09-300001035443are:PacificTechnologyParkMember2025-01-012025-09-300001035443are:A5505MorehouseDriveMember2025-09-300001035443are:A5505MorehouseDriveMemberare:OperatingPropertiesMember2025-08-310001035443are:A5505MorehouseDriveMemberare:FutureDevelopmentProjectsMember2025-09-300001035443are:A5505MorehouseDriveMember2025-08-012025-08-310001035443are:A2425GarciaAvenueAnd24002450BayshoreParkwayMember2025-09-300001035443are:A2425GarciaAvenueAnd24002450BayshoreParkwayMemberare:OperatingPropertiesMember2025-09-300001035443are:A2425GarciaAvenueAnd24002450BayshoreParkwayMemberare:FutureDevelopmentProjectsMember2025-09-300001035443are:A2425GarciaAvenueAnd24002450BayshoreParkwayMember2025-01-012025-09-300001035443are:OtherTexasMember2025-09-300001035443are:OtherTexasMemberare:OperatingPropertiesMember2025-09-300001035443are:OtherTexasMemberare:FutureDevelopmentProjectsMember2025-09-300001035443are:OtherTexasMember2025-01-012025-09-300001035443are:OthermarketsMember2025-01-012025-09-300001035443srt:NorthAmericaMember2025-01-012025-09-300001035443are:CostaVerdeAndScrippsScienceParkMemberus-gaap:NotesReceivableMember2025-03-310001035443are:A199EastBlaineStreetMember2025-01-012025-09-300001035443are:A300248thAvenueMember2025-01-012025-09-300001035443are:A300248thAvenueMemberare:OperatingPropertiesMember2025-09-300001035443are:A300248thAvenueMember2025-09-300001035443are:A550ArsenalStreetMember2025-01-012025-09-300001035443are:A550ArsenalStreetMemberare:OperatingPropertiesMember2025-09-300001035443are:A550ArsenalStreetMemberare:FutureDevelopmentProjectsMember2025-09-300001035443are:A550ArsenalStreetMemberus-gaap:SubsequentEventMember2025-10-012025-10-310001035443are:OtherOtherMarketMember2025-01-012025-09-300001035443are:OtherOtherMarketMemberare:FutureDevelopmentProjectsMember2025-09-300001035443are:A5600AvenidaEncinasMember2025-01-012025-09-300001035443are:A5600AvenidaEncinasMember2025-09-300001035443are:A5600AvenidaEncinasMember2025-04-012025-06-300001035443are:A5600AvenidaEncinasMember2025-07-012025-09-300001035443are:SanFranciscoBayAreaMember2025-01-012025-03-310001035443are:A7TriangleDriveMember2025-01-012025-09-300001035443are:A7TriangleDriveMember2025-09-300001035443are:A7TriangleDriveMemberare:OperatingPropertiesMember2025-09-300001035443are:A10256And10260MeanleyDriveMember2025-01-012025-09-300001035443are:A10256And10260MeanleyDriveMemberare:FutureDevelopmentProjectsMember2025-09-300001035443are:A6260SequenceDriveAnd5505MorehouseDriveMember2025-01-012025-09-300001035443are:A6260SequenceDriveAnd5505MorehouseDriveMember2025-09-300001035443are:AlexandriaCenterForLifeScienceNewYorkCityMember2025-09-300001035443are:A50And60BinneyStreetMemberare:AlexandriaMember2025-09-300001035443are:A75125BinneyStreetMemberare:AlexandriaMember2025-09-300001035443are:A100And225BinneyStreetAnd300ThirdStreetMemberare:AlexandriaMember2025-09-300001035443are:A15NeccoStreetMemberare:AlexandriaMember2025-09-300001035443are:A285299307And345DorchesterAvenueMemberare:AlexandriaMember2025-09-300001035443are:AlexandriaCenterForScienceAndTechnologyMissionBayMemberare:AlexandriaMember2025-09-300001035443are:A601611651681685And701GatewayBoulevardMemberare:AlexandriaMember2025-09-300001035443are:A751GatewayBoulevardMemberare:AlexandriaMember2025-09-300001035443are:A211And213EastGrandAvenueMemberare:AlexandriaMember2025-09-300001035443are:A500ForbesBoulevardMemberare:AlexandriaMember2025-09-300001035443are:AlexandriaCenterForLifeScienceMillbraeMemberare:AlexandriaMember2025-09-300001035443are:A3215MerryfieldRowMemberare:AlexandriaMember2025-09-300001035443are:CampusPointByAlexandriaMemberare:AlexandriaMember2025-09-300001035443are:A5200IlluminaWayMemberare:AlexandriaMember2025-09-300001035443are:A9625TowneCentreDriveMemberare:AlexandriaMember2025-09-300001035443are:SDTechbyAlexandriaMemberare:AlexandriaMember2025-09-300001035443are:SummersRidgeScienceParkMemberare:AlexandriaMember2025-09-300001035443are:A1201And1208EastlakeAvenueEastMemberare:AlexandriaMember2025-09-300001035443are:A400DexterAvenueNorthMemberare:AlexandriaMember2025-09-300001035443are:A800MercerStreetMemberare:AlexandriaMember2025-09-300001035443are:A1655And1725ThirdStreetMember2025-09-300001035443are:A1450ResearchBoulevardMember2025-09-300001035443are:A101WestDickmanStreetMember2025-09-300001035443are:A99CoolidgeAvenueMember2025-09-300001035443are:A99CoolidgeAvenueMember2025-07-310001035443are:A99CoolidgeAvenueMemberus-gaap:AdditionalPaidInCapitalMember2025-07-012025-09-300001035443are:PacificTechnologyParkMember2025-06-300001035443are:PacificTechnologyParkMemberare:AlexandriaMember2025-06-300001035443are:A199EastBlaineStreetMember2025-06-300001035443are:A199EastBlaineStreetMemberare:AlexandriaMember2025-06-300001035443are:PacificTechnologyParkMember2025-07-012025-09-300001035443are:PacificTechnologyParkMember2025-09-300001035443are:A199EastBlaineStreetMemberus-gaap:AdditionalPaidInCapitalMember2025-07-012025-09-300001035443are:A199EastBlaineStreetMember2025-09-300001035443are:PacificTechnologyParkAnd199EastBlaineStreetMember2025-07-012025-09-300001035443are:A199EastBlaineStreetMemberare:AlexandriaMember2025-09-300001035443us-gaap:VariableInterestEntityPrimaryBeneficiaryMember2025-09-300001035443us-gaap:VariableInterestEntityPrimaryBeneficiaryMember2024-12-310001035443are:GreaterBostonMember2025-03-310001035443are:GreaterBostonMemberus-gaap:NoncontrollingInterestMember2025-03-012025-03-310001035443are:A1655And1725ThirdStreetMember2024-12-310001035443are:A1450ResearchBoulevardMember2024-12-310001035443are:A101WestDickmanStreetMember2024-12-310001035443are:OtherunconsolidatedrealestatejointventuresMember2025-09-300001035443are:OtherunconsolidatedrealestatejointventuresMember2024-12-310001035443are:A101WestDickmanStreetMember2025-01-012025-09-300001035443are:A1450ResearchBoulevardMember2025-01-012025-09-300001035443are:A1655And1725ThirdStreetMember2025-01-012025-09-300001035443us-gaap:EquityMethodInvestmentNonconsolidatedInvesteeOrGroupOfInvesteesMember2025-09-300001035443are:A1655And1725ThirdStreetMember2025-03-3100010354432025-03-310001035443are:PurchaseOptionTermOneMember2025-01-012025-09-300001035443are:PurchaseOptionTermTwoMember2025-01-012025-09-300001035443are:PurchaseOptionTermThreeMember2025-01-012025-09-3000010354432017-10-012017-10-010001035443are:LandparcelssubjecttoleaseagreementthatcontainsapurchaseoptionMember2025-01-012025-09-300001035443are:A1201And1208EastlakeAvenueEastMember2025-09-300001035443are:A1208EastlakeAvenueEastMember2025-09-300001035443are:A1201EastlakeAvenueEastMember2025-09-300001035443are:A1208EastlakeAvenueEastMember2025-01-012025-09-300001035443are:A1201EastlakeAvenueEastMember2025-01-012025-09-300001035443are:OtherOperatingPropertiesMember2025-09-300001035443are:A30003018WesternAvenueMember2025-01-012025-03-310001035443are:A30003018WesternAvenueMember2025-07-012025-09-300001035443srt:CumulativeEffectPeriodOfAdoptionAdjustmentMemberare:IncomefromrentalsMember2025-01-012025-09-300001035443srt:CumulativeEffectPeriodOfAdoptionAdjustmentMemberare:IncomefromrentalsMember2024-01-012024-09-300001035443are:GroundandOperatingLeasesMember2025-09-300001035443are:OperatingPropertyWithGroundLeaseMember2025-09-300001035443srt:MinimumMember2025-01-012025-09-300001035443srt:MaximumMember2025-01-012025-09-300001035443are:AlexandriaTechnologySquareMember2025-01-012025-09-300001035443are:FundsheldinescrowrelatedtoconstructionprojectsandinvestingactivitiesMember2025-09-300001035443are:FundsheldinescrowrelatedtoconstructionprojectsandinvestingactivitiesMember2024-12-310001035443are:OtherrestrictedcashMember2025-09-300001035443are:OtherrestrictedcashMember2024-12-310001035443are:LimitedpartnershipsMember2025-01-012025-09-300001035443are:InvestmentsinpubliclytradedcompaniesMember2025-09-300001035443are:LimitedpartnershipsMember2025-09-300001035443are:EntitieswithobservablepricechangeMemberare:InvestmentsinprivatelyheldentitiesthatdonotreportNAVMember2025-09-300001035443are:EntitieswithoutobservablepricechangesMemberare:InvestmentsinprivatelyheldentitiesthatdonotreportNAVMember2025-09-300001035443are:InvestmentsinpubliclytradedcompaniesMember2024-12-310001035443are:LimitedpartnershipsMember2024-12-310001035443are:EntitieswithobservablepricechangeMemberare:InvestmentsinprivatelyheldentitiesthatdonotreportNAVMember2024-12-310001035443are:EntitieswithoutobservablepricechangesMemberare:InvestmentsinprivatelyheldentitiesthatdonotreportNAVMember2024-12-310001035443are:EntitieswithobservablepricechangeMemberare:InvestmentsinprivatelyheldentitiesthatdonotreportNAVMember2025-01-012025-09-300001035443are:EntitieswithobservablepricechangeMemberare:InvestmentsinprivatelyheldentitiesthatdonotreportNAVMember2024-01-012024-09-300001035443are:TotalInvestmentsHeldMember2025-01-012025-09-300001035443are:TotalInvestmentsHeldMember2024-01-012024-09-300001035443us-gaap:EquityMethodInvestmentsMember2025-01-012025-09-300001035443are:SanDiegoMemberus-gaap:NotesReceivableMember2025-01-012025-09-300001035443are:SanDiegoMemberus-gaap:NotesReceivableMember2025-09-300001035443are:SanDiegoMemberus-gaap:NotesReceivableMember2024-12-310001035443are:GreaterBostonMemberus-gaap:NotesReceivableMember2025-01-012025-09-300001035443are:GreaterBostonMemberus-gaap:NotesReceivableMember2025-09-300001035443are:GreaterBostonMemberus-gaap:NotesReceivableMember2024-12-310001035443are:InvestmentsInPubliclyTradedCompaniesMember2025-09-300001035443are:InvestmentsInPubliclyTradedCompaniesMemberus-gaap:FairValueInputsLevel1Member2025-09-300001035443are:InvestmentsInPubliclyTradedCompaniesMemberus-gaap:FairValueInputsLevel2Member2025-09-300001035443are:InvestmentsInPubliclyTradedCompaniesMemberus-gaap:FairValueInputsLevel3Member2025-09-300001035443are:InvestmentsInPubliclyTradedCompaniesMember2024-12-310001035443are:InvestmentsInPubliclyTradedCompaniesMemberus-gaap:FairValueInputsLevel1Member2024-12-310001035443are:InvestmentsInPubliclyTradedCompaniesMemberus-gaap:FairValueInputsLevel2Member2024-12-310001035443are:InvestmentsInPubliclyTradedCompaniesMemberus-gaap:FairValueInputsLevel3Member2024-12-310001035443us-gaap:CurrencySwapMember2025-09-300001035443us-gaap:CurrencySwapMemberus-gaap:FairValueInputsLevel1Member2025-09-300001035443us-gaap:CurrencySwapMemberus-gaap:FairValueInputsLevel2Member2025-09-300001035443us-gaap:CurrencySwapMemberus-gaap:FairValueInputsLevel3Member2025-09-300001035443us-gaap:CurrencySwapMember2024-12-310001035443us-gaap:CurrencySwapMemberus-gaap:FairValueInputsLevel1Member2024-12-310001035443us-gaap:CurrencySwapMemberus-gaap:FairValueInputsLevel2Member2024-12-310001035443us-gaap:CurrencySwapMemberus-gaap:FairValueInputsLevel3Member2024-12-310001035443us-gaap:EstimateOfFairValueFairValueDisclosureMemberus-gaap:FairValueMeasurementsNonrecurringMember2025-09-300001035443us-gaap:EstimateOfFairValueFairValueDisclosureMemberus-gaap:FairValueMeasurementsNonrecurringMemberus-gaap:FairValueInputsLevel1Member2025-09-300001035443us-gaap:EstimateOfFairValueFairValueDisclosureMemberus-gaap:FairValueMeasurementsNonrecurringMemberus-gaap:FairValueInputsLevel2Member2025-09-300001035443us-gaap:EstimateOfFairValueFairValueDisclosureMemberus-gaap:FairValueMeasurementsNonrecurringMemberus-gaap:FairValueInputsLevel3Member2025-09-300001035443us-gaap:EstimateOfFairValueFairValueDisclosureMemberus-gaap:FairValueMeasurementsNonrecurringMember2024-12-310001035443us-gaap:EstimateOfFairValueFairValueDisclosureMemberus-gaap:FairValueMeasurementsNonrecurringMemberus-gaap:FairValueInputsLevel1Member2024-12-310001035443us-gaap:EstimateOfFairValueFairValueDisclosureMemberus-gaap:FairValueMeasurementsNonrecurringMemberus-gaap:FairValueInputsLevel2Member2024-12-310001035443us-gaap:EstimateOfFairValueFairValueDisclosureMemberus-gaap:FairValueMeasurementsNonrecurringMemberus-gaap:FairValueInputsLevel3Member2024-12-310001035443us-gaap:EstimateOfFairValueFairValueDisclosureMemberare:EntitieswithoutobservablepricechangesMemberus-gaap:FairValueMeasurementsNonrecurringMemberare:InvestmentsinprivatelyheldentitiesthatdonotreportNAVMember2025-09-300001035443us-gaap:FairValueMeasurementsNonrecurringMemberare:InvestmentsinprivatelyheldentitiesthatdonotreportNAVMemberus-gaap:EstimateOfFairValueFairValueDisclosureMemberare:EntitieswithoutobservablepricechangesMemberus-gaap:FairValueInputsLevel1Member2025-09-300001035443us-gaap:FairValueMeasurementsNonrecurringMemberare:InvestmentsinprivatelyheldentitiesthatdonotreportNAVMemberus-gaap:EstimateOfFairValueFairValueDisclosureMemberare:EntitieswithoutobservablepricechangesMemberus-gaap:FairValueInputsLevel2Member2025-09-300001035443us-gaap:FairValueMeasurementsNonrecurringMemberare:InvestmentsinprivatelyheldentitiesthatdonotreportNAVMemberus-gaap:EstimateOfFairValueFairValueDisclosureMemberare:EntitieswithoutobservablepricechangesMemberus-gaap:FairValueInputsLevel3Member2025-09-300001035443us-gaap:EstimateOfFairValueFairValueDisclosureMemberare:EntitieswithoutobservablepricechangesMemberus-gaap:FairValueMeasurementsNonrecurringMemberare:InvestmentsinprivatelyheldentitiesthatdonotreportNAVMember2024-12-310001035443us-gaap:FairValueMeasurementsNonrecurringMemberare:InvestmentsinprivatelyheldentitiesthatdonotreportNAVMemberus-gaap:EstimateOfFairValueFairValueDisclosureMemberare:EntitieswithoutobservablepricechangesMemberus-gaap:FairValueInputsLevel1Member2024-12-310001035443us-gaap:FairValueMeasurementsNonrecurringMemberare:InvestmentsinprivatelyheldentitiesthatdonotreportNAVMemberus-gaap:EstimateOfFairValueFairValueDisclosureMemberare:EntitieswithoutobservablepricechangesMemberus-gaap:FairValueInputsLevel2Member2024-12-310001035443us-gaap:FairValueMeasurementsNonrecurringMemberare:InvestmentsinprivatelyheldentitiesthatdonotreportNAVMemberus-gaap:EstimateOfFairValueFairValueDisclosureMemberare:EntitieswithoutobservablepricechangesMemberus-gaap:FairValueInputsLevel3Member2024-12-310001035443us-gaap:CarryingReportedAmountFairValueDisclosureMember2025-09-300001035443us-gaap:CarryingReportedAmountFairValueDisclosureMemberare:A22BillionUnsecuredSeniorLineOfCreditMember2025-09-300001035443us-gaap:EstimateOfFairValueFairValueDisclosureMemberus-gaap:FairValueMeasurementsNonrecurringMemberus-gaap:FairValueInputsLevel1Memberare:A22BillionUnsecuredSeniorLineOfCreditMember2025-09-300001035443us-gaap:EstimateOfFairValueFairValueDisclosureMemberus-gaap:FairValueMeasurementsNonrecurringMemberus-gaap:FairValueInputsLevel2Memberare:A22BillionUnsecuredSeniorLineOfCreditMember2025-09-300001035443us-gaap:EstimateOfFairValueFairValueDisclosureMemberus-gaap:FairValueMeasurementsNonrecurringMemberus-gaap:FairValueInputsLevel3Memberare:A22BillionUnsecuredSeniorLineOfCreditMember2025-09-300001035443us-gaap:EstimateOfFairValueFairValueDisclosureMemberus-gaap:FairValueMeasurementsNonrecurringMemberare:A22BillionUnsecuredSeniorLineOfCreditMember2025-09-300001035443us-gaap:CommercialPaperMemberus-gaap:CarryingReportedAmountFairValueDisclosureMember2025-09-300001035443us-gaap:CommercialPaperMemberus-gaap:EstimateOfFairValueFairValueDisclosureMemberus-gaap:FairValueMeasurementsNonrecurringMemberus-gaap:FairValueInputsLevel1Member2025-09-300001035443us-gaap:CommercialPaperMemberus-gaap:EstimateOfFairValueFairValueDisclosureMemberus-gaap:FairValueMeasurementsNonrecurringMemberus-gaap:FairValueInputsLevel2Member2025-09-300001035443us-gaap:CommercialPaperMemberus-gaap:EstimateOfFairValueFairValueDisclosureMemberus-gaap:FairValueMeasurementsNonrecurringMemberus-gaap:FairValueInputsLevel3Member2025-09-300001035443us-gaap:CommercialPaperMemberus-gaap:EstimateOfFairValueFairValueDisclosureMemberus-gaap:FairValueMeasurementsNonrecurringMember2025-09-300001035443us-gaap:CarryingReportedAmountFairValueDisclosureMember2024-12-310001035443us-gaap:CarryingReportedAmountFairValueDisclosureMemberare:A22BillionUnsecuredSeniorLineOfCreditMember2024-12-310001035443us-gaap:EstimateOfFairValueFairValueDisclosureMemberus-gaap:FairValueMeasurementsNonrecurringMemberus-gaap:FairValueInputsLevel1Memberare:A22BillionUnsecuredSeniorLineOfCreditMember2024-12-310001035443us-gaap:EstimateOfFairValueFairValueDisclosureMemberus-gaap:FairValueMeasurementsNonrecurringMemberus-gaap:FairValueInputsLevel2Memberare:A22BillionUnsecuredSeniorLineOfCreditMember2024-12-310001035443us-gaap:EstimateOfFairValueFairValueDisclosureMemberus-gaap:FairValueMeasurementsNonrecurringMemberus-gaap:FairValueInputsLevel3Memberare:A22BillionUnsecuredSeniorLineOfCreditMember2024-12-310001035443us-gaap:EstimateOfFairValueFairValueDisclosureMemberus-gaap:FairValueMeasurementsNonrecurringMemberare:A22BillionUnsecuredSeniorLineOfCreditMember2024-12-310001035443us-gaap:CommercialPaperMemberus-gaap:CarryingReportedAmountFairValueDisclosureMember2024-12-310001035443us-gaap:CommercialPaperMemberus-gaap:EstimateOfFairValueFairValueDisclosureMemberus-gaap:FairValueMeasurementsNonrecurringMemberus-gaap:FairValueInputsLevel1Member2024-12-310001035443us-gaap:CommercialPaperMemberus-gaap:EstimateOfFairValueFairValueDisclosureMemberus-gaap:FairValueMeasurementsNonrecurringMemberus-gaap:FairValueInputsLevel2Member2024-12-310001035443us-gaap:CommercialPaperMemberus-gaap:EstimateOfFairValueFairValueDisclosureMemberus-gaap:FairValueMeasurementsNonrecurringMemberus-gaap:FairValueInputsLevel3Member2024-12-310001035443us-gaap:CommercialPaperMemberus-gaap:EstimateOfFairValueFairValueDisclosureMemberus-gaap:FairValueMeasurementsNonrecurringMember2024-12-310001035443us-gaap:CommercialPaperMemberus-gaap:LineOfCreditMember2025-09-300001035443us-gaap:CommercialPaperMemberus-gaap:LineOfCreditMember2025-01-012025-09-300001035443are:A4.30UnsecuredSeniorNotesPayableMember2025-09-300001035443are:A4.30UnsecuredSeniorNotesPayableMember2025-01-012025-09-300001035443are:A3.80UnsecuredSeniorNotesPayableMember2025-09-300001035443are:A3.80UnsecuredSeniorNotesPayableMember2025-01-012025-09-300001035443are:A3.95UnsecuredSeniorNotesPayableMember2025-09-300001035443are:A3.95UnsecuredSeniorNotesPayableMember2025-01-012025-09-300001035443are:A3.95UnsecuredSeniorNotesPayableDuein2028Member2025-09-300001035443are:A3.95UnsecuredSeniorNotesPayableDuein2028Member2025-01-012025-09-300001035443are:UnsecuredSeniorNotesDueinJuly2029Member2025-09-300001035443are:UnsecuredSeniorNotesDueinJuly2029Member2025-01-012025-09-300001035443are:A2.75UnsecuredSeniorNotesPayableDue2029Member2025-09-300001035443are:A2.75UnsecuredSeniorNotesPayableDue2029Member2025-01-012025-09-300001035443are:A4.70UnsecuredSeniorNotesPayableMember2025-09-300001035443are:A4.70UnsecuredSeniorNotesPayableMember2025-01-012025-09-300001035443are:A4.90UnsecuredSeniorNotesPayableMember2025-09-300001035443are:A4.90UnsecuredSeniorNotesPayableMember2025-01-012025-09-300001035443are:A3.375UnsecuredSeniorNotesPayableMember2025-09-300001035443are:A3.375UnsecuredSeniorNotesPayableMember2025-01-012025-09-300001035443are:A200UnsecuredSeniorNotesPayableMember2025-09-300001035443are:A200UnsecuredSeniorNotesPayableMember2025-01-012025-09-300001035443are:A1875UnsecuredSeniorNotesPayableMember2025-09-300001035443are:A1875UnsecuredSeniorNotesPayableMember2025-01-012025-09-300001035443are:A295UnsecuredSeniorNotesPayableMember2025-09-300001035443are:A295UnsecuredSeniorNotesPayableMember2025-01-012025-09-300001035443are:A475UnsecuredSeniorNotesPayableMember2025-09-300001035443are:A475UnsecuredSeniorNotesPayableMember2025-01-012025-09-300001035443are:A5.50UnsecuredSeniorNotesPayableMember2025-09-300001035443are:A5.50UnsecuredSeniorNotesPayableMember2025-01-012025-09-300001035443are:A5.25UnsecuredSeniorNotesPayableMember2025-09-300001035443are:A5.25UnsecuredSeniorNotesPayableMember2025-01-012025-09-300001035443are:A4.85UnsecuredSeniorNotePayableMember2025-09-300001035443are:A4.85UnsecuredSeniorNotePayableMember2025-01-012025-09-300001035443are:A4.00UnsecuredSeniorNotesPayableMember2025-09-300001035443are:A4.00UnsecuredSeniorNotesPayableMember2025-01-012025-09-300001035443are:A300UnsecuredSeniorNotesPayableMember2025-09-300001035443are:A300UnsecuredSeniorNotesPayableMember2025-01-012025-09-300001035443are:A355UnsecuredSeniorNotesPayableMember2025-09-300001035443are:A355UnsecuredSeniorNotesPayableMember2025-01-012025-09-300001035443are:A515UnsecuredSeniorNotesPayableMember2025-09-300001035443are:A515UnsecuredSeniorNotesPayableMember2025-01-012025-09-300001035443are:A5.625UnsecuredSeniorNotesPayableMember2025-09-300001035443are:A5.625UnsecuredSeniorNotesPayableMember2025-01-012025-09-300001035443us-gaap:UnsecuredDebtMember2025-09-300001035443us-gaap:SeniorNotesMember2025-09-300001035443us-gaap:SeniorNotesMember2025-01-012025-09-300001035443us-gaap:LineOfCreditMember2025-09-300001035443us-gaap:CommercialPaperMember2025-09-300001035443us-gaap:CommercialPaperMember2025-01-012025-09-300001035443are:A5.25UnsecuredSeniorNotesPayableMember2025-02-280001035443are:A3.45unsecuredseniornotespayableduein2025Member2025-04-300001035443are:A3.45unsecuredseniornotespayableduein2025Member2025-04-012025-04-280001035443us-gaap:LineOfCreditMember2025-01-012025-09-300001035443us-gaap:LineOfCreditMember2025-01-012025-03-310001035443us-gaap:LineOfCreditMember2024-01-012024-12-310001035443us-gaap:CommercialPaperMembersrt:MinimumMember2025-01-012025-09-300001035443us-gaap:CommercialPaperMembersrt:MaximumMember2025-01-012025-09-300001035443are:A99CoolidgeAvenueMemberare:SecuredNotesPayableMaturingOn111926Member2025-07-012025-09-300001035443are:A99CoolidgeAvenueMemberare:SecuredNotesPayableMaturingOn111926Member2025-06-300001035443us-gaap:CurrencySwapMemberus-gaap:DesignatedAsHedgingInstrumentMember2025-09-300001035443us-gaap:CurrencySwapMemberus-gaap:NetInvestmentHedgingMember2025-07-012025-09-300001035443us-gaap:CurrencySwapMemberus-gaap:NetInvestmentHedgingMember2025-01-012025-09-3000010354432025-01-012025-03-310001035443are:ATMCommonStockOfferingProgramEstablishedFebruary2024Member2024-02-150001035443are:ATMCommonStockOfferingProgramEstablishedFebruary2024Member2025-09-3000010354432025-04-012025-06-300001035443us-gaap:CorporateMember2025-01-012025-09-300001035443us-gaap:CorporateAndOtherMember2025-01-012025-09-300001035443us-gaap:AllOtherSegmentsMember2025-01-012025-09-300001035443are:IncomeFromRentalsMemberus-gaap:ReportableSegmentAggregationBeforeOtherOperatingSegmentMember2025-07-012025-09-300001035443are:IncomeFromRentalsMemberus-gaap:ReportableSegmentAggregationBeforeOtherOperatingSegmentMember2024-07-012024-09-300001035443are:IncomeFromRentalsMemberus-gaap:ReportableSegmentAggregationBeforeOtherOperatingSegmentMember2025-01-012025-09-300001035443are:IncomeFromRentalsMemberus-gaap:ReportableSegmentAggregationBeforeOtherOperatingSegmentMember2024-01-012024-09-300001035443us-gaap:ProductAndServiceOtherMemberus-gaap:ReportableSegmentAggregationBeforeOtherOperatingSegmentMember2025-07-012025-09-300001035443us-gaap:ProductAndServiceOtherMemberus-gaap:ReportableSegmentAggregationBeforeOtherOperatingSegmentMember2024-07-012024-09-300001035443us-gaap:ProductAndServiceOtherMemberus-gaap:ReportableSegmentAggregationBeforeOtherOperatingSegmentMember2025-01-012025-09-300001035443us-gaap:ProductAndServiceOtherMemberus-gaap:ReportableSegmentAggregationBeforeOtherOperatingSegmentMember2024-01-012024-09-300001035443us-gaap:ReportableSegmentAggregationBeforeOtherOperatingSegmentMember2025-07-012025-09-300001035443us-gaap:ReportableSegmentAggregationBeforeOtherOperatingSegmentMember2024-07-012024-09-300001035443us-gaap:ReportableSegmentAggregationBeforeOtherOperatingSegmentMember2025-01-012025-09-300001035443us-gaap:ReportableSegmentAggregationBeforeOtherOperatingSegmentMember2024-01-012024-09-300001035443us-gaap:AllOtherSegmentsMember2025-07-012025-09-300001035443us-gaap:AllOtherSegmentsMember2024-07-012024-09-300001035443us-gaap:AllOtherSegmentsMember2024-01-012024-09-300001035443us-gaap:ReportableSegmentAggregationBeforeOtherOperatingSegmentMember2025-09-300001035443us-gaap:ReportableSegmentAggregationBeforeOtherOperatingSegmentMember2024-12-310001035443us-gaap:AllOtherSegmentsMember2025-09-300001035443us-gaap:AllOtherSegmentsMember2024-12-310001035443are:A2285RutherfordRoadAnd7TriangleDriveMemberare:OperatingPropertiesMember2025-09-300001035443are:A2285RutherfordRoadAnd7TriangleDriveMemberus-gaap:SubsequentEventMember2025-10-012025-10-310001035443are:A601KeystoneParkDriveMemberus-gaap:SubsequentEventMember2025-10-012025-10-31
UNITED STATES
SECURITIES AND EXCHANGE COMMISSION
Washington, D.C. 20549
FORM 10-Q 
(Mark One)
    QUARTERLY REPORT PURSUANT TO SECTION 13 OR 15(d) OF THE SECURITIES
          EXCHANGE ACT OF 1934 
For the quarterly period ended September 30, 2025
OR
    TRANSITION REPORT PURSUANT TO SECTION 13 OR 15(d) OF THE SECURITIES
EXCHANGE ACT OF 1934
For the transition period from ____________ to ____________
Commission file number 1-12993
ALEXANDRIA REAL ESTATE EQUITIES, INC.
(Exact name of registrant as specified in its charter)
Maryland
 
95-4502084
(State or other jurisdiction of
incorporation or organization)
 
(I.R.S. Employer Identification Number)
 26 North Euclid Avenue, Pasadena, California 91101
(Address of principal executive offices) (Zip code)
(626) 578-0777
(Registrant’s telephone number, including area code)
N/A
(Former name, former address and former fiscal year, if changed since last report)
Securities registered pursuant to Section 12(b) of the Exchange Act:
Title of each class
Trading Symbol(s)
Name of each exchange on which registered
Common Stock, $0.01 par value per share
ARE
New York Stock Exchange
Indicate by check mark whether the registrant (1) has filed all reports required to be filed by Section 13 or 15(d) of the Securities
Exchange Act of 1934 during the preceding 12 months (or for such shorter period that the registrant was required to file such reports),
and (2) has been subject to such filing requirements for the past 90 days. Yes   No 
Indicate by check mark whether the registrant has submitted electronically every Interactive Data File required to be submitted and
posted pursuant to Rule 405 of Regulation S-T (§ 232.405 of this chapter) during the preceding 12 months (or for such shorter period
that the registrant was required to submit and post such files). Yes   No 
Indicate by check mark whether the registrant is a large accelerated filer, an accelerated filer, a non-accelerated filer, a smaller reporting
company, or an emerging growth company. See the definitions of “large accelerated filer,” “accelerated filer,” “smaller reporting
company,” and “emerging growth company” in Rule 12b-2 of the Exchange Act.
Large accelerated filer
Smaller reporting company 
Accelerated filer 
Emerging growth company 
Non-accelerated filer
If an emerging growth company, indicate by check mark if the registrant has elected not to use the extended transition period for
complying with any new or revised financial accounting standards provided pursuant to Section 13(a) of the Exchange Act.
Indicate by check mark whether the registrant is a shell company (as defined in Rule 12b-2 of the Exchange Act). Yes   No
As of October 15, 2025, 172,825,059 shares of common stock, par value $0.01 per share, were outstanding.
i
TABLE OF CONTENTS
 
 
Page


Consolidated Balance Sheets as of September 30, 2025 and December 31, 2024 ..................................................
 
Consolidated Financial Statements for the Three and Nine Months Ended September 30, 2025 and 2024:
 
Consolidated Statements of Operations ...................................................................................................................
 
 
Consolidated Statements of Comprehensive Income ............................................................................................


Consolidated Statements of Cash Flows for the Nine Months Ended September 30, 2025 and 2024 ...................
 
 
Notes to Consolidated Financial Statements ....................................................................................................................
 
OPERATIONS ........................................................................................................................................................................
 
 
QUANTITATIVE AND QUALITATIVE DISCLOSURES ABOUT MARKET RISK .........................................................
 
 
CONTROLS AND PROCEDURES .....................................................................................................................................
LEGAL PROCEEDINGS ......................................................................................................................................................
RISK FACTORS ....................................................................................................................................................................
UNREGISTERED SALES OF EQUITY SECURITIES AND USE OF PROCEEDS ...................................................
OTHER INFORMATION .......................................................................................................................................................
EXHIBITS ...............................................................................................................................................................................
 
 
SIGNATURES .................................................................................................................................................................................................
ii
GLOSSARY
The following abbreviations or acronyms that may be used in this document
shall have the adjacent meanings set forth below:
ASU
Accounting Standards Update
ATM
At the Market
CAD
Canadian Dollar
CIP
Construction in Progress
EPS
Earnings per Share
FASB
Financial Accounting Standards Board
FFO
Funds From Operations
GAAP
U.S. Generally Accepted Accounting Principles
IRS
Internal Revenue Service
JV
Joint Venture
Nareit
National Association of Real Estate Investment Trusts
NAV
Net Asset Value
NYSE
New York Stock Exchange
REIT
Real Estate Investment Trust
RSF
Rentable Square Feet/Foot
SEC
Securities and Exchange Commission
SF
Square Feet/Foot
SoDo
South of Downtown submarket of Seattle
SOFR
Secured Overnight Financing Rate
SoMa
South of Market submarket of the San Francisco Bay Area
U.S.
United States
USD
U.S. Dollar
VIE
Variable Interest Entity
1
PART I – FINANCIAL INFORMATION
ITEM 1. FINANCIAL STATEMENTS (UNAUDITED)
Alexandria Real Estate Equities, Inc.
Consolidated Balance Sheets
(In thousands)
September 30, 2025
December 31, 2024
(Unaudited)
Assets
Investments in real estate
$31,743,917
$32,110,039
Investments in unconsolidated real estate joint ventures
39,601
39,873
Cash and cash equivalents
579,474
552,146
Restricted cash
4,705
7,701
Tenant receivables
6,409
6,409
Deferred rent
1,257,378
1,187,031
Deferred leasing costs
505,241
485,959
Investments
1,537,638
1,476,985
Other assets
1,700,785
1,661,306
Total assets
$37,375,148
$37,527,449
Liabilities, Noncontrolling Interests, and Equity
Secured notes payable
$
$149,909
Unsecured senior notes payable
12,044,999
12,094,465
Unsecured senior line of credit and commercial paper
1,548,542
Accounts payable, accrued expenses, and other liabilities
2,432,726
2,654,351
Dividends payable
230,603
230,263
Total liabilities
16,256,870
15,128,988
Commitments and contingencies
Redeemable noncontrolling interests
58,662
19,972
Alexandria Real Estate Equities, Inc.’s stockholders’ equity:
Common stock
1,703
1,722
Additional paid-in capital
16,669,802
17,933,572
Accumulated other comprehensive loss
(32,203)
(46,252)
Alexandria Real Estate Equities, Inc.’s stockholders’ equity
16,639,302
17,889,042
Noncontrolling interests
4,420,314
4,489,447
Total equity
21,059,616
22,378,489
Total liabilities, noncontrolling interests, and equity
$37,375,148
$37,527,449
The accompanying notes are an integral part of these consolidated financial statements.
2
Alexandria Real Estate Equities, Inc.
Consolidated Statements of Operations
(In thousands, except per share amounts)
(Unaudited)
Three Months Ended
September 30,
Nine Months Ended
September 30,
2025
2024
2025
2024
Revenues:
Income from rentals
$735,849
$775,744
$2,216,303
$2,286,457
Other income
16,095
15,863
55,839
40,992
Total revenues
751,944
791,607
2,272,142
2,327,449
Expenses:
Rental operations
239,234
233,265
690,062
668,833
General and administrative
29,224
43,945
89,027
135,629
Interest
54,852
43,550
161,024
130,179
Depreciation and amortization
340,230
293,998
1,028,415
872,272
Impairment of real estate
323,870
5,741
485,630
36,504
Loss on early extinguishment of debt
107
107
Total expenses
987,517
620,499
2,454,265
1,843,417
Equity in earnings (losses) of unconsolidated real estate joint
ventures
201
139
(9,327)
424
Investment income (loss)
28,161
15,242
(52,453)
14,866
Gain on sales of real estate
9,366
27,114
22,531
27,506
Net (loss) income
(197,845)
213,603
(221,372)
526,828
Net income attributable to noncontrolling interests
(34,909)
(45,656)
(127,323)
(141,634)
Net (loss) income attributable to Alexandria Real Estate Equities,
Inc.’s stockholders
(232,754)
167,947
(348,695)
385,194
Net income attributable to unvested restricted stock awards
(2,183)
(3,273)
(7,452)
(10,717)
Net (loss) income attributable to Alexandria Real Estate Equities,
Inc.’s common stockholders
$(234,937)
$164,674
$(356,147)
$374,477
Net (loss) income per share attributable to Alexandria Real Estate
Equities, Inc.’s common stockholders:
Basic
$(1.38)
$0.96
$(2.09)
$2.18
Diluted
$(1.38)
$0.96
$(2.09)
$2.18
The accompanying notes are an integral part of these consolidated financial statements.
3
Alexandria Real Estate Equities, Inc.
Consolidated Statements of Comprehensive Income
(In thousands)
(Unaudited)
Three Months Ended September 30,
Nine Months Ended September 30,
2025
2024
2025
2024
Net (loss) income
$(197,845)
$213,603
$(221,372)
$526,828
Other comprehensive (loss) income
Unrealized (losses) gains on foreign currency
translation:
Unrealized gains related to net investment hedge
2,970
2,970
Unrealized foreign currency translation (losses)
gains arising during the period
(7,758)
5,056
11,079
(6,758)
Reclassification adjustment for losses included in net
income
125
125
Unrealized (losses) gains on foreign currency
translation, net
(4,788)
5,181
14,049
(6,633)
Total other comprehensive (loss) income
(4,788)
5,181
14,049
(6,633)
Comprehensive (loss) income
(202,633)
218,784
(207,323)
520,195
Less: comprehensive income attributable to
noncontrolling interests
(34,909)
(45,656)
(127,323)
(141,634)
Comprehensive (loss) income attributable to Alexandria
Real Estate Equities, Inc.’s stockholders
$(237,542)
$173,128
$(334,646)
$378,561
The accompanying notes are an integral part of these consolidated financial statements.
4
Alexandria Real Estate Equities, Inc.
Consolidated Statement of Changes in Stockholders’ Equity and Noncontrolling Interests
(Dollars in thousands)
(Unaudited)
Alexandria Real Estate Equities, Inc.’s Stockholders’ Equity
Number of
Common
Shares
Common
Stock
Additional
Paid-In
Capital
Retained
Earnings
Accumulated
Other
Comprehensive
Loss
Noncontrolling
Interests
Total
Equity
Redeemable
Noncontrolling
Interests
Balance as of June 30, 2025
170,146,069
$1,701
$17,200,949
$
$(27,415)
$4,554,156
$21,729,391
$9,612
Net (loss) income
(232,754)
34,368
(198,386)
541
Total other comprehensive loss
(4,788)
(4,788)
Contributions from and sales of noncontrolling interests
36,107
36,107
Distributions to and redemption of noncontrolling interests
(66,317)
(175,607)
(241,924)
(201)
Transfer of noncontrolling interests
(48,710)
(48,710)
48,710
Reallocation of capital to joint venture partner
(20,000)
20,000
Issuance pursuant to stock plan
321,057
4
26,995
26,999
Taxes related to net settlement of equity awards
(128,046)
(2)
(10,944)
(10,946)
Dividends declared on common stock ($1.32 per share)
(228,127)
(228,127)
Reclassification of distributions and net loss
(460,881)
460,881
Balance as of September 30, 2025
170,339,080
$1,703
$16,669,802
$
$(32,203)
$4,420,314
$21,059,616
$58,662
The accompanying notes are an integral part of these consolidated financial statements.
5
Alexandria Real Estate Equities, Inc.
Consolidated Statement of Changes in Stockholders’ Equity and Noncontrolling Interests
(Dollars in thousands)
(Unaudited)
Alexandria Real Estate Equities, Inc.’s Stockholders’ Equity
Number of
Common
Shares
Common
Stock
Additional
Paid-In
Capital
Retained
Earnings
Accumulated
Other
Comprehensive
Loss
Noncontrolling
Interests
Total
Equity
Redeemable
Noncontrolling
Interests
Balance as of June 30, 2024
172,017,674
$1,720
$18,284,611
$
$(27,710)
$4,391,806
$22,650,427
$16,440
Net income
167,947
45,385
213,332
271
Total other comprehensive income
5,181
5,181
Contributions from and sales of noncontrolling interests
490
91,118
91,608
Distributions to and redemption of noncontrolling interests
(59,000)
(59,000)
(201)
Issuance pursuant to stock plan
376,781
4
31,235
31,239
Taxes related to net settlement of equity awards
(150,054)
(2)
(18,654)
(18,656)
Dividends declared on common stock ($1.30 per share)
(227,191)
(227,191)
Reclassification of distributions in excess of earnings
(59,244)
59,244
Balance as of September 30, 2024
172,244,401
$1,722
$18,238,438
$
$(22,529)
$4,469,309
$22,686,940
$16,510
The accompanying notes are an integral part of these consolidated financial statements.
6
Alexandria Real Estate Equities, Inc.
Consolidated Statement of Changes in Stockholders’ Equity and Noncontrolling Interests
(Dollars in thousands)
(Unaudited)
Alexandria Real Estate Equities, Inc.’s Stockholders’ Equity
Number of
Common
Shares
Common
Stock
Additional
Paid-In
Capital
Retained
Earnings
Accumulated
Other
Comprehensive
Loss
Noncontrolling
Interests
Total
Equity
Redeemable
Noncontrolling
Interests
Balance as of December 31, 2024
172,203,443
$1,722
$17,933,572
$
$(46,252)
$4,489,447
$22,378,489
$19,972
Net (loss) income
(348,695)
126,311
(222,384)
1,012
Total other comprehensive income
14,049
14,049
Contributions from and sales of noncontrolling interests
73
132,089
132,162
Distributions to and redemption of noncontrolling interests
(73,365)
(298,823)
(372,188)
(11,032)
Transfer of noncontrolling interests
(48,710)
(48,710)
48,710
Reallocation of capital to joint venture partner
(20,000)
20,000
Issuance pursuant to stock plan
472,123
5
87,526
87,531
Taxes related to net settlement of equity awards
(184,193)
(2)
(16,372)
(16,374)
Repurchase of common stock
(2,152,293)
(22)
(208,165)
(208,187)
Dividends declared on common stock ($3.96 per share)
(684,772)
(684,772)
Reclassification of distributions and net loss
(1,033,467)
1,033,467
Balance as of September 30, 2025
170,339,080
$1,703
$16,669,802
$
$(32,203)
$4,420,314
$21,059,616
$58,662
The accompanying notes are an integral part of these consolidated financial statements.
7
Alexandria Real Estate Equities, Inc.
Consolidated Statement of Changes in Stockholders’ Equity and Noncontrolling Interests
(Dollars in thousands)
(Unaudited)
Alexandria Real Estate Equities, Inc.’s Stockholders’ Equity
Number of
Common
Shares
Common
Stock
Additional
Paid-In
Capital
Retained
Earnings
Accumulated
Other
Comprehensive
Loss
Noncontrolling
Interests
Total
Equity
Redeemable
Noncontrolling
Interests
Balance as of December 31, 2023
171,910,599
$1,719
$18,485,352
$
$(15,896)
$4,135,338
$22,606,513
$16,480
Net income
385,194
140,820
526,014
814
Total other comprehensive loss
(6,633)
(6,633)
Contributions from and sales of noncontrolling interests
8,190
350,003
358,193
Distributions to and redemption of noncontrolling interests
(8,084)
(186,787)
(194,871)
(1,034)
Transfer of noncontrolling interests
(250)
(250)
250
Reallocation of capital to joint venture partner
(30,185)
30,185
Issuance pursuant to stock plan
555,959
6
101,302
101,308
Taxes related to net settlement of equity awards
(222,157)
(3)
(26,598)
(26,601)
Dividends declared on common stock ($3.87 per share)
(676,733)
(676,733)
Reclassification of distributions in excess of earnings
(291,539)
291,539
Balance as of September 30, 2024
172,244,401
$1,722
$18,238,438
$
$(22,529)
$4,469,309
$22,686,940
$16,510
The accompanying notes are an integral part of these consolidated financial statements.
8
Alexandria Real Estate Equities, Inc.
Consolidated Statements of Cash Flows
(In thousands)
(Unaudited)
Nine Months Ended September 30,
2025
2024
Operating Activities:
Net (loss) income
$(221,372)
$526,828
Adjustments to reconcile net (loss) income to net cash provided by operating activities:
Depreciation and amortization
1,028,415
872,272
Impairment of real estate
485,630
36,504
Gain on sales of real estate
(22,531)
(27,506)
Loss on early extinguishment of debt
107
Equity in losses (earnings) of unconsolidated real estate joint ventures
9,327
(424)
Distributions of earnings from unconsolidated real estate joint ventures
1,749
2,637
Amortization of loan fees
13,811
12,510
Amortization of debt discounts
1,009
976
Amortization of acquired above- and below-market leases
(31,874)
(70,167)
Deferred rent
(59,380)
(125,676)
Stock compensation expense
32,887
47,157
Investment loss (income)
52,453
(14,866)
Changes in operating assets and liabilities:
Tenant receivables
12
1,216
Deferred leasing costs
(64,259)
(74,608)
Other assets
(37,647)
(36,334)
Accounts payable, accrued expenses, and other liabilities
(86,669)
79,827
Net cash provided by operating activities
1,101,668
1,230,346
Investing Activities:
Proceeds from sales of real estate
227,105
229,790
Additions to real estate
(1,538,613)
(1,932,351)
Purchases of real estate
(201,049)
Change in escrow deposits
(7,364)
(5,512)
Investments in unconsolidated real estate joint ventures
(11,239)
(4,039)
Return of capital from unconsolidated real estate joint ventures
458
Additions to non-real estate investments
(184,952)
(185,560)
Sales of and distributions from non-real estate investments
77,067
141,762
Net cash used in investing activities
$(1,437,538)
$(1,956,959)
9
Alexandria Real Estate Equities, Inc.
Consolidated Statements of Cash Flows
(In thousands)
(Unaudited)
Nine Months Ended September 30,
2025
2024
Financing Activities:
Borrowings under secured note payable
$4,031
$24,853
Repayments of borrowings from secured notes payable
(154,212)
(32)
Proceeds from issuance of unsecured senior notes payable
548,532
998,806
Repayment of unsecured senior notes payable
(600,000)
Proceeds from issuances under commercial paper program
15,378,015
7,935,600
Repayments of borrowings under commercial paper program
(13,828,015)
(7,580,600)
Payments of loan fees
(5,307)
(36,366)
Taxes paid related to net settlement of equity awards
(17,207)
(45,670)
Repurchase of common stock
(208,187)
Dividends on common stock
(684,419)
(671,366)
Contributions from and sales of noncontrolling interests
132,162
251,252
Distributions to and purchases of noncontrolling interests
(204,543)
(231,072)
Net cash provided by financing activities
360,850
645,405
Effect of foreign exchange rate changes on cash and cash equivalents
(648)
74
Net increase (decrease) in cash, cash equivalents, and restricted cash
24,332
(81,134)
Cash, cash equivalents, and restricted cash as of the beginning of period
559,847
660,771
Cash, cash equivalents, and restricted cash as of the end of period
$584,179
$579,637
Supplemental Disclosure and Non-Cash Investing and Financing Activities:
Cash paid during the period for interest, net of interest capitalized
$128,808
$87,660
Accrued construction for current-period additions to real estate
$233,622
$419,072
Transfer of real estate assets and/or equipment from tenants
$171,153
$107,562
Notes receivable issued in connection with sales of real estate
$91,000
$
Derecognition of net investment in real estate from sales-type lease
$4,677
$
Contribution of assets from and issuance of noncontrolling interest to real estate joint
venture partner
$
$106,941
Reallocation of additional paid-in capital to consolidated joint venture partner’s noncontrolling
interest
$20,000
$30,185
Initial recognition of right-of-use asset and lease liability
$
$265,110
Exchange of joint venture interests(1):
Disposition of our interest in Pacific Technology Park
$82,392
$
Acquisition of our partner’s noncontrolling interest in 199 East Blaine Street
$96,543
$
(1)Refer to Note 4 – “Consolidated and unconsolidated real estate joint ventures” for additional information.
The accompanying notes are an integral part of these consolidated financial statements.
10
Alexandria Real Estate Equities, Inc.
Notes to Consolidated Financial Statements
(Unaudited)
1.ORGANIZATION AND BASIS OF PRESENTATION
Alexandria Real Estate Equities, Inc. (NYSE: ARE), an S&P 500® life science REIT, is the pioneer of the life science real estate
niche since its founding in 1994. Alexandria is the preeminent and longest-tenured owner, operator, and developer of collaborative
Megacampus™ ecosystems in AAA life science innovation cluster locations, including Greater Boston, the San Francisco Bay Area,
San Diego, Seattle, Maryland, Research Triangle, and New York City. As of September 30, 2025, Alexandria has a total market
capitalization of $27.8 billion and an asset base in North America that includes 39.1 million RSF of operating properties and 4.2 million
RSF of Class A/A+ properties undergoing construction and one 100% pre-leased committed near-term project expected to commence
construction in the next year. As used in this quarterly report on Form 10-Q, references to the “Company,” “Alexandria,” “ARE,” “we,”
“us,” and “our” refer to Alexandria Real Estate Equities, Inc. and its consolidated subsidiaries. The accompanying unaudited
consolidated financial statements include the accounts of Alexandria Real Estate Equities, Inc. and its consolidated subsidiaries. All
significant intercompany balances and transactions have been eliminated.
We have prepared the accompanying interim consolidated financial statements in accordance with GAAP and in conformity
with the rules and regulations of the SEC. In our opinion, these interim consolidated financial statements presented herein reflect all
adjustments, of a normal recurring nature, that are necessary to fairly present the interim consolidated financial statements. The results
of operations for the interim period are not necessarily indicative of the results that may be expected for the year ending December 31,
2025. These unaudited consolidated financial statements should be read in conjunction with the audited consolidated financial
statements and the notes thereto included in our annual report on Form 10-K for the year ended December 31, 2024. Any references to
our total market capitalization, number or quality of buildings or tenants, quality of location, square footage, number of leases, or
occupancy percentage, and any amounts derived from these values in these notes to consolidated financial statements are outside the
scope of our independent registered public accounting firm’s procedures.
2.SUMMARY OF SIGNIFICANT ACCOUNTING POLICIES
Consolidation
On an ongoing basis, as circumstances indicate the need for reconsideration, we evaluate each legal entity that is not wholly
owned by us in accordance with the consolidation accounting guidance. Our evaluation considers all of our variable interests, including
equity ownership, as well as fees paid to us for our involvement in the management of each partially owned entity. To fall within the
scope of the consolidation guidance, an entity must meet both of the following criteria:
The entity has a legal structure that has been established to conduct business activities and to hold assets; such entity
can be in the form of a partnership, limited liability company, or corporation, among others; and
We have a variable interest in the legal entity — i.e., variable interests that are contractual, such as equity ownership, or
other financial interests that change with changes in the fair value of the entity’s net assets.
If an entity does not meet both criteria above, we apply other accounting literature, such as the equity method of accounting. If
an entity does meet both criteria above, we evaluate such entity for consolidation under either the variable interest model if the legal
entity meets any of the characteristics below to qualify as a VIE, or under the voting model for all other legal entities that are not VIEs.
A legal entity is determined to be a VIE if it has any of the following three characteristics:
1)The entity does not have sufficient equity to finance its activities without additional subordinated financial support;
2)The entity is established with non-substantive voting rights (i.e., the entity deprives the majority economic interest
holder(s) of voting rights); or
3)The equity holders, as a group, lack the characteristics of a controlling financial interest. Equity holders meet this criterion
if they lack any of the following:
The power, through voting rights or similar rights, to direct the activities of the entity that most significantly influence
the entity’s economic performance, as evidenced by:
Substantive participating rights in day-to-day management of the entity’s activities; or
Substantive kick-out rights over the party responsible for significant decisions;
The obligation to absorb the entity’s expected losses; or
The right to receive the entity’s expected residual returns.
11
2.SUMMARY OF SIGNIFICANT ACCOUNTING POLICIES (continued)
For an entity, including our real estate joint ventures, structured as a limited partnership or a limited liability company, our
evaluation of whether the equity holders (equity partners other than the general partner or the managing member of a joint venture) lack
the characteristics of a controlling financial interest includes the evaluation of whether the limited partners or non-managing members
(the noncontrolling equity holders) lack both substantive participating rights and substantive kick-out rights, defined as follows:
Participating rights provide the noncontrolling equity holders the ability to direct significant financial and operating
decisions made in the ordinary course of business that most significantly influence the entity’s economic performance.
Kick-out rights allow the noncontrolling equity holders to remove the general partner or managing member without cause.
If we conclude that any of the three characteristics of a VIE are met, including that the equity holders lack the characteristics of
a controlling financial interest because they lack both substantive participating rights and substantive kick-out rights, we conclude that
the entity is a VIE and evaluate it for consolidation under the variable interest model.
Variable interest model
If an entity is determined to be a VIE, we evaluate whether we are the primary beneficiary. The primary beneficiary analysis is
a qualitative analysis based on power and benefits. We consolidate a VIE if we have both power and benefits — that is, (i) we have the
power to direct the activities of a VIE that most significantly influence the VIE’s economic performance (power) and (ii) we have the
obligation to absorb losses of or the right to receive benefits from the VIE that could potentially be significant to the VIE (benefits). We
consolidate VIEs whenever we determine that we are the primary beneficiary. Refer to Note 4 – “Consolidated and unconsolidated real
estate joint ventures” and Note 7 – “Investments” to our unaudited consolidated financial statements for information on specific entities
that qualify as VIEs. If we have a variable interest in a VIE but are not the primary beneficiary, we account for our investment using the
equity method.
Voting model
If a legal entity fails to meet any of the three characteristics of a VIE (i.e., insufficiency of equity, existence of non-substantive
voting rights, or lack of a controlling financial interest), we then evaluate such entity under the voting model. Under the voting model, we
consolidate the entity if we determine that we, directly or indirectly, have greater than 50% of the voting shares (or own a majority of the
limited partnership’s kick-out rights through voting interests), and that other equity holders do not have substantive participating rights.
Refer to Note 4 – “Consolidated and unconsolidated real estate joint ventures” to our unaudited consolidated financial statements for
information on specific joint ventures that qualify for evaluation under the voting model.
Noncontrolling interests in consolidated real estate joint ventures
Noncontrolling interests represent the third-party interests in consolidated real estate joint ventures in which we have a
controlling interest. Certain of our noncontrolling interests have the right to require us to redeem their ownership interests in the
respective entities. We classify the ownership interests in these entities as redeemable noncontrolling interests outside of total equity in
our consolidated balance sheets. Redeemable noncontrolling interests are adjusted for additional contributions and distributions, the
proportionate share of net earnings or losses, and other comprehensive income or loss. If the amount of a redeemable noncontrolling
interest is less than the maximum redemption value at the balance sheet date, such amount is adjusted to the maximum redemption
value. Subsequent declines in the redemption value are recognized only to the extent that previous increases have been recognized.
Use of estimates
The preparation of consolidated financial statements in conformity with GAAP requires us to make estimates and assumptions
that affect the reported amounts of assets, liabilities, and equity; the disclosure of contingent assets and liabilities as of the date of the
consolidated financial statements; and the amounts of revenues and expenses during the reporting period. Actual results could
materially differ from those estimates.
12
2.SUMMARY OF SIGNIFICANT ACCOUNTING POLICIES (continued)
Investments in real estate
Evaluation of business combination or asset acquisition
We evaluate each acquisition of real estate or in-substance real estate (including equity interests in entities that predominantly
hold real estate assets) to determine whether the integrated set of assets and activities acquired meets the definition of a business and
needs to be accounted for as a business combination. An acquisition of an integrated set of assets and activities that does not meet the
definition of a business is accounted for as an asset acquisition. If either of the following criteria is met, the integrated set of assets and
activities acquired would not qualify as a business:
Substantially all of the fair value of the gross assets acquired is concentrated in either a single identifiable asset or a group
of similar identifiable assets; or
The integrated set of assets and activities is lacking, at a minimum, an input and a substantive process that together
significantly contribute to the ability to create outputs (i.e., revenue generated before and after the transaction).
An acquired process is considered substantive if:
The process includes an organized workforce (or includes an acquired contract that provides access to an organized
workforce) that is skilled, knowledgeable, and experienced in performing the process;
The process cannot be replaced without significant cost, effort, or delay; or
The process is considered unique or scarce.
Generally, our acquisitions of real estate or in-substance real estate do not meet the definition of a business because
substantially all of the fair value is concentrated in a single identifiable asset or group of similar identifiable assets (i.e., land, buildings,
and related intangible assets) or because the acquisition does not include a substantive process in the form of an acquired workforce or
an acquired contract that cannot be replaced without significant cost, effort, or delay. When evaluating acquired service or management
contracts, we consider the nature of the services performed, the terms of the contract relative to similar arm’s-length contracts, and the
availability of comparable vendors in evaluating whether the acquired contract constitutes a substantive process.
Recognition of real estate acquired
We evaluate each acquisition of real estate or in-substance real estate (including equity interests in entities that predominantly
hold real estate assets) to determine whether the integrated set of assets and activities acquired meets the definition of a business and
needs to be accounted for as a business combination. An acquisition of an integrated set of assets and activities that does not meet the
definition of a business is accounted for as an asset acquisition.
For acquisitions of real estate or in-substance real estate that are accounted for as business combinations, we allocate the
acquisition consideration (excluding acquisition costs) to the assets acquired, liabilities assumed, noncontrolling interests, and
previously existing ownership interests at fair value as of the acquisition date. Assets include intangible assets such as tenant
relationships, acquired in-place leases, and favorable intangibles associated with in-place leases in which we are the lessor. Liabilities
include unfavorable intangibles associated with in-place leases in which we are the lessor. In addition, for acquired in-place finance or
operating leases in which we are the lessee, acquisition consideration is allocated to lease liabilities and related right-of-use assets,
adjusted to reflect favorable or unfavorable terms of the lease when compared with market terms. Any excess (deficit) of the
consideration transferred relative to the fair value of the net assets acquired is accounted for as goodwill (bargain purchase gain).
Acquisition costs related to business combinations are expensed as incurred.
Generally, we expect that acquisitions of real estate or in-substance real estate will not meet the definition of a business
because substantially all of the fair value is concentrated in a single identifiable asset or group of similar identifiable assets (i.e., land,
buildings, and related intangible assets). The accounting model for asset acquisitions is similar to the accounting model for business
combinations, except that the acquisition consideration (including acquisition costs) is allocated to the individual assets acquired and
liabilities assumed on a relative fair value basis. Any excess (deficit) of the consideration transferred relative to the sum of the fair value
of the assets acquired and liabilities assumed is allocated to the individual assets and liabilities based on their relative fair values. As a
result, asset acquisitions do not result in the recognition of goodwill or a bargain purchase gain. Incremental and external direct
acquisition costs related to acquisitions of real estate or in-substance real estate (such as legal and other third-party services) are
capitalized.
We exercise judgment to determine the key assumptions used to allocate the purchase price of real estate acquired among its
components. The allocation of the consideration to the various components of properties acquired during the year can have an effect on
our net income due to the useful depreciable and amortizable lives applicable to each component and the recognition of the related
depreciation and amortization expense in our consolidated statements of operations. We apply judgment in utilizing available
comparable market information to assess relative fair value. We assess the relative fair values of tangible and intangible assets and
liabilities based on available comparable market information, including estimated replacement costs, rental rates, and recent market
transactions. In addition, we may use estimated cash flow projections that utilize appropriate discount and capitalization rates.
13
2.SUMMARY OF SIGNIFICANT ACCOUNTING POLICIES (continued)
Estimates of future cash flows are based on a number of factors, including the historical operating results, known and anticipated
trends, and market/economic conditions that may affect the property.
The value of tangible assets acquired is based upon our estimation of fair value on an “as if vacant” basis. The value of
acquired in-place leases includes the estimated costs during the hypothetical lease-up period and other costs that would have been
incurred in the execution of similar leases under the market conditions at the acquisition date of the acquired in-place lease. If there is a
bargain fixed-rate renewal option for the period beyond the noncancelable lease term of an in-place lease, we evaluate intangible
factors, such as the business conditions in the industry in which the lessee operates, the economic conditions in the area in which the
property is located, and the ability of the lessee to sublease the property during the renewal term, in order to determine the likelihood
that the lessee will renew. When we determine that there is reasonable assurance that such bargain purchase option will be exercised,
we consider the option in determining the intangible value of such lease and its related amortization period. We also recognize the
relative fair values of assets acquired, the liabilities assumed, and any noncontrolling interest in acquisitions of less than a 100%
interest when the acquisition constitutes a change in control of the acquired entity.
Depreciation and amortization
The values allocated to buildings and building improvements, land improvements, tenant improvements, and equipment are
depreciated on a straight-line basis. For buildings and building improvements, we depreciate using the shorter of the respective ground
lease terms or their estimated useful lives, not to exceed 40 years. Land improvements are depreciated over their estimated useful
lives, not to exceed 20 years. Tenant improvements are depreciated over their respective lease terms or estimated useful lives, and
equipment is depreciated over the shorter of the lease term or its estimated useful life. The values of the right-of-use assets are
amortized on a straight-line basis over the remaining terms of each related lease. The values of acquired in-place leases and
associated favorable intangibles (i.e., acquired above-market leases) are classified in other assets in our consolidated balance sheets
and are amortized over the remaining terms of the related leases as a reduction of income from rentals in our consolidated statements
of operations. The values of unfavorable intangibles (i.e., acquired below-market leases) associated with acquired in-place leases are
classified in accounts payable, accrued expenses, and other liabilities in our consolidated balance sheets and are amortized over the
remaining terms of the related leases as an increase in income from rentals in our consolidated statements of operations.
Capitalized project costs
We capitalize project costs, including pre-construction costs, interest, property taxes, insurance, and other costs directly
related and essential to the development, redevelopment, pre-construction, or construction of a project. Capitalization of development,
redevelopment, pre-construction, and construction costs is required while activities are ongoing to prepare an asset for its intended use.
Fluctuations in our development, redevelopment, pre-construction, and construction activities could result in significant changes to total
expenses and net income. Costs incurred after a project is substantially complete and ready for its intended use are expensed as
incurred. Should development, redevelopment, pre-construction, or construction activity cease, interest, property taxes, insurance, and
certain other costs would no longer be eligible for capitalization and would be expensed as incurred. Expenditures for repairs and
maintenance are expensed as incurred.
Real estate sales
A property is classified as held for sale when all of the following criteria for a plan of sale have been met: (i) management,
having the authority to approve the action, commits to a plan to sell the property; (ii) the property is available for immediate sale in its
present condition, subject only to terms that are usual and customary; (iii) an active program to locate a buyer and other actions
required to complete the plan to sell have been initiated; (iv) the sale of the property is probable and is expected to be completed within
one year; (v) the property is being actively marketed for sale at a price that is reasonable in relation to its current fair value; and
(vi) actions necessary to complete the plan of sale indicate that it is unlikely that significant changes to the plan will be made or that the
plan will be withdrawn. Depreciation of assets ceases upon designation of a property as held for sale.
If the disposal of a property represents a strategic shift that has (or will have) a major effect on our operations or financial
results, such as (i) a major line of business, (ii) a major geographic area, (iii) a major equity method investment, or (iv) other major parts
of an entity, then the operations of the property, including any interest expense directly attributable to it, are classified as discontinued
operations in our consolidated statements of operations, and amounts for all prior periods presented are reclassified from continuing
operations to discontinued operations. The disposal of an individual property generally will not represent a strategic shift and therefore
will typically not meet the criteria for classification as a discontinued operation.
We recognize gains or losses on real estate sales in accordance with the accounting standard on the derecognition of
nonfinancial assets arising from contracts with noncustomers. Our ordinary output activities consist of the leasing of space to our
tenants in our operating properties, not the sales of real estate. Therefore, sales of real estate (in which we are the seller) qualify as
contracts with noncustomers. In our transactions with noncustomers, we apply certain recognition and measurement principles
consistent with our method of recognizing revenue arising from contracts with customers. Derecognition of the asset is based on the
transfer of control. If a real estate sales contract includes our ongoing involvement with the property, then we evaluate each promised
good or service under the contract to determine whether it represents a separate performance obligation, constitutes a guarantee, or
14
2.SUMMARY OF SIGNIFICANT ACCOUNTING POLICIES (continued)
prevents the transfer of control. If a good or service is considered a separate performance obligation, an allocated portion of the
transaction price is recognized as revenue as we transfer the related good or service to the buyer.
The recognition of gain or loss on the sale of a partial interest also depends on whether we retain a controlling or
noncontrolling interest in the property. If we retain a controlling interest in the property upon completion of the sale, we continue to
reflect the asset at its book value, record a noncontrolling interest for the book value of the partial interest sold, and recognize additional
paid-in capital for the difference between the consideration received and the partial interest at book value. Conversely, if we retain a
noncontrolling interest upon completion of the sale of a partial interest of real estate, we recognize a gain or loss as if 100% of the asset
were sold.
Impairment of long-lived assets
Prior to and subsequent to the end of each quarter, we review current activities and changes in the business conditions of all of
our long-lived assets to determine the existence of any triggering events or impairment indicators requiring an impairment analysis. If
triggering events or impairment indicators are identified, we review an estimate of the future undiscounted cash flows, including, if
necessary, a probability-weighted approach if multiple outcomes are under consideration.
Long-lived assets to be held and used, including our rental properties, CIP, land held for development, right-of-use assets
related to operating leases in which we are the lessee, and intangibles, are individually evaluated for impairment when conditions exist
that may indicate that the carrying amount of a long-lived asset may not be recoverable. The carrying amount of a long-lived asset to be
held and used is not recoverable if it exceeds the sum of the undiscounted cash flows expected to result from the use and eventual
disposition of the asset. Triggering events or impairment indicators for long-lived assets to be held and used are assessed by project
and include significant fluctuations in estimated net operating income, occupancy changes, significant near-term lease expirations,
current and historical operating and/or cash flow losses, construction costs, estimated completion dates, rental rates, and other market
factors. We assess the expected undiscounted cash flows based upon numerous factors, including, but not limited to, projected rental
rates, estimated exit capitalization rates, and anticipated construction costs for projects under construction, which are based on
available market information, current and historical operating results, known trends, current market/economic conditions that may affect
the asset, and our assumptions about the use of the asset, including, if necessary, a probability-weighted approach if multiple outcomes
are under consideration. 
Upon determination that an impairment has occurred, a write-down is recognized to reduce the carrying amount of the asset to
its estimated fair value. If an impairment charge is not required to be recognized, the recognition of depreciation or amortization is
adjusted prospectively, as necessary, to reduce the carrying amount of the asset to its estimated disposition value over the remaining
period that the asset is expected to be held and used. We may adjust depreciation of properties that are expected to be disposed of or
redeveloped prior to the end of their useful lives.
We use the held for sale impairment model for our properties classified as held for sale, which is different from the held and
used impairment model. Under the held for sale impairment model, an impairment charge is recognized if the carrying amount of the
long-lived asset classified as held for sale exceeds its fair value less cost to sell. Because of these two different models, it is possible for
a long-lived asset previously classified as held and used to require the recognition of an impairment charge upon classification as held
for sale.
International operations
In addition to operating properties in the U.S., we have 11 properties in Canada. The functional currency for our subsidiaries
operating in the U.S. is the U.S. dollar. The local currency of a foreign subsidiary serves as its functional currency. The assets and
liabilities of our foreign subsidiaries are translated into U.S. dollars at the exchange rate in effect as of the financial statement date.
Revenue and expense accounts of our foreign subsidiaries are translated using the weighted-average exchange rate for the periods
presented. Gains or losses resulting from the translation are classified in accumulated other comprehensive income (loss) as a
separate component of total equity and are excluded from net income (loss).
Whenever a foreign investment meets the criteria for classification as held for sale, we evaluate the recoverability of the
investment under the held for sale impairment model. We may recognize an impairment charge if the carrying amount of the investment
exceeds its fair value less cost to sell. In determining an investment’s carrying amount, we consider its net book value and any
cumulative unrealized foreign currency translation adjustment related to the investment.
The appropriate amounts of foreign exchange rate gains or losses classified in accumulated other comprehensive income
(loss) are reclassified to net income (loss) when realized upon the sale of our investment or upon the complete or substantially
complete liquidation of our investment.
15
2.SUMMARY OF SIGNIFICANT ACCOUNTING POLICIES (continued)
Investments
We hold investments in publicly traded companies and privately held entities primarily involved in the life science industry. As a
REIT, we generally limit our ownership of each individual entity’s voting stock to less than 10%. We evaluate each investment to
determine whether we have the ability to exercise significant influence, but not control, over an investee. We evaluate investments in
which our ownership is equal to or greater than 20%, but less than or equal to 50%, of an investee’s voting stock with a presumption
that we have this ability. For our investments in limited partnerships that maintain specific ownership accounts, we presume that such
ability exists when our ownership interest exceeds 3% to 5%. In addition to our ownership interest, we consider whether we have a
board seat or whether we participate in the investee’s policymaking process, among other criteria, to determine if we have the ability to
exert significant influence, but not control, over an investee. If we determine that we have such ability, we account for the investment
under the equity method, as described below. From time to time, we may hold equity investments in publicly traded companies that are
subject to temporary contractual sale restrictions. We do not recognize a discount related to a contractual sale restriction.
Investments accounted for under the equity method
Under the equity method of accounting, we initially recognize our investment at cost and subsequently adjust the carrying
amount of the investment for our share of earnings or losses reported by the investee, distributions received, and other-than-temporary
impairments. For additional information about our investments accounted for under the equity method, refer to Note 7 – “Investments” to
our unaudited consolidated financial statements.
Investments that do not qualify for the equity method of accounting
For investees over which we determine that we do not have the ability to exercise significant influence or control, we account
for each investment depending on whether it is an investment in a (i) publicly traded company, (ii) privately held entity that reports NAV
per share, or (iii) privately held entity that does not report NAV per share, as described below.
Investments in publicly traded companies
Our investments in publicly traded companies are classified as investments with readily determinable fair values and are
presented at fair value in our consolidated balance sheets, with changes in fair value classified in investment income (loss) in our
consolidated statements of operations. The fair values for our investments in publicly traded companies are determined based on sales
prices or quotes available on securities exchanges.
Investments in privately held companies
Our investments in privately held entities without readily determinable fair values consist of (i) investments in privately held
entities that report NAV per share and (ii) investments in privately held entities that do not report NAV per share. These investments are
accounted for as follows:
Investments in privately held entities that report NAV per share
Investments in privately held entities that report NAV per share, such as our privately held investments in limited partnerships,
are presented at fair value using NAV as a practical expedient, with changes in fair value classified in investment income (loss) in our
consolidated statements of operations. We use NAV per share reported by limited partnerships generally without adjustment, unless we
are aware of information indicating that the NAV reported by a limited partnership does not accurately reflect the fair value of the
investment at our reporting date.
Investments in privately held entities that do not report NAV per share
Investments in privately held entities that do not report NAV per share are accounted for using a measurement alternative
under which these investments are measured at cost, adjusted for observable price changes and impairments, with changes classified
in investment income (loss) in our consolidated statements of operations.
An observable price arises from an orderly transaction for an identical or similar investment of the same issuer, which is
observed by an investor without expending undue cost and effort. Observable price changes result from, among other things, equity
transactions of the same issuer executed during the reporting period, including subsequent equity offerings or other reported equity
transactions related to the same issuer. To determine whether these transactions are indicative of an observable price change, we
evaluate, among other factors, whether these transactions have similar rights and obligations, including voting rights, distribution
preferences, and conversion rights to the investments we hold.
16
2.SUMMARY OF SIGNIFICANT ACCOUNTING POLICIES (continued)
Impairment evaluation of equity method investments and investments in privately held entities that do not report NAV per share
We monitor equity method investments and investments in privately held entities that do not report NAV per share for new
developments, including operating results, prospects and results of clinical trials, new product initiatives, new collaborative agreements,
capital-raising events, and merger and acquisition activities. These investments are evaluated on the basis of a qualitative assessment
for indicators of impairment by monitoring the presence of the following triggering events or impairment indicators:
(i)a significant deterioration in the earnings performance, credit rating, asset quality, or business prospects of the investee;
(ii)a significant adverse change in the regulatory, economic, or technological environment of the investee;
(iii)a significant adverse change in the general market condition, including the research and development of technology and
products that the investee is bringing or attempting to bring to the market;
(iv)significant concerns about the investee’s ability to continue as a going concern; and/or
(v)a decision by investors to cease providing support or reduce their financial commitment to the investee.
If such indicators are present, we are required to estimate the investment’s fair value and immediately recognize an
impairment charge in an amount equal to the investment’s carrying value in excess of its estimated fair value.
Investment income/loss recognition and classification
We recognize both realized and unrealized gains and losses in our consolidated statements of operations, classified in
investment income (loss) in our consolidated statements of operations. Unrealized gains and losses represent:
(i)changes in fair value for investments in publicly traded companies;
(ii)changes in NAV for investments in privately held entities that report NAV per share;
(iii)observable price changes for investments in privately held entities that do not report NAV per share; and
(iv)our share of unrealized gains or losses reported by our equity method investees.
Realized gains and losses on our investments represent the difference between proceeds received upon disposition of
investments and their historical or adjusted cost basis. For our equity method investments, realized gains and losses represent our
share of realized gains or losses reported by the investee. Impairments are realized losses, which result in an adjusted cost basis, and
represent charges to reduce the carrying values of investments in privately held entities that do not report NAV per share and equity
method investments, if impairments are deemed other than temporary, to their estimated fair value.
Revenues
The table below provides details of our consolidated total revenues for the three and nine months ended September 30, 2025
and 2024 (in thousands):
Three Months Ended September 30,
Nine Months Ended September 30,
2025
2024
2025
2024
Income from rentals:
Revenues subject to the lease accounting standard:
Operating leases
$722,643
$763,947
$2,176,999
$2,255,634
Direct financing and sales-type leases
1,409
665
3,308
1,986
Revenues subject to the lease accounting standard
724,052
764,612
2,180,307
2,257,620
Revenues subject to the revenue recognition
accounting standard
11,797
11,132
35,996
28,837
Income from rentals
735,849
775,744
2,216,303
2,286,457
Other income
16,095
15,863
55,839
40,992
Total revenues
$751,944
$791,607
$2,272,142
$2,327,449
During the three and nine months ended September 30, 2025, revenues that were subject to the lease accounting standard
aggregated $724.1 million and $2.2 billion, respectively, and represented 96.3% and 96.0% of our total revenues. During the three and
nine months ended September 30, 2024, revenues that were subject to the lease accounting standard aggregated $764.6 million and
$2.3 billion, respectively, and represented 96.6% and 97.0% of our total revenues. Our other income consisted primarily of management
fees and interest income earned during each period presented. For a detailed discussion related to our revenue streams, refer to
Lease accounting” and “Recognition of revenue arising from contracts with customers” in Note 2 – “Summary of significant accounting
policies” to our unaudited consolidated financial statements.
17
2.SUMMARY OF SIGNIFICANT ACCOUNTING POLICIES (continued)
Lease accounting
Definition and classification of a lease
When we enter into a contract or amend an existing contract, we evaluate whether the contract meets the definition of a lease.
To meet the definition of a lease, the contract must meet all three criteria:
(i)One party (lessor) must hold an identified asset;
(ii)The counterparty (lessee) must have the right to obtain substantially all of the economic benefits from the use of the asset
throughout the period of the contract; and
(iii)The counterparty (lessee) must have the right to direct the use of the identified asset throughout the period of the contract.
We classify our leases as either finance leases or operating leases if we are the lessee, or sales-type, direct financing, or
operating leases if we are the lessor. We use the following criteria to determine if a lease is a finance lease (as a lessee) or sales-type
or direct financing lease (as a lessor):
(i)Ownership is transferred from lessor to lessee by the end of the lease term;
(ii)An option to purchase is reasonably certain to be exercised;
(iii)The lease term is for the major part of the underlying asset’s remaining economic life;
(iv)The present value of lease payments equals or exceeds substantially all of the fair value of the underlying asset; or
(v)The underlying asset is specialized and is expected to have no alternative use at the end of the lease term.
If we meet any of the above criteria, we account for the lease as a finance, a sales-type, or a direct financing lease. If we do
not meet any of the criteria, we account for the lease as an operating lease.
A lease is accounted for as a sales-type lease if it is considered to transfer control of the underlying asset to the lessee. A
lease is accounted for as a direct financing lease if risks and rewards are conveyed without the transfer of control, which is normally
indicated by the existence of a residual value guarantee from an unrelated third party other than the lessee.
This classification will determine the method of recognition of the lease:
For an operating lease, we recognize income from rentals if we are the lessor, or rental operations expense if we are the
lessee, over the term of the lease on a straight-line basis.
For a sales-type lease or a direct financing lease, we recognize the income from rentals, or for a finance lease, we
recognize rental operations expense, over the term of the lease using the effective interest method.
At inception of a sales-type lease or a direct financing lease, if we determine the fair value of the leased property is lower
than its carrying amount, we recognize a selling loss immediately at lease commencement. If fair value exceeds the
carrying amount of a lease, a gain is recognized at lease commencement on a sales-type lease. For a direct financing
lease, a gain is deferred at lease commencement and amortized over the lease term.
Lessor accounting
Costs to execute leases
We capitalize initial direct costs, which represent only incremental costs to execute a lease that would not have been incurred
if the lease had not been obtained. Costs that we incur to negotiate or arrange a lease, regardless of its outcome, such as for fixed
employee compensation, tax or legal advice to negotiate lease terms, and other costs, are expensed as incurred.
Operating leases
We account for the revenue from our lease contracts by utilizing the single component accounting policy. This policy requires
us to account for, by class of underlying asset, the lease component and nonlease component(s) associated with each lease as a single
component if two criteria are met:
(i)The timing and pattern of transfer of the lease component and the nonlease component(s) are the same; and
(ii)The lease component would be classified as an operating lease if it were accounted for separately.
Lease components consist primarily of fixed rental payments, which represent scheduled rental amounts due under our
leases, and contingent rental payments. Nonlease components consist primarily of tenant recoveries representing reimbursements of
rental operating expenses under our triple net lease structure, including recoveries for property taxes, insurance, utilities, repairs and
maintenance, and common area expenses.
18
2.SUMMARY OF SIGNIFICANT ACCOUNTING POLICIES (continued)
If the lease component is the predominant component, we account for all revenues under such lease as a single component in
accordance with the lease accounting standard. Conversely, if the nonlease component is the predominant component, all revenues
under such lease are accounted for in accordance with the revenue recognition accounting standard. Our operating leases qualify for
the single component accounting, and the lease component in each of our leases is predominant. Therefore, we account for all
revenues from our operating leases under the lease accounting standard and classify these revenues as income from rentals in our
consolidated statements of operations.
We commence recognition of income from rentals related to the operating leases at the date the property is ready for its
intended use by the tenant and the tenant takes possession or controls the physical use of the leased asset. When a lease includes
construction of improvements, we determine whether the improvements are landlord or tenant assets. In determining if the
improvements are landlord or tenant improvements, we consider various factors, including, but not limited to, the following:
Which party retains legal title to the improvements upon lease expiration;
Whether the improvements are expected to have significant residual value at the end of the lease term;
Whether the improvements are unique to the tenant;
What happens to the improvements upon lease expiration (i.e., whether they are removed or preserved for the landlord);
Which party bears all costs of the improvements (including the risk of cost overruns); and
Which party supervises the construction of the improvements.
If the improvements are landlord assets, we capitalize such improvements. If the improvements are tenant assets, we do not
capitalize these assets. Improvements that qualify as tenant assets, if funded by us, are accounted for as lease incentives and
amortized as a reduction of revenue over the term of the lease. If the tenant funds improvements without reimbursement from us, and
we determine these improvements to be landlord assets, we consider the amount associated with the improvements to be non-cash
lease payments, which are recognized as incremental revenue over the term of the lease.
Income from rentals related to fixed rental payments under operating leases is recognized on a straight-line basis over the
respective operating lease terms. We classify amounts expected to be received in later periods as deferred rent in our consolidated
balance sheets. Amounts received currently but recognized as revenue in future periods are classified in accounts payable, accrued
expenses, and other liabilities in our consolidated balance sheets.
Income from rentals related to variable payments includes tenant recoveries and contingent rental payments. Tenant
recoveries, including reimbursements of utilities, repairs and maintenance, common area expenses, real estate taxes and insurance,
and other operating expenses, are recognized as revenue in the period during which the applicable expenses are incurred and the
tenant’s obligation to reimburse us arises. Income from rentals related to other variable payments is recognized when associated
contingencies are removed.
We assess collectibility from our tenants of future lease payments for each of our operating leases. If we determine that
collectibility is probable, we recognize income from rentals based on the methodology described above. If we determine that
collectibility is not probable, we recognize an adjustment to lower our income from rentals. Furthermore, we may recognize a general
allowance at a portfolio level (not the individual level) if we do not expect to collect future lease payments in full.
For each lease for which we determine that collectibility of future lease payments is not probable, we cease the recognition of
income from rentals on a straight-line basis and limit the recognition of income to the lesser of payments collected from the lessee or
lease income that would have been recognized on a straight-line basis. We do not resume straight-line recognition of income from
rentals for these leases until we determine that the collectibility of future payments related to these leases is probable. We also record a
general allowance related to the deferred rent balances that at the portfolio level (not the individual level) are not expected to be
collected in full through the lease term. As of September 30, 2025 and December 31, 2024, our general allowance balance aggregated
$14.3 million and $21.3 million, respectively.
Direct financing and sales-type leases
Income from rentals related to direct financing and sales-type leases is recognized over the lease term using the effective
interest rate method. At lease commencement, we derecognize the underlying asset classified within investments in real estate and
record net investment in a lease within other assets in our consolidated balance sheets. This initial net investment is determined by
aggregating the present values of the total future lease payments and the estimated residual value of the property, less any unearned
income related to a direct financing lease. Over the lease term, the investment in the lease accretes in value, producing a constant
periodic rate of return on the net investment in the lease. Income from these leases is classified in income from rentals in our
consolidated statements of operations. Our net investment is reduced over time as lease payments are received.
We evaluate our net investment in direct financing and sales-type leases for impairment under the current expected credit
losses accounting standard. For additional information, refer to “Provision for expected credit losses” in Note 2 – “Summary of
significant accounting policies” to our unaudited consolidated financial statements.
19
2.SUMMARY OF SIGNIFICANT ACCOUNTING POLICIES (continued)
As a lessor, we classify a lease with variable lease payments that do not depend on an index or a rate as an operating lease
on the commencement date of the lease if both of the following criteria are met:
(i)The lease would have been classified as a sales-type lease or direct financing lease under the current lease accounting
standard; and
(ii)The sales-type lease or direct financing lease classification would have resulted in a selling loss at lease commencement.
We do not derecognize the underlying asset and do not recognize a loss upon lease commencement but continue to
depreciate the underlying asset over its useful life.
Lessee accounting
We have operating lease agreements in which we are the lessee consisting of ground and office leases. At the lease
commencement date (or at the acquisition date if the lease is acquired as part of a real estate acquisition), we are required to recognize
a liability to account for our future obligations under these operating leases, and a corresponding right-of-use asset.
The lease liability is measured based on the present value of the future lease payments, including payments during the term
under our extension options that we are reasonably certain to exercise. The present value of the future lease payments is calculated for
each operating lease using each respective remaining lease term and a corresponding estimated incremental borrowing rate, which is
the interest rate that we estimate we would have to pay to borrow on a collateralized basis over a similar term for an amount equal to
the lease payments. Subsequently, the lease liability is accreted by applying a discount rate established at the lease commencement
date to the lease liability balance as of the beginning of the period and is reduced by the payments made during the period. We classify
the operating lease liability in accounts payable, accrued expenses, and other liabilities in our consolidated balance sheets.
The right-of-use asset is measured based on the corresponding lease liability, adjusted for initial direct leasing costs and any
other consideration exchanged with the landlord prior to the commencement of the lease, as well as adjustments to reflect favorable or
unfavorable terms of an acquired lease when compared with market terms at the time of acquisition. Subsequently, the right-of-use
asset is amortized on a straight-line basis during the lease term. We classify the right-of-use asset in other assets in our consolidated
balance sheets.
Recognition of revenue arising from contracts with customers
We recognize revenues associated with transactions arising from contracts with customers, excluding revenues subject to the
lease accounting standard discussed in “Lease accounting” above, in accordance with the revenue recognition accounting standard. A
customer is distinguished from a noncustomer by the nature of the goods or services that are transferred. Customers are provided with
goods or services that are generated by a company’s ordinary output activities, whereas noncustomers are provided with nonfinancial
assets that are outside of a company’s ordinary output activities.
We generally recognize revenue representing the transfer of goods and services to customers in an amount that reflects the
consideration to which we expect to be entitled in the exchange. In order to determine the recognition of revenue from customer
contracts, we use a five-step model to (i) identify the contract with the customer, (ii) identify the performance obligations in the contract,
(iii) determine the transaction price, including variable consideration to the extent that it is probable that a significant future reversal will
not occur, (iv) allocate the transaction price to the performance obligations in the contract, and (v) recognize revenue when (or as) we
satisfy the performance obligation.
We identify contractual performance obligations and determine whether revenue should be recognized at a point in time or
over time, based on when control of goods and services transfers to a customer. We consider whether we control the goods or services
prior to the transfer to the customer in order to determine whether we should account for the arrangement as a principal or agent. If we
determine that we control the goods or services provided to the customer, then we are the principal to the transaction, and we recognize
the gross amount of consideration expected in the exchange. If we simply arrange but do not control the goods or services being
transferred to the customer, then we are considered to be an agent to the transaction, and we recognize the net amount of
consideration we are entitled to retain in the exchange.
Total revenues subject to the revenue recognition accounting standard and classified within income from rentals in our
consolidated statements of operations for the three and nine months ended September 30, 2025 included $11.8 million and $36.0
million, respectively, primarily related to short-term parking revenues associated with long-term lease agreements. Short-term parking
revenues do not qualify for the single component accounting policy, as discussed in “Lessor accounting” in Note 2 – “Summary of
significant accounting policies,” due to the difference in the timing and pattern of transfer of our parking service obligations and
associated lease components within the same lease agreement. We recognize short-term parking revenues in accordance with the
revenue recognition accounting standard when the service is provided and the performance obligation is satisfied, which normally
occurs at a point in time.
20
2.SUMMARY OF SIGNIFICANT ACCOUNTING POLICIES (continued)
Monitoring of tenant credit quality
During the term of each lease, we monitor the credit quality and any related material changes of our tenants by (i) monitoring
the credit rating of tenants that are rated by a nationally recognized credit rating agency, (ii) reviewing financial statements of the
tenants that are publicly available or that are required to be delivered to us pursuant to the applicable lease, (iii) monitoring news
reports regarding our tenants and their respective businesses, and (iv) monitoring the timeliness of lease payments.
Notes receivable
We carry notes receivable at amortized cost, adjusted for an estimated provision for expected credit losses. Interest income on
notes receivable is recognized using the effective interest rate method and is classified within other income in our consolidated
statements of operations. Direct costs incurred in originating notes, along with any premium or discount, are deferred and amortized as
an adjustment to interest income over the note’s term using the effective interest rate method. Notes receivable are classified within
other assets in our consolidated balance sheets. Refer to Note 8 – “Other assets” to our unaudited consolidated financial statements for
additional details.
Provision for expected credit losses
We are required to estimate and recognize lifetime expected losses, rather than incurred losses, for most financial assets
measured at amortized cost and certain other instruments, including trade, notes, and other receivables (excluding receivables arising
from operating leases), loans, held-to-maturity debt securities, net investments in leases arising from sales-type and direct financing
leases, and off-balance-sheet credit exposures (e.g., loan commitments). The recognition of such expected losses, even if the expected
risk of credit loss is remote, typically results in earlier recognition of credit losses. At each reporting date, we reassess our provision for
expected credit losses, and, if necessary, we recognize an adjustment for our current estimate of expected credit losses. Refer to
Note 5 – “Leases” and Note 8 – “Other assets” to our unaudited consolidated financial statements for additional details.
An assessment of the collectibility of operating lease payments and the recognition of an adjustment to lease income based on
this assessment is governed by the lease accounting standard discussed in “Lease accounting” earlier in Note 2 — “Summary of
significant accounting policies” to our unaudited consolidated financial statements.
Income taxes
We are organized and operate as a REIT pursuant to the Internal Revenue Code (the “Code”). Under the Code, a REIT that
distributes at least 90% of its REIT taxable income to its stockholders annually (excluding net capital gains) and meets certain other
conditions is not subject to federal income tax on its distributed taxable income, but could be subject to certain federal, foreign, state,
and local taxes. We distribute 100% of our taxable income annually; therefore, a provision for federal income taxes is not required. In
addition to our REIT returns, we file federal, foreign, state, and local tax returns for our subsidiaries. We file with jurisdictions located in
the U.S., Canada, and other international locations. Our tax returns are subject to routine examination in various jurisdictions for the
2019 through 2024 calendar years.
Employee and non-employee share-based payments
We have implemented an entity-wide accounting policy to account for forfeitures related to unmet service conditions of share-
based awards granted to employees and non-employees when they occur. Under this policy, when forfeitures occur, any previously
recognized expense related to those forfeited awards is reversed in the period of forfeiture.
Our employee and non-employee share-based awards are measured at fair value on the grant date and recognized over the
recipient’s required service period. For share-based awards with performance conditions, we continue to assess the probability of
achieving the performance conditions and recognize expense only when it becomes probable that the performance targets will be met.
Conversely, for share-based awards with market conditions, expense is recognized regardless of whether the market condition is met.
Dividends paid on share-based awards with nonforfeitable dividends are initially classified in retained earnings and reclassified
to compensation cost only if the underlying awards are forfeited. Conversely, for share-based awards with forfeitable dividends,
declared dividends are initially classified in retained earnings and in dividends payable within our consolidated balance sheets. If the
underlying awards are forfeited, the corresponding accrued dividend is reversed in the period of forfeiture. Upon vesting of the
underlying share-based awards with forfeitable dividends, the accumulated dividend payment is made and the dividend payable liability
is settled.
21
2.SUMMARY OF SIGNIFICANT ACCOUNTING POLICIES (continued)
Forward equity sales agreements
From time to time, we enter into forward equity sales agreements and account for them in accordance with the accounting
guidance governing financial instruments and derivatives. Under the accounting guidance, our forward equity sales agreements are not
deemed to be liabilities as they do not embody obligations to repurchase our shares, nor do they embody obligations to issue a variable
number of shares for which the monetary value is predominantly fixed, varied with something other than the fair value of our shares, or
varied inversely in relation to our shares. We also evaluate whether the agreements meet the derivatives and hedging guidance scope
exception to be accounted for as equity instruments. Our forward equity sales agreements are classified as equity contracts based on
the following assessment: (i) none of the agreements’ exercise contingencies are based on observable markets or indices besides
those related to the market for our own stock price and operations; and (ii) none of the settlement provisions preclude the agreements
from being indexed to our own stock.
Hedge accounting
From time to time, we utilize derivative instruments to manage our exposure to certain risks. We are exposed to foreign
currency exchange rate risk related to our ongoing business operations in Canada. To mitigate the impact of fluctuations in the USD-
CAD exchange rate associated with our net investment in Canada, we use cross-currency swap agreements designated and qualifying
as net investment hedges under applicable derivatives and hedging standards.
We designate the USD-CAD cross-currency swap agreements as net investment hedges using the spot method to assess
hedge effectiveness. The spot component represents changes in fair value attributable to movements in the USD-CAD spot exchange
rate, which reflects the market exchange rate between the two currencies as of each reporting date. Changes in the fair value of the
designated spot component are recorded in other comprehensive income (loss) as part of the foreign currency translation adjustment,
to the extent the relationship is highly effective, until the net investment is sold or substantially liquidated. The related amounts due from
or due to counterparties are included in other assets or in accounts payable, accrued expenses, and other liabilities, respectively, within
our consolidated balance sheets.
We have elected to account for the forward points (the portion of the derivative’s fair value attributable to the difference
between the forward exchange rate and spot exchange rate) as an excluded component in accordance with applicable derivatives and
hedging accounting standards. The excluded component is recognized over the life of the cross-currency swap agreements using a
systematic and rational basis (as interest settlements occur) and is classified within other income in our consolidated statement of
operations.
Issuer and guarantor subsidiaries of guaranteed securities
Generally, a parent entity of an issuer that holds guaranteed securities must provide separate subsidiary issuer or guarantor
financial statements, unless it qualifies for disclosure exceptions. A parent entity may be eligible for disclosure exceptions if it meets the
following criteria:
(i)The subsidiary issuer or guarantor is a consolidated subsidiary of the parent company, and
(ii)The subsidiary issues a registered security that is:
issued jointly and severally with the parent company, or
fully and unconditionally guaranteed by the parent company.
A parent entity that meets the above criteria may instead present summarized financial information (“alternative disclosures”)
either within the consolidated financial statements or in “Item 2. Management’s discussion and analysis of financial condition and results
of operations” (“Item 2”). We evaluated the criteria and determined that we are eligible for the disclosure exceptions, which allow us to
provide alternative disclosures; as such, we present alternative disclosures in Item 2.
Loan fees
Fees incurred in obtaining long-term financing are capitalized and classified with the corresponding debt instrument appearing
on our consolidated balance sheets. Loan fees related to our unsecured senior line of credit are capitalized and classified within other
assets. Capitalized amounts are amortized over the term of the related loan, and the amortization is classified in interest expense in our
consolidated statements of operations.
Distributions from equity method investments
We use the “nature of the distribution” approach to determine the classification within our consolidated statements of cash
flows of cash distributions received from equity method investments, including our unconsolidated real estate joint ventures and equity
method non-real estate investments. Under this approach, distributions are classified based on the nature of the underlying activity that
generated the cash distributions. If we lack the information necessary to apply this approach in the future, we will be required to apply
the “cumulative earnings” approach as an accounting change on a retrospective basis. Under the cumulative earnings approach,
distributions up to the amount of cumulative equity in earnings recognized are classified as cash inflows from operating activities, and
those in excess of that amount are classified as cash inflows from investing activities.
22
2.SUMMARY OF SIGNIFICANT ACCOUNTING POLICIES (continued)
Restricted cash
We present cash and cash equivalents separately from restricted cash within our consolidated balance sheets. However, we
include restricted cash with cash and cash equivalents when reconciling the beginning-of-period and end-of-period total amounts shown
in the consolidated statements of cash flows. We provide a reconciliation between the consolidated balance sheets and the
consolidated statements of cash flows, which is required when the balance includes greater than one line item for cash, cash
equivalents, and restricted cash. We also provide a disclosure of the nature of the restrictions related to material restricted cash
balances.
Recent accounting pronouncements
On November 4, 2024, the FASB issued ASU 2024-03, Disaggregation of Income Statement Expenses, which will require
entities to provide enhanced disclosures related to certain expense categories included in income statement line items. The ASU aims
to increase transparency and provide investors with additional detailed information about the nature of expenses reported on the face of
the income statement. The new standard does not change the requirements for the presentation of expenses on the face of the income
statement.
Under this ASU, entities are required to disaggregate, in a tabular format, expense line items presented on the face of the
income statement — excluding earnings or losses from equity method investments — if they include any of the following expense
categories: purchases of inventory, employee compensation, depreciation, intangible asset amortization, and depreciation or depletion.
For any remaining items within each relevant expense line item, entities must provide a qualitative description of the nature of those
expenses. The new ASU is effective for annual reporting periods beginning after December 15, 2026 and interim reporting periods
beginning after December 15, 2027. Early adoption is permitted. We expect to adopt this ASU on January 1, 2027. Although the
adoption is not expected to have an impact on our financial statements, it is expected to result in incremental disclosures within the
footnotes to our consolidated financial statements.
23
3.INVESTMENTS IN REAL ESTATE
Our consolidated investments in real estate consisted of the following as of September 30, 2025 and December 31, 2024 (in
thousands):
September 30, 2025
December 31, 2024
Rental properties:
Land (related to rental properties)
$3,242,824
$3,863,027
Buildings and building improvements
20,715,991
20,377,935
Other improvements
4,609,447
4,354,785
Rental properties
28,568,262
28,595,747
Current and future development and redevelopment projects
8,596,264
8,618,727
Gross investments in real estate
37,164,526
37,214,474
Less: accumulated depreciation
(6,120,878)
(5,477,082)
Investments in real estate assets held for sale(1)
700,269
372,647
Investments in real estate
$31,743,917
$32,110,039
(1)Refer to “Assets held for sale” below.
Assets held for sale
As of September 30, 2025, we had 14 operating properties aggregating 1.8 million RSF and land parcels aggregating 939,756
SF that were classified as held for sale.
The disposal of properties classified as held for sale does not represent a strategic shift that has (or will have) a major effect
on our operations or financial results and therefore does not meet the criteria for classification as a discontinued operation. We cease
depreciation of our properties upon their classification as held for sale.
The following is a summary of net assets as of September 30, 2025 and December 31, 2024 for our real estate investments
that were classified as held for sale as of each respective date (in thousands):
September 30, 2025
December 31, 2024
Investments in real estate
$700,269
$372,647
Other assets
84,515
9,488
Total assets
784,784
382,135
Total liabilities
(20,028)
(13,462)
Total accumulated other comprehensive income
1,877
2,584
Net assets classified as held for sale
$766,633
$371,257
For additional information, refer to “Real estate sales” in Note 2 – “Summary of significant accounting policies” to our unaudited
consolidated financial statements.
24
3.INVESTMENTS IN REAL ESTATE (continued)
Sales of real estate assets and impairment of real estate
Our completed dispositions of real estate assets during the nine months ended September 30, 2025 consisted of the following
(dollars in thousands):
Square Footage
Gain on
Sales of
Real Estate
Property
Submarket/Market
Date of
Sale
Interest
Sold
Operating
Land and
Future
Sales Price
Costa Verde by Alexandria
University Town Center/San
Diego
1/31/25
100%
8,730
537,000
$124,000
(1)
$
Pacific Technology Park(2)
Sorrento Mesa/San Diego
9/9/25
50%
544,352
96,000
(2)
9,290
5505 Morehouse Drive
Sorrento Mesa/San Diego
8/26/25
100%
79,945
45,000
2425 Garcia Avenue and 2400/2450
Bayshore Parkway
Greater Stanford/San
Francisco Bay Area
6/30/25
100%
95,901
11,000
Land parcel
Texas
5/7/25
100%
1,350,000
73,287
Other
Various
87,584
13,241
$436,871
(3)
$22,531
(1)As part of the transaction, we provided $91.0 million of seller financing during the three months ended March 31, 2025. This note receivable is classified within “Other
assets” in our consolidated balance sheet. Refer to Note 8 – “Other assets” to our unaudited consolidated financial statements for additional information.
(2)$94.4 million of the sales price represents non-cash consideration. Refer to “Pacific Technology Park and 199 East Blaine Street” in Note 4 – “Consolidated and
unconsolidated real estate joint ventures” to our unaudited consolidated financial statements for additional information regarding this sale.
(3)Represents the aggregate contractual sales price of our dispositions, which differs from the sum of amounts disclosed in our consolidated statement of cash flows under
“Investing activities” (proceeds from sales of real estate), “Financing activities” (contributions from and sales of noncontrolling interests), and “Supplemental disclosure
and non-cash investing and financing activities" (non-cash sales) primarily due to the timing of payment, closing costs, and other sales adjustments such as prorations of
rents and expenses.
Impairment of real estate
During the nine months ended September 30, 2025, we recognized impairment charges aggregating $485.6 million, classified
in impairment of real estate in our consolidated statement of operations, primarily related to the following assets:
Impairment charge of $206.2 million was recognized to reduce the carrying amount of a non-Megacampus property
aggregating 179,100 RSF in Long Island City, a non-core location within our New York City submarket, to its estimated fair
value less costs to sell of approximately $31.1 million upon meeting the criteria for classification as held for sale. This property
met the held for sale criteria in September 2025, when we committed to dispose of it following our reevaluation of its alignment
with our Megacampus strategy and decided to allocate sales proceeds toward other projects with higher value-creation
opportunities. As of September 30, 2025, the property is 52% occupied. We expect to complete the sale of this property within
the next 12 months.
Impairment charge of $43.4 million was recognized to reduce the carrying amount of a retail shopping center aggregating
249,275 RSF with a future development opportunity aggregating 281,592 SF in our Cambridge/Inner Suburbs submarket of
Greater Boston to its estimated fair value less costs to sell of approximately $96.3 million upon meeting the criteria for
classification as held for sale.This property met the held for sale criteria in September 2025 upon our commitment to dispose
of this asset and allocate sales proceeds toward other projects with higher value-creation opportunities and our obtaining of all
required approvals to sell. In October 2025, we completed the sale of this asset, with no gain or loss recognized upon sale.
Impairment charge of $47.3 million was recognized to reduce the carrying amount of land parcels aggregating 374,349 SF in a
non-cluster/other market to its estimated fair value less costs to sell of approximately $28.9 million upon meeting the criteria for
classification as held for sale. The held for sale criteria were met in June 2025 upon our decision to dispose of this asset. In
September 2025, we completed the sale, with no gain or loss recognized upon sale.
Impairment charge of $42.8 million was recognized to reduce the carrying amount of an office property aggregating 182,276
RSF in Carlsbad, San Diego to its estimated fair value less costs to sell. This property met the criteria for classification as held
for sale in April 2025 upon our commitment to sell, at which time we recognized an impairment of $35.4 million based on
negotiations with a potential buyer at that time. In September 2025, we recognized an additional impairment charge of $7.3
million to adjust the asset’s carrying amount to the currently negotiated reduced sales price less costs to sell of approximately
$61.8 million. We expect to complete this sale within the next 12 months.
Impairment charge of $32.2 million was recognized during the three months ended March 31, 2025 related to a ground lease
entered into in 2021 for a future development opportunity in the San Francisco Bay Area market. Refer to “Lessee operating
costs” in Note 5 – “Leases” to our unaudited consolidated financial statements for additional information.
25
3.INVESTMENTS IN REAL ESTATE (continued)
Impairment charge of $31.8 million was recognized to reduce the carrying amount of one vacant property aggregating 104,531
RSF in the Research Triangle market to its estimated fair value less costs to sell of approximately $1.2 million upon meeting
the criteria for classification as held for sale in September 2025. The held for sale criteria were met upon our decision to sell
this asset, due to its noncontiguous location relative to most other properties on the Alexandria Center® for Sustainable
Technologies Megacampus, and to allocate the sales proceeds, and other capital necessary to lease the property, toward
other projects with greater value-creation opportunities. We expect to complete the sale within the next 12 months.
Impairment charge of $27.8 million was recognized to reduce the carrying amounts of land parcels aggregating 154,308 SF on
a non-Megacampus in our Sorrento Mesa submarket of San Diego to their estimated fair values less costs to sell of
approximately $13.9 million upon meeting the criteria for classification as held for sale in September 2025. These assets met
the criteria for classification as held for sale upon our reevaluation of their alignment with our Megacampus strategy and our
decision to reallocate capital toward our other projects with greater value-creation opportunities. We expect to complete the
sale of these assets within the next 12 months.
Impairment charge of $17.3 million was recognized to reduce the carrying amounts of two operating properties aggregating
210,481 RSF in our Sorrento Mesa submarket of San Diego to their estimated fair values less costs to sell of approximately
$112.3 million upon meeting the criteria for classification as held for sale. The held for sale criteria were met in June 2025 upon
our commitment to dispose of these properties. In August 2025, we completed the sale of one of the properties aggregating
79,945 RSF for a sales price of $45.0 million, with no gain or loss recognized upon sale. We expect to complete the sale of the
remaining property within the next 12 months.
Other
In 2006, ARE-East River Science Park, LLC, a subsidiary of Alexandria Real Estate Equities, Inc., was granted an option to
incorporate a land parcel adjacent to and north of the Alexandria Center® for Life Science – New York City (“ACLS-NYC”) campus
(“Option Parcel”) into the existing ground lease of that campus. The Option Parcel will allow ARE-East River Science Park, LLC to
develop a future world-class life science building within the ACLS-NYC campus. ARE-East River Science Park, LLC’s investment in pre-
construction costs related to the development of the Option Parcel, including costs related to design, engineering, environmental,
survey/title, and permitting and legal costs, aggregated $175.7 million as of September 30, 2025.
On August 6, 2024, ARE-East River Science Park, LLC filed a lawsuit in the United States District Court for the Southern
District of New York against its landlord, New York City Health + Hospitals Corporation (“H+H”), and the New York City Economic
Development Corporation (“EDC”). On January 24, 2025, ARE-East River Science Park, LLC filed a first amended complaint. The
lawsuit alleges two principal claims against H+H and EDC: fraud in the inducement, and, in the alternative, breach of contract in
violation of the implied covenant of good faith and fair dealing. As alleged in the complaint, ARE-East River Science Park, LLC’s claims
arise from H+H’s and EDC’s misrepresentations and concealment of material facts in connection with a floodwall, which H+H and EDC
are seeking to require ARE-East River Science Park, LLC to integrate into the development of the Option Parcel. ARE-East River
Science Park, LLC alleges that H+H’s and EDC’s misconduct have prevented it from commencing the development of the Option
Parcel. In light of the pending litigation, the closing date for our option and thus the commencement date for construction of the third
tower at the campus are presently indeterminate. Among other things, ARE-East River Science Park, LLC is seeking significant
damages and equitable relief from the court to confirm our understanding that the option is in full force and effect.
This matter exposes us to potential losses ranging from zero to the full amount of our investment in the project aggregating
$175.7 million as of September 30, 2025, depending on any collection of damages and/or the ability to develop the project. We
performed a probability-weighted recoverability analysis based on estimates of various possible outcomes and determined no
impairment was present as of September 30, 2025.
26
4.CONSOLIDATED AND UNCONSOLIDATED REAL ESTATE JOINT VENTURES
From time to time, we enter into joint venture agreements through which we own a partial interest in real estate entities that
own, develop, and operate real estate properties. As of September 30, 2025, our real estate joint ventures held the following properties:
Property(1)
Market
Submarket
Our Ownership
Interest
Consolidated real estate joint ventures(2):
50 and 60 Binney Street
Greater Boston
Cambridge/Inner Suburbs
34.0%
75/125 Binney Street
Greater Boston
Cambridge/Inner Suburbs
40.0%
100 and 225 Binney Street and 300 Third Street
Greater Boston
Cambridge/Inner Suburbs
30.0%
15 Necco Street
Greater Boston
Seaport Innovation District
56.7%
285, 299, 307, and 345 Dorchester Avenue
Greater Boston
Seaport Innovation District
60.0%
Alexandria Center® for Science and Technology –
Mission Bay(3)
San Francisco Bay Area
Mission Bay
25.0%
601, 611, 651, 681, 685, and 701 Gateway
Boulevard
San Francisco Bay Area
South San Francisco
50.0%
751 Gateway Boulevard
San Francisco Bay Area
South San Francisco
51.0%
211 and 213 East Grand Avenue
San Francisco Bay Area
South San Francisco
30.0%
500 Forbes Boulevard
San Francisco Bay Area
South San Francisco
10.0%
Alexandria Center® for Life Science – Millbrae
San Francisco Bay Area
South San Francisco
48.5%
3215 Merryfield Row
San Diego
Torrey Pines
30.0%
Campus Point by Alexandria(4)
San Diego
University Town Center
55.0%
(5)
5200 Illumina Way
San Diego
University Town Center
51.0%
9625 Towne Centre Drive
San Diego
University Town Center
30.0%
SD Tech by Alexandria(6)
San Diego
Sorrento Mesa
50.0%
Summers Ridge Science Park(7)
San Diego
Sorrento Mesa
30.0%
1201 and 1208 Eastlake Avenue East
Seattle
Lake Union
30.0%
400 Dexter Avenue North
Seattle
Lake Union
30.0%
800 Mercer Street
Seattle
Lake Union
60.0%
Unconsolidated real estate joint ventures(8):
1655 and 1725 Third Street
San Francisco Bay Area
Mission Bay
10.0%
1450 Research Boulevard
Maryland
Rockville
73.2%
(9)
101 West Dickman Street
Maryland
Beltsville
58.4%
(9)
(1)Refer to the table on the next page that shows the categorization of our real estate joint ventures under the consolidation framework.
(2)In addition to the real estate joint ventures listed, we have one consolidated real estate joint venture in Greater Boston market in which a partner holds a $48.7 million
redeemable noncontrolling interest earning a fixed return.
(3)Includes 409 and 499 Illinois, 1450, 1500, and 1700 Owens Street, and 455 Mission Bay Boulevard South.
(4)Includes 10210, 10260, 10290, and 10300 Campus Point Drive and 4110, 4135, 4155, 4161, 4165, 4224, and 4242 Campus Point Court.
(5)The noncontrolling interest share of our joint venture partner is anticipated to decrease to 25%, as we expect to fund the majority of future construction costs at the
campus until our ownership interest increases to 75%, after which future capital would be contributed pro rata with our partner.
(6)Includes 9605, 9645, 9675, 9725, 9735, 9805, 9808, 9855, and 9868 Scranton Road and 10055, 10065, and 10075 Barnes Canyon Road.
(7)Includes 9965, 9975, 9985, and 9995 Summers Ridge Road.
(8)In addition to the real estate joint ventures listed, we hold an interest in one insignificant unconsolidated real estate joint venture. 
(9)Represents a joint venture with a local real estate operator in which our joint venture partner manages the day-to-day activities that significantly affect the economic
performance of the joint venture.
Our consolidation policy is described under “Consolidation” in Note 2 – “Summary of significant accounting policies” to our
unaudited consolidated financial statements. Consolidation accounting is highly technical, but its framework is primarily based on the
controlling financial interests and benefits of the joint ventures. We generally consolidate a joint venture that is a legal entity that we
control (i.e., we have the power to direct the activities of the joint venture that most significantly affect its economic performance)
through contractual rights, regardless of our ownership interest, and where we determine that we have benefits through the allocation of
earnings or losses and fees paid to us that could be significant to the joint venture (the “VIE model”).
27
4.CONSOLIDATED AND UNCONSOLIDATED REAL ESTATE JOINT VENTURES (continued)
We also generally consolidate joint ventures when we have a controlling financial interest through voting rights and where our
voting interest is greater than 50% (the “voting model”). Voting interest differs from ownership interest for some joint ventures. We
account for joint ventures that do not meet the consolidation criteria under the equity method of accounting by recognizing our share of
income and losses.
The table below shows the categorization of our real estate joint ventures under the consolidation framework:
Property(1)
Consolidation
Model
Voting Interest
Consolidation Analysis
Conclusion
50 and 60 Binney Street
VIE model
Not applicable
under VIE
model
Consolidated
75/125 Binney Street
We have:
100 and 225 Binney Street and 300
Third Street
15 Necco Street
(i)
The power to direct the
activities of the joint venture
that most significantly affect its
economic performance; and
285, 299, 307, and 345 Dorchester
Avenue
Alexandria Center® for Science and
Technology – Mission Bay
601, 611, 651, 681, 685, and 701
Gateway Boulevard
751 Gateway Boulevard
211 and 213 East Grand Avenue
(ii)
Benefits that can be significant
to the joint venture.
500 Forbes Boulevard
Alexandria Center® for Life Science –
Millbrae
3215 Merryfield Row
Campus Point by Alexandria
5200 Illumina Way
Therefore, we are the primary
beneficiary of each VIE
9625 Towne Centre Drive
SD Tech by Alexandria
Summers Ridge Science Park
1201 and 1208 Eastlake Avenue East
400 Dexter Avenue North
800 Mercer Street
1450 Research Boulevard
We do not control the joint venture
and are therefore not the primary
beneficiary.
Equity method
of accounting
101 West Dickman Street
1655 and 1725 Third Street
Voting model
Does not
exceed 50%
Our voting interest is 50% or less.
(1)In addition to the real estate joint ventures listed, we have one real estate joint venture that we control and consolidate under the VIE model, in which the partner holds a
$48.7 million redeemable noncontrolling interest earning a fixed preferred return. We also hold an interest in one insignificant unconsolidated real estate joint venture.
99 Coolidge Avenue
In July 2025, we amended the agreement for our consolidated real estate joint venture at 99 Coolidge Avenue in our
Cambridge/Inner Suburbs submarket. Pursuant to the amended agreement, the carrying amount of our partner’s noncontrolling interest
was adjusted from $42.0 million to $48.7 million. We continued to control and consolidate the joint venture. Accordingly, we accounted
for the $6.7 million adjustment as an equity transaction and recognized it in additional paid-in capital.
Pursuant to the amended agreement, our partner’s noncontrolling interest was converted into a $48.7 million redeemable
noncontrolling interest that accrues a fixed 4.05% annual preferred return (“distributions”) and no longer participates in the joint
venture’s earnings or distributions in excess of preferred return. Further, under the amended agreement, our partner has a put option
beginning January 2026 to require us to purchase its preferred interest for $48.7 million plus any unpaid distributions. As of September
30, 2025, the contractual preferred interest amount of $48.7 million and accrued distribution of $340 thousand were classified as
redeemable noncontrolling interests within temporary equity in our consolidated balance sheet and consolidated statement of
stockholders equity.
28
4.CONSOLIDATED AND UNCONSOLIDATED REAL ESTATE JOINT VENTURES (continued)
Pacific Technology Park and 199 East Blaine Street
Prior to September 2025, we had two consolidated real estate joint ventures with one partner through its affiliates: (i) a joint
venture that owned Pacific Technology Park, a non-Megacampus of five non-laboratory properties aggregating 544,352 RSF in our
Sorrento Mesa submarket, in which we had a 50% ownership interest and our partner held the remaining 50% ownership interest, and
(ii) a joint venture that owned a laboratory building at 199 East Blaine Street, aggregating 115,084 RSF on the Alexandria Center® for
Life Science – Eastlake Megacampus in our Lake Union submarket, in which we had a 30% ownership interest and our partner held the
remaining 70% ownership interest.
In September 2025, we completed the following transaction with our partner through its affiliates:
(i)We sold our 50% controlling interest in the consolidated joint venture that owned Pacific Technology Park for a sales price
of $96.0 million. In connection with this disposition, we derecognized our partner’s noncontrolling interest of $82.4 million
and recognized a gain on sale of real estate of $9.3 million in our consolidated statements of operations for the three and
nine months ended September 30, 2025; and
(ii)We acquired our partner’s 70% noncontrolling interest at 199 East Blaine Street for a purchase price of $94.4 million. We
accounted for this acquisition as an equity transaction, with the $66.3 million excess of the purchase price over the $30.3
million book value of the noncontrolling interest acquired less costs to sell, recognized in additional paid-in capital and no
gain or loss recognized in earnings.
As a result of this transaction, we received proceeds of $1.6 million. As of September 30, 2025, we own 100% of 199 East
Blaine Street and no longer have an ownership interest in Pacific Technology Park.
Consolidated VIEs’ balance sheet information
We, together with joint venture partners, hold interests in real estate joint ventures that we consolidate in our financial
statements. These existing joint ventures provide significant equity capital to fund a portion of our future construction spending, and our
joint venture partners may also contribute equity into these entities for financing-related activities.
The table below aggregates the balance sheet information of our consolidated VIEs (in thousands):
September 30, 2025
December 31, 2024
Investments in real estate
$7,570,226
$8,917,718
Cash and cash equivalents
298,135
335,223
Other assets
778,271
777,033
Total assets
$8,646,632
$10,029,974
Secured note payable
$
$149,321
Other liabilities
424,752
626,460
Total liabilities
424,752
775,781
Redeemable noncontrolling interests
49,050
10,360
Alexandria Real Estate Equities, Inc.’s share of equity
3,752,516
4,754,386
Noncontrolling interests’ share of equity
4,420,314
4,489,447
Total liabilities and equity
$8,646,632
$10,029,974
In determining whether to aggregate the balance sheet information of consolidated VIEs, we considered the similarity of each
VIE, including the primary purpose of these entities to own, manage, operate, and lease real estate properties owned by the VIEs, and
the similar nature of our involvement in each VIE as a managing member. Due to the similarity of the characteristics, we present the
balance sheet information of these entities on an aggregated basis. None of our consolidated VIEs’ assets have restrictions that limit
their use to settle specific obligations of the VIE. Other than a put option described in “99 Coolidge Avenue” above, there are no
creditors or other partners of our consolidated VIEs that have recourse to our general credit, and our maximum exposure to our
consolidated VIEs is limited to our variable interests in each VIE.
29
4.CONSOLIDATED AND UNCONSOLIDATED REAL ESTATE JOINT VENTURES (continued)
Noncontrolling interests in consolidated real estate joint ventures
Noncontrolling interests represent the third-party interests in consolidated joint ventures in which we have a controlling interest.
Noncontrolling interests are adjusted for additional contributions and distributions, the proportionate share of the net earnings or losses,
and other comprehensive income or loss. Distributions, profits, and losses related to these entities are allocated in accordance with the
respective operating agreements. During the nine months ended September 30, 2025 and 2024, we distributed $186.8 million and
$179.1 million, respectively, to our consolidated real estate joint venture partners.
In March 2025, we redeemed our partner’s entire noncontrolling interests in three real estate joint ventures in the Greater
Boston market, with a book value aggregating $10.4 million, and recognized $7.0 million of consideration in excess of the book value in
additional paid-in capital.
Unconsolidated real estate joint ventures
Our maximum exposure to our unconsolidated VIEs is limited to our investment in each VIE, except for our 1450 Research
Boulevard and 101 West Dickman Street unconsolidated real estate joint ventures in which we guarantee up to $6.7 million of the
outstanding balance related to each VIE’s secured loan. Our investments in unconsolidated real estate joint ventures, accounted for
under the equity method and classified in investments in unconsolidated real estate joint ventures in our consolidated balance sheets,
consisted of the following as of September 30, 2025 and December 31, 2024 (in thousands):
Property
September 30, 2025
December 31, 2024
1655 and 1725 Third Street
$19,904
$10,574
1450 Research Boulevard
8,355
9,193
101 West Dickman Street
9,717
9,749
Other
1,625
10,357
$39,601
$39,873
Below are key terms of unconsolidated real estate joint ventures’ secured loans as of September 30, 2025 (dollars in thousands):
Interest
Rate(1)
At 100%
Our
Share
Unconsolidated Joint Venture
Maturity Date
Stated Rate
Aggregate
Commitment
Debt
Balance(2)
101 West Dickman Street
10/29/26
SOFR+1.95%
(3)
6.20%
$26,750
$18,999
58.4%
1450 Research Boulevard
12/6/26
SOFR+1.95%
(3)
6.26%
13,000
8,932
73.2%
1655 and 1725 Third Street(4)
2/10/35
6.37%
6.44%
500,000
496,794
10.0%
$539,750
$524,725
(1)Includes interest expense and amortization of loan fees.
(2)Represents outstanding principal, net of unamortized deferred financing costs, as of September 30, 2025.
(3)This loan is subject to a fixed SOFR floor of 0.75%.
(4)During the three months ended March 31, 2025, the unconsolidated real estate joint venture refinanced $500 million of its $600 million existing fixed-rate debt with a new
secured note payable maturing in 2035. The remaining debt balance of approximately $100 million was repaid through contributions from the unconsolidated joint
venture partners, including our share of $10.8 million.
30
5.LEASES
Refer to “Lease accounting” in Note 2 – “Summary of significant accounting policies” to our unaudited consolidated financial
statements for information about lease accounting standards that set principles for the recognition, measurement, presentation, and
disclosure of leases for both parties to a lease agreement (i.e., lessees and lessors).
Leases in which we are the lessor
As of September 30, 2025, we had 375 properties aggregating 39.1 million operating RSF in key cluster locations, including
Greater Boston, the San Francisco Bay Area, San Diego, Seattle, Maryland, Research Triangle, and New York City. We primarily focus
on developing Class A/A+ properties in AAA life science innovation cluster locations that offer the scale and strategic design integral to
our Megacampus strategy. Strategically located near top academic and medical research institutions and equipped with curated
amenities and services, and convenient access to transit, our Megacampus ecosystems are designed to support our tenants in
attracting and retaining top talent, which we believe is a key driver of tenant demand for our properties.
As of September 30, 2025, all leases in which we are the lessor were classified as operating leases, with the exception of one
direct financing and one sales-type lease. Our leases are described below.
Operating leases
As of September 30, 2025, our 375 properties were subject to operating lease agreements. Seven of these properties are
subject to operating lease agreements that each contain a purchase option as described below:
(i)Two of these properties, representing two land parcels in the San Francisco Bay Area market, are subject to lease
agreements that each contain an option for the lessee to purchase the underlying asset from us at fair market value during
each of the 30-day periods commencing on the dates that are 15 years, 30 years, and 74.5 years after the rent
commencement date of October 1, 2017. The remaining lease term related to each of the two land parcels is 67.2 years.
(ii)Two operating properties in our Seattle market, held by a consolidated real estate joint venture, are subject to purchase
options held by our partner in this joint venture, which is also a tenant at these properties. One purchase option allows our
partner to purchase our 30% interest in one property for $40.0 million in 2031. Contingent upon the exercise of this option,
the second purchase option allows our partner to purchase our 30% interest in one property for $69.1 million in 2034. Our
partner’s remaining lease terms for these operating leases are 5.4 years and 19.0 years, respectively.
(iii)Three properties subject to operating lease agreements contain purchase options with a weighted-average (based on
property RSF) exercise date in October 2027.
Certain operating leases contain options for the tenant to extend their lease at prevailing market rates at the time of expiration.
In addition, certain operating leases contain an early termination option that requires advance notification and payment of an early
termination fee by the tenant.
At the commencement of each lease, we establish the lease term comprising the noncancelable period for each lease together
with periods covered by options to extend or terminate the lease that we determine the lessee is reasonably certain to exercise. Our
assessment of whether a lessee is reasonably certain to exercise or not exercise an option considers all economic factors relevant to
the assessment, including property-based, market-based, and tenant-based factors. We do not reassess the lease term or a lessee
option to purchase the underlying asset unless there is a lease modification that is not accounted for as a separate contract.
Future lease payments to be received under the terms of our operating lease agreements, excluding expense
reimbursements, in effect as of September 30, 2025 are outlined in the table below (in thousands):
Year
Amount
2025
$452,603
2026
1,702,409
2027
1,564,917
2028
1,429,284
2029
1,329,387
Thereafter
8,457,826
Total
$14,936,426
Refer to Note 3 – “Investments in real estate” to our unaudited consolidated financial statements for additional information
about our owned real estate assets, which are the underlying assets under our operating leases.
31
5.LEASES (continued)
Direct financing and sales-type leases
As of September 30, 2025, we have one direct financing lease agreement, with a net investment balance of $42.0 million, for a
parking structure with a remaining lease term of 67.2 years. The lessee has an option to purchase the underlying asset at fair market
value during each of the 30-day periods commencing on the dates that are 15 years, 30 years, and 74.5 years after the rent
commencement date of October 1, 2017.
As of September 30, 2025, we also have one sales-type lease for a property in the Seattle market. As of September 30, 2025,
the net investment in this lease is $15.9 million. Upon recognition of the sales-type lease during the three months ended March
31, 2025, we recognized a gain on sale of real estate aggregating $12.7 million classified in gain on sales of real estate within our
unaudited consolidated statement of operations for the nine months ended September 30, 2025. At the end of the lease term in March
2026, the property under this lease transfers to the tenant for the sales price of approximately $18.0 million.
As of September 30, 2025, our estimated provision for expected credit loss related to our direct financing lease and sales-type
lease aggregated $2.2 million, which was predominantly related to our direct financing lease. We estimate the provision for expected
credit loss related to our direct financing lease using a probability of default methodology, which incorporates the borrower’s investment-
grade credit rating from S&P Global Ratings, to evaluate the probability of default. Additionally, we incorporate the projected value of the
real estate securing the investments to estimate potential recoveries in the event of default, among other inputs. The estimate of the
expected credit loss related to our sales-type lease estimate was determined using historical industry losses and transaction-specific
information, including the estimated fair value of the underlying real estate asset securing this transaction, the short-term nature of this
lease, and other available information. For further details, refer to “Provision for expected credit losses” in Note 2 – “Summary of
significant accounting policies” to our unaudited consolidated financial statements.
The components of our aggregate net investment in our direct financing and sales-type leases as of September 30, 2025 and
December 31, 2024 are summarized in the table below (in thousands):
September 30, 2025
December 31, 2024
Gross investment in direct financing and sales-type leases
$265,903
$251,405
Less: unearned income on direct financing lease
(205,715)
(207,734)
Less: provision for expected credit losses
(2,217)
(2,168)
Net investment in leases
$57,971
$41,503
Future lease payments to be received under the terms of our direct financing lease and our sales-type lease as of
September 30, 2025 are outlined in the table below (in thousands):
Year
Total
2025
$495
2026
18,015
2027
2,097
2028
2,160
2029
2,224
Thereafter
240,912
Total
$265,903
32
5.LEASES (continued)
Income from rentals
Our income from rentals includes revenue related to agreements for the rental of our real estate, which primarily includes
revenues subject to the lease accounting standard and the revenue recognition accounting standard as shown below (in thousands):
Three Months Ended
September 30,
Nine Months Ended
September 30,
2025
2024
2025
2024
Income from rentals:
Revenues subject to the lease accounting standard:
Operating leases
$722,643
$763,947
$2,176,999
$2,255,634
Direct financing and sales-type leases
1,409
665
3,308
1,986
Revenues subject to the lease accounting standard
724,052
764,612
2,180,307
2,257,620
Revenues subject to the revenue recognition
accounting standard
11,797
11,132
35,996
28,837
Income from rentals
$735,849
$775,744
$2,216,303
$2,286,457
Revenues subject to the revenue recognition accounting standard and classified in income from rentals consist primarily of
short-term parking revenues that are not considered lease revenues under the lease accounting standard. Refer to “Revenues” and
Recognition of revenue arising from contracts with customers” in Note 2 – “Summary of significant accounting policies” to our
unaudited consolidated financial statements for additional information.
Residual value risk management strategy
Our leases do not have guarantees of residual value on the underlying assets. We manage risk associated with the residual
value of our leased assets by (i) evaluating each potential acquisition of real estate to determine whether it meets our business
objective to invest primarily in high-demand markets, (ii) directly managing our leased properties, conducting frequent property
inspections, proactively addressing potential maintenance issues, and/or timely resolving any occurring issues, and (iii) carefully
selecting our tenants and monitoring their credit quality throughout their respective lease terms.
Leases in which we are the lessee
Operating lease agreements
We have operating lease agreements in which we are the lessee consisting of ground and office leases. Certain of these
leases have options to extend or terminate the contract terms upon meeting certain criteria. There are no notable restrictions or
covenants imposed by the leases, nor guarantees of residual value.
We recognize a right-of-use asset, which is classified within other assets in our consolidated balance sheets, and a related
liability, which is classified within accounts payable, accrued expenses, and other liabilities in our consolidated balance sheets, to
account for our future obligations under ground and office lease arrangements in which we are the lessee. Refer to “Lessee accounting
in Note 2 – “Summary of significant accounting policies” to our unaudited consolidated financial statements.
As of September 30, 2025, the present value of the remaining contractual payments aggregating $778.8 million under our
operating lease agreements, including our extension options that we are reasonably certain to exercise, was $362.0 million. Our
corresponding operating lease right-of-use assets, adjusted for initial direct leasing costs and other consideration exchanged with the
landlord prior to the commencement of the lease, aggregated $713.4 million. As of September 30, 2025, the weighted-average
remaining lease term of operating leases in which we are the lessee was approximately 54 years, including extension options that we
are reasonably certain to exercise, and the weighted-average discount rate was 4.7%. The weighted-average discount rate is based on
the incremental borrowing rate estimated for each lease, which is the interest rate that we estimate we would have to pay to borrow on
a collateralized basis over a similar term for an amount equal to the lease payments.
Ground lease obligations as of September 30, 2025 included leases for 31 of our properties, which accounted for
approximately 8% of our total number of properties. Excluding one ground lease that expires in 2036 related to one operating property
with a net book value of $5.2 million as of September 30, 2025, our ground lease obligations have remaining lease terms ranging from
approximately 29 to 81 years, including extension options that we are reasonably certain to exercise.
33
5.LEASES (continued)
The reconciliation of future lease payments under noncancelable operating leases in which we are the lessee to the operating
lease liability reflected in our unaudited consolidated balance sheet as of September 30, 2025 is in the table below (in thousands):
Year
Total
2025
$5,389
2026
22,768
2027
21,849
2028
21,517
2029
21,025
Thereafter
686,239
Total future payments under our operating leases in which we are the lessee
778,787
Effect of discounting
(416,801)
Operating lease liability
$361,986
Lessee operating costs
Operating lease costs relate to our ground and office leases in which we are the lessee. Ground leases generally require fixed
annual rent payments and may also include escalation clauses and renewal options. For the nine months ended September 30, 2025
and 2024, amounts paid and classified as operating activities in our unaudited consolidated statements of cash flows for leases in which
we are the lessee aggregated $165.2 million and $24.7 million, respectively. The increase is primarily due to the second installment of a
ground lease prepayment aggregating $135.0 million made in January 2025 for a 24-year extension to our existing ground lease
agreement at the Alexandria Technology Square® Megacampus in our Cambridge submarket.
Our operating lease obligations related to our office leases have remaining terms of up to 11 years, exclusive of extension
options. For the three and nine months ended September 30, 2025 and 2024, our costs of operating leases in which we are the lessee
were as follows (in thousands):
Three Months Ended
September 30,
Nine Months Ended
September 30,
2025
2024
2025
2024
Gross operating lease costs
$11,525
$10,701
$36,743
$29,842
Capitalized lease costs
(880)
(521)
(2,293)
(1,567)
Expenses for operating leases in which we are the lessee
$10,645
$10,180
$34,450
$28,275
During the three months ended March 31, 2025, we recognized an impairment charge related to a ground lease entered into in
2021 for a future development opportunity in the San Francisco Bay Area market. Based on our financial outlook for this project, we
made the determination to no longer proceed with this project and recognized an impairment charge of $32.2 million to write off our
remaining right-of-use asset balance. As of September 30, 2025 and December 31, 2024, we had no operating lease liability associated
with this ground lease, as the related lease obligation had been fully prepaid.
6. CASH, CASH EQUIVALENTS, AND RESTRICTED CASH
Cash, cash equivalents, and restricted cash consisted of the following as of September 30, 2025 and December 31, 2024 (in
thousands):
 
September 30, 2025
December 31, 2024
Cash and cash equivalents
$579,474
$552,146
Restricted cash:
Funds held in escrow for real estate acquisitions
2,954
Other
4,705
4,747
4,705
7,701
Total
$584,179
$559,847
34
7.INVESTMENTS
We hold investments in publicly traded companies and privately held entities primarily involved in the life science industry. As a
REIT, we generally limit our ownership of each individual entity’s voting stock to less than 10%. We evaluate each investment to
determine whether we have the ability to exercise significant influence, but not control, over an investee. We evaluate investments in
which our ownership is equal to or greater than 20%, but less than or equal to 50%, of an investee’s voting stock with a presumption
that we have this ability. For our investments in limited partnerships that maintain specific ownership accounts, we presume that such
ability exists when our ownership interest exceeds 3% to 5%. In addition to our ownership interest, we consider whether we have a
board seat or whether we participate in the investee’s policy-making process, among other criteria, to determine if we have the ability to
exert significant influence, but not control, over an investee. If we determine that we have such ability, we account for the investment
under the equity method, as described below.
From time to time, we may hold equity investments in publicly traded companies that are subject to temporary contractual sale
restrictions. We do not recognize a discount related to such contractual sale restrictions.
Investments accounted for under the equity method
Under the equity method of accounting, we initially recognize our investment at cost and subsequently adjust the carrying
amount of the investment for our share of earnings or losses reported by the investee, distributions received, and other-than-temporary
impairments.
As of September 30, 2025, we had ten investments in limited partnerships maintaining specific ownership accounts for each
investor, which were accounted for under the equity method. These investments aggregated $326.4 million. Our ownership interest in
each of these ten investments was greater than 5%.
Investments that do not qualify for the equity method of accounting
For investees over which we determine that we do not have the ability to exercise significant influence or control, we account
for each investment depending on whether it is an investment in a (i) publicly traded company, (ii) privately held entity that reports NAV
per share, or (iii) privately held entity that does not report NAV per share, as described below.
Investments in publicly traded companies
Our investments in publicly traded companies are classified as investments with readily determinable fair values and are
presented at fair value in our consolidated balance sheets, with changes in fair value classified in investment income (loss) in our
consolidated statements of operations. The fair values for our investments in publicly traded companies are determined based on sales
prices or quotes available on securities exchanges.
Investments in privately held companies
Our investments in privately held entities without readily determinable fair values consist of (i) investments in privately held
entities that report NAV per share and (ii) investments in privately held entities that do not report NAV per share. These investments are
accounted for as follows:
Investments in privately held entities that report NAV per share
Investments in privately held entities that report NAV per share, such as our privately held investments in limited partnerships,
are presented at fair value using NAV as a practical expedient, with changes in fair value classified in investment income (loss) in our
consolidated statements of operations. We use NAV per share reported by limited partnerships generally without adjustment, unless we
are aware of information indicating that the NAV reported by a limited partnership does not accurately reflect the fair value of the
investment at our reporting date.
Investments in privately held entities that do not report NAV per share
Investments in privately held entities that do not report NAV per share are accounted for using a measurement alternative
under which these investments are measured at cost, adjusted for observable price changes and impairments, with changes classified
in investment income (loss) in our consolidated statements of operations.
An observable price arises from an orderly transaction for an identical or similar investment of the same issuer, which is
observed by an investor without expending undue cost and effort. Observable price changes result from, among other things, equity
transactions of the same issuer executed during the reporting period, including subsequent equity offerings or other reported equity
transactions related to the same issuer. To determine whether these transactions are indicative of an observable price change, we
evaluate, among other factors, whether these transactions have similar rights and obligations, including voting rights, distribution
preferences, and conversion rights to the investments we hold.
35
7.INVESTMENTS (continued)
Impairment evaluation of equity method investments and investments in privately held entities that do not report NAV per share
We monitor equity method investments and investments in privately held entities that do not report NAV per share for new
developments, including operating results, prospects and results of clinical trials, new product initiatives, new collaborative agreements,
capital-raising events, and merger and acquisition activities. These investments are evaluated on the basis of a qualitative assessment
for indicators of impairment by monitoring the presence of the following triggering events or impairment indicators:
(i)a significant deterioration in the earnings performance, credit rating, asset quality, or business prospects of the investee;
(ii)a significant adverse change in the regulatory, economic, or technological environment of the investee;
(iii)a significant adverse change in the general market condition, including the research and development of technology and
products that the investee is bringing or attempting to bring to the market;
(iv)significant concerns about the investee’s ability to continue as a going concern; and/or
(v)a decision by investors to cease providing support or reduce their financial commitment to the investee.
If such indicators are present, we are required to estimate the investment’s fair value and immediately recognize an
impairment charge in an amount equal to the investment’s carrying value in excess of its estimated fair value.
Investment income/loss recognition and classification
We recognize both realized and unrealized gains and losses in our consolidated statements of operations, classified in
investment income (loss) in our consolidated statements of operations. Unrealized gains and losses represent:
(i)changes in fair value for investments in publicly traded companies;
(ii)changes in NAV for investments in privately held entities that report NAV per share;
(iii)observable price changes for investments in privately held entities that do not report NAV per share; and
(iv)our share of unrealized gains or losses reported by our equity method investees.
Realized gains and losses on our investments represent the difference between proceeds received upon disposition of
investments and their historical or adjusted cost basis. For our equity method investments, realized gains and losses represent our
share of realized gains or losses reported by the investee. Impairments are realized losses, which result in an adjusted cost basis, and
represent charges to reduce the carrying values of investments in privately held entities that do not report NAV per share and equity
method investments, if impairments are deemed other than temporary, to their estimated fair value.
Funding commitments to investments in privately held entities that report NAV
We are committed to funding approximately $347.2 million for our investments in privately held entities that report NAV. Our
funding commitments expire at various dates over the next 11 years, with a weighted-average expiration of 7.9 years as of September
30, 2025. These investments are not redeemable by us, but we may receive distributions from these investments throughout their
terms. Our investments in privately held entities that report NAV generally have expected initial terms in excess of 10 years. The
weighted-average remaining term during which these investments are expected to be liquidated was 5.4 years as of September 30,
2025.
The following tables summarize our investments as of September 30, 2025 and December 31, 2024 (in thousands):
September 30, 2025
Cost
Unrealized
Gains
Unrealized
Losses
Carrying
Amount
Publicly traded companies
$197,229
$28,964
$(101,901)
$124,292
Entities that report NAV
482,734
98,002
(40,603)
540,133
Entities that do not report NAV:
Entities with observable price changes
80,454
53,409
(9,614)
124,249
Entities without observable price changes
422,519
422,519
Investments accounted for under the equity method
N/A
N/A
N/A
326,445
Total investments
$1,182,936
$180,375
$(152,118)
$1,537,638
36
7.INVESTMENTS (continued)
December 31, 2024
Cost
Unrealized
Gains
Unrealized
Losses
Carrying
Amount
Publicly traded companies
$188,653
$24,262
$(107,248)
$105,667
Entities that report NAV
518,074
126,077
(34,285)
609,866
Entities that do not report NAV:
Entities with observable price changes
99,932
77,761
(2,956)
174,737
Entities without observable price changes
400,487
400,487
Investments accounted for under the equity method
N/A
N/A
N/A
186,228
Total investments
$1,207,146
$228,100
$(144,489)
$1,476,985
Cumulative gains and losses (realized and unrealized) on investments in privately held entities that do not report NAV still held
as of September 30, 2025 aggregated to a loss of $112.4 million, which consisted of upward adjustments aggregating $53.4 million,
downward adjustments aggregating $9.6 million, and impairments aggregating $156.2 million.
Our investment income (loss) for the three and nine months ended September 30, 2025 and 2024 consisted of the following (in
thousands):
Three Months Ended September 30,
Nine Months Ended September 30,
2025
2024
2025
2024
Realized gains
$9,646
(1)
$12,632
$19,115
(1)
$47,336
Unrealized gains (losses)
18,515
2,610
(71,568)
(32,470)
Investment income (loss)
$28,161
$15,242
$(52,453)
$14,866
(1)Consists of realized gains of $34.8 million and $94.7 million, partially offset by impairment charges of $25.1 million and $75.5 million during the three and nine months
ended September 30, 2025, respectively.
During the nine months ended September 30, 2025, gains and losses on investments in privately held entities that do not
report NAV still held as of September 30, 2025 aggregated to a loss of $79.1 million, which consisted of upward adjustments
aggregating $14.9 million and downward adjustments and impairments aggregating $94.0 million.
During the nine months ended September 30, 2024, gains and losses on investments in privately held entities that do not
report NAV still held as of September 30, 2024 aggregated to a loss of $27.3 million, which consisted of upward adjustments
aggregating $17.6 million and downward adjustments and impairments aggregating $44.9 million.
Unrealized gains or losses related to investments still held (excluding investments accounted for under the equity method) as
of September 30, 2025 and 2024 aggregated to a gain of $16.6 million and $15.7 million during the nine months ended
September 30, 2025 and 2024, respectively.
Our investment loss of $52.5 million for the nine months ended September 30, 2025 also included $1.8 million of equity in
losses of our equity method investments.
Refer to “Investments” in Note 2 – “Summary of significant accounting policies” to our unaudited consolidated financial
statements for additional information.
37
8. OTHER ASSETS
The following table summarizes the components of other assets as of September 30, 2025 and December 31, 2024 (in
thousands):
September 30, 2025
December 31, 2024
Acquired in-place leases
$235,299
$305,144
Deferred compensation plan
51,470
47,727
Deferred financing costs – unsecured senior line of credit
41,819
49,056
Deposits
28,790
21,768
Furniture, fixtures, equipment, and software
63,245
39,558
Net investment in leases
57,971
41,503
Notes receivable
220,458
120,546
Operating lease right-of-use assets
713,433
(1)
764,472
Other assets
109,789
96,690
Prepaid expenses
47,419
33,567
Property, plant, and equipment
131,092
141,275
Total
$1,700,785
$1,661,306
(1)Refer to “Leases in which we are the lessee” in Note 5 – “Leases” for information about the decrease in this balance since December 31, 2024.
Notes receivable
Our notes receivable as of September 30, 2025 and December 31, 2024 consisted of the following (dollars in thousands): 
As of September 30, 2025
Weighted Average
Notes Receivable
Effective
Interest Rate
Maturity
Date
Balance
December 31, 2024
Secured by real estate assets in San Diego
10.1%
11/4/28
$203,013
$103,427
Secured by real estate assets in Greater Boston
4.6%
12/16/29
17,918
17,356
Less: provision for expected credit losses
(473)
(237)
Notes receivable
$220,458
$120,546
Our notes receivable represent held-to-maturity debt securities carried at amortized costs and are generally secured by real
estate. Under the current expected credit losses accounting standard, we are required to estimate and, if necessary, recognize a
provision for expected credit losses related to these notes. We do not have a history of losses on such securities; therefore, we utilize
available information on historical losses for the commercial real estate industry. We determine expected credit losses for our notes
receivable using historical industry losses and considering loan-specific information, including credit ratings of the borrowers, estimated
fair values of underlying real estate assets, loan-to-value ratios, the presence of guarantors, and/or other available information. During
the three months ended September 30, 2025, no adjustment to the provision for expected credit losses related to our notes receivable
was required. The provision is reevaluated on an ongoing basis, with any necessary adjustments recognized in the corresponding
period.
38
9.FAIR VALUE MEASUREMENTS
We provide fair value information about all financial instruments for which it is practicable to estimate fair value. We measure
and disclose the estimated fair value of financial assets and liabilities by utilizing a fair value hierarchy that distinguishes between data
obtained from sources independent of the reporting entity and the reporting entity’s own assumptions about market participant
assumptions. This hierarchy consists of three broad levels, as follows: (i) quoted prices in active markets for identical assets or liabilities
(Level 1), (ii) significant other observable inputs (Level 2), and (iii) significant unobservable inputs (Level 3). Significant other observable
inputs can include quoted prices for similar assets or liabilities in active markets, as well as inputs that are observable for the asset or
liability, such as interest rates, foreign exchange rates, and yield curves. Significant unobservable inputs are typically based on an
entity’s own assumptions, since there is little, if any, related market activity. In instances in which the determination of the fair value
measurement is based on inputs from different levels of the fair value hierarchy, the level in the fair value hierarchy within which the
entire fair value measurement falls is based on the lowest level of input that is significant to the fair value measurement in its entirety.
Our assessment of the significance of a particular input to the fair value measurement in its entirety requires judgment and considers
factors specific to the asset or liability.
Assets and liabilities measured at fair value on a recurring basis
The following table sets forth the assets and liabilities that we measure at fair value on a recurring basis by level in the fair
value hierarchy as of September 30, 2025 and December 31, 2024 (in thousands). There were no transfers of assets measured at fair
value on a recurring basis to or from Level 3 in the fair value hierarchy during the nine months ended September 30, 2025.
Fair Value Measurement Using
Description
Total
Quoted Prices in
Active Markets
for Identical Assets
(Level 1)
Significant
Other
Observable Inputs
(Level 2)
Significant
Unobservable
Inputs
(Level 3)
Assets:
Investments in publicly traded companies:
As of September 30, 2025
$124,292
$124,292
$
$
As of December 31, 2024
$105,667
$105,667
$
$
Cross-currency swap agreements:
As of September 30, 2025
$2,970
$
$2,970
$
As of December 31, 2024
$
$
$
$
Our investments in publicly traded companies represent investments with readily determinable fair values, and are carried at
fair value, with changes in fair value classified in investment income (loss) in our consolidated financial statements. We also hold
investments in privately held entities, which consist of (i) investments that report NAV and (ii) investments that do not report NAV, as
further described below.
Our investments in privately held entities that report NAV, such as our privately held investments in limited partnerships, are
carried at fair value using NAV as a practical expedient, with changes in fair value classified in net income. As of September 30, 2025
and December 31, 2024, the carrying values of investments in privately held entities that report NAV aggregated $540.1 million and
$609.9 million, respectively. These investments are excluded from the fair value hierarchy above as required by the fair value
accounting standard. We estimate the fair value of each of our investments in limited partnerships based on the most recent NAV
prepared by the general partner and reported by each limited partnership. As a result, the determination of fair values of our
investments in privately held entities that report NAV generally does not involve significant estimates, assumptions, or judgments on our
part.
Our cross-currency swap agreements are recognized at fair value. Refer to Note 2 – “Summary of significant accounting
policies” and Note 11 – “Hedge agreements” to our unaudited consolidated financial statements for additional information.
39
9.FAIR VALUE MEASUREMENTS (continued)
Assets and liabilities measured at fair value on a nonrecurring basis
The following table sets forth the assets measured at fair value on a nonrecurring basis by level within the fair value hierarchy
as of September 30, 2025 and December 31, 2024 (in thousands).
Fair Value Measurement Using
Description
Carrying
Amount
Quoted Prices in
Active Markets
for Identical Assets
(Level 1)
Significant
Other
Observable Inputs
(Level 2)
Significant
Unobservable
Inputs
(Level 3)
Real estate assets held for sale with carrying values
adjusted to fair value less costs to sell:
As of September 30, 2025
$405,342
(1)
$
$
$405,342
(2)
As of December 31, 2024
$322,662
(1)
$
$
$322,662
(2)
Investments in privately held entities that do not
report NAV:
As of September 30, 2025
$138,931
$
$124,249
(3)
$14,682
(4)
As of December 31, 2024
$184,236
$
$174,737
(3)
$9,499
(4)
(1)These amounts are included in the total balances of our net assets classified as held for sale aggregating $766.6 million and $371.3 million as of September 30, 2025
and December 31, 2024, respectively, disclosed in Note 3 – “Investments in real estate,” and represent assets held for sale as of September 30, 2025 and December 31,
2024, for which impairments were recognized.
(2)These amounts represent the aggregate carrying amounts of assets held for sale after adjustments to their respective fair values less costs to sell based on executed
purchase and sale agreements, letters of intent, or valuations provided by third-party real estate brokers.
(3)These amounts represent the total carrying amounts of our equity investments in privately held entities with observable price changes, which are included in the
investments balances of $1.5 billion and $1.5 billion in our unaudited consolidated balance sheets as of September 30, 2025 and December 31, 2024, respectively,
disclosed in Note 7 – “Investments” to our unaudited consolidated financial statements.
(4)These amounts are included in the investments in privately held entities without observable price changes balances aggregating $422.5 million and $400.5 million as of
September 30, 2025 and December 31, 2024, respectively, disclosed in Note 7 – “Investments” to our unaudited consolidated financial statements. The aforementioned
balances represent the carrying amounts of investments in privately held entities that do not report NAV for which impairments have been recognized in accordance with
the measurement alternative guidance described in “Investments” in Note 2 – “Summary of significant accounting policies” to our unaudited consolidated financial
statements.
Real estate assets classified as held for sale measured at fair value less costs to sell
Our real estate assets classified as held for sale and measured at fair value less costs to sell are presented in the table above.
These properties represent a subset of our total real estate assets classified as held for sale as of September 30, 2025 and
December 31, 2024. The fair values for these real estate assets were estimated based on executed purchase and sale agreements,
letters of intent, or valuations provided by third-party real estate brokers. Refer to “Investments in real estate” in Note 2 – “Summary of
significant accounting policies” and “Assets held for sale” in Note 3 – “Investments in real estate” to our unaudited consolidated financial
statements for additional information.
Investments in privately held entities that do not report NAV
Our investments in privately held entities that do not report NAV are measured at cost, adjusted for observable price changes
and impairments, with changes recognized in net income (loss). These investments are adjusted based on the observable price
changes in orderly transactions for the identical or similar investment of the same issuer. Further adjustments are not made until
another observable transaction occurs. Therefore, the determination of fair values of our investments in privately held entities that do
not report NAV does not involve significant estimates and assumptions or subjective and complex judgments.
We also subject our investments in privately held entities that do not report NAV to a qualitative assessment for indicators of
impairment. If indicators of impairment are present, we are required to estimate the investment’s fair value and immediately recognize
an impairment charge in an amount equal to the investment’s carrying value in excess of its estimated fair value.
The estimates of fair value typically incorporate valuation techniques that include an income approach reflecting a discounted
cash flow analysis, and a market approach that includes a comparative analysis of acquisition multiples and pricing multiples generated
by market participants. In certain instances, we may use multiple valuation techniques for a particular investment and estimate its fair
value based on an average of multiple valuation results.
Refer to Note 7 – “Investments” to our unaudited consolidated financial statements for additional information.
40
9.FAIR VALUE MEASUREMENTS (continued)
Assets and liabilities not measured at fair value in the statement of financial position but for which the fair value is disclosed
The fair value of our secured note payable and unsecured senior notes payable, and the amounts outstanding on our
unsecured senior line of credit and commercial paper program, were estimated using widely accepted valuation techniques, including
discounted cash flow analyses using significant other observable inputs such as available market information on discount and
borrowing rates with similar terms, maturities, and credit ratings. Because the valuations of our financial instruments are based on these
types of estimates, the actual fair value of our financial instruments may differ materially if our estimates do not prove to be accurate.
Additionally, the use of different market assumptions or estimation methods may have a material effect on the estimated fair value
amounts.
As of September 30, 2025 and December 31, 2024, the book and estimated fair values of our secured note payable and
unsecured senior notes payable and the amounts outstanding under our unsecured senior line of credit and commercial paper program,
including the level within the fair value hierarchy for which the estimates were derived, were as follows (in thousands):
September 30, 2025
Book Value
Fair Value Hierarchy
Estimated
Fair Value
Quoted Prices in
Active Markets
for Identical Assets
(Level 1)
Significant
Other
Observable Inputs
(Level 2)
Significant
Unobservable
Inputs
(Level 3)
Liabilities:
Secured notes payable
$
$
$
$
$
Unsecured senior notes payable
$12,044,999
$
$10,775,923
$
$10,775,923
Unsecured senior line of credit
$
$
$
$
$
Commercial paper program
$1,548,542
$
$1,548,606
$
$1,548,606
December 31, 2024
Book Value
Fair Value Hierarchy
Estimated
Fair Value
Quoted Prices in
Active Markets
for Identical Assets
(Level 1)
Significant
Other
Observable Inputs
(Level 2)
Significant
Unobservable
Inputs
(Level 3)
Liabilities:
Secured notes payable
$149,909
$
$149,413
$
$149,413
Unsecured senior notes payable
$12,094,465
$
$10,472,993
$
$10,472,993
Unsecured senior line of credit
$
$
$
$
$
Commercial paper program
$
$
$
$
$
The carrying values of cash and cash equivalents, restricted cash, tenant receivables, deposits, notes receivable, accounts
payable, accrued expenses, and other short-term liabilities approximate their fair value.
41
10.SECURED AND UNSECURED SENIOR DEBT
The following table summarizes our outstanding indebtedness and respective principal payments remaining as of September 30, 2025 (dollars in thousands):
Stated 
Rate
Interest
Rate(1)
Maturity
Date(2)
Principal Payments Remaining for the Periods Ending December 31,
Unamortized
(Deferred
Financing
Cost),
(Discount)/
Premium
Debt
2025
2026
2027
2028
2029
Thereafter
Principal
Total
Unsecured senior line of credit and
commercial paper program(3)
(3)
4.52%
(3)
1/22/30
(3)
$
$
$
$
$
$1,550,000
$1,550,000
$(1,458)
$1,548,542
Unsecured senior notes payable
4.30%
4.50
1/15/26
300,000
300,000
(160)
299,840
Unsecured senior notes payable
3.80%
3.96
4/15/26
350,000
350,000
(285)
349,715
Unsecured senior notes payable
3.95%
4.13
1/15/27
350,000
350,000
(684)
349,316
Unsecured senior notes payable
3.95%
4.07
1/15/28
425,000
425,000
(994)
424,006
Unsecured senior notes payable
4.50%
4.60
7/30/29
300,000
300,000
(860)
299,140
Unsecured senior notes payable
2.75%
2.87
12/15/29
400,000
400,000
(1,757)
398,243
Unsecured senior notes payable
4.70%
4.81
7/1/30
450,000
450,000
(1,779)
448,221
Unsecured senior notes payable
4.90%
5.05
12/15/30
700,000
700,000
(4,143)
695,857
Unsecured senior notes payable
3.375%
3.48
8/15/31
750,000
750,000
(3,866)
746,134
Unsecured senior notes payable
2.00%
2.12
5/18/32
900,000
900,000
(6,275)
893,725
Unsecured senior notes payable
1.875%
1.97
2/1/33
1,000,000
1,000,000
(6,458)
993,542
Unsecured senior notes payable
2.95%
3.07
3/15/34
800,000
800,000
(6,668)
793,332
Unsecured senior notes payable
4.75%
4.88
4/15/35
500,000
500,000
(4,615)
495,385
Unsecured senior notes payable
5.50%
5.66
10/1/35
550,000
550,000
(6,470)
543,530
Unsecured senior notes payable
5.25%
5.38
5/15/36
400,000
400,000
(3,853)
396,147
Unsecured senior notes payable
4.85%
4.93
4/15/49
300,000
300,000
(2,785)
297,215
Unsecured senior notes payable
4.00%
3.91
2/1/50
700,000
700,000
9,880
709,880
Unsecured senior notes payable
3.00%
3.08
5/18/51
850,000
850,000
(10,938)
839,062
Unsecured senior notes payable
3.55%
3.63
3/15/52
1,000,000
1,000,000
(13,339)
986,661
Unsecured senior notes payable
5.15%
5.26
4/15/53
500,000
500,000
(7,427)
492,573
Unsecured senior notes payable
5.625%
5.71
5/15/54
600,000
600,000
(6,525)
593,475
Unsecured debt weighted-average interest
rate/subtotal
3.97
650,000
350,000
425,000
700,000
11,550,000
13,675,000
(81,459)
13,593,541
Weighted-average interest rate/total
3.97%
$
$650,000
$350,000
$425,000
$700,000
$11,550,000
$13,675,000
$(81,459)
$13,593,541
(1)Represents the weighted-average interest rate as of the end of the applicable period, including amortization of loan fees, amortization of debt premiums (discounts), and other bank fees.
(2)Reflects any extension options that we control.
(3)Refer to footnote 3 on the following page.
42
10.SECURED AND UNSECURED SENIOR DEBT (continued)
The following table summarizes our unsecured senior debt and amounts outstanding under our unsecured senior line of credit
and commercial paper program as of September 30, 2025 (dollars in thousands):
Fixed-Rate
Debt
Variable-Rate
Debt
Weighted-Average
Interest
Remaining
Term
(in years)
Total
Percentage
Rate(1)
Unsecured senior notes payable
$12,044,999
$
$12,044,999
88.6%
3.90%
12.6
Unsecured senior line of credit
and commercial paper program
1,548,542
1,548,542
(2)
11.4
4.52
(2)
4.3
(3)
Total/weighted average
$12,044,999
$1,548,542
$13,593,541
100.0%
3.97%
11.6
(3)
Percentage of total debt
88.6%
11.4%
100%
(1)Represents the weighted-average interest rate as of the end of the applicable period, including expense/income related to the amortization of loan fees, amortization of
debt premiums (discounts), and other bank fees.
(2)As of September 30, 2025, we had no outstanding balance on our unsecured senior line of credit and $1.5 billion of commercial paper notes outstanding.
(3)We calculate the weighted-average remaining term of our commercial paper notes by using the maturity date of our unsecured senior line of credit. Using the maturity
date of our outstanding commercial paper notes, the consolidated weighted-average maturity of our debt is 11.1 years. The commercial paper notes sold during the nine
months ended September 30, 2025 were issued at a weighted-average yield to maturity of 4.64% and had a weighted-average maturity term of 17 days.
Issuance and repayment of unsecured senior notes payable
In February 2025, we issued $550.0 million of unsecured senior notes payable, due 2035, with an interest rate of 5.50%.
In April 2025, we repaid our 3.45% unsecured senior notes payable aggregating $600.0 million upon their maturity, using 
proceeds from our February 2025 unsecured senior notes payable offering, with no gain or loss incurred in connection with this
repayment.
$5.0 billion unsecured senior line of credit
As of September 30, 2025, our unsecured senior line of credit, which matures in 2030, including extension options under our
control,  had aggregate commitments of $5.0 billion and bore an interest rate of SOFR plus 0.855%. In addition to the cost of borrowing,
the unsecured senior line of credit is subject to an annual facility fee of 0.145% based on the aggregate commitments outstanding.
Based upon our ability to achieve certain annual sustainability metrics, the interest rate and facility fee rate are also subject to upward
or downward adjustments of up to four basis points with respect to the interest rate and up to one basis point with respect to the facility
fee rate.
Based on certain sustainability metrics achieved in accordance with the terms of our unsecured senior line of credit
agreement, the borrowing rate was reduced for a one-year period by two basis points to SOFR plus 0.855%, from SOFR plus 0.875%,
and the facility fee was reduced by 0.5 basis point to 0.145% from 0.15%. As of September 30, 2025, we had no outstanding balance
on our unsecured line of credit.
$2.5 billion commercial paper program
Our commercial paper program provides us with the ability to issue up to $2.5 billion of commercial paper notes that bear
interest at short-term fixed rates with a maturity of generally 30 days or less and a maximum maturity of 397 days from the date of
issuance. Our commercial paper program is backed by our unsecured senior line of credit, and at all times we expect to retain a
minimum undrawn amount of borrowing capacity under our unsecured senior line of credit equal to any outstanding notes issued under
our commercial paper program. We use the net proceeds from the issuances of the notes for general working capital and other general
corporate purposes. General corporate purposes may include, but are not limited to, the repayment of other debt and selective
development, redevelopment, or acquisition of properties. During the nine months ended September 30, 2025, the commercial paper
notes were issued at a weighted-average yield to maturity of 4.64% and had a weighted-average maturity term of 17 days. As of
September 30, 2025, we had a $1.5 billion outstanding balance on our commercial paper program.
Repayment of secured note payable
In August 2025, we repaid a secured construction loan aggregating $154.6 million with an interest rate of 7.18%, which was
related to our development project at 99 Coolidge Avenue in our Cambridge/Inner Suburbs submarket. In connection with the
repayment, we recognized a loss on early extinguishment of debt of $107 thousand for the write-off of unamortized deferred financing
costs during the three and nine months ended September 30, 2025.
43
10.SECURED AND UNSECURED SENIOR DEBT (continued)
Interest expense
The following table summarizes interest expense for the three and nine months ended September 30, 2025 and 2024 (in
thousands):
Three Months Ended September 30,
Nine Months Ended September 30,
2025
2024
2025
2024
Interest incurred
$140,943
$130,046
$409,603
$379,554
Capitalized interest
(86,091)
(86,496)
(248,579)
(249,375)
Interest expense
$54,852
$43,550
$161,024
$130,179
11. HEDGE AGREEMENTS
We are exposed to foreign currency exchange rate risk related to our ongoing business operations in Canada. To mitigate the
impact of fluctuations in the USDCAD exchange rate, on July 29, 2025, we entered into fixed-to-fixed cross-currency swap
agreements designated as net investment hedges, which were deemed effective on the commencement date. The aggregate notional
amount of the swaps is CAD $400.0 million, and the corresponding total USD notional is approximately $290.3 million based on the
fixed contractual USDCAD exchange rate of 1.38 at inception. Under the terms of the swap agreements, USD fixed interest amounts
are payable to us and CAD fixed interest amounts are payable to the counterparty. The swap agreements mature on April 30, 2026. As
of September 30, 2025, the hedge relationship remained highly effective. Refer to “Hedge accounting” in Note 2 – “Summary of
significant accounting policies” to our unaudited consolidated financial statements for additional information.
The tables below summarize the fair value of our cross-currency swap agreements designated as net investment hedges and
the impact on our consolidated financial statements. We did not have any outstanding hedge agreements as of and during the year
ended December 31, 2024. Amounts are presented in USD (in thousands).
Fair value of cross-currency swap agreements designated as net investment hedges
As of September 30, 2025
Balance Sheet Location
Fair Value – Asset
Notional Amount Outstanding
Other assets
$2,970
$290,317
Effect on consolidated other comprehensive income
Location in Consolidated Statement of
Comprehensive Income
September 30, 2025
Three Months Ended
Nine Months Ended
Total unrealized gain recognized in other
comprehensive income
Unrealized gains related to net
investment hedge
$2,970
$2,970
For the three and nine months ended September 30, 2025, there were no reclassification of gain or loss from accumulated
other comprehensive income into net income in connection with our hedge agreements.
Effect on consolidated statements of operations
Location in Consolidated
Statement of Operations
September 30, 2025
Three Months Ended
Nine Months Ended
Total gain recognized in net income(1)
Other income
$748
$748
(1)Represents net interest expense settlements and interest rate forward points excluded from assessment of hedge effectiveness. Refer to “Hedge accounting” in Note 2 –
“Summary of significant accounting policies” to our unaudited consolidated financial statements for additional information.
44
12. ACCOUNTS PAYABLE, ACCRUED EXPENSES, AND OTHER LIABILITIES
The following table summarizes the components of accounts payable, accrued expenses, and other liabilities as of
September 30, 2025 and December 31, 2024 (in thousands):
September 30, 2025
December 31, 2024
Accounts payable and accrued expenses
$514,908
$534,803
Accrued construction
306,290
500,890
Acquired below-market leases
145,514
180,407
Conditional asset retirement obligations
45,490
53,968
Deferred rent liabilities
13,366
11,461
Operating lease liability
361,986
507,127
Unearned rent and tenant security deposits
876,854
691,873
Other liabilities
168,318
173,822
Total
$2,432,726
$2,654,351
As of September 30, 2025 and December 31, 2024, our conditional asset retirement obligations liability primarily consisted of
the soil and groundwater remediation liabilities associated with certain of our properties. Some of our properties may contain asbestos
or may be subjected to other hazardous or toxic substances, which, under certain conditions, requires remediation. We engage
independent environmental consultants to conduct Phase I or similar environmental assessments at our properties. This type of
assessment generally includes a site inspection, interviews, and a public records review; asbestos, lead-based paint, and mold surveys;
subsurface sampling; and other testing. We recognize a liability for the fair value of a conditional asset retirement obligation when the
fair value of the liability can be reasonably estimated. In addition, environmental laws and regulations subject our tenants, and
potentially us, to liability that may result from our tenants’ routine handling of hazardous substances and wastes as part of their
operations at our properties. These assessments and investigations of our properties have not to date revealed any additional
environmental liability we believe would have a material adverse effect on our business and financial statements or that would require
additional disclosures or recognition in our consolidated financial statements.
45
13.EARNINGS PER SHARE
With respect to dividend rights, we have granted two types of restricted stock awards: (i) restricted stock awards with
nonforfeitable dividends and (ii) restricted stock awards with forfeitable dividends.
We account for unvested restricted stock awards (“RSAs”) with nonforfeitable dividends as participating securities and include
these securities in the computation of EPS using the two-class method. Under the two-class method, we allocate net income (after
amounts attributable to noncontrolling interests) to common stockholders and unvested RSAs with nonforfeitable dividends by using the
weighted-average shares of each class outstanding for quarter-to-date and year-to-date periods independently, based on their
respective participation rights to dividends declared (or accumulated) and undistributed earnings.
Unvested RSAs with forfeitable dividends do not qualify as participating securities under the two-class method because the
dividends are forfeited if the awards do not vest. As a result, undistributed earnings are not allocated to these awards prior to vesting,
and these awards have no effect on the computation of basic EPS while unvested. Once these awards vest, they are included in the
denominator of basic EPS, weighted for the portion of the reporting period they were vested. Prior to vesting, these awards are included
in the denominator of diluted EPS if they are dilutive, which is determined using the treasury stock method. Under this method,
incremental shares are calculated as the difference between the total unvested shares and the number of shares that could
hypothetically be repurchased using the assumed proceeds (including unrecognized compensation cost related to these awards).
These incremental shares are weighted for the portion of the reporting period they were unvested and are included in the diluted EPS
denominator only if their inclusion reduces EPS (i.e., if they are not antidilutive).
In addition, from time to time, we enter into forward equity sales agreements. We consider the potential dilution resulting from
the forward equity sales agreements on the EPS calculations. At inception, the agreements do not have an effect on the computation of
basic EPS as no shares are delivered until settlement. The common shares issued upon the settlement of the forward equity sales
agreements, weighted for the period these common shares were outstanding, are included in the denominator of basic EPS. To
determine the dilution resulting from the forward equity sales agreements during the period of time prior to settlement, we calculate the
number of weighted-average shares outstanding – diluted using the treasury stock method. As of September 30, 2025, no forward
equity sales agreements were outstanding.
The table below reconciles the numerators and denominators of the basic and diluted EPS computations for the three and nine
months ended September 30, 2025 and 2024 (in thousands, except per share amounts):
Three Months Ended
September 30,
Nine Months Ended
September 30,
2025
2024
2025
2024
Net (loss) income
$(197,845)
$213,603
$(221,372)
$526,828
Net income attributable to noncontrolling interests
(34,909)
(45,656)
(127,323)
(141,634)
Net income attributable to unvested RSAs with nonforfeitable
dividends
(2,183)
(3,273)
(7,452)
(10,717)
Numerator for basic and diluted EPS – net (loss) income
attributable to Alexandria Real Estate Equities, Inc.’s
common stockholders
$(234,937)
$164,674
$(356,147)
$374,477
Denominator for basic EPS – weighted-average shares of
common stock outstanding
170,181
172,058
170,278
172,007
Dilutive effect of unvested RSAs with forfeitable dividends
Denominator for diluted EPS – weighted-average shares of
common stock outstanding
170,181
172,058
170,278
172,007
Net (loss) income per share attributable to Alexandria Real
Estate Equities, Inc.’s common stockholders:
Basic
$(1.38)
$0.96
$(2.09)
$2.18
Diluted
$(1.38)
$0.96
$(2.09)
$2.18
46
14.STOCKHOLDERS’ EQUITY
Common equity transactions
Common stock repurchase program
Under our common stock repurchase program authorized in December 2024, we may repurchase up to $500.0 million of our
common stock in the open market, in privately negotiated transactions, or otherwise through December 31, 2025.
During the three months ended March 31, 2025, we repurchased 2.2 million shares of common stock under this repurchase
program at an average price per share of $96.71.
No shares were repurchased during the three months ended June 30, and September 30, 2025. As of September 30, 2025,
the approximate value of shares that may yet be purchased under this program was $241.8 million.
ATM common stock offering program
In February 2024, we entered into an ATM common stock offering program that allows us to sell up to an aggregate of
$1.5 billion of our common stock.
During the nine months ended September 30, 2025, we had no activity under our ATM program. As of September 30, 2025,
the remaining aggregate amount available under our ATM program for future sales of common stock was $1.47 billion.
Dividends
During the three months ended March 31, 2025, we declared cash dividends on our common stock aggregating $228.3 million,
or $1.32 per share.
During the three months ended June 30, 2025, we declared cash dividends on our common stock aggregating $228.3 million,
or $1.32 per share.
During the three months ended September 30, 2025, we declared cash dividends on our common stock aggregating
$228.1 million, or $1.32 per share.
Accumulated other comprehensive loss
The change in accumulated other comprehensive loss attributable to Alexandria Real Estate Equities, Inc.’s stockholders
during the nine months ended September 30, 2025 was entirely due to net unrealized gains of $14.0 million on foreign currency
translation related to our operations primarily in Canada.
Common stock, preferred stock, and excess stock authorizations
Our charter authorizes the issuance of 400.0 million shares of common stock, of which 170.3 million shares were issued and
outstanding as of September 30, 2025. Our charter also authorizes the issuance of up to 100.0 million shares of preferred stock, none
of which were issued and outstanding as of September 30, 2025. In addition, 200.0 million shares of “excess stock” (as defined in our
charter) are authorized, none of which were issued and outstanding as of September 30, 2025.
47
15.SEGMENT INFORMATION
We are a life science REIT focused on developing, redeveloping, and operating properties that provide space for lease to
tenants primarily in the life science industry. Our properties are leased predominantly through triple-net lease agreements and share
key characteristics, including generic and reusable improvements, consistent lease structures, and business strategy. All properties are
located within North America, predominantly in the U.S., and operate within a comparable regulatory environment.
Operating segments
Our Chief Operating Decision Maker (“CODM”), represented by our Executive Chairman and our Chief Executive Officer,
evaluates operating results at the geographic market level to assess performance and allocate resources. Our operating segments align
with our markets, including Greater Boston, the San Francisco Bay Area, San Diego, and Seattle, among others. Regular market
performance updates are provided directly to the CODM. These updates include each market’s net operating income (“NOI”), which
serves as the profit or loss measure used by the CODM for performance assessment and resource allocation. NOI provides useful
information regarding performance of each market as it reflects income and expenses incurred in connection with real estate operations
in each market. This metric enables the CODM to evaluate the profitability and performance of each market on a consistent and
comparable basis, supporting decisions on capital resource allocation, including in connection with development, redevelopment,
acquisition, and disposition activities in each market.
Evaluation of economic similarity and aggregation of operating segments
In accordance with the segment reporting accounting standard, we evaluate the economic similarity of our operating
segments. Seven of our nine operating segments exhibit consistent long-term economic characteristics, including similar historical long-
term NOI margins, which are also expected to remain similar in the future. Additionally, these markets share similar operational
characteristics, including nature of services provided (i.e., leasing, operating, developing, and redeveloping life science properties),
tenant base (i.e., a variety of tenants involved in the life science industry), methods of operation (i.e., consistent lease structures,
property management practices, and business strategies), nature of the regulatory environment (consistent across North America,
where all our operating segments are located). Based on shared economic characteristics, we have aggregated our seven operating
segments into one reportable segment for segment reporting purposes. Two of our operating segments, specifically our New York City
and Canada markets, do not meet the aggregation criteria and individually do not meet the quantitative thresholds to qualify as
reportable segments. Therefore, these operating segments are included in the “all other” category in the tables below.
The following table presents the reportable segment profit or loss measure, NOI, for the three and nine months ended
September 30, 2025 and 2024 (in thousands):
Three Months Ended September 30,
Nine Months Ended September 30,
2025
2024
2025
2024
Reportable segment revenues:
Revenues from external customers
$700,635
$733,817
$2,103,291
$2,168,331
Other income
7,764
12,173
24,779
23,526
Reportable segment total revenues
708,399
745,990
2,128,070
2,191,857
Reportable segment total rental operating expenses
(222,441)
(215,563)
(647,279)
(606,584)
Reportable segment net operating income (reportable
segment profit or loss)
$485,958
$530,427
$1,480,791
$1,585,273
Significant expenses included in the reportable segment profit or loss measure (i.e., NOI) are represented by the reportable
segment total rental operating expenses and are disclosed in the table above. These expenses primarily include property taxes, utilities,
repairs and maintenance, engineering, janitorial, and other costs.
48
15.SEGMENT INFORMATION (continued)
Presented below are reconciliations of the reportable segment total revenues to the consolidated revenues, the reportable
segment total rental operating expenses to consolidated rental operations, the reportable segment NOI to the consolidated net income,
and the reportable segment investments in real estate assets to the consolidated investments in real estate assets (in thousands):
Three Months Ended
September 30,
Nine Months Ended
September 30,
2025
2024
2025
2024
Reconciliation of reportable segment revenues to
consolidated total revenues:
Reportable segment total revenues
$708,399
$745,990
$2,128,070
$2,191,857
All other revenues
43,545
45,617
144,072
135,592
Consolidated revenues
$751,944
$791,607
$2,272,142
$2,327,449
Reconciliation of reportable segment total rental operating
expenses to consolidated rental operations:
Reportable segment total rental operating expenses
$(222,441)
$(215,563)
$(647,279)
$(606,584)
All other rental operating expenses
(16,793)
(17,702)
(42,783)
(62,249)
Consolidated rental operations
$(239,234)
$(233,265)
$(690,062)
$(668,833)
Reconciliation of reportable segment net operating income
to consolidated net income:
Reportable segment net operating income (reportable
segment profit or loss)
$485,958
$530,427
$1,480,791
$1,585,273
All other revenues
43,545
45,617
144,072
135,592
All other rental operating expenses
(16,793)
(17,702)
(42,783)
(62,249)
Other items not allocated to segments:
General and administrative
(29,224)
(43,945)
(89,027)
(135,629)
Interest expense
(54,852)
(43,550)
(161,024)
(130,179)
Depreciation and amortization
(340,230)
(293,998)
(1,028,415)
(872,272)
Impairment of real estate
(323,870)
(5,741)
(485,630)
(36,504)
Loss on early extinguishment of debt
(107)
(107)
Equity in earnings (losses) of unconsolidated real
estate joint ventures
201
139
(9,327)
424
Investment income (loss)
28,161
15,242
(52,453)
14,866
Gain on sale of real estate
9,366
27,114
22,531
27,506
Consolidated net (loss) income
$(197,845)
$213,603
$(221,372)
$526,828
September 30, 2025
December 31, 2024
Reconciliation of reportable segment assets to consolidated investments in real
estate assets:
Reportable segment investments in real estate
$30,316,524
$30,393,144
All other investments in real estate
1,427,393
1,716,895
Consolidated investments in real estate
$31,743,917
$32,110,039
49
16.SUBSEQUENT EVENTS
Sales of real estate in October 2025
In October 2025, we completed the following dispositions:
A retail shopping center aggregating 249,275 RSF, with future development opportunity aggregating 281,592 SF, at 550
Arsenal Street in our Cambridge/Inner Suburbs submarket of Greater Boston for a sales price of $99.3 million with no gain
or loss recognized.
Two operating properties aggregating 206,340 RSF in our San Diego and Research Triangle markets for a sales price
aggregating $68.1 million and recognized a gain on sale of real estate of $4.4 million.
50
ITEM 2. MANAGEMENT’S DISCUSSION AND ANALYSIS OF FINANCIAL CONDITION AND RESULTS OF OPERATIONS
Forward-looking statements
Certain information and statements included in this quarterly report on Form 10-Q, including, without limitation, statements
containing the words “forecast,” “guidance,” “goals,” “projects,” “estimates,” “anticipates,” “believes,” “expects,” “intends,” “may,” “plans,”
“seeks,” “should,” “targets,” or “will,” or the negative of those words or similar words, constitute “forward-looking statements” within the
meaning of Section 27A of the Securities Act of 1933, as amended, and Section 21E of the Securities Exchange Act of 1934, as
amended. Forward-looking statements involve inherent risks and uncertainties regarding events, conditions, and financial trends that
may affect our future plans of operations, business strategy, results of operations, and financial position. A number of important factors
could cause actual results to differ materially from those included within or contemplated by the forward-looking statements, including,
but not limited to, the following:
Operating factors, such as a failure to operate our business successfully in comparison to market expectations or in
comparison to our competitors, our inability to obtain capital when desired or refinance debt maturities when desired, and/
or a failure to maintain our status as a REIT for federal tax purposes;
Market and industry factors, such as adverse developments concerning the life science industry and/or our tenants;
Government factors, such as any unfavorable effects resulting from federal, state, local, and/or foreign government
policies, laws, and/or funding levels;
Global factors, such as negative economic, social, political, financial, credit market, banking conditions, and/or regional
armed hostilities; and
Other factors, such as climate change, cyber intrusions, and/or changes in laws, regulations, and financial accounting
standards.
Global trade policies
We have been monitoring and will continue to monitor macroeconomic trends and uncertainties. In particular, we are
assessing how recent fluctuations in international trade relations and trade policies could adversely affect our business or the
businesses of our tenants.
In early March 2025, the U.S. government imposed or indicated that it would impose a series of tariffs on certain goods from
Canada and Mexico as well as raise tariffs on Chinese imports. President Trump has also indicated his intent to impose a “major”
pharmaceutical-specific tariff, which could adversely affect our business and/or the business of our tenants. As a result of these
developments, the global securities and trade markets have reacted with volatility, and trade tensions remain high.
The imposition of tariffs or the potential future imposition of additional or modified tariffs in the current geopolitical climate could
have material adverse effects on the net profitability, revenues, or operations of Alexandria and many other companies. While we are
evaluating the potential impacts of such tariffs, as well as our ability to mitigate such impacts, these recent trends may in the meantime
interrupt supply chains, fragment international business relationships, and create unknown risks that would thereby affect our or our
tenants’ business operations.
This list of risks and uncertainties is not exhaustive. Additional information regarding risk factors that may affect us is included
under Part I; “Item 1A. Risk factors”; and “Item 7. Management’s discussion and analysis of financial condition and results of
operations” in our annual report on Form 10-K for the year ended December 31, 2024 and under respective sections in this quarterly
report on Form 10-Q. Readers of this quarterly report on Form 10-Q should also read our other documents filed publicly with the SEC
for further discussion regarding such factors.
51
Overview
We are a Maryland corporation formed in October 1994 that has elected to be taxed as a REIT for federal income tax
purposes. Alexandria Real Estate Equities, Inc. (NYSE: ARE), an S&P 500® company, is a best-in-class, mission-driven life science
REIT making a positive and lasting impact on the world. With our founding in 1994, Alexandria pioneered the life science real estate
niche. Alexandria is the preeminent and longest-tenured owner, operator, and developer of collaborative Megacampus™ ecosystems in
AAA life science innovation cluster locations, including Greater Boston, the San Francisco Bay Area, San Diego, Seattle, Maryland,
Research Triangle, and New York City. As of September 30, 2025, Alexandria has a total market capitalization of $27.8 billion and an
asset base in North America that includes 39.1 million RSF of operating properties and 4.2 million RSF of Class A/A+ properties
undergoing construction and one 100% pre-leased committed near-term project expected to commence construction in the next year.
We develop dynamic Megacampus ecosystems that enable and inspire some of the world’s most brilliant minds and innovative
companies to create life-changing scientific and technological innovations. We believe in the utmost professionalism, humility, and
teamwork. Our tenants include multinational pharmaceutical companies; life science product, service, and device companies; public
and private biotechnology companies; advanced technologies companies; biomedical institutions; U.S. government institutions; and
others. Alexandria has a long-standing and proven track record of developing Class A/A+ properties clustered in highly dynamic and
collaborative Megacampus environments that enhance our tenants’ ability to successfully recruit and retain world-class talent and
inspire productivity, efficiency, creativity, and success. Alexandria also provides strategic capital to transformative life science
companies through our venture capital platform.
As of September 30, 2025:
Investment-grade or publicly traded large cap tenants represented 53% of our annual rental revenue;
Approximately 97% of our leases (on an annual rental revenue basis) contained effective annual rent escalations
approximating 3% that were either fixed or indexed based on a consumer price index or other index;
Approximately 91% of our leases (on an annual rental revenue basis) were triple net leases, which require tenants to pay
substantially all real estate taxes, insurance, utilities, repairs and maintenance, common area expenses, and other
operating expenses (including increases thereto) in addition to base rent;
Approximately 92% of our leases (on an annual rental revenue basis) provided for the recapture of capital expenditures
(such as HVAC maintenance and/or replacement, roof replacement, and parking lot resurfacing) that we believe would
typically be borne by the landlord in traditional office leases; and
82% of our leasing activity during the last twelve months was generated from our existing tenant base.
A key element of our business strategy is our unique focus on Class A/A+ properties primarily located in collaborative
Megacampus ecosystems in AAA life science innovation clusters. Our Megacampus ecosystems are designed for optionality and
scalability, offering our tenants a clear path to address their growth requirements, including through our future developments and
redevelopments. Strategically located near top academic and medical research institutions and equipped with curated amenities and
services, and convenient access to transit, our Megacampus ecosystems are designed to support our tenants in attracting and retaining
top talent and in meeting our tenants’ growth needs, which we believe is a key driver of tenant demand for our properties. Our strategy
also includes drawing upon our deep, broad, and long-standing real estate and life science industry relationships in order to retain
tenants, identify and attract new and leading tenants, and source additional real estate.
52
Executive summary
Operating results
Three Months Ended September 30,
Nine Months Ended September 30,
2025
2024
2025
2024
Net (loss) income attributable to Alexandria’s
common stockholders – diluted:
In millions
$(234.9)
$164.7
$(356.1)
$374.5
Per share
$(1.38)
$0.96
$(2.09)
$2.18
Funds from operations attributable to Alexandria’s
common stockholders – diluted, as adjusted:
In millions
$377.8
$407.9
$1,166.3
$1,217.3
Per share
$2.22
$2.37
$6.85
$7.08
For additional information, refer to “Funds from operations and funds from operations, as adjusted, attributable to Alexandria
Real Estate Equities, Inc.’s common stockholders” under “Definitions and reconciliations” and to the tabular presentation of these items
in “Results of operations” in Item 2.
A sector-leading REIT with a high-quality, diverse tenant base, strong margins, and long lease terms
(As of September 30, 2025, unless stated otherwise)
Occupancy of operating properties in North America
90.6%
Percentage of total annual rental revenue in effect from Megacampus platform
77%
Percentage of total annual rental revenue in effect from investment-grade or publicly traded large cap tenants
53%
Adjusted EBITDA margin for the three months ended September 30, 2025
71%
Percentage of leases containing annual rent escalations
97%
Weighted-average remaining lease term:
Top 20 tenants
9.4
years
All tenants
7.5
years
Strong tenant collections for the three months ended September 30, 2025:
Tenant rents and receivables for the three months ended September 30, 2025 collected as of the date of this
report
99.9%
Strong and flexible balance sheet with significant liquidity; top 15% credit rating ranking among all publicly traded U.S. REITs
As of September 30, 2025, unless stated otherwise:
Net debt and preferred stock to Adjusted EBITDA of 6.1x and fixed-charge coverage ratio of 3.9x for the three months
ended September 30, 2025 annualized, with targets for the three months ended December 31, 2025 annualized of 5.5x to
6.0x and 3.6x to 4.1x, respectively.
Significant liquidity of $4.2 billion, or 4.2x our debt maturities through 2027.
Only 7% of our total debt matures through 2027.
11.6 years weighted-average remaining term of debt, longest among S&P 500 REITs.
Since 2021, our quarter-end fixed-rate debt has averaged 96.7%.
Total debt and preferred stock to gross assets of 31%.
$166.9 million of capital contribution commitments from existing consolidated real estate joint venture partners to fund
construction from October 1, 2025 through 2027 and beyond.
53
Solid leasing volume and rental rate increases
Leasing volume of 1,171,344 RSF during the three months ended September 30, 2025.
Includes the largest life science lease in company history with a long-standing multinational pharmaceutical tenant for
a 16-year build-to-suit lease expansion aggregating 466,598 RSF on the Campus Point by Alexandria Megacampus
in our University Town Center submarket.
Leasing of previously vacant space aggregating 256,633 RSF, up 40%, over the quarterly average over the last five
quarters.
Rental rate increases on lease renewals and re-leasing of space of 15.2% and 6.1% (cash basis) for the three months
ended September 30, 2025 and 13.6% and 6.8% (cash basis) for the nine months ended September 30, 2025.
82% of our leasing activity during the last twelve months was generated from our existing tenant base.
September 30, 2025
Three Months Ended
Nine Months Ended
Lease renewals and re-leasing of space:
Rental rate increase
15.2%
13.6%
Rental rate increase (cash basis)
6.1%
6.8%
RSF
354,367
1,722,184
Leasing of previously vacant space – RSF
256,633
550,986
Leasing of development and redevelopment space – RSF
560,344
698,542
Total leasing activity – RSF
1,171,344
2,971,712
Key operating metrics
Total revenues
$751.9 million, down 5.0%, for the three months ended September 30, 2025, compared to $791.6 million for the three
months ended September 30, 2024. Excluding dispositions completed after January 1, 2024, total revenues would
have been relatively flat compared to the three months ended September 30, 2025.
$2.3 billion, down 2.4%, for the nine months ended September 30, 2025, compared to $2.3 billion for the nine months
ended September 30, 2024. Excluding dispositions completed after January 1, 2024, total revenues would have
increased by 3.0% for the nine months ended September 30, 2025.
Net operating income (cash basis) of $1.9 billion for the three months ended September 30, 2025 annualized decreased
by $118.5 million, or 5.8%, compared to the three months ended September 30, 2024 annualized. Refer to “Net operating
income, net operating income (cash basis), and operating margin” under “Definitions and reconciliations” in Item 2 for a
reconciliation of our net income to net operating income (cash basis).
Decrease in net operating income (cash basis) includes the impact of operating properties disposed of after January
1, 2024. Excluding these dispositions, net operating income (cash basis) – annualized for the three months ended
September 30, 2025, would have decreased by 1.2%, and for the nine months ended September 30, 2025 would
have increased by 7.3%, compared to the corresponding periods in 2024.
Same property net operating income changes
(6.0)% and (3.1)% (cash basis) for the three months ended September 30, 2025, compared to the three months
ended September 30, 2024.
91.4% same properties’ average occupancy for the three months ended September 30, 2025, compared to
94.8% average occupancy for the three months ended September 30, 2024.
(3.1)% and 3.0% (cash basis) for the nine months ended September 30, 2025, compared to the nine months ended
September 30, 2024.
92.6% same properties’ average occupancy for the nine months ended September 30, 2025, compared to 94.6%
average occupancy for the nine months ended September 30, 2024.
General and administrative expenses
$89.0 million for the nine months ended September 30, 2025, representing cost reductions of $46.6 million or 34%,
compared to the nine months ended September 30, 2024, primarily the result of cost-control and efficiency initiatives
related to reducing personnel-related costs and streamlining business processes. Given that some of these cost
savings are expected to be temporary in nature, we anticipate approximately half of the cost reductions expected to
be achieved in 2025 will continue in 2026.
As a percentage of net operating income, our general and administrative expenses for the trailing twelve months
ended September 30, 2025 were 5.7% the lowest level in the past ten years and approximately half the average of
other S&P 500 REITs.
54
Dividend strategy to share net cash flows from operating activities with stockholders while retaining a significant portion for reinvestment
Common stock dividend declared of $1.32 per share for the three months ended September 30, 2025, aggregating $5.28
per common share for the twelve months ended September 30, 2025, up 14 cents, or 2.7%, over the twelve months
ended September 30, 2024.
Dividend yield of 6.3% as of September 30, 2025 and dividend payout ratio of 60% for the three months ended
September 30, 2025.
Significant net cash flows provided by operating activities after dividends retained for reinvestment aggregating $2.3 billion
for the years ended December 31, 2021 through 2024 and the midpoint of our 2025 guidance range.
In addition, as described in the “Summary of key items that may impact 2026 results” section of “Results of operations” in
this Item 2, in light of market and life science industry conditions and our continued focus on capital efficiency, our Board
of Directors expects to carefully evaluate our 2026 dividend strategy.
Ongoing execution of Alexandria’s 2025 capital recycling strategy
We expect to fund a significant portion of our capital requirements for the year ending December 31, 2025 through dispositions
of non-core assets, land, partial interest sales, and sales to owner/users. We expect dispositions of land to represent 20%30% of our
total dispositions and sales of partial interests in 2025 (dollars in millions):
Sales Price
Total dispositions completed as of October 27, 2025
$508
Our share of pending transactions subject to non-refundable deposits, signed letters of intent, and/or purchase and
sale agreement negotiations
1,032
Our share of completed and pending 2025 dispositions and sales of partial interests
$1,540
(1)
(1)Excludes an exchange of partial interests of Pacific Technology Park and 199 East Blaine Street with nominal net cash proceeds. Refer to “Dispositions and sales of
partial interests” in Item 2 for additional details.
Leasing progress on temporary vacancy
Operating occupancy as of June 30, 2025
90.8%
Assets with vacancy designated as held for sale during the three months ended September 30, 2025, now excluded
from operating occupancy and expected to be sold primarily during the fourth quarter of 2025
0.9
Reduction in occupancy, primarily from lease expirations during the three months ended September 30, 2025
(1.1)
(1)
Operating occupancy as of September 30, 2025
90.6
Key vacant space leased with future delivery
1.6
(2)
Operating occupancy as of September 30, 2025, including leased but not yet delivered space
92.2%
(1)Comprises the following: (i) 0.3% related to lease expirations that became vacant during the three months ended September 30, 2025 and have been re-leased with a
future delivery upon completion of construction (and is included in item 2 below); (ii) 0.2% vacancy at one asset in our Greater Stanford submarket, which was recently
acquired with the intent to redevelop office to laboratory space but for which we are now evaluating options to reposition for advanced technologies use; and (iii) 0.6% of
other occupancy declines, primarily from space that became vacant during the three months ended September 30, 2025 which we are currently marketing. These lease
expirations resulting in the 1.1% decline in occupancy previously generated annual rental revenue aggregating approximately $29.0 million and had a weighted-average
lease expiration date at the end of July 2025.
(2)Represents temporary vacancies as of September 30, 2025 aggregating 617,458 RSF, primarily in the Greater Boston, San Francisco Bay Area, San Diego, and Seattle
markets, that are leased and expected to be occupied upon completion of building and/or tenant improvements. The weighted-average expected delivery date is
approximately May 1, 2026 and the expected annual rental revenue is approximately $46 million.
Key capital metrics as of or for the three months ended September 30, 2025
$27.8 billion in total market capitalization.
$14.2 billion in total equity capitalization.
Non-real estate investments aggregating $1.5 billion:
Unrealized gains presented in our consolidated balance sheet were $28.3 million, comprising gross unrealized gains
and losses aggregating $180.4 million and $152.1 million, respectively.
Investment income of $28.2 million for the three months ended September 30, 2025 presented in our consolidated
statement of operations consisted of $34.8 million of realized gains, $18.5 million of unrealized gains, and $25.1 million of
impairment charges.
55
Key capital events
In August 2025, we repaid a secured construction loan aggregating $154.6 million with an interest rate of 7.18%, which
was secured by our development project at 99 Coolidge Avenue in our Cambridge/Inner Suburbs submarket. The project
is currently 81% leased/negotiating and is expected to be delivered in the fourth quarter of 2026. In connection with the
repayment, we recognized a loss on early extinguishment of debt of $107 thousand for the write-off of unamortized
deferred financing costs during the three and nine months ended September 30, 2025.
External growth and investments in real estate
Alexandria’s development and redevelopment pipeline delivered incremental annual net operating income of $16 million, commencing
during the three months ended September 30, 2025, with an additional $111 million of incremental annual net operating income
anticipated to deliver by the fourth quarter of 2026 primarily from projects that are 80% leased/negotiating.
During the three months ended September 30, 2025, we placed into service development projects aggregating 185,517
RSF that are 89% occupied across multiple submarkets and delivered incremental annual net operating income of
$16 million.
A significant delivery during the three months ended September 30, 2025 consisted of 122,302 RSF at 10935, 10945,
and 10955 Alexandria Way on the One Alexandria Square Megacampus in our Torrey Pines submarket.
Annual net operating income (cash basis) from recently delivered projects is expected to increase by $50 million upon the
burn-off of initial free rent, which has a weighted-average remaining period of approximately three months.
During 20252026, we expect to deliver annual net operating income representing nearly 8% growth in total net operating
income from 2024 from projects that are 85% leased.
76% of the RSF in our total development and redevelopment pipeline is within our Megacampus ecosystems.
(dollars in millions)
Incremental
Annual Net
Operating Income
RSF
Occupied/
Leased/
Negotiating
Percentage
Placed into service:
Six months ended June 30, 2025
$52
527,268
96%
Three months ended September 30, 2025
16
185,517
89
Total placed into service during nine months ended September 30, 2025
$68
(1)
712,785
94%
Expected to be placed into service:
Fourth quarter of 2025 through fourth quarter of 2026
$111
(2)
969,524
(3)
80%
(4)
(1)Excludes future incremental annual net operating income from recently delivered spaces aggregating 42,449 RSF that are vacant and/or unleased at delivery.
(2)Includes expected partial deliveries through the fourth quarter of 2026 from projects expected to stabilize in 2027 and beyond, including speculative future leasing
that is not yet fully committed. Refer to the initial and stabilized occupancy years under “New Class A/A+ development and redevelopment properties: current
projects” in Item 2 for additional information.
(3)Represents the RSF related to projects expected to stabilize by the fourth quarter of 2026. Does not include RSF for partial deliveries through the fourth quarter of
2026 from projects expected to stabilize in 2027 and beyond.
(4)Represents the current leased/negotiating percentage of development and redevelopment projects that are expected to stabilize during the fourth quarter of 2025
through the fourth quarter of 2026.
56
Trends that may affect our future results
Current identified key market trends and uncertainties that had or may have a negative effect on our business are discussed
below. Although we seek to minimize the risks posed by these trends and uncertainties as discussed in the mitigating factors section
below, there can be no assurance that these measures will be successful in preventing material impacts on our future results of
operations, financial position, and cash flows. Refer to “Item 1A. Risk factors” within “Part II – Other information” of this quarterly report
on Form 10-Q and “Item 1A. Risk factors” within Part I in our annual report on Form 10-K for the year ended December 31, 2024 for
discussion of additional risks we face.
New competitive supply may exert pressure on our rental rates and occupancy, and adversely affect our operating
results.
During and after the COVID-19 pandemic, the shift toward hybrid and remote work arrangements has led certain office and
other real estate companies to repurpose their underutilized office spaces into laboratory facilities. Our success and the
success of other laboratory operators have prompted and may continue to prompt new and existing life science developers to
commence speculative redevelopment and/or development projects in anticipation of demand for laboratory facilities. These
conversion and speculative development projects have contributed to a significant influx of new laboratory properties in key
markets such as Boston, San Diego, and the San Francisco Bay Area, heightening competitive pressures and diluting
landlords’ pricing power in certain submarkets.
To remain competitive with the influx of new laboratory properties, we may be required to reduce our rental rates and/or offer
more tenant improvement allowances or additional tenant concessions, including free rent, to retain existing tenants, or attract
new tenants. Furthermore, our existing operating properties may require additional revenue- and non-revenue-enhancing
capital investments earlier than typically expected. The table below reflects a trend of increasing revenue- and non-revenue-
enhancing capital expenditures, which include tenant improvement expenditures. The table also presents the trend, on a per
RSF basis, for our tenant improvements and leasing commissions, free rent concessions, decreasing growth in rental rates
related to our renewed/re-leased spaces, and decreases in our operating occupancy (dollars in thousands, except per RSF
amounts):
Revenue- and
Non-Revenue-
Enhancing
Capital
Expenditures
Tenant
Improvements/
Leasing
Commissions
per RSF
Free Rent
Concessions per
Annum
(leases executed in
trailing 12 months)
Rental Rate
Increases
(on renewed/
re-leased
spaces)
Operating
Occupancy
(as of each
period end)
Fiscal year 2023
$260,392
$26.09
0.6 months
29.4%
94.6%
Fiscal year 2024
$273,377
$46.89
0.7 months
16.9%
94.6%
Nine months ended September 30, 2025
$230,867
$66.29
1.2 months
13.6%
90.6%
Midpoint of 2025 guidance range
$415,000
N/A
11.0%
90.8%
(1)
(1)Our guidance assumes an approximate 1% benefit related to a range of assets with vacancy that could potentially qualify for held for sale designation during
the fourth quarter of 2025. These assets have not yet reached the criteria for held for sale designation as of September 30, 2025.
Additionally, we have leases at 20 properties, primarily located in the Greater Boston, San Francisco Bay Area, and San Diego
markets, aggregating 1.2 million RSF with a weighted-average lease expiration date of March 19, 2026. These spaces are
expected to become vacant at lease expiration and re-leased to new tenants. We currently expect downtime on the 1.2 million
RSF to range from 6 to 24 months on a weighted-average basis. However, given the elevated supply of new laboratory space
in these markets, there can be no assurance that we will be able to re-lease some or all of this space on acceptable terms or
within anticipated time frames, even at reduced rates.
As of September 30, 2025, we anticipate that 4.2 million RSF of our projects undergoing construction and one 100% pre-
leased committed near-term project expected to commence construction in the next year will be placed into service from 2025
through 2028 and will generate $390 million in future incremental annual net operating income. These projects are 43% leased
or under lease negotiations as of September 30, 2025. Additionally, landlord-funded tenant improvement allowances have
increased significantly for first-generation space, including development and redevelopment projects, with most space in shell
condition requiring landlords to fund the full build-out cost. This trend places additional pressure on projected returns and
overall economics. Realization of the aforementioned risks could hinder our ability to secure tenants for the remaining
unleased RSF related to these projects at the expected rates, or at all, potentially leading to a shortfall in, or delays in the
commencement of, the projected incremental annual net operating income.
57
Unfavorable macroeconomic environment, capital markets, and life science industry fundamentals may negatively
impact the value of our real estate and non-real estate portfolios which could result in significant impairments, and
may limit our ability to raise capital efficiently to further our business objectives.
The effective execution of our development and redevelopment activities is contingent on access to capital required to fund
projects. The midpoint of our range for 2025 construction spend is $1.75 billion. This includes significant remaining
construction costs to complete our active pipeline, and anticipated increases in both revenue- and non-revenue-enhancing
capital expenditures in our operating portfolio. We expect funding for construction spending in 2026 to be similar or slightly
higher than the $1.75 billion midpoint of our guidance range for 2025 construction in order to complete our active construction
projects and significant revenue- and non-revenue-enhancing capital expenditures necessary to lease vacant space.
Additionally, given the factors previously described which could negatively impact EBITDA, we would require significant equity-
type capital to manage our leverage profile.
Lower property valuations and increased capitalization rates. A portion of our projected construction spending and
acquisition and other opportunistic uses of capital spending is expected to be funded through dispositions and sales of
partial interests in core and non-core real estate assets. Real estate investments are generally less liquid than many other
investment types, which can present challenges in selling our properties timely or at desirable prices, especially in an
environment of oversupply.
Real estate sales can be particularly challenging given the demand for real estate is impacted by an economic climate
marked by ongoing uncertainties around tenant demand for space and elevated interest rates, in addition to those related
to oversupply. Although the U.S. Federal Reserve lowered the federal funds target range from 5.25%5.50% at the end of
2023 to 4.25%4.50% during 2024, and to 4.00%4.25% in September 2025, interest rates remain elevated. This could
continue to limit access to debt and/or equity financing for prospective buyers of our real estate assets, potentially
eliminating their participation in the market or forcing them to seek more expensive alternative funding options. All other
aspects being equal, such challenges for buyers lead to an excess of properties available for sale, which exert downward
pressure on property valuations and elevate capitalization rates, adversely impacting the sales proceeds we expect from
our real estate asset sales.
The new supply, discussed above, combined with high interest rates and reduced market liquidity, has resulted in a
prolonged period of lower property valuations and higher capitalization rates, potentially leading to significant additional
real estate impairments and making it more challenging to execute asset sales within expected timelines and at favorable
pricing. For additional information about our dispositions, refer to “Sales of real estate assets and impairment of real
estate” in Note 3 – “Investments in real estate” to our unaudited consolidated financial statements in “Item 1. Financial
statements” (“Item 1”) for additional information. In 2025, we expect to complete dispositions and sales of partial interests
of approximately $1.50 billion at the midpoint of our 2025 guidance range. However, we may not be able to achieve this
and/or other targets disclosed in our 2025 guidance as a result of the uncertainties discussed in this section as well as in
“Item 1A. Risk factors” within “Part II – Other information” of this quarterly report on Form 10-Q and “Item 1A. Risk factors”
within Part I in our annual report on Form 10-K for the year ended December 31, 2024.
The table below presents total dispositions and a trend of increasing impairments of real estate and capitalization rates
associated with dispositions and sales of partial interests in our real estate assets (dollars in thousands), which is partly
attributable to the quality of core and non-core assets we sold during each period. There is no assurance that this upward
trend will stabilize or reverse in the future.
Total Dispositions and
Sales of Partial
Interests
Impairment of
Real Estate
Capitalization
Rates(1)
Capitalization
Rates
(Cash Basis)(1)
2023
$1,314,414
$461,114
6.7%
5.9%
2024
$1,382,453
$223,068
7.7%
6.5%
Nine months ended September 30, 2025
$342,441
$485,630
N/A(2)
Midpoint of 2025 guidance range
$1,500,000
$828,500
N/A
(1)Capitalization rates are calculated only for stabilized operating assets sold. Refer to “Capitalization rates” under “Definitions and reconciliations for
additional information.
(2)There were no significant stabilized laboratory dispositions completed during the nine months ended September 30, 2025.
The midpoint of our 2025 guidance range for dispositions of real estate assets is $1.5 billion. As of September 30, 2025,
we have completed dispositions aggregating $340.9 million, and expect to complete an additional $1.2 billion of
dispositions during the fourth quarter of 2025 to achieve the midpoint of our 2025 guidance range. We continue to
evaluate a significant number of disposition targets, including non-core operating properties, both stabilized and
unstabilized, and land parcels.
58
Under U.S. GAAP, existing real estate assets are evaluated for impairment upon indication of potential impairment.
Impairments of real estate assets held and used are recognized if future undiscounted cash flows, including estimated
proceeds from eventual sale of an asset, are less than the carrying amount of the asset. For real estate assets held for
sale, impairments are recognized if the expected sales price less costs to sell is less than the carrying amount. For
additional information on accounting for real estate impairments, refer to “Impairment of long-lived assets” in Note 2 –
“Summary of significant accounting policies” to our unaudited consolidated financial statements.
As of September 30, 2025, we have evaluated a large number of potential disposition targets under a probability-weighted
method, including under the held and used and held for sale models. In each case, no impairment charge was required. If
these specific assets meet the criteria to be designated as held for sale during the fourth quarter of 2025, we may incur
impairments ranging from $0 to $685 million.
Our revised 2025 guidance range for impairments of real estate is from $485.6 million to $1.17 billion (with a midpoint at
$828.5 million) consisting of $485.6 million recognized in our consolidated statements of operations during the nine
months ended September 30, 2025 and additional potential impairments ranging from $0 to $685 million during the fourth
quarter of 2025. If these impairments are recognized during the fourth quarter of 2025, they will have a material impact on
our net income and earnings per share for the year ending December 31, 2025. However, these impairments will not
impact our funds from operations (“FFO”) per share as Nareit requires the add-back of real estate impairment charges.
FFO and FFO per share, as adjusted represent non-GAAP measures. For their definitions and reconciliations from the
most directly comparable financial measure presented in accordance with GAAP, refer to “Funds from operations and
funds from operations, as adjusted, attributable to Alexandria Real Estate Equities, Inc.’s common stockholders” under
“Definitions and reconciliations” in Item 2.
We expect a significant source of funding from the sale of non-core assets in 2026. We anticipate an end to our large-
scale non-core asset sales program in 2026 or early 2027. As of September 30, 2025, 77% of our annual rental revenue is
from our Megacampus™ platform and we expect this percentage to continue to grow over time.
Increased cost and limited availability of capital. In February 2025, we issued $550.0 million of unsecured senior notes
payable, primarily to refinance our $600.0 million unsecured senior notes payable that matured in April 2025. Currently, we
do not expect to issue any additional new debt in 2025. However, should we encounter difficulties in selling our real estate
assets at our targeted prices, we may need to increase our reliance on debt financing to fund our construction projects,
which are projected to aggregate approximately $1.75 billion in construction spending based on the midpoint of our 2025
guidance range. Elevated benchmark interest rates may result in debt funding options that are costlier, less accessible, or
even unavailable, potentially limiting our ability to complete our development and redevelopment projects on schedule and
thereby delaying our expected incremental annual net operating income generation and negatively affecting our business.
The table below reflects interest rates related to our unsecured senior notes payable issued in 2023, 2024, and in
February 2025 (dollars in thousands). There is no assurance that high debt costs will not continue into the future.
Unsecured Senior
Notes Payable Issued
Interest Rate(1)
2023
$1,000,000
5.07%
2024
$1,000,000
5.57%
February 2025 issuance and midpoint of our 2025 guidance
$550,000
5.66%
(1)Includes amortization of loan fees, amortization of debt premiums (discounts), and other bank fees.
Capitalized Interest. In 2025, our capitalized interest and interest expense are expected to be $335 million and
$210 million, respectively, each at the midpoints of our 2025 guidance ranges. Our strategic focus is on prioritizing the
completion of our projects under construction that are highly leased. Additionally, we invest in our future pipeline with the
goals of enhancing value and reducing the timeline to allow for vertical construction. This is in response to our expectation
of increased future demand for these projects and is reflected in our expectation for capitalized interest. Refer to
Capitalized interest” under “Definitions and reconciliations” in Item 2 for additional information.
The challenging macroeconomic environment, including the elevated supply of laboratory space, high costs or
unavailability of debt, and challenges in obtaining sufficient proceeds from real estate dispositions, as discussed above,
have, however, necessitated and may continue to necessitate a reevaluation of our current plans, and lead to a temporary
suspension of our construction projects, delay of future projects, or sale of non-income-producing property. This could
result in a decline in our capitalized interest for 2025 and beyond below our current projections and a further increase in
interest expense recognized in our consolidated statement of operations.
59
The table below presents gross interest expense, capitalized interest, and interest expense in 2023 and 2024 and
projections for 2025 based on the midpoint of our 2025 guidance ranges (in thousands):
Gross Interest Expense
Capitalized Interest
Interest Expense
2023
$438,182
$(363,978)
$74,204
2024
$516,799
$(330,961)
$185,838
Midpoint of 2025 guidance range
$545,000
$(335,000)
$210,000
In addition to capitalized interest, we incur capitalized projects costs, including property taxes, insurance, and other costs
directly related and essential to the construction of Class A/A+ properties. If we cease activities necessary to prepare a
project for its intended use, costs related to such project are expensed as incurred.
During the nine months ended September 30, 2025, our average real estate basis capitalized aggregated $8.2 billion. This
includes:
$2.8 billion related to development and redevelopment projects under construction and one 100% pre-leased
committed near-term project expected to commence construction in the next year;
$1.1 billion related to smaller redevelopments and repositioning capital projects; and
$4.2 billion related to future pipeline projects expected to reach key milestones in the fourth quarter of 2025 and 2026,
including various phases of entitlement, design, site work, and other activities necessary to begin aboveground
vertical construction, on April 14, 2026, on a weighted-average real estate investment basis. At that time, we may
evaluate whether to proceed with additional pre-construction and/or construction activities based on leasing demand
and/or market conditions, pause future investments, or consider the potential dispositions of real estate assets.
Volatility in non-real estate investments. We hold strategic investments in publicly traded companies and privately held
entities primarily involved in the life science industry. These investments are subject to market and sector-specific risks
that can substantially affect their valuation. Like many other industries, the life science industry is susceptible to
macroeconomic challenges, such as ongoing economic uncertainty and a tighter capital environment. These factors may
lead to increased volatility in the valuation of our non-real estate investments.
In such a challenging environment, distributions from our investments — which we may receive as dividends, as
liquidation distributions from our investments in limited partnerships, or as a result of mergers and acquisitions that lead to
our privately held investees being acquired by other entities — may be limited and could result in lower realized gains.
Moreover, we may face challenges in selling these securities at optimal prices, potentially disrupting our capital strategy.
There can be no assurance that we will be able to realize these gains or sustain our historical level of annual realized
gains in the future, and in periods with limited or no realized gains, our FFO per share, as adjusted, may be adversely
affected. 
For the nine months ended September 30, 2025, we recognized $94.7 million, or an average of approximately $32 million
per quarter, in realized gains on non-real estate investments. The midpoint of our revised guidance range for realized
gains on non-real estate investments assumes approximately $15 million in the fourth quarter of 2025.
The table below presents realized gains, impairments, and unrealized losses on our non-real estate investments (in
thousands):
Non-Real Estate Investments
Realized Gains(1)
Impairments
Unrealized Losses
2023
$80,628
$74,550
$201,475
2024
$117,214
$58,090
$112,246
Nine months ended September 30, 2025
$94,650
$75,535
$71,568
Midpoint of 2025 guidance range
$110,000
N/A
(1)Excludes impairment charges.
Gross unrealized gains related to non-real estate investments held as of September 30, 2025, December 31, 2024, and
December 31, 2023 aggregated to $180.4 million, $228.1 million, and $320.4 million, respectively.
Unfavorable market conditions could also indicate potential impairment of our investments in privately held entities that do
not report NAV per share and lead to the recognition of additional significant non-real estate impairments.
60
Government policy and regulatory disruption. Recent and ongoing policy actions by the U.S. government have introduced
significant volatility and uncertainty into the life science ecosystem, with direct implications for our tenants, non-real estate
investments, and overall business. Material developments include workforce reductions at the National Institutes of Health
and U.S. Food and Drug Administration, reimbursement cuts at the Centers for Medicare & Medicaid Services, and
funding freezes affecting research at certain U.S. research institutions. These changes have led to the suspension of
many research projects, delays in regulatory reviews and approvals of drugs and other medical products, and increased
barriers to clinical and regulatory progress, including for early-stage life science companies. Moreover, foreign markets,
especially China, are rapidly gaining ground as global biotechnology leaders due to their centralized funding and faster
regulatory timelines. The U.S. life science industry risks losing its competitive advantage as companies increasingly look
abroad to conduct research. Combined with new immigration restrictions that affect international research talent, these
policy actions threaten the long-term viability of the U.S. biomedical industry. The cumulative effect of these developments
may significantly reduce tenant demand for U.S. life science real estate. At the same time, trade tensions and widespread
tariffs may increase the cost of capital and key materials, which could delay or reduce our development pipeline. Refer to
“Item 1A. Risk factors” within “Part II – Other information” of this quarterly report on Form 10-Q for more information.
The realization of any of the aforementioned risks could have a material adverse impact on our revenues and operating
performance, including but not limited to our income from rentals, net operating income, results of operations, funds from operations,
operating margins, initial stabilized yields (unlevered) on new or existing construction projects, occupancy, EPS, FFO per share, FFO
per share, as adjusted, and net cash provided by operating activities. These impacts could decrease Adjusted EBITDA, adversely
impacting our key metrics such as our Adjusted EBITDA margin and Net Debt and Preferred Stock to Adjusted EBITDA ratio, as well
as our credit ratings and credit rating outlooks. To preserve liquidity and mitigate an increase to our Net Debt and Preferred Stock to
Adjusted EBITDA ratio that may be caused by potential declines in Adjusted EBITDA, we may seek additional capital through equity
offerings, pursue additional sales of real and non-real estate assets, which could be dilutive to existing stockholders. A reduction in
earnings and/or net cash provided by operating activities could potentially necessitate or make advisable a reduction in our dividends
per share, as determined by our board of directors. Any of the foregoing could further negatively affect our business and the market
value of our common stock. 
Mitigating factors:
Megacampus strategy: focusing on premier Class A/A+ assets in AAA life science innovation cluster locations.
Alexandria has established a high-quality Labspace® asset base predominantly concentrated in markets with high barriers
to entry. Despite a recent increase in the availability of laboratory space, we expect to continue to benefit from our focus
on Class A/A+ assets strategically clustered in Megacampus ecosystems in AAA life science innovation cluster locations
in close proximity to top academic and medical research institutions. This proximity is a key driver of tenant demand.
These campuses are used in two distinct ways: (i) to house the research operations of our tenants and (ii) to recruit and
retain the best talent available from a limited pool, which underscores why their scale, strategic design, and location are
critical.
Chief executive officers of life science companies typically anticipate rapid growth upon their companies’ achievement of
scientific milestones. Our Megacampus ecosystems, which offer both high visibility and a clear path for growth, are
designed for scalability to accommodate our tenants’ growth. Our future developments and redevelopments aggregate
26.4 million RSF as of September 30, 2025, of which 76% is concentrated within our Megacampus ecosystems. Their
strategic locations and path for growth serve as powerful incentives for tenants to lease space from us.
Moreover, our tenants recognize that their success is directly linked to their ability to attract and retain personnel to
advance their science. With our Megacampus ecosystems, we aim to provide a superior set of amenities, services, and
access to transit. With inspiring design and people-centric amenities, we believe these campuses enhance our tenants’
confidence in using these spaces as effective recruiting tools. In contrast, we believe that a significant amount of the
competitive supply in the market today consists of isolated facilities that provide operational space but lack the scale and
strategic design of our Megacampus ecosystems. 
Consequently, we believe an external growth strategy that focuses on the development of new Megacampus ecosystems,
and the enhancement of existing ones, serves as our most effective defense against competitive supply. Over the past
three decades, we have established a significant market presence in AAA innovation cluster locations, which is
challenging to replicate due to the significant time and capital requirement. We believe the focus on our Megacampus
strategy will continue to position us favorably over the supply of new competitive laboratory spaces. The strength of this
strategy is reflected in the 2025 performance metrics below, achieved despite a challenging macroeconomic environment:
61
Leasing volume aggregating 3.0 million RSF for the nine months ended September 30, 2025.
In July 2025, we executed the largest life science lease in company history with a long-standing multinational
pharmaceutical tenant for a 16-year build-to-suit lease expansion aggregating 466,598 RSF on the Campus
Point by Alexandria Megacampus in our University Town Center submarket.
Weighted-average lease term of 12.6 years for leases executed during the nine months ended September 30, 2025.
Projects expected to stabilize in 2025 and 2026 are 80% leased/negotiating.
Rental rate increases of 13.6% and 6.8% (cash basis) for the nine months ended September 30, 2025.
Occupancy of 90.6% as of September 30, 2025.
Strength of our brand. As a recognized leader in the life science and real estate sectors, Alexandria has successfully
built a diverse and high-quality tenant base. Over the past three decades, we have fostered long-standing relationships
and strategic partnerships with our tenants, which have enabled us to maintain strong occupancy, leasing, and growth in
net operating income and cash flows and to effectively navigate through various economic cycles. Key indicators of our
brand strength include the following:
As of September 30, 2025, 82% of our leasing activity during the last twelve months was generated from our existing
tenant base.
As of September 30, 2025, 90% of our top 20 tenant annual rental revenue is derived from investment-grade or
publicly traded large cap companies.
Our tenant collections have remained consistently high, averaging 99.8% since the beginning of 2021 through
September 30, 2025.
Prudent financial management. Our strong and flexible balance sheet and prudent balance sheet management are key
factors in our ability to navigate macroeconomic uncertainties and capitalize on new opportunities. The strength of our
financial position is highlighted by several key indicators:
Our significant liquidity of $4.2 billion as of September 30, 2025 provides us the flexibility to address our operational
needs and to pursue strategic opportunities.
We expect to have the ability to self-fund a large portion of our capital requirements through the following sources in
2025:
$475 million in net cash provided by operating activities after dividends at the midpoint of our 2025 guidance
range.
$166.9 million in capital contributions to fund construction expected from our existing consolidated real estate
joint venture partners from October 1, 2025 through December 31, 2027 and beyond.
$1.50 billion from dispositions and sales of partial interests in real estate assets at the midpoint of our 2025
guidance range.
As of September 30, 2025, our credit ratings from S&P Global Ratings and Moody’s Ratings were BBB+ and Baa1,
respectively, which rank in the top 15% among all publicly traded U.S. REITs.
Our net debt and preferred stock to Adjusted EBITDA ratio target is 5.5x to 6.0x for the fourth quarter of 2025
annualized.
As of September 30, 2025, our fixed-rate debt represents 88.6% of our total debt, which provides predictability in debt
servicing costs. Since 2021, our quarter-end fixed-rate debt has averaged 96.7%.
Our debt maturity schedule is well laddered, which provides us with financial flexibility and reduces short-term
refinancing risks. As of September 30, 2025, only 7% of our debt matures through 2027.
As of September 30, 2025, the weighted-average remaining term of our debt is 11.6 years, longest among S&P 500
REITs, demonstrating our strategic approach to debt management and our focus on maintaining manageable annual
debt maturities.
Operational excellence of our team. Alexandria focuses on operational excellence in the direct asset management and
operations of our Labspace® asset base. Our team is composed of highly experienced, educated, and professionally
credentialed facilities specialists. This expertise is essential in ensuring a secure and efficient environment for
groundbreaking scientific research and has been cultivated and maintained over many years.
The demanding nature of laboratory-based scientific research requires strict adherence to safety standards set by local,
state, and federal regulatory bodies. Key compliance aspects include good manufacturing practices (GMP) and Clinical
Laboratory Improvement Amendments (CLIA) certifications, adherence to national biosafety level guidelines, proper
permitting and handling of hazardous waste generation and chemical storage, maintenance of safety stations, effective
management of ultra-low temperature freezers, and careful licensing and management of radioactive materials.
62
Life science fundamentals. We monitor market demand trends, particularly in the life science industry, to optimally align
our property offerings with tenant requirements. The life science industry has shown strong long-term growth, fueled by
multifaceted sources of funding, including private venture capital, biopharmaceutical spend, government funding, and
philanthropic support for biomedical innovation. We believe our focus on high-quality Labspace® assets in prime locations
positions us to effectively capitalize on these long-term trends:
The R&D expenditures by U.S. publicly traded life science companies nearly doubled in 2023 compared to 2014. As
of December 31, 2024, 17 of the top 20 pharma R&D spenders (for the year 2023) are Alexandria tenants.
The sector’s growth is further supported by substantial funding of life science companies by private-venture capital,
which aggregated over $40 billion in 2024, or over 2.5x the capital deployed in 2014.
Other mitigating factors
Improvement in office market. The increase in demand for premium office space since 2024, primarily driven by the
technology sector, particularly companies focused on artificial intelligence, absorbed some of the market’s supply
previously anticipated for life science use, which is now being repositioned back into offices. High ceilings, improved
ventilation systems, and abundant natural light have become highly desirable features, appealing to office and
advanced technologies tenants. We expect this trend may lead to the exit from the life science sector of
inexperienced life science real estate developers and expedite the resolution of the oversupply impacting the sector.
Projected decrease in general and administrative expenses. Over the past several years, we have implemented
comprehensive measures to reduce our expenditures across our organization, including our general and
administrative expenses, which provided savings during the year ended December 31, 2024, compared to the year
ended December 31, 2023. These initiatives are expected to generate a reduction in general and administrative
expenses of approximately $49 million, or 29%, during the year ending December 31, 2025 (at the midpoint of our
2025 guidance range) compared to the year ended December 31, 2024. These savings are expected to stem from a
variety of implemented cost-control and efficiency initiatives, including, but not limited to, the following:
(i)Personnel-related matters, including:
Reduction in headcount over the last two years.
Restructuring of various compensation plans.
(ii)Streamlining of business processes:
Implementation of systems upgrades, process improvements, and smarter technology.
Renegotiation of contracts related to legal, technology, and operational support services, and
elimination of redundancies through better alignment and consolidation of roles.
We anticipate that approximately half of the cost reductions expected to be achieved in 2025 will continue in 2026.
63
Operating summary
Same Property Performance:
  Net Operating Income Changes
Rental Rate Growth:
Renewed/Re-Leased Space
Margins(2)
Favorable Lease Structure(3)
Operating
Adjusted EBITDA
Strategic Lease Structure by Owner and
Operator of Collaborative Megacampus Ecosystems
68%
71%
Increasing cash flows
Percentage of leases containing annual
rent escalations
97%
Stable cash flows
Long-Duration Lease Terms(4)
Percentage of triple net leases
91%
9.4 Years
7.5 Years
Lower capex burden
Percentage of leases providing for the
recapture of capital expenditures
92%
Top 20 Tenants
All Tenants
Net Debt and Preferred Stock
to Adjusted EBITDA(5)
Fixed-Charge Coverage Ratio(5)
25
13
37
1
(3.1)%
2024
YTD
9/30/25
(1)
49
5.5x to 6.0x
61
3.6x to 4.1x
Refer to “Same properties” and “Definitions and reconciliations” in Item 2 for additional details. “Definitions and reconciliations” contains the definitions of “Fixed-charge
coverage ratio,” “Net debt and preferred stock to Adjusted EBITDA,” and “Net operating income” and their respective reconciliations from the most directly comparable
financial measures presented in accordance with GAAP.
(1)Refer to footnote 1 in “Same properties” in Item 2 for additional details. 
(2)For the three months ended September 30, 2025.
(3)Percentages calculated based on our annual rental revenue in effect as of September 30, 2025.
(4)Represents the weighted-average remaining term based on annual rental revenue in effect as of September 30, 2025.
(5)Quarter annualized.
64
Stable Cash Flows From Our High-Quality and Diverse Mix of
Approximately 700 Tenants
Investment-Grade or Publicly Traded
Large Cap Tenants
90%
of ARE’s Top 20 Tenant
Annual Rental Revenue
53%
of ARE’s Total Annual
Rental Revenue
25
Life Science
Product,
Service, and
Device
Multinational
Pharmaceutical
Public
Biotechnology
– Approved or
Marketed
Product
Other(1)
Advanced
Technologies(2)
Public
Biotechnology –
Preclinical or
Clinical Stage
Government
Institutions
Biomedical
Institutions(3)
Private
Biotechnology
Percentage of ARE’s
Annual Rental Revenue
As of September 30, 2025. Annual rental revenue represents amounts in effect as of September 30, 2025. Refer to “Definitions and reconciliations” in Item 2 for additional
information.
(1)Represents the percentage of our annual rental revenue generated by professional services, finance, telecommunications, construction/real estate companies, and
retail-related tenants.
(2)68% of our annual rental revenue from advanced technologies tenants is from investment-grade or publicly traded large cap tenants.
(3)80% of our annual rental revenue from biomedical institutions is from investment-grade or publicly traded large cap tenants.
65
Leasing Activity
The following table summarizes our leasing activity at our properties:
Three Months Ended
Nine Months Ended
Year Ended
September 30, 2025
September 30, 2025
December 31, 2024
(Dollars per RSF)
Including
Straight-Line Rent
Cash Basis
Including
Straight-Line Rent
Cash Basis
Including
Straight-Line Rent
Cash Basis
Leasing activity:
Renewed/re-leased space(1)


Rental rate changes
15.2%
6.1%
13.6%
6.8%
16.9%
7.2%
New rates
$56.91
$57.07
$59.45
$59.17
$65.48
$64.18
Expiring rates
$49.42
$53.77
$52.34
$55.41
$56.01
$59.85
RSF
354,367
1,722,184
3,888,139
Tenant improvements/leasing
commissions
$47.15
$66.29
$46.89
Weighted-average lease term
7.3 years
9.5 years
8.5 years
Previously vacant/developed/
redeveloped space leased(2)
New rates
$85.31
$76.33
$74.93
$69.16
$59.44
$57.34
Previously vacant RSF
256,633
550,986
672,474
Developed/redeveloped RSF
560,344
(3)
698,542
493,341
Weighted-average lease term
15.4 years
14.7 years
10.0 years
Leasing activity summary
(totals):
New rates
$76.72
$70.51
$65.96
$63.37
$64.16
$62.68
RSF
1,171,344
2,971,712
5,053,954
Weighted-average lease term
14.6 years
12.6 years
8.9 years
Lease expirations(1)
Expiring rates
$66.03
$67.63
$56.68
$57.98
$53.82
$57.24
RSF
800,421
(4)
3,549,052
5,005,638
Leasing activity includes 100% of results for properties in North America in which we have an investment.
(1)Excludes month-to-month leases aggregating 85,652 RSF and 136,131 RSF as of September 30, 2025 and December 31, 2024, respectively. During the trailing twelve
months ended September 30, 2025, we granted free rent concessions averaging 1.2 months per annum.
(2)Refer to “New Class A/A+ development and redevelopment properties: summary of pipeline” in Item 2 for additional information, including total project costs.
(3)Includes the largest life science lease in company history, executed in July 2025 with a long-standing multinational pharmaceutical tenant. The 16-year expansion build-to-
suit lease aggregates 466,598 RSF on the Campus Point by Alexandria Megacampus in our University Town Center submarket. Refer to “New Class A/A+ development
and redevelopment properties: current projects” in Item 2 for additional details.
(4)Includes 75,735 of vacant RSF at one recently acquired asset in our Greater Stanford submarket for which we are evaluating options to reposition for advanced
technologies use.
66
Summary of contractual lease expirations
The following table summarizes the contractual lease expirations at our properties as of September 30, 2025:
Year
RSF
Percentage of
Occupied RSF
Annual Rental Revenue
(per RSF)(1)
Percentage of
Annual Rental Revenue
2025
(2)
434,371
1.3%
$50.71
1.1%
2026
3,084,651
9.1%
$54.43
8.5%
2027
3,177,025
9.4%
$55.06
8.9%
2028
3,954,063
11.7%
$50.63
10.1%
2029
2,115,070
6.3%
$47.02
5.0%
2030
2,999,453
8.9%
$43.32
6.6%
2031
3,654,099
10.8%
$55.36
10.2%
2032
968,848
2.9%
$58.14
2.9%
2033
2,382,921
7.1%
$49.05
5.9%
2034
3,031,460
9.0%
$67.16
10.3%
Thereafter
7,915,520
23.5%
$76.06
30.5%
Contractual lease expirations for properties classified as held for sale as of September 30, 2025 are excluded from the information on this page.
(1)Represents amounts in effect as of September 30, 2025.
(2)Excludes month-to-month leases aggregating 85,652 RSF as of September 30, 2025.
67
The following tables present our lease expirations by market for the remainder of 2025 and for 2026 as of September 30,
2025:
2025 Contractual Lease Expirations (in RSF)
Market
Leased
Negotiating/
Anticipating
Targeted for Future
Development/
Redevelopment
Remaining
Expiring Leases
Total(1)
Annual Rental
Revenue
(per RSF)(2)
Greater Boston
21,892
12,113
34,005
$57.84
San Francisco Bay Area
55,766
55,766
64.75
San Diego
23,327
1,579
48,794
73,700
62.02
Seattle
50,552
23,756
74,308
22.80
Maryland
1,136
18,338
19,474
33.48
Research Triangle
10,478
3,951
4,843
19,272
N/A
New York City
11,798
7,825
19,623
105.22
Texas
Canada
40,679
40,679
10.72
Non-cluster/other markets
Subtotal
107,385
17,328
212,114
336,827
44.52
Key lease expirations(3)
97,544
97,544
72.08
Total
107,385
17,328
309,658
434,371
$50.71
Percentage of expiring leases
25%
4%
0%
71%
100%
2026 Contractual Lease Expirations (in RSF)
Market
Leased
Negotiating/
Anticipating
Targeted for Future
Development/
Redevelopment
Remaining
Expiring Leases
Total
Annual Rental
Revenue
(per RSF)(2)
Greater Boston
119,978
11,897
229,566
361,441
$57.14
San Francisco Bay Area
28,609
103,596
282,976
415,181
69.31
San Diego
52,620
(4)
275,029
327,649
53.34
Seattle
34,719
137,715
172,434
24.17
Maryland
6,823
151,847
158,670
21.38
Research Triangle
22,660
165,542
188,202
41.69
New York City
12,168
62,241
74,409
72.35
Texas
Canada
247,743
1,755
249,498
21.72
Non-cluster/other markets
31,659
31,659
64.43
Subtotal
465,877
122,316
52,620
1,338,330
1,979,143
48.10
Key lease expirations(3)
1,105,508
1,105,508
65.74
Total
465,877
122,316
52,620
2,443,838
3,084,651
$54.43
Percentage of expiring leases
15%
4%
2%
79%
100%
Contractual lease expirations for properties classified as held for sale as of September 30, 2025 are excluded from the information on this page.
(1)Excludes month-to-month leases aggregating 85,652 RSF as of September 30, 2025.
(2)Represents amounts in effect as of September 30, 2025.
(3)Includes lease expirations at 20 properties primarily located in the Greater Boston, San Francisco Bay Area, and San Diego markets aggregating 1.2 million RSF with a
weighted-average lease expiration date of March 19, 2026 and annual rental revenue aggregating $81 million, which are expected to become vacant at lease expiration
and re-leased to new tenants, including the following:
(i)Recently acquired properties comprising two properties aggregating 137,970 RSF in our Greater Stanford submarket for which we are evaluating options to
reposition for advanced technologies use;
(ii)Two properties comprising 163,648 RSF in our University Town Center submarket and 118,225 RSF in our Torrey Pines submarket for which we are evaluating
options to re-lease or reposition from single tenancy to multi-tenancy;
(iii)One property aggregating 83,354 RSF in our Sorrento Mesa submarket, where the in-place credit tenant will relocate and expand into our development project at
10075 Barnes Canyon Road, which is expected to be delivered during the second half of 2026; and
(iv)113,097 RSF at our Alexandria Center® at One Kendall Square Megacampus in our Cambridge submarket. We plan to upgrade most of these spaces, most of
which have not undergone major improvements since our acquisition in 2016.
We continue to evaluate the business plans and re-leasing strategies for these projects to maximize occupancy and rental revenue. We expect downtime on the 1.2
million RSF to range from 6 to 24 months on a weighted-average basis, and we expect these properties to remain operating properties.
(4)Relates to a single-tenant, 100% pre-leased development project aggregating 466,598 RSF that expands the existing Campus Point by Alexandria Megacampus. At the
beginning of 2026, the tenant will vacate 52,620 RSF, which generated annual rental revenue of $4.1 million as of September 30, 2025,  from an existing building to
allow for the demolition and development of the new, build-to-suit life science building at this site. Refer to “New Class A/A+ development and redevelopment properties:
current projects” in Item 2 for additional details.
68
Top 20 tenants
90% of Top 20 Tenant Annual Rental Revenue Is From Investment-Grade
or Publicly Traded Large Cap Tenants(1)
Our properties are leased to a high-quality and diverse group of tenants, with no individual tenant accounting for greater than
5.5% of our annual rental revenue in effect as of September 30, 2025. The following table sets forth information regarding leases with our
20 largest tenants in North America based upon annual rental revenue in effect as of September 30, 2025 (dollars in thousands, except
average market cap amounts):
Remaining
Lease
Term(1)
(in Years)
Aggregate
RSF
Annual
Rental
Revenue(1)
Percentage
of Annual
Rental
Revenue(1)
Investment-Grade
Credit Ratings
Average
Market
Cap
(in billions)
Tenant
Moody’s
S&P
1
Bristol-Myers Squibb Company
5.7
1,283,860
$
110,865
5.5%
A2
A
$106.5
2
Eli Lilly and Company
9.1
1,086,165
90,805
4.5
Aa3
A+
$753.2
3
Moderna, Inc.
13.2
462,100
71,571
3.5
$13.3
4
Takeda Pharmaceutical Company Limited
9.7
549,759
47,899
2.4
Baa1
BBB+
$45.6
5
AstraZeneca PLC
6.4
440,087
39,413
1.9
A1
A+
$223.0
6
Eikon Therapeutics, Inc.(2)
13.3
311,806
38,913
1.9
$
7
Roche
7.5
647,069
36,383
1.8
Aa2
AA
$256.8
8
Illumina, Inc.
5.1
857,967
35,924
1.8
Baa3
BBB
$17.1
9
Alphabet Inc.
2.2
589,218
33,260
1.6
Aa2
AA+
$2,231.6
10
United States Government
4.8
429,359
29,597
(3)
1.5
Aaa
AA+
$
11
Novartis AG
2.3
377,095
29,463
1.5
Aa3
AA-
$240.2
12
Uber Technologies, Inc.
57.0
(4)
1,009,188
27,820
1.4
Baa1
BBB
$167.1
13
Boston Children's Hospital
11.5
309,231
26,294
1.3
Aa2
AA
$
14
The Regents of the University of California
9.7
364,606
24,318
1.2
Aa2
AA
$
15
Sanofi
5.3
267,278
21,851
1.1
Aa3
AA
$127.1
16
New York University
6.8
218,983
21,110
1.0
Aa2
AA-
$
17
Merck & Co., Inc.
7.9
333,124
21,001
1.0
Aa3
A+
$225.8
18
Charles River Laboratories, Inc.
9.8
253,036
20,959
1.0
$8.2
19
Cloud Software Group, Inc.
1.0
(5)
216,278
20,553
1.0
$
20
Massachusetts Institute of Technology
4.3
242,428
20,529
1.0
Aaa
AAA
$
Total/weighted-average
9.4
(4)
10,248,637
$
768,528
37.9%
Annual rental revenue and RSF include 100% of each property managed by us in North America. Refer to “Annual rental revenue” and “Investment-grade or publicly traded large
cap tenants” under “Definitions and reconciliations” in Item 2 for additional details, including our methodologies of calculating annual rental revenue from unconsolidated real
estate joint ventures and average market capitalization, respectively.
(1)Based on total annual rental revenue in effect as of September 30, 2025.
(2)Eikon Therapeutics, Inc. is a private biotechnology company led by renowned biopharmaceutical executive Roger Perlmutter, formerly an executive vice president at Merck
& Co., Inc. As of February 25, 2025, the company has raised over $1.2 billion in private venture capital funding.
(3)Includes leases, which are not subject to annual appropriations, with governmental entities such as the National Institutes of Health and the General Services
Administration. Approximately 3% of the annual rental revenue derived from our leases with the United States Government is cancellable prior to the lease expiration date.
(4)Includes (i) ground leases for land at 1455 and 1515 Third Street (two buildings aggregating 422,980 RSF) and (ii) leases at 1655 and 1725 Third Street (two buildings
aggregating 586,208 RSF) in our Mission Bay submarket owned by our unconsolidated real estate joint venture in which we have an ownership interest of 10%. Annual
rental revenue is presented using 100% of the annual rental revenue from our consolidated properties and our share of annual rental revenue from our unconsolidated real
estate joint ventures. Excluding these ground leases, the weighted-average remaining lease term for our top 20 tenants was 7.7 years as of September 30, 2025.
(5)Represents one lease encompassing four properties acquired in 2022 that we expect to reposition upon lease expiration. This lease with Cloud Software Group, Inc.
(formerly known as TIBCO Software, Inc.) was in place when we acquired the properties, of which 137,970 RSF has lease expirations through 2026. Refer to footnote 1 in
“Summary of contractual lease expirations” in Item 2 for additional details.
69
Locations of properties
Our properties are strategically located in AAA life science innovation cluster markets. The following table sets forth the total
RSF, number of properties, and annual rental revenue in effect as of September 30, 2025 in each of our markets in North America
(dollars in thousands, except per RSF amounts):
RSF
Number of
Properties
Annual Rental Revenue
Market
Operating
Development
Redevelopment
Total
% of Total
Total
% of Total
Per RSF
Greater Boston
9,096,225
583,407
1,626,322
11,305,954
26%
64
$708,464
35%
$89.74
San Francisco Bay Area
7,525,945
212,796
344,934
8,083,675
19
62
421,518
21
67.18
San Diego
6,314,303
648,516
6,962,819
16
68
328,638
15
54.67
Seattle
3,178,029
227,577
3,405,606
8
45
126,834
6
44.29
Maryland
3,855,906
3,855,906
9
50
157,213
8
44.00
Research Triangle
3,648,703
3,648,703
9
36
94,255
5
27.22
New York City
742,700
742,700
2
3
69,317
3
94.97
Texas
1,646,187
73,298
1,719,485
4
13
36,866
2
28.02
Canada
979,575
56,314
1,035,889
2
11
20,186
1
22.83
Non-cluster/other markets
315,440
315,440
1
9
12,195
1
55.52
Properties held for sale
1,811,787
1,811,787
4
14
53,266
3
44.62
North America
39,114,800
1,672,296
2,100,868
42,887,964
100%
375
$2,028,752
100%
$58.94
3,773,164
Summary of occupancy percentages in North America
The following table sets forth the occupancy percentages for our operating properties and our operating and redevelopment
properties in each of our North America markets, excluding properties held for sale, as of the following dates:
 
Operating Properties
Operating and Redevelopment Properties
Market
9/30/25
6/30/25
9/30/24
9/30/25
6/30/25
9/30/24
Greater Boston
86.8%
(1)(2)
90.1%
94.6%
73.6%
76.7%
80.9%
San Francisco Bay Area
90.4
(1)(3)
88.9
94.1
86.4
85.2
91.1
San Diego
95.2
94.8
96.0
95.2
94.8
96.0
Seattle
90.1
90.3
92.3
90.1
90.3
91.3
Maryland
93.9
93.9
96.2
93.9
93.9
96.2
Research Triangle
94.9
(1)
92.8
97.5
94.9
92.8
97.5
New York City
98.3
88.9
85.1
98.3
88.9
85.1
Texas
79.9
(1)
82.1
95.5
76.5
78.9
91.8
Subtotal
90.8
91.0
94.9
85.9
86.3
90.0
Canada
90.3
90.7
95.5
85.4
85.8
82.6
Non-cluster/other markets
69.6
72.6
72.8
69.6
72.6
72.8
North America
90.6%
(1)(4)
90.8%
94.7%
85.8%
86.2%
89.7%
(1)Refer to the table below for a summary of our previously disclosed key lease expirations that became vacant during the three months ended March 31, 2025:
Property
Submarket
Vacant RSF
as of 3Q25
Vacant RSF
leased as of 3Q25
with future delivery
%
Included in 3Q25 occupancy and same property results:
Alexandria Technology Square® Megacampus
Cambridge
182,054
89,222
49%
507 East Howard Lane and 13813 Center Lake Drive
Austin
247,246
102,930
42
429,300
192,152
45%
Classified as held for sale as of 3Q25 (excluded from occupancy and same property results):
409 Illinois Street
Mission Bay
234,249
N/A
7 Triangle Drive
Research Triangle
104,531
N/A
Total 1Q25 key lease expirations vacant at 3Q25
768,080
(2)The decline in occupancy during the three months ended September 30, 2025, was primarily due to one lease expiration of 78,380 RSF in Cambridge which we are
marketing and a 72,846 RSF lease expiration located in Watertown which has been leased but was not occupied as of September 30, 2025.
(3)Increase in occupancy from the second quarter of 2025 is primarily due to the classification as held for sale of 409 and 499 Illinois Street on the Alexandria Center® for
Science and Technology – Mission Bay Megacampus as of September 30, 2025, partially offset by the new vacancy at 3301 Hillview Avenue in our Greater Stanford
submarket, which was previously occupied by an acquired software tenant, for which we are evaluating options to reposition as an advanced technologies campus.
(4)Includes temporary vacancies as of September 30, 2025 aggregating 617,458 RSF, or 1.6% of total operating RSF, primarily in the Greater Boston, San Francisco Bay
Area, San Diego, and Seattle markets, which are leased and expected to be occupied upon completion of building and/or tenant improvements. The weighted-average
expected delivery date is approximately May 1, 2026, and the expected annual rental revenue is approximately $46 million.
70
Investments in real estate
A key component of our business model is our disciplined allocation of capital to the development and redevelopment of new
Class A/A+ properties, and property enhancements identified during the underwriting of certain acquired properties, primarily located in
collaborative Megacampus ecosystems in AAA life science innovation clusters. These projects are focused on providing high-quality,
generic, and reusable spaces that meet the real estate requirements of a wide range of tenants. Upon completion, each development or
redevelopment project is expected to generate increases in rental income, net operating income, and cash flows. Our development and
redevelopment projects are generally in locations that are highly desirable to high-quality entities, which we believe may result in higher
occupancy levels, longer lease terms, higher rental income, higher returns, and greater long-term asset value. Our pre-construction
activities are undertaken in order to prepare the property for its intended use and include entitlements, permitting, design, site work, and
other activities preceding commencement of construction of aboveground building improvements.
Our investments in real estate consisted of the following as of September 30, 2025 (dollars in thousands):
Development and Redevelopment
Under Construction
100%
Pre-leased
Committed
Near Term(1)
Operating
2025 and
2026
2027 and
Beyond
Future
Subtotal
Total
Square footage
Operating
37,303,013
37,303,013
Future Class A/A+ development and
redevelopment properties
969,524
2,803,640
466,598
24,257,782
28,497,544
28,497,544
Future development and redevelopment square
feet currently included in rental properties(2)
(52,620)
(2,082,454)
(2,135,074)
(2,135,074)
Total square footage, excluding properties held for
sale
37,303,013
969,524
2,803,640
413,978
22,175,328
26,362,470
63,665,483
Properties held for sale
1,811,787
939,756
939,756
2,751,543
Total square footage
39,114,800
969,524
2,803,640
413,978
23,115,084
27,302,226
66,417,026
Investments in real estate
Gross book value as of September 30, 2025(3)
$29,451,717
$901,674
$2,762,729
$60,398
$4,984,144
$8,708,945
(4)
$38,160,662
Properties held for sale
883,455
112,681
112,681
996,136
Total gross investment in real estate, excluding
properties held for sale
$28,568,262
$901,674
$2,762,729
$60,398
$4,871,463
$8,596,264
$37,164,526
4398046511348
20%
Non-Income-
Producing Assets
Projects under active construction with
stabilization in 2025-2027 and beyond
and one 100% pre-leased committed
near-term project expected to commence
in the next year– $3.7 billion
Future development projects(5) and land parcels,
primarily located in Megacampuses with critical
milestones in 4Q25 and 2026 – $4.9 billion
Non-Income-Producing Assets as a Percentage of Gross Assets
(1)Represents a single-tenant project that expands the existing Campus Point by Alexandria Megacampus, where we currently have a 55% interest. Refer to “New Class A/
A+ development and redevelopment properties: current projects” in Item 2 for additional details.
(2)Refer to “Investments in real estate” under “Definitions and reconciliations” in Item 2 for additional details, including future development and redevelopment square feet
currently included in rental properties.
(3)Balances exclude accumulated depreciation and our share of the cost basis associated with our properties held by our unconsolidated real estate joint ventures, which is
classified as investments in unconsolidated real estate joint ventures in our consolidated balance sheet.
(4)Our share of investment in our development and redevelopment pipeline is $7.6 billion.
(5)As of September 30, 2025, annual rental revenue from future development parcels with existing income was approximately 1% of total annual rental revenue.
71
Dispositions and sales of partial interests
Our completed dispositions and sales of partial interests of real estate assets during the nine months ended September 30, 2025 and pending dispositions as of the date of this
report consisted of the following (dollars in thousands):
Interest
Sold/
Acquired
Square Footage
Gain on Sales
of Real Estate
Property
Submarket/Market
Date of
Transaction
Operating
Future
Development
Price
Dispositions
Completed during the nine months ended September 30, 2025:
Properties with vacancy and near-term lease expirations:
2425 Garcia Avenue and 2400/2450 Bayshore Parkway
Greater Stanford/San Francisco Bay Area
6/30/25
100%
95,901
$11,000
$
5505 Morehouse Drive
Sorrento Mesa/San Diego
8/26/25
100%
79,945
45,000
Other
23,334
12,737
79,334
12,737
Land:
Costa Verde by Alexandria
University Town Center/San Diego
1/31/25
100%
537,000
124,000
(1)
Land parcel
Texas
5/7/25
100%
1,350,000
73,287
Land parcel
Other
9/12/25
100%
374,349
30,250
Other land parcels
34,000
504
261,537
504
Total completed during the nine months ended September 30, 2025
340,871
13,241
(2)
Completed in October 2025:
550 Arsenal Street(3)
Cambridge/Inner Suburbs/Greater Boston
10/15/25
100%
249,275
281,592
99,250
Other
Various
68,129
4,362
Total dispositions as of October 27, 2025
508,250
$17,603
Our share of pending dispositions subject to non-refundable deposits, signed letters of intent, and/or purchase and
sale agreement negotiations
1,032,495
Completed and pending YTD 2025 dispositions, excluding exchange of partial interests (see below)
$1,540,745
2025 guidance range for dispositions and sales of partial interests
$1,100,000 – $1,900,000
2025 guidance midpoint for dispositions and sales of partial interests
$1,500,000
Exchange of partial interests(4)
Disposition of Pacific Technology Park
Sorrento Mesa/San Diego
9/9/25
50%
544,352
$96,000
$9,290
Acquisition of 199 East Blaine Street
Lake Union/Seattle
9/9/25
70%
115,084
(94,430)
Difference in sales price received in cash
$1,570
(1)As part of a completed transaction, we provided seller financing of $91.0 million. This note receivable is classified within “Other assets” in our consolidated balance sheet. Refer to Note 8 – “Other assets” to our unaudited consolidated
financial statements for additional information.
(2)Excludes a gain on sale of interest related to an unconsolidated real estate joint venture of $458 thousand, which is classified as equity in earnings of unconsolidated real estate joint ventures in our consolidated statement of operations.
(3)Represents a retail shopping center with future development opportunity. We originally acquired the property in 2021 with the intent to demolish the retail center and develop it into laboratory space. However, due to the project’s financial
outlook and the substantial capital that development would have required, we decided to recycle the capital generated by the disposition into our development and redevelopment pipeline. The capitalization rates of the disposition were
6.1% and 5.4% (cash basis) based upon net operating income and net operating income (cash basis), respectively, for the three months ended September 30, 2025 annualized.
(4)In September 2025, we completed an exchange of partial interests in two consolidated joint ventures, Pacific Technology Park and 199 East Blaine Street, with one joint venture partner, resulting in a sales price received by cash of $1.6
million. Refer to Note 4 – “Consolidated and unconsolidated real estate joint ventures” to our unaudited consolidated financial statements for additional information.
We sold our 50% controlling interest in Pacific Technology Park, a non-Megacampus comprising five non-laboratory properties that were 93% occupied, at capitalization rates of 4.9% and 5.0% (cash basis). The disposition had
consolidated annual net operating income of $9.4 million based on three months ended June 30, 2025 annualized (at 100%). As of September 30, 2025, we no longer have any ownership interest in Pacific Technology Park, and the
consolidated net operating income is no longer included in our statement of operations following the sale.
We acquired our partner’s 70% noncontrolling interest at 199 East Blaine Street, a fully occupied laboratory building located in our Alexandria Center® for Life Science – Eastlake Megacampus, with a weighted-average remaining lease
term of 1.3 years. The purchase price exceeded the book value of the noncontrolling interest by $66.3 million, which was recognized in additional paid-in capital. As of September 30, 2025, we own 100% of 199 East Blaine Street.
72
New Class A/A+ development and redevelopment properties
pipelinepagev2.jpg
ALEXANDRIA’S DEVELOPMENT AND REDEVELOPMENT
DELIVERIES ARE EXPECTED TO PROVIDE INCREMENTAL
GROWTH IN ANNUAL NET OPERATING INCOME
Placed Into Service
Near-Term Deliveries
YTD 3Q25
4Q254Q26
$68M
$111M
94%
Occupied
80%
Leased/Negotiating
712,785 RSF
969,524 RSF
(1)
(2)
(3)
(4)
For the definition of “Net operating income” and a reconciliation from the most directly comparable GAAP measure, refer to the “Definitions and reconciliations in Item 2.
(1)Excludes future incremental annual net operating income from recently delivered spaces aggregating 42,449 RSF that were vacant and/or unleased at delivery.
(2)Includes expected partial deliveries through the fourth quarter of 2026 from projects expected to stabilize in 2027 and beyond, including speculative future leasing that is not yet fully committed. Our share of incremental annual net
operating income from development and redevelopment projects expected to be placed into service primarily commencing from the fourth quarter of 2025 through the fourth quarter of 2026 is projected to be $83 million. Refer to
the initial and stabilized occupancy years under “New Class A/A+ development and redevelopment properties: current projects” in Item 2 for additional details.
(3)Represents the current leased/negotiating percentage of development and redevelopment projects that are expected to stabilize during the fourth quarter of 2025 through the end of 2026.
(4)Represents the RSF related to projects expected to stabilize by the fourth quarter of 2026. Does not include RSF for partial deliveries through the fourth quarter of 2026 from projects expected to stabilize in 2027 and beyond.
73
New Class A/A+ development and redevelopment properties: recent deliveries
99 Coolidge Avenue
500 North Beacon Street and
4 Kingsbury Avenue(1)
Greater Boston/
Cambridge/Inner Suburbs
Greater Boston/
Cambridge/Inner Suburbs
129,413 RSF
248,018 RSF
100% Occupancy
92% Occupancy
99Coolidge.jpg
arsenalphaseii v2.jpg
230 Harriet Tubman Way
10935, 10945, and 10955
Alexandria Way(2)
10075 Barnes Canyon Road
San Francisco Bay Area/
South San Francisco
San Diego/Torrey Pines
San Diego/Sorrento Mesa
285,346 RSF
334,996 RSF
31,490 RSF
100% Occupancy
100% Occupancy
100% Occupancy
harriettubmanv2.jpg
alexandriawayOASv2.jpg
barnescanyon10075 v2.jpg
(1)Image represents 500 North Beacon Street on The Arsenal on the Charles Megacampus.
(2)Image represents 10955 Alexandria Way on the One Alexandria Square Megacampus.
74
New Class A/A+ development and redevelopment properties: recent deliveries (continued)
Incremental Annual Net Operating Income Generated From YTD 3Q25 Deliveries
Aggregated $68 Million,(1) Including $16 Million in 3Q25
The following table presents development and redevelopment of new Class A/A+ projects placed into service during the nine months ended September 30, 2025 (dollars in
thousands):
Property/Market/Submarket
3Q25
Delivery
Date(2)
Our
Ownership
Interest
RSF Placed in Service
Occupancy
Percentage(3)
Total Project
Unlevered Yields
Prior to
1/1/25
1Q25
2Q25
3Q25
Total
Initial
Stabilized
Initial
Stabilized
(Cash Basis)
RSF
Investment
Development projects
99 Coolidge Avenue/Greater Boston/Cambridge/
Inner Suburbs
7/15/25
100%
116,414
12,999
129,413
100%
320,809
$444,000
6.0%
6.8%
500 North Beacon Street and 4 Kingsbury
Avenue/Greater Boston/Cambridge/Inner
Suburbs
8/23/25
100%
211,574
36,444
248,018
92%
248,018
429,000
6.5
5.9
230 Harriet Tubman Way/San Francisco Bay
Area/South San Francisco
N/A
48.5%
285,346
285,346
100%
285,346
476,000
7.5
6.2
10935, 10945, and 10955 Alexandria Way/San
Diego/Torrey Pines
7/1/25
100%
93,492
119,202
122,302
334,996
100%
334,996
480,000
7.2
6.9
10075 Barnes Canyon Road/San Diego/Sorrento
Mesa
7/23/25
50.0%
17,718
13,772
31,490
100%
253,079
321,000
5.5
5.7
Redevelopment projects
651 Gateway Boulevard/San Francisco Bay
Area/South San Francisco
N/A
50.0%
67,017
22,005
89,022
75%
326,706
487,000
5.0
5.1
Canada
N/A
100%
78,487
6,430
76,567
161,484
100%
250,790
115,000
6.0
6.0
Weighted average/total
7/5/25
566,984
309,494
217,774
185,517
1,279,769
2,019,744
$2,752,000
6.3%
6.1%
(1)Excludes future incremental annual net operating income from recently delivered spaces aggregating 42,449 RSF that were vacant and/or unleased at delivery.
(2)Represents the average delivery date for deliveries that occurred during the three months ended September 30, 2025, weighted by annual rental revenue.
(3)Occupancy reflects total operating RSF placed in service as of each respective delivery date when the space was placed into service. Subsequent occupancy changes are not reflected.
75
New Class A/A+ development and redevelopment properties: 2025 and 2026 stabilization (near-term deliveries)
99 Coolidge Avenue
4135 Campus Point Court
Greater Boston/
Cambridge/Inner Suburbs
San Diego/
University Town Center
191,396 RSF
426,927 RSF
81% Leased/Negotiating
100% Leased
99Coolidge.jpg
Campuspoint4135.jpg
10075 Barnes Canyon Road
8800 Technology Forest Place
San Diego/Sorrento Mesa
Texas/Greater Houston
221,589 RSF
73,298 RSF
68% Leased/Negotiating
41% Leased/Negotiating
barnescanyon10075 v2.jpg
Techforest8800.jpg
76
New Class A/A+ development and redevelopment properties: 2027 and beyond stabilization (intermediate-term deliveries)
311 Arsenal Street
421 Park Drive
401 Park Drive
40, 50, and 60 Sylvan Road(1)
Greater Boston/
Cambridge/Inner Suburbs
Greater Boston/Fenway
Greater Boston/Route 128
333,758 RSF
392,011 RSF
137,675 RSF
596,064 RSF
arsenal311.jpg
parkdrive421.jpg
parkdrive401v2.jpg
60 Sylvan.jpg
1450 Owens Street
651 Gateway Boulevard
269 East Grand Avenue
701 Dexter Avenue North
San Francisco Bay Area/
Mission Bay
San Francisco Bay Area/
South San Francisco
San Francisco Bay Area/
South San Francisco
Seattle/Lake Union
212,796 RSF
237,684 RSF
107,250 RSF
227,577 RSF
owens1450.jpg
gateway651.jpg
269EGrand.jpg
701Dexter.jpg
(1)Image represents 60 Sylvan Road on the Alexandria Center® for Life Science – Waltham Megacampus. The project is expected to capture demand in our Route 128 submarket.
77
New Class A/A+ development and redevelopment properties: current projects
The following tables set forth a summary of our new Class A/A+ development and redevelopment properties under construction as of September 30, 2025 (dollars in thousands):
Property/Market/Submarket
Square Footage
Percentage
Occupancy(1)
Dev/Redev
In Service
CIP
Total
Leased
Leased/
Negotiating
Initial
Stabilized
Under construction
2025 and 2026 stabilization
99 Coolidge Avenue/Greater Boston/Cambridge/Inner Suburbs
Dev
129,413
191,396
320,809
81%
81%
4Q23
4Q26
4135 Campus Point Court/San Diego/University Town Center
Dev
426,927
426,927
100
100
3Q26
3Q26
10075 Barnes Canyon Road/San Diego/Sorrento Mesa
Dev
31,490
221,589
253,079
68
68
1Q25
2H26
8800 Technology Forest Place/Texas/Greater Houston
Redev
50,094
73,298
123,392
41
41
2Q23
4Q26
Canada
Redev
194,476
56,314
250,790
78
78
3Q23
4Q25
405,473
969,524
1,374,997
80
80
2027 and beyond stabilization
One Hampshire Street/Greater Boston/Cambridge
Redev
104,956
104,956
2027
2028
311 Arsenal Street/Greater Boston/Cambridge/Inner Suburbs
Redev
56,904
333,758
390,662
7
7
2027
2027
421 Park Drive/Greater Boston/Fenway
Dev
392,011
392,011
13
13
2027
2028
401 Park Drive/Greater Boston/Fenway
Redev
137,675
137,675
2027
2027
40, 50, and 60 Sylvan Road/Greater Boston/Route 128
Redev
596,064
596,064
33
33
4Q26
2027
Other/Greater Boston
Redev
453,869
453,869
2027
2027
1450 Owens Street/San Francisco Bay Area/Mission Bay
Dev
212,796
212,796
49
2027
2027
651 Gateway Boulevard/San Francisco Bay Area/South San Francisco(2)
Redev
89,022
237,684
326,706
21
21
1Q24
2027
269 East Grand Avenue/San Francisco Bay Area/South San Francisco
Redev
107,250
107,250
2H26
2027
701 Dexter Avenue North/Seattle/Lake Union
Dev
227,577
227,577
23
23
4Q26
2027
145,926
2,803,640
2,949,566
100% Pre-leased committed near-term project expected to commence construction in the next year
Campus Point by Alexandria/San Diego/University Town Center(3)
Dev
466,598
466,598
100
100
2028
2028
Total 2027 and beyond stabilization and committed near-term project
145,926
3,270,238
3,416,164
25
28
551,399
4,239,762
4,791,161
41%
43%
(1)Initial occupancy dates are subject to leasing and/or market conditions. Stabilized occupancy may vary depending on single tenancy versus multi-tenancy. Multi-tenant projects may increase in occupancy over time.
(2)We continue to build out this project on a floor-by-floor basis. As of September 30, 2025, the remaining cost to complete is $138 million, or 28% of the total cost at completion.
(3)Represents a single-tenant project that expands the existing Campus Point by Alexandria Megacampus, where we currently have a 55% interest. The project is fully leased to a longtime multinational pharmaceutical tenant that currently
occupies two buildings on the Megacampus: one building aggregating 52,620 RSF and another building aggregating 52,853 RSF. These buildings generated annual rental revenue of $7.5 million as of September 30, 2025. At the
beginning of 2026, the tenant will vacate the 52,620 RSF building, and during 2028, the tenant will vacate the 52,853 RSF building. We expect to fund the majority of future construction costs at the Megacampus until our ownership
interest increases from 55% to 75%, after which future capital would be contributed pro rata with our joint venture partner.
78
New Class A/A+ development and redevelopment properties: current projects (continued)
Our
Ownership
Interest
At 100%
Unlevered Yields
Property/Market/Submarket
In Service
CIP
Cost to
Complete
Total at
Completion
Initial
Stabilized
Initial Stabilized
(Cash Basis)
Under construction
2025 and 2026 stabilization with 80% leased/negotiating
99 Coolidge Avenue/Greater Boston/Cambridge/Inner Suburbs
100%
$154,608
$210,017
$79,375
$444,000
6.0%
6.8%
4135 Campus Point Court/San Diego/University Town Center
55.0%
412,619
111,381
524,000
9.0%
6.2%
10075 Barnes Canyon Road/San Diego/Sorrento Mesa
50.0%
25,573
217,841
77,586
321,000
5.5%
5.7%
8800 Technology Forest Place/Texas/Greater Houston
100%
60,480
46,526
4,994
112,000
6.3%
6.0%
Canada
100%
95,750
14,671
4,579
115,000
6.0%
6.0%
336,411
901,674
2027 and beyond stabilization(1)
One Hampshire Street/Greater Boston/Cambridge
100%
173,897
TBD
311 Arsenal Street/Greater Boston/Cambridge/Inner Suburbs
100%
21,756
298,829
421 Park Drive/Greater Boston/Fenway
100%
561,633
401 Park Drive/Greater Boston/Fenway
100%
174,402
40, 50, and 60 Sylvan Road/Greater Boston/Route 128
100%
511,925
Other/Greater Boston
100%
160,950
1450 Owens Street/San Francisco Bay Area/Mission Bay
25.0%
245,677
651 Gateway Boulevard/San Francisco Bay Area/South San Francisco
50.0%
116,744
232,429
137,827
487,000
5.0%
5.1%
269 East Grand Avenue/San Francisco Bay Area/South San Francisco
100%
109,065
TBD
701 Dexter Avenue North/Seattle/Lake Union
100%
293,922
138,500
2,762,729
474,911
3,664,403
100% Pre-leased committed near-term project expected to commence construction in the next year
Campus Point by Alexandria/San Diego/University Town Center(2)
55.0%
60,398
599,602
660,000
7.3%
6.5%
Total
$474,911
$3,724,801
$2,670,000
(3)
$6,870,000
(3)
Our share of investment(3)(4)
$410,000
$3,100,000
$2,180,000
$5,690,000
Refer to “Initial stabilized yield (unlevered)” under “Definitions and reconciliations” in Item 2 for additional information.
(1)We expect to provide total estimated costs and related yields for each project with estimated stabilization in 2027 and beyond over the next several quarters.
(2)Refer to footnote 3 on the prior page for additional details.
(3)Represents dollar amount rounded to the nearest $10 million and includes preliminary estimated amounts for projects listed as TBD.
(4)Represents our share of investment based on our ownership percentage upon completion of development or redevelopment projects.
79
New Class A/A+ development and redevelopment properties: summary of pipeline
76% of Our Total Development and Redevelopment Pipeline RSF
Is Within Our Megacampus Ecosystems
The following table summarizes the key information for all our development and redevelopment projects in North America as of September 30, 2025 (dollars in thousands):
Market
Property/Submarket
Our
Ownership
Interest
Book Value
Square Footage
Development and Redevelopment
Total(1)
Under
Construction
Committed Near
Term
Future
Greater Boston
Megacampus: Alexandria Center® at One Kendall Square/Cambridge
100%
$173,897
104,956
104,956
One Hampshire Street
Megacampus: The Arsenal on the Charles/Cambridge/Inner Suburbs
100%
311,016
333,758
34,157
367,915
311 Arsenal Street
Megacampus: 480 Arsenal Way and 446, 458, and 500 Arsenal Street, and 99
Coolidge Avenue/Cambridge/Inner Suburbs
100%
233,479
191,396
560,000
751,396
446, 458, and 500 Arsenal Street, and 99 Coolidge Avenue
Megacampus: Alexandria Center® for Life Science – Fenway/Fenway
100%
736,035
529,686
529,686
401 and 421 Park Drive
Megacampus: Alexandria Center® for Life Science – Waltham/Route 128
100%
576,242
596,064
515,000
1,111,064
40, 50, and 60 Sylvan Road, and 35 Gatehouse Drive
Megacampus: Alexandria Center® at Kendall Square/Cambridge
100%
212,439
174,500
174,500
100 Edwin H. Land Boulevard
Megacampus: Alexandria Technology Square®/Cambridge
100%
8,449
100,000
100,000
Megacampus: 285, 299, 307, and 345 Dorchester Avenue/Seaport Innovation District
60.0%
295,345
1,040,000
1,040,000
10 Necco Street/Seaport Innovation District
100%
106,373
175,000
175,000
215 Presidential Way/Route 128
100%
6,816
112,000
112,000
Other development and redevelopment projects
100%
379,674
453,869
1,348,541
1,802,410
$3,039,765
2,209,729
4,059,198
6,268,927
Refer to “Megacampus” under “Definitions and reconciliations” in Item 2 for additional information.
(1)Represents total square footage upon completion of development or redevelopment of one or more new Class A/A+ properties. Square footage presented includes the RSF of buildings currently in operation at properties that also have
future development or redevelopment opportunities. Upon expiration of existing in-place leases, we have the intent to demolish or redevelop the existing property subject to market conditions and leasing. Refer to “Investments in real
estate” under “Definitions and reconciliations” in Item 2 for additional information, including development and redevelopment square feet currently included in rental properties.
80
New Class A/A+ development and redevelopment properties: summary of pipeline (continued)
Market
Property/Submarket
Our
Ownership
Interest
Book Value
Square Footage
Development and Redevelopment
Total(1)
Under
Construction
Committed Near
Term
Future
San Francisco Bay Area
Megacampus: Alexandria Center® for Science and Technology – Mission Bay/Mission
Bay
25.0%
$245,677
212,796
212,796
1450 Owens Street
Megacampus: Alexandria Technology Center® – Gateway/South San Francisco
50.0%
259,005
237,684
291,000
528,684
651 Gateway Boulevard
Megacampus: Alexandria Center® for Advanced Technologies – South San
Francisco/South San Francisco
100%
115,720
107,250
90,000
197,250
211(2) and 269 East Grand Avenue
Megacampus: Alexandria Center® for Advanced Technologies – Tanforan/South San
Francisco
100%
429,101
1,930,000
1,930,000
1122, 1150, and 1178 El Camino Real
Alexandria Center® for Life Science – Millbrae/South San Francisco
48.5%
158,718
348,401
348,401
201 and 231 Adrian Road and 30 Rollins Road
Megacampus: Alexandria Center® for Life Science – San Carlos/Greater Stanford
100%
479,347
1,497,830
1,497,830
960 Industrial Road, 987 and 1075 Commercial Street, and 888 Bransten Road
3825 and 3875 Fabian Way/Greater Stanford
100%
164,226
478,000
478,000
2100, 2200, 2300, and 2400 Geng Road/Greater Stanford
100%
81,552
240,000
240,000
Megacampus: 88 Bluxome Street/SoMa
100%
418,909
1,070,925
1,070,925
$2,352,255
557,730
5,946,156
6,503,886
Refer to “Megacampus” under “Definitions and reconciliations” in Item 2 for additional information.
(1)Represents total square footage upon completion of development or redevelopment of one or more new Class A/A+ properties. Square footage presented includes the RSF of buildings currently in operation at properties that also have
future development or redevelopment opportunities. Upon expiration of existing in-place leases, we have the intent to demolish or redevelop the existing property subject to market conditions and leasing. Refer to “Investments in real
estate” under “Definitions and reconciliations” in Item 2 for additional information, including development and redevelopment square feet currently included in rental properties.
(2)We own a partial interest in this property through a real estate joint venture. Refer to Note 4 – “Consolidated and unconsolidated real estate joint ventures” to our unaudited consolidated financial statements in Item 1 for additional details.
81
New Class A/A+ development and redevelopment properties: summary of pipeline (continued)
Market
Property/Submarket
Our
Ownership
Interest
Book Value
Square Footage
Development and Redevelopment
Total(1)
Under
Construction
Committed Near
Term
Future
San Diego
Megacampus: Campus Point by Alexandria/University Town Center
55.0%
(3)
$620,470
426,927
466,598
500,859
1,394,384
10010(2), 10140(2), 10210, and 10260 Campus Point Drive and 4135, 4161, 4165,
and 4224 Campus Point Court
Megacampus: SD Tech by Alexandria/Sorrento Mesa
50.0%
414,636
221,589
493,845
715,434
9805 Scranton Road and 10075 Barnes Canyon Road
11255 and 11355 North Torrey Pines Road/Torrey Pines
100%
158,326
215,000
215,000
Megacampus: One Alexandria Square/Torrey Pines
100%
64,545
125,280
125,280
10975 and 10995 Torreyana Road
Megacampus: 5200 Illumina Way/University Town Center
51.0%
17,536
451,832
451,832
9625 Towne Centre Drive/University Town Center
30.0%
837
100,000
100,000
Megacampus: Sequence District by Alexandria/Sorrento Mesa
100%
48,303
1,661,915
1,661,915
6290, 6310, 6340, 6350, and 6450 Sequence Drive
4075 Sorrento Valley Boulevard/Sorrento Valley
100%
28,167
144,000
144,000
Other development and redevelopment projects
(4)
78,036
475,000
475,000
1,430,856
648,516
466,598
4,167,731
5,282,845
Seattle
Megacampus: Alexandria Center® for Advanced Technologies – South Lake Union/
Lake Union
(5)
584,896
227,577
1,057,400
1,284,977
601 and 701 Dexter Avenue North and 800 Mercer Street
1010 4th Avenue South/SoDo
100%
62,116
544,825
544,825
410 West Harrison Street/Elliott Bay
100%
91,000
91,000
Megacampus: Alexandria Center® for Advanced Technologies – Canyon Park/Bothell
100%
19,739
230,000
230,000
21660 20th Avenue Southeast
Other development and redevelopment projects
100%
151,672
706,087
706,087
$818,423
227,577
2,629,312
2,856,889
Refer to “Megacampus” under “Definitions and reconciliations” in Item 2 for additional information.
(1)Represents total square footage upon completion of development or redevelopment of one or more new Class A/A+ properties. Square footage presented includes the RSF of buildings currently in operation at properties that also have
future development or redevelopment opportunities. Upon expiration of existing in-place leases, we have the intent to demolish or redevelop the existing property subject to market conditions and leasing. Refer to “Investments in real
estate” under “Definitions and reconciliations” in Item 2 for additional information, including development and redevelopment square feet currently included in rental properties.
(2)We have a 100% interest in this property.
(3)The noncontrolling interest share of our joint venture partner is anticipated to decrease to 25%, as we expect to fund the majority of future construction costs at the campus until our ownership interest increases from 55% to 75%, after
which future capital would be contributed pro rata with our partner.
(4)Includes a property in which we own a partial interest through a real estate joint venture. 
(5)We have a 100% interest in 601 and 701 Dexter Avenue North aggregating 415,977 RSF and a 60% interest in the future development project at 800 Mercer Street aggregating 869,000 RSF.
82
New Class A/A+ development and redevelopment properties: summary of pipeline (continued)
Market
Property/Submarket
Our
Ownership
Interest
Book Value
Square Footage
Development and Redevelopment
Total(1)
Under
Construction
Committed Near
Term
Future
Maryland
Megacampus: Alexandria Center® for Life Science – Shady Grove/Rockville
100%
$25,629
296,000
296,000
9830 Darnestown Road
25,629
296,000
296,000
Research Triangle
Megacampus: Alexandria Center® for Life Science – Durham/Research Triangle
100%
163,894
2,060,000
2,060,000
Megacampus: Alexandria Center® for Advanced Technologies and AgTech –
Research Triangle/Research Triangle
100%
111,537
1,170,000
1,170,000
4 and 12 Davis Drive
Megacampus: Alexandria Center® for NextGen Medicines/Research Triangle
100%
113,456
1,055,000
1,055,000
3029 East Cornwallis Road
Megacampus: Alexandria Center® for Sustainable Technologies/Research Triangle
100%
55,732
750,000
750,000
120 TW Alexander Drive, 2752 East NC Highway 54, and 10 South Triangle Drive
100 Capitola Drive/Research Triangle
100%
65,965
65,965
Other development and redevelopment projects
100%
4,185
76,262
76,262
448,804
5,177,227
5,177,227
New York City
Megacampus: Alexandria Center® for Life Science – New York City/New York City
100%
175,666
550,000
(2)
550,000
$175,666
550,000
550,000
Refer to “Megacampus” under “Definitions and reconciliations” in Item 2 for additional information.
(1)Represents total square footage upon completion of development or redevelopment of one or more new Class A/A+ properties. Square footage presented includes the RSF of buildings currently in operation at properties that also have
inherent future development or redevelopment opportunities. Upon expiration of existing in-place leases, we have the intent to demolish or redevelop the existing property. Refer to “Investments in real estate” under “Definitions and
reconciliations” for additional information, including development and redevelopment square feet currently included in rental properties.
(2)During the three months ended September 30, 2024, we filed a lawsuit against the New York City Health + Hospitals Corporation and the New York City Economic Development Corporation for fraud and breach of contract concerning our
option to ground lease a land parcel to develop a future world-class life science building within the Alexandria Center® for Life Science – New York City Megacampus. Refer to “Legal proceedings” in Item 1 under Part II – Other
Information for additional details.
83
New Class A/A+ development and redevelopment properties: summary of pipeline (continued)
Market
Property/Submarket
Our
Ownership
Interest
Book Value
Square Footage
Development and Redevelopment
Total(1)
Under
Construction
Committed Near
Term
Future
Texas
Alexandria Center® for Advanced Technologies at The Woodlands/Greater Houston
100%
$49,575
73,298
116,405
189,703
8800 Technology Forest Place
1001 Trinity Street and 1020 Red River Street/Austin
100%
133,684
250,010
250,010
Other development and redevelopment projects
100%
59,432
344,000
344,000
242,691
73,298
710,415
783,713
Canada
100%
14,671
56,314
371,743
428,057
Other development and redevelopment projects
100%
47,504
350,000
350,000
Total pipeline as of September 30, 2025, excluding properties held for sale
8,596,264
3,773,164
466,598
24,257,782
28,497,544
Properties held for sale
112,681
939,756
939,756
Total pipeline as of September 30, 2025
$8,708,945
(2)
3,773,164
466,598
25,197,538
29,437,300
Refer to “Megacampus” under “Definitions and reconciliations” in Item 2 for additional information.
(1)Total square footage includes 2,135,074 RSF of buildings currently in operation that we expect to demolish or redevelop and commence future construction subject to market conditions and leasing. Refer to “Investments in real estate
under “Definitions and reconciliations” in Item 2 for additional information, including development and redevelopment square feet currently included in rental properties.
(2)Includes $3.7 billion of projects that are currently under construction and one 100% pre-leased committed near-term project expected to commence vertical construction in 2026.
84
Results of operations
We present a tabular comparison of items, whether gain or loss, that may facilitate a high-level understanding of our results
and provide context for the disclosures included in our annual report on Form 10-K for the year ended December 31, 2024 and our
subsequent quarterly reports on Form 10-Q. We believe that such tabular presentation promotes a better understanding for investors of
the corporate-level decisions made and activities performed that significantly affect comparison of our operating results from period to
period. We also believe that this tabular presentation will supplement for investors an understanding of our disclosures and real estate
operating results. Gains or losses on sales of real estate and impairments of real estate are related to corporate-level decisions to
dispose of real estate. Gains or losses on early extinguishment of debt are related to corporate-level financing decisions focused on our
capital structure strategy. Significant realized and unrealized gains or losses on non-real estate investments, impairments of real estate
and non-real estate investments, and acceleration of stock compensation expense due to the resignations of executive officers are not
related to the operating performance of our real estate assets as they result from strategic, corporate-level non-real estate investment
decisions and external market conditions. Impairments of non-real estate investments and changes in provision for expected credit
losses on financial instruments are not related to the operating performance of our real estate as they represent the write-down of non-
real estate investments when their fair values decrease below their respective carrying values due to changes in general market or
other conditions outside of our control. Significant items, whether a gain or loss, included in the tabular disclosure for current periods
are described in further detail in Item 2. Key items included in net income attributable to Alexandria’s common stockholders for the three
and nine months ended September 30, 2025 and 2024 and the related per share amounts were as follows (in millions, except per share
amounts):
Three Months Ended September 30,
Nine Months Ended September 30,
2025
2024
2025
2024
2025
2024
2025
2024
Amount
Per Share – Diluted
Amount
Per Share – Diluted
Unrealized gains (losses) on non-real estate
investments
$18.5
$2.6
$0.11
$0.02
$(71.6)
$(32.5)
$(0.42)
$(0.19)
Gain on sales of real estate
9.4
27.1
0.06
0.16
22.5
27.5
0.13
0.16
Impairment of non-real estate investments
(25.1)
(10.3)
(0.15)
(0.06)
(75.5)
(37.8)
(0.45)
(0.22)
Impairment of real estate
(323.9)
(5.7)
(1.90)
(0.03)
(485.6)
(36.5)
(2.85)
(0.22)
Loss on early extinguishment of debt
(0.1)
(0.1)
Increase in provision for expected credit
losses on financial instruments
(0.3)
Total
$(321.2)
$13.7
$(1.88)
$0.09
$(610.6)
$(79.3)
$(3.59)
$(0.47)
Refer to Note 3 – “Investments in real estate,” Note 5 – “Leases,” Note 7 – “Investments,” and Note 8 – “Other assets” to our
unaudited consolidated financial statements in Item 1 for additional information.
85
Same properties
We supplement an evaluation of our results of operations with an evaluation of operating performance of certain of our
properties, referred to as “Same Properties.” For additional information on the determination of our Same Properties portfolio, refer to
Same property comparisons” under “Definitions and reconciliations” in Item 2. The following table reconciles the number of Same
Properties to total properties for the nine months ended September 30, 2025:
Development – under construction
Properties
99 Coolidge Avenue
1
1450 Owens Street
1
10075 Barnes Canyon Road
1
421 Park Drive
1
4135 Campus Point Court
1
701 Dexter Avenue North
1
6
Development – placed into service after
January 1, 2024
Properties
9810 Darnestown Road
1
9820 Darnestown Road
1
1150 Eastlake Avenue East
1
4155 Campus Point Court
1
201 Brookline Avenue
1
9808 Medical Center Drive
1
230 Harriet Tubman Way
1
500 North Beacon Street and 4 Kingsbury Avenue
2
10935, 10945, and 10955 Alexandria Way
3
12
Redevelopment – under construction
Properties
40, 50, and 60 Sylvan Road
3
269 East Grand Avenue
1
651 Gateway Boulevard
1
401 Park Drive
1
8800 Technology Forest Place
1
311 Arsenal Street
1
One Hampshire Street
1
Canada
4
Other
2
15
Redevelopment – placed into service after
January 1, 2024
Properties
840 Winter Street
1
Alexandria Center® for Advanced Technologies –
Monte Villa Parkway
6
7
Acquisitions after January 1, 2024
Properties
Other
3
3
Unconsolidated real estate JVs
4
Properties held for sale
14
Total properties excluded from Same Properties
61
Same Properties
314
Total properties in North America as of
September 30, 2025
375
The following table presents information regarding our Same Properties for the three and nine months ended September 30,
2025:
September 30, 2025
Three Months Ended
Nine Months Ended
Percentage change in net operating income over comparable period from prior
year(1)
(6.0)%
(3.1)%
Percentage change in net operating income (cash basis) over comparable period
from prior year(1)
(3.1%)
3.0%
(2)
Operating margin
67%
68%
Number of Same Properties
316
314
RSF
31,953,032
31,739,397
Occupancy – current-period average
91.4%
92.6%
Occupancy – same-period prior-year average
94.8%
94.6%
(1)Reflects previously disclosed lease expirations aggregating 768,080 RSF that became vacant during the three months ended March 31, 2025, as presented under
Summary of occupancy percentages in North America” in Item 2. As of September 30, 2025, 338,780 RSF of this vacant space met the criteria for classification as held
for sale and has been excluded from our same property results. The remaining 429,300 RSF is included in our same property results for the three and nine months
ended September 30, 2025. Excluding the impact of this vacant 429,300 RSF, same property net operating income changes for the three and nine months ended
September 30, 2025 would have been (4.2)% and (1.3)% (cash basis), and (1.9)% and 4.2% (cash basis), respectively.
(2)Includes the impact of initial free rent concessions that burned off after January 1, 2024 for development and redevelopment projects that were placed into service in
2023 and accordingly are part of our same property pool for the nine months ended September 30, 2025, including at 325 Binney Street in our Cambridge submarket, 15
Necco Street in our Seaport Innovation District submarket, and 751 Gateway Boulevard in our South San Francisco submarket. Excluding the impact of these initial free
rent concessions, same property net operating income changes (cash basis) for the nine months ended September 30, 2025 would have been (0.3)%.
86
The charts below present our reported same property results (“As reported”), which reflect the operating performance of all
consolidated properties that were fully operational throughout the comparative quarterly periods presented. To provide additional insight
and a retrospective view of the performance of our ongoing operating portfolio, the charts also present an alternative calculation of our
same property performance, using the 3Q25 same property pool (“3Q25 same properties”) for each period presented. We believe this
alternative presentation provides a useful operating trend primarily by removing properties expected to be sold.
Same Property Net Operating Income
SS NOI chartv5.jpg
Percentage Change in Same Property Performance – Net Operating
Income
Three Months Ended
March 31, 2025
June 30, 2025
September 30, 2025
As reported
(3.1)%
(5.4)%
(6.0)%
3Q25 same properties
0.3%
(2.5)%
(6.0)%
Same Property Net Operating Income (Cash Basis)
SS NOI chart cash basisv3.jpg
Percentage Change in Same Property Performance – Net Operating
Income (Cash Basis)
Three Months Ended
March 31, 2025
June 30, 2025
September 30, 2025
As reported
5.1%
2.0%
(3.1)%
3Q25 same properties
8.0%
5.6%
(3.1)%
87
Comparison of results for the three months ended September 30, 2025 to the three months ended September 30, 2024
The following table presents a comparison of the components of net operating income for our Same Properties and Non-Same
Properties for the three months ended September 30, 2025, compared to the three months ended September 30, 2024 (dollars in
thousands). Refer to “Definitions and reconciliations” in Item 2 for definitions of “Tenant recoveries” and “Net operating income” and
their reconciliations from the most directly comparable financial measures presented in accordance with GAAP, income from rentals and
net income, respectively.
Three Months Ended September 30,
2025
2024
$ Change
% Change
Income from rentals:
Same Properties
$430,646
$451,763
$(21,117)
(4.7)%
Non-Same Properties
110,424
127,806
(17,382)
(13.6)
Rental revenues
541,070
579,569
(38,499)
(6.6)
Same Properties
167,933
165,579
2,354
1.4
Non-Same Properties
26,846
30,596
(3,750)
(12.3)
Tenant recoveries
194,779
196,175
(1,396)
(0.7)
Income from rentals
735,849
775,744
(39,895)
(5.1)
Same Properties
352
386
(34)
(8.8)
Non-Same Properties
15,743
15,477
266
1.7
Other income
16,095
15,863
232
1.5
Same Properties
598,931
617,728
(18,797)
(3.0)
Non-Same Properties
153,013
173,879
(20,866)
(12.0)
Total revenues
751,944
791,607
(39,663)
(5.0)
Same Properties
199,051
192,229
6,822
3.5
Non-Same Properties
40,183
41,036
(853)
(2.1)
Rental operations
239,234
233,265
5,969
2.6
Same Properties
399,880
425,499
(25,619)
(6.0)
Non-Same Properties
112,830
132,843
(20,013)
(15.1)
Net operating income
$512,710
$558,342
$(45,632)
(8.2)%
(1)
Net operating income – Same Properties
$399,880
$425,499
$(25,619)
(6.0)%
Straight-line rent revenue
(8,019)
(21,594)
13,575
(62.9)
Amortization of acquired below-market leases and deferred
revenue related to tenant-funded and -built landlord
improvements
(8,167)
(7,739)
(428)
5.5
Net operating income – Same Properties (cash basis)
$383,694
$396,166
$(12,472)
(3.1%)
(1)Decrease in total net operating income includes the impact of operating properties disposed of after January 1, 2024. Excluding these dispositions, net operating income
for the three months ended September 30, 2025 would have decreased by 3.7% over the corresponding period in 2024.
88
Income from rentals
Total income from rentals for the three months ended September 30, 2025 decreased by $39.9 million, or 5.1%, to
$735.8 million, compared to $775.7 million for the three months ended September 30, 2024, due to a decrease in rental revenues, as
discussed below.
Rental revenues
Total rental revenues for the three months ended September 30, 2025 decreased by $38.5 million, or 6.6%, to $541.1 million,
compared to $579.6 million for the three months ended September 30, 2024. The decrease was partially related to dispositions of real
estate assets within our Non-Same Properties since July 1, 2024. The decrease also reflects a $4.4 million write-off of a deferred rent
balance related to one tenant at a non-same property in our Seattle market, recognized upon our determination during the three months
ended September 2025 that the collectibility of future payments was not probable.
Same Properties’ rental revenues for the three months ended September 30, 2025 decreased by $21.1 million, or 4.7%, to
$430.6 million, compared to $451.8 million for the three months ended September 30, 2024. This decrease is primarily attributable to a
decrease in Same Properties’ average occupancy to 91.4% for the three months ended September 30, 2025 from 94.8% for the three
months ended September 30, 2024, including the impact of the following lease expirations in the first quarter of 2025 that remained
vacant during the three months ended September 30, 2025: (i) 182,054 RSF at the Alexandria Technology Square® Megacampus in our
Cambridge submarket (of which 89,222 RSF had been leased as of September 30, 2025, with expected occupancy commencing after
September 30, 2025) and (ii) two properties aggregating 247,246 RSF in our Austin submarket (of which 102,930 RSF had been leased
as of September 30, 2025, with expected occupancy commencing after September 30, 2025).
Tenant recoveries
Tenant recoveries for the three months ended September 30, 2025 decreased by $1.4 million, or 0.7%, to $194.8 million,
compared to $196.2 million for the three months ended September 30, 2024, primarily in connection with dispositions of real estate
assets within our Non-Same Properties since July 1, 2024.
The decrease in Non-Same Properties tenant recoveries was partially offset by the increase of $2.4 million, or 1.4%, to
$167.9 million in Same Properties’ tenant recoveries for the three months ended September 30, 2025, compared to $165.6 million for
the three months ended September 30, 2024. This increase was primarily due to the $6.0 million increase in operating expenses during
the three months ended September 30, 2025, as discussed under “Rental operations” below. As of September 30, 2025, 91% of our
leases (on an annual rental revenue basis) were triple net leases, which require tenants to pay substantially all real estate taxes,
insurance, utilities, repairs and maintenance, common area expenses, and other operating expenses (including increases thereto) in
addition to base rent. This increase was partially offset by a decrease in Same Properties’ tenant recoveries resulting from a decrease
in Same Properties’ average occupancy to 91.4% for the three months ended September 30, 2025 from 94.8% for the three months
ended September 30, 2024.
Rental operations
Total rental operating expenses for the three months ended September 30, 2025 increased by $6.0 million, or 2.6%, to
$239.2 million, compared to $233.3 million for the three months ended September 30, 2024. The increase was primarily due to higher
rental operating expenses related to our Same Properties, as discussed below, partially offset by the decrease in Non-Same Properties’
rental operating expenses of $0.9 million primarily as a result of real estate dispositions since July 1, 2024.
Same Properties’ rental operating expenses increased by $6.8 million, or 3.5%, to $199.1 million during the three months
ended September 30, 2025, compared to $192.2 million for the three months ended September 30, 2024, primarily as the result of
increases in (i) utilities expenses and engineering, security, janitorial, and other operating contractual costs aggregating $5.4 million,
primarily due to increased tenant operations at certain properties delivered in 2023, and (ii) property taxes aggregating $2.0 million,
primarily due to new developments in the Greater Boston and San Francisco Bay Area markets delivered in 2023, with property taxes
based on these properties’ higher assessed values becoming effective subsequent to July 1, 2024.
Depreciation and amortization
Depreciation and amortization expense for the three months ended September 30, 2025 increased by $46.2 million, or 15.7%,
to $340.2 million, compared to $294.0 million for the three months ended September 30, 2024. The increase primarily relates to (i) the
change in useful lives of certain buildings, (ii) 1.6 million RSF of development and redevelopment projects placed into service
subsequent to July 1, 2024, and (iii) two operating properties aggregating 383,360 RSF acquired subsequent to July 1, 2024.
89
Impairment of real estate
During the three months ended September 30, 2025, we recognized impairment charges aggregating $323.9 million, which
primarily included the following:
Impairment charge of $206.2 million was recognized to reduce the carrying amount of a non-Megacampus property
aggregating 179,100 RSF in Long Island City, a non-core location within our New York City submarket, to its estimated fair
value less costs to sell of approximately $31.1 million upon meeting the criteria for classification as held for sale. This
property met the held for sale criteria in September 2025, when we committed to dispose of it following our reevaluation of
its alignment with our Megacampus strategy and decided to allocate sales proceeds toward other projects with higher
value-creation opportunities. As of September 30, 2025, the property is 52% occupied. We expect to complete the sale of
this property within the next 12 months.
Impairment charge of $43.4 million was recognized to reduce the carrying amount of a retail shopping center aggregating
249,275 RSF with a future development opportunity aggregating 281,592 SF in our Cambridge/Inner Suburbs submarket
of Greater Boston to its estimated fair value less costs to sell of approximately $96.3 million upon meeting the criteria for
classification as held for sale.This property met the held for sale criteria in September 2025 upon our commitment to
dispose of this asset and allocate sales proceeds toward other projects with higher value-creation opportunities and our
obtaining of all required approvals to sell. In October 2025, we completed the sale of this asset, with no gain or loss
recognized upon sale.
Impairment charge of $31.8 million was recognized to reduce the carrying amount of one vacant property aggregating
104,531 RSF in the Research Triangle market to its estimated fair value less costs to sell of approximately $1.2 million
upon meeting the criteria for classification as held for sale in September 2025. The held for sale criteria were met upon
our decision to sell this asset, due to its noncontiguous location relative to most other properties on the Alexandria Center®
for Sustainable Technologies Megacampus, and to allocate the sales proceeds, and other capital necessary to lease the
property, toward other projects with greater value-creation opportunities. We expect to complete the sale within the next
12 months.
Impairment charge of $27.8 million was recognized to reduce the carrying amounts of land parcels aggregating 154,308
SF on a non-Megacampus in our Sorrento Mesa submarket of San Diego to their estimated fair values less costs to sell of
approximately $13.9 million upon meeting the criteria for classification as held for sale in September 2025. These assets
met the criteria for classification as held for sale upon our reevaluation of their alignment with our Megacampus strategy
and our decision to reallocate capital toward our other projects with greater value-creation opportunities. We expect to
complete the sale of these assets within the next 12 months.
During the three months ended September 30, 2024, we recognized real estate impairment charges aggregating $5.7 million
to adjust the carrying amount of one property in Canada that continued to meet the held-for-sale classification to the sales price under
negotiation with a potential buyer less costs to sell.
General and administrative expenses
General and administrative expenses for the three months ended September 30, 2025 decreased by $14.7 million, or 33.5%,
to $29.2 million, compared to $43.9 million for the three months ended September 30, 2024, primarily due to cost-control and efficiency
initiatives implemented since 2024, including reduction in headcount, restructuring of compensation plans, systems upgrades, and
process improvements. As a percentage of net operating income, our general and administrative expenses for the trailing twelve
months ended September 30, 2025 and 2024 were 5.7% and 8.9%, respectively.
Interest expense
Interest expense for the three months ended September 30, 2025 and 2024 consisted of the following (dollars in thousands):
Three Months Ended September 30,
Component
2025
2024
Change
Gross interest
$140,943
$130,046
$10,897
Capitalized interest
(86,091)
(86,496)
405
Interest expense
$54,852
$43,550
$11,302
Average debt balance outstanding(1)
$13,512,336
$12,694,260
$818,076
Weighted-average annual interest rate(2)
4.2%
4.1%
0.1%
(1)Represents the average debt balance outstanding during the respective periods.
(2)Represents annualized total interest incurred divided by the average debt balance outstanding during the respective periods.
90
The net change in interest expense during the three months ended September 30, 2025, compared to the three months ended
September 30, 2024, resulted from the following (dollars in thousands):
Component
Interest Rate(1)
Effective Date
Change
Increases in interest incurred due to:
Issuances of debt:
$550 million of unsecured senior notes payable due 2035
5.66%
February 2025
$7,590
Higher average outstanding balances under commercial paper program and/or
unsecured senior line of credit
10,100
Other increase in interest
356
Total increases
18,046
Decreases in interest incurred due to:
Repayments of debt:
$600 million of unsecured senior notes payable due 2025
3.62%
April 2025
(5,218)
Secured notes payable
7.18%
August 2025
(1,931)
Total decreases
(7,149)
Change in gross interest
10,897
Decrease in capitalized interest
405
Total change in interest expense
$11,302
(1)Represents the weighted-average interest rate as of the end of the applicable period, including amortization of loan fees, amortization of debt premiums (discounts), and
other bank fees.
Investment income (loss)
During the three months ended September 30, 2025, we recognized investment income aggregating $28.2 million, which
consisted of $34.8 million of realized gains, $18.5 million of unrealized gains, and $25.1 million of impairment charges.
During the three months ended September 30, 2024, we recognized investment income aggregating $15.2 million, which
consisted of $23.0 million of realized gains, $2.6 million of unrealized gains, and $10.3 million of impairment charges.
For additional information about our investments, refer to Note 7 – “Investments” to our unaudited consolidated financial
statements in Item 1. For our impairments accounting policy, refer to “Investments” in Note 2 – “Summary of significant accounting
policies” to our unaudited consolidated financial statements in Item 1.
Gain on sales of real estate
During the three months ended September 30, 2025, we recognized a $9.4 million gain related to the disposition of our
controlling interest in a consolidated joint venture that owns Pacific Technology Park in our Sorrento Mesa submarket. For additional
information, refer to Note 4 – “Consolidated and unconsolidated real estate joint ventures” to our unaudited consolidated financial
statements in Item 1.
During the three months ended September 30, 2024, we recognized $27.1 million of gains primarily related the disposition of
1165 Eastlake Avenue East in our Lake Union submarket.
The gains were classified in gain on sales of real estate within our consolidated statement of operations for the three months
ended September 30, 2025 and 2024, respectively.
Other comprehensive (loss) income
Other comprehensive income (loss) primarily comprised unrealized foreign currency translation gains or losses related to our
operations in Canada. Total other comprehensive loss for the three months ended September 30, 2025 aggregating $4.8 million
included $7.8 million of cumulative translation loss related to our operations in Canada, resulting from the CAD’s weakening against the
USD during this period. This loss was partially offset by $3.0 million of unrealized gains related to the change in the fair value of our
cross-currency swap agreements, resulting from the CAD’s weakening since the execution of these agreements on July 29, 2025
through September 30, 2025. Refer to Note 11 – “Hedge Agreements” to our unaudited consolidated financial statements in Item 1 for
additional information.
Total other comprehensive income of $5.2 million for the three months ended September 30, 2024 is primarily due to
unrealized foreign currency translation gains related to our operations in Canada.
91
Comparison of results for the nine months ended September 30, 2025 to the nine months ended September 30, 2024
The following table presents a comparison of the components of net operating income for our Same Properties and Non-Same
Properties for the nine months ended September 30, 2025, compared to the nine months ended September 30, 2024 (dollars in
thousands). Refer to “Definitions and reconciliations” in Item 2 for definitions of “Tenant recoveries” and “Net operating income” and
their reconciliations from the most directly comparable financial measures presented in accordance with GAAP, income from rentals and
net income, respectively.
Nine Months Ended September 30,
2025
2024
$ Change
% Change
Income from rentals:
Same Properties
$1,330,669
$1,353,855
$(23,186)
(1.7%)
Non-Same Properties
315,890
383,949
(68,059)
(17.7)
Rental revenues
1,646,559
1,737,804
(91,245)
(5.3)
Same Properties
492,718
460,690
32,028
7.0
Non-Same Properties
77,026
87,963
(10,937)
(12.4)
Tenant recoveries
569,744
548,653
21,091
3.8
Income from rentals
2,216,303
2,286,457
(70,154)
(3.1)
Same Properties
1,127
1,058
69
6.5
Non-Same Properties
54,712
39,934
14,778
37.0
Other income
55,839
40,992
14,847
36.2
Same Properties
1,824,514
1,815,603
8,911
0.5
Non-Same Properties
447,628
511,846
(64,218)
(12.5)
Total revenues
2,272,142
2,327,449
(55,307)
(2.4)
Same Properties
587,333
539,271
48,062
8.9
Non-Same Properties
102,729
129,562
(26,833)
(20.7)
Rental operations
690,062
668,833
21,229
3.2
Same Properties
1,237,181
1,276,332
(39,151)
(3.1)
Non-Same Properties
344,899
382,284
(37,385)
(9.8)
Net operating income
$1,582,080
$1,658,616
$(76,536)
(4.6%)
(1)
Net operating income – Same Properties
$1,237,181
$1,276,332
$(39,151)
(3.1%)
Straight-line rent revenue
(19,703)
(96,437)
76,734
(79.6)
Amortization of acquired below-market leases and deferred
revenue related to tenant-funded and -built landlord
improvements
(26,385)
(24,055)
(2,330)
9.7
Net operating income – Same Properties (cash basis)
$1,191,093
$1,155,840
$35,253
3.0%
(1)Decrease in total net operating income includes the impact of operating properties disposed of after January 1, 2024. Excluding these dispositions, net operating income
for the nine months ended September 30, 2025 would have increased by 0.8% over the corresponding period in 2024.
92
Income from rentals
Total income from rentals for the nine months ended September 30, 2025 decreased by $70.2 million, or 3.1%, to $2.22 billion,
compared to $2.29 billion for the nine months ended September 30, 2024, due to a decrease in rental revenues, partially offset by an
increase in tenant recoveries, as discussed below.
Rental revenues
Total rental revenues for the nine months ended September 30, 2025 decreased by $91.2 million, or 5.3%, to $1.6 billion,
compared to $1.7 billion for the nine months ended September 30, 2024. The decrease was primarily related to dispositions of real
estate assets within our Non-Same Properties since January 1, 2024. The decrease also reflects a $4.4 million write-off of a deferred
rent balance related to one tenant at a non-same property in our Seattle market, recognized upon our determination during the three
months ended September 2025 that the collectibility of future payments was not probable.
Same Properties’ rental revenues for the nine months ended September 30, 2025 decreased by $23.2 million, or 1.7%, to
$1.3 billion, compared to $1.4 billion for the nine months ended September 30, 2024. This decrease was primarily attributable to a
decrease in Same Properties’ average occupancy to 92.6% for the nine months ended September 30, 2025 from 94.6% for the nine
months ended September 30, 2024, including the impact of the following lease expirations in the first quarter of 2025 that were vacant
during the nine months ended September 30, 2025: (i) 182,054 RSF at the Alexandria Technology Square® Megacampus in our
Cambridge submarket (of which 89,222 RSF had been leased as of September 30, 2025, with expected occupancy commencing after
September 30, 2025) and (ii) two properties aggregating 247,246 RSF in our Austin submarket (of which 102,930 RSF had been leased
as of September 30, 2025, with expected occupancy commencing after September 30, 2025).
Tenant recoveries
Tenant recoveries for the nine months ended September 30, 2025 increased by $21.1 million, or 3.8%, to $569.7 million,
compared to $548.7 million for the nine months ended September 30, 2024, primarily in connection with Same Properties.
Same Properties’ tenant recoveries for the nine months ended September 30, 2025 increased by $32.0 million, or 7.0%, to
$492.7 million, compared to $460.7 million for the nine months ended September 30, 2024, primarily due to the $48.1 million increase in
the operating expenses during the nine months ended September 30, 2025, as discussed under “Rental operations” below. As of
September 30, 2025, 91% of our leases (on an annual rental revenue basis) were triple net leases, which require tenants to pay
substantially all real estate taxes, insurance, utilities, repairs and maintenance, common area expenses, and other operating expenses
(including increases thereto) in addition to base rent. This increase was partially offset by a decrease in Same Properties’ tenant
recoveries resulting from a decrease in Same Properties’ average occupancy to 92.6% for the nine months ended September 30, 2025
from 94.6% for the nine months ended September 30, 2024.
Other income
Other income for the nine months ended September 30, 2025 increased by $14.8 million, or 36.2%, to $55.8 million, compared
to $41.0 million for the nine months ended September 30, 2024. Other income represented approximately 2.5% and 1.8% of total
revenues during each respective period and primarily consisted of interest income and management fee income during both periods.
Rental operations
Total rental operating expenses for the nine months ended September 30, 2025 increased by $21.2 million, or 3.2%, to
$690.1 million, compared to $668.8 million for the nine months ended September 30, 2024. The increase was primarily due to
incremental expenses related to our Same Properties’ rental operating expenses as discussed below, partially offset by the decrease in
Non-Same Properties’ rental operating expenses of $26.8 million primarily as a result of dispositions of real estate assets since January
1, 2024.
Same Properties’ rental operating expenses increased by $48.1 million, or 8.9%, to $587.3 million during the nine months
ended September 30, 2025, compared to $539.3 million for the nine months ended September 30, 2024, primarily as the result of the
increase in (i) utilities expenses and contractual costs aggregating $21.6 million primarily due to higher consumption related to certain
tenants’ increased operations, and higher electricity and HVAC contract services rates in our San Diego market; (ii) property taxes
aggregating $10.0 million primarily due to new developments in the Greater Boston and San Francisco Bay Area markets delivered in
2023, with property taxes based on these properties’ higher assessed values becoming effective subsequent to July 1, 2024, and (iii)
repair and maintenance expenses aggregating $8.3 million primarily due to a more severe winter in 2025 compared to 2024 in the
Greater Boston market.
93
Depreciation and amortization
Depreciation and amortization expense for the nine months ended September 30, 2025 increased by $156.1 million, or 17.9%,
to $1.03 billion, compared to $872.3 million for the nine months ended September 30, 2024, primarily as a result of (i) the change in
useful lives of certain buildings, (ii) 3.2 million RSF of development and redevelopment projects placed into service subsequent to
January 1, 2024, and (iii) three operating properties aggregating 401,560 RSF acquired subsequent to January 1, 2024.
Impairment of real estate
During the nine months ended September 30, 2025, we recognized impairment charges aggregating $485.6 million, classified
in impairment of real estate in our consolidated statement of operations, primarily related to the following assets:
Impairment charge of $206.2 million was recognized to reduce the carrying amount of a non-Megacampus property
aggregating 179,100 RSF in Long Island City, a non-core location within our New York City submarket, to its estimated fair
value less costs to sell of approximately $31.1 million upon meeting the criteria for classification as held for sale. This property
met the held for sale criteria in September 2025, when we committed to dispose of it following our reevaluation of its alignment
with our Megacampus strategy and decided to allocate sales proceeds toward other projects with higher value-creation
opportunities. As of September 30, 2025, the property is 52% occupied. We expect to complete the sale of this property within
the next 12 months.
Impairment charge of $43.4 million was recognized to reduce the carrying amount of a retail shopping center aggregating
249,275 RSF with a future development opportunity aggregating 281,592 SF in our Cambridge/Inner Suburbs submarket of
Greater Boston to its estimated fair value less costs to sell of approximately $96.3 million upon meeting the criteria for
classification as held for sale.This property met the held for sale criteria in September 2025 upon our commitment to dispose
of this asset and allocate sales proceeds toward other projects with higher value-creation opportunities and our obtaining of all
required approvals to sell. In October 2025, we completed the sale of this asset, with no gain or loss recognized upon sale.
Impairment charge of $47.3 million was recognized to reduce the carrying amount of land parcels aggregating 374,349 SF in a
non-cluster/other market to its estimated fair value less costs to sell of approximately $28.9 million upon meeting the criteria for
classification as held for sale. The held for sale criteria were met in June 2025 upon our decision to dispose of this asset. In
September 2025, we completed the sale, with no gain or loss recognized upon sale.
Impairment charge of $42.8 million was recognized to reduce the carrying amount of an office property aggregating 182,276
RSF in Carlsbad, San Diego to its estimated fair value less costs to sell. This property met the criteria for classification as held
for sale in April 2025 upon our commitment to sell, at which time we recognized an impairment of $35.4 million based on
negotiations with a potential buyer at that time. In September 2025, we recognized an additional impairment charge of $7.3
million to adjust the asset’s carrying amount to the currently negotiated reduced sales price less costs to sell of approximately
$61.8 million. We expect to complete this sale within the next 12 months.
Impairment charge of $32.2 million was recognized during the three months ended March 31, 2025 related to a ground lease
entered into in 2021 for a future development opportunity in the San Francisco Bay Area market. Refer to “Lessee operating
costs” in Note 5 – “Leases” to our unaudited consolidated financial statements in Item 1 for additional information.
Impairment charge of $31.8 million was recognized to reduce the carrying amount of one vacant property aggregating 104,531
RSF in the Research Triangle market to its estimated fair value less costs to sell of approximately $1.2 million upon meeting
the criteria for classification as held for sale in September 2025. The held for sale criteria were met upon our decision to sell
this asset, due to its noncontiguous location relative to most other properties on the Alexandria Center® for Sustainable
Technologies Megacampus, and to allocate the sales proceeds, and other capital necessary to lease the property, toward
other projects with greater value-creation opportunities. We expect to complete the sale within the next 12 months.
Impairment charge of $27.8 million was recognized to reduce the carrying amounts of land parcels aggregating 154,308 SF on
a non-Megacampus in our Sorrento Mesa submarket of San Diego to their estimated fair values less costs to sell of
approximately $13.9 million upon meeting the criteria for classification as held for sale in September 2025. These assets met
the criteria for classification as held for sale upon our reevaluation of their alignment with our Megacampus strategy and our
decision to reallocate capital toward our other projects with greater value-creation opportunities. We expect to complete the
sale of these assets within the next 12 months.
Impairment charge of $17.3 million was recognized to reduce the carrying amounts of two operating properties aggregating
210,481 RSF in our Sorrento Mesa submarket of San Diego to their estimated fair values less costs to sell of approximately
$112.3 million, upon meeting the criteria for classification as held for sale. The held for sale criteria were met in June 2025
upon our commitment to dispose of these properties. In August 2025, we completed the sale of one of the properties
aggregating 79,945 RSF for a sales price of $45.0 million, with no gain or loss recognized upon sale. We expect to complete
the sale of the remaining property within the next 12 months.
During the nine months ended September 30, 2024, we recognized real estate impairment charges aggregating $36.5 million,
which primarily consisted of pre-acquisition costs related to two potential acquisitions in the Greater Boston market that we decided to
no longer proceed with as a result of the macroeconomic environment that negatively impacted the financial outlooks of these
acquisitions, and a real estate impairment charge to adjust the carrying amount of one property in Canada that continued to meet the
held-for-sale classification to the sales price under negotiation with a potential buyer less costs to sell.
94
General and administrative expenses
General and administrative expenses for the nine months ended September 30, 2025 decreased by $46.6 million, or 34.4%, to
$89.0 million, compared to $135.6 million for the nine months ended September 30, 2024, primarily due to cost-control and efficiency
initiatives implemented in since 2024, including reduction in headcount, restructuring of compensation plans, systems upgrades, and
process improvements. As a percentage of net operating income, our general and administrative expenses for the trailing twelve
months ended September 30, 2025 and 2024 were 5.7% and 8.9%, respectively.
Interest expense
Interest expense for the nine months ended September 30, 2025 and 2024 consisted of the following (dollars in thousands):
Nine Months Ended September 30,
Component
2025
2024
Change
Gross interest
$409,603
$379,554
$30,049
Capitalized interest
(248,579)
(249,375)
796
Interest expense
$161,024
$130,179
$30,845
Average debt balance outstanding(1)
$13,200,441
$12,417,845
$782,596
Weighted-average annual interest rate(2)
4.1%
4.1%
—%
(1)Represents the average debt balance outstanding during the respective periods.
(2)Represents annualized total interest incurred divided by the average debt balance outstanding during the respective periods.
The net change in interest expense during the nine months ended September 30, 2025, compared to the nine months ended
September 30, 2024, resulted from the following (dollars in thousands):
Component
Interest Rate(1)
Effective Date
Change
Increases in interest incurred due to:
Issuances of debt:
$550 million of unsecured senior notes payable due 2035
5.66%
February 2025
$19,227
$600 million of unsecured senior notes payable due 2054
5.71%
February 2024
4,127
$400 million of unsecured senior notes payable due 2036
5.38%
February 2024
2,576
Higher average outstanding balances under commercial paper program and/
or unsecured senior line of credit
13,197
Other increase in interest
1,476
Total increases
40,603
Decreases in interest incurred due to:
Repayments of debt:
$600 million of unsecured senior notes payable due 2025
3.62%
April 2025
(8,749)
Secured notes payable
7.18%
August 2025
(1,805)
Total decreases
(10,554)
Change in gross interest
30,049
Decrease in capitalized interest
796
Total change in interest expense
$30,845
(1)Represents the weighted-average interest rate as of the end of the applicable period, including amortization of loan fees, amortization of debt premiums (discounts), and
other bank fees.
95
Investment loss
During the nine months ended September 30, 2025, we recognized investment loss aggregating $52.5 million, which consisted
of $94.7 million of realized gains, $71.6 million of unrealized losses, and $75.5 million of impairment charges.
During the nine months ended September 30, 2024, we recognized investment income aggregating $14.9 million, which
consisted of $85.2 million of realized gains, $32.5 million of unrealized losses, and $37.8 million of impairment charges.
For additional information about our investments, refer to Note 7 – “Investments” to our unaudited consolidated financial
statements in Item 1. For our impairments accounting policy, refer to “Investments” in Note 2 – “Summary of significant accounting
policies” to our unaudited consolidated financial statements in Item 1.
Gain on sales of real estate
During the nine months ended September 30, 2025, we recognized $22.5 million of gains classified in gain on sales of real
estate within our consolidated statement of operations. These gains included $12.7 million recognized during the three months ended
March 31, 2025, in connection with one sales-type lease for an operating property in our Seattle market, and $9.3 million recognized
upon the disposition of our controlling interest in a consolidated joint venture that owns Pacific Technology Park in our Sorrento Mesa
submarket. For additional information, refer to Note 5 – “Leases” and Note 4 “Consolidated and unconsolidated real estate joint
ventures,” respectively, to our unaudited consolidated financial statements in Item 1.
During the nine months ended September 30, 2024, we recognized $27.5 million of gains primarily related to the disposition of
1165 Eastlake Avenue East in our Lake Union submarket. The gains were classified in gain on sales of real estate within our
consolidated statement of operations for the nine months ended September 30, 2024.
Other comprehensive income
Other comprehensive income (loss) primarily comprised unrealized foreign currency translation gains or losses related to our
operations in Canada. Total other comprehensive income for the nine months ended September 30, 2025 aggregating $14.0 million
includes $11.1 million of cumulative translation gain related to our operations in Canada, resulting from the CAD’s strengthening against
the USD during this period. The increase also includes $3.0 million of unrealized gains related to the change in the fair value of our
cross-currency swap agreements, resulting from the CAD’s weakening since the execution of these agreements on July 29, 2025
through September 30, 2025. Refer to Note 11 – “Hedge Agreements” to our unaudited consolidated financial statements in Item 1 for
additional information.
Total other comprehensive loss of $6.6 million for the nine months ended September 30, 2024 is primarily due to unrealized
foreign currency translation loss related to our operations in Canada
96
Summary of capital expenditures
Our construction spending for the nine months ended September 30, 2025 and projected spending for the year ending
December 31, 2025 consisted of the following (in thousands):
Nine Months Ended
September 30, 2025
Projected Guidance Midpoint
for Year Ending
December 31, 2025
Construction of Class A/A+ properties:
Active construction projects
Under construction
$
799,723
$
1,240,000
Future pipeline pre-construction
Primarily Megacampus expansion pre-construction work (entitlement,
design, and site work)
365,654
500,000
Revenue- and non-revenue-enhancing capital expenditures
230,867
415,000
(1)
Construction spending (before contributions from noncontrolling interests or
tenants):
1,396,244
2,155,000
Contributions from noncontrolling interests (consolidated real estate joint
ventures)
(156,668)
(230,000)
(2)
Tenant-funded and -built landlord improvements
(171,153)
(175,000)
Total construction spending
$
1,068,423
$
1,750,000
2025 guidance range for construction spending
$1,450,000 – $2,050,000
(1)Represents revenue-enhancing and non-revenue-enhancing capital expenditures before contributions from noncontrolling interests and tenant-funded and tenant-built
landlord improvements for the year ending December 31, 2025. Our share of the 2025 revenue-enhancing and non-revenue-enhancing capital expenditures is projected
to be $320 million at the midpoint of our guidance for 2025 construction spending.
(2)Represents contractual capital commitments from existing consolidated real estate joint venture partners to fund construction.
Projected capital contributions from partners in consolidated real estate joint ventures to fund construction
The following table summarizes projected capital contributions from partners in our existing consolidated joint ventures to fund
construction through 2027 and beyond (in thousands):
Projected timing
Amount(1)
October 1, 2025 through December 31, 2026
$130,980
2027 and beyond
35,925
Total
$166,905
(1)Amounts represent reductions to our consolidated construction spending. 
Average real estate basis used for capitalization of interest
Our construction spending includes capitalized interest. The table below provides key categories of interest capitalized during
the nine months ended September 30, 2025 (in thousands):
Average Real Estate Basis Capitalized
Amount
Percentage
Construction of Class A/A+ properties:
Development and redevelopment of projects under construction and one 100% pre-leased
committed near-term project expected to commence construction in the next year:
2025 and 2026 stabilization
$650,004
8%
2027 and beyond stabilization
2,157,701
26
Smaller redevelopments and repositioning of capital projects
1,128,760
(1)
14
Future pipeline projects with key pre-construction milestones during 4Q25 and 2026:(3)
Megacampus projects
3,032,254
(2)(3)
37
Non-Megacampus projects
1,211,641
(3)
15
Total average real estate basis capitalized(4)
$8,180,360
100%
(1)Includes the real estate basis related to the 617,458 RSF of vacant space as of September 30, 2025 that is leased but not yet delivered. The weighted-average expected
delivery date is approximately May 1, 2026.
(2)Includes four key active and future Megacampus development projects at Alexandria Center® for Advanced Technologies – Tanforan, Alexandria Center® for Life Science
– San Carlos, Campus Point by Alexandria, and Alexandria Center® for Advanced Technologies – South Lake Union, which represent a total average capitalized real
estate basis of approximately $1.2 billion during the nine months ended September 30, 2025.
(3)Includes future pipeline projects that are expected to reach anticipated pre-construction milestones, including various phases of entitlement, design, site work, and other
activities necessary to begin aboveground vertical construction on April 14, 2026 on a weighted-average real estate investment basis. We will evaluate whether to
proceed with additional pre-construction and/or construction activities based on leasing demand and/or market conditions, pause future investments, or consider the
potential dispositions of real estate assets.
(4)In addition to capitalized interest, we incur additional capitalized project costs, including property taxes, insurance, and other costs directly related and essential to the
construction of Class A/A+ properties. If we cease activities necessary to prepare a project for its intended use, costs related to such project are expensed as incurred.
Annualized capitalized operating expenses and payroll represent approximately 2% and 1%, respectively, of the total average real estate basis subject to capitalization
for the nine months ended September 30, 2025.
97
Projected results
We present updated guidance for EPS attributable to Alexandria’s common stockholders – diluted, funds from operations per
share attributable to Alexandria’s common stockholders – diluted, funds from operations per share attributable to Alexandria’s common
stockholders – diluted, as adjusted, key assumptions, and key credit metric targets based on our current view of existing market
conditions and other assumptions for the year ending December 31, 2025, as set forth in the tables below. The tables below also
provide a reconciliation of EPS attributable to Alexandria’s common stockholders – diluted, the most directly comparable financial
measure presented in accordance with GAAP, to funds from operations per share and funds from operations per share, as adjusted,
non-GAAP measures, and other key assumptions included in our updated guidance for the year ending December 31, 2025. There can
be no assurance that actual amounts will not be materially higher or lower than these expectations. Refer to our discussion of “Forward-
looking statements” and “Trends that may affect our future results” included in the beginning of this Item 2.
Key changes to our 2025 guidance include the following:
1)The midpoint of our guidance range for 2025 net (loss) income per share was reduced by $3.44 from $0.50 to $(2.94).  In
addition to the items discussed in item 2 below, the update to our guidance range for 2025 net (loss) income per share
includes the following:
Potential additional impairments of real estate (including impairments on stabilized and non-stabilized properties and land)
that may be recognized during the three months ending December 31, 2025, ranging from $0 to $685 million, related to
assets that could potentially be sold in the fourth quarter of 2025 or 2026, and if such assets meet the held for sale criteria
during the three months ending December 31, 2025, considering market factors, buyer ability to perform, our desire to
proceed with a sale at a particular price, and other factors. As of September 30, 2025, these assets were evaluated under
the held for use model and were determined to be recoverable using a weighted-average probability approach. However,
if any of these assets subsequently meet the criteria to be designated as held for sale, we could recognize impairment
charges to reduce the carrying value of these assets to each asset’s fair value less costs to sell.
Potential additional gain on sales of real estate that may be recognized during the three months ending December 31,
2025, ranging from $0 to $240 million, related to assets that may be sold in the fourth quarter of 2025.
These potential impairments and gains on sales of real estate will not impact our funds from operations per share
pursuant to the Nareit definition of funds from operations.
2)The midpoint of our guidance range for 2025 funds from operations per share – diluted, as adjusted, was reduced by 25 cents,
from $9.26 to $9.01. The primary drivers of the change include the following:
A 1.0% reduction in projected 2025 same property net operating income and a 0.9% reduction in our projected operating
occupancy percentage in North America as of December 31, 2025 (at the midpoints of our guidance ranges), primarily due
to slower than anticipated re-leasing of expiring spaces and lease-up of vacancy in our operating portfolio, reflecting
reduced demand across the life science industry.
A reduction in projected 2025 realized gains on non-real estate investments. The midpoint of our revised guidance range
for 2025 realized gains on non-real estate investments assumes approximately $15 million in the fourth quarter of 2025,
compared to the quarterly average realized gains of approximately $32 million per quarter for the nine months ended
September 30, 2025.
3)Our guidance range for net debt and preferred stock Adjusted EBITDA – fourth quarter of 2025 annualized increased from less
than or equal to 5.2x to a range of 5.5x to 6.0x. The primary drivers of the change include the following:
A $450 million reduction in the midpoint of our guidance range for 2025 dispositions and sales of partial interests. This
includes expected delays in the closing of certain dispositions that are now anticipated to be completed during the first half
of 2026.
A reduction in projected Adjusted EBITDA in the fourth quarter of 2025 related to the changes in same property
performance (net operating income) and realized gains on non-real estate investments as described above.
98
Projected 2025 Earnings per Share and Funds From Operations
per Share Attributable to Alexandria’s Common Stockholders
– Diluted
As of 10/27/25
As of 7/21/25
Key Changes
to Midpoint
Net (loss) income per share(1)
$(5.68) to $(0.20)
$0.40 to $0.60
(2)
Depreciation and amortization of real estate assets
7.05
7.05
Gain on sales of real estate
(0.14) to (1.54)
(0.08)
(2)
Impairment of real estate – rental properties and land(3)
6.69 to 2.67
0.77
(2)
Allocation of unvested restricted stock awards
(0.03)
(0.03)
Funds from operations per share(4)
$7.89 to $7.95
$8.11 to $8.31
Unrealized losses on non-real estate investments
0.42
0.53
Impairment of non-real estate investments
0.45
0.30
Impairment of real estate
0.23
0.23
Allocation to unvested restricted stock awards
(0.01)
(0.01)
Funds from operations per share, as adjusted(4)
$8.98 to $9.04
$9.16 to $9.36
Midpoint
$9.01
$9.26
Reduction of
25 cents(2)
(1)Excludes unrealized gains or losses on non-real estate investments after September 30, 2025 that are required to be recognized in earnings and are excluded from
funds from operations per share, as adjusted.
(2)Refer to the discussion regarding key changes to our 2025 guidance above for additional details.
(3)Refer to Note 3 – “Investments in real estate” to our unaudited consolidated financial statements in Item 1 for additional information.
(4)Refer to “Funds from operations and funds from operations, as adjusted, attributable to Alexandria Real Estate Equities, Inc.’s common stockholders” under “Definitions
and reconciliations” in Item 2 for additional information.
Key Assumptions(1)
(Dollars in millions)
As of 10/27/25
As of 7/21/25
Key Changes
to Midpoint
Low
High
Low
High
Operating occupancy percentage in North America as of
December 31, 2025
90.0%
91.6%
(2)
90.9%
92.5%
90 bps reduction
Lease renewals and re-leasing of space:
Rental rate changes
7.0%
15.0%
(3)
9.0%
17.0%
200 bps reduction(2)
Rental rate changes (cash basis)
0.5%
8.5%
0.5%
8.5%
No change
Same property performance:
Net operating income changes
(4.7)%
(2.7)%
(3.7)%
(1.7)%
100 bps reduction
Net operating income changes (cash basis)
(1.2)%
0.8%
(1.2)%
0.8%
No change
Straight-line rent revenue
$75
$95
$96
$116
$21 million reduction
General and administrative expenses
$112
$127
$112
$127
No Change
Capitalization of interest
$320
$350
$320
$350
Interest expense(4)
$195
$225
$185
$215
$10 million increase(3)
Realized gains on non-real estate investments(5)
$100
$120
$100
$130
$5 million reduction
(1)Our assumptions presented in the table above are subject to a number of variables and uncertainties, including those discussed as “Forward-looking statements” under
Part I; “Item 1A. Risk factors”; and “Item 7. Management’s discussion and analysis of financial condition and results of operations” in our annual report on Form 10-K for
the year ended December 31, 2024, as well as in “Item 1A. Risk factors”; and “Item 2. Trends that may affect our future results” within “Part II – Other information” of this
quarterly report on Form 10-Q. To the extent our full-year earnings guidance is updated during the year, we will provide additional disclosure supporting reasons for any
significant changes to such guidance.
(2)Our guidance assumes an approximate 1% benefit related to a range of assets with vacancy that could potentially qualify for classification as held for sale by
December 31, 2025. These assets have not yet reached the criteria for held for sale designation as of September 30, 2025.
(3)In October 2025, we executed a one-year lease extension aggregating 247,743 RSF with an investment-grade rated government institution tenant at a recently acquired
office property in our Canada market. At acquisition, this building was originally targeted for a future change in use, but we instead renewed the existing tenant through
the beginning of 2027, with no incremental capital investment. We continue to evaluate options to convert this space, subject to market conditions. The impact from this
renewal on our 2025 rental rate changes is anticipated to result in a reduction of approximately 2.0%.
(4)The increase in the midpoint of our guidance range for 2025 interest expense is primarily due to the $450 million reduction to the midpoint of our guidance range for
2025 dispositions and sales of partial interests, which includes expected delays in the closing of certain dispositions that are now anticipated to be completed in the first
half of 2026.
(5)Represents realized gains and losses included in funds from operations per share – diluted, as adjusted, and excludes significant impairments realized on non-real
estate investments, if any. The midpoint of our revised guidance range for 2025 realized gains on non-real estate investments assumes approximately $15 million in the
fourth quarter of 2025, compared to the quarterly average realized gains of approximately $32 million per quarter for the nine months ended September 30, 2025. Refer
to Note 7 – “Investments” to our unaudited consolidated financial statements in Item 1 for additional details.
99
Key Credit Metric Targets(1)
As of 10/27/25
As of 7/21/25
Key Changes
Net debt and preferred stock to Adjusted EBITDA – fourth
quarter of 2025 annualized
5.5x to 6.0x
Less than or equal to 5.2x
0.6x increase(2)
Fixed-charge coverage ratio – fourth quarter of 2025
annualized
3.6x to 4.1x
4.0x to 4.5x
0.4x reduction
(1)Refer to “Definitions and reconciliations” in Item 2 for additional information.
(2)Refer to the discussion regarding key changes to our 2025 guidance above for additional details.
100
Summary of key items that may impact 2026 results
We expect to introduce 2026 guidance on December 3, 2025 at Investor Day. The following is an initial summary of key items
that are expected to impact 2026 results:
Core operations – Slower demand across the life science sector and increased supply for life science real estate could negatively
impact future occupancy. Additional considerations include the following:
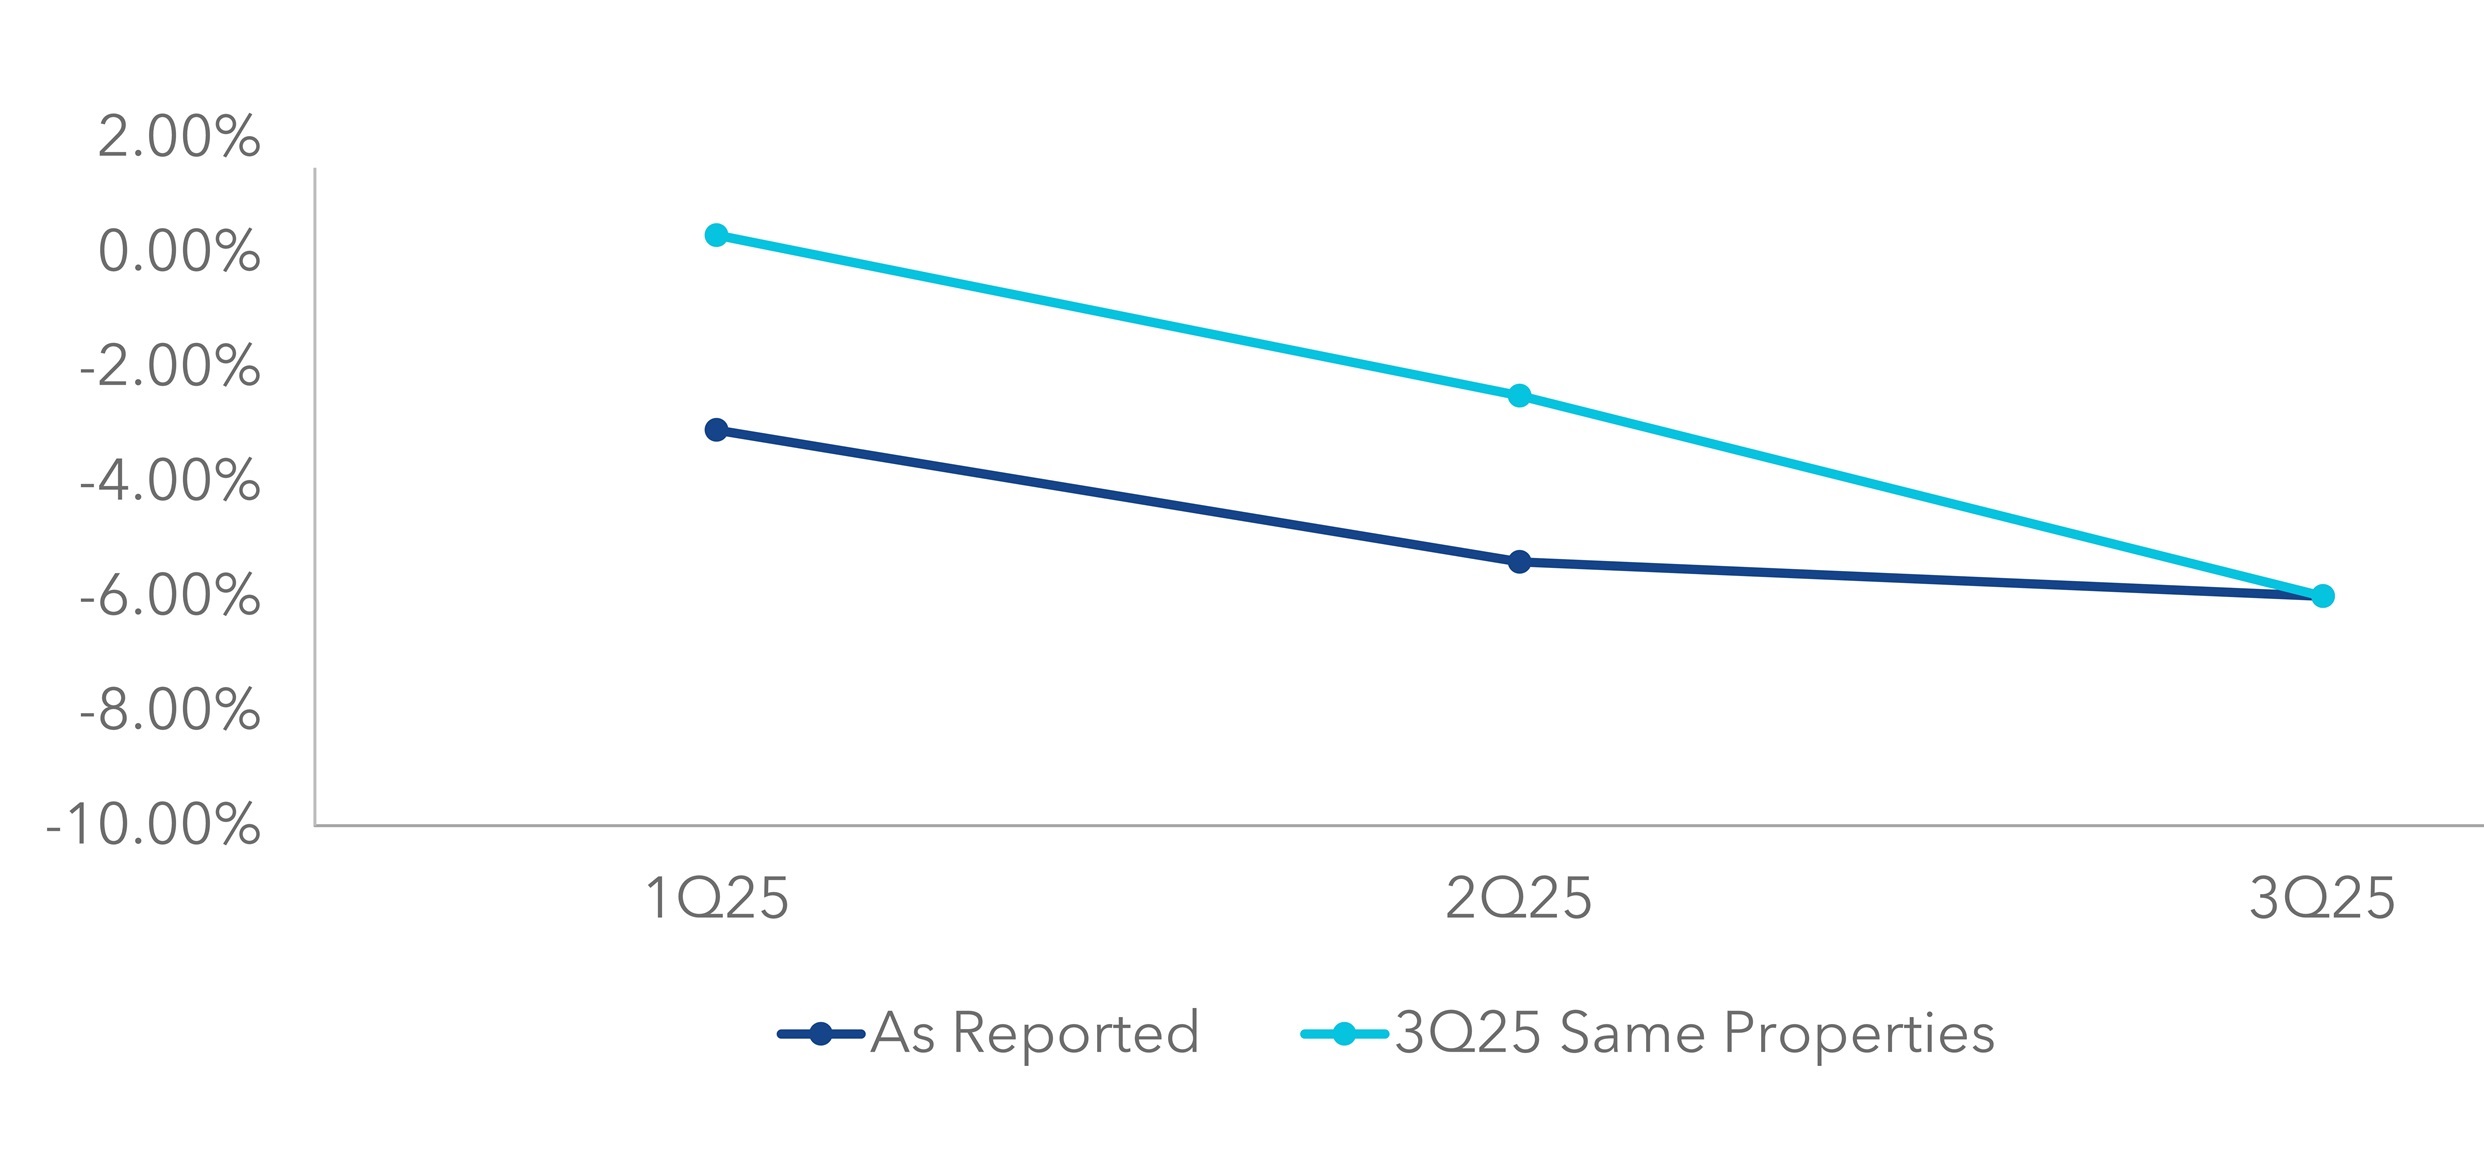
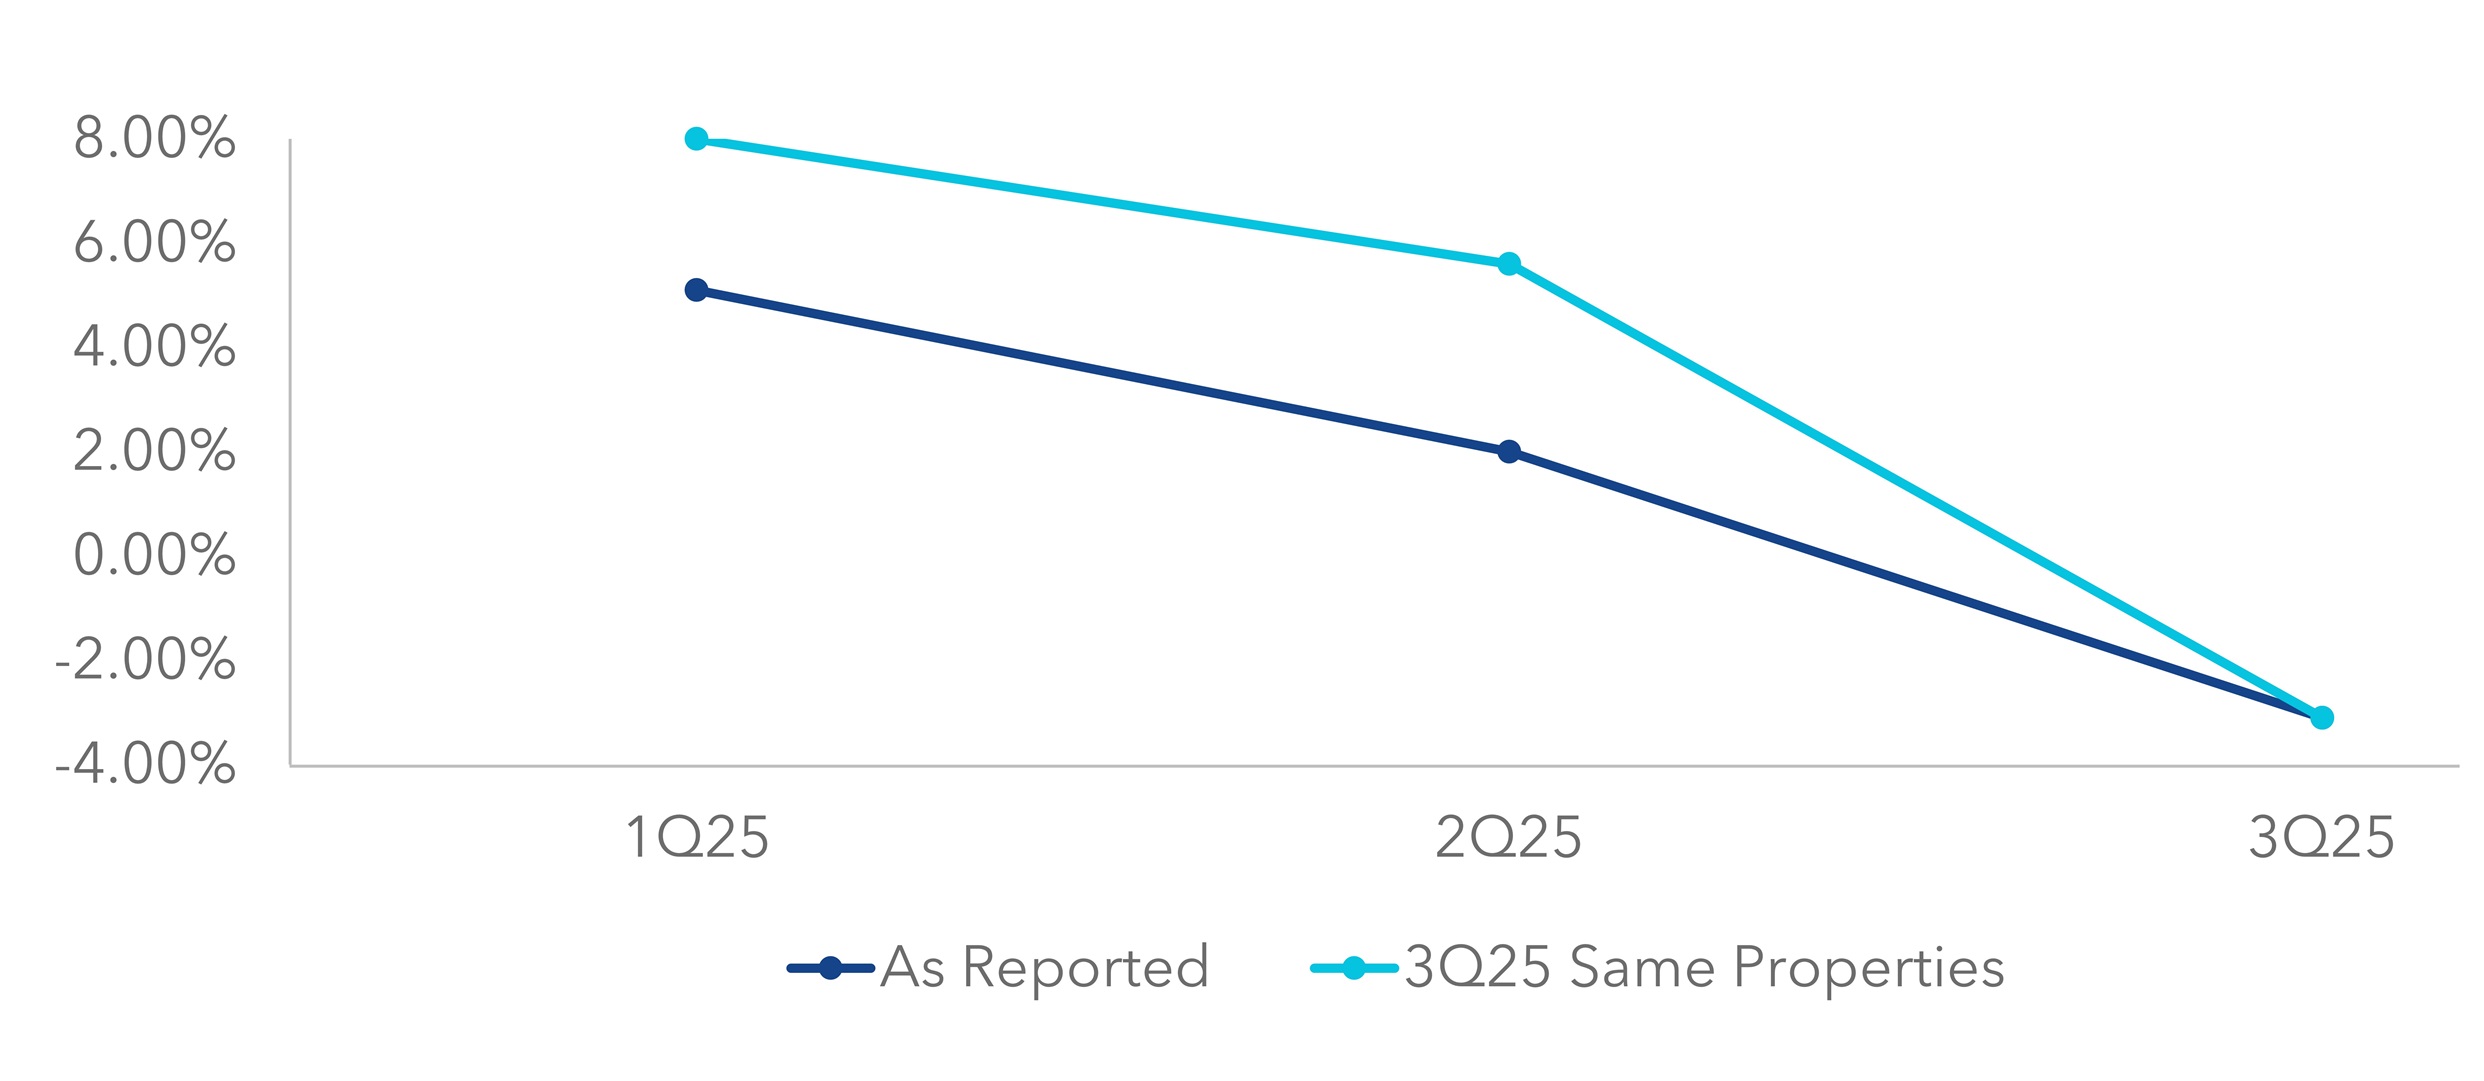
Same property net operating income decrease for the three months ended September 30, 2025 compared to the three months
ended September 30, 2024 of 6.0% reflects a decline relative to the first half of 2025. Refer to “Same properties” in Item 2 for
additional details.
Operating occupancy has decreased four consecutive quarters from 94.7% as of September 30, 2024 to 90.6% as of
September 30, 2025.
Before the benefit of excluding assets designated as held for sale which contained vacancy, occupancy during the three
months ended September 30, 2025 declined 1.1% compared to the three months ended June 30, 2025, primarily related to
lease expirations during the third quarter of 2025. These lease expirations resulting in the 1.1% decline in occupancy
previously generated annual rental revenue aggregating approximately $29.0 million and had a weighted-average lease
expiration date at the end of July 2025. We are currently marketing these spaces.
Our guidance for operating occupancy percentage in North America as of December 31, 2025 assumes an approximate 1%
benefit related to a range of assets with vacancy that could potentially qualify for designation as held for sale by December 31,
2025, but that have not yet qualified as of September 30, 2025. After considering this potential adjustment, the midpoint of our
guidance range for occupancy as of December 31, 2025 implies an 80 bps decline in operating occupancy percentage during
the fourth quarter of 2025.
There are key lease expirations primarily located in the Greater Boston, San Francisco Bay Area, and San Diego markets
aggregating 1.2 million RSF with a weighted-average lease expiration date of March 19, 2026 and annual rental revenue
aggregating $81 million, which are expected to become vacant upon lease expiration. We expect downtime on these spaces
ranging from 6 to 24 months on a weighted-average basis. Refer to “Summary of contractual lease expirations” in Item 2 for
additional details.
Capitalized interest – There is approximately $4.2 billion of average real estate basis capitalized during the nine months ended
September 30, 2025, related to future pipeline projects undergoing critical pre-construction activities, including various phases of
entitlement, design, site work, and other activities necessary to begin aboveground vertical construction. We expect these projects
to reach anticipated pre-construction milestones on April 14, 2026, on a weighted-average real estate investment basis. We will
evaluate, on an asset-by-asset basis, whether to (i) proceed with additional pre-construction and/or construction activities based on
leasing demand and/or market conditions, (ii) pause future investments, or (iii) consider the potential dispositions of these real
estate assets. If we cease activities necessary to prepare a project for its intended use, costs related to such project, including
interest, payroll, property taxes, insurance, and other costs directly related and essential to the construction of Class A/A+
properties, will be expensed as incurred. Refer to “Average real estate basis used for capitalization of interest” in Item 2 for
additional details.
Realized gains on non-real estate investments – The midpoint of our revised guidance range for 2025 realized gains on non-real
estate investments assumes approximately $15 million for the fourth quarter of 2025, compared to the quarterly average realized
gains of approximately $32 million per quarter for the nine months ended September 30, 2025. Refer to “Note 7 – Investments” to
our unaudited consolidated financial statements in Item 1 for additional details. 
General and administrative expenses – Over the past several years, we have implemented comprehensive measures to reduce our
expenditures across our organization, including our general and administrative expenses. These initiatives are expected to
generate a reduction in general and administrative expenses of approximately $49 million, or 29%, during the year ending
December 31, 2025 (at the midpoint of our 2025 guidance range) compared to the year ended December 31, 2024. Given that
some of these costs savings are expected to be temporary in nature, we anticipate approximately half of the cost reductions
expected to be achieved in 2025 will continue in 2026.
Dispositions and equity-type capital
As of October 27, 2025, our share of pending dispositions subject to non-refundable deposits, signed letters of intent, and/or
purchase and sale agreement negotiations aggregated $1.0 billion. We expect these dispositions to close in late fourth quarter
of 2025; therefore, the corresponding reduction in EBITDA is expected to impact the first quarter of 2026. Refer to
“Dispositions and sale of partial interests” in Item 2 for additional details.
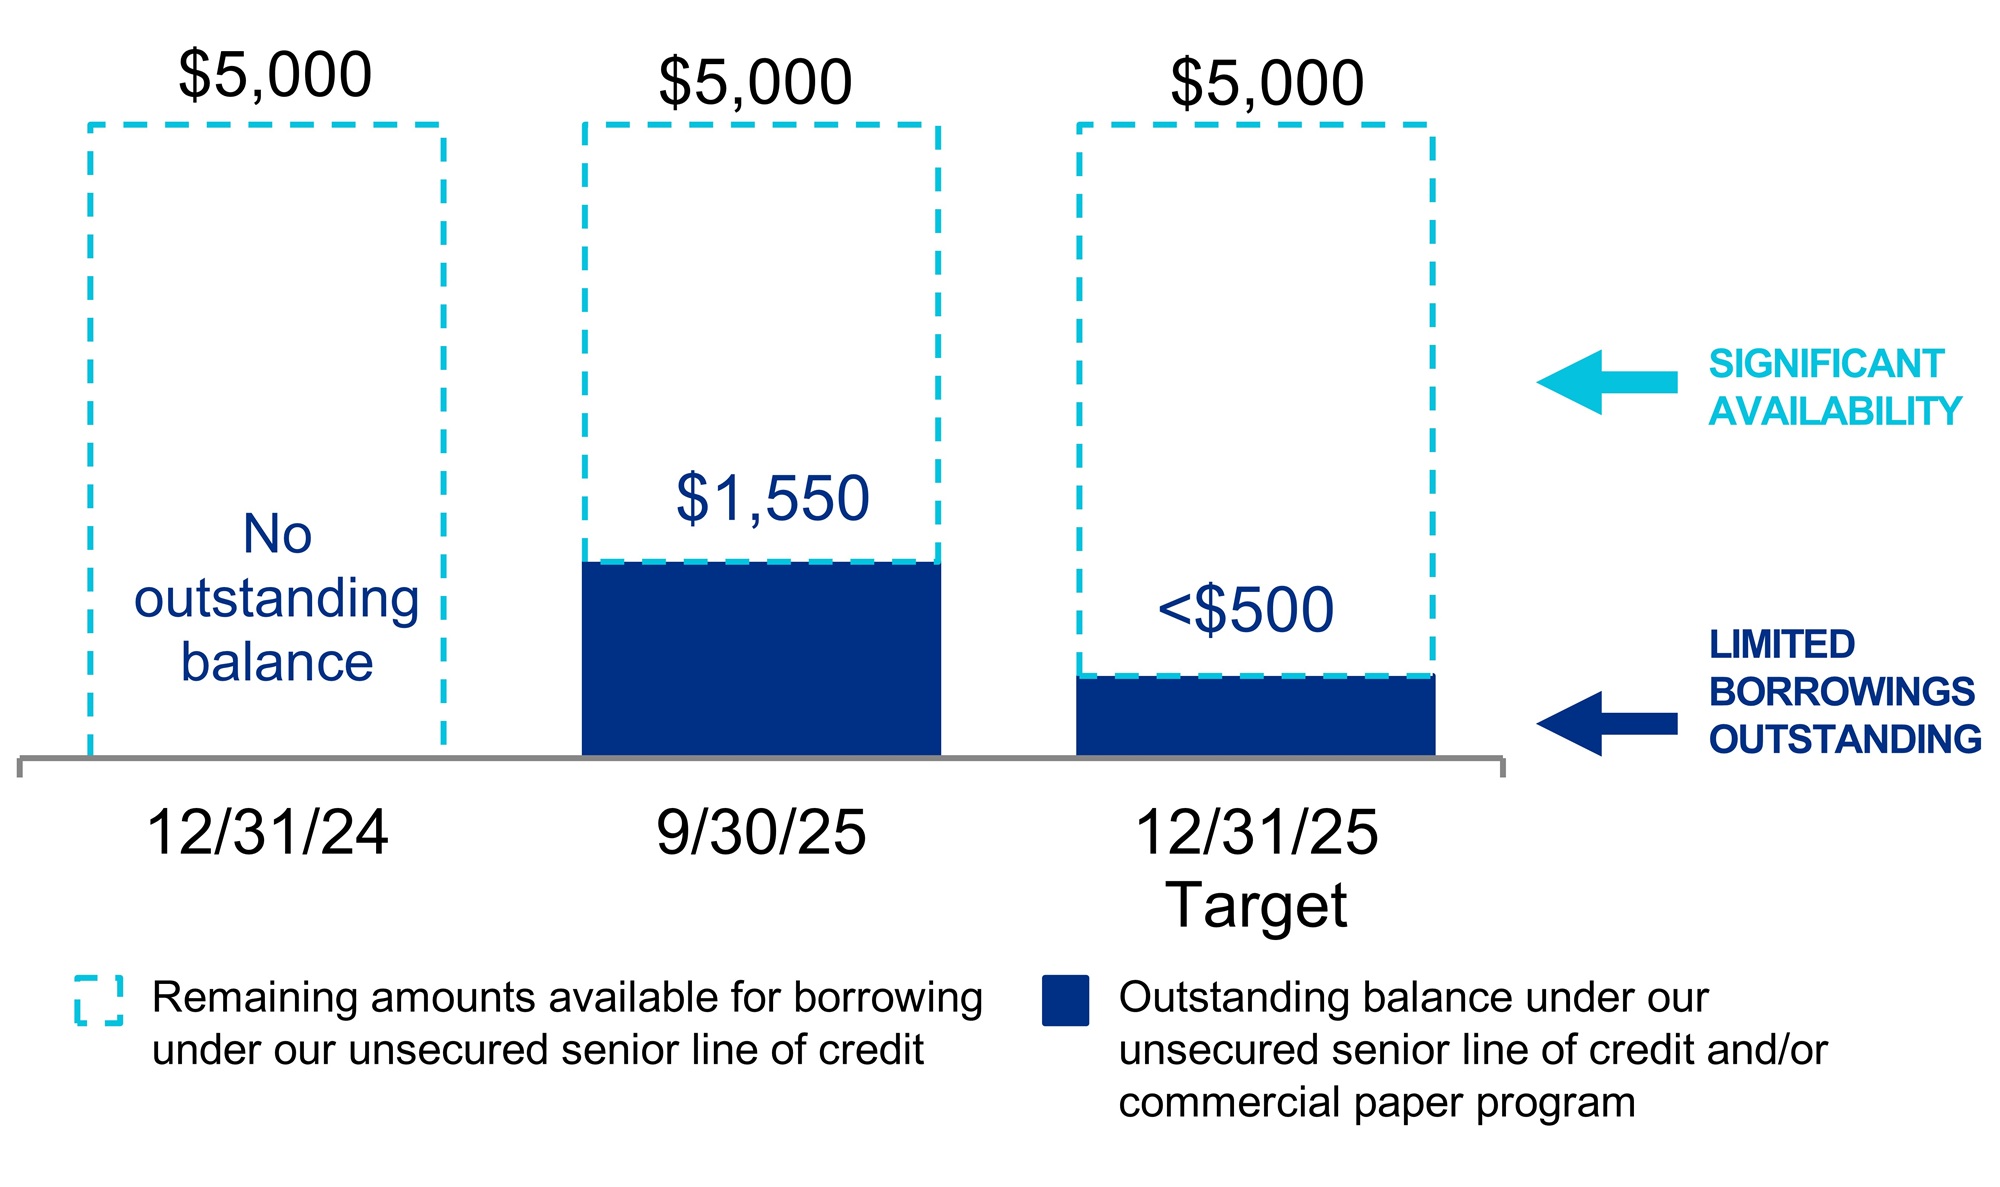
We expect construction spending in 2026 to be similar or slightly higher than the $1.75 billion midpoint of our guidance range
for 2025 construction in order to complete our active construction projects and significant revenue- and non-revenue-
enhancing capital expenditures necessary to lease vacant space. Given the factors previously described that could negatively
impact EBITDA, we may require significant equity-type capital to manage our leverage profile.
We expect a significant source of funding to come from the sale of non-core assets in 2026. We anticipate an end to our large-
scale non-core asset sales program in 2026 or early 2027. As of September 30, 2025, 77% of our annual rental revenue is
from our Megacampus™ platform, and we expect this percentage to continue to grow over time.
Dividends and net cash provided by operating activities after dividends
From 2013 to 2025, dividends per share and funds from operations per share, as adjusted have been highly correlated, with
cumulative increases of 102% and 105%, respectively.
The factors previously described could lead to a reduction in funds from operations per share, as adjusted and net cash
provided by operating activities. At the current dividend rate, the amount of net cash provided by operating activities after
payment of dividends available to recycle and address our 2026 capital needs could be reduced. As a result, we expect our
Board of Directors to carefully evaluate our 2026 dividend strategy.
101
Consolidated and unconsolidated real estate joint ventures
We present components of balance sheet and operating results information for the noncontrolling interest share of our
consolidated real estate joint ventures and for our share of investments in unconsolidated real estate joint ventures to help investors
estimate balance sheet and operating results information related to our partially owned entities. These amounts are estimated by
computing, for each joint venture that we consolidate in our financial statements, the noncontrolling interest percentage of each financial
item to arrive at the cumulative noncontrolling interest share of each component presented. In addition, for our real estate joint ventures
that we do not control and do not consolidate, we apply our economic ownership percentage to the unconsolidated real estate joint
ventures to arrive at our proportionate share of each component presented. Refer to Note 4 – “Consolidated and unconsolidated real
estate joint ventures” to our unaudited consolidated financial statements in Item 1 for further discussion.
Consolidated Real Estate Joint Ventures(1)
Property/Market/Submarket
Noncontrolling
Interest Share
Operating RSF
at 100%
50 and 60 Binney Street/Greater Boston/Cambridge/Inner Suburbs
66.0%
532,395
75/125 Binney Street/Greater Boston/Cambridge/Inner Suburbs
60.0%
388,270
100 and 225 Binney Street and 300 Third Street/Greater Boston/Cambridge/Inner Suburbs
70.0%
870,641
15 Necco Street/Greater Boston/Seaport Innovation District
43.3%
345,996
285, 299, 307, and 345 Dorchester Avenue/Greater Boston/Seaport Innovation District
40.0%
(2)
Alexandria Center® for Science and Technology – Mission Bay/San Francisco Bay Area/
Mission Bay(3)
75.0%
548,215
601, 611, 651(2), 681, 685, and 701 Gateway Boulevard/San Francisco Bay Area/
South San Francisco
50.0%
874,234
751 Gateway Boulevard/San Francisco Bay Area/South San Francisco
49.0%
230,592
211 and 213 East Grand Avenue/San Francisco Bay Area/South San Francisco
70.0%
300,930
500 Forbes Boulevard/San Francisco Bay Area/South San Francisco
90.0%
155,685
Alexandria Center® for Life Science – Millbrae/San Francisco Bay Area/South San Francisco
51.5%
285,346
3215 Merryfield Row/San Diego/Torrey Pines
70.0%
170,523
Campus Point by Alexandria/San Diego/University Town Center(2)(4)
45.0%
(5)
1,212,414
5200 Illumina Way/San Diego/University Town Center
49.0%
792,687
9625 Towne Centre Drive/San Diego/University Town Center
70.0%
163,648
SD Tech by Alexandria/San Diego/Sorrento Mesa(2)(6)
50.0%
829,437
Summers Ridge Science Park/San Diego/Sorrento Mesa(7)
70.0%
316,531
1201 and 1208 Eastlake Avenue East/Seattle/Lake Union
70.0%
206,134
400 Dexter Avenue North/Seattle/Lake Union
70.0%
290,754
800 Mercer Street/Seattle/Lake Union
40.0%
(2)
Unconsolidated Real Estate Joint Ventures
Property/Market/Submarket
Our Ownership
Share(8)
Operating RSF
at 100%
1655 and 1725 Third Street/San Francisco Bay Area/Mission Bay
10.0%
586,208
1450 Research Boulevard/Maryland/Rockville
73.2%
(9)
42,012
101 West Dickman Street/Maryland/Beltsville
58.4%
(9)
142,933
Refer to “Joint venture financial information” under “Definitions and reconciliations” in Item 2 for additional details.
(1)In addition to the real estate joint ventures listed, we have one consolidated real estate joint venture in the Greater Boston market in which a partner holds a $48.7 million
redeemable noncontrolling interest earning a fixed return.
(2)Represents a property currently under construction or in our future development and redevelopment pipeline. Refer to “New Class A/A+ development and redevelopment
properties” in Item 2 for additional details.
(3)Includes 409 and 499 Illinois, 1450, 1500, and 1700 Owens Street, and 455 Mission Bay Boulevard South. Operating RSF excludes 409 and 499 Illinois, which met the
criteria to be designated as held for sale as of September 2025.
(4)Includes 10210, 10260, 10290, and 10300 Campus Point Drive and 4110, 4135, 4155, 4161, 4165, 4224, and 4242 Campus Point Court.
(5)The noncontrolling interest share of our joint venture partner is anticipated to decrease to 25%, as we expect to fund the majority of future construction costs at the
campus until our ownership interest increases from 55% to 75%, after which future capital would be contributed pro rata with our partner. Refer to “New Class A/A+
development and redevelopment properties: current projects” in Item 2 for additional details.
(6)Includes 9605, 9645, 9675, 9725, 9735, 9805, 9808, 9855, and 9868 Scranton Road and 10055, 10065, and 10075 Barnes Canyon Road.
(7)Includes 9965, 9975, 9985, and 9995 Summers Ridge Road.
(8)In addition to the real estate joint ventures listed, we hold an interest in one insignificant unconsolidated real estate joint venture. 
(9)Represents a joint venture with a local real estate operator in which our joint venture partner manages the day-to-day activities that significantly affect the economic
performance of the joint venture.
102
The following table presents key terms related to our unconsolidated real estate joint ventures’ secured loans as of
September 30, 2025 (dollars in thousands):
Maturity Date
Stated Rate
Interest
Rate(1)
At 100%
Our
Share
Unconsolidated Joint Venture
Aggregate
Commitment
Debt Balance(2)
101 West Dickman Street
10/29/26
SOFR+1.95%
(3)
6.20%
$26,750
$18,999
58.4%
1450 Research Boulevard
12/6/26
SOFR+1.95%
(3)
6.26%
13,000
8,932
73.2%
1655 and 1725 Third Street(4)
2/10/35
6.37%
6.44%
500,000
496,794
10.0%
$539,750
$524,725
(1)Includes interest expense and amortization of loan fees.
(2)Represents outstanding principal, net of unamortized deferred financing costs, as of September 30, 2025.
(3)This loan is subject to a fixed SOFR floor of 0.75%.
(4)During the three months ended March 31, 2025, the unconsolidated real estate joint venture refinanced $500 million of its $600 million existing fixed-rate debt with a new
secured note payable maturing in 2035. The remaining debt balance of approximately $100 million was repaid through contributions from the unconsolidated joint
venture partners, including our share of $10.8 million.
The following tables present information related to the operating results and financial positions of our consolidated and
unconsolidated real estate joint ventures as of and for the three and nine months ended September 30, 2025 (in thousands):
Noncontrolling Interest Share of
Consolidated Real Estate Joint Ventures
Our Share of Unconsolidated
Real Estate Joint Ventures
September 30, 2025
September 30, 2025
Three Months Ended
Nine Months Ended
Three Months Ended
Nine Months Ended
Total revenues
$118,646
$353,241
$2,700
$7,963
Rental operations
(38,170)
(108,978)
(1,025)
(3,008)
80,476
244,263
1,675
4,955
General and administrative
(630)
(2,193)
(20)
(101)
Interest
(151)
(905)
(1,060)
(3,118)
Depreciation and amortization of real
estate assets
(45,327)
(114,785)
(852)
(2,848)
Impairment of real estate
(8,673)
Gain on sale of interest of
unconsolidated JV
458
458
Fixed returns allocated to
redeemable noncontrolling
interests(1)
541
943
$34,909
$127,323
$201
$(9,327)
Straight-line rent and below-market
lease revenue
$6,663
$16,857
$172
$506
Funds from operations(2)
$80,236
$242,108
$595
$1,736
Refer to “Joint venture financial information” under “Definitions and reconciliations” in Item 2 for additional details.
(1)Represents an allocation of joint venture earnings to redeemable noncontrolling interests for properties in the Greater Boston and San Francisco Bay Area markets.
These redeemable noncontrolling interests earn a fixed return on their investment rather than participate in the operating results of the properties.
(2)Refer to “Funds from operations and funds from operations, as adjusted, attributable to Alexandria Real Estate Equities, Inc.’s common stockholders” under “Definitions
and reconciliations” in Item 2 for the definition and its reconciliation from the most directly comparable financial measure presented in accordance with GAAP.
As of September 30, 2025
Noncontrolling Interest
Share of Consolidated
Real Estate Joint Ventures
Our Share of
Unconsolidated
Real Estate Joint Ventures
Investments in real estate
$4,103,608
$99,393
Cash, cash equivalents, and restricted cash
160,646
2,341
Other assets
445,479
10,533
Secured notes payable
(67,315)
Other liabilities
(230,757)
(5,351)
Redeemable noncontrolling interests
(58,662)
$4,420,314
$39,601
During the nine months ended September 30, 2025 and 2024, our consolidated real estate joint ventures distributed an
aggregate of $186.8 million and $179.1 million, respectively, to our joint venture partners. Refer to our consolidated statements of cash
flows and Note 4 – “Consolidated and unconsolidated real estate joint ventures” to our unaudited consolidated financial statements in
Item 1 for additional information.
103
Investments
We hold investments in publicly traded companies and privately held entities primarily involved in the life science industry. The
tables below summarize components of our investment income (loss) and non-real estate investments (in thousands). Refer to Note 7 –
“Investments” to our unaudited consolidated financial statements in Item 1 for additional information.
September 30, 2025
Year Ended
December 31, 2024
Three Months Ended
Nine Months Ended
Realized gains
$9,646
(1)
$19,115
(1)
$59,124
(2)
Unrealized gains (losses)
18,515
(3)
(71,568)
(4)
(112,246)
(5)
Investment income (loss)
$28,161
$(52,453)
$(53,122)
September 30, 2025
December 31, 2024
Investments
Cost
Unrealized
Gains
Unrealized
Losses
Carrying
Amount
Carrying
Amount
Publicly traded companies
$197,229
$28,964
$(101,901)
$124,292
$105,667
Entities that report NAV
482,734
98,002
(40,603)
540,133
609,866
Entities that do not report NAV:
Entities with observable price changes
80,454
53,409
(9,614)
124,249
174,737
Entities without observable price changes
422,519
422,519
400,487
Investments accounted for under the equity
method
N/A
N/A
N/A
326,445
186,228
September 30, 2025
$1,182,936
(6)
$180,375
$(152,118)
$1,537,638
$1,476,985
December 31, 2024
$1,207,146
$228,100
$(144,489)
$1,476,985
Public/Private Mix (Cost)
Tenant/Non-Tenant Mix (Cost)
1
13
13%
Public
21%
Tenant
87%
Private
79%
Non-Tenant
(1)Consists of realized gains of $34.8 million and $94.7 million, partially offset by impairment charges of $25.1 million and $75.5 million during the three and nine months
ended September 30, 2025, respectively.
(2)Consists of realized gains of $117.2 million, partially offset by impairment charges aggregating $58.1 million during the year ended December 31, 2024.
(3)Consists of unrealized gains of $51.3 million primarily resulting from the increase in fair values of our investments in publicly traded entities and investments in privately
held entities that report NAV and $32.8 million resulting from accounting reclassifications of unrealized gains recognized in prior periods into realized gains upon our
realization of investments during the three months ended September 30, 2025.
(4)Primarily relates to the accounting reclassifications of unrealized gains recognized in prior periods into realized gains upon our realization of investments during the nine
months ended September 30, 2025.
(5)Primarily relates to the accounting reclassifications of unrealized gains recognized in prior periods into realized gains upon our realization of investments during the year
ended December 31, 2024.
(6)Represents 2.7% of gross assets as of September 30, 2025. Refer to “Gross assets” under “Definitions and reconciliations” in Item 2 for additional details.
104
Liquidity
Liquidity
Limited Outstanding Borrowings and
Significant Availability on
Unsecured Senior Line of Credit
$4.2B
(in millions)
q325lineofcredit v4.jpg
(In millions)
Availability under our unsecured senior line of credit, net of
amounts outstanding under our commercial paper program
$3,450
Cash, cash equivalents, and restricted cash
584
Investments in publicly traded companies
124
Liquidity as of September 30, 2025
$4,158
We expect to meet certain long-term liquidity requirements, such as requirements for development, redevelopment, other
construction projects, capital improvements, tenant improvements, property acquisitions, equity repurchases, leasing costs, non-
revenue-enhancing capital expenditures, scheduled debt maturities, distributions to noncontrolling interests, and payment of dividends
through net cash provided by operating activities, periodic asset dispositions, strategic real estate joint ventures, long-term secured and
unsecured indebtedness, borrowings under our unsecured senior line of credit, issuances under our commercial paper program, and
issuances of additional debt and/or equity securities.
We also expect to continue meeting our short-term liquidity and capital requirements, as further detailed in this section,
generally through our working capital and net cash provided by operating activities. We believe that the net cash provided by operating
activities will continue to be sufficient to enable us to make the distributions necessary to continue qualifying as a REIT.
For additional information on our liquidity requirements related to our contractual obligations and commitments, refer to
Note 5 – “Leases” and Note 10 – “Secured and unsecured senior debt” to our unaudited consolidated financial statements in Item 1.
Over the next several years, our balance sheet, capital structure, and liquidity objectives are as follows:
Retain net cash flows from operating activities after payment of dividends and distributions to noncontrolling interests for
investment in development and redevelopment projects and/or acquisitions;
Maintain significant balance sheet liquidity;
Maintain a strong credit profile and relative long-term cost of capital;
Maintain diverse sources of capital, including sources from net cash provided by operating activities, unsecured debt,
secured debt, selective real estate asset sales, strategic real estate joint ventures, non-real estate investment sales, and
common stock;
Maintain commitment to long-term capital to fund growth;
Maintain prudent laddering of debt maturities;
Maintain solid credit metrics;
Prudently manage variable-rate debt exposure;
Maintain a large, unencumbered asset pool to provide financial flexibility;
Fund common stock dividends and distributions to noncontrolling interests from net cash provided by operating activities;
Manage a disciplined level of development and redevelopment projects as a percentage of our gross real estate assets;
and
Maintain high levels of pre-leasing and percentage leased in development and redevelopment projects.
105
The following table presents the availability under our unsecured senior line of credit, net of amounts outstanding under our
commercial paper program; cash, cash equivalents, and restricted cash; and investments in publicly traded companies as of
September 30, 2025 (in thousands):
Description
Stated Rate
Aggregate
Commitments
Outstanding
Balance
Remaining
Commitments/
Liquidity
Availability under our unsecured senior line of credit, net of
amounts outstanding under our commercial paper program
SOFR+0.855%
$5,000,000
$1,550,000
$3,450,000
Cash, cash equivalents, and restricted cash
584,179
Investments in publicly traded companies
124,292
Liquidity as of September 30, 2025
$4,158,471
Cash, cash equivalents, and restricted cash
As of September 30, 2025 and December 31, 2024, we had $584.2 million and $559.8 million, respectively, of cash, cash
equivalents, and restricted cash. We expect existing cash, cash equivalents, and restricted cash, net cash provided by operating
activities, proceeds from real estate asset sales, sales of partial interests, strategic real estate joint ventures, non-real estate investment
sales, borrowings under our unsecured senior line of credit, issuances under our commercial paper program, issuances of unsecured
senior notes payable, and issuances of common stock to continue to be sufficient to fund our operating activities and cash
commitments for investing and financing activities, such as regular quarterly dividends, distributions to noncontrolling interests,
scheduled debt repayments, acquisitions, and certain capital expenditures, including expenditures related to construction activities and
any common stock repurchases.
Cash flows
We report and analyze our cash flows based on operating activities, investing activities, and financing activities. The following
table summarizes changes in our cash flows for the nine months ended September 30, 2025 and 2024 (in thousands):
Nine Months Ended September 30,
2025
2024
Change
Net cash provided by operating activities
$1,101,668
$1,230,346
$(128,678)
Net cash used in investing activities
$(1,437,538)
$(1,956,959)
$519,421
Net cash provided by financing activities
$360,850
$645,405
$(284,555)
Operating activities
Cash flows provided by operating activities are primarily dependent upon the occupancy level of our asset base, the rental
rates of our leases, the collectibility of rent and recovery of operating expenses from our tenants, the timing of completion of
development and redevelopment projects, and the timing of acquisitions and dispositions of operating properties. Net cash provided by
operating activities for the nine months ended September 30, 2025 decreased by $128.7 million to $1.1 billion, compared to $1.2 billion
for the nine months ended September 30, 2024. The decrease was primarily due to the ground lease prepayment of $135.0 million
made in January 2025 for a 24-year extension to our existing ground lease agreement at the Alexandria Technology Square®
Megacampus in our Cambridge submarket.
106
Investing activities
Cash used in investing activities for the nine months ended September 30, 2025 and 2024 consisted of the following (in
thousands):
 
Nine Months Ended September 30,
Change
 
2025
2024
Sources of cash from investing activities:
Proceeds from sales of real estate
$227,105
$229,790
$(2,685)
Sales of and distributions from non-real estate investments
77,067
141,762
(64,695)
Return of capital from unconsolidated real estate joint ventures
458
458
304,630
371,552
(66,922)
Uses of cash for investing activities:
Purchases of real estate
201,049
(201,049)
Additions to real estate
1,538,613
1,932,351
(393,738)
Change in escrow deposits
7,364
5,512
1,852
Investments in unconsolidated real estate joint ventures
11,239
4,039
7,200
Additions to non-real estate investments
184,952
185,560
(608)
1,742,168
2,328,511
(586,343)
Net cash used in investing activities
$1,437,538
$1,956,959
$(519,421)
The decrease in net cash used in investing activities for the nine months ended September 30, 2025, compared to the nine
months ended September 30, 2024, was primarily due to a decreased use of cash for purchases of and additions to real estate. Refer
to Note 3 – “Investments in real estate” to our unaudited consolidated financial statements in Item 1 for additional information.
Financing activities
Cash flows provided by financing activities for the nine months ended September 30, 2025 and 2024 consisted of the following
(in thousands):
Nine Months Ended September 30,
2025
2024
Change
Borrowings under secured note payable
$4,031
$24,853
$(20,822)
Repayments of borrowings under secured notes payable
(154,212)
(32)
(154,180)
Proceeds from issuance of unsecured senior notes payable
548,532
998,806
(450,274)
Repayment of unsecured senior note payable
(600,000)
(600,000)
Proceeds from issuances under commercial paper program
15,378,015
7,935,600
7,442,415
Repayments of borrowings under commercial paper program
(13,828,015)
(7,580,600)
(6,247,415)
Payments of loan fees
(5,307)
(36,366)
31,059
Changes related to debt
1,343,044
1,342,261
783
Contributions from and sales of noncontrolling interests
132,162
251,252
(119,090)
Distributions to and purchases of noncontrolling interests
(204,543)
(231,072)
26,529
Repurchase of common stock
(208,187)
(208,187)
Dividends on common stock
(684,419)
(671,366)
(13,053)
Taxes paid related to net settlement of equity awards
(17,207)
(45,670)
28,463
Net cash provided by financing activities
$360,850
$645,405
$(284,555)
107
Capital resources
We expect that our principal liquidity needs for the year ending December 31, 2025 will be satisfied by the following multiple
sources of capital, as shown in the table below. There can be no assurance that our sources and uses of capital will not be materially
higher or lower than these expectations.
Key Sources and Uses of Capital
(In millions)
As of 10/27/25
Certain
Completed
Items
As of
7/21/25
Midpoint
Key Changes to
Midpoint
Range
Midpoint
Sources of capital:
Increase in debt
$60
$260
$160
See below
$(290)
$450 million
increase
Net cash provided by operating activities after
dividends
425
525
475
475
Dispositions and sales of partial interests
1,100
1,900
1,500
(1)
1,950
$450 million
decrease
Total sources of capital
$1,585
$2,685
$2,135
$2,135
Uses of capital:
Construction
$1,450
$2,050
$1,750
$1,750
Acquisitions and other opportunistic uses of capital(2)
500
250
$208
(2)
250
Ground lease prepayment
135
135
135
$135
135
Total uses of capital
$1,585
$2,685
$2,135
$2,135
Increase in debt (included above):
Issuance of unsecured senior notes payable
$550
$550
$550
$550
$550
Repayment of unsecured notes payable
(600)
(600)
(600)
$(600)
(600)
Repayment of secured note payable(3)
(154)
(154)
(154)
$(154)
(154)
Unsecured senior line of credit, commercial paper
program, and other
264
464
364
(86)
Increase in debt
$60
$260
$160
$(290)
$450 million
increase
(1)As of the date of this report, completed dispositions aggregated $508.3 million and our share of pending transactions subject to non-refundable deposits, signed letters
of intent, or purchase and sale agreement negotiations aggregated $1.0 billion. We expect to achieve a weighted-average capitalization rate on our projected 2025
dispositions and partial interest sales (excluding land and including stabilized and non-stabilized operating properties) in the 7.5%8.5% range. We expect dispositions
of land to represent 20%30% of our total dispositions and sales of partial interest sales for the year ending December 31, 2025. Refer to “Dispositions and sales of
partial interests” in Item 2 for additional information on our real estate dispositions.
(2)Under our common stock repurchase program authorized in December 2024, we may repurchase up to $500.0 million of our common stock through December 31,
2025. During the three months ended September 30, 2025, we did not repurchase any shares of common stock. As of the date of this report, the approximate value of
shares authorized and remaining under this program was $241.8 million. Subject to market conditions, we may consider repurchasing additional shares of our common
stock.
(3)In August 2025, we repaid a secured construction loan held by our development project at 99 Coolidge Avenue in our Cambridge/Inner Suburbs submarket. Refer to
Note 10 – “Secured and unsecured senior debt” to our unaudited consolidated financial statements in Item 1 for additional information.
The key assumptions behind the sources and uses of capital in the table above include favorable real estate transaction and
capital market environments, performance of our core operating properties, lease-up and delivery of current and future development
and redevelopment projects, and leasing activity. Our expected sources and uses of capital are subject to a number of variables and
uncertainties, including those discussed as “Forward-looking statements” under Part I; “Item 1A. Risk factors”; and “Item 7.
Management’s discussion and analysis of financial condition and results of operations” in our annual report on Form 10-K for the year
ended December 31, 2024; as well as in “Item 1A. Risk factors”; and “Item 2. Trends that may affect our future results” within “Part II –
Other information” of this quarterly report on Form 10-Q. We expect to update our forecast for key sources and uses of capital on a
quarterly basis.
108
Sources of capital
Net cash provided by operating activities after dividends
We expect to retain $425 million to $525 million of net cash flows from operating activities after payment of common stock
dividends, and distributions to noncontrolling interests for the year ending December 31, 2025, excluding the payment of our final
installment of $135.0 million made in January 2025 for the ground lease at the Alexandria Technology Square® Megacampus. For
purposes of this calculation, changes in operating assets and liabilities representing timing differences are excluded. For the year
ending December 31, 2025, we expect our recently delivered projects, our development and redevelopment projects expected to be
delivered, and contributions from Same Properties to contribute to income from rentals, net operating income, and cash flows. We
anticipate contractual near-term growth in annual net operating income (cash basis) of $50 million related to the commencement of
contractual rents on the projects recently placed into service that are near the end of their initial free rent period. Refer to “Cash flows
in Item 2 for a discussion of cash flows provided by operating activities for the nine months ended September 30, 2025.
Debt
We expect to fund a portion of our capital needs for 2025 from issuances under our commercial paper program, issuances of
unsecured senior notes payable, and/or borrowings under our unsecured senior line of credit.
As of September 30, 2025, our unsecured senior line of credit, which matures in 2030, including extension options under our
control, had aggregate commitments of $5.0 billion and bore an interest rate of SOFR plus 0.855%. In addition to the cost of borrowing,
the unsecured senior line of credit is subject to an annual facility fee of 0.145% based on the aggregate commitments outstanding.
Based upon our ability to achieve certain annual sustainability targets, the interest rate and facility fee rate are also subject to upward or
downward adjustments of up to four basis points with respect to the interest rate and up to one basis point with respect to the facility fee
rate.
Based on certain sustainability metrics achieved in accordance with the terms of our unsecured senior line of credit
agreement, the borrowing rate was reduced by two basis points to SOFR plus 0.855%, from SOFR plus 0.875%, and the facility fee
was reduced by 0.5 basis point to 0.145% from 0.15%. As of September 30, 2025, we had no outstanding balance on our unsecured
line of credit.
Our commercial paper program provides us with the ability to issue up to $2.5 billion of commercial paper notes with a maturity
of generally 30 days or less and with a maximum maturity of 397 days from the date of issuance. Our commercial paper program is
backed by our unsecured senior line of credit, and at all times we expect to retain a minimum undrawn amount of borrowing capacity
under our unsecured senior line of credit equal to any outstanding balance under our commercial paper program. We use borrowings
under the program to fund short-term capital needs. The notes issued under our commercial paper program are sold under customary
terms in the commercial paper market. They are typically issued at a discount to par, representing a yield to maturity dictated by market
conditions at the time of issuance. In the event we are unable to issue commercial paper notes or refinance outstanding commercial
paper notes under terms equal to or more favorable than those under the unsecured senior line of credit, we expect to borrow under the
unsecured senior line of credit. The commercial paper notes sold during the nine months ended September 30, 2025 were issued at a
weighted-average yield to maturity of 4.64%. As of September 30, 2025, we had $1.5 billion of commercial paper notes outstanding.
In February 2025, we issued $550.0 million of unsecured senior notes payable, due 2035, with an interest rate of 5.50%.
The following table presents our average debt outstanding and weighted-average interest rates during the three and nine
months ended September 30, 2025 (dollars in thousands):
Average Debt Outstanding
Weighted-Average Interest Rate
September 30, 2025
September 30, 2025
Three Months Ended
Nine Months Ended
Three Months Ended
Nine Months Ended
Long-term fixed-rate debt
$12,121,219
$12,290,203
3.88%
3.86%
Short-term variable-rate unsecured
senior line of credit and commercial
paper program debt
1,503,453
935,353
4.64
4.64
Blended average interest rate
13,624,672
13,225,556
3.96
3.92
Loan fee amortization and annual facility
fee related to unsecured senior line of
credit
N/A
N/A
0.14
0.13
Total/weighted average
$13,624,672
$13,225,556
4.10%
4.05%
109
Real estate dispositions and sales of partial interests
We expect to continue to focus on the disciplined execution of select sales of real estate. Future sales will provide an important
source of capital to fund our development and redevelopment projects and opportunistic share repurchases and also provide significant
capital for growth. We may also consider additional sales of partial interests in core Class A/A+ properties, development projects, and/or
land. For the year ending December 31, 2025, we expect real estate dispositions and sales of partial interests in real estate assets to
range from $1.10 billion to $1.90 billion. The amount of asset sales necessary to meet our forecasted sources of capital will vary
depending upon the amount of EBITDA associated with the assets sold.
Refer to Note 3 – “Investments in real estate,” Note 4 – “Consolidated and unconsolidated real estate joint ventures,” and
Note 14 – “Stockholders’ equity” to our unaudited consolidated financial statements in Item 1 and to “Dispositions and sales of partial
interests” in Item 2 for additional information on our real estate dispositions.
As a REIT, we are generally subject to a 100% tax on the net income from real estate asset sales that the IRS characterizes as
“prohibited transactions.” We do not expect our sales will be categorized as prohibited transactions. However, unless we meet certain
“safe harbor” requirements, whether a real estate asset sale is a “prohibited transaction” will be based on the facts and circumstances
of the sale. Our real estate asset sales may not always meet such “safe harbor” requirements. Refer to “Item 1A. Risk factors” in our
annual report on Form 10-K for the year ended December 31, 2024 for additional information about the “prohibited transaction” tax.
Common equity transactions
During the three and nine months ended September 30, 2025, we have not issued any common stock under our ATM
program. As of September 30, 2025, the remaining aggregate amount available under our ATM program for future sales of common
stock was $1.47 billion.
Other sources
As a well-known seasoned issuer, we may, from time to time, issue securities at our discretion based on our needs and market
conditions, including, as necessary, to balance our use of incremental debt capital.
Additionally, we, together with joint venture partners, hold interests in real estate joint ventures that we consolidate in our
financial statements. These existing joint ventures provide significant equity capital to fund a portion of our future construction spending,
and our joint venture partners may also contribute equity into these entities for financing-related activities. From October 1, 2025
through December 31, 2027 and beyond, we expect to receive capital contributions aggregating $166.9 million from existing
consolidated real estate joint venture partners to fund construction. During the year ending December 31, 2025, contributions from
noncontrolling interests from existing joint venture partners are expected to aggregate to up to $230.0 million at the midpoint of our
guidance range for 2025 construction spending.
110
Uses of capital
Summary of capital expenditures
One of our primary uses of capital relates to the development, redevelopment, pre-construction, and construction of properties.
We currently have projects in our development and redevelopment pipeline aggregating 4.2 million RSF of Class A/A+ properties
undergoing construction and one 100% pre-leased committed near-term project expected to commence construction in the next year.
We incur capitalized construction costs related to development, redevelopment, pre-construction, and other construction activities. We
also incur additional capitalized project costs, including interest, property taxes, insurance, and other costs directly related and essential
to the development, redevelopment, pre-construction, or construction of a project, during periods when activities necessary to prepare
an asset for its intended use are in progress. Refer to “New Class A/A+ development and redevelopment properties: current projects”
and “Summary of capital expenditures” in Item 2 for additional information on our capital expenditures.
We capitalize interest cost as a cost of the project only during the period in which activities necessary to prepare an asset for
its intended use are ongoing, provided that expenditures for the asset have been made and interest cost has been incurred. Capitalized
interest, classified in investments in real estate in our consolidated balance sheets, aggregated $248.6 million for the nine months
ended September 30, 2025, consistent with $249.4 million capitalized during nine months ended September 30, 2024. This reflects a
consistent weighted-average capitalized cost basis of $8.2 billion for the nine months ended September 30, 2025, as compared to
$8.1 billion for the nine months ended September 30, 2024
Property taxes, insurance on real estate, and indirect project costs, such as construction, administration, legal fees, and office
costs that clearly relate to projects under development or construction, are capitalized as incurred during the period an asset is
undergoing activities to prepare it for its intended use. We capitalized payroll and other indirect costs related to development,
redevelopment, pre-construction, and construction projects aggregating $69.6 million and $76.8 million, and property taxes, insurance
on real estate, and indirect project costs aggregating $111.7 million and $96.5 million during the nine months ended
September 30, 2025 and 2024, respectively.
Pre-construction activities include entitlements, permitting, design, site work, and other activities preceding commencement of
construction of aboveground building improvements. The advancement of pre-construction efforts is focused on reducing the time
required to deliver projects to prospective tenants. These critical activities add significant value for future ground-up development and
are required for the vertical construction of buildings. Should we cease activities necessary to prepare an asset for its intended use, the
interest, taxes, insurance, and certain other direct and indirect project costs related to the asset would be expensed as incurred.
Expenditures for repairs and maintenance are expensed as incurred.
Fluctuations in our development, redevelopment, and construction activities could result in significant changes to total
expenses and net income. For example, had we experienced a 10% reduction in development, redevelopment, and construction
activities without a corresponding decrease in indirect project costs, including interest and payroll, total expenses would have increased
by approximately $43.0 million for the nine months ended September 30, 2025.
We use third-party brokers to assist in our leasing activity, who are paid on a contingent basis upon successful leasing. We are
required to capitalize initial direct costs related to successful leasing transactions that result directly from and are essential to the lease
transaction and would not have been incurred had that lease transaction not been successfully executed. During the nine months
ended September 30, 2025, we capitalized total initial direct leasing costs of $95.7 million. Costs that we incur to negotiate or arrange a
lease regardless of its outcome, such as fixed employee compensation, tax, or legal advice to negotiate lease terms, and other costs,
are expensed as incurred.
Real estate acquisitions and common stock repurchase program
Under our common stock repurchase program authorized in December 2024, we may repurchase up to $500.0 million of our
common stock in the open market, in privately negotiated transactions, or otherwise through December 31, 2025.
During the three months ended September 30, 2025, we did not repurchase any shares of common stock.
During the nine months ended September 30, 2025, we repurchased 2.2 million shares of common stock for an aggregate
value of $208 million at an average price per share of $96.71.
As of the date of this report, the approximate value of shares authorized and remaining under this program was $241.8
million.
We have not made any real estate acquisitions during the nine months ended September 30, 2025.
For the year ending December 31, 2025, we expect real estate acquisitions and other opportunistic uses of capital, including
common stock repurchases, to aggregate up to $500 million.
111
Dividends
During the nine months ended September 30, 2025 and 2024, we paid common stock dividends of $684.4 million and
$671.4 million, respectively. The increase of $13.1 million in dividends paid on our common stock for the nine months ended
September 30, 2025, compared to the nine months ended September 30, 2024, was primarily due to an increase in the related
dividends to $3.96 per common share paid for the nine months ended September 30, 2025 from $3.84 per common share paid for the
nine months ended September 30, 2024. We have historically funded the payment of our common stock dividends using net cash
provided by operating activities. We expect to continue funding future quarterly common stock dividends from net cash provided by
operating activities, which may be supplemented by proceeds from periodic asset dispositions, issuances of additional debt and/or
equity securities, and borrowings under our unsecured senior line of credit and/or our commercial paper program. Future dividends are
at the discretion of our Board and subject to various considerations, including net income, cash flows, capital requirements, debt
covenants, market conditions, dividend yield, taxable income, payout ratios, and other factors. There can be no assurance that we will
continue our historical dividend per share growth or maintain dividends at the current level.
Unsecured senior notes payable and unsecured senior line of credit
The requirements of, and our actual performance with respect to, the key financial covenants under our unsecured senior
notes payable as of September 30, 2025 were as follows:
Covenant Ratios(1)
Requirement
September 30, 2025
Total Debt to Total Assets
Less than or equal to 60%
32%
Secured Debt to Total Assets
Less than or equal to 40%
—%
Consolidated EBITDA(2) to Interest Expense
Greater than or equal to 1.5x
9.8x
Unencumbered Total Asset Value to Unsecured Debt
Greater than or equal to 150%
302%
(1)All covenant ratio titles utilize terms as defined in the respective debt agreements.
(2)The calculation of consolidated EBITDA is based on the definitions contained in our loan agreements and is not directly comparable to the computation of EBITDA as
described in Exchange Act Release No. 47226.
In addition, the terms of the indentures, among other things, limit the ability of the Company, Alexandria Real Estate Equities,
L.P., and the Company’s subsidiaries to (i) consummate a merger, or consolidate, or sell all or substantially all of the Company’s assets
and (ii) incur certain secured or unsecured indebtedness.
The requirements of, and our actual performance with respect to, the key financial covenants under our unsecured senior line
of credit as of September 30, 2025 were as follows:
Covenant Ratios(1)
Requirement
September 30, 2025
Leverage Ratio
Less than or equal to 60.0%
33.6%
Secured Debt Ratio
Less than or equal to 45.0%
—%
Fixed-Charge Coverage Ratio
Greater than or equal to 1.50x
3.58x
Unsecured Interest Coverage Ratio
Greater than or equal to 1.75x
8.54x
(1)All covenant ratio titles utilize terms as defined in the credit agreement.
Estimated interest payments
Estimated interest payments on our fixed-rate debt are calculated based upon contractual interest rates, including interest
payment dates and scheduled maturity dates. As of September 30, 2025, 88.6% of our debt was fixed-rate debt. For additional
information regarding our debt, refer to Note 10 – “Secured and unsecured senior debt” to our unaudited consolidated financial
statements in Item 1.
112
Ground lease obligations
Ground lease obligations as of September 30, 2025 included leases for 31 of our properties and accounted for approximately
8% of our total number of properties. Among these 31 properties, 17 properties are subject to ground leases with a weighted-average
remaining lease term of 40 years, including extension options that we are reasonably certain to exercise. These leases are with a single
lessor in our Greater Stanford submarket with whom we have extended three ground leases over the past 10 years.
Our remaining 14 properties subject to ground leases are located across multiple submarkets and have remaining lease terms
ranging from approximately 45 to 81 years. The weighted-average remaining lease term of these ground leases is 73 years, including
extension options that we are reasonably certain to exercise.
In many cases, we seek to extend our ground leases well ahead of their scheduled contractual expirations. If we are
successful in extending ground leases, we could see significant up-front or increased recurring future payments to the ground lessor
and/or increased ground lease expense, which may require us to increase our capital funding needs.
Operating lease agreements
As of September 30, 2025, the remaining contractual payments under ground and office lease agreements in which we are the
lessee aggregated $757.9 million and $20.9 million, respectively. As of September 30, 2025, our operating lease liability, calculated as
the present value of the remaining payments aggregating $778.8 million under our operating lease agreements, including our extension
options that we are reasonably certain to exercise, was $362.0 million and was classified in accounts payable, accrued expenses, and
other liabilities in our consolidated balance sheet. As of September 30, 2025, the weighted-average remaining lease term of operating
leases in which we are the lessee was approximately 54 years, including extension options that we are reasonably certain to exercise,
and the weighted-average discount rate was 4.7%. Our corresponding operating lease right-of-use assets, adjusted for initial direct
leasing costs and other consideration exchanged with the landlord prior to the commencement of the lease, aggregated $713.4 million.
We classify the right-of-use asset in other assets in our consolidated balance sheets. Refer to “Lease accounting” in Note 2 –
“Summary of significant accounting policies” to our unaudited consolidated financial statements in Item 1 for additional information.
Commitments
As of September 30, 2025, remaining aggregate costs under contract for the construction of properties undergoing
development, redevelopment, and improvements under the terms of leases approximated $1.1 billion. We expect payments for these
obligations to occur over one to three years, subject to capital planning adjustments from time to time. We may have the ability to cease
the construction of certain projects, which would result in the reduction of our commitments. In addition, we have letters of credit and
performance obligations aggregating $5.3 million.
We are committed to funding approximately $377.0 million related to our non-real estate investments. These funding
commitments are primarily associated with our investments in privately held entities that report NAV and expire at various dates over
the next 11 years, with a weighted-average expiration of 7.9 years as of September 30, 2025. 
Our former joint venture partner in the Greater Boston market has an option, subject to certain conditions, to obtain a
$50 million secured loan from us, which, if the option is exercised, will bear interest at SOFR plus 6.5%, with a floor of 9.0% and a term
not to exceed five years. As of September 30, 2025, the option has not been exercised.
In July 2025, we amended the agreement for our consolidated joint venture at 99 Coolidge Avenue in our Cambridge/Inner
Suburbs submarket. Pursuant to the amended agreement, our partner has a put option beginning January 2026 to require us to
purchase its redeemable noncontrolling interest aggregating $48.7 million plus any unpaid distributions accruing at a fixed annual rate
of 4.05%.
Exposure to environmental liabilities
In connection with the acquisition of all of our properties, we have obtained Phase I environmental assessments to ascertain
the existence of any environmental liabilities or other issues. The Phase I environmental assessments of our properties have not
revealed any environmental liabilities that we believe would have a material adverse effect on our financial condition or results of
operations taken as a whole, nor are we aware of any material environmental liabilities that have occurred since the Phase I
environmental assessments were completed. In addition, we carry a policy of pollution legal liability insurance covering exposure to
certain environmental losses at substantially all of our properties.
113
Foreign currency translation gains and losses
The following table presents the change in accumulated other comprehensive loss attributable to Alexandria Real Estate
Equities, Inc.’s stockholders during the nine months ended September 30, 2025 primarily due to the changes in the foreign exchange
rates for our real estate investments in Canada (in thousands). We reclassify unrealized foreign currency translation gains and losses
into net income as we dispose of these holdings.
Total
Balance as of December 31, 2024
$(46,252)
Other comprehensive income before reclassifications
14,049
Net other comprehensive income
14,049
Balance as of September 30, 2025
$(32,203)
Inflation
As of September 30, 2025, approximately 91% of our leases (on an annual rental revenue basis) were triple net leases, which
require tenants to pay substantially all real estate taxes, insurance, utilities, repairs and maintenance, common area expenses, and
other operating expenses (including increases thereto) in addition to base rent. Approximately 97% of our leases (on an annual rental
revenue basis) contained effective annual rent escalations approximating 3% that were either fixed or indexed based on a consumer
price index or other indices. Accordingly, we do not believe that our cash flows or earnings from real estate operations are subject to
significant risks from inflation. A period of inflation, however, could cause an increase in the cost of issuing new unsecured senior notes
payable and our variable-rate borrowings, including borrowings under our unsecured senior line of credit and commercial paper
program, and secured loans held by our unconsolidated real estate joint ventures.
114
Issuer and guarantor subsidiary summarized financial information
Alexandria Real Estate Equities, Inc. (the “Issuer”) has sold certain debt securities registered under the Securities Act of 1933,
as amended, that are fully and unconditionally guaranteed by Alexandria Real Estate Equities, L.P. (the “LP” or the “Guarantor
Subsidiary”), an indirectly 100% owned subsidiary of the Issuer. The Issuer’s other subsidiaries, including, but not limited to, the
subsidiaries that own substantially all of its real estate (collectively, the “Combined Non-Guarantor Subsidiaries”), will not provide a
guarantee of such securities, including the subsidiaries that are partially or 100% owned by the LP. The following summarized financial
information presents, on a combined basis, balance sheet information as of September 30, 2025 and December 31, 2024, and results
of operations and comprehensive income for the nine months ended September 30, 2025 and year ended December 31, 2024 for the
Issuer and the Guarantor Subsidiary. The information presented below excludes eliminations necessary to arrive at the information on a
consolidated basis. In presenting the summarized financial statements, the equity method of accounting has been applied to (i) the
Issuer’s interests in the Guarantor Subsidiary, (ii) the Guarantor Subsidiary’s interests in the Combined Non-Guarantor Subsidiaries,
and (iii) the Combined Non-Guarantor Subsidiaries’ interests in the Guarantor Subsidiary, where applicable, even though all such
subsidiaries meet the requirements to be consolidated under GAAP. All assets and liabilities have been allocated to the Issuer and the
Guarantor Subsidiary generally based on legal entity ownership.
The following tables present combined summarized financial information as of September 30, 2025 and December 31, 2024
and for the nine months ended September 30, 2025 and year ended December 31, 2024 for the Issuer and Guarantor Subsidiary.
Amounts provided do not represent our total consolidated amounts (in thousands):
September 30, 2025
December 31, 2024
Assets:
Cash, cash equivalents, and restricted cash
$139,186
$103,993
Other assets
180,796
153,913
Total assets
$319,982
$257,906
Liabilities:
Unsecured senior notes payable
$12,044,999
$12,094,465
Unsecured senior line of credit and commercial paper
1,548,542
Other liabilities
540,406
542,322
Total liabilities
$14,133,947
$12,636,787
Nine Months Ended
September 30, 2025
Year Ended
December 31, 2024
Total revenues
$34,489
$59,023
Total expenses
(248,954)
(349,437)
Net loss
(214,465)
(290,414)
Net income attributable to unvested restricted stock awards
(7,452)
(13,394)
Net loss attributable to Alexandria Real Estate Equities, Inc.’s common stockholders
$(221,917)
$(303,808)
As of September 30, 2025, 359 of our 375 properties were held indirectly by the REIT’s wholly owned consolidated subsidiary,
Alexandria Real Estate Equities, L.P.
Critical accounting estimates
Refer to our annual report on Form 10-K for the year ended December 31, 2024 for a discussion of our critical accounting
estimates related to recognition of real estate acquired, impairment of long-lived assets, impairment of non-real estate investments, and
monitoring of tenant credit quality.
115
Definitions and reconciliations
This section contains additional information on certain non-GAAP financial measures, including reconciliations from the most
directly comparable financial measure calculated and presented in accordance with GAAP and the reasons why we use these
supplemental measures of performance and believe they provide useful information to investors, as well as the definitions of other
terms used in this report.
Funds from operations and funds from operations, as adjusted, attributable to Alexandria Real Estate Equities, Inc.’s common
stockholders
GAAP-basis accounting for real estate assets utilizes historical cost accounting and assumes that real estate values diminish
over time. In an effort to overcome the difference between real estate values and historical cost accounting for real estate assets, the
Nareit Board of Governors established funds from operations as an improved measurement tool. Since its introduction, funds from
operations has become a widely used non-GAAP financial measure among equity REITs. We believe that funds from operations is
helpful to investors as an additional measure of the performance of an equity REIT. Moreover, we believe that funds from operations, as
adjusted, allows investors to compare our performance to the performance of other real estate companies on a consistent basis, without
having to account for differences recognized because of real estate acquisition and disposition decisions, financing decisions, capital
structure, capital market transactions, variances resulting from the volatility of market conditions outside of our control, or other
corporate activities that may not be representative of the operating performance of our properties.
The 2018 White Paper published by the Nareit Board of Governors (the “Nareit White Paper”) defines funds from operations as
net income (computed in accordance with GAAP), excluding gains or losses on sales of real estate, and impairments of real estate, plus
depreciation and amortization of operating real estate assets, and after adjustments for our share of consolidated and unconsolidated
partnerships and real estate joint ventures. Impairments represent the write-down of assets when fair value over the recoverability
period is less than the carrying value due to changes in general market conditions and do not necessarily reflect the operating
performance of the properties during the corresponding period.
We compute funds from operations, as adjusted, as funds from operations calculated in accordance with the Nareit White
Paper, excluding significant gains, losses, and impairments realized on non-real estate investments, unrealized gains or losses on non-
real estate investments, impairments of real estate primarily consisting of right-of-use assets and pre-acquisition costs related to
projects that we decided to no longer pursue, gains or losses on early extinguishment of debt, changes in the provision for expected
credit losses on financial instruments, significant termination fees, acceleration of stock compensation expense due to the resignations
of executive officers, deal costs, the income tax effect related to such items, and the amount of such items that is allocable to our
unvested restricted stock awards. We compute the amount that is allocable to our unvested restricted stock awards with nonforfeitable
dividends using the two-class method. Under the two-class method, we allocate net income (after amounts attributable to noncontrolling
interests) to common stockholders and to unvested restricted stock awards with nonforfeitable dividends by applying the respective
weighted-average shares outstanding during each quarter-to-date and year-to-date period. This may result in a difference of the
summation of the quarter-to-date and year-to-date amounts. Neither funds from operations nor funds from operations, as adjusted,
should be considered as alternatives to net income (determined in accordance with GAAP) as indications of financial performance, or to
cash flows from operating activities (determined in accordance with GAAP) as measures of liquidity, nor are they indicative of the
availability of funds for our cash needs, including our ability to make distributions.
The following table reconciles net income (loss) to funds from operations for the share of consolidated real estate joint
ventures attributable to noncontrolling interests and our share of unconsolidated real estate joint ventures for the three and nine months
ended September 30, 2025 (in thousands):
Noncontrolling Interest Share of
Consolidated Real Estate Joint Ventures
Our Share of Unconsolidated
Real Estate Joint Ventures
September 30, 2025
September 30, 2025
Three Months Ended
Nine Months Ended
Three Months Ended
Nine Months Ended
Net income (loss)
$34,909
$127,323
$201
$(9,327)
Depreciation and amortization of real
estate assets
45,327
114,785
852
2,848
Gain on sale of interest of
unconsolidated JV
(458)
(458)
Impairment of real estate
8,673
Funds from operations
$80,236
$242,108
$595
$1,736
116
The following tables present a reconciliation of net income (loss) attributable to Alexandria Real Estate Equities, Inc.’s common
stockholders, the most directly comparable financial measure presented in accordance with GAAP, including our share of amounts from
consolidated and unconsolidated real estate joint ventures, to funds from operations attributable to Alexandria Real Estate Equities,
Inc.’s common stockholders – diluted, and funds from operations attributable to Alexandria Real Estate Equities, Inc.’s common
stockholders – diluted, as adjusted, and the related per share amounts for the three and nine months ended September 30, 2025 and
2024 (in thousands, except per share amounts). Per share amounts may not add due to rounding.
Three Months Ended
September 30,
Nine Months Ended
September 30,
2025
2024
2025
2024
Net (loss) income attributable to Alexandria Real Estate Equities,
Inc.’s common stockholders – basic and diluted
$(234,937)
$164,674
$(356,147)
$374,477
Depreciation and amortization of real estate assets
338,182
291,258
1,021,292
864,326
Noncontrolling share of depreciation and amortization from
consolidated real estate JVs
(45,327)
(32,457)
(114,785)
(94,725)
Our share of depreciation and amortization from unconsolidated
real estate JVs
852
1,075
2,848
3,177
Gain on sales of real estate
(9,824)
(1)
(27,114)
(22,989)
(27,506)
Impairment of real estate – rental properties and land
323,870
(2)
5,741
454,960
7,923
Allocation to unvested restricted stock awards
(1,648)
(2,908)
(3,590)
(7,657)
Funds from operations attributable to Alexandria Real Estate
Equities, Inc.’s common stockholders – diluted(3)
371,168
400,269
981,589
1,120,015
Unrealized (gains) losses on non-real estate investments
(18,515)
(2,610)
71,568
32,470
Impairment of non-real estate investments
25,139
(4)
10,338
75,535
37,824
Impairment of real estate
39,343
28,581
Loss on early extinguishment of debt
107
(5)
107
Increase in provision for expected credit losses on financial
instruments
285
Allocation to unvested restricted stock awards
(74)
(125)
(2,156)
(1,640)
Funds from operations attributable to Alexandria Real Estate
Equities, Inc.’s common stockholders – diluted, as adjusted
$377,825
$407,872
$1,166,271
$1,217,250
(1)Includes our share of gain on sale of real estate by an unconsolidated real estate joint venture of $458 thousand, which is classified as equity in earnings of
unconsolidated real estate joint ventures in our consolidated statements of operations.
(2)Refer to Note 3 – “Investments in real estate” to our unaudited consolidated financial statements for additional information.
(3)Calculated in accordance with standards established by the Nareit Board of Governors.
(4)Primarily related to four non-real estate investments in privately held entities that do not report NAV.
(5)Refer to Note 10 – “Secured and unsecured senior debt” to our unaudited consolidated financial statements for additional information.
117
Three Months Ended
September 30,
Nine Months Ended
September 30,
(Per share)
2025
2024
2025
2024
Net (loss) income per share attributable to Alexandria Real
Estate Equities, Inc.’s common stockholders – diluted
$(1.38)
$0.96
$(2.09)
$2.18
Depreciation and amortization of real estate assets
1.73
1.51
5.34
4.49
Gain on sales of real estate
(0.06)
(0.16)
(0.14)
(0.16)
Impairment of real estate – rental properties and land
1.90
0.03
2.67
0.05
Allocation to unvested restricted stock awards
(0.01)
(0.01)
(0.02)
(0.05)
Funds from operations per share attributable to Alexandria
Real Estate Equities, Inc.’s common stockholders – diluted
2.18
2.33
5.76
6.51
Unrealized (gains) losses on non-real estate investments
(0.11)
(0.02)
0.42
0.19
Impairment of non-real estate investments
0.15
0.06
0.45
0.22
Impairment of real estate
0.23
0.17
Allocation to unvested restricted stock awards
(0.01)
(0.01)
Funds from operations per share attributable to Alexandria
Real Estate Equities, Inc.’s common stockholders –
diluted, as adjusted
$2.22
$2.37
$6.85
$7.08
Weighted-average shares of common stock outstanding –
diluted(1)
Earnings per share – diluted
170,181
172,058
170,278
172,007
Funds from operations – diluted, per share
170,305
172,058
170,351
172,007
Funds from operations – diluted, as adjusted, per share
170,305
172,058
170,351
172,007
 
(1)Refer to “Weighted-average shares of common stock outstanding – diluted” in this section for additional information.
118
Adjusted EBITDA and Adjusted EBITDA margin
We use Adjusted EBITDA as a supplemental performance measure of our operations, for financial and operational decision-
making, and as a supplemental means of evaluating period-to-period comparisons on a consistent basis. Adjusted EBITDA is calculated
as earnings before interest, taxes, depreciation, and amortization (“EBITDA”), excluding stock compensation expense, gains or losses
on early extinguishment of debt, gains or losses on sales of real estate, impairments of real estate, changes in provision for expected
credit losses on financial instruments, and significant termination fees. Adjusted EBITDA also excludes unrealized gains or losses and
significant realized gains or losses and impairments that result from our non-real estate investments. These non-real estate investment
amounts are classified in our consolidated statements of operations outside of total revenues.
We believe Adjusted EBITDA provides investors with relevant and useful information as it allows investors to evaluate the
operating performance of our business activities without having to account for differences recognized because of investing and
financing decisions related to our real estate and non-real estate investments, our capital structure, capital market transactions, and
variances resulting from the volatility of market conditions outside of our control. For example, we exclude gains or losses on the early
extinguishment of debt to allow investors to measure our performance independent of our indebtedness and capital structure. We
believe that adjusting for the effects of impairments and gains or losses on sales of real estate, significant impairments and realized
gains or losses on non-real estate investments, changes in provision for expected credit losses on financial instruments, and significant
termination fees allows investors to evaluate performance from period to period on a consistent basis without having to account for
differences recognized because of investing and financing decisions related to our real estate and non-real estate investments or other
corporate activities that may not be representative of the operating performance of our properties.
In addition, we believe that excluding charges related to stock compensation and unrealized gains or losses facilitates for
investors a comparison of our business activities across periods without the volatility resulting from market forces outside of our control.
Adjusted EBITDA has limitations as a measure of our performance. Adjusted EBITDA does not reflect our historical expenditures or
future requirements for capital expenditures or contractual commitments. While Adjusted EBITDA is a relevant measure of performance,
it does not represent net income (loss) or cash flows from operations calculated and presented in accordance with GAAP, and it should
not be considered as an alternative to those indicators in evaluating performance or liquidity.
In order to calculate the Adjusted EBITDA margin, we divide Adjusted EBITDA by total revenues as presented in our
consolidated statements of operations. We believe that this supplemental performance measure provides investors with additional
useful information regarding the profitability of our operating activities.
We are not able to forecast the net income of future periods without unreasonable effort and therefore do not provide a
reconciliation for Adjusted EBITDA on a forward-looking basis. This is due to the inherent difficulty of forecasting the timing and/or
amount of items that depend on market conditions outside of our control, including the timing of dispositions, capital events, and
financing decisions, as well as quarterly components such as gain on sales of real estate, unrealized gains or losses on non-real estate
investments, impairments of real estate, impairments of non-real estate investments, and changes in provision for expected credit
losses on financial instruments. Our attempt to predict these amounts may produce significant but inaccurate estimates, which would be
potentially misleading for our investors.
119
The following table reconciles net income, the most directly comparable financial measure calculated and presented in
accordance with GAAP, to Adjusted EBITDA and calculates the Adjusted EBITDA margin for the three and nine months ended
September 30, 2025 and 2024 (dollars in thousands):
Three Months Ended
September 30,
Nine Months Ended
September 30,
2025
2024
2025
2024
Net (loss) income
$(197,845)
$213,603
$(221,372)
$526,828
Interest expense
54,852
43,550
161,024
130,179
Income taxes
3,737
1,877
5,902
4,823
Depreciation and amortization
340,230
293,998
1,028,415
872,272
Stock compensation expense
10,293
15,525
32,887
47,157
Loss on early extinguishment of debt
107
107
Gain on sales of real estate
(9,366)
(27,114)
(22,531)
(27,506)
Unrealized (gains) losses on non-real estate investments
(18,515)
(2,610)
71,568
32,470
Impairment of real estate
323,870
5,741
485,630
36,504
Impairment of non-real estate investments
25,139
10,338
75,535
37,824
Increase in provision for expected credit losses on financial
instruments
285
Adjusted EBITDA
$532,502
$554,908
$1,617,450
$1,660,551
Total revenues
$751,944
$791,607
$2,272,142
$2,327,449
Adjusted EBITDA margin
71%
70%
71%
71%
Annual rental revenue
 
Annual rental revenue represents the annualized fixed base rental obligations, calculated in accordance with GAAP, including
the amortization of deferred revenue related to tenant-funded and tenant-built landlord improvements, for leases in effect as of the end
of the period, related to our operating RSF. Annual rental revenue is presented using 100% of the annual rental revenue from our
consolidated properties and our share of annual rental revenue for our unconsolidated real estate joint ventures. Annual rental revenue
per RSF is computed by dividing annual rental revenue by the sum of 100% of the RSF of our consolidated properties and our share of
the RSF of properties held in unconsolidated real estate joint ventures. As of September 30, 2025, approximately 91% of our leases (on
an annual rental revenue basis) were triple net leases, which require tenants to pay substantially all real estate taxes, insurance,
utilities, repairs and maintenance, common area expenses, and other operating expenses (including increases thereto) in addition to
base rent. Annual rental revenue excludes these operating expenses recovered from our tenants. Amounts recovered from our tenants
related to these operating expenses, along with base rent, are classified in income from rentals in our consolidated statements of
operations.
Capitalization rates
Capitalization rates are calculated based on net operating income and net operating income (cash basis) annualized,
excluding lease termination fees, on stabilized operating assets for the quarter preceding the date on which the property is sold, or
near-term prospective net operating income.
Capitalized interest
We capitalize interest cost as a cost of a project during periods for which activities necessary to develop, redevelop, or
reposition a project for its intended use are ongoing, provided that expenditures for the asset have been made and interest cost has
been incurred. Activities necessary to develop, redevelop, or reposition a project include pre-construction activities such as
entitlements, permitting, design, site work, and other activities preceding commencement of construction of aboveground building
improvements. The advancement of pre-construction efforts is focused on reducing the time required to deliver projects to prospective
tenants. These critical activities add significant value for future ground-up development and are required for the vertical construction of
buildings. If we cease activities necessary to prepare a project for its intended use, interest costs related to such project are expensed
as incurred.
120
Cash interest
Cash interest is equal to interest expense calculated in accordance with GAAP plus capitalized interest, less amortization of
loan fees and debt premiums (discounts). Refer to “Fixed-charge coverage ratio” in this section for a reconciliation of interest expense,
the most directly comparable financial measure calculated and presented in accordance with GAAP, to cash interest.
Class A/A+ properties and AAA locations
Class A/A+ properties are properties clustered in AAA locations that provide innovative tenants with highly dynamic and
collaborative environments that enhance their ability to successfully recruit and retain world-class talent and inspire productivity,
efficiency, creativity, and success. These properties are typically well-located, professionally managed, and well-maintained, offering a
wide range of amenities and featuring premium construction materials and finishes. Class A/A+ properties are generally newer or have
undergone substantial redevelopment and are generally expected to command higher annual rental rates compared to other classes of
similar properties. AAA locations are in close proximity to concentrations of specialized skills, knowledge, institutions, and related
businesses. It is important to note that our definition of property classification may not be directly comparable to other equity REITs.
Credit rating
Represents the credit ratings assigned by S&P Global Ratings or Moody’s Ratings as of September 30, 2025. A credit rating is
not a recommendation to buy, sell, or hold securities and may be subject to revision or withdrawal at any time.
Development, redevelopment, and pre-construction
A key component of our business model is our disciplined allocation of capital to the development and redevelopment of new
Class A/A+ properties, as well as property enhancements identified during the underwriting of certain acquired properties. These efforts
are primarily concentrated in collaborative Megacampus™ ecosystems within AAA life science innovation clusters, as well as other
strategic locations that support innovation and growth. These projects are generally focused on providing high-quality, generic, and
reusable spaces that meet the real estate requirements of a wide range of tenants. Upon completion, each development or
redevelopment project is expected to generate increases in rental income, net operating income, and cash flows. Our development and
redevelopment projects are generally in locations that are highly desirable to high-quality entities, which we believe results in higher
occupancy levels, longer lease terms, higher rental income, higher returns, and greater long-term asset value.
Development projects generally consist of the ground-up development of generic and reusable laboratory facilities.
Redevelopment projects consist of the permanent change in use of acquired office, warehouse, or shell space into laboratory space.
We generally will not commence new development projects for aboveground construction of new Class A/A+ laboratory space without
first securing significant pre-leasing for such space, except when there is solid market demand for high-quality Class A/A+ properties.
Pre-construction activities include entitlements, permitting, design, site work, and other activities preceding commencement of
construction of aboveground building improvements. The advancement of pre-construction efforts is focused on reducing the time
required to deliver projects to prospective tenants. These critical activities add significant value for future ground-up development and
are required for the vertical construction of buildings. Ultimately, these projects will provide high-quality facilities and are expected to
generate significant revenue and cash flows.
Development, redevelopment, and pre-construction spending also includes the following costs: (i) amounts to bring certain
acquired properties up to market standard and/or other costs identified during the acquisition process (generally within two years of
acquisition) and (ii) permanent conversion of space for highly flexible, move-in-ready laboratory space to foster the growth of promising
early- and growth-stage life science companies.
Revenue-enhancing and repositioning capital expenditures represent spending to reposition or significantly change the use of
a property, including through improvement in the asset quality from Class B to Class A/A+.
Non-revenue-enhancing capital expenditures represent costs required to maintain the current revenues of a stabilized
property, including the associated costs for renewed and re-leased space.
Dividend payout ratio (common stock)
Dividend payout ratio (common stock) is the ratio of the absolute dollar amount of dividends on our common stock (shares of
common stock outstanding on the respective record dates multiplied by the related dividend per share) to funds from operations
attributable to Alexandria’s common stockholders – diluted, as adjusted.
Dividend yield
Dividend yield for the quarter represents the annualized quarter dividend divided by the closing common stock price at the end
of the quarter.
121
Fixed-charge coverage ratio
Fixed-charge coverage ratio is a non-GAAP financial measure representing the ratio of Adjusted EBITDA to cash interest and
fixed charges. We believe that this ratio is useful to investors as a supplemental measure of our ability to satisfy fixed financing
obligations and preferred stock dividends. Cash interest is equal to interest expense calculated in accordance with GAAP plus
capitalized interest, less amortization of loan fees and debt premiums (discounts).
The following table reconciles interest expense, the most directly comparable financial measure calculated and presented in
accordance with GAAP, to cash interest and computes fixed-charge coverage ratio for the three and nine months ended September 30,
2025 and 2024 (dollars in thousands):
Three Months Ended September 30,
Nine Months Ended September 30,
2025
2024
2025
2024
Adjusted EBITDA
$532,502
$554,908
$1,617,450
$1,660,551
Interest expense
$54,852
$43,550
$161,024
$130,179
Capitalized interest
86,091
86,496
248,579
249,375
Amortization of loan fees
(4,505)
(4,222)
(13,811)
(12,510)
Amortization of debt discounts
(325)
(330)
(1,009)
(976)
Cash interest and fixed charges
$136,113
$125,494
$394,783
$366,068
Fixed-charge coverage ratio:
– quarter annualized
3.9x
4.4x
4.1x
4.5x
– trailing 12 months
4.1x
4.5x
4.1x
4.5x
We are not able to forecast the net income of future periods without unreasonable effort and therefore do not provide a
reconciliation for fixed-charge coverage ratio on a forward-looking basis. This is due to the inherent difficulty of forecasting the timing
and/or amount of items that depend on market conditions outside of our control, including the timing of dispositions, capital events, and
financing decisions, as well as quarterly components such as gain on sales of real estate, unrealized gains or losses on non-real estate
investments, impairments of real estate, impairments of non-real estate investments, and changes in provision for expected credit
losses on financial instruments. Our attempt to predict these amounts may produce significant but inaccurate estimates, which would be
potentially misleading for our investors.
Gross assets
Gross assets are calculated as total assets plus accumulated depreciation as of September 30, 2025 and December 31, 2024
(in thousands):
September 30, 2025
December 31, 2024
Total assets
$37,375,148
$37,527,449
Accumulated depreciation
6,416,745
5,625,179
Gross assets
$43,791,893
$43,152,628
122
Incremental annual net operating income on development and redevelopment projects
Incremental annual net operating income represents the amount of net operating income, on an annual basis, expected to be
realized upon a project being placed into service and achieving full occupancy. Incremental annual net operating income is calculated
as the initial stabilized yield multiplied by the project’s total cost at completion.
Initial stabilized yield (unlevered)
Initial stabilized yield is calculated as the estimated amounts of net operating income at stabilization divided by our investment
in the property. For this calculation, we exclude any tenant-funded and tenant-built landlord improvements from our investment in the
property. Our initial stabilized yield excludes the benefit of leverage. Our cash rents related to our development and redevelopment
projects are generally expected to increase over time due to contractual annual rent escalations. Our estimates for initial stabilized
yields, initial stabilized yields (cash basis), and total costs at completion represent our initial estimates at the commencement of the
project. We expect to update this information upon completion of the project, or sooner if there are significant changes to the expected
project yields or costs.
Initial stabilized yield reflects rental income, including contractual rent escalations and any rent concessions over the
term(s) of the lease(s), calculated on a straight-line basis, and any amortization of deferred revenue related to tenant-
funded and tenant-built landlord improvements.
Initial stabilized yield (cash basis) reflects cash rents at the stabilization date after initial rental concessions, if any, have
elapsed and our total cash investment in the property.
Investment-grade or publicly traded large cap tenants
Investment-grade or publicly traded large cap tenants represent tenants that are investment-grade rated or publicly traded
companies with an average daily market capitalization greater than $10 billion for the twelve months ended September 30, 2025, as
reported by Bloomberg Professional Services. Credit ratings from Moody’s Ratings and S&P Global Ratings reflect credit ratings of the
tenant’s parent entity, and there can be no assurance that a tenant’s parent entity will satisfy the tenant’s lease obligation upon such
tenant’s default. We monitor the credit quality and related material changes of our tenants. Material changes that cause a tenant’s
market capitalization to decrease below $10 billion, which are not immediately reflected in the twelve-month average, may result in their
exclusion from this measure.
Investments in real estate
The following table presents our new Class A/A+ development and redevelopment pipeline, excluding properties held for sale,
as a percentage of gross assets and as a percentage of annual rental revenue as of September 30, 2025 (dollars in thousands):
Percentage of
Book Value
Gross Assets
Annual Rental
Revenue
Projects under active construction and one 100% pre-leased committed near-
term project expected to commence in the next year
$3,724,801
9%
—%
Future development projects(1) and land parcels primarily located in
Megacampuses
4,871,463
11
1
$8,596,264
20%
1%
(1)Includes projects with existing buildings that are generating or can generate operating cash flows. Also includes development rights associated with existing operating
campuses.
123
The square footage presented in the table below is classified as operating as of September 30, 2025. These lease expirations
or vacant space at recently acquired properties represent future opportunities for which we have the intent, subject to market conditions
and leasing, to commence first-time conversion from non-laboratory space to laboratory space, or to commence future ground-up
development:
Dev/Redev
RSF of Lease Expirations Targeted for
Development and Redevelopment
Property/Submarket
2025
2026
Thereafter(1)
Total
Committed near-term project:
Campus Point by Alexandria/University Town Center
Dev
52,620
52,620
Future projects:
446, 458, and 500 Arsenal Street/Cambridge/Inner Suburbs
Dev
116,623
116,623
Other/Greater Boston
Redev
167,549
167,549
1122 and 1150 El Camino Real/South San Francisco
Dev
375,232
375,232
3875 Fabian Way/Greater Stanford
Dev
228,000
228,000
2100 and 2200 Geng Road/Greater Stanford
Dev
62,526
62,526
960 Industrial Road/Greater Stanford
Dev
112,590
112,590
Campus Point by Alexandria/University Town Center
Dev
96,805
96,805
Sequence District by Alexandria/Sorrento Mesa
Dev/Redev
555,754
555,754
410 West Harrison Street/Elliott Bay
Dev
17,205
17,205
Other/Seattle
Dev
63,057
63,057
100 Capitola Drive/Research Triangle
Dev
39,370
39,370
Canada
Redev
247,743
247,743
2,082,454
2,082,454
Total
52,620
2,082,454
2,135,074
(1)Includes vacant square footage as of September 30, 2025.
Joint venture financial information
We present components of balance sheet and operating results information related to our real estate joint ventures, which are
not presented, or intended to be presented, in accordance with GAAP. We present the proportionate share of certain financial line items
as follows: (i) for each real estate joint venture that we consolidate in our financial statements, which are controlled by us through
contractual rights or majority voting rights, but of which we own less than 100%, we apply the noncontrolling interest economic
ownership percentage to each financial item to arrive at the amount of such cumulative noncontrolling interest share of each component
presented; and (ii) for each real estate joint venture that we do not control and do not consolidate, which are instead controlled jointly or
by our joint venture partners through contractual rights or majority voting rights, we apply our economic ownership percentage to each
financial item to arrive at our proportionate share of each component presented.
The components of balance sheet and operating results information related to our real estate joint ventures do not represent
our legal claim to those items. For each entity that we do not wholly own, the joint venture agreement generally determines what equity
holders can receive upon capital events, such as sales or refinancing, or in the event of a liquidation. Equity holders are normally
entitled to their respective legal ownership of any residual cash from a joint venture only after all liabilities, priority distributions, and
claims have been repaid or satisfied.
We believe that this information can help investors estimate the balance sheet and operating results information related to our
partially owned entities. Presenting this information provides a perspective not immediately available from consolidated financial
statements and one that can supplement an understanding of the joint venture assets, liabilities, revenues, and expenses included in
our consolidated results.
The components of balance sheet and operating results information related to our real estate joint ventures are limited as an
analytical tool as the overall economic ownership interest does not represent our legal claim to each of our joint ventures’ assets,
liabilities, or results of operations. In addition, joint venture financial information may include financial information related to the
unconsolidated real estate joint ventures that we do not control. We believe that in order to facilitate for investors a clear understanding
of our operating results and our total assets and liabilities, joint venture financial information should be examined in conjunction with our
consolidated statements of operations and balance sheets. Joint venture financial information should not be considered an alternative
to our consolidated financial statements, which are presented and prepared in accordance with GAAP.
124
Megacampus™
A Megacampus ecosystem is a cluster campus that consists of approximately 1 million RSF or greater, including operating,
active development/redevelopment, and land RSF less operating RSF expected to be demolished. The following table reconciles our
annual rental revenue and development and redevelopment pipeline RSF, excluding properties classified as held for sale, as of
September 30, 2025 (dollars in thousands):
Annual Rental
Revenue
Development and
Redevelopment
Pipeline RSF
Megacampus
$1,522,942
20,092,287
Core and non-core
452,544
6,270,183
Total
$1,975,486
26,362,470
Megacampus as a percentage of annual rental revenue and of total development and
redevelopment pipeline RSF
77%
76%
Net cash provided by operating activities after dividends
Net cash provided by operating activities after dividends is reduced by distributions to noncontrolling interests and excludes
changes in operating assets and liabilities as they represent timing differences.
Net debt and preferred stock to Adjusted EBITDA
Net debt and preferred stock to Adjusted EBITDA is a non-GAAP financial measure that we believe is useful to investors as a
supplemental measure of evaluating our balance sheet leverage. Net debt and preferred stock is equal to the sum of total consolidated
debt less cash, cash equivalents, and restricted cash, plus preferred stock outstanding as of the end of the period. Refer to “Adjusted
EBITDA and Adjusted EBITDA margin” in this section for further information on the calculation of Adjusted EBITDA.
We are not able to forecast the net income of future periods without unreasonable effort and therefore do not provide a
reconciliation for net debt and preferred stock to Adjusted EBITDA on a forward-looking basis. This is due to the inherent difficulty of
forecasting the timing and/or amount of items that depend on market conditions outside of our control, including the timing of
dispositions, capital events, and financing decisions, as well as quarterly components such as gain on sales of real estate, unrealized
gains or losses on non-real estate investments, impairments of real estate, impairments of non-real estate investments, and changes in
provision for expected credit losses on financial instruments. Our attempt to predict these amounts may produce significant but
inaccurate estimates, which would be potentially misleading for our investors.
The following table reconciles debt to net debt and preferred stock and computes the ratio to Adjusted EBITDA as of
September 30, 2025 and December 31, 2024 (dollars in thousands):
September 30, 2025
December 31, 2024
Secured notes payable
$
$149,909
Unsecured senior notes payable
12,044,999
12,094,465
Unsecured senior line of credit and commercial paper
1,548,542
Unamortized deferred financing costs
76,383
77,649
Cash and cash equivalents
(579,474)
(552,146)
Restricted cash
(4,705)
(7,701)
Preferred stock
Net debt and preferred stock
$13,085,745
$11,762,176
Adjusted EBITDA:
– quarter annualized
$2,130,008
$2,273,480
– trailing 12 months
$2,185,820
$2,228,921
Net debt and preferred stock to Adjusted EBITDA:
– quarter annualized
6.1x
5.2x
– trailing 12 months
6.0x
5.3x
125
Net operating income, net operating income (cash basis), and operating margin
The following table reconciles net income (loss) to net operating income and net operating income (cash basis) and computes
operating margin for the three and nine months ended September 30, 2025 and 2024 (dollars in thousands):
Three Months Ended
September 30,
Nine Months Ended
September 30,
2025
2024
2025
2024
Net (loss) income
$(197,845)
$213,603
$(221,372)
$526,828
Equity in (earnings) losses of unconsolidated real estate joint
ventures
(201)
(139)
9,327
(424)
General and administrative expenses
29,224
43,945
89,027
135,629
Interest expense
54,852
43,550
161,024
130,179
Depreciation and amortization
340,230
293,998
1,028,415
872,272
Impairment of real estate
323,870
5,741
485,630
36,504
Loss on early extinguishment of debt
107
107
Gain on sales of real estate
(9,366)
(27,114)
(22,531)
(27,506)
Investment (income) loss
(28,161)
(15,242)
52,453
(14,866)
Net operating income
512,710
558,342
1,582,080
1,658,616
Straight-line rent revenue
(18,821)
(29,087)
(59,380)
(125,676)
Amortization of deferred revenue related to tenant-funded
and -built landlord improvements
(5,455)
(329)
(9,507)
(329)
Amortization of acquired below-market leases
(6,456)
(17,312)
(31,874)
(70,167)
Provision for expected credit losses on financial instruments
285
Net operating income (cash basis)
$481,978
$511,614
$1,481,604
$1,462,444
Net operating income (cash basis) – annualized
$1,927,912
$2,046,456
$1,975,472
$1,949,925
Net operating income (from above)
$512,710
$558,342
$1,582,080
$1,658,616
Total revenues
$751,944
$791,607
$2,272,142
$2,327,449
Operating margin
68%
71%
70%
71%
Net operating income is a non-GAAP financial measure calculated as net income (loss), the most directly comparable financial
measure calculated and presented in accordance with GAAP, excluding equity in the earnings of our unconsolidated real estate joint
ventures, general and administrative expenses, interest expense, depreciation and amortization, impairments of real estate, gains or
losses on early extinguishment of debt, gains or losses on sales of real estate, and investment income or loss. We believe net operating
income provides useful information to investors regarding our financial condition and results of operations because it primarily reflects
those income and expense items that are incurred at the property level. Therefore, we believe net operating income is a useful measure
for investors to evaluate the operating performance of our consolidated real estate assets. Net operating income on a cash basis is net
operating income adjusted to exclude the effect of straight-line rent, amortization of acquired above- and below-market lease revenue,
amortization of deferred revenue related to tenant-funded and tenant-built landlord improvements, and changes in the provision for
expected credit losses on financial instruments required by GAAP. We believe that net operating income on a cash basis is helpful to
investors as an additional measure of operating performance because it eliminates straight-line rent revenue and the amortization of
acquired above- and below-market leases and tenant-funded and tenant-built landlord improvements.
126
Furthermore, we believe net operating income is useful to investors as a performance measure of our consolidated properties
because, when compared across periods, net operating income reflects trends in occupancy rates, rental rates, and operating costs,
which provide a perspective not immediately apparent from net income or loss. Net operating income can be used to measure the initial
stabilized yields of our properties by calculating net operating income generated by a property divided by our investment in the property.
Net operating income excludes certain components from net income in order to provide results that are more closely related to the
results of operations of our properties. For example, interest expense is not necessarily linked to the operating performance of a real
estate asset and is often incurred at the corporate level rather than at the property level. In addition, depreciation and amortization,
because of historical cost accounting and useful life estimates, may distort comparability of operating performance at the property level.
Impairments of real estate have been excluded in deriving net operating income because we do not consider impairments of real estate
to be property-level operating expenses. Impairments of real estate relate to changes in the values of our assets and do not reflect the
current operating performance with respect to related revenues or expenses. Our impairments of real estate represent the write-down in
the value of the assets to the estimated fair value less cost to sell. These impairments result from investing decisions or a deterioration
in market conditions. We also exclude realized and unrealized investment gain or loss, which results from investment decisions that
occur at the corporate level related to non-real estate investments in publicly traded companies and certain privately held entities.
Therefore, we do not consider these activities to be an indication of operating performance of our real estate assets at the property
level. Our calculation of net operating income also excludes charges incurred from changes in certain financing decisions, such as
losses on early extinguishment of debt and changes in provision for expected credit losses on financial instruments, as these charges
often relate to corporate strategy. Property operating expenses included in determining net operating income primarily consist of costs
that are related to our operating properties, such as utilities, repairs, and maintenance; rental expense related to ground leases;
contracted services, such as janitorial, engineering, and landscaping; property taxes and insurance; and property-level salaries.
General and administrative expenses consist primarily of accounting and corporate compensation, corporate insurance, professional
fees, rent, and supplies that are incurred as part of corporate office management. We calculate operating margin as net operating
income divided by total revenues.
We believe that in order to facilitate for investors a clear understanding of our operating results, net operating income should
be examined in conjunction with net income or loss as presented in our consolidated statements of operations. Net operating income
should not be considered as an alternative to net income or loss as an indication of our performance, nor as an alternative to cash flows
as a measure of our liquidity or our ability to make distributions.
We are not able to forecast the net income of future periods without unreasonable effort and therefore do not provide a
reconciliation for net operating income on a forward-looking basis. This is due to the inherent difficulty of forecasting the timing and/or
amount of items that depend on market conditions outside of our control, including the timing of dispositions, capital events, and
financing decisions, as well as quarterly components such as gain on sales of real estate, unrealized gains or losses on non-real estate
investments, impairments of real estate, impairments of non-real estate investments, and changes in provision for expected credit
losses on financial instruments. Our attempt to predict these amounts may produce significant but inaccurate estimates, which would be
potentially misleading for our investors.
Operating statistics
We present certain operating statistics related to our properties, including number of properties, RSF, occupancy percentage,
leasing activity, and contractual lease expirations as of the end of the period. We believe these measures are useful to investors
because they facilitate an understanding of certain trends for our properties. We compute the number of properties, RSF, occupancy
percentage, leasing activity, and contractual lease expirations at 100%, excluding RSF at properties classified as held for sale, for all
properties in which we have an investment, including properties owned by our consolidated and unconsolidated real estate joint
ventures. For operating metrics based on annual rental revenue, refer to “Annual rental revenue” in this section.
Same property comparisons
As a result of changes within our total property portfolio during the comparative periods presented, including changes from
assets acquired or sold, properties placed into development or redevelopment, and development or redevelopment properties recently
placed into service, the consolidated total income from rentals, as well as rental operating expenses in our operating results, can show
significant changes from period to period. In order to supplement an evaluation of our results of operations over a given quarterly or
annual period, we analyze the operating performance for all consolidated properties that were fully operating for the entirety of the
comparative periods presented, referred to as same properties. We separately present quarterly and year-to-date same property results
to align with the interim financial information required by the SEC in our management’s discussion and analysis of our financial
condition and results of operations. These same properties are analyzed separately from properties acquired subsequent to the first day
in the earliest comparable quarterly or year-to-date period presented, properties that underwent development or redevelopment at any
time during the comparative periods, unconsolidated real estate joint ventures, properties classified as held for sale, and corporate
entities (legal entities performing general and administrative functions), which are excluded from same property results. Additionally,
termination fees, if any, are excluded from the results of same properties. Refer to “Same properties” in Item 2 for additional information.
127
Stabilized occupancy date
The stabilized occupancy date represents the estimated date on which a development or redevelopment project is expected to
reach occupancy of 95% or greater.
Tenant recoveries
Tenant recoveries represent revenues comprising reimbursement of real estate taxes, insurance, utilities, repairs and
maintenance, common area expenses, and other operating expenses and earned in the period during which the applicable expenses
are incurred and the tenant’s obligation to reimburse us arises.
We classify rental revenues and tenant recoveries generated through the leasing of real estate assets within revenues in
income from rentals in our consolidated statements of operations. We provide investors with a separate presentation of rental revenues
and tenant recoveries in “Results of operations” in Item 2 because we believe it promotes investors’ understanding of our operating
results. We believe that the presentation of tenant recoveries is useful to investors as a supplemental measure of our ability to recover
operating expenses under our triple net leases, including recoveries of utilities, repairs and maintenance, insurance, property taxes,
common area expenses, and other operating expenses, and of our ability to mitigate the effect to net income for any significant
variability to components of our operating expenses.
The following table reconciles income from rentals to tenant recoveries for the three and nine months ended September 30,
2025 and 2024 (in thousands):
Three Months Ended
September 30,
Nine Months Ended
September 30,
2025
2024
2025
2024
Income from rentals
$735,849
$775,744
$2,216,303
$2,286,457
Rental revenues
(541,070)
(579,569)
(1,646,559)
(1,737,804)
Tenant recoveries
$194,779
$196,175
$569,744
$548,653
Total equity capitalization
Total equity capitalization is equal to the outstanding shares of common stock multiplied by the closing price on the last trading
day at the end of each period presented.
Total market capitalization
Total market capitalization is equal to the sum of total equity capitalization and total debt.
Unencumbered net operating income as a percentage of total net operating income
 
Unencumbered net operating income as a percentage of total net operating income is a non-GAAP financial measure that we
believe is useful to investors as a performance measure of the results of operations of our unencumbered real estate assets as it
reflects those income and expense items that are incurred at the unencumbered property level. Unencumbered net operating income is
derived from assets classified in continuing operations, which are not subject to any mortgage, deed of trust, lien, or other security
interest, as of the period for which income is presented.
The following table summarizes unencumbered net operating income as a percentage of total net operating income for the
three and nine months ended September 30, 2025 and 2024 (dollars in thousands):
Three Months Ended
September 30,
Nine Months Ended
September 30,
2025
2024
2025
2024
Unencumbered net operating income
$512,710
$553,589
$1,579,167
$1,644,687
Encumbered net operating income
4,753
2,913
13,929
Total net operating income
$512,710
$558,342
$1,582,080
$1,658,616
Unencumbered net operating income as a percentage of total
net operating income
100.0%
99.1%
99.8%
99.2%
128
Weighted-average shares of common stock outstanding – diluted
From time to time, we enter into capital market transactions, including forward equity sales agreements (“Forward
Agreements”), to fund acquisitions, to fund construction of our development and redevelopment projects, and for general working
capital purposes. While the Forward Agreements are outstanding, we are required to consider the potential dilutive effect of our Forward
Agreements under the treasury stock method. Under this method, we also include the dilutive effect of unvested restricted stock awards
(“RSAs”) with forfeitable dividends in the calculation of diluted shares. Refer to Note 13 – “Earnings per share” and Note 14 –
“Stockholders’ equity” to our unaudited consolidated financial statements in Item 1 for additional information.
The weighted-average shares of common stock outstanding used in calculating EPS – diluted, funds from operations per
share – diluted, and funds from operations per share – diluted, as adjusted, for the three and nine months ended September 30, 2025
and 2024 are calculated as follows. Also shown are the weighted-average unvested RSAs with nonforfeitable dividends used in
calculating the amounts allocable to these awards pursuant to the two-class method for each of the respective periods presented below
(in thousands):
Three Months Ended
September 30,
Nine Months Ended
September 30,
2025
2024
2025
2024
Basic shares for earnings per share
170,181
172,058
170,278
172,007
Unvested RSAs with forfeitable dividends
Diluted shares for earnings per share
170,181
172,058
170,278
172,007
Basic shares for funds from operations per share and funds from
operations per share, as adjusted
170,181
172,058
170,278
172,007
Unvested RSAs with forfeitable dividends
124
73
Diluted shares for funds from operations per share and funds
from operations per share, as adjusted
170,305
172,058
170,351
172,007
Weighted-average unvested RSAs with nonforfeitable dividends
used in the allocations of net income, funds from operations,
and funds from operations, as adjusted
1,917
2,838
1,989
2,901
129
ITEM 3. QUANTITATIVE AND QUALITATIVE DISCLOSURES ABOUT MARKET RISK
Interest rate risk
The primary market risk to which we believe we may be exposed is interest rate risk, which may result from many factors,
including government monetary and tax policies, domestic and international economic and political considerations, and other factors
that are beyond our control.
In order to modify and manage the interest rate characteristics of our outstanding debt and to limit the effects of interest rate
risks on our operations, we may utilize a variety of financial instruments, including interest rate hedge agreements, caps, floors, and
other interest rate exchange contracts. The use of these types of instruments to hedge a portion of our exposure to changes in interest
rates may carry additional risks, such as counterparty credit risk and the legal enforceability of hedge agreements. As of September 30,
2025, we did not have any outstanding interest rate hedge agreements.
Our future earnings and fair values relating to our outstanding debt are primarily dependent upon prevalent market rates of
interest. The following tables illustrate the effect of a 1% change in interest rates, assuming a zero percent interest rate floor, on our
fixed- and variable-rate debt as of September 30, 2025 (in thousands):
Annualized effect on future earnings due to variable-rate debt:
Rate increase of 1%
$(4,755)
Rate decrease of 1%
$4,755
Effect on fair value of total consolidated debt:
Rate increase of 1%
$(774,133)
Rate decrease of 1%
$886,080
These amounts are determined by considering the effect of the hypothetical interest rates on our borrowings as of
September 30, 2025. These analyses do not consider the effects of the reduced level of overall economic activity that could exist in
such an environment. Furthermore, in the event of a change of such magnitude, we would consider taking actions to further mitigate our
exposure to the change. Because of the uncertainty of the specific actions that would be taken and their possible effects, the sensitivity
analyses assume no changes in our capital structure.
Equity price risk
We have exposure to equity price market risk because we hold equity investments in publicly traded companies and privately
held entities. All of our investments in actively traded public companies are reflected in our consolidated balance sheets at fair value.
Our investments in privately held entities that report NAV per share are measured at fair value using NAV as a practical expedient to fair
value. Our equity investments in privately held entities that do not report NAV per share are measured at cost less impairments,
adjusted for observable price changes during the period. Changes in fair value of public investments, changes in NAV per share
reported by privately held entities, and observable price changes of privately held entities that do not report NAV per share are
classified as investment income (loss) in our consolidated statements of operations. There is no assurance that future declines in value
will not have a material adverse effect on our future results of operations. The following table illustrates the effect that a 10% change in
the value of our equity investments would have on earnings as of September 30, 2025 (in thousands):
Equity price risk:
Fair value increase of 10%
$153,764
Fair value decrease of 10%
$(153,764)
130
Foreign currency exchange rate risk
We have exposure to foreign currency exchange rate risk related to our subsidiaries operating in Canada and Asia. The
functional currencies of our foreign subsidiaries are the local currencies in each respective country. Gains or losses resulting from the
translation of our foreign subsidiaries’ balance sheets and statements of operations are classified in accumulated other comprehensive
income (loss) as a separate component of total equity and are excluded from net income (loss). Gains or losses will be reflected in our
consolidated statements of operations when there is a sale or partial sale of our investment in these operations or upon a complete or
substantially complete liquidation of the investment. The following tables illustrate the effect that a 10% change in foreign currency rates
relative to the USD would have on our potential future earnings, and on the fair value of our net investment in foreign subsidiaries based
on our current operating assets outside the U.S. as of September 30, 2025 (in thousands):
Effect on potential future earnings due to foreign currency exchange rate:
Rate increase of 10%
$71
Rate decrease of 10%
$(71)
Effect on the fair value of net investment in foreign subsidiaries due to foreign currency exchange rate:
Rate increase of 10% (USD weakening)
$37,819
Rate decrease of 10% (USD strengthening)
$(37,819)
Change in the fair value of cross-currency swap agreements designated as a net investment hedge(1):
Rate increase of 10% (USD weakening)
$(28,400)
Rate decrease of 10% (USD strengthening)
$28,400
(1)Refer to Note 11 – “Hedge agreements” to our unaudited consolidated financial statements for additional information.
The sensitivity analyses assume a parallel shift of all foreign currency exchange rates with respect to the USD; however,
foreign currency exchange rates do not typically move in such a manner, and actual results may differ materially.
Our exposure to market risk elements for the nine months ended September 30, 2025 was consistent with the risk elements
presented above, including the effects of changes in interest rates, equity prices, and foreign currency exchange rates.
ITEM 4. CONTROLS AND PROCEDURES
Evaluation of disclosure controls and procedures
As of September 30, 2025, we had performed an evaluation, under the supervision of our principal executive officers and
principal financial officer, of the effectiveness of the design and operation of our disclosure controls and procedures. These controls and
procedures have been designed to ensure that information required for disclosure is recorded, processed, summarized, and reported
within the requisite time periods. Based on our evaluation, the principal executive officers and principal financial officer concluded that
our disclosure controls and procedures were effective as of September 30, 2025.
Changes in internal control over financial reporting
There has not been any change in our internal control over financial reporting during the three months ended September 30,
2025 that has materially affected, or is reasonably likely to materially affect, our internal control over financial reporting.
131
PART II – OTHER INFORMATION
ITEM 1. LEGAL PROCEEDINGS
In 2006, ARE-East River Science Park, LLC, a subsidiary of Alexandria Real Estate Equities, Inc., was granted an option to
incorporate a land parcel adjacent to and north of the Alexandria Center® for Life Science – New York City (“ACLS-NYC”) campus
(“Option Parcel”) into the existing ground lease of that campus. The Option Parcel will allow ARE-East River Science Park, LLC to
develop a future world-class life science building within the ACLS-NYC campus. ARE-East River Science Park, LLC’s investment in pre-
construction costs related to the development of the Option Parcel, including costs related to design, engineering, environmental,
survey/title, and permitting and legal costs, aggregated $175.7 million as of September 30, 2025.
On August 6, 2024, ARE-East River Science Park, LLC filed a lawsuit in the U.S. District Court for the Southern District of New
York against its landlord, New York City Health + Hospitals Corporation (“H+H”), and the New York City Economic Development
Corporation (“EDC”). On January 24, 2025, ARE-East River Science Park, LLC filed a first amended complaint. The lawsuit alleges two
principal claims against H+H and EDC: fraud in the inducement, and, in the alternative, breach of contract in violation of the implied
covenant of good faith and fair dealing. As alleged in the complaint, ARE-East River Science Park, LLC’s claims arise from H+H’s and
EDC’s misrepresentations and concealment of material facts in connection with a floodwall, which H+H and EDC are seeking to require
ARE-East River Science Park, LLC to integrate into the development of the Option Parcel. ARE-East River Science Park, LLC alleges
that H+H’s and EDC’s misconduct have prevented it from commencing the development of the Option Parcel. In light of the pending
litigation, the closing date for our option and thus the commencement date for construction of the third tower at the campus are
presently indeterminate. Among other things, ARE-East River Science Park, LLC is seeking significant damages and equitable relief
from the court to confirm our understanding that the option is in full force and effect.
This matter exposes us to potential losses ranging from zero to the full amount of the investment in the project aggregating
$175.7 million as of September 30, 2025, depending on any collection of damages and/or the ability to develop the project. We
performed a probability-weighted recoverability analysis based on initial estimates of various possible outcomes and determined no
impairment was present as of September 30, 2025.
132
ITEM 1A. RISK FACTORS
In addition to the information set forth in this quarterly report on Form 10-Q, one should also carefully review and consider the
information contained in the other reports and periodic filings that we make with the SEC, including, without limitation, the information
contained under the caption “Item 1A. Risk factors” in our annual report on Form 10-K for the year ended December 31, 2024. Those risk
factors could materially affect our business, financial condition, and results of operations. The risks that we describe in our public filings
are not the only risks that we face. Additional risks and uncertainties not currently known to us, or that we presently deem to be
immaterial, also may materially adversely affect our business, financial condition, and results of operations.
There have been no material changes in our risk factors from those disclosed under the caption “Item 1A. Risk factors” in our
annual report on Form 10-K for the year ended December 31, 2024, except for the following updates:
Changes to U.S. government funding, staffing, trade, policies, and other federal actions could adversely affect
our business operations or those of our tenants and our venture investment portfolio companies.
Domestic and international policy shifts may introduce considerable uncertainty to the macroeconomic and regulatory
landscape in which we, our tenants, and our venture investment portfolio companies operate. Our tenants and our venture
investment portfolio companies include entities in the pharmaceutical, biotechnology, medical device, life science, and related
industries, academic and private institutions, and government institutions that determine their R&D budgets based on several
factors, including the availability of government and other funding and the operational efficiency and reliability of public
regulatory institutions.
Since January 2025, the U.S. administration has implemented and proposed substantial policy changes that affect
federal health agencies, research funding, public health priorities, and international trade. These measures, ranging from
staffing and budget reductions at the U.S. Food and Drug Administration (“FDA”) and the National Institutes of Health (“NIH”) to
sweeping tariff actions as described below, may significantly disrupt the life science ecosystem in which we, our tenants, and
our venture investment portfolio companies operate.
Reductions in FDA workforce
In 2025 to date, the FDA laid off approximately 3,500 employees, representing approximately 19% of its workforce at
the beginning of the year. Such workforce reductions at the FDA have raised some concerns regarding the agency’s capacity to
perform timely regulatory reviews and approvals of drugs and other medical products. Recent and/or potential further reductions
in workforce or other personnel changes at the FDA, including terminations, may disrupt the agency’s review and approval
processes for our tenants’ and our venture investment portfolio companies’ products. Such disruptions could lead to setbacks in
research and development timelines, negatively impacting life science companies’ ability to advance their pipelines, secure
investor funding, or achieve commercial viability, which could severely affect their operations and financial performance and, as
a result, adversely impact our operating and financial results.
Restructuring and workforce reductions at the CDC
In 2025 to date, the U.S. Centers for Disease Control and Prevention (“CDC”) underwent a significant restructuring and
workforce reduction, including the dismissal of key scientific and policy personnel and the consolidation of several vaccine
safety and surveillance programs. These developments have raised concerns among public health and industry stakeholders
about the agency’s capacity to maintain vaccine oversight, coordinate immunization programs, and respond to emerging
infectious disease threats. Reduced CDC staffing and operational realignments may disrupt the collection and dissemination of
critical epidemiological data, delay updates to vaccination guidelines, and impair public confidence in vaccine safety. For our
tenants and venture investment portfolio companies operating in the vaccine research, development, and manufacturing
sectors, diminished CDC engagement could lead to uncertainty in regulatory expectations, lower vaccine uptake rates, and
delay the adoption of new immunization technologies. Any such disruptions could undermine the commercial viability of
vaccine-related products, reduce R&D investment in the field, and in turn negatively impact demand for our specialized life
science facilities and the value of our venture investment portfolio.
NIH grant cuts and impact on research institutions
The U.S. administration has implemented significant policy changes affecting the NIH, leading to substantial
disruptions in biomedical research across the U.S. These actions have included staff layoffs and funding cuts as described
below and have resulted in the suspension of numerous research projects, posing risks to scientific advancement and
introducing uncertainty for some of our tenants and venture investment portfolio companies.
133
NIH budget freeze and workforce cuts. On January 27, 2025, the U.S. administration issued an executive order to
suspend NIH grant funding, freezing much of the NIH’s nearly $48 billion budget for 2025. Though the suspension
was eventually blocked and reversed, during the first half of 2025, the NIH laid off approximately 5,000 employees
and contractors across its approximately 20,000-person workforce.
In May 2025, the White House introduced a budget proposal for fiscal year 2026 that would reduce the NIH
budget by 40%, from $48 billion to $27.5 billion. The proposal has been met with resistance from Congress, and,
until a new budget is approved Congress, the NIH budget will remain at 2024 levels through a continuing
resolution. Should the NIH budget be significantly reduced, it may affect funding of early research that drives the
formation of new life science companies, potentially impacting U.S. global life science leadership and long-term
domestic demand for life science real estate. 
Termination of NIH grants and funding commitments to major research institutions. On January 20, 2025,
President Trump issued an executive order directing every U.S. agency, including the NIH, to “terminate, to the
maximum extent allowed by law” all grants relating to diversity, equity, and inclusion. Further, on January 29, 2025,
the President issued an executive order to make it “the policy of the United States to combat anti-Semitism
vigorously, using all available and appropriate legal tools, to prosecute, remove, or otherwise hold to account the
perpetrators of unlawful anti-Semitic harassment and violence.” As a result of one or both executive orders, the
NIH, the world’s largest funder of biomedical research, has withheld funding from certain U.S. research
institutions.
15% cap on indirect cost reimbursements of all NIH grants. On February 7, 2025, the NIH introduced a policy
limiting indirect cost reimbursements to 15% for all NIH grants, representing a significant reduction from historic
levels, which were approximately double that rate on average, and in some cases significantly higher. This change
threatens to substantially impact the ability of research institutions to support their infrastructure and administrative
costs, including their ability to lease life science facilities.
A coalition of 22 state attorneys general, along with organizations such as the Association of American Medical
Colleges, filed lawsuits challenging the NIH’s policy changes, particularly the 15% cap on indirect costs. On April 7, 2025, a
federal court issued a permanent injunction blocking the enforcement of this cap. However, the U.S. administration has signaled
its intent to appeal and/or pursue similar funding restrictions through future legislative or administrative actions. If implemented,
any such funding cap could negatively impact our tenants that depend on grant funding for its operations. It could also reduce
the financial resources available to such tenants, forcing them to scale back operations, reduce leased space, or delay their
plans for lease expansion. 
Termination of federal research funding that affected prominent academic institutions has already led to reductions in 
postdoctoral hiring and the closure of critical programs. Moreover, recent changes to visa and immigration rules have introduced
new uncertainty around the ability of international graduate students and postdoctoral researchers to remain in the U.S.
following graduation. Many of these individuals represent years of training investment and historically have formed a key
segment of the U.S. biotechnology workforce. As limitations on their residency and employment take effect, a growing share of
talent is migrating to foreign markets. The U.S. life science real estate market has historically benefited from robust domestic
R&D activity and venture capital investment. However, other countries are increasingly positioned to attract top-tier biomedical
talent, venture capital, and clinical trials. The global leadership in biotechnology currently held by the U.S. may begin to shift
abroad. The reduced attractiveness of the U.S. as a destination for research and commercialization could lead to a substantial
long-term decline in the size of our life science tenant base and of life science real estate.
Drug pricing regulation — Most-Favored Nation Executive Order
On May 12, 2025, President Trump issued an executive order titled “Delivering Most-Favored-Nation Prescription Drug
Pricing to American Patients,” directing the Department of Health and Human Services to set U.S. drug price benchmarks at the
lowest prices paid in comparable developed countries. Although the President projected price reductions of 30%-80%, most
reforms would require formal rulemaking and are likely to face legal obstacles. In July 2025, the White House sent letters to the
chief executive officers of 17 major drug manufacturers, demanding compliance within 60 days and noting that noncompliance
could result in the federal government's enforcement through "every tool in our arsenal." Most recently, the Trump
administration and AstraZeneca and Pfizer reached public agreements under which both companies will offer many drugs at
“most-favored-nation” (“MFN”) pricing through Medicaid and via a new direct-to-consumer platform, and in return AstraZeneca
and Pfizer will receive a three-year tariff reprieve. While these developments signal accelerating government pressure on
industry pricing, they also inject significant ambiguity into commercial forecasts for pharmaceutical and biotechnology firms. If
widely adopted, MFN pricing could materially compress margins, reduce investment in R&D, and suppress expansions by our
life science tenants, adversely impacting demand for laboratory and related technical office space and manufacturing space,
and thereby posing downside risk to property income and investment valuations.
134
Reductions in Medicaid funding under the One Big Beautiful Bill Act
On July 4, 2025, the One Big Beautiful Bill Act was signed into law. Included in the bill is an estimated $1 trillion in cuts
to Medicaid spending, implemented through Medicaid work requirements, patient cost-sharing, and a phase-down of Medicaid
provider taxes and state-directed payments. Such reductions in Medicaid spending could result in lower revenue for some life
science tenants, adversely impacting financial performance and potentially resulting in reduced life science investment and real
estate requirements.
Rapid expansion of China’s biotechnology sector and potential adverse impact on demand for U.S. life science real estate
The U.S. life science real estate market has historically benefited from robust domestic R&D activity and venture
capital investment. The accelerated growth of China’s biotechnology industry, fueled by state subsidies, regulatory reform, and
inexpensive talent, could negatively impact demand for U.S. laboratory space. Given lower operational costs and faster clinical
trial recruitment timelines, China may attract biotechnology firms to conduct their R&D activities, including clinical trials, in China
rather than in the U.S.
Additionally, the U.S. biopharmaceutical sector is increasingly sourcing innovative assets from China, with over one-
third of in-licensed molecules at major U.S. pharmaceutical companies now originating from Chinese firms. If biopharmaceutical
companies increasingly rely on acquiring or in-licensing assets from China instead of those developed in the U.S., it could
negatively impact the fundamentals of the U.S. biotechnology market, leading to reduced investment and fewer U.S.-based
biotechnology companies. Should this occur, demand for domestic laboratory space could decline.
Tariff escalation, trade disruption, and financial market instability
Beginning in March 2025, the U.S. government implemented a series of trade actions that have reshaped global
economic relations and triggered market volatility, specifically:
On February 1, 2025, President Trump signed executive orders imposing a 25% tariff on all goods from Mexico
and Canada and a 10% tariff on China.
On March 3, 2025, the President increased tariffs on all products from China from 10% to 20%. He also
implemented new 25% tariffs on imports from Mexico and Canada.
On April 2, 2025, the President declared a national emergency to address the U.S. trade deficit and imposed a
10% universal import tariff on all goods, with higher rates for 57 trading partners. This announcement led to a
significant stock market decline, with the S&P 500 Index, Dow Jones Industrial Average, and the Nasdaq
Composite dropping by approximately 6.0%, 5.5%, and 5.8%, respectively. 
On April 9, 2025, facing a global financial market meltdown, the President announced a 90-day pause on tariffs for
most countries but raised the tax rate on Chinese imports to 125%. Following the announcement, the S&P 500
Index surged 9.5%. However, on April 10, 2025, U.S. stocks fell as the initial euphoria over the pause on tariffs
faded. Subsequently, on June 12, 2025, the President announced that the 125% tariff would be replaced with a
55% tariff on select Chinese goods. Pharmaceutical ingredients and critical materials remained partially exempt.
On April 14, 2025, the U.S. government launched an investigation into pharmaceuticals to justify tariffs that may
be implemented on pharmaceutical products. In 2024, over $200 billion in pharmaceutical products were imported
to the U.S., and it is estimated that U.S. tariffs could add $46 billion in costs to the pharmaceutical industry.
On August 21, 2025, the U.S. and the European Union reached a trade agreement establishing a 15% ceiling on
tariffs applied to pharmaceutical products traded between the two regions. The accord preserves supply chain
continuity for a significant share of imported active pharmaceutical ingredients and finished drug products sourced
from Europe while signaling potential divergence in tariff treatment for manufacturers based outside allied markets
such as India and China.
On September 25, 2025, President Trump announced, effective October 1, pharmaceutical manufacturers would
be subject to a 100% tariff on all branded and patented drugs imported into the U.S. The President stated that
manufacturers could avoid these tariffs by establishing U.S.-based production operations, with qualifying activity
defined as either projects that have broken ground or are already under construction. The measure excludes
generic drugs and exempts companies actively developing or constructing domestic manufacturing facilities.
135
If tariff uncertainty, its associated costs, and the disruption of broader financial markets continue, we may face the
following risks:
Restricted access to capital. Market instability may hinder our ability to raise capital, including through
dispositions, sales of partial interests, and new debt capital, and could potentially delay our current or future
development and redevelopment projects.
Rising construction costs. Our general contractors may face difficulty procuring construction materials at
reasonable prices, particularly those subject to tariffs or disrupted supply, which may lead to project delays and/or
increased costs. Rising costs and procurement challenges could significantly impact the yields and delay
commencement of net operating income from our current and future development and redevelopment pipeline.
Risks to tenant operations. Many of our tenants rely on the import and export of materials, components, and/or
specialized equipment. As a result, their products may become prohibitively expensive to manufacture or sell.
These challenges may adversely affect our tenants’ ability to meet their lease obligations or to renew their leases
with us.
Macroeconomic impact. Widespread tariffs, restricted trade, increased market volatility, and reduced investor
confidence may trigger inflationary pressure and elevate the risk of a U.S. recession.
The cost increases that may result from tariffs, trade conflicts, and financial market volatility may significantly impact
our development and redevelopment projects. Elevated material costs may lead to higher overall project budgets and extended
construction timelines or require modifications to project scope to preserve economic feasibility. Any such adjustments may
prevent our delivery of space on time and within budget, delay occupancy and commencement of rental income, and impact
projected net operating income and yields.
Any of the aforementioned and future developments may adversely affect occupancy rates, rental income, and the
value of our real estate portfolio in several ways. First, regulatory delays and reduced NIH funding may slow the pace of
innovation and company formation, leading to fewer early-stage tenants seeking laboratory space. Established tenants may
face financial strain due to reduced grant support, drug pricing pressures, and increased operational costs from tariffs,
prompting them to downsize, consolidate, or defer expansion plans. These dynamics could result in lower leasing, increased
vacancy rates, and downward pressure on rental rates across our portfolio.
Second, macroeconomic volatility and restricted access to capital markets may impair our ability to fund new
developments, raise new debt or equity capital at favorable terms, and impact pricing on dispositions. Rising construction costs
and supply chain disruptions could delay project completions, reduce development yields, and impact the timing of rental
income generation. Additionally, if tenants are unable to absorb higher operating costs or pass them on to customers, their
financial health may deteriorate, increasing the risk of lease defaults or renegotiations.
Finally, the growing competitiveness of international markets, particularly China’s rapidly expanding biotechnology
sector, may shift R&D activity abroad, reducing domestic demand for specialized laboratory infrastructure. If U.S.-based life
science companies increasingly rely on foreign innovation or relocate operations to more favorable regulatory or cost
environments, the long-term fundamentals of the U.S. life science real estate market could weaken. This may lead to asset
devaluation, reduced investor confidence, and a more challenging environment for sustaining growth and delivering stockholder
value.
Life science industry dynamics
The life science industry is undergoing a prolonged period of structural and cyclical challenges that may materially and
adversely affect our business, financial condition, and results of operations. The venture capital ecosystem that supports early-
stage platform development has experienced several years of contraction as investors look to more de-risked later-stage assets
that may not require significant R&D laboratory requirements. Additionally, historical performance data increasingly shows that
life science venture capital returns have underperformed relative to technology-focused funds and broader public market
indices. While a small number of firms have demonstrated consistently outperformed, the majority of life science-focused funds
have delivered uneven results, leading institutional investors, including endowments, foundations, and pension funds, to
reassess their long-term allocations to the sector.
This reassessment may result in a long-term reduction in capital available to private biotechnology companies, which
represent a meaningful portion of our tenant base. The high failure rate of private biotechnology companies, coupled with the
increasing cost and complexity of drug development, has led many investors to shift their focus toward more de-risked clinical-
stage assets, often sourced internationally. As a result, fewer early-stage private biotechnology companies may be formed and
funded in the U.S., which may reduce demand for the specialized laboratory space we provide across our campuses.
136
In addition, the private life science market has become increasingly selective, with available capital chasing a limited
number of high-quality opportunities. This dynamic has compressed potential returns, on average, and altered the risk-reward
profile for investors. While this does not necessarily indicate a permanent shift, it does reflect a more cautious and selective
investment environment that may persist for the foreseeable future. These conditions may lead to reduced biotechnology
company formation in the U.S., diminished tenant demand, slower leasing velocity, and increased turnover among higher-risk
early-stage biotechnology tenants, particularly in markets where our portfolio is heavily concentrated in emerging biotechnology.
These industry dynamics may also affect our ability to raise capital to fund future development projects. If capital
markets perceive the life science sector as structurally challenged, our cost of capital may increase and our access to equity or
debt financing may be constrained. This could limit our ability to pursue new development opportunities, reposition existing
assets, or invest in strategic initiatives that enhance long-term stockholder value.
To address these risks, we have employed and may continue to employ a range of mitigating strategies, including:
Deepening relationships with top-tier venture capital firms and academic institutions to identify and support high-
potential tenants earlier in their life cycle.
Expanding our proprietary products to offer operational support, shared infrastructure, and flexible leasing models
that improve capital efficiency for emerging companies.
Enhancing our data and analytics capabilities to better assess tenant viability, monitor portfolio risk, and inform
leasing and development decisions.
Exploring strategic partnerships with pharmaceutical companies, contract research organizations (“CROs”), and
investment-grade institutions to create more stable demand anchors within our campuses.
Convening influential stakeholders through our industry-leading Alexandria Summit® event series, which brings
together key decision makers, life science thought leaders, venture capital firms, members of Congress,
regulatory agency executives, and other policymakers to prioritize diseases with unmet needs and advance the
development of novel, effective therapies.
Exploring alternative uses for Alexandria’s robust laboratory and office infrastructure by, for example,  technology
tenants that require specialized R&D space.
While we believe these strategies can help mitigate the impact of current industry headwinds, there can be no
assurance that they will fully offset the risks associated with reduced formation and performance of private biotechnology
companies. If we are unable to respond effectively to these evolving market conditions, our ability to lease space, maintain high
occupancy levels, generate consistent cash flows, deliver earnings growth, and provide long-term value to our stockholders
may be materially and adversely affected.
Failure of the U.S. federal government to manage its fiscal matters may negatively impact the economic environment
and adversely impact our business
An inability of the U.S. federal government to manage its fiscal matters and enact appropriate fiscal legislation may
significantly impact the national and global economic and financial environment, result in reduced economic confidence
domestically and globally, reduce investment spending, increase borrowing costs, impact availability and cost of capital, and
significantly hinder or reduce economic activity. These economic impacts could adversely affect our business and the
businesses of our tenants.
In September 2025, Congress failed to enact a budget for the upcoming fiscal year, which resulted in a partial
government shutdown that began on October 1, 2025 and remains in effect as of the date of this report. The shutdown affected
certain key agencies at the federal government level, resulting in partial closures of operations. Thousands of federal
employees have been furloughed or laid off, some essential personnel are working without pay, and many non-essential agency
functions have ceased. During a shutdown, the FDA maintains critical operations but is unable to accept new drug applications.
The NIH and CDC may experience staffing furloughs, suspended operations, and delayed reviews of grant applications.
Prolonged or repeated shutdowns or short-term Congressional budget resolutions could adversely affect business operations of
some of our tenants that depend on federal funding, contracts, or regulatory actions to sustain their operations. Our tenants
may experience delays in submitting or advancing new drug applications, or receiving device approvals should the operations at
the FDA and other oversight bodies be reduced. The NIH may pause peer-review meetings, issuance of new grants, and many
program activities, and its Clinical Center will be unable to launch new trials during the funding lapse. The FDA’s operations may
become limited to work deemed “safety-critical” and activities supported by carryover user fees, and the agency has stated it
will be unable to accept certain new submissions requiring fees until funding resumes. These outcomes could impede R&D
progress, postpone commercialization milestones, and delay anticipated financing. Additionally, the broader economic and
capital market consequences of an extended shutdown, such as weakened investor confidence, deferred initial public offerings
(“IPOs”), and a slower pace of venture and private equity deployment, could further strain tenants’ access to capital. Our
tenants may seek to reduce cash outflows by delaying rent payments, renegotiating lease terms, downsizing existing space
commitments, or filing for bankruptcy or ceasing operations altogether.
If any of our tenants becomes a debtor in a case under the U.S. Bankruptcy Code, as amended, we cannot evict that
tenant solely because of its bankruptcy. The bankruptcy court may authorize the tenant to reject and terminate its lease with us.
137
Our claim against such a tenant for uncollectible future rent would be subject to a statutory limitation that will likely be
substantially less than the remaining rent actually owed to us under the tenant’s lease. Any shortfall in rent payments could
adversely affect our cash flows and our ability to make distributions to our stockholders.
We hold equity investments in certain publicly traded companies, limited partnerships, and privately held entities
primarily involved in the life science and technology industries. The valuation of these investments is affected by many external
factors beyond our control, including, but not limited to, market prices, market conditions, healthcare legislation, prospects for
favorable or unfavorable clinical trial results, new product initiatives, the manufacturing and distribution of new products, product
safety and efficacy issues, and new collaborative agreements. Reduced activities or temporary closures of agencies such as
the FDA and SEC may adversely affect business operations, financial results, IPO processing, and project funding for the
companies in which we hold equity investments. Unfavorable developments with respect to any of these factors may have an
adverse impact on the valuation of our equity investments.
We cannot predict the timing or duration of appropriation lapses or the extent of any public policy changes. If the
shutdown persists, or if future lapses recur, our business and that of our tenants and our venture investment portfolio
companies could be adversely affected. These risks may also impact our overall liquidity, our borrowing costs, or the market
price of our common stock.
138
ITEM 2. UNREGISTERED SALES OF EQUITY SECURITIES AND USE OF PROCEEDS
Purchases of equity securities
On December 9, 2024, we announced that our Board of Directors authorized a share repurchase program, allowing the
repurchase of shares with an aggregate value up to $500.0 million until December 31, 2025 in the open market, through privately
negotiated transactions, or otherwise, in accordance with all applicable securities laws and regulations, including Rule 10b-18 of the
Exchange Act. No shares were repurchased during the three months ended June 30, and September 30, 2025, As of September 30,
2025, we had remaining authorization to repurchase shares with an aggregate value up to $241.8 million.
ITEM 5. OTHER INFORMATION
Disclosure of 10b5-1 plans
During the three months ended September 30, 2025, none of our officers or directors adopted or terminated any contract,
instruction, or written plan for the purchase or sale of our securities that was intended to satisfy the affirmative defense conditions of
Rule 10b5-1(c) or any “non-Rule 10b5-1 trading arrangement.
139
ITEM 6. EXHIBITS
Exhibit
Number
Exhibit Title
Incorporated by
Reference to:
Date Filed
3.1*
Form 10-Q
August 14, 1997
3.2*
Form 10-Q
August 14, 1997
3.3*
Form 8-K
May 12, 2017
3.4*
Form 8-K
May 19, 2022
3.5*
Form 10-Q
August 13, 1999
3.6*
Form 8-K
February 10, 2000
3.7*
Form 8-K
February 10, 2000
3.8*
Form 8-A
January 18, 2002
3.9*
Form 8-A
June 28, 2004
3.10*
Form 8-K
March 25, 2008
3.11*
Form 8-K
March 14, 2012
3.12*
Form 8-K
May 12, 2017
3.13*
Form 8-K
December 9, 2024
10.1(1)
N/A
Filed herewith
22.1
N/A
Filed herewith
31.1
N/A
Filed herewith
31.2
N/A
Filed herewith
31.3
N/A
Filed herewith
32.0
N/A
Filed herewith
101.1
The following materials from the Company’s quarterly report on Form 10-Q for
the quarterly period ended September 30, 2025, formatted in iXBRL (Inline
eXtensible Business Reporting Language): (i) Consolidated Balance Sheets
as of September 30, 2025 and December 31, 2024 (unaudited), (ii)
Consolidated Statements of Operations for the three and nine months ended
September 30, 2025 and 2024 (unaudited), (iii) Consolidated Statements of
Comprehensive Income for the three and nine months ended September 30,
2025 and 2024 (unaudited), (iv) Consolidated Statements of Changes in
Stockholders’ Equity and Noncontrolling Interests for the three and nine
months ended September 30, 2025 and 2024 (unaudited), (v) Consolidated
Statements of Cash Flows for the nine months ended September 30, 2025
and 2024 (unaudited), and (vi) Notes to Consolidated Financial Statements
(unaudited)
N/A
Filed herewith
104
Cover Page Interactive Data File – the cover page from this Quarterly Report
on Form 10-Q for the quarter ended September 30, 2025 is formatted in Inline
XBRL and contained in Exhibit 101.1
N/A
Filed herewith
(*) Incorporated by reference.
(1) Management contract or compensatory arrangement.
140
SIGNATURES
Pursuant to the requirements of the Securities Exchange Act of 1934, the registrant has duly caused this report to be signed
on its behalf by the undersigned, thereunto duly authorized, on October 27, 2025.
 
ALEXANDRIA REAL ESTATE EQUITIES, INC.
/s/ Joel S. Marcus
Joel S. Marcus
Executive Chairman
(Principal Executive Officer)
/s/ Peter M. Moglia
Peter M. Moglia
Chief Executive Officer and Chief Investment Officer
(Principal Executive Officer)
/s/ Marc E. Binda
Marc E. Binda
Chief Financial Officer and Treasurer
(Principal Financial Officer)