QUALITY PEOPLE. BUILDING SOLUTIONS. NYSE: FIX February 20, 2026
SAFE HARBOR Certain statements and information in this presentation may constitute forward - looking statements regarding our future business expectations, which are subject to applicable securities laws and regulations. The words “believe,” “expect,” “anticipate,” “plan,” “intend,” “forese e,” “should,” “would,” “could,” or other similar expressions are intended to identify forward - looking statements, which are generally not historic in nature. These forward - looki ng statements are based on the current expectations and beliefs of Comfort Systems USA, Inc. and its subsidiaries (collectively, the “Company”) concerning f utu re developments and their effect on the Company. While the Company’s management believes that these forward - looking statements are reasonable as and when made, ther e can be no assurance that future developments affecting the Company will be those that it anticipates, and the Company’s actual results of operations, fin ancial condition and liquidity, and the development of the industry in which the Company operates, may differ materially from those made in or suggested by the forwa rd - looking statements contained in this presentation. In addition, even if our results of operations, financial condition and liquidity, and the development of th e industry in which we operate, are consistent with the forward - looking statements contained in this presentation, those results or developments may not be indicati ve of our results or developments in subsequent periods. All comments concerning the Company’s expectations for future revenue and operating results are based on the Company’s forecasts for its existing operations and do not include the potential impact of any future acquisitions. The Company’s forward - looking statements involve significant risks and uncertainties (some of which are beyond the Company’s control) and assumptions that could cause actual future results to diff er materially from the Company’s historical experience and its present expectations or projections. Important factors that could cause actual results to differ materially from those in the forward - looking statements include, bu t are not limited to: the use of incorrect estimates for bidding a fixed - price contract; undertaking contractual commitments that exceed the Company’s labor reso urces; failing to perform contractual obligations efficiently enough to maintain profitability; national or regional weakness in construction activity and economic conditions; economic downturns in the markets where the Company operates; shortages of labor and specialty building materials or material increase s t o the cost thereof; financial difficulties affecting projects, vendors, customers, or subcontractors; unexpected adjustments or cancellations in our backl og resulting in the Company’s backlog failing to translate into actual revenue or profits; inflation, supply chain disruptions, and capital market volatility; the los s of significant customers; intense competition in the Company’s industry; risks associated with acquisitions, including the ability to successfully integrate th ose companies; impairment charges for goodwill and intangible assets; reductions or reversals of previously recorded revenue or profits as a result of the Company’ s c ost - to - cost input method of accounting; difficulties in the financial and surety markets; delays and/or defaults in customer payments; difficult work environment; wo rld wide political and economic uncertainties, including international conflicts and epidemics or pandemics; attraction and retention of key management and e mpl oyees; the Company’s decentralized management structure; our ability to effectively manage our backlog and the size and cost of our operations; fa ilu re of third party subcontractors and suppliers to complete work as anticipated; difficulty in obtaining, or increased costs associated with, bonding and insurance ; o ur ability to remain in compliance with covenants under our credit agreement, service our indebtedness, or fund our other liquidity needs; our inability to properly uti lize our workforce; increases and uncertainty in insurance costs; regulatory and legal risks, including adverse litigation results, failure to comply with laws and regulations; changes in United States trade policy, and tax - related risks; the imposition of past and future liability from environmental, safety, and health regulati ons including the inherent risk associated with self - insurance; an increase in our effective tax rate; a material information technology failure or a material cybersecurit y breach; risks related to our common stock; failure or circumvention of our disclosure controls and procedures or internal control environment; our ability to man age growth and geographically - dispersed operations; severe weather conditions (such as storms, droughts, extreme heat or cold, wildfires and floods), including as a res ult of climate change, and any resulting regulations or restrictions related thereto; force majeure events; deliberate, malicious acts, including terrorism and sabota ge; findings of inadequate internal controls; changes in accounting rules and regulations; and other risks detailed in our reports filed with the Securities and Exchange C omm ission (the “SEC”). For additional information regarding known material factors that could cause the Company’s results to differ from its project ed results, please see its filings with the SEC, including its Annual Report on Form 10 - K, Quarterly Reports on Form 10 - Q, and Current Reports on Form 8 - K. Readers are cautioned not to place undue reliance on forward - looking statements, which speak only as of the date hereof. The Company undertakes no obligation to publicly update or revise any forward - looking statements after the date they are made, whether because of new information, future events, or otherwise. NON - GAAP MEASURES Certain measures in this presentation are not measures calculated in accordance with generally accepted accounting principles ( “GAAP”). They should not be considered a replacement for GAAP results. Non - GAAP financial measures appearing in these slides are identified in the footnote. See the Appendices for a reconciliation of these non - GAAP measures to the most comparable GAAP financial measures. 1
• Leading national mechanical, electrical, and plumbing (“MEP”) installation and service provider • $9.0+ billion yearly revenue • 67% industrial • 22,000 + employees • History of profitable growth and cash flow • Leading mechanical, electrical, and modular construction and service portfolio COMFORT SYSTEMS USA 2
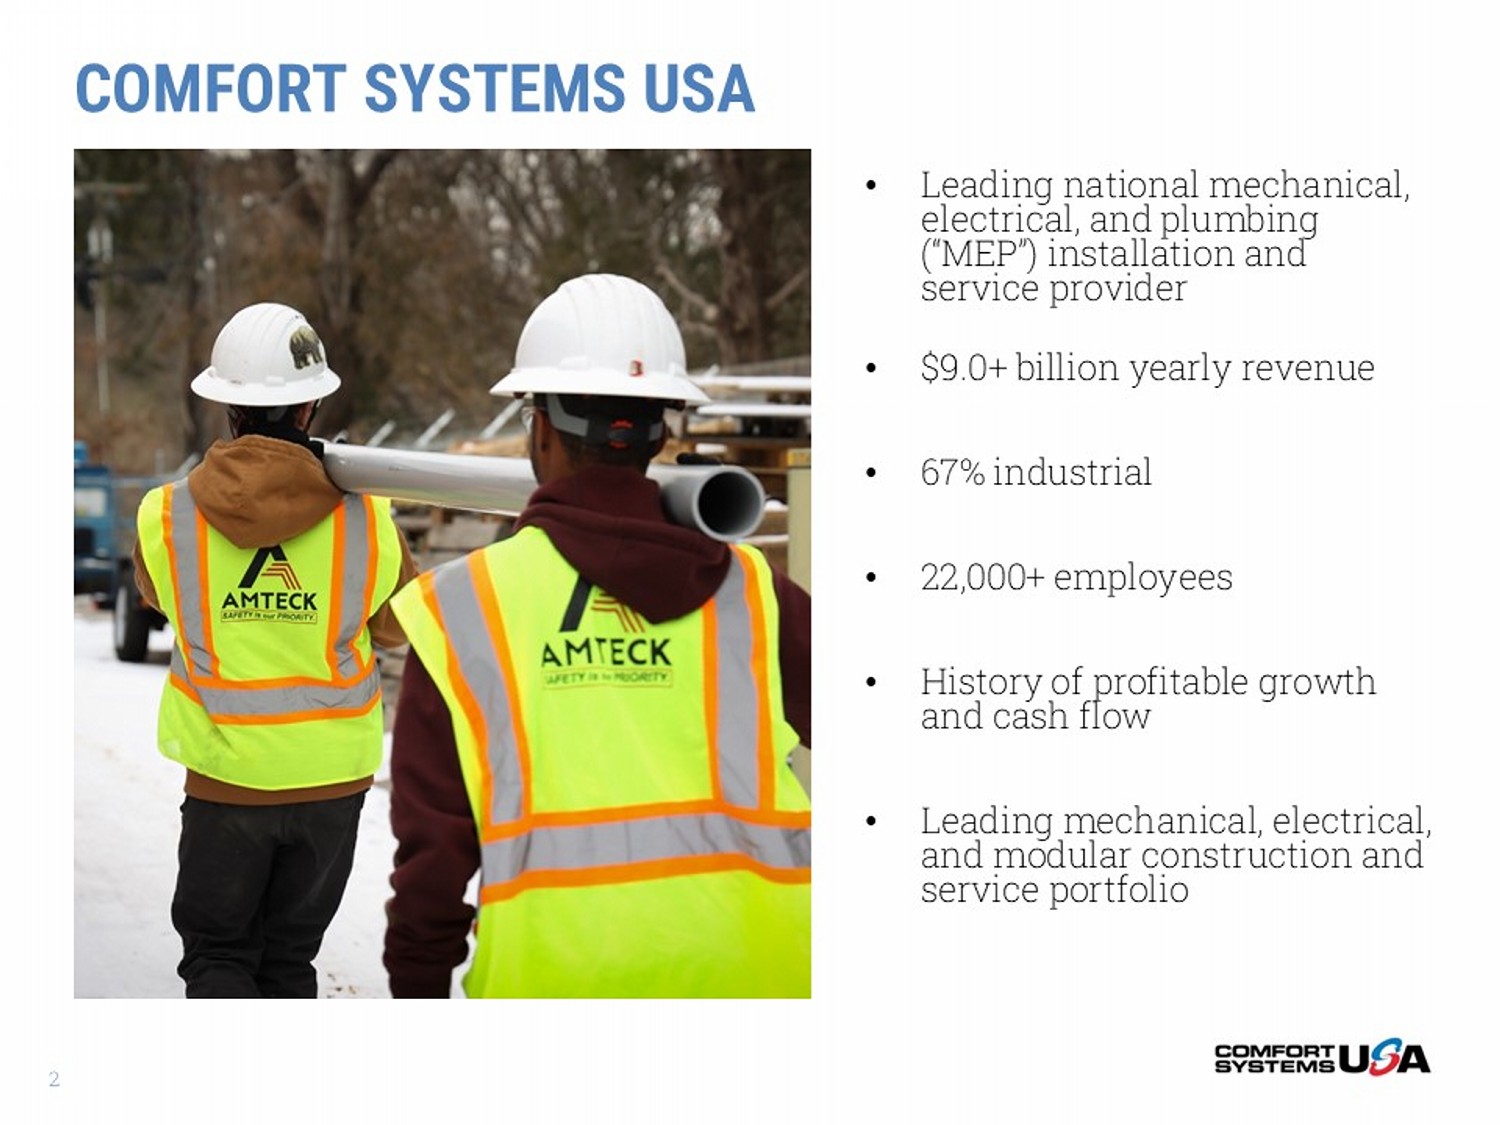
190 LOCATIONS | 142 CITIES | 22 ,000+ EMPLOYEES NATIONAL FOOTPRINT 3
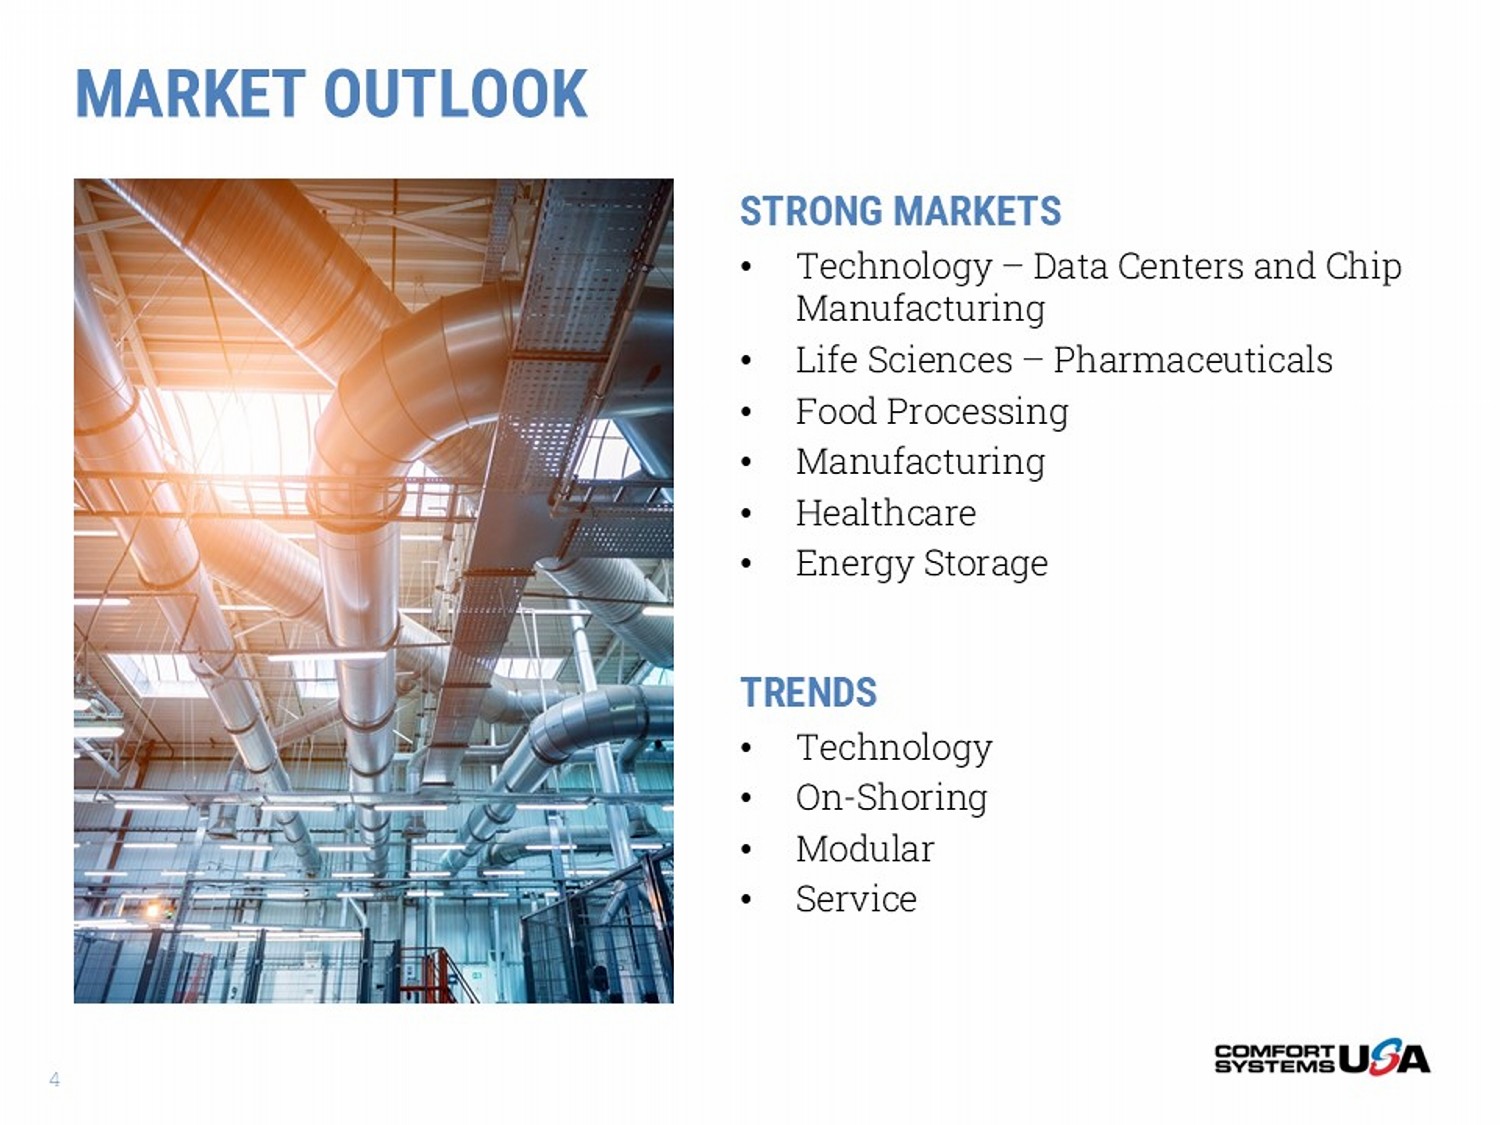
MARKET OUTLOOK STRONG MARKETS • Technology – Data Centers and Chip Manufacturing • Life Sciences – Pharmaceuticals • Food Processing • Manufacturing • Healthcare • Energy Storage TRENDS • Technology • On - Shoring • Modular • Service 4
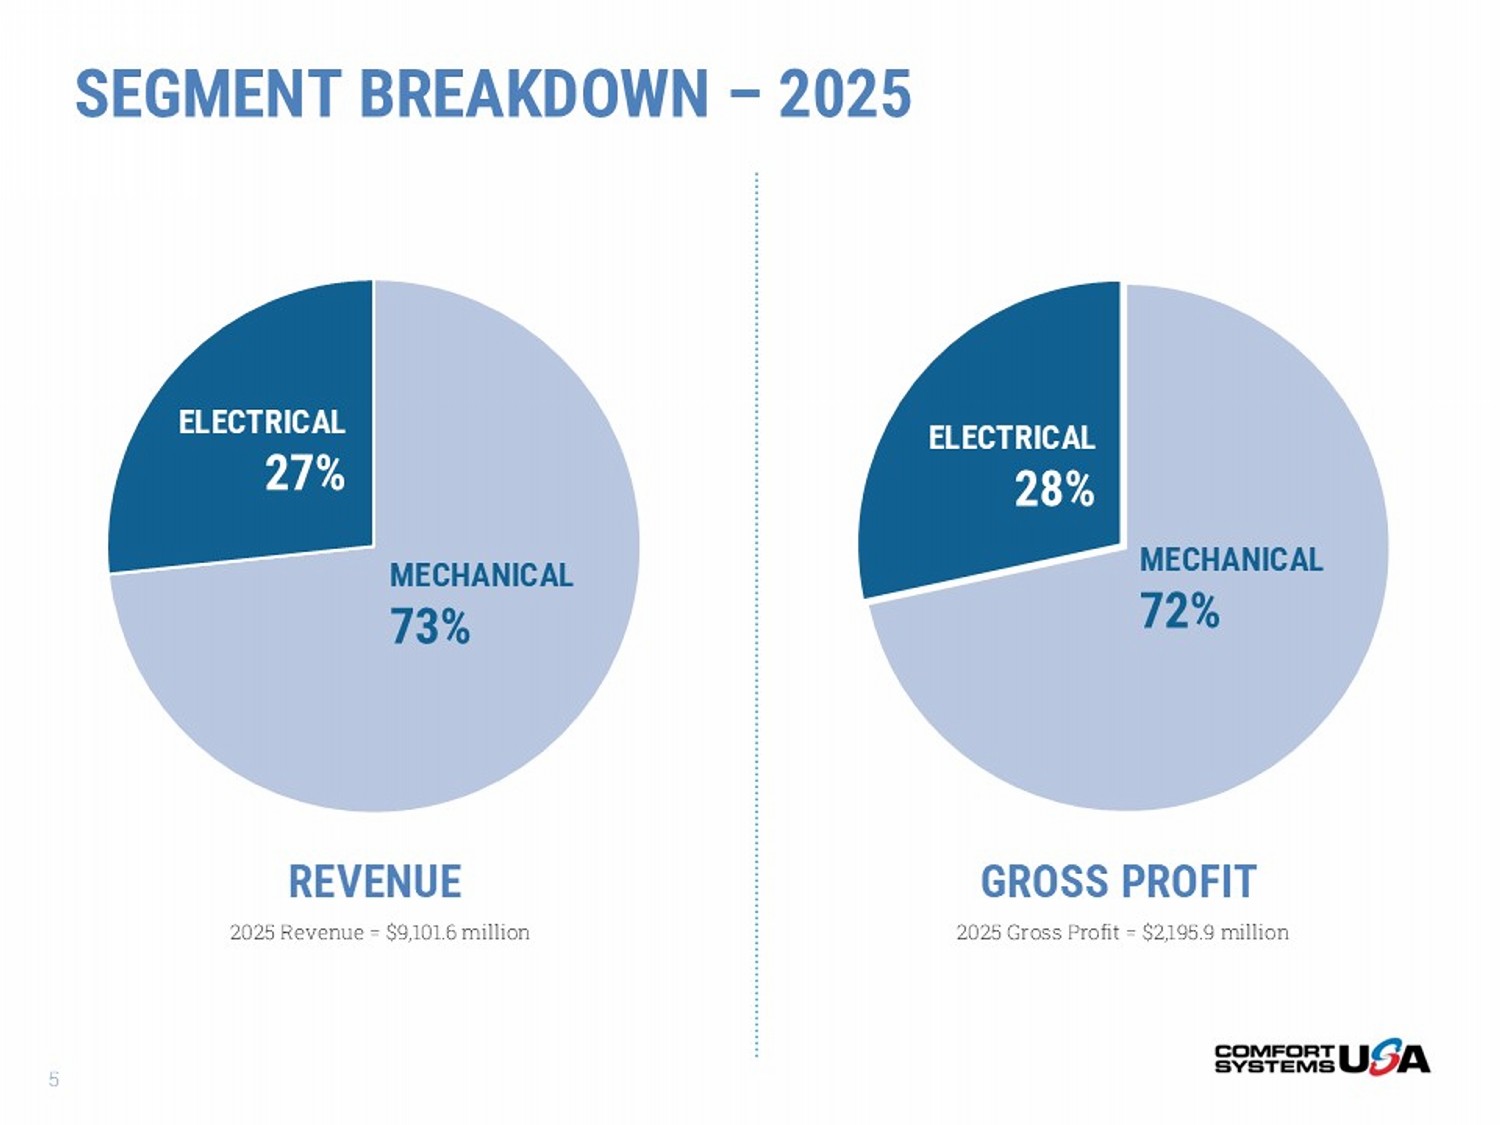
REVENUE GROSS PROFIT 2025 Gross Profit = $2,195.9 million 2025 Revenue = $9,101.6 million SEGMENT BREAKDOWN – 2025 MECHANICAL 73% ELECTRICAL 27% MECHANICAL 72% ELECTRICAL 28% 5
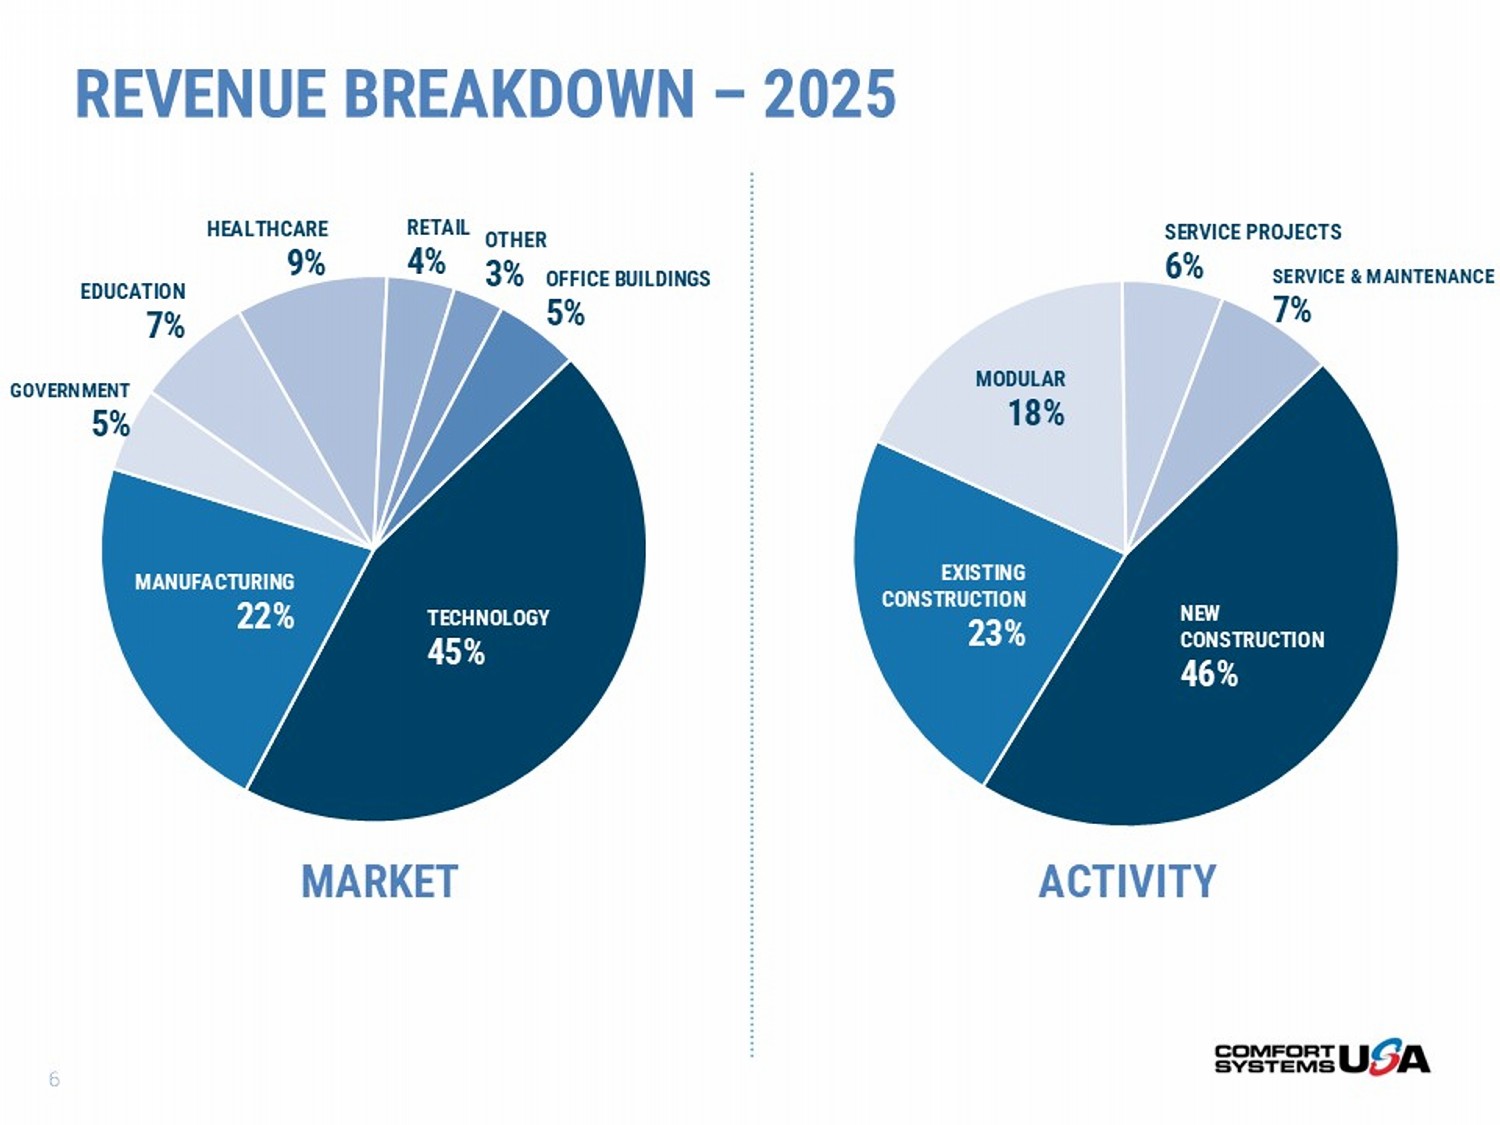
MARKET ACTIVITY REVENUE BREAKDOWN – 2025 TECHNOLOGY 45% MANUFACTURING 22% GOVERNMENT 5% EDUCATION 7% HEALTHCARE 9% RETAIL 4% OTHER 3% OFFICE BUILDINGS 5% NEW CONSTRUCTION 46% EXISTING CONSTRUCTION 23% MODULAR 18% SERVICE PROJECTS 6% SERVICE & MAINTENANCE 7% 6
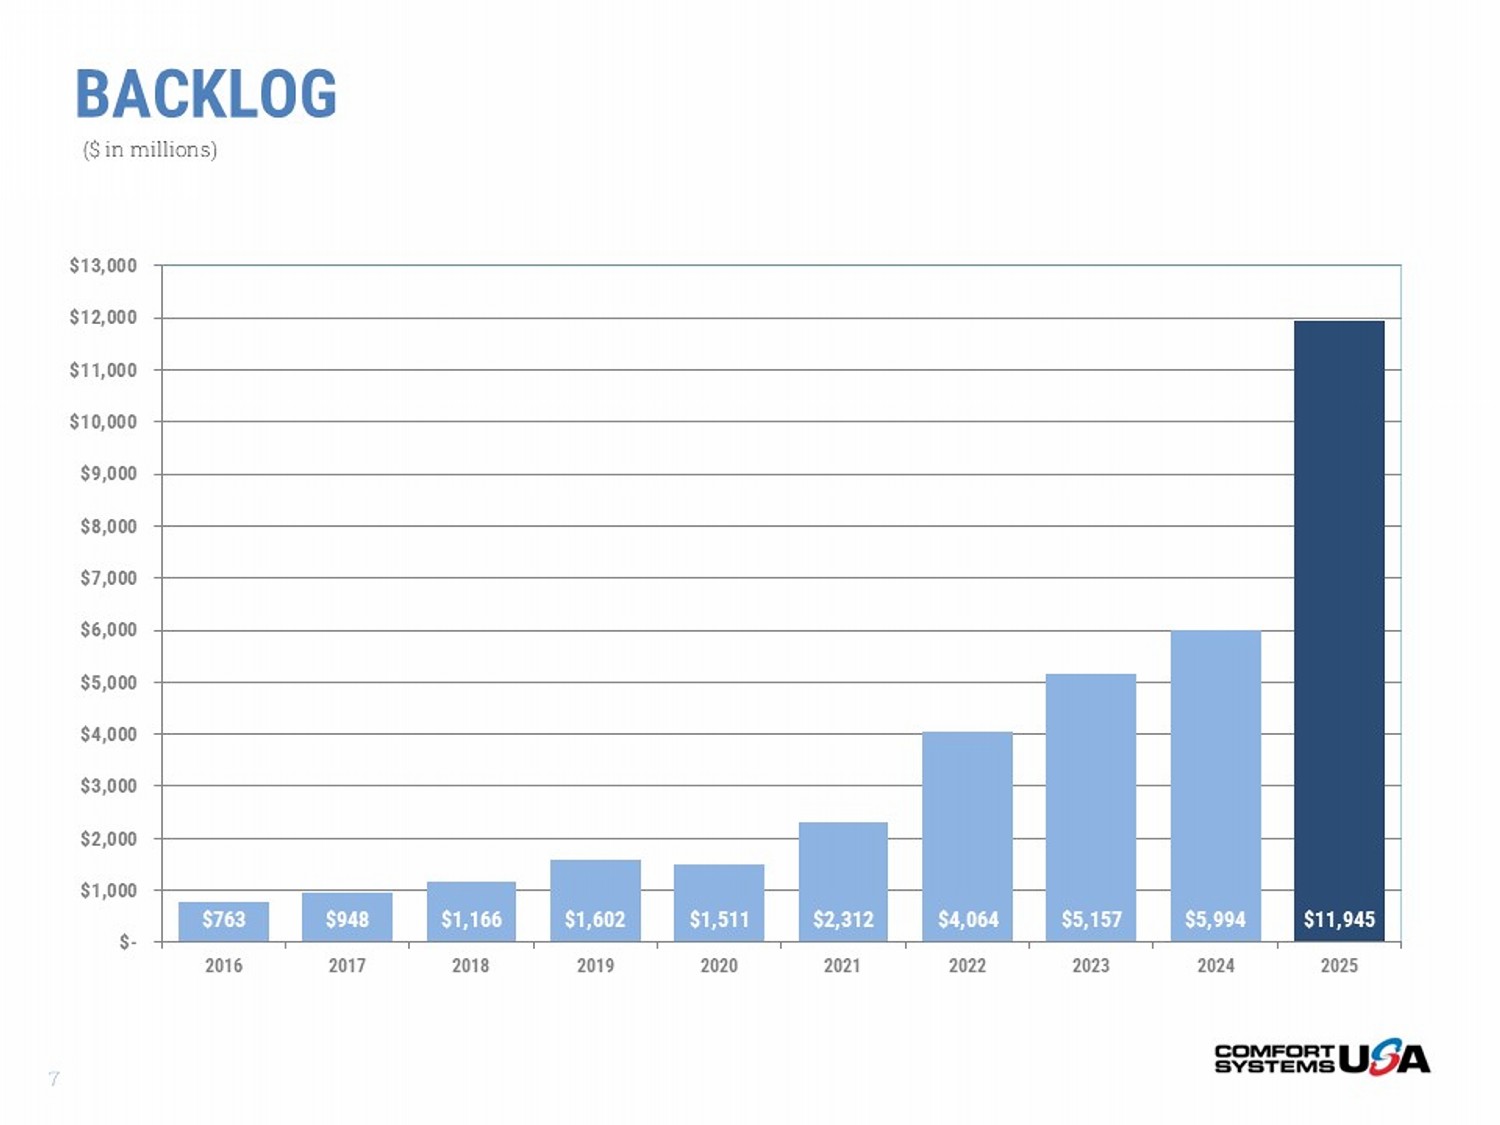
BACKLOG $763 $948 $1,166 $1,602 $1,511 $2,312 $4,064 $5,157 $5,994 $11,945 $- $1,000 $2,000 $3,000 $4,000 $5,000 $6,000 $7,000 $8,000 $9,000 $10,000 $11,000 $12,000 $13,000 2016 2017 2018 2019 2020 2021 2022 2023 2024 2025 ($ in millions) 7
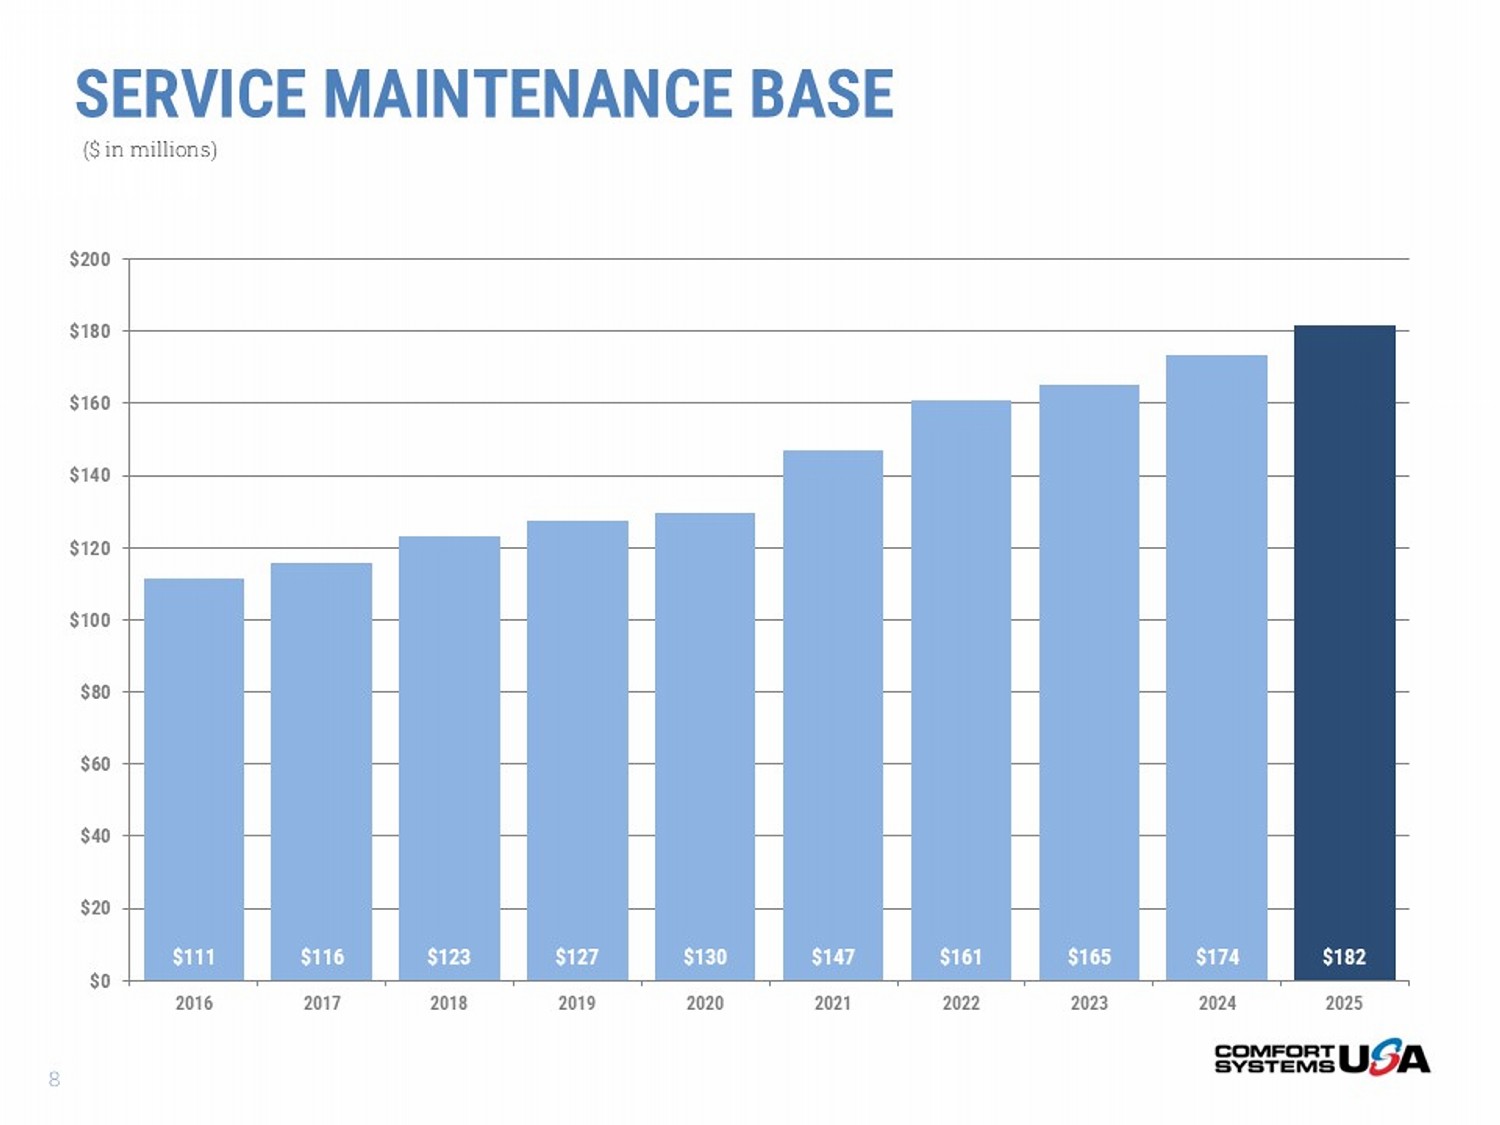
$111 $116 $123 $127 $130 $147 $161 $165 $174 $182 $0 $20 $40 $60 $80 $100 $120 $140 $160 $180 $200 2016 2017 2018 2019 2020 2021 2022 2023 2024 2025 SERVICE MAINTENANCE BASE ($ in millions) 8
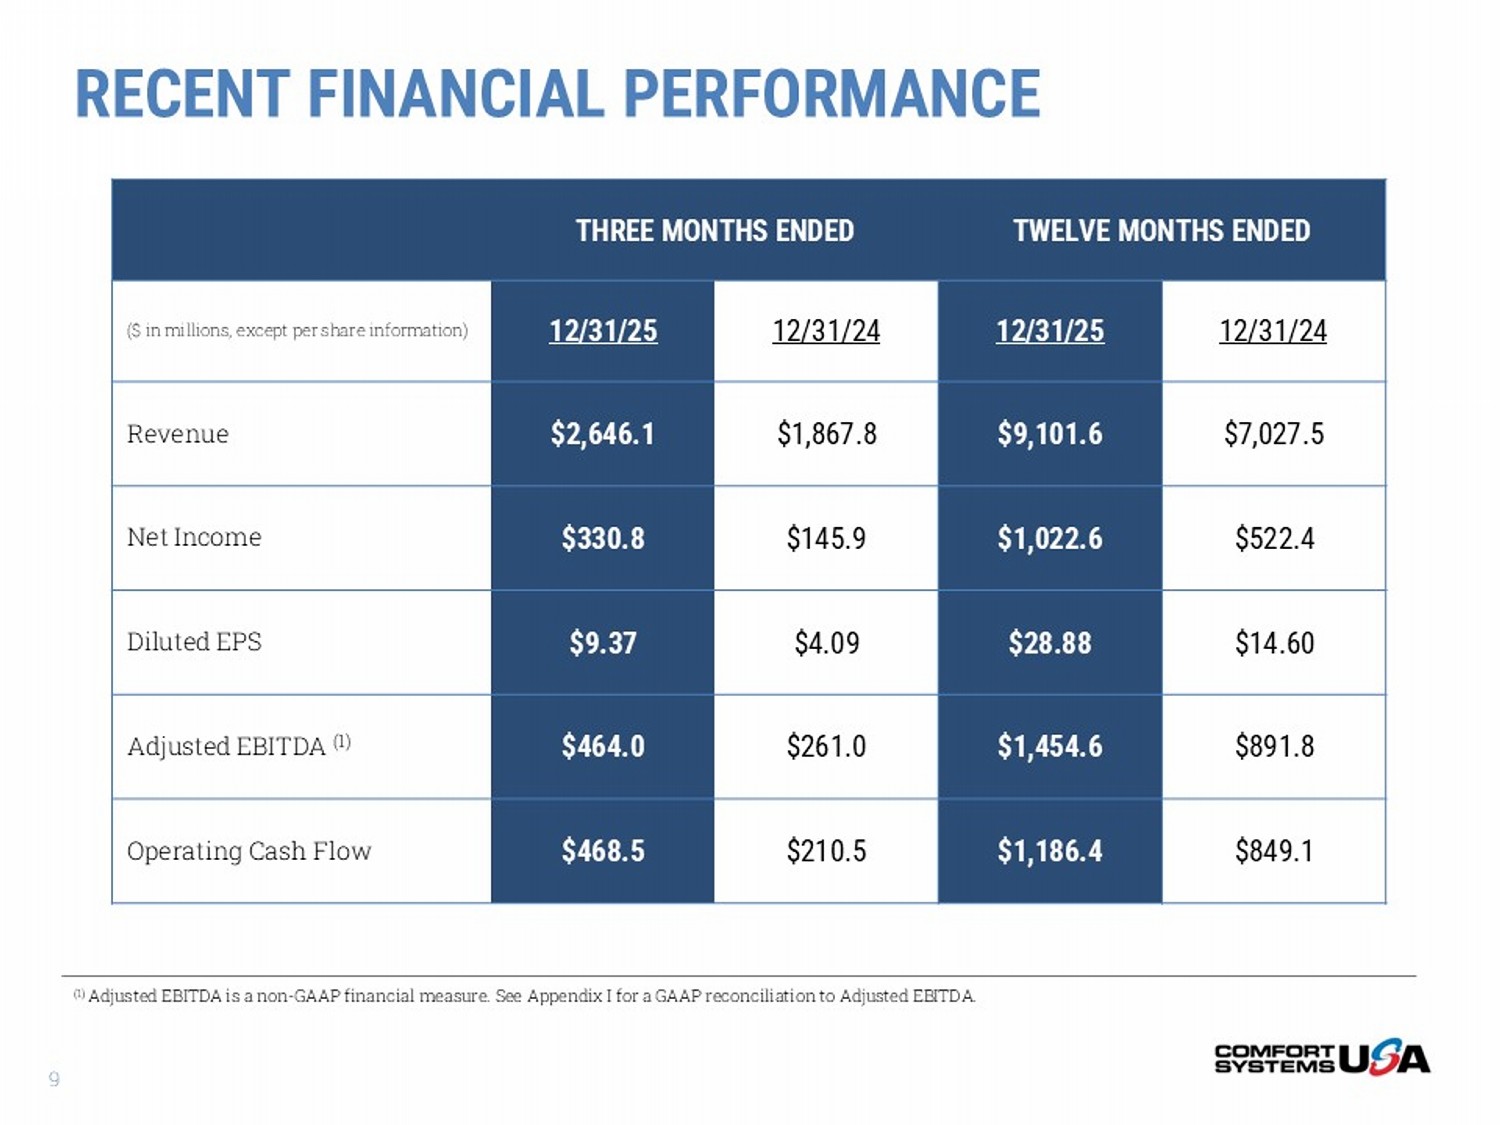
TWELVE MONTHS ENDED THREE MONTHS ENDED 12/31/24 12/31/25 12/31/24 12/31/25 ($ in millions, except per share information) $7,027.5 $9,101.6 $1,867.8 $2,646.1 Revenue $522.4 $1,022.6 $145.9 $330.8 Net Income $14.60 $28.88 $4.09 $9.37 Diluted EPS $891.8 $1,454.6 $261.0 $464.0 Adjusted EBITDA (1) $849.1 $1,186.4 $210.5 $468.5 Operating Cash Flow (1) Adjusted EBITDA is a non - GAAP financial measure. See Appendix I for a GAAP reconciliation to Adjusted EBITDA. RECENT FINANCIAL PERFORMANCE 9
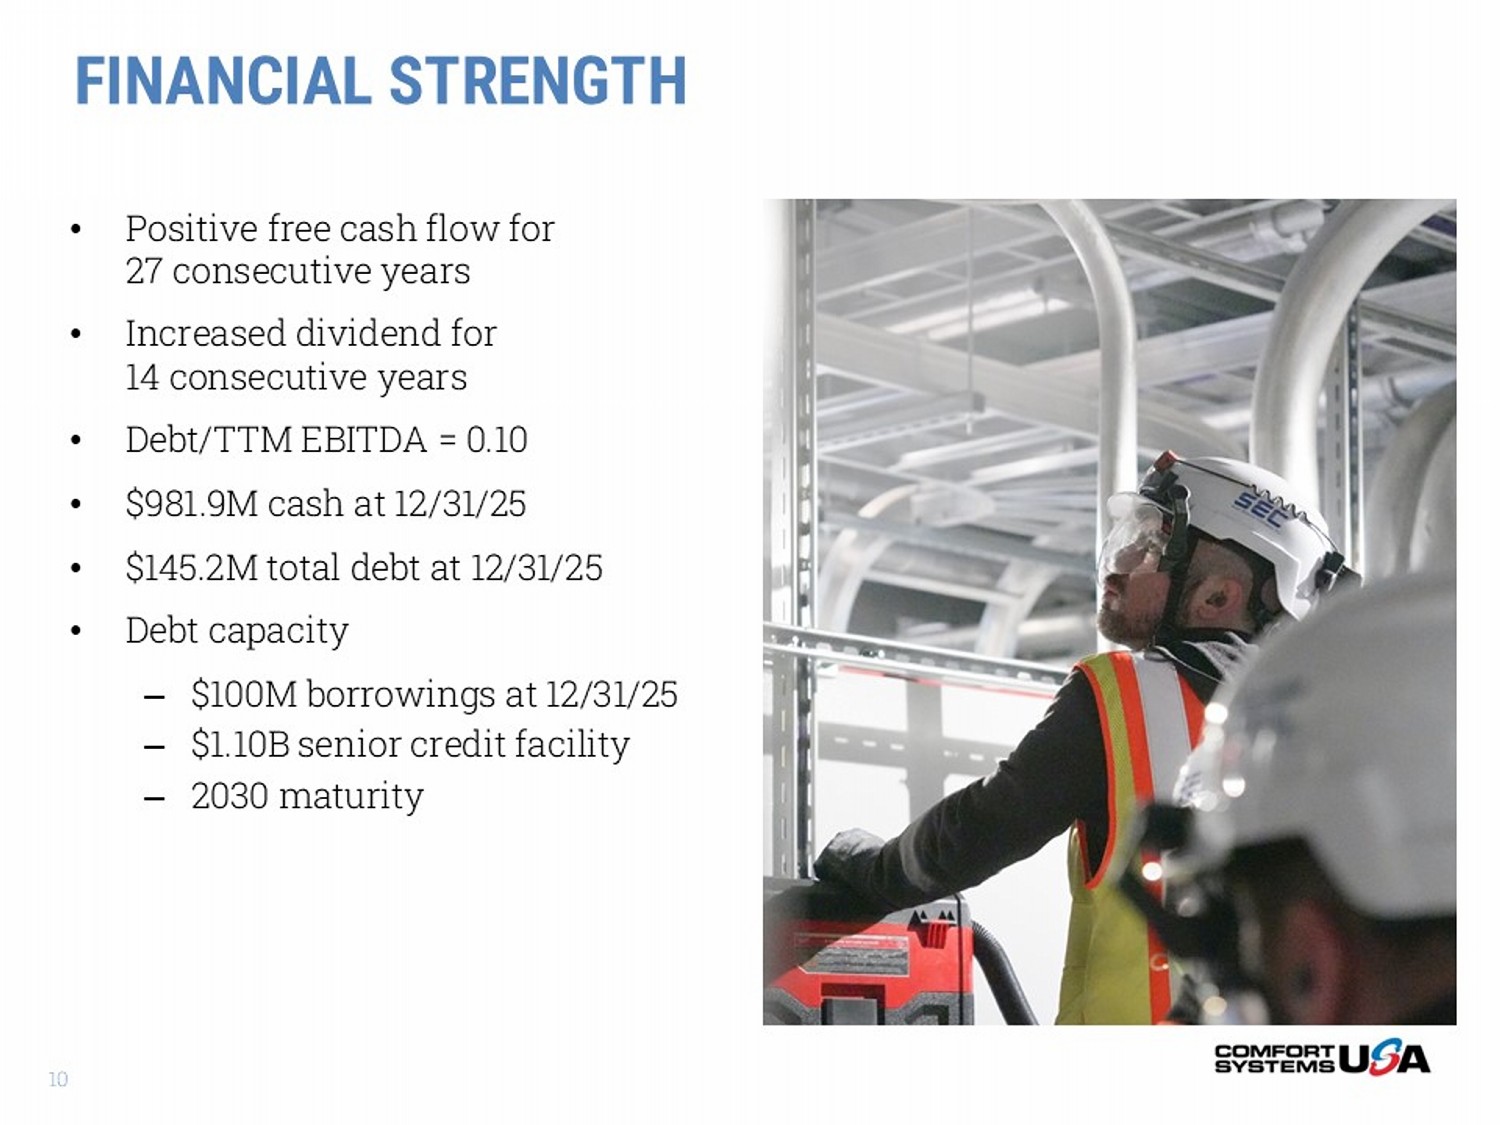
FINANCIAL STRENGTH • Positive free cash flow for 27 consecutive years • Increased dividend for 14 consecutive years • Debt/TTM EBITDA = 0.10 • $981.9M cash at 12/31/25 • $145.2M total debt at 12/31/25 • Debt capacity – $100M borrowings at 12/31/25 – $1.10B senior credit facility – 2030 maturity 10
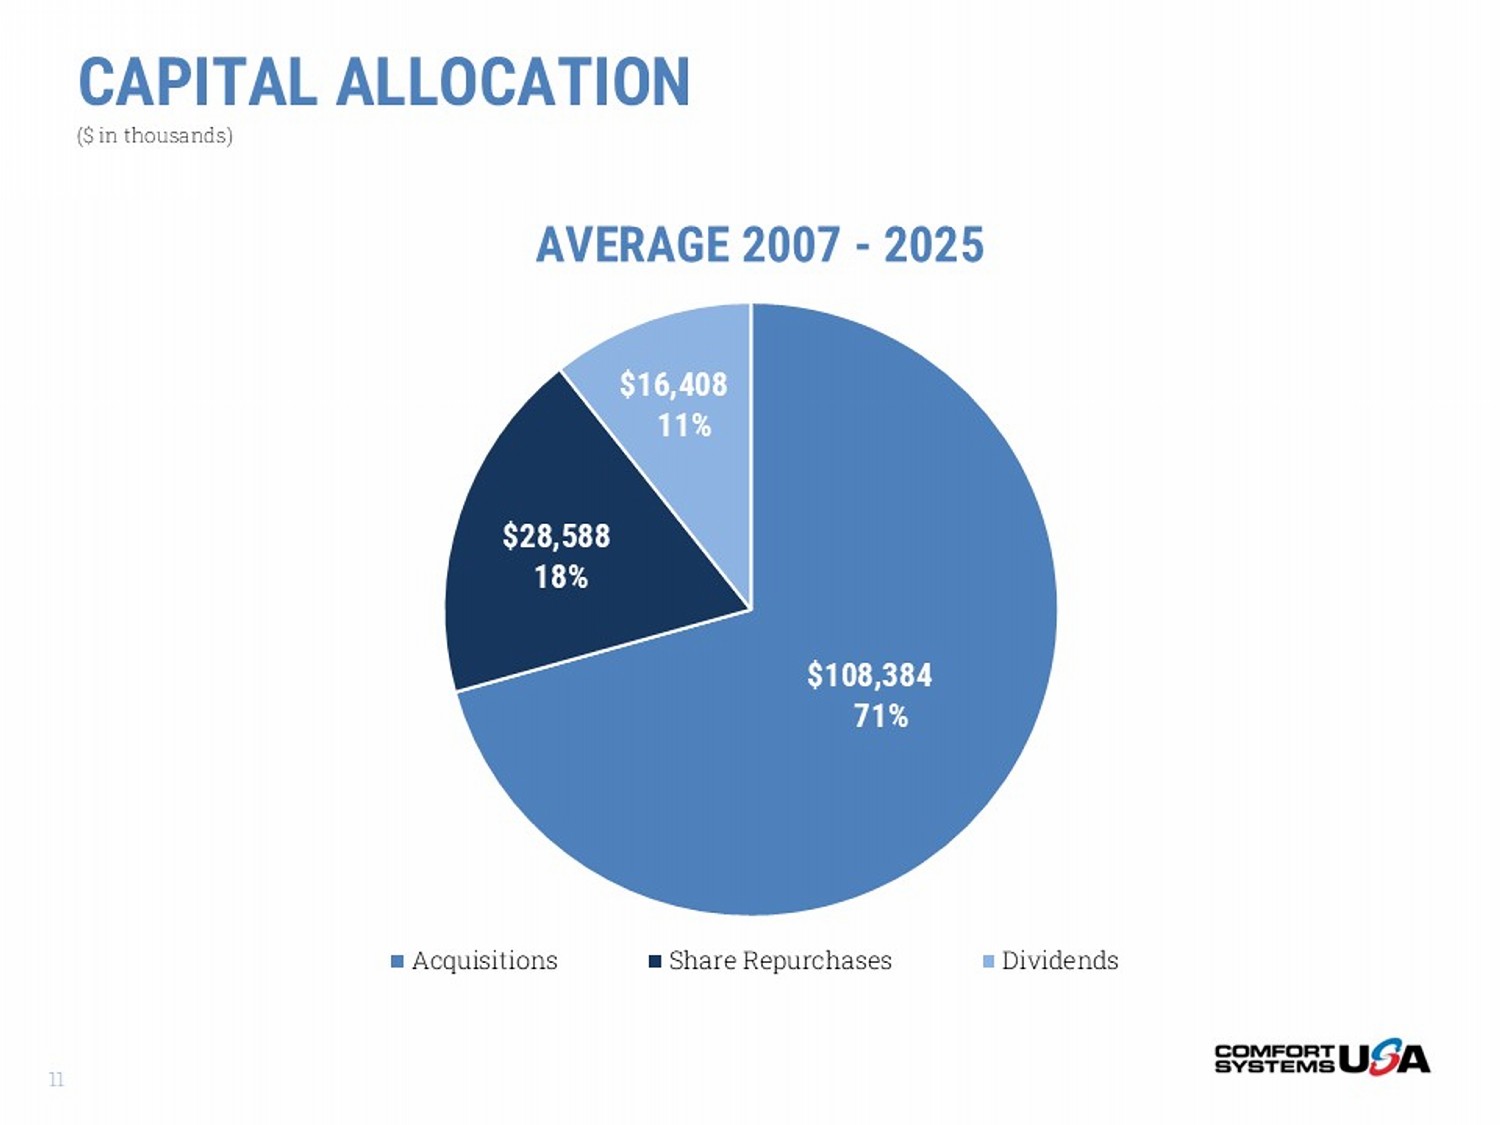
$108,384 71% $28,588 18% $16,408 11% AVERAGE 2007 - 2025 Acquisitions Share Repurchases Dividends CAPITAL ALLOCATION ($ in thousands) 11
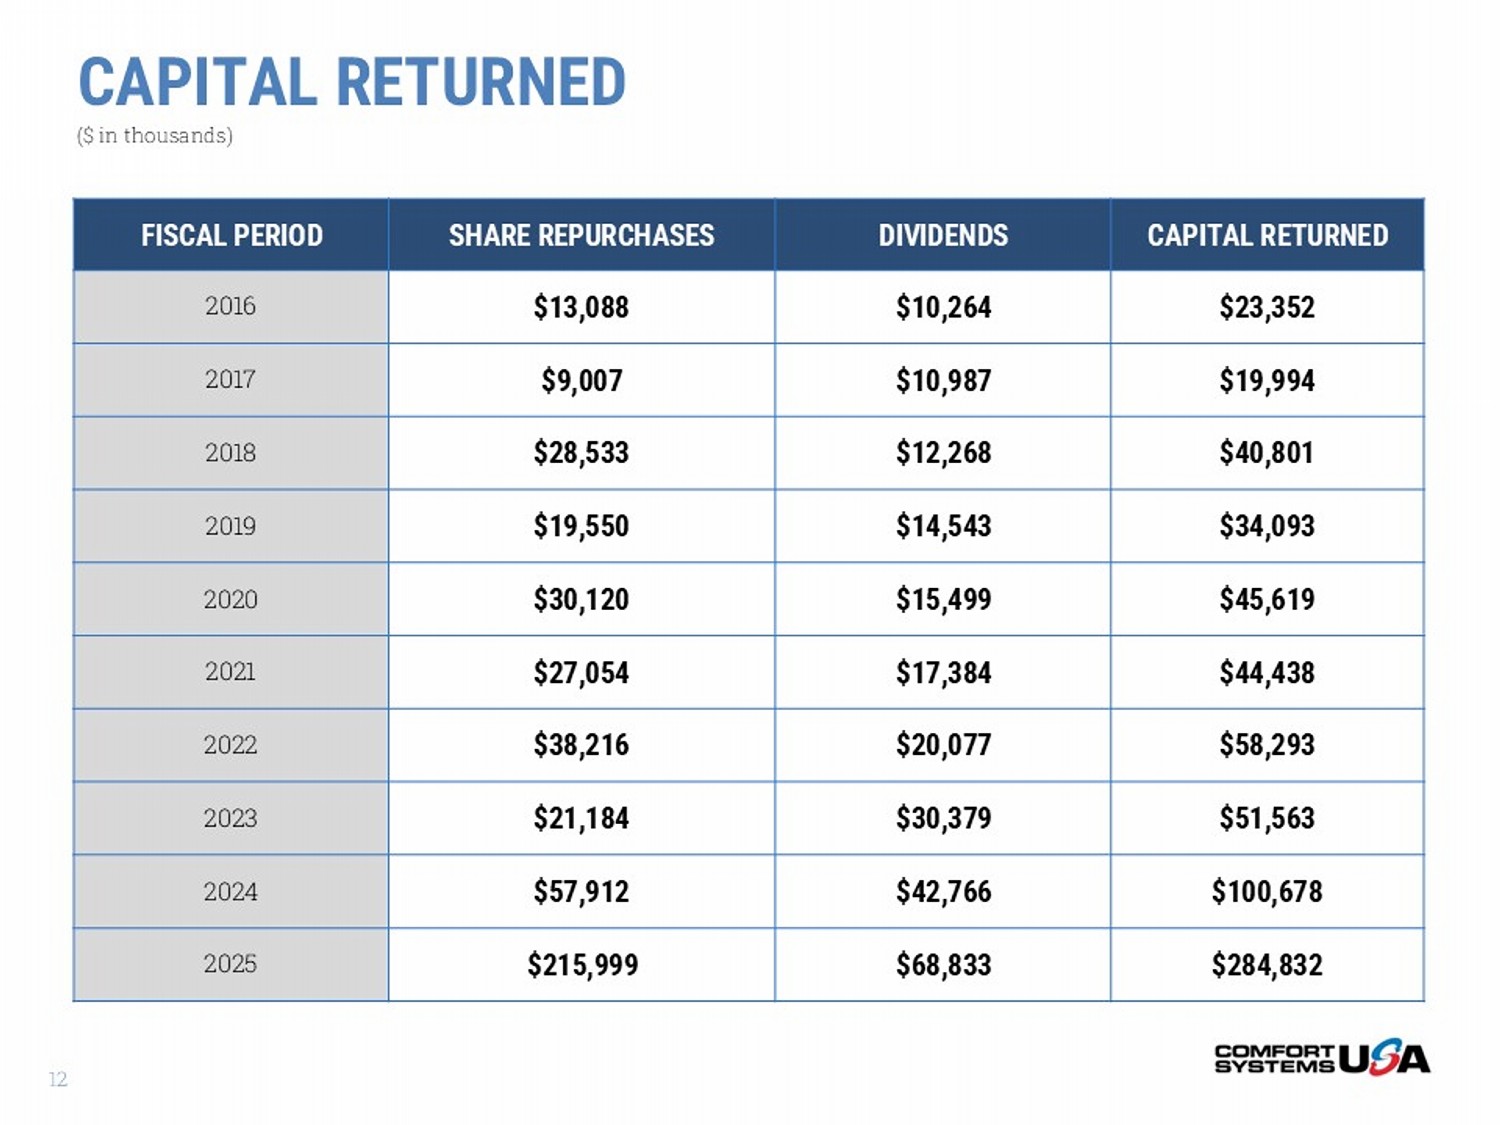
CAPITAL RETURNED ($ in thousands) CAPITAL RETURNED DIVIDENDS SHARE REPURCHASES FISCAL PERIOD $23,352 $10,264 $13,088 2016 $19,994 $10,987 $9,007 2017 $40,801 $12,268 $28,533 2018 $34,093 $14,543 $19,550 2019 $45,619 $15,499 $30,120 2020 $44,438 $17,384 $27,054 2021 $58,293 $20,077 $38,216 2022 $51,563 $30,379 $21,184 2023 $100,678 $42,766 $57,912 2024 $284,832 $68,833 $215,999 2025 12
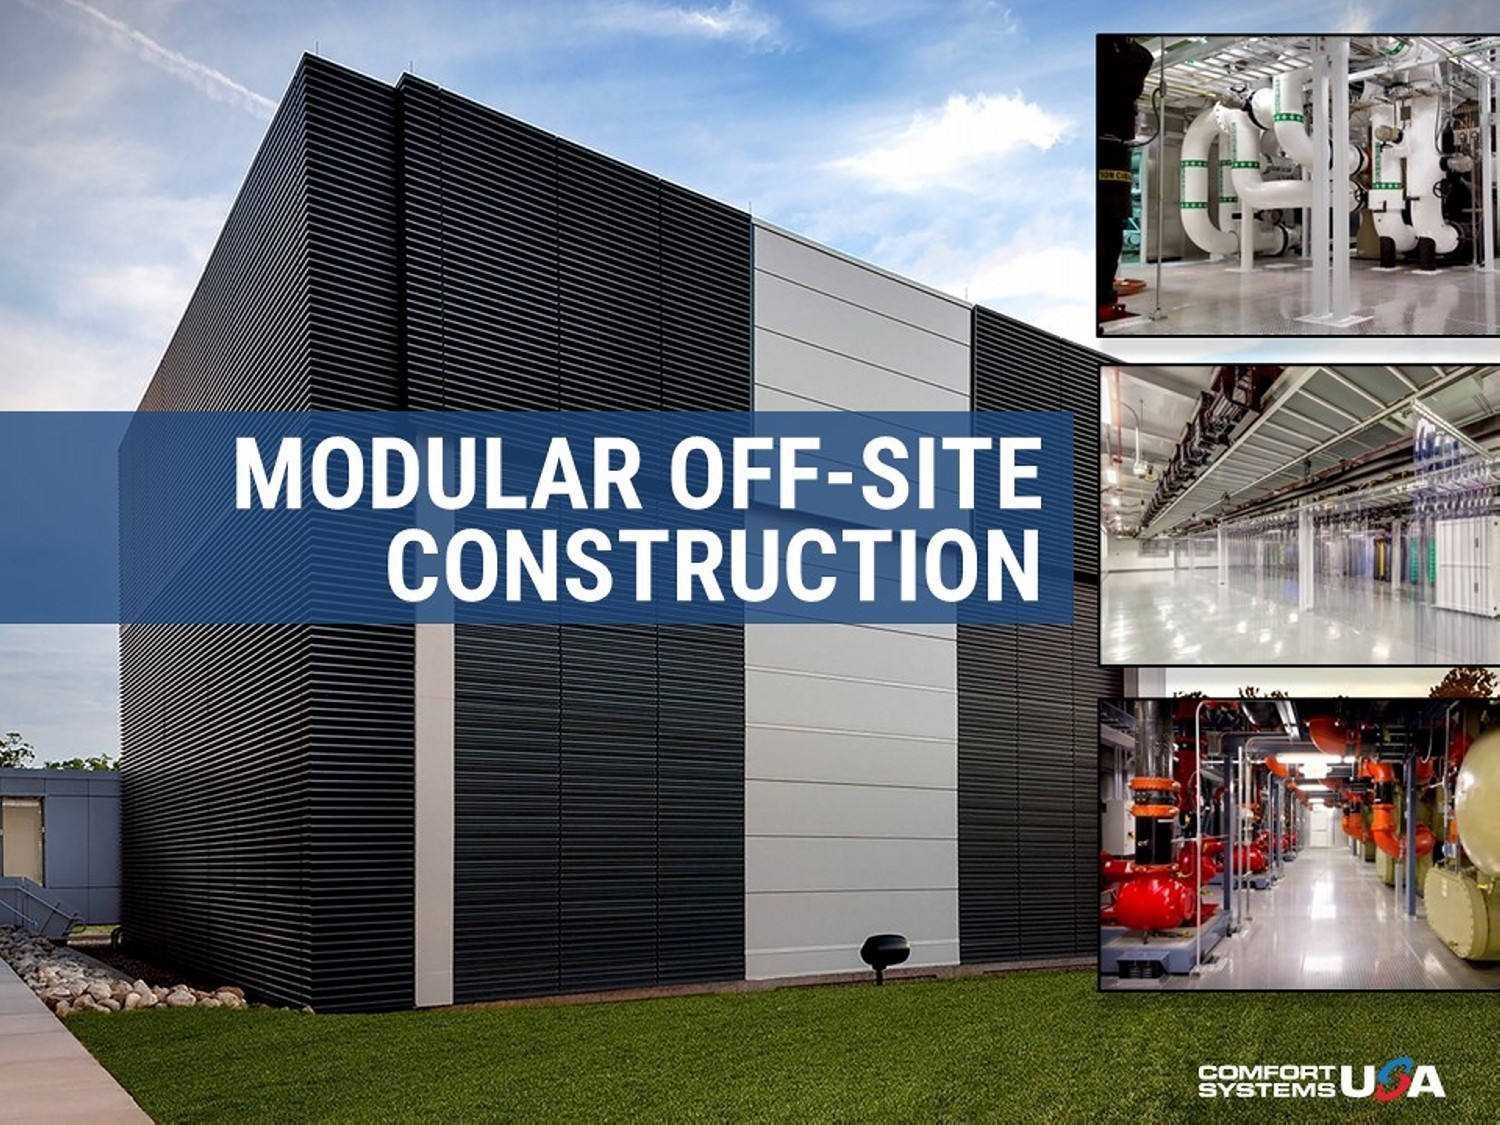
MODULAR OFF - SITE CONSTRUCTION
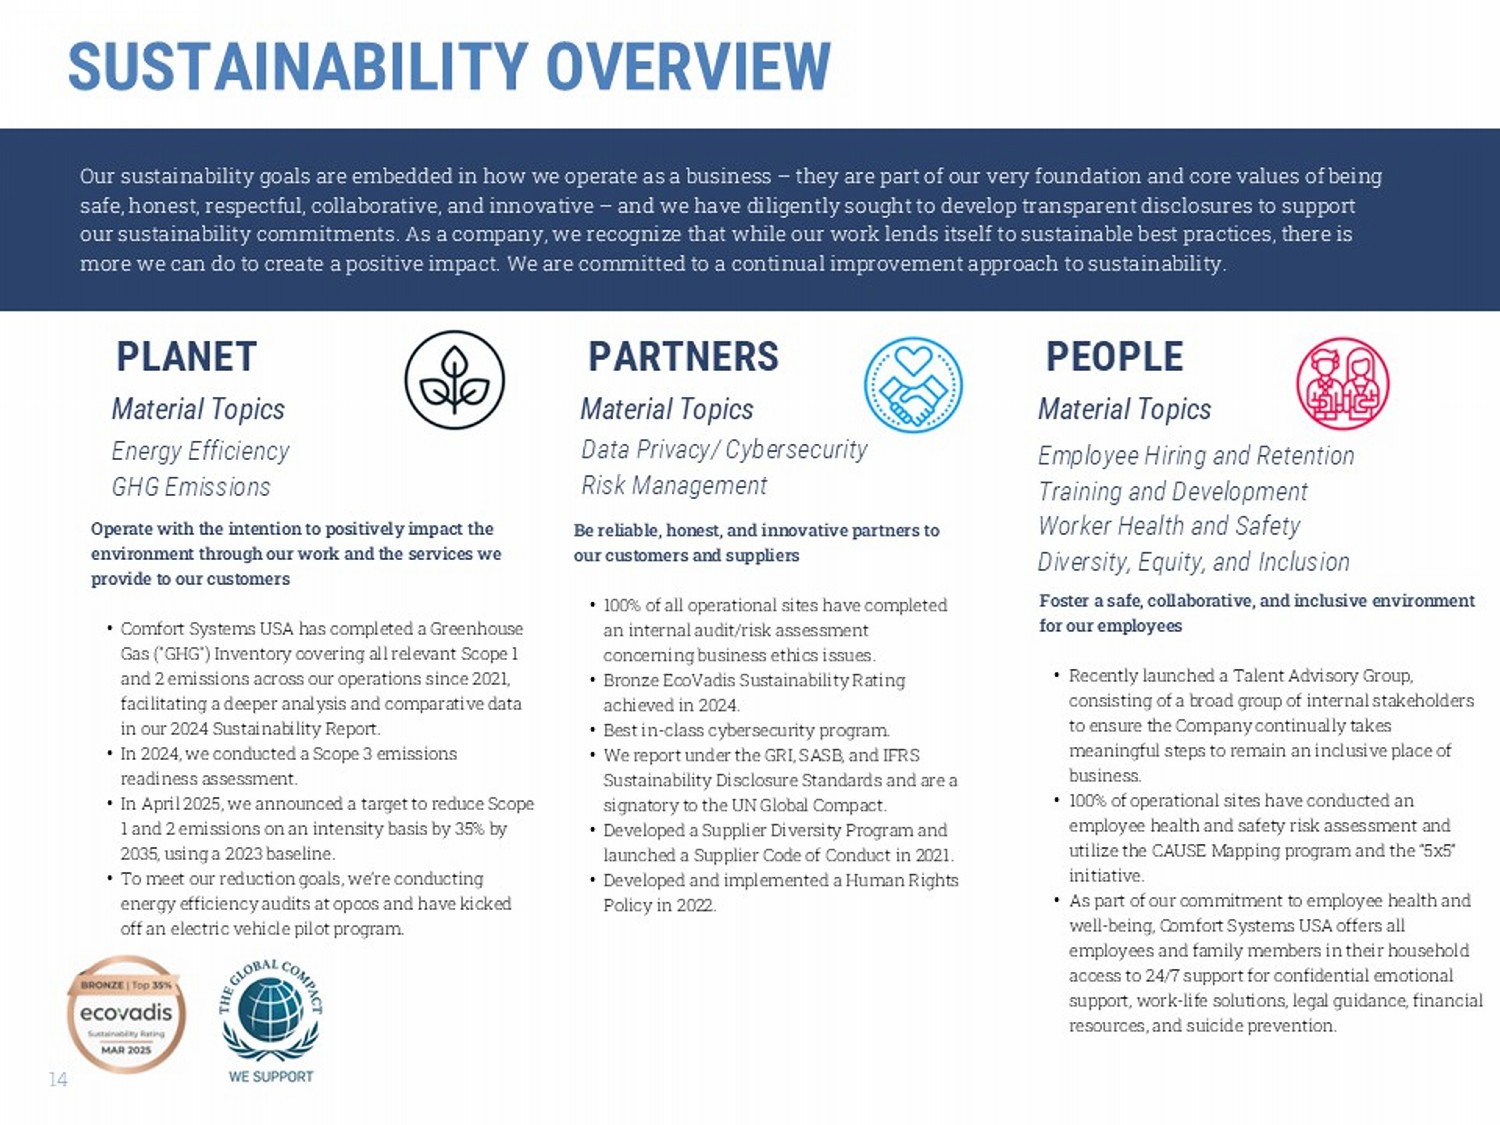
Foster a safe, collaborative, and inclusive environment for our employees • Recently launched a Talent Advisory Group, consisting of a broad group of internal stakeholders to ensure the Company continually takes meaningful steps to remain an inclusive place of business. • 100% of operational sites have conducted an employee health and safety risk assessment and utilize the CAUSE Mapping program and the “5x5” initiative. • As part of our commitment to employee health and well - being, Comfort Systems USA offers all employees and family members in their household access to 24/7 support for confidential emotional support, work - life solutions, legal guidance, financial resources, and suicide prevention. Our sustainability goals are embedded in how we operate as a business – they are part of our very foundation and core values of being safe, honest, respectful, collaborative, and innovative – and we have diligently sought to develop transparent disclosures to su pport our sustainability commitments. As a company, we recognize that while our work lends itself to sustainable best practices, th ere is more we can do to create a positive impact. We are committed to a continual improvement approach to sustainability. PEOPLE PARTNERS PLANET Be reliable, honest, and innovative partners to our customers and suppliers • 100% of all operational sites have completed an internal audit/risk assessment concerning business ethics issues. • Bronze EcoVadis Sustainability Rating achieved in 2024. • Best in - class cybersecurity program. • We report under the GRI, SASB, and IFRS Sustainability Disclosure Standards and are a signatory to the UN Global Compact. • Developed a Supplier Diversity Program and launched a Supplier Code of Conduct in 2021. • Developed and implemented a Human Rights Policy in 2022. Operate with the intention to positively impact the environment through our work and the services we provide to our customers • Comfort Systems USA has completed a Greenhouse Gas ("GHG") Inventory covering all relevant Scope 1 and 2 emissions across our operations since 2021, facilitating a deeper analysis and comparative data in our 2024 Sustainability Report. • In 2024, we conducted a Scope 3 emissions readiness assessment. • In April 2025, we announced a target to reduce Scope 1 and 2 emissions on an intensity basis by 35% by 2035, using a 2023 baseline. • To meet our reduction goals, we’re conducting energy efficiency audits at opcos and have kicked off an electric vehicle pilot program. Energy Efficiency GHG Emissions Data Privacy/ Cybersecurity Risk Management Employee Hiring and Retention Training and Development Worker Health and Safety Diversity, Equity, and Inclusion Material Topics Material Topics Material Topics SUSTAINABILITY OVERVIEW 14 14
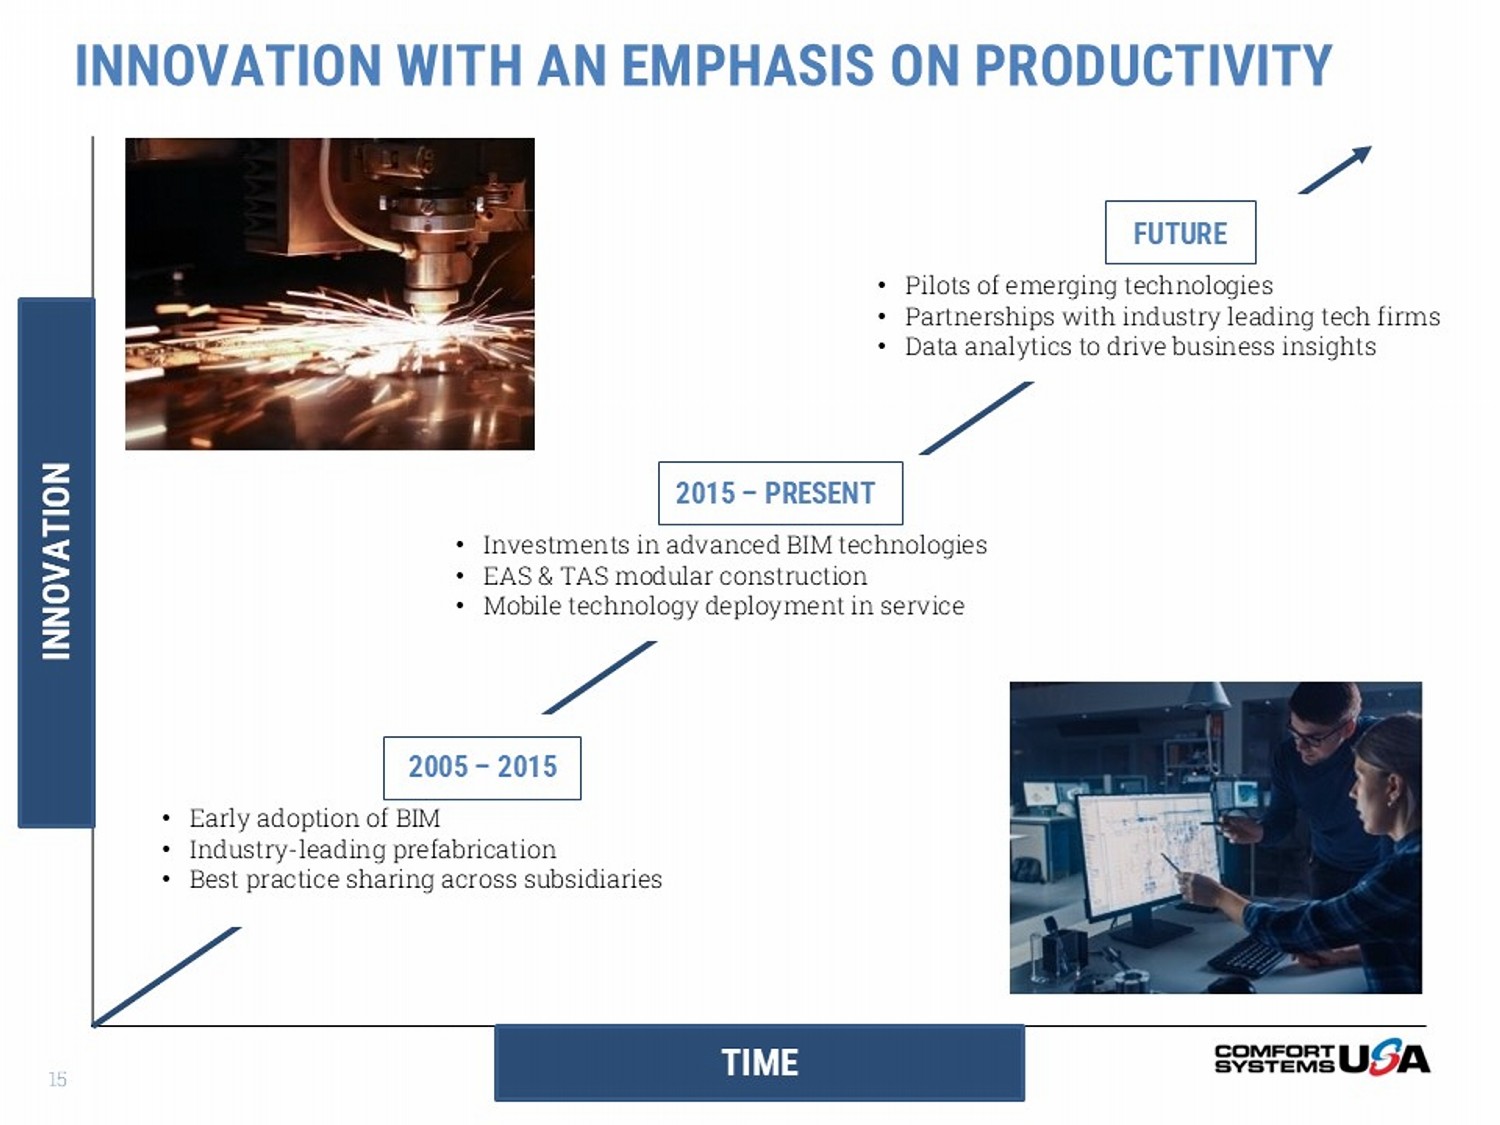
TIME INNOVATION INNOVATION WITH AN EMPHASIS ON PRODUCTIVITY 2005 – 2015 • Early adoption of BIM • Industry - leading prefabrication • Best practice sharing across subsidiaries 2015 – PRESENT • Investments in advanced BIM technologies • EAS & TAS modular construction • Mobile technology deployment in service FUTURE • Pilots of emerging technologies • Partnerships with industry leading tech firms • Data analytics to drive business insights 15
Be safe Be honest Be respectful Be innovative Be collaborative OUR VALUES 16
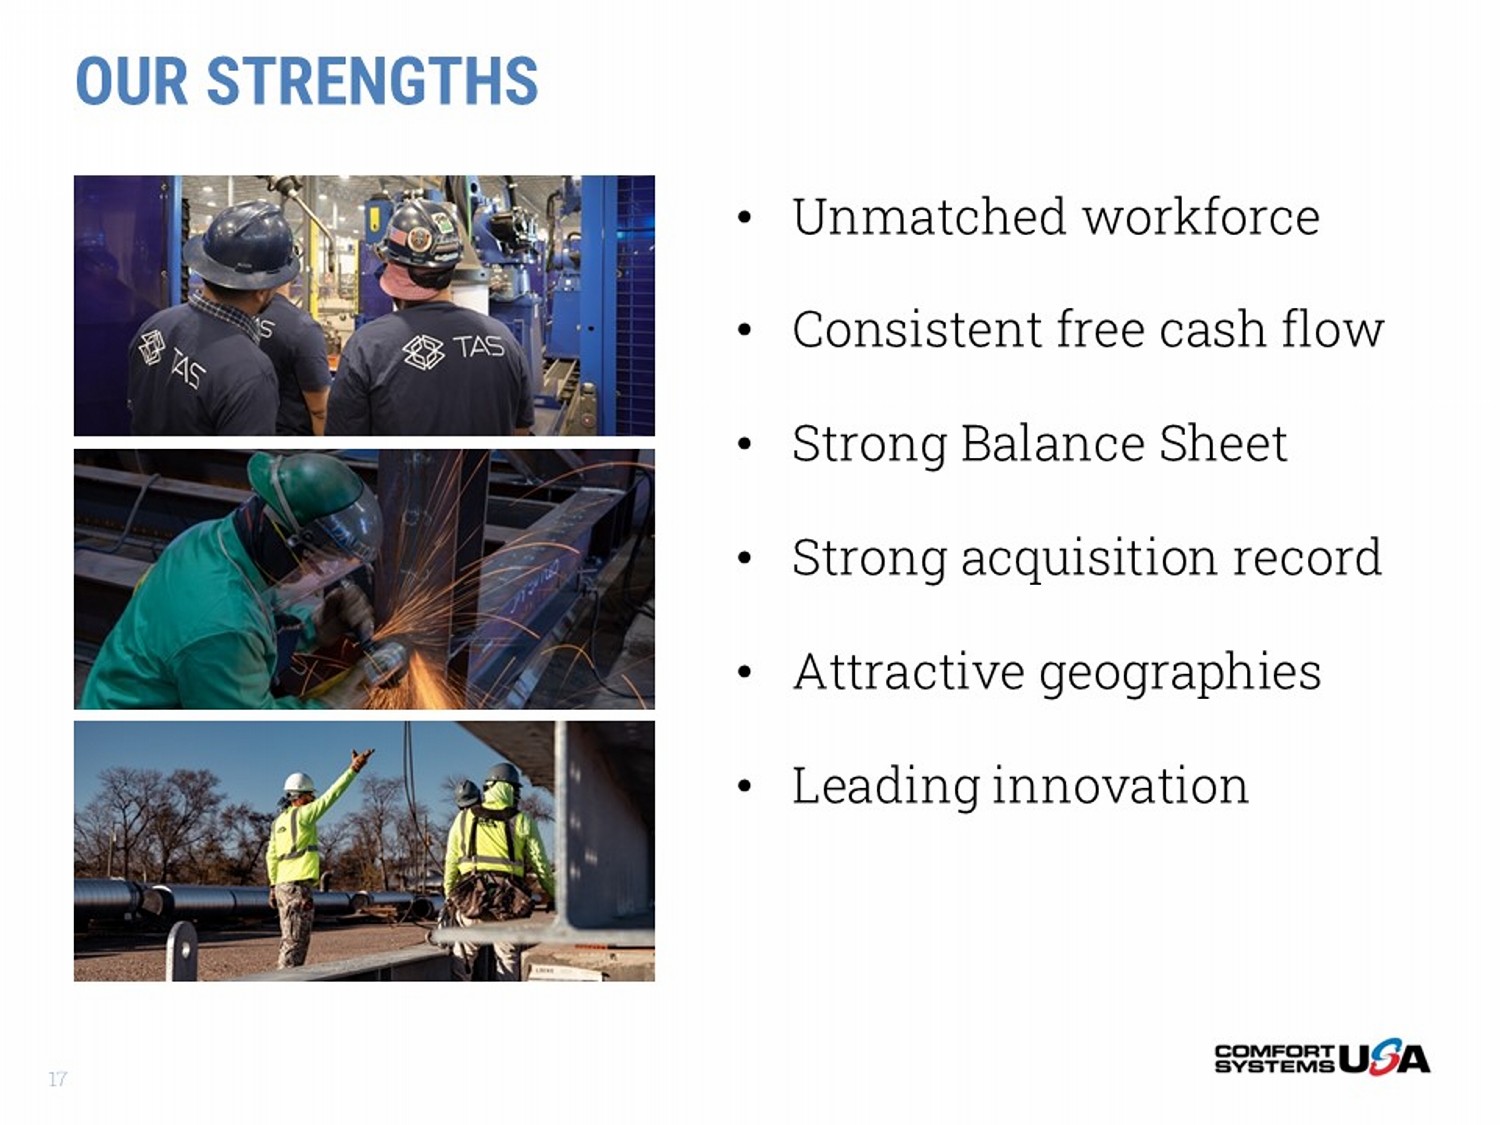
OUR STRENGTHS • Unmatched workforce • Consistent free cash flow • Strong Balance Sheet • Strong acquisition record • Attractive geographies • Leading innovation 17
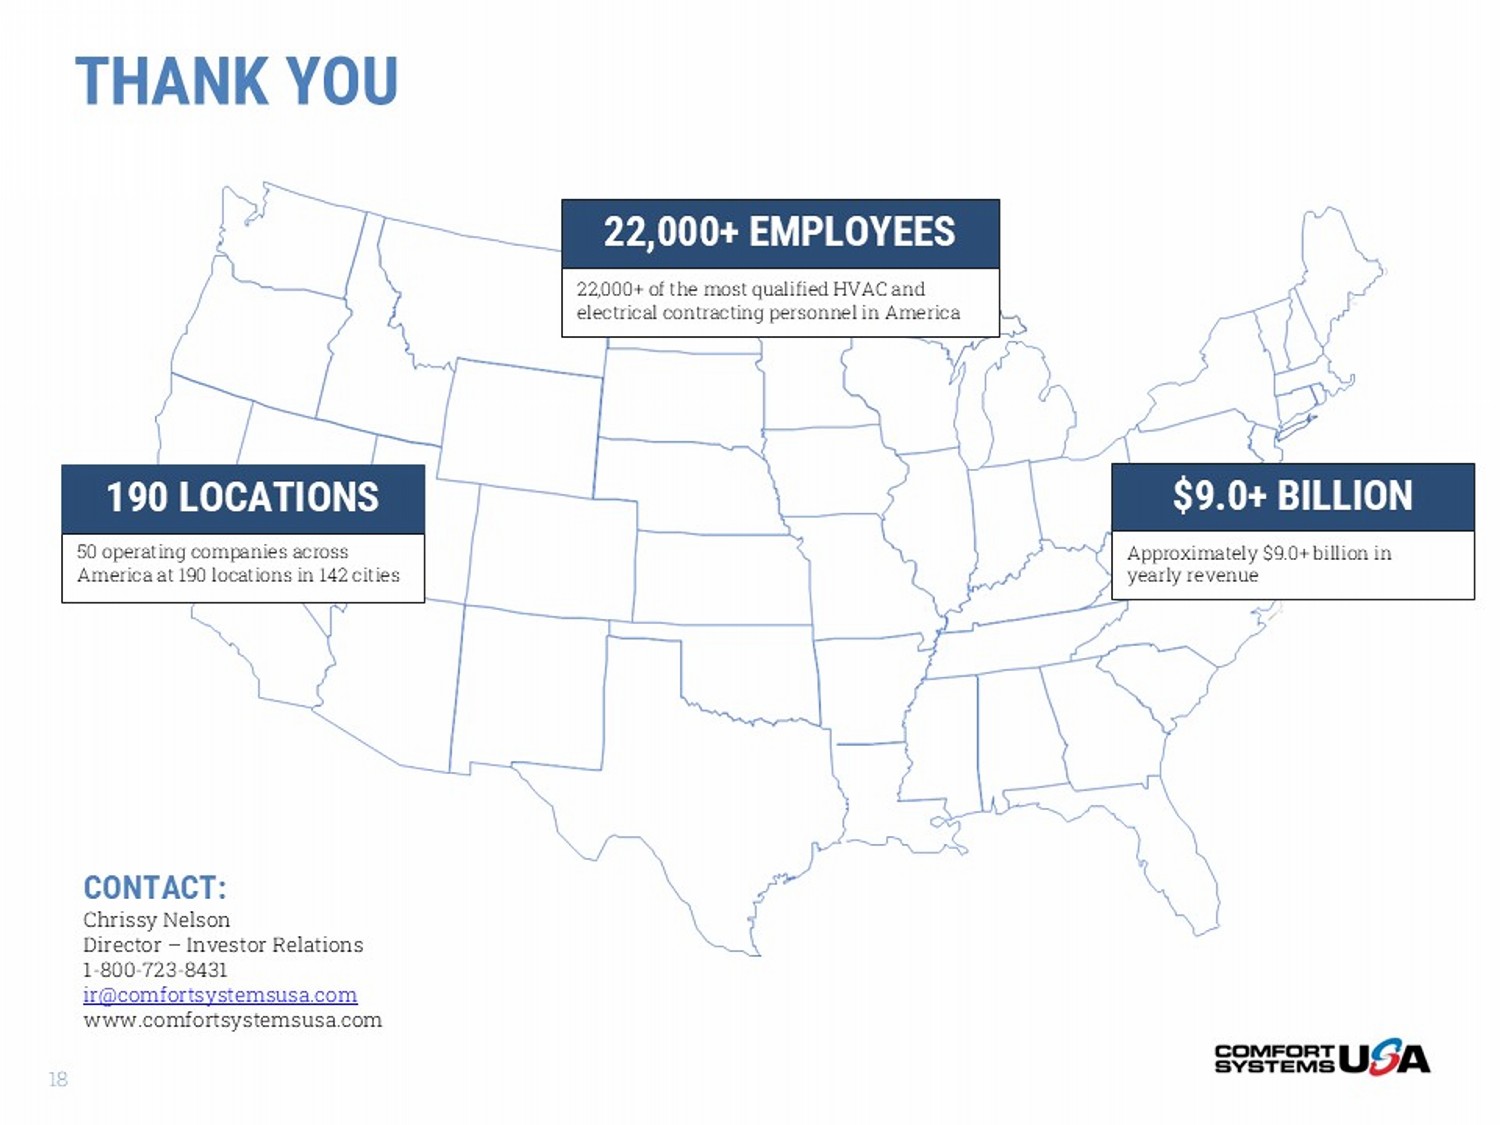
THANK YOU 190 LOCATIONS 50 operating companies across America at 190 locations in 142 cities 22,000+ of the most qualified HVAC and electrical contracting personnel in America 22,000+ EMPLOYEES $9.0+ BILLION Approximately $9.0+ billion in yearly revenue CONTACT: Chrissy Nelson Director – Investor Relations 1 - 800 - 723 - 8431 ir@comfortsystemsusa.com www.comfortsystemsusa.com 18
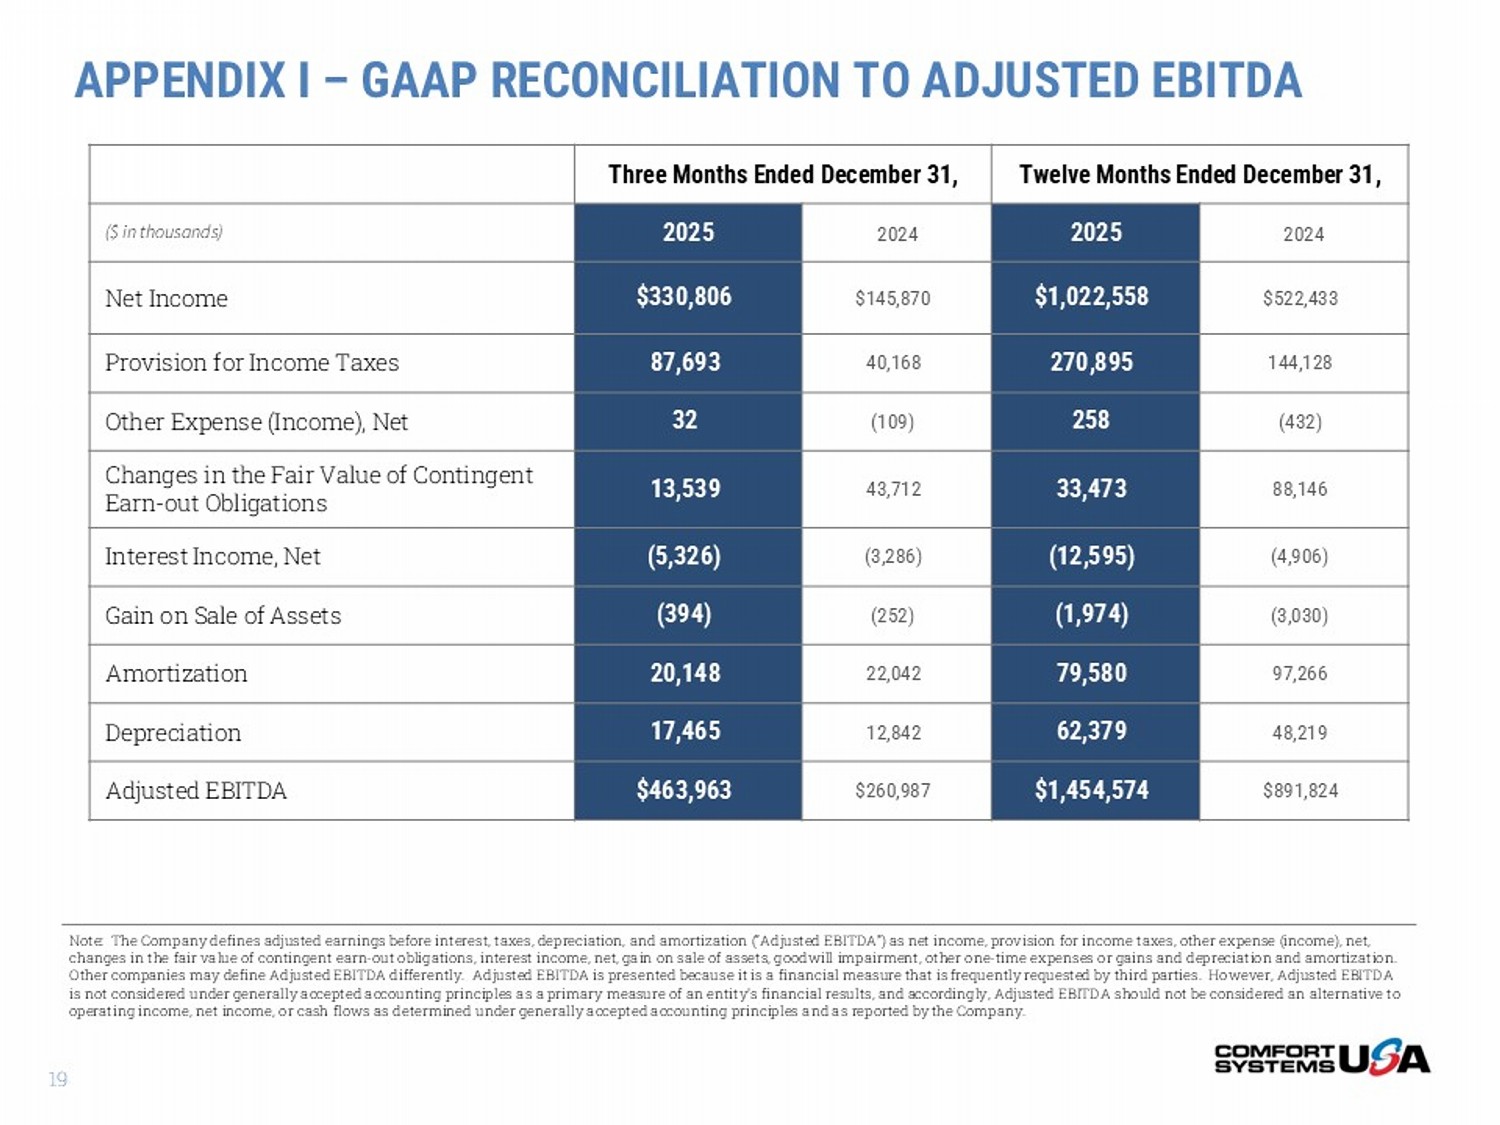
APPENDIX I – GAAP RECONCILIATION TO ADJUSTED EBITDA Twelve Months Ended December 31, Three Months Ended December 31, 2024 2025 2024 2025 ($ in thousands) $522,433 $1,022,558 $145,870 $330,806 Net Income 144,128 270,895 40,168 87,693 Provision for Income Taxes (432) 258 (109) 32 Other Expense (Income), Net 88,146 33,473 43,712 13,539 Changes in the Fair Value of Contingent Earn - out Obligations (4,906) (12,595) (3,286) (5,326) Interest Income, Net (3,030) (1,974) (252) (394) Gain on Sale of Assets 97,266 79,580 22,042 20,148 Amortization 48,219 62,379 12,842 17,465 Depreciation $891,824 $1,454,574 $260,987 $463,963 Adjusted EBITDA Note: The Company defines adjusted earnings before interest, taxes, depreciation, and amortization (“Adjusted EBITDA”) as ne t i ncome, provision for income taxes, other expense (income), net, changes in the fair value of contingent earn - out obligations, interest income, net, gain on sale of assets, goodwill impairment, other one - time expenses or gains and depreciation and amortization. Other companies may define Adjusted EBITDA differently. Adjusted EBITDA is presented because it is a financial measure that is frequently requested by third parties. However, Adjusted EBITDA is not considered under generally accepted accounting principles as a primary measure of an entity’s financial results, and a cco rdingly, Adjusted EBITDA should not be considered an alternative to operating income, net income, or cash flows as determined under generally accepted accounting principles and as reported by t he Company. 19