| 1 INVESTOR CALL 4Q 2025 January 21, 2026, 10:00am ET Webcast: www.smartbank.com (Investor Relations) Audio Only: 1 -833 -470 -1428 Access Code: 680807 Miller Welborn Chairman of the Board Billy Carroll President & CEO Ron Gorczynski CFO |
| Forward-Looking Statements This presentation may contain statements that are based on management’s current estimates or expectations of future events or future results, and that may be deemed to constitute forward-looking statements as defined under the Private Securities Litigation Reform Act of 1995. These statements on SmartFinancial Inc.’s (“SmartFinancial”) business and financial results and conditions, are not historical in nature and can generally be identified by such words as “expect,” “anticipate,” “intend,” “plan,” “believe,” “seek,” “may,” “estimate,” and similar expressions. All forward-looking statements are subject to risks, uncertainties, and other factors that may cause the actual results of SmartFinancial to differ materially from future results expressed or implied by such forward-looking statements. Such risks, uncertainties, and other factors include, among others, (1) risks associated with our growth strategy, including a failure to implement our growth plans or an inability to manage our growth effectively; (2) claims and litigation arising from our business activities and from the companies we acquire, which may relate to contractual issues, environmental laws, fiduciary responsibility, and other matters; (3) general risks related to our disposition merger and acquisition activity, including risks associated with our pursuit of future acquisitions or sales; (4) changes in management’s plans for the future; (5) prevailing, or changes in, economic or political conditions (including those resulting from the current administration and Congress), particularly in our market areas, including the effects of declines in the real estate market, high unemployment rates, inflationary pressures, elevated interest rates and slowdowns in economic growth, as well as the financial stress on borrowers as a result of the foregoing; (6) our ability to anticipate interest rate changes and manage interest rate risk (including the impact of higher interest rates on macroeconomic conditions, competition, and the cost of doing business and the impact of interest rate fluctuations on our financial projections, models and guidance); (7) tariffs or trade wars (including reduced consumer spending, lower economic growth or recession, reduced demand for U.S. exports, disruptions to supply chains, and decreased demand for other banking products and services); (8) uncertain duration of trade conflicts and the magnitude of the impact that proposed tariffs may have on our customers’ businesses; (9) increased technology and cybersecurity risks, including generative artificial intelligence risks; (10) the impact of a failure in, or breach of, our operational or security systems or infrastructure, or those of third parties with whom we do business, including as a result of cyber-attacks or an increase in the incidence or severity of fraud, illegal payments, security breaches or other illegal acts impacting us and our customers; (11) credit risk associated with our lending activities; (12) changes in loan demand, real estate values, or competition; (13) developments in our mortgage banking business, including loan modifications, general demand, and the effects of judicial or regulatory requirements or guidance; (14) changes in accounting principles, policies, or guidelines; (15) changes in applicable laws, rules, or regulations; (16) adverse results from current or future litigation, regulatory examinations or other legal and/or regulatory actions; (17) potential impacts of any adverse developments in the banking industry, including the impacts on customer confidence, deposit outflows, liquidity and the regulatory response thereto; (18) significant turbulence or a disruption in the capital or financial markets and the effect of a fall in stock market prices on our investment securities; (19) the effects of war or other conflicts; (20) the impact of government actions or inactions, including a prolonged shutdown of the federal government; and (21) other general competitive, economic, political, and market factors, including those affecting our business, operations, pricing, products, or services. These and other factors that could cause results to differ materially from those described in the forward-looking statements can be found in SmartFinancial’s most recent annual report on Form 10-K, quarterly reports on Form 10-Q, and current reports on Form 8-K, in each case filed with or furnished to the Securities and Exchange Commission (the “SEC”) and available on the SEC’s website (www.sec.gov). Undue reliance should not be placed on forward-looking statements. SmartFinancial disclaims any obligation to update or revise any forward-looking statements contained in this presentation, which speak only as of the date hereof, whether as a result of new information, future events, or otherwise. DISCLOSURES 2 Non-GAAP Financial Measures Statements included in this presentation include measures not recognized under U.S. generally accepted accounting principles (“GAAP”) and therefore are considered Non-GAAP financial measures (“Non-GAAP”) and should be read along with the accompanying tables, which provide a reconciliation of Non-GAAP financial measures to GAAP financial measures. SmartFinancial management uses several Non-GAAP financial measures and ratios derived therefrom in its analysis of SmartFinancial's performance, including: (i) Operating revenue (ii) Operating earnings (iii) Operating noninterest income (iv) Operating noninterest expense (v) Operating pre-provision net revenue (“PPNR”) earnings (vi) Tangible common equity (vii) Tangible common equity (excluding Accumulated Other Comprehensive income (“AOCI”)) (viii) Average tangible common equity (ix) Tangible book value per common share (x) Tangible book value per common share (excluding AOCI) (xi) Tangible assets (xii) Operating efficiency ratio Operating earnings, operating revenue, operating PPNR earnings, operating noninterest income and operating noninterest expense exclude non-operating related income and expense items from net income, noninterest income and noninterest expense, respectively. Operating efficiency ratio is the quotient of operating noninterest expense divided by the sum of net interest income adjusted for taxable equivalent yields plus operating noninterest income. Tangible common equity and average tangible common equity excludes goodwill and other intangible assets from shareholders' equity and average shareholders' equity, respectively. Tangible common equity (excluding AOCI) excludes goodwill and other intangible assets from shareholders’ equity and accumulated other comprehensive income. Tangible book value per common share is tangible common equity divided by common shares outstanding. Tangible book value per common share (excluding AOCI) is tangible common equity (excluding AOCI) divided by common shares outstanding. Tangible assets excludes goodwill and other intangibles from total assets. A detailed reconciliation of these items and the ratios derived therefrom is available in the Non-GAAP reconciliations. Management believes that Non-GAAP financial measures provide additional useful information that allows investors to evaluate the ongoing performance of the company and provide meaningful comparisons to its peers. Management also believes these Non-GAAP financial measures enhance investors' ability to compare period-to-period financial results and allow investors and company management to view our operating results excluding the impact of items that are not reflective of the underlying operating performance. Non-GAAP financial measures should not be considered as an alternative to any measure of performance or financial condition as promulgated under GAAP, and investors should consider SmartFinancial's performance and financial condition as reported under GAAP and all other relevant information when assessing the performance or financial condition of the company. Non-GAAP financial measures have limitations as analytical tools, and investors should not consider them in isolation or as a substitute for analysis of the results or financial condition as reported under GAAP. Unless otherwise indicated, all financial data contained in this presentation is as of 12/31/25 |
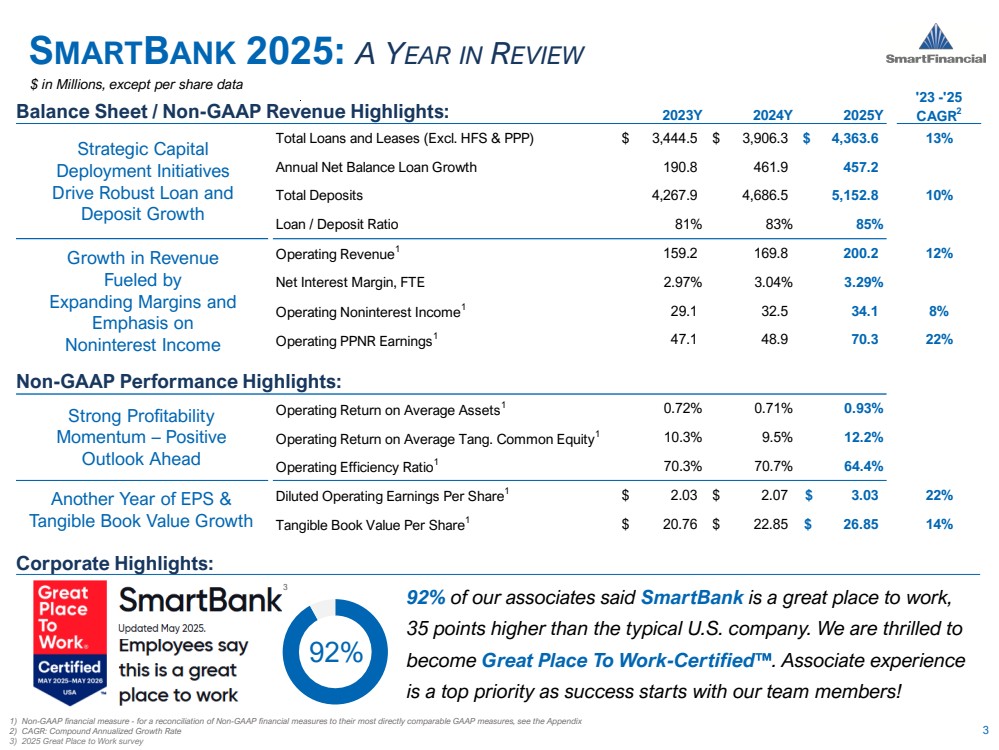
| '23 -'25 2023Y 2024Y 2025Y CAGR2 Total Loans and Leases (Excl. HFS & PPP) $ 3,444.5 $ 3,906.3 $ 4,363.6 13% Annual Net Balance Loan Growth 190.8 461.9 457.2 Total Deposits 4,267.9 4,686.5 5,152.8 10% Loan / Deposit Ratio 81% 83% 85% Operating Revenue1 159.2 169.8 200.2 12% Net Interest Margin, FTE 2.97% 3.04% 3.29% Operating Noninterest Income1 29.1 32.5 34.1 8% Operating PPNR Earnings1 47.1 48.9 70.3 22% Operating Return on Average Assets1 0.72% 0.71% 0.93% Operating Return on Average Tang. Common Equity1 10.3% 9.5% 12.2% Operating Efficiency Ratio1 70.3% 70.7% 64.4% Diluted Operating Earnings Per Share1 $ 2.03 $ 2.07 $ 3.03 22% Tangible Book Value Per Share1 $ 20.76 $ 22.85 $ 26.85 14% 3 SMARTBANK 2025: A YEAR IN REVIEW $ in Millions, except per share data Strategic Capital Deployment Initiatives Drive Robust Loan and Deposit Growth Growth in Revenue Fueled by Expanding Margins and Emphasis on Noninterest Income Another Year of EPS & Tangible Book Value Growth Strong Profitability Momentum – Positive Outlook Ahead Balance Sheet / Non-GAAP Revenue Highlights: Non-GAAP Performance Highlights: 1) Non-GAAP financial measure - for a reconciliation of Non-GAAP financial measures to their most directly comparable GAAP measures, see the Appendix 2) CAGR: Compound Annualized Growth Rate 3) 2025 Great Place to Work survey 92% of our associates said SmartBank is a great place to work, 35 points higher than the typical U.S. company. We are thrilled to become Great Place To Work-Certified . Associate experience is a top priority as success starts with our team members! Corporate Highlights: 3 92% |
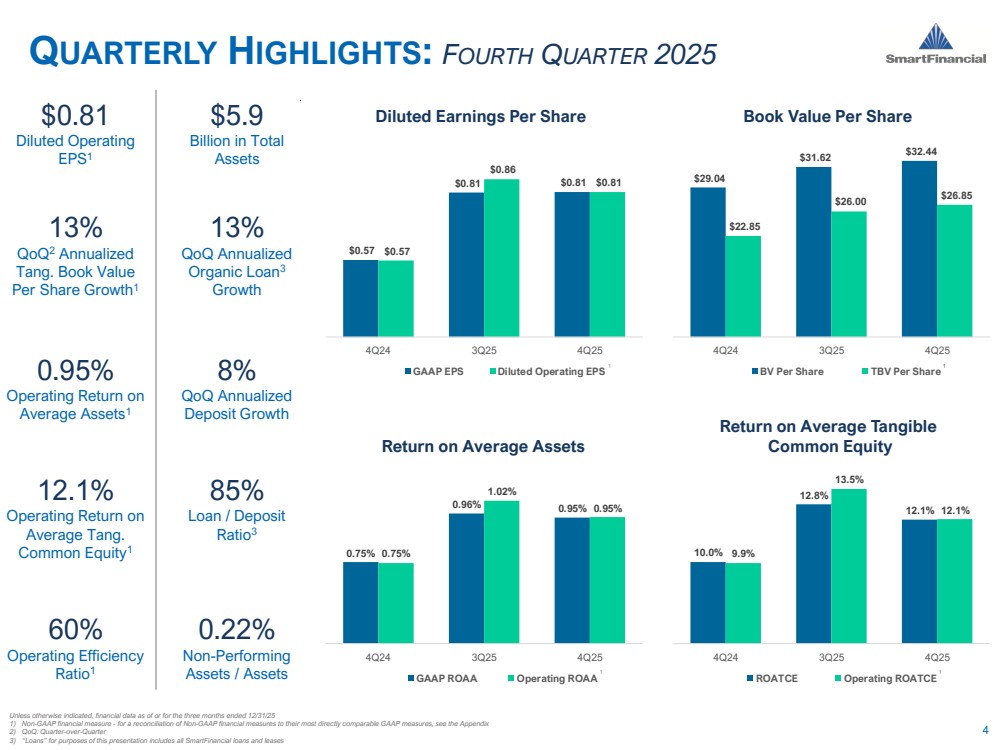
| $0.57 $0.81 $0.81 $0.57 $0.86 $0.81 4Q24 3Q25 4Q25 GAAP EPS Diluted Operating EPS $29.04 $31.62 $32.44 $22.85 $26.00 $26.85 4Q24 3Q25 4Q25 BV Per Share TBV Per Share 0.75% 0.96% 0.95% 0.75% 1.02% 0.95% 4Q24 3Q25 4Q25 GAAP ROAA Operating ROAA 10.0% 12.8% 12.1% 9.9% 13.5% 12.1% 4Q24 3Q25 4Q25 ROATCE Operating ROATCE 4 Unless otherwise indicated, financial data as of or for the three months ended 12/31/25 1) Non-GAAP financial measure - for a reconciliation of Non-GAAP financial measures to their most directly comparable GAAP measures, see the Appendix 2) QoQ: Quarter-over-Quarter 3) “Loans” for purposes of this presentation includes all SmartFinancial loans and leases QUARTERLY HIGHLIGHTS: FOURTH QUARTER 2025 13% QoQ2 Annualized Tang. Book Value Per Share Growth1 $0.81 Diluted Operating EPS1 0.95% Operating Return on Average Assets1 12.1% Operating Return on Average Tang. Common Equity1 60% Operating Efficiency Ratio1 8% QoQ Annualized Deposit Growth 13% QoQ Annualized Organic Loan3 Growth 85% Loan / Deposit Ratio3 0.22% Non-Performing Assets / Assets $5.9 Billion in Total Assets Diluted Earnings Per Share Book Value Per Share Return on Average Assets Return on Average Tangible Common Equity 1 1 1 1 |
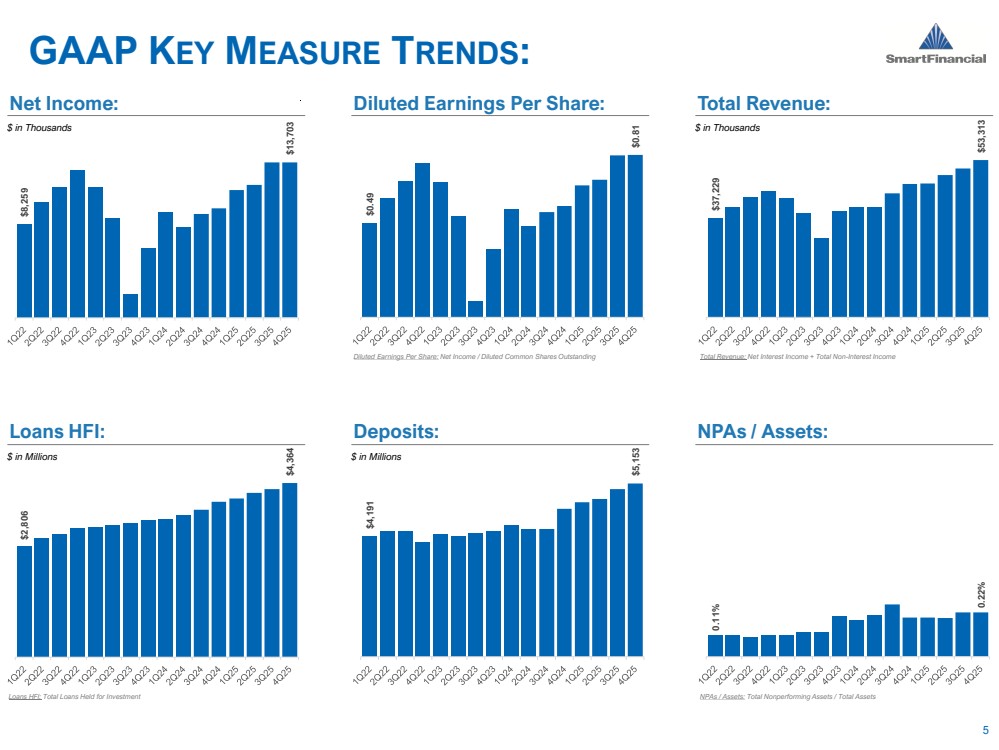
| $8,259 $13,703 $( 1, 000) $1, 000 $3, 000 $5, 000 $7, 000 $9, 000 $11, 000 $13, 000 $15, 000 $17, 000 $0.49 $0.81 $0 $0 $0 $0 $0 $1 $1 $1 $1 $1 $37,229 $53,313 $10, 000 $20, 000 $30, 000 $40, 000 $50, 000 $60, 000 $2,806 $4,364 $100 $600 $1, 100 $1, 600 $2, 100 $2, 600 $3, 100 $3, 600 $4, 100 $4, 600 $5, 100 $4,191 $5,153 $2, 000 $2, 500 $3, 000 $3, 500 $4, 000 $4, 500 $5, 000 $5, 500 0.11%0.22% $- $0 $0 $0 $0 $0 5 GAAP KEY MEASURE TRENDS: $ in Thousands Net Income: Diluted Earnings Per Share: Total Revenue: Loans HFI: Deposits: NPAs / Assets: $ in Thousands $ in Millions $ in Millions Diluted Earnings Per Share: Net Income / Diluted Common Shares Outstanding Total Revenue: Net Interest Income + Total Non-Interest Income Loans HFI: Total Loans Held for Investment NPAs / Assets: Total Nonperforming Assets / Total Assets |
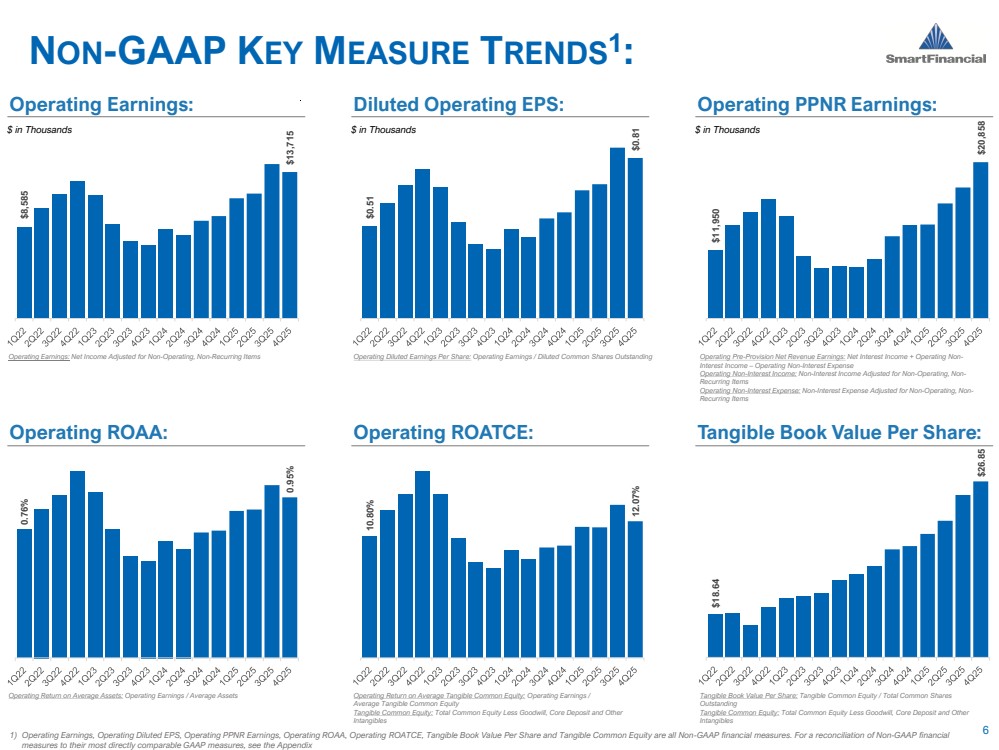
| $8,585 $13,715 $- $2, 000 $4, 000 $6, 000 $8, 000 $10, 000 $12, 000 $14, 000 $16, 000 $18, 000 $0.51 $0.81 $0 $0 $0 $0 $1 $1 $1 $1 $1 $11,950 $20,858 $5, 000 $7, 000 $9, 000 $11, 000 $13, 000 $15, 000 $17, 000 $19, 000 $21, 000 $23, 000 0.76% 0.95% $- $0 $0 $0 $0 $0 $0 10.80%12.07% $- $0 $0 $0 $0 $0 $0 $0 $0 $0 $18.64 $26.85 $16 $18 $20 $22 $24 $26 $28 6 NON-GAAP KEY MEASURE TRENDS1 : 1) Operating Earnings, Operating Diluted EPS, Operating PPNR Earnings, Operating ROAA, Operating ROATCE, Tangible Book Value Per Share and Tangible Common Equity are all Non-GAAP financial measures. For a reconciliation of Non-GAAP financial measures to their most directly comparable GAAP measures, see the Appendix $ in Thousands Operating Earnings: Diluted Operating EPS: Operating PPNR Earnings: Operating ROAA: Operating ROATCE: Tangible Book Value Per Share: $ in Thousands Operating Diluted Earnings Per Share: Operating Earnings / Diluted Common Shares Outstanding Operating Pre-Provision Net Revenue Earnings: Net Interest Income + Operating Non-Interest Income – Operating Non-Interest Expense Operating Non-Interest Income: Non-Interest Income Adjusted for Non-Operating, Non-Recurring Items Operating Non-Interest Expense: Non-Interest Expense Adjusted for Non-Operating, Non-Recurring Items Operating Return on Average Assets: Operating Earnings / Average Assets Tangible Book Value Per Share: Tangible Common Equity / Total Common Shares Outstanding Tangible Common Equity: Total Common Equity Less Goodwill, Core Deposit and Other Intangibles Operating Earnings: Net Income Adjusted for Non-Operating, Non-Recurring Items Operating Return on Average Tangible Common Equity: Operating Earnings / Average Tangible Common Equity Tangible Common Equity: Total Common Equity Less Goodwill, Core Deposit and Other Intangibles $ in Thousands |
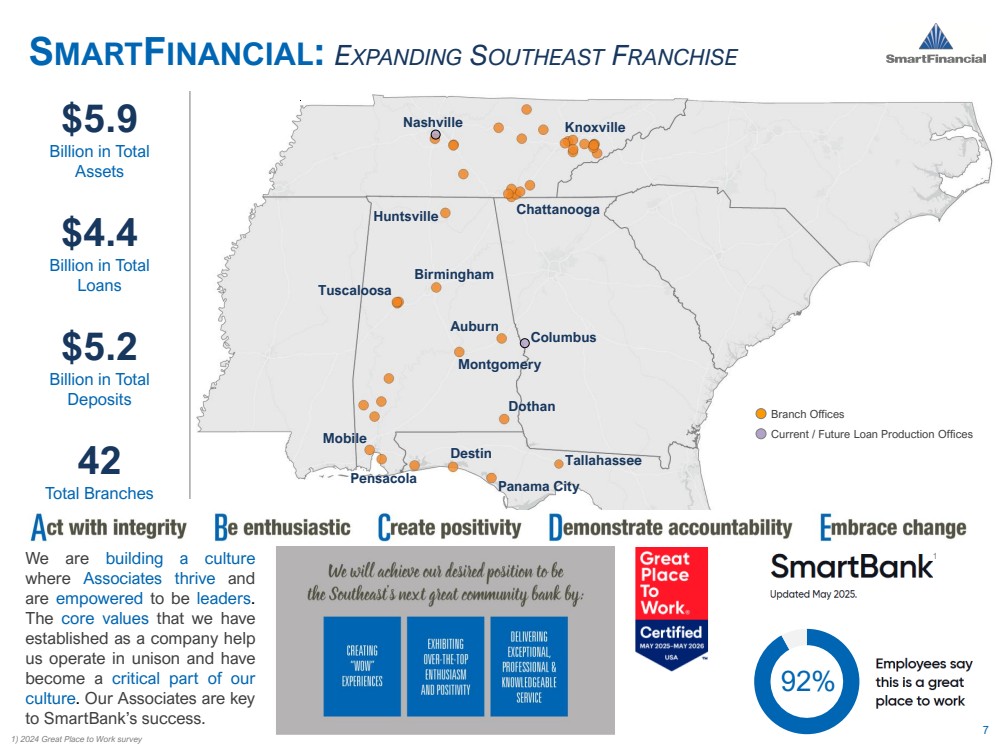
| 7 SMARTFINANCIAL: EXPANDING SOUTHEAST FRANCHISE $5.9 Billion in Total Assets $4.4 Billion in Total Loans We are building a culture where Associates thrive and are empowered to be leaders. The core values that we have established as a company help us operate in unison and have become a critical part of our culture. Our Associates are key to SmartBank’s success. $5.2 Billion in Total Deposits 42 Total Branches Knoxville Nashville Huntsville Tuscaloosa Mobile Pensacola Birmingham Auburn Tallahassee Dothan Montgomery Branch Offices Current / Future Loan Production Offices Chattanooga 1) 2024 Great Place to Work survey Panama City 1 92% Destin Columbus |
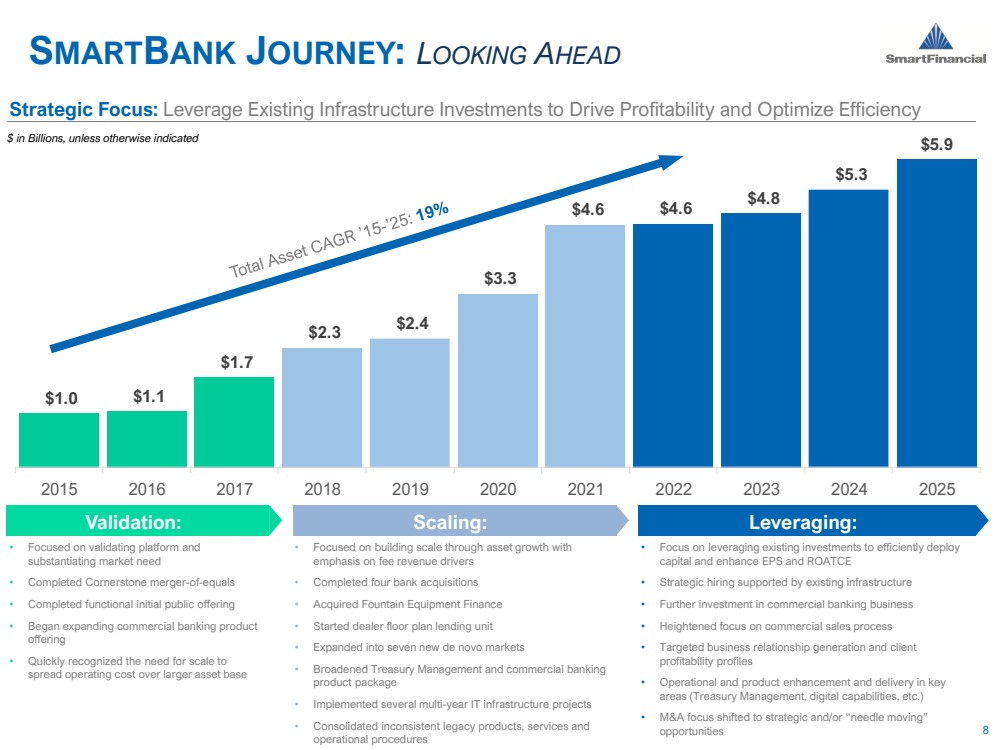
| $1.0 $1.1 $1.7 $2.3 $2.4 $3.3 $4.6 $4.6 $4.8 $5.3 $5.9 $- $1 $2 $3 $4 $5 $6 $7 2015 2016 2017 2018 2019 2020 2021 2022 2023 2024 2025 8 SMARTBANK JOURNEY: LOOKING AHEAD Validation: Scaling: Leveraging: • Focused on validating platform and substantiating market need • Completed Cornerstone merger-of-equals • Completed functional initial public offering • Began expanding commercial banking product offering • Quickly recognized the need for scale to spread operating cost over larger asset base • Focused on building scale through asset growth with emphasis on fee revenue drivers • Completed four bank acquisitions • Acquired Fountain Equipment Finance • Started dealer floor plan lending unit • Expanded into seven new de novo markets • Broadened Treasury Management and commercial banking product package • Implemented several multi-year IT infrastructure projects • Consolidated inconsistent legacy products, services and operational procedures • Focus on leveraging existing investments to efficiently deploy capital and enhance EPS and ROATCE • Strategic hiring supported by existing infrastructure • Further investment in commercial banking business • Heightened focus on commercial sales process • Targeted business relationship generation and client profitability profiles • Operational and product enhancement and delivery in key areas (Treasury Management, digital capabilities, etc.) • M&A focus shifted to strategic and/or “needle moving” opportunities $ in Billions, unless otherwise indicated Strategic Focus: Leverage Existing Infrastructure Investments to Drive Profitability and Optimize Efficiency |
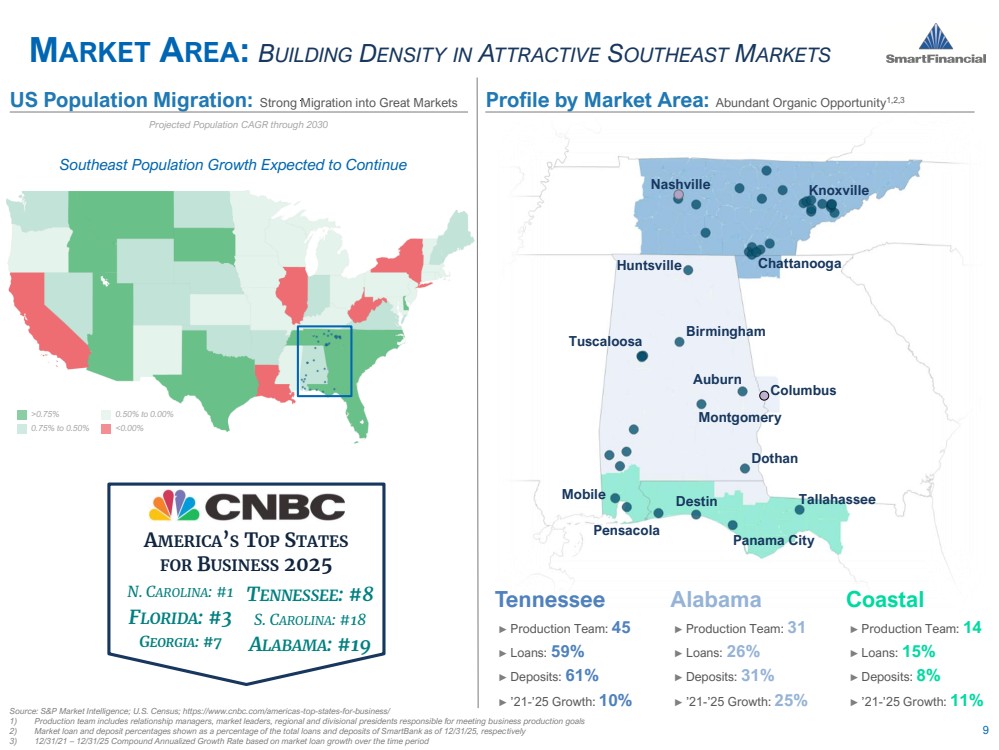
| MARKET AREA: BUILDING DENSITY IN ATTRACTIVE SOUTHEAST MARKETS 9 ► Production Team: 45 ► Loans: 59% ► Deposits: 61% ► ’21-’25 Growth: 10% Tennessee Source: S&P Market Intelligence; U.S. Census; https://www.cnbc.com/americas-top-states-for-business/ 1) Production team includes relationship managers, market leaders, regional and divisional presidents responsible for meeting business production goals 2) Market loan and deposit percentages shown as a percentage of the total loans and deposits of SmartBank as of 12/31/25, respectively 3) 12/31/21 – 12/31/25 Compound Annualized Growth Rate based on market loan growth over the time period Profile by Market Area: Abundant Organic Opportunity US Population Migration: Strong Migration into Great Markets 1,2,3 ► Production Team: 31 ► Loans: 26% ► Deposits: 31% ► ’21-’25 Growth: 25% Alabama ► Production Team: 14 ► Loans: 15% ► Deposits: 8% ► ’21-’25 Growth: 11% Coastal Projected Population CAGR through 2030 AMERICA’S TOP STATES FOR BUSINESS 2025 N. CAROLINA: #1 FLORIDA: #3 GEORGIA: #7 TENNESSEE: #8 S. CAROLINA: #18 ALABAMA: #19 Knoxville Nashville Huntsville Pensacola Birmingham Tallahassee Montgomery Chattanooga Mobile Auburn Dothan Tuscaloosa Panama City >0.75% 0.75% to 0.50% 0.50% to 0.00% <0.00% Southeast Population Growth Expected to Continue Columbus Destin |
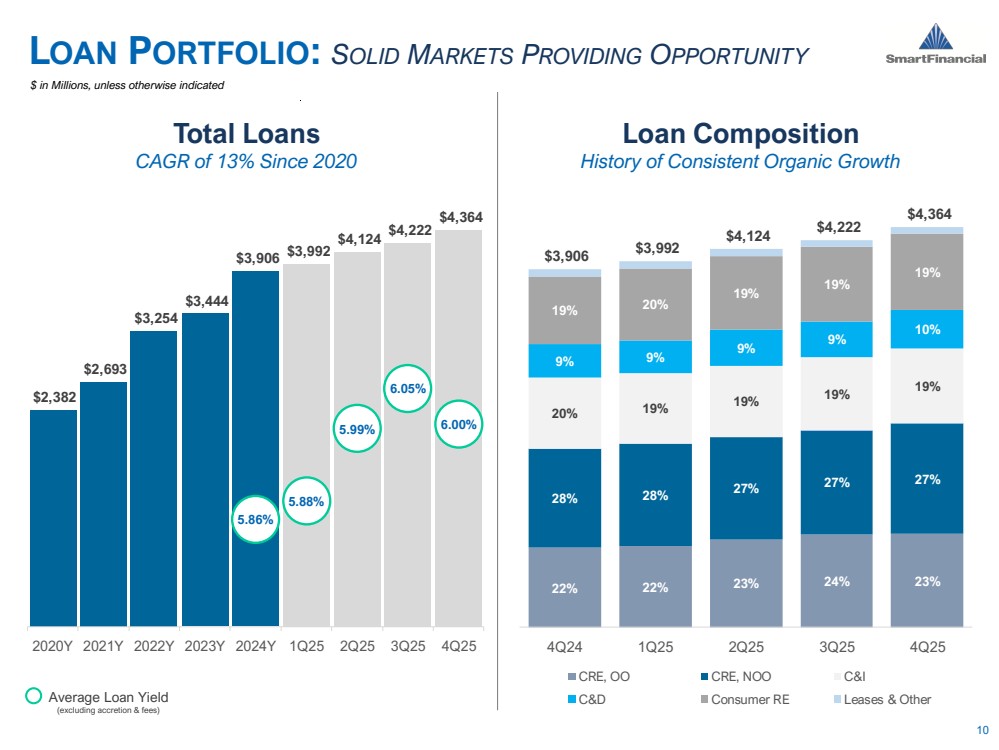
| 22% 22% 23% 24% 23% 28% 28% 27% 27% 27% 20% 19% 19% 19% 19% 9% 9% 9% 9% 10% 19% 20% 19% 19% 19% $3,906 $3,992 $4,124 $4,222 $4,364 4Q24 1Q25 2Q25 3Q25 4Q25 CRE, OO CRE, NOO C&I C&D Consumer RE Leases & Other $2,382 $2,693 $3,254 $3,444 $3,906 $3,992 $4,124 $4,222 $4,364 5.86% 5.88% 5.99% 6.05% 6.00% 5. 70% 5. 80% 5. 90% 6. 00% 6. 10% 6. 20% 6. 30% $- $500 $1, 000 $1, 500 $2, 000 $2, 500 $3, 000 $3, 500 $4, 000 $4, 500 2020Y 2021Y 2022Y 2023Y 2024Y 1Q25 2Q25 3Q25 4Q25 10 LOAN PORTFOLIO: SOLID MARKETS PROVIDING OPPORTUNITY Total Loans CAGR of 13% Since 2020 $ in Millions, unless otherwise indicated Average Loan Yield (excluding accretion & fees) Loan Composition History of Consistent Organic Growth |
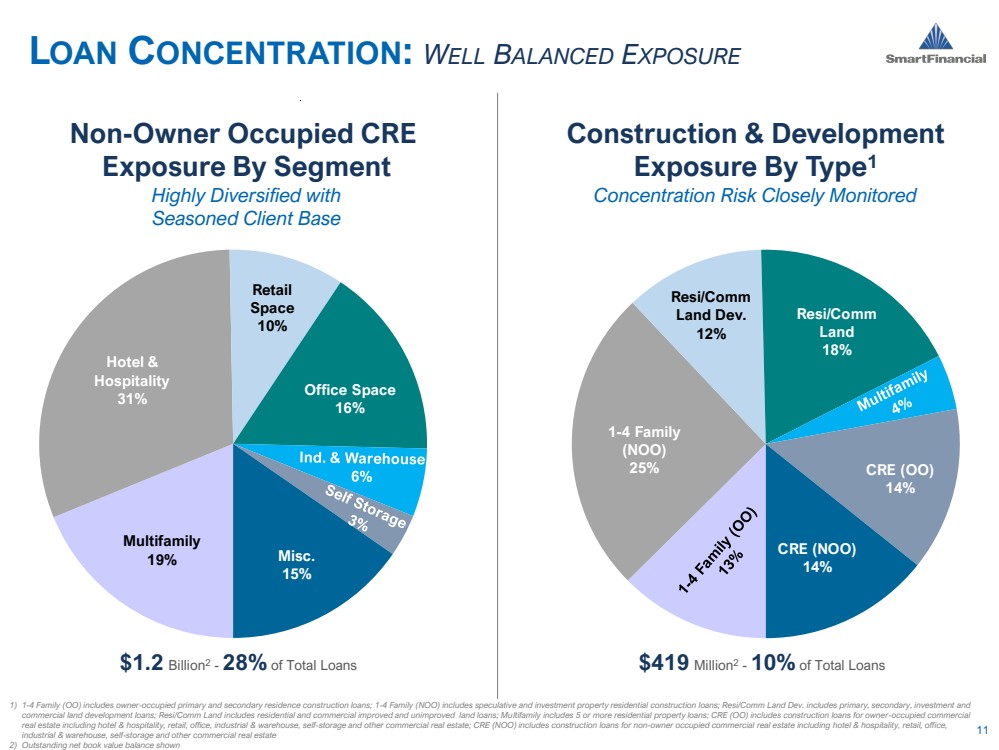
| 1-4 Family (NOO) 25% Resi/Comm Land Dev. 12% Resi/Comm Land 18% CRE (OO) 14% CRE (NOO) 14% Multifamily 19% Hotel & Hospitality 31% Retail Space 10% Office Space 16% Misc. 15% 11 LOAN CONCENTRATION: WELL BALANCED EXPOSURE Non-Owner Occupied CRE Exposure By Segment Highly Diversified with Seasoned Client Base Construction & Development Exposure By Type1 Concentration Risk Closely Monitored 1) 1-4 Family (OO) includes owner-occupied primary and secondary residence construction loans; 1-4 Family (NOO) includes speculative and investment property residential construction loans; Resi/Comm Land Dev. includes primary, secondary, investment and commercial land development loans; Resi/Comm Land includes residential and commercial improved and unimproved land loans; Multifamily includes 5 or more residential property loans; CRE (OO) includes construction loans for owner-occupied commercial real estate including hotel & hospitality, retail, office, industrial & warehouse, self-storage and other commercial real estate; CRE (NOO) includes construction loans for non-owner occupied commercial real estate including hotel & hospitality, retail, office, industrial & warehouse, self-storage and other commercial real estate 2) Outstanding net book value balance shown $1.2 Billion2 - 28% of Total Loans $419 Million2 - 10% of Total Loans |
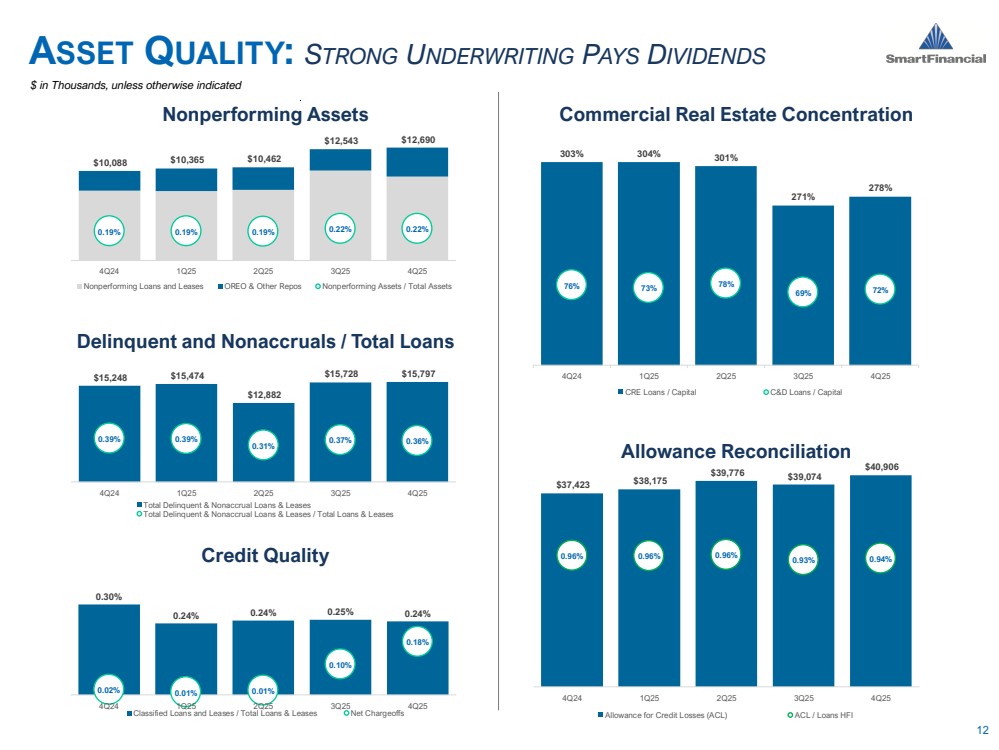
| $10,088 $10,365 $10,462 $12,543 $12,690 0.19% 0.19% 0.19% 0.22% 0.22% - 0.10% 0.10% 0.30% 0.50% 0.70% 0.90% 1.10% 1.30% 1.50% $- $2, 000 $4, 000 $6, 000 $8, 000 $10, 000 $12, 000 $14, 000 $16, 000 $18, 000 4Q24 1Q25 2Q25 3Q25 4Q25 Nonperforming Loans and Leases OREO & Other Repos Nonperforming Assets / Total Assets 303% 304% 301% 271% 278% 76% 73% 78% 69% 72% 0% 50% 100% 150% 200% 250% 150% 170% 190% 210% 230% 250% 270% 290% 310% 330% 350% 4Q24 1Q25 2Q25 3Q25 4Q25 CRE Loans / Capital C&D Loans / Capital $15,248 $15,474 $12,882 $15,728 $15,797 0.39% 0.39% 0.31% 0.37% 0.36% - 0.10% 0.10% 0.30% 0.50% 0.70% 0.90% 1.10% 1.30% 1.50% 1.70% $2, 000 $4, 000 $6, 000 $8, 000 $10, 000 $12, 000 $14, 000 $16, 000 $18, 000 $20, 000 $22, 000 $24, 000 4Q24 1Q25 2Q25 3Q25 4Q25 Total Delinquent & Nonaccrual Loans & Leases Total Delinquent & Nonaccrual Loans & Leases / Total Loans & Leases 0.30% 0.24% 0.24% 0.25% 0.24% 0.02% 0.01% 0.01% 0.10% 0.18% - 0.10% 0.00% 0.10% 0.20% 0.30% 0.40% 0.50% 4Q24 1Q25 2Q25 3Q25 4Q25 Classified Loans and Leases / Total Loans & Leases Net Chargeoffs $37,423 $38,175 $39,776 $39,074 $40,906 0.96% 0.96% 0.96% 0.93% 0.94% 0.00% 0.50% 1.00% 1.50% 2.00% $- $2, 000 $4, 000 $6, 000 $8, 000 $10, 000 $12, 000 $14, 000 $16, 000 $18, 000 $20, 000 $22, 000 $24, 000 $26, 000 $28, 000 $30, 000 $32, 000 $34, 000 $36, 000 $38, 000 $40, 000 $42, 000 $44, 000 $46, 000 $48, 000 $50, 000 $52, 000 4Q24 1Q25 2Q25 3Q25 4Q25 Allowance for Credit Losses (ACL) ACL / Loans HFI 12 Credit Quality Delinquent and Nonaccruals / Total Loans Nonperforming Assets Commercial Real Estate Concentration ASSET QUALITY: STRONG UNDERWRITING PAYS DIVIDENDS $ in Thousands, unless otherwise indicated Allowance Reconciliation |
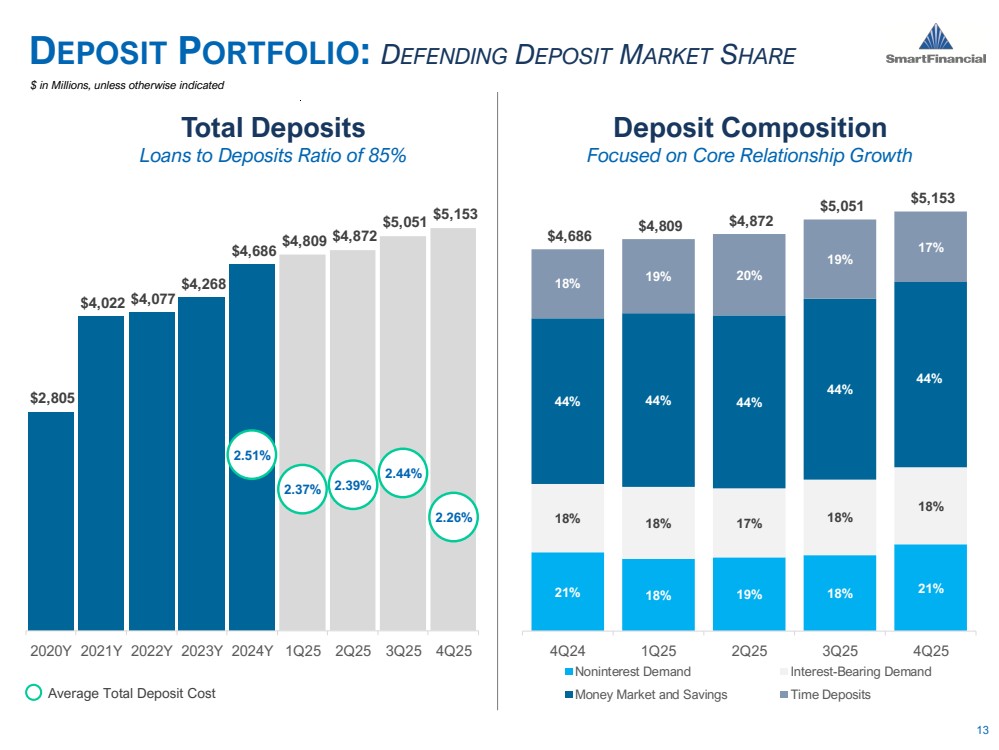
| 21% 18% 19% 18% 21% 18% 18% 17% 18% 18% 44% 44% 44% 44% 44% 18% 19% 20% 19% 17% $4,686 $4,809 $4,872 $5,051 $5,153 4Q24 1Q25 2Q25 3Q25 4Q25 Noninterest Demand Interest-Bearing Demand Money Market and Savings Time Deposits $2,805 $4,022 $4,077 $4,268 $4,686 $4,809 $4,872 $5,051 $5,153 2.51% 2.37% 2.39% 2.44% 2.26% 1. 80% 2. 00% 2. 20% 2. 40% 2. 60% 2. 80% 3. 00% 3. 20% 3. 40% $- $1, 000 $2, 000 $3, 000 $4, 000 $5, 000 2020Y 2021Y 2022Y 2023Y 2024Y 1Q25 2Q25 3Q25 4Q25 $4,364 13 DEPOSIT PORTFOLIO: DEFENDING DEPOSIT MARKET SHARE Total Deposits Loans to Deposits Ratio of 85% $ in Millions, unless otherwise indicated Average Total Deposit Cost Deposit Composition Focused on Core Relationship Growth |
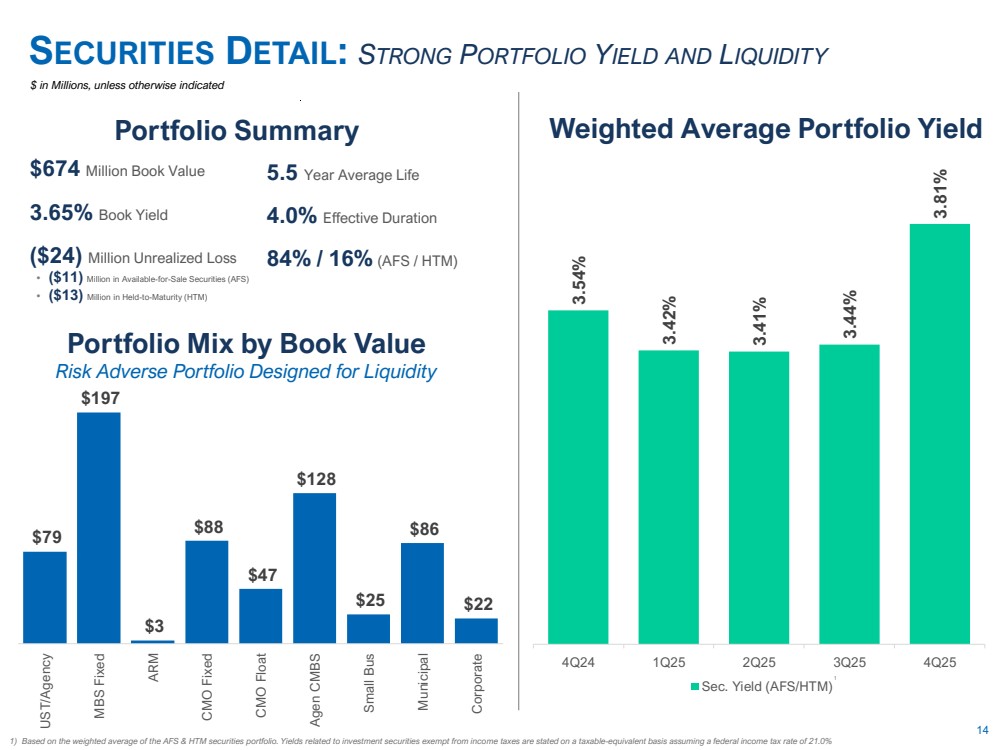
| $79 $197 $3 $88 $47 $128 $25 $86 $22 $- $50 $100 $150 $200 $250 $300 UST/Agency MBS Fixed ARM CMO Fixed CMO Float Agen CMBS Small Bus Municipal Corporate 3.54% 3.42% 3.41% 3.44% 3.81% 2.50% 3.00% 3.50% 4.00% 4.50% 4Q24 1Q25 2Q25 3Q25 4Q25 Sec. Yield (AFS/HTM) 14 SECURITIES DETAIL: STRONG PORTFOLIO YIELD AND LIQUIDITY $ in Millions, unless otherwise indicated Portfolio Summary Weighted Average Portfolio Yield Portfolio Mix by Book Value Risk Adverse Portfolio Designed for Liquidity $674 Million Book Value 3.65% Book Yield ($24) Million Unrealized Loss • ($11) Million in Available-for-Sale Securities (AFS) • ($13) Million in Held-to-Maturity (HTM) 5.5 Year Average Life 4.0% Effective Duration 84% / 16% (AFS / HTM) 1 1) Based on the weighted average of the AFS & HTM securities portfolio. Yields related to investment securities exempt from income taxes are stated on a taxable-equivalent basis assuming a federal income tax rate of 21.0% |
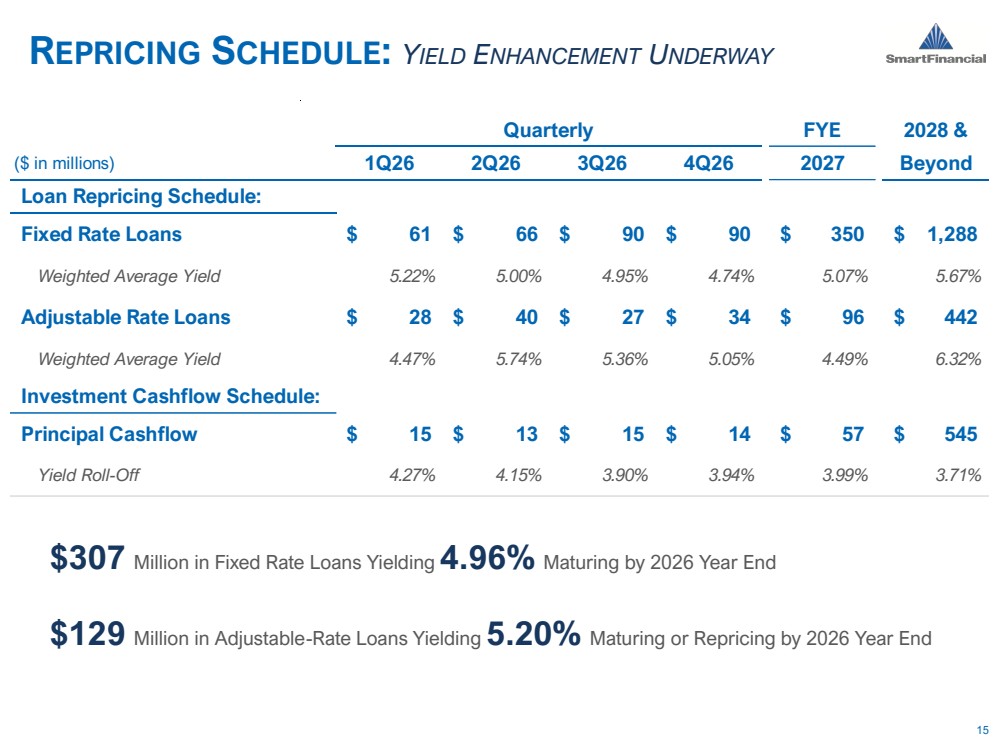
| 15 REPRICING SCHEDULE: YIELD ENHANCEMENT UNDERWAY $307 Million in Fixed Rate Loans Yielding 4.96% Maturing by 2026 Year End $129 Million in Adjustable-Rate Loans Yielding 5.20% Maturing or Repricing by 2026 Year End FYE 2028 & ($ in millions) 1Q26 2Q26 3Q26 4Q26 2027 Beyond Loan Repricing Schedule: Fixed Rate Loans $ 61 $ 66 $ 90 $ 90 $ 350 $ 1,288 Weighted Average Yield 5.22% 5.00% 4.95% 4.74% 5.07% 5.67% Adjustable Rate Loans $ 28 $ 40 $ 27 $ 34 $ 96 $ 442 Weighted Average Yield 4.47% 5.74% 5.36% 5.05% 4.49% 6.32% Investment Cashflow Schedule: Principal Cashflow $ 15 $ 13 $ 15 $ 14 $ 57 $ 545 Yield Roll-Off 4.27% 4.15% 3.90% 3.94% 3.99% 3.71% Quarterly |
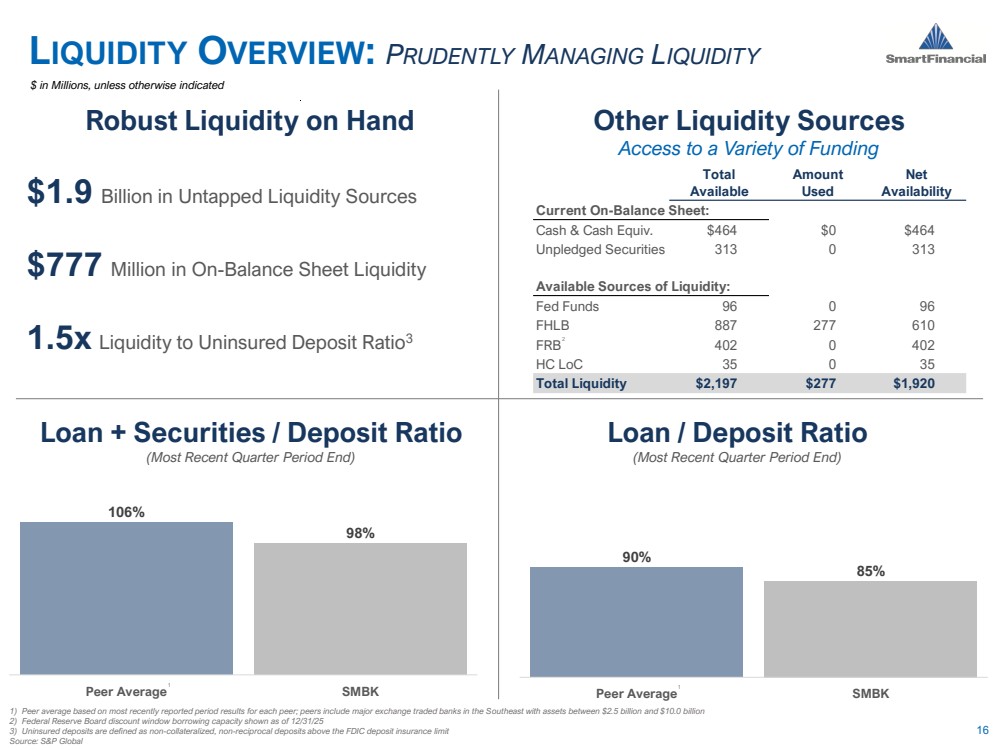
| 106% 98% Peer Average SMBK 90% 85% Peer Average SMBK Total Amount Net Available Used Availability Current On-Balance Sheet: Cash & Cash Equiv. $464 $0 $464 Unpledged Securities 313 0 313 Available Sources of Liquidity: Fed Funds 96 0 96 FHLB 887 277 610 FRB 402 0 402 HC LoC 35 0 35 Total Liquidity $2,197 $277 $1,920 16 LIQUIDITY OVERVIEW: PRUDENTLY MANAGING LIQUIDITY 1) Peer average based on most recently reported period results for each peer; peers include major exchange traded banks in the Southeast with assets between $2.5 billion and $10.0 billion 2) Federal Reserve Board discount window borrowing capacity shown as of 12/31/25 3) Uninsured deposits are defined as non-collateralized, non-reciprocal deposits above the FDIC deposit insurance limit Source: S&P Global Loan + Securities / Deposit Ratio (Most Recent Quarter Period End) Loan / Deposit Ratio (Most Recent Quarter Period End) Other Liquidity Sources Access to a Variety of Funding Robust Liquidity on Hand $1.9 Billion in Untapped Liquidity Sources $777 Million in On-Balance Sheet Liquidity 1.5x Liquidity to Uninsured Deposit Ratio3 1 1 $ in Millions, unless otherwise indicated 2 |
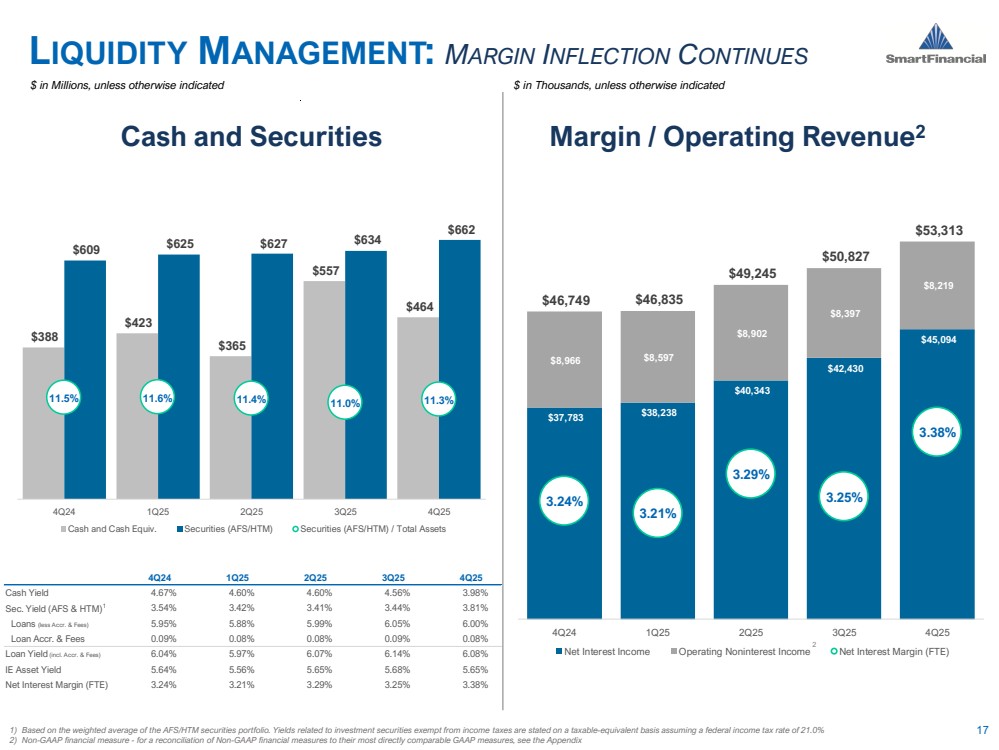
| 4Q24 1Q25 2Q25 3Q25 4Q25 Cash Yield 4.67% 4.60% 4.60% 4.56% 3.98% Sec. Yield (AFS & HTM)1 3.54% 3.42% 3.41% 3.44% 3.81% Loans (less Accr. & Fees) 5.95% 5.88% 5.99% 6.05% 6.00% Loan Accr. & Fees 0.09% 0.08% 0.08% 0.09% 0.08% Loan Yield (incl. Accr. & Fees) 6.04% 5.97% 6.07% 6.14% 6.08% IE Asset Yield 5.64% 5.56% 5.65% 5.68% 5.65% Net Interest Margin (FTE) 3.24% 3.21% 3.29% 3.25% 3.38% $37,783 $38,238 $40,343 $42,430 $45,094 $8,966 $8,597 $8,902 $8,397 $8,219 $46,749 $46,835 $49,245 $50,827 $53,313 3.24% 3.21% 3.29% 3.25% 3.38% $18, 000 $23, 000 $28, 000 $33, 000 $38, 000 $43, 000 $48, 000 $53, 000 3.00% 3.10% 3.20% 3.30% 3.40% 3.50% 3.60% 3.70% 3.80% 4Q24 1Q25 2Q25 3Q25 4Q25 Net Interest Income Operating Noninterest Income Net Interest Margin (FTE) $388 $423 $365 $557 $464 $609 $625 $627 $634 $662 11.5% 11.6% 11.4% 11.0% 11.3% 0.0% 5.0% 10.0% 15.0% 20.0% 25.0% 30.0% 35.0% 40.0% $- $100 $200 $300 $400 $500 $600 $700 $800 $900 4Q24 1Q25 2Q25 3Q25 4Q25 Cash and Cash Equiv. Securities (AFS/HTM) Securities (AFS/HTM) / Total Assets 17 LIQUIDITY MANAGEMENT: MARGIN INFLECTION CONTINUES Cash and Securities Margin / Operating Revenue2 1) Based on the weighted average of the AFS/HTM securities portfolio. Yields related to investment securities exempt from income taxes are stated on a taxable-equivalent basis assuming a federal income tax rate of 21.0% 2) Non-GAAP financial measure - for a reconciliation of Non-GAAP financial measures to their most directly comparable GAAP measures, see the Appendix 2 $ in Millions, unless otherwise indicated $ in Thousands, unless otherwise indicated |
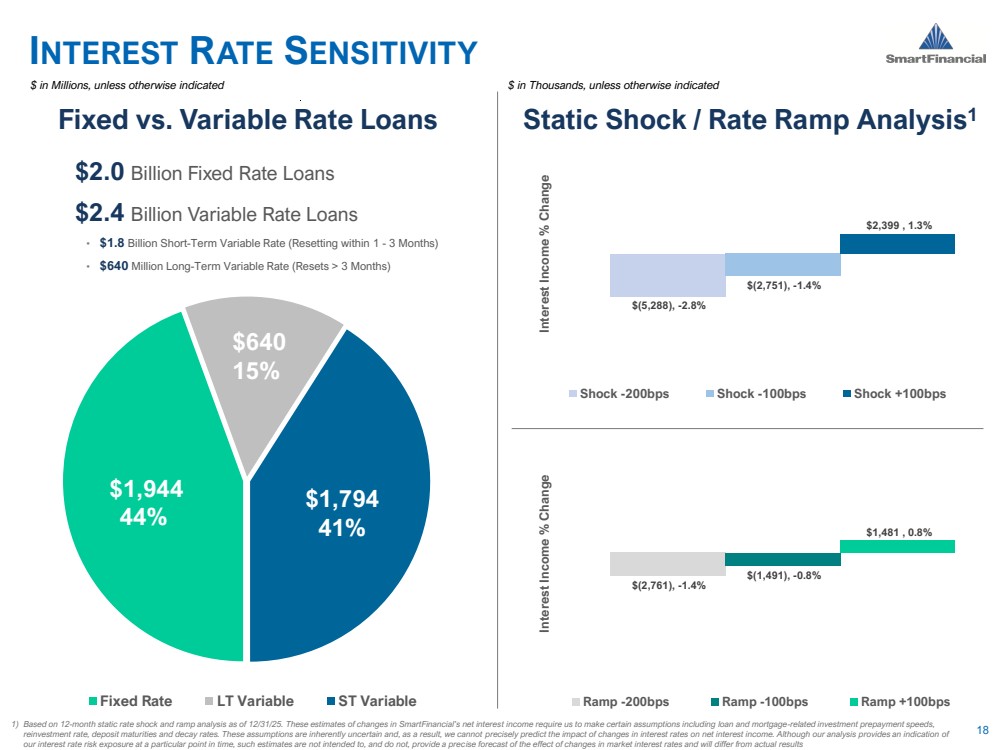
| $(5,288), -2.8% $(2,751), -1.4% $2,399 , 1.3% Interest Income % Change Shock -200bps Shock -100bps Shock +100bps $(2,761), -1.4% $(1,491), -0.8% $1,481 , 0.8% Interest Income % Change Ramp -200bps Ramp -100bps Ramp +100bps $1,944 44% $640 15% $1,794 41% Fixed Rate LT Variable ST Variable 18 INTEREST RATE SENSITIVITY Fixed vs. Variable Rate Loans Static Shock / Rate Ramp Analysis1 1) Based on 12-month static rate shock and ramp analysis as of 12/31/25. These estimates of changes in SmartFinancial’s net interest income require us to make certain assumptions including loan and mortgage-related investment prepayment speeds, reinvestment rate, deposit maturities and decay rates. These assumptions are inherently uncertain and, as a result, we cannot precisely predict the impact of changes in interest rates on net interest income. Although our analysis provides an indication of our interest rate risk exposure at a particular point in time, such estimates are not intended to, and do not, provide a precise forecast of the effect of changes in market interest rates and will differ from actual results $2.0 Billion Fixed Rate Loans $2.4 Billion Variable Rate Loans • $1.8 Billion Short-Term Variable Rate (Resetting within 1 - 3 Months) • $640 Million Long-Term Variable Rate (Resets > 3 Months) $ in Millions, unless otherwise indicated $ in Thousands, unless otherwise indicated |
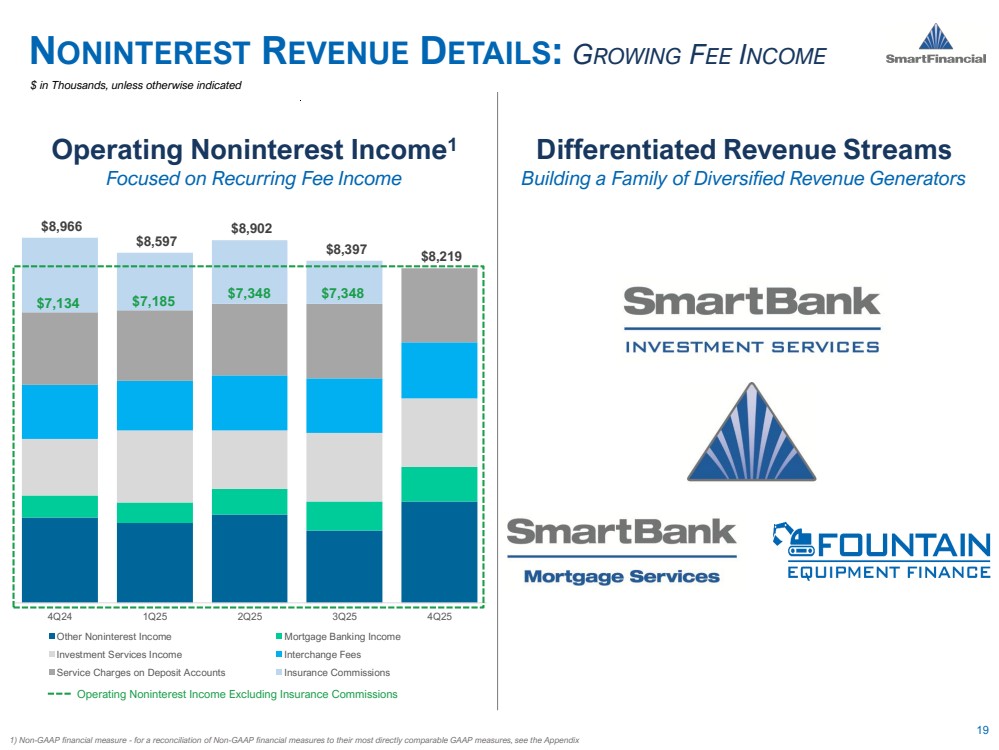
| $8,966 $8,597 $8,902 $8,397 $8,219 4Q24 1Q25 2Q25 3Q25 4Q25 Other Noninterest Income Mortgage Banking Income Investment Services Income Interchange Fees Service Charges on Deposit Accounts Insurance Commissions 19 NONINTEREST REVENUE DETAILS: GROWING FEE INCOME Operating Noninterest Income1 Focused on Recurring Fee Income 1) Non-GAAP financial measure - for a reconciliation of Non-GAAP financial measures to their most directly comparable GAAP measures, see the Appendix Differentiated Revenue Streams Building a Family of Diversified Revenue Generators $ in Thousands, unless otherwise indicated $7,134 $7,185 $7,348 $7,348 Operating Noninterest Income Excluding Insurance Commissions |
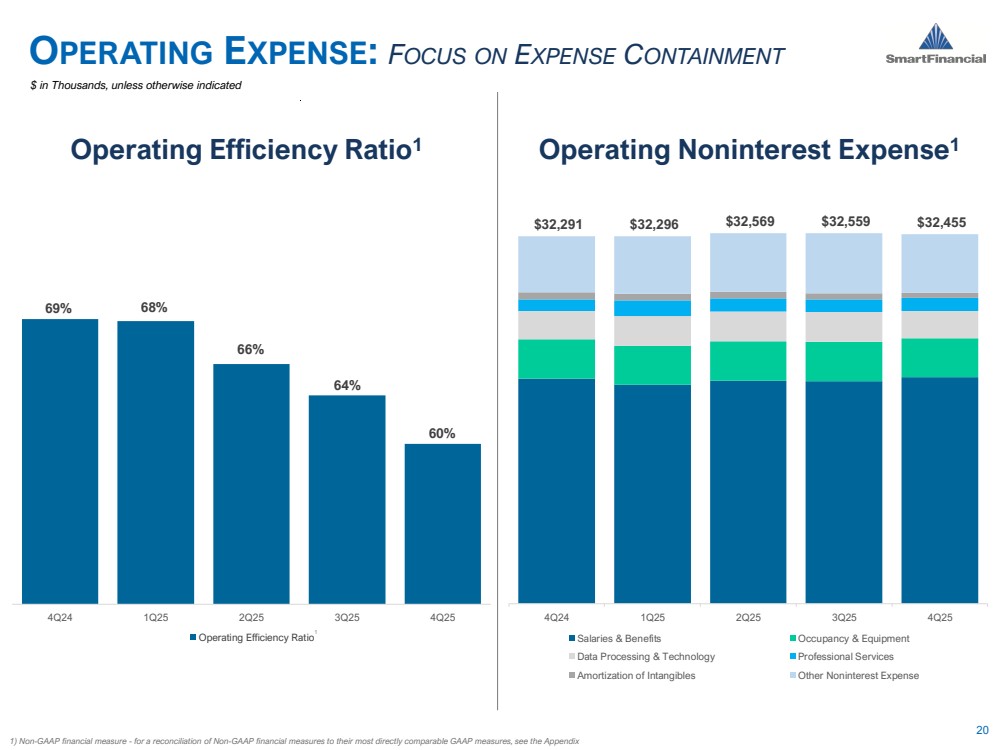
| 69% 68% 66% 64% 60% 4Q24 1Q25 2Q25 3Q25 4Q25 Operating Efficiency Ratio $32,291 $32,296 $32,569 $32,559 $32,455 4Q24 1Q25 2Q25 3Q25 4Q25 Salaries & Benefits Occupancy & Equipment Data Processing & Technology Professional Services Amortization of Intangibles Other Noninterest Expense 20 1) Non-GAAP financial measure - for a reconciliation of Non-GAAP financial measures to their most directly comparable GAAP measures, see the Appendix OPERATING EXPENSE: FOCUS ON EXPENSE CONTAINMENT Operating Efficiency Ratio1 Operating Noninterest Expense1 1 $ in Thousands, unless otherwise indicated |
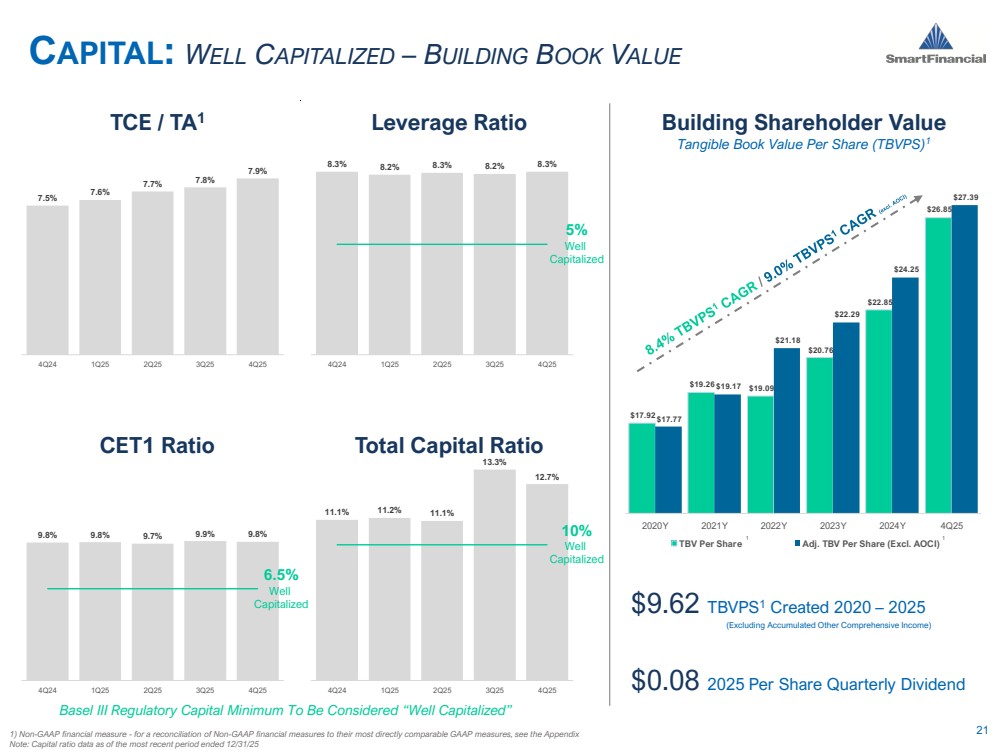
| $17.92 $19.26 $19.09 $20.76 $22.85 $26.85 $17.77 $19.17 $21.18 $22.29 $24.25 $27.39 $14. 00 $16. 00 $18. 00 $20. 00 $22. 00 $24. 00 $26. 00 $28. 00 2020Y 2021Y 2022Y 2023Y 2024Y 4Q25 TBV Per Share Adj. TBV Per Share (Excl. AOCI) 7.5% 7.6% 7.7% 7.8% 7.9% 4Q24 1Q25 2Q25 3Q25 4Q25 9.8% 9.8% 9.7% 9.9% 9.8% 4Q24 1Q25 2Q25 3Q25 4Q25 8.3% 8.2% 8.3% 8.2% 8.3% 4Q24 1Q25 2Q25 3Q25 4Q25 11.1% 11.2% 11.1% 13.3% 12.7% 4Q24 1Q25 2Q25 3Q25 4Q25 CAPITAL: WELL CAPITALIZED – BUILDING BOOK VALUE 1) Non-GAAP financial measure - for a reconciliation of Non-GAAP financial measures to their most directly comparable GAAP measures, see the Appendix 21 Note: Capital ratio data as of the most recent period ended 12/31/25 TCE / TA1 CET1 Ratio Total Capital Ratio Leverage Ratio Basel III Regulatory Capital Minimum To Be Considered “Well Capitalized” Building Shareholder Value Tangible Book Value Per Share (TBVPS)1 $9.62 TBVPS1 Created 2020 – 2025 (Excluding Accumulated Other Comprehensive Income) $0.08 2025 Per Share Quarterly Dividend 5% Well Capitalized 10% Well Capitalized 6.5% Well Capitalized 1 1 |
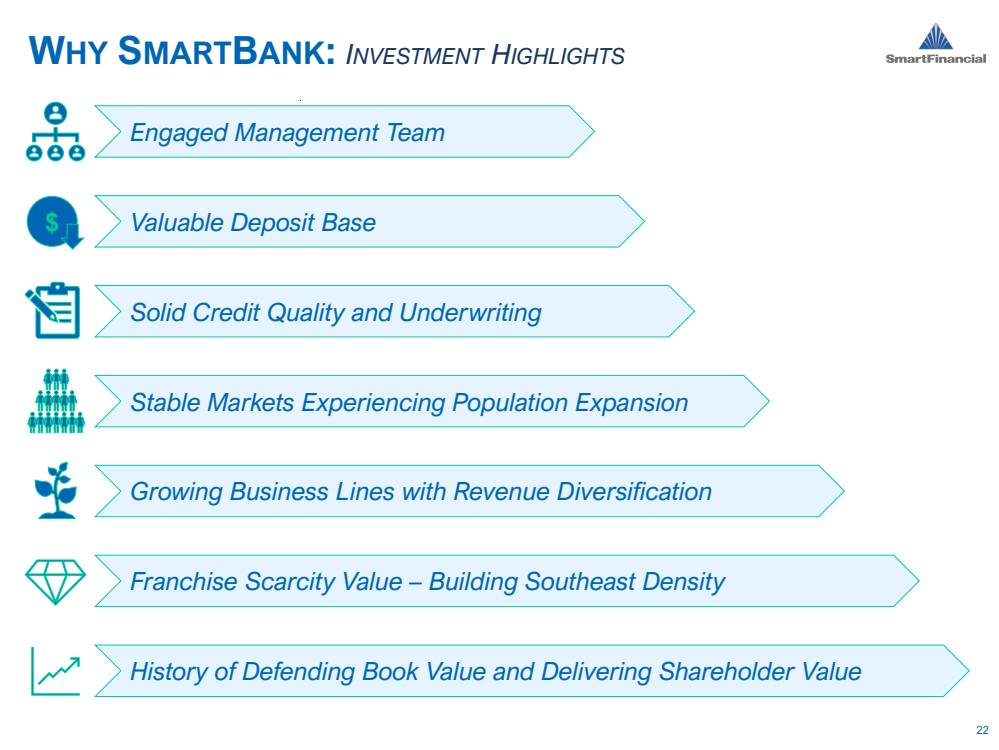
| WHY SMARTBANK: INVESTMENT HIGHLIGHTS 22 Franchise Scarcity Value – Building Southeast Density Engaged Management Team Stable Markets Experiencing Population Expansion Valuable Deposit Base Growing Business Lines with Revenue Diversification Solid Credit Quality and Underwriting History of Defending Book Value and Delivering Shareholder Value $ |
| APPENDIX 23 |
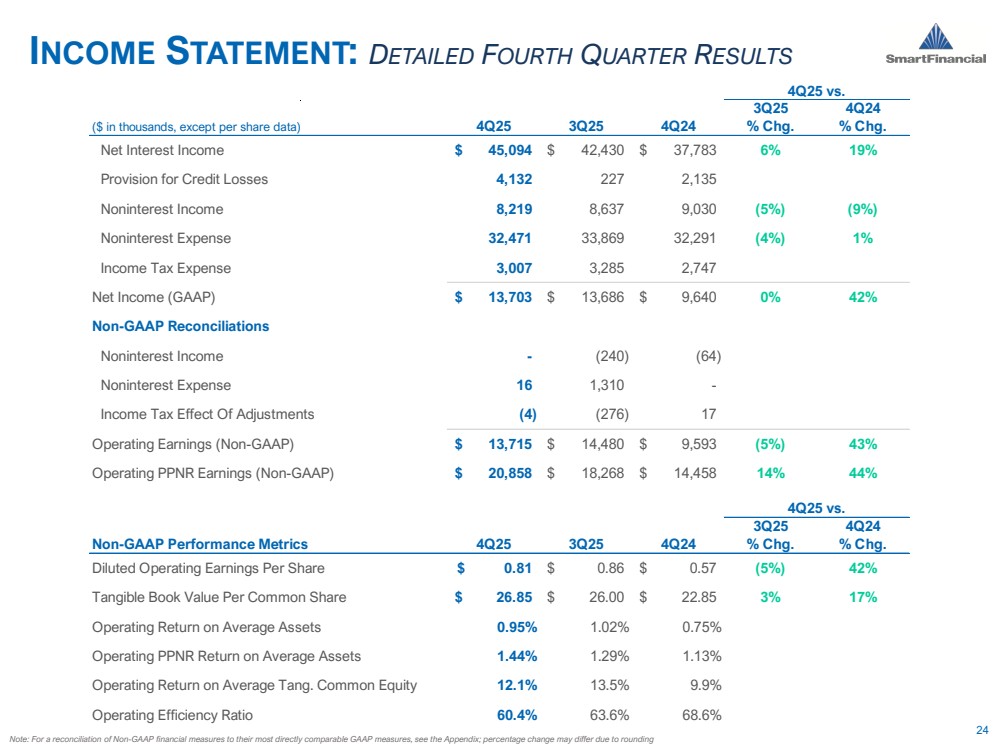
| 3Q25 4Q24 ($ in thousands, except per share data) 4Q25 3Q25 4Q24 % Chg. % Chg. Net Interest Income $ 45,094 $ 42,430 $ 37,783 6% 19% Provision for Credit Losses 4,132 227 2,135 Noninterest Income 8,219 8,637 9,030 (5%) (9%) Noninterest Expense 32,471 33,869 32,291 (4%) 1% Income Tax Expense 3,007 3,285 2,747 Net Income (GAAP) $ 13,703 $ 13,686 $ 9,640 0% 42% Non-GAAP Reconciliations Noninterest Income - (240) (64) Noninterest Expense 16 1,310 - Income Tax Effect Of Adjustments (4) (276) 17 Operating Earnings (Non-GAAP) $ 13,715 $ 14,480 $ 9,593 (5%) 43% Operating PPNR Earnings (Non-GAAP) $ 20,858 $ 18,268 $ 14,458 14% 44% 3Q25 4Q24 Non-GAAP Performance Metrics 4Q25 3Q25 4Q24 % Chg. % Chg. Diluted Operating Earnings Per Share $ 0.81 $ 0.86 $ 0.57 (5%) 42% Tangible Book Value Per Common Share $ 26.85 $ 26.00 $ 22.85 3% 17% Operating Return on Average Assets 0.95% 1.02% 0.75% Operating PPNR Return on Average Assets 1.44% 1.29% 1.13% Operating Return on Average Tang. Common Equity 12.1% 13.5% 9.9% Operating Efficiency Ratio 60.4% 63.6% 68.6% 4Q25 vs. 4Q25 vs. 24 Note: For a reconciliation of Non-GAAP financial measures to their most directly comparable GAAP measures, see the Appendix; percentage change may differ due to rounding INCOME STATEMENT: DETAILED FOURTH QUARTER RESULTS |
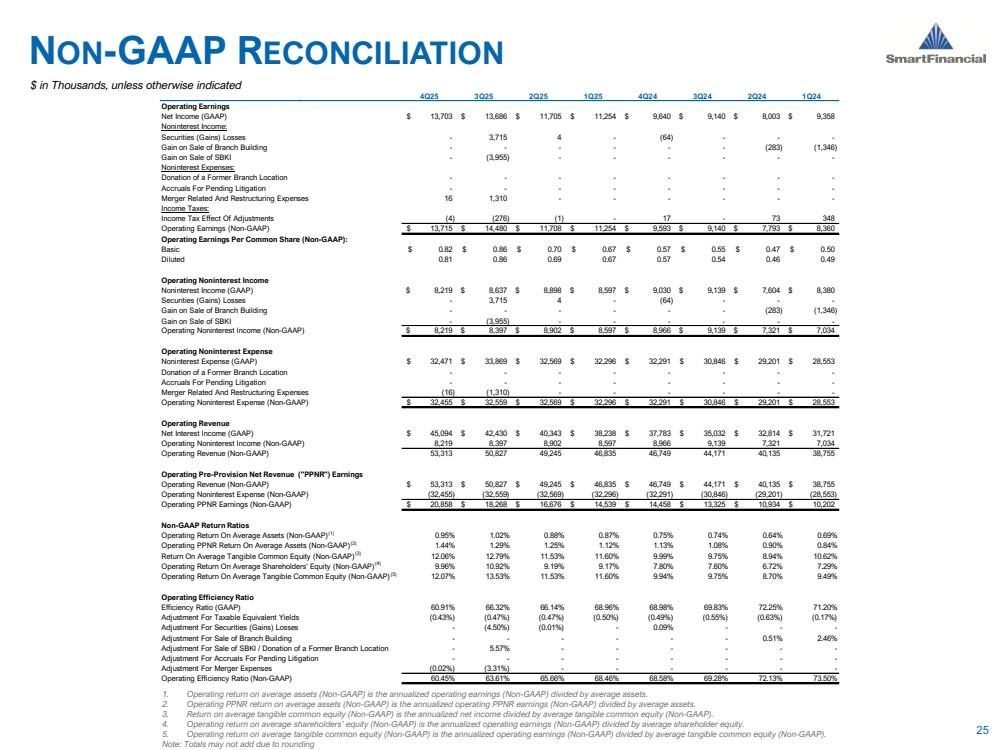
| 4Q25 3Q25 2Q25 1Q25 4Q24 3Q24 2Q24 1Q24 Operating Earnings Net Income (GAAP) $ 13,703 $ 13,686 $ 11,705 $ 11,254 $ 9,640 $ 9,140 $ 8,003 $ 9,358 Noninterest Income: Securities (Gains) Losses - 3,715 4 - (64) - - - Gain on Sale of Branch Building - - - - - - (283) (1,346) Gain on Sale of SBKI - (3,955) - - - - - - Noninterest Expenses: Donation of a Former Branch Location - - - - - - - - Accruals For Pending Litigation - - - - - - - - Merger Related And Restructuring Expenses 16 1,310 - - - - - - Income Taxes: Income Tax Effect Of Adjustments (4) (276) (1) - 17 - 73 348 Operating Earnings (Non-GAAP) $ 13,715 $ 14,480 $ 11,708 $ 11,254 $ 9,593 $ 9,140 $ 7,793 $ 8,360 Operating Earnings Per Common Share (Non-GAAP): Basic $ 0.82 $ 0.86 $ 0.70 $ 0.67 $ 0.57 $ 0.55 $ 0.47 $ 0.50 Diluted 0.81 0.86 0.69 0.67 0.57 0.54 0.46 0.49 Operating Noninterest Income Noninterest Income (GAAP) $ 8,219 $ 8,637 $ 8,898 $ 8,597 $ 9,030 $ 9,139 $ 7,604 $ 8,380 Securities (Gains) Losses - 3,715 4 - (64) - - - Gain on Sale of Branch Building - - - - - - (283) (1,346) Gain on Sale of SBKI - (3,955) - - - - - - Operating Noninterest Income (Non-GAAP) $ 8,219 $ 8,397 $ 8,902 $ 8,597 $ 8,966 $ 9,139 $ 7,321 $ 7,034 Operating Noninterest Expense Noninterest Expense (GAAP) $ 32,471 $ 33,869 $ 32,569 $ 32,296 $ 32,291 $ 30,846 $ 29,201 $ 28,553 Donation of a Former Branch Location - - - - - - - - Accruals For Pending Litigation - - - - - - - - Merger Related And Restructuring Expenses (16) (1,310) - - - - - - Operating Noninterest Expense (Non-GAAP) $ 32,455 $ 32,559 $ 32,569 $ 32,296 $ 32,291 $ 30,846 $ 29,201 $ 28,553 Operating Revenue Net Interest Income (GAAP) $ 45,094 $ 42,430 $ 40,343 $ 38,238 $ 37,783 $ 35,032 $ 32,814 $ 31,721 Operating Noninterest Income (Non-GAAP) 8,219 8,397 8,902 8,597 8,966 9,139 7,321 7,034 Operating Revenue (Non-GAAP) 53,313 50,827 49,245 46,835 46,749 44,171 40,135 38,755 Operating Pre-Provision Net Revenue ("PPNR") Earnings Operating Revenue (Non-GAAP) $ 53,313 $ 50,827 $ 49,245 $ 46,835 $ 46,749 $ 44,171 $ 40,135 $ 38,755 Operating Noninterest Expense (Non-GAAP) (32,455) (32,559) (32,569) (32,296) (32,291) (30,846) (29,201) (28,553) Operating PPNR Earnings (Non-GAAP) $ 20,858 $ 18,268 $ 16,676 $ 14,539 $ 14,458 $ 13,325 $ 10,934 $ 10,202 Non-GAAP Return Ratios Operating Return On Average Assets (Non-GAAP)(1) 0.95% 1.02% 0.88% 0.87% 0.75% 0.74% 0.64% 0.69% Operating PPNR Return On Average Assets (Non-GAAP)(2) 1.44% 1.29% 1.25% 1.12% 1.13% 1.08% 0.90% 0.84% Return On Average Tangible Common Equity (Non-GAAP)(3) 12.06% 12.79% 11.53% 11.60% 9.99% 9.75% 8.94% 10.62% Operating Return On Average Shareholders' Equity (Non-GAAP)(4) 9.96% 10.92% 9.19% 9.17% 7.80% 7.60% 6.72% 7.29% Operating Return On Average Tangible Common Equity (Non-GAAP)(5) 12.07% 13.53% 11.53% 11.60% 9.94% 9.75% 8.70% 9.49% Operating Efficiency Ratio Efficiency Ratio (GAAP) 60.91% 66.32% 66.14% 68.96% 68.98% 69.83% 72.25% 71.20% Adjustment For Taxable Equivalent Yields (0.43%) (0.47%) (0.47%) (0.50%) (0.49%) (0.55%) (0.63%) (0.17%) Adjustment For Securities (Gains) Losses - (4.50%) (0.01%) - 0.09% - - - Adjustment For Sale of Branch Building - - - - - - 0.51% 2.46% Adjustment For Sale of SBKI / Donation of a Former Branch Location - 5.57% - - - - - - Adjustment For Accruals For Pending Litigation - - - - - - - - Adjustment For Merger Expenses (0.02%) (3.31%) - - - - - - Operating Efficiency Ratio (Non-GAAP) 60.45% 63.61% 65.66% 68.46% 68.58% 69.28% 72.13% 73.50% NON-GAAP RECONCILIATION 25 1. Operating return on average assets (Non-GAAP) is the annualized operating earnings (Non-GAAP) divided by average assets. 2. Operating PPNR return on average assets (Non-GAAP) is the annualized operating PPNR earnings (Non-GAAP) divided by average assets. 3. Return on average tangible common equity (Non-GAAP) is the annualized net income divided by average tangible common equity (Non-GAAP). 4. Operating return on average shareholders’ equity (Non-GAAP) is the annualized operating earnings (Non-GAAP) divided by average shareholder equity. 5. Operating return on average tangible common equity (Non-GAAP) is the annualized operating earnings (Non-GAAP) divided by average tangible common equity (Non-GAAP). Note: Totals may not add due to rounding $ in Thousands, unless otherwise indicated |
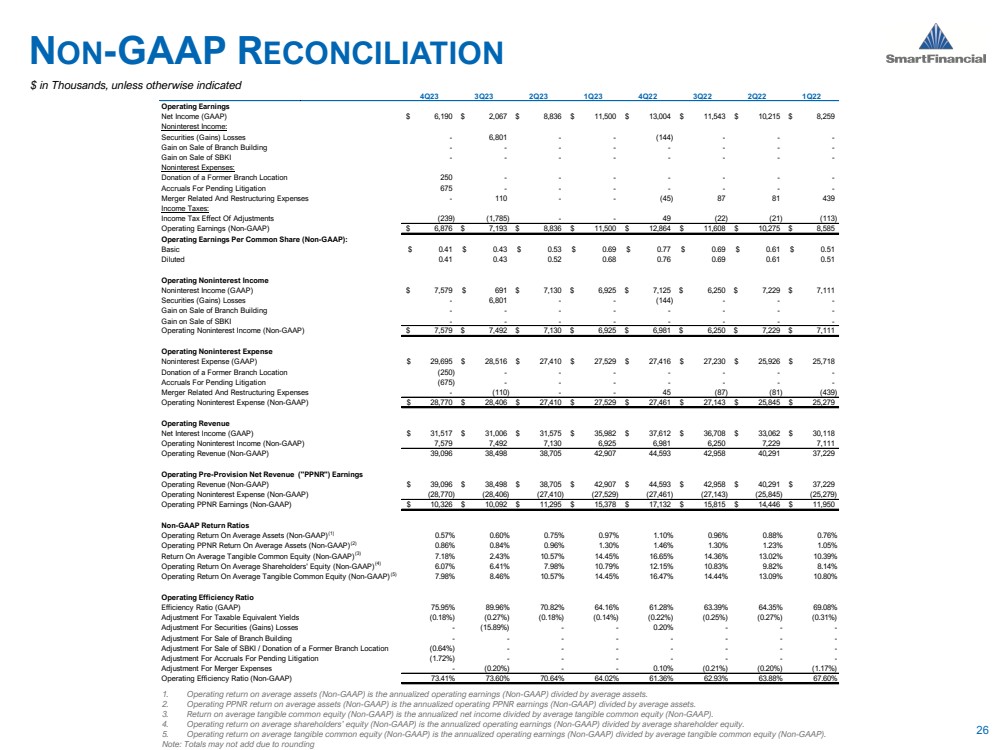
| 4Q23 3Q23 2Q23 1Q23 4Q22 3Q22 2Q22 1Q22 Operating Earnings Net Income (GAAP) $ 6,190 $ 2,067 $ 8,836 $ 11,500 $ 13,004 $ 11,543 $ 10,215 $ 8,259 Noninterest Income: Securities (Gains) Losses - 6,801 - - (144) - - - Gain on Sale of Branch Building - - - - - - - - Gain on Sale of SBKI - - - - - - - - Noninterest Expenses: Donation of a Former Branch Location 250 - - - - - - - Accruals For Pending Litigation 675 - - - - - - - Merger Related And Restructuring Expenses - 110 - - (45) 87 81 439 Income Taxes: Income Tax Effect Of Adjustments (239) (1,785) - - 49 (22) (21) (113) Operating Earnings (Non-GAAP) $ 6,876 $ 7,193 $ 8,836 $ 11,500 $ 12,864 $ 11,608 $ 10,275 $ 8,585 Operating Earnings Per Common Share (Non-GAAP): Basic $ 0.41 $ 0.43 $ 0.53 $ 0.69 $ 0.77 $ 0.69 $ 0.61 $ 0.51 Diluted 0.41 0.43 0.52 0.68 0.76 0.69 0.61 0.51 Operating Noninterest Income Noninterest Income (GAAP) $ 7,579 $ 691 $ 7,130 $ 6,925 $ 7,125 $ 6,250 $ 7,229 $ 7,111 Securities (Gains) Losses - 6,801 - - (144) - - - Gain on Sale of Branch Building - - - - - - - - Gain on Sale of SBKI - - - - - - - - Operating Noninterest Income (Non-GAAP) $ 7,579 $ 7,492 $ 7,130 $ 6,925 $ 6,981 $ 6,250 $ 7,229 $ 7,111 Operating Noninterest Expense Noninterest Expense (GAAP) $ 29,695 $ 28,516 $ 27,410 $ 27,529 $ 27,416 $ 27,230 $ 25,926 $ 25,718 Donation of a Former Branch Location (250) - - - - - - - Accruals For Pending Litigation (675) - - - - - - - Merger Related And Restructuring Expenses - (110) - - 45 (87) (81) (439) Operating Noninterest Expense (Non-GAAP) $ 28,770 $ 28,406 $ 27,410 $ 27,529 $ 27,461 $ 27,143 $ 25,845 $ 25,279 Operating Revenue Net Interest Income (GAAP) $ 31,517 $ 31,006 $ 31,575 $ 35,982 $ 37,612 $ 36,708 $ 33,062 $ 30,118 Operating Noninterest Income (Non-GAAP) 7,579 7,492 7,130 6,925 6,981 6,250 7,229 7,111 Operating Revenue (Non-GAAP) 39,096 38,498 38,705 42,907 44,593 42,958 40,291 37,229 Operating Pre-Provision Net Revenue ("PPNR") Earnings Operating Revenue (Non-GAAP) $ 39,096 $ 38,498 $ 38,705 $ 42,907 $ 44,593 $ 42,958 $ 40,291 $ 37,229 Operating Noninterest Expense (Non-GAAP) (28,770) (28,406) (27,410) (27,529) (27,461) (27,143) (25,845) (25,279) Operating PPNR Earnings (Non-GAAP) $ 10,326 $ 10,092 $ 11,295 $ 15,378 $ 17,132 $ 15,815 $ 14,446 $ 11,950 Non-GAAP Return Ratios Operating Return On Average Assets (Non-GAAP)(1) 0.57% 0.60% 0.75% 0.97% 1.10% 0.96% 0.88% 0.76% Operating PPNR Return On Average Assets (Non-GAAP)(2) 0.86% 0.84% 0.96% 1.30% 1.46% 1.30% 1.23% 1.05% Return On Average Tangible Common Equity (Non-GAAP)(3) 7.18% 2.43% 10.57% 14.45% 16.65% 14.36% 13.02% 10.39% Operating Return On Average Shareholders' Equity (Non-GAAP)(4) 6.07% 6.41% 7.98% 10.79% 12.15% 10.83% 9.82% 8.14% Operating Return On Average Tangible Common Equity (Non-GAAP)(5) 7.98% 8.46% 10.57% 14.45% 16.47% 14.44% 13.09% 10.80% Operating Efficiency Ratio Efficiency Ratio (GAAP) 75.95% 89.96% 70.82% 64.16% 61.28% 63.39% 64.35% 69.08% Adjustment For Taxable Equivalent Yields (0.18%) (0.27%) (0.18%) (0.14%) (0.22%) (0.25%) (0.27%) (0.31%) Adjustment For Securities (Gains) Losses - (15.89%) - - 0.20% - - - Adjustment For Sale of Branch Building - - - - - - - - Adjustment For Sale of SBKI / Donation of a Former Branch Location (0.64%) - - - - - - - Adjustment For Accruals For Pending Litigation (1.72%) - - - - - - - Adjustment For Merger Expenses - (0.20%) - - 0.10% (0.21%) (0.20%) (1.17%) Operating Efficiency Ratio (Non-GAAP) 73.41% 73.60% 70.64% 64.02% 61.36% 62.93% 63.88% 67.60% NON-GAAP RECONCILIATION 26 1. Operating return on average assets (Non-GAAP) is the annualized operating earnings (Non-GAAP) divided by average assets. 2. Operating PPNR return on average assets (Non-GAAP) is the annualized operating PPNR earnings (Non-GAAP) divided by average assets. 3. Return on average tangible common equity (Non-GAAP) is the annualized net income divided by average tangible common equity (Non-GAAP). 4. Operating return on average shareholders’ equity (Non-GAAP) is the annualized operating earnings (Non-GAAP) divided by average shareholder equity. 5. Operating return on average tangible common equity (Non-GAAP) is the annualized operating earnings (Non-GAAP) divided by average tangible common equity (Non-GAAP). Note: Totals may not add due to rounding $ in Thousands, unless otherwise indicated |
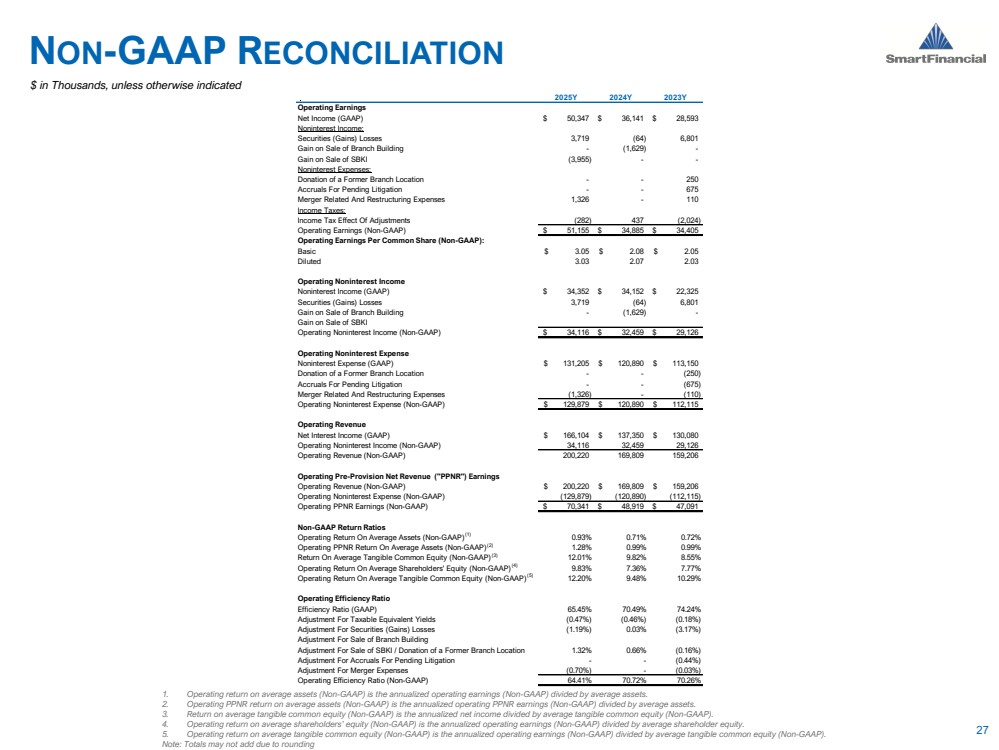
| 2025Y 2024Y 2023Y Operating Earnings Net Income (GAAP) $ 50,347 $ 36,141 $ 28,593 Noninterest Income: Securities (Gains) Losses 3,719 (64) 6,801 Gain on Sale of Branch Building - (1,629) - Gain on Sale of SBKI (3,955) - - Noninterest Expenses: Donation of a Former Branch Location - - 250 Accruals For Pending Litigation - - 675 Merger Related And Restructuring Expenses 1,326 - 110 Income Taxes: Income Tax Effect Of Adjustments (282) 437 (2,024) Operating Earnings (Non-GAAP) $ 51,155 $ 34,885 $ 34,405 Operating Earnings Per Common Share (Non-GAAP): Basic $ 3.05 $ 2.08 $ 2.05 Diluted 3.03 2.07 2.03 Operating Noninterest Income Noninterest Income (GAAP) $ 34,352 $ 34,152 $ 22,325 Securities (Gains) Losses 3,719 (64) 6,801 Gain on Sale of Branch Building - (1,629) - Gain on Sale of SBKI Operating Noninterest Income (Non-GAAP) $ 34,116 $ 32,459 $ 29,126 Operating Noninterest Expense Noninterest Expense (GAAP) $ 131,205 $ 120,890 $ 113,150 Donation of a Former Branch Location - - (250) Accruals For Pending Litigation - - (675) Merger Related And Restructuring Expenses (1,326) - (110) Operating Noninterest Expense (Non-GAAP) $ 129,879 $ 120,890 $ 112,115 Operating Revenue Net Interest Income (GAAP) $ 166,104 $ 137,350 $ 130,080 Operating Noninterest Income (Non-GAAP) 34,116 32,459 29,126 Operating Revenue (Non-GAAP) 200,220 169,809 159,206 Operating Pre-Provision Net Revenue ("PPNR") Earnings Operating Revenue (Non-GAAP) $ 200,220 $ 169,809 $ 159,206 Operating Noninterest Expense (Non-GAAP) (129,879) (120,890) (112,115) Operating PPNR Earnings (Non-GAAP) $ 70,341 $ 48,919 $ 47,091 Non-GAAP Return Ratios Operating Return On Average Assets (Non-GAAP)(1) 0.93% 0.71% 0.72% Operating PPNR Return On Average Assets (Non-GAAP)(2) 1.28% 0.99% 0.99% Return On Average Tangible Common Equity (Non-GAAP)(3) 12.01% 9.82% 8.55% Operating Return On Average Shareholders' Equity (Non-GAAP)(4) 9.83% 7.36% 7.77% Operating Return On Average Tangible Common Equity (Non-GAAP)(5) 12.20% 9.48% 10.29% Operating Efficiency Ratio Efficiency Ratio (GAAP) 65.45% 70.49% 74.24% Adjustment For Taxable Equivalent Yields (0.47%) (0.46%) (0.18%) Adjustment For Securities (Gains) Losses (1.19%) 0.03% (3.17%) Adjustment For Sale of Branch Building Adjustment For Sale of SBKI / Donation of a Former Branch Location 1.32% 0.66% (0.16%) Adjustment For Accruals For Pending Litigation - - (0.44%) Adjustment For Merger Expenses (0.70%) - (0.03%) Operating Efficiency Ratio (Non-GAAP) 64.41% 70.72% 70.26% NON-GAAP RECONCILIATION 27 1. Operating return on average assets (Non-GAAP) is the annualized operating earnings (Non-GAAP) divided by average assets. 2. Operating PPNR return on average assets (Non-GAAP) is the annualized operating PPNR earnings (Non-GAAP) divided by average assets. 3. Return on average tangible common equity (Non-GAAP) is the annualized net income divided by average tangible common equity (Non-GAAP). 4. Operating return on average shareholders’ equity (Non-GAAP) is the annualized operating earnings (Non-GAAP) divided by average shareholder equity. 5. Operating return on average tangible common equity (Non-GAAP) is the annualized operating earnings (Non-GAAP) divided by average tangible common equity (Non-GAAP). Note: Totals may not add due to rounding $ in Thousands, unless otherwise indicated |
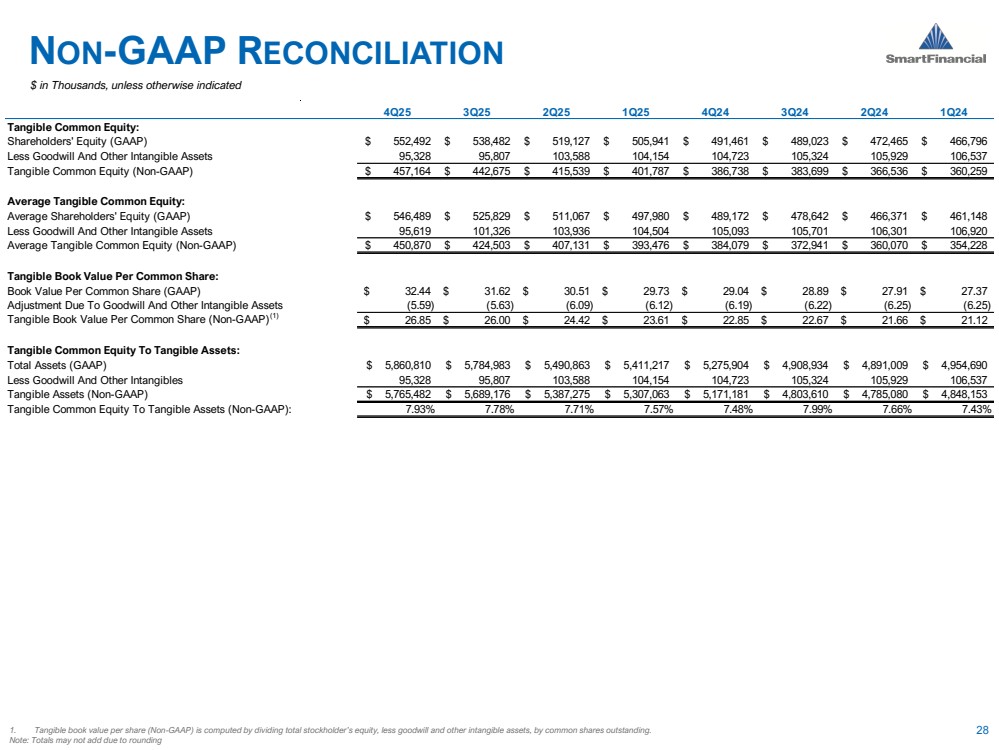
| NON-GAAP RECONCILIATION 1. Tangible book value per share (Non-GAAP) is computed by dividing total stockholder’s equity, less goodwill and other intangible assets, by common shares outstanding. 28 Note: Totals may not add due to rounding $ in Thousands, unless otherwise indicated 4Q25 3Q25 2Q25 1Q25 4Q24 3Q24 2Q24 1Q24 Tangible Common Equity: Shareholders' Equity (GAAP) $ 552,492 $ 538,482 $ 519,127 $ 505,941 $ 491,461 $ 489,023 $ 472,465 $ 466,796 Less Goodwill And Other Intangible Assets 95,328 95,807 103,588 104,154 104,723 105,324 105,929 106,537 Tangible Common Equity (Non-GAAP) $ 457,164 $ 442,675 $ 415,539 $ 401,787 $ 386,738 $ 383,699 $ 366,536 $ 360,259 Average Tangible Common Equity: Average Shareholders' Equity (GAAP) $ 546,489 $ 525,829 $ 511,067 $ 497,980 $ 489,172 $ 478,642 $ 466,371 $ 461,148 Less Goodwill And Other Intangible Assets 95,619 101,326 103,936 104,504 105,093 105,701 106,301 106,920 Average Tangible Common Equity (Non-GAAP) $ 450,870 $ 424,503 $ 407,131 $ 393,476 $ 384,079 $ 372,941 $ 360,070 $ 354,228 Tangible Book Value Per Common Share: Book Value Per Common Share (GAAP) $ 32.44 $ 31.62 $ 30.51 $ 29.73 $ 29.04 $ 28.89 $ 27.91 $ 27.37 Adjustment Due To Goodwill And Other Intangible Assets (5.59) (5.63) (6.09) (6.12) (6.19) (6.22) (6.25) (6.25) Tangible Book Value Per Common Share (Non-GAAP)(1) $ 26.85 $ 26.00 $ 24.42 $ 23.61 $ 22.85 $ 22.67 $ 21.66 $ 21.12 Tangible Common Equity To Tangible Assets: Total Assets (GAAP) $ 5,860,810 $ 5,784,983 $ 5,490,863 $ 5,411,217 $ 5,275,904 $ 4,908,934 $ 4,891,009 $ 4,954,690 Less Goodwill And Other Intangibles 95,328 95,807 103,588 104,154 104,723 105,324 105,929 106,537 Tangible Assets (Non-GAAP) $ 5,765,482 $ 5,689,176 $ 5,387,275 $ 5,307,063 $ 5,171,181 $ 4,803,610 $ 4,785,080 $ 4,848,153 Tangible Common Equity To Tangible Assets (Non-GAAP): 7.93% 7.78% 7.71% 7.57% 7.48% 7.99% 7.66% 7.43% |
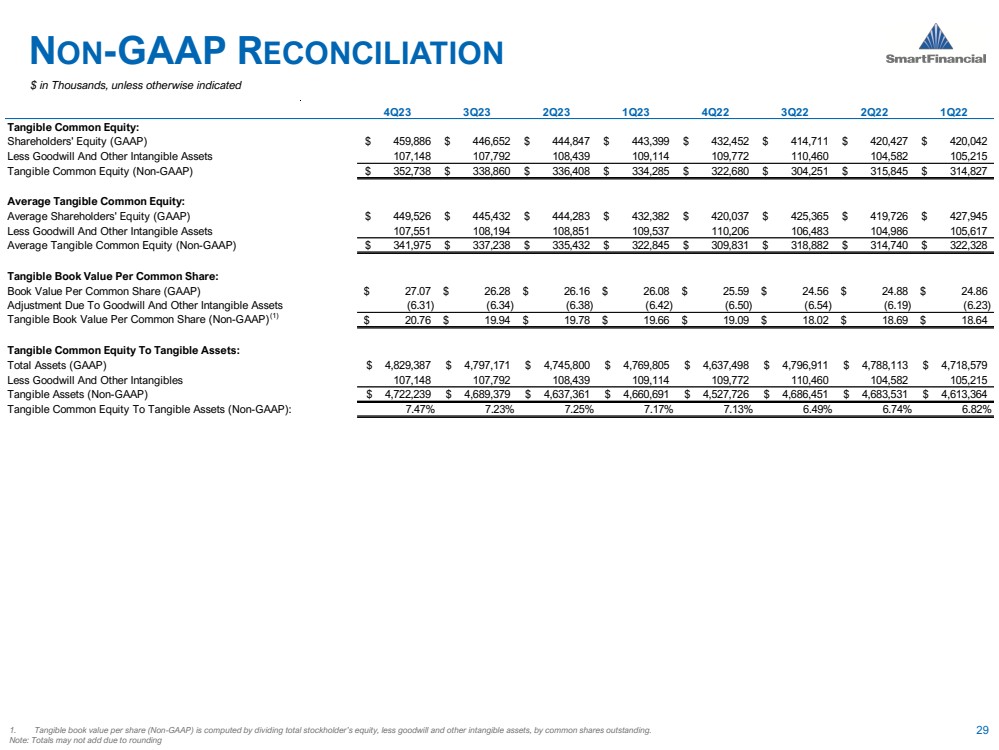
| 4Q23 3Q23 2Q23 1Q23 4Q22 3Q22 2Q22 1Q22 Tangible Common Equity: Shareholders' Equity (GAAP) $ 459,886 $ 446,652 $ 444,847 $ 443,399 $ 432,452 $ 414,711 $ 420,427 $ 420,042 Less Goodwill And Other Intangible Assets 107,148 107,792 108,439 109,114 109,772 110,460 104,582 105,215 Tangible Common Equity (Non-GAAP) $ 352,738 $ 338,860 $ 336,408 $ 334,285 $ 322,680 $ 304,251 $ 315,845 $ 314,827 Average Tangible Common Equity: Average Shareholders' Equity (GAAP) $ 449,526 $ 445,432 $ 444,283 $ 432,382 $ 420,037 $ 425,365 $ 419,726 $ 427,945 Less Goodwill And Other Intangible Assets 107,551 108,194 108,851 109,537 110,206 106,483 104,986 105,617 Average Tangible Common Equity (Non-GAAP) $ 341,975 $ 337,238 $ 335,432 $ 322,845 $ 309,831 $ 318,882 $ 314,740 $ 322,328 Tangible Book Value Per Common Share: Book Value Per Common Share (GAAP) $ 27.07 $ 26.28 $ 26.16 $ 26.08 $ 25.59 $ 24.56 $ 24.88 $ 24.86 Adjustment Due To Goodwill And Other Intangible Assets (6.31) (6.34) (6.38) (6.42) (6.50) (6.54) (6.19) (6.23) Tangible Book Value Per Common Share (Non-GAAP)(1) $ 20.76 $ 19.94 $ 19.78 $ 19.66 $ 19.09 $ 18.02 $ 18.69 $ 18.64 Tangible Common Equity To Tangible Assets: Total Assets (GAAP) $ 4,829,387 $ 4,797,171 $ 4,745,800 $ 4,769,805 $ 4,637,498 $ 4,796,911 $ 4,788,113 $ 4,718,579 Less Goodwill And Other Intangibles 107,148 107,792 108,439 109,114 109,772 110,460 104,582 105,215 Tangible Assets (Non-GAAP) $ 4,722,239 $ 4,689,379 $ 4,637,361 $ 4,660,691 $ 4,527,726 $ 4,686,451 $ 4,683,531 $ 4,613,364 Tangible Common Equity To Tangible Assets (Non-GAAP): 7.47% 7.23% 7.25% 7.17% 7.13% 6.49% 6.74% 6.82% NON-GAAP RECONCILIATION 1. Tangible book value per share (Non-GAAP) is computed by dividing total stockholder’s equity, less goodwill and other intangible assets, by common shares outstanding. 29 Note: Totals may not add due to rounding $ in Thousands, unless otherwise indicated |
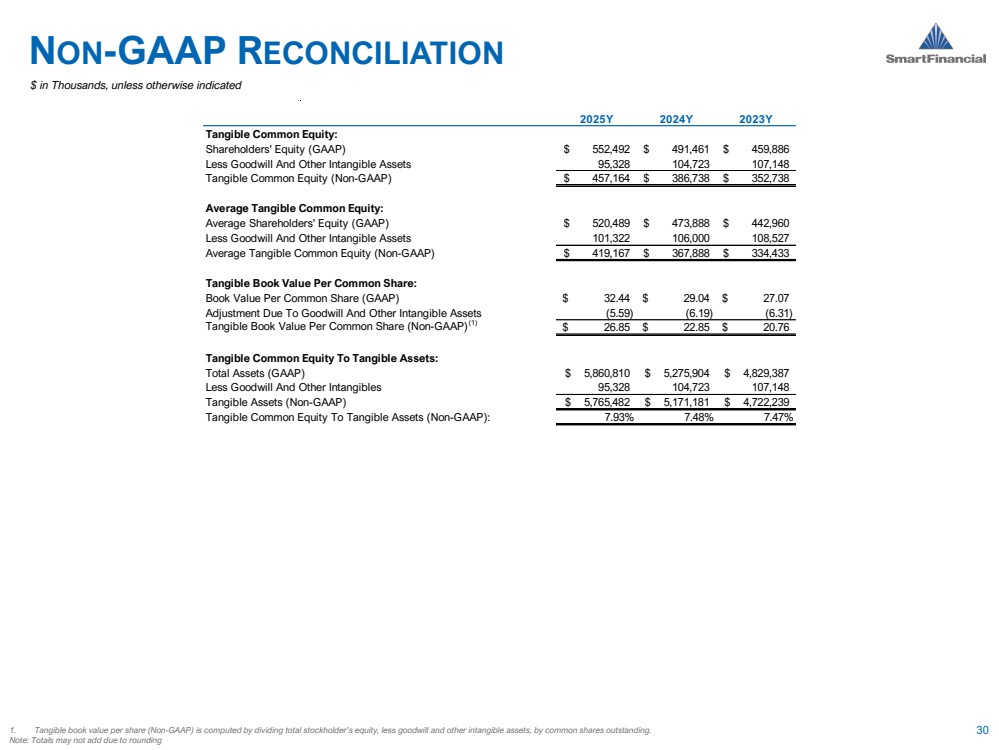
| NON-GAAP RECONCILIATION 1. Tangible book value per share (Non-GAAP) is computed by dividing total stockholder’s equity, less goodwill and other intangible assets, by common shares outstanding. 30 Note: Totals may not add due to rounding $ in Thousands, unless otherwise indicated 2025Y 2024Y 2023Y Tangible Common Equity: Shareholders' Equity (GAAP) $ 552,492 $ 491,461 $ 459,886 Less Goodwill And Other Intangible Assets 95,328 104,723 107,148 Tangible Common Equity (Non-GAAP) $ 457,164 $ 386,738 $ 352,738 Average Tangible Common Equity: Average Shareholders' Equity (GAAP) $ 520,489 $ 473,888 $ 442,960 Less Goodwill And Other Intangible Assets 101,322 106,000 108,527 Average Tangible Common Equity (Non-GAAP) $ 419,167 $ 367,888 $ 334,433 Tangible Book Value Per Common Share: Book Value Per Common Share (GAAP) $ 32.44 $ 29.04 $ 27.07 Adjustment Due To Goodwill And Other Intangible Assets (5.59) (6.19) (6.31) Tangible Book Value Per Common Share (Non-GAAP)(1) $ 26.85 $ 22.85 $ 20.76 Tangible Common Equity To Tangible Assets: Total Assets (GAAP) $ 5,860,810 $ 5,275,904 $ 4,829,387 Less Goodwill And Other Intangibles 95,328 104,723 107,148 Tangible Assets (Non-GAAP) $ 5,765,482 $ 5,171,181 $ 4,722,239 Tangible Common Equity To Tangible Assets (Non-GAAP): 7.93% 7.48% 7.47% |
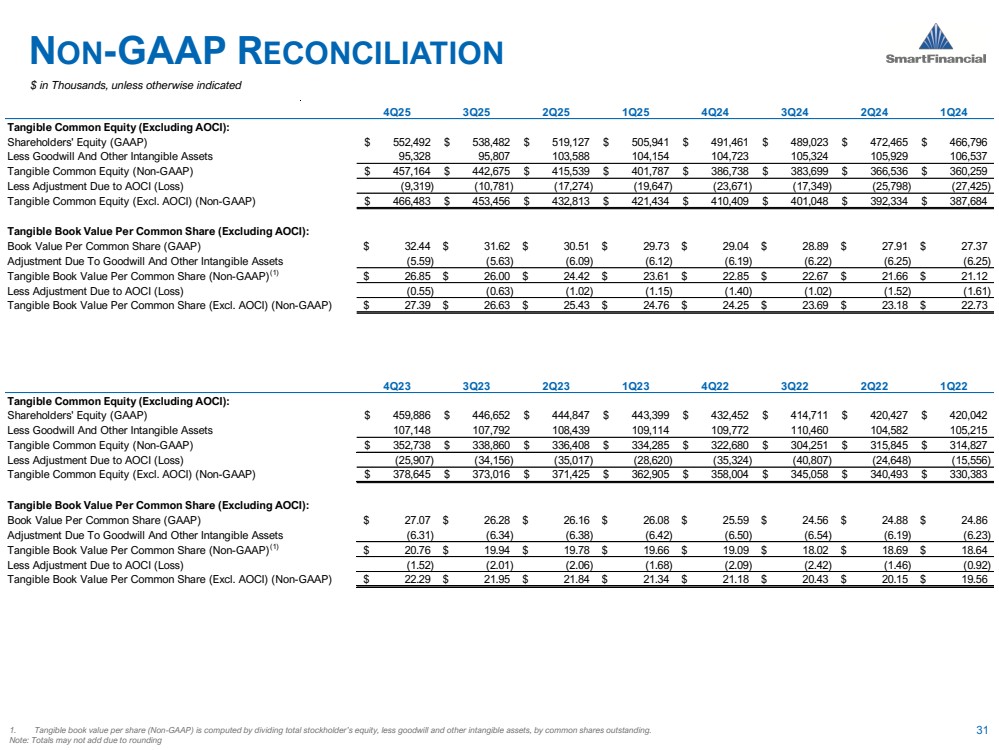
| 4Q23 3Q23 2Q23 1Q23 4Q22 3Q22 2Q22 1Q22 Tangible Common Equity (Excluding AOCI): Shareholders' Equity (GAAP) $ 459,886 $ 446,652 $ 444,847 $ 443,399 $ 432,452 $ 414,711 $ 420,427 $ 420,042 Less Goodwill And Other Intangible Assets 107,148 107,792 108,439 109,114 109,772 110,460 104,582 105,215 Tangible Common Equity (Non-GAAP) $ 352,738 $ 338,860 $ 336,408 $ 334,285 $ 322,680 $ 304,251 $ 315,845 $ 314,827 Less Adjustment Due to AOCI (Loss) (25,907) (34,156) (35,017) (28,620) (35,324) (40,807) (24,648) (15,556) Tangible Common Equity (Excl. AOCI) (Non-GAAP) $ 378,645 $ 373,016 $ 371,425 $ 362,905 $ 358,004 $ 345,058 $ 340,493 $ 330,383 Tangible Book Value Per Common Share (Excluding AOCI): Book Value Per Common Share (GAAP) $ 27.07 $ 26.28 $ 26.16 $ 26.08 $ 25.59 $ 24.56 $ 24.88 $ 24.86 Adjustment Due To Goodwill And Other Intangible Assets (6.31) (6.34) (6.38) (6.42) (6.50) (6.54) (6.19) (6.23) Tangible Book Value Per Common Share (Non-GAAP)(1) $ 20.76 $ 19.94 $ 19.78 $ 19.66 $ 19.09 $ 18.02 $ 18.69 $ 18.64 Less Adjustment Due to AOCI (Loss) (1.52) (2.01) (2.06) (1.68) (2.09) (2.42) (1.46) (0.92) Tangible Book Value Per Common Share (Excl. AOCI) (Non-GAAP) $ 22.29 $ 21.95 $ 21.84 $ 21.34 $ 21.18 $ 20.43 $ 20.15 $ 19.56 NON-GAAP RECONCILIATION 1. Tangible book value per share (Non-GAAP) is computed by dividing total stockholder’s equity, less goodwill and other intangible assets, by common shares outstanding. 31 Note: Totals may not add due to rounding $ in Thousands, unless otherwise indicated 4Q25 3Q25 2Q25 1Q25 4Q24 3Q24 2Q24 1Q24 Tangible Common Equity (Excluding AOCI): Shareholders' Equity (GAAP) $ 552,492 $ 538,482 $ 519,127 $ 505,941 $ 491,461 $ 489,023 $ 472,465 $ 466,796 Less Goodwill And Other Intangible Assets 95,328 95,807 103,588 104,154 104,723 105,324 105,929 106,537 Tangible Common Equity (Non-GAAP) $ 457,164 $ 442,675 $ 415,539 $ 401,787 $ 386,738 $ 383,699 $ 366,536 $ 360,259 Less Adjustment Due to AOCI (Loss) (9,319) (10,781) (17,274) (19,647) (23,671) (17,349) (25,798) (27,425) Tangible Common Equity (Excl. AOCI) (Non-GAAP) $ 466,483 $ 453,456 $ 432,813 $ 421,434 $ 410,409 $ 401,048 $ 392,334 $ 387,684 Tangible Book Value Per Common Share (Excluding AOCI): Book Value Per Common Share (GAAP) $ 32.44 $ 31.62 $ 30.51 $ 29.73 $ 29.04 $ 28.89 $ 27.91 $ 27.37 Adjustment Due To Goodwill And Other Intangible Assets (5.59) (5.63) (6.09) (6.12) (6.19) (6.22) (6.25) (6.25) Tangible Book Value Per Common Share (Non-GAAP)(1) $ 26.85 $ 26.00 $ 24.42 $ 23.61 $ 22.85 $ 22.67 $ 21.66 $ 21.12 Less Adjustment Due to AOCI (Loss) (0.55) (0.63) (1.02) (1.15) (1.40) (1.02) (1.52) (1.61) Tangible Book Value Per Common Share (Excl. AOCI) (Non-GAAP) $ 27.39 $ 26.63 $ 25.43 $ 24.76 $ 24.25 $ 23.69 $ 23.18 $ 22.73 |
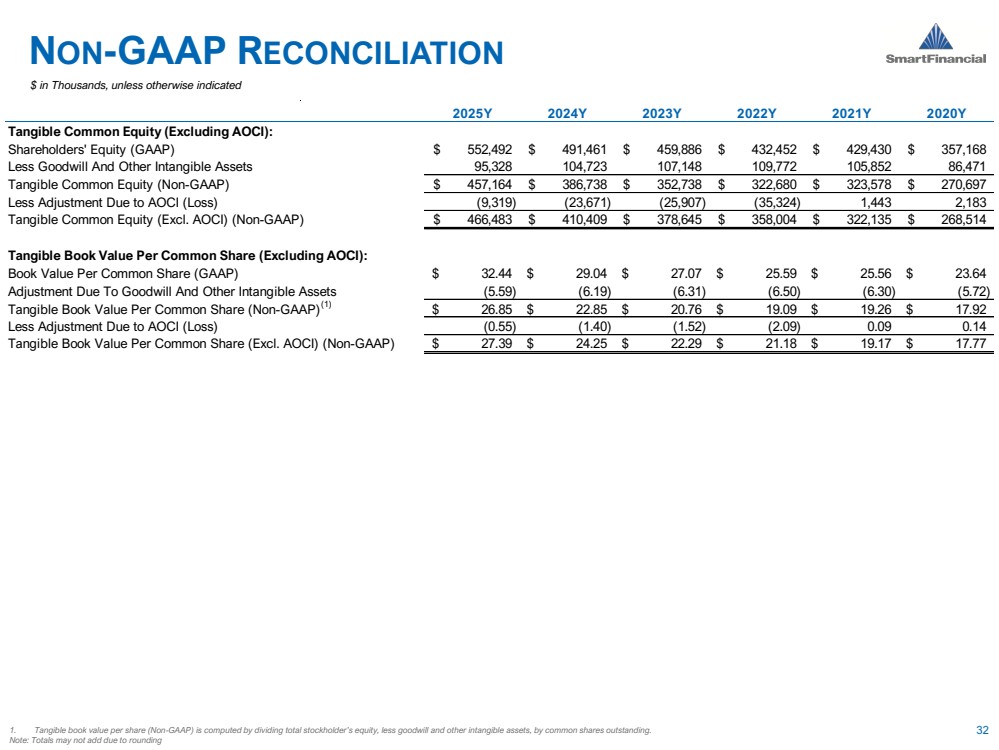
| NON-GAAP RECONCILIATION 1. Tangible book value per share (Non-GAAP) is computed by dividing total stockholder’s equity, less goodwill and other intangible assets, by common shares outstanding. 32 Note: Totals may not add due to rounding $ in Thousands, unless otherwise indicated 2025Y 2024Y 2023Y 2022Y 2021Y 2020Y Tangible Common Equity (Excluding AOCI): Shareholders' Equity (GAAP) $ 552,492 $ 491,461 $ 459,886 $ 432,452 $ 429,430 $ 357,168 Less Goodwill And Other Intangible Assets 95,328 104,723 107,148 109,772 105,852 86,471 Tangible Common Equity (Non-GAAP) $ 457,164 $ 386,738 $ 352,738 $ 322,680 $ 323,578 $ 270,697 Less Adjustment Due to AOCI (Loss) (9,319) (23,671) (25,907) (35,324) 1,443 2,183 Tangible Common Equity (Excl. AOCI) (Non-GAAP) $ 466,483 $ 410,409 $ 378,645 $ 358,004 $ 322,135 $ 268,514 Tangible Book Value Per Common Share (Excluding AOCI): Book Value Per Common Share (GAAP) $ 32.44 $ 29.04 $ 27.07 $ 25.59 $ 25.56 $ 23.64 Adjustment Due To Goodwill And Other Intangible Assets (5.59) (6.19) (6.31) (6.50) (6.30) (5.72) Tangible Book Value Per Common Share (Non-GAAP)(1) $ 26.85 $ 22.85 $ 20.76 $ 19.09 $ 19.26 $ 17.92 Less Adjustment Due to AOCI (Loss) (0.55) (1.40) (1.52) (2.09) 0.09 0.14 Tangible Book Value Per Common Share (Excl. AOCI) (Non-GAAP) $ 27.39 $ 24.25 $ 22.29 $ 21.18 $ 19.17 $ 17.77 |
| CONTACT 33 Billy Carroll President & CEO 865.868.0613 Billy.Carroll@smartbank.com Miller Welborn Chairman 423.385.3067 Miller.Welborn@smartbank.com 5401 Kingston Pike, Suite 600 Knoxville, TN 37919 Ron Gorczynski Chief Financial Officer 865.437.5724 Ron.Gorczynski@smartbank.com |