SECURITIES AND EXCHANGE COMMISSION
Washington, D.C. 20549
FORM 6-K
Report of Foreign Private Issuer
Pursuant to Rule 13a-16 or 15d-16 of the
Securities Exchange Act of 1934
For the month of November, 2025
Commission File Number 1-14668
COMPANHIA PARANAENSE DE ENERGIA
(Exact name of registrant as specified in its charter)
Energy Company of Paraná
(Translation of Registrant's name into English)
José Izidoro Biazetto, 158
81200-240 Curitiba, Paraná
Federative Republic of Brazil
+55 (41) 3331-4011
(Address of principal executive offices)
Indicate by check mark whether the registrant files or will file annual reports under cover Form 20-F or Form 40-F. Form 20-F ___X___ Form 40-F _______
Indicate by check mark whether the registrant by furnishing the information contained in this Form is also thereby furnishing the information to the Commission pursuant to Rule 12g3-2(b) under the Securities Exchange Act of 1934.
Yes _______ No ___X____

| Summary | ||
| 1. Consolidated Results | ||
[1]
1 Copel Serviços, Elejor and other stakes in generation assets.
2 Excluding non-recurring items, mark-to-market - MTM at TradeCo, new replacement value for the adjustment to present value of the indemnifiable asset (VNR) at DisCo, equity equivalence and IFRS effects on transmission contract assets.
3 Copel (Holding), Copel Serviços and Elejor accounted for -2.1% of recurring Ebitda. 1
| 2 |
| |
| 3 |
| |
| 4 |
| |
| 5 |
| |
| 6 |
| |
| 2. Investments | ||
| 7 |
| |
|
3. Copel Geração e Transmissão (GenCo) (Consolidated Result) |
||
[4] Excluding non-recurring items and IFRS effects on transmission contract assets.
| 8 |
| |
| 9 |
| |
[5] Jandaíra I, II, III and IV wind farms (30° LEN - CCEAR 2025 - 2044).
| 10 |
| |
[6] This refers to concession contract 060/2001, which represents 36.6% of GenCo's annual permitted revenue (APR) for transmission and proportional stakes.
| 11 |
| |
| 4. Copel Distribuição (DisCo) | ||
| 12 |
| |
| 13 |
| |
| 14 |
| |
| 5. Copel Comercialização (TradeCo) | ||
| 15 |
| |
| 16 |
| |
| 6. ESG performance | ||
| 17 |
| |
| 18 |
| |
| 7. Other highlights from the period | ||
7. Other highlights from the period
| 19 |
| |
| 20 |

| EXHIBIT I - CONSOLIDATED RESULTS > INCOME STATEMENT |
| R$ '000 | |||||||
| Income Statement | 3Q25 | 3Q24 | Δ% | 9M25 | 9M24 | Δ% | |
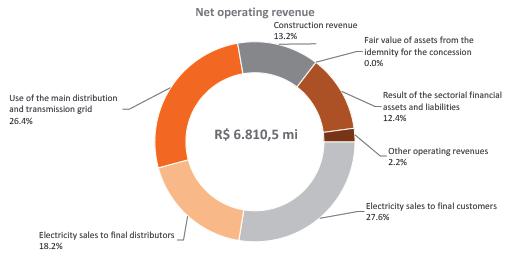
| OPERATING REVENUES | 6,811,177 | 5,735,608 | 18.8 | 18,928,417 | 16,631,872 | 13.8 | |
| Electricity sales to final customers | 1,878,258 | 1,970,334 | -4.7 | 5,982,373 | 6,255,268 | -4.4 | |
| Electricity sales to distributors | 1,241,556 | 834657 | 48.8 | 3,357,229 | 2,301,493 | 45.9 | |
| Use of the main distribution and transmission grid | 1,752,729 | 1,660,092 | 5.6 | 5,212,408 | 5,133,304 | 1.5 | |
| Construction revenue | 952,822 | 661,016 | 44.1 | 2,435,282 | 1,908,985 | 27.6 | |
| Fair value of assets from the indemnity for the concession | 36,909 | 17,190 | 114.7 | 72,651 | 49,467 | 46.9 | |
| Result of Sectorial financial assets and liabilities | 845,437 | 420,709 | 101.0 | 1,408,164 | 566,185 | 148.7 | |
| Other operating revenues | 103,466 | 171,610 | -39.7 | 460,310 | 417,170 | 10.3 | |
| OPERATING COSTS AND EXPENSES | -5,866,333 | -4,640,519 | 26.4 | -15,545,166 | -13,715,653 | 13.3 | |
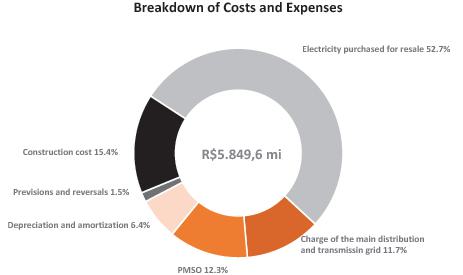
| Electricity purchased for resale | -3,083,439 | -2,327,982 | 32.5 | -7,899,201 | -6,314,383 | 25.1 | |
| Charge of the main distribution and transmission grid | -687,026 | -714,064 | -3.8 | -2,080,127 | -2,222,422 | -6.4 | |
| Personnel and management | -212,592 | -278,929 | -23.8 | -704,166 | -857,625 | -17.9 | |
| Pension and healthcare plans | -57,932 | -63,291 | -8.5 | -176,884 | -198,988 | -11.1 | |
| Materials and supplies | -19,122 | -22,093 | -13.4 | -64,036 | -62,236 | 2.9 | |
| Materials and supplies for power eletricity | — | — | — | — | -936 | — | |
| Third-party services | -287,408 | -274,613 | 4.7 | -848,418 | -772,679 | 9.8 | |
| Depreciation and amortization | -376,524 | -368,414 | 2.2 | -1,092,755 | -1,089,197 | 0.3 | |
| Provisions and reversals | -85,565 | -68,379 | 25.1 | -240,010 | -227,955 | 5.3 | |
| Construction cost | -950,376 | -658,392 | 44.3 | -2,426,558 | -1,902,041 | 27.6 | |
| Other cost and expenses | -106,349 | 135,638 | -178.4 | -13,011 | -67,191 | -80.6 | |
| EQUITY IN EARNINGS OF SUBSIDIARIES | 37,329 | 63,210 | -40.9 | 202,001 | 225,398 | -10.4 | |
| PROFIT BEFORE FINANCIAL RESULTS AND TAXES | 982,173 | 1,158,299 | -15.2 | 3,585,252 | 3,141,617 | 14.1 | |
| FINANCIAL RESULTS | -442,561 | -222,378 | 99.0 | -1,290,947 | -780,237 | 65.5 | |
| Financial income | 352,570 | 331,192 | 6.5 | 1,025,522 | 857,229 | 19.6 | |
| Financial expenses | -795,131 | -553,570 | 43.6 | -2,316,469 | -1,637,466 | 41.5 | |
| OPERATIONAL EXPENSES/ INCOME | 539,612 | 935,921 | -42.3 | 2,294,305 | 2,361,380 | -2.8 | |
| INCOME TAX AND SOCIAL CONTRIBUTION ON PROFIT | -175,437 | -198,541 | -11.6 | -691,899 | -628,745 | 10.0 | |
| Income tax and social contribution on profit | -72,813 | -65,713 | 10.8 | -225,118 | -208,150 | 8.2 | |
| Deferred income tax and social contribution on profit | -102,624 | -132,828 | -22.7 | -466,781 | -420,595 | 11.0 | |
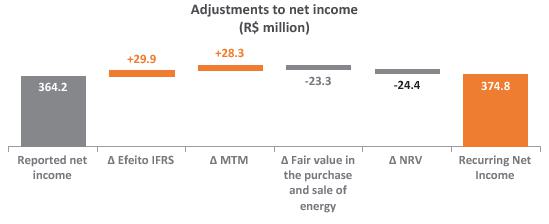
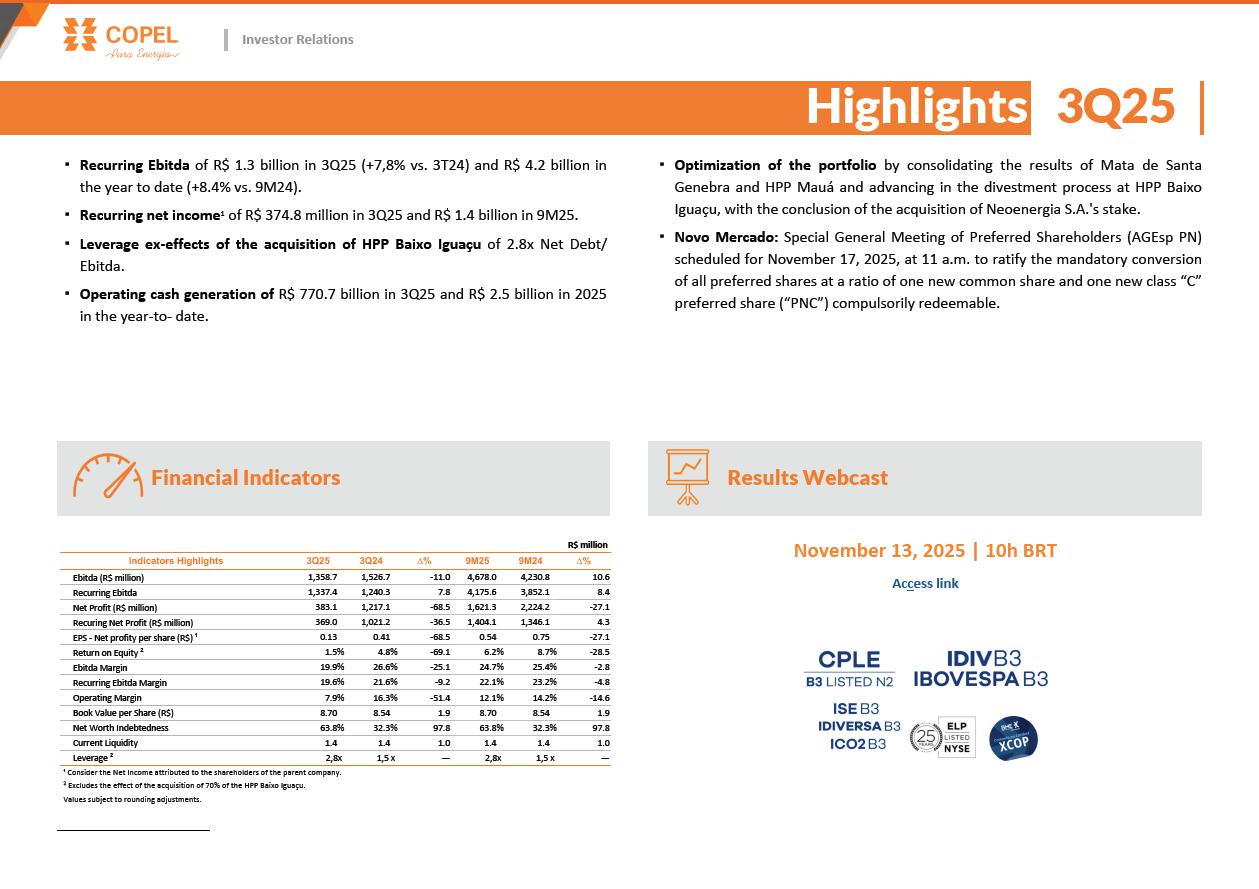
| NET INCOME continuing operations | 364,175 | 737,380 | -50.6 | 1,602,406 | 1,732,635 | -7.5 | |
| NET INCOME discontinued operations | 18,898 | 479,709 | -96.1 | 18,898 | 491,571 | -96.2 | |
| NET INCOME | 383,073 | 1,217,089 | -68.5 | 1,621,304 | 2,224,206 | -27.1 | |
| Attributed to the controlling company's shareholders - continuing operations | 365,324 | 744,556 | -50.9 | 1,602,972 | 1,759,435 | -8.9 | |
| Attributed to the controlling company's shareholders - discontinued operations | 18,898 | 475,104 | — | 18,898 | 463,690 | -95.9 | |
| Attributed to non-controlling shareholders - continuing operations | -1,149 | -7,142 | -83.9 | -566 | -15,458 | -96.3 | |
| Attributed to non-controlling shareholders - discontinued operations | — | 4,571 | — | — | 16,539 | -100.0 | |
| EBITDA continued operations | 1,358,697 | 1,526,713 | -11.0 | 4,678,007 | 4,230,814 | 10.6 |
| 22 |
| |
| EXHIBIT I - CONSOLIDATED RESULTS > BALANCE SHEET |
| R$ '000 | R$ '000 | |||||||
| Assets | Sep-25 | Dec-24 | Δ% | Liabilities | Sep-25 | Dec-24 | Δ% | |
| CURRENT | 13,140,211 | 13,041,808 | 0.8 | CURRENT | 9,161,089 | 10,342,380 | (11.4) | |
| Cash and cash equivalents | 3,815,007 | 4,161,939 | (8.3) | Payroll, social charges and accruals | 266,081 | 411,102 | (35.3) | |
| Bonds and securities | 155,621 | 623 | 24,879.3 | Suppliers | 3,008,055 | 2,324,423 | 29.4 | |
| Collaterals and escrow accounts | 9 | 9 | — | Income tax and social contribution payable | 58,969 | 83,482 | (29.4) | |
| Customers | 4,280,345 | 3,962,702 | 8.0 | Other taxes due | 327,463 | 302,345 | 8.3 | |
| Dividends receivable | 80,520 | 82,278 | (2.1) | Loans and financing | 214,337 | 1,231,205 | (82.6) | |
| Sectorial financial assets | 101,272.0 | — | — | Debentures | 1,943,347 | 2,025,110 | (4.0) | |
| Account receivable related to concession | 12,454 | 10,609 | 17.4 | Minimum compulsory dividend payable | 4,869 | 3,878 | 25.6 | |
| Contract Assets | 406,223 | 283,896 | 43.1 | Post employment benefits | 112,988 | 95,383 | 18.5 | |
| Fair value in energy purchase and sale operations | 257,470 | 217,350 | 18.5 | Customer charges due | 100,913 | 44,825 | 125.1 | |
| Other current receivables | 1,058,206 | 949,674 | 11.4 | Research and development and energy efficiency | 100,650 | 179,149 | (43.8) | |
| Inventories | 164,913 | 136,324 | 21.0 | Accounts Payable related to concession | 142,527 | 113,092 | 26.0 | |
| Income tax and social contribution | 361,936 | 296,128 | 22.2 | Net sectorial financial liabilities | 1,343,870 | 935,322 | 43.7 | |
| Other current recoverable taxes | 576,238 | 994,618 | (42.1) | Lease liability | 61,491 | 57,502 | 6.9 | |
| Prepaid expenses | 58,203 | 63,211 | (7.9) | Fair value in energy purchase and sale operations | 259,232 | 214,955 | 20.6 | |
| Related parties | — | 621 | (100.0) | Other accounts payable | 987,947 | 1,199,195 | (17.6) | |
| Assets held for sale | 1,811,794 | 1,881,826 | (3.7) | Provision for allocation of Pis and Cofins credits | 59,640 | 580,000 | — | |
| NON-CURRENT | 48,908,206 | 44,342,348 | 10.3 | Liabilities associated with assets held for sale | 168,710 | 541,412 | (68.8) | |
| Long Term Assets | 19,347,248 | 15,315,121 | 26.3 | NON-CURRENT | 26,939,661 | 21,404,841 | 25.9 | |
| Bonds and securities | 688,675 | 529,085 | 30.2 | Social and labor obligations | 2,169 | 457 | 374.6 | |
| Other temporary investments | 31,327 | 30,603 | 2.4 | Suppliers | 130,938 | 142,380 | (8.0) | |
| Customers | 143,422 | 116,180 | 23.4 | Deferred income tax and social contribution | 2,053,413 | 1,895,459 | 8.3 | |
| Judicial deposits | 373,897 | 394,364 | (5.2) | Other taxes due | 253,381 | 291,195 | (13.0) | |
| Sectoral financial assets | 303,816 | — | — | Loans and financing | 3,196,297 | 3,387,589 | (5.6) | |
| Account receivable related to concession | 4,051,462 | 3,497,351 | 15.8 | Debentures | 15,574,106 | 10,602,255 | 46.9 | |
| Contract Assets | 10,296,319 | 6,927,010 | 48.6 | Post employment benefits | 1,068,935 | 1,063,326 | 0.5 | |
| Fair value in energy purchase and sale operations | 561,453 | 479,938 | 17.0 | Research and development and energy efficiency | 285,639 | 241,294 | 18.4 | |
| Other non-current receivables | 745,396 | 681,846 | 9.3 | Accounts Payable related to concession | 973,291 | 992,252 | (1.9) | |
| Income tax and social contribution | 103,115 | 164,043 | (37.1) | Net sectorial financial liabilities | — | 142,488 | — | |
| Deferred income tax and social contribution | 880,813 | 1,174,175 | (25.0) | Lease liability | 245,884 | 271,004 | (9.3) | |
| Other non-current recoverable taxes | 1,167,468 | 1,320,526 | (11.6) | Fair value in energy purchase and sale operations | 223,222 | 170,837 | 30.7 | |
| Advance expenses | 85 | — | — | Other accounts payable | 249,142 | 247,021 | 0.9 | |
| Investments | 2,926,176 | 3,577,937 | (18.2) | Provision for allocation of Pis and Cofins credits | 709,120 | 1,000,588 | (29.1) | |
| Property, plant and equipment, net | 8,229,048 | 8,516,697 | (3.4) | Provisions for litigation | 1,974,124 | 956,696 | 106.3 | |
| Intangible assets | 18,128,024 | 16,623,610 | 9.0 | EQUITY | 25,947,667 | 25,636,935 | 1.2 | |
| Right to use an asset | 277,710 | 308,983 | (10.1) | Attributed to controlling shareholders | 25,986,034 | 25,674,718 | 1.2 | |
| TOTAL | 62,048,417 | 57,384,156 | 8.1 | Share capital | 12,821,758 | 12,821,758 | — | |
| Capital reserves | 12,116 | 5,595 | 116.6 | |||||
| Equity valuation adjustments | 482,585 | 517,408 | (6.7) | |||||
| Treasury shares | (117,194) | (50,044) | 134.2 | |||||
| Legal reserves | 1,766,110 | 1,766,110 | — | |||||
| Tax incentive reserve | 4,009 | — | — | |||||
| Retained earnings | 9,363,687 | 9,363,866 | — | |||||
| Proposed additional dividend | — | 1,250,025 | (100.0) | |||||
| Accrued earnings | 1,652,963 | — | — | |||||
| Attributable to non-controlling interest | (38,367) | (37,783) | 1.5 | |||||
| TOTAL | 62,048,417 | 57,384,156 | 8.1 | |||||
| 23 |
| |
| EXHIBIT I - CONSOLIDATED RESULTS > CASH FLOW |
| CASH FLOWS FROM OPERATIONAL ACTIVITIES | ||
| R$'000 | ||
| 09/30/25 | 09/30/24 | |
| Net income from continuing operations | 1,602.406 | 1,732.635 |
| Adjustments to reconcile net income for the period with cash generation from operating activities: | 3,241.563 | 3,799.845 |
| Unrealized monetary and exchange variation and debt charges - net | 2,045,940 | 1,511,124 |
| Interest - bonus from the grant of concession agreements under the quota system | -94,742 | -88,600 |
| Remuneration of transmission concession contracts | -563,403 | -597,298 |
| Income tax and social contribution | 225,118 | 208,150 |
| Deferred income tax and social contribution | 466,781 | 420,595 |
| Equity in earnings of investees | -202,001 | -225,398 |
| Appropriation of post-employment benefits obligations | 172,717 | 192,662 |
| Creation for research and development and energy efficiency programs | 148,920 | 132,771 |
| Recognition of fair value of assets from the indemnity for the concession | -72,651 | -49,467 |
| Sectorial financial assets and liabilities result | -1,551,696 | -623,896 |
| Depreciation and amortization | 1,092,755 | 1,089,197 |
| Provision from the voluntary dismissal program | 20,979 | 18,388 |
| Long-term incentives | 10,416 | 976 |
| Net operating estimated losses, provisions and reversals | 240,010 | 227,955 |
| Realization of added value in business combinations | -1,348 | -539 |
| Fair value in energy purchase and sale operations | -24,973 | 26,009 |
| Fair value adjustment of debt instruments and hedges (swaps) | 16,779 | — |
| Loss on disposal of accounts receivable related to concession | 2,093 | 3,193 |
| Loss on disposal of contract assets | 7,289 | 11,963 |
| Loss on disposal of property, plant and equipment | 4,551 | 16,084 |
| Loss on disposal of intangible assets | 75,985 | 62,406 |
| Result of write-offs of use rights of assets and liabilities of leases - net | — | -4,631 |
| Assets disposal results | -356,278 | -264,434 |
| Others | -24,084 | — |
| Decrease (increase) in assets | 700.833 | 674.876 |
| Trade accounts receivable | 353,483 | 583,818 |
| Dividends and interest on own capital received | 164,241 | 158,889 |
| Judicial deposits | 46,386 | 6,133 |
| Sectorial financial assets | 502,571 | 124,699 |
| Other receivables | -78,927 | -39,671 |
| Inventories | -28,589 | 27,493 |
| Income tax and social contribution recoverable | -178,513 | -162,094 |
| Other taxes recoverable | -85,411 | -33,493 |
| Prepaid expenses | 4,971 | 8,517 |
| Related parties | 621 | 585 |
| Increase (decrease) in liabilities | 162,968 | -507,704 |
| Payroll, social charges and accruals | -49,089 | -334,900 |
| Related parties | — | — |
| Suppliers | 398,007 | 110,944 |
| Other taxes | 827,585 | 654,962 |
| Post-employment benefits | -149,503 | -164,689 |
| Sectorial charges due | 56,088 | 7,188 |
| Research and development and energy efficiency | -199,080 | -235,389 |
| Payable related to the concession | -84,955 | -82,483 |
| Other accounts payable | -373,593 | -191,986 |
| Provisions for legal claims | -262,492 | -271,351 |
| CASH GENERATED BY OPERATING ACTIVITIES | 4,105.364 | 3,967.017 |
| Income tax and social contribution paid | -249,631 | -257,299 |
| Loans and financing - interest due and paid | -359,006 | -386,404 |
| Debentures - interest due and paid | -963,399 | -658,810 |
| Charges for lease liabilities paid | -24,081 | -23,957 |
| Charges on loans granted/obtained from related parties | — | |
| NET CASH GENERATED BY OPERATING ACTIVITIES FROM CONTINUING OPERATIONS | 2,509,247 | 2,640,547 |
| NET CASH GENERATED BY OPERATING ACTIVITIES FROM DISCONTINUED OPERATIONS | — | 3,620 |
| NET CASH GENERATED FROM OPERATING ACTIVITIES | 2,509,247 | 2,644,167 |
| CASH FLOWS FROM INVESTMENT ACTIVITIES | ||
| Financial investments | -88,352 | -39,727 |
| Loans and financing granted to related parties | — | — |
| Receipt of loans and financing granted to related parties | — | — |
| Additions to contract assets | -2,210.701 | -1,652.051 |
| Acquisitions of subsidiaries - effect on cash | -108,137 | -82,954 |
| Acquisitions in investments | — | 10,357 |
| Sale of investments | -26.319 | -9,923 |
| Additions in investments | 294 | 37,129 |
| Capital reduction of investees | — | — |
| Additions to property, plant and equipment | -190,433 | — |
| Sale of property, plant and equipment | -1,060.804 | — |
| Additions to intangible assets | 914,795 | 2,066 |
| NET CASH USED BY INVESTMENT ACTIVITIES FROM CONTINUING OPERATIONS | -2,769.657 | -1,735.103 |
| NET CASH USED BY INVESTMENT ACTIVITIES FROM DISCONTINUED OPERATIONS | — | 608.713 |
| NET CASH USED FROM INVESTING ACTIVITIES | -2,769.657 | -1,126.390 |
| CASH FLOWS FROM FINANCING ACTIVITIES | ||
| Issue of loans and financing | — | 2,474 |
| Issue of debentures | 5,000,000 | 2,320,000 |
| Transaction costs in the issuing of debentures | -66,366 | -55,612 |
| Payments of principal - loans and financing | -1,202,171 | -196,430 |
| Payments of principal - debentures | -2,448,147 | -1,061,675 |
| Amortization of principal of lease liabilities | -49,859 | -54,364 |
| Buyback of own shares | -70,040 | — |
| Dividends and interest on own capital paid | -1,249,037 | -586,257 |
| NET CASH GENERATED (USED) BY FINANCING ACTIVITIES FROM CONTINUING OPERATIONS | -85,620 | 368,136 |
| NET CASH GENERATED (USED) BY FINANCING ACTIVITIES FROM DISCONTINUED OPERATIONS | — | -9,656 |
| NET CASH GENERATED (USED) FROM FINANCING ACTIVITIES | -85.620 | 358.480 |
| TOTAL EFFECTS ON CASH AND CASH EQUIVALENTS | -346,030 | 1,876,257 |
| Cash and cash equivalents at the beginning of the period | 4,161,939 | 5,634,623 |
| Cash and cash equivalents at the end of the period | 3,815,007 | 7,580,218 |
| Change in cash and cash equivalents from discontinued operations | 902 | -69,338 |
| CHANGE IN CASH AND CASH EQUIVALENTS | -346,030 | 1,876,257 |
| 24 |
| |
| EXHIBIT I - CONSOLIDATED RESULTS > ADJUSTED EBITDA AND FINANCIAL RESULT |
| R$'000 | ||||||
| RECURRING EBITDA | 3Q25 | 3Q24 | Δ% | 9M25 | 9M24 | Δ% |
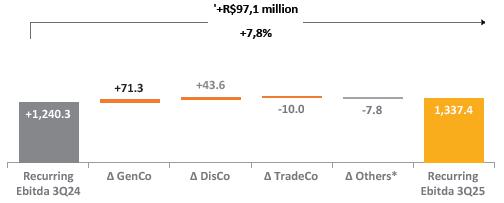
| EBITDA | 1,359 | 1,527 | -11.0 | 4,678 | 4,231 | 10.6 |
| (-/+) Fair value in the purchase and sale of energy | 43 | -18 | -339.7 | -25 | 26 | -196.2 |
| (-/+) Provision (reversal) Incentive Dismissal Program | — | 18 | -100.0 | 21 | 18 | 14.1 |
| (-/+) Assets disposal /swap | -35 | -264 | -86.6 | -346 | -264 | 30.7 |
| (-/+) Ebitda from discontinued Op. Compagas and UEGA | — | 20 | -100.0 | — | 59 | -100.0 |
| (-/+) Equity Income | -37 | -63 | -41.0 | -202 | -225 | -10.4 |
| (-/+)NRV | -37 | -17 | 114.5 | -73 | -50 | 46.9 |
| (+/-)Difference in Revenue from Corporate/Regulatory Transfer (see item 3.1.1) | 45 | 38 | 20.4 | 122 | 58 | 111.6 |
| RECURRING EBITDA | 1,337 | 1,240 | 7.8 | 4,176 | 3,852 | 8.4 |
| R$'000 | ||||||
| 3Q25 | 3Q24 | Δ% | 9M25 | 9M24 | Δ% | |
| Financial Revenues | 352,570 | 330,431 | 6.7 | 1,025,522 | 857,230 | 19.6 |
| Income from investments held for trading | 176,485 | 205,967 | -14.3 | 520,551 | 537,453 | -3.1 |
| Late fees on electricity bills | 83,284 | 85,594 | -2.7 | 246,843 | 188,771 | 30.8 |
| Interest on taxes to be compensated | 37,409 | 40,253 | -7.1 | 120,716 | 58,695 | 105.7 |
| Monetary restatement and adjustment to present value of accounts payable related to concession | 4,450 | 3 | 148,233.3 | 38,802 | 17,838 | 117.5 |
| Income and monetary restatement of judicial deposits | 11,099 | 10,467 | 6.0 | 32,926 | 26,725 | 23.2 |
| Income from sectorial assets and liabilities | 16,280 | 5,281 | 208.3 | 32,222 | 40,795 | -21.0 |
| Adjust the fair value of debentures | 20,033 | — | — | 20,033 | — | — |
| (-) Pis/Pasep and Cofins on revenues | -14,714 | -13,772 | 6.8 | -43,507 | -34,963 | 24.4 |
| Other financial revenues | 18,244 | -3,362 | -642.7 | 56,936 | 21,916 | 159.8 |
| Financial Expenses | -795,131 | -553,570 | 43.6 | -2,316,469 | -1,637,466 | 41.5 |
| Monetary variation, foreign exchange and debt service charges | -655,907 | -419,198 | 56.5 | -1,869,617 | -1,251,890 | 49.3 |
| Monetary variation and adjustment to present value of accounts payable related to concession | -33,792 | -35,722 | -5.4 | -121,537 | -107,907 | 12.6 |
| Income from sectorial assets and liabilities (NE nº 8) | — | — | — | -77,774 | -33,027 | 135.5 |
| Monetary variation of litigation | -24,784 | -39,642 | -37.5 | -57,080 | -70,988 | -19.6 |
| Uptade of provision for allocation of Pis and Cofins credits | -6,852 | -21,656 | -68.4 | -52,717 | -26,385 | 99.8 |
| Swap effect on debentures | -36,812 | — | — | -36,812 | — | — |
| Interest on lease liabilities | -8,055 | -5,097 | 58.0 | -25,009 | -19,877 | 25.8 |
| Interest on tax installments | -7,097 | -6,647 | 6.8 | -20,269 | -21,110 | -4.0 |
| Interest on R&D and PEE | -6,600 | -5,608 | 17.7 | -18,209 | -16,723 | 8.9 |
| Pis/ Pasep and Cofins taxes over interest on equity | -10,175 | — | — | -10,231 | -27,812 | -63.2 |
| Other financial expenses | -5,057 | -20,000 | -74.7 | -27,214 | -61,747 | -55.9 |
| Financial income (expenses) | -442,561 | -223,139 | 98.3 | -1,290,947 | -780,236 | 65.5 |
| 25 |
| |
| EXHIBIT I - CONSOLIDATED RESULTS > EQUITY IN EARNINGS OF SUBSIDIARIES AND INDICATORS |
| R$'000 | ||||||
| Variation in Equity in earnings of subsidiaries | 3T25 | 3T24 | Δ% | 9M25 | 9M24 | Δ% |
| Joint Ventures | 30,157 | 57,344 | (47.4) | 183,786 | 211,365 | (13.0) |
| Voltalia São Miguel do Gostoso I Participações S.A. | (283) | 3,656 | (107.7) | (4,384) | (1,189) | 268.7 |
| Caiuá Transmissora de Energia S.A. | 3,128 | 2,700 | 15.9 | 12,333 | 9,113 | 35.3 |
| Integração Maranhense Transmissora de Energia S.A. | 4,903 | 4,600 | 6.6 | 16,422 | 14,364 | 14.3 |
| Matrinchã Transmissora de Energia (TP NORTE) S.A. | 24,234 | 18,007 | 34.6 | 72,894 | 65,354 | 11.5 |
| Guaraciaba Transmissora de Energia (TP SUL) S.A. | 9,455 | 12,664 | (25.3) | 31,753 | 35,199 | (9.8) |
| Paranaíba Transmissora de Energia S.A. | 7,645 | 6,096 | 25.4 | 24,751 | 21,490 | 15.2 |
| Mata de Santa Genebra Transmissão S.A. | — | 2,387 | (100.0) | 23,057 | 36,764 | (37.3) |
| Cantareira Transmissora de Energia S.A. | (19,068) | 7,181 | (365.5) | 6,552 | 30,138 | (78.3) |
| Solar Paraná | 143 | 53 | 169.8 | 408 | 132 | 209.1 |
| Associates | 7,172 | 5,866 | 22.3 | 18,215 | 14,033 | 29.8 |
| Dona Francisca Energética S.A. | 1,865 | 1,480 | 26.0 | 5,035 | 4,002 | 25.8 |
| Foz do Chopim Energética Ltda. | 5,307 | 4,386 | 21.0 | 13,180 | 10,033 | 31.4 |
| Carbocampel S.A. | — | — | — | — | (2) | — |
| TOTAL | 37,329 | 63,210 | (40.9) | 202,001 | 225,398 | (10.4) |
| R$'000 | |||||||
|
Main Indicators -Associates Sep-25 |
Dona Francisca | Foz do Chopim | |||||
| Total assets | 172,252 | 43,080 | |||||
| Shareholder’s equity¹ | 161,667 | 40,845 | |||||
| Net operating revenue | 49,952 | 50,555 | |||||
| Net Income | 21,866 | 36,845 | |||||
| Participation in the enterprise - % | 23.03 | 35.77 | |||||
| Investment book value | 37,232 | 14,610 | |||||
| R$ mil | |||||||
|
Main Indicators -Joint ventures Sep-25 |
Voltalia | Caiuá | Integração Maranhense | Matrinchã | Guaraciaba | Paranaíba | Cantareira |
| Total assets | 228,486 | 351,435 | 631,606 | 3,350,123 | 1,713,159 | 2,023,603 | 1,821,827 |
| Shareholder’s equity¹ | 228,246 | 259,145 | 417,415 | 2,366,505 | 1,151,609 | 1,173,194 | 804,184 |
| Net operating revenue | — | 27,041 | 41,493 | 187,894 | 105,088 | 171,935 | 50,951 |
| Net Income | (9,576) | 22,894 | 28,389 | 105,988 | 45,373 | 90,684 | 9,469 |
| Participation in the enterprise - % | 49.0 | 49.0 | 49.0 | 49.0 | 49.0 | 24.5 | 49.0 |
| Investment book value | 111,841 | 126,981 | 204,533 | 1,159,587 | 564,288 | 287,433 | 394,050 |
| Note: Income from Transmitters according to adjustments for the application of CPC 47 / IFRS 15 in the Corporate Statements. | |||||||
| 26 |
| |
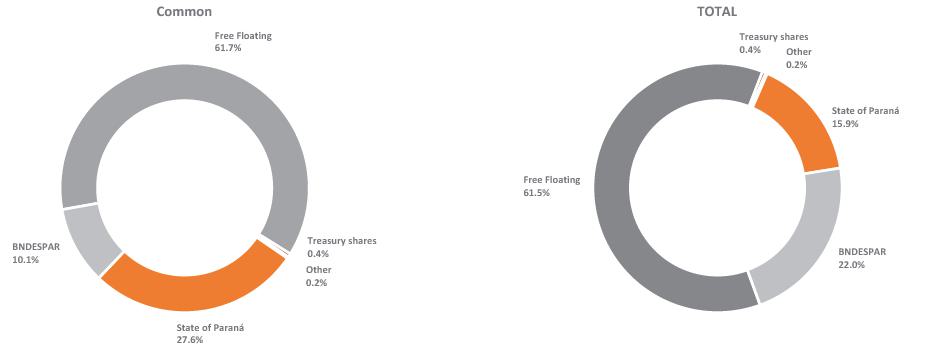
| EXHIBIT I - CONSOLIDATED RESULTS > SHARE CAPITAL |
| Share Capital - As of September 30, 2025 | |||||||||
| mil ações | |||||||||
| Shareholders | ON | % | PNA | % | PNB | % | Especial* | TOTAL | % |
| State of Paraná | 358,563 | 27.6 % | — | — | 116,081 | 6.9 % | <1 | 474,644 | 15.9 % |
| BNDESPAR | 131,162 | 10.1 % | — | — | 524,646 | 31.2 % | — | 655,808 | 22.0 % |
| Free Floating | 801,852 | 61.7 % | 1,075 | 34.4 % | 1,030,306 | 61.4 % | — | 1,833,233 | 61.5 % |
| B3 | 788,628 | 60.6 % | 1,075 | 34.4 % | 939,927 | 56.0 % | — | 1,729,630 | 58.0 % |
| NYSE | 13,016 | 1.0 % | — | — | 88,753 | 5.3 % | — | 101,769 | 3.4 % |
| LATIBEX | 208 | — % | — | — | 1,626 | 0.1 % | — | 1,834 | 0.1 % |
| Other | 2,946 | 0.2 % | 2,053 | 66 | 949 | 0.1 % | — | 5,948 | 0.2 % |
| Treasury shares | 5,825 | 0.4 % | — | — % | 7,353 | 0.4 % | — | 13,178 | 0.4 % |
| TOTAL | 1,300,348 | 100 % | 3,128 | 100 % | 1,679,335 | 100 % | <1 | 2,982,811 | 100 % |
| * State of Paraná has a special class preferred share with veto power as established in the Statute. | |||||||||
| 27 |
 |
| EXHIBIT II- RESULT BY SUBSIDIARY > COPEL GET (CONSOLIDATED) |
| R$ '000 | ||||||
| Income Statement | 3Q25 | 3Q24 | Δ% | 9M25 | 9M24 | Δ% |
| OPERATING REVENUES | 1,252,299 | 1,096,920 | 14.2 | 3,653,229 | 3,311,337 | 10.3 |
| Electricity sales to distributors | 878,430 | 866,090 | 1.4 | 2,678,548 | 2,528,738 | 5.9 |
| Use of the main transmission grid | 316,159 | 204,312 | 54.7 | 781,932 | 708,172 | 10.4 |
| Construction revenue | 54,530 | 19,013 | — | 165,671 | 48,887 | — |
| Other operating revenues | 3,180 | 7,505 | -57.6 | 27,078 | 25,540 | 6.0 |
| OPERATING COSTS AND EXPENSES | -727,611 | -430,080 | 69.2 | -1,713,548 | -1,693,164 | 1.2 |
| Electricity purchased for resale | -179,725 | -66,075 | — | -290,395 | -111,715 | — |
| Charges of main distribution and transmission grid | -125,444 | -143,403 | -12.5 | -386,559 | -438,291 | -11.8 |
| Personnel and management | -65,370 | -87,689 | -25.5 | -222,269 | -278,444 | -20.2 |
| Pension and healthcare plans | -16,887 | -19,172 | -11.9 | -52,369 | -60,603 | -13.6 |
| Materials and supplies | -8,550 | -6,030 | 41.8 | -24,628 | -14,557 | 69.2 |
| Materials and supplies for power eletricity | — | — | — | — | -936 | — |
| Third-party services | -58,239 | -68,491 | -15.0 | -191,576 | -202,014 | -5.2 |
| Depreciation and amortization | -186,411 | -205,511 | -9.3 | -541,112 | -625,566 | -13.5 |
| Provisions and reversals | -10,073 | -16,480 | -38.9 | -16,842 | -22,618 | -25.5 |
| Construction cost | -52,084 | -16,390 | — | -156,947 | -41,944 | — |
| Other cost and expenses | -24,828 | 199,161 | — | 169,149 | 103,524 | 63.4 |
| EQUITY IN EARNINGS OF SUBSIDIARIES | 35,603 | 58,021 | -38.6 | 200,940 | 222,454 | -9.7 |
| PROFIT BEFORE FINANCIAL RESULTS AND TAXES | 560,291 | 724,861 | -22.7 | 2,140,621 | 1,840,627 | 16.3 |
| FINANCIAL RESULTS | -269,049 | -133,918 | — | -762,640 | -447,250 | 70.5 |
| Financial income | 109,843 | 106,711 | 2.9 | 335,363 | 275,770 | 21.6 |
| Financial expenses | -378,892 | -240,629 | 57.5 | -1,098,003 | -723,020 | 51.9 |
| OPERATIONAL EXPENSES/ INCOME | 291,242 | 590,943 | -50.7 | 1,377,981 | 1,393,377 | -1.1 |
| INCOME TAX AND SOCIAL CONTRIBUTION ON PROFIT | -60,816 | -186,599 | -67.4 | -365,997 | -317,381 | 15.3 |
| Income tax and social contribution on profit | -69,124 | -60,379 | 14.5 | -199,814 | -174,792 | 14.3 |
| Deferred income tax and social contribution on profit | 8,308 | -126,220 | — | -166,183 | -142,589 | 16.5 |
| NET INCOME continuing operations | 230,426 | 404,344 | -43.0 | 1,011,984 | 1,075,996 | -5.9 |
| NET INCOME discontinued operations | 18,898.00 | 12,004 | 57.4 | 18,898.00 | -18,377 | — |
| NET INCOME | 249,324 | 416,348 | -40.1 | 1,030,882 | 1,057,619 | -2.5 |
| Attributed to shareholders of the parent company - continuing operations | 230,426 | 404,344 | -43.0 | 1,011,984 | 1,084,352 | -6.7 |
| Attributed to the controlling company's shareholders - discontinued operations | 18,898 | 12,004 | 57.4 | 18,898 | -11,586 | — |
| Attributed to non-controlling shareholders | — | — | — | — | -15,147 | — |
| EBITDA continuing operations | 746,702 | 930,372 | -19.7 | 2,681,733 | 2,466,193 | 8.7 |
| 28 |
| |
| EXHIBIT II- RESULT BY SUBSIDIARY > COPEL DIS |
| R$ '000 | ||||||
| Income Statement | 3Q25 | 3Q24 | Δ% | 9M25 | 9M24 | Δ% |
| OPERATING REVENUES | 5,125,167 | 4,352,365 | 17.8 | 13,986,100 | 12,556,067 | 11.4 |
| Electricity sales to final customers | 1,463,734 | 1,482,084 | -1.2 | 4,770,004 | 4,835,789 | -1.4 |
| Electricity sales to distributors | 183,393 | 62,717 | 192.4 | 284,740 | 83,935 | 239.2 |
| Use of the main distribution grid | 1,556,804 | 1,568,245 | -0.7 | 4,782,283 | 4,774,303 | 0.2 |
| Construction revenue | 898,292 | 642,002 | 39.9 | 2,269,611 | 1,860,097 | 22.0 |
| Fair value of assets from the indemnity for the concession | 36,909 | 17,190 | 114.7 | 72,651 | 49,467 | 46.9 |
| Sectorial assets and liabilities result | 845,436 | 420,709 | 101.0 | 1,408,163 | 566,185 | 148.7 |
| Other operating revenues | 140,598 | 159,418 | -11.8 | 398,648 | 386,291 | 3.2 |
| OPERATING COSTS AND EXPENSES | -4,616,770 | -3,893,834 | 18.6 | -12,532,390 | -11,163,695 | 12.3 |
| Electricity purchased for resale | -2,344,772 | -1,910,333 | 22.7 | -6,170,339 | -5,222,496 | 18.1 |
| Charges of main transmission grid | -678,247 | -676,178 | 0.3 | -2,024,457 | -2,113,943 | -4.2 |
| Personnel and management | -115,838 | -166,337 | -30.4 | -399,998 | -514,552 | -22.3 |
| Pension and healthcare plans | -38,056 | -41,217 | -7.7 | -115,521 | -129,216 | -10.6 |
| Materials and supplies | -10,255 | -15,409 | -33.4 | -38,275 | -46,026 | -16.8 |
| Third-party services | -216,410 | -187,818 | 15.2 | -617,866 | -519,102 | 19.0 |
| Depreciation and amortization | -179,433 | -152,595 | 17.6 | -519,851 | -433,938 | 19.8 |
| Provisions and reversals | -73,628 | -46,880 | 57.1 | -221,736 | -188,090 | 17.9 |
| Construction cost | -898,292 | -642,002 | 39.9 | -2,269,611 | -1,860,097 | 22.0 |
| Other cost and expenses | -61,840 | -55,064 | 12.3 | -154,736 | -136,235 | 13.6 |
| PROFIT BEFORE FINANCIAL RESULTS AND TAXES | 508,397 | 458,531 | 10.9 | 1,453,710 | 1,392,372 | 4.4 |
| FINANCIAL RESULTS | -179,976 | -103,031 | 74.7 | -569,070 | -381,617 | 49.1 |
| Financial income | 194,454 | 162,905 | 19.4 | 519,387 | 367,811 | 41.2 |
| Financial expenses | -374,430 | -265,936 | 40.8 | -1,088,457 | -749,428 | 45.2 |
| OPERATIONAL EXPENSES/ INCOME | 328,421 | 355,500 | -7.6 | 884,640 | 1,010,755 | -12.5 |
| INCOME TAX AND SOCIAL CONTRIBUTION ON PROFIT | -103,077 | -111,695 | -7.7 | -273,909 | -317,165 | -13.6 |
| Income tax and social contribution on profit | — | — | — | — | — | — |
| Deferred income tax and social contribution on profit | -103,077 | -111,695 | -7.7 | -273,909 | -317,165 | -13.6 |
| NET INCOME (LOSS) | 225,344 | 243,805 | -7.6 | 610,731 | 693,590 | -11.9 |
| EBITDA | 687,830 | 611,127 | 12.6 | 1,973,561 | 1,826,310 | 8.1 |
| 29 |
| |
| EXHIBIT II- RESULT BY SUBSIDIARY > COPEL DIS |
| R$'000 | ||||||
| OPERATING REVENUE | 3Q25 | 3Q24 | Δ% | 9M25 | 9M24 | Δ% |
| Electricity sales to final customers | 1,922,785 | 1,816,194 | 5.9 | 5,642,216.0 | 5,831,298.0 | -3.2 |
| Residential | 998,892 | 866,777 | 15.2 | 2,894,590.0 | 2,736,461.0 | 5.8 |
| Industrial | 145,126 | 173,431 | -16.3 | 410,976.0 | 527,212.0 | -22.0 |
| Commercial, service and other activities | 432,224 | 416,827 | 3.7 | 1,297,038.0 | 1,371,374.0 | -5.4 |
| Rural | 194,216 | 183,580 | 5.8 | 601,792.0 | 615,340.0 | -2.2 |
| Public Sector | 70,992 | 63,484 | 11.8 | 211,974.0 | 212,449.0 | -0.2 |
| Street lightining | 57,045 | 50,113 | 13.8 | 148,366.0 | 141,632.0 | 4.8 |
| Public Service | 24,290 | 61,982 | -60.8 | 77,480.0 | 226,830.0 | -65.8 |
| Donations and subsidies | 383,554 | 283,646 | 35.2 | 1,123,505.0 | 826,980.0 | 35.9 |
| Electricity sales to distributors | 190,495 | 65,329 | 191.6 | 295,980.0 | 88,072.0 | 236.1 |
| Bilateral contracts | 2,665 | 4,068 | -34.5 | 7,796.0 | 16,471.0 | -52.7 |
| Electricity Trading Chamber - CCEE | 187,830 | 61,261 | 206.6 | 288,184.0 | 71,601.0 | 302.5 |
| Use of the main distribution grid | 3,205,443 | 2,920,059 | 9.8 | 9,426,178.0 | 8,874,798.0 | 6.2 |
| Residential | 1,081,623 | 957,338 | 13.0 | 3,224,929.0 | 2,962,998.0 | 8.8 |
| Industrial | 343,882 | 338,325 | 1.6 | 984,752.0 | 965,024.0 | 2.0 |
| Commercial, service and other activities | 538,163 | 521,217 | 3.3 | 1,656,918.0 | 1,644,790.0 | 0.7 |
| Rural | 214,916 | 208,072 | 3.3 | 683,492.0 | 679,621.0 | 0.6 |
| Public Sector | 79,145 | 75,184 | 5.3 | 247,429.0 | 241,233.0 | 2.6 |
| Street lightining | 54,012 | 52,129 | 3.6 | 153,884.0 | 152,137.0 | 1.1 |
| Public Service | 35,356 | 57,505 | -38.5 | 107,352.0 | 194,389.0 | -44.8 |
| Free Market | 819,984 | 666,994 | 22.9 | 2,246,691.0 | 1,912,089.0 | 17.5 |
| Dealers and generators | 38,362 | 43,295 | -11.4 | 120,731.0 | 122,517.0 | -1.5 |
| Construction Revenue | 898,292 | 642,002 | 39.9 | 2,269,611.0 | 1,860,097.0 | 22.0 |
| Fair value of assets from the indemnity for the concession | 36,909 | 17,190 | 114.7 | 72,651.0 | 49,467.0 | 46.9 |
| Sectorial assets and liabilities result | 931,610 | 463,591 | 101.0 | 1,551,695.0 | 623,895.0 | 148.7 |
| Other operating income | 154,932 | 175,668 | -11.8 | 439,287.0 | 425,665.0 | 3.2 |
| Leases and rentals | 143,565 | 162,847 | -11.8 | 416,627.0 | 404,046.0 | 3.1 |
| Income from the provision of services | 1,723 | 1,942 | -11.3 | 3,355.0 | 3,696.0 | -9.2 |
| Other income | 9,644 | 10,879 | -11.4 | 19,305.0 | 17,923.0 | 7.7 |
| RECEITA OPERACIONAL BRUTA | 7,724,020 | 6,383,679 | 21.0 | 20,821,123.0 | 18,580,272.0 | 12.1 |
| (-) Tributos e deduções | -2,598,851 | -2,031,314 | 27.9 | -6,835,022.0 | -6,024,205.0 | 13.5 |
| (-) PIS/PASEP e COFINS | -540,173 | -453,255 | 19.2 | -1,460,826.0 | -1,315,394.0 | 11.1 |
| (-) ICMS | -851,647 | -794,979 | 7.1 | -2,554,192.0 | -2,436,437.0 | 4.8 |
| (-) Encargos Setoriais | -1,207,029 | -783,080 | 54.1 | -2,819,999.0 | -2,272,374.0 | 24.1 |
| (-) ISS | -2 | — | — | -5.0 | — | — |
| NET OPERATING REVENUES | 5,125,169 | 4,352,365 | 17.8 | 13,986,101.0 | 12,556,067.0 | 11.4 |
| 30 |
| |
| EXHIBIT II- RESULT BY SUBSIDIARY > COPEL COM (MERCADO LIVRE) |
| R$ '000 | ||||||
| Income Statement | 3Q25 | 3Q24 | Δ% | 9M25 | 9M24 | Δ% |
| OPERATING REVENUES | 1,122,386 | 901,385 | 24.5 | 3,209,841.0 | 2,590,380.0 | 23.9 |
| Electricity sales to final customers | 414,694 | 488,576 | -15.1 | 1,212,945.0 | 1,420,544.0 | -14.6 |
| Electricity sales to distributors | 750,140 | 410,894 | 82.6 | 1,969,890.0 | 1,167,170.0 | 68.8 |
| Other operating revenues | -42,448 | 1,915 | — | 27,006.0 | 2,666.0 | 913.1 |
| OPERATING COSTS AND EXPENSES | -1,172,599 | -880,878 | 33.1 | -3,153,561.0 | -2,549,093.0 | 23.7 |
| Electricity purchased for resale | -1,162,277 | -871,755 | 33.3 | -3,125,498.0 | -2,523,054.0 | 23.9 |
| Personnel and management | -5,504 | -3,591 | 53.3 | -14,340.0 | -11,152.0 | 28.6 |
| Pension and healthcare plans | -429 | -429 | — | -1,302.0 | -1,321.0 | -1.4 |
| Materials and supplies | -113 | -14 | 720.7 | -221.0 | -48.0 | 360.3 |
| Third-party services | -724 | -1,847 | -60.8 | -2,730.0 | -4,253.0 | -35.8 |
| Depreciation and amortization | -500 | -443 | 12.9 | -1,387.0 | -1,313.0 | 5.7 |
| Provisions and reversals | -314 | -1,847 | -83.0 | -1,552.0 | -4,436.0 | -65.0 |
| Other cost and expenses | -2,738 | -953 | 187.3 | -6,530.0 | -3,516.0 | 85.7 |
| EQUITY IN EARNINGS OF SUBSIDIARIES | — | — | 0.0 | 0.0 | 0.0 | 0.0 |
| PROFIT BEFORE FINANCIAL RESULTS AND TAXES | -50,213 | 20,508 | — | 56,280.0 | 41,287.0 | 36.3 |
| FINANCIAL RESULTS | 9,190 | 10,626 | -13.5 | 28,800.0 | 29,924.0 | -3.8 |
| Financial income | 9,322 | 10,731 | -13.1 | 29,213.0 | 30,166.0 | -3.2 |
| Financial expenses | -132 | -105 | 25.8 | -414.0 | -242.0 | 71.0 |
| OPERATIONAL EXPENSES/ INCOME | -41,023 | 31,134 | — | 85,080.0 | 71,211.0 | 19.5 |
| INCOME TAX AND SOCIAL CONTRIBUTION ON PROFIT | 13,985 | -10,667 | — | -29,106.0 | -23,980.0 | 21.4 |
| Income tax and social contribution on profit | -963 | -4,893 | -80.3 | -21,069.0 | -32,723.0 | -35.6 |
| Deferred income tax and social contribution on profit | 14,948 | -5,774 | — | -8,036.0 | 8,743.0 | — |
| NET INCOME (LOSS) | -27,037 | 20,467 | — | 55,974.0 | 47,231.0 | 18.5 |
| EBITDA | -49,713 | 20,951 | — | 54,893.0 | 42,600.0 | 28.9 |
| 31 |
| |
| EXHIBIT II- RESULT BY SUBSIDIARY > INCOME STATEMENT FOR THE QUARTER BY COMPANY |
| R$'000 | |||||||||||||||||
| Income Statement 3Q25 | GET | Distribuição | Compagas | Elejor | UEG Araucária | Serviços | Parques Eólicos | FDA | Bela Vista | Pequenos ativos mantidos para venda | MSG | C. Oeste, Marumbi, Uirapuru | Mercado Livre | Holding |
Elimin. e Reclassif. |
Consolidado | |
| Geração | Transmissão | ||||||||||||||||
| NET OPERATING INCOME | 590,479 | 273,419 | 5,125,167 | — | 34,901 | — | 2,411 | 155,644 | 149,661 | 8,185 | — | 83,684 | 23,152 | 1,122,386 | — | -757,912 | 6,811,177 |
| Electricity sales to final customers | — | — | 1,463,734 | — | — | — | — | — | — | — | — | — | — | 414,694 | — | -170 | 1,878,258 |
| Electricity sales to distributors | 580,339 | — | 183,393 | — | 34,814 | — | — | 155,644 | 149,661 | 8,185 | — | — | — | 750,140 | — | -620,620 | 1,241,556 |
| Use of the main distribution and transmission grid (TUSD/ TUST) | — | 218,364 | 1,556,804 | — | — | — | — | — | — | — | — | 82,677 | 17,776 | — | — | -122,892 | 1,752,729 |
| Construction revenue | — | 48,247 | 898,292 | — | — | — | — | — | — | — | — | 915 | 5,368 | — | — | — | 952,822 |
| Fair value of assets from the indemnity for the concession | — | — | 36,909 | — | — | — | — | — | — | — | — | — | — | — | — | — | 36,909 |
| Sectoral assets and liabilities result | — | — | 845,437 | — | — | — | — | — | — | — | — | — | — | — | — | — | 845,437 |
| Other operating revenues | 10,140 | 6,808 | 140,598 | — | 87 | — | 2,411 | — | — | — | — | 92 | 8 | -42,448 | — | -14,230 | 103,466 |
| OPERATING COSTS AND EXPENSES | -342,550 | -111,403 | -4,616,769 | — | -22,708 | — | -2,490 | -171,994 | -104,602 | -6,294 | — | -9,704 | -6,731 | -1,172,599 | -52,832 | 754,343 | -5,866,333 |
| Energy purchased for resale | -122,727 | — | -2,344,772 | — | -27 | — | — | -41,511 | -28,990 | -1,238 | — | — | — | -1,162,276 | — | 618,102 | -3,083,439 |
| Charges of the main distribution and transmission grid | -71,028 | — | -678,247 | — | -6,245 | — | — | -18,175 | -37,203 | -360 | — | — | — | — | — | 124,232 | -687,026 |
| Personnel and management | -32,443 | -28,419 | -115,838 | — | -1,250 | — | -95 | -2,430 | -974 | -86 | — | -882 | -136 | -5,504 | -24,535 | — | -212,592 |
| Private pension and health plans | -8,780 | -7,525 | -38,056 | — | -41 | — | -18 | -331 | -144 | -11 | — | -76 | -20 | -429 | -2,501 | — | -57,932 |
| Materials and supplies | -1,256 | -1,218 | -10,254 | — | -83 | — | -9 | -5,466 | -523 | -45 | — | -14 | -33 | -113 | -109 | — | -19,122 |
| Third-party services | -21,732 | -13,381 | -216,410 | — | -3,752 | — | -1,378 | -23,038 | -5,474 | -973 | — | -5,843 | -1,668 | -723 | -7,560 | 14,524 | -287,408 |
| Depreciation and amortization | -83,232 | -4,820 | -179,433 | — | -8,157 | — | -968 | -69,573 | -19,307 | -2,850 | — | -77 | -10 | -500 | -1,055 | -6,542 | -376,524 |
| Provisions and reversals | -5,102 | -4,208 | -73,628 | — | — | — | — | -116 | -23 | -571 | — | -163 | -3 | -315 | -4,231 | 2,795 | -85,565 |
| Construction cost | — | -46,034 | -898,292 | — | — | — | — | — | — | — | — | -1,425 | -4,625 | — | — | — | -950,376 |
| Other operating costs and expenses | 3,750 | -5,798 | -61,839 | — | -3,153 | — | -22 | -11,354 | -11,964 | -160 | — | -1,224 | -236 | -2,739 | -12,841 | 1,232 | -106,349 |
| EQUITY IN EARNINGS OF SUBSIDIARIES | 889 | 84,928 | — | — | — | — | — | -20,435 | — | — | — | — | — | — | 428,744 | -456,797 | 37,329 |
| EARNINGS BEFORE INCOME TAXES | 248,818 | 246,944 | 508,398 | — | 12,193 | — | -79 | -36,785 | 45,059 | 1,891 | — | 73,980 | 16,421 | -50,213 | 375,912 | -460,366 | 982,173 |
| FINANCIAL RESULTS | -139,302 | -110,707 | -179,977 | — | -17,987 | — | -1,636 | 2,934 | 3,314 | 2,451 | 676 | -30,813 | 2,397 | 9,189 | 16,900 | — | -442,561 |
| Financial income | 22,067 | 15,463 | 194,454 | — | 7,538 | — | 1,454 | 50,033 | 5,666 | 2,460 | — | 11,270 | 2,883 | 9,321 | 29,962 | -1 | 352,570 |
| Financial expenses | -161,369 | -126,170 | -374,431 | — | -25,525 | — | -3,090 | -47,099 | -2,352 | -9 | 676 | -42,083 | -486 | -132 | -13,062 | 1 | -795,131 |
| OPERATIONAL EXPENSES / INCOME | 109,516 | 136,237 | 328,421 | — | -5,794 | — | -1,715 | -33,851 | 48,373 | 4,342 | 676 | 43,167 | 18,818 | -41,024 | 392,812 | -460,366 | 539,612 |
| INCOME TAX AND SOCIAL CONTRIBUTION ON PROFIT | -593 | -14,732 | -103,077 | — | 1,962 | — | — | -22,253 | -16,269 | -1,093 | — | -14,712 | 6,708 | 13,986 | -27,488 | 2,124 | -175,437 |
| NET INCOME FROM CONTINUING OPERATIONS | 108,923 | 121,505 | 225,344 | — | -3,832 | — | -1,715 | -56,104 | 32,104 | 3,249 | 676 | 28,455 | 25,526 | -27,038 | 365,324 | -458,242 | 364,175 |
| NET INCOME FROM DISCONTINUED OPERATIONS | 18,898 | — | — | — | — | — | — | — | — | — | — | — | — | — | — | — | 18,898 |
| NET INCOME | 127,821 | 121,505 | 225,344 | — | -3,832 | — | -1,715 | -56,104 | 32,104 | 3,249 | 676 | 28,455 | 25,526 | -27,038 | 365,324 | -458,242 | 383,073 |
| Attributed to shareholders of the parent company - continuing operations | 109,477 | 120,951 | 225,344 | — | -2,683 | — | -1,716 | -56,092 | 32,103 | 3,248 | 670 | 28,454 | 25,526 | -27,036 | 384,220 | -477,137 | 365,329 |
| Attributed to shareholders of the parent company - discontinued operations | 18,898 | — | — | — | — | — | — | — | — | — | — | — | — | — | — | — | 18,898 |
| Attributed to non-controlling shareholders - continuing operations | — | — | — | — | 1,428 | — | — | — | — | — | — | — | — | — | — | — | 1,428 |
| Attributed to non-controlling shareholders - discontinued operations | — | — | — | — | — | — | — | — | — | — | — | — | — | — | — | — | — |
| EBITDA continuing operations | 332,050 | 251,764 | 687,831 | — | 20,350 | — | 889 | 32,788 | 64,366 | 4,741 | — | 74,057 | 16,431 | -49,713 | 376,967 | -453,824 | 1,358,697 |
| 32 |
| |
| Income Statement 3Q24 | GET | Distribuição | Compagas | Elejor | UEG Araucária | Serviços | Parques Eólicos | FDA | Bela Vista | Pequenos ativos mantidos pra venda | MSG | C. Oeste, Marumbi, Uirapuru | Mercado Livre | Holding |
Elimin. e Reclassif. |
Consolidado | |||
| Geração | Transmissão | ||||||||||||||||||
| NET OPERATING INCOME | 528,893 | 211,441 | 4,352,365 | 155,965 | 19,880 | — | 2,920 | 182,149 | 156,887 | 9,425 | — | — | 21,098 | 901,383 | — | -806,798 | 5,735,608 | ||
| Electricity sales to final customers | — | — | 1,482,084 | — | — | — | — | — | — | — | — | 488,575 | — | -325 | 1,970,334 | ||||
| Electricity sales to distributors | 517,630 | — | 62,717 | — | 19,760 | — | — | 182,150 | 156,884 | 9,425 | — | 410,894 | — | -524,803 | 834,657 | ||||
| Use of the main distribution and transmission grid (TUSD/ TUST) | — | 187,755 | 1,568,245 | — | — | — | — | — | — | — | 18,665 | — | — | -114,573 | 1,660,092 | ||||
| Construction revenue | — | 16,588 | 642,002 | 3,287 | — | — | — | — | — | — | 2,426 | — | — | -3,287 | 661,016 | ||||
| Fair value of assets from the indemnity for the concession | — | — | 17,190 | — | — | — | — | — | — | — | — | — | — | — | 17,190 | ||||
| Distribution of piped gas | — | — | — | 152,678 | — | — | — | — | — | — | — | — | — | -152,678 | — | ||||
| Sectoral assets and liabilities result | — | — | 420,709 | — | — | — | — | — | — | — | — | — | — | — | 420,709 | ||||
| Other operating revenues | 11,263 | 7,098 | 159,418 | — | 120 | — | 2,920 | -1 | 3 | — | 7 | 1,914 | — | -11,132 | 171,610 | ||||
| OPERATING COSTS AND EXPENSES | -187,540 | -6,451 | -3,893,834 | -140,556 | -26,214 | — | -2,072 | -160,633 | -71,122 | -5,796 | — | — | -4,457 | -880,878 | -62,277 | 801,310 | -4,640,519 | ||
| Energy purchased for resale | -37,649 | — | -1,910,333 | — | -2,871 | — | — | -19,446 | -7,404 | -1,572 | — | — | — | -871,755 | — | 523,048 | -2,327,982 | ||
| Charges of the main distribution and transmission grid | -89,832 | — | -676,178 | — | -6,104 | — | — | -17,327 | -38,231 | -345 | — | — | — | — | — | 113,953 | -714,064 | ||
| Personnel and management | -47,883 | -35,249 | -166,338 | -7,703 | -1,547 | — | -39 | -3,726 | -525 | -140 | — | — | -166 | -3,591 | -19,724 | 7,702 | -278,929 | ||
| Private pension and health plans | -10,666 | -7,796 | -41,217 | -1,003 | -40 | — | -6 | -581 | -82 | -22 | — | — | -26 | -429 | -2,426 | 1,003 | -63,291 | ||
| Materials | -2,931 | -1,969 | -15,409 | -449 | -138 | — | — | -724 | -346 | -21 | — | — | -31 | -14 | -502 | 441 | -22,093 | ||
| Raw material and supplies - energy production | — | — | — | — | — | — | — | — | — | — | — | — | — | — | — | — | — | ||
| Natural gas and supplies for gas business | — | — | — | -113,280 | — | — | — | — | — | — | — | — | — | — | — | 113,280 | — | ||
| Third-party services | -24,009 | -12,365 | -187,818 | -1,166 | -4,684 | — | -972 | -31,746 | -9,371 | -688 | — | — | -1,182 | -1,847 | -11,753 | 12,988 | -274,613 | ||
| Depreciation and amortization | -89,870 | -4,403 | -152,595 | -4,752 | -7,972 | — | -1,053 | -69,143 | -31,885 | -2,847 | — | — | -11 | -443 | -843 | -2,597 | -368,414 | ||
| Provisions and reversals | -10,873 | -5,082 | -46,881 | -5,019 | — | — | — | -285 | — | — | — | — | -356 | -1,847 | -20,182 | 22,145 | -68,379 | ||
| Construction cost | — | -13,987 | -642,002 | -3,287 | — | — | — | — | — | — | — | — | -2,403 | — | — | 3,287 | -658,392 | ||
| Other operating costs and expenses | 126,173 | 74,400 | -55,063 | -3,897 | -2,858 | — | -2 | -17,655 | 16,722 | -161 | — | — | -282 | -952 | -6,847 | 6,060 | 135,638 | ||
| EQUITY IN EARNINGS OF SUBSIDIARIES | 53,839 | 70,463 | — | — | — | — | — | 5,422 | — | — | — | — | — | — | 673,175 | -739,689 | 63,210 | ||
| EARNINGS BEFORE INCOME TAXES | 395,192 | 275,453 | 458,531 | 15,409 | -6,334 | — | 848 | 26,938 | 85,765 | 3,629 | — | — | 16,641 | 20,505 | 610,898 | -745,177 | 1,158,299 | ||
| FINANCIAL RESULTS | -76,970 | -50,400 | -103,031 | -5,518 | -29,724 | — | -1,043 | -14,328 | 5,391 | 1,151 | — | — | 1,238 | 10,626 | 34,711 | 5,519 | -222,378 | ||
| Financial income | 35,847 | 21,724 | 162,905 | 4,279 | 4,628 | — | 1,230 | 40,722 | 5,526 | 1,151 | — | — | 1,741 | 10,731 | 47,308 | -6,600 | 331,192 | ||
| Financial expenses | -112,817 | -72,124 | -265,936 | -9,797 | -34,352 | — | -2,273 | -55,050 | -135 | — | — | — | -503 | -105 | -12,597 | 12,119 | -553,570 | ||
| OPERATIONAL EXPENSES / INCOME | 318,222 | 225,053 | 355,500 | 9,891 | -36,058 | — | -195 | 12,610 | 91,156 | 4,780 | — | — | 17,879 | 31,131 | 645,609 | -739,658 | 935,921 | ||
| INCOME TAX AND SOCIAL CONTRIBUTION ON PROFIT | -83,874 | -55,059 | -111,695 | -3,698 | 12,252 | — | -780 | -17,222 | -30,987 | -686 | — | — | -1,169 | -10,667 | 98,947 | 6,097 | -198,541 | ||
| NET INCOME continuing operations | 234,348 | 169,994 | 243,805 | 6,193 | -23,806 | — | -975 | -4,612 | 60,169 | 4,094 | — | — | 16,710 | 20,464 | 744,556 | -733,561 | 737,380 | ||
| NET INCOME discontinued operations | 12,004 | — | — | — | — | — | — | — | — | — | — | — | — | — | 475,104 | -7,399 | 479,709 | ||
| NET INCOME | 246,352 | 169,994 | 243,805 | 6,193 | -23,806 | — | -975 | -4,612 | 60,169 | 4,094 | — | — | 16,710 | 20,464 | 1,219,660 | -740,960 | 1,217,089 | ||
| Attributed to shareholders of the parent company - continuing operations | 234,348 | 169,994 | 243,805 | — | -16,902 | — | -975 | -4,612 | 60,169 | 4,094 | — | — | 16,710 | 20,464 | 1,340,046 | -918,243 | 744,556 | ||
| Attributed to the controlling company's shareholders - discontinued operations | 12,004 | — | — | 3,158 | — | — | — | — | — | — | — | — | — | — | -120,386 | 592,332 | 475,104 | ||
| Attributed to non-controlling shareholders - continuing operations | — | — | — | — | -6,904 | — | — | — | — | — | — | — | — | — | — | -238 | -7,142 | ||
| Attributed to non-controlling shareholders - discontinued operations | — | — | — | 3,035 | — | — | — | — | — | — | — | — | — | — | — | 1,536 | 4,571 | ||
| EBITDA continuing operations | 485,062 | 279,856 | 611,126 | 20,161 | 1,638 | — | 1,901 | 96,081 | 117,650 | 6,476 | — | — | 16,652 | 20,948 | 611,741 | -742,580 | 1,526,713 | ||
| 33 |
| |
| ANEXO II - RESULTADO POR SUBSIDIÁRIA > DRE POR EMPRESA ACUMULADO |
| R$'000 | |||||||||||||||||
| Income Statement 9M25 | GET | Distribuição | Compagas | Elejor | UEG Araucária | Serviços | Parques Eólicos | FDA | Bela Vista | Small Assets | MSG | C. Oeste, Marumbi, Uirapuru | Mercado Livre | Holding |
Elimin. e Reclassif. |
Consolidated | |
| Geração | Transmissão | ||||||||||||||||
| NET OPERATING INCOME | 1,679,414 | 790,448 | 13,986,101 | — | 113,051 | — | 8,542 | 573,088 | 447,026 | 27,996 | 27,740 | 114,752 | 70,764 | 3,209,841 | — | -2,120,346 | 18,928,417 |
| Electricity sales to final customers | — | — | 4,770,004 | — | — | — | — | — | — | — | — | — | — | 1,212,945 | — | -576 | 5,982,373 |
| Electricity sales to distributors | 1,644,065 | — | 284,740 | — | 112,846 | — | — | 564,749 | 447,026 | 27,996 | 27,740 | — | — | 1,969,890 | — | -1,721,823 | 3,357,229 |
| Use of the main distribution and transmission grid (TUSD/ TUST) | — | 620,982 | 4,782,283 | — | — | — | — | — | — | — | — | 113,575 | 54,521 | — | — | -358,953 | 5,212,408 |
| Construction revenue | — | 148,395 | 2,269,611 | — | — | — | — | — | — | — | — | 1,055 | 16,221 | — | — | — | 2,435,282 |
| Fair value of assets from the indemnity for the concession | — | — | 72,651 | — | — | — | — | — | — | — | — | — | — | — | — | — | 72,651 |
| Sectoral assets and liabilities result | — | — | 1,408,164 | — | — | — | — | — | — | — | — | — | — | — | — | — | 1,408,164 |
| Other operating revenues | 35,349 | 21,071 | 398,648 | — | 205 | — | 8,542 | 8,339 | — | — | — | 122 | 22 | 27,006 | — | -38,994 | 460,310 |
| OPERATING COSTS AND EXPENSES | -521,745 | -470,763 | -12,532,390 | — | -70,449 | — | -7,474 | -454,409 | -272,652 | -15,978 | -7,461 | -14,130 | -19,958 | -3,153,561 | -111,405 | 2,107,209 | -15,545,166 |
| Energy purchased for resale | -213,165 | — | -6,170,339 | — | -91 | — | — | -60,717 | -46,253 | -2,098 | -515 | — | — | -3,125,498 | — | 1,719,475 | -7,899,201 |
| Charges of the main distribution and transmission grid | -225,800 | — | -2,024,457 | — | -18,544 | — | — | -52,760 | -112,814 | -1,056 | -2,186 | — | — | — | — | 357,491 | -2,080,126 |
| Personnel and management | -117,326 | -92,035 | -399,998 | — | -4,013 | — | -316 | -8,070 | -2,474 | -292 | — | -1,650 | -422 | -14,340 | -63,230 | — | -704,166 |
| Private pension and health plans | -28,125 | -22,444 | -115,521 | — | -119 | — | -60 | -1,167 | -366 | -42 | — | -161 | -64 | -1,302 | -7,513 | — | -176,884 |
| Materials and supplies | -6,450 | -4,529 | -38,275 | — | -347 | — | -8 | -12,203 | -1,398 | -55 | — | 43 | -37 | -222 | -556 | — | -64,037 |
| Materials and supplies for power eletricity | — | — | — | — | — | — | — | — | — | — | — | — | — | — | — | — | — |
| Third-party services | -65,579 | -38,876 | -617,866 | — | -12,812 | — | -3,857 | -89,847 | -19,726 | -2,860 | -1 | -7,956 | -4,555 | -2,730 | -21,774 | 40,021 | -848,418 |
| Depreciation and amortization | -231,156 | -13,535 | -519,851 | — | -24,442 | — | -2,919 | -208,600 | -57,902 | -8,551 | -4,513 | -103 | -24 | -1,387 | -3,044 | -16,728 | -1,092,755 |
| Provisions and reversals | -6,627 | -9,869 | -221,736 | — | — | — | -250 | -1,297 | -23 | -572 | 100 | -255 | -36 | -1,552 | -943 | 3,050 | -240,010 |
| Construction cost | — | -140,466 | -2,269,611 | — | — | — | — | — | — | — | — | -2,342 | -14,139 | — | — | — | -2,426,558 |
| Other operating costs and expenses | 372,483 | -149,009 | -154,736 | — | -10,081 | — | -64 | -19,748 | -31,696 | -452 | -346 | -1,706 | -681 | -6,530 | -14,345 | 3,900 | -13,011 |
| EQUITY IN EARNINGS OF SUBSIDIARIES | 157,992 | 281,295 | — | — | — | — | — | 12,975 | — | — | — | — | — | — | 1,676,396 | -1,926,657 | 202,001 |
| EARNINGS BEFORE INCOME TAXES | 1,315,661 | 600,980 | 1,453,711 | — | 42,602 | — | 1,068 | 131,654 | 174,374 | 12,018 | 20,279 | 100,622 | 50,806 | 56,280 | 1,564,991 | -1,939,794 | 3,585,252 |
| FINANCIAL RESULTS | -393,633 | -289,627 | -569,071 | — | -45,360 | — | -4,253 | -58,611 | 6,926 | 6,245 | 115 | -40,979 | 6,923 | 28,799 | 61,579 | — | -1,290,947 |
| Financial income | 94,105 | 65,383 | 519,387 | — | 48,953 | — | 4,090 | 132,780 | 14,665 | 6,254 | — | 13,764 | 8,411 | 29,213 | 88,522 | -5 | 1,025,522 |
| Financial expenses | -487,738 | -355,010 | -1,088,458 | — | -94,313 | — | -8,343 | -191,391 | -7,739 | -9 | 115 | -54,743 | -1,488 | -414 | -26,943 | 5 | -2,316,469 |
| OPERATIONAL EXPENSES / INCOME | 922,028 | 311,353 | 884,640 | — | -2,758 | — | -3,185 | 73,043 | 181,300 | 18,263 | 20,394 | 59,643 | 57,729 | 85,079 | 1,626,570 | -1,939,794 | 2,294,305 |
| INCOME TAX AND SOCIAL CONTRIBUTION ON PROFIT | -213,016 | -8,380 | -273,909 | — | 881 | — | -168 | -60,717 | -60,856 | -3,004 | -824 | -20,276 | -5,376 | -29,105 | -23,598 | 6,449 | -691,899 |
| NET INCOME | 709,012 | 302,973 | 610,731 | — | -1,877 | — | -3,353 | 12,326 | 120,444 | 15,259 | 19,570 | 39,367 | 52,353 | 55,974 | 1,602,972 | -1,933,345 | 1,602,406 |
| Attributed to shareholders of the parent company - continuing operations | 690,114 | 302,973 | 610,731 | — | -1,314 | — | -3,353 | 12,326 | 120,444 | 15,259 | 19,570 | 39,367 | 52,353 | 55,974 | 1,584,074 | -1,914,447 | 1,584,071 |
| Attributed to shareholders of the parent company - descontinued operations | 18,898 | — | — | — | — | — | — | — | — | — | — | — | — | — | 18,898 | -18,898 | 18,898 |
| Attributed to non-controlling shareholders - continuing operations | — | — | — | — | -563 | — | — | — | — | — | — | — | — | — | — | -563 | |
| EBITDA continuing operations | 1,546,817 | 614,515 | 1,973,562 | — | 67,044 | — | 3,987 | 340,254 | 232,276 | 20,569 | 24,792 | 100,725 | 50,830 | 57,667 | 1,568,035 | -1,923,066 | 4,678,007 |
| 34 |
| |
| Income Statement 9M24 | GET | Distribuição | Compagas | Elejor | UEG Araucária | Serviços | Parques Eólicos | FDA | Bela Vista | C. Oeste, Marumbi, Uirapuru | Small Assets | MSG | Mercado Livre | Holding | Elimination | Consolidated | |
| Geração | Transmissão | ||||||||||||||||
| NET OPERATING INCOME | 1,588,303 | 724,766 | 12,556,067 | 562,129 | 67,212 | — | 3,093 | 542,593 | 416,916 | 26,594 | — | — | 59,742 | 2,590,380 | — | -2,505,923 | 16,631,872 |
| Electricity sales to final customers | — | — | 4,835,789 | — | — | — | — | — | — | — | — | — | — | 1,420,544 | — | -1,065 | 6,255,268 |
| Electricity sales to distributors | 1,547,071 | — | 83,935 | — | 66,834 | — | — | 538,443 | 416,908 | 26,594 | — | — | — | 1,167,170 | — | -1,545,462 | 2,301,493 |
| Use of the main distribution and transmission grid (TUSD/ TUST) | — | 656,585 | 4,774,303 | — | — | — | — | — | — | — | — | — | 58,828 | — | — | -356,412 | 5,133,304 |
| Construction revenue | — | 47,995 | 1,860,097 | 13,618 | — | — | — | — | — | — | — | — | 893 | — | — | -13,618 | 1,908,985 |
| Fair value of assets from the indemnity for the concession | — | — | 49,467 | — | — | — | — | — | — | — | — | — | — | — | — | — | 49,467 |
| Distribution of piped gas | — | — | — | 548,511 | — | — | — | — | — | — | — | — | — | — | — | -548,511 | — |
| Sectoral assets and liabilities result | — | — | 566,185 | — | — | — | — | — | — | — | — | — | — | — | — | — | 566,185 |
| Other operating revenues | 41,232 | 20,186 | 386,291 | — | 378 | — | 3,093 | 4,150 | 8 | — | — | — | 21 | 2,666 | — | -40,855 | 417,170 |
| OPERATING COSTS AND EXPENSES | -806,253 | -173,188 | -11,163,695 | -503,516 | -71,378 | -44,679 | -4,340 | -455,323 | -260,488 | -14,964 | — | — | -7,342 | -2,549,093 | -166,560 | 2,505,166 | -13,715,653 |
| Energy purchased for resale | -53,356 | — | -5,222,496 | — | -2,928 | — | — | -47,088 | -9,559 | -1,991 | — | — | — | -2,523,054 | — | 1,546,089 | -6,314,383 |
| Charges of the main distribution and transmission grid | -275,413 | — | -2,113,943 | — | -18,726 | -18,392 | — | -49,679 | -119,233 | -1,033 | — | — | — | — | — | 373,997 | -2,222,422 |
| Personnel and management | -152,031 | -112,000 | -514,553 | -33,621 | -4,255 | -3,124 | -128 | -11,765 | -1,661 | -447 | — | — | -540 | -11,152 | -49,092 | 36,744 | -857,625 |
| Private pension and health plans | -33,753 | -24,664 | -129,216 | -4,083 | -124 | -364 | -21 | -1,783 | -253 | -68 | — | — | -83 | -1,321 | -7,702 | 4,447 | -198,988 |
| Materials | -6,794 | -3,818 | -46,026 | -416 | -239 | -18 | -16 | -2,596 | -1,182 | -87 | — | — | -72 | -48 | -1,350 | 426 | -62,236 |
| Raw material and supplies - energy production | -936 | — | — | — | — | -944 | — | — | — | — | — | — | — | — | — | 944 | -936 |
| Natural gas and supplies for gas business | — | — | — | -397,554 | — | — | — | — | — | — | — | — | — | — | — | 397,554 | — |
| Third-party services | -67,174 | -37,982 | -519,102 | -10,650 | -12,598 | -9,842 | -2,533 | -96,707 | -27,186 | -2,263 | — | — | -4,588 | -4,253 | -35,198 | 57,397 | -772,679 |
| Depreciation and amortization | -280,055 | -12,450 | -433,938 | -27,146 | -24,232 | -10,316 | -1,729 | -206,666 | -95,773 | -8,540 | — | — | -33 | -1,313 | -2,420 | 15,414 | -1,089,197 |
| Provisions and reversals | -16,938 | -10,202 | -188,091 | -7,541 | — | -176 | — | -445 | -7 | -38 | — | — | -293 | -4,436 | -49,357 | 49,569 | -227,955 |
| Construction cost | — | -41,077 | -1,860,097 | -13,618 | — | — | — | — | — | — | — | — | -867 | — | — | 13,618 | -1,902,041 |
| Other operating costs and expenses | 80,197 | 69,005 | -136,233 | -8,887 | -8,276 | -1,503 | 87 | -38,594 | -5,634 | -497 | — | — | -866 | -3,516 | -21,441 | 8,967 | -67,191 |
| EQUITY IN EARNINGS OF SUBSIDIARIES | 83,246 | 269,437 | — | — | — | — | — | -10,003 | — | — | — | — | — | — | 1,825,750 | -1,943,032 | 225,398 |
| EARNINGS BEFORE INCOME TAXES | 865,296 | 821,015 | 1,392,372 | 58,613 | -4,166 | -44,679 | -1,247 | 77,267 | 156,428 | 11,630 | — | — | 52,400 | 41,287 | 1,659,190 | -1,943,789 | 3,141,617 |
| FINANCIAL RESULTS | -231,737 | -161,521 | -381,617 | -10,607 | -73,886 | -4,372 | -487 | -82,874 | 22,036 | 3,156 | — | — | 5,061 | 29,924 | 95,876 | 10,811 | -780,237 |
| Financial income | 88,115 | 54,876 | 367,811 | 29,114 | 29,394 | 1,068 | 2,063 | 101,948 | 22,474 | 3,111 | — | — | 6,617 | 30,166 | 157,457 | -36,985 | 857,229 |
| Financial expenses | -319,852 | -216,397 | -749,428 | -39,721 | -103,280 | -5,440 | -2,550 | -184,822 | -438 | 45 | — | — | -1,556 | -242 | -61,581 | 47,796 | -1,637,466 |
| OPERATIONAL EXPENSES / INCOME | 633,559 | 659,494 | 1,010,755 | 48,006 | -78,052 | -49,051 | -1,734 | -5,607 | 178,464 | 14,786 | — | — | 57,461 | 71,211 | 1,755,066 | -1,932,978 | 2,361,380 |
| INCOME TAX AND SOCIAL CONTRIBUTION ON PROFIT | -122,134 | -86,568 | -317,165 | -17,301 | 26,532 | — | -1,117 | -47,565 | -60,653 | -1,890 | — | — | -4,079 | -23,980 | 4,369 | 22,806 | -628,745 |
| NET INCOME continuing operations | 511,425 | 572,926 | 693,590 | 30,705 | -51,520 | -49,051 | -2,851 | -53,172 | 117,811 | 12,896 | — | — | 53,382 | 47,231 | 1,759,435 | -1,910,172 | 1,732,635 |
| NET INCOME discontinued operations | -11,586 | — | — | — | — | — | — | — | — | — | — | — | — | — | 463,690 | 39,467 | 491,571 |
| NET INCOME | 499,839 | 572,926 | 693,590 | 30,705 | -51,520 | -49,051 | -2,851 | -53,172 | 117,811 | 12,896 | — | — | 53,382 | 47,231 | 2,223,125 | -1,870,705 | 2,224,206 |
| Attributed to shareholders of the parent company - continuing operations | 511,425 | 572,926 | 693,590 | — | -36,579 | — | -2,851 | -53,172 | 117,811 | 12,896 | — | — | 53,382 | 47,231 | 1,747,850 | -1,905,074 | 1,759,435 |
| Attributed to the controlling company's shareholders - discontinued operations | -11,586 | — | — | 15,660 | — | -39,829 | — | — | — | — | — | — | — | — | 475,275 | 24,171 | 463,690 |
| Attributed to non-controlling shareholders - continuing operations | — | — | — | — | -14,941 | — | — | — | — | — | — | — | — | — | — | -517 | -15,458 |
| Attributed to non-controlling shareholders - discontinued operations | — | — | — | 15,045 | — | -9,222 | — | — | — | — | — | — | — | — | — | 10,715 | 16,539 |
| EBITDA continuing operations | 1,145,351 | 833,465 | 1,826,310 | 85,759 | 20,066 | -34,363 | 482 | 283,933 | 252,201 | 20,170 | — | — | 52,433 | 42,600 | 1,661,610 | -1,959,203 | 4,230,814 |
| 35 |
| |
| EXHIBIT II- RESULT BY SUBSIDIARY > ASSETS BY COMPANY |
| R$'000 | ||||||||||||||||
| Assets - Sep-2025 | Geração e Transmissão | Distribuição | Compagas | Elejor | UEG Araucária | Serviços | Parques Eólicos | FDA | Bela Vista | Small Assets | MSG | Costa Oeste, Marumbi, Uirapuru | Mercado Livre | Holding | Elimin. e Reclassif. | Consolidado |
| CURRENT | 3,155 | 6,537 | — | 122 | — | 125 | 1,183 | 154 | 71 | — | 331 | 90 | 898 | 2,699 | -2,226 | 13,140 |
| Cash and cash equivalents | 343 | 1,514 | — | 90 | — | 36 | 1,013 | 75 | 66 | — | 61 | 59 | 183 | 376 | — | 3,815 |
| Bonds and securities | — | — | — | 1 | — | 1 | — | — | — | — | 154 | — | — | — | — | 156 |
| Collaterals and escrow accounts | — | — | — | — | — | — | — | — | — | — | — | — | — | — | — | — |
| Customers | 378 | 3,473 | — | 14 | — | 1 | 97 | 64 | 4 | — | 40 | 9 | 434 | — | -233 | 4,280 |
| Dividends receivable | 132 | — | — | — | — | — | 33 | — | — | — | — | — | — | 1,870 | -1,954 | 81 |
| Sectorial financial assets | — | 101,272 | — | — | — | — | — | — | — | — | — | — | — | — | — | 101,272 |
| Account receivable related to concession | 12 | — | — | — | — | — | — | — | — | — | — | — | — | — | — | 12 |
| Contract Assets | 314 | — | — | — | — | — | — | — | — | — | 73 | 19 | — | — | — | 406 |
| Fair value in the purchase and sale of energy | — | — | — | — | — | — | — | — | — | — | — | — | 257 | — | — | 257 |
| Other current receivables | 143 | 566 | — | 3 | — | — | 3 | 13 | — | — | 1 | 1 | 1 | 333 | -6 | 1,058 |
| Inventories | 34 | 129 | — | 2 | — | — | — | — | — | — | — | — | — | — | — | 165 |
| Income tax and social contribution | 47 | 144 | — | 8 | — | 2 | 33 | — | 1 | — | 1 | 2 | 22 | 102 | — | 362 |
| Other current recoverable taxes | 12 | 563 | — | — | — | — | — | 1 | — | — | — | — | — | — | — | 576 |
| Prepaid expenses | 8 | 41 | — | 4 | — | — | 2 | 1 | — | — | — | — | — | 1 | — | 58 |
| Related parties | 13 | 7 | — | — | — | — | 3 | — | — | — | — | — | — | 10 | -33 | — |
| Assets held for sale | 1,718 | — | — | — | — | 86 | — | — | — | — | — | — | — | 7 | — | 1,812 |
| NON-CURRENT | 24,168 | 18,508 | — | 603 | — | 23 | 7,494 | 2,226 | 176 | — | 3,199 | 523 | 601 | 23,608 | -32,221 | 48,908 |
| Long Term Assets | 6,575 | 7,628 | — | 133 | — | 20 | 659 | 55 | — | — | 3,198 | 523 | 591 | 312 | -346 | 19,347 |
| Bonds and securities | 185 | 3 | — | — | — | — | 365 | 19 | — | — | 112 | 4 | — | — | — | 689 |
| Other temporary investments | — | — | — | — | — | 20 | — | — | — | — | — | — | — | 11 | — | 31 |
| Customers | — | 143 | — | — | — | — | — | — | — | — | — | — | — | — | — | 143 |
| Judicial deposits | 47 | 182 | — | — | — | — | 5 | — | — | — | — | — | 17 | 122 | — | 374 |
| Sectoral financial assets | — | 304 | — | — | — | — | — | — | — | — | — | — | — | — | — | 304 |
| Account receivable related to concession | 911 | 3,141 | — | — | — | — | — | — | — | — | — | — | — | — | — | 4,051 |
| Contract Assets | 4,712 | 2,037 | — | — | — | — | — | — | — | — | 3,079 | 519 | — | — | -51 | 10,296 |
| Fair value in the purchase and sale of energy | — | — | — | — | — | — | — | — | — | — | — | — | 561 | — | — | 561 |
| Other non-current receivables | 623 | 82 | — | 7 | — | — | — | 34 | — | — | — | — | — | — | — | 745 |
| Income tax and social contribution | 2 | 64 | — | — | — | — | — | — | — | — | 6 | — | 12 | 19 | — | 103 |
| Deferred income tax and social contribution | — | 644 | — | 120 | — | — | — | — | — | — | — | — | — | 116 | — | 881 |
| Other non-current recoverable taxes | 94 | 1,029 | — | — | — | — | — | 1 | — | — | — | — | — | 43 | — | 1,167 |
| Prepaid expenses | — | — | — | — | — | — | — | — | — | — | — | — | — | — | — | — |
| Related parties | — | — | — | 6 | — | — | 288 | — | — | — | — | — | — | — | -294 | — |
| Investments | 10,487 | — | — | — | — | — | 2,463 | — | — | — | — | — | — | 23,272 | -33,297 | 2,926 |
| Property, plant and equipment, net | 3,129 | — | — | 305 | — | 1 | 4,315 | 299 | 172 | — | — | 1 | 1 | 6 | — | 8,229 |
| Intangible assets | 3,900 | 10,738 | — | 165 | — | 2 | 12 | 1,872 | 4 | — | — | — | 5 | 10 | 1,421 | 18,128 |
| Right to use an asset | 78 | 141 | — | — | — | — | 45 | — | — | — | 1 | — | 4 | 8 | — | 278 |
| TOTAL | 27,323 | 25,044 | — | 725 | — | 148 | 8,678 | 2,380 | 247 | — | 3,530 | 613 | 1,499 | 26,307 | -34,448 | 62,048 |
| 36 |
| |
| EXHIBIT II- RESULT BY SUBSIDIARY > ASSETS BY COMPANY |
| R$'000 | ||||||||||||||
| Assets - Sep-2024 | Geração e Transmissão | Distribuição | Compagas | Elejor | UEG Araucária | Serviços | Parques Eólicos | FDA | Bela Vista | Costa Oeste, Marumbi, Uirapuru | Mercado Livre | Holding | Elimin. e Reclassif. | Consolidado |
| CURRENT | 3,478,566 | 6,769,769 | — | 124,996 | — | 48,889 | 1,119,406 | 146,365 | 60,415 | 106,590 | 916,049 | 3,264,843 | -2,994,084 | 13,041,808 |
| Cash and cash equivalents | 511,790 | 1,734,522 | — | 97,082 | — | 42,389 | 976,988 | 61,545 | 55,027 | 77,510 | 324,750 | 280,340 | -13 | 4,161,939 |
| Bonds and securities | — | — | — | — | — | 528 | — | — | — | — | — | 95 | — | 624 |
| Collaterals and escrow accounts | — | 9 | — | — | — | — | — | — | — | — | — | — | — | 9 |
| Customers | 379,135 | 3,267,284 | — | 10,752 | — | 3,795 | 94,192 | 76,636 | 4,118 | 8,750 | 348,795 | — | -230,755 | 3,962,702 |
| Dividends receivable | 153,322 | — | — | — | — | — | 8,393 | — | — | — | — | 2,644,431 | -2,723,868 | 82,278 |
| Sectorial financial assets | — | — | — | — | — | — | — | — | — | — | — | — | — | 10,609 |
| Account receivable related to concession | 10,609 | — | — | — | — | — | — | — | — | 18,050 | — | — | — | 283,896 |
| Contract Assets | 265,846 | — | — | — | — | — | — | — | — | — | 217,350 | — | — | 217,350 |
| Other current receivables | 90,679 | 541,676 | — | 3,210 | — | 74 | 4,084 | 6,595 | — | 549 | 8,561 | 301,929 | -7,680 | 949,674 |
| Inventories | 39,204 | 95,620 | — | 1,299 | — | — | — | — | — | 201 | — | — | — | 136,324 |
| Income tax and social contribution | 108,582 | 101,406 | — | 10,831 | — | 2,035 | 25,086 | 134 | 907 | 1,409 | 13,387 | 32,349 | — | 296,128 |
| Other current recoverable taxes | 10,626 | 979,880 | — | — | — | — | 80 | 1,035 | 8 | — | 2,990 | — | — | 994,618 |
| Prepaid expenses | 9,288 | 42,066 | — | 1,822 | — | 68 | 7,913 | 420 | 355 | 122 | 216 | 944 | — | 63,211 |
| Related parties | 17,664 | 7,306 | — | — | — | — | 2,670 | — | — | — | — | 4,754 | -31,773 | 621 |
| Assets classified as held for sale | 1,881,821 | — | — | — | — | — | — | — | — | — | — | — | 5 | 1,881,826 |
| NON-CURRENT | 22,800,216 | 16,797,534 | — | 623,724 | — | 100,266 | 7,961,804 | 2,279,634 | 184,758 | 508,080 | 531,035 | 23,164,333 | -30,609,036 | 44,342,348 |
| Long Term Assets | 6,186,586 | 6,847,655 | — | 132,366 | — | 15,084 | 747,629 | 54,415 | — | 507,812 | 520,497 | 708,857 | -405,709 | 15,315,121 |
| Bonds and securities | 149,368 | 3,159 | — | — | — | — | 353,799 | 17,941 | — | 4,815 | — | — | — | 529,085 |
| Other temporary investments | — | — | — | — | — | 14,709 | — | — | — | — | — | 15,894 | — | 30,603 |
| Customers | — | 116,180 | — | — | — | — | — | — | — | — | — | — | — | 116,180 |
| Judicial deposits | 49,775 | 190,181 | — | — | — | 72 | 484 | — | — | 242 | 16,933 | 136,677 | — | 394,364 |
| Sectoral financial assets | — | — | — | — | — | — | — | — | — | — | — | — | — | — |
| Account receivable related to concession | 886,620 | 2,610,731 | — | — | — | — | — | — | — | — | — | — | — | 3,497,351 |
| Contract Assets | 4,729,547 | 1,701,448 | — | — | — | — | — | — | — | 502,754 | — | — | -6,739 | 6,927,010 |
| Other non-current receivables | 276,590 | 65,322 | — | — | — | — | — | — | — | — | 479,938 | — | — | 479,938 |
| Income tax and social contribution | 1,819 | 59,940 | — | 6,954 | — | — | — | 34,860 | — | — | — | 298,120 | — | 681,846 |
| Deferred income tax and social contribution | — | 918,078 | — | — | — | — | — | — | — | — | 22,780 | 79,504 | — | 164,043 |
| Other non-current recoverable taxes | 92,867 | 1,182,616 | — | 119,561 | — | — | — | — | — | — | — | 136,536 | — | 1,174,175 |
| Prepaid expenses | — | — | — | — | — | 303 | 224 | 1,614 | — | — | 776 | 42,126 | — | 1,320,526 |
| Related parties | — | — | — | 5,851 | — | — | 393,122 | — | — | — | — | — | -398,970 | — |
| Investments | 10,104,390 | 442 | — | — | — | — | 2,698,723 | — | — | — | — | 22,431,868 | -31,657,485 | 3,577,937 |
| Property, plant and equipment, net | 3,160,968 | — | — | 317,388 | — | 80,590 | 4,462,642 | 306,000 | 180,931 | 229 | 702 | 7,248 | — | 8,516,697 |
| Intangible assets | 3,260,920 | 9,788,358 | — | 173,337 | — | 901 | 8,809 | 1,918,982 | 3,827 | 39 | 5,731 | 8,546 | 1,454,158 | 16,623,610 |
| Right to use an asset | 87,352 | 161,079 | — | 633 | — | 3,691 | 44,001 | 237 | — | — | 4,174 | 7,815 | — | 308,983 |
| TOTAL | 26,278,782 | 23,567,303 | — | 748,720 | — | 149,155 | 9,081,210 | 2,425,999 | 245,173 | 614,670 | 1,447,083 | 26,429,176 | -33,603,120 | 57,384,156 |
| 37 |
| |
| EXHIBIT II- RESULT BY SUBSIDIARY > LIABILITIES BY COMPANY |
| R$'000 | ||||||||||||||||
| Liabilities - Sep-25 | Geração e Transmissão | Distribuição | Compagas | Elejor | UEG Araucária | Serviços | Parques Eólicos | FDA | Bela Vista | Small Assets | MSG | Costa Oeste, Marumbi, Uirapuru | Mercado Livre | Holding | Eliminations | Consolidated |
| CURRENT | 3,184 | 6,021 | — | 117 | — | 18 | 903 | 106 | 3 | — | 139 | 31 | 834 | 36 | -2,230 | 9,161 |
| Social charges and accruals | 79 | 163 | — | 1 | — | — | — | — | — | — | — | — | 5 | 18 | — | 266 |
| Associated companies and parent company | 7 | 16 | — | — | — | — | 9 | 1 | — | — | 1 | — | — | 2 | -37 | — |
| Suppliers | 305 | 2,377 | — | 7 | — | 9 | 74 | 30 | 2 | — | 6 | 2 | 429 | 5 | -239 | 3,008 |
| Income Tax and Social Contribution payable | — | — | — | — | — | — | 12 | 44 | 1 | — | — | 2 | — | — | — | 59 |
| Other taxes | 27 | 277 | — | 1 | — | — | 8 | 3 | — | — | 3 | — | 7 | — | — | 327 |
| Loans and financing | 79 | 3 | — | — | — | — | 128 | — | — | — | — | 5 | — | — | — | 214 |
| Debentures | 832 | 923 | — | — | — | 4 | 59 | — | — | — | 125 | — | — | — | — | 1,943 |
| Dividends payable | 1,395 | 357 | — | — | — | — | 64 | — | — | — | — | 20 | 118 | 5 | -1,954 | 5 |
| Post employment benefits | 30 | 79 | — | — | — | — | — | — | — | — | — | — | — | 5 | — | 113 |
| Customer charges due | 11 | 89 | — | — | — | — | — | — | — | — | — | — | — | — | — | 101 |
| Research and development and energy efficiency | 3 | 86 | — | — | — | — | — | 8 | — | — | 1 | 1 | — | — | — | 101 |
| Payables related to concession | 25 | — | — | 105 | — | — | — | 12 | — | — | — | — | — | — | — | 143 |
| Sectorial financial liabilities | — | 1,344 | — | — | — | — | — | — | — | — | — | — | — | — | — | 1,344 |
| Other accounts payable | 12 | 47 | — | — | — | — | 1 | — | — | — | — | — | — | 1 | — | 61 |
| Fair value in energy purchase and sale operations | — | — | — | — | — | — | — | — | — | — | — | — | 259 | — | — | 259 |
| Other bills to pay | 215 | 199 | — | 2 | — | — | 548 | 7 | — | — | 1 | — | 15 | 1 | — | 988 |
| PIS and Cofins to be refunded to consumers | — | — | — | — | — | — | — | — | — | — | — | — | — | — | — | — |
| Provision for allocation of Pis and Cofins credits | — | 60 | — | — | — | — | — | — | — | — | — | — | — | — | — | 60 |
| Provisions for litigation | — | — | — | — | — | — | — | — | — | — | — | — | — | — | — | — |
| Liabilities associated with assets held for sale | 165 | — | — | — | — | 4 | — | — | — | — | — | — | — | — | — | 169 |
| NON-CURRENT | 9,571 | 10,869 | — | 736 | — | 70 | 2,833 | 78 | 4 | — | 1,988 | 36 | 341 | 285 | 128 | 26,940 |
| Social accruals | — | — | — | — | — | — | — | — | — | — | — | — | — | 2 | — | 2 |
| Associated companies and parent company | — | — | — | — | — | — | 285 | — | — | — | — | — | — | 6 | -291 | — |
| Suppliers | 131 | — | — | — | — | — | — | — | — | — | — | — | — | — | — | 131 |
| Deferred income tax and social contribution | 1,496 | — | — | 1 | — | — | 40 | 8 | 2 | — | 239 | 20 | 110 | — | 138 | 2,053 |
| Tax liabilities | — | 253 | — | — | — | — | — | — | — | — | — | — | — | — | — | 253 |
| Loans and financing | 463 | 750 | — | — | — | — | 1,972 | — | — | — | — | 12 | — | — | — | 3,196 |
| Debentures | 5,917 | 7,531 | — | — | — | 70 | 332 | — | — | — | 1,723 | — | — | — | — | 15,574 |
| Post-employment benefits | 308 | 722 | — | — | — | — | — | — | — | — | — | — | 2 | 37 | — | 1,069 |
| Research and development and energy efficiency | — | 278 | — | — | — | — | — | 3 | — | — | 4 | — | — | — | — | 286 |
| Payables related to the concession | 176 | — | — | 731 | — | — | — | 66 | — | — | — | — | — | — | — | 973 |
| Sectorial financial liabilities | — | — | — | — | — | — | — | — | — | — | — | — | — | — | — | — |
| Lease liability | 74 | 109 | — | — | — | — | 49 | — | — | — | — | — | 5 | 8 | — | 246 |
| Other payables | — | — | — | — | — | — | — | — | — | — | — | — | 223 | — | — | 223 |
| Fair value in energy purchase and sale operations | 60 | 34 | — | — | — | — | 153 | — | — | — | 1 | — | — | 90 | -90 | 249 |
| PIS/Cofins to be refunded to consumers | — | — | — | — | — | — | — | — | — | — | — | — | — | — | — | — |
| Provision for allocation of PIS and COFINS | — | 709 | — | — | — | — | — | — | — | — | — | — | — | — | — | 709 |
| Provisions for litigation | 947 | 483 | — | 3 | — | — | 2 | — | 2 | — | 20 | 4 | — | 142 | 371 | 1,974 |
| EQUITY | 14,569 | 8,154 | — | -128 | — | 60 | 4,942 | 2,196 | 241 | — | 1,404 | 546 | 324 | 25,986 | -32,346 | 25,948 |
| Attributable to controlling shareholders | 14,569 | 8,154 | — | -128 | — | 60 | 4,942 | 2,196 | 241 | — | 1,404 | 546 | 324 | 25,986 | -32,308 | 25,986 |
| Capital | 6,843 | 5,372 | — | 36 | — | 79 | 4,878 | 2,010 | 224 | — | 1,135 | 275 | 237 | 12,822 | -21,088 | 12,822 |
| Advance for Future Capital Increase | — | — | — | — | — | — | 26 | — | — | — | — | 1 | — | — | -27 | — |
| Capital reserves | — | 1 | — | — | — | — | — | — | — | — | — | — | 1 | 12 | -2 | 12 |
| Asset valuation adjustments | 502 | — | — | 2 | — | — | — | — | — | — | — | — | — | 483 | -504 | 483 |
| Treasury shares | — | — | — | — | — | — | — | — | — | — | — | — | — | -117 | — | -117 |
| Legal Reserves | 1,028 | 392 | — | — | — | — | 53 | 66 | 1 | — | 22 | 32 | 30 | 1,766 | -1,624 | 1,766 |
| Profit retention reserve | 5,240 | 1,778 | — | — | — | — | 321 | — | — | — | 161 | 187 | — | 9,364 | -7,686 | 9,364 |
| Tax incentive reserve | 4 | — | — | — | — | — | — | — | — | — | — | — | — | 4 | -4 | 4 |
| Additional proposed dividends | — | — | — | — | — | — | — | — | — | — | — | — | — | — | — | — |
| Accumulated profit | 952 | 611 | — | -166 | — | -19 | -336 | 120 | 15 | — | 85 | 52 | 56 | 1,653 | -1,372 | 1,653 |
| Attributable to noncontrolling interests | — | — | — | — | — | — | — | — | — | — | — | — | — | — | -38 | -38 |
| TOTAL | 27,323 | 25,044 | — | 725 | — | 148 | 8,678 | 2,380 | 247 | — | 3,530 | 613 | 1,499 | 26,307 | -34,448 | 62,048 |
| 38 |
| |
| EXHIBIT II- RESULT BY SUBSIDIARY > LIABILITIES BY COMPANY |
| R$'000 | ||||||||||||||
| Liabilities - Sep-24 | Geração e Transmissão | Distribuição | Compagas | Elejor | UEG Araucária | Serviços | Parques Eólicos | FDA | Bela Vista | Costa Oeste, Marumbi, Uirapuru | Mercado Livre | Holding | Eliminations | Consolidated |
| CURRENT | 5,107,929 | 5,979,105 | — | 114,110 | — | 11,151 | 655,490 | 153,431 | 5,495 | 29,976 | 878,302 | 404,699 | -2,997,302 | 10,342,381 |
| Social charges and accruals | 119,712 | 265,757 | — | 381 | — | — | — | — | — | — | 4,447 | 20,805 | — | 411,102 |
| Associated companies and parent company | 10,810 | 11,482 | — | — | — | 160 | 9,617 | 520 | 141 | 162 | 368 | 1,690 | -34,954 | — |
| Suppliers | 319,382 | 1,792,275 | — | 3,857 | — | 9,345 | 56,148 | 21,547 | 718 | 5,323 | 350,946 | 3,362 | -238,481 | 2,324,423 |
| Income Tax and Social Contribution payable | — | — | — | — | — | 457 | 9,548 | 72,506 | 368 | 602 | — | — | — | 83,482 |
| Other taxes | 24,925 | 252,462 | — | 736 | — | -24 | 7,382 | 5,255 | 177 | 362 | 10,462 | 614 | — | 302,346 |
| Loans and financing | 1,097,232 | 2,971 | — | — | — | — | 126,082 | — | — | 4,921 | — | — | — | 1,231,205 |
| Debentures | 1,056,707 | 908,720 | — | — | — | 1,192 | 58,491 | — | — | — | — | — | — | 2,025,110 |
| Dividends payable | 1,699,433 | 663,654 | — | — | — | — | 21,710 | 36,982 | 3,688 | 17,527 | 280,873 | 3,881 | -2,723,868 | 3,878 |
| Post employment benefits | 24,557 | 66,352 | — | — | — | — | — | — | — | — | 126 | 4,348 | — | 95,383 |
| Customer charges due | 19,940 | 23,598 | — | — | — | — | — | 855 | — | 432 | — | — | — | 44,825 |
| Research and development and energy efficiency | 13,567 | 161,074 | — | 104 | — | — | — | 3,827 | — | 577 | — | — | — | 179,149 |
| Payables related to concession | 4,686 | — | — | 106,333 | — | — | — | 2,073 | — | — | — | — | — | 113,092 |
| Sectorial financial liabilities | — | 935,322 | — | — | — | — | — | — | — | — | — | — | — | 935,322 |
| Other accounts payable | 13,697 | 41,959 | — | 284 | — | 21 | 571 | 186 | — | — | 180 | 604 | — | 57,502 |
| Fair value in the purchase and sale of energy | — | — | — | — | — | — | — | — | — | — | 214,955 | — | — | 214,955 |
| Other bills to pay | 161,869 | 273,479 | — | 2,415 | — | — | 365,940 | 9,682 | 403 | 69 | 15,945 | 369,395 | — | 1,199,195 |
| PIS and Cofins to be refunded to consumers | — | — | — | — | — | — | — | — | — | — | — | — | — | — |
| Provision for allocation of PIS and Cofins credits | — | 580,000 | — | — | — | — | — | — | — | — | — | — | — | 580,000 |
| Provisions for litigation | — | — | — | — | — | — | — | — | — | — | — | — | — | — |
| Assets held for sale | 541,412 | — | — | — | — | — | — | — | — | — | — | — | — | 541,412 |
| NON-CURRENT | 6,931,439 | 9,922,614 | — | 760,550 | — | 74,736 | 3,145,692 | 86,163 | 3,221 | 38,654 | 280,154 | 349,758 | -188,137 | 21,404,840 |
| Social obligations | — | 30 | — | — | — | — | — | — | — | — | — | 427 | — | 457 |
| Associated companies and parent company | — | — | — | — | — | — | 389,891 | — | — | — | — | 5,851 | -395,742 | — |
| Suppliers | 142,376 | — | — | — | — | — | — | — | — | — | — | — | — | 142,380 |
| Deferred income tax and social contribution | 1,445,182 | — | — | 1,222 | — | 802 | 33,343 | 10,513 | 1,679 | 18,752 | 102,398 | — | 281,567 | 1,895,459 |
| Tax liabilities | — | 291,195 | — | — | — | — | — | — | — | — | — | — | — | 291,195 |
| Loans and financing | 566,724 | 750,733 | — | — | — | — | 2,054,424 | — | — | 15,708 | — | — | — | 3,387,589 |
| Debentures | 3,892,598 | 6,205,483 | — | — | — | 69,701 | 434,474 | — | — | — | — | — | — | 10,602,255 |
| Post-employment benefits | 304,420 | 718,933 | — | — | — | — | — | — | — | — | 2,342 | 37,631 | — | 1,063,326 |
| Research and development and energy efficiency | — | 234,277 | — | — | — | — | — | 6,488 | — | 529 | — | — | — | 241,294 |
| Payables related to the concession | 167,478 | — | — | 755,649 | — | — | — | 69,125 | — | — | — | — | — | 992,252 |
| Sectorial financial liabilities | — | 142,488 | — | — | — | — | — | — | — | — | — | — | — | 142,488 |
| Lease liability | 80,058 | 127,277 | — | 393 | — | 3,861 | 47,308 | 36 | — | — | 4,311 | 7,761 | — | 271,004 |
| Other payables | — | — | — | — | — | — | — | — | — | — | 170,837 | — | — | 170,837 |
| Fair value in the purchase and sale of energy | 53,364 | 6,275 | — | — | — | 369 | 184,203 | — | — | — | — | 90,966 | -88,156 | 247,021 |
| PIS/Cofins to be refunded to consumers | — | — | — | — | — | — | — | — | — | — | — | — | — | — |
| Provision for allocation of PIS and Cofins credits | — | 1,000,588 | — | — | — | — | — | — | — | — | — | — | — | 1,000,588 |
| Provisions for litigation | 279,240 | 445,335 | — | 3,285 | — | — | 2,049 | — | 1,542 | 3,664 | 265 | 207,123 | 14,194 | 956,696 |
| EQUITY | 14,239,413 | 7,665,584 | — | -125,940 | — | 63,269 | 5,280,029 | 2,186,403 | 236,457 | 546,040 | 288,629 | 25,674,718 | -30,417,679 | 25,636,934 |
| Attributable to controlling shareholders | 14,239,413 | 7,665,584 | — | -125,940 | — | 63,269 | 5,280,029 | 2,186,403 | 236,457 | 546,040 | 288,629 | 25,674,718 | -30,379,896 | 25,674,717 |
| Capital | 6,242,757 | 5,372,206 | — | 35,503 | — | 78,785 | 5,186,230 | 2,009,509 | 223,913 | 275,161 | 237,210 | 12,821,758 | -19,661,293 | 12,821,758 |
| Advance for Future Capital Increase | 600,000 | — | — | — | — | — | 3,000 | — | — | — | — | — | -603,000 | — |
| Capital reserves | — | 166 | — | — | — | — | — | — | — | — | — | 5,595 | -166 | 5,595 |
| Equity valuation adjustments | 537,346 | -420 | — | 2,372 | — | 148 | — | — | — | — | -137 | 517,408 | -539,309 | 517,408 |
| Treasury shares | — | — | — | — | — | — | — | — | — | — | — | -50,044 | — | -50,044 |
| Legal Reserves | 1,027,643 | 391,901 | — | — | — | — | 53,090 | 65,950 | 1,479 | 31,639 | 30,275 | 1,766,110 | -1,601,979 | 1,766,110 |
| Profit retention reserve | 5,239,801 | 1,778,071 | — | — | — | — | 343,425 | — | — | 186,658 | — | 9,363,866 | -7,547,951 | 9,363,866 |
| Additional proposed dividends | 591,866 | 123,660 | — | — | — | — | 41,574 | 110,945 | 11,064 | 52,581 | 21,279 | 1,250,025 | -952,968 | 1,250,025 |
| Accumulated profit | — | — | — | -163,815 | — | -15,664 | -347,290 | — | — | — | — | — | 526,769 | — |
| Attributable to noncontrolling interests | — | — | — | — | — | — | — | — | — | — | — | — | -37,783 | -37,783 |
| TOTAL | 26,278,782 | 23,567,303 | — | 748,720 | — | 149,155 | 9,081,210 | 2,425,999 | 245,173 | 614,670 | 1,447,083 | 26,429,176 | -33,603,120 | 57,384,156 |
| 39 |
 |
| EXHIBIT III - ENERGY MARKET> DISTRIBUTION AND TOTAL MARKET |
| Copel’s Total Market | Number of Customers / Agreements | Energy Sold (GWh) | ||||||||||
| set/25 | set/24 | ∆% | 3Q25 | 3Q24 | ∆% | 9M25 | 9M24 | ∆% | ||||
| Copel DIS | 5,250,727 | 5,159,535 | 1.8 | 6,110 | 6,141 | -0.5 | 18,125 | 17,286 | 4.9 | |||
| Captive Market | 5,250,309 | 5,159,261 | 1.8 | 4,625 | 4,898 | -5.6 | 15,051 | 16,010 | -6.0 | |||
| Concessionaries and Licensees | 2 | 2 | — | 8 | 18 | -55.6 | 27 | 67 | -59.0 | |||
| CCEE (Assigments MCSD EN) | 416 | 272 | 52.9 | 556 | 532 | 4.5 | 1,138 | 602 | 89.3 | |||
| CCEE (MVE) | — | — | — | — | — | — | — | — | — | |||
| CCEE (MCP) 2 | — | — | — | 921 | 693 | 32.9 | 1,909 | 608 | — | |||
| Copel GeT | 425 | 523 | -18.7 | 3,662 | 3,621 | 1.1 | 12,090 | 12,317 | -1.8 | |||
| CCEAR (Copel DIS) | 5 | 4 | 25.0 | 51 | 30 | 70.0 | 116 | 94 | 23.1 | |||
| CCEAR (other concessionaries) | 101 | 119 | -15.1 | 459 | 581 | -21.0 | 1,604 | 1,736 | -7.6 | |||
| Bilateral Agreements (Copel Mercado Livre) | 312 | 396 | -21.2 | 2,961 | 2,951 | 0.3 | 10,087 | 10,014 | 0.7 | |||
| Bilateral Agreements 1 | 7 | 4 | 75.0 | 648 | 40 | 1,520.0 | 756 | 132 | 472.9 | |||
| CCEE (MCP) 2 | — | — | — | -457 | 19 | — | -473 | 341 | — | |||
| Wind Farms Complex | 703 | 660 | 6.5 | 1,195 | 1,113 | 7.4 | 3,623 | 3,288 | 10.2 | |||
| CCEAR (Copel DIS) | 19 | 15 | 26.7 | 35 | 31 | 12.9 | 100 | 96 | 4.2 | |||
| CCEAR (other concessionaries) | 654 | 580 | 12.8 | 687 | 657 | 4.6 | 1,997 | 1,852 | 7.8 | |||
| CER | 10 | 10 | — | 230 | 230 | — | 683 | 694 | -1.6 | |||
| Bilateral Agreements (Copel Mercado Livre) | 5 | 22 | -77.3 | 159 | 137 | 16.1 | 406 | 316 | 28.5 | |||
| Bilateral Agreements | 15 | 33 | -54.5 | 241 | 179 | 34.6 | 477 | 419 | 13.8 | |||
| CCEE (MCP) 2 | — | — | — | -157 | -121 | — | -40 | -89 | — | |||
| Copel Mercado Livre | 1,758 | 1,602 | 9.7 | 7,270 | 5,814 | 25.0 | 20,528 | 17,383 | 18.1 | |||
| Free Customers | 1,457 | 1,413 | 3.1 | 2,519 | 2,753 | -8.5 | 7,264 | 7,982 | -9.0 | |||
| CCEAR (other concessionaries) | 29 | — | — | 95 | — | — | 197 | — | — | |||
| Bilateral Agreements (Group Companies) | 37 | 12 | 208.3 | 852 | 321 | 165.4 | 1,508 | 604 | 149.7 | |||
| Bilateral Agreements | 235 | 177 | 32.8 | 3,746 | 2,713 | 38.1 | 11,440 | 8,673 | 31.9 | |||
| CCEE (MCP) 2 | — | — | — | 58 | 27 | — | 119 | 124 | -4.0 | |||
| Total Copel | 5,253,613 | 5,162,320 | 1.8 | 18,237 | 16,689 | 9.3 | 54,367 | 50,274 | 8.1 | |||
| Eliminations (operations with Group companies) | 4,058 | 3,470 | 16.9 | 12,216 | 11,124 | 9.8 | ||||||
| Total Consolidated Copel | 14,179 | 13,219 | 7.3 | 42,151 | 39,150 | 7.7 | ||||||
|
Note: Not considering the energy from MRE (Energy Relocation Mechanism). ¹ Includes Short Term Sales Agreements and CBR ² Negative values mean that there were more purchases than sales. CCEE: Electric Power Trade Chamber / CCEAR: Energy Purchase Agreements in the Regulated Market / MCP: Short Term Market / CER: Agreements Reserve Energy / MCSD EN - Mechanism for Compensation of Surpluses and Deficits of New Energy / MVE - MVE - Sale of energy to the free market through the Surplus Selling Mechanism. | ||||||||||||
| Copel’s Dis Market | Number of Customers | Consumed Energy (GWh) | ||||||||||
| set/25 | set/24 | ∆% | 3Q25 | 3Q24 | ∆% | 9M25 | 9M24 | ∆% | ||||
| Residential | 4,371,253 | 4,274,234 | 2.3 | 2,366 | 2,275 | 4.0 | 7,552 | 7,376 | 2.4 | |||
| Industrial | 68,395 | 68,991 | (0.9) | 3,293 | 3,244 | 1.5 | 9,728 | 9,496 | 2.4 | |||
| Captive | 65,822 | 67,319 | (2.2) | 314 | 430 | (27.0) | 980 | 1,315 | (25.5) | |||
| Free | 2,573 | 1,672 | 53.9 | 2,979 | 2,814 | 5.9 | 8,748 | 8,180 | 6.9 | |||
| Commercial | 451,413 | 446,640 | 1.1 | 1,727 | 1,690 | 2.2 | 5,528 | 5,498 | 0.5 | |||
| Captive | 448,000 | 444,466 | 0.8 | 992 | 1,074 | (7.6) | 3,315 | 3,587 | (7.6) | |||
| Free | 3,413 | 2,174 | 57.0 | 735 | 616 | 19.2 | 2,213 | 1,911 | 15.8 | |||
| Rural | 308,614 | 317,110 | (2.7) | 593 | 615 | (3.6) | 2,018 | 2,056 | (1.8) | |||
| Captive | 308,447 | 317,008 | (2.7) | 529 | 565 | (6.2) | 1,814 | 1,902 | (4.6) | |||
| Free | 167 | 102 | 63.7 | 64 | 51 | 25.4 | 204 | 154 | 32.6 | |||
| Others | 57,608 | 56,442 | 2.1 | 598 | 610 | (2.0) | 1,876 | 1,905 | (1.5) | |||
| Captive | 56,787 | 56,234 | 1.0 | 424 | 556 | (23.7) | 1,389 | 1,829 | (24.1) | |||
| Free | 821 | 208 | 294.7 | 174 | 54 | — | 487 | 76 | — | |||
| Total Captive Market | 5,250,309 | 5,159,261 | 1.8 | 4,625 | 4,898 | (5.6) | 15,050 | 16,010 | (6.0) | |||
| Total Free Market | 6,974 | 4,156 | 67.8 | 3,951 | 3,535 | 11.8 | 11,652 | 10,321 | 12.9 | |||
| Supply to Concessionaries | 7 | 7 | — | 258 | 253 | 1.9 | 769 | 752 | 2.2 | |||
| Total Grid Market | 5,257,290 | 5,163,424 | 1.8 | 8,834 | 8,687 | 1.7 | 27,471 | 27,083 | 1.4 | |||
| Micro and Mini Distributed Energy Generation | 502,341 | 383,261 | 31.1 | (769) | (581) | 32.3 | (2,437) | (1,859) | 31.1 | |||
| Offset Energy from Distributed Generation II and III | 276 | 93 | 196.4 | 799 | 215 | 271.1 | ||||||
| Total Billed Market | 8,341 | 8,199 | 1.7 | 25,833 | 25,439 | 1.5 | ||||||
| 40 |
| |
| EXHIBIT III - ENERGY MARKET> TARIFFS |
| Supply Tariff (R$/MWh) | 2025 | Product Class* | Validity* | ||
| Amount Average MW | Price (R$)¹ | ||||
| Copel Geração e Transmissão | |||||
| Auction CCEAR 2011 - 2040 ( HPP Mauá) | 192 | 315.71 | SP100/SP92 | 01.07.2020 | 31.12.2040 |
| Auction - CCEAR 2024 - 2053 (SHP Bela Vista) | 15 | 274.80 | 01.01.2024 | 12.31.2053 | |
| Copel Distribuição | |||||
| Concession holders in the State of Paraná | 24 | 305.74 | |||
| Total / Tariff Weighted Average Supply | 231 | 312.02 | |||
| Contains PIS and COFINS. Net of ICMS. | |||||
| *GSF renegotiation | |||||
| Purchase Tariff - Copel Distribuição (R$/MWh) | Amount | Sep/25 | Sep/24 | Δ% | |
| Average MW | |||||
| Itaipu 1 | 481.1 | 225.84 | 245.89 | -8.2 % | |
| Auction – CCEAR 2010 – H30 | 69.1 | 329.88 | 313.22 | 5.3 % | |
| Auction – CCEAR 2010 - T15 2 | — | — | 353.86 | -100.0 % | |
| Auction – CCEAR 2011 - H30 | 57.0 | 340.11 | 322.93 | 5.3 % | |
| Auction – CCEAR 2011 - T15 2 | 53.7 | 284.49 | 307.74 | -7.6 % | |
| Auction – CCEAR 2012 - T15 2 | 107.5 | 331.37 | 293.65 | 12.8 % | |
| Auction – CCEAR 2016 - T20 ² | 26.6 | 206.19 | 229.47 | -10.1 % | |
| Angra | 96.8 | 315.90 | 347.53 | -9.1 % | |
| CCGF 3 | 361.7 | 201.50 | 179.84 | 12.0 % | |
| Santo Antônio | 136.1 | 211.07 | 200.41 | 5.3 % | |
| Jirau | 226.5 | 185.71 | 176.33 | 5.3 % | |
| Others Auctions 4 | 755.7 | 290.69 | 311.04 | -6.5 % | |
| Total / Average Purchuse Tariff | 2,371.8 | 253.46 | 252.95 | 0.2 % | |
| Contains PIS and COFINS | |||||
| 1 Furnas transport charge not included. | |||||
| 2 Average auction price restated according as bilateral payment to vendors. It does not include | |||||
| 3 Contract of quotas of assured power of those HPPs which concessions were extended pursuant | |||||
| 4 Products average price, does not include PROINFA. | |||||
| *The table has been updated for all periods as new calculation methodology for average prices, a result of the 4th phase of the Public Hearing 78/2011 Aneel approved on 03.28.2016. | |||||
| Retail Tariff - Copel Distribuição (R$/MWh) | Sep/25 | Sep/24 | Δ% | ||
| Industrial | 536.91 | 551.30 | -2.6 % | ||
| Residential | 535.80 | 527.34 | 1.6 % | ||
| Commercial | 572.13 | 583.06 | -1.9 % | ||
| Rural | 556.17 | 575.85 | -3.4 % | ||
| Other | 615.52 | 590.55 | 4.2 % | ||
| Retail Tariff supply average tariff | 592.40 | 615.21 | -3.7 % | ||
| Demand average tariff (R$/kW) | 33.45 | 40.02 | -16.4 % | ||
| Does not consider tariff flags, Pis/Pasep and net of ICMS. | |||||
| 41 |
| |
| EXHIBIT III - ENERGY MARKET> ELECTRICITY PURCHASED AND CHARGES |
| R$'000 | ||||||
| Electricity Purchased for Resale | 3Q25 | 3Q24 | Δ% | 9M25 | 9M24 | Δ% |
| Purchase of energy in the regulated party - CCEAR | 1,080,404 | 1,077,768 | 0.2 | 2,952,919 | 3,009,783 | -1.9 |
| Itaipu Binacional | 243,028 | 252,548 | -3.8 | 742,033 | 707,070 | 4.9 |
| Câmara de Comercialização de Energia - CCEE | 465,591 | 277,655 | 67.7 | 851,223 | 450,261 | 89.1 |
| Micro and mini generators and customer repurchase | 609,491 | 390,409 | 56.1 | 1,709,902 | 1,200,327 | 42.5 |
| Proinfa | 107,232 | 84,278 | 27.2 | 320,561 | 252,990 | 26.7 |
| Bilateral Agreements | 829,468 | 478,001 | 73.5 | 2,004,286 | 1,267,164 | 58.2 |
| Fair value in the purchase and sale of energy | — | -17,872 | — | — | 26,009 | — |
| (-) PIS/Pasep and Cofins | -251,775 | -214,805 | 17.2 | -681,723 | -599,221 | 13.8 |
| TOTAL | 3,083,439 | 2,327,982 | 32.5 | 7,899,201 | 6,314,383 | 25.1 |
| R$'000 | ||||||
| Charges of the main distribution and transmission grid | 3Q25 | 3Q24 | Δ% | 2025 | 2024 | Δ% |
| Itaipu transportation charges | 51,113 | 43,439 | 17.7 | 135,344 | 153,025 | -11.6 |
| System Service Charges - ESS | 628 | 39,171 | -98.4 | 7,194 | 61,629 | -88.3 |
| System usage charges | 613,239 | 586,044 | 4.6 | 1,838,063 | 1,914,412 | -4.0 |
| Charge reserve energy - EER | 100,233 | 115,845 | -13.5 | 336,847 | 337,581 | -0.2 |
| Grid Use charges - Provisions | 482 | 10,852 | — | 538 | 10,900 | -95 |
| (-) PIS / Pasep and Cofins taxes on charges for use of power grid | -78,664 | -81,293 | -3.2 | -237,855 | -255,128 | -6.8 |
| TOTAL | 687,031 | 714,058 | -3.8 | 2,080,131 | 2,222,419 | -6.4 |
| 42 |
| |
| EXHIBIT III - ENERGY MARKET> ENERGY BALANCE |
| (average MW) | ||||||
| Energy Balance - Copel GET - Sep-25 | 2025 | 2026 | 2027 | 2028 | 2029 | 2030 |
| Own Resources GeT | 1,956 | 1,890 | 1,901 | 1,920 | 1,928 | 1,928 |
| GeT (1) | 1,359 | 1,291 | 1,291 | 1,291 | 1,291 | 1,291 |
| GPS (CCGF) (2) | 73 | 73 | 73 | 73 | 73 | 73 |
| Bela Vista + FDA | 524 | 526 | 537 | 556 | 564 | 564 |
| Own Resources SPP and Wind Farm (3) | 544 | 544 | 544 | 544 | 544 | 544 |
| Purchases | 220 | 75 | 50 | — | — | — |
| TOTAL OWN RESOURCES + SOLD | 2,720 | 2,509 | 2,495 | 2,464 | 2,472 | 2,472 |
| TOTAL SOLD | 2,407 | 2,114 | 1,847 | 1,586 | 1,262 | 961 |
| Sales (Regulated) | 737 | 706 | 706 | 706 | 706 | 706 |
| Sales (Regulated) % | 27% | 28% | 28% | 29% | 29% | 29% |
| Sales (Free Market) | 1,670 | 1,408 | 1,141 | 880 | 556 | 255 |
| Sales (Free Market) % | 62% | 57% | 46% | 36% | 23% | 10% |
| Total Available | 312 | 395 | 647 | 878 | 1,210 | 1,511 |
| Total Available (%) | 11% | 15% | 26% | 35% | 48% | 61% |
| Avarege price of energy sold (R$))(4) | 175.18 | 189.99 | 190.70 | 198.93 | 209.97 | 227.61 |
| Reference: September/25 | ||||||
| (1) Includes Mauá 100% from June25 and GPS 30% (ex-CCGF). Does not include Baixo Iguaçu, Elejor and Foz do Chopim. | ||||||
| (2) GPS 70% (quota regime). | ||||||
| (3) Does not include Voltália Wind Complex. | ||||||
| (4) Average gross energy price (with PIS/COFINS and without ICMS). The GPS CCGF RAG is not considered in the calculation of average prices. | ||||||
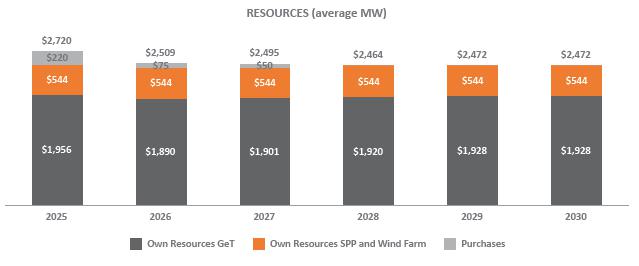
SALES (average MW)
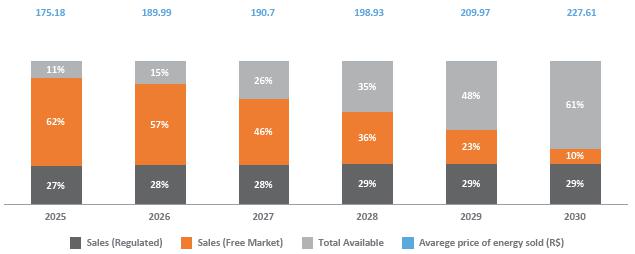
|
Comments: 1- Excluding losses and internal consumption. 2- Considering the GFs of wind SPEs constant for all periods. 3- Considering the Sales of wind SPEs constant for all periods. 4- Considering energy purchases in each period. 5 - Prices updated according to the contractual readjustment index, from the reference dates until September/2025. 6 - The GPS CCGF RAG is not considered in the calculation of average prices. 7 - Average gross energy prices (with PIS/COFINS and without ICMS) 8- Considers the physical guarantee of the plants on September 30,2025. |
| 43 |
| |
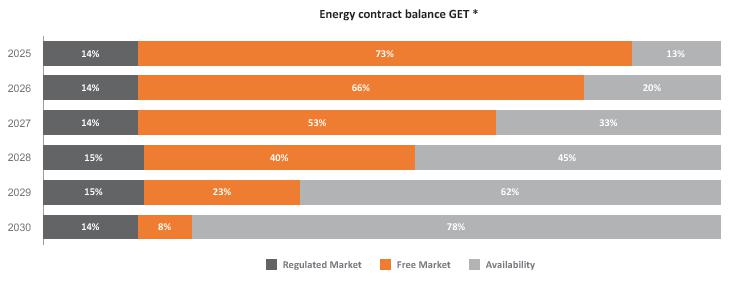
| avarage prices of energy sold | ||||||||||||
| 2025 | 2026 | 2027 | 2028 | 2029 | 2030 | |||||||
| $167.52 | $185.69 | $187.19 | $198.77 | $217.54 | $260.69 | |||||||
| *Includes hydroelectric plants, CCGF (GPS Plant), SPE FDA and SPE Bela Vista. | ||||||||||||
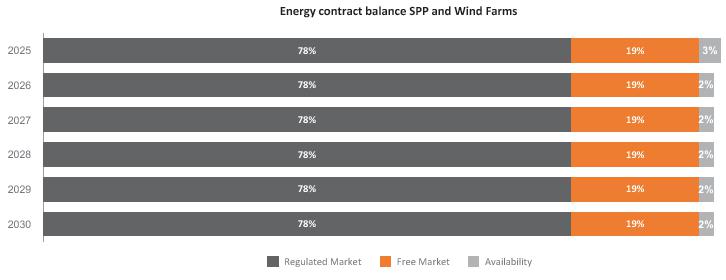
| avarage prices of energy sold | ||||||||||||
| 2025 | 2026 | 2027 | 2028 | 2029 | 2030 | |||||||
| $219.89 | $220.19 | $216.71 | $215.49 | $214.33 | $213.30 | |||||||
| Comments: | ||||||||||||
| 1- Excluding losses and internal consumption. | ||||||||||||
| 2- Considering the GFs of wind SPEs constant for all periods. | ||||||||||||
| 3- Considering the Sales of wind SPEs constant for all periods. | ||||||||||||
| 4- Considering energy purchases in each period. | ||||||||||||
| 5 - Prices updated according to the contractual readjustment index, from the reference dates until September/2025. | ||||||||||||
| 6 - The GPS CCGF RAG is not considered in the calculation of average prices. | ||||||||||||
| 7 - Average gross energy prices (with PIS/COFINS and without ICMS) | ||||||||||||
| 8- Considers the physical guarantee of the plants on September 30,2025. | ||||||||||||
| 44 |
| |
| EXHIBIT III - ENERGY MARKET> WIND POWER PRICES |
| Wind Farms - Sold | Auction ¹ | Price (R$) ² | Certification |
Amount MW average/year |
Start of Supply | End of Supply |
| São Bento Energia, Invest. e Part. S.A. | ||||||
| GE Boa Vista S.A. |
2º LFA (26/08/2010) |
326.41 | P50 | 5.70 | 01.01.2013 | 31.12.2032 |
| GE Farol S.A. | 316.90 | P50 | 9.10 | |||
| GE Olho D’Água S.A. | 316.90 | P50 | 14.90 | |||
| GE São Bento do Norte S.A. | 316.90 | P50 | 14.00 | |||
| Copel Brisa Potiguar S.A. | ||||||
| Nova Asa Branca I Energias Renováveis S.A. |
2º LFA (26/08/2010) |
320.28 | P50 | 13.20 | 01.01.2013 | 31.12.2032 |
| Nova Asa Branca II Energias Renováveis S.A. | 320.28 | P50 | 12.80 | |||
| Nova Asa Branca III Energias Renováveis S.A. | 320.28 | P50 | 12.50 | |||
| Nova Eurus IV Energias Renováveis S.A. | 320.28 | P50 | 13.70 | |||
| Santa Maria Energias Renováveis S.A. |
4º LER (18/08/2011) |
225.72 | P50 | 15.70 | 01.07.2014 | 30.06.2034 |
| Santa Helena Energias Renováveis S.A. | 225.72 | P50 | 16.00 | |||
| Ventos de Santo Uriel S.A. | 223.97 | P50 | 9.00 | |||
| Cutia | ||||||
| UEE Cutia S.A. |
6º LER (31/10/2014) |
265.51 | P90 | 9.60 | 01.10.2017 | 30.09.2037 |
| UEE Esperança do Nordeste S.A. | 265.51 | P90 | 9.10 | |||
| UEE Guajiru S.A. | 265.51 | P90 | 8.30 | |||
| UEE Jangada S.A. | 265.51 | P90 | 10.30 | |||
| UEE Maria Helena S.A. | 265.51 | P90 | 12.00 | |||
| UEE Paraíso dos Ventos do Nordeste S.A. | 265.51 | P90 | 10.60 | |||
| UEE Potiguar S.A. | 265.51 | P90 | 11.30 | |||
| Bento Miguel | ||||||
| CGE São Bento do Norte I S.A. |
20ª LEN (28/11/2014) |
251.49 | P90 | 9.70 | 01.01.2019 | 31.12.2038 |
| CGE São Bento do Norte II S.A. | 251.49 | P90 | 10.00 | |||
| CGE São Bento do Norte III S.A. | 251.49 | P90 | 9.60 | |||
| CGE São Miguel I S.A. | 251.49 | P90 | 8.70 | |||
| CGE São Miguel II S.A. | 251.49 | P90 | 8.40 | |||
| CGE São Miguel III S.A. | 251.49 | P90 | 8.40 | |||
| Vilas | ||||||
| Vila Ceará I (Antiga Vila Paraíba IV) | 28ª LEN (31/08/2018) | 135.23 | P90 | 8.20 | 01.01.2024 | 31.12.2043 |
| Vila Maranhão I | 135.23 | P90 | 8.30 | |||
| Vila Maranhão II | 135.23 | P90 | 8.30 | |||
| Vila Maranhão III (Antiga Vila Paraíba III) | 135.23 | P90 | 8.20 | |||
| Vila Mato Grosso (Antiga Vila Alagoas III) |
29ª LEN (28/06/2019) |
112.80 | P90 | 3.30 | 01.01.2023 | 31.12.2042 |
| Jandaira | ||||||
| Jandaira I |
30ª LEN (18/10/2019) |
137.95 | P90 | 1.60 | 01.01.2025 | 31.12.2044 |
| Jandaira II | 137.95 | P90 | 4.10 | |||
| Jandaira III | 137.95 | P90 | 4.40 | |||
| Jandaira IV | 137.95 | P90 | 4.30 | |||
| Aventura | ||||||
| Aventura II |
26º LEN (20/12/2017) |
145.83 | P90 | 11.70 | 01.01.2023 | 31.12.2042 |
| Aventura III | 145.83 | P90 | 12.80 | |||
| Aventura IV | 145.83 | P90 | 14.10 | |||
| Aventura V | 145.83 | P90 | 15.00 | |||
| Santa Rosa & Mundo Novo | ||||||
| Santa Rosa & Mundo Novo I |
26º LEN (20/12/2017) |
148.84 | P90 | 16.50 | 01.01.2023 | 31.12.2042 |
| Santa Rosa & Mundo Novo II | 148.84 | P90 | 17.00 | |||
| Santa Rosa & Mundo Novo III | 148.84 | P90 | 18.00 | |||
| Santa Rosa & Mundo Novo IV | 148.84 | P90 | 7.50 | |||
| Santa Rosa & Mundo Novo V | 148.84 | P90 | 8.10 | |||
| Voltália3 | ||||||
| Caranaúbas |
04ª LER (18/08/2011) |
218.94 | — | 13.10 | 01.07.2014 | 30.06.2034 |
| Reduto | 218.94 | — | 13.90 | |||
| Santo Cristo | 218.94 | — | 14.80 | |||
| São João | 218.94 | — | 14.30 | |||
| ¹LFA - Alternative Sources Auction/LER - Reserve Energy Auction/LEN - New Energy Auction. | ||||||
| ²Price updated by IPCA until Sep/24 (Reference Oct/24). Source: CCEE | ||||||
| 3Values presented refer to 100% of the Complex. Copel has a 49% stake in the project. | ||||||
| 45 |
| |
| EXHIBIT III - ENERGY MARKET> ENERGY FLOW |
| GWh | ||||||||||||
| Energy Flow | COPEL DIS | COPEL GET + FDA + BELA VISTA | EÓLICAS | COPEL COM | ELIMINAÇÕES | CONSOLIDADO | ||||||
| 3Q25 | 3Q24 | 3Q25 | 3Q24 | 3Q25 | 3Q24 | 3Q25 | 3Q24 | 3Q25 | 3Q24 | 3Q25 | 3Q24 | |
| Own Generation | — | — | 4,406 | 6,700 | 922 | 1089 | — | — | — | — | 5,328 | 7,789 |
| Purchased energy | 5,858 | 6,375 | 927 | 466 | 89 | 7 | 7,270 | 5,814 | 4,058 | 3,470 | 10,086 | 9,192 |
| Copel Comercialização | — | — | 763 | 321 | 89 | — | — | — | 852 | 321 | — | — |
| Companies of the group | 86 | 60 | — | — | — | — | 3,120 | 3,089 | 3,206 | 3,149 | — | — |
| Itaipu | 1,120 | 1,146 | — | — | — | — | — | 0 | — | — | 1,120 | 1,146 |
| Auction – CCEAR | 3,315 | 3,898 | — | — | — | — | — | 0 | — | — | 3,315 | 3,898 |
| CCEE (MCP) | 0 | 6 | — | — | — | — | — | 0 | — | — | 0 | 6 |
| Angra | 214 | 215 | — | — | — | — | — | — | — | — | 214 | 215 |
| CCGF | 770 | 933 | — | — | — | — | — | — | — | — | 770 | 933 |
| Proinfa | 93 | 104 | — | — | — | — | — | — | — | — | 93 | 104 |
| Other (1) | 260 | 13 | 164 | — | — | 7 | 4,116 | 2,725 | — | — | 4,540 | 2,745 |
| Elejor | — | — | — | — | — | — | — | 0 | — | — | — | 0 |
| Dona Francisca | — | — | 0 | 34 | — | — | 34 | — | — | — | 34 | 34 |
| MRE Receipt | — | — | 0 | 111 | — | — | — | — | — | — | 0 | 111 |
| Avaiable | 5,858 | 6,375 | 5,333 | 7,166 | 1,011 | 1096 | 7,270 | 5,814 | 4,058 | 3,470 | 15,414 | 16,981 |
| Captive Market | 4,625 | 4,898 | — | — | — | — | — | — | — | — | 4,625 | 4,898 |
| Concessionaires (2) | 8 | 18 | — | — | — | — | — | — | — | — | 8 | 18 |
| CCEE concessionaire supply (3) | — | — | 42 | 40 | — | — | — | — | — | — | 42 | 40 |
| CCEE (MCSD EN Assignments) (4) | 556 | 532 | — | — | — | — | — | — | — | — | 556 | 532 |
| CCEE (MVE) (5) | — | — | — | — | — | — | — | — | — | — | — | — |
| CCEE (MCP) (6) | 921 | 699 | -457 | 19 | -157 | -121 | 58 | 27 | — | — | 365 | 624 |
| Free Customers | — | — | — | — | — | — | 2,519 | 2,753 | — | — | 2,519 | 2,753 |
| Bilateral Agreements | — | — | 606 | — | 241 | 179 | 3,746 | 2,713 | — | — | 4,593 | 2,892 |
| Auction CCEAR (7) | — | — | 459 | 581 | 687 | 657 | 95 | — | — | — | 1,241 | 1238 |
| MRE assignment (8) | — | — | 1,671 | 3,545 | — | — | — | — | — | — | 1,671 | 3,545 |
| CER (9) | — | — | — | — | 230 | 230 | — | — | — | — | 230 | 230 |
| Copel Comercialização | — | — | 2,961 | 2,952 | 159 | 137 | — | — | 3,120 | 3,089 | — | — |
| Companies of the group | — | — | 51 | 29 | 35 | 31 | 852 | 321 | 938 | 381 | — | — |
| Losses and Differences (10) | -252 | 228 | — | — | -184 | -17 | — | — | — | — | -436 | 211 |
| (1) Others: Includes MCSD EM Assignments of Copel Distribuição (purchase). | ||||||||||||
| (2) Energy supply to concessionaires and licensees with their own market below 500GWh/year. | ||||||||||||
| (3) Supply of energy to CCEE's agent distributor, through a Regulated Bilateral Contract Agreement - CBR | ||||||||||||
| (4) Assignments MCSD EN - Contractual assignments to other distributors through the New Energy Surplus and Deficit Compensation Mechanism. | ||||||||||||
| (5) CCEE (MVE): Financial settlement of energy surpluses from the distributor to the free market through the Surplus Sale Mechanism. | ||||||||||||
| (6) CCEE (MCP): Electric Energy Commercialization Chamber (Spot Market). | ||||||||||||
| (7) CCEAR: Energy Trading Agreement in the Regulated Environment. | ||||||||||||
| (8) MRE: Energy Reallocation Mechanism. | ||||||||||||
| (9) CER: Reserve Energy Contract. | ||||||||||||
| (10) Considers the effects of Mini and Micro Distributed Generation (MMGD). | ||||||||||||
| 46 |
| |
| EXHIBIT III - ENERGY MARKET> ENERGY FLOW |
| GWh | ||||||||||||
| Energy Flow | COPEL DIS | COPEL GET + FDA + BELA VISTA | EÓLICAS | COPEL COM | ELIMINAÇÕES | CONSOLIDADO | ||||||
| 9M25 | 9M24 | 9M25 | 9M24 | 9M25 | 9M24 | 9M25 | 9M24 | 9M25 | 9M24 | 9M25 | 9M24 | |
| Own Generation | — | — | 13,435 | 18,087 | 2,473 | 2,412 | — | — | — | 15,908 | 20,499 | |
| Purchased energy | 17,496 | 18,232 | 2,381 | 729 | 387 | 201 | 20,539 | 17,383 | 12,213 | 11,118 | 28,590 | 25,427 |
| Copel Comercialização | — | — | 1,120 | 414 | 387 | 190 | — | — | 1,507 | 604 | — | — |
| Companies of the group | 214 | 184 | — | — | — | — | 10,492 | 10,330 | 10,706 | 10,514 | — | — |
| Itaipu | 3,323 | 3,414 | — | — | — | — | — | — | — | — | 3,323 | 3,414 |
| Auction – CCEAR | 9,889 | 10,480 | — | — | — | — | — | — | — | — | 9,889 | 10,480 |
| CCEE (MCP) | — | 245 | — | — | — | — | 11 | — | — | — | 11 | 245 |
| Angra | 634 | 641 | — | — | — | — | — | — | — | — | 634 | 641 |
| CCGF | 2,388 | 2,914 | — | — | — | — | — | — | — | — | 2,388 | 2,914 |
| Proinfa | 275 | 315 | — | — | — | — | — | — | — | — | 275 | 315 |
| Other (1) | 773 | 39 | 229 | — | — | 11 | 9,969 | 7,053 | — | — | 10,971 | 7,103 |
| Elejor | — | — | — | — | 0 | 0 | — | — | — | — | — | 0 |
| Dona Francisca | — | — | 33 | 100 | 0 | 0 | 67 | — | — | — | 100 | 100 |
| MRE Receipt | — | — | 999 | 215 | 0 | 0 | — | — | — | — | 999 | 215 |
| Avaiable | 17,496 | 18,232 | 15,816 | 18,816 | 2,860 | 2613 | 20,539 | 17,383 | 12,216 | 11,118 | 44,495 | 45,926 |
| Captive Market | 15,050 | 16,010 | — | — | — | — | — | — | — | — | 15,050 | 16,010 |
| Concessionaires (2) | 27 | 67 | — | — | — | — | — | — | — | — | 27 | 67 |
| CCEE concessionaire supply (3) | — | — | 134 | 128 | — | — | — | — | — | — | 134 | 128 |
| CCEE (MCSD EN Assignments) (4) | 1,139 | 602 | — | — | — | — | — | — | — | — | 1139 | 602 |
| CCEE (MVE) (5) | — | — | — | — | — | — | — | — | — | — | — | — |
| CCEE (MCP) (6) | 1,909 | 853 | (472) | 341 | (40) | (89) | 130 | 124 | — | — | 1527 | 1,229 |
| Free Customers | — | — | — | — | — | — | 7,264 | 7,982 | — | — | 7,264 | 7,982 |
| Bilateral Agreements | — | — | 622 | 4 | 477 | 419 | 11,440 | 8,673 | — | — | 12,539 | 9,096 |
| Auction CCEAR (7) | — | — | 1,604 | 1,736 | 1,997 | 1,852 | 197 | — | — | — | 3,798 | 3588 |
| MRE assignment (8) | — | — | 3,726 | 6,499 | — | — | — | — | — | — | 3,726 | 6,499 |
| CER (9) | — | — | — | — | 683 | 694 | — | — | — | — | 683 | 694 |
| Copel Comercialização | — | — | 10,087 | 10,015 | 406 | 315 | — | — | 10,493 | 10,330 | — | — |
| Companies of the group | — | — | 115 | 93 | 100 | 92 | 1,508 | 604 | 1,723 | 788 | 0 | 1 |
| Losses and Differences (10) | (629) | 700 | — | — | (763) | (670) | — | — | — | — | -1392 | 30 |
| (1) Others: Energy purchased by Copel Comercialização. Includes MCSD EM Assignments of Copel Distribuição (purchase). | ||||||||||||
| (2) Energy supply to concessionaires and licensees with their own market below 500GWh/year. | ||||||||||||
| (3) Supply of energy to CCEE's agent distributor, through a Regulated Bilateral Contract Agreement - CBR. | ||||||||||||
| (4) Assignments MCSD EN - Contractual assignments to other distributors through the New Energy Surplus and Deficit Compensation Mechanism. | ||||||||||||
| (5) CCEE (MVE): Financial settlement of energy surpluses from the distributor to the free market through the Surplus Sale Mechanism. | ||||||||||||
| (6) CCEE (MCP): Electric Energy Commercialization Chamber (Spot Market). | ||||||||||||
| (7) CCEAR: Energy Trading Agreement in the Regulated Environment. | ||||||||||||
| (8) MRE: Energy Reallocation Mechanism. | ||||||||||||
| (9) CER: Reserve Energy Contract. | ||||||||||||
| (10) Considers the effects of Mini and Micro Distributed Generation (MMGD). | ||||||||||||
| 47 |
| |
| EXHIBIT III - ENERGY MARKET> ENERGY FLOW |
| ENERGY FLOW CONSOLIDATED 3Q25 | ENERGY FLOW CONSOLIDATED 3Q25 | |||||||||||||||||||||||
| GWh | GWh | |||||||||||||||||||||||
| Own Generation | Captive Market | Own Generation | Captive Market | |||||||||||||||||||||
| 5,328 | 34.6% | 4,625 | 30.0% | 15,908 | 35.8% | 15,050 | 33.8% | |||||||||||||||||
| Concessionaires2 | Concessionaires2 | |||||||||||||||||||||||
| 8 | —% | 27.00 | 0.1% | |||||||||||||||||||||
| Electricity sales to distributor CCEE3 | Electricity sales to distributor CCEE3 | |||||||||||||||||||||||
| 42 | 0.3% | 134.00 | 0,3% | |||||||||||||||||||||
| Assignment MCSD EN4 | Assignment MCSD EN4 | |||||||||||||||||||||||
| 556 | 3.6% | 1,139.00 | 2.6% | |||||||||||||||||||||
| Total Available Power | Total Available Power | |||||||||||||||||||||||
| 15,414 | CCEE (MVE) | 44,495 | CCEE (MVE) | |||||||||||||||||||||
| 0 | 0.0% | 0.00 | 0% | |||||||||||||||||||||
| Free Customers | Free Customers | |||||||||||||||||||||||
| Purchased energy | 2,519 | 16.3% | Purchased energy | 7,264.00 | 16.3% | |||||||||||||||||||
| 10086 | 65.4 % | 28,590.000 | 64.30% | |||||||||||||||||||||
| CCEAR: | 3,315 | Supplied Energy | CCEAR: | 9,889 | Supplied Energy | |||||||||||||||||||
| Itaipu: | 1,120 | 8,100 | 52.5 % | Itaipu: | 3,323 | 22,273.00 | 50.1 % | |||||||||||||||||
| Dona Francisca: | 34 | Contratos Bilaterais | 4,593 | Dona Francisca: | 100 | Contratos Bilaterais | 12,539 | |||||||||||||||||
| CCEE (MCP): | 0 | CCEAR: | 1,241 | CCEE (MCP): | 11 | CCEAR: | 3,798 | |||||||||||||||||
| Angra: | 214 | CER: | 230 | Angra: | 634 | CER: | 683 | |||||||||||||||||
| CCGF: | 770 | CCEE (MCP): | 365 | CCGF: | 2,388 | CCEE (MCP): | 1,527 | |||||||||||||||||
| MRE: | 0 | MRE: | 1,671 | MRE: | 999 | MRE: | 3,726 | |||||||||||||||||
| Elejor: | 0 | Elejor: | 0 | |||||||||||||||||||||
| Proinfa: | 93 | Losses and Differences | Proinfa: | 275 | Losses and Differences | |||||||||||||||||||
| Outros1: | 4,540 | -436 | -2.8% | Outros1: | 10,971 | -1,392 | -3.1% | |||||||||||||||||
| Notes: | ||||||||||||||||||||||||
| CCEAR: Energy Purchase Agreements in the Regulated Market. | ||||||||||||||||||||||||
| CER: Reserve Energy Agreements. | ||||||||||||||||||||||||
| CCEE (MCP): Electric Power Trade Chamber (Short-term market). | ||||||||||||||||||||||||
| MRE: Energy Reallocation Mechanism. | ||||||||||||||||||||||||
| CG: Center of gravity of the Submarket (difference between billed and energy received from CG). | ||||||||||||||||||||||||
| ¹ Other: Energy purchased by Copel Comercialização and Copel Distribuição | ||||||||||||||||||||||||
| 2 Electricity sales to concessionaries and licensees with own market of less than 500GWh/year | ||||||||||||||||||||||||
| 3 Eletricity sales to the agent distributor of CCEE through a Regulated Bilateral Contract - CBR | ||||||||||||||||||||||||
| 4 Assignments MCSD EN - Contractual assignments to other distributors through the Mechanism for Compensation of Surpluses and Deficits (MCSD) | ||||||||||||||||||||||||
| 5 Considers the effect of Distributed Mini and Microgeneration (MMGD) | ||||||||||||||||||||||||
| 6 Considers losses and the volume of energy not delivered, referring to availability contracts, which provide for subsequent reimbursement. | ||||||||||||||||||||||||
| 48 |
 |
| EXHIBIT IV - OPERATIONAL DATA > INDICATORS SUMMARY |
| MANAGEMENT | ||||||
| Copel Staff List | 2020 | 2021 | 2022 | 2023 | 2024 | Sep-25 |
| Geração e Transmissão | 1,533 | 1,523 | 1,487 | 1,477 | 1,091 | 1,046 |
| Distribuição | 4,641 | 4,430 | 4,257 | 4,203 | 3,199 | 3,092 |
| Telecomunicações | 355 | — | — | — | — | — |
| Holding | 96 | 169 | 84 | 83 | 60 | 54 |
| Comercialização | 42 | 44 | 47 | 41 | 39 | 47 |
| Serviços | — | — | 217 | — | — | — |
| TOTAL | 6,667 | 6,166 | 6,092 | 5,804 | 4,389 | 4,239 |
| Cotrolated Staff List | 2020 | 2021 | 2022 | 2023 | 2024 | Sep-25 |
| Elejor | 7 | 7 | 7 | 7 | 7 | 11 |
| GENERATION | ||||||
| Copel GET | Amount | Installed Capacity (MW) | Assured Power (Average MW) | |||
| Hydroelectric | 7 | 4,833.3 | 1,990.3 | |||
| Wind | 42 | 1,127.9 | 560.9 | |||
| Copel GET (Interest) | Proportional installed capacity (MW) | Proporcional Assured Power (Average MW) | ||||
| Hydroelectric | 1 | 10.4 | 7.3 | |||
| Total Copel GET | 5,971.6 | 2,558.5 | ||||
| Other Interest Copel | Proportional installed capacity (MW) | Proporcional Assured Power (Average MW) | ||||
| Hydroelectric | 5 | 201.3 | 109.7 | |||
| Wind | 4 | 53.2 | 28.0 | |||
| Solar | 1 | 1.1 | — | |||
| Total Other Interest | 10 | 255.6 | 137.7 | |||
| TOTAL Copel Group | 6,227.2 | 2,696.2 | ||||
| TRANSMISSION | ||||||
| Copel GeT | Amount | APR (R$ million) | ||||
| Transmission Lines (km) | 4,591 | 1,423.9 | ||||
| Substation (amount) | 46 | |||||
| Interest | Amount | Proporcional APR (R$ million) | ||||
| Transmission Lines (km) | 5,093 | 387.4 | ||||
| Substation (amount) | 7 | |||||
| TOTAL | TL | 9,684 | 1,811.3 | |||
| Substation | 53 | |||||
| DISTRIBUTION | ||||||
| Distribution lines (km) | 217,385 | Captive customers | 5,250,309 | |||
| Substations | 406 | Customers by distribution employee | 1,622 | |||
| Installed power substations (MVA) | 12,574 | DEC (in hundredths of an hour and minute) | 7.46 | |||
| Municipalities served | 395 | FEC (number of outages) | 4.90 | |||
| Locations served | 1,068 | |||||
| MERCADO LIVRE | ||||||
| Number of contracts | 1,758 | |||||
| Energy sold (GWh) | 7,270 | |||||
| 49 |
| |
| EXHIBIT IV - OPERATIONAL DATA > GENERATION |
| COPEL GET | ||||
| Installed Capacity (MW) | Assured Power (Average MW) | Generation 3Q25 (GWh)* | Concession Expires | |
| Hydroelectric Power Plants | 4,833.3 | 1,990.3 | 12,682.3 | |
| Large hydroelectric power plant (HPP) | 4,797.0 | 1,965.8 | 12,562.9 | |
| Gov. Bento Munhoz da Rocha Netto (Foz do Areia - FDA) | 1,676.0 | 567.6 | 3,286.5 | 20.11.2054 |
| Gov. Ney Aminthas de B. Braga (Segredo) | 1,260.0 | 552.8 | 3,901.4 | 21.11.2054 |
| Gov. José Richa (Salto Caxias) | 1,240.0 | 553.3 | 3,882.8 | 21.11.2054 |
| Gov. Parigot de Souza (GPS) (1) | 260.0 | 103.6 | 678.2 | 06.01.2053 |
| - Regime de Cotas (70%) | 182.0 | 72.5 | 474.7 | |
| - Copel GeT(30%) | 78.0 | 31.1 | 203.5 | |
| HPP Gov. Jayme Canet Junior (Mauá) (2) | 361.0 | 188.5 | 814.0 | 28.06.2049 |
| Small hydroelectric power station (SHP) | 36.3 | 24.5 | 119.4 | |
| Bela Vista | 29.8 | 18.6 | 83.5 | 08.03.2041 |
| Derivação do Rio Jordão ** | 6.5 | 5.9 | 35.9 | 21.06.2032 |
| Wind Power Plants | 1,127.9 | 560.9 | 2,474.1 | |
| São Bento Energia, Invest. e Part. S.A. | 94.0 | 38.1 | 170.1 | |
| GE Boa Vista S.A. | 14.0 | 5.2 | 21.2 | 28.04.2046 |
| GE Farol S.A. | 20.0 | 8.8 | 36.8 | 20.04.2046 |
| GE Olho D’Água S.A. | 30.0 | 12.8 | 58.3 | 01.06.2046 |
| GE São Bento do Norte S.A. | 30.0 | 11.3 | 53.8 | 19.05.2046 |
| Copel Brisa Potiguar S.A. | 183.6 | 89.4 | 347.4 | |
| Nova Asa Branca I Energias Renováveis S.A. | 27.0 | 12.1 | 49.3 | 25.04.2046 |
| Nova Asa Branca II Energias Renováveis S.A. | 27.0 | 11.9 | 48.5 | 31.05.2046 |
| Nova Asa Branca III Energias Renováveis S.A. | 27.0 | 12.3 | 41.8 | 31.05.2046 |
| Nova Eurus IV Energias Renováveis S.A. | 27.0 | 12.4 | 48.7 | 27.04.2046 |
| Santa Maria Energias Renováveis S.A. | 29.7 | 15.7 | 57.7 | 08.05.2047 |
| Santa Helena Energias Renováveis S.A. | 29.7 | 16.0 | 68.3 | 09.04.2047 |
| Ventos de Santo Uriel S.A. | 16.2 | 9.0 | 33.1 | 09.04.2047 |
| Cutia | 180.6 | 71.4 | 316.9 | |
| UEE Cutia S.A. | 23.1 | 9.6 | 46.3 | 05.01.2042 |
| UEE Esperança do Nordeste S.A. | 27.3 | 9.1 | 42.8 | 11.05.2050 |
| UEE Guajiru S.A. | 21.0 | 8.3 | 33.4 | 05.01.2042 |
| UEE Jangada S.A. | 27.3 | 10.3 | 55.0 | 05.01.2042 |
| UEE Maria Helena S.A. | 27.3 | 12.0 | 51.6 | 05.01.2042 |
| UEE Paraíso dos Ventos do Nordeste S.A. | 27.3 | 10.6 | 42.5 | 11.05.2050 |
| UEE Potiguar S.A. | 27.3 | 11.5 | 45.3 | 11.05.2050 |
| Bento Miguel | 132.3 | 58.7 | 235.9 | |
| CGE São Bento do Norte I S.A. | 23.1 | 10.1 | 44.3 | 04.08.2050 |
| CGE São Bento do Norte II S.A. | 23.1 | 10.8 | 49.3 | 04.08.2050 |
| CGE São Bento do Norte III S.A. | 23.1 | 10.2 | 40.9 | 04.08.2050 |
| CGE São Miguel I S.A. | 21.0 | 9.3 | 36.9 | 04.08.2050 |
| CGE São Miguel II S.A. | 21.0 | 9.1 | 32.0 | 04.08.2050 |
| CGE São Miguel III S.A. | 21.0 | 9.2 | 32.5 | 04.08.2050 |
| Vilas | 186.9 | 98.6 | 399.0 | |
| Vila Ceará I (Antiga Vila Paraíba IV) | 32.0 | 17.8 | 69.7 | 14.01.2054 |
| Vila Maranhão I | 32.0 | 17.8 | 70.0 | 11.01.2054 |
| Vila Maranhão II | 32.0 | 17.8 | 70.1 | 14.01.2054 |
| Vila Maranhão III (Antiga Vila Paraíba III) | 32.0 | 16.6 | 69.4 | 14.01.2054 |
| Vila Mato Grosso (Antiga Vila Alagoas III) | 58.9 | 28.6 | 119.8 | 06.12.2054 |
| Jandaira | 90.1 | 46.9 | 199.6 | |
| Jandaira I | 10.4 | 5.6 | 26.3 | 02.04.2055 |
| Jandaira II | 24.3 | 12.3 | 55.4 | 02.04.2055 |
| Jandaira III | 27.7 | 14.8 | 56.2 | 02.04.2055 |
| Jandaira IV | 27.7 | 14.2 | 61.7 | 02.04.2055 |
| Aventura | 105.0 | 65.0 | 304.0 | |
| Aventura II | 21.0 | 13.1 | 62.2 | 06.05.2053 |
| Aventura III | 25.2 | 15.5 | 72.5 | 06.11.2053 |
| Aventura IV | 29.4 | 18.5 | 85.2 | 06.05.2053 |
| Aventura V | 29.4 | 17.9 | 84.1 | 06.05.2053 |
| Santa Rosa e Mundo Novo | 155.4 | 92.8 | 501.2 | |
| Santa Rosa e Mundo Novo I | 33.6 | 17.3 | 91.2 | 06.04.2053 |
| Santa Rosa e Mundo Novo II | 29.4 | 17.2 | 105.4 | 06.04.2053 |
| Santa Rosa e Mundo Novo III | 33.6 | 21.5 | 117.1 | 06.04.2053 |
| Santa Rosa e Mundo Novo IV | 33.6 | 21.0 | 115.4 | 06.01.2053 |
| Santa Rosa e Mundo Novo V | 25.2 | 15.8 | 72.1 | 06.01.2053 |
| TOTAL | 5,961.2 | 2,551.2 | 15,156.4 | |
|
(1) The Annual Generation Revenue (RAG), totaling R$176.6 million, was updated by ANEEL’s Homologatory Resolution No. 3,506, dated July 22, 2025. A PIS/Cofins rate of 9.25% applies to this amount. However, it is important to note that, as established by ANEEL regulations, the RAG already includes the pass-through of these federal taxes to the beneficiary distribution companies. (2) Power plants exempted from concession, are only registered with ANEEL. * Considers internal consumption of generators and generation in commercial operation. ** Plant do not participate in the MRE. | ||||
| 50 |
| |
| EXHIBIT IV - OPERATIONAL DATA > GENERATION |
| INTEREST | ||||||
| Enterprise | Partners | Installed Capacity (MW) | Assured Power ¹ (Average MW) | Proportional installed capacity (MW) | Proporcional Assured Power (Average MW) | Concession Expires |
| Hydroelectric Power Plants | 400.6 | 225.9 | 211.7 | 117.2 | ||
| Large hydroelectric power plant (HPP) | 365.4 | 200.6 | 197.1 | 106.4 | ||
|
HPP Santa Clara (Elejor) |
COPEL - 70% Paineira Participações - 30% |
120.2 | 66.0 | 84.2 | 46.2 | 10.05.2040 |
|
HPP Fundão (Elejor) |
COPEL - 70% Paineira Participações - 30% |
120.2 | 62.1 | 84.1 | 43.5 | 06.11.2040 |
|
HPP Dona Francisca (DFESA) |
COPEL - 23,03% Gerdau - 53,94% Celesc - 23,03% |
125.0 | 72.5 | 28.8 | 16.7 | 09.21.2037 |
| Small hydroelectric power station (SHP) | 29.1 | 20.4 | 10.4 | 7.3 | ||
|
SHP Arturo Andreoli 5 (Foz do Chopim) |
COPEL GeT - 35,77% Silea Participações - 64,23% |
29.1 | 20.4 | 10.4 | 7.3 | 07.07.2034 |
| Hydroelectric Generating Centers (CGH) | 6.1 | 4.9 | 4.2 | 3.5 | ||
|
CGH Santa Clara I (Elejor) |
COPEL - 70% Paineira Participações - 30% |
3.6 | 2.8 | 2.5 | 2.0 | (2) |
|
CGH Fundão I (Elejor) |
COPEL - 70% Paineira Participações - 30% |
2.5 | 2.1 | 1.7 | 1.5 | (2) |
| Wind Power Plants | 108.5 | 57.1 | 53.2 | 28.0 | ||
| Voltalia - São Miguel do Gostoso (4 parques) |
COPEL- 49% Voltalia- 51% |
108.5 | 57.1 | 53.2 | 28.0 | (3) |
| Solar | 2.3 | — | 1.1 | — | ||
| Solar Paraná 4 |
COPEL - 49% Sistechne Participações Societárias Ltda. - 51% |
2.3 | — | 1.1 | — | 09.15.2046 |
| TOTAL | 511.4 | 283.0 | 1,391.9 | 145.2 | ||
| ¹ Assured power updated by Ordinance No. 709/2022 of: HPP Mauá, Santa Clara, Fundão and Dona Francisca. | ||||||
| ² Elejor requested the reclassification of its Small Hydroelectric Power Plants - (SHPs) Fundão I and Santa Clara I to Hydroelectric Generating Centers (CGHs), as amended by Art. 8 of Law 9074/1995. This was formalized through ANEEL Authorizing Resolutions 14,744 and 14,745 of 06/20/2023, with the plants exempted from concession, having only registration with ANEEL. | ||||||
| ³ The Concession Expires of the wind farm concessions are respectively: Carnaúbas (04.09.2047), Reduto (04.16.2047), Santo Cristo (04.18.2047), São João (03.26.2047). | ||||||
| ⁴ Holding of 6 SCPs operating in the field of distributed generation (photovoltaic plants): Pharma Solar II, Pharma Solar III, Pharma Solar IV, in commercial operation, e Bandeirantes Solar I, Bandeirantes Solar II e Bandeirantes Solar III, in pre-operational. | ||||||
| ⁵ Extension of Grant according to REH 3.242/2023. | ||||||
| 51 |
| |
| EXHIBIT IV - OPERATIONAL DATA > TRANSMISSION |
| Subsidiary / SPC | Contract | Enterprise | UF | TL | APR ¹ (R$ milhões) | Adjustment installment (R$ millions) | Concession Expiration | ||
| Extension (km)2 | Substation | MVA | |||||||
| Copel GeT | 060/2001 | Several | SP/PR | 2,129 | 35 | 13,015 | 663.6 | 01.11.1900 | 01.01.2043 |
| Copel GeT | 075/2001 | TL Bateias - Jaguariaiva | PR | 137 | — | — | 18.2 | -0.5 | 08.17.2031 |
| Copel GeT | 006/2008 | TL Bateias - Pilarzinho | PR | 32 | — | — | 3.1 | 0.1 | 03.17.2038 |
| Copel GeT | 027/2009 | TL Foz - Cascavel Oeste | PR | 117 | — | — | 16.9 | -0.5 | 11.19.2039 |
| Copel GeT | 010/2010 | TL Araraquara II — Taubaté | SP | 334 | — | — | 47.7 | -1.3 | 06.10.2040 |
| Copel GeT | 015/2010 | SE Cerquilho III | SP | — | 1 | 300 | 7.7 | -0.4 | 06.10.2040 |
| Copel GeT | 022/2012 | TL Foz do Chopim - Salto Osório LT Londrina - Figueira |
PR | 102 | — | — | 8.5 | -0.3 | 08.27.2042 |
| Copel GeT | 002/2013 | TL Assis — Paraguaçu Paulista II | SP | 83 | 1 | 150 | 12.3 | -2.3 | 02.25.2043 |
| Copel GeT | 005/2014 | TL Bateias - Curitiba Norte | PR | 31 | 1 | 300 | 14.0 | -0.8 | 01.29.2044 |
| Copel GeT | 021/2014 | TL Foz do Chopim - Realeza | PR | 52 | 1 | 300 | 16.2 | 1.6 | 05.09.2044 |
| Copel GeT | 022/2014 | TL Assis – Londrina | SP/PR | 122 | — | — | 28.1 | -1.1 | 05.09.2044 |
| Copel GeT | 006/16 | Lot E: TL Baixo Iguaçu - Realeza; TL Uberaba - Curitiba Centro; TL Curitiba Leste - Blumenau; SE Medianeira; SE Curitiba Centro; SE Andirá leste; Other Sections | PR | 255 | 4 | 900 | 169.4 | -5.2 | 07.04.2046 |
|
Costa Oeste Copel Get - 100% |
001/2012 |
TL Cascavel Norte - Cascavel Oeste TL Cascavel Norte - Umuarama Sul SE Umuarama Sul |
PR | 159 | 1 | 300 | 20.7 | -0.6 | 12.01.2042 |
|
Marumbi Copel GeT - 100% |
008/2012 | TL Curitiba - Curitiba Leste | PR | 29 | 1 | 672 | 29.9 | -1 | 10.05.2042 |
|
Uirapuru Transmissora Copel GeT - 100% |
002/2005 | TL Ivaiporã - Londrina | PR | 122 | — | — | 28.9 | -1 | 04.03.2035 |
|
Mata de Santa Genebra³ Copel GeT - 100% |
001/14 | TL Araraquara II - Bateias | SP/PR | 887 | 1 | 3,600 | 338.7 | -10.7 | 05.14.2044 |
| Subtotal Copel GeT | 4,591 | 46 | 19,537 | 1423.9 | -11.7 | ||||
|
Caiuá Transmissora Copel GeT - 49% Elecnor - 51% |
007/2012 |
TL Guaíra - Umuarama Sul TL Cascavel Norte - Cascavel Oeste SE Santa Quitéria / SE Cascavel Norte |
PR | 142 | 2 | 700 | 17.9 | -0.3 | 10.05.2042 |
|
Integração Maranhense Copel GeT - 49% Elecnor - 51% |
011/2012 | TL Açailandia - Miranda II | MA | 365 | 0 | 0 | 27.0 | -0.9 | 10.05.2042 |
|
Matrinchã Copel GeT - 49% State Grid - 51% |
012/2012 | TL Paranaíta - Ribeirãozinho | MT | 2,033 | 4 | 800 | 146.2 | -4.7 | 10.05.2042 |
|
Guaraciaba Copel GeT - 49% State Grid - 51% |
013/2012 | TL Ribeirãozinho - Marimbondo | GO/MG | 930 | 1 | — | 75.5 | -2.7 | 10.05.2042 |
|
Paranaíba Copel GeT - 24,5% Furnas - 24,5% State Grid - 51% |
007/2012 | TL Barreiras II - Pirapora II | GO/MG | 967 | — | — | 50.2 | -1.8 | 02.05.2043 |
|
Cantareira Copel GeT - 49% Elecnor - 51% |
19/2014 | TL Estreito - Fernão Dias | MG/SP | 656 | 0 | 0 | 70.6 | -2.4 | 05.09.2044 |
| Subtotal SPCs 4 | 5,093 | 7 | 1,500 | 387.4 | -12.80 | ||||
| Total | 9,684 | 53 | 21,037 | 1,811.3 | -24.50 | ||||
|
1 Proportional to Copel's interest in the project. Values referring to the 2025/2026 cycle, effective from July 1, 2025, according to REH 3.481/2025. RAP values consider Active RAP, which is the portion of RAP referring to assets in operation at the beginning of the tariff cycle. ² Considers double circuit sections (circuits that share the same transmission tower). ³ Transmission line in the process of consolidation, according to Material Fact 03/25. 4 Equity Income.
| |||||||||
| 52 |
| |
| EXHIBIT IV - OPERATIONAL DATA > DISTRIBUTION |
| OPERATIONAL DATA | ||||||
| Number of Consumers | Locations served | Cities served | Voltage | Number of Substations | MVA | Km of lines |
| 5,257,290 | 1,068 | 395 | 13,8 kV | — | — | 115,533 |
| 34,5 kV | 237 | 1,815 | 93,667 | |||
| 69 kV | 36 | 2,519 | 755 | |||
| 88 kV | 0 | 5 | — | |||
| 138 kV | 133 | 8,235 | 7,430 | |||
| 406 | 12,574 | 217,385 | ||||
| Consumer-to-employee ratio DIS | 2020 | 2021 | 2022 | 2023 | 2024 | set/25 |
| Captive Consumers | 4,835,852 | 4,926,608 | 5,011,555 | 5,098,006 | 5,184,322 | 5,250,309 |
| Copel Dis employees | 4,641 | 4,430 | 4,257 | 4,257 | 3,199 | 3,092 |
| Consum/Emp | 1,042 | 1,112 | 1,177 | 1,198 | 1,621 | 1,698 |
| QUALITY OF SUPPLY | ||||||
| Year | DEC ¹ (hours) | FEC ² (outages) | ||||
| 2020 | 7.83 | 5.61 | ||||
| 2021 | 7.47 | 5.09 | ||||
| 2022 | 7.96 | 5.10 | ||||
| 2023 | 7.97 | 5.41 | ||||
| 2024 | 7.92 | 5.36 | ||||
| Sep-25 | 7.46 | 4.90 | ||||
|
¹ DEC measured in hours and hundredths of an hour ² FEC expressed in number of interruptions and hundredths of a number of interruptions year to date * Values of the last 12 months |
||||||
| Period | Technical Loss | Non-Technical Loss | Total loss | |||
| Regulatory (1) | Real (2) | Regulatory (3) | Calculated (4) | Regulatory (5) | Total (6) | |
| Sep-21 | 5.79 % | 5.91 % | 4.47 % | 4.48 % | 7.71 % | 7.71 % |
| Sep-22 | 5.79 % | 5.73 % | 4.47 % | 4.22 % | 7.63 % | 7.53 % |
| Sep-23 | 5.79 % | 5.85 % | 4.47 % | 4.71 % | 7.57 % | 7.67 % |
| Sep-24 | 5.79 % | 5.68 % | 4.47 % | 5.33 % | 7.57 % | 7.91 % |
| Sep-25 | 5.79 % | 5.75 % | 5.29 % | 3.41 % | 8.15 % | 7.31 % |
| (1) Percentage established in the tariff review; | ||||||
| (2) Technical loss calculated and reported monthly to Aneel; | ||||||
| (3) Percentage established in the tariff review; | ||||||
| (4) Difference between reported total losses and technical losses calculated as a percentage established in the review and the total injected energy, also reported monthly to Aneel; | ||||||
| (5) (Regulatory percentage of PNT x informed BT Market + technical losses calculated as a percentage established in the review and the total energy injected) / Injected energy; | ||||||
| (6) Total loss on injected energy. | ||||||
| NOTE: In the calculation of the distributor's total losses, energy losses inherent to the electric power system (technical losses), commercial losses (mainly due to fraud, theft) and differences related to the shift in the billing schedule and the effects of the portion of mini and micro generation distributed in the Company's network | ||||||
| 53 |

SIGNATURE
Pursuant to the requirements of the Securities Exchange Act of 1934, the registrant has duly caused this report to be signed on its behalf by the undersigned, thereunto duly authorized.
Date November 12, 2025
| COMPANHIA PARANAENSE DE ENERGIA – COPEL | ||
| By: |
/S/ Daniel Pimentel Slaviero |
|
| Daniel Pimentel Slaviero Chief Executive Officer |
||
FORWARD-LOOKING STATEMENTS
This press release may contain forward-looking statements. These statements are statements that are not historical facts, and are based on management's current view and estimates of future economic circumstances, industry conditions, company performance and financial results. The words "anticipates", "believes", "estimates", "expects", "plans" and similar expressions, as they relate to the company, are intended to identify forward-looking statements. Statements regarding the declaration or payment of dividends, the implementation of principal operating and financing strategies and capital expenditure plans, the direction of future operations and the factors or trends affecting financial condition, liquidity or results of operations are examples of forward-looking statements. Such statements reflect the current views of management and are subject to a number of risks and uncertainties. There is no guarantee that the expected events, trends or results will actually occur. The statements are based on many assumptions and factors, including general economic and market conditions, industry conditions, and operating factors. Any changes in such assumptions or factors could cause actual results to differ materially from current expectations.