SECURITIES AND EXCHANGE COMMISSION
Washington, D.C. 20549
FORM 6-K
Report of Foreign Private Issuer
Pursuant to Rule 13a-16 or 15d-16 of the
Securities Exchange Act of 1934
For the month of May, 2026
Commission File Number 1-14668
COMPANHIA PARANAENSE DE ENERGIA
(Exact name of registrant as specified in its charter)
Energy Company of Paraná
(Translation of Registrant's name into English)
José Izidoro Biazetto, 158
81200-240 Curitiba, Paraná
Federative Republic of Brazil
+55 (41) 3331-4011
(Address of principal executive offices)
Indicate by check mark whether the registrant files or will file annual reports under cover Form 20-F or Form 40-F. Form 20-F ___X___ Form 40-F _______
Indicate by check mark whether the registrant by furnishing the information contained in this Form is also thereby furnishing the information to the Commission pursuant to Rule 12g3-2(b) under the Securities Exchange Act of 1934.
Yes _______ No ___X____
RESULTS 1Q26 │ Highlights 1Q26 Operational and Commercial Performance Financial results Shareholder returns Gains from modulation and submarkets, resulting from an efficient commercial strategy Sales: -11.7% 5,275 GWh DisCo's billed grid market grew by +2.1% Significant results in revenue generation, even in the face of a challenging scenario: - GSF: 92.0% - Curtailment: 20.7% - PLD: R$ 359.40/MWh (vs. R$ 161.87 in 1Q25) Recurring Ebitda R$ 1,754.6 milhões +16.7% vs.1Q25 Recurring Net Income R$ 638.9 milhões +10.7% vs. 1Q25 Capex of R$ 681,6 million in 1Q26 Indebtedness: leverage of 2,8x net debt to Ebitda as of March 31, 2026 Interest on Equity R$ 706 million (R$ 0.2377 per share) Dividend Payment R$ 1.35 billion to be paid in June 30, 2026, relating to the dividends announced in December 2025 ESG Dow Jones Best in Class Index Copel Joins the DJ BIC Portfolio │Financial Indicators R$ million Key Financial Highlights 1Q26 1Q25 Δ% EBITDA (R$ million) 1,907.90 1,736.5 9.9 Recurring Ebitda (R$ million) 1,754.6 1,503.2 16.7 Net profit (R$ million) 694.0 664.7 4.4 Recurring Net Income (R$ million) 638.9 576.9 10.7 EPS - Earnings per share (R$)¹ 0.23 0.20 15.0 Interest on Equity 2.9% 2.5% 16.0 Ebitda margin 27.0% 29.5% '-2,5p.p Recurring Ebitda Margin 25.4% 25.9% -0,5 p.p Recurring Operating Margin 14.7% 16.1% -1.4 p.p Book value per share (R$) 8.01 7.78 3.0 Equity-to-Debt Ratio 73.4% 70.6% 4.0 Current Liquidity 1.4 1.5 (6.7) Leverage 2,8x 2,3x +0,5x ¹ Considers net income attributed to shareholders of the parent company Amounts subject to rounding. COPEL | 1Q26 | Access link COPEL | 1Q26 | │Summary 1 Consolidated Results 3 1.1 Ebitda 3 1.2 Operating Revenue 4 1.3 Operating costs and expenses 6 1.4 Equity Income Result 8 1.5 Financial Results 8 1.6 Consolidated Net Income 9 1.7 Debt and Leverage 10 2 Investiments 12 3 Copel Geração e Transmissão (GenCo)(Consolidated Result) 13 3.1 Economic and Financial Performance 13 3.1.1 IFRS effect on the Transmission segment 15 3.2 Operational Performance 16 3.2.1 Generation 17 3.2.3 Transmission 18 4 Strategy of Commercialization 20 4.1 Business Context 20 4.2 Business Performance 20 5 Copel Distribuição (DisCo) 23 5.1 Economic and Financial Performance 23 5.2 Operation Performance 26 5.2.1 Grid Market (TUSD) 26 5.2.2 Captive Market 26 5.2.3 Operational data 26 6 ESG performance 29 6.1 ESG in Copel's Strategy 29 6.2 Recents highlights 30 6.3 Indicators 30 6.4 Ratings, Rankings and Indexes 31 7 Other highlights from the period 32 COPEL | 1Q26 | 1 Consolidated Results The consolidated result consist of the combined operations of Copel (Holding), Copel Geração e Transmissão (GenCo), Copel Distribuição (DisCo), Copel Comercialização (TradeCo) and other equity holdings1. The following analyses refer to the first quarter of 2026 (1Q26) compared to the same period in 2025 (1Q25). 1.1 Ebitda Copel's recurring Ebitda2 amounted to R$ 1,754.6 million in 1Q26, a 16.7% increase compared to the R$ 1,503.2 million recorded in 1Q25. This result reflects the Company’s ability to consistently generate value, supported by the strength of its assets and the efficient execution of its operational and commercial strategy. Roughly speaking, GenCo and TradeCo together accounted for 57.2% of this result, while Copel DIS accounted for the remainder.3 Highlights for Q1 2026 include: I. GenCo's Ebitda growth of 30.7% (+R$ 240.6 million) compared to 1Q25, totaling R$ 1,023.7 million, resulting from the following factors: i. an increase in CCEE supply revenue, mainly due to the positive effects of transactions carried out in the Short-Term Market (MCP), particularly the adjustment of the hydroelectric generation portfolio in light of the behavior of the Settlement Price of Differences (PLD) in the Southern submarket during the period; ii. the increase in supply revenue from Bilateral Contracts, due to higher volumes and prices of energy sold, up 11.7% and 7.5%, respectively, between the periods; and iii. an increase in revenue from grid availability, explained primarily by the acquisition of Transmissora Mata de Santa Genebra S.A. (MSG) and an average 2.2% increase in the RAP of transmission companies wholly owned by our GenCo for the 2025/2026 cycle, excluding MSG. This result was partially offset by the increase in electricity purchased for resale, resulting from the combination of a lower GSF — which fell from 107.7% in 1Q25 to 92.0% in 1Q26 — and a higher level of curtailment, which rose from 8.8% to 20.7% in the same period, also impacting the increase in generation deviation at wind farms. Further details in section 3.1; II. the 10.0% increase in DisCo's Ebitda (+R$ 69.4 million) compared to 1Q25, resulting primarily from: i. 2.1% growth in the billed electricity market, reflecting increased economic activity in the concession area and growth in the customer base over the period; and ii. the Annual Tariff Adjustment (RTA) of June 2025, with an average effect of 1.3% on parcel B. Further details in section 4.1; and COPEL | 1Q26 | 3 Summary Results Investments GenCo TradeCo DisCo ESG Others Exhibits 1 Copel Serviços, Elejor, and other holdings in generation assets. 2 Excluding non-recurring items, mark-to-market (MTM) at Copel Comercialização, new replacement value due to the present value adjustment of the indemnifiable asset (VNR) at Copel Distribuição, equity method, and the effects of IFRS on transmission contract assets 3 The remaining segments include the Holding Company, Copel Serviços, Elejor, as well as Elimination and Reclassification adjustments. III. the R$ 8.0 million increase in Elejor’s Ebitda compared to 1Q25, driven by higher volumes of energy sold under bilateral contracts during the period and an increase in the average selling price; This result was partially offset by the impact of contracts for power generation from intermittent sources, which had an effect of approximately R$ 37.8 million in 1Q26 at TradeCo. The non-recurring items considered in the calculation of Recurring Ebitda are shown in the table below: R$ million Recurring Ebitda 1Q26 1Q25 Δ% Ebitda 1,907.9 1,736.5 9.9 (-/+) Fair value on purchase and sale of energy (48.0) (6.7) 616.4 (-/+) Provision/Reversal of severance pay 18.9 21.0 (10.0) (-/+) Disposal of assets / asset swap — (109.8) — (-/+) Equity equivalence (69.8) (100.4) (30.5) (-/+) New Replacement Value - NRV (20.1) (24.0) (16.3) (-/+) IFRS effect (Corporate/Regulatory Transmission Revenue (34.3) (13.4) 1.6 Recurring Ebitda 1,754.6 1,503.2 16.7 | Consolidated Recurring Ebitda (R$ million) '+R$251.4 million +16,7% W +1,503.2 +240.6 +69.4 +8.0 -66.6 1,754.6 Recurring Ebitda 1T25 Δ GenCo Δ DisCo Δ Elejor Δ Others* Recurring Ebitda 1T26 *Includes Ebitda from discontinued operations, Copel (Holding), Copel Serviços, Elejor and eliminations and reclassifications between group companies. 1.2 Operating Revenue Recurring Net Operating Revenue, including the effects of IFRS in the power transmission segment and excluding VNR, MTM, and non-recurring events, totaled R$ 6,909.1 million in 1Q26, a 19.2% COPEL | 1Q26 | 4 Summary Results Investments GenCo TradeCo DisCo ESG Others Exhibits increase compared to the R$ 5,797.4 million recorded in 1Q25. This result reflects, primarily, the following increases: I. R$ 714.1 million in the result from sector-specific financial assets and liabilities (CVA), a consequence of the application of rate-based cost coverage for Parcel A, particularly regarding energy purchased for resale and the refund of PIS/Cofins to DisCo's consumers during the period; II. R$ 538.5 million (+55.2%) in electricity supply revenue, with the following highlights: i. growth in GenCo's supply revenue, driven by the positive impact of transactions carried out in the Short-Term Market (MCP), notably the modulation of the hydroelectric generation portfolio and the increase in the average Settlement Price of Differences (PLD) for the Southern submarket, as well as the higher volume of energy sold (+11.7%) in bilateral contracts between periods; ii. a 9.0% increase in the volume of energy sold for TradeCo’s bilateral contracts. This result was partially offset by a 61.4% increase in generation deviation at wind farms due to higher curtailment in 1Q26; III. R$ 103.1 million (+5.4%) in higher revenue from GenCo’s grid availability, adjusted for the IFRS effect on the Transmission Companies, in the amount of R$ 93.3 million, explained mainly by the acquisition of the Mata de Santa Genebra - MSG Transmission Company and an average 2.2% increase in the RAP of the transmission companies wholly owned by Copel GeT for the 2025/2026 cycle, ex-MSG. This result was partially offset by a decrease: I. of R$ 196.0 million (-8.9%) in electricity supply revenue, due mainly to the lower volume sold to eligible consumers by TradeCo (-25.9%) and the effect of periodic rate adjustments that reduced the Energy Tariff - TE by 5.5% in the RTA/2025, partially offset by growth in revenue from subsidies for DisCo tariff discounts. II. in construction revenue by R$ 61.8 million (-10.6%), explained mainly by the reduction in the volume of construction projects related to DisCo's investment program. | Net operating revenue Energy sales to final consumers 28.9% Energy sales to distributors 21.9% Grid availability (TUSD/TUST) 29.3% Construction revenue 7.6% Result of the sectorial financial assets and liabilities 10.1% Other operating revenues 2.2% R$6,909.10 COPEL | 1Q26 | 5 Summary Results Investments GenCo TradeCo DisCo ESG Others Exhibits 1.3 Operating costs and expenses In 1Q26, recurring operating costs and expenses totaled R$ 5,557.6 million, an increase of 19.5% compared to the R$ 4,649.2 million recorded in 1Q25. The cost of electricity purchased for resale represents 55.8% of total costs incurred in the quarter, followed by PMSO at 13.2%, sector-specific charges at 12.8%, construction costs at 9.4%, and other costs at 8.8%. | Breakdown of Costs and Expenses Energy purchased for resale 55.8% Grid usage charges 12.8% PMSO 13.2% Depreciation and amortization 7.3% Provisions and reversals 1.5% Construction costs 9.4% R$5.557,6 mi The main changes during the period are: I. an increase of R$ 849.8 million (+37.7%) in Energy purchased for resale, resulting mainly from: i. an increase of R$ 539.5 million in energy purchases from DisCo, notably the acquisition of energy on the CCEE (+R$ 363.3 million) and the higher volume from the distributed generation system (+R$ 180.7 million); ii. the increase of R$ 303.6 million (+30.2%) at TradeCo due to the purchase of electricity under bilateral contracts; and iii. an increase of R$ 96.1 million in energy purchases by Copel GeT, primarily due to energy purchased under bilateral contracts from the hydro portfolio (+R$ 78.0 million) and energy procurement on the CCEE (short-term) for wind farms, as a result of higher curtailment during the period. II. an increase of R$ 48.0 million in depreciation and amortization due to a larger asset base resulting from growth in invested capital between periods, particularly at DisCo. III. the higher cost of electricity grid usage charges (+R$ 29.8 million), mainly related to the Basic Grid at DisCo. IV. an increase of R$ 27.5 million (+3.9%) in recurring managed costs (PMSO). V. a Growth in provisions and reversals (+R$ 15.1 million) due to higher PECLD at DisCo (+R$ 51.3 million), partially offset by a reduction in litigation (-R$ 38.0 million), specifically, civil and administrative (-R$ 22.9 million) and labor (-R$ 6.0 million). This result was partially offset by a R$ 61.8 million (-10.6%) decrease in construction costs due to lower capital invested in 1Q26. COPEL | 1Q26 | 6 Summary Results Investments GenCo TradeCo DisCo ESG Others Exhibits For recurring manageable costs (PMSO), the 3.9% increase stems from the following factors: i. a 15.6% rise (+R$ 35.5 million) in personnel expenses, driven by a 38.0% increase in provisions for variable compensation as a result of the Company’s operational performance, and the effect of the collective bargaining agreement — ACT 2025 — with a salary adjustment based on the National Consumer Price Index (INPC) of 5.01%; ii. a 9.4% increase (+R$ 10.3 million) in Other operating costs and expenses, notably equipment and software rentals (+R$ 9.5 million); iii. an 8.5% increase (+R$ 5.2 million) in social security and employee benefits; and iv. a 12.6% increase (+R$ 2.9 million) in material costs, primarily electrical components at GenCo. The PMSO result was partially offset by a 9.3% decrease (-R$ 26.3 million) in third-party services, lower costs for administrative facilities, communication and data transmission, and customer service and call center operations. The table below presents controllable costs with a comparison between quarters and year-to-date: R$ million Recurring Manageable Costs* 1Q26 1Q25 Δ% Staff and management 263.7 228.3 15.5 Social security and assistance plans 66.1 60.9 8.5 Material 25.9 23.0 12.6 Third-party services 256.0 282.3 (9.3) Other operating costs and expense 120.0 109.7 9.4 TOTAL 731.7 704.2 3.9 *Excludes the effects of the following non-recurring items: Personnel - Reversal/provision for Voluntary Dismissal Program; and Others - disposal/swap of assets. After neutralizing the effects of provisions related to the Performance Bonus (PPD), Profit Sharing (PLR), and Long-Term Incentives (ILP), there was an increase of R$ 7.6 million (+4.2%) in personnel and administrative costs in the quarterly comparison, an effect primarily driven by the collective bargaining agreement - ACT 2025, with a salary adjustment based on the National Consumer Price Index (INPC) of 5.01%, considering the 12-month period through September 2025. Excluding the effects of cumulative inflation as measured by the INPC, which stood at 3.8% between March 2025 and March 2026, personnel and management costs remained stable. R$ million Recurring Personnel Costs 1Q26 1Q25* Δ% Personnel and management 263.7 228.3 15.5 (-/+) Profit sharing, PPD, and ILP (73.2) (45.4) 61.2 TOTAL 190.5 182.9 4.2 COPEL | 1Q26 | 7 Summary Results Investments GenCo TradeCo DisCo ESG Others Exhibits | Evolution of the workforce 1.4 Equity Income Result The equity income from Copel’s jointly controlled entities and other associates in 1Q26 decreased by 30.5% compared to the same period of the previous year (R$ 69.8 million, compared to R$ 100.4 million recorded in 1Q25). The decline is mainly due to the 100% consolidation of the transmission company Mata de Santa Genebra S.A. - MSG, effective June 1, 2025, and to the decrease in the revaluation of contract assets in the transmission segment, caused by lower inflation in the quarters (IPCA of 1.92% vs. 2.04% in 1Q25). 1.5 Financial Results The financial result was a loss of R$ 489.7 million in 1Q26, compared to a loss of R$ 446.5 million recorded in 1Q25, a negative increase of R$ 43.0 million (+9.6%). This change stems mainly from the increase in debt service expenses, which totaled an additional R$ 129.2 million (+21.4%), reflecting, above all, the raising of funds to finance the Company’s investments. These effects were partially offset by a R$ 34.0 million increase in the remuneration and restatement of segment assets and liabilities and a R$ 21.3 million decrease in the monetary restatement of litigation. R$ million Financial Results 1Q26 1Q25 Δ% Financial Revenues 318.1 327.6 (2.9) Financial Expanses (825.5) (704.3) 17.2 Total Financial Result (507.4) (376.7) 34.7 COPEL | 1Q26 | 8 Summary Results Investments GenCo TradeCo DisCo ESG Others Exhibits 1.6 Consolidated Net Income Copel reported net income of R$ 694.0 million in 1Q26, compared to R$ 664.7 million in 1Q25, an increase of 4.4%, mainly due to improved operating performance with reported Ebitda of R$ 1,907.9 million (+9.9%), compared to Ebitda of R$ 1,736.5 million in 1Q25. This result was partially offset by lower financial income (-R$ 43.0 million) and an increase in tax payments (+R$ 50.9 million), given the stronger operating performance. The main adjustments to net income in 1Q26 were: | Adjustments to net income in 1Q26 (R$ million) 638.9 694.0 -31.7 -22.7 -13.2 +12.5 Reported Net Income MTM IFRS Effect New Replacement Value Voluntary Dismissal Program Recurring Net Income Excluding non-recurring items and non-cash factors — such as New Replacement Value (VNR), MTM, IFRS adjustments for broadcasters, and net income from discontinued operations — recurring net income grew by 10.7% compared to 1Q25, reaching R$ 638.9 million. This performance was driven by the increase in recurring Ebitda (+16.7%), effects partially offset by the decline in financial income, in equity method income due to the consolidation of Mata de Santa Genebra S.A., and by higher tax payments during the period. | Change in Recurring Net Income (R$ million) 638.9 576.9 +251.4 -67.7 -48.0 -43.0 -30.7 Recurring 1Q25 Δ Recurring Ebitda Δ Taxes Δ Depreciation Δ Financial Results Δ Others Recurring 1Q26 COPEL | 1Q26 | 9 Summary Results Investments GenCo TradeCo DisCo ESG Others Exhibits 1.7 Debt and Leverage Copel’s total consolidated debt as of March 31, 2026, was R$ 23,340.8 million, a 16.5% increase compared to the amount recorded as of December 31, 2025, of R$ 20,038.9 million. The following table and charts show the indebtedness of Copel and its subsidiaries as of March 31, 2025. | Debt by subsidiary R$ million R$ mil GenCo2 DisCo Others3 Total Total Debt1 7,893.0 11,084.2 4,363.6 23,340.8 Availability 1,575.8 1,793.8 2,514.3 5,883.9 Adjusted Net Debt 6,317.2 9,290.4 1,849.3 17,456.9 Leverage 2,8x Duration (years) 3.5 3.6 5.2 3.7 1 Includes the effect of swaps on debentures. 2 Includes Copel Geração e Transmissão S.A. (parent company). 3 Includes Copel Serviços, wind farms (Brisa Potiguar, São Bento, Cutia, Jandaíra, Vilas, Aventura, and SRMN), and transmission facilities (Costa Oeste, Marumbi, and Mata de Santa Genebra). As of March 31, 2026, consolidated leverage stood at 2.8x, reflecting net debt of R$ 17,456.9 million — an increase of 0.1x from the 2.7x recorded at the end of 2025. The indicator remains at a comfortable level and within the parameters defined by the Company’s optimal capital structure, with a target midpoint of 2.8x and a range of 2.5x to 3.1x, provided there is a convergence toward 2.8x within 24 months. | Adjusted Net Debt/Recurring Ebitda *excludes equity equivalence, considers discontinued operations and excludes the effects of impairment, severance pay, MTM, GSF renegotiation, losses on decommissioning of assets, and gains on disposal/swap of assets COPEL | 1Q26 | 10 Summary Results Investments GenCo TradeCo DisCo ESG Others Exhibits The average cost of debt at the nominal rate as of March 31, 2026, is 13.05% p.a. (13.07% p.a. as of December 31, 2025), which is equivalent to 89.11% of the CDI (87.74 % of the CDI as of December 31, 2025). | Debt Composition and Indexation | Amortization (R$ million) Average term: 5,2 years (vs. 4,9 years in 2025) COPEL | 1Q26 | 11 Summary Results Investments GenCo TradeCo DisCo ESG Others Exhibits 2 Investiments In 1Q26, the amount realized from the investment program was R$ 581.7 million, with 75.4% coming from DisCo and 24.3% from GenCo, TradeCo and Copel Holding. R$ million Subsidiary / SPE Realized 1Q26 1Q25 DisCo 438.6 596.6 GenCo 141.4 80.8 Generation 65.1 20.6 Hydroelectric 49.9 8.7 Wind 15.2 11.9 Transmission 67.1 48.9 Improvements/Reinforcemen¹ 66.1 45.8 Other Investments 1.0 3.1 Other GenCo Projectst² 9.2 11.3 Copel (Holding) 1.4 0.2 TradeCo 0.3 0.3 Copel Serviços and other equities3 0.0 0.3 Total 581.7 678.2 1 Includes Facility Modernization Plan - PMI. 2 Includes modernization of COGT (Generation and Transmission Operations Center), modernization of GPS Parigot de Souza HPP and Marumbi and Uirapuru SPEs 3 Includes an innovation plan in the energy sector aligned with the investment thesis, Copel's innovation programs, and ESG practices Investments made in the distribution company are primarily allocated to the modernization and renewal of the distribution grid, using standardized technologies to support automation equipment. Among the benefits are grid resilience to reduce outages and ensure service quality, reduced costs for O&M and commercial services, and improved control of the Equivalent Duration of Interruption per Consumer Unit (DEC) and Equivalent Frequency of Interruption per Consumer Unit (FEC) indicators. All capital invested in Copel DIS during the quarter was directed toward investments in power infrastructure assets. During the quarter, investments made at GenCo were directed primarily toward reinforcing and improving transmission lines, maintaining and modernizing the generating units of hydroelectric plants, and enhancing the performance of wind power assets. These segments accounted for 93.5% of the total invested at GenCo during the period. COPEL | 1Q26 | 12 Summary Results Investments GenCo TradeCo DisCo ESG Others Exhibits 3 Copel Geração e Transmissão (GenCo)(Consolidated Result) 3.1 Economic and Financial Performance Copel GeT reported recurring Ebitda4 of R$ 1,023.7 million, an amount 30.7% or R$ 240.6 million higher than the the R$ 783.1 million recorded in 1Q25. This result reflects, primarily: I. an increase of R$ 166.8 million in CCEE supply revenue, driven largely by the positive impact of transactions conducted on the MCP, notably the modulation of the hydroelectric generation portfolio. This performance was driven by the rise in the average PLD of the Southern submarket, which increased from R$ 161.87/MWh in 1Q25 to R$ 359.40/MWh in the current period; II. the R$ 99.2 million increase in revenue from bilateral supply contracts, driven by higher energy sales volume (+11.7%) between the periods, as well as a 7.5% increase in the average price of Copel GeT’s portfolio (R$ 195.90/MWh in 1Q26 compared to R$ 182.29/ MWh in 1Q25) III. higher revenue from grid availability, adjusted for the IFRS effect on the Transmission Companies, in the amount of R$ 93.3 million, explained mainly by the incorporation of the MSG Transmission Company and an average increase of 2.2% in the RAP of the transmission companies in which Copel GeT holds a 100% stake for the 2025/2026 cycle, excluding MSG; IV. a decrease of R$ 11.6 million in recurring managed costs (PMSO). The positive effects mentioned above were partially offset by: I. an increase of R$ 96.1 million in electricity purchased for resale, resulting from the combination of purchases under bilateral contracts in the hydro portfolio (+R$ 78.0 million) and the acquisition of energy on the CCEE (short-term) for wind complexes, due to higher curtailment during the period; I. a higher generation variance of R$ 21.1 million (+61.4%), resulting from the increase in curtailment, which rose from 8.8% in 1Q25 to 20.7% in 1Q26. COPEL | 1Q26 | 13 Summary Results Investments GenCo TradeCo DisCo ESG Others Exhibits 4 Excluding non-recurring items and the effects of IFRS on transmission contract assets. R$ million Recurring Ebitda 1Q26 1Q25 Δ% Ebitda 1,124.2 998.1 12.6 (-/+) Disposal and swap of assets — (109.8) — (-/+) Reversal/provision of severance pay 5.5 8.6 (36.0) (-/+) Equity equivalence (71.6) (100.4) (28.7) (-/+) IFRS effect (Corporate/Regulatory Transmission Revenue) - see item 3.1.1 (34.3) (13.4) 156.0 Recurring Ebitda 1,023.7 783.1 30.7 PMSO, excluding non-recurring items, provisions, and reversals, decreased by R$ 11.6 million (-5.0%), mainly due to lower costs for third-party services (-R$ 20.0 million), due to lower maintenance costs for facilities and services, and by a R$ 4.4 million reduction in Other costs and expenses, primarily from lower costs related to financial compensation for water resource usage, given lower generation during the period. This result was partially offset by higher costs related to: the purchase of Materials (+R$ 6.2 million), primarily for wind assets, and an increase in Personnel and administrative costs of R$ 4.6 million, due to higher variable compensation (profit-sharing - PLR, performance bonus - PPD, and long-term incentive - ILP), primarily due to the Company’s improved operational performance. R$ million Recurring Manageable Costs* 1Q26 1Q25 Δ% Personnel and management 80.4 75.7 6.2 Pension and welfare plans 20.1 18.2 10.4 Material 10.9 4.7 131.9 Third-party services 47.9 67.9 (29.5) Other operating costs and expenses 62.7 67.1 (6.6) TOTAL 222.0 233.6 (5.0) *Excludes the effects of the following non-recurring items: Personnel - Reversal/provision for Voluntary Dismissal Program; and Others - disposal/swap of assets; Curtailment Excluding the effects of PLR, PPD, and ILP, personnel costs decreased by 2.7%, reflecting efficient workforce management, partially offset by the impact of the ACT 2025 collective bargaining agreement, which provides for salary adjustments based on the National Consumer Price Index (INPC), of 5.01% (12-month cumulative INPC through September 2025). Excluding the effects of cumulative inflation as measured by the INPC, which stood at 3.8% between April 2025 and March 2026, there was a 6.3% reduction in personnel costs. R$ million Recurring Personnel costs 1Q26 1Q25 Δ% Personnel and administrators ¹ 80.4 75.7 6.2 (-/+) Profit sharing, PPD and ILP (19.3) (12.9) 49.6 TOTAL 61.1 62.8 0.0 ¹ Excludes the effects of the following non-recurring items: Personnel - Reversal/provision for Voluntary Dismissal Program Recurring net income reached R$ 455.4 million in 1Q26, an increase of 33.8% (+R$ 115.0 million) compared to 1Q25. This result reflects, primarily, a combination of the following effects: i. improved Ebitda (+R$ 240.6 million), driven by the operational performance and consolidation of the COPEL | 1Q26 | 14 Summary Results Investments GenCo TradeCo DisCo ESG Others Exhibits transmission company Mata de Santa Genebra S.A.; ii. a 4.2% increase in financial income (+R$ 10.9 million), driven by higher income from financial investments, partially offset by expenses resulting from higher debt levels and a higher CDI (3.4% in 1Q26, compared to 2.9% in 1Q25); iii. an increase of R$ 94.4 million in tax payments, due to improved operating performance; iv. a decrease of R$ 28.8 million in equity method income, mainly due to the consolidation of Mata de Santa Genebra into the portfolio, which ceased to contribute R$ 17.0 million to equity method income; and v. an increase of R$ 13.3 million in depreciation and amortization due to higher investments made between the periods. | Change in recurring Net Income (R$ million) 455.4 340.4 240.6 -94.4 -13.3 10.9 -28.8 Recurring 1Q25 Δ Ebitda Δ Taxes Δ D&A Δ Financial Results Δ Equity Recurring 1Q26 R$ million Main Indicators 1Q26 1Q25 Δ% Net Operating Revenue (R$ million) 1,579.2 1,239.5 27.4 Recurring Net Operating Revenue (R$ million) 1,488.7 1,175.6 26.6 Operating Costs and Expenses (R$ million) (716.8) (518.7) 38.2 Operating Result (R$ million) 687.8 564.2 21.9 Net Profit (R$ million) 474.4 416.0 14.0 Recurring Net Profit (R$ million) 455.4 340.4 33.8 Ebitda (R$ million) 1,124.2 998.1 12.6 Recurring Ebitda (R$ million) 1,023.7 783.1 30.7 Operating Margin 43.6% 45.5% -1,9 p.p Net Margin 28.8% 27.5% 1,3 p.p Ebitda Margin 71.2% 80.5% -9,3 p.p Recurring Ebitda Margin 68.8% 66.6% 5,6 p.p Investment Program (R$ million) 141.3 80.8 74.9 3.1.1 IFRS effect on the Transmission segment For the calculation, an adjustment was made to account for the effects of applying ICPC 01/IFRIC 12 to the company’s financial statements in the transmission segment. COPEL | 1Q26 | 15 Summary Results Investments GenCo TradeCo DisCo ESG Others Exhibits R$ million IFRS effect in the Transmission segment 1Q26 1Q25 Δ% (A) Corporate revenue1 394.6 280.3 8.7 O&M revenue and effective interest 396.8 275.8 9.1 Construction revenue and margin 54.0 55.1 47.3 Cost of construction (56.2) (50.6) 64.5 (B) Regulatory revenue1 360.3 266.9 41.2 (B-A) IFRS effect - Difference between regulatory and corporate revenue (34.3) (13.4) — (+/-) Effects on Equity of transmission companies2 (21.0) (59.1) (92.5) IFRS effect in Transmission business (55.3) (72.5) — ¹ Net of taxes and charges. ² Difference between corporate and regulatory profit of jointly owned subsidiaries in the transmission segment, proportional to GenCo's stake in the ventures. 3.2 Operational Performance Operating in 10 Brazilian states, Copel Geração e Transmissão manages a diversified portfolio of hydroelectric and wind power plants, totaling 6,226.1 MW of installed capacity and an average of 2,696.4 MW of physical supply. In the Transmission segment, Copel operates a grid totaling 9,680 km of transmission lines and 53 basic grid substations, considering its equity interests. COPEL | 1Q26 | 16 Summary Results Investments GenCo TradeCo DisCo ESG Others Exhibits 3.2.1 Generation Copel’s generation portfolio consists entirely of renewable sources in operation. | Installed Capacity by Source Hydro 81.0% 6.226,1 MW Wind 19.0% Copel Geração e Transmissão S.A.’s hydroelectric generation was 39.8% lower in 1Q26 (3,793 GWh, compared to 6,303 GWh in 1Q25), due to a less favorable hydrological scenario, compared to the same period of the previous year, and divestments in small hydroelectric plants and the Colíder hydroelectric plant. At wind farms, generation was 16.6% lower in 1Q26 (627 GWh, compared to 752 GWh in 1Q25), primarily due to increased curtailment in 1Q26 (20.7%, compared to 8.8% in 1Q25). COPEL | 1Q26 | 17 Summary Results Investments GenCo TradeCo DisCo ESG Others Exhibits | GSF - Generation Scaling Factor 113.2% 111.0% 98.8% 101.7% 97.1% 87.7% 69.3% 62.6% 63.0% 62.8% 65.7% 73.6% 81.2% 100.3% 94.5% 101.7% 97.1% 87.7% 69.3% 62.6% 63.0% 62.8% 65.7% 73.6% 2025 2026 Jan Fev Mar Abr Mai Jun Jul Ago Set Out Nov Dez Fonte: CCEE | Average Monthly PLD - Southern Submarket (R$/MWh) 59.21 93.83 332.56 202.98 233.39 236.10 211.67 287.17 260.34 250.18 278.02 265.89 249.95 402.69 425.57 2025 2026 Jan Fev Mar Abr Mai Jun Jul Ago Set Out Nov Dez 3.2.3 Transmission Copel operates over 9,600 km of transmission lines across eight Brazilian states, including its own assets and those in partnership with other companies. In addition to building, maintaining, and operating its own extensive power transmission grid, Copel provides services to projects operated by other utilities. The Transmission projects comprise 11 line contracts from Copel Geração e Transmissão, the SPEs Costa Oeste, Marumbi, Uirapuru Transmissora, and MSG (100% Copel GeT), as well as the 6 SPEs in which Copel Geração e Transmissão holds an interest. COPEL | 1Q26 | 18 Summary Results Investments GenCo TradeCo DisCo ESG Others Exhibits RBSE Below we describe the revenue stream from the portion of revenue related to the Basic Grid of the Existing System (RBSE)5 for the upcoming cycles. It is important to note that the data may change in the future due to tariff review processes and/or revisions to the parameters used to calculate these revenues by the regulatory agency. The figures below reflect the revision to the calculation methodology for the financial component, established by Approval Resolution No. 3,467/2025, with a negative impact of R$ 115.1 million, and have been adjusted annually by the IPCA, in accordance with Approval Resolution No. 3,481/2025. 663.6 703.5 709.7 175.6 175.6 175.6 122.1 122.1 122.1 176.3 176.3 176.3 189.6 229.5 235.7 RBSE - O&M RBSE - Economic component PRT 120/2016 RBSE - Financial component PRT 120/2016 RBNI - new projects 2025-2026 cicle 2026-2027 cicle 2027-2028 cicle — 250.0 500.0 750.0 Economic component: future values based on the 2025–2026 cycle (as per REH No. 3,481/2025)] Financial component: amounts published in REH No. 3,467/2025 RAP values through the 2027-2028 cycle projected based on the values in REH No. 3,467/2025, excluding PIS/COFINS and the Adjustment Portion. COPEL | 1Q26 | 19 Summary Results Investments GenCo TradeCo DisCo ESG Others Exhibits 5 Refers to concession contract 060/2001, which represents 36.6% of the annual permitted revenue (RAP) for transmission by Copel Geração e Transmissão and is proportional to the equity interests. 4 Strategy of Commercialization 4.1 Business Context Copel’s marketing strategy focuses on consistent and sustainable growth, with disciplined capital allocation and active risk management, within an environment of transition and modernization in the Brazilian electricity sector. The Company has been expanding its operations beyond the traditional concession model, positioning marketing as a strategic driver for value capture and revenue diversification. Through its wholly-owned subsidiary Copel Comercialização S.A. (TradeCo), Copel structures energy solutions aligned with the evolution of the free market, combining contracts, portfolios, and customized supply arrangements tailored to different consumer profiles. This approach allows the Company to capitalize on opportunities arising from the gradual opening of the market, while maintaining its cash flow predictability and commercial flexibility, thereby protecting and optimizing the portfolio. In this context, our TradeCo, one of the largest energy retailers in the country, has established itself as one of the Company’s main platforms for operating in the Free Market. As of March 31, 2026, Copel served 1,515 customers across 23 states, with an average of 3.02 GW of electricity traded on the CCEE. The 3.6% decrease compared to the same period last year reflects a deliberate portfolio management strategy, prioritizing commercial selectivity, margin optimization, and a balance between scale, risk, and profitability, strengthening the Company’s ability to make sound decisions and capture value even in a highly complex market environment. 4.2 Business Performance In the first quarter of 2026, Copel sold 5.3 GWh of electricity, a volume 11.7% lower than that recorded in 1Q25, impacted mainly by the average GSF of 92% in the period, compared to a secondary generation of 108% in the same quarter of the previous year. Despite the reduction in the physical volume sold, the economic performance of sales was positive, reflecting the effectiveness of the adopted strategy. The integrated view of the portfolio, combined with hedging operations, active management of submarkets, and favorable seasonal generation patterns in the first half of the year, allowed for the capture of high prices during the period. The flexibility and fluctuations in customer consumption were effectively offset by the integrated portfolio and hedging operations. In addition, the effects of the hourly profiles of hydroelectric generation and consumption resulted in gains of approximately R$ 70.0 million over the quarter. COPEL | 1Q26 | 20 Summary Results Investments GenCo TradeCo DisCo ESG Others Exhibits From a regional perspective, the appreciation of the Southern submarket relative to other regions generated an estimated additional profit of R$ 70.0 million. At the same time, hedging operations mitigated the effects of price divergence in the Northeastern submarket. In the long term, although the pricing environment remains under pressure, the market continues to offer opportune windows for contracting generation capacity, in line with the Company’s origination strategy. Even amid heightened attention to credit risk in the sector, Copel maintained a default rate of just 0.01% on energy sales, demonstrating the robustness of its commercial policy and risk management, while also representing a significant competitive advantage in its relationships with free market customers. | Consolidated Sales (GWh) | Energy balance The energy balance presented reflects the Company’s strategy of maintaining a robust and diversified portfolio, combining its own resources and purchase and sale contracts in effect as of March 31, 2026. The breakdown of the contracted portfolio and average sales prices demonstrates how Copel manages hydrological, regulatory, and market risks, balancing cash flow predictability and commercial flexibility to operate efficiently throughout the electricity sector’s cycles. COPEL | 1Q26 | 21 Summary Results Investments GenCo TradeCo DisCo ESG Others Exhibits (MW médio) Energy balance - COPEL GET - mar/26 2026 2027 2028 2029/2030(5) Own Resources GeT 1,890 1,901 1,920 1,928 GeT (1) 1,291 1,291 1,291 1,291 GPS (CCGF) (2) 73 73 73 73 Bela Vista + FDA 526 537 556 564 Own Resources SPP and Wind Farm (3) 544 544 544 544 Purchases 111 85 — 8 TOTAL OWN RESOURCES + SOLD 2,545 2,530 2,464 2,480 Total Sold 2,144 1,931 1,686 1,155 Sales (Regulated) 706 706 706 706 Sales (Regulated) % 28% 28% 28% 28% Sales (Free Market) 1,438 1,225 980 449 Sales (Free Market) % 56% 48% 40% 19% Total Available 401 599 778 1,324 Total Available (%) 16% 24% 32% 53% Avarege price of energy sold (R$)(4) 195.90 196.62 203.63 223.20 Reference: march/26 (1) Includes Mauá 100% from June25 and GPS 30% (ex-CCGF). Does not include Baixo Iguaçu, Elejor and Foz do Chopim. (2) GPS 70% (quota regime). (3) Does not include Voltália Wind Complex. (4) Average gross energy price (with PIS/COFINS and without ICMS). The GPS CCGF RAG is not considered in the calculation of average prices. (5) Calculate the weighted average based on the grades from both periods. Energy balance (Hydro + Wind) (P-MIX (R$/MWh)) Notes: (i) losses and internal consumption were deducted; (ii) both physical guarantees (GFs) and sales by wind SPEs were considered constant for all periods; (iii) energy purchases in each period were considered; (iv) prices were adjusted according to contractual adjustment indices, from the respective reference dates through March 2026; (v) the RAG of the CCGF for GPS is not considered in the calculation of average prices; (vi) average energy prices are gross, including PIS/ COFINS and excluding ICMS; (vii) the physical guarantee of the plants in effect as of March 31, 2026, was considered; (viii) the Mauá Hydroelectric Plant has GSF insurance covering 96% of the physical guarantee; and (ix) does not take into account short-term ballast sales transactions. COPEL | 1Q26 | 22 Summary Results Investments GenCo TradeCo DisCo ESG Others Exhibits 5 Copel Distribuição (DisCo) 5.1 Economic and Financial Performance DisCo reported recurring Ebitda of R$ 762.3 million in 1Q26, an increase of 10.0% (R$ 69.4 million) compared to 1Q25. This performance was driven primarily by: i. a 2.1% growth in the billed electricity market, which already accounts for the deduction of the portion of energy offset by Mini and Micro Distributed Generation (MMGD), reflecting increased economic activity in the concession area and growth in the customer base over the period; and ii. by the Annual Tariff Adjustment (RTA) of June 2025, with an average effect of 1.3% on Parcel B. The following table presents the variation in recurring Ebitda and non-recurring adjustments: Recurring Ebitda 1Q26 1Q25 Δ% Ebitda 769.2 704.7 9.2 (-/+) Reversal/Provision for severance pay 13.2 12.2 8.2 (-/+) New Replacement Value - NRV (20.1) (24.0) (16.3) Recurring Ebitda 762.3 692.9 10.0 The following factors contributed to the recurring Ebitda result: I. the increase of R$ 18.3 million in other revenues stems mainly from the increase in infrastructure sharing; and II. the increase of R$ 76.3 million (+7.2%) in the gross distribution margin (table below), an indicator that reflects the amount retained by the distributor to cover the costs of its operations, after deducting costs directly associated with the purchase of electricity and sector-specific charges. Gross Distribution Margin 1Q26 1Q25 Δ% Recurring Net Operating Revenue (excluding VNR) 4,904.7 4,280.8 14.6 (-) Construction Revenue 522.8 584.6 (10.6) (-) Other Operating Income 145.2 126.8 14.5 (=) Recurring ROL (excluding construction, other revenues, and VNR) 4,236.7 3,569.4 18.7 (-) Electricity Purchased for Resale 2,386.6 1,847.2 29.2 (-) Electricity Grid Usage Charges 708.4 656.8 7.9 Gross Distribution Margin 1,141.7 1,065.4 7.2 ¹ Excludes the effects of the following non-recurring items: Personnel - Reversal/provision for Voluntary Dismissal Program COPEL | 1Q26 | 23 Summary Results Investments GenCo TradeCo DisCo ESG Others Exhibits The main margin results were: a) an increase of R$ 714.1 million in CVA (segment-level financial assets and liabilities); b) an increase of R$ 18.9 million in cash flow revenue, resulting primarily from the 6.4% adjustment in the Distribution System Usage Tariff (TUSD – RTA/2025) and the 2.5% growth in consumption in the wholesale market (ex-Distributed Generation), partially offset by an increase of R$ 207.7 million in CDE Usage (CDE quota); c) the increase of R$ 539.5 million in energy purchased for resale, driven mainly by the greater impact of the MMGD and the rise in energy purchases in the short-term market/CCEE. The positive effects I and II mentioned above were offset by increases of i. R$ 10.8 million in expenses related to provisions and reversals, mainly due to an increase of R$ 51.4 million in Expected Credit Losses and Doubtful Accounts (PECLD) and ii. R$ 14.4 million in PMSO (+3.4%) compared to 1Q25, mainly due to: I. an increase of R$ 15.2 million in personnel costs, excluding provisions related to the voluntary severance program, due to higher variable compensation (Performance Bonus - PPD and Long-Term Incentive - ILP), primarily driven by the Company’s improved operational performance; II. an increase of R$ 4.5 million in other costs and expenses, mainly due to higher lease and rental expenses. R$ million Recurring Manageable Costs (PMSO) ¹ 1Q26 1Q25 Δ% Staff and administrators 145.5 130.2 11.8 Pension and welfare plans 43.1 39.8 8.3 Material 14.2 17.8 (20.2) Third-party services 195.7 200.7 (2.5) Other operating costs and expenses 45.6 41.1 10.9 TOTAL 444.1 429.6 3.4 ¹ Excludes the effects of the following non-recurring items: Personnel - Reversal/provision for Voluntary Dismissal Personnel costs, excluding the effects of PLR, PPD, and ILP (see table below), increased by 3.2%, reflecting primarily the 5.01% salary adjustment (cumulative INPC for the 12 months through September 2025). Excluding the effects of cumulative inflation as measured by the INPC, which stood at 3.8% between April 2025 and March 2026, personnel costs decreased by 0.6%. R$ million Recurring Personnel Costs ¹ 1Q26 1Q25 Δ% Personnel and management 145.5 130.2 11.8 (-/+) Profit sharing, PPD and ILP (38.9) (26.9) 44.6 TOTAL 106.6 103.3 3.2 ¹ Desconsidera efeitos dos seguintes itens não recorrentes: Pessoal - Reversão/provisão Indenização PDVExcludes the COPEL | 1Q26 | 24 Summary Results Investments GenCo TradeCo DisCo ESG Others Exhibits | Change in Recurring Net Income (R$ million) 224.6 214.7 69.4 4.7 -35.3 -48.7 Recurring 1T25 Δ Recurring Ebitda Δ Taxes Δ D&A Δ Financial Results Recurring 1T26 DisCo’s recurring net income in 1Q26 was R$ 214.7 million, down 4.4% from 1Q25, impacted by a combination of the following factors: i. a R$ 48.6 million (25.3%) decrease in net financial income, given the higher volume of loans and financing used for investments in the concession area; ii. a 21.1% increase (+R$ 35.3 million) in depreciation expenses, due to the larger asset base in the rate cycle; and iii. a R$ 4.7 million reduction in taxes for the period, reflecting lower operating income, as well as the deductibility of the profit-sharing incentive (PLR) in 1Q26, which was recognized in 2Q25 in the prior fiscal year. Below are DisCo’s key indicators: Key Indicators 1Q26 1Q25 Δ% Net Operating Revenue (R$ million) 4,924.8 4,304.8 14.4 Net Operating Revenue Recurring (R$ million) 4,904.7 4,280.7 14.6 Operating Costs and Expenses (R$ million) (4,358.6) (3,767.7) 15.7 Operating Income (R$ million) 325.2 344.7 (5.7) Net profit (R$ million) 219.2 232.4 (5.7) Recurring net income (R$ million) 214.7 224.6 (4.4) Ebitda (R$ million) 769.2 704.7 9.2 Recurring Ebitda (R$ million) 762.3 692.9 10.0 Operating Margin 6.6% 8.0% -1,4 p.p Net Margin 4.5% 5.4% -0,9 p.p Ebitda margin 15.6% 16.4% -0,8 p.p Recurring Ebitda Margin 15.5% 16.1% -0,6 p.p Investment Program (R$ million) 438.6 596.6 (26.5) COPEL | 1Q26 | 25 Summary Results Investments GenCo TradeCo DisCo ESG Others Exhibits 5.2 Operation Performance 5.2.1 Grid Market (TUSD) In 1Q26, electricity consumption in DisCo’s wholesale market grew 2.5% compared to the same period of the previous year. The billed grid market, which excludes a portion of the energy offset by MMGD, recorded 2.1% growth in 1Q26 compared to 1Q25. This performance was driven primarily by increased consumption in the residential and commercial segments, reflecting greater economic activity in the concession area, as well as growth in the customer base over the period. 5.2.2 Captive Market The captive market remained virtually stable, with a 0.1% increase in electricity consumption in 1Q26 compared to the same period of the previous year. The billed captive market, which includes energy offset by MMGD, decreased by 1.0% in 1Q26. This decline is mainly explained by the expansion of MMGD, excluding energy from Distributed Generation (DG) Modalities II and III, which is offset, and by the migration of consumers to the Free Contracting Environment (ACL), driven by migrations, new loads, expansions, and increased consumption by industrial and commercial customers. 5.2.3 Operational data Our DisCo holds a concession valid through July 7, 2045, whose service quality criteria (Equivalent Duration of Interruption per Consumer Unit - DEC and Equivalent Frequency of Interruption per Consumer Unit - FEC) are defined by Aneel. The Company has acted promptly to restore power supply and prevent vegetation encroachment on the grid, which has contributed to maintaining service quality indices within regulatory limits. For the DEC, the result for the last 12 months calculated in March 2026 was 6.59 hours, while for the FEC, the result for the same period was 4.30 interruptions, both within the established regulatory limit. DEC (Measured in hours and hundredths of an hour) 7.2 7.98 7.85 7.92 7.17 6.59 7.20 7.98 7.85 7.92 7.17 6.59 9.29 9.19 8.69 8.35 8.14 7.88 Performed Regulatory threshold 2021 2022 2023 2024 2025 LTM 1Q26 FEC (Measured in terms of outage frequency and fraction) 4.76 5.29 5.2 5.36 4.95 4.3 4.76 5.29 5.20 5.36 4.95 4.30 6.84 6.8 6.39 5.93 5.8 5.36 Performed Regulatory threshold 2021 2022 2023 2024 2025 LTM 1T26 COPEL | 1Q26 | 26 Summary Results Investments GenCo TradeCo DisCo ESG Others Exhibits Losses - Distribution losses can be defined as the difference between the electricity purchased by distributors and that billed to their consumers, and are categorized as Technical and Non-Technical. Technical Losses are inherent to the electricity distribution activity, and Non-Technical Losses stem mainly from theft (illegal connections, direct diversion from the grid), fraud (meter tampering or diversions), and errors in reading, measurement, and billing. As of the end of March 2026, Technical Losses for the past 12 months were 2,314 GWh, compared to 2,299 GWh for the same period the previous year, and Non-Technical Losses were 768 GWh, compared to 682 GWh for the same period the previous year. Total losses for the last 12 months amounted to 3,082 GWh. GWh - 12 Meses mar-22 mar-23 mar-24 mar-25 mar-26 Injected Energy 34,861 35,285 37,519 39,730 40,000 Distribution Losses 2,627 2,794 2,924 2,981 3,082 Technical Losses 2,017 2,042 2,171 2,299 2,314 Non-Technical Losses 610 752 753 682 768 *As established by the result of CP 09/2024 (DSP Nº 1,220/2025) Non-Technical Losses, calculated as the difference between total losses and technical losses, are largely associated with the utility’s management and the socioeconomic characteristics of the service areas. In this regard, Copel maintains a Program to Combat Non-Technical Losses through, among other measures, the following actions: • using smart meter alarms to improve performance in selected target areas; • enhancing efforts to combat irregular practices, improving the performance of targeted inspections; • investments aimed at providing and/or acquiring inspection equipment; • development and implementation of specific training and refresher courses related to commercial losses; • conducting inspections in both Medium and Low Voltage systems; • educational notices in the press and messages on electricity bills; • joint operations with the Civil Police and the Public Prosecutor’s Office; and • opening of police investigations in regions where significant numbers of irregularities have been identified. The tariff pass-through for efficient loss levels is provided for in the concession contracts, and these losses are included in energy purchase costs up to the regulatory limit set by Aneel. Copel remained within regulatory limits in recent rate proceedings, and in March 2026, total losses were 0.44% below the regulatory limit, influenced by the revision of targets resulting from the effects of CP 09/24. COPEL | 1Q26 | 27 Summary Results Investments GenCo TradeCo DisCo ESG Others Exhibits Losses 7.5 8.0 7.8 7.5 7.7 7.7 7.6 7.6 7.6 8.2 Total losses/Injected energy (%) Regulatory Framework (%) mar-22 mar-23 mar-24 mar-25 mar-26 COPEL | 1Q26 | 28 Summary Results Investments GenCo TradeCo DisCo ESG Others Exhibits 6 ESG performance 6.1 ESG in Copel's Strategy Copel incorporates ESG (Environmental, Social, and Governance) principles into its corporate strategy, basing its actions on material issues identified through consultation with stakeholders and on the guidelines established by the Sustainability Policy. Integrity is a cross-cutting value that guides all of the company's practices, reinforcing its commitment to ethics, transparency, and compliance. This approach is complemented by voluntary commitments aligned with the Principles of the Global Compact and the UN Sustainable Development Goals (Agenda 2030). Priority SDGs by Copel ESG in Copel's strategy aims to promote a systemic and broad culture of sustainability, originating from stakeholders, and material issues guide programs and initiatives that generate shared value, minimize risks, and maximize opportunities. On the environmental front, decarbonization, climate adaptation and resilience, biodiversity, and eco-efficiency are drivers for projects and initiatives such as the Carbon Neutrality Plan, through which the Company is taking measures to neutralize its direct carbon emissions by 2030. Copel invests in 100% renewable energy, researches alternative sources, and reduces greenhouse gas emissions, reinforcing its commitment to combating climate change. In the social field, the People pillar is central, focusing on employee health and safety, human rights, and diversity. Copel values the promotion of a healthy work environment, with a goal of zero fatal accidents, acting fairly and inclusively with employees and stakeholders, in addition to strengthening engagement with communities. In governance, Copel adopts a structured and transparent approach, with emphasis on the Integrity Program, which is based on the Code of Conduct and aligned with the principles of the Global Compact. The program develops actions aimed at risk prevention, the promotion of an ethical culture, and the continuous engagement of employees. The Company also maintains robust risk management and internal controls, ensuring compliance with rules and regulations and strengthening governance at all organizational levels. ESG performance is continuously monitored by indicators and external assessments, such as ISE, from [B]³, CSA, from S&P Global, and CDP. COPEL | 1Q26 | 29 Summary Results Investments GenCo TradeCo DisCo ESG Others Exhibits In this way, Copel integrates its strategy across the board, committed to sustainable development, generating value for society, and strengthening corporate governance. 6.2 Recents highlights - Honorable Mention 2025: Copel received an honorable mention in the Paraná State Government’s Solidarity Seal program, which certifies companies and organizations that excel in social, environmental, and governance (ESG) practices, with a focus on reducing social vulnerability. The recognition highlighted Copel’s programs such as Cultivar Energia, Eletricidadania, and Iluminando Gerações. - Cultivar Energia 2025: A regulatory update made it possible to nearly double the number of urban gardens in the program by 2025, while also enabling partnerships with individuals and thereby allowing for a greater number of preserved areas beneath Copel’s power lines. The number of urban gardens registered by the program jumped from 24 to 57, spanning 12 cities in Paraná. 6.3 Indicators Regarding the scope 1 GHG indicator (tCO2), the data refer to direct greenhouse gas emissions from Copel's operations (fleet, land use change, and fugitive emissions), calculated every six months. The 2026 data will be audited later by a third party. Environmental Indicator 2023 2024 2025 Δp.p 1Q26 Renewable sources (% Installed Capacity) 94.06 94.07 100.0 — 100.00 Renewable sources (% Energy Generated) 99.86 99.97 100.0 — 100.00 Scope 1 GHG emissions (tCO2)¹ 81,690.3 17,318.0 13,359.2 — — Scope 2 GHG emissions (tCO2)² 148,798.7 229.169,5 183,670.7 — — ¹Scope 1 refers to direct greenhouse gas emissions from Copel's operations (fleet, land use change, and fugitive emissions), calculated every six months. The 2025 data will be verified later by a third party. ²Scope 2 refers to indirect greenhouse gas emissions from Copel's operations (electricity consumption and loss) - GHG emissions are calculated every six months. Social Indicator 2023 2024 2025 Δp.p 1Q26 Women at Copel (% of Own Employees) 21.7 21.9 22.1 -0.2 21.9 Women at Copel (% Third-Party Employees) 11.7 14.0 13.6 -1.6 12.0 Accident frequency rate - TFIFR (% Own Employees) 1.4 2.0 0.9 — — Accident frequency rate - TFIFR (% Third-Party Employees) 4.9 3.9 2.7 -1.3 1.4 TFIFR: Lost time injury frequency rate. This rate represents, in relation to one million man-hours of exposure to risk, the number of contractors involved in lost time accidents or fatal cases during the period considered. ABNT – NBR 14280: 2001 COPEL | 1Q26 | 30 Summary Results Investments GenCo TradeCo DisCo ESG Others Exhibits Governance Indicator 2023 2024 2025 Δp.p 1Q26 Women in leadership positions (%) 21.8 22.5 22.0 -1.0 21.0 Women on the Board of Directors (%) 11.1 11.1 11.1 — 11.1 Independent directors (%) 88.8 88.8 88.8 — 88.8 Complaints resolved through the Complaints Channel (%)* 82.7 82.0 93.0 -18.0 75.0 *The indicator considers the completion of investigations in the period analyzed/year. The Company analyzes 100% of the complaints received. 6.4 Ratings, Rankings and Indexes Index Ranking 82.47% Ranking 19º CSA Score 84 A Yes Medium Risk AA Reference Year 2025 2026 2025 2025 2025 2025 COPEL | 1Q26 | 31 Summary Results Investments GenCo TradeCo DisCo ESG Others Exhibits 7 Other highlights from the period Dividends to shareholders On January 19, 2026, Copel made a payment of R$ 1,100.0 million in Interest on Equity (IOE), in accordance with the minimum distribution schedule for the 2025 fiscal year, as provided for in its Dividend Policy. Additionally, the Company will distribute R$ 1,350.0 million in dividends on June 30, 2026, and R$ 706.0 million in Interest on Equity on September 30, 2026, in fulfillment of its commitment to carry out at least two profit distribution events throughout the year. Copel Consolidates its Position as One of the Top Companies in ESG Practices - Dow Jones Best in Class Index Copel has been included in the Dow Jones Best-in-Class Index (DJ BIC), in the Global segment, ranking among the companies with the strongest performance in ESG practices. The index is internationally recognized as one of the leading benchmarks for corporate sustainability. The DJ BIC comprises approximately 10% of the leading companies in each sector that stand out for their consistent adoption and high performance in environmental, social, and governance (ESG) criteria, and it is widely used by investors who incorporate these factors into their investment decisions and portfolios. Copel’s inclusion in the Dow Jones Best-in-Class Index represents an important recognition of the Company’s consistent efforts and continuous commitment to improving its processes. This achievement reinforces our team’s dedication to the business sustainability pillars and to responsible management, integrating them into day-to-day decisions and the Company’s long-term strategy. Copel Increases Weighting in the MSCI Brazil Index Morgan Stanley announced an update to the composition of the MSCI Brazil Index, highlighting the significant increase in Copel’s (CPLE3) weighting, which rose from 0.54% to 0.96%. As of March 2, 2026, the index has assigned a higher weighting to the CPLE3 stock. MSCI indices are global benchmarks for institutional investors and are widely used as benchmarks for asset allocation by passive funds around the world. The increase in Copel’s weighting in the index enhances its visibility among major international investors, expands its fundraising potential, and underscores the consistency of the Company’s strategy in generating sustainable value for its shareholders. Copel wins LRCAP with two hydroelectric plants On March 18, the Company was declared the winner of the Capacity Reserve Auction in the form of power, contributing 1,862.8 MW of total installed capacity from the Foz do Areia and Segredo hydroelectric plants, for a term of 15 years, with operations scheduled to begin in August 2030. The projects enhance the Company’s value, competitiveness, and flexibility. For more information, see Material Fact 01/26. Copel reaffirms excellence in compliance management with recertification Copel maintained its ISO 37301 international certification following a recertification process conducted in January 2026, which confirmed the Integrity Program’s adherence to international best practices in compliance, internal controls, and corporate risk management. The recertification reinforces the Company’s commitment to ethics, compliance, and the continuous improvement of its processes. COPEL | 1Q26 | 32 Summary Results Investments GenCo TradeCo DisCo ESG Others Exhibits New General Director of Copel GeT On February 26, Mr. Rogério Pereira Jorge was sworn in as the new General Director of Copel Geração e Transmissão. He has 27 years of experience in the Brazilian electricity sector, having worked in technical, commercial, and strategic areas within the energy Generation, Distribution, and Sales segments. In 2023, he took over as CEO of AES Brasil, and his most recent position was Director of Energy and Supply Business at Companhia Brasileira de Alumínio (CBA). Under the leadership of Mr. Rogério Jorge, Copel GeT will continue to strengthen the efficiency of its power generation and transmission businesses, with a focus on sustainability, operational excellence, and the continuous creation of value for shareholders. For more information, please refer to Market Announcement 05/26. Copel Wins Award for Communication Grid Implementation Project On March 17, Copel’s project to deploy a private telecommunications network within its energy infrastructure received the Latin America Telecom Award during the UTCAL Summit 2026, in recognition of innovation and pioneering spirit in the electricity sector. The network connects substations, field equipment, and smart meters to the Operations Center, enabling real-time monitoring, remote operation, and reduced outage times. Elejor submits a request to join the renegotiation of the UBP Centrais Elétricas do Rio Jordão S.A. - Elejor, a special-purpose company in which Copel holds a majority stake, announced on April 29, 2026, its agreement to the renegotiation of the upcoming installments due for the Use of Public Assets (UBP), pursuant to Law no. 15,235 of October 8, 2025, and Order no. 668/2026-ANEEL of February 24, 2026, regarding the Santa Clara and Fundão hydroelectric plants, in accordance with the amount officially calculated and published by Aneel, totaling R$ 420.6 million. As established by law, following acceptance, there is a 20-day period, starting from Aneel's notice, to sign the Amendment to the concession contract with the granting authority, and an additional 30 days for financial settlement. The renegotiation demonstrates value creation for the concessions of assets operated by Elejor and is fully aligned with the Company’s value creation strategy. Copel completes the closing of the divestiture of the Figueira Thermal Power Plant. On April 30, 2026, the Company completed the closing of the divestment of the Figueira Thermal Power Plant, after fulfilling all applicable conditions precedent. With this transaction, the Company concludes the process of divesting non-renewable assets, reinforcing its strategy of focusing on sustainability and aligning its portfolio with long-term objectives. COPEL | 1Q26 | 33 Summary Results Investments GenCo TradeCo DisCo ESG Others Exhibits Disclaimer Information contained in this document may include forward-looking statements and reflects management’s current perceptions and outlook regarding the evolution of the macroeconomic environment, industry conditions, the Company’s performance, and financial results. Any statements, expectations, capabilities, plans, and projections contained in this document that do not describe historical facts — such as information regarding the declaration of dividend payments, the future direction of operations, the implementation of relevant operational and financial strategies, the investment program, and the factors or trends affecting the financial condition, liquidity, or results of operations—are forward-looking statements as defined in the U.S. Private Securities Litigation Reform Act of 1995 and involve various risks and uncertainties. There is no guarantee that such results will occur. The statements are based on various factors and expectations, including economic and market conditions, industry competitiveness, and operational factors. Any changes in such expectations and factors may cause actual results to differ materially from current expectations. Investor Relations ri@copel.com Phone: +55 (41) 3331-4011 COPEL | 1Q26 | 34 Summary Results Investments GenCo TradeCo DisCo ESG Others Exhibits Consolidated Results Result by Subsidiary INCOME STATEMENTS COPEL GET INCOME STATEMENT BALANCE SHEET COPEL DIS INCOME STATEMENT CASH FLOW COPEL COM INCOME STATEMENT EBITDA AND FINANCIAL RESULT The remaining tables are available on the Investor Relations website. To access them, click here. 35 Summary Results Investments GenCo TradeCo DisCo ESG Others Exhibits │CONSOLIDATED RESULTS - Income Statement R$ '000 Income Statement 1Q26 1Q25 Δ% OPERATING REVENUES 7,067,701 5,892,086 20.0 Electricity sales to final customers 1,996,141 2,192,099 (8.9) Electricity sales to distributors 1,513,472 974,940 55.2 Use of the main distribution and transmission grid 2,058,698 1,928,023 6.8 Construction revenue 576,768 639,690 (9.8) Fair value of assets from the indemnity for the concession 20,075 24,016 (16.4) Result of Sectorial financial assets and liabilities 699,600 (14,456) — Other operating revenues 202,947 147,774 37.3 OPERATING COSTS AND EXPENSES (5,632,684) (4,610,970) 22.2 Electricity purchased for resale (3,102,189) (2,252,353) 37.7 Charge of the main distribution and transmission grid (712,305) (682,523) 4.4 Personnel and management (282,631) (249,222) 13.4 Pension and healthcare plans (66,120) (60,937) 8.5 Materials and supplies (25,891) (23,001) 12.6 Materials and supplies for power eletricity — — — Third-party services (255,988) (282,321) (9.3) Depreciation and amortization (403,049) (355,020) 13.5 Provisions and reversals (85,601) (70,511) 21.4 Construction cost (578,931) (635,191) (8.9) Other cost and expenses (119,979) 109 — EQUITY IN EARNINGS OF SUBSIDIARIES 69,785 100,416 (30.5) PROFIT BEFORE FINANCIAL RESULTS AND TAXES 1,504,802 1,381,532 8.9 FINANCIAL RESULTS (489,563) (446,525) 9.6 Financial income 332,946 297,640 11.9 Financial expenses (822,509) (744,165) 10.5 OPERATIONAL EXPENSES/ INCOME 1,015,239 935,007 8.6 INCOME TAX AND SOCIAL CONTRIBUTION ON PROFIT (321,195) (270,340) 18.8 Income tax and social contribution on profit (162,856) (228,982) (28.9) Deferred income tax and social contribution on profit (158,339) (41,358) 282.8 NET INCOME continuing operations 694,044 664,667 4.4 NET INCOME discontinued operations — — — NET INCOME 694,044 664,667 4.4 Attributed to the controlling company's shareholders - continuing operations 692,039 665,508 4.0 Attributed to the controlling company's shareholders - discontinued operations — — — Attributed to non-controlling shareholders - continuing operations 2,005 (841) (338.4) Attributed to non-controlling shareholders - discontinued operations — — — Ebitda continued operations 1,907,851 1,736,552 9.9 % COPEL | 1Q26 | 36 Summary Results Investments GenCo TradeCo DisCo ESG Others Exhibits │CONSOLIDATED RESULTS - Balance Sheet R$ '000 Assets Mar-26 Dec-25 Δ% CURRENT 13,098,936 10,881,654 20.4 Cash and cash equivalents 5,175,351 3,130,363 65.3 Bonds and securities 575 895 (35.8) Collaterals and escrow accounts 9 9 — Trade accounts receivable 4,250,296 4,300,957 (1.2) Dividends receivable 141,431 141,297 0.1 Sectorial financial assets 828,038.0 400,463 106.8 Accounts receivable – concessions 13,329 12,867 3.6 Contract assets 406,668 392,594 3.6 Fair value in the purchase and sale of power 279,007 263,645 5.8 Other current receivables 922,072 1,050,086 (12.2) Inventories 162,531 173,398 (6.3) Income tax and social contribution receivable 405,331 502,825 (19.4) Other current recoverable taxes 426,232 426,106 — Prepaid expenses 62,889 60,972 3.1 Receivable from related parties — — — Assets held for sale 25,177 25,177 — NON-CURRENT 49,827,726 49,532,802 0.6 Long Term Assets 19,493,610 19,065,339 2.2 Bonds and securities 834,741 690,886 20.8 Other temporary investments 42,124 30,627 37.5 Trade accounts receivable 170,354 162,189 5.0 Judicial deposits 381,605 373,949 2.0 Sectorial financial assets 276,013 400,463 (31.1) Accounts receivable – concessions 4,670,228 4,590,579 1.7 Contract assets 9,534,418 9,202,412 3.6 Fair value in the purchase and sale of power 667,752 597,856 11.7 Other noncurrent receivables 806,345 794,296 1.5 Income tax and social contribution receivable 103,778 102,589 1.2 Deferred income tax and social contribution 945,347 991,404 (4.6) Other noncurrent recoverable taxes 1,060,398 1,127,582 (6.0) Prepaid expenses 507 507 — Investments 2,912,139 2,849,002 2.2 Property, plant and equipment, net 8,071,988 8,145,552 (0.9) Intangible assets 19,078,813 19,206,609 (0.7) Right to use an asset 271,176 266,300 1.8 TOTAL 62,926,662 60,414,456 4.2 COPEL | 1Q26 | 37 Summary Results Investments GenCo TradeCo DisCo ESG Others Exhibits R$ '000 CURRENT Mar-26 Dec-25 Δ% CURRENT LIABILITIES 9,549,851 11,062,317 (13.7) Payroll, social charges and accruals 369,901 310,773 19.0 Accounts payable to related parties — — — Accounts payable to suppliers 3,062,636 3,059,667 0.1 Income tax and social contribution payable 76,530 81,875 (6.5) Other taxes due 372,964 677,273 (44.9) Loans and financing 223,119 217,827 2.4 Debentures 1,921,162 1,850,538 3.8 Dividend payable 1,353,319 2,325,889 (41.8) Post-employment benefits 121,184 118,854 2.0 Sectorial charges payable 55,819 60,108 (7.1) Research and development and Energy efficiency 89,857 99,244 (9.5) Accounts payable related to concession 145,099 147,205 (1.4) Sectorial financial liabilities 424,111 883,990 (52.0) Lease liability 63,821 58,741 8.6 Fair value in the purchase and sale of power 255,299 262,821 (2.9) Other accounts payable 836,110 788,232 6.1 Provision for allocation of PIS and Cofins credits 178,920 119,280 50.0 NONCURRENT LIABILITIES 29,580,513 26,260,161 12.6 Payroll, social charges and accruals 9,805 4,764 105.8 Accounts payable to suppliers — — — Deferred income tax and social contribution 133,269 133,544 (0.2) Other taxes due 2,094,774 1,982,596 5.7 Loans and financing 220,490 239,448 (7.9) Debentures 3,107,110 3,150,592 (1.4) Post-employment benefits 18,063,866 14,796,386 22.1 Research and development and Energy efficiency 1,360,092 1,359,303 0.1 Accounts payable related to concession 347,096 311,856 11.3 Sectorial financial liabilities 951,835 959,122 (0.8) Lease liability 237,970 234,221 1.6 Fair value in the purchase and sale of power 313,437 268,621 16.7 Other accounts payable 244,198 224,415 8.8 Provision for allocation of PIS and Cofins credits 613,262 661,273 (7.3) Provisions for legal claims and other provisions 1,883,309 1,934,020 (2.6) EQUITY 23,796,298 23,091,978 3.1 Attributable to controlling shareholders 23,832,389 23,130,019 3.0 Capital 12,821,758 12,821,758 — Capital reserves 28,961 18,638 55.4 Equity valuation adjustments 280,372 287,992 (2.6) Treasury shares (113,237) (113,389) (0.1) Legal reserve 1,900,541 1,900,541 — Profit retention reserve 8,214,541 8,214,479 — Accumulated profit 699,453 — — Attributable to non-controlling interests (36,091) (38,041) (5.1) TOTAL LIABILITIES & EQUITY 62,926,662 60,414,456 4.2 COPEL | 1Q26 | 38 Summary Results Investments GenCo TradeCo DisCo ESG Others Exhibits │CONSOLIDATED RESULTS - Cash Flow R$ mil 03/31/2026 03/31/2025 CASH FLOWS FROM OPERATIONAL ACTIVITIES Net income from continuing operations 694,044 664,667 Adjustments to reconcile net income for the period with cash generation from operating activities: 1,218,200 1,720,700 Unrealized charges and monetary variations - net 821,078 684,147 Interest – bonus from the grant of concession agreements under the quota system (36,691) (36,806) Result of transmission concession contracts (331,878) (204,960) Income tax and social contribution 162,856 228,982 Deferred income tax and social contribution 158,339 41,358 Equity in earnings of investees (69,785) (100,416) Appropriation of post-employment benefits obligations 64,968 59,776 Appropriation of research and development and energy efficiency programs 58,245 46,998 Recognition of fair value of assets from the indemnity for the concession (20,075) (24,016) Sectorial financial assets and liabilities result (770,909) 15,931 Depreciation and amortization 403,049 355,020 Provision arising from the dismissal program 18,894 20,979 Long-Term Incentive Plan - ILP 10,617 2,098 Net operating estimated losses, provisions and reversals 85,601 70,511 Realization of added value in business combinations (786) (181) Fair value in energy purchase and sale operations (47,964) (6,704) Fair value adjustment of debt instruments and Hedge (Swap) (3,938) — Result of write-offs of accounts receivable related to concession 349 1,757 Result of write-offs or disposal of contract assets 1,531 2,114 Result of write-offs or disposal of property, plant and equipment 15 365 Result of write-offs or disposal of intangible assets 20,387 18,211 Result of write-offs of use rights of assets and liabilities of leases – net 253 — Results from asset sales — (109,807) Others — (9,324) Decrease (increase) in assets 236,804 75,705 Trade accounts receivable 277,728 117,931 Dividends and interest on own capital received 6,420 3,743 Judicial deposits 287 6,084 Sectorial financial assets 29,934 16,849 Other receivables (32,446) 10,981 Inventories 10,867 (16,607) Income tax and social contribution recoverable (77,505) (53,651) Other taxes recoverable 23,436 (1,935) Prepaid expenses (1,917) (7,349) Related parties — (341) Increase (decrease) in liabilities (123,863) (338,517) Payroll, social charges and accruals 48,316 21,608 Related parties — 1,310 Suppliers 36,535 (63,474) Other taxes (56,123) 303,631 Post-employment benefits (61,849) (51,824) Sectorial charges due (4,289) (13,615) Research and development and energy efficiency (36,795) (52,244) Payable related to the concession (42,069) (28,443) Other accounts payable 50,371 (409,336) COPEL | 1Q26 | 39 Summary Results Investments GenCo TradeCo DisCo ESG Others Exhibits Provisions for legal claims (57,960) (46,130) CASH GENERATED BY OPERATING ACTIVITIES 1,331,141 1,457,888 Income tax and social contribution paid (168,201) (188,416) Loans and financing - interest due and paid (72,401) (143,677) Debentures - interest due and paid (503,825) (124,643) Lease liabilities - interest paid (8,234) (8,479) NET CASH GENERATED FROM OPERATING ACTIVITIES 578,480 992,673 CASH FLOWS FROM INVESTMENT ACTIVITIES Financial investments (155,097) (17,115) Additions to contract assets -523,448 -549,349 Additions to property, plant and equipment -47,349 -17,001 Disposal of property, plant and equipment — 1,071 Additions to intangible assets (11,600) (5,156) Investment disposial 174,892 276,938 NET CASH USED FROM INVESTING ACTIVITIES (562,602) (310,612) CASH FLOWS FROM FINANCING ACTIVITIES Loans and financing obtained from third parties 550,000 — Transaction costs of loans and financing obtained from third parties (213) — Issue of debentures 3,200,000 2,000,000 Transaction costs in the issuing of debentures (104,318) (22,632) Payments of principal - loans and financing (602,200) (565,351) Payments of principal - debentures (2,493) (111,808) Payments of principal of lease liabilities (15,403) (16,822) Share buyback — (70,040) Dividends and interest on own capital paid (996,263) -3 NET CASH GENERATED (USED) FROM FINANCING ACTIVITIES 2,029,110 1,213,344 TOTAL EFFECTS ON CASH AND CASH EQUIVALENTS 2,044,988 1,895,405 Cash and cash equivalents at the beginning of the period 3,130,363 4,161,939 Cash and cash equivalents at the end of the period 5,175,351 6,055,823 Cash and cash equivalents from assets classified as held for sale — 1,521 CHANGE IN CASH AND CASH EQUIVALENTS 2,044,988 1,895,405 COPEL | 1Q26 | 40 Summary Results Investments GenCo TradeCo DisCo ESG Others Exhibits │CONSOLIDATED RESULTS - Adjusted Ebitda and Financial Result R$ '000 RECURRING EBITDA 1Q26 1Q25 Δ% EBITDA 1,907.9 1,736.5 987 % (-/+) Fair value in the purchase and sale of energy (48.0) (6.7) 616.4 (-/+) Provision (reversal) Incentive Dismissal Program 18.9 21.0 (10.0) (-/+) Assets disposal /swap — (109.8) (100.0) (-/+) Ebitda from discontinued Operations (69.8) (100.4) (30.5) (-/+) Curtailment reimbursement (20.1) (24.0) (16.3) (-/+) Equity Income (34.3) (13.4) 156.0 (-/+)NRV 1,754.6 1,503.2 16.7 (+/-)Difference in Revenue from Corporate/Regulatory Transfer (see item 3.1.1) RECURRING EBITDA 1Q26 1Q25 Δ% 332946 297640 11.86198091 65435 160093 154613 3.544333270 81165 Financial Revenues 76,724 78,750 (2.6) Income from investments held for trading 34,139 43,413 (21.4) Late fees on electricity bills 9,821 7,764 26.5 Interest on taxes to be compensated 8,098 11,434 (29.2) Monetary restatement and adjustment to present value of accounts payable related to concession 22,029 2,364 831.9 Income and monetary restatement of judicial deposits 2,102 — — Income from sectorial assets and liabilities 12,990 — — Adjust the fair value of debentures (12,682) (13,804) (8.1) (-) Pis/Pasep and Cofins on revenues 19,632 13,106 49.8 Other financial revenues 822,509 744,165 10.5 Financial Expenses 733,695 604,490 21.4 Monetary variation, foreign exchange and debt service charges 42,497 48,399 (12.2) Monetary variation and adjustment to present value of accounts payable related to concession — 14,358 (100.0) Income from sectorial assets and liabilities (NE nº 8) (5,375) 15,983 — Monetary variation of litigation 11,629 24,869 (53.2) Uptade of provision for allocation of Pis and Cofins credits (5,338) — — Swap effect on debentures 16,492 — — Interest on lease liabilities 8,232 8,480 (2.9) Interest on tax installments — — — Interest on R&D and PEE 5,450 5,572 (2.2) Adjust the fair value of debentures — — — Pis/ Pasep and Cofins taxes over interest on equity — — — Other financial expenses 15,227 22,014 (30.8) Financial income (expenses) (489,563) (446,525) 9.6 COPEL | 1Q26 | 41 Summary Results Investments GenCo TradeCo DisCo ESG Others Exhibits │RESULT BY SUBSIDIARY - COPEL GET R$ '000 Income Statement 1Q26 1Q25 Δ% OPERATING REVENUES 1,579,188 1,239,547 27.4 Electricity sales to distributors 1,121,833 900,452 24.6 Use of the main transmission grid 394,601 273,671 44.2 Construction revenue 54,007 55,107 (2.0) Other operating revenues 8,747 10,317 (15.2) OPERATING COSTS AND EXPENSES (716,829) (518,689) 38.2 Electricity purchased for resale (120,214) (24,087) 399.1 Charges of main distribution and transmission grid (121,000) (132,766) (8.9) Personnel and management (85,899) (84,306) 1.9 Pension and healthcare plans (20,089) (18,180) 10.5 Materials and supplies (10,885) (4,659) 133.6 Third-party services (47,917) (67,927) (29.5) Depreciation and amortization (190,155) (176,873) 7.5 Provisions and reversals (1,778) (1,962) (9.4) Construction cost (56,170) (50,607) 11.0 Other cost and expenses (62,722) 42,678 — EQUITY IN EARNINGS OF SUBSIDIARIES 71,639 100,437 (28.7) PROFIT BEFORE FINANCIAL RESULTS AND TAXES 933,998 821,295 13.7 FINANCIAL RESULTS (246,217) (257,103) (4.2) Financial income 125,106 91,894 36.1 Financial expenses (371,323) (348,997) 6.4 OPERATIONAL EXPENSES/ INCOME 687,781 564,192 21.9 INCOME TAX AND SOCIAL CONTRIBUTION ON PROFIT (213,411) (148,148) 44.1 Income tax and social contribution on profit (112,173) (122,176) (8.2) Deferred income tax and social contribution on profit (101,238) (25,972) 289.8 NET INCOME continuing operations 474,370 416,044 14.0 NET INCOME discontinued operations — — - NET INCOME 474,370 416,044 14.0 Attributed to shareholders of the parent company - continuing operations 474,370 416,044 14.0 Attributed to non-controlling shareholders — — - EBITDA continuing operations 1,124,153 998,168 12.6 COPEL | 1Q26 | 42 Summary Results Investments GenCo TradeCo DisCo ESG Others Exhibits │RESULT BY SUBSIDIARY - COPEL DIS R$ '000 Income Statement 1Q26 1Q25 Δ% OPERATING REVENUES 4,924,766 4,304,765 14.4 Electricity sales to final customers 1,725,106 1,783,667 (3.3) Electricity sales to distributors 24,000 31,003 (22.6) Use of the main distribution grid 1,788,069 1,769,147 1.1 Construction revenue 522,761 584,584 (10.6) Fair value of assets from the indemnity for the concession 20,075 24,016 (16.4) Sectorial assets and liabilities result 699,600 (14,456) — Other operating revenues 145,155 126,804 14.5 OPERATING COSTS AND EXPENSES (4,358,564) (3,767,686) 15.7 Electricity purchased for resale (2,386,639) (1,847,182) 29.2 Charges of main transmission grid (708,425) (656,801) 7.9 Personnel and management (158,656) (142,379) 11.4 Pension and healthcare plans (43,059) (39,773) 8.3 Materials and supplies (14,244) (17,806) (20.0) Third-party services (195,675) (200,707) (2.5) Depreciation and amortization (202,972) (167,658) 21.1 Provisions and reversals (80,536) (69,705) 15.5 Construction cost (522,761) (584,584) (10.6) Other cost and expenses (45,597) (41,091) 11.0 PROFIT BEFORE FINANCIAL RESULTS AND TAXES 566,202 537,079 5.4 FINANCIAL RESULTS (241,045) (192,380) 25.3 Financial income 168,946 152,928 10.5 Financial expenses (409,991) (345,308) 18.7 OPERATIONAL EXPENSES/ INCOME 325,157 344,699 (5.7) INCOME TAX AND SOCIAL CONTRIBUTION ON PROFIT (105,940) (112,277) (5.6) Income tax and social contribution on profit (48,680) (95,565) (49.1) Deferred income tax and social contribution on profit (57,260) (16,712) 242.6 NET INCOME (LOSS) 219,217 232,422 (5.7) EBITDA 769,174 704,737 9.1 COPEL | 1Q26 | 43 Summary Results Investments GenCo TradeCo DisCo ESG Others Exhibits │RESULT BY SUBSIDIARY - COPEL COM R$ '000 Income Statement 1Q26 1Q25 Δ% OPERATING REVENUES 1,269,034 956,242 32.7 Electricity sales to final customers 271,130 408,616 (33.6) Electricity sales to distributors 948,822 539,845 75.8 Other operating revenues 49,082 7,781 530.8 OPERATING COSTS AND EXPENSES (1,242,370) (928,809) 33.8 Electricity purchased for resale (1,231,547) (920,657) 33.8 Personnel and management (7,124) (3,653) 95.0 Pension and healthcare plans (464) (438) 5.9 Materials and supplies (12) (160) (92.5) Third-party services (936) (1,048) (10.7) Depreciation and amortization (506) (429) 17.9 Provisions and reversals 71 (1,097) (106.5) Other cost and expenses (1,852) (1,327) 39.6 PROFIT BEFORE FINANCIAL RESULTS AND TAXES 26,664 27,433 (2.8) FINANCIAL RESULTS 5,422 10,712 (49.4) Financial income 5,536 10,874 (49.1) Financial expenses (114) (162) (29.6) OPERATIONAL EXPENSES/ INCOME 32,086 38,145 (15.9) INCOME TAX AND SOCIAL CONTRIBUTION ON PROFIT (11,043) (13,010) (15.1) Income tax and social contribution on profit — (11,134) (100.0) Deferred income tax and social contribution on profit (11,043) (1,876) 488.6 NET INCOME (LOSS) 21,043 25,135 (16.3) EBITDA 27,170 27,862 (2.5) % COPEL | 1Q26 | 44 Summary Results Investments GenCo TradeCo DisCo ESG Others Exhibits 45 Summary Results Investments GenCo TradeCo DisCo ESG Others Exhibits
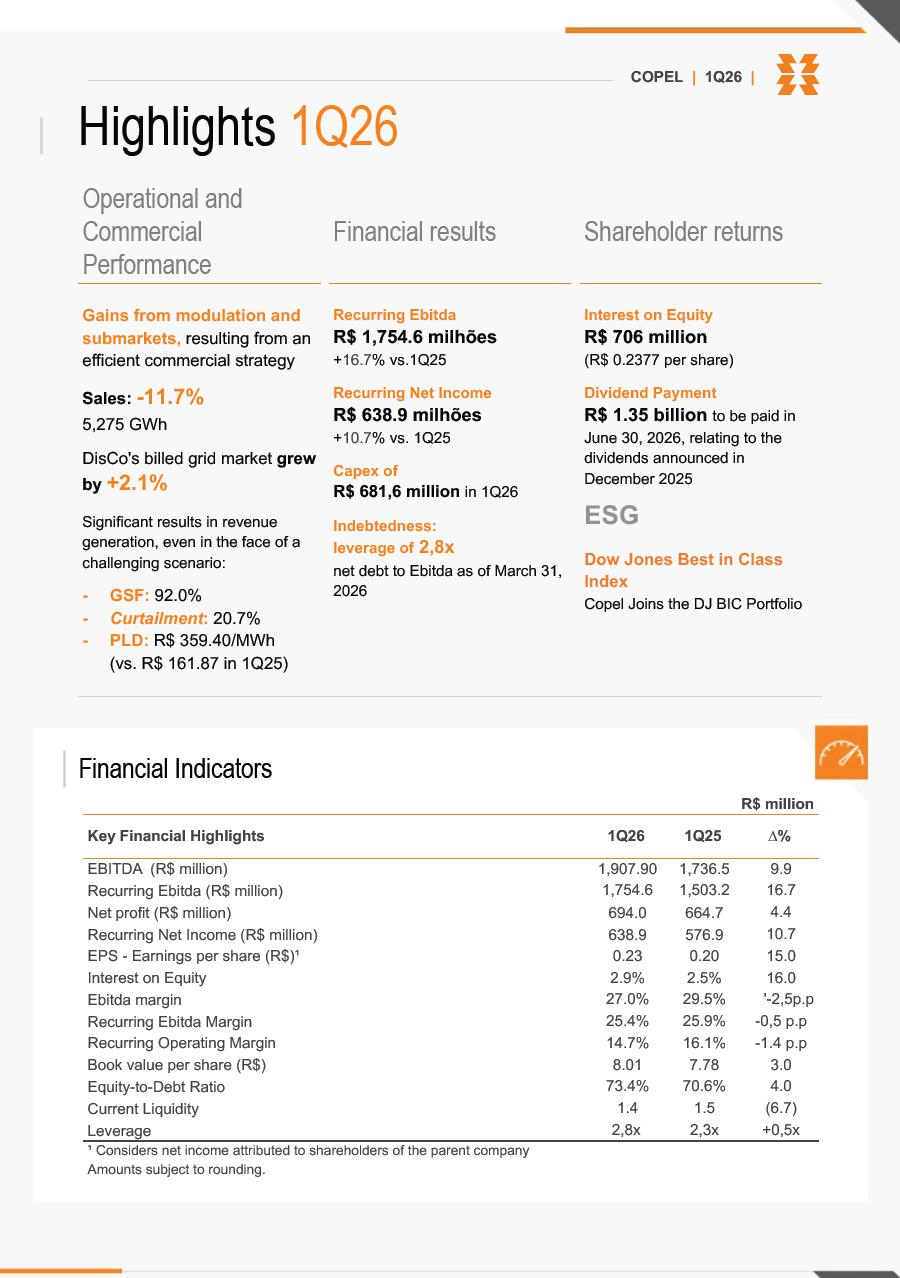
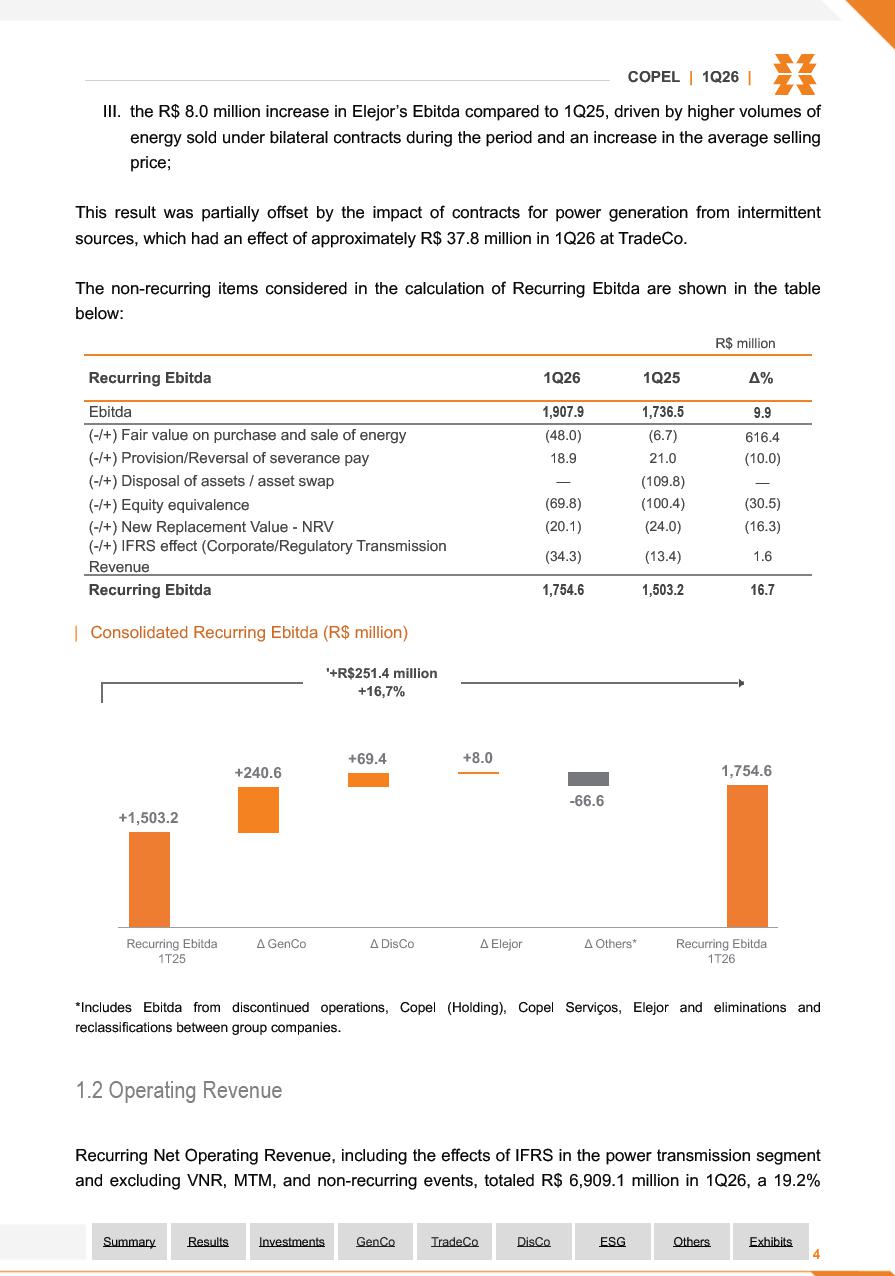
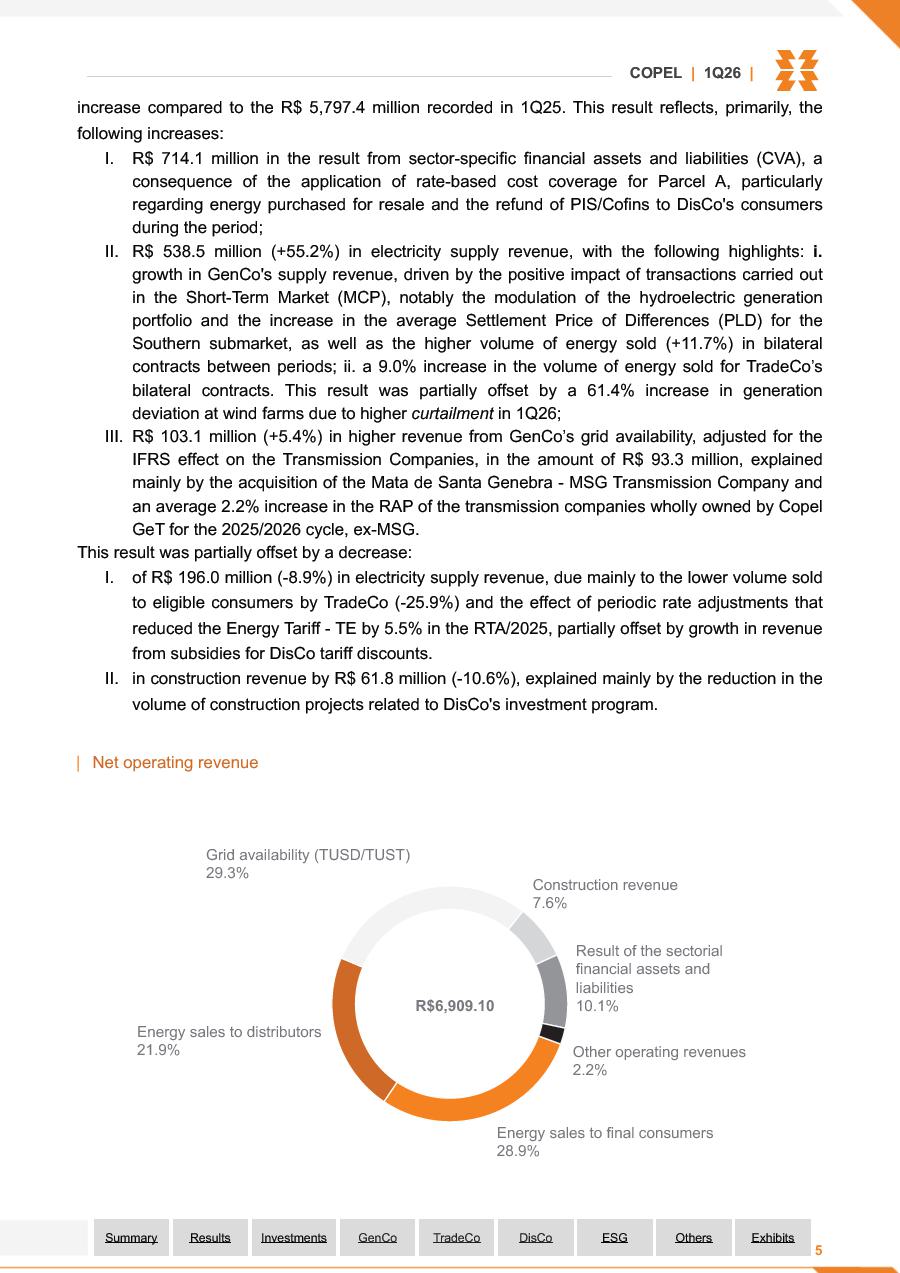
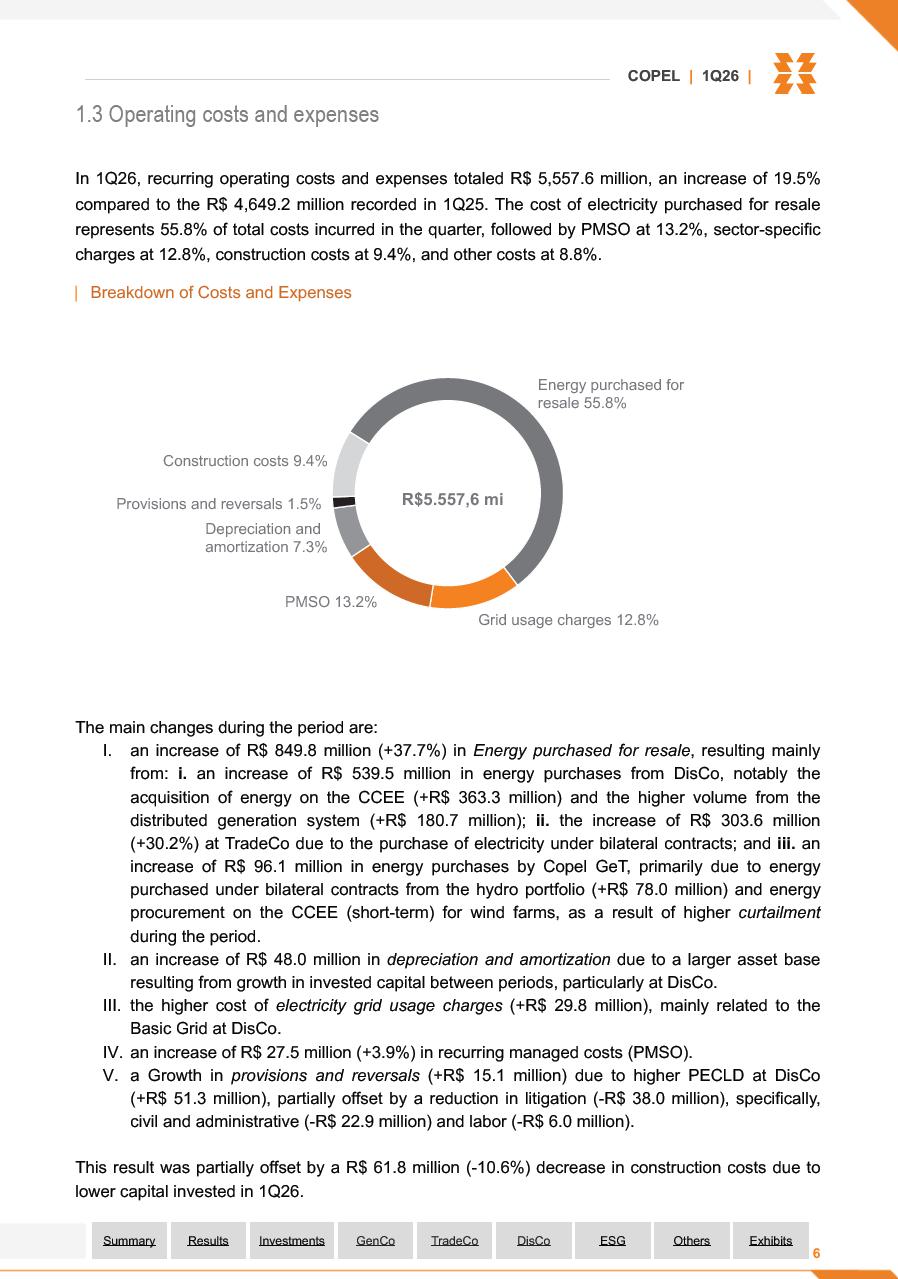
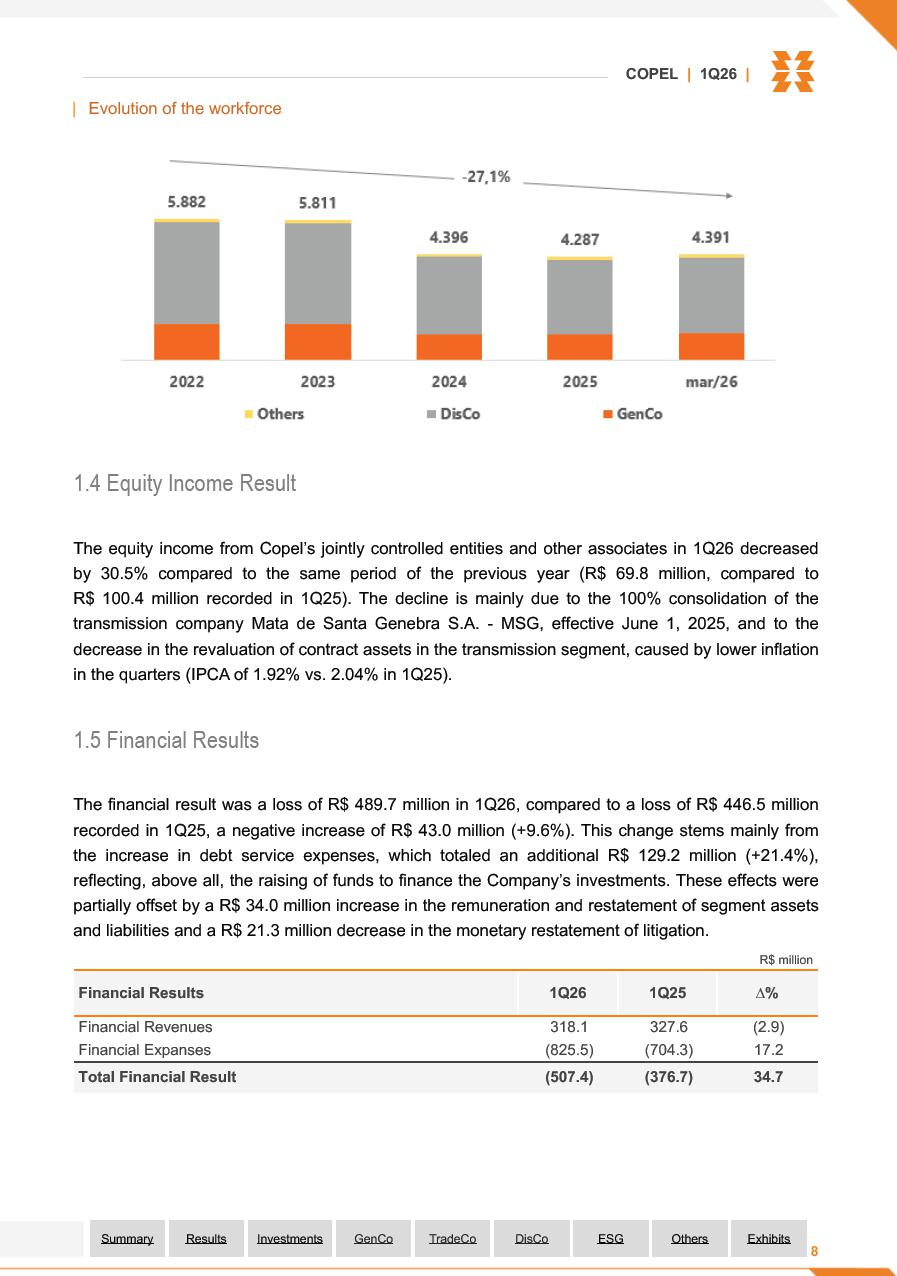
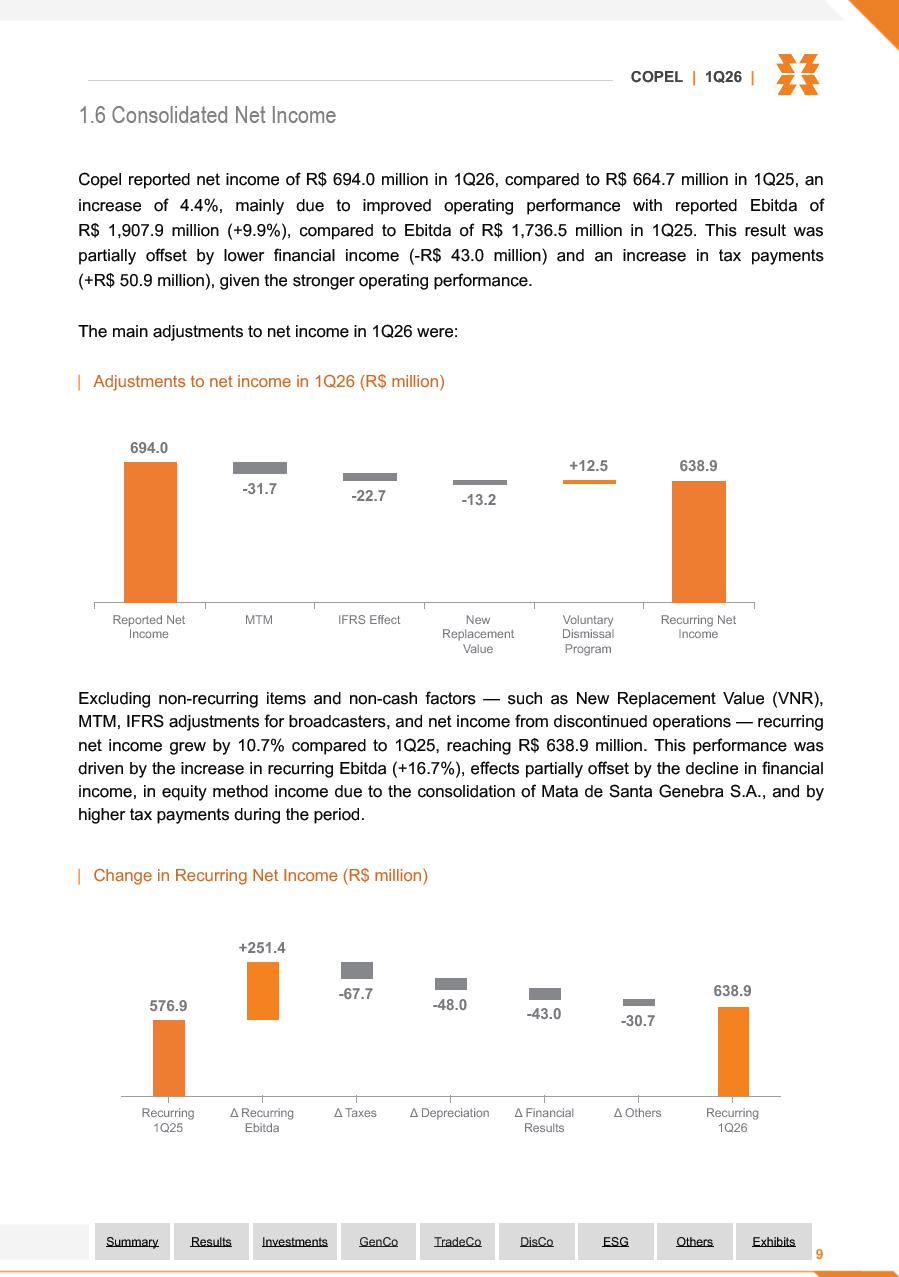
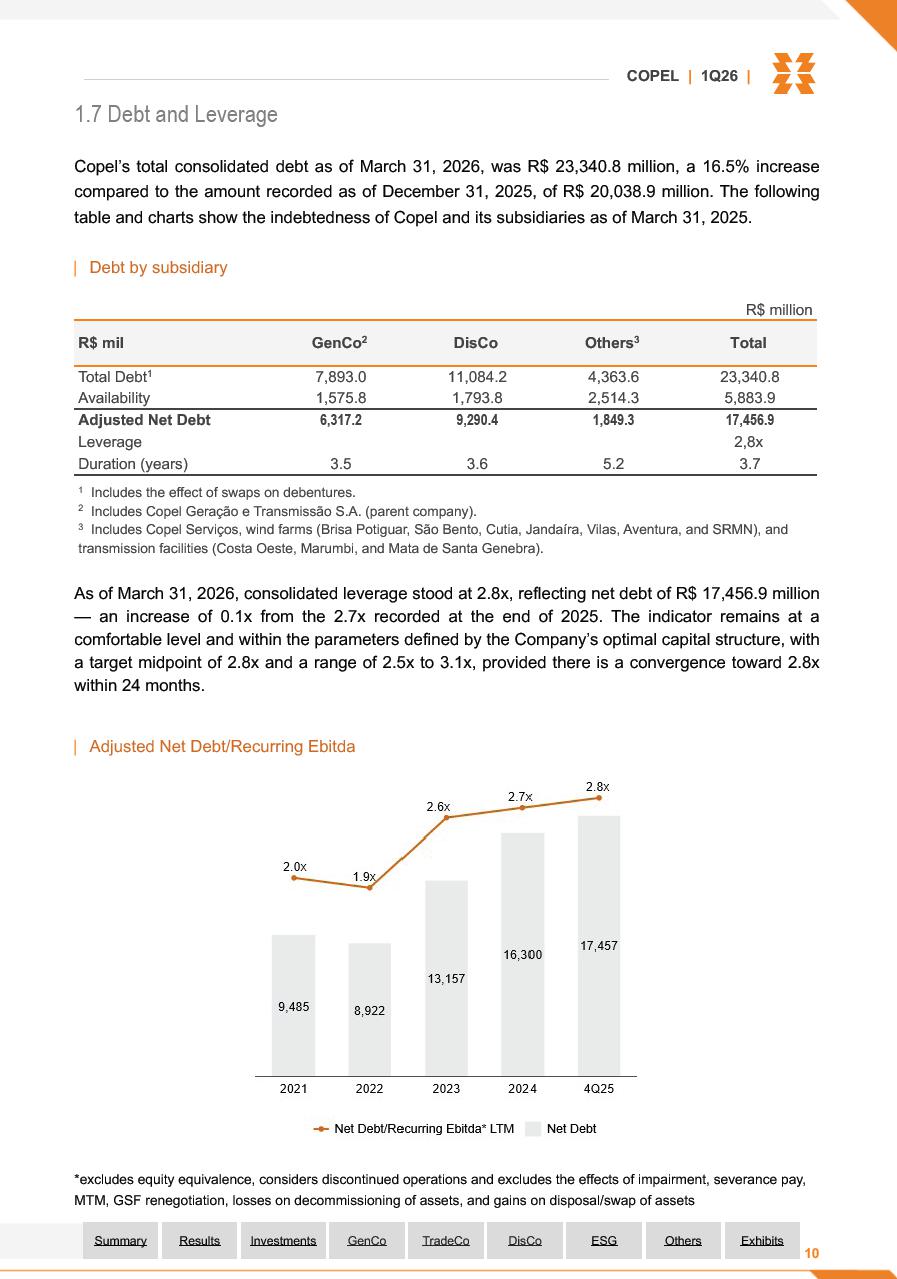
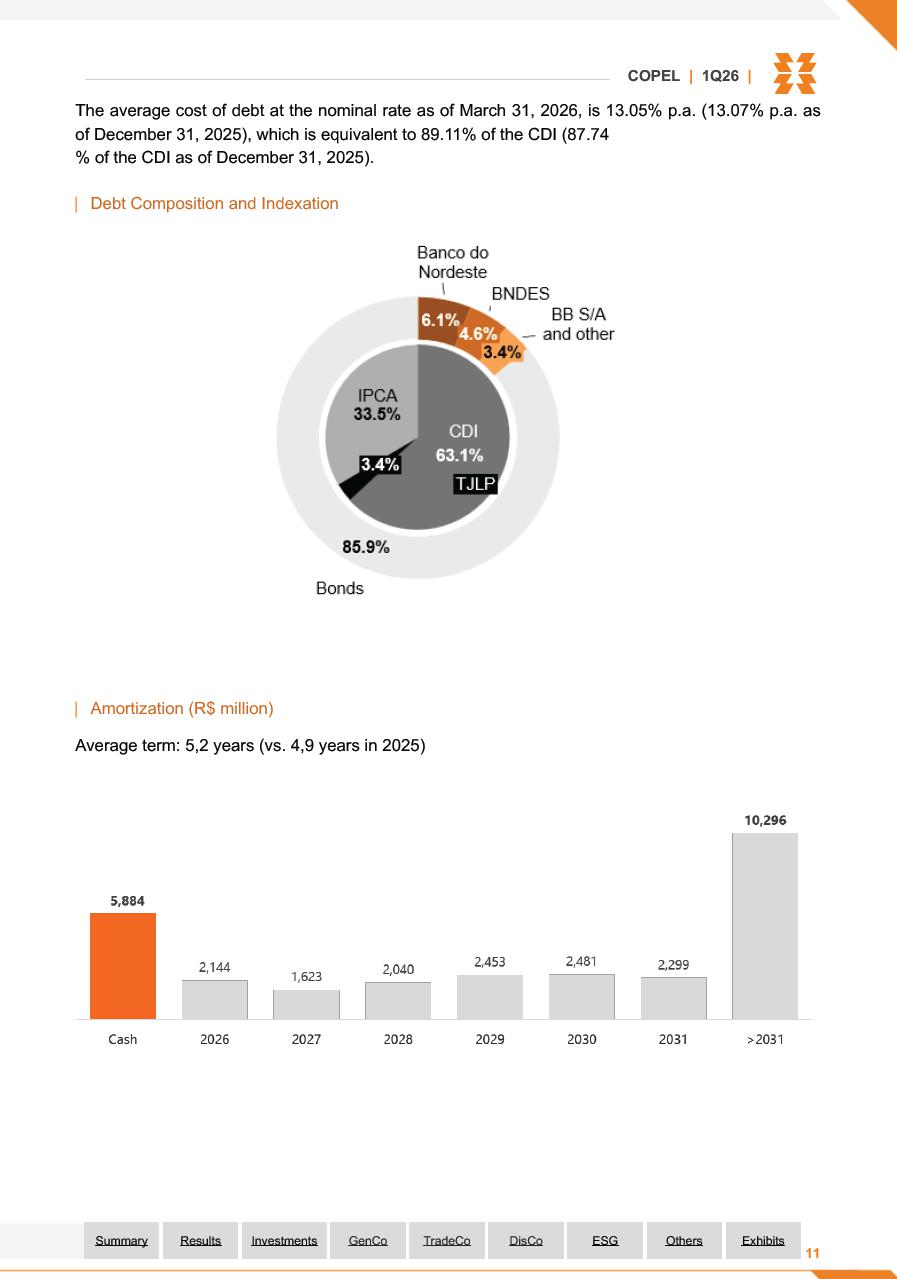
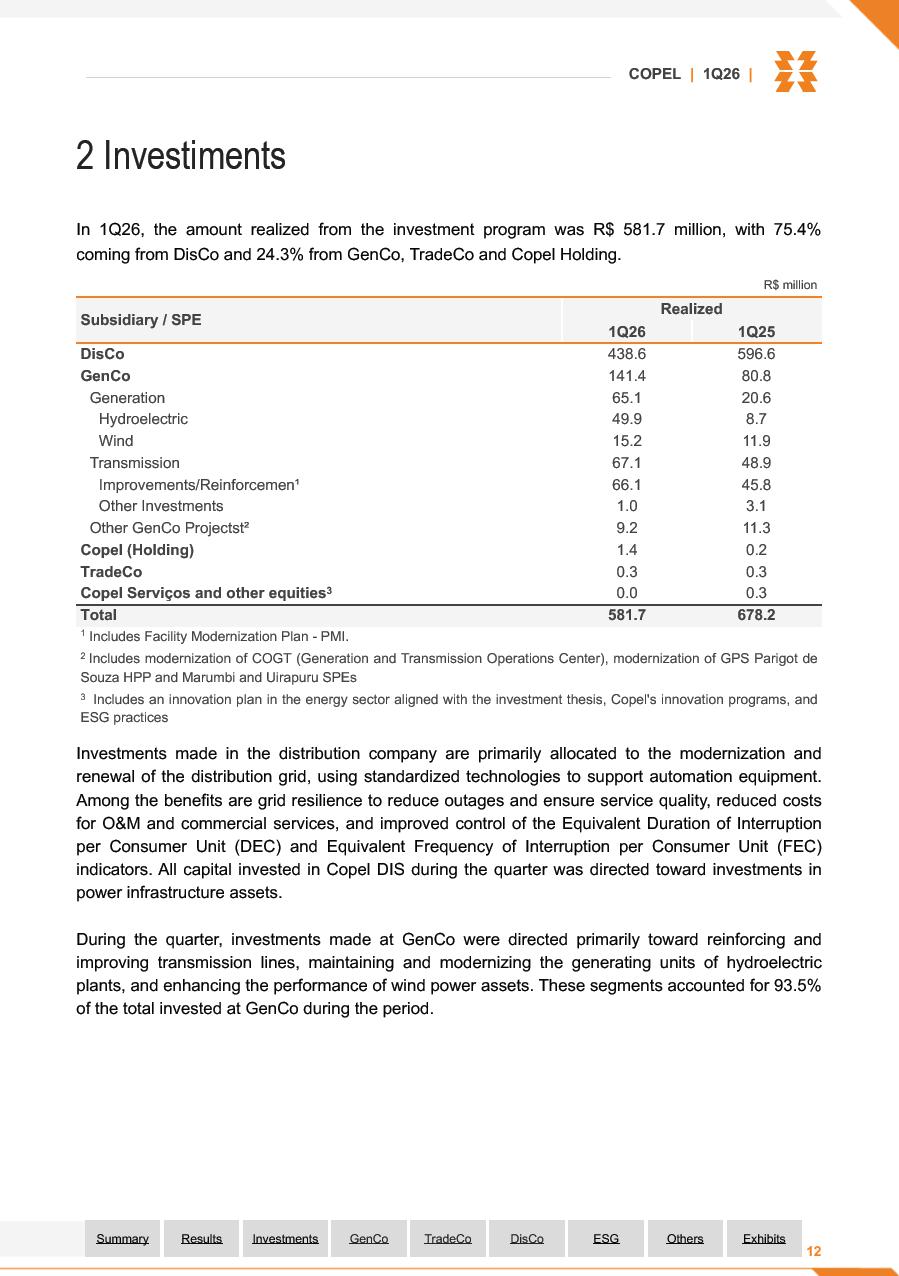
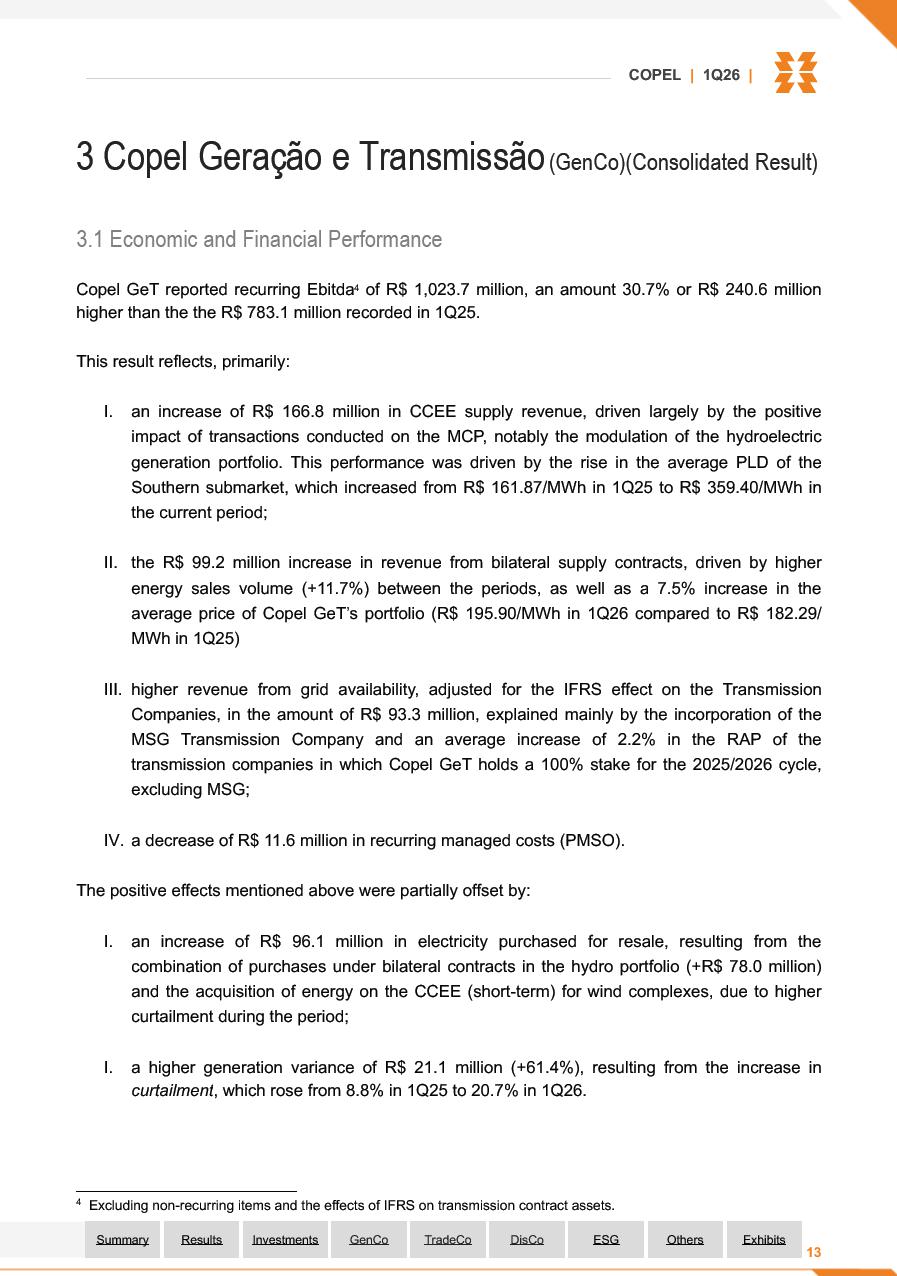
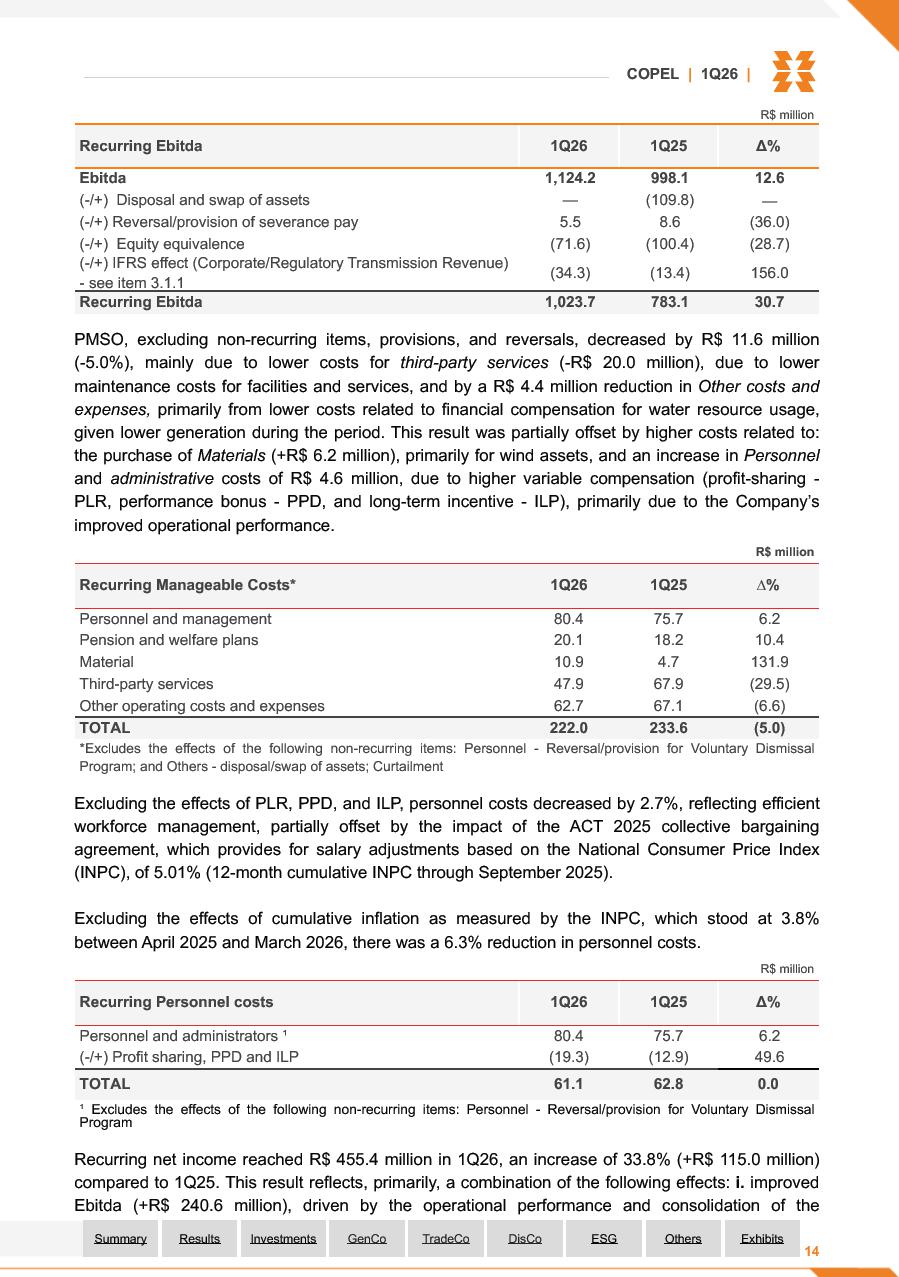
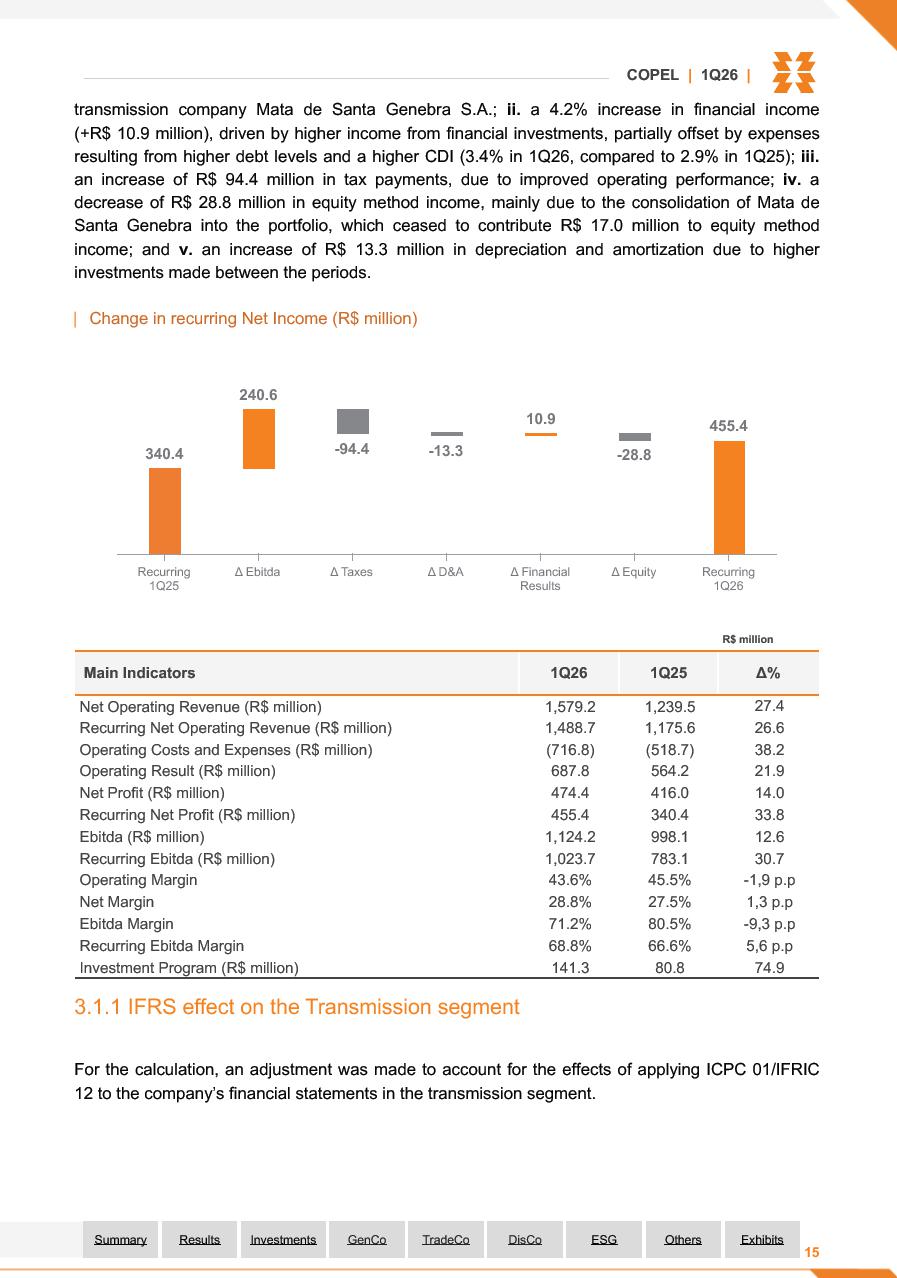
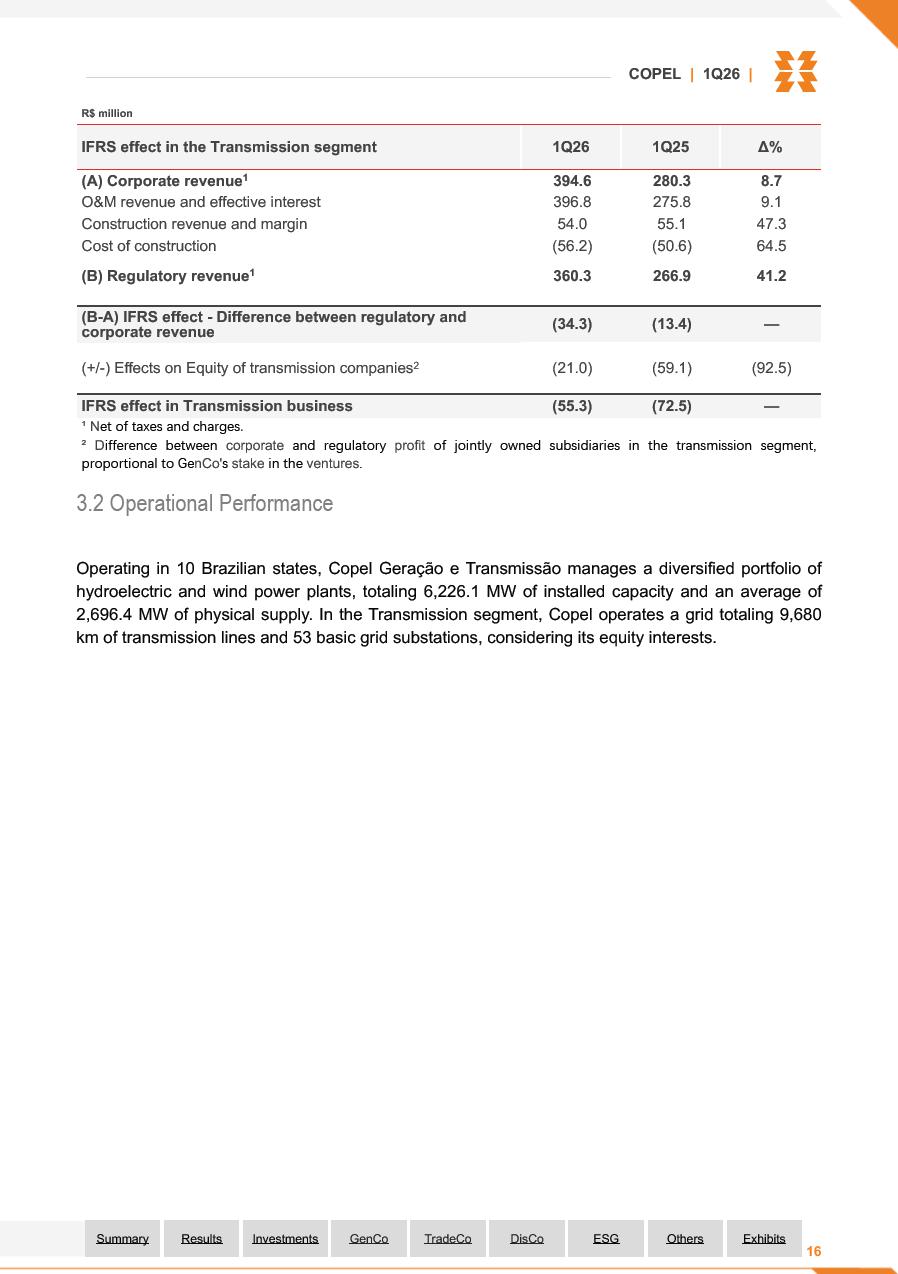
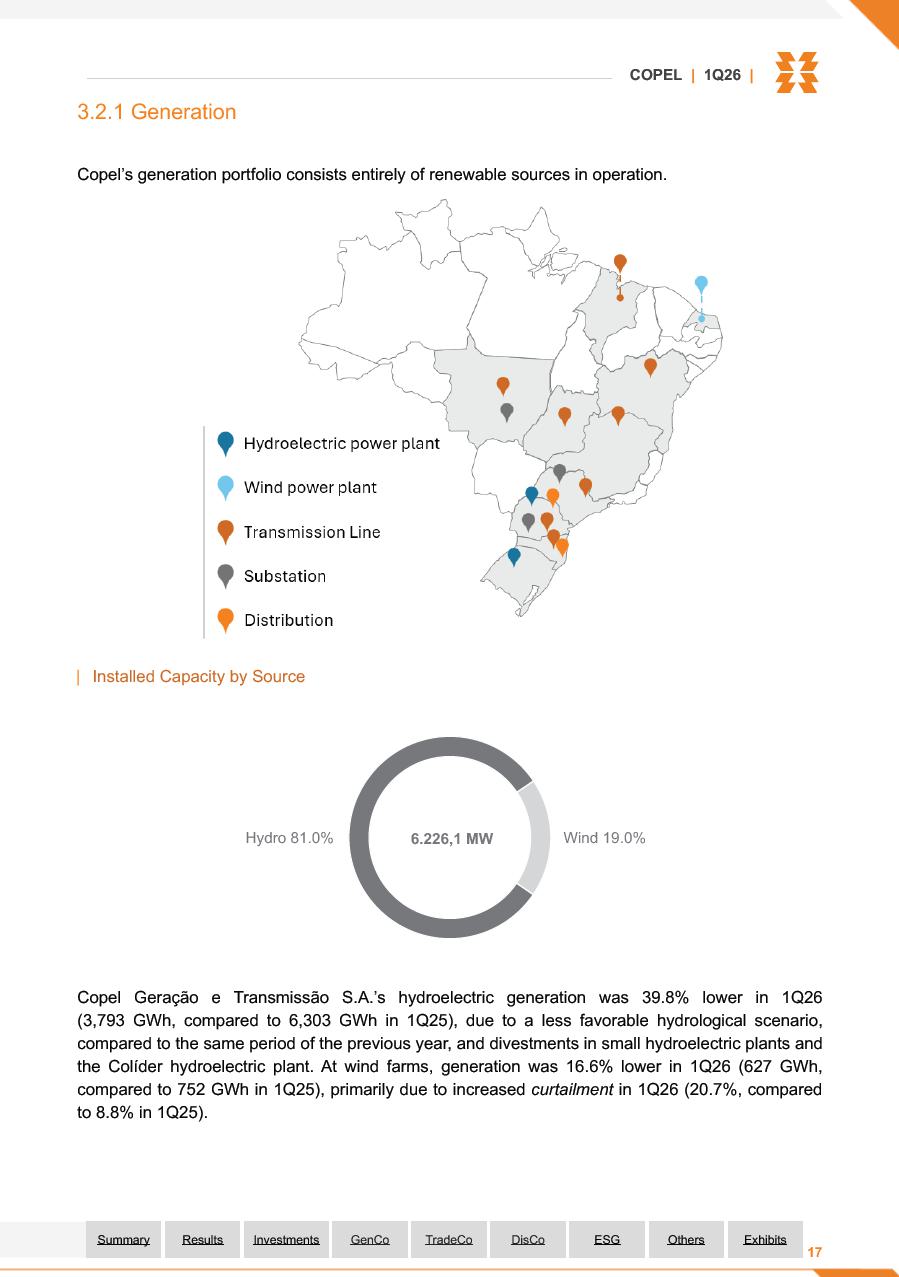
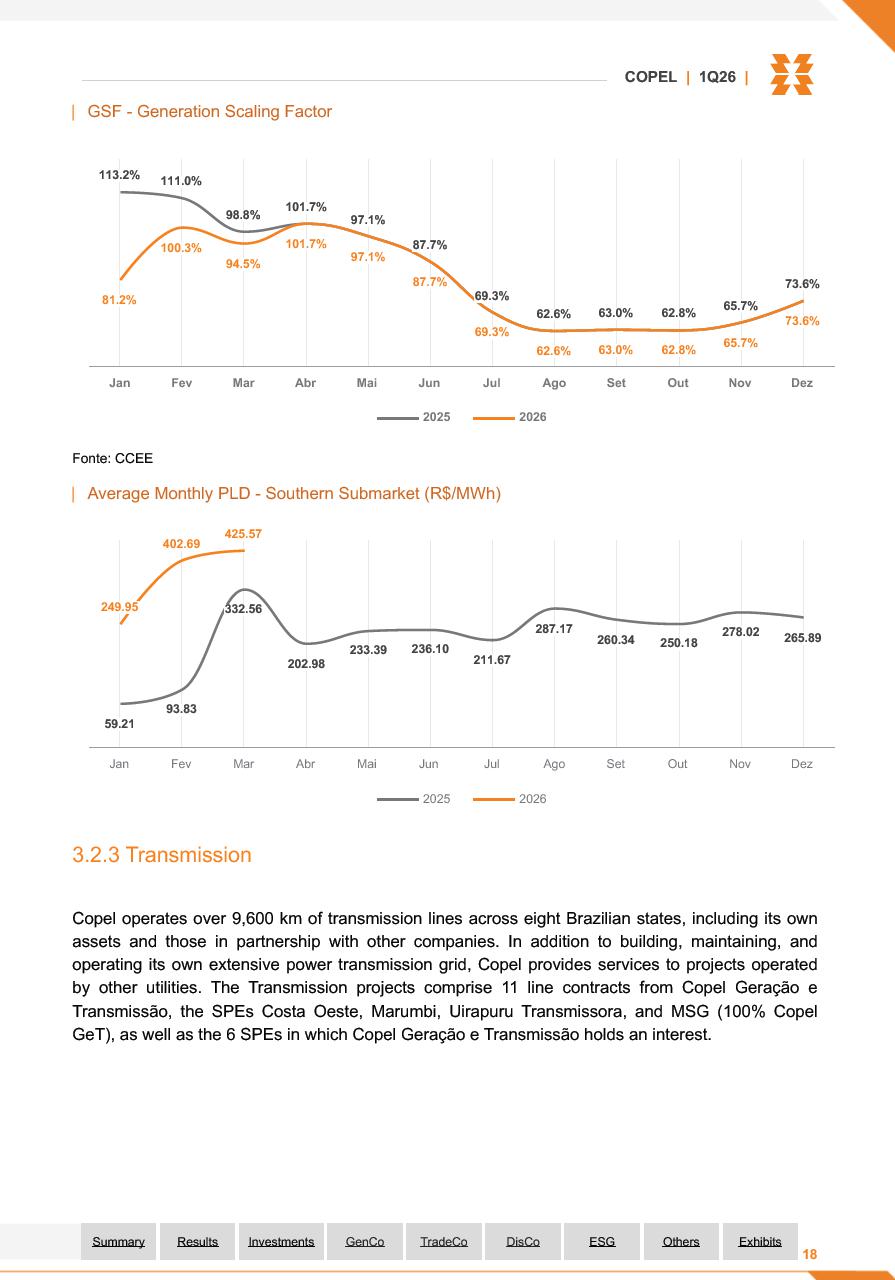
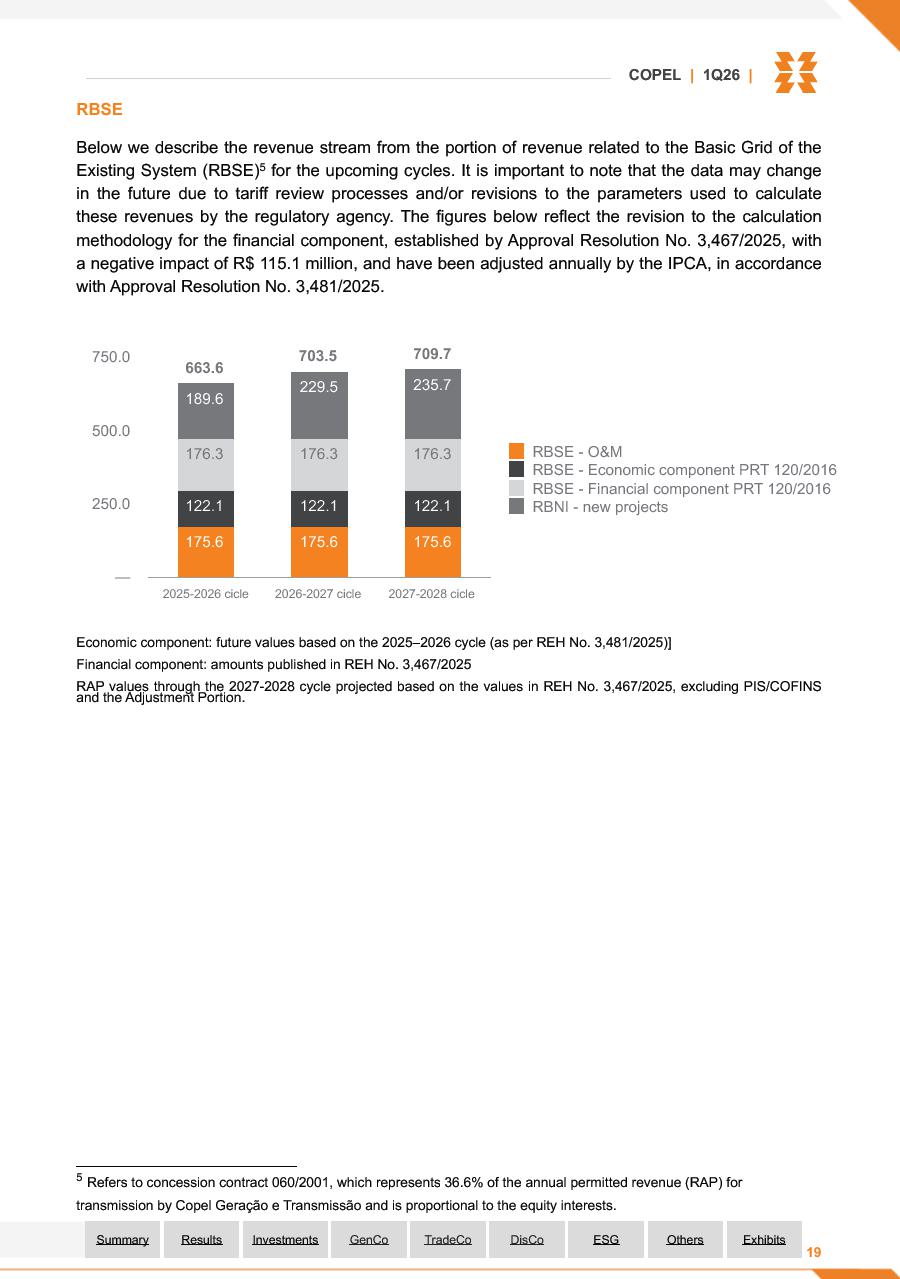
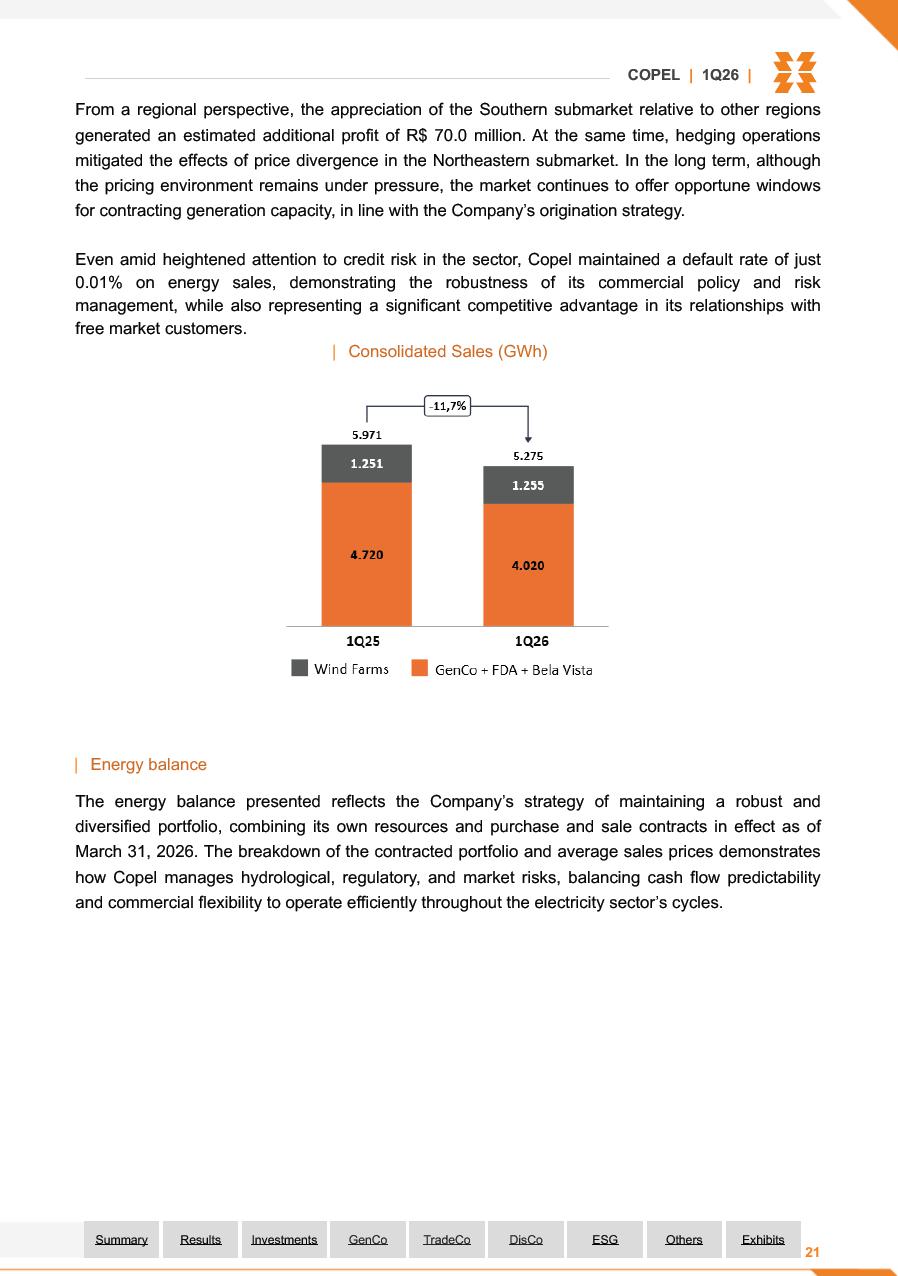
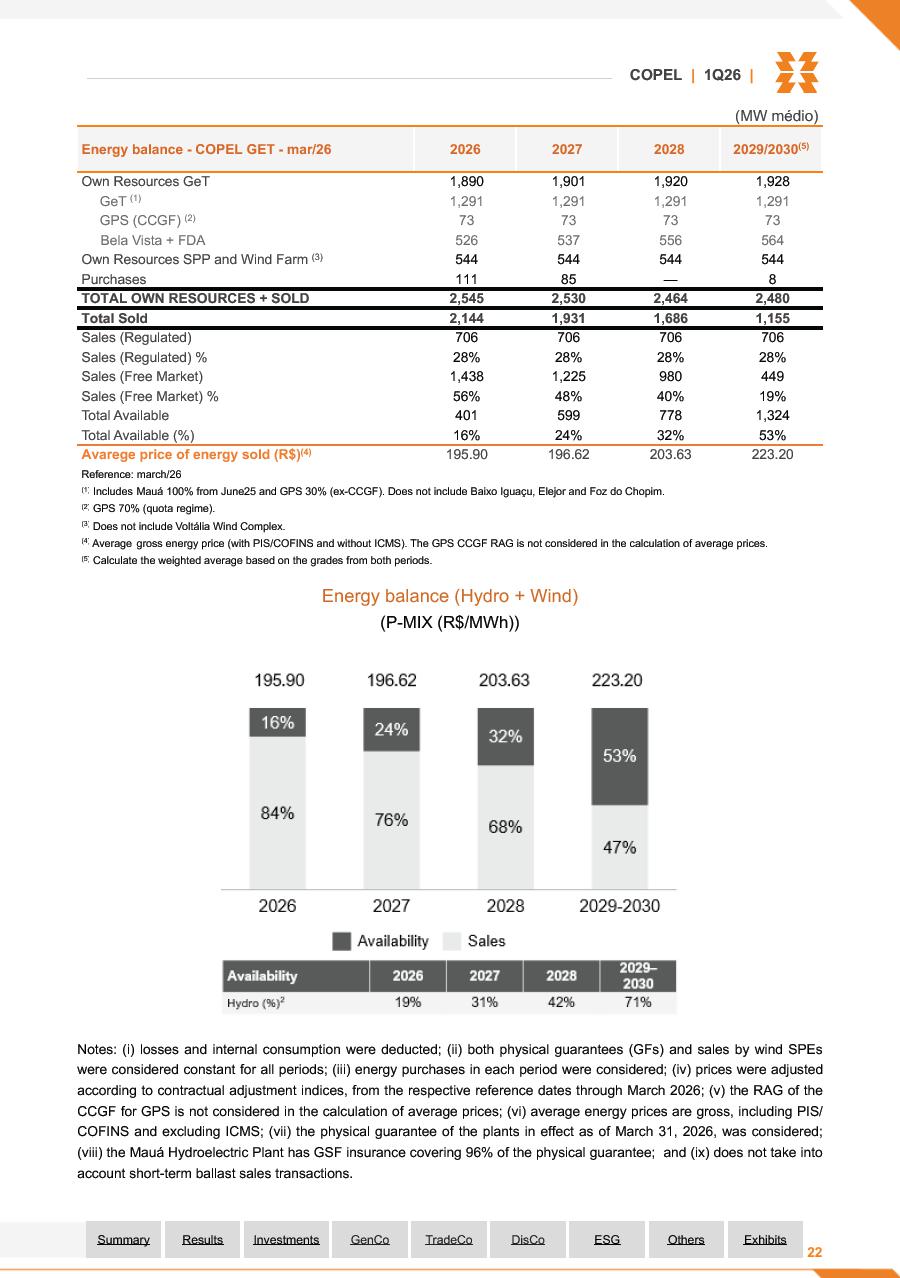
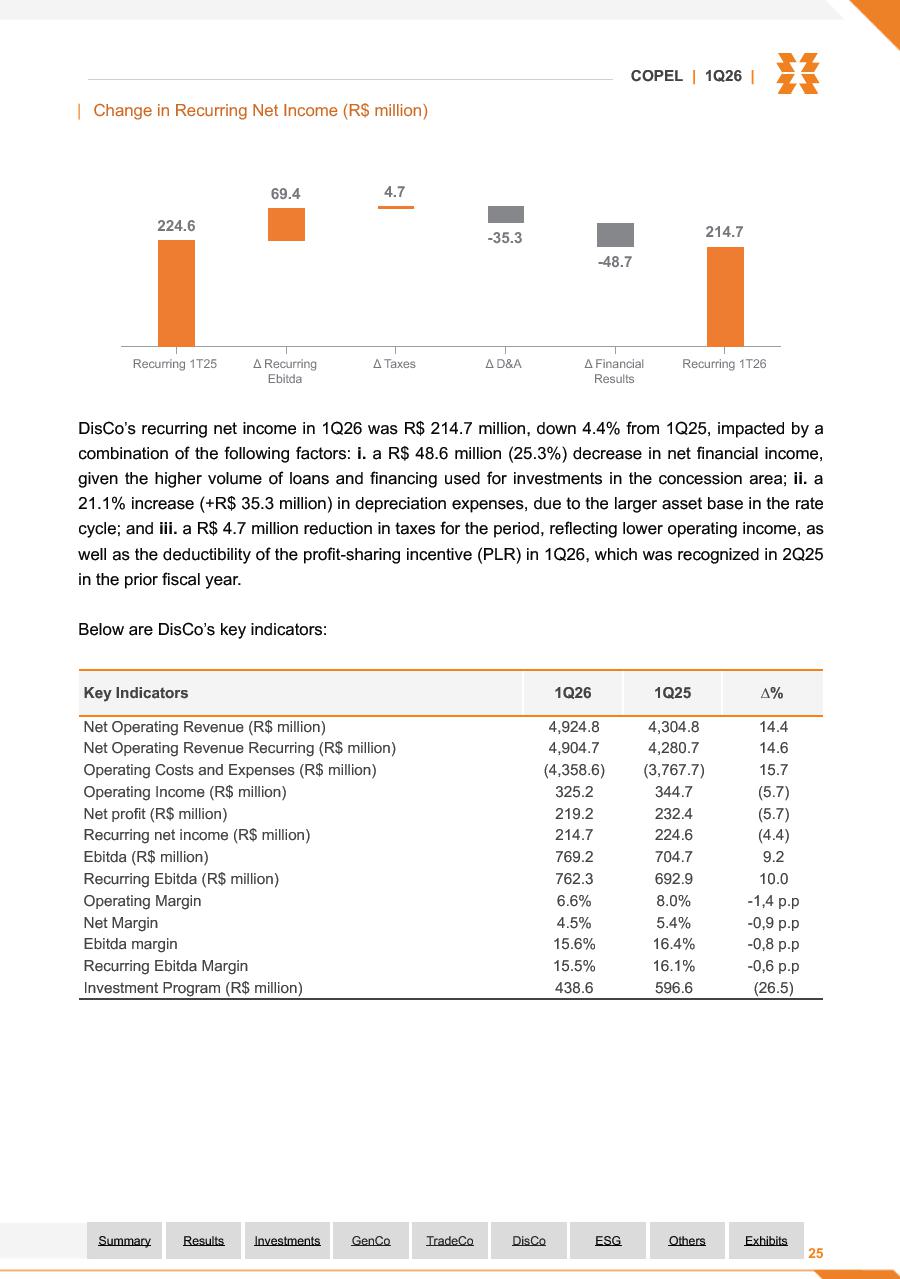
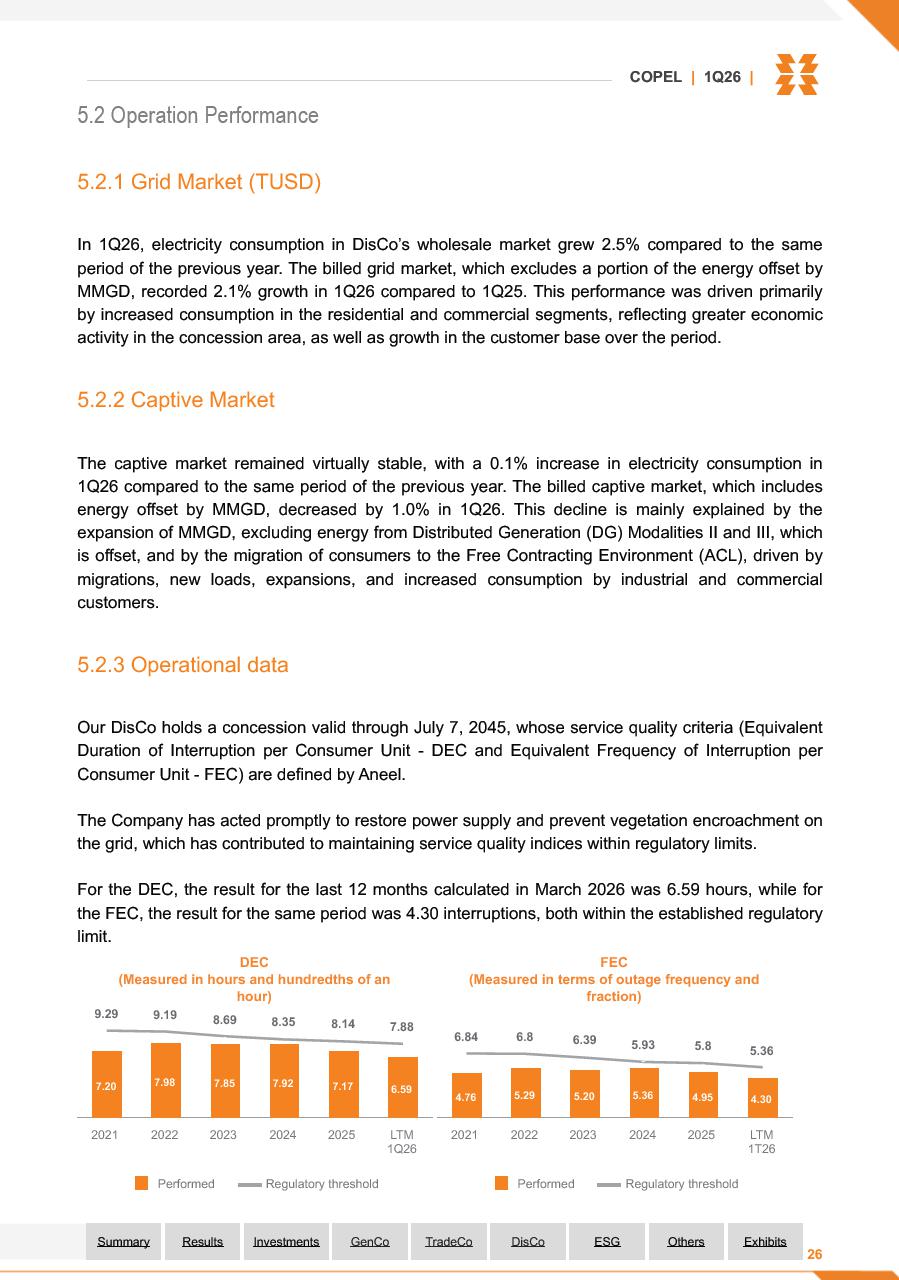
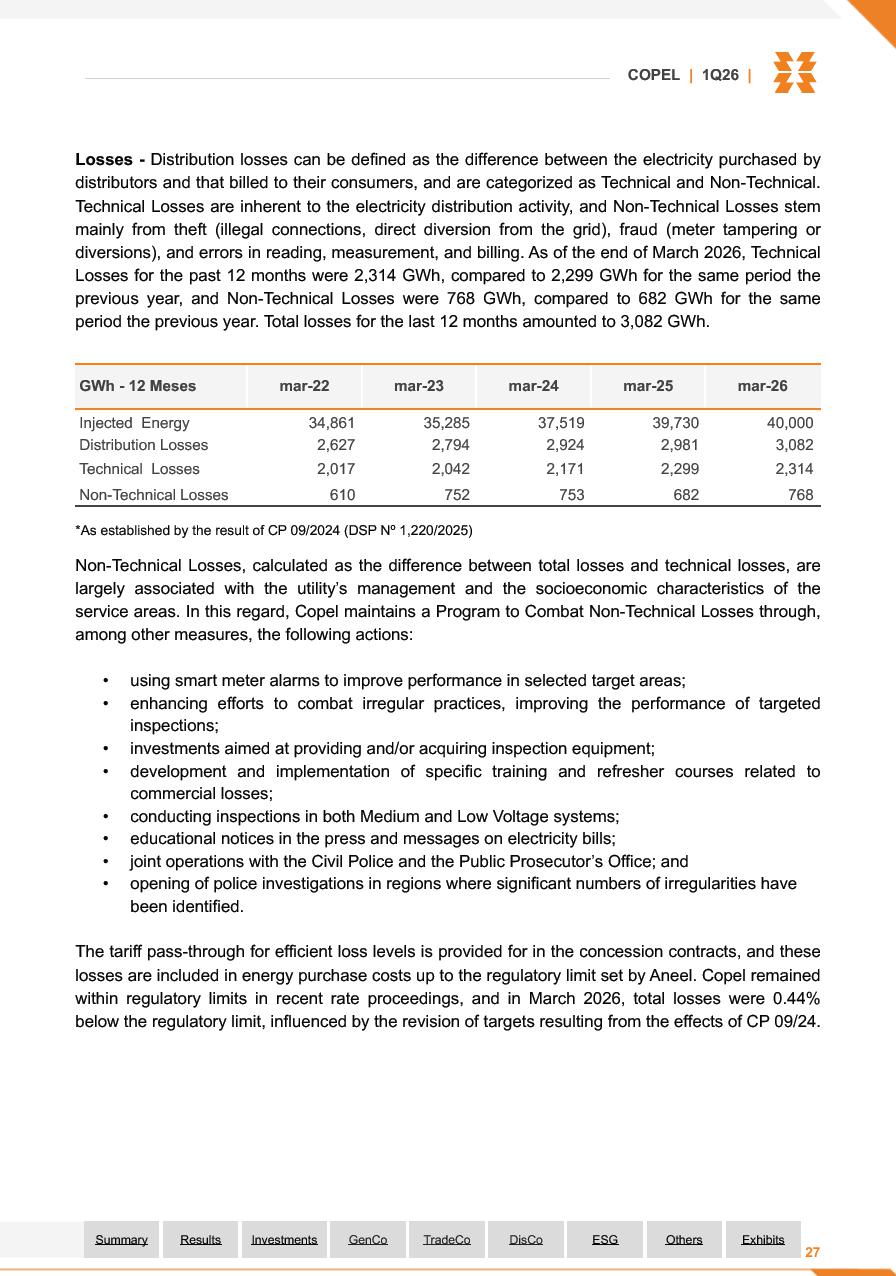
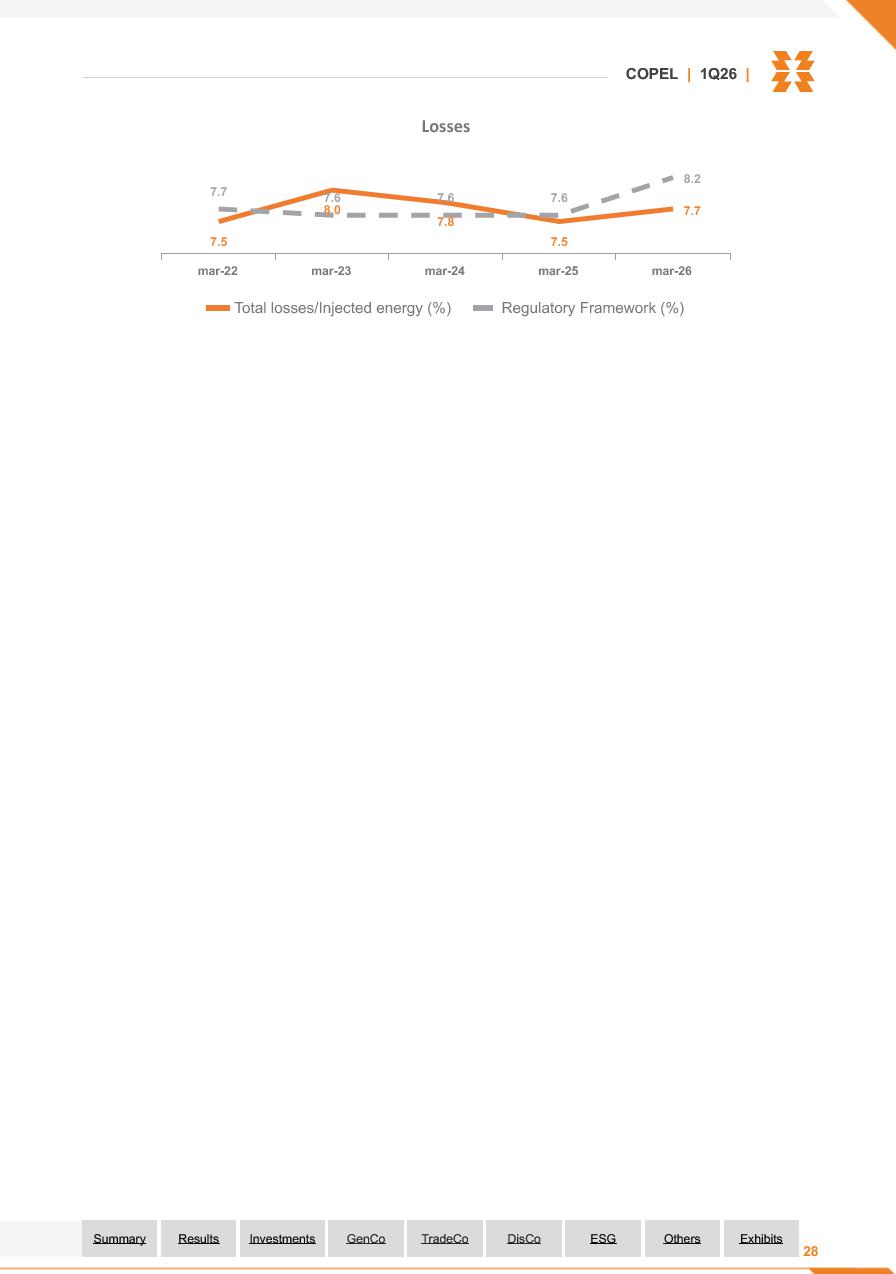
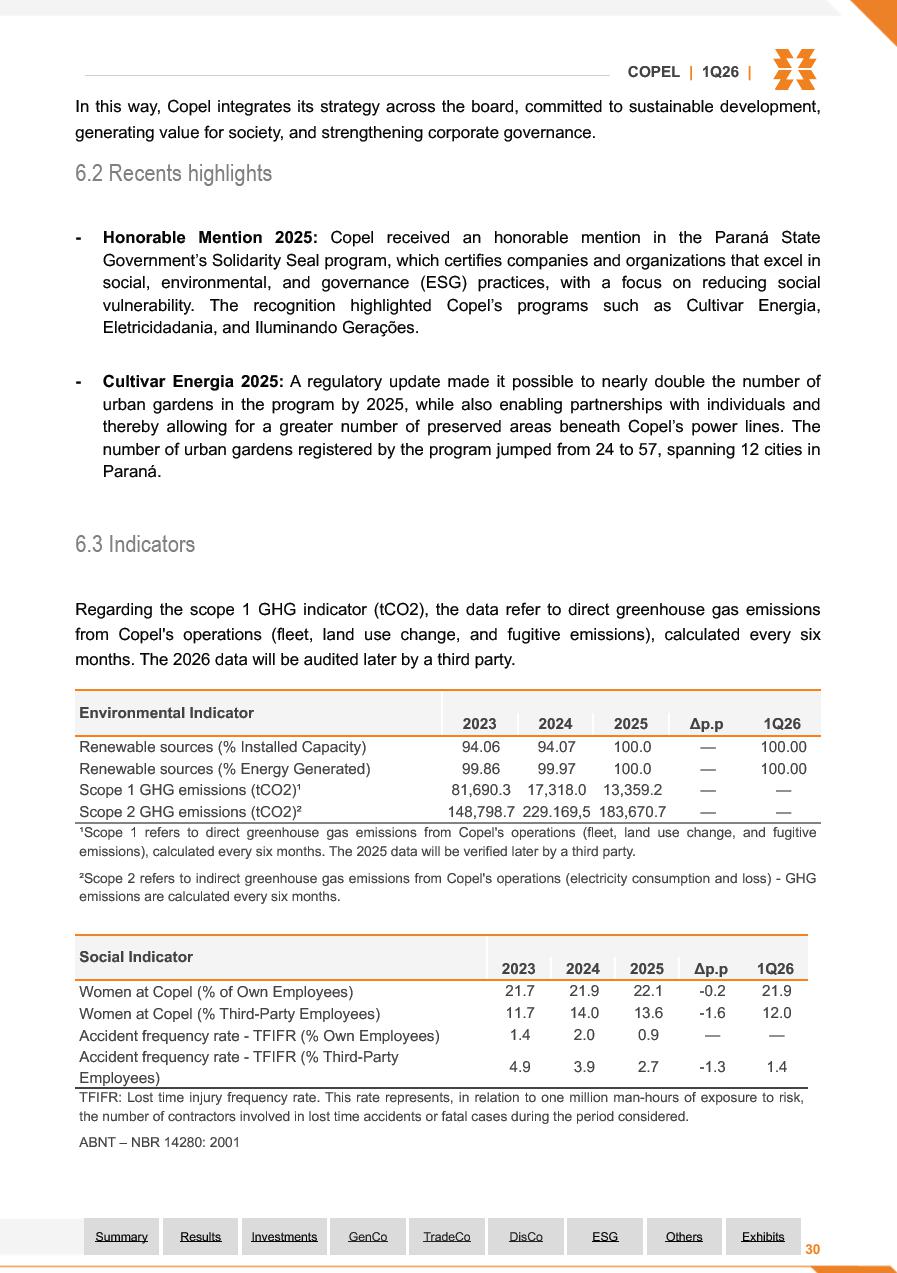
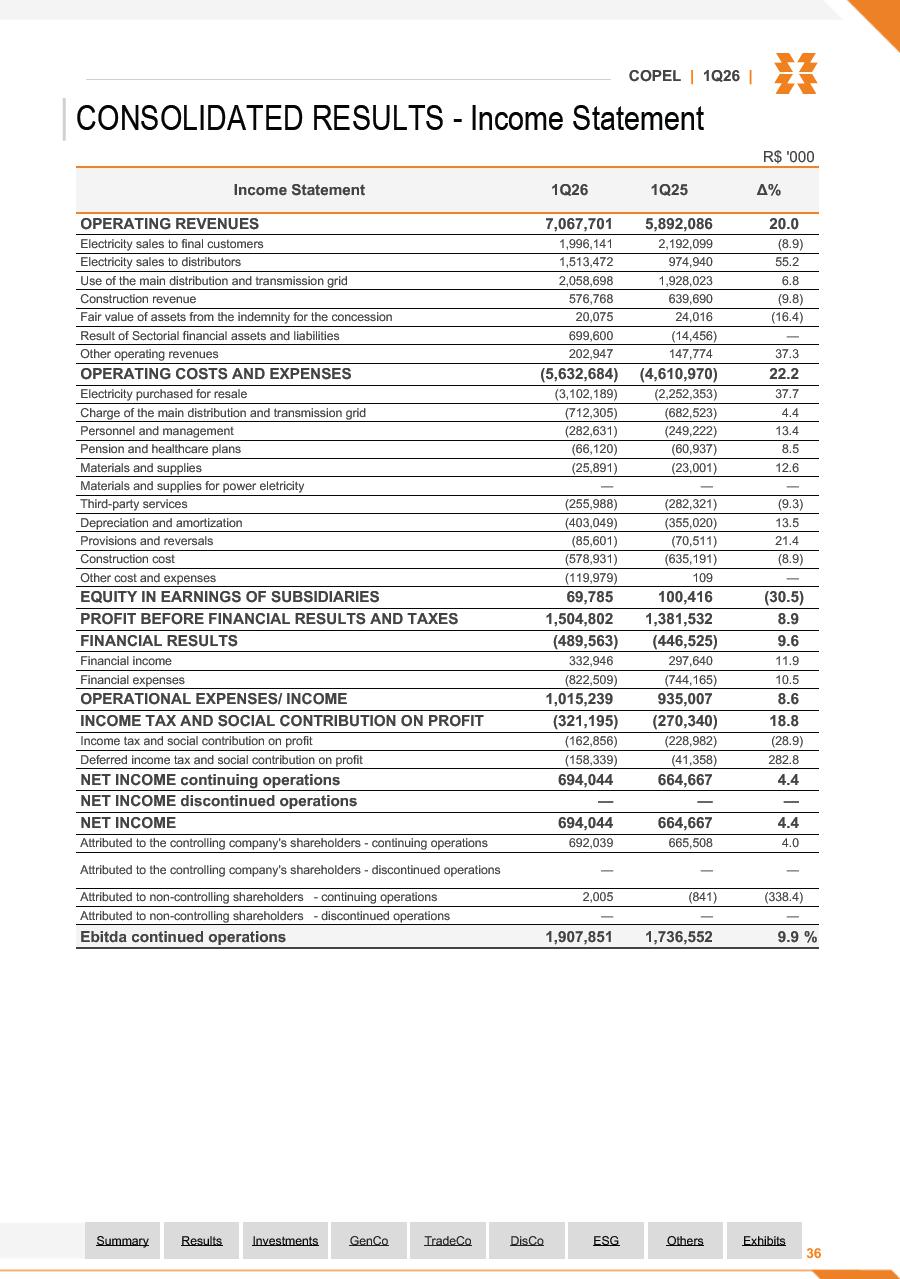
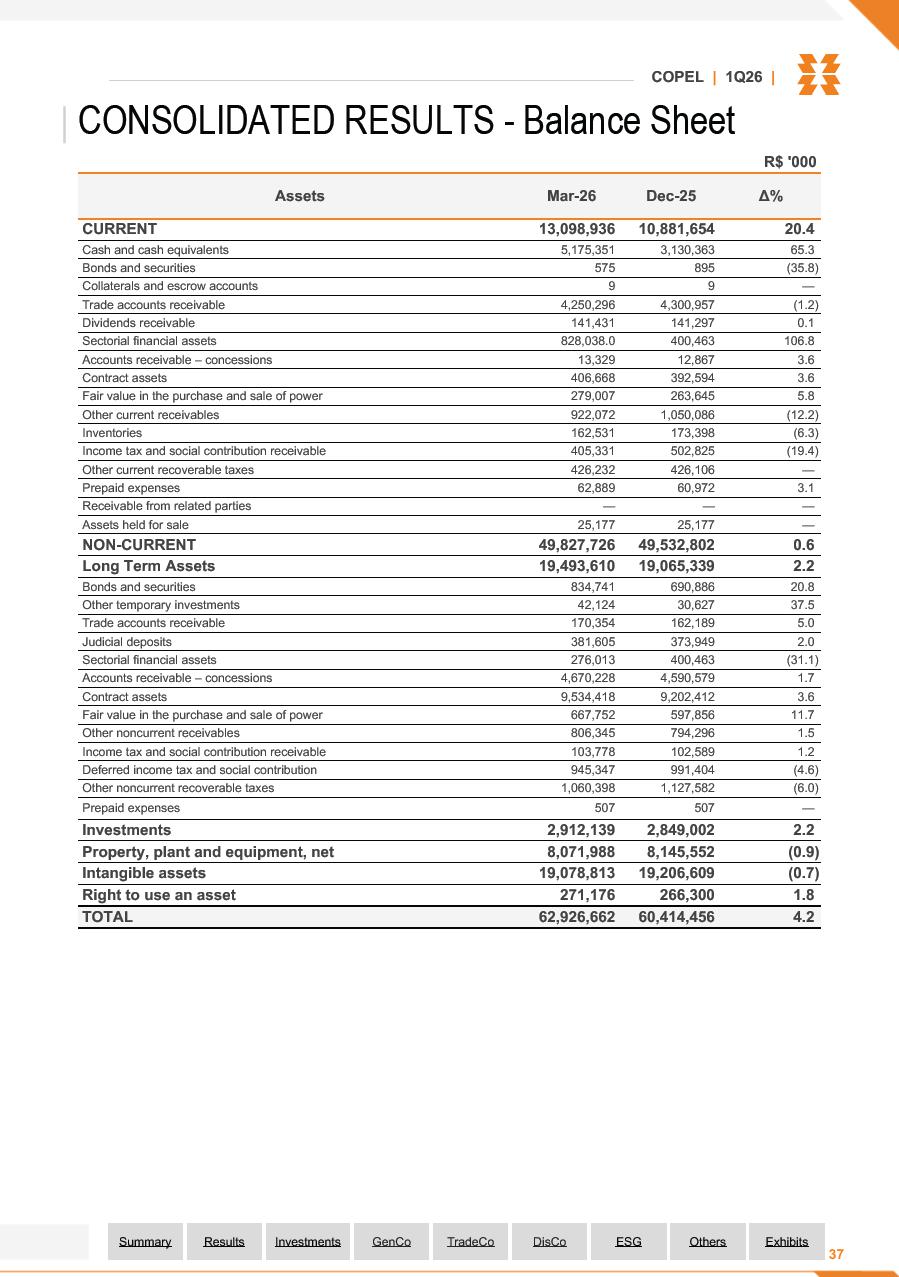
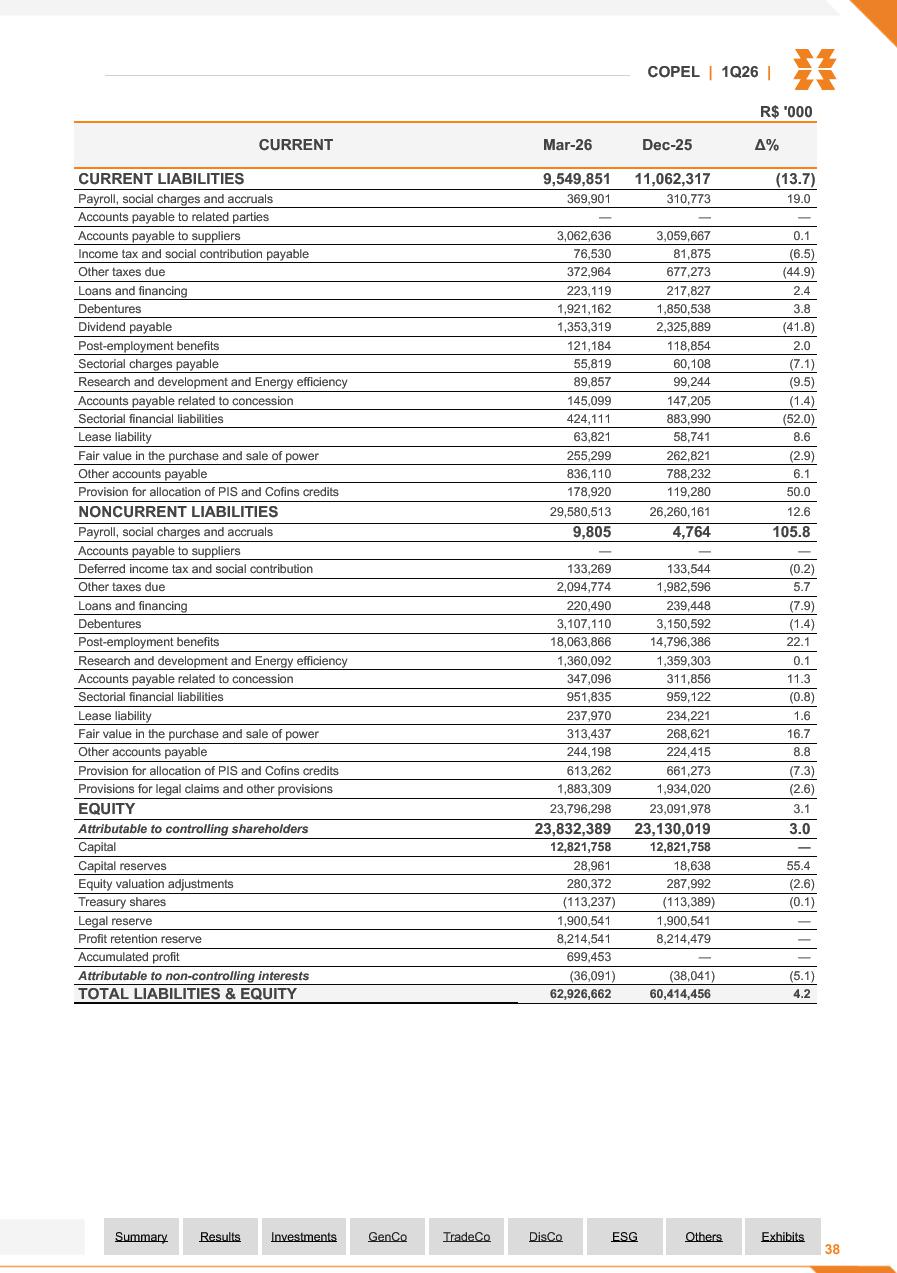
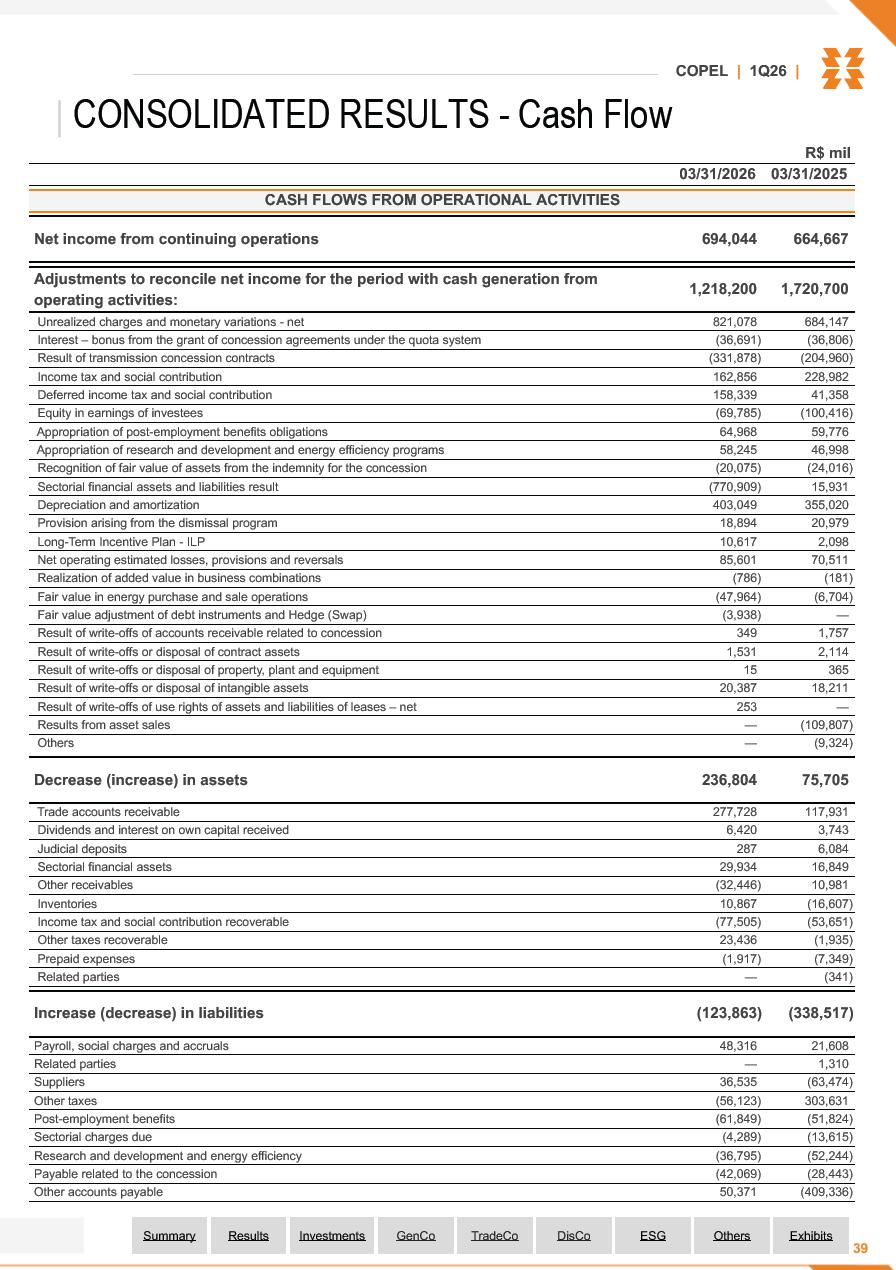
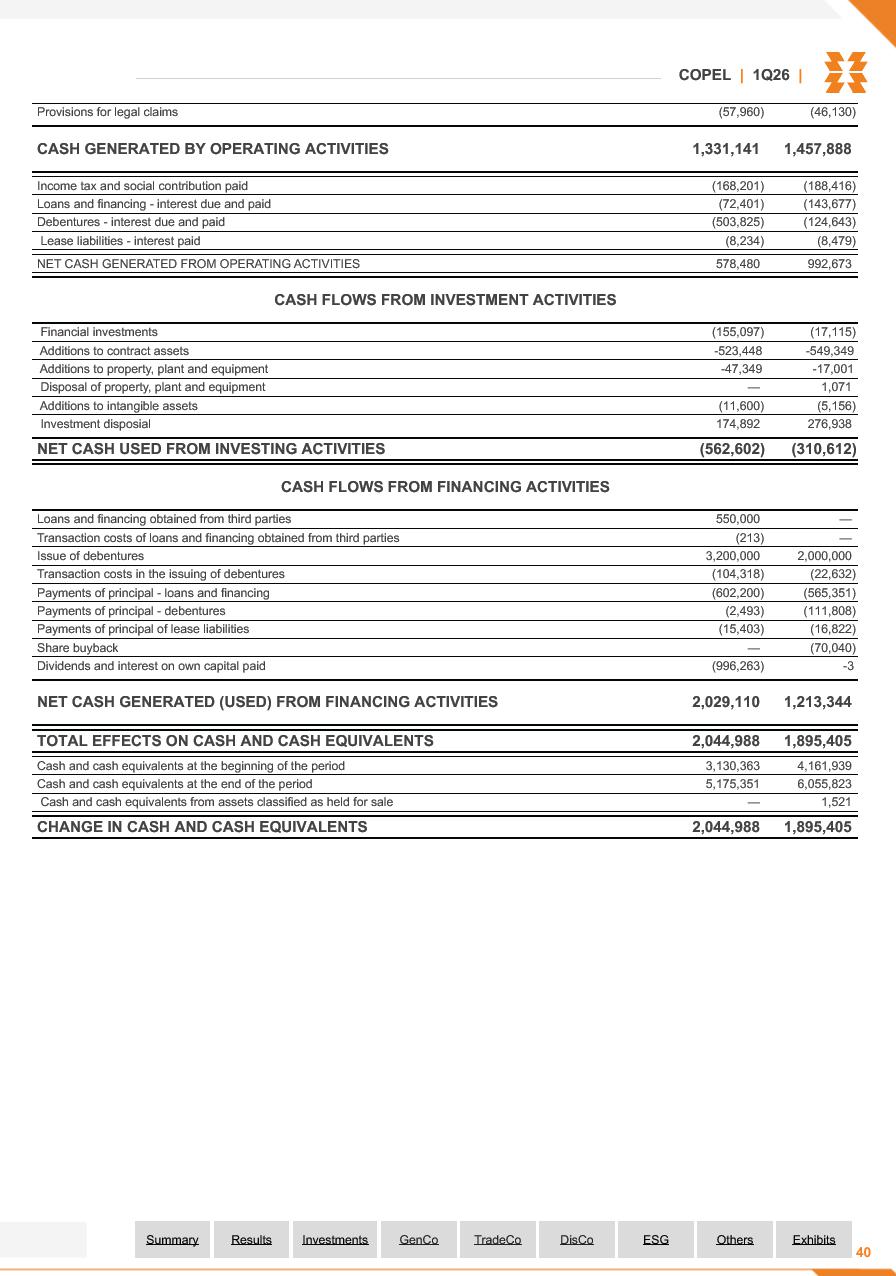
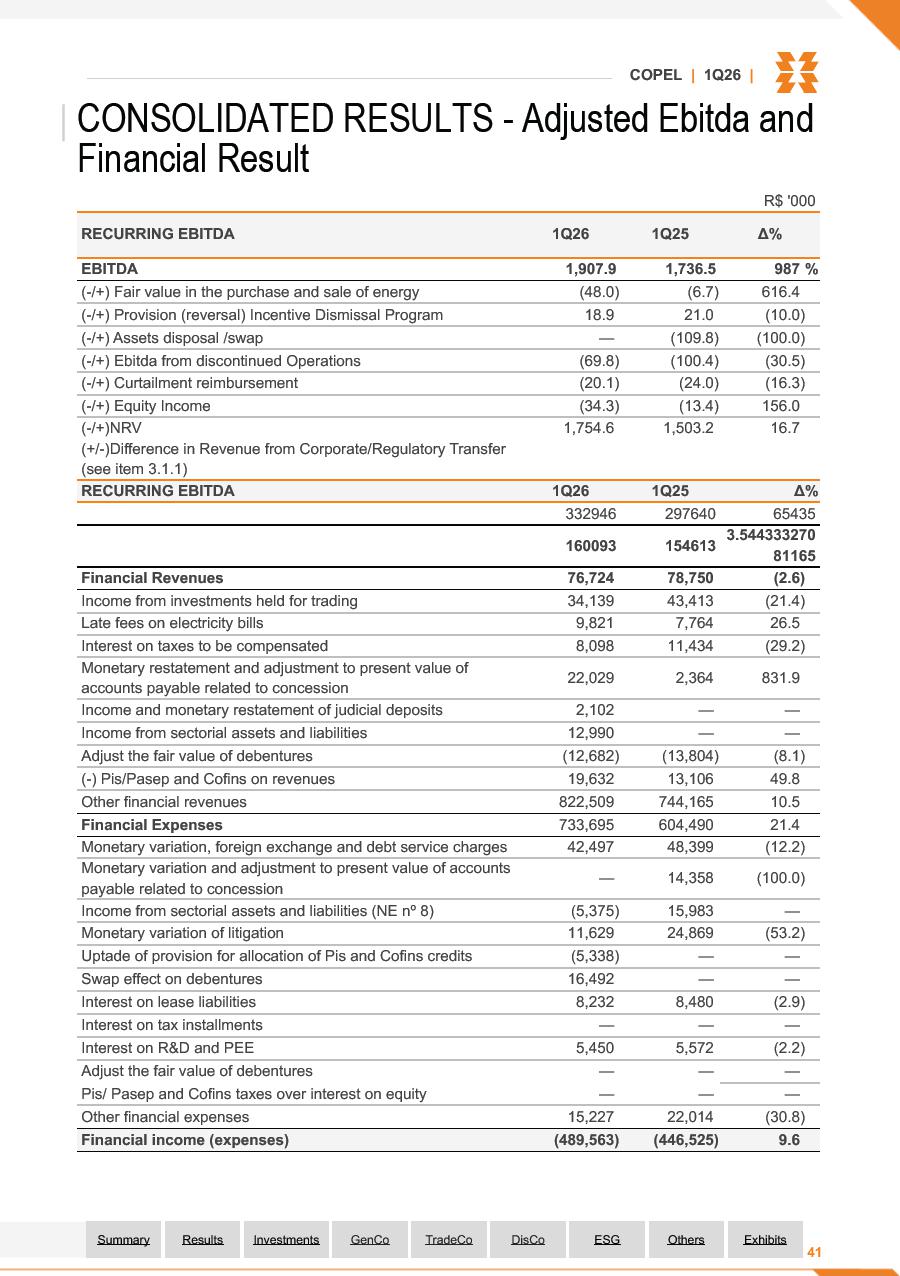
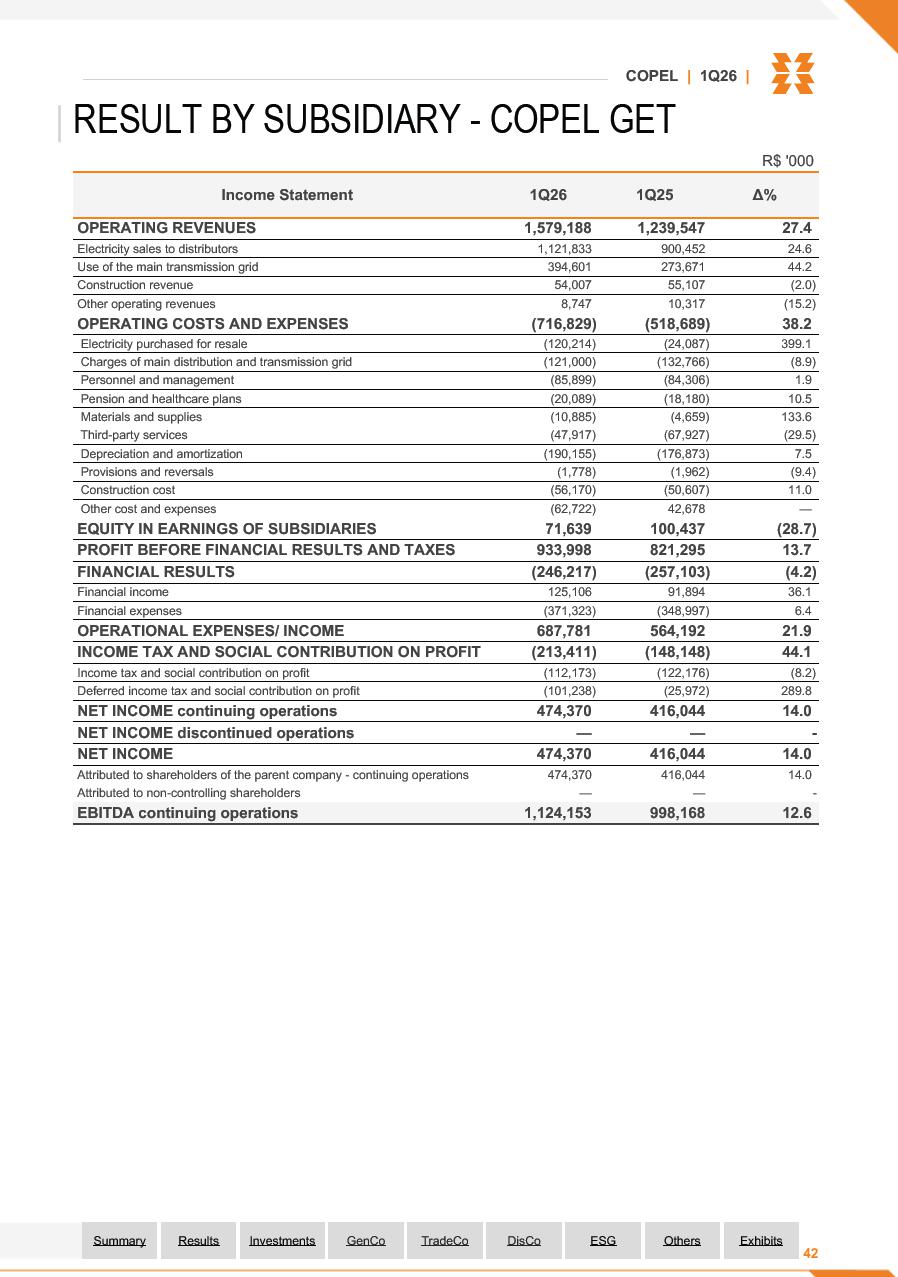
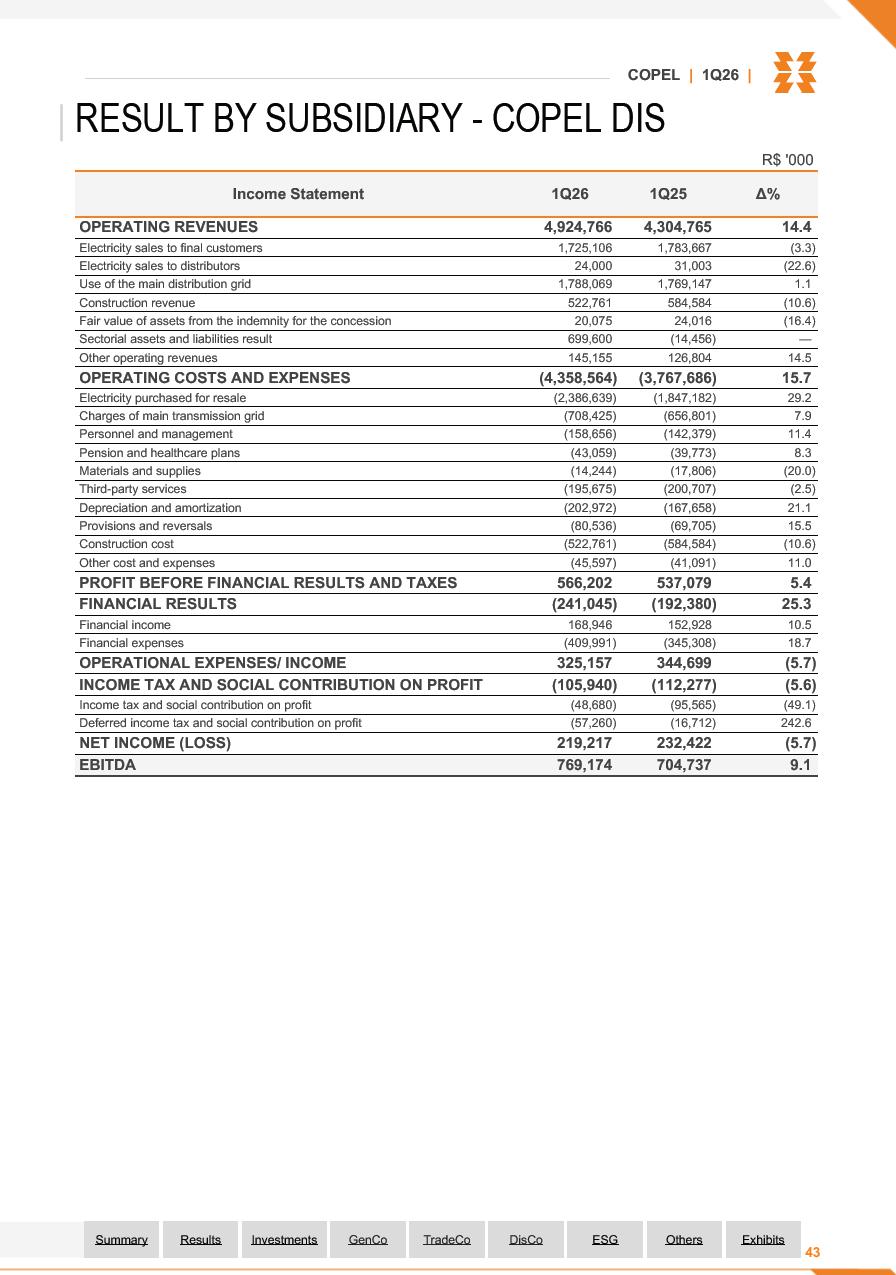
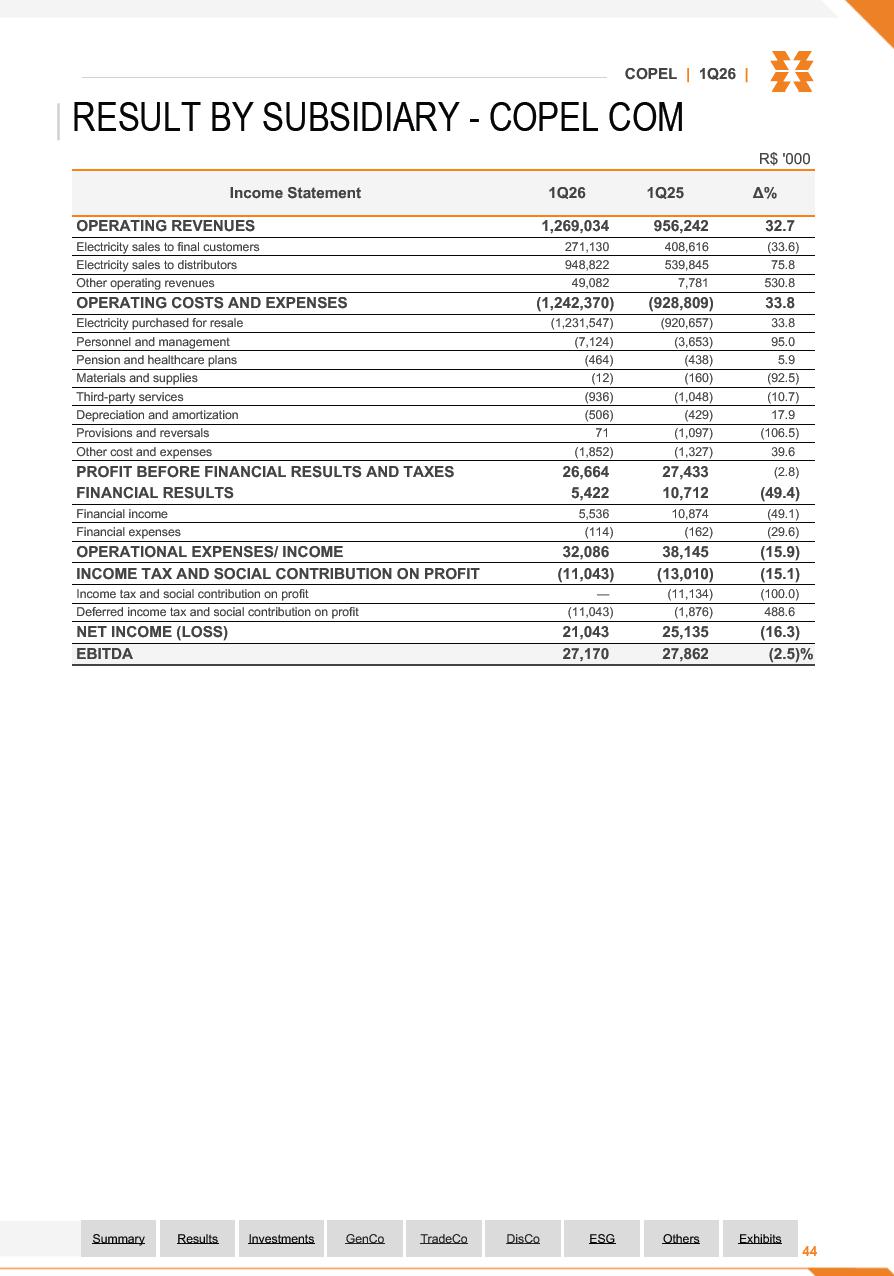

SIGNATURE
Pursuant to the requirements of the Securities Exchange Act of 1934, the registrant has duly caused this report to be signed on its behalf by the undersigned, thereunto duly authorized.
Date May 5, 2026
| COMPANHIA PARANAENSE DE ENERGIA – COPEL | ||
| By: |
/S/ Daniel Pimentel Slaviero |
|
| Daniel Pimentel Slaviero Chief Executive Officer |
||
FORWARD-LOOKING STATEMENTS
This press release may contain forward-looking statements. These statements are statements that are not historical facts, and are based on management's current view and estimates of future economic circumstances, industry conditions, company performance and financial results. The words "anticipates", "believes", "estimates", "expects", "plans" and similar expressions, as they relate to the company, are intended to identify forward-looking statements. Statements regarding the declaration or payment of dividends, the implementation of principal operating and financing strategies and capital expenditure plans, the direction of future operations and the factors or trends affecting financial condition, liquidity or results of operations are examples of forward-looking statements. Such statements reflect the current views of management and are subject to a number of risks and uncertainties. There is no guarantee that the expected events, trends or results will actually occur. The statements are based on many assumptions and factors, including general economic and market conditions, industry conditions, and operating factors. Any changes in such assumptions or factors could cause actual results to differ materially from current expectations.