
| Page | Page | |||||||||||||
| Introduction | Diversification Tables | |||||||||||||
| Forward-Looking Statements | Tenant Diversification | |||||||||||||
| Earnings Release | Tenant Credit Rating & Lease Distribution | |||||||||||||
| Company Information | Industry Diversification | |||||||||||||
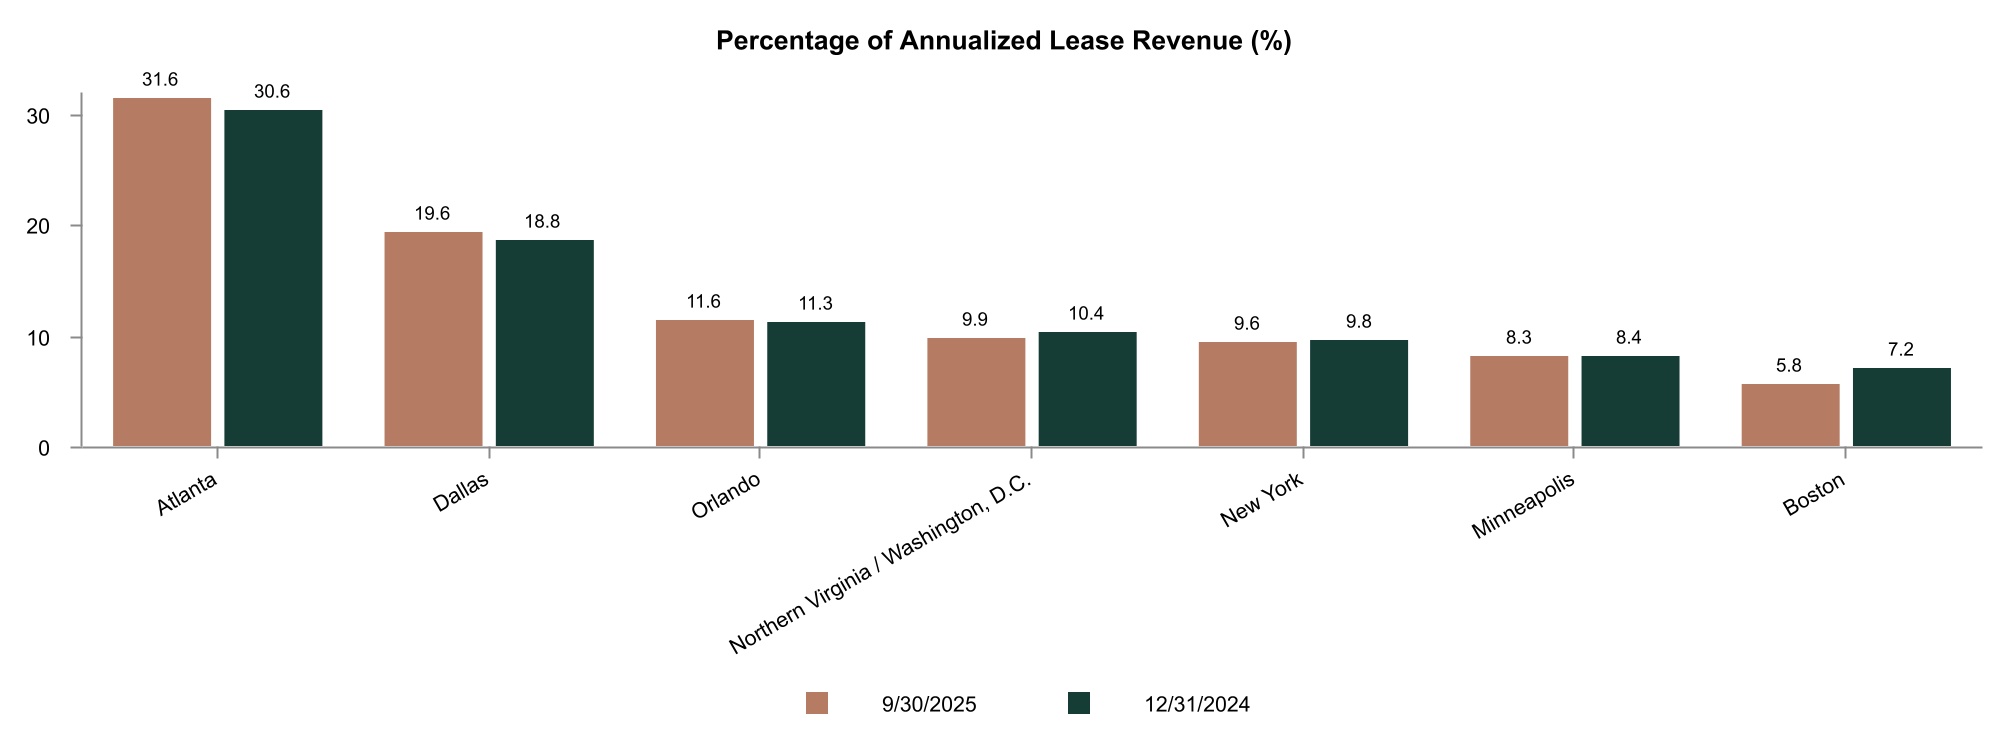
| Research Coverage | Geographic Diversification | |||||||||||||
| Portfolio Statistics & Key Performance Indicators | Geographic Diversification by Location Type | |||||||||||||
| Financials | Portfolio Information | |||||||||||||
| Consolidated Balance Sheets | Portfolio Detail | |||||||||||||
| Consolidated Statements of Income | Property Investment Activity and Land Holdings | |||||||||||||
| Funds From Operations & Adjusted Funds From Operations | ||||||||||||||
| Same Store Net Operating Income | Supporting Information | |||||||||||||
| Debt Summary | Definitions | |||||||||||||
| Debt Detail | Non-GAAP Reconciliations | |||||||||||||
| Debt Covenants & Ratios | ||||||||||||||
| Operational & Leasing Information | ||||||||||||||
| Leased Percentage | ||||||||||||||
| Rental Rate Roll Up / Roll Down | ||||||||||||||
| Contractual Tenant Improvements & Leasing Commissions | ||||||||||||||
| Net Effective Rents | ||||||||||||||
| Leases Yet to Commence and Abatements | ||||||||||||||
| Lease Expiration Schedule | ||||||||||||||
| Quarterly Lease Expirations | ||||||||||||||
| Annual Lease Expirations | ||||||||||||||
| Notice to Readers: | ||
Please refer to page 3 for a discussion of important risks related to the business of Piedmont Realty TrustTM, as well as an investment in its securities, including risks that could cause actual results and events to differ materially from results and events referred to in the forward-looking information. Considering these risks, uncertainties, assumptions, and limitations, the forward-looking statements about leasing, financial operations, leasing prospects, acquisitions, dispositions, etc. contained in this quarterly supplemental information report may differ from actual results. | ||
| Certain prior period amounts have been reclassified to conform to the current period financial statement presentation. In addition, many of the schedules herein contain rounding to the nearest thousands or millions and, therefore, the schedules may not total due to this rounding convention. | ||
To supplement the presentation of the Company’s financial results prepared in accordance with U.S. generally accepted accounting principles (GAAP), this report contains certain financial measures that are not prepared in accordance with GAAP, including FFO, Core FFO, AFFO, Same Store NOI, Property NOI, EBITDAre and Core EBITDA. Definitions and reconciliations of these non-GAAP measures to their most comparable GAAP metrics are included beginning on page 38. Each of the non-GAAP measures included in this report has limitations as an analytical tool and should not be considered in isolation or as a substitute for an analysis of the Company’s results calculated in accordance with GAAP. In addition, because not all companies use identical calculations, the Company’s presentation of non-GAAP measures in this report may not be comparable to similarly titled measures disclosed by other companies, including other REITs. The Company may also change the calculation of any of the non-GAAP measures included in this report from time to time in light of its then existing operations. | ||

| Three Months Ended | Nine Months Ended | ||||||||||||||||
| (in 000s other than per share amounts) | September 30, 2025 | September 30, 2024 | September 30, 2025 | September 30, 2024 | |||||||||||||
| Net loss applicable to Piedmont | $(13,462) | $(11,519) | $(40,374) | $(49,091) | |||||||||||||
| Net loss per share applicable to common stockholders - basic and diluted | $(0.11) | $(0.09) | $(0.32) | $(0.40) | |||||||||||||
| Gain/(loss) on sale of real estate assets | $— | $(445) | $2,013 | $(445) | |||||||||||||
| Loss on early extinguishment of debt | $— | $— | $8,000 | $386 | |||||||||||||
| Impairment charges | $— | $— | $— | $18,432 | |||||||||||||
| Interest expense, net of interest income | $31,908 | $30,148 | $95,113 | $89,143 | |||||||||||||
| NAREIT Funds From Operations ("FFO") applicable to common stock | $43,485 | $44,627 | $125,530 | $138,745 | |||||||||||||
| Core FFO applicable to common stock | $43,485 | $44,627 | $133,530 | $139,131 | |||||||||||||
| NAREIT FFO per diluted share | $0.35 | $0.36 | $1.00 | $1.11 | |||||||||||||
| Core FFO per diluted share | $0.35 | $0.36 | $1.06 | $1.11 | |||||||||||||
| Adjusted FFO applicable to common stock | $26,504 | $25,937 | $66,234 | $72,330 | |||||||||||||
| Same Store NOI - cash basis | 2.8 | % | (0.5) | % | |||||||||||||
| Same Store NOI - accrual basis | 3.2 | % | 2.6 | % | |||||||||||||
| Three Months Ended | Nine Months Ended | |||||||
| September 30, 2025 | September 30, 2025 | |||||||
| # of lease transactions | 75 | 189 | ||||||
Total leasing sf (in 000s) | 724 | 1,799 | ||||||
New tenant leasing sf (in 000s) | 551 | 1,198 | ||||||
| Cash rent roll up | 8.6% | 8.9% | ||||||
| Accrual rent roll up | 20.2% | 18.1% | ||||||
| Leased percentage as of period end | 89.2% | |||||||
| (in 000s except for ratios) | September 30, 2025 | December 31, 2024 | |||||||||
| Cash and Cash Equivalents | $2,990 | $109,637 | |||||||||
| Total Real Estate Assets | $3,431,258 | $3,461,239 | |||||||||
| Total Assets | $4,003,728 | $4,114,651 | |||||||||
| Total Debt | $2,193,324 | $2,222,346 | |||||||||
| Weighted Average Cost of Debt | 5.95 | % | 6.01% | ||||||||
| Net Principal Amount of Debt / Total Gross Assets less Cash and Cash Equivalents | 40.0 | % | 39.2% | ||||||||
| Average Net Debt to Core EBITDA (ttm) | 7.1 x | 6.8 x | |||||||||
| Current | Previous | ||||||||||||||||||||||
| (in millions, except per share data) | Low | High | Low | High | |||||||||||||||||||
| Net loss | $ | (53) | $ | (51) | $ | (54) | $ | (51) | |||||||||||||||
| Add: | |||||||||||||||||||||||
| Depreciation | 163 | 165 | 165 | 168 | |||||||||||||||||||
| Amortization | 60 | 60 | 58 | 60 | |||||||||||||||||||
| Less: | |||||||||||||||||||||||
| Gain on sale | (2) | (2) | (2) | (2) | |||||||||||||||||||
| NAREIT FFO applicable to common stock | $ | 168 | $ | 172 | $ | 167 | $ | 175 | |||||||||||||||
| Loss on early extinguishment of debt | 8 | 8 | 8 | 8 | |||||||||||||||||||
| Core FFO applicable to common stock | $ | 176 | $ | 180 | $ | 175 | $ | 183 | |||||||||||||||
| Core FFO applicable to common stock per diluted share | $1.40 | $1.42 | $1.38 | $1.44 | |||||||||||||||||||
| Executive Management | |||||||||||
| C. Brent Smith | Sherry L. Rexroad | Laura P. Moon | George M. Wells | ||||||||
| President, Chief Executive Officer | Chief Financial Officer | Chief Accounting Officer | Chief Operating Officer | ||||||||
| and Director | and Executive Vice President | and Executive Vice President | and Executive Vice President | ||||||||
| Kevin D. Fossum | Christopher A. Kollme | Damian J. Miller | Alex Valente | ||||||||
| Executive Vice President, | Executive Vice President, | Executive Vice President, | Executive Vice President, | ||||||||
| Property Management | Investments | Central Region | Southeast Region | ||||||||
| Pierre Dait | Wade Grace | Jennifer Heneisen | Lisa Tyler | ||||||||
| Senior Vice President, | Senior Vice President, | Senior Vice President, | Senior Vice President, | ||||||||
| Risk Management | Controller | Financial Planning & Analysis | Human Resources | ||||||||
| Board of Directors | |||||||||||
| Kelly H. Barrett | Dale H. Taysom | Glenn G. Cohen | Barbara B. Lang | ||||||||
| Chair of the Board of Directors | Vice Chair of the Board of Directors | Chair of the Compensation Committee | Chair of the Nominating and | ||||||||
| Chair of the Audit Committee | Corporate Governance Committee | ||||||||||
| Jeffrey J. Donnelly | Deneen L. Donnley | Mary Hager | Stephen E. Lewis | ||||||||
| Director | Director | Director | Director | ||||||||
| C. Brent Smith | |||||||||||
| Director & Chief Executive Officer | |||||||||||
| Contact Information | |||||||||||
| Corporate Headquarters | Research Analysts / Institutional Investors | Shareholder Services / Transfer Agent Services | Corporate Counsel | ||||||||
| 5565 Glenridge Connector, Suite 450 | 770.418.8592 | Computershare, Inc. | King & Spalding | ||||||||
| Atlanta, Georgia 30342 | investor.relations@piedmontreit.com | 866.354.3485 | 1180 Peachtree Street, NE | ||||||||
| 770.418.8800 | investor.services@piedmontreit.com | Atlanta, GA 30309 | |||||||||
| www.piedmontreit.com | 404.572.4600 | ||||||||||
| Equity Research Coverage | |||||||||||
| Dylan Burzinski | Anthony Paolone, CFA | Nicholas Thillman | Michael Lewis, CFA | ||||||||
| Green Street | JP Morgan | Robert W. Baird & Co. | Truist Securities | ||||||||
| 100 Bayview Circle, Suite 400 | 383 Madison Avenue, 32nd Floor | 777 East Wisconsin Avenue | 50 Hudson Yards, 69th Floor | ||||||||
| Newport Beach, CA 92660 | New York, NY 10179 | Milwaukee, WI 53202 | New York, NY 10001 | ||||||||
| Phone: (949) 640-8780 | Phone: (212) 622-6682 | Phone: (414) 298-5053 | Phone: (212) 319-5659 | ||||||||
| Fixed Income Research Coverage | ||||||||
| Mark S. Streeter, CFA | ||||||||
| JP Morgan | ||||||||
| 383 Madison Avenue, 3rd Floor | ||||||||
| New York, NY 10179 | ||||||||
| Phone: (212) 834-5086 | ||||||||
| Credit Ratings | ||||||||
| Issuer Credit Ratings: | Senior Unsecured Notes Ratings: | |||||||
| Baa3 (Moody's) | Baa3 (Moody's) | |||||||
| BB+ (Standard & Poor's) | BBB- (Standard & Poor's) | |||||||
| BBB- (Fitch) | BBB- (Fitch) | |||||||
This section of our supplemental report includes non-GAAP financial measures, including, but not limited to, Earnings Before Interest, Taxes, Depreciation, and Amortization for real estate (EBITDAre), Core Earnings Before Interest, Taxes, Depreciation, and Amortization (Core EBITDA), Funds from Operations (FFO), Core Funds from Operations (Core FFO), Adjusted Funds from Operations (AFFO), and Same Store Net Operating Income (Same Store NOI). Definitions of these non-GAAP measures are provided on page 38 and reconciliations are provided beginning on page 39. | ||
| Three Months Ended | |||||||||||||||||||||||||||||
| 9/30/2025 | 6/30/2025 | 3/31/2025 | 12/31/2024 | 9/30/2024 | |||||||||||||||||||||||||
| Portfolio Statistics: | |||||||||||||||||||||||||||||
Number of in-service projects (1) | 29 | 29 | 30 | 30 | 30 | ||||||||||||||||||||||||
Rentable in-service square footage (1) | 14,918 | 14,923 | 15,241 | 15,323 | 15,335 | ||||||||||||||||||||||||
Leased percentage (2) | 89.2 | % | 88.7 | % | 88.1 | % | 88.4 | % | 88.8 | % | |||||||||||||||||||
Commenced leased percentage | 85.4 | % | 85.0 | % | 85.2 | % | 85.5 | % | 84.8 | % | |||||||||||||||||||
Economic leased percentage (3) | 79.4 | % | 78.7 | % | 77.5 | % | 80.7 | % | 80.6 | % | |||||||||||||||||||
| Leasing Activity: | |||||||||||||||||||||||||||||
| Total square feet leased during the period | 724 | 712 | 363 | 433 | 461 | ||||||||||||||||||||||||
| Square feet (new) leased during the period | 551 | 468 | 179 | 94 | 205 | ||||||||||||||||||||||||
| Square feet (renewal) leased during the period | 173 | 243 | 184 | 339 | 256 | ||||||||||||||||||||||||
Rental rate roll up / roll down - accrual rents | 20.2 | % | 13.6 | % | 18.6 | % | 14.7 | % | 8.5 | % | |||||||||||||||||||
| Rental rate roll up / roll down - cash rents | 8.6 | % | 7.3 | % | 10.3 | % | 11.5 | % | 4.0 | % | |||||||||||||||||||
| Net effective rent per square foot after capex and opex | $21.26 | $20.78 | $24.29 | $22.65 | $20.28 | ||||||||||||||||||||||||
| Financial Results: | |||||||||||||||||||||||||||||
| Total revenues | $139,163 | $140,292 | $142,686 | $143,231 | $139,293 | ||||||||||||||||||||||||
| Net income (loss) applicable to Piedmont | -$13,462 | -$16,808 | -$10,104 | -$29,978 | -$11,519 | ||||||||||||||||||||||||
| Net income (loss) per share applicable to common stockholders - diluted | -$0.11 | -$0.14 | -$0.08 | -$0.24 | -$0.09 | ||||||||||||||||||||||||
| Core EBITDA | $75,826 | $76,856 | $77,605 | $78,455 | $77,065 | ||||||||||||||||||||||||
| Core FFO applicable to common stock | $43,485 | $44,512 | $45,533 | $46,436 | $44,627 | ||||||||||||||||||||||||
| Core FFO per share - diluted | $0.35 | $0.36 | $0.36 | $0.37 | $0.36 | ||||||||||||||||||||||||
| AFFO applicable to common stock | $26,504 | $16,241 | $23,489 | $24,576 | $25,937 | ||||||||||||||||||||||||
Same store net operating income - accrual basis (4) | 3.2 | % | 1.7 | % | 3.2 | % | 2.5 | % | -2.1 | % | |||||||||||||||||||
Same store net operating income - cash basis (4) | 2.8 | % | -2.0 | % | -2.0 | % | 0.9 | % | -0.8 | % | |||||||||||||||||||
| Balance Sheet and Capitalization Information: | |||||||||||||||||||||||||||||
| Weighted average shares outstanding - diluted (WASO) | 126,007 | 125,178 | 125,177 | 125,614 | 125,675 | ||||||||||||||||||||||||
| Shares of common stock issued and outstanding at period end | 124,504 | 124,492 | 124,408 | 124,083 | 124,000 | ||||||||||||||||||||||||
| Closing price of common stock at period end | $9.00 | $7.29 | $7.37 | $9.15 | $10.10 | ||||||||||||||||||||||||
Gross regular dividends (5) | — | — | $15,536 | $15,500 | $15,500 | ||||||||||||||||||||||||
Regular dividends per share | — | — | $0.125 | $0.125 | $0.125 | ||||||||||||||||||||||||
| Total debt - GAAP | $2,193,324 | $2,177,752 | $2,186,231 | $2,222,346 | $2,221,907 | ||||||||||||||||||||||||
| Total principal amount of debt outstanding | $2,213,196 | $2,199,101 | $2,209,536 | $2,242,423 | $2,243,300 | ||||||||||||||||||||||||
Total net principal amount of debt outstanding (6) | $2,205,061 | $2,191,286 | $2,202,902 | $2,128,541 | $2,106,333 | ||||||||||||||||||||||||
| Total gross real estate assets | $4,740,790 | $4,685,403 | $4,709,785 | $4,688,113 | $4,658,663 | ||||||||||||||||||||||||
Equity market capitalization (7) | $1,120,536 | $907,547 | $916,887 | $1,135,360 | $1,252,399 | ||||||||||||||||||||||||
Total market capitalization (7) | $3,333,732 | $3,106,648 | $3,126,423 | $3,377,783 | $3,495,699 | ||||||||||||||||||||||||
| Piedmont Office Realty Trust, Inc. | |||||||||||||||||||||||||||||
| Portfolio Statistics & Key Performance Indicators (continued) | |||||||||||||||||||||||||||||
| Unaudited (in thousands except for per share data and ratios) | |||||||||||||||||||||||||||||
| Three Months Ended | |||||||||||||||||||||||||||||
| 9/30/2025 | 6/30/2025 | 3/31/2025 | 12/31/2024 | 9/30/2024 | |||||||||||||||||||||||||
| Ratios for Debt Holders | |||||||||||||||||||||||||||||
Core EBITDA to total revenues | 54.5 | % | 54.8 | % | 54.4 | % | 54.8 | % | 55.3 | % | |||||||||||||||||||
Net principal amount of debt / Total gross assets less cash and cash equivalents (8) | 40.0 | % | 40.3 | % | 40.3 | % | 39.2 | % | 39.0 | % | |||||||||||||||||||
Average net principal amount of debt to Core EBITDA - trailing twelve months (9) | 7.1 x | 6.9 x | 6.9 x | 6.8 x | 6.7 x | ||||||||||||||||||||||||
Fixed charge coverage ratio (10) | 2.1 x | 2.1 x | 2.2 x | 2.2 x | 2.1 x | ||||||||||||||||||||||||
| (1) | As of September 30, 2025, the Company's in-service office portfolio excluded three projects currently held out of service for redevelopment, totaling 788,000 square feet. Additional information on these projects can be found on page 36. | ||||
| (2) | Refer to page 22 for detailed analysis on the Company's leased percentage. | ||||
| (3) | Excludes the square footage associated with tenants currently in rental abatement periods. | ||||
| (4) | Refer to the three pages starting with page 16 for reconciliations to net income and additional same store net operating income information. The statistic provided for each of the prior quarters is based on the same store property population applicable at the time that the metric was initially reported. | ||||
| (5) | Reflects dividends paid in the quarter in which the record date occurred. | ||||
| (6) | Defined as the total principal amount of debt outstanding, minus cash and restricted cash and escrows, all as of the end of the period. | ||||
| (7) | Reflects common stock closing price, shares outstanding and principal amount of debt outstanding as of the end of the reporting period. | ||||
| (8) | Metric shown on a net debt basis to account for certain periods presented that had elevated balances of cash and restricted cash and escrows to be used primarily for debt retirement in a future period. | ||||
| (9) | Calculated using the sum of Core EBITDA for the trailing twelve month period and the average principal balance of debt outstanding for the trailing twelve months less the average balance of cash and restricted cash and escrows during the trailing twelve month period. | ||||
| (10) | Calculated as Core EBITDA divided by the sum of interest expense, principal amortization, capitalized interest and preferred dividends (none during periods presented). | ||||
| The Company recorded principal amortization of $0.9 million for each of the quarters ended September 30, 2025, June 30, 2025, March 31, 2025, December 31, 2024, and September 30, 2024. | |||||
| The Company recorded capitalized interest of $2.9 million for the quarter ended September 30, 2025, $3.2 million for the quarter ended June 30, 2025, $3.3 million for the quarter ended March 31, 2025, $3.7 million for the quarter ended December 31, 2024, and $3.4 million for the quarter ended September 30, 2024. | |||||
| 9/30/2025 | 6/30/2025 | 3/31/2025 | 12/31/2024 | 9/30/2024 | |||||||||||||||||||||||||
| Assets: | |||||||||||||||||||||||||||||
| Real estate assets, at cost: | |||||||||||||||||||||||||||||
| Land | $ | 545,102 | $ | 545,101 | $ | 550,724 | $ | 552,744 | $ | 552,744 | |||||||||||||||||||
| Buildings and improvements | 4,018,671 | 3,911,368 | 3,918,373 | 3,894,804 | 3,815,948 | ||||||||||||||||||||||||
| Buildings and improvements, accumulated depreciation | (1,238,031) | (1,199,698) | (1,183,585) | (1,150,892) | (1,116,169) | ||||||||||||||||||||||||
| Intangible lease assets | 119,734 | 120,726 | 133,266 | 136,461 | 146,005 | ||||||||||||||||||||||||
| Intangible lease assets, accumulated amortization | (71,501) | (68,474) | (77,090) | (75,982) | (80,620) | ||||||||||||||||||||||||
| Construction in progress | 57,283 | 108,208 | 107,422 | 104,104 | 143,966 | ||||||||||||||||||||||||
| Total real estate assets | 3,431,258 | 3,417,231 | 3,449,110 | 3,461,239 | 3,461,874 | ||||||||||||||||||||||||
| Cash and cash equivalents | 2,990 | 3,314 | 2,911 | 109,637 | 133,624 | ||||||||||||||||||||||||
| Tenant receivables | 5,729 | 4,386 | 7,026 | 5,524 | 6,963 | ||||||||||||||||||||||||
| Straight-line rent receivables | 211,591 | 207,025 | 201,228 | 193,783 | 189,904 | ||||||||||||||||||||||||
| Restricted cash and escrows | 5,145 | 4,501 | 3,723 | 4,245 | 3,343 | ||||||||||||||||||||||||
| Prepaid expenses and other assets | 27,598 | 29,802 | 29,075 | 25,792 | 26,455 | ||||||||||||||||||||||||
| Goodwill | 53,491 | 53,491 | 53,491 | 53,491 | 53,491 | ||||||||||||||||||||||||
| Interest rate swaps | — | 72 | 27 | 671 | 992 | ||||||||||||||||||||||||
| Deferred lease costs, gross | 473,597 | 458,839 | 465,584 | 464,419 | 468,385 | ||||||||||||||||||||||||
| Deferred lease costs, accumulated amortization | (207,671) | (198,398) | (208,218) | (204,150) | (206,814) | ||||||||||||||||||||||||
| Total assets | $ | 4,003,728 | $ | 3,980,263 | $ | 4,003,957 | $ | 4,114,651 | $ | 4,138,217 | |||||||||||||||||||
| Liabilities: | |||||||||||||||||||||||||||||
| Unsecured debt, net of discount | $ | 2,003,588 | $ | 1,987,111 | $ | 1,994,695 | $ | 2,029,923 | $ | 2,028,607 | |||||||||||||||||||
| Secured debt | 189,736 | 190,641 | 191,536 | 192,423 | 193,300 | ||||||||||||||||||||||||
| Accounts payable, accrued expenses and accrued capital expenditures | 135,220 | 131,104 | 119,994 | 164,346 | 150,648 | ||||||||||||||||||||||||
| Deferred income | 111,174 | 94,529 | 104,988 | 107,030 | 99,294 | ||||||||||||||||||||||||
| Intangible lease liabilities, less accumulated amortization | 26,788 | 28,752 | 30,720 | 32,794 | 35,165 | ||||||||||||||||||||||||
| Interest rate swaps | 175 | 116 | 293 | 8 | 1,035 | ||||||||||||||||||||||||
| Total liabilities | 2,466,681 | 2,432,253 | 2,442,226 | 2,526,524 | 2,508,049 | ||||||||||||||||||||||||
| Stockholders' equity: | |||||||||||||||||||||||||||||
| Common stock | 1,245 | 1,245 | 1,244 | 1,241 | 1,240 | ||||||||||||||||||||||||
| Additional paid in capital | 3,727,914 | 3,725,769 | 3,723,373 | 3,723,680 | 3,721,423 | ||||||||||||||||||||||||
| Cumulative distributions in excess of earnings | (2,184,104) | (2,170,642) | (2,153,834) | (2,128,194) | (2,082,716) | ||||||||||||||||||||||||
| Accumulated other comprehensive loss | (9,517) | (9,873) | (10,575) | (10,123) | (11,314) | ||||||||||||||||||||||||
| Piedmont stockholders' equity | 1,535,538 | 1,546,499 | 1,560,208 | 1,586,604 | 1,628,633 | ||||||||||||||||||||||||
| Non-controlling interest | 1,509 | 1,511 | 1,523 | 1,523 | 1,535 | ||||||||||||||||||||||||
| Total stockholders' equity | 1,537,047 | 1,548,010 | 1,561,731 | 1,588,127 | 1,630,168 | ||||||||||||||||||||||||
| Total liabilities and stockholders' equity | $ | 4,003,728 | $ | 3,980,263 | $ | 4,003,957 | $ | 4,114,651 | $ | 4,138,217 | |||||||||||||||||||
| Three Months Ended | |||||||||||||||||||||||||||||
| 9/30/2025 | 6/30/2025 | 3/31/2025 | 12/31/2024 | 9/30/2024 | |||||||||||||||||||||||||
Revenues: (1) | |||||||||||||||||||||||||||||
Rental revenue | $ | 110,748 | $ | 111,130 | $ | 111,776 | $ | 111,169 | $ | 109,393 | |||||||||||||||||||
Tenant reimbursements | 22,282 | 22,824 | 24,288 | 24,312 | 23,439 | ||||||||||||||||||||||||
| Property management fee revenue | 115 | 81 | 81 | 203 | 896 | ||||||||||||||||||||||||
| Other property related income | 6,018 | 6,257 | 6,541 | 7,547 | 5,565 | ||||||||||||||||||||||||
| 139,163 | 140,292 | 142,686 | 143,231 | 139,293 | |||||||||||||||||||||||||
| Expenses: | |||||||||||||||||||||||||||||
| Property operating costs | 55,890 | 55,610 | 57,914 | 58,605 | 57,510 | ||||||||||||||||||||||||
| Depreciation | 42,127 | 40,646 | 40,893 | 40,150 | 39,000 | ||||||||||||||||||||||||
| Amortization | 15,188 | 14,785 | 15,421 | 16,422 | 17,067 | ||||||||||||||||||||||||
Impairment charges | — | — | — | 15,400 | — | ||||||||||||||||||||||||
General and administrative (2) | 7,607 | 7,960 | 7,563 | 12,650 | 6,809 | ||||||||||||||||||||||||
| 120,812 | 119,001 | 121,791 | 143,227 | 120,386 | |||||||||||||||||||||||||
| Other income (expense): | |||||||||||||||||||||||||||||
| Interest expense | (31,968) | (31,954) | (31,677) | (31,629) | (32,072) | ||||||||||||||||||||||||
Other income (3) | 160 | 133 | 395 | 1,648 | 2,091 | ||||||||||||||||||||||||
Loss on early extinguishment of debt | — | (7,500) | (500) | — | — | ||||||||||||||||||||||||
Gain / (loss) on sale of real estate assets | — | 1,224 | 789 | — | (445) | ||||||||||||||||||||||||
| Net loss | (13,457) | (16,806) | (10,098) | (29,977) | (11,519) | ||||||||||||||||||||||||
| Less: Net income applicable to noncontrolling interest | (5) | (2) | (6) | (1) | — | ||||||||||||||||||||||||
| Net loss applicable to Piedmont | $ | (13,462) | $ | (16,808) | $ | (10,104) | $ | (29,978) | $ | (11,519) | |||||||||||||||||||
Weighted average common shares outstanding - basic and diluted (4) | 124,502 | 124,459 | 124,258 | 124,001 | 124,000 | ||||||||||||||||||||||||
| Net loss per share applicable to common stockholders - basic and diluted | $ | (0.11) | $ | (0.14) | $ | (0.08) | $ | (0.24) | $ | (0.09) | |||||||||||||||||||
| (1) | To be in conformance with GAAP presentation, the Company would combine "Rental income" and "Tenant reimbursements" amounts and present an aggregated figure on one line entitled "Rental and tenant reimbursement revenue." | ||||
| (2) | General and administrative expense for the fourth quarter of 2024 included $4.8 million in executive separation costs. | ||||
| (3) | Includes interest income (in thousands) of $60, $31, $395, $1,528, and $1,924 for the three months ended September 30, 2025, June 30, 2025, March 31, 2025, December 31, 2024, and September 30, 2024, respectively. | ||||
| (4) | As Piedmont recognized a net loss for the periods presented, earnings per share is computed using basic weighted-average common shares outstanding. | ||||
| Three Months Ended | Nine Months Ended | ||||||||||||||||||||||||||||||||||
| 9/30/2025 | 9/30/2024 | Change ($) | Change (%) | 9/30/2025 | 9/30/2024 | Change ($) | Change (%) | ||||||||||||||||||||||||||||
Revenues: (1) | |||||||||||||||||||||||||||||||||||
Rental revenue | $ | 110,748 | $ | 109,393 | $ | 1,355 | 1.2 | % | $ | 333,654 | $ | 334,287 | $ | (633) | (0.2) | % | |||||||||||||||||||
Tenant reimbursements | 22,282 | 23,439 | (1,157) | (4.9) | % | 69,394 | 74,296 | (4,902) | (6.6) | % | |||||||||||||||||||||||||
| Property management fee revenue | 115 | 896 | (781) | (87.2) | % | 277 | 1,535 | (1,258) | (82.0) | % | |||||||||||||||||||||||||
| Other property related income | 6,018 | 5,565 | 453 | 8.1 | % | 18,816 | 16,975 | 1,841 | 10.8 | % | |||||||||||||||||||||||||
| 139,163 | 139,293 | (130) | (0.1) | % | 422,141 | 427,093 | (4,952) | (1.2) | % | ||||||||||||||||||||||||||
| Expenses: | |||||||||||||||||||||||||||||||||||
| Property operating costs | 55,890 | 57,510 | 1,620 | 2.8 | % | 169,414 | 175,519 | 6,105 | 3.5 | % | |||||||||||||||||||||||||
| Depreciation | 42,127 | 39,000 | (3,127) | (8.0) | % | 123,666 | 116,683 | (6,983) | (6.0) | % | |||||||||||||||||||||||||
| Amortization | 15,188 | 17,067 | 1,879 | 11.0 | % | 45,394 | 53,284 | 7,890 | 14.8 | % | |||||||||||||||||||||||||
| Impairment charges | — | — | — | — | % | — | 18,432 | 18,432 | 100.0 | % | |||||||||||||||||||||||||
| General and administrative | 7,607 | 6,809 | (798) | (11.7) | % | 23,130 | 22,773 | (357) | (1.6) | % | |||||||||||||||||||||||||
| 120,812 | 120,386 | (426) | (0.4) | % | 361,604 | 386,691 | 25,087 | 6.5 | % | ||||||||||||||||||||||||||
| Other income (expense): | |||||||||||||||||||||||||||||||||||
| Interest expense | (31,968) | (32,072) | 104 | 0.3 | % | (95,599) | (91,355) | (4,244) | (4.6) | % | |||||||||||||||||||||||||
| Other income | 160 | 2,091 | (1,931) | (92.3) | % | 688 | 2,697 | (2,009) | (74.5) | % | |||||||||||||||||||||||||
Loss on early extinguishment of debt | — | — | — | — | % | (8,000) | (386) | (7,614) | (1,972.5) | % | |||||||||||||||||||||||||
Gain / (loss) on sale of real estate assets | — | (445) | 445 | 100.0 | % | 2,013 | (445) | 2,458 | 552.4 | % | |||||||||||||||||||||||||
| Net loss | (13,457) | (11,519) | (1,938) | (16.8) | % | (40,361) | (49,087) | 8,726 | 17.8 | % | |||||||||||||||||||||||||
| Less: Net income applicable to noncontrolling interest | (5) | — | (5) | (100.0) | % | (13) | (4) | (9) | (225.0) | % | |||||||||||||||||||||||||
| Net loss applicable to Piedmont | $ | (13,462) | $ | (11,519) | $ | (1,943) | (16.9) | % | $ | (40,374) | $ | (49,091) | $ | 8,717 | 17.8 | % | |||||||||||||||||||
Weighted average common shares outstanding - basic and diluted (2) | 124,502 | 124,000 | 124,407 | 123,918 | |||||||||||||||||||||||||||||||
| Net loss per share applicable to common stockholders - basic and diluted | $ | (0.11) | $ | (0.09) | $ | (0.32) | $ | (0.40) | |||||||||||||||||||||||||||
| (1) | To be in conformance with GAAP presentation, the Company would combine "Rental income" and "Tenant reimbursements" amounts and present an aggregated figure on one line entitled "Rental and tenant reimbursement revenue." | ||||
| (2) | As Piedmont recognized a net loss for the periods presented, earnings per share is computed using basic weighted-average common shares outstanding. | ||||
| Three Months Ended | Nine Months Ended | ||||||||||||||||||||||
| 9/30/2025 | 9/30/2024 | 9/30/2025 | 9/30/2024 | ||||||||||||||||||||
| GAAP net loss applicable to common stock | $ | (13,462) | $ | (11,519) | $ | (40,374) | $ | (49,091) | |||||||||||||||
Depreciation of real estate assets | 41,759 | 38,642 | 122,538 | 115,699 | |||||||||||||||||||
Amortization of lease-related costs | 15,188 | 17,059 | 45,379 | 53,260 | |||||||||||||||||||
Impairment charges | — | — | — | 18,432 | |||||||||||||||||||
(Gain) / loss on sale of real estate assets | — | 445 | (2,013) | 445 | |||||||||||||||||||
| NAREIT Funds From Operations applicable to common stock | 43,485 | 44,627 | 125,530 | 138,745 | |||||||||||||||||||
| Adjustments: | |||||||||||||||||||||||
Loss on early extinguishment of debt (1) | — | — | 8,000 | 386 | |||||||||||||||||||
| Core Funds From Operations applicable to common stock | 43,485 | 44,627 | 133,530 | 139,131 | |||||||||||||||||||
| Adjustments: | |||||||||||||||||||||||
Amortization of debt issuance costs and discounts on debt | 1,561 | 1,332 | 4,591 | 3,679 | |||||||||||||||||||
| Depreciation of non-real estate assets | 368 | 347 | 1,106 | 950 | |||||||||||||||||||
Straight-line effects of lease revenue | (6,251) | (5,125) | (24,887) | (15,570) | |||||||||||||||||||
| Stock-based compensation adjustments | 2,503 | 2,153 | 4,954 | 5,240 | |||||||||||||||||||
Amortization of lease-related intangibles | (1,959) | (2,463) | (5,978) | (7,668) | |||||||||||||||||||
Non-incremental capital expenditures (2) | |||||||||||||||||||||||
| Base Building Costs | (3,203) | (6,829) | (18,768) | (25,971) | |||||||||||||||||||
| Tenant Improvement Costs | (5,575) | 67 | (14,013) | (6,579) | |||||||||||||||||||
| Leasing Commission Costs | (4,425) | (8,172) | (14,301) | (20,882) | |||||||||||||||||||
| Adjusted Funds From Operations applicable to common stock | $ | 26,504 | $ | 25,937 | $ | 66,234 | $ | 72,330 | |||||||||||||||
Weighted average common shares outstanding - diluted (3) | 126,007 | 125,675 | 125,638 | 125,087 | |||||||||||||||||||
| NAREIT Funds From Operations per share (diluted) | $ | 0.35 | $ | 0.36 | $ | 1.00 | $ | 1.11 | |||||||||||||||
| Core Funds From Operations per share (diluted) | $ | 0.35 | $ | 0.36 | $ | 1.06 | $ | 1.11 | |||||||||||||||
| (1) | During the nine months ended September 30, 2025, Piedmont repurchased approximately $67.5 million of the aggregate principal amount of the $600 Million Unsecured Senior Notes due 2028. The premium paid to repurchase the debt, as well as the write-off of the pro-rata share of unamortized debt issuance costs, resulted in the recognition of a $7.5 million loss on early extinguishment of debt. | ||||
| (2) | Non-incremental capital expenditures are defined on page 38. | ||||
| (3) | Includes potential share dilution using the treasury stock method. Such shares are not included when calculating net loss per share applicable to Piedmont as presented on the Consolidated Statements of Income, as they would reduce the loss per share presented. | ||||
| Three Months Ended | Nine Months Ended | ||||||||||||||||||||||
| 9/30/2025 | 9/30/2024 | 9/30/2025 | 9/30/2024 | ||||||||||||||||||||
| Net loss applicable to Piedmont | $ | (13,462) | $ | (11,519) | $ | (40,374) | $ | (49,091) | |||||||||||||||
| Net income applicable to noncontrolling interest | 5 | — | 13 | 4 | |||||||||||||||||||
Interest expense | 31,968 | 32,072 | 95,599 | 91,355 | |||||||||||||||||||
Depreciation | 42,127 | 38,988 | 123,644 | 116,649 | |||||||||||||||||||
Amortization | 15,188 | 17,059 | 45,379 | 53,260 | |||||||||||||||||||
| Depreciation and amortization attributable to noncontrolling interests | — | 20 | 38 | 59 | |||||||||||||||||||
Impairment charges | — | — | — | 18,432 | |||||||||||||||||||
(Gain) / loss on sale of real estate assets | — | 445 | (2,013) | 445 | |||||||||||||||||||
EBITDAre | 75,826 | 77,065 | 222,286 | 231,113 | |||||||||||||||||||
| Loss on early extinguishment of debt | — | — | 8,000 | 386 | |||||||||||||||||||
Core EBITDA | 75,826 | 77,065 | 230,286 | 231,499 | |||||||||||||||||||
General and administrative expense | 7,607 | 6,809 | 23,130 | 22,773 | |||||||||||||||||||
Management fee revenue (net) | (114) | (714) | (254) | (965) | |||||||||||||||||||
Other income | (52) | (1,983) | (364) | (2,374) | |||||||||||||||||||
Straight-line effects of lease revenue | (6,251) | (5,125) | (24,887) | (15,570) | |||||||||||||||||||
| Straight-line effects of lease revenue attributable to noncontrolling interests | — | 1 | (4) | 1 | |||||||||||||||||||
Amortization of lease-related intangibles | (1,959) | (2,463) | (5,978) | (7,668) | |||||||||||||||||||
| Property net operating income (cash basis) | 75,057 | 73,590 | 221,929 | 227,696 | |||||||||||||||||||
| Deduct net operating (income) loss from: | |||||||||||||||||||||||
Acquisitions (1) | — | — | — | — | |||||||||||||||||||
Dispositions (1) | 54 | (1,383) | (1,616) | (5,141) | |||||||||||||||||||
Other investments (2) | (42) | 816 | 211 | (838) | |||||||||||||||||||
| Same store net operating income (cash basis) | $ | 75,069 | $ | 73,023 | $ | 220,524 | $ | 221,717 | |||||||||||||||
| Change period over period | 2.8 | % | N/A | (0.5) | % | N/A | |||||||||||||||||
| (1) | Refer to page 37 for detailed information on recent acquisitions and dispositions. | ||||
| (2) | |||||
| Three Months Ended | Nine Months Ended | ||||||||||||||||||||||
| 9/30/2025 | 9/30/2024 | 9/30/2025 | 9/30/2024 | ||||||||||||||||||||
| Net loss applicable to Piedmont | $ | (13,462) | $ | (11,519) | $ | (40,374) | $ | (49,091) | |||||||||||||||
| Net income applicable to noncontrolling interest | 5 | — | 13 | 4 | |||||||||||||||||||
Interest expense | 31,968 | 32,072 | 95,599 | 91,355 | |||||||||||||||||||
Depreciation | 42,127 | 38,988 | 123,644 | 116,649 | |||||||||||||||||||
Amortization | 15,188 | 17,059 | 45,379 | 53,260 | |||||||||||||||||||
| Depreciation and amortization attributable to noncontrolling interests | — | 20 | 38 | 59 | |||||||||||||||||||
Impairment charges | — | — | — | 18,432 | |||||||||||||||||||
(Gain) / loss on sale of real estate assets | — | 445 | (2,013) | 445 | |||||||||||||||||||
EBITDAre | 75,826 | 77,065 | 222,286 | 231,113 | |||||||||||||||||||
| Loss on early extinguishment of debt | — | — | 8,000 | 386 | |||||||||||||||||||
Core EBITDA | 75,826 | 77,065 | 230,286 | 231,499 | |||||||||||||||||||
General and administrative expense | 7,607 | 6,809 | 23,130 | 22,773 | |||||||||||||||||||
Management fee revenue (net) | (114) | (714) | (254) | (965) | |||||||||||||||||||
Other income | (52) | (1,983) | (364) | (2,374) | |||||||||||||||||||
| Property net operating income (accrual basis) | 83,267 | 81,177 | 252,798 | 250,933 | |||||||||||||||||||
| Deduct net operating (income) loss from: | |||||||||||||||||||||||
Acquisitions (1) | — | — | — | — | |||||||||||||||||||
Dispositions (1) | 54 | (1,269) | (1,725) | (5,188) | |||||||||||||||||||
Other investments (2) | (118) | 687 | (37) | (1,131) | |||||||||||||||||||
| Same store net operating income (accrual basis) | $ | 83,203 | $ | 80,595 | $ | 251,036 | $ | 244,614 | |||||||||||||||
| Change period over period | 3.2 | % | N/A | 2.6 | % | N/A | |||||||||||||||||
| (1) | Refer to page 37 for detailed information on recent acquisitions and dispositions. | ||||
| (2) | |||||
| Three Months Ended | Nine Months Ended | |||||||||||||||||||||||||||||||
| 9/30/2025 | 9/30/2024 | Change ($) | Change (%) | 9/30/2025 | 9/30/2024 | Change ($) | Change (%) | |||||||||||||||||||||||||
| Revenue | ||||||||||||||||||||||||||||||||
| Cash rental income | $ | 102,222 | $ | 99,754 | $ | 2,468 | 2.5 | % | $ | 299,702 | $ | 300,315 | $ | (613) | (0.2) | % | ||||||||||||||||
| Tenant reimbursements | 22,159 | 22,670 | (511) | (2.3) | % | 68,190 | 69,175 | (985) | (1.4) | % | ||||||||||||||||||||||
| Straight-line effects of lease revenue | 6,175 | 5,108 | 1,067 | 20.9 | % | 24,534 | 15,228 | 9,306 | 61.1 | % | ||||||||||||||||||||||
| Amortization of lease-related intangibles | 1,959 | 2,464 | (505) | (20.5) | % | 5,978 | 7,669 | (1,691) | (22.0) | % | ||||||||||||||||||||||
Total rents | 132,515 | 129,996 | 2,519 | 1.9 | % | 398,404 | 392,387 | 6,017 | 1.5 | % | ||||||||||||||||||||||
Other property related income | 5,991 | 5,687 | 304 | 5.3 | % | 18,715 | 17,383 | 1,332 | 7.7 | % | ||||||||||||||||||||||
| Total revenue | 138,506 | 135,683 | 2,823 | 2.1 | % | 417,119 | 409,770 | 7,349 | 1.8 | % | ||||||||||||||||||||||
| Property operating expense | 55,411 | 55,196 | (215) | (0.4) | % | 166,406 | 165,479 | (927) | (0.6) | % | ||||||||||||||||||||||
| Other income | 108 | 108 | — | — | % | 323 | 323 | — | — | % | ||||||||||||||||||||||
| Same store net operating income (accrual) | $ | 83,203 | $ | 80,595 | $ | 2,608 | 3.2 | % | $ | 251,036 | $ | 244,614 | $ | 6,422 | 2.6 | % | ||||||||||||||||
| Less: | ||||||||||||||||||||||||||||||||
| Straight-line effects of lease revenue | (6,175) | (5,108) | (1,067) | (20.9) | % | (24,534) | (15,228) | (9,306) | (61.1) | % | ||||||||||||||||||||||
| Amortization of lease-related intangibles | (1,959) | (2,464) | 505 | 20.5 | % | (5,978) | (7,669) | 1,691 | 22.0 | % | ||||||||||||||||||||||
| Same store net operating income (cash) | $ | 75,069 | $ | 73,023 | $ | 2,046 | 2.8 | % | $ | 220,524 | $ | 221,717 | $ | (1,193) | (0.5) | % | ||||||||||||||||
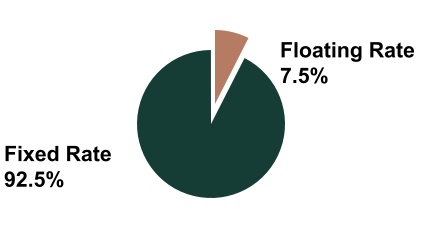
| Floating Rate & Fixed Rate Debt | |||||||||||
Debt | Principal Outstanding | Weighted Average Interest Rate | Weighted Average Maturity | ||||||||
| Fixed Rate | $2,047,196 | 6.01% | 45.4 months | ||||||||
Floating Rate | 166,000 | 5.29% | 57.0 months | ||||||||
| Total | $2,213,196 | 5.95% | 46.3 months | ||||||||
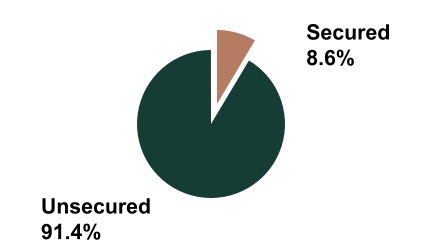
| Unsecured & Secured Debt | |||||||||||
Debt | Principal Outstanding | Weighted Average Interest Rate | Weighted Average Maturity | ||||||||
| Unsecured | $2,023,460 | 6.13% | 47.3 months | ||||||||
Secured (1) | 189,736 | 4.10% | 36.1 months | ||||||||
| Total | $2,213,196 | 5.95% | 46.3 months | ||||||||
Debt Maturities (2) | ||||||||||||||
Maturity Year | Secured Principal Outstanding | Unsecured Principal Outstanding | Weighted Average Interest Rate | Percentage of Total Debt | ||||||||||
| 2025 | $— | $— | — | — | ||||||||||
| 2026 | — | — | — | — | ||||||||||
| 2027 | — | — | — | — | ||||||||||
| 2028 | 189,736 | 857,460 | 7.12% | 47.3% | ||||||||||
| 2029 | — | 400,000 | 7.11% | 18.1% | ||||||||||
| 2030 | — | 466,000 | 4.40% | 21.0% | ||||||||||
| 2031 | — | — | — | — | ||||||||||
| 2032 | — | 300,000 | 2.78% | 13.6% | ||||||||||
| Total | $ | 189,736 | $ | 2,023,460 | 5.95% | 100.00% | ||||||||
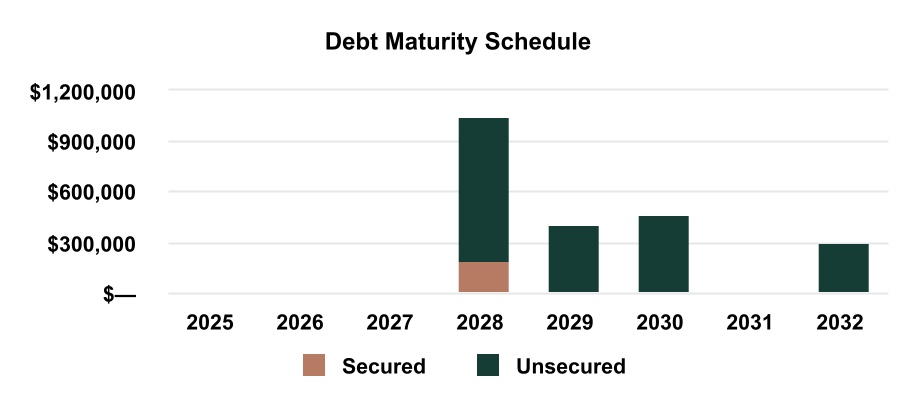
| (1) | All outstanding debt as of September 30, 2025 was interest-only with the exception of the amortizing fixed-rate mortgage associated with the 1180 Peachtree asset. | ||||
| (2) | For loans that provide extension options conditional upon proper notice to the loan's administrative agent and the payment of an extension fee, the final extended maturity date is reflected. | ||||
Facility | Stated Rate (1) | Effective Rate (2) | Maturity Date | Principal Outstanding (3) | |||||||||||||
| Secured Debt | |||||||||||||||||
| Fixed-Rate Mortgage (1180 Peachtree) | 4.10% | 4.10% | Fixed | 10/1/2028 | 189,736 | ||||||||||||
| Secured Subtotal / Weighted Average Interest Rate | 4.10% | $ | 189,736 | ||||||||||||||
| Unsecured Debt | |||||||||||||||||
$325 Million Unsecured 2024 Term Loan (4) | SOFR + 1.30% | 5.38% | Fixed | 1/29/2028 | 325,000 | ||||||||||||
$600 Million Unsecured 2023 Senior Notes (5) | 9.25% | 9.25% | Fixed | 7/20/2028 | 532,460 | ||||||||||||
| $400 Million Unsecured 2024 Senior Notes | 6.88% | 7.11% | Fixed | 7/15/2029 | 400,000 | ||||||||||||
$600 Million Unsecured Line of Credit (6) | SOFR + 1.05% | 5.29% | Floating | 6/30/2030 | 166,000 | ||||||||||||
| $300 Million Unsecured 2020 Senior Notes | 3.15% | 3.90% | Fixed | 8/15/2030 | 300,000 | ||||||||||||
| $300 Million Unsecured 2021 Senior Notes | 2.75% | 2.78% | Fixed | 4/1/2032 | 300,000 | ||||||||||||
| Unsecured Subtotal / Weighted Average Interest Rate | 6.13% | $ | 2,023,460 | ||||||||||||||
Total Debt - Principal Amount Outstanding / Weighted Average Interest Rate | 5.95% | $ | 2,213,196 | ||||||||||||||
GAAP Adjustments - Discounts and Unamortized Debt Issuance Costs | (19,872) | ||||||||||||||||
| Total Debt - GAAP | $ | 2,193,324 | |||||||||||||||
| Less: Cash, cash equivalents, and restricted cash and escrows | 8,135 | ||||||||||||||||
| Total Net Debt - Principal Amount Outstanding | $ | 2,205,061 | |||||||||||||||
| (1) | The stated rates for the term loan and the line of credit are comprised of the relevant SOFR selection and an additional spread based on Piedmont's current credit rating, as defined in the respective loan agreement. | ||||
| (2) | The effective rates reflect the consideration of settled or in-place interest rate swap agreements and issuance discounts. | ||||
| (3) | All outstanding debt at period end was interest-only with the exception of the amortizing fixed-rate mortgage. | ||||
| (4) | The $325 million unsecured term loan has a stated variable interest rate; however, Piedmont has entered into multiple interest rate swap agreements which effectively fixes the entire facility through February 1, 2026. The loan has an initial maturity date of January 29, 2027 with two six-month extension options for a final maturity date of January 29, 2028; provided that Piedmont is not then in default and upon payment of extension fees. | ||||
| (5) | During the second quarter of 2025, Piedmont repurchased approximately $67.5 million of its $600 Million Unsecured 2023 Senior Notes, using availability on the $600 Million Unsecured Line of Credit and cash on hand. | ||||
| (6) | Piedmont may select from multiple interest rate options with each draw under the revolving credit facility, including the prime rate and various SOFR selections. The facility has an initial maturity date of June 30, 2028 with two one-year extension options for a final maturity date of June 30, 2030; provided that Piedmont is not then in default and upon payment of extension fees. | ||||
| Three Months Ended | ||||||||||||||||||||
Bank Debt Covenant Compliance (1) | Required | 9/30/2025 | 6/30/2025 | 3/31/2025 | 12/31/2024 | 9/30/2024 | ||||||||||||||
| Maximum leverage ratio | 0.60 | 0.48 | 0.47 | 0.48 | 0.44 | 0.42 | ||||||||||||||
Minimum fixed charge coverage ratio (2) | 1.50 | 2.15 | 2.15 | 2.21 | 2.24 | 2.35 | ||||||||||||||
| Maximum secured indebtedness ratio | 0.40 | 0.04 | 0.04 | 0.04 | 0.04 | 0.04 | ||||||||||||||
| Minimum unencumbered leverage ratio | 1.60 | 2.12 | 2.13 | 2.12 | 2.31 | 2.33 | ||||||||||||||
Minimum unencumbered interest coverage ratio (3) | 1.75 | 2.19 | 2.17 | 2.22 | 2.30 | 2.40 | ||||||||||||||
| Three Months Ended | ||||||||||||||||||||
Bond Covenant Compliance (4) | Required | 9/30/2025 | 6/30/2025 | 3/31/2025 | 12/31/2024 | 9/30/2024 | ||||||||||||||
| Total debt to total assets | 60% or less | 46.5% | 46.8% | 46.8% | 46.6% | 46.7% | ||||||||||||||
| Secured debt to total assets | 40% or less | 4.0% | 4.1% | 4.1% | 4.0% | 4.0% | ||||||||||||||
| Ratio of consolidated EBITDA to interest expense | 1.50 or greater | 2.53 | 2.53 | 2.58 | 2.57 | 2.70 | ||||||||||||||
| Unencumbered assets to unsecured debt | 150% or greater | 213% | 212% | 212% | 213% | 212% | ||||||||||||||
| Other Debt Coverage Ratios for Debt Holders | As of | As of | ||||||
| (trailing twelve months) | September 30, 2025 | December 31, 2024 | ||||||
Average net principal amount of debt to Core EBITDA (5) | 7.1 x | 6.8 x | ||||||
Fixed charge coverage ratio (6) | 2.1 x | 2.2 x | ||||||
Interest coverage ratio (7) | 2.2 x | 2.3 x | ||||||
| (1) | Bank debt covenant compliance calculations relate to the most restrictive of the specific calculations detailed in the relevant credit agreements. Please refer to such agreements for relevant defined terms. | ||||
| (2) | Defined as EBITDA for the trailing four quarters (including the Company's share of EBITDA from unconsolidated interests), excluding one-time or non-recurring gains or losses, less a $0.15 per square foot capital reserve, and excluding the impact of straight line rent leveling adjustments and amortization of intangibles divided by the Company's share of fixed charges, as more particularly described in the credit agreements. This definition of fixed charge coverage ratio as prescribed by our credit agreements is different from the fixed charge coverage ratio definition employed elsewhere within this report. | ||||
| (3) | Defined as net operating income for the trailing four quarters for unencumbered assets (including the Company's share of net operating income from partially-owned entities and subsidiaries that are deemed to be unencumbered) less a $0.15 per square foot capital reserve divided by the Company's share of interest expense associated with unsecured financings only, as more particularly described in the credit agreements. | ||||
| (4) | Bond covenant compliance calculations relate to specific calculations prescribed in the relevant debt agreements. Please refer to the Indenture and the First Supplemental Indenture dated March 6, 2014, the Second Supplemental Indenture dated August 12, 2020, the Third Supplemental Indenture dated September 20, 2021, the Fourth Supplemental Indenture dated July 20, 2023, and the Fifth Supplemental Indenture dated June 25, 2024 for defined terms and detailed information about the calculations. | ||||
| (5) | Calculated using the sum of Core EBITDA for the trailing twelve month period and the average principal balance of debt outstanding for the trailing twelve months less the average balance of cash and restricted cash and escrows during the trailing twelve month period. | ||||
| (6) | Calculated as Core EBITDA divided by the sum of interest expense, principal amortization, capitalized interest and preferred dividends (none during periods presented). | ||||
| The Company recorded principal amortization of $0.9 million for each of the quarters ended September 30, 2025, June 30, 2025, March 31, 2025, December 31, 2024, and September 30, 2024. | |||||
| The Company recorded capitalized interest of $2.9 million for the quarter ended September 30, 2025, $3.2 million for the quarter ended June 30, 2025, $3.3 million for the quarter ended March 31, 2025, $3.7 million for the quarter ended December 31, 2024, and $3.4 million for the quarter ended September 30, 2024. | |||||
| (7) | Calculated as Core EBITDA divided by the sum of interest expense and capitalized interest. The Company recorded capitalized interest of $2.9 million for the quarter ended September 30, 2025, $3.2 million for the quarter ended June 30, 2025, $3.3 million for the quarter ended March 31, 2025, $3.7 million for the quarter ended December 31, 2024, and $3.4 million for the quarter ended September 30, 2024. | ||||
| Three Months Ended | Three Months Ended | ||||||||||||||||||||||
| September 30, 2025 | September 30, 2024 | ||||||||||||||||||||||
Leased Square Footage | Rentable Square Footage | Percent Leased (1) | Leased Square Footage | Rentable Square Footage | Percent Leased (1) | ||||||||||||||||||
| In-Service Leased - beginning of period | 13,230 | 14,923 | 88.7 | % | 13,669 | 15,658 | 87.3 | % | |||||||||||||||
| Total leasing executed during period | 724 | 461 | |||||||||||||||||||||
| Less: Lease renewals signed during period | (173) | (256) | |||||||||||||||||||||
| Less: New leases signed during period for currently occupied space | (74) | (49) | |||||||||||||||||||||
| Less: New leases signed during period for current out of service space | (183) | (14) | |||||||||||||||||||||
| Less: Leases expired during period and other | (220) | (5) | (45) | (8) | |||||||||||||||||||
| Subtotal | 13,304 | 14,918 | 89.2 | % | 13,766 | 15,650 | 88.0 | % | |||||||||||||||
Acquisitions / (dispositions) (2) | — | — | (146) | (315) | |||||||||||||||||||
Assets placed in service / (taken out of service) (3) | — | — | — | — | |||||||||||||||||||
| In-Service Leased - end of period | 13,304 | 14,918 | 89.2 | % | 13,620 | 15,335 | 88.8 | % | |||||||||||||||
| Nine Months Ended | Nine Months Ended | ||||||||||||||||||||||
| September 30, 2025 | September 30, 2024 | ||||||||||||||||||||||
Leased Square Footage | Rentable Square Footage | Percent Leased (1) | Leased Square Footage | Rentable Square Footage | Percent Leased (1) | ||||||||||||||||||
| In-Service Leased - beginning of period | 13,538 | 15,323 | 88.4 | % | 14,426 | 16,563 | 87.1 | % | |||||||||||||||
| Total leasing executed during period | 1,799 | 1,999 | |||||||||||||||||||||
| Less: Lease renewals signed during period | (600) | (1,061) | |||||||||||||||||||||
| Less: New leases signed during period for currently occupied space | (202) | (264) | |||||||||||||||||||||
| Less: New leases signed during period for current out of service space | (361) | (32) | |||||||||||||||||||||
| Less: Leases expired during period and other | (507) | 22 | (1,015) | — | |||||||||||||||||||
| Subtotal | 13,667 | 15,345 | 89.1 | % | 14,053 | 16,563 | 84.8 | % | |||||||||||||||
Acquisitions / (dispositions) (2) | (363) | (427) | (403) | (572) | |||||||||||||||||||
Assets placed in service / (taken out of service) (3) | — | — | (30) | (656) | |||||||||||||||||||
| In-Service Leased - end of period | 13,304 | 14,918 | 89.2 | % | 13,620 | 15,335 | 88.8 | % | |||||||||||||||
| Same Store Analysis | ||||||||||||||||||||||||||
Less: Acquisitions and dispositions after September 30, 2024 (2) | — | — | — | % | (359) | (427) | 84.1 | % | ||||||||||||||||||
Less: Change in out of service assets after September 30, 2024 (3) | — | — | — | % | — | — | — | % | ||||||||||||||||||
| Same Store Leased Percentage - end of period | 13,304 | 14,918 | 89.2 | % | 13,261 | 14,908 | 89.0 | % | ||||||||||||||||||
| (1) | Calculated as the square footage of commenced leases plus the square footage of uncommenced leases for spaces vacant as of period end, divided by total rentable in-service square footage at period end. | ||||
| (2) | Refer to page 37 for detailed information on recent acquisitions and dispositions. | ||||
| (3) | Refer to page 36 for detailed information on assets placed out of service. | ||||
| Three Months Ended | |||||||||||||||||
| September 30, 2025 | |||||||||||||||||
| Square Feet (in thousands) | % of Total Signed During Period | % of Rentable Square Footage | % Change Cash Rents (1) | % Change Accrual Rents (2) | |||||||||||||
Leases executed for spaces vacant one year or less | 237 | 32.7% | 1.6% | 8.6% | 20.2% | ||||||||||||
Leases executed for spaces excluded from analysis (3) | 488 | 67.3% | |||||||||||||||
| Nine Months Ended | |||||||||||||||||
| September 30, 2025 | |||||||||||||||||
| Square Feet (in thousands) | % of Total Signed During Period | % of Rentable Square Footage | % Change Cash Rents (1) | % Change Accrual Rents (2) | |||||||||||||
Leases executed for spaces vacant one year or less | 591 | 32.8% | 4.0% | 8.9% | 18.1% | ||||||||||||
Leases executed for spaces excluded from analysis (3) | 1,209 | 67.2% | |||||||||||||||
| (1) | Calculation compares the last twelve months of cash paying rents of the previous lease to the first twelve months of cash paying rents of the new lease. | ||||
| (2) | Calculation compares the accrual basis rents of the previous lease to the accrual basis rents of the new leases. For newly signed leases which have variations in accrual basis rents, whether because of known future expansions, contractions, lease expense recovery structure changes, or other similar reasons, the weighted average of such varying accrual basis rents is used for the calculation. | ||||
| (3) | Leases are excluded from the above analyses if: (1) the space has been vacant for more than one year, (2) the lease term is less than one year, (3) the lease is associated with storage space, retail space, a management office, or a percentage rent agreement, or (4) the lease is associated with a recently acquired asset for which there is less than one year of operating history. | ||||
| Three Months Ended September 30, 2025 | Nine Months Ended September 30, 2025 | For the Year Ended | 2021 to 2025 (Weighted Average) | ||||||||||||||||||||
2024 (2) | 2023 (3) | 2022 | 2021 | ||||||||||||||||||||
| Total Leasing Transactions | |||||||||||||||||||||||
Square feet (1) | 724,415 | 1,795,835 | 2,428,246 | 2,239,797 | 2,142,852 | 2,247,366 | 10,854,096 | ||||||||||||||||
Tenant improvements per square foot per year of lease term | $3.75 | $4.25 | $3.70 | $3.80 | $3.22 | $2.78 | $3.58 | ||||||||||||||||
Leasing commissions per square foot per year of lease term | $2.71 | $2.77 | $2.31 | $2.21 | $2.22 | $1.67 | $2.24 | ||||||||||||||||
Total per square foot per year of lease term | $6.46 | $7.02 | $6.01 | $6.01 | $5.44 | $4.45 | $5.82 | ||||||||||||||||
Less Adjustment for Commitment Expirations (4) | |||||||||||||||||||||||
| Expired tenant improvements (not paid out) per square foot per year of lease term | $0.30 | -$0.29 | -$0.34 | -$0.79 | -$0.10 | -$0.20 | -$0.37 | ||||||||||||||||
| Adjusted total per square foot per year of lease term | $6.76 | $6.73 | $5.67 | $5.22 | $5.34 | $4.25 | $5.45 | ||||||||||||||||
| (1) | Excludes leasing transactions associated with storage and license spaces. | ||||
| (2) | Tenant improvement and leasing commission amounts presented for the twelve months ended December 31, 2024 include a 101,500 square foot 11-year lease executed in the first quarter of 2024 with no capital outlay requirements. | ||||
| (3) | Tenant improvement amounts presented for the year ended December 31, 2023 were adjusted to reflect the overall concession package for the 447,000 square foot 10-year renewal with US Bancorp, executed in the fourth quarter of 2023. The renewal terms provided for zero months of rent abatement, offset by an above-market tenant improvement allowance. The amounts are presented as if the renewal had included the standard twelve months of gross rent abatement in line with market conditions and, therefore, a normalized tenant improvement allowance. This adjustment effectively lowered the total capital per square foot per year of lease term for the year ended December 31, 2023 by $0.97. | ||||
| (4) | The Company reports total tenant improvement amounts based on the maximum amount of committed leasing capital in the period in which the lease is executed. However, tenants do not always use the full allowance provided for in the lease, or a portion of the allowance could expire at a set date. To provide additional clarity on actual costs for completed leasing transactions, tenant improvement allowances that have expired or are no longer available to the tenant are disclosed in this section and are deducted from the capital commitments per square foot of leased space in the periods in which they expired. | ||||
| Three Months Ended | Five Quarter | ||||||||||||||||||||||||||||||||||
| 9/30/2025 | 6/30/2025 | 3/31/2025 | 12/31/2024 | 9/30/2024 | Average | ||||||||||||||||||||||||||||||
Leasing activity included in net effective rent analysis (1) | |||||||||||||||||||||||||||||||||||
| Renewal leasing square footage (in 000s) | 119 | 124 | 162 | 301 | 159 | 173 | |||||||||||||||||||||||||||||
| New tenant leasing square footage (in 000s) | 539 | 455 | 169 | 93 | 191 | 289 | |||||||||||||||||||||||||||||
| Total leasing square footage (in 000s) | 658 | 579 | 331 | 394 | 350 | 462 | |||||||||||||||||||||||||||||
| Renewal square footage (% of total) | 18.1 | % | 21.4 | % | 48.9 | % | 76.4 | % | 45.4 | % | 42.0 | % | |||||||||||||||||||||||
| New Lease square footage (% of total) | 81.9 | % | 78.6 | % | 51.1 | % | 23.6 | % | 54.6 | % | 58.0 | % | |||||||||||||||||||||||
| # of lease transactions | 64 | 49 | 50 | 40 | 49 | 50 | |||||||||||||||||||||||||||||
Net effective rents (2) (3) | |||||||||||||||||||||||||||||||||||
| Base rent (gross) | $ | 44.67 | $ | 45.62 | $ | 49.60 | $ | 45.58 | $ | 43.78 | $ | 45.85 | |||||||||||||||||||||||
| Rent concessions | (2.46) | (2.57) | (2.71) | (1.97) | (2.22) | (2.39) | |||||||||||||||||||||||||||||
| GAAP Rent | $ | 42.21 | $ | 43.06 | $ | 46.89 | $ | 43.60 | $ | 41.56 | $ | 43.46 | |||||||||||||||||||||||
| Tenant improvements | (3.31) | (4.40) | (3.33) | (3.00) | (3.38) | (3.48) | |||||||||||||||||||||||||||||
| Leasing commissions | (2.75) | (2.70) | (2.89) | (2.69) | (2.21) | (2.65) | |||||||||||||||||||||||||||||
| Other concessions | (0.01) | — | (0.35) | (0.21) | (0.01) | (0.12) | |||||||||||||||||||||||||||||
| Effective rent after capex | $ | 36.14 | $ | 35.95 | $ | 40.32 | $ | 37.70 | $ | 35.96 | $ | 37.21 | |||||||||||||||||||||||
| Expense stop | (14.88) | (15.17) | (16.03) | (15.05) | (15.68) | (15.36) | |||||||||||||||||||||||||||||
| Effective rent after capex and opex | $ | 21.26 | $ | 20.78 | $ | 24.29 | $ | 22.65 | $ | 20.28 | $ | 21.85 | |||||||||||||||||||||||
| Weighted average lease term in years (weighted by square feet) | 8.8 | 9.5 | 7.4 | 7.0 | 6.9 | 7.9 | |||||||||||||||||||||||||||||
| (1) | Leases are excluded from this analysis if: (1) the lease term is one year or less or (2) the lease is associated with non-office space (storage, retail or a management office). Total leased square footage in this analysis will not tie to the total reported leasing volume reported elsewhere in this supplemental report. | ||||
| (2) | Based on the weighted average per rentable square footage over the lease term of each deal. | ||||
| (3) | Excludes parking income due to the variable nature between markets and individual lease transactions. | ||||
Uncommenced Leases for Vacant Space (1) | ||||||||||||||||||||
| 920,000 square feet representing $38.7 million in future annual cash rent | ||||||||||||||||||||
| Major Leases (by Industry) | Project | Market | Square Feet Leased | Space Status | Estimated Lease Commencement Date | New / Expansion | ||||||||||||||
| Video game development | The Exchange on Orange | Orlando | 27,830 | Vacant | Q4 2025 | New | ||||||||||||||
| Supply chain solutions consultant | Galleria on the Park | Atlanta | 25,437 | Vacant | Q4 2025 | New | ||||||||||||||
| Food production and distribution | 9320 Excelsior | Minneapolis | 84,479 | Vacant | Q1 2026 (77,197 SF) & Q1 2029 (7,282 SF) | New | ||||||||||||||
| General contracting and construction | Meridian | Minneapolis | 34,013 | Vacant | Q1 2026 | New | ||||||||||||||
| Banking and financial services | Meridian | Minneapolis | 27,049 | Vacant | Q1 2026 | New | ||||||||||||||
| Global risk management | Galleria Towers | Dallas | 92,977 | Vacant | Q2 2026 | New | ||||||||||||||
| International data centers provider | Interlink at Las Colinas | Dallas | 56,080 | Vacant | Q2 2026 | New | ||||||||||||||
| Engineering, architecture and construction | Galleria Towers | Dallas | 46,004 | Vacant | Q2 2026 | New | ||||||||||||||
| Insurance and financial services | 9320 Excelsior | Minneapolis | 40,793 | Vacant | Q2 2026 | New | ||||||||||||||
| Banking and financial services | Meridian | Minneapolis | 44,977 | Vacant | Q4 2026 | New | ||||||||||||||
| Engineering and environmental consulting | Meridian | Minneapolis | 85,267 | Vacant | Q4 2026 | New | ||||||||||||||
Leases Currently Under Abatement (1) | ||||||||||||||||||||
| 1.1 million square feet representing $35.7 million in future annual cash rent | ||||||||||||||||||||
| Major Leases (by Industry) | Project | Market | Square Feet Abated | Lease Commencement | Remaining Abatement Schedule | Lease Expiration | ||||||||||||||
| Global energy conglomerate | Galleria on the Park | Atlanta | 77,163 | Q3 2024 | September 2024 through September 2025 | Q3 2036 | ||||||||||||||
| Financial services | Crescent Ridge II | Minneapolis | 32,326 | Q4 2024 | October 2024 through March 2026 | Q1 2041 | ||||||||||||||
| Insurance and financial services | Glenridge Highlands | Atlanta | 35,903 | Q4 2024 | December 2024 through November 2025 | Q4 2035 | ||||||||||||||
| Insurance and financial services | Galleria on the Park | Atlanta | 30,168 | Q4 2024 | December 2024 through October 2025 | Q3 2035 | ||||||||||||||
| Construction materials supplier | Interlink at Las Colinas | Dallas | 21,303 | Q4 2024 | Mid-December 2024 through Mid-December 2025 | Q4 2036 | ||||||||||||||
| Accounting and business advisory | US Bancorp Center | Minneapolis | 40,622 | Q4 2024 | January 2025 through December 2025 | Q4 2037 | ||||||||||||||
| Commercial real estate | CNL Center | Orlando | 26,372 | Q2 2025 | April 2025 through December 2025 | Q4 2037 | ||||||||||||||
| Commercial real estate | CNL Center | Orlando | 23,711 | Q2 2025 | May 2025 through February 2026 (50% abated) | Q3 2031 | ||||||||||||||
| National legal services | Galleria Towers | Dallas | 28,153 | Q3 2025 | August 2025 through January 2026 | Q1 2032 | ||||||||||||||
| Travel services | 501 West Church | Orlando | 182,461 | Q3 2025 | September 2025 through October 2025 | Q4 2040 | ||||||||||||||
| Insurance and financial services | Galleria on the Park | Atlanta | 46,939 | Q3 2025 | September 2025 through August 2026 | Q4 2036 | ||||||||||||||
| (1) | Includes leasing activity for the total portfolio, including assets currently out of service. | ||||
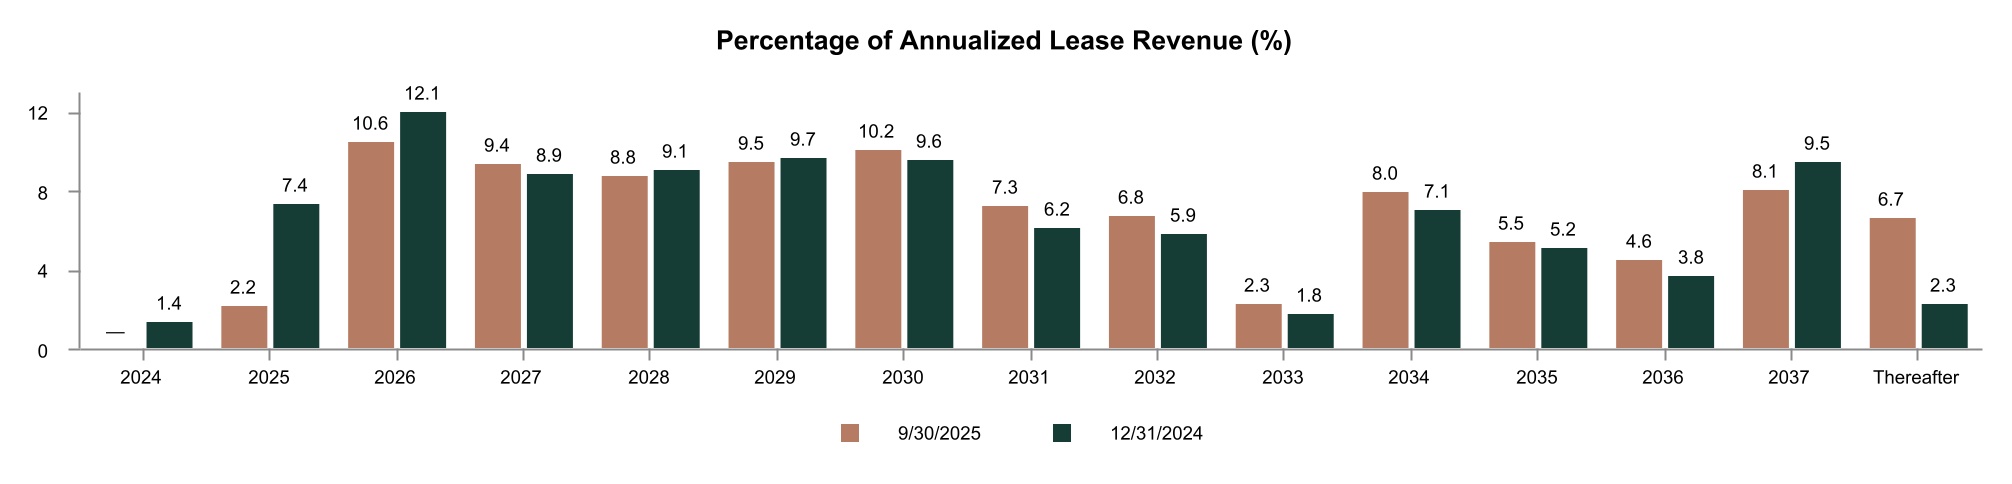
| Expiration Year | Annualized Lease Revenue (1) | Percentage of Annualized Lease Revenue (%) | Rentable Square Footage | Percentage of Rentable Square Footage (%) | |||||||||||||
| Vacant | $— | — | 1,614 | 10.8 | |||||||||||||
2025 (2) | 12,774 | 2.2 | 334 | 2.3 | |||||||||||||
| 2026 | 60,908 | 10.6 | 1,442 | 9.7 | |||||||||||||
| 2027 | 54,106 | 9.4 | 1,361 | 9.1 | |||||||||||||
| 2028 | 50,400 | 8.8 | 1,252 | 8.4 | |||||||||||||
| 2029 | 54,570 | 9.5 | 1,264 | 8.5 | |||||||||||||
| 2030 | 58,700 | 10.2 | 1,362 | 9.1 | |||||||||||||
| 2031 | 41,824 | 7.3 | 1,020 | 6.8 | |||||||||||||
| 2032 | 39,408 | 6.8 | 918 | 6.2 | |||||||||||||
| 2033 | 13,056 | 2.3 | 295 | 2.0 | |||||||||||||
| 2034 | 46,224 | 8.0 | 1,167 | 7.8 | |||||||||||||
| 2035 | 31,740 | 5.5 | 778 | 5.2 | |||||||||||||
| 2036 | 26,231 | 4.6 | 647 | 4.3 | |||||||||||||
| 2037 | 46,349 | 8.1 | 867 | 5.8 | |||||||||||||
| Thereafter | 38,479 | 6.7 | 597 | 4.0 | |||||||||||||
| Total | $574,769 | 100.0 | 14,918 | 100.0 | |||||||||||||
| Average Lease Term Remaining | |||||
| 9/30/2025 | 6.0 years | ||||
| 12/31/2024 | 6.0 years | ||||
| (1) | Annualized rental income associated with each newly executed lease for currently occupied space is incorporated herein only at the expiration date for the current lease. Annualized rental income associated with each such new lease is removed from the expiry year of the current lease and added to the expiry year of the new lease. These adjustments effectively incorporate known roll ups and roll downs into the expiration schedule. | ||||
| (2) | Includes leases with an expiration date of September 30, 2025, comprised of approximately 20,000 square feet and Annualized Lease Revenue of $0.9 million. | ||||
Q4 2025 (1) | Q1 2026 | Q2 2026 | Q3 2026 | |||||||||||||||||||||||||||||||||||
| Location | Expiring Square Footage | Expiring Lease Revenue (2) | Expiring Square Footage | Expiring Lease Revenue (2) | Expiring Square Footage | Expiring Lease Revenue (2) | Expiring Square Footage | Expiring Lease Revenue (2) | ||||||||||||||||||||||||||||||
| Atlanta | 79 | $2,721 | 52 | $2,145 | 282 | $11,305 | 88 | $3,452 | ||||||||||||||||||||||||||||||
| Boston | — | — | 3 | 167 | 2 | 102 | 6 | 32 | ||||||||||||||||||||||||||||||
| Dallas | 65 | 2,644 | 6 | 313 | 240 | 8,576 | 37 | 1,244 | ||||||||||||||||||||||||||||||
| Minneapolis | 140 | 5,526 | 11 | 290 | 9 | 395 | 3 | 147 | ||||||||||||||||||||||||||||||
| New York | — | 6 | 5 | 176 | 313 | 16,619 | — | — | ||||||||||||||||||||||||||||||
| Orlando | 32 | 1,137 | 32 | 1,201 | 20 | 678 | 56 | 2,229 | ||||||||||||||||||||||||||||||
| Northern Virginia / Washington, D.C. | 18 | 979 | 1 | 70 | — | 16 | 57 | 3,198 | ||||||||||||||||||||||||||||||
| Other | — | — | — | — | — | — | — | — | ||||||||||||||||||||||||||||||
Total (3) | 334 | $13,013 | 110 | $4,362 | 866 | $37,691 | 247 | $10,302 | ||||||||||||||||||||||||||||||
| (1) | Includes leases with an expiration date of September 30, 2025, comprised of approximately 20,000 square feet and expiring lease revenue of $0.9 million. No such adjustments are made to other periods presented. | ||||
| (2) | Expiring Lease Revenue is calculated as expiring square footage multiplied by the gross rent per square foot of the tenant currently leasing the space. | ||||
| (3) | Total expiring lease revenue in any given year will not tie to the expiring Annualized Lease Revenue presented on the Lease Expiration Schedule on the previous page as the Lease Expiration Schedule accounts for the revenue effects of newly signed leases. Reflected herein are expiring revenues based on in-place rental rates. | ||||
12/31/2025 (1) | 12/31/2026 | 12/31/2027 | 12/31/2028 | 12/31/2029 | |||||||||||||||||||||||||||||||||||||||||||
| Location | Expiring Square Footage | Expiring Lease Revenue (2) | Expiring Square Footage | Expiring Lease Revenue (2) | Expiring Square Footage | Expiring Lease Revenue (2) | Expiring Square Footage | Expiring Lease Revenue (2) | Expiring Square Footage | Expiring Lease Revenue (2) | |||||||||||||||||||||||||||||||||||||
| Atlanta | 79 | $2,721 | 449 | $17,888 | 601 | $24,805 | 424 | $17,649 | 442 | $18,077 | |||||||||||||||||||||||||||||||||||||
| Boston | — | — | 13 | 403 | 44 | 2,200 | 8 | 419 | 197 | 8,558 | |||||||||||||||||||||||||||||||||||||
| Dallas | 65 | 2,644 | 372 | 13,607 | 158 | 5,181 | 325 | 14,089 | 269 | 13,227 | |||||||||||||||||||||||||||||||||||||
| Minneapolis | 140 | 5,526 | 26 | 888 | 210 | 7,466 | 67 | 2,380 | 50 | 1,915 | |||||||||||||||||||||||||||||||||||||
| New York | — | 6 | 318 | 16,795 | 7 | 636 | 2 | 175 | 17 | 1,024 | |||||||||||||||||||||||||||||||||||||
| Orlando | 32 | 1,137 | 164 | 6,015 | 297 | 11,215 | 89 | 3,347 | 218 | 8,285 | |||||||||||||||||||||||||||||||||||||
| Northern Virginia / Washington, D.C. | 18 | 979 | 100 | 5,663 | 44 | 2,502 | 78 | 4,536 | 71 | 3,789 | |||||||||||||||||||||||||||||||||||||
| Other | — | — | — | — | — | 5 | 259 | 8,364 | — | 6 | |||||||||||||||||||||||||||||||||||||
Total (3) | 334 | $13,013 | 1,442 | $61,259 | 1,361 | $54,010 | 1,252 | $50,959 | 1,264 | $54,881 | |||||||||||||||||||||||||||||||||||||
| (1) | Includes leases with an expiration date of September 30, 2025, comprised of approximately 20,000 square feet and expiring lease revenue of $0.9 million. No such adjustments are made to other periods presented. | ||||
| (2) | Expiring Lease Revenue is calculated as expiring square footage multiplied by the gross rent per square foot of the tenant currently leasing the space. | ||||
| (3) | Total expiring lease revenue in any given year will not tie to the expiring Annualized Lease Revenue presented on the Lease Expiration Schedule on page 27 as the Lease Expiration Schedule accounts for the revenue effects of newly signed leases. Reflected herein are expiring revenues based on in-place rental rates. | ||||
| Tenants Contributing 1% or More to Annualized Lease Revenue | |||||||||||||||||||||||
| Tenant | Credit Rating (1) S&P / Moody's | Number of Properties | Lease Term Remaining (in years) | Annualized Lease Revenue (in thousands) | Percentage of Annualized Lease Revenue (%) | Leased Square Footage (in thousands) | Percentage of Leased Square Footage (%) | ||||||||||||||||
| State of New York | AA+ / Aa1 | 1 | 11.9 | $28,344 | 4.9 | 486 | 3.6 | ||||||||||||||||
| City of New York | AA / Aa2 | 1 | 0.7 | 16,619 | 2.9 | 313 | 2.3 | ||||||||||||||||
| US Bancorp | A / A3 | 1 | 8.4 | 16,184 | 2.8 | 447 | 3.4 | ||||||||||||||||
| Amazon | AA / A1 | 2 | 4.8 | 15,289 | 2.7 | 285 | 2.1 | ||||||||||||||||
| Microsoft | AAA / Aaa | 2 | 5.7 | 14,319 | 2.5 | 355 | 2.7 | ||||||||||||||||
| King & Spalding | No Rating Available | 1 | 5.5 | 13,438 | 2.3 | 268 | 2.0 | ||||||||||||||||
| Transocean | CCC+ / B3 | 1 | 10.6 | 12,315 | 2.1 | 301 | 2.3 | ||||||||||||||||
| VMware, Inc. | A- / A3 | 1 | 1.8 | 9,761 | 1.7 | 215 | 1.6 | ||||||||||||||||
| Schlumberger Technology | A / A1 | 1 | 3.3 | 8,311 | 1.4 | 254 | 1.9 | ||||||||||||||||
| Gartner | BBB- / Baa3 | 3 | 8.7 | 8,270 | 1.4 | 209 | 1.6 | ||||||||||||||||
| Fiserv | BBB / Baa2 | 1 | 1.8 | 7,900 | 1.4 | 195 | 1.5 | ||||||||||||||||
| Salesforce.com | A+ / A1 | 1 | 3.8 | 7,803 | 1.4 | 182 | 1.4 | ||||||||||||||||
| Epsilon Data Management (subsidiary of Publicis) | BBB+ / Baa1 | 1 | 0.8 | 7,351 | 1.3 | 222 | 1.7 | ||||||||||||||||
| Eversheds Sutherland | No Rating Available | 1 | 0.6 | 7,279 | 1.3 | 180 | 1.3 | ||||||||||||||||
| Travel + Leisure Co. | BB- / Ba3 | 1 | 15.1 | 5,702 | 1.0 | 182 | 1.4 | ||||||||||||||||
| Other | Various | 395,884 | 68.9 | 9,210 | 69.2 | ||||||||||||||||||
| Total | $574,769 | 100.0 | 13,304 | 100.0 | |||||||||||||||||||
| (1) | Credit rating may reflect the credit rating of the parent or a guarantor. The absence of a credit rating for a tenant is not an indication of the creditworthiness of the tenant; in most cases, the lack of a credit rating reflects that the tenant has not sought such a rating. | ||||
Rating Level (1) S&P / Moody's | Annualized Lease Revenue (in thousands) | Percentage of Annualized Lease Revenue (%) | ||||||
| AAA / Aaa | $15,021 | 2.6 | ||||||
| AA / Aa | 80,306 | 14.0 | ||||||
| A / A | 69,325 | 12.1 | ||||||
| BBB / Baa | 51,097 | 8.9 | ||||||
| BB / Ba | 19,970 | 3.5 | ||||||
| B / B | 28,885 | 5.0 | ||||||
| Below | 126 | — | ||||||
Not rated (2) | 310,039 | 53.9 | ||||||
| Total | $574,769 | 100.0 | ||||||
| Lease Size | Number of Leases | Percentage of Leases (%) | Annualized Lease Revenue (in thousands) | Percentage of Annualized Lease Revenue (%) | Leased Square Footage (in thousands) | Percentage of Leased Square Footage (%) | ||||||||||||||
| 2,500 sf or Less | 325 | 33.5 | $26,865 | 4.7 | 243 | 1.8 | ||||||||||||||
| 2,501 - 10,000 sf | 387 | 39.9 | 83,202 | 14.5 | 2,008 | 15.1 | ||||||||||||||
| 10,001 - 20,000 sf | 107 | 11.0 | 59,689 | 10.4 | 1,434 | 10.8 | ||||||||||||||
| 20,001 - 40,000 sf | 80 | 8.2 | 86,630 | 15.0 | 2,150 | 16.2 | ||||||||||||||
| 40,001 - 100,000 sf | 50 | 5.2 | 138,584 | 24.1 | 3,158 | 23.7 | ||||||||||||||
| Greater than 100,000 sf | 21 | 2.2 | 179,799 | 31.3 | 4,311 | 32.4 | ||||||||||||||
| Total | 970 | 100.0 | $574,769 | 100.0 | 13,304 | 100.0 | ||||||||||||||
| (1) | Credit rating may reflect the credit rating of the parent or a guarantor. Where differences exist between the Standard & Poor's credit rating and the Moody's credit rating for a tenant, the higher credit rating is selected for this analysis. | ||||
| (2) | The classification of a tenant as "not rated" is not an indication of the creditworthiness of the tenant; in most cases, the lack of a credit rating reflects that the tenant has not sought such a rating. Included in this category are such tenants as Piper Sandler, Ernst & Young, KPMG, BDO, and RaceTrac Petroleum. | ||||
| Percentage of | Leased | Percentage | |||||||||||||||||||||
| Number of | Percentage of Total | Annualized Lease | Annualized Lease | Square | of Leased | ||||||||||||||||||
| Industry | Tenants | Tenants (%) | Revenue (ALR) | Revenue (%) | Footage | Square Footage (%) | |||||||||||||||||
| Business Services | 87 | 11.5 | $86,548 | 15.1 | 2,132 | 16.0 | |||||||||||||||||
| Engineering, Accounting, Research, Management & Related Services | 98 | 12.9 | 74,256 | 12.9 | 1,703 | 12.8 | |||||||||||||||||
| Legal Services | 82 | 10.8 | 62,148 | 10.8 | 1,424 | 10.7 | |||||||||||||||||
Governmental Entity (1) | 5 | 0.7 | 50,910 | 8.9 | 917 | 6.9 | |||||||||||||||||
| Real Estate | 51 | 6.7 | 30,065 | 5.2 | 842 | 6.3 | |||||||||||||||||
| Holding and Other Investment Offices | 45 | 5.9 | 25,570 | 4.4 | 574 | 4.3 | |||||||||||||||||
| Depository Institutions | 18 | 2.4 | 24,961 | 4.3 | 651 | 4.9 | |||||||||||||||||
| Oil and Gas Extraction | 4 | 0.5 | 23,738 | 4.1 | 642 | 4.8 | |||||||||||||||||
| Security & Commodity Brokers, Dealers, Exchanges & Services | 56 | 7.4 | 20,792 | 3.6 | 514 | 3.9 | |||||||||||||||||
| Miscellaneous Retail | 7 | 0.9 | 16,860 | 2.9 | 328 | 2.5 | |||||||||||||||||
| Insurance Agents, Brokers & Services | 18 | 2.4 | 15,854 | 2.8 | 378 | 2.8 | |||||||||||||||||
| Health Services | 33 | 4.4 | 15,364 | 2.7 | 363 | 2.7 | |||||||||||||||||
| Automotive Repair, Services & Parking | 9 | 1.2 | 14,700 | 2.6 | 8 | 0.1 | |||||||||||||||||
| Membership Organizations | 22 | 2.9 | 13,987 | 2.4 | 249 | 1.9 | |||||||||||||||||
| Insurance Carriers | 16 | 2.1 | 10,016 | 1.7 | 265 | 2.0 | |||||||||||||||||
| Other | 206 | 27.3 | 89,000 | 15.6 | 2,314 | 17.4 | |||||||||||||||||
| Total | 757 | 100.0 | $574,769 | 100.0 | 13,304 | 100.0 | |||||||||||||||||
| (1) | Comprised of all levels of governmental entities, including federal (0.7% of ALR), state (5.0% of ALR), and city / local (3.2% of ALR). | ||||
| Location | Number of Projects | Annualized Lease Revenue | Percentage of Annualized Lease Revenue (%) | Rentable Square Footage | Percentage of Rentable Square Footage (%) | Leased Square Footage | Percent Leased (%) | ||||||||||||||||
| Atlanta | 6 | $181,734 | 31.6 | 4,723 | 31.7 | 4,419 | 93.6 | ||||||||||||||||
| Dallas | 5 | 112,651 | 19.6 | 2,827 | 18.9 | 2,584 | 91.4 | ||||||||||||||||
| Orlando | 4 | 66,543 | 11.6 | 1,754 | 11.8 | 1,646 | 93.8 | ||||||||||||||||
| Northern Virginia / Washington, D.C. | 5 | 57,038 | 9.9 | 1,583 | 10.6 | 1,059 | 66.9 | ||||||||||||||||
| New York | 1 | 54,963 | 9.6 | 1,047 | 7.0 | 974 | 93.0 | ||||||||||||||||
| Minneapolis | 3 | 47,898 | 8.3 | 1,434 | 9.6 | 1,280 | 89.3 | ||||||||||||||||
| Boston | 3 | 33,251 | 5.8 | 936 | 6.3 | 782 | 83.5 | ||||||||||||||||
| Other | 2 | 20,691 | 3.6 | 614 | 4.1 | 560 | 91.2 | ||||||||||||||||
| Total / Weighted Average | 29 | $574,769 | 100.0 | 14,918 | 100.0 | 13,304 | 89.2 | ||||||||||||||||
| CBD | URBAN INFILL / SUBURBAN | TOTAL | |||||||||||||||||||||||||||||||||||||||||||||
| Location | Number of Projects | Percentage of Annualized Lease Revenue (%) | Rentable Square Footage | Percentage of Rentable Square Footage (%) | Number of Projects | Percentage of Annualized Lease Revenue (%) | Rentable Square Footage | Percentage of Rentable Square Footage (%) | Number of Projects | Percentage of Annualized Lease Revenue (%) | Rentable Square Footage | Percentage of Rentable Square Footage (%) | |||||||||||||||||||||||||||||||||||
| Atlanta | 2 | 10.9 | 1,304 | 8.8 | 4 | 20.7 | 3,419 | 22.9 | 6 | 31.6 | 4,723 | 31.7 | |||||||||||||||||||||||||||||||||||
| Dallas | — | — | — | — | 5 | 19.6 | 2,827 | 18.9 | 5 | 19.6 | 2,827 | 18.9 | |||||||||||||||||||||||||||||||||||
| Orlando | 3 | 9.7 | 1,445 | 9.7 | 1 | 1.9 | 309 | 2.1 | 4 | 11.6 | 1,754 | 11.8 | |||||||||||||||||||||||||||||||||||
| Northern Virginia / Washington, D.C. | 2 | 4.8 | 687 | 4.6 | 3 | 5.1 | 896 | 6.0 | 5 | 9.9 | 1,583 | 10.6 | |||||||||||||||||||||||||||||||||||
| New York | 1 | 9.6 | 1,047 | 7.0 | — | — | — | — | 1 | 9.6 | 1,047 | 7.0 | |||||||||||||||||||||||||||||||||||
| Minneapolis | 1 | 5.2 | 930 | 6.2 | 2 | 3.1 | 504 | 3.4 | 3 | 8.3 | 1,434 | 9.6 | |||||||||||||||||||||||||||||||||||
| Boston | — | — | — | — | 3 | 5.8 | 936 | 6.3 | 3 | 5.8 | 936 | 6.3 | |||||||||||||||||||||||||||||||||||
| Other | — | — | — | — | 2 | 3.6 | 614 | 4.1 | 2 | 3.6 | 614 | 4.1 | |||||||||||||||||||||||||||||||||||
| Total | 9 | 40.2 | 5,413 | 36.3 | 20 | 59.8 | 9,505 | 63.7 | 29 | 100.0 | 14,918 | 100.0 | |||||||||||||||||||||||||||||||||||
| In-Service Assets | Energy Star Certification | LEED Certification | BOMA 360 Certification | Percent Ownership | Number of Buildings | Rentable Square Footage Owned | Percent Leased | Percent Commenced Leased | Percent Economic Leased (1) | Annualized Lease Revenues | ||||||||||||||||||||||
| Atlanta | ||||||||||||||||||||||||||||||||
| 999 Peachtree | P | P | P | 100.0% | 1 | 626 | 93.1 | % | 82.1 | % | 78.1 | % | 26,504 | |||||||||||||||||||
| 1180 Peachtree | P | P | P | 100.0% | 1 | 678 | 96.9 | % | 96.8 | % | 93.4 | % | 36,293 | |||||||||||||||||||
| Galleria on the Park | P | P | P | 100.0% | 5 | 2,173 | 92.4 | % | 88.7 | % | 78.9 | % | 72,346 | |||||||||||||||||||
| Glenridge Highlands One and Two | P | P | P | 100.0% | 2 | 713 | 91.3 | % | 91.3 | % | 83.7 | % | 24,965 | |||||||||||||||||||
| 1155 Perimeter Center West | P | P | P | 100.0% | 1 | 377 | 98.4 | % | 96.0 | % | 94.7 | % | 15,245 | |||||||||||||||||||
| The Medici | P | P | 100.0% | 1 | 156 | 96.2 | % | 84.0 | % | 81.4 | % | 6,381 | ||||||||||||||||||||
| Market Subtotal / Weighted Average | 11 | 4,723 | 93.6 | % | 89.8 | % | 82.9 | % | 181,734 | |||||||||||||||||||||||
| Boston | ||||||||||||||||||||||||||||||||
| 5 Wall | P | P | P | 100.0% | 1 | 182 | 100.0 | % | 100.0 | % | 100.0 | % | 7,806 | |||||||||||||||||||
| Wayside Office Park | P | P | 100.0% | 2 | 473 | 90.3 | % | 90.3 | % | 89.6 | % | 17,609 | ||||||||||||||||||||
| 25 Mall | P | P | 100.0% | 1 | 281 | 61.6 | % | 58.0 | % | 56.9 | % | 7,836 | ||||||||||||||||||||
| Market Subtotal / Weighted Average | 4 | 936 | 83.5 | % | 82.5 | % | 81.8 | % | 33,251 | |||||||||||||||||||||||
| Dallas | ||||||||||||||||||||||||||||||||
| Galleria Towers | P | P | P | 100.0% | 3 | 1,397 | 93.8 | % | 81.8 | % | 78.8 | % | 63,259 | |||||||||||||||||||
| Park Place on Turtle Creek | P | P | 100.0% | 1 | 183 | 80.3 | % | 77.6 | % | 66.7 | % | 7,795 | ||||||||||||||||||||
| 6565 MacArthur | P | P | P | 100.0% | 1 | 254 | 89.8 | % | 89.8 | % | 88.2 | % | 8,512 | |||||||||||||||||||
| Las Colinas Connection | P | P | 100.0% | 3 | 605 | 98.7 | % | 95.4 | % | 94.5 | % | 21,785 | ||||||||||||||||||||
| The Interlink at Las Colinas | P | P | 100.0% | 2 | 388 | 77.6 | % | 62.4 | % | 55.4 | % | 11,300 | ||||||||||||||||||||
| Market Subtotal / Weighted Average | 10 | 2,827 | 91.4 | % | 82.5 | % | 79.0 | % | 112,651 | |||||||||||||||||||||||
| Minneapolis | ||||||||||||||||||||||||||||||||
| US Bancorp Center | P | P | P | 100.0% | 1 | 930 | 84.8 | % | 82.3 | % | 75.6 | % | 29,867 | |||||||||||||||||||
| Crescent Ridge II | P | P | P | 100.0% | 1 | 295 | 96.3 | % | 96.3 | % | 78.3 | % | 10,707 | |||||||||||||||||||
| Norman Pointe I | P | P | 100.0% | 1 | 209 | 99.0 | % | 99.0 | % | 94.7 | % | 7,324 | ||||||||||||||||||||
| Market Subtotal / Weighted Average | 3 | 1,434 | 89.3 | % | 87.6 | % | 78.9 | % | 47,898 | |||||||||||||||||||||||
| New York | ||||||||||||||||||||||||||||||||
| 60 Broad | P | 100.0% | 1 | 1,047 | 93.0 | % | 92.0 | % | 88.5 | % | 54,963 | |||||||||||||||||||||
| Market Subtotal / Weighted Average | 1 | 1,047 | 93.0 | % | 92.0 | % | 88.5 | % | 54,963 | |||||||||||||||||||||||
| Orlando | ||||||||||||||||||||||||||||||||
| 200 South Orange at The Exchange | P | P | P | 100.0% | 1 | 646 | 87.8 | % | 84.1 | % | 80.8 | % | 24,453 | |||||||||||||||||||
| CNL Center I and II | P | P | P | 99.0% | 2 | 617 | 95.3 | % | 94.5 | % | 87.5 | % | 25,348 | |||||||||||||||||||
| 501 West Church | 100.0% | 1 | 182 | 100.0 | % | 100.0 | % | — | % | 5,706 | ||||||||||||||||||||||
| 400 and 500 TownPark | P | P | P | 100.0% | 2 | 309 | 100.0 | % | 98.7 | % | 98.7 | % | 11,036 | |||||||||||||||||||
| Market Subtotal / Weighted Average | 6 | 1,754 | 93.8 | % | 92.0 | % | 77.9 | % | 66,543 | |||||||||||||||||||||||
| In-Service Assets (continued) | Energy Star Certification | LEED Certification | BOMA 360 Certification | Percent Ownership | Number of Buildings | Rentable Square Footage Owned | Percent Leased | Percent Commenced Leased | Percent Economic Leased (1) | Annualized Lease Revenues | ||||||||||||||||||||||
| Northern Virginia / Washington, D.C. | ||||||||||||||||||||||||||||||||
| 4250 North Fairfax | P | P | P | 100.0% | 1 | 307 | 63.8 | % | 57.0 | % | 52.8 | % | 9,784 | |||||||||||||||||||
| Arlington Gateway | P | P | P | 100.0% | 1 | 331 | 63.7 | % | 57.4 | % | 53.8 | % | 10,604 | |||||||||||||||||||
| 3100 Clarendon | P | P | P | 100.0% | 1 | 258 | 76.7 | % | 73.6 | % | 65.1 | % | 8,763 | |||||||||||||||||||
| 1201 and 1225 Eye Street | P | P | P | (2) | 2 | 478 | 68.2 | % | 67.4 | % | 65.9 | % | 21,090 | |||||||||||||||||||
| 400 Virginia | P | P | P | 100.0% | 1 | 209 | 61.2 | % | 60.8 | % | 59.3 | % | 6,797 | |||||||||||||||||||
| Market Subtotal / Weighted Average | 6 | 1,583 | 66.9 | % | 63.4 | % | 59.8 | % | 57,038 | |||||||||||||||||||||||
| Other | ||||||||||||||||||||||||||||||||
| Enclave Place | P | P | P | 100.0% | 1 | 301 | 100.0 | % | 100.0 | % | 100.0 | % | 12,321 | |||||||||||||||||||
| 1430 Enclave | P | P | P | 100.0% | 1 | 313 | 82.7 | % | 82.7 | % | 82.7 | % | 8,370 | |||||||||||||||||||
| Market Subtotal / Weighted Average | 2 | 614 | 91.2 | % | 91.2 | % | 91.2 | % | 20,691 | |||||||||||||||||||||||
| In-Service Total | 43 | 14,918 | 89.2 | % | 85.4 | % | 79.4 | % | 574,769 | |||||||||||||||||||||||
Out-of-Service Redevelopment Projects (3) | Market | Estimated Stabilization Date | Current Basis (in millions) | Percent Ownership | Number of Buildings | Rentable Square Footage Owned | Percent Leased | Percent Commenced Leased | Percent Economic Leased (1) | Annualized Lease Revenues | ||||||||||||||||||||||
| 222 South Orange at The Exchange | Orlando | Q4 2026 | 50.3 | 100.0% | 1 | 130 | 46.6 | % | 25.2 | % | 9.2 | % | 2,159 | |||||||||||||||||||
| 9320 Excelsior | Minneapolis | Q4 2026 | 24.8 | 100.0% | 1 | 261 | 47.9 | % | — | % | — | % | 4,596 | |||||||||||||||||||
| Meridian | Minneapolis | Q4 2026 | 63.1 | 100.0% | 2 | 397 | 59.9 | % | 8.2 | % | 8.2 | % | 8,845 | |||||||||||||||||||
| Out-of-Service Total | 138.2 | 4 | 788 | 53.7 | % | 8.3 | % | 5.6 | % | 15,600 | ||||||||||||||||||||||
| (1) | Economic leased percentage excludes the square footage associated with executed but not commenced leases for currently vacant spaces and the square footage associated with tenants receiving rental abatements (after proportional adjustments for tenants receiving only partial rental abatements). | ||||
| (2) | Piedmont owns 98.6% of 1201 Eye Street and 98.1% of 1225 Eye Street; however, it is entitled to 100% of the cash flows for each asset pursuant to the terms of each property ownership entity's joint venture agreement. | ||||
| (3) | These projects have been placed into redevelopment and are currently excluded from our in-service portfolio metrics. During the redevelopment phase, the Company is adding or fully renovating the lobbies, common areas and other tenant amenities, transforming the projects into multi-tenant assets with a distinct focus on hospitality. Assets will be reclassified back to in-service upon the earlier of (a) one year after receiving the final certificate of occupancy for the space or (b) the asset reaching 80 percent occupied (i.e. commenced leased). | ||||
Acquisitions Completed During Prior Year and Current Year | ||||||||||||||||||||
| None | ||||||||||||||||||||
| Dispositions Completed During Prior Year and Current Year | ||||||||||||||||||||
| Property | Market / Submarket | Disposition Period | Percent Ownership | Year Built | Square Feet (in thousands) | Sale Price (in millions) | ||||||||||||||
| One Lincoln Park | Dallas / Preston Center | Q1 2024 | 100% | 1999 | 257 | $54.0 | ||||||||||||||
| 750 West John Carpenter | Dallas / Las Colinas | Q3 2024 | 100% | 1999 | 315 | 23.0 | ||||||||||||||
| 80 and 90 Central | Boston / Boxborough | Q2 2025 | 100% | 1988 / 2001 | 322 | 29.5 | ||||||||||||||
| Total | 894 | $106.5 | ||||||||||||||||||
| Developable Land Parcels | ||||||||||||||
| Property | Market / Submarket | Adjacent Piedmont Project | Acres | Book Value (in millions) | ||||||||||
| Gavitello | Atlanta / Buckhead | The Medici | 2.0 | $2.6 | ||||||||||
| Glenridge Highlands Three | Atlanta / Central Perimeter | Glenridge Highlands | 3.0 | 2.0 | ||||||||||
| Galleria Atlanta | Atlanta / Northwest | Galleria on the Park | 16.3 | 24.2 | ||||||||||
| State Highway 161 | Dallas / Las Colinas | The Interlink at Las Colinas | 4.5 | 3.3 | ||||||||||
| Royal Lane | Dallas / Las Colinas | Las Colinas Connection | 10.6 | 2.8 | ||||||||||
| Galleria Dallas | Dallas / Lower North Tollway | Galleria Office Towers | 1.9 | 6.3 | ||||||||||
| TownPark | Orlando / Lake Mary | 400 and 500 TownPark | 18.9 | 9.1 | ||||||||||
| Total | 57.2 | $50.3 | ||||||||||||
Included below are definitions of various terms used throughout this supplemental report, including definitions of certain non-GAAP financial measures and the reasons why the Company’s management believes these measures provide useful information to investors about the Company’s financial condition and results of operations. Reconciliations of any non-GAAP financial measures defined below are included beginning on page 39. | ||
Adjusted Funds From Operations ("AFFO"): The Company calculates AFFO by starting with Core FFO and adjusting for non-incremental capital expenditures and then adding back non-cash items including: non-real estate depreciation, straight-lined rents and fair value lease adjustments, non-cash components of interest expense and compensation expense, and by making similar adjustments for joint ventures, if any. AFFO is a non-GAAP financial measure and should not be viewed as an alternative to net income calculated in accordance with GAAP as a measurement of the Company’s operating performance. The Company believes that AFFO is helpful to investors as a meaningful supplemental comparative performance measure of our ability to make incremental capital investments. Other REITs may not define AFFO in the same manner as the Company; therefore, the Company’s computation of AFFO may not be comparable to that of other REITs. | ||
Annualized Lease Revenue ("ALR"): ALR is calculated by multiplying (i) current rental payments (defined as base rent plus operating expense reimbursements, if payable by the tenant on a monthly basis under the terms of a lease that has been executed, but excluding a) rental abatements and b) rental payments related to executed but not commenced leases for space that was covered by an existing lease), by (ii) 12. In instances in which contractual rents or operating expense reimbursements are collected on an annual, semi-annual, or quarterly basis, such amounts are multiplied by a factor of 1, 2, or 4, respectively, to calculate the annualized figure. For leases that have been executed but not commenced relating to unleased space, ALR is calculated by multiplying (i) the monthly base rental payment (excluding abatements) plus any operating expense reimbursements for the initial month of the lease term, by (ii) 12. Unless stated otherwise, this measure excludes revenues associated with development properties and properties taken out of service for redevelopment, if any. | ||
Core EBITDA: The Company calculates Core EBITDA as net income/(loss) (computed in accordance with GAAP) before interest, taxes, depreciation and amortization and removing any impairment charges, gains or losses from sales of property and other significant infrequent items that create volatility within our earnings and make it difficult to determine the earnings generated by our core ongoing business. Core EBITDA is a non-GAAP financial measure and should not be viewed as an alternative to net income calculated in accordance with GAAP as a measurement of the Company’s operating performance. The Company believes that Core EBITDA is helpful to investors as a supplemental performance measure because it provides a metric for understanding the performance of the Company’s results from ongoing operations without taking into account the effects of non-cash expenses (such as depreciation and amortization), as well as items that are not part of normal day-to-day operations of the Company’s business. Other REITs may not define Core EBITDA in the same manner as the Company; therefore, the Company’s computation of Core EBITDA may not be comparable to that of other REITs. | ||
Core Funds From Operations ("Core FFO"): The Company calculates Core FFO by starting with FFO, as defined by NAREIT, and adjusting for gains or losses on the extinguishment of swaps and/or debt and any significant non-recurring items. Core FFO is a non-GAAP financial measure and should not be viewed as an alternative to net income calculated in accordance with GAAP as a measurement of the Company’s operating performance. The Company believes that Core FFO is helpful to investors as a supplemental performance measure because it excludes the effects of certain infrequent or non-recurring items which can create significant earnings volatility, but which do not directly relate to the Company’s core business operations. As a result, the Company believes that Core FFO can help facilitate comparisons of operating performance between periods and provides a more meaningful predictor of future earnings potential. Other REITs may not define Core FFO in the same manner as the Company; therefore, the Company’s computation of Core FFO may not be comparable to that of other REITs. | ||
EBITDA: EBITDA is defined as net income/(loss) before interest, taxes, depreciation and amortization. | ||
EBITDAre: The Company calculates EBITDAre in accordance with the current National Association of Real Estate Investment Trusts (“NAREIT”) definition. NAREIT currently defines EBITDAre as net income/(loss) (computed in accordance with GAAP) adjusted for gains or losses from sales of property, impairment charges, depreciation on real estate assets, amortization on real estate assets, interest expense and taxes, along with the same adjustments for joint ventures. Some of the adjustments mentioned can vary among owners of identical assets in similar conditions based on historical cost accounting and useful-life estimates. EBITDAre is a non-GAAP financial measure and should not be viewed as an alternative to net income calculated in accordance with GAAP as a measurement of the Company’s operating performance. The Company believes that EBITDAre is helpful to investors as a supplemental performance measure because it provides a metric for understanding the Company’s results from ongoing operations without taking into account the effects of non-cash expenses (such as depreciation and amortization) and capitalization and capital structure expenses (such as interest expense and taxes). The Company also believes that EBITDAre can help facilitate comparisons of operating performance between periods and with other REITs. However, other REITs may not define EBITDAre in accordance with the NAREIT definition, or may interpret the current NAREIT definition differently than the Company; therefore, the Company’s computation of EBITDAre may not be comparable to that of such other REITs. | ||
Funds From Operations ("FFO"): The Company calculates FFO in accordance with the current National Association of Real Estate Investment Trusts (“NAREIT”) definition. NAREIT currently defines FFO as net income/(loss) (calculated in accordance with GAAP), excluding depreciation and amortization related to real estate, gains and losses from the sale of certain real estate assets, gains and losses from change in control, and impairment write-downs of certain real estate assets, goodwill, and investment in entities when the impairment is directly attributable to decreases in the value of depreciable real estate held by the entity, along with appropriate adjustments to those reconciling items for joint ventures, if any. These adjustments can vary among owners of identical assets in similar conditions based on historical cost accounting and useful-life estimates. FFO is a non-GAAP financial measure and should not be viewed as an alternative to net income calculated in accordance with GAAP as a measurement of the Company’s operating performance. The Company believes that FFO is helpful to investors as a supplemental performance measure because it excludes the effects of depreciation, amortization and gains or losses from sales of real estate, all of which are based on historical costs, which implicitly assumes that the value of real estate diminishes predictably over time. The Company also believes that FFO can help facilitate comparisons of operating performance between periods and with other REITs. However, other REITs may not define FFO in accordance with the NAREIT definition, or may interpret the current NAREIT definition differently than the Company; therefore, the Company’s computation of FFO may not be comparable to that of such other REITs. | ||
Incremental Capital Expenditures: Incremental Capital Expenditures are defined as capital expenditures of a non-recurring nature that incrementally enhance the underlying assets' income generating capacity. Tenant improvements, leasing commissions, building capital and deferred lease incentives ("Leasing Costs") incurred to lease space that was vacant at acquisition, Leasing Costs for spaces vacant for greater than one year, Leasing Costs for spaces at newly acquired properties for which in-place leases expire shortly after acquisition, improvements associated with the expansion of a building, renovations that change the underlying classification of a building, and deferred building maintenance capital identified at and completed shortly after acquisition are included in this measure. | ||
Non-Incremental Capital Expenditures: Non-Incremental Capital Expenditures are defined as capital expenditures of a recurring nature related to tenant improvements and leasing commissions that do not incrementally enhance the underlying assets' income generating capacity. We exclude first generation tenant improvements and leasing commissions from this measure, in addition to other capital expenditures that qualify as Incremental Capital Expenditures, as defined above. | ||
Property Net Operating Income ("Property NOI"): The Company calculates Property NOI by starting with Core EBITDA and adjusting for general and administrative expense, income associated with property management performed by Piedmont for other organizations and other income or expense items for the Company, such as interest income from loan investments or costs from the pursuit of non-consummated transactions. The Company may present this measure on an accrual basis or a cash basis. When presented on a cash basis, the effects of non-cash general reserve for uncollectible accounts, straight-lined rents and fair value lease revenue are also eliminated. Property NOI is a non-GAAP financial measure and should not be viewed as an alternative to net income calculated in accordance with GAAP as a measurement of the Company’s operating performance. The Company believes that Property NOI is helpful to investors as a supplemental comparative performance measure of income generated by its properties alone without the administrative overhead of the Company. Other REITs may not define Property NOI in the same manner as the Company; therefore, the Company’s computation of Property NOI may not be comparable to that of other REITs. | ||
Same Store Net Operating Income ("Same Store NOI"): The Company calculates Same Store NOI as Property NOI attributable to the properties for which the following criteria were met during the entire span of the current and prior year reporting periods: (i) they were owned, (ii) they were not under development / redevelopment, and (iii) none of the operating expenses for which were capitalized. Same Store NOI also excludes amounts attributable to land assets. The Company may present this measure on an accrual basis or a cash basis. Same Store NOI is a non-GAAP financial measure and should not be viewed as an alternative to net income calculated in accordance with GAAP as a measurement of the Company’s operating performance. The Company believes that Same Store NOI is helpful to investors as a supplemental comparative performance measure of the income generated from the same group of properties from one period to the next. Other REITs may not define Same Store NOI in the same manner as the Company; therefore, the Company’s computation of Same Store NOI may not be comparable to that of other REITs. | ||
Same Store Properties: Same Store Properties is defined as those properties for which the following criteria were met during the entire span of the current and prior year reporting periods: (i) they were owned, (ii) they were not under development / redevelopment, and (iii) none of the operating expenses for which were capitalized. Same Store Properties excludes land assets. | ||
Total Gross Assets: Total Gross Assets is defined as total assets with the add-back of accumulated depreciation and accumulated amortization related to real estate assets and accumulated amortization related to deferred lease costs. | ||
Total Gross Real Estate Assets: Total Gross Real Estate Assets is defined as total real estate assets with the add-back of accumulated depreciation and accumulated amortization related to real estate assets. | ||
| Three Months Ended | Nine Months Ended | ||||||||||||||||||||||||||||||||||||||||
| 9/30/2025 | 6/30/2025 | 3/31/2025 | 12/31/2024 | 9/30/2024 | 9/30/2025 | 9/30/2024 | |||||||||||||||||||||||||||||||||||
| GAAP net loss applicable to common stock | $ | (13,462) | $ | (16,808) | $ | (10,104) | $ | (29,978) | $ | (11,519) | $ | (40,374) | $ | (49,091) | |||||||||||||||||||||||||||
Depreciation | 41,759 | 40,266 | 40,513 | 39,769 | 38,642 | 122,538 | 115,699 | ||||||||||||||||||||||||||||||||||
Amortization | 15,188 | 14,778 | 15,413 | 16,414 | 17,059 | 45,379 | 53,260 | ||||||||||||||||||||||||||||||||||
Impairment charges | — | — | — | 15,400 | — | — | 18,432 | ||||||||||||||||||||||||||||||||||
(Gain) / loss on sale of real estate assets | — | (1,224) | (789) | — | 445 | (2,013) | 445 | ||||||||||||||||||||||||||||||||||
| NAREIT Funds From Operations applicable to common stock | 43,485 | 37,012 | 45,033 | 41,605 | 44,627 | 125,530 | 138,745 | ||||||||||||||||||||||||||||||||||
| Adjustments: | |||||||||||||||||||||||||||||||||||||||||
| Executive separation costs | — | — | — | 4,831 | — | — | — | ||||||||||||||||||||||||||||||||||
| Loss on early extinguishment of debt | — | 7,500 | 500 | — | — | 8,000 | 386 | ||||||||||||||||||||||||||||||||||
| Core Funds From Operations applicable to common stock | 43,485 | 44,512 | 45,533 | 46,436 | 44,627 | 133,530 | 139,131 | ||||||||||||||||||||||||||||||||||
| Adjustments: | |||||||||||||||||||||||||||||||||||||||||
Amortization of debt issuance costs and discounts on debt | 1,561 | 1,574 | 1,456 | 1,463 | 1,332 | 4,591 | 3,679 | ||||||||||||||||||||||||||||||||||
| Depreciation of non real estate assets | 368 | 369 | 369 | 370 | 347 | 1,106 | 950 | ||||||||||||||||||||||||||||||||||
Straight-line effects of lease revenue | (6,251) | (8,968) | (9,668) | (5,996) | (5,125) | (24,887) | (15,570) | ||||||||||||||||||||||||||||||||||
| Stock-based compensation adjustments | 2,503 | 2,396 | 55 | 1,392 | 2,153 | 4,954 | 5,240 | ||||||||||||||||||||||||||||||||||
Amortization of lease-related intangibles | (1,959) | (1,957) | (2,062) | (2,351) | (2,463) | (5,978) | (7,668) | ||||||||||||||||||||||||||||||||||
| Non-incremental capital expenditures | |||||||||||||||||||||||||||||||||||||||||
| Base Building Costs | (3,203) | (10,149) | (5,416) | (5,535) | (6,829) | (18,768) | (25,971) | ||||||||||||||||||||||||||||||||||
| Tenant Improvement Costs | (5,575) | (3,809) | (4,629) | (4,493) | 67 | (14,013) | (6,579) | ||||||||||||||||||||||||||||||||||
| Leasing Commission Costs | (4,425) | (7,727) | (2,149) | (6,710) | (8,172) | (14,301) | (20,882) | ||||||||||||||||||||||||||||||||||
| Adjusted Funds From Operations applicable to common stock | $ | 26,504 | $ | 16,241 | $ | 23,489 | $ | 24,576 | $ | 25,937 | $ | 66,234 | $ | 72,330 | |||||||||||||||||||||||||||
| Three Months Ended | Nine Months Ended | ||||||||||||||||||||||||||||||||||||||||
| 9/30/2025 | 6/30/2025 | 3/31/2025 | 12/31/2024 | 9/30/2024 | 9/30/2025 | 9/30/2024 | |||||||||||||||||||||||||||||||||||
| Net loss applicable to Piedmont | $ | (13,462) | $ | (16,808) | $ | (10,104) | $ | (29,978) | $ | (11,519) | $ | (40,374) | $ | (49,091) | |||||||||||||||||||||||||||
| Net income applicable to noncontrolling interest | 5 | 2 | 6 | 1 | — | 13 | 4 | ||||||||||||||||||||||||||||||||||
| Interest expense | 31,968 | 31,954 | 31,677 | 31,629 | 32,072 | 95,599 | 91,355 | ||||||||||||||||||||||||||||||||||
| Depreciation | 42,127 | 40,635 | 40,883 | 40,139 | 38,988 | 123,644 | 116,649 | ||||||||||||||||||||||||||||||||||
| Amortization | 15,188 | 14,778 | 15,413 | 16,414 | 17,059 | 45,379 | 53,260 | ||||||||||||||||||||||||||||||||||
| Depreciation and amortization attributable to noncontrolling interests | — | 19 | 19 | 19 | 20 | 38 | 59 | ||||||||||||||||||||||||||||||||||
| Impairment charges | — | — | — | 15,400 | — | — | 18,432 | ||||||||||||||||||||||||||||||||||
| (Gain) / loss on sale of real estate assets | — | (1,224) | (789) | — | 445 | (2,013) | 445 | ||||||||||||||||||||||||||||||||||
| EBITDAre | 75,826 | 69,356 | 77,105 | 73,624 | 77,065 | 222,286 | 231,113 | ||||||||||||||||||||||||||||||||||
| Executive separation costs | — | — | — | 4,831 | — | — | — | ||||||||||||||||||||||||||||||||||
| Loss on early extinguishment of debt | — | 7,500 | 500 | — | — | 8,000 | 386 | ||||||||||||||||||||||||||||||||||
| Core EBITDA | 75,826 | 76,856 | 77,605 | 78,455 | 77,065 | 230,286 | 231,499 | ||||||||||||||||||||||||||||||||||
| General and administrative expense | 7,607 | 7,960 | 7,563 | 7,819 | 6,809 | 23,130 | 22,773 | ||||||||||||||||||||||||||||||||||
| Management fee revenue | (114) | (77) | (64) | (126) | (714) | (254) | (965) | ||||||||||||||||||||||||||||||||||
| Other income | (52) | (25) | (288) | (1,540) | (1,983) | (364) | (2,374) | ||||||||||||||||||||||||||||||||||
| Straight-line effects of lease revenue | (6,251) | (8,968) | (9,668) | (5,996) | (5,125) | (24,887) | (15,570) | ||||||||||||||||||||||||||||||||||
| Straight-line effects of lease revenue attributable to noncontrolling interests | — | (3) | (1) | 2 | 1 | (4) | 1 | ||||||||||||||||||||||||||||||||||
| Amortization of lease-related intangibles | (1,959) | (1,957) | (2,061) | (2,351) | (2,463) | (5,978) | (7,668) | ||||||||||||||||||||||||||||||||||
| Property net operating income (cash basis) | 75,057 | 73,786 | 73,086 | 76,263 | 73,590 | 221,929 | 227,696 | ||||||||||||||||||||||||||||||||||
| Deduct net operating (income) loss from: | |||||||||||||||||||||||||||||||||||||||||
| Acquisitions | — | — | — | — | — | — | — | ||||||||||||||||||||||||||||||||||
| Dispositions | 54 | (447) | (1,224) | (1,322) | (1,383) | (1,616) | (5,141) | ||||||||||||||||||||||||||||||||||
| Other investments | (42) | 92 | 162 | 92 | 816 | 211 | (838) | ||||||||||||||||||||||||||||||||||
| Same store net operating income (cash basis) | $ | 75,069 | $ | 73,431 | $ | 72,024 | $ | 75,033 | $ | 73,023 | $ | 220,524 | $ | 221,717 | |||||||||||||||||||||||||||