EARNINGS CALL PRESENTATION Q3 2025
2 The financial results in this document reflect preliminary, unaudited results, which are not final until the Company’s Quarterly Report on Form 10-Q is filed. With the exception of historical information, certain statements contained or incorporated by reference herein may contain forward-looking statements within the meaning of Section 27A of the Securities Act of 1933, as amended (the “Securities Act”), and Section 21E of the Securities Exchange Act of 1934, as amended (the “Exchange Act”), such as those pertaining to our guidance, our capital resources and liquidity, our pursuit of growth opportunities, the timing of transaction closings and investment spending, our ongoing negotiations to exit from certain joint ventures or the ultimate terms of any such exit, our expected cash flows, the performance of our customers, our expected cash collections and our results of operations and financial condition. Forward-looking statements involve numerous risks and uncertainties, and you should not rely on them as predictions of actual events. There is no assurance that the events or circumstances reflected in the forward-looking statements will occur. You can identify forward-looking statements by use of words such as “will be,” “intend,” “continue,” “believe,” “may,” “expect,” “hope,” “anticipate,” “goal,” “forecast,” “pipeline,” “estimates,” “offers,” “plans,” “would” or other similar expressions or other comparable terms or discussions of strategy, plans or intentions contained or incorporated by reference herein. Forward-looking statements necessarily are dependent on assumptions, data or methods that may be incorrect or imprecise. These forward-looking statements represent our intentions, plans, expectations and beliefs and are subject to numerous assumptions, risks and uncertainties. Many of the factors that will determine these items are beyond our ability to control or predict. For further discussion of these factors see “Item 1A. Risk Factors” in our most recent Annual Report on Form 10-K and, to the extent applicable, our Quarterly Reports on Form 10-Q. For these statements, we claim the protection of the safe harbor for forward-looking statements contained in the Private Securities Litigation Reform Act of 1995. You are cautioned not to place undue reliance on our forward- looking statements, which speak only as of the date hereof or the date of any document incorporated by reference herein. All subsequent written and oral forward-looking statements attributable to us or any person acting on our behalf are expressly qualified in their entirety by the cautionary statements contained or referred to in this section. Except as required by law, we do not undertake any obligation to release publicly any revisions to our forward-looking statements to reflect events or circumstances after the date hereof. DISCLAIMER
INTRODUCTORY COMMENTS
4 QUARTERLY HIGHLIGHTS • Steady Progress in Q3 Results – positioning for accelerated growth • Disciplined Deployment – pipeline actionable over next 90-120 days; given fluidity of timing, felt it was prudent not to raise investment spending guidance • Consolidated Portfolio Coverage Remained Strong – at 2.0x • Box Office Continued Recovery – anticipate robust Q4 and new post- COVID high for 2025; significant increase in percentage rent from Regal • Potential Sale of Catskills Land – were advised the bond transaction, which would fund exercise of our tenant’s purchase option, is delayed o It is pending the recently announced proposed merger among Genting gaming entities o While tenant has indicated desire to complete bond transaction and option exercise in 2026, the timing and outcome remains uncertain Our strong balance sheet & clear visibility into future opportunities position us to materially accelerate investment spending in 2026, regardless of whether option is exercised

PORTFOLIO
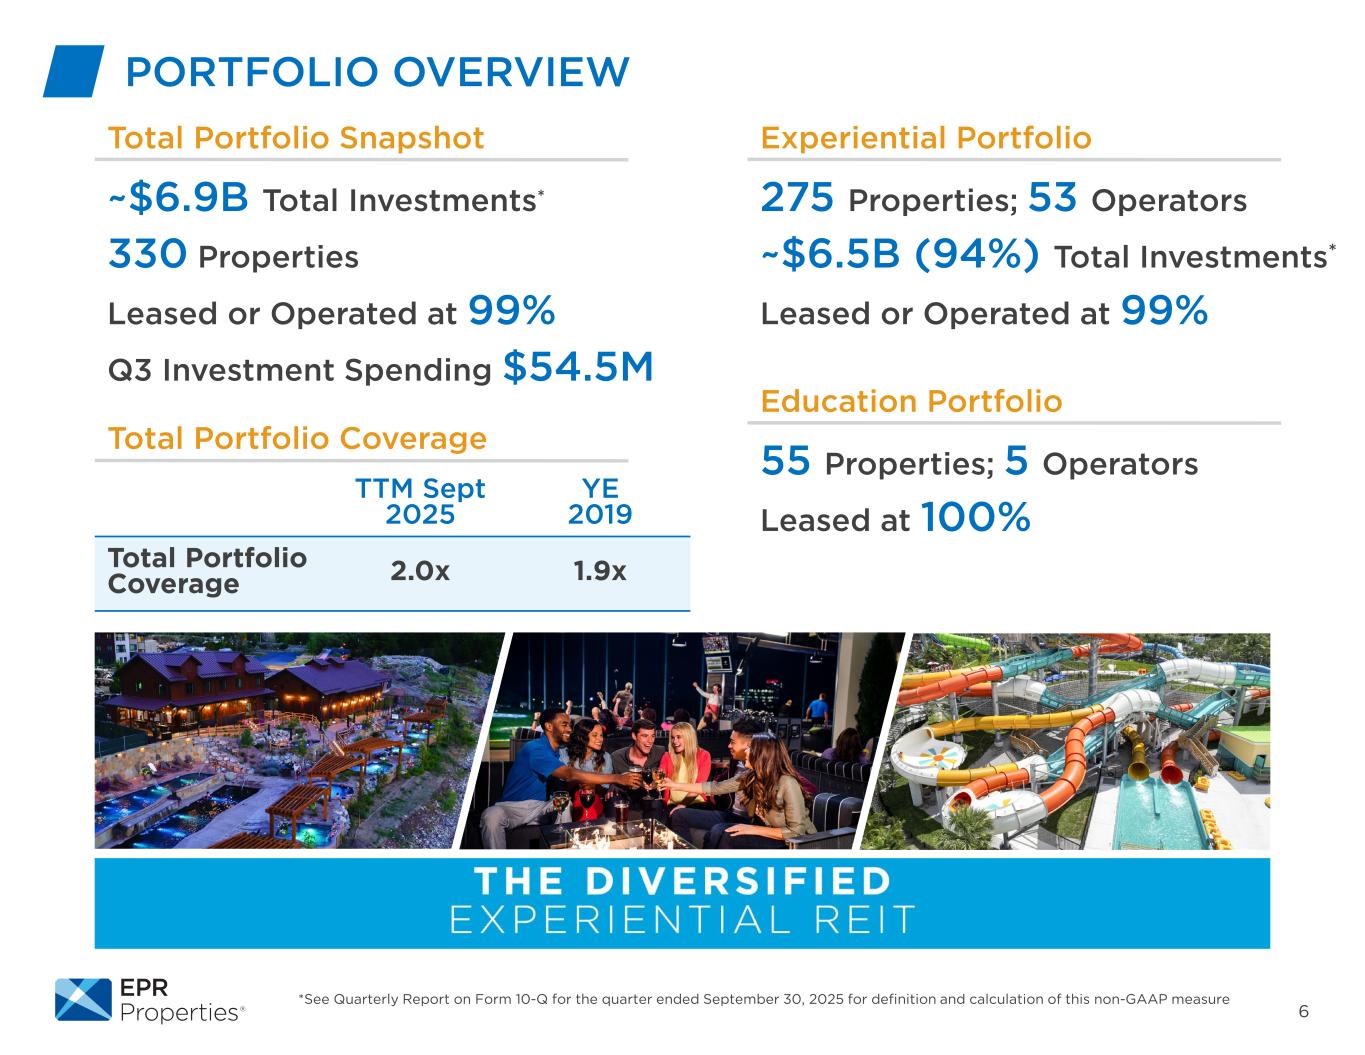
6 PORTFOLIO OVERVIEW Education Portfolio 55 Properties; 5 Operators Leased at 100% *See Quarterly Report on Form 10-Q for the quarter ended September 30, 2025 for definition and calculation of this non-GAAP measure Experiential Portfolio 275 Properties; 53 Operators ~$6.5B (94%) Total Investments* Leased or Operated at 99% Total Portfolio Snapshot ~$6.9B Total Investments* 330 Properties Leased or Operated at 99% Q3 Investment Spending $54.5M Total Portfolio Coverage TTM Sept 2025 YE 2019 Total Portfolio Coverage 2.0x 1.9x
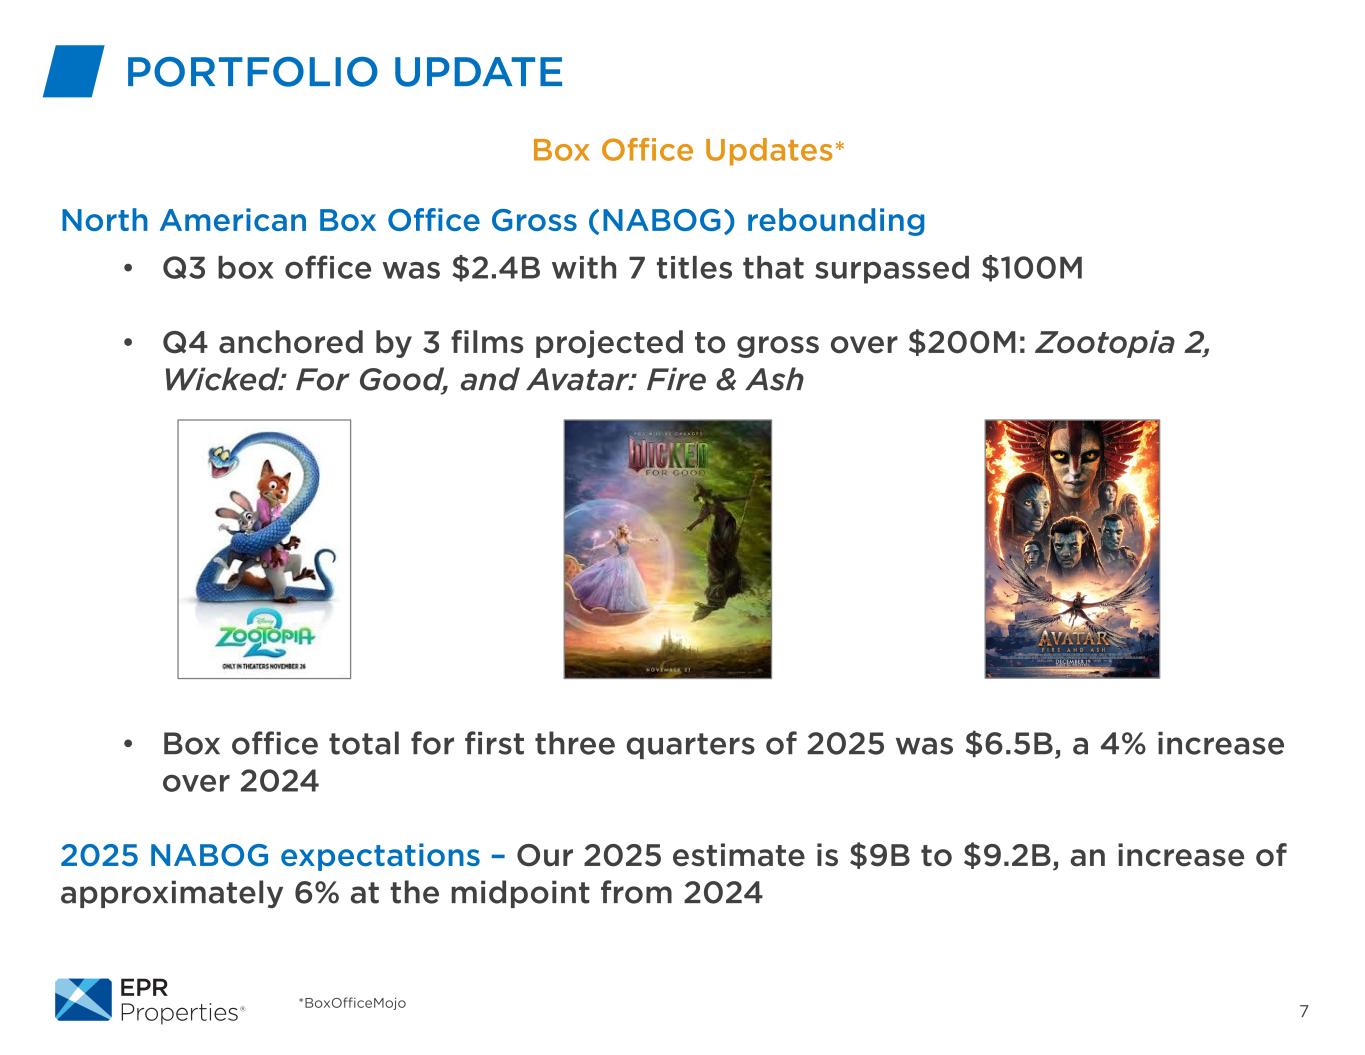
7*BoxOfficeMojo PORTFOLIO UPDATE Box Office Updates* North American Box Office Gross (NABOG) rebounding • Q3 box office was $2.4B with 7 titles that surpassed $100M • Q4 anchored by 3 films projected to gross over $200M: Zootopia 2, Wicked: For Good, and Avatar: Fire & Ash • Box office total for first three quarters of 2025 was $6.5B, a 4% increase over 2024 2025 NABOG expectations – Our 2025 estimate is $9B to $9.2B, an increase of approximately 6% at the midpoint from 2024
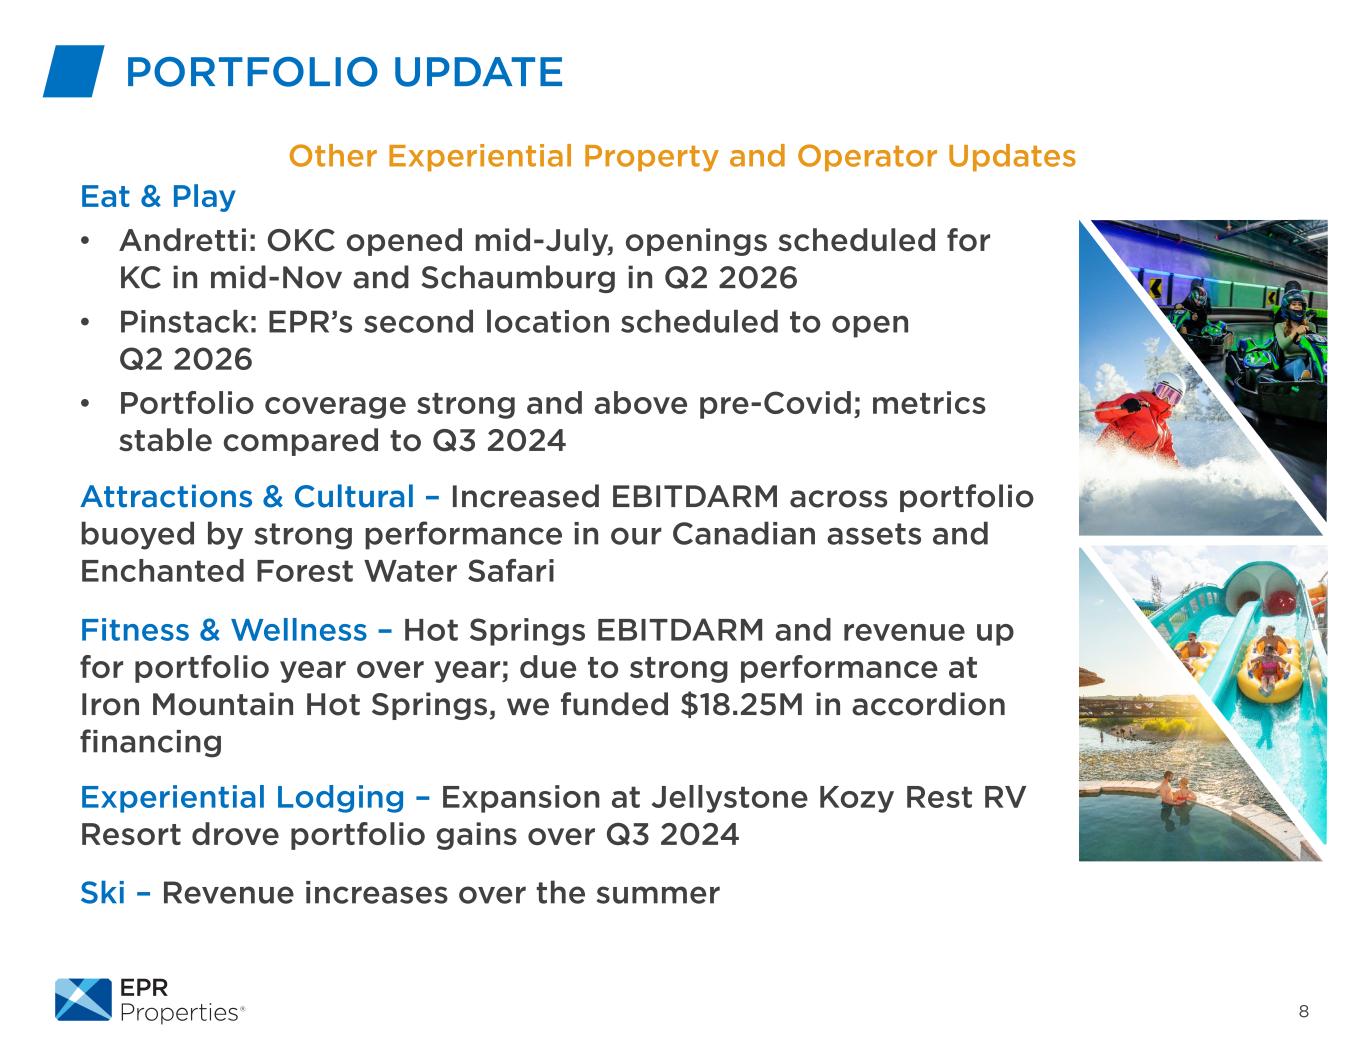
8 Eat & Play • Andretti: OKC opened mid-July, openings scheduled for KC in mid-Nov and Schaumburg in Q2 2026 • Pinstack: EPR’s second location scheduled to open Q2 2026 • Portfolio coverage strong and above pre-Covid; metrics stable compared to Q3 2024 Attractions & Cultural – Increased EBITDARM across portfolio buoyed by strong performance in our Canadian assets and Enchanted Forest Water Safari Other Experiential Property and Operator Updates PORTFOLIO UPDATE Fitness & Wellness – Hot Springs EBITDARM and revenue up for portfolio year over year; due to strong performance at Iron Mountain Hot Springs, we funded $18.25M in accordion financing Experiential Lodging – Expansion at Jellystone Kozy Rest RV Resort drove portfolio gains over Q3 2024 Ski – Revenue increases over the summer
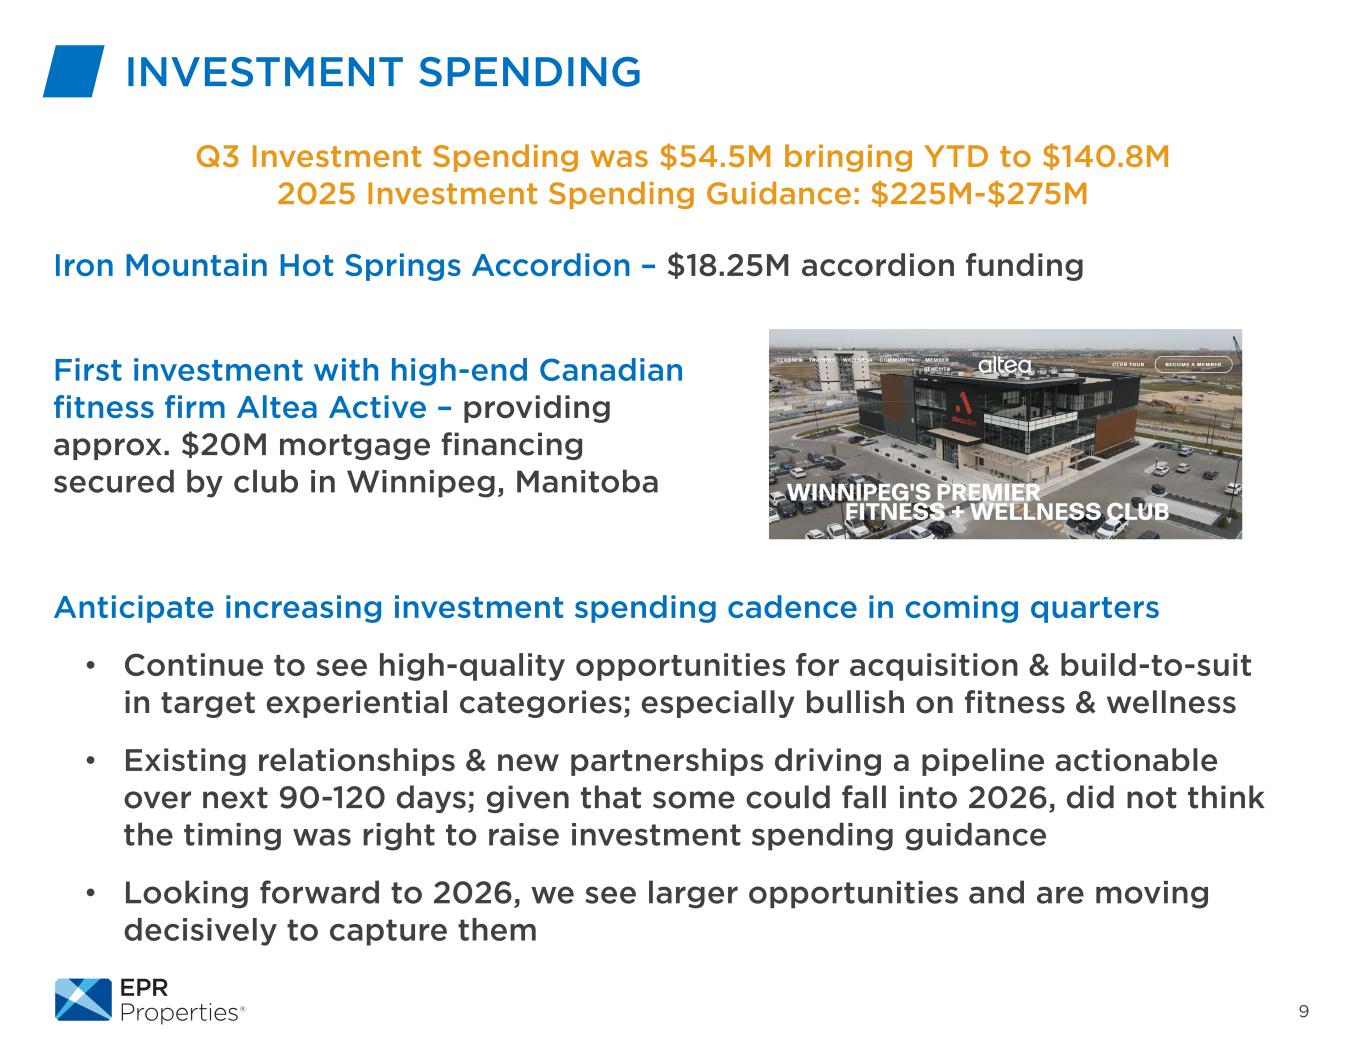
9 INVESTMENT SPENDING Q3 Investment Spending was $54.5M bringing YTD to $140.8M 2025 Investment Spending Guidance: $225M-$275M First investment with high-end Canadian fitness firm Altea Active – providing approx. $20M mortgage financing secured by club in Winnipeg, Manitoba Iron Mountain Hot Springs Accordion – $18.25M accordion funding Anticipate increasing investment spending cadence in coming quarters • Continue to see high-quality opportunities for acquisition & build-to-suit in target experiential categories; especially bullish on fitness & wellness • Existing relationships & new partnerships driving a pipeline actionable over next 90-120 days; given that some could fall into 2026, did not think the timing was right to raise investment spending guidance • Looking forward to 2026, we see larger opportunities and are moving decisively to capture them
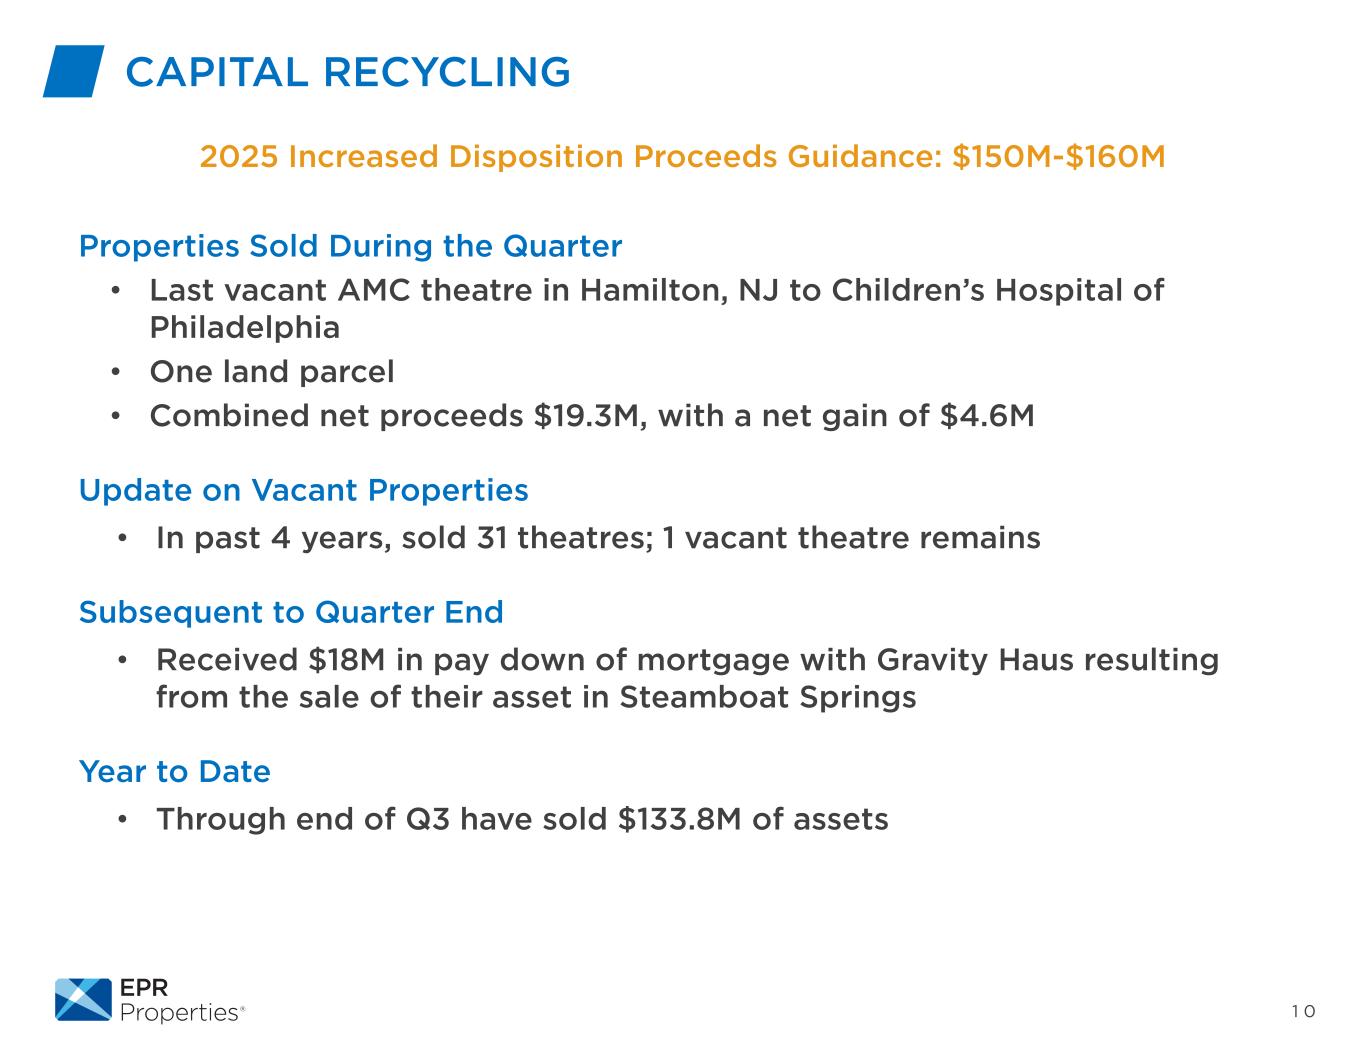
1 0 Properties Sold During the Quarter • Last vacant AMC theatre in Hamilton, NJ to Children’s Hospital of Philadelphia • One land parcel • Combined net proceeds $19.3M, with a net gain of $4.6M Update on Vacant Properties • In past 4 years, sold 31 theatres; 1 vacant theatre remains Subsequent to Quarter End • Received $18M in pay down of mortgage with Gravity Haus resulting from the sale of their asset in Steamboat Springs Year to Date • Through end of Q3 have sold $133.8M of assets CAPITAL RECYCLING 2025 Increased Disposition Proceeds Guidance: $150M-$160M
FINANCIAL REVIEW
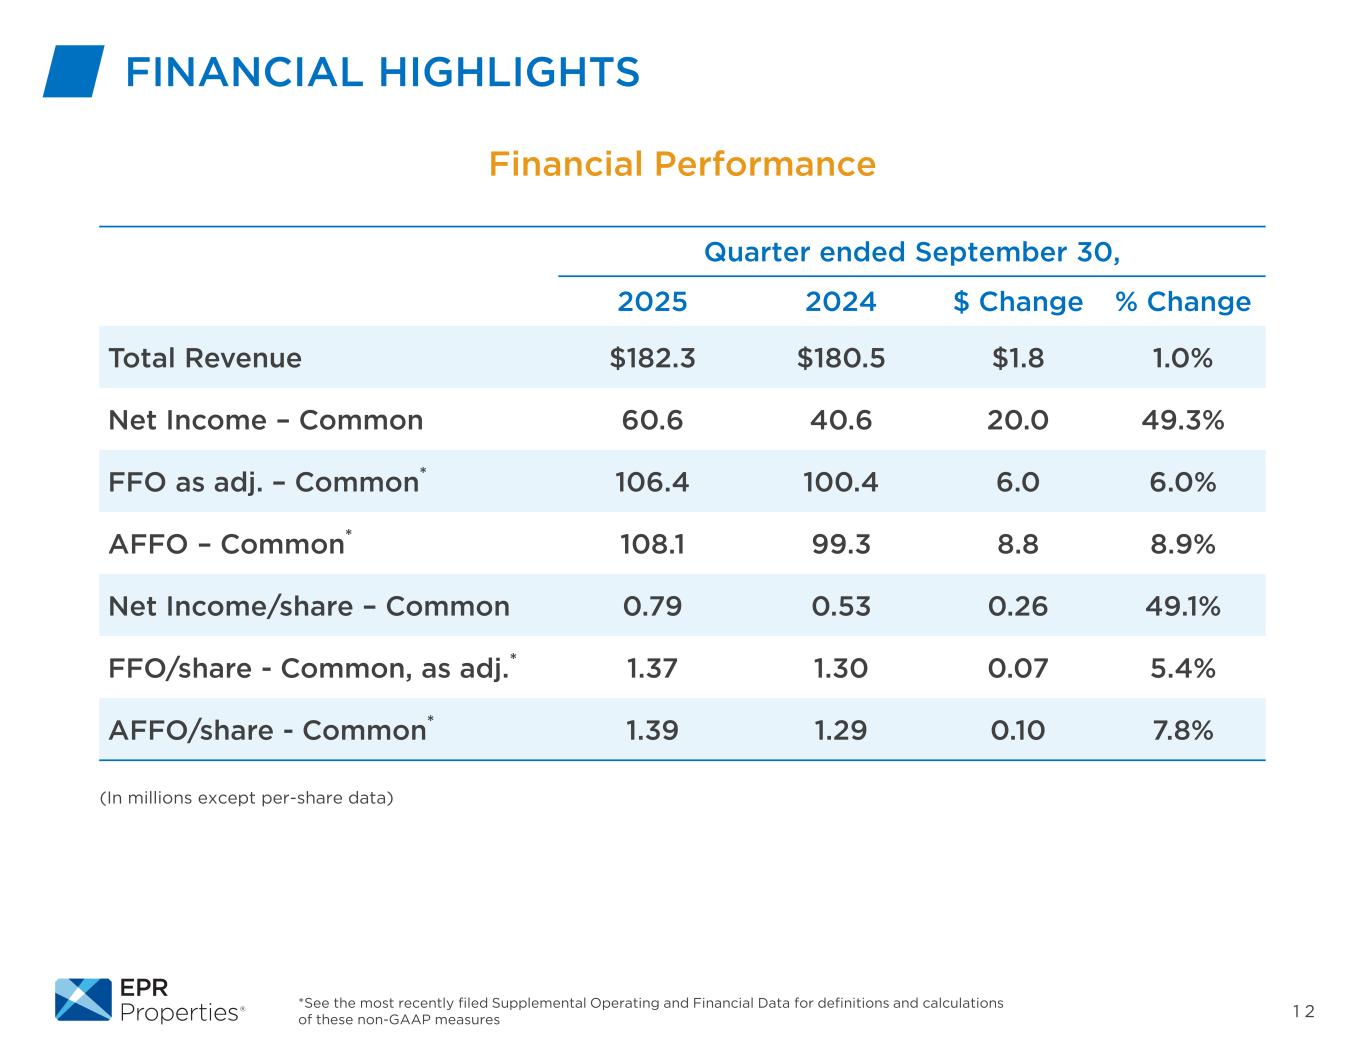
1 2*See the most recently filed Supplemental Operating and Financial Data for definitions and calculations of these non-GAAP measures FINANCIAL HIGHLIGHTS (In millions except per-share data) Financial Performance Quarter ended September 30, 2025 2024 $ Change % Change Total Revenue $182.3 $180.5 $1.8 1.0% Net Income – Common 60.6 40.6 20.0 49.3% FFO as adj. – Common* 106.4 100.4 6.0 6.0% AFFO – Common* 108.1 99.3 8.8 8.9% Net Income/share – Common 0.79 0.53 0.26 49.1% FFO/share - Common, as adj.* 1.37 1.30 0.07 5.4% AFFO/share - Common* 1.39 1.29 0.10 7.8%
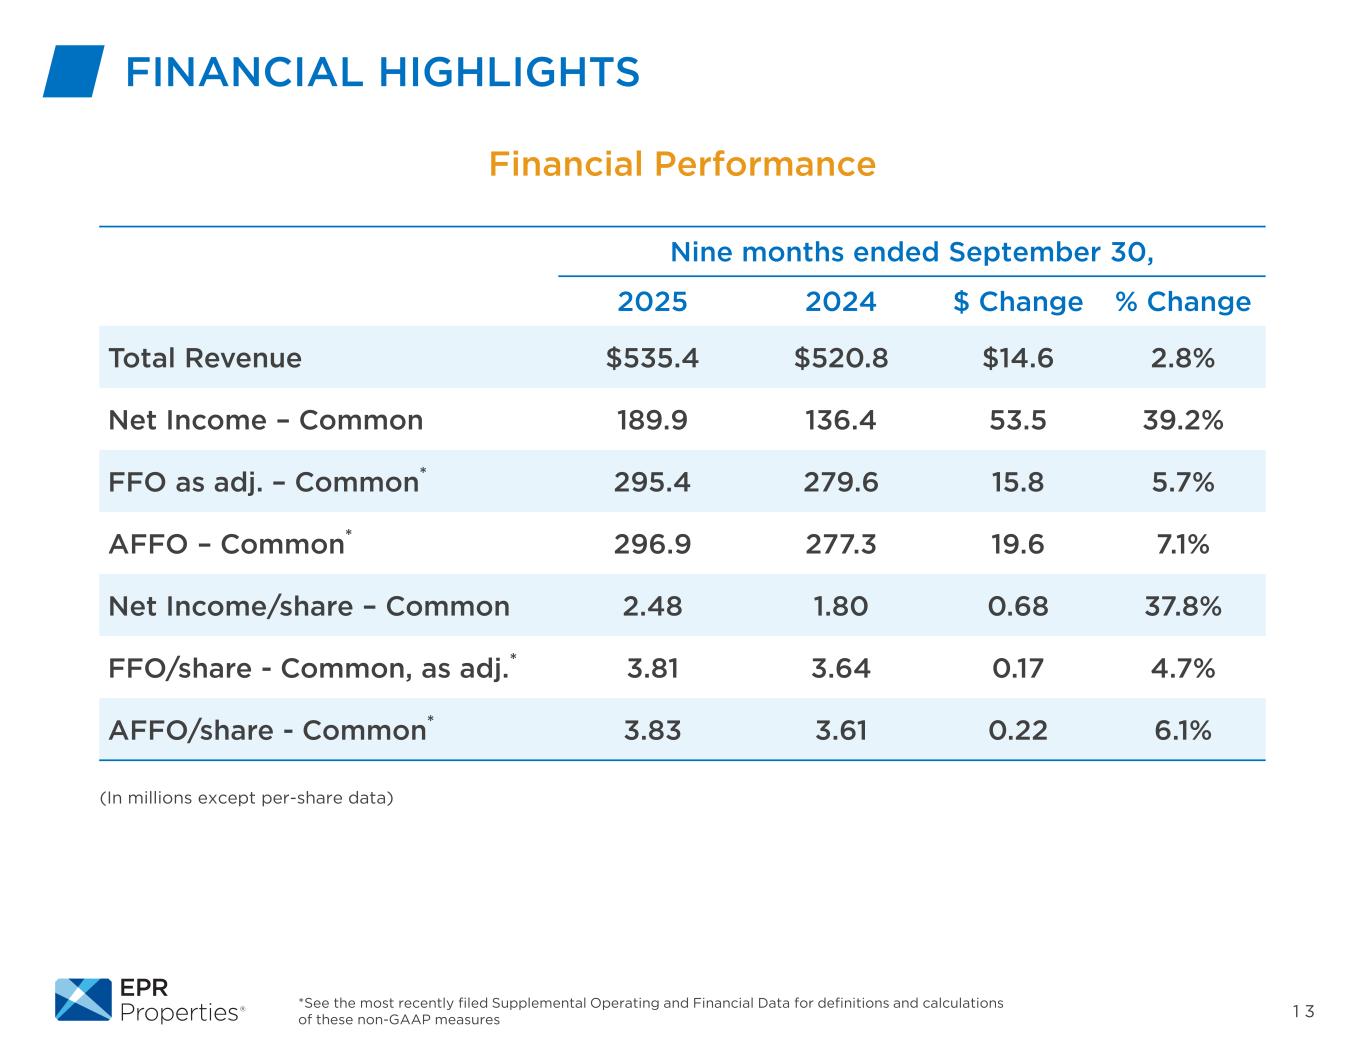
1 3*See the most recently filed Supplemental Operating and Financial Data for definitions and calculations of these non-GAAP measures FINANCIAL HIGHLIGHTS (In millions except per-share data) Financial Performance Nine months ended September 30, 2025 2024 $ Change % Change Total Revenue $535.4 $520.8 $14.6 2.8% Net Income – Common 189.9 136.4 53.5 39.2% FFO as adj. – Common* 295.4 279.6 15.8 5.7% AFFO – Common* 296.9 277.3 19.6 7.1% Net Income/share – Common 2.48 1.80 0.68 37.8% FFO/share - Common, as adj.* 3.81 3.64 0.17 4.7% AFFO/share - Common* 3.83 3.61 0.22 6.1%
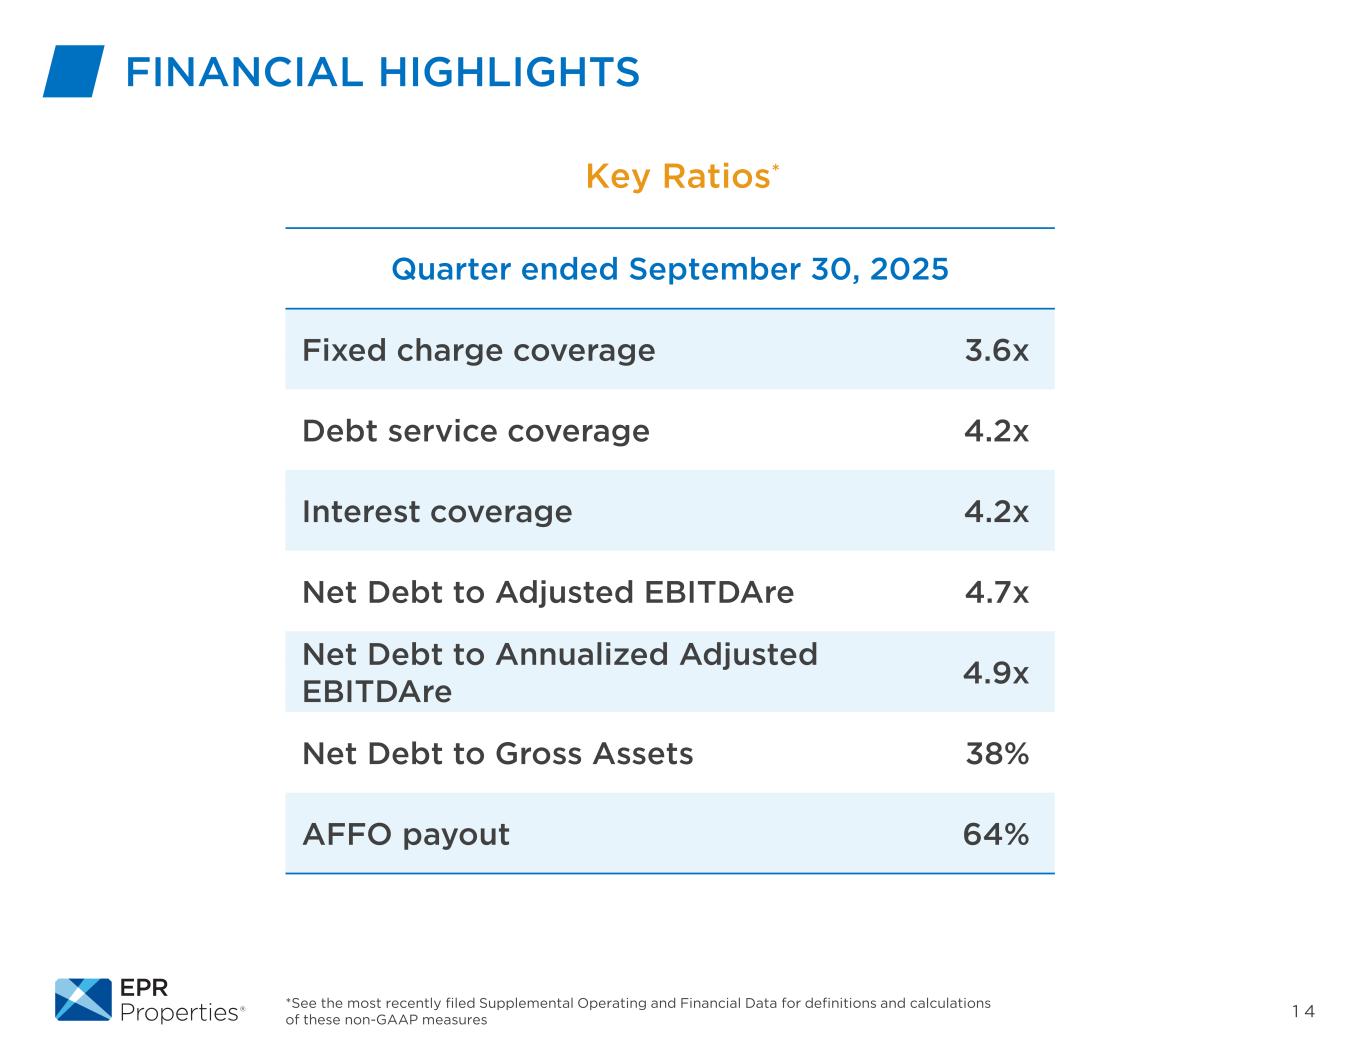
1 4 Key Ratios* Quarter ended September 30, 2025 Fixed charge coverage 3.6x Debt service coverage 4.2x Interest coverage 4.2x Net Debt to Adjusted EBITDAre 4.7x Net Debt to Annualized Adjusted EBITDAre 4.9x Net Debt to Gross Assets 38% AFFO payout 64% *See the most recently filed Supplemental Operating and Financial Data for definitions and calculations of these non-GAAP measures FINANCIAL HIGHLIGHTS
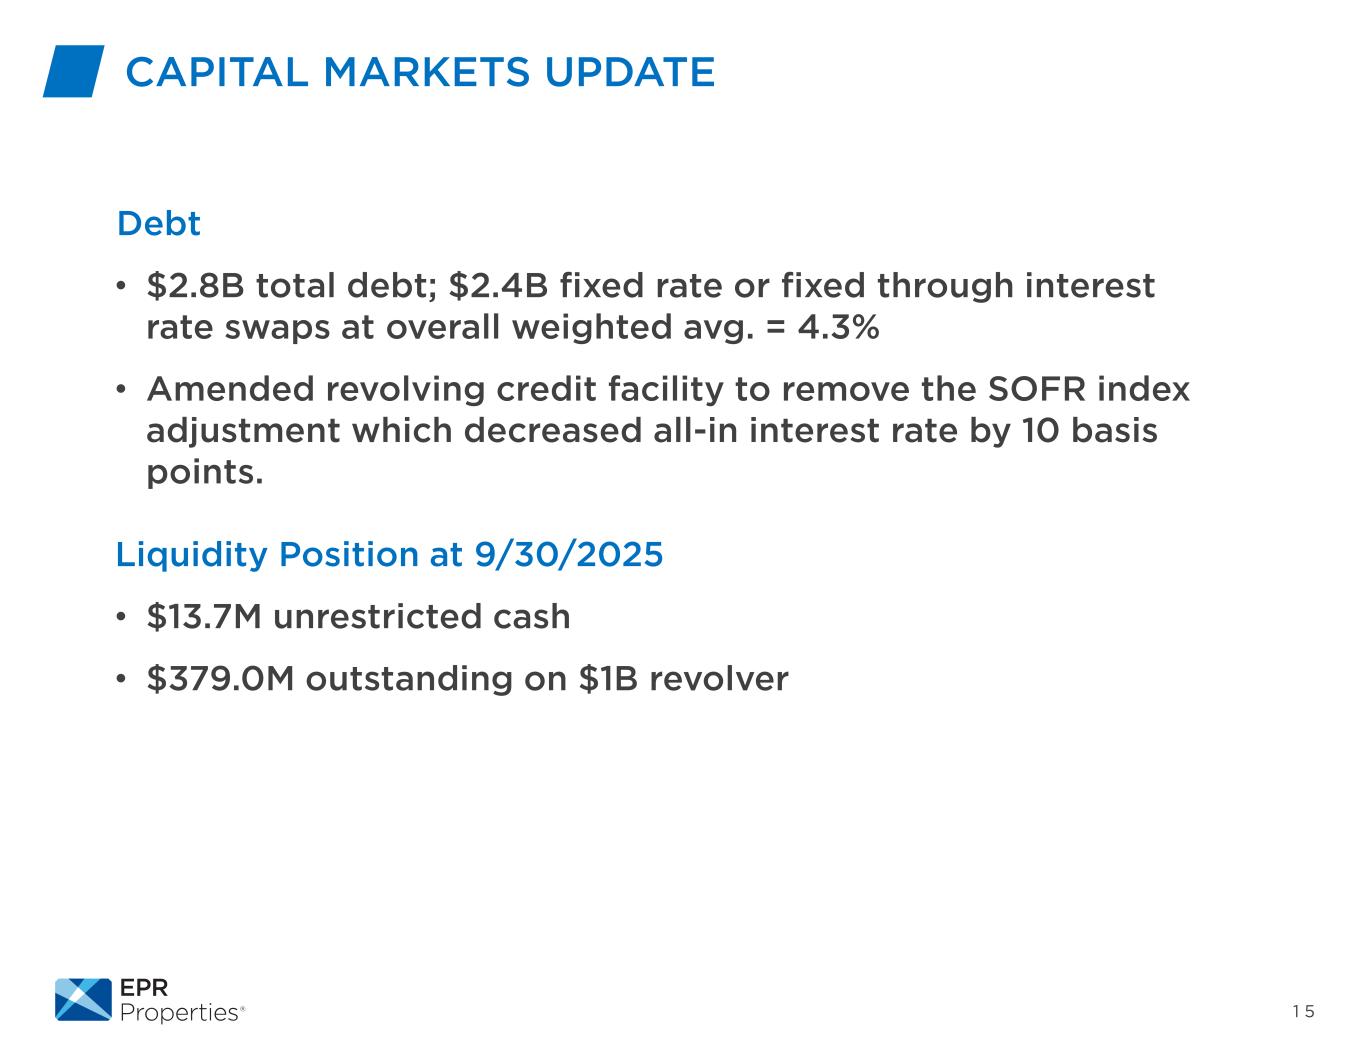
1 5 CAPITAL MARKETS UPDATE Debt • $2.8B total debt; $2.4B fixed rate or fixed through interest rate swaps at overall weighted avg. = 4.3% • Amended revolving credit facility to remove the SOFR index adjustment which decreased all-in interest rate by 10 basis points. Liquidity Position at 9/30/2025 • $13.7M unrestricted cash • $379.0M outstanding on $1B revolver
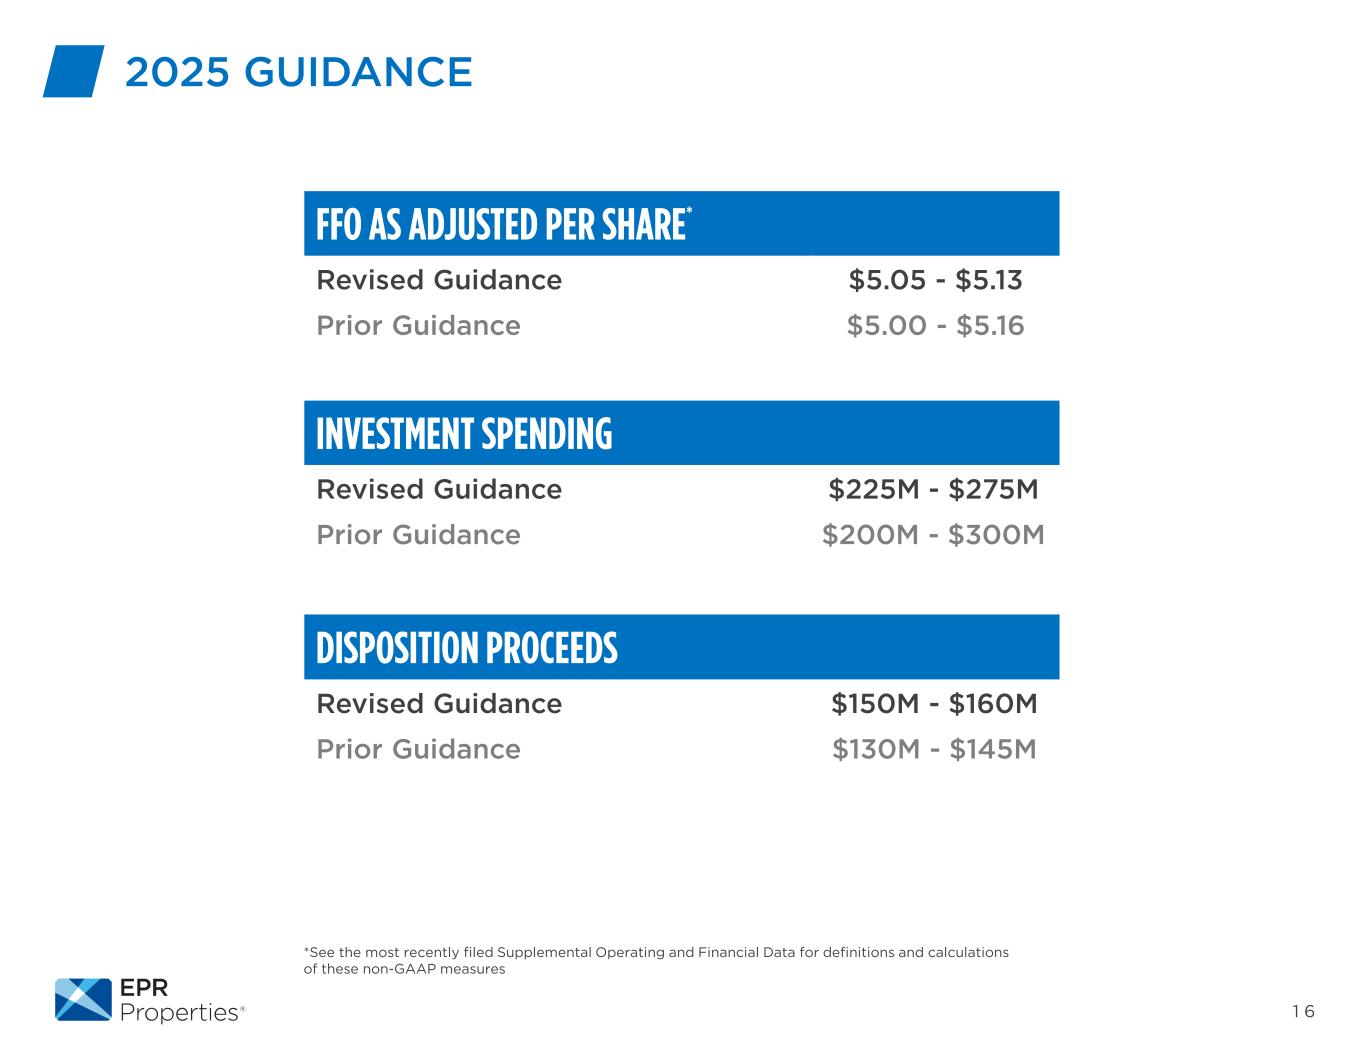
1 6 FFO AS ADJUSTED PER SHARE* Revised Guidance $5.05 - $5.13 Prior Guidance $5.00 - $5.16 INVESTMENT SPENDING Revised Guidance $225M - $275M Prior Guidance $200M - $300M DISPOSITION PROCEEDS Revised Guidance $150M - $160M Prior Guidance $130M - $145M *See the most recently filed Supplemental Operating and Financial Data for definitions and calculations of these non-GAAP measures 2025 GUIDANCE
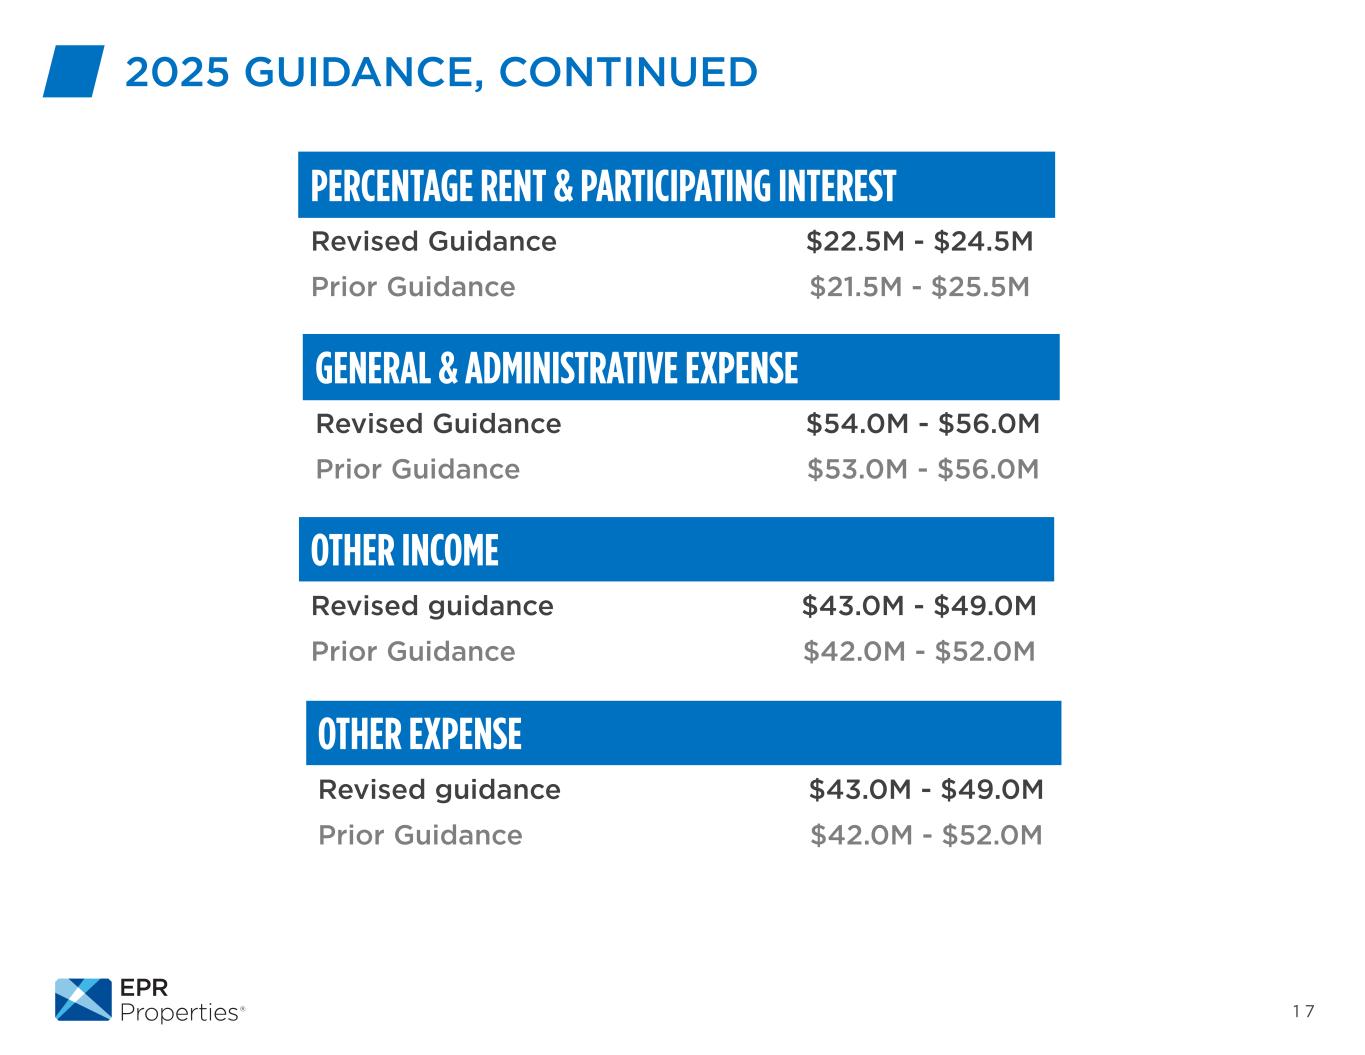
1 7 OTHER EXPENSE Revised guidance $43.0M - $49.0M Prior Guidance $42.0M - $52.0M PERCENTAGE RENT & PARTICIPATING INTEREST Revised Guidance $22.5M - $24.5M Prior Guidance $21.5M - $25.5M GENERAL & ADMINISTRATIVE EXPENSE Revised Guidance $54.0M - $56.0M Prior Guidance $53.0M - $56.0M 2025 GUIDANCE, CONTINUED OTHER INCOME Revised guidance $43.0M - $49.0M Prior Guidance $42.0M - $52.0M
CLOSING COMMENTS
