Report to Shareholders for the First Quarter, www.cibc.com February 26, 2026 |
Report of the President and Chief Executive Officer
Overview of results
CIBC today announced its financial results for the first quarter ended January 31, 2026.
First quarter highlights
Q1/26 |
Q1/25 |
Q4/25 |
YoY Variance |
QoQ Variance |
||||||||||||||||||||||||||
Revenue |
$8,398 million | $7,281 million | $7,576 million | +15% | +11% | |||||||||||||||||||||||||
Reported Net Income |
$3,100 million | $2,171 million | $2,180 million | +43% | +42% | |||||||||||||||||||||||||
Adjusted Net Income (1) |
$2,685 million | $2,179 million | $2,188 million | +23% | +23% | |||||||||||||||||||||||||
Adjusted pre-provision, pre-tax earnings (1) |
$4,079 million | $3,415 million | $3,408 million | +19% | +20% | |||||||||||||||||||||||||
Reported Diluted Earnings Per Share (EPS) |
$3.21 | $2.19 | $2.20 | +47% | +46% | |||||||||||||||||||||||||
Adjusted Diluted EPS (1) |
$2.76 | $2.20 | $2.21 | +25% | +25% | |||||||||||||||||||||||||
Reported Return on Common Shareholders’ Equity (ROE) (2) |
20.2% | 15.2% | 14.1% | |||||||||||||||||||||||||||
Adjusted ROE (1) |
17.4% | 15.3% | 14.1% | |||||||||||||||||||||||||||
Net interest margin on average interest-earnings assets (2)(3) |
1.61% | 1.50% | 1.59% | |||||||||||||||||||||||||||
| Net interest margin on average interest-earnings assets (excluding trading) (2)(3) |
2.06% |
1.89% |
2.00% |
|||||||||||||||||||||||||||
Common Equity Tier 1 (CET1) Ratio (4) |
13.4% | 13.5% | 13.3% |
Results for the first quarter of 2026 were affected by the following items of note resulting in a positive impact of $0.45 per share:
| • | $422 million income tax recoveries related to a capital gains distribution and utilization of capital losses; and |
| • | $10 million ($7 million after-tax) amortization of acquisition-related intangible assets. |
Our CET1 ratio
(4)
was 13.4% at January 31, 2026, compared with 13.3% at the end of the prior quarter. CIBC’s leverage ratio(4)
and liquidity coverage ratio(4)
at January 31, 2026 were 4.4% and 133%, respectively. We delivered strong financial performance in the first quarter of 2026 including record revenue across all of our business units and higher return on equity, as we accelerated the execution of our client-focused strategy to build on our momentum and deliver more for our stakeholders. We’re driving growth through deep client relationships while maintaining our financial strength and risk discipline and we’re working closely with our clients as they navigate a more fluid operating environment. Many of our clients are leaders in their industries and we are committed to standing with them as they make investments in the future to benefit key sectors across the economy.
Core business performance
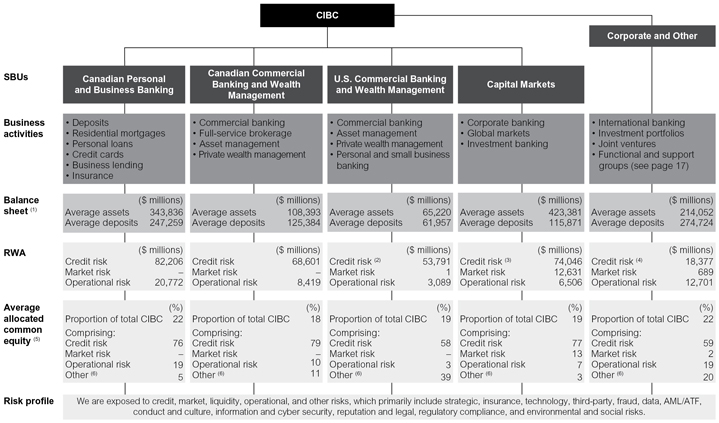
Canadian Personal and Business Banking
reported net income of $960 million for the first quarter, up $195 million or 25% from the first quarter a year ago, primarily due to higher revenue, partially offset by higher non-interest expenses and a higher provision for credit losses. Adjusted pre-provision, pre-tax earnings
(1)
were $1,743 million, up $273 million from the first quarter a year ago, as higher revenue was partially offset by higher adjusted(1)
non-interest
expenses. The higher revenue was mainly driven by a higher net interest margin and loan growth. Adjusted(1)
non-interest expenses were higher mainly due to higher spending on technology and other strategic initiatives and employee-related compensation. Canadian Commercial Banking and Wealth Management
reported net income of $647 million for the first quarter, up $56 million or 9% from the first quarter a year ago, primarily due to higher revenue, partially offset by higher non-interest expenses and a higher provision for credit losses. Adjusted pre-provision, pre-tax earnings
(1)
were $982 million, up $132 million from the first quarter a year ago, as higher revenue was partially offset by higher non-interest expenses. Commercial banking revenue was higher compared to the prior year due to volume growth and higher net interest margin. In wealth management, the increase in revenue was due to higher fee-based revenue from higher average assets under administration (AUA) and assets under management (AUM) balances as a result of market appreciation, higher net interest income from volume growth, and higher commission revenue from increased client activity. Expenses increased primarily due to higher performance-based and other employee-related compensation, and higher spending on technology and other strategic initiatives. | (1) | This measure is a non-GAAP measure. For additional information, see the “Non-GAAP measures” section, including the quantitative reconciliations of reported GAAP measures to: adjusted non-interest expenses and adjusted net income on pages 9 to 11; and adjusted pre-provision, pre-tax earnings on page 11. |
| (2) | For additional information on the composition of these specified financial measures, see the “Glossary” section. |
| (3) | Average balances are calculated as a weighted average of daily closing balances. |
| (4) | Our capital ratios are calculated pursuant to the Office of the Superintendent of Financial Institution’s (OSFI’s) Capital Adequacy Requirements (CAR) Guideline and the leverage ratio is calculated pursuant to OSFI’s Leverage Requirements Guideline, all of which are based on the Basel Committee on Banking Supervision (BCBS) standards. For additional information, see the “Capital management” and “Liquidity risk” sections. |