Unleash Innovation © 12026 TSMC, Ltd TSMC Property Unleash Innovation 2026 Second Quarter Earnings Conference July 16, 2026
Unleash Innovation © 22026 TSMC, Ltd TSMC Property Agenda • Welcome Jeff Su, IR Director • 2Q26 Financial Results and 3Q26 Outlook Wendell Huang, CFO • Key Messages Wendell Huang, CFO C.C. Wei, Chairman & CEO • Q&A
Unleash Innovation © 32026 TSMC, Ltd TSMC Property Safe Harbor Notice • TSMC’s statements of its current expectations are forward-looking statements subject to significant risks and uncertainties and actual results may differ materially from those contained in the forward-looking statements. • Information as to those factors that could cause actual results to vary can be found in TSMC’s 2025 Annual Report on Form 20-F filed with the United States Securities and Exchange Commission (the “SEC”) on April 16, 2026 and such other documents as TSMC may file with, or submit to, the SEC from time to time. • Except as required by law, we undertake no obligation to update any forward-looking statement, whether as a result of new information, future events, or otherwise.
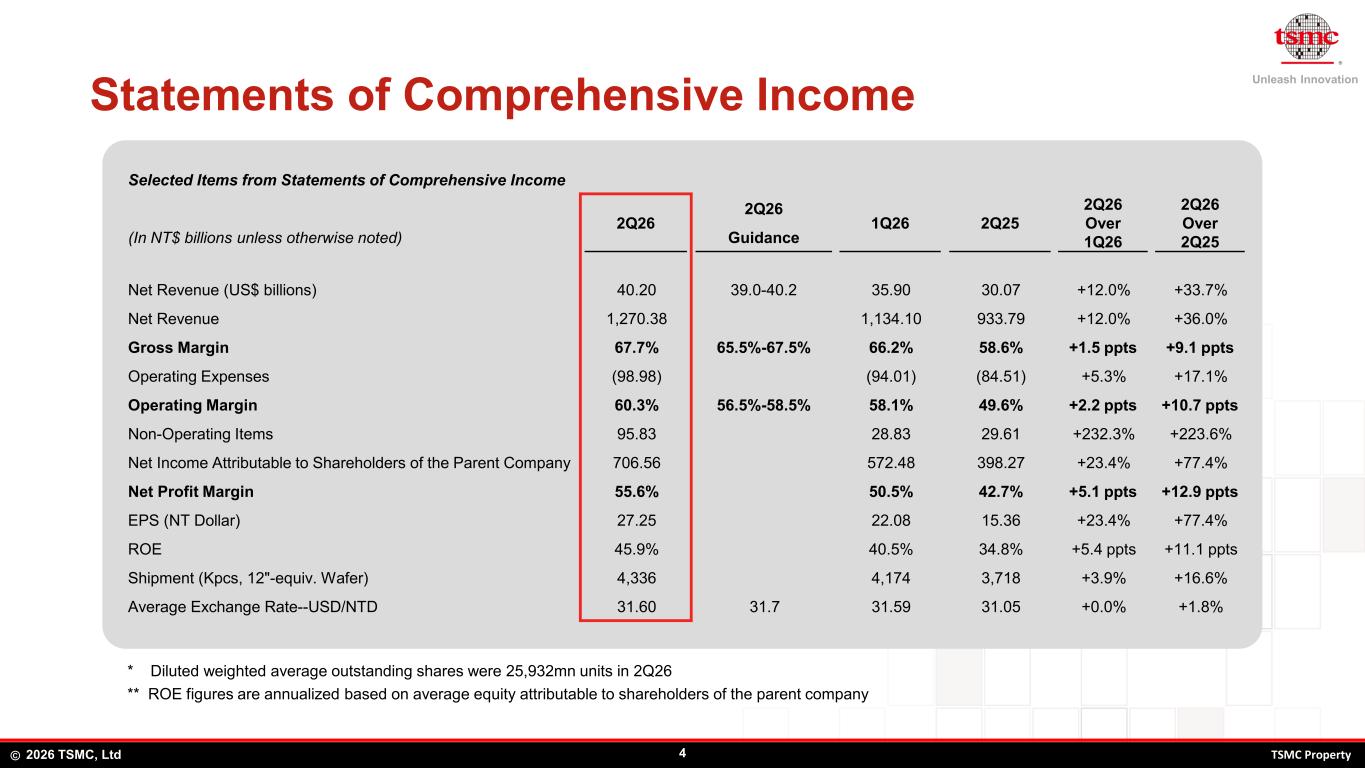
Unleash Innovation © 42026 TSMC, Ltd TSMC Property Statements of Comprehensive Income Selected Items from Statements of Comprehensive Income 2Q26 2Q26 1Q26 2Q25 2Q26 Over 1Q26 2Q26 Over 2Q25(In NT$ billions unless otherwise noted) Guidance Net Revenue (US$ billions) 40.20 39.0-40.2 35.90 30.07 +12.0% +33.7% Net Revenue 1,270.38 1,134.10 933.79 +12.0% +36.0% Gross Margin 67.7% 65.5%-67.5% 66.2% 58.6% +1.5 ppts +9.1 ppts Operating Expenses (98.98) (94.01) (84.51) +5.3% +17.1% Operating Margin 60.3% 56.5%-58.5% 58.1% 49.6% +2.2 ppts +10.7 ppts Non-Operating Items 95.83 28.83 29.61 +232.3% +223.6% Net Income Attributable to Shareholders of the Parent Company 706.56 572.48 398.27 +23.4% +77.4% Net Profit Margin 55.6% 50.5% 42.7% +5.1 ppts +12.9 ppts EPS (NT Dollar) 27.25 22.08 15.36 +23.4% +77.4% ROE 45.9% 40.5% 34.8% +5.4 ppts +11.1 ppts Shipment (Kpcs, 12"-equiv. Wafer) 4,336 4,174 3,718 +3.9% +16.6% Average Exchange Rate--USD/NTD 31.60 31.7 31.59 31.05 +0.0% +1.8% * Diluted weighted average outstanding shares were 25,932mn units in 2Q26 ** ROE figures are annualized based on average equity attributable to shareholders of the parent company
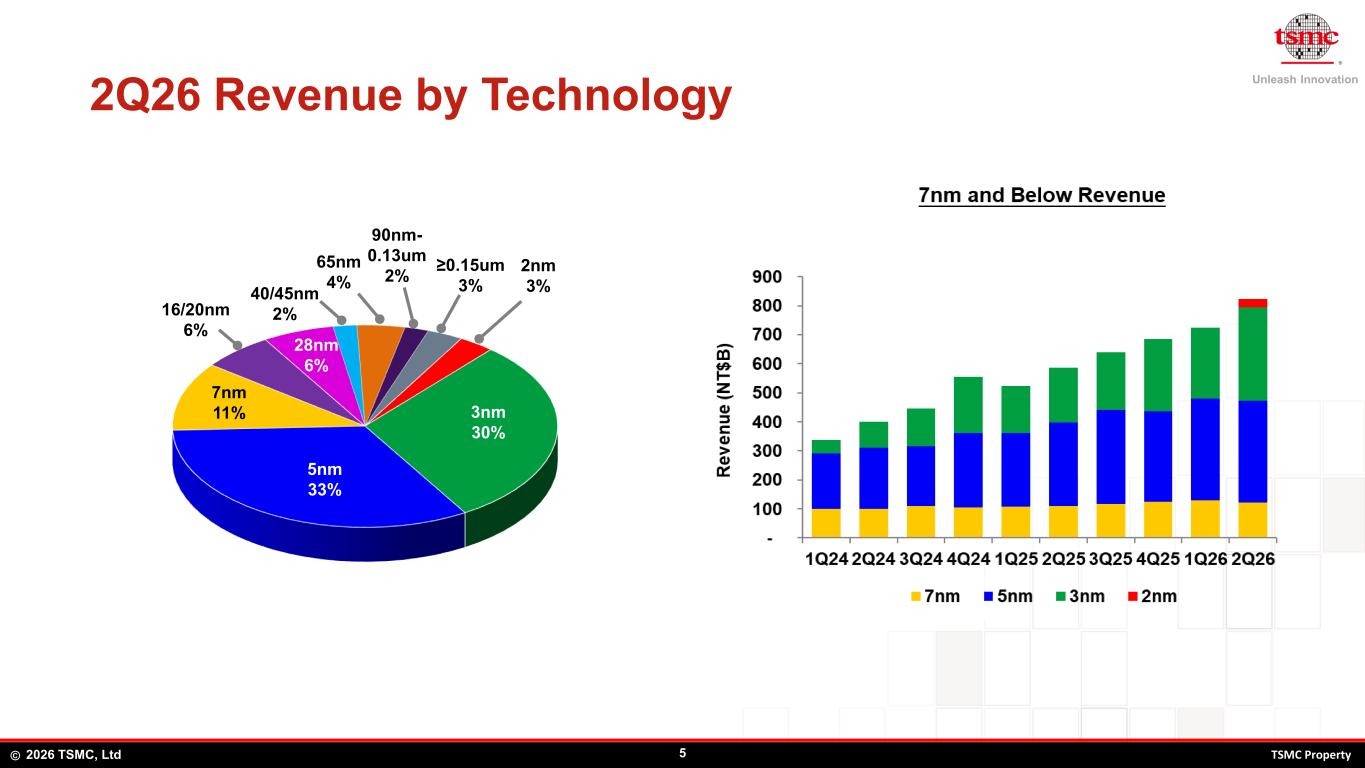
Unleash Innovation © 52026 TSMC, Ltd TSMC Property 2Q26 Revenue by Technology 28nm 6% 16/20nm 6% 7nm 11% 5nm 33% 3nm 30% 90nm- 0.13um 2% 40/45nm 2% ≥0.15um 3% 65nm 4% 2nm 3%
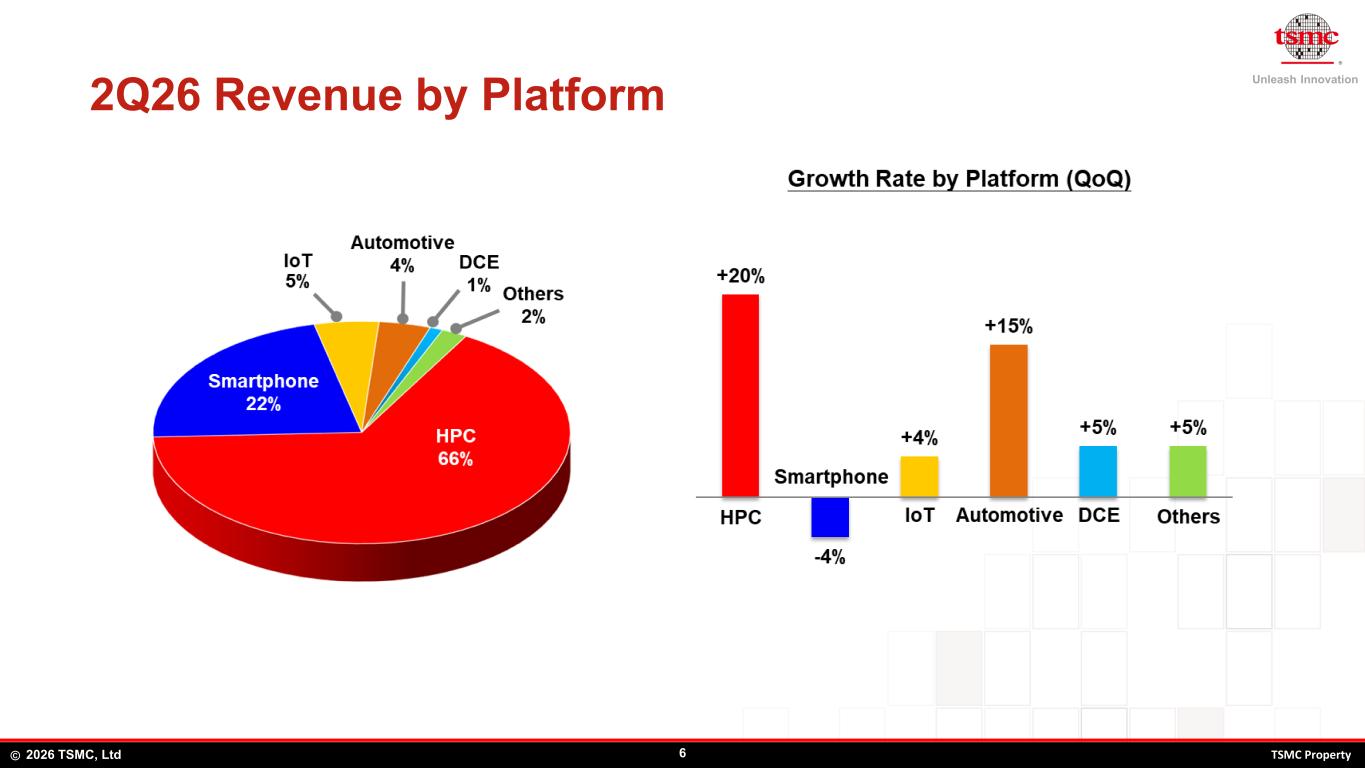
Unleash Innovation © 62026 TSMC, Ltd TSMC Property 2Q26 Revenue by Platform
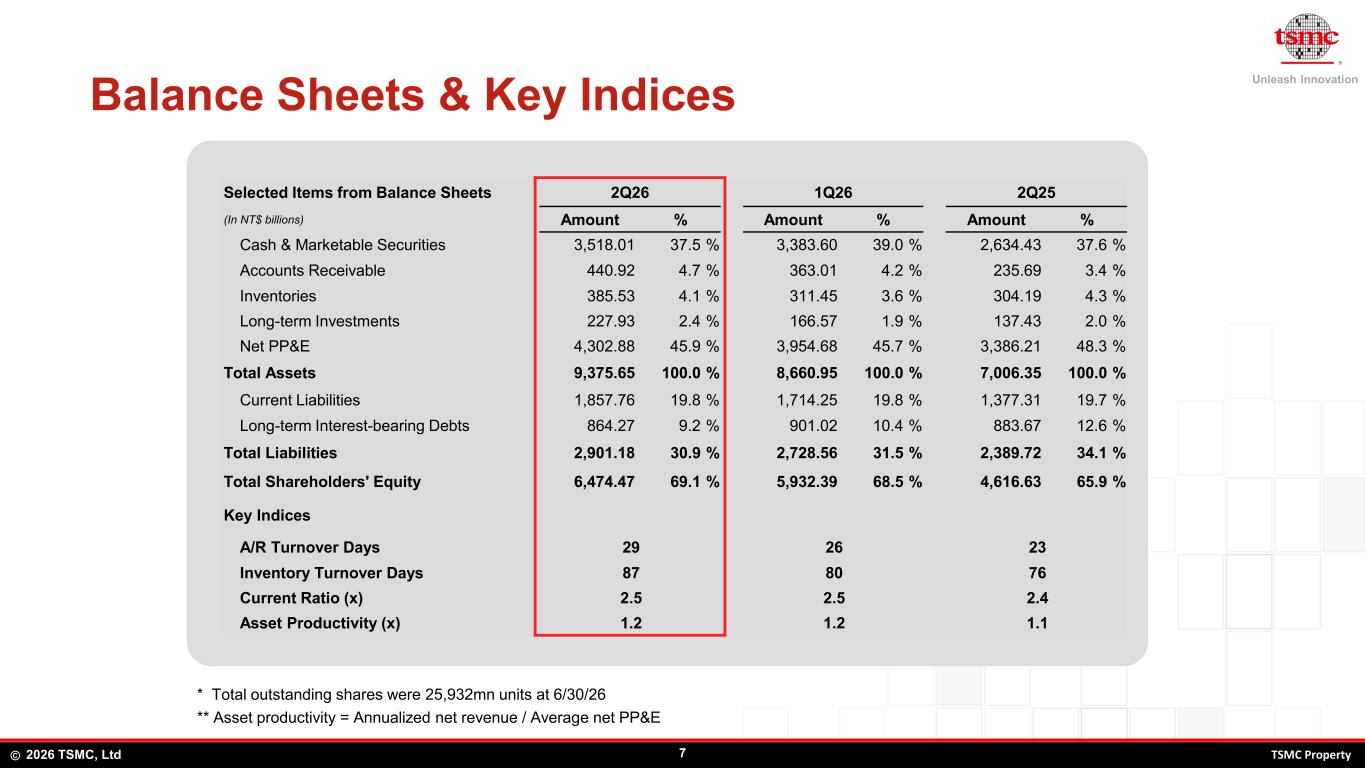
Unleash Innovation © 72026 TSMC, Ltd TSMC Property Balance Sheets & Key Indices Selected Items from Balance Sheets 2Q26 1Q26 2Q25 (In NT$ billions) Amount % Amount % Amount % Cash & Marketable Securities 3,518.01 37.5 % 3,383.60 39.0 % 2,634.43 37.6 % Accounts Receivable 440.92 4.7 % 363.01 4.2 % 235.69 3.4 % Inventories 385.53 4.1 % 311.45 3.6 % 304.19 4.3 % Long-term Investments 227.93 2.4 % 166.57 1.9 % 137.43 2.0 % Net PP&E 4,302.88 45.9 % 3,954.68 45.7 % 3,386.21 48.3 % Total Assets 9,375.65 100.0 % 8,660.95 100.0 % 7,006.35 100.0 % Current Liabilities 1,857.76 19.8 % 1,714.25 19.8 % 1,377.31 19.7 % Long-term Interest-bearing Debts 864.27 9.2 % 901.02 10.4 % 883.67 12.6 % Total Liabilities 2,901.18 30.9 % 2,728.56 31.5 % 2,389.72 34.1 % Total Shareholders' Equity 6,474.47 69.1 % 5,932.39 68.5 % 4,616.63 65.9 % Key Indices A/R Turnover Days 29 26 23 Inventory Turnover Days 87 80 76 Current Ratio (x) 2.5 2.5 2.4 Asset Productivity (x) 1.2 1.2 1.1 * Total outstanding shares were 25,932mn units at 6/30/26 ** Asset productivity = Annualized net revenue / Average net PP&E
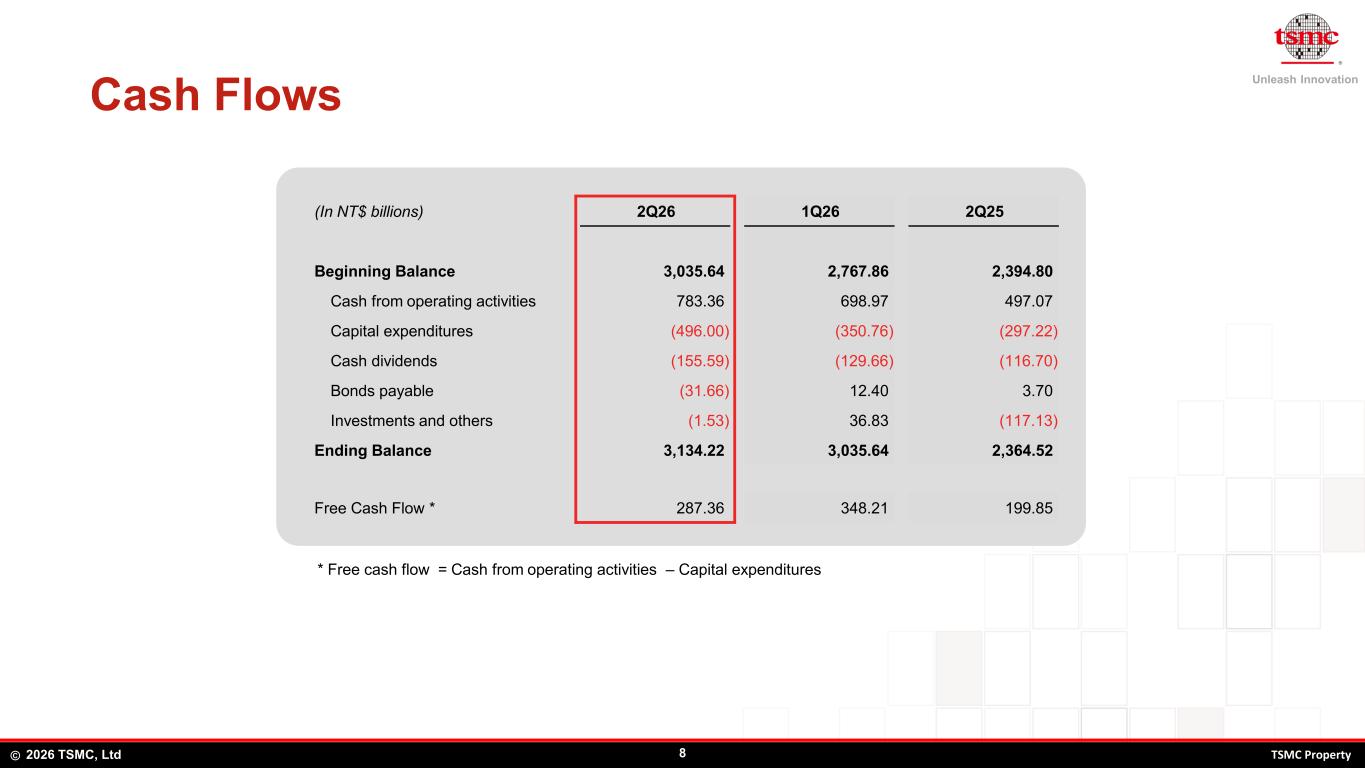
Unleash Innovation © 82026 TSMC, Ltd TSMC Property Cash Flows * Free cash flow = Cash from operating activities – Capital expenditures (In NT$ billions) 2Q26 1Q26 2Q25 Beginning Balance 3,035.64 2,767.86 2,394.80 Cash from operating activities 783.36 698.97 497.07 Capital expenditures (496.00) (350.76) (297.22) Cash dividends (155.59) (129.66) (116.70) Bonds payable (31.66) 12.40 3.70 Investments and others (1.53) 36.83 (117.13) Ending Balance 3,134.22 3,035.64 2,364.52 Free Cash Flow * 287.36 348.21 199.85
Unleash Innovation © 92026 TSMC, Ltd TSMC Property 3Q26 Guidance Based on our current business outlook, management expects: ▪ Revenue to be between US$44.6 billion and US$45.8 billion And, based on the exchange rate assumption of 1 US dollar to 32 NT dollars, management expects: ▪ Gross profit margin to be between 65% and 67% ▪ Operating profit margin to be between 56% and 58%
Unleash Innovation © 102026 TSMC, Ltd TSMC Property Future Outlook Based on our current business outlook, management expects: ▪ 2026 revenue to increase by slightly above 40% in US dollar terms
Unleash Innovation © 112026 TSMC, Ltd TSMC Property • Please visit TSMC's website (https://www.tsmc.com) and Market Observation Post System (https://mops.twse.com.tw) for details and other announcements • TSMC Sold 8.1% of Vanguard International Semiconductor (2026/05/15) • TSMC Board of Directors Approved NT$7.00 Cash Dividend for the First Quarter of 2026 and Set September 16, 2026 as Ex-Dividend Date, September 22, 2026 as the Record Date and October 8, 2026 as the Distribution Date (2026/05/12) • Sony Semiconductor Solutions and TSMC Entered Preliminary Agreement for Next- Generation Image Sensor Strategic Partnership (2026/05/08) • TSMC Debuted A13 Technology at 2026 North America Technology Symposium (2026/04/23) Recap of Recent Major Events
Unleash Innovation © 122026 TSMC, Ltd TSMC Property https://www.tsmc.com invest@tsmc.com