Please wait
Filed Pursuant to Rule 424(b)(3)
Registration No. 333-159645
SUPPLEMENT NO. 6 DATED SEPTEMBER 24, 2012
TO PROSPECTUS DATED MARCH 29, 2012
AMBIENT CORPORATION
This document supplements the prospectus dated March 29, 2012, as subsequently amended by Supplement No.1 dated May 16, 2012, Supplement No. 2 dated June 12, 2012, Supplement No. 3 dated June 21, 2012, Supplement No. 4 dated August 16, 2012 and Supplement No. 5 dated September 12, 2012 by attaching to and making as part of this Prospectus Supplement the following documents of Ambient Corporation, all of which were filed with the Securities and Exchange Commission on September 24, 2012:
|
(i)
|
amended and restated Annual Report on Form 10-K/A for the year ended December 31, 2011:
|
|
(ii)
|
amended and restated Quarterly Report on Form 10-Q/A for the quarter ended March 31, 2012;
|
|
(iii)
|
Quarterly Report on Form 10-Q for the quarter ended June 30, 2012; and
|
|
(iv)
|
Current Report on Form 8-K.
|
This prospectus supplement is incorporated by reference into the prospectus. This Prospectus Supplement is not complete without, and may not be delivered or utilized except in connection with, the prospectus, including any amendments or supplements to the prospectus.
NEITHER THE SECURITIES AND EXCHANGE COMMISSION NOR ANY STATE SECURITIES COMMISSION HAS APPROVED OR DISAPPROVED OF THESE SECURITIES OR PASSED ON THE ADEQUACY OR ACCURACY OF THIS PROSPECTUS. ANY REPRESENTATION TO THE CONTRARY IS A CRIMINAL OFFENSE.
The date of this prospectus supplement is September 24, 2012.
UNITED STATES
SECURITIES AND EXCHANGE COMMISSION
Washington, D.C. 20549
———————
FORM 10-K/A
(Amendment No. 1)
þ ANNUAL REPORT UNDER SECTION 13 OR 15(d) OF THE SECURITIES EXCHANGE ACT OF 1934
for the fiscal year ended December 31, 2011
¨ TRANSITION REPORT UNDER SECTION 13 OR 15(d) OF THE SECURITIES EXCHANGE ACT OF 1934
For the transition period from: _____________ to _____________
Commission file number 001-35259
———————
AMBIENT CORPORATION
(Exact name of registrant as specified in its charter)
———————
|
Delaware
|
|
98-0166007
|
|
(State or Other Jurisdiction
|
|
(I.R.S. Employer
|
|
of Incorporation)
|
|
Identification No.)
|
7 WELLS AVENUE, NEWTON, MASSACHUSETTS 02459
(Address of Principal Executive Office)
617-332-0004
(Registrant’s telephone number, including area code)
Securities Registered Under Section 12(b) of the Exchange Act:
|
Common Stock, par value $0.001 per share
|
|
NASDAQ Capital Market
|
Securities Registered Under Section 12(g) of the Exchange Act: None
Indicate by check mark if the registrant is a well-known seasoned issuer, as defined in Rule 405 of the Securities Act. Yes ¨ No þ
Indicate by check mark if the registrant is not required to file reports pursuant to Section 13 or Section 15(d) of the Securities Act of 1933. Yes ¨ No þ
Indicate by check mark whether the registrant: (1) has filed all reports required to be filed by Section 13 or 15(d) of the Exchange Act during the preceding 12 months (or for such shorter period that the registrant was required to file such reports), and (2) has been subject to such filing requirements for the past 90 days. Yes o No þ
Indicate by check mark whether the registrant has submitted electronically and posted on its corporate Web site, if any, every Interactive Data File required to be submitted and posted pursuant to Rule 405 Regulation S-T (232.405 of this chapter) during the preceding 12 months (or for such shorter period that the registrant was required to submit and post such files Yes o No þ
Indicate by check mark if disclosure of delinquent filers in response to Item 405 of Regulation S-K is not contained in this form, and no disclosure will be contained, to the best of the registrant's knowledge, in definitive proxy or information statements incorporated by reference in Part III of this Form 10-K or any amendment to this Form 10-K. þ
Indicate by check mark whether the registrant is a large accelerated filer, an accelerated filer, or a non-accelerated filer. See definition of "accelerated filer and large accelerated filer" in Rule 12b-2 of the Exchange Act.
Large accelerated filer ¨ Accelerated filer ¨ Non-accelerated filer ¨ Smaller reporting company þ
Indicate by check mark whether the registrant is a shell company (as defined in Rule 12b-2 of the Exchange Act.) Yes ¨ No þ
The registrant had 16,663,720 shares of common stock outstanding as of September 21, 2012. The aggregate market value of the common stock held by non-affiliates of the registrant as of June 30, 2011, was approximately $17.3 million computed by reference to the closing price of such common stock on the OTC Bulletin Board on such date.
Explanatory Note
We are filing this Amended Annual Report on Form 10-K/A (the “Amended Filing”) to our Annual Report on Form 10-K for the year ended December 31, 2011 originally filed with the Securities and Exchange Commission on March 6, 2012 (the “Original Filing”), to amend and restate our audited financial statements and related disclosures for the years ended December 31, 2007 through December 31, 2011. This Amended Filing will also include restated quarterly financial information for each of the first three quarterly periods in the fiscal years ended December 31, 2010 and 2011 and amend certain other Items in the Original Filing as listed in “Items Amended in this Filing” below, as a result of the restatement of our financial statements. The details of the amendments are discussed below and in Note 2 to the accompanying restated financial statements.
Background of Restatement
In connection with the preparation of Form 10-Q for the quarter ended June 30, 2012, management of the Company concluded that certain previously filed financial statements did not properly account for embedded derivative features of certain historical debt and warrants issued by the Company, which are described in detail below.
Convertible Debt: Certain historical convertible notes (the “Notes”) issued by the Company were previously recorded at their discounted face value. The discounts were comprised of both beneficial conversion features associated with the Notes and the fair value of warrants issued in connection with the Notes. However, the Notes contained certain features, including anti-dilution price protection and others that, in accordance with ASC-815, Derivatives and Hedging (“ASC 815”), should have been bifurcated from the host contract and accounted for as a derivative instrument (the “Embedded Derivatives”). Such Embedded Derivatives are recorded as a separate liability at their fair value on the date of issuance, and as a corresponding discount to the Notes which is amortized as interest expense over the term of the Notes. Changes in the fair values of these instruments require adjustments to the amount of the liabilities recorded on the Company’s balance sheet, and the corresponding gain or loss is required to be recorded in the Company’s statement of operations, as long as the Notes are outstanding.
Warrants: In connection with issuing the Notes, as well as in connection with other financing transactions, the Company issued warrants to purchase common stock (collectively, the “Warrants”). The Company had previously classified the value of the Warrants as equity. After further review, the Company determined that these instruments should have been classified as liabilities in accordance with ASC 815, due primarily to an anti-dilution price protection feature. Changes in the fair values of these instruments require adjustments to the amount of the liabilities recorded on the Company’s balance sheet, and the corresponding gain or loss is required to be recorded in the Company’s statement of operations.
Stock-based Compensation: The Company had previously used volatility assumptions based on the historical volatility of the price of the Company's common stock, which, based on the historical trading activity of the stock, resulted in inflated price volatilities that were not necessarily indicative of the expected volatility and were substantially higher than other peer-industry companies. Upon further review of the volatility assumptions, the Company determined that it was more appropriate to use an expected volatility based on the volatilities of its industry peer group. Such an approach was used to determine appropriate volatility assumptions for valuation purposes of the Embedded Derivatives and Warrants. As a result, assumed volatilities are lower than those previously used, which reduces stock-based compensation expense.
In addition to the adjustments listed above, the Company recorded immaterial adjustments to revenue to account for the deferral of maintenance revenue arising from the initial period of free maintenance provided upon shipment of our communication nodes.
All of the necessary adjustments relating to the Notes and Warrants are non-cash in nature and do not impact the Company’s total cash flows from operating, investing and financing activities. The adjustments are related to complex accounting requirements of certain characteristics of the Notes and Warrants that require the recording of debt discounts and related amortization, mark-to-market adjustments in the fair value of Warrants and Embedded Derivatives and gains or losses associated with the extinguishment of debt under certain circumstances.
As a result of these cumulative adjustments, as of December 31, 2011, accumulated deficit increased from $138.7 million to $221.4 million and additional paid in capital increased from $155.7 million to $237.4 million. At December 31, 2011, the net impact of the cumulative adjustments reduced overall stockholders’ equity by approximately $1.0 million. Since all of the Notes were either paid off or converted by early 2010 and many of the Warrants were either exercised or expired by the end of 2011, the estimated impact of accounting for these instruments in 2012 and for future periods is expected to be immaterial.
Detailed discussions of the impact of the proper accounting for the Notes and Warrants on our financial statements are contained in the consolidated financial statements in Part II – Item 8 of this Amended Filing.
Restatement of Other Financial Statements
In addition to this Amended Filing, we are concurrently filing an amendment to our Quarterly Report on Form 10-Q for the quarter ended March 31, 2012 (the “March 10-Q/A”). The March 10-Q/A is being filed to restate our unaudited financial statements and related financial information for the periods contained in that report and to amend certain other Items within the previously-issued quarterly filing, including Item 4 – “Controls and Procedures” to reflect a reassessment of our disclosure controls and procedures, and internal control over financial reporting.
Internal Control Consideration
Our management has determined that there was a control deficiency in our internal control over financial reporting that constitutes a material weakness, as discussed in Part II — Item 9A of this Amended Filing. A material weakness is a deficiency, or combination of control deficiencies, in internal control over financial reporting, such that there is a reasonable possibility that a material misstatement of the annual or interim consolidated financial statements will not be prevented or detected on a timely basis. For a discussion of management’s consideration of our disclosure controls and procedures and the material weakness identified, see Part II — Item 9A included in this Amended Filing.
Items Amended in This Filing
For the convenience of the reader, this Amended Filing sets forth the Original Filing, as modified and superseded where necessary to reflect the restatement. The following items have been amended as a result of, and to reflect, the restatement:
|
●
|
Part I – Item 1A Risk Factors
|
|
●
|
Part II – Item 6. Selected Financial Data
|
|
●
|
Part II – Item 7. Management’s Discussion and Analysis of Financial Condition and Results of Operations
|
|
●
|
Part II– Item 8. Financial Statements and Supplementary Data
|
|
●
|
Part II– Item 9A. Controls and Procedures (Restated)
|
| ● |
Part III-Item 11. Executive Compensation
|
In accordance with applicable SEC rules, this Amended Filing includes new certifications required by Rule 13a-14 under the Securities and Exchange Act of 1934 (“Exchange Act”) from our Chief Executive Officer and Chief Financial Officer dated as of the date of filing of this Amended Filing.
We have not updated items in this Amended filing to reflect events occuring subsequently to the Original Filing date other than those associated with the restatement of the Company's financial statements and an update to Part III-Item 12 Security Ownership of Certain Beneficial Owners.
AMBIENT CORPORATION
2011 FORM 10-K/A ANNUAL REPORT
TABLE OF CONTENTS
| |
|
|
Page
|
|
| |
PART I
|
|
|
|
| |
|
|
|
|
|
Item 1.
|
Business
|
|
|
4
|
|
| |
|
|
|
|
|
|
Item 1A.
|
Risk Factors
|
|
|
17
|
|
| |
|
|
|
|
|
|
Item 1B.
|
Unresolved Staff Comments
|
|
|
28
|
|
| |
|
|
|
|
|
|
Item 2.
|
Properties
|
|
|
28
|
|
| |
|
|
|
|
|
|
Item 3.
|
Legal Proceedings
|
|
|
28
|
|
| |
|
|
|
|
|
|
Item 4.
|
Mine Safety Disclosures
|
|
|
28
|
|
| |
|
|
|
|
|
| |
PART II
|
|
|
|
|
| |
|
|
|
|
|
|
Item 5.
|
Market for Registrant's Common Equity, Related Stockholder Matters and Issuer Purchases of Equity Securities
|
|
|
29
|
|
| |
|
|
|
|
|
|
Item 6.
|
Restated Selected Financial Data
|
|
|
30
|
|
| |
|
|
|
|
|
|
Item 7.
|
Restated Management Discussion and Analysis of Financial Condition and Results of Operation.
|
|
|
31
|
|
| |
|
|
|
|
|
|
Item 7A.
|
Quantitative and Qualitative Disclosures About Market Risk.
|
|
|
39
|
|
| |
|
|
|
|
|
|
Item 8.
|
Restated Financial Statements and Supplementary Data
|
|
|
39
|
|
| |
|
|
|
|
|
|
Item 9.
|
Changes in and Disagreements With Accountants on Accounting and Financial Disclosure
|
|
|
39
|
|
| |
|
|
|
|
|
|
Item 9A
|
Controls and Procedures Restated
|
|
|
39
|
|
| |
|
|
|
|
|
|
Item 9B.
|
Other Information
|
|
|
40
|
|
| |
|
|
|
|
|
| |
PART III
|
|
|
|
|
| |
|
|
|
|
|
|
Item 10.
|
Directors, Executive Officers and Corporate Governance
|
|
|
41
|
|
| |
|
|
|
|
|
|
Item 11.
|
Executive Compensation
|
|
|
44
|
|
| |
|
|
|
|
|
|
Item 12.
|
Security Ownership of Certain Beneficial Owners and Management and Related Stockholder Matters
|
|
|
48
|
|
| |
|
|
|
|
|
|
Item 13.
|
Certain Relationships and Related Transactions and Director Independence
|
|
|
49
|
|
| |
|
|
|
|
|
|
Item 14.
|
Principal Accountant Fees and Services
|
|
|
50
|
|
| |
|
|
|
|
|
|
Item 15.
|
Exhibits and Financial Statement Schedules
|
|
|
51
|
|
| |
|
|
|
|
|
|
SIGNATURES
|
|
|
54
|
|
FORWARD LOOKING STATEMENTS
The following discussion should be read in conjunction with the financial statements and related notes contained elsewhere in this annual report on Form 10-K. We make forward-looking statements in this report, in other materials we file with the Securities and Exchange Commission (the “SEC”) or that we otherwise release to the public, and on our website. In addition, our senior management might make forward-looking statements orally to analysts, investors, the media, and others. These statements are “forward-looking statements” within the meaning of Section 27A of the Securities Act of 1933, as amended, and 21E of the Securities Exchange Act of 1934, as amended. Statements concerning our future operations, prospects, strategies, financial condition, future economic performance (including growth and earnings) and demand for our products and services, and other statements of our plans, beliefs, or expectations, including the statements contained in Item 7, “Management’s Discussion and Analysis of Financial Condition and Results of Operations” regarding our future plans, strategies and expectations are forward-looking statements. In some cases these statements are identifiable through the use of words such as “anticipate,” “believe,” “estimate,” “predict,” “expect,” “intend,” “plan,” “project,” “target,” “continue,” “can,” “could,” “may,” “should,” “will,” “would,” and similar expressions. You are cautioned not to place undue reliance on these forward-looking statements because these forward-looking statements we make are not guarantees of future performance and are subject to various assumptions, risks, and other factors that could cause actual results to differ materially from those suggested by these forward-looking statements. Thus, our ability to predict results or the actual effect of our future plans or strategies is inherently uncertain. Factors which could have a material adverse effect on our operations and future prospects include, but are not limited to, our ability to retain and attract customers, particularly in light of our current dependence on a single customer for all of our revenue; our expectations regarding our expenses and revenue, including our expectations that our research and development expenses and selling, general and administrative expenses may increase in absolute dollars; our material weakness in internal control over financial reporting; anticipated trends and challenges in our business and the markets in which we operate, including the market for smart grid technologies; our expectations regarding competition as more and larger companies enter our markets and as existing competitors improve or expand their product offerings; our plans for future products and enhancements of existing products; our anticipated cash needs and our estimates regarding our capital requirements; and our anticipated growth strategies. These risks and uncertainties, together with the other risks described from time to time in reports and documents that we file with the SEC, should be considered in evaluating forward-looking statements. Although we believe that the expectations reflected in the forward-looking statements are reasonable, we cannot guarantee future results, performance or achievements. Indeed, it is likely that some of our assumptions will prove to be incorrect. Our actual results and financial position will vary from those projected or implied in the forward-looking statements and the variances may be material. Moreover, we do not assume the responsibility for the accuracy and completeness of these forward-looking statements. We expressly disclaim any obligation to update or revise any forward-looking statements, whether as a result of new information, future events, or otherwise, except as required by law.
PART I
ITEM 1. BUSINESS
We are a leading provider of a smart grid communications platform designed to enable utilities to effectively deploy, integrate and communicate with multiple devices creating smart grid applications within the electric power grid. Our smart grid communications platform significantly improves the ability of utilities to use advanced technologies to upgrade their electric power grids, effectively making the grids more intelligent.
The term “smart grid” refers to the use of advanced technologies to upgrade the electric power grid, or the grid, effectively making the grid more intelligent and efficient. The grid was largely designed and built decades ago to reliably distribute electricity from generators to customers in a manner resulting in sizable capital investments and operating costs. A number of factors are increasingly straining the grid, including growing electricity demand, two-way power flow, the implementation of renewable and distributed energy sources and advanced pricing plans. As such, the aging grid is prone to reliability, security, availability and power quality issues, costing utilities and consumers billions of dollars each year. Technology is now revolutionizing the grid and transforming it into an efficient, communicating energy service platform. We believe that the smart grid will address the current shortcomings of the grid and deliver significant benefits to utilities and consumers of energy, including reduced costs, increased power reliability and quality, accommodation of renewable energy technologies, consumer empowerment over energy consumption and a platform for continued integration of new technologies.
The Ambient Smart Grid® communications platform, which includes hardware, software and firmware, enables utilities to effectively manage smart grid applications. Our communications platform provides utilities with a secure, two-way, flexible and open Internet protocol, or IP, architecture that efficiently networks smart grid applications and different technologies within each application and supports multiple communications technologies currently used by utilities, such as Wi-Fi, radio frequency, cellular technologies, power line communications, serial and Ethernet. Today, our communications platform enables the simultaneous integration and parallel communication of multiple smart grid applications provided by a variety of vendors, including smart metering, demand response and distribution automation. We believe that the Ambient Smart Grid® communications platform delivers significant benefits to utilities, including support of a single network; an open, scalable and interoperable platform; preservation of utility investments; third-party application hosting; remote and distributed intelligence; secure communications; and reduced overall implementation and operating costs.
The Ambient Smart Grid® products and services include communications nodes; a network management system, AmbientNMS®; integrated applications; and maintenance and consulting services. The communications nodes, our principal product, are physical boxes that contain the hardware and software needed for communications and data collection in support of smart grid assets. We have configured our communications nodes to act as individual data processors and collectors that receive signals from other networked devices, enabling smart grid applications. Duke Energy, our sole customer, to date has deployed approximately 105,000 of our communications nodes that receive data from smart electric and gas meters, using a variety of communications technologies, and process and transmit these data to the utility back office over a cellular carrier network for further processing. Furthermore, our communications nodes, in the fourth generation of development, also accommodate integrated applications that include our own developed technology and third-party technology, thereby substantially increasing their functionality. By enabling such system interoperability, our communications platform both reduces implementation and ongoing communications costs and improves overall power management efficiencies. We believe that, to date, no other single solution or technology has provided the necessary flexibility in a cost-effective manner, enabling a comprehensive digital communications platform while leveraging standards-based technologies. We developed our communications platform to fill this void.
Our long-standing relationship with Duke Energy, which we believe has one of the most forward-looking smart grid initiatives in North America, has led to rapid growth in our business. We entered into a long-term agreement in September 2009 with Duke Energy to supply the utility with our Ambient Smart Grid® communications platform and license our AmbientNMS® through 2015. We increased revenue from $2.2 million in 2009 to $20.2 million in 2010 to $62.1 million in 2011. As of December 31, 2011, we had backlog of approximately $35 million. We believe that there are opportunities for additional sales of our products and services with Duke Energy. Furthermore, we also intend to leverage our success with the utility to secure additional customers in the global utility market place.
We were incorporated in the state of Delaware on June 26, 1996. Our common stock currently trades on the NASDAQ Capital Market under the symbol “AMBT.”
Industry Overview
The Electric Power Distribution Grid
The grid was largely designed and built decades ago, and is increasingly becoming strained. According to the U.S. Department of Energy, or DOE, in the United States 70% of transmission lines are 25 years old or older; 70% of power transformers are 25 years old or older; and 60% of circuit breakers are 30 years old or older. The current grid infrastructure, both in the United States and abroad, simply is not designed to accommodate the dynamic electricity distribution requirements of today or the future. As a result, the aging grid is prone to reliability, security, availability and power quality issues, costing utilities and consumers billions of dollars each year. For example, according to the Electrical Power Research Institute, or EPRI, power disturbances and quality problems alone cost U.S. businesses between $119 billion and $188 billion each year.
The following factors highlight the deficiencies of today’s grid:
Severely Strained and Aging Grid. The strain on the grid has led to efficiency losses, service interruptions, higher electricity rates and costly unplanned maintenance and repair expenses. According to the EPRI, power quality issues alone already cost between $15 billion and $24 billion per year in the United States. As consumers and industries increase their reliance on electronic devices, these disturbances and quality issues will become more disruptive and more costly. Increased grid efficiency will help reduce the capital required for added grid infrastructure.
Inability of the Grid to Support Proliferation of Renewable Energy and Related Technologies. Over the past few years, utilities and consumers have increased their adoption of centralized and distributed renewable energy, such as wind, solar and energy storage technologies, as a source of electricity. According to the EIA, renewable energy sources will account for 23% of total electricity generation worldwide in 2035. Furthermore, expected growth in electric vehicles will create the need for charging stations, placing additional strain on the grid. The grid will not be able to accommodate all of these renewable energy initiatives. Moreover, approximately half of the states in the United States have some form of renewable portfolio standards, which require that specified amounts of electricity are sourced from renewable sources, resulting in a substantial anticipated increase in the need for grid modernization. This is a global trend evidenced, in part, by the European Union, or EU, climate energy goals. The EU has adopted aggressive climate and energy goals — the “20-20-20” targets — that aim to reduce EU greenhouse gas emissions at least 20% below 1990 levels, derive 20% of EU energy consumption from renewable resources and create a 20% reduction in primary energy use compared with projected levels through improving energy efficiency, in each case, by 2020.
Limited Real-Time Operational Insight, Communication and Analysis. The century-old grid in the United States consists of over 300,000 miles of transmission lines and over 1,000,000 megawatts of generating capacity. The importance of today’s grid to modern society is unquestionable; however, it remains largely untouched by modern networking and communications technologies. For example, power outages are still manually reported for the majority of the grid. The lack of communications technologies represents a significant limiting factor in the amount of information and control available to both utility operators and their customers. The lack of these technologies has also had a limiting effect on the ability of utilities to engage with their customers and for customers to take an active role in their consumption and cost of energy and resources.
The Smart Grid
We believe that grid modernization will address the shortcomings of the current grid as well as deliver significant benefits to utilities and consumers of energy. The smart grid encompasses multiple technologies and applications, and represents significantly more than just smart electric meters. The U.S. Energy Independence and Security Act of 2007 provided the following, thorough definition of the smart grid:
The term “smart grid” refers to a modernization of the electricity delivery system so it monitors, protects and automatically optimizes the operation of its interconnected elements — from the central and distributed generator through the high-voltage network and distribution system, to industrial users and building automation systems, to energy storage installations and to end-use consumers and their thermostats, electric vehicles, appliances and other household devices. The smart grid will be characterized by a two-way flow of electricity and information to create an automated, widely distributed energy delivery network. It incorporates into the grid the benefits of distributed computing and communications to deliver real-time information and enable the near-instantaneous balance of supply and demand at the device level.
In brief, the term “smart grid” refers to the use of advanced communications technologies and modern computing capabilities to upgrade and modernize the electric power grid (and even other utility infrastructures, such as gas and water), effectively making the grid more intelligent and efficient. We believe that the implementation of intelligent and seamless communication across the grid represents the largest expected wave of information technology spending, similar to the previous telecommunications and Internet investment cycles.
Smart Grid Applications
The smart grid will connect millions of devices that generate, distribute, control, monitor and use energy, thereby enabling utilities and consumers to dynamically interact with the energy supply chain. The smart grid is more than just smart meters, and we believe that fully realizing the benefits of the smart grid will require the implementation of a variety of technologies and applications. For all smart grid applications to work seamlessly together, a flexible and open communications platform is needed for the interoperability of each connected smart grid application, including the following:
Smart Meters. Smart meters encompass the meters themselves, related communications equipment and data management systems that record and monitor real-time energy consumption information at regular intervals. Smart meters allow for two-way communication of data between the smart meter and a utility’s back office, providing utilities with valuable information to measure and control production, transmission and distribution more efficiently and providing consumers with information to make informed choices regarding energy consumption. This technology further enables a utility to reduce the costs of operating its distribution system by automating various functions that are currently performed manually, such as reading customer meters and turning power on and off at the customer meter.
Demand Response. Demand response is an initiative in which utilities provide incentives to consumers to reduce energy usage during times of peak demand. Demand response includes technology that can manage the consumption of electricity in conjunction with supply and demand fluctuations, enabling variable pricing and providing information to encourage consumers to make more active decisions about their energy usage. Utilities can use demand response to enable consumers to reduce, or provide direct utility control of, electricity use, particularly during high price/demand periods, by sending time-differentiated prices to customers via the meter and recording customers’ actual real-time usage. Demand response technology enables utilities to better manage their distribution network, delivering electricity more efficiently and potentially reducing peak and baseload generation requirements.
Distribution Automation. Distribution automation encompasses utilities deploying control devices and communications infrastructure to monitor and control energy distribution in real time, enabling intelligent control over grid functions at the distribution level. Utilities use distribution automation applications to directly control the flow of electricity from individual substations to consumers in order to improve the quality of power generation, reduce the frequency, duration and scale of power outages, reduce energy losses and ultimately optimize operating efficiency and reliability of the grid.
Network Management Systems. Utilities require back office software and computer hardware systems to monitor and manage the vast numbers of devices and information collected by those devices from various smart grid applications. Network management systems control smart grid devices and collect and process data in the back office relying on two-way communications.
Smart Grid Requirements
The success of the smart grid, with its promise of delivering significant benefits to utilities, consumers and the environment, will depend upon the successful implementation of smart grid applications that rely on a network communications infrastructure. Due to the varied nature of applications, technologies and communication methods, the dedicated communications infrastructure requires ample flexibility in order to accommodate and support all connected applications. Key requirements of the smart grid include the following:
Communications Platform. A secure, flexible and open communications platform is required to enable the smart grid. The communications platform provides real-time, two-way information flow from multiple smart grid applications to a network management system at a utility’s operations center, providing the critical foundation upon which a utility deploys its smart grid applications. A flexible, purpose-built communications platform accommodates different functional requirements of each smart grid application, allows different communications technologies to work in parallel and allows a utility to rapidly scale a large number of smart grid applications.
Interoperability. Various agencies, including the U.S. National Institute of Standards and Technology and the Institute of Electrical and Electronics Engineers, are developing specific smart grid standards that will allow for software and hardware components from different applications, vendors and technologies to seamlessly work together. Interoperability standards, and an open communications platform that supports them, will allow for growth of the smart grid that is not predicated on any one proprietary network architecture or communication technology.
Scalability. As utilities incorporate millions of smart grid devices into the grid, all of which will generate vast amounts of information, the communications platform must both support all connected applications in parallel and allow for quick and cost-effective deployment of new smart grid devices and new applications. A communications platform that cannot scale or is limited with latency or bandwidth issues seriously curtails realizing the full benefits of a smart grid.
Security. With increasing threats of cyber-attacks and the corresponding increased sophistication of malicious technology, communications infrastructure must provide security to protect the assets of the utility, preserve the reliability of the grid and protect consumers. Secure, IP-based communication protocols are an integral part of any communications platform.
Cost Effectiveness. An interoperable, scalable and flexible communications platform allows a utility to deploy a single platform for all smart grid applications, reducing operation and maintenance costs associated with running separate networks. A flexible communications platform also allows utilities to avoid stranding assets by incorporating legacy technologies into more advanced systems, while also providing a platform for future technologies.
Anticipated Smart Grid Investment
Pike Research forecasts that smart grid investment will total $52 billion in North America by 2015, $80 billion in Europe by 2020 and $171 billion in Asia by 2017. The U.S. government is a substantial proponent of smart grid technologies, primarily through the American Recovery and Reinvestment Act of 2009, or ARRA, which awarded more than $3.4 billion in stimulus funding for smart grid technology development and demonstration, plus $615 million for smart grid storage, across 99 smart grid initiatives to be spent by 2013. Due to the cost-share nature of the awards, U.S. investment in smart grid technologies associated with the ARRA reached approximately $8 billion in projects to be completed by 2015. The rollout of smart meters, one specific smart grid application, is currently a driving factor in the deployment of the smart grid. According to EIA, approximately 7% of all electric meters in the United States are smart meters, illustrating a large remaining opportunity for smart meters alone.
We expect that distribution automation, another important smart grid application, may represent the fastest growing and potentially largest area of smart grid investment. According to SBI Energy, the global substation automation product market is expected to reach $106 billion by 2015, where a bulk of the growth is expected to come from countries that are working to modernize their electricity networks and accommodate smart grid technologies. We expect future investment in all smart grid applications and technologies to substantially increase.
Smart Grid Benefits
The following represent some of the most significant benefits of the smart grid:
Reduces Costs for Utilities and Consumers. To meet the long-term demand for electricity, utilities will need to invest substantial capital for added generation and transmission and distribution infrastructure. However, according to the DOE, utilities in the United States can save up to $163 billion through 2025 in costs associated with this investment through increased energy efficiency with the grid, reducing transmission congestion and preserving reserve capacity resulting from the deployment of smart grid applications. By avoiding such substantial costs, utilities can therefore better mitigate anticipated consumer rate increases. Moreover, the two-way communication facilitated by smart grid technologies will enhance utilities’ ability to balance supply and demand of electricity, allowing them to more efficiently utilize their generation assets and reduce the amount of expensive peak demand assets. According to the EPRI, an investment of $338 to $476 billion in smart grid initiatives over the next 20 years will provide overall benefits valued between $1.3 and $2.0 trillion.
Increases Power Reliability and Quality. The smart grid’s two-way communications capabilities provide real-time information about the grid’s electricity characteristics, such as current and voltage, allowing grid operators and smart devices to identify and optimize how electricity flows through the grid. Smart grid technologies, such as distributed capacitor banks and Volt/VAR controls, can smooth out the overall quality of electricity as well as protect grid elements and customers against sudden power surges and other transient power events, all while decreasing line loss. According to the EPRI, power quality issues cost between $15 billion and $24 billion per year in the United States, costs that we believe can be substantially avoided by utilizing the smart grid.
Accommodates Renewable Energy Sources and Electric Vehicles. Utilities need smart grid technologies to support the widespread adoption of renewable energy sources, electric vehicles and other clean technology solutions. The intermittent nature of renewable electricity, the developing energy storage technologies and the demand of electric vehicles all create challenges for utilities in matching energy generating sources with demand. We believe that each of these issues is effectively addressed with a full smart grid implementation.
Facilitates Consumer Empowerment. Two-way communication will allow consumers to proactively monitor and control the way in which they consume electricity, which will ultimately help consumers to lower their electricity bills. Utilities can also develop improved pricing practices aimed at creating a more efficient pricing structure that addresses potential pricing inequalities during normal and peak demand cycles.
Provides a Platform for Technology Innovation. The development of new smart grid applications and technologies and their continued integration into the grid are critical to full development of the smart grid. The smart grid will allow for the seamless integration of new technologies into the grid without the need to substantially change existing infrastructure, thereby avoiding significant capital costs required to support ever-evolving technologies.
Our Solution
The Ambient Smart Grid® Communications Platform
The Ambient Smart Grid® communications platform, which includes hardware, software and firmware, enables utilities to both effectively manage smart grid applications and directly integrate certain applications into our products themselves. Our communications platform provides a utility with a secure, two-way, flexible and open IP architecture that efficiently networks smart grid applications and different technologies within each application and supports multiple communications technologies currently used by utilities, such as Wi-Fi, radio frequency, cellular technologies, power line communications, serial and Ethernet. Our communications platform enables the integration of smart grid applications, such as smart metering, demand response, distribution automation and monitoring, and direct load control. It also provides an open and flexible platform allowing for the addition of multiple applications, as well as enhancements and future applications.
Our Ambient Smart Grid® communications nodes are attached on or near a utility’s transformer, and they support applications and connectivity to devices that comprise the smart grid. These communications nodes are physical boxes we designed for use in the harsh, outdoor environments in which utilities operate. Our network management system, known as AmbientNMS® is the software that manages the large numbers of devices on a smart grid network. By enabling such system interoperability, our communications platform both reduces implementation and ongoing communications costs, and improves overall power management efficiencies. Furthermore, our communications platform also accommodate smart grid applications installed directly into our communications nodes, which include our own developed technology and third-party technology, thereby substantially increasing their functionality.
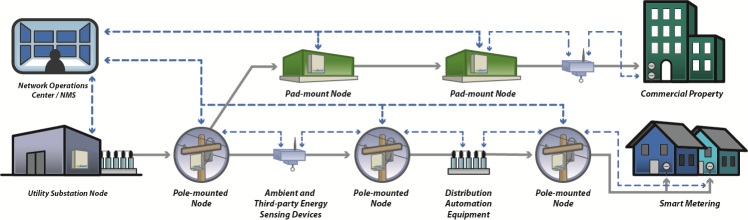
The following diagram depicts our products in the utility infrastructure:
Ambient Smart Grid® Benefits
Our products offer the following benefits to utilities:
Support of a Single Network Through Flexible Communication. Our communications nodes support multiple communication technologies simultaneously, allowing a utility to leverage a single communications platform to support many smart grid applications that rely on different communication technologies, such as cellular, Wi-Fi, 900MHz radio frequency, power line carrier, serial and Ethernet, all operating in parallel in a single communications node.
Open Platform for Scalability and Interoperability. Our AmbientNMS® or third-party management systems, can manage our open communications platform. Our communications platform offers flexibility that allows utilities to deploy multiple smart grid applications from multiple vendors, including our competitors, and it can evolve with new technologies.
Preservation of Utility Smart Grid Investments. The flexibility and open architecture of our communications platform protect a utility against stranding existing assets, including an investment in our communications platform itself. It is a major impediment for utility smart grid investment if a utility is not able to recover, or is concerned about recovering, the costs of previously deployed assets. For example, our communications nodes can support the collection of data from legacy, one-way communicating meters, (often referred to as AMR meters) which many utilities have previously installed and carry significant undepreciated value on their balance sheets. It is generally not cost effective for utilities to replace these legacy meters with current, two-way communicating smart meters; however, they can use our communications nodes to increase the intelligence/functionality of the existing system and eliminate costly, time-delayed manual data collection routines, such as drive-by meter readings. As utilities gradually replace legacy smart grid assets with current technologies throughout the natural replacement cycle, they can seamlessly integrate into our existing communications nodes and communications platform, eliminating the need for a costly, wholesale deployment as smart grid technologies and applications continue to evolve.
Local Application Hosting and Development Framework. We have designed our communications nodes to host both Ambient-developed applications and third-party applications. By leveraging our open communications platform, excess processing power and flash memory, we can integrate smart grid applications for utilities directly into our communications nodes, expanding their overall functionality. Our open framework and flexibility provide an environment for new applications and the ability to add newly developed or tailored applications to our communications nodes even after they have been deployed. Utilities can perform central updates to our communications nodes, eliminating the need for deploying human and equipment capital, thereby providing for quick and inexpensive software updates.
Remote and Distributed Intelligence. Our communications nodes are equipped with powerful processing capabilities that allow for local management and control of smart grid data, which may be aggregated from multiple smart grid applications. Processing and storage capabilities within our communications nodes allow a utility to more efficiently manage a vast amount of distributed data.
Secure Communications. We secure our communications platform through the use of both physical tamper detection features and secure protocols that encrypt data traffic. Additionally, we are active participants in helping to establish industry standards regarding security and other technical requirements, allowing us to continually improve the security of our products.
Reduced Overall Communications Implementation and Operating Costs. We deliver our communications platform completely preconfigured to the needs of the utility, allowing for a rapid and simplified deployment. Simplifying the deployment process of smart grid applications saves utilities time and cost because the deployments of smart grid applications require a substantial human effort. Our communications nodes are deployed preconfigured and are capable of communicating with several different applications via a variety of communication technologies. As a result, no other follow-on effort is required in order to become active within a utility’s communications network. Furthermore, there is no need for a utility to develop and invest in separate, application-specific communications platforms in order to integrate all smart grid-related assets because our communications platform provides for a single network that can accommodate a variety of applications and technologies in parallel.
Our Products and Services
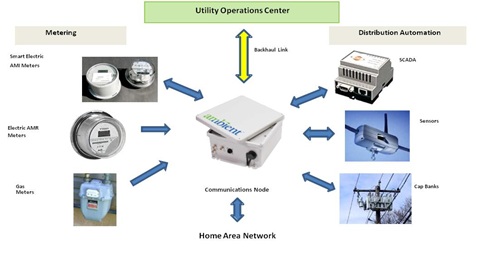
Ambient Smart Grid® Communications Nodes. Communications nodes are physical boxes that contain the hardware and software needed for communications and data collection in support of smart grid assets. We configured our communications nodes to act as individual data processors and collectors that receive signals from other networked devices, enabling smart grid applications. Our communications nodes can also contain our own or third-party embedded smart grid applications. We are currently in final testing and evaluation of our fourth-generation communications nodes. The following is a graphical depiction of how our communications nodes interact and connect with smart grid applications and the utility.
AmbientNMS® is a network management system that manages large numbers of communications nodes, devices and customers on a smart grid network. A utility can use the AmbientNMS® to effectively manage its entire smart grid distribution system, providing valuable information over a single communications network. We customize AmbientNMS®, providing a utility with the tools necessary to tailor its monitoring and processing and to act upon vast amounts of information on a real-time basis. For example, we have integrated our AmbientNMS® into an industry standard Distribution and Outage Management System (DOMS) that provides for the delivery of faster, more accurate information to power outage notification and restoration systems. This allows utilities to quickly assess and respond to power delivery issues in reduced response time, thereby better managing disruptions and enhancing system reliability. AmbientNMS® also provides the functionality to predict, and precisely control, the amount of data traffic to be used by individual devices and the communications network as a whole. Utilities can systematically push software updates to deployed communications nodes and other downstream devices.
Ambient Energy Sensing Solution. Our Energy Sensing Solution monitors critical aspects of a utility’s distribution network through measurement of current and voltage characteristics. Having the capability of measuring and monitoring power quality allows a utility to obtain real-time insight into characteristics such as power factor and general power quality, as well as the ability to quickly identify problem areas from a central location without having to deploy equipment and human capital to do so. Real-time power quality monitoring also allows utilities to better interface with their customers who may have strict tolerances associated with their power requirements, and it also can provide critical information for outage notification and restoration systems. The hardware and software used in our Energy Sensing Solution are incorporated directly into our communications nodes, creating a much more efficient use of capital and utility pole real estate.
Partial Discharge Monitoring. The same Energy Sensing technology that allows our communications platform to pull current information from the medium voltage distribution lines, also allows our communications nodes to monitor the health of the power lines. Real-time information regarding the health of buried power lines is not generally available today. Our communications platform offers utilities this information, thereby allowing utilities the ability to more-effectively maintain their underground distribution lines and manage their replacement schedules.
Maintenance and Consulting Service. We provide maintenance and implementation services to maintain the software installed within our communications platform. We can remotely distribute software upgrades and added features to deployed communications nodes within the network. We also provide a variety of consulting services relating to product development, network management services and smart grid deployment strategies. We provide maintenance and consulting services to provide a turnkey offering of our communications platform.
Duke Energy Relationship
Since 2005, we have maintained a strategic relationship with Duke Energy and we believe that we are the leading supplier of its smart grid communications technology in connection with its smart grid implementation. With what we believe is one of the most forward-looking smart grid initiatives in North America, Duke Energy announced plans to invest $1 billion over the next five years in smart grid equipment for its service territories including Ohio, Indiana, Kentucky and the Carolinas. Specifically, Duke Energy’s smart grid deployment includes digital and automated technology, such as communications nodes, smart meters and automated power delivery equipment. The following table summarizes the evolution of our relationship with Duke Energy:
|
2005
|
● |
Security and safety testing of our communications nodes
|
| |
|
|
|
2006
|
● |
Delivery of approximately 700 communications nodes for pilot deployment
|
| |
|
|
|
2008
|
● |
Commercial agreement for 9,000 communications nodes
|
| |
|
|
|
2009
|
● |
Award to Duke Energy of $204 million in ARRA digital grid stimulus funds and Duke Energy announcement of plans to invest a total of $1 billion in smart grid deployment initiatives over five years
|
| |
● |
Long-term supply agreement with Duke Energy to supply our communications nodes and services through 2015
|
| |
|
|
|
2010
|
● |
Full-scale smart grid deployment by Duke Energy in Ohio, which includes smart meters, automated power distribution equipment and a communications network encompassing more than 130,000 of our communications nodes, 700,000 electric meters and 450,000 gas meters
|
| |
● |
Deployment by Duke Energy of approximately 20,000 of our communications nodes
|
| |
|
|
|
2011
|
● |
Deployed a cumulative total of approximately 75,000 Ambient communications nodes, including approximately 3,000 of our communications nodes in the Carolinas
|
| |
● |
Total backlog of approximately $35 million as of December 31, 2011 |
Duke Energy is actively deploying thousands of our communications nodes each month and is licensing the AmbientNMS® system, specifically for its deployment in Ohio. We believe that we are the predominant provider of communications nodes and network management system software for Duke Energy’s Ohio deployment.
We believe that we have demonstrated that our technology is secure, two-way, flexible, open, scalable, reliable and cost-effective through the total deployment of approximately 105,000 communications nodes in the field with Duke Energy. We believe that Duke Energy will continue to predominantly use our communications platform for the remainder of its Ohio smart grid deployment through 2013. Furthermore, Duke Energy’s pilot deployment of approximately 3,000 communications nodes in the Carolinas predominantly uses our communications platform as well. Throughout the past five years, we have worked with Duke Energy to develop our communications platform, which has enabled Duke Energy’s ability to deploy its smart grid initiatives.
We believe that we have a substantial opportunity to grow our business with Duke Energy. In addition to the 130,000 communications nodes scheduled for deployment in Ohio, we estimate that Duke Energy would potentially require hundreds of thousands of communications nodes if it implements a full deployment of smart grid communications nodes in Indiana, Kentucky and the Carolinas. According to Duke Energy, it is currently working through the planning process to finalize full-scale deployment plans in Kentucky and the Carolinas and has filed with the North Carolina Public Utilities Commission for the required approvals. Duke Energy is using information from its North Carolina pilot programs and its Ohio deployment to enhance its customer experience in its other service territories. We believe that substantially all smart grid communications nodes deployed by Duke Energy to date are our communications nodes.
Competitive Strengths
We believe that the following competitive strengths help us to maintain a leading position in providing smart grid communications solutions to utilities:
Proven Technology. Since 2008, Duke Energy has successfully deployed our communications platform. With the deployment of approximately 75,000 communications nodes providing the connectivity for a variety of smart grid applications, we have demonstrated that our technology is quickly scalable and highly reliable. We believe that our communications nodes have met all of the strict reliability requirements of Duke Energy and have proven reliable through years of exposure to the elements. We believe that our continued ability to satisfy Duke Energy’s rigorous qualification standards and testing, as well as our proven ability to scale, provides us with an advantage over many of our competitors.
Premier Utility Customer. Duke Energy is one of the largest utilities in the United States with what we believe to be one of the most forward-looking smart grid initiatives in North America. We have served as a strategic partner of Duke Energy’s smart grid programs since 2005. Duke Energy has successfully deployed our products on a commercial scale. We believe that other utilities will adopt Duke Energy’s vision of implementing a communications platform that can accommodate a variety of smart grid applications and communications technologies, moving beyond a focus on smart meters, in order to realize the full benefits of the smart grid.
Communications Focused. Since 2000, we have maintained a focus on the development of a communications platform that meets the needs of utilities. Our commitment to this market segment allows us to focus all research and development and engineering efforts on meeting the challenges of this market and rapidly responding to customer needs. We do not design or provide equipment such as meters or home area network devices. Rather, we focus on the communications platform that enables these devices. Our focus, experience and industry know-how, built over three increasingly robust generations of our current communications platform, allow us to quickly react to the ever-changing and individualized needs of utilities, thereby providing a competitive edge over our competitors with products that may not represent their core competency.
Purpose-Built Products. Our substantial industry experience and relationship with Duke Energy have led to the development of products that are purpose-built for the harsh, outdoor environments in which utilities must operate. We have designed our equipment for direct placement onto the distribution infrastructure, which exposes it to the natural elements, without the need for an additional enclosure. Further, the internal elements of our communications nodes include, which includes hardened components, battery backups, excess surge protection and other components. Preconfigured and self-registering communications nodes allow for rapid and safe installation and eliminate the need for on-site field engineers, reducing installation time and cost.
Our Growth Strategy
Our objective is to maintain our market leadership position in providing a communications and application platform that enables a utility’s comprehensive smart grid initiatives. The following key initiatives comprise our growth strategy:
Expand Our Relationship with Duke Energy. We plan to expand our relationship with Duke Energy as it continues its smart grid deployment initiatives in additional service territories and with additional applications. We expect that, as Duke Energy deploys smart grid assets in other regions, including Indiana, Kentucky and the Carolinas, an opportunity exists for us to provide thousands of our communications nodes. Furthermore, as we continue to work with Duke Energy, we expect that we will be able to develop and provide additional product offerings.
Secure New Utility Customers. We intend to leverage our successful commercial deployment with Duke Energy to secure new domestic and international customers that are evaluating communications platforms to accommodate and integrate a variety of smart grid applications. These new customers may include utilities that have already deployed smart meter-centric systems and utilities that are still developing their smart grid plans. We intend to use this industry momentum in promoting our communications platform to the many utilities with whom we have relationships, as well as other utilities interested in an open communications architecture. We will also promote our communications platform to utilities that are limited by legacy metering technology. We believe that our technology can help utilities expand the functionality of their previously deployed smart metering initiatives, and we intend to pursue this market segment. To facilitate this initiative, we expect to substantially increase our investment in business development activities, including investing in initiatives aimed at penetrating both domestic and international markets.
Establish Strategic Relationships. We plan to form additional strategic relationships with smart grid application vendors, including meter manufacturers, distribution automation equipment manufacturers, communications providers and other key value-added providers in the smart grid industry. By establishing such relationships, we believe that we can accelerate the sales of our products. Further, by incorporating our communications platform into existing smart grid applications, we can help such providers offer a complete smart grid solution in addition to the equipment that they offer, while lowering the overall cost of deployment for a utility.
Continue Product Innovation and Development. We will continue to invest in the development of new capabilities for our communications platform in order to meet the evolving needs of utilities. For example, we have already developed Energy Sensing Solutions and Partial Discharge Monitoring that are directly integrated into our communications nodes. We will also continue to invest in expanding the functionality of our communications platform to accommodate the proprietary technologies of our competitors, thereby providing utilities with the added flexibility of utilizing multiple vendors. We have released three generations of our Ambient Smart Grid® products, and we are currently in the final testing stages of our fourth generation products, which we expect to begin shipping during 2012. With our commitment to research and development, we believe that we will provide significantly improved products with greater functionality delivered at lower cost than previously released products.
Sales and Marketing
We believe that the successful deployment of Duke Energy’s smart grid implementation in Ohio, which includes our communications platform, will result in other utilities adopting similar smart grid strategies to fully realize the benefits of the smart grid. We expect to leverage this success in order to acquire new utility customers. We expect to increase selling, marketing and business development activities, including the hire of additional personnel, to secure new customers domestically and internationally.
Given the strategic impact of smart grid applications on a utility, a utility’s decision-making process typically involves top-level executives and large multi-functional teams across many organizational layers. Utilities generally undertake extensive budgeting, procurement, competitive bidding, technical and performance review activities. Additionally, utilities often seek regulatory approval for projects if they expect to recover project costs through customer rate base increases. Such regulatory approval processes can be lengthy. A typical sales cycle with a new utility can take 12 months or more, depending on the size of the utility and the smart grid initiatives it intends to deploy. Utilities generally conduct both lab testing and field pilots to verify the functionality of products prior to awarding a contract for a larger deployment. However, based upon our experience with pilot programs with Duke Energy and the flexible nature of our communications platform, we believe that we are well positioned to effectively execute such pilot programs. Furthermore, new customers can learn how our technology is deployed within Duke Energy’s territories. For example, our communications platform is profiled at Duke Energy’s Envision Center in Ohio where prospective customers can observe the integration of our technology into Duke Energy’s smart grid initiatives. Furthermore, prospective customers can gain a better understanding of the potential financial benefits of a smart grid related project as documented in the results of an independent third-party audit conducted at the request of the Public Utility Commission of Ohio relating to Duke Energy’s Ohio smart grid project progress to date.
Strategic Alliances and Relationships
We believe that we possess the internal resources for the further development of our technology. However, we have, and will continue to develop, relationships with certain suppliers, smart grid equipment manufacturers and wireless communication providers to ensure that we can offer competitive products to support our business development initiatives. Specifically, we have established relationships with certain component suppliers, such as Qualcomm, Sierra Wireless and Novatel Wireless. We have also entered into joint marketing agreements with certain wireless communication providers, including Verizon Wireless and Sprint.
As an example of our efforts to improve the interoperability of our communications platform with various smart grid applications, we have entered into an Interoperability and Co-Marketing Agreement with Tollgrade Communications, Inc., a leading provider of network assurance solutions for the telecommunications and utility industries, which allows us to incorporate its LightHouse™ centralized remote monitoring system for electric power utilities and also provides for the opportunity to develop additional technologies.
Research and Development
The majority of our employees are engaged in product research and development activities. We also engage independent contractors to provide research and development services. Research and development is critical to ensure the continued success and growth of our business. We plan to expand our research and development activities, including hiring additional personnel. We also intend to continue to work with our customers so that we can continue to develop and provide additional product offerings.
We incurred research and development expenses of approximately $4.9 million in 2009, $6.2 million in 2010 and $11.7 million in 2011.
Intellectual Property
We currently rely upon a combination of trade secrets, patents, copyrights and trademarks, as well as non-disclosure agreements and invention assignment agreements, to protect our technologies and other proprietary company information. As of December 31, 2011, our intellectual property portfolio included 26 patents issued or allowed by the United States Patent and Trademark Office, (USPTO) and we have 5 pending patent applications in the United States. We have also filed many of our U.S. patents in various foreign jurisdictions, and expect that we will file our U.S. pending patent applications in foreign jurisdictions as well. Approximately half of our issued and pending U.S. patents relate to our legacy utilities communications technologies, and the other half relate to our communications platform, including our Energy Sensing Solution. Our issued U.S. patents will expire between 2020 and 2029. Ambient®, Ambient Smart Grid®, Communications for a Smarter Grid® and AmbientNMS® are registered trademarks of Ambient Corporation with the USPTO. We have other marks registered and pending with the USPTO.
Our policy is to require our employees, consultants, advisors and collaborators to execute confidentiality agreements. Additionally, we require our employees and consultants to execute assignment of invention agreements upon the commencement of employment, consulting or advisory relationships. These agreements generally provide that all confidential information developed or made known to a party by us during the course of the party’s association with our company is to be kept confidential and not to be disclosed to third parties except in specific circumstances. In the case of employees and consultants, the agreements also provide that all inventions conceived by the individuals in the course of their employment or consulting relationship will be our exclusive property.
Employees
As of December 31, 2011, we had 88 full-time employees. Almost of all of our employees are located at our Newton, Massachusetts headquarters, and we have three field engineers located at various Duke Energy locations. None of our employees are covered by collective bargaining agreements. We have never experienced any work stoppages and consider our relations with our employees to be good.
We have had a contract with Insperity, formerly known as Administaff, which is a professional employment organization. Pursuant to this contract, we and Insperity were co-employers of our personnel. Insperity was responsible for paying the salaries and wages of our personnel and providing our personnel with health, dental and various other types of insurance and benefits at favorable rates for which we would not otherwise qualify. Insperity paid salaries and wages of our personnel directly from our bank accounts, and we paid Insperity a fee for its services.
As of January 1, 2012, we terminated our contract with Insperity and currently administer our human resource related activities internally.
Manufacturing and Assembly
We have a Master Supply and Alliance Agreement with Bel Fuse Inc., a global producer of high-quality electronic components, for the manufacture and assembly of our communications nodes. We leverage the capabilities of Bel Fuse Inc. with respect to its low-cost, global manufacturing capabilities, supply-chain management and engineering expertise. As we continue to value engineer our communications nodes, deliver higher volumes and source alternative key components, we believe that we will continue to reduce our production costs.
Our products are made to order and are shipped directly to our customer’s warehouses in the United States. We purchase components, such as power cords, brackets and other accessories, which typically are shipped directly to our customer. In order to minimize total cost and limit our exposure of excess inventory, we typically do not hold significant amounts of finished goods or component materials at any given time.
Competition
Competition in the smart grid market is increasing and involves evolving technologies, developing industry standards, frequent new product introductions, changes in customer or regulatory requirements and localized market requirements. Competitive pressures require us to keep pace with the evolving needs of utilities; to continue to develop and introduce new products, features and services in a timely, efficient and cost-effective manner; and to stay abreast of regulatory factors affecting the utility industry.
We compete with a wide array of manufacturers, vendors, strategic alliances, systems developers and other businesses. These include smart grid communications technology companies, ranging from relatively smaller companies focusing mainly on communications technology to large Internet, hardware and software companies. In addition, some providers of smart meters may add communications capabilities in the future to provide some level of connectivity to the utility’s back office.
Some of our present and potential future competitors have, or may have, greater name recognition, experience and customer bases, as well as substantially greater financial, technical, sales, marketing, manufacturing and other resources than we possess and that afford them competitive advantages. These potential competitors may undertake more extensive marketing campaigns, adopt more aggressive pricing policies, obtain more favorable pricing from suppliers and manufacturers and exert more influence on sales channels than we do. Competitors may sell products at lower prices in order to obtain market share. Competitors may be able to respond more quickly than we can to new or emerging technologies and changes in customer requirements. Competitors may also be able to devote greater resources to the development, promotion and sale of their products and services than we can. Competitors may introduce products and services that are more cost-efficient, provide superior performance or achieve greater market acceptance than our products and services. Other companies may also drive technological innovation and develop products that are equal or superior in quality and performance to our products and render our products non-competitive or obsolete.
We believe that we compete effectively in the market based on a number of factors. These factors include the proven technology of our communications platform, our successful commercial deployments with Duke Energy, our focus on our communications platform, our scalable and interoperable products that we have purpose-built for the utility environment and our competitive cost of ownership. However, we may have to change our product offerings, invest more heavily in research and development or business development or acquire complementary technologies in order to remain competitive in the future.
AVAILABLE INFORMATION
Our annual report on Form 10-K, quarterly reports on Form 10-Q, current reports on Form 8-K, and all amendments to those reports are made available free of charge though our internet website (http://www.ambientcorp.com) as soon as practicable after such material is electronically filed with, or furnished to, the Securities and Exchange Commission. Except as otherwise stated in these documents, the information contained on our website or available by hyperlink from our website is not incorporated by reference into this report or any other documents we file with or furnish to the Securities and Exchange Commission.
ITEM 1A. RISK FACTORS
Our business, financial condition and results of operations could be materially adversely affected by various risks, including, but not limited to the principal risks noted below.
We currently depend on one customer for substantially all of our revenue, and any material delay, reduction or cancellation of orders from this customer would significantly reduce our revenue and have a material negative impact on our business.
Duke Energy accounted for all of our revenue for each of our last three fiscal years. Any material delay, reduction or cancellation of orders from Duke Energy would have a material adverse effect on our business, including significantly reduced revenue, unabsorbed overhead and incurred net losses.
Although we have a long-term contract that stipulates the general terms of our relationship, Duke Energy does not provide us with firm purchase commitments for the duration of the contract. Instead, Duke Energy provides us with 12-month rolling order forecasts and periodic purchase orders. Duke Energy can delay, reduce or cancel purchase orders at any time prior to the anticipated lead time for delivery of the products (typically three months), subject to Duke Energy’s payment of a cancellation fee not to exceed the price of the products cancelled. Duke Energy may also delay, reduce or cancel its purchase orders without penalty if we are unable to deliver the products ordered thereunder within a specified time from the scheduled delivery date.
Our immediate business opportunities continue to be primarily dependent on the success of our deployments with Duke Energy and the future decisions of Duke Energy relating to its smart grid deployment in its service territories. Our goal is to increase our business with Duke Energy and to attract new customers. We may not achieve this goal within an acceptable period of time or at all. The failure to increase our business with Duke Energy or to attract new customers would have a material adverse effect on our business and prospects.
In January 2011, Duke Energy and Progress Energy announced a proposed merger that is subject to stockholder and regulatory approval. Since the merger of Duke Energy and Progress Energy is complex and each company has its own smart grid related investment plans, we are unable to assess the effects, if any, that the proposed merger, or delays in the proposed merger, will have on our business. The proposed merger has taken longer to consummate than originally planned. We cannot assure you that the post-merger entity will continue or expand its business with us.
We have a limited history of profitability on an annual basis, and we may be unable to achieve or maintain profitability in future periods.
Fiscal year 2011 was our first full year of profitability. We may not, however, be able to maintain profitability in future fiscal years. At December 31, 2011, we had an accumulated deficit of $221.4 million. To grow our revenue and customer base, we also plan to increase spending associated with research and development and business development, thereby increasing our operating expenses. These increased costs may cause us to incur net losses in the foreseeable future, and we may be unable to grow our revenue and expand our customer base to maintain profitability on an annual basis
We depend on factors affecting the utility industry.
We expect to continue to derive substantially all of our revenue from sales of products to utilities. Purchases of our products may be deferred as a result of many factors, including economic downturns, slowdowns in new residential and commercial construction, access to capital at acceptable terms, utility specific financial circumstances, mergers and acquisitions, regulatory decisions, weather conditions and interest rates. We may experience variability in operating results on an annual and a quarterly basis as a result of these factors.
Utility industry sales cycles can be lengthy and unpredictable, which can negatively impact our ability to expand the deployment of our products with Duke Energy and to secure new customers.
Sales cycles for smart grid projects are generally long and unpredictable due to budgeting, procurement and regulatory approval processes that can take up to several years to complete. Utility customers typically issue requests for quotes and proposals, establish evaluation committees, review different technical options, require pilot programs prior to commercial deployments, analyze cost and benefit metrics, consider regulatory factors and follow their normal budget approval processes. In addition, many electric utilities tend to be risk averse and tend to follow industry trends rather than be the first to purchase new products or services. These tendencies can extend the lead time for, or prevent acceptance of, new products or services, including those for smart grid initiatives despite the support of the federal government through grants and other incentives.
Accordingly, potential customers may take longer to reach a decision to initiate smart grid programs or to purchase our products or services. It is not unusual for a utility customer to go through the entire sales process and not accept any proposal or quote. This extended sales process requires the dedication of significant time by our personnel to develop relationships at various levels and within various departments of utilities and our use of significant financial resources, with no certainty of success or recovery of our related expenses. Long and unpredictable sales cycles with utility customers could have a material adverse effect on our business, operating results or our financial condition.
The market for our products and services, and smart grid technology generally, is still developing and we will have difficulty expanding our business and securing new customers if the market develops less extensively or more slowly than we expect.
The market for our products and services, and smart grid technology generally, is still developing, and it is uncertain whether our products and services will achieve and sustain high levels of demand and market acceptance. Our success will depend to a substantial extent on the willingness and ability of utilities to implement smart grid technology. Many utilities lack the financial resources and/or technical expertise required to evaluate, deploy and operate smart grid technology. Regulatory agencies, including public utility commissions, govern utilities’ activities, and they may not create a regulatory environment that is conducive to the implementation of smart grid technologies in a particular jurisdiction. Furthermore, some utilities may be reluctant or unwilling to adopt smart grid technology because they may be unable to develop a business case to justify the up-front and ongoing expenditures. If utilities do not widely adopt smart grid technologies or do so more slowly than we expect, we will have difficulty expanding our business and securing new customers, which will adversely affect our business and operating results.
Because the markets for our products are highly competitive, we may lose sales to our competitors, which would harm our revenue and operating results.
Competition in the smart grid market is intense and involves rapidly changing technologies, evolving industry standards, frequent new product introductions, changes in customer or regulatory requirements and localized market requirements. Competitive pressures require us to keep pace with the evolving needs of utilities; to continue to develop and introduce new products, features and services in a timely, efficient and cost-effective manner; and to stay abreast of regulatory factors affecting the utility industry.
We compete with a wide array of manufacturers, vendors, strategic alliances, systems developers and other businesses, including other smart grid communications technology companies, ranging from relatively smaller companies focusing mainly on communications technology to large Internet and software-based companies. In addition, some providers of smart meters may add communications capabilities to their existing business in the future, which could decrease our base of potential customers and could decrease our revenue and profitability. “Early adopters,” or customers that have sought out new technologies and services, have largely comprised the target market for our products. Because the number of early adopters is limited, we will need to expand our target markets by marketing and selling our products to mainstream customers to continue our growth.
Some of our present and potential future competitors have, or may have, greater name recognition, experience and customer bases as well as substantially greater financial, technical, sales, marketing, manufacturing and other resources than we possess and that afforded them competitive advantages. These potential competitors may undertake more extensive marketing campaigns, adopt more aggressive pricing policies, obtain more favorable pricing from suppliers and manufacturers and exert more influence on sales channels than we do. Competitors may sell products at lower prices in order to obtain market share. Competitors may be able to respond more quickly than we can to new or emerging technologies and changes in customer requirements. Competitors may also be able to devote greater resources to the development, promotion and sale of their products and services than we can. Competitors may introduce products and services that are more cost-efficient, provide superior performance or achieve greater market acceptance than our products and services. Our competitors may make strategic acquisitions or establish cooperative relationships among themselves or with third parties that enhance their ability to address the needs of our prospective customers. It is possible that new competitors or alliances among current and new competitors may emerge and rapidly gain significant market share. Other companies may also drive technological innovation and develop products that are equal or superior in quality and performance to our products and render our products non-competitive or obsolete.
Any of these competitive factors could make it more difficult for us to attract and retain customers, cause us to lower our prices in order to compete and reduce our market share and revenue, any of which could have a material adverse effect on our operating results and financial condition. If we fail to compete successfully with current or future competitors, we could experience material adverse effects on our business, financial condition, results of operations and cash flows.
If we are unable to keep pace with technological innovations and are unable to continue to develop new products and product enhancements, we may be unable to expand our business with Duke Energy or secure new customers.
We operate in a new and evolving market. Technological advances, the introduction of new products, evolving industry standards, changing industry preferences and changes in utility industry regulatory requirements could adversely affect our business unless we are able to adapt to the changing conditions. Technological advances or changing industry preferences could render our products less desirable or obsolete, and we may not be able to respond effectively to the requirements of evolving market conditions. As a result, we may need to commit significant financial and other resources to the following:
| |
|
|
| |
●
|
engaging additional engineering and other technical personnel;
|
| |
●
|
continuing research and development activities on existing and potential products;
|
| |
●
|
maintaining and enhancing our technological capabilities;
|
| |
●
|
pursuing innovative development of new products and technologies;
|
| |
●
|
designing and developing new products and product enhancements that appeal to customers;
|
| |
●
|
meeting the expectations of our customers in terms of product design, cost, performance and service;
|
| |
●
|
responding to changing industry preferences;
|
| |
●
|
maintaining efficient, timely and cost-effective manufacturing resources of our products; and
|
| |
●
|
achieving customer acceptance of our products and technologies.
|
Our future success depends on our ability to address the changing market needs by developing and introducing new products and product updates that compare favorably on the basis of timely introduction, cost and performance with the products of competitive suppliers and evolving technologies. We must also extend and keep pace with technological developments and emerging industry standards that address the needs of customers. We intend to commit substantial resources to developing new products, product enhancements and technological advances for the smart grid market. The smart grid market is relatively new, and industry standards for this market are evolving and changing. If the smart grid market does not develop as anticipated, or if demand for our products in this market does not materialize or occurs more slowly than we expect, we will have expended substantial resources and capital without realizing sufficient revenue, which will adversely affect our business and operating results.
Existing and future regulations concerning the electric utility industry may present technical, regulatory and economic barriers that may significantly impact future demand for our products.
International, federal, state and local government regulations and policies, as well as internal policies and regulations promulgated by electric utilities, heavily influence the market for the electric utility industry. These regulations and policies often relate to investment initiatives, including decisions relating to investment in smart grid technologies, as well as building codes, public safety regulations and licensing requirements. In addition, certain of our contracts with our potential utility customers may be subject to approval by federal, state or local regulatory agencies, which may not be obtained or be issued on a timely basis. In the United States and in a number of other countries, these regulations and policies are being modified and may continue to be modified and have a substantial impact on the market for our and other smart grid related technologies. If such regulations or policies do not continue to gain acceptance for smart grid initiatives or the adoption of such initiatives takes substantially longer than expected, our prospects for developing new customers could be significantly limited.
Duke Energy and some potential utility customers have applied for government grants and may also seek to participate in other government incentive programs, and if those grants or other incentives are not received or are significantly delayed, our results of operations could suffer.
Many utilities, including Duke Energy and some of our potential utility customers, have applied for grants and may seek to participate in other government incentive programs designed to stimulate the U.S. economy and support environmental initiatives, including smart grid technologies. In certain cases, such as with the American Reinvestment and Recovery Act of 2009, or ARRA, the U.S. government has approved the funds, and the government and the utilities have entered into agreements under which the government has agreed to award funds to the utilities, but significant portions of the funds have not yet been distributed. Furthermore, such funds must be spent by the end of 2013 or awards will not be further funded, which could reduce the demand for smart gird related products beyond 2013. Duke Energy has applied for and been granted funding under ARRA programs, which may account for a significant portion of our current and anticipated future revenue and billings. Duke Energy and our potential utility customers that seek these government grants or incentives may delay or condition the purchase of our products and services upon receipt of such funds or upon their confidence in the future disbursement and tax treatment of those funds. If Duke Energy and our potential utility customers do not receive these funds or if their receipt of funds is significantly delayed, our operating results could suffer. Similarly, the receipt of government funds or incentives may be conditioned upon utilities meeting milestones and other requirements, some of which may not be known until a future point in time. If our products and services do not meet the requirements necessary for receipt of government funds or other incentives, Duke Energy and our potential utility customers may delay or condition the purchase of our products and services until they meet these requirements, and our results of operations could suffer. Furthermore, there may not be government funds or incentives for utilities in future periods. As a result, Duke Energy and our potential utility customers may not have the resources or incentives to purchase our products and services in those future periods.
The adoption of industry standards applicable to our products or services could limit our ability to compete in the marketplace.
Standards bodies, which are formal and informal associations that seek to establish voluntary, non-governmental product and technology standards, are influential in the United States and abroad. We participate in voluntary standards organizations in order to both help promote non-proprietary, open standards for interoperability with our products and to prevent the adoption of exclusionary standards. However, we are not able to control the content of adopted voluntary standards and do not have the resources to participate in all voluntary standards processes that may affect our markets. The adoption, or expected adoption, of voluntary standards that are incompatible with our products or technology or that favor our competitors’ products or technology could limit the market opportunity for our products and services or render them obsolete, any of which could materially and adversely affect our revenue, results of operations and financial condition.
If we become subject to product returns and product liability claims resulting from defects in our products, we may fail to achieve market acceptance of our products, and our business could be harmed.
We develop complex products for use in an evolving marketplace and generally warrant our products for a period of 12 months from the date of sale. Despite testing by us and customers, our products may contain or may be alleged to contain undetected errors or failures. In addition, a customer or its installation partners may improperly install or implement our products. The integration of our products in smart grid networks or applications may entail the risk of product liability or warranty claims based on disruption to these networks or applications. Any such manufacturing errors or product defects could result in a delay in recognition or loss of revenue, loss of market share or failure to achieve market acceptance. Additionally, these defects could result in financial or other damages to a customer; cause us to incur significant warranty, support and repair costs; and divert the attention of our engineering personnel from our product development efforts. A product liability claim brought against us, even if unsuccessful, would likely be time-consuming and costly to defend. The occurrence of these problems would likely harm our business.
We currently maintain property, general commercial liability, errors and omissions and other lines of insurance. Such insurance may be insufficient in amount to cover any particular claim, or we might not carry insurance that covers a specific claim. In addition, such insurance may not be available in the future or the cost of such insurance may increase substantially.
Our ability to provide bid bonds, performance bonds or letters of credit may be limited and could negatively affect our ability to bid on or enter into significant long-term agreements.
We may be required to provide bid bonds or performance bonds to secure our performance under customer contracts or, in some cases, as a prerequisite to submit a bid on a potential project. Our ability to obtain such bonds will depend upon our capitalization, working capital, past performance, management expertise and reputation, and external factors beyond our control, including the overall capacity of the surety market. Surety companies consider those factors in relation to the amount of our tangible net worth and other underwriting standards that may change from time to time. Surety companies may require that we collateralize a percentage of the bond with our cash or other form of credit enhancement. Events that affect surety markets generally may result in bonding becoming more difficult to obtain in the future, or being available only at a significantly greater cost. In addition, utilities may require collateral guarantees in the form of letters of credit to secure performance or to fund possible damages as the result of an event of default under any contracts with them. If we enter into significant long-term agreements that require the issuance of letters of credit, our liquidity could be negatively impacted. Our inability to obtain adequate bonding or letters of credit and, as a result, to bid or enter into significant long-term agreements, could have a material adverse effect on our ability to effectively compete and could impact our future business.
We currently rely on a single contract manufacturer to produce our products, and a loss of our sole contract manufacturer or its inability to satisfy our quality and other requirements could severely disrupt the production and supply of our products.
We utilize one contract manufacturer for all of our production requirements. This manufacturing is conducted in China by a U.S.-based company that also performs services for numerous other companies. We depend on our manufacturer to maintain high levels of productivity and satisfactory delivery schedules. Our reliance on our manufacturer reduces our control over the manufacturing process, exposing us to risks, including reduced control over quality assurance, product costs and product supply. Any financial, operational or other difficulties involving our manufacturer could adversely affect us. We provide our manufacturer with up to 12-month rolling forecasts of our production requirements. We do not, however, have long-term agreements with our manufacturer that guarantees production capacity, prices, lead times or delivery schedules. Since our manufacturer serves other customers, a number of which have greater production requirements than we do, our manufacturer could determine to prioritize production capacity for other customers or reduce or eliminate production for us on short notice. We could also encounter lower manufacturing productivity and longer delivery schedules in commencing volume production of new products. Any of these problems could result in our inability to deliver our products in a timely manner and adversely affect our operating results. The loss of our relationship with our manufacturer or its inability to conduct its manufacturing services for us as anticipated in terms of cost, quality and timeliness could adversely affect our ability to fill customer orders in accordance with required delivery, quality and performance requirements. If this were to occur, the resulting decline in revenue would harm our business.
If any one of these risks materializes, it could significantly impact our operations and our ability to fulfill our obligations under purchase orders with Duke Energy as well as future orders from Duke Energy or other customers. Qualifying new manufacturers is time consuming and might result in unforeseen manufacturing and operational problems. If we had to transition to an alternative contract manufacturer we could experience operational delays, increased product costs and increased operating costs which could irreparably harm our relationship with Duke Energy, harm our reputation and could potentially impact our ability to secure new customers.
Shortages of components and materials may delay or reduce our sales and increase our costs, thereby harming our results of operations.
The inability of our manufacturer to obtain sufficient quantities of components and other materials necessary for the production of our products could result in reduced or delayed sales or lost orders. Any delay in or loss of sales could adversely impact our operating results. Some of the materials used in the production of our products are available from a limited number of foreign suppliers, particularly suppliers located in Asia. In most cases, neither we nor our manufacturer has long-term supply contracts with these suppliers. As a result, we are subject to increased costs, supply interruptions and difficulties in obtaining materials.
Security breaches involving our smart grid products or services, publicized breaches in smart grid products and services offered by others or the public perception of security risks or vulnerability created by the deployment of the smart grid in general, whether or not valid, could harm our business.
The security technologies we have integrated into our communications platform and products that are designed to detect unauthorized activity and prevent or minimize security breaches may not function as expected and our products and services, those of other companies with whose products our products and services are integrated or interact, or even the products of other smart grid solutions providers may be subject to significant real or perceived security breaches.
Our communications platform allows utilities to monitor, compile and analyze sensitive information related to consumers’ energy usage, as well as the performance of different parts of the electric power distribution grid. As part of our data transfer and managed services, we may store and/or come into contact with sensitive consumer information and data when we perform operational, installation or maintenance functions for a utility customer. If, in handling this information, we, our partners or a utility customer fails to comply with privacy or security laws, we could face significant legal and financial exposure to claims of government agencies, utility customers and consumers whose privacy is compromised. Even the perception that we, our partners or a utility customer has improperly handled sensitive, confidential information could have a negative effect on our business. In addition, third parties may, through computer viruses, physical or electronic break-ins and other means, attempt to breach our security measures or inappropriately use or access our AmbientNMS® or the communications nodes we have in the field. If a breach is successful, sensitive information may be improperly obtained, manipulated or corrupted, and we may face legal and financial exposure. In addition, a breach could lead to a loss of confidence in our products and services, and our business could suffer.
Our current and anticipated future products and services allow authorized personnel to remotely control equipment at residential and commercial locations, as well as at various points on the grid. For example, our software could allow a utility to remotely connect and disconnect electricity at specific customer locations. If an unauthorized third party were to breach our security measures and disrupt, gain access to, or take control of, any of our products or services, our business and reputation could be severely harmed.
Our products and services may also be integrated or interface with products and services sold by third parties, and rely on the security of those products and their secure transmission of proprietary data over the Internet and other networks. Because we do not have control over the security measures implemented by third parties in their products or in the transmission of data over the Internet and other networks, we cannot ensure the complete integrity or security of such third-party products and transmissions.
Concerns about security or customer privacy may result in the adoption of state or federal legislation that restricts the implementation of smart grid technology or requires us to make modifications to our products, which could significantly limit the deployment of our technologies or result in significant expense to modify our products.
Any real or perceived security breach could seriously harm our reputation and result in significant legal and financial exposure, inhibit market acceptance of our products and services, halt or delay the deployment by utilities of our products and services, cause us to lose sales, trigger unfavorable legislation and regulatory action and inhibit the growth of the overall market for smart grid products and services. Any of these risks could have a material adverse effect on our business, operating results and financial condition.
Developments in data protection laws and regulations may affect technology relating to smart grid products and solutions, which could adversely affect the demand for our products and services.
Our products and services may be subject to data protection laws and regulations that impose a general framework for the collection, processing and use of personal data. Our communications platform relies on the transfer of data relating to individual energy use and may be affected by these laws and regulations. It is unclear how the regulations governing the transfer of personal data in connection with privacy requirements will further develop in the United States and internationally, and to what extent this may affect technology relating to smart grid products and services. This could have a material adverse effect on our business, financial condition and results of operations.
We use some open source software in our products and services that may subject our products and services to general release or require us to re-engineer our products and services, which may cause harm to our business.
We use some open source software in connection with our products and services. From time to time, companies that incorporate open source software into their products have faced claims challenging the ownership of open source software and/or compliance with open source license terms. Therefore, we could be subject to suits by parties claiming ownership of what we believe to be open source software or noncompliance with open source licensing terms. Some open source software licenses require users who distribute open source software as part of their software to publicly disclose all or part of the source code to such software and/or make available any derivative works of the open source code on unfavorable terms or at no cost. We monitor the use of open source software in our products and services and try to ensure that none of the open source software is used in a manner that would require us to disclose the source code to the related product or that would otherwise breach the terms of an open source agreement. However, such use could inadvertently occur and we may be required to release our proprietary source code, pay damages for breach of contract, re-engineer our products, discontinue the sale of our products in the event re-engineering cannot be accomplished on a timely basis or take other remedial action that may divert resources away from our development efforts, any of which could adversely affect our business, operating results and financial condition.
Our quarterly results are inherently unpredictable and subject to substantial fluctuations, and, as a result, we may fail to meet the expectations of securities analysts and investors, which could adversely affect the trading price of our common stock.
Our revenue and other operating results may vary significantly from quarter to quarter as a result of a number of factors, many of which are outside of our control. While our revenue has increased in recent periods, there can be no assurances that our revenue will continue to increase or will not decrease on a quarterly or annual basis.
The factors that may affect the unpredictability of our quarterly results and cause our stock price to fluctuate include the following:
| |
|
|
| |
●
|
long, and sometimes unpredictable, sales and customer deployment cycles;
|
| |
●
|
changes in the mix of products and services sold;
|
| |
●
|
our dependence on a single customer;
|
| |
●
|
changing market conditions;
|
| |
●
|
changes in the competitive environment;
|
| |
●
|
failures of our products or components that we use in our products that delay deployments, harm our reputation or result in high warranty costs, contractual penalties or terminations;
|
| |
●
|
product or project failures by third-party vendors, utility customers or competitors that result in the cancellation, slowing down or deferring of projects;
|
| |
●
|
liquidated damage provisions in our current or future contracts, which could result in significant penalties if triggered or, even if not triggered, could affect our ability to recognize revenue in a given period;
|
| |
●
|
the ability of our suppliers and manufacturers to deliver supplies and products to us on a timely basis;
|
| |
●
|
delays associated with government funding programs for smart grid projects;
|
| |
●
|
political and consumer sentiment and the related impact on the scope and timing of smart grid deployment; and
|
| |
●
|
economic, regulatory and political conditions in the markets where we operate or anticipate operating.
|
As a result, we believe that quarter to quarter comparisons of operating results are not necessarily indicative of what our future performance will be. In future quarters, our operating results may be below the expectations of securities analysts or investors, in which case the price of our common stock may decline.
Negative economic conditions in the United States and globally may have a material and adverse effect on our operating results, cash flow and financial condition.
The economies in the United States and countries around the world have been recovering from a global financial crisis and recession, which began in 2008, but financial markets and world economies continue to be volatile. Significant long-term effects will likely result from the financial crisis and recession, including slower and more volatile future global economic growth than during the years prior to the financial crisis of 2008. A lower future economic growth rate could result in reductions in sales of our products and services, slower adoption of new technologies and an increase price competition. Any of these events would likely harm our business, results of operations and financial condition.
International manufacturing and sales risks could adversely affect our operating results.
Our products are produced in China by a U.S.-based, third-party contract manufacturer. We may also expand our addressable market by pursuing opportunities to sell our products in international markets. We have had no experience operating in markets outside of the United States. Accordingly, new markets may require us to respond to new and unanticipated regulatory, marketing, sales and other challenges. We may not be successful in responding to these and other challenges that we may face as we enter and attempt to expand in international markets. International operations also entail a variety of other risks. The manufacture of our products abroad and our potential expansion into international markets expose us to various economic, political and other risks that could adversely affect our operations and operating results, including the following:
| |
●
|
potentially reduced protection for intellectual property rights;
|
| |
●
|
political, social or economic instability in certain parts of the world;
|
| |
●
|
unexpected changes in legislature or regulatory requirements of foreign countries;
|
| |
●
|
differing labor regulations;
|
| |
●
|
tariffs and duties and other trade barrier restrictions;
|
| |
●
|
possible employee turnover or labor unrest;
|
| |
●
|
the burdens and costs of compliance with a variety of foreign laws;
|
| |
●
|
currency exchange fluctuations;
|
| |
●
|
potentially adverse tax consequences; and
|
| |
●
|
potentially longer payment cycles and greater difficulty in accounts receivable collections.
|
International operations are also subject to general geopolitical risks, such as political, social and economic instability and changes in diplomatic and trade relations. One or more of these factors could adversely affect any international operations and result in lower revenue than we expect and could significantly affect our profitability.
Growth in our business may be impacted if international trade is hindered, disrupted or economically disadvantaged.
Political and economic conditions abroad may adversely affect the foreign production of our products as well as the sale of our products if we expand our business internationally. Protectionist trade legislation in either the United States or foreign countries, such as a change in the current tariff structures, export or import compliance laws or other trade policies, could adversely affect our ability to obtain product production from foreign manufacturers and to sell our products in foreign countries.
Changes in policies by the U.S. or foreign governments resulting in, among other things, higher taxation, currency conversion limitations, restrictions on the transfer of funds or the expropriation of private enterprises also could have a material adverse effect on us. Any actions by countries in which we conduct business to reverse policies that encourage foreign investment or foreign trade also could adversely affect our operating results. In addition, U.S. trade policies, such as “most favored nation” status and trade preferences for certain Asian nations, could affect the attractiveness of our services to our U.S. customers and adversely impact our operating results.
Our operating results could be adversely affected by fluctuations in the value of the U.S. dollar against foreign currencies.
We currently transact business in U.S. dollars with our U.S.-based manufacturer that produces our products in China. A weakening of the dollar could cause our overseas manufacturer to require renegotiation of either the prices or currency we pay for its services. In the future, our manufacturer and international customers, if any, could negotiate pricing and make or require payments in non-U.S. currencies.
If our overseas vendors or customers require us to transact business in non-U.S. currencies, fluctuations in foreign currency exchange rates could affect our cost of goods, operating expenses and operating margins and could result in exchange losses. In addition, currency devaluation can result in a loss to us if we hold deposits of that currency. Hedging foreign currencies can be difficult, especially if the currency is not freely traded. We cannot predict the impact of future exchange rate fluctuations on our operating results. We currently do not hedge any foreign currencies.
Our inability to protect our intellectual property could impair our competitive advantage, reduce our revenue and increase our costs.
Our success and ability to compete depend in part on our ability to maintain the proprietary aspects of our technologies and products. We rely on a combination of trade secrets, patents, copyrights, trademarks, confidentiality agreements and other contractual provisions to protect our intellectual property, but these measures may provide only limited protection. We generally enter into written confidentiality and non-disclosure agreements with our employees, consultants, customers, manufacturers and other recipients of our technologies and products and assignment of invention agreements with our employees and consultants. We may not always be able to enforce these agreements and may fail to enter into any such agreement in every instance when appropriate. We license from third parties certain technology used in and for our products. These third-party licenses are granted with restrictions; therefore, such third-party technology may not remain available to us on terms beneficial to us. Our failure to enforce and protect our intellectual property rights or obtain from third parties the right to use necessary technology could have a material adverse effect on our business, operating results and financial condition. In addition, the laws of some foreign countries do not protect proprietary rights as fully as do the laws of the United States.
Patents may not issue from the patent applications that we have filed or may file in the future. Our issued patents may be challenged, invalidated or circumvented, and claims of our patents may not be of sufficient scope or strength, or issued in the proper geographic regions, to provide meaningful protection or any commercial advantage. We have not applied for, and do not have, any copyright registration on our technologies or products. We have applied to register certain of our trademarks in the United States and other countries. We cannot assure you that we will obtain registrations of principle or other trademarks in key markets. Failure to obtain registrations could compromise our ability to protect fully our trademarks and brands and could increase the risk of challenge from third parties to our use of our trademarks and brands.
We may be required to incur substantial expenses and divert management attention and resources in defending intellectual property litigation against us.
We cannot be certain that our technologies and products do not and will not infringe issued patents or other proprietary rights of others. While we are not currently subject to any infringement claim, any future claim, with or without merit, could result in significant litigation costs and diversion of resources, including the attention of management, and could require us to enter into royalty and licensing agreements, any of which could have a material adverse effect on our business. We may not be able to obtain such licenses on commercially reasonable terms, if at all, or the terms of any offered licenses may be unacceptable to us. If forced to cease using such technology, we may be unable to develop or obtain alternate technology. Accordingly, an adverse determination in a judicial or administrative proceeding or failure to obtain necessary licenses could prevent us from manufacturing, using or selling certain of our products, which could have a material adverse effect on our business, operating results, and financial condition.
Furthermore, parties making such claims could secure a judgment awarding substantial damages, as well as injunctive or other equitable relief that could effectively block our ability to make, use or sell our products in the United States or abroad. Such a judgment could have a material adverse effect on our business, operating results and financial condition. In addition, we are obligated under certain agreements to indemnify the other party in connection with infringement by us of the proprietary rights of third parties. In the event we are required to indemnify parties under these agreements, it could have a material adverse effect on our business, financial condition and results of operations.
We may incur substantial expenses and divert management resources in prosecuting others for their unauthorized use of our intellectual property rights.
Other companies, including our competitors, may develop technologies that are similar or superior to our technologies, duplicate our technologies or design around our patents and may have or obtain patents or other proprietary rights that would prevent, limit or interfere with our ability to make, use or sell our products. Effective intellectual property protection may be unavailable or limited in some foreign countries in which we may do business, such as China. Unauthorized parties may attempt to copy or otherwise use aspects of our technologies and products that we regard as proprietary. Our means of protecting our proprietary rights in the United States or abroad may not be adequate or competitors may independently develop similar technologies. If our intellectual property protection is insufficient to protect our intellectual property rights, we could face increased competition in the market for our technologies and products.
Should any of our competitors file patent applications or obtain patents that claim inventions also claimed by us, we may choose to participate in an interference proceeding to determine the right to a patent for these inventions because our business would be harmed if we fail to enforce and protect our intellectual property rights. Even if the outcome is favorable, this proceeding could result in substantial cost to us and disrupt our business.
In the future, we also may need to file lawsuits to enforce our intellectual property rights, to protect our trade secrets or to determine the validity and scope of the proprietary rights of others. This litigation, whether successful or unsuccessful, could result in substantial costs and diversion of resources, which could have a material adverse effect on our business, financial condition and results of operations.
We depend on key personnel who would be difficult to replace, and our business will likely be harmed if we lose their services or cannot hire additional qualified personnel.
Our success depends substantially on the efforts and abilities of our senior management and key personnel. The competition for qualified management and key personnel, especially engineers, is intense. Although we maintain noncompetition and nondisclosure covenants with most of our key personnel, we do not have employment agreements with most of them. The loss of services of one or more of our key employees or the inability to hire, train and retain key personnel, especially engineers and technical support personnel, could delay the development and sale of our products, disrupt our business and interfere with our ability to execute our business plan.
Potential strategic alliances may not achieve their objectives, and the failure to do so could impede our growth.
We anticipate that we will enter into strategic alliances. Among other matters, we continually explore strategic alliances designed to enhance or complement our technology or to work in conjunction with our technology; to provide necessary know-how, components or supplies; to attract additional customers; and to develop, introduce and distribute products utilizing our technology. Any strategic alliances may not achieve their intended objectives, and parties to our strategic alliances may not perform as contemplated. The failure of these alliances may impede our ability to introduce new products and expand our business.
Any acquisitions that we undertake could be difficult to integrate, disrupt our business, dilute stockholder value and harm our operating results.
We may pursue opportunities to acquire other businesses and technologies in order to complement our products, expand the breadth of our business, enhance our technical capabilities or otherwise grow our business. While we have no current definitive agreements underway, we may acquire businesses, products or technologies in the future. If we make any future acquisitions, we could issue stock that would dilute existing stockholders’ percentage ownership, incur substantial debt, assume contingent liabilities or experience higher operating expenses. We have no experience in acquiring other businesses or technologies. Potential acquisitions also involve numerous risks, including the following:
| |
|
|
| |
●
|
problems assimilating the purchased operations, technologies or products;
|
| |
●
|
unanticipated costs associated with the acquisition;
|
| |
●
|
diversion of management’s attention from our core businesses;
|
| |
●
|
adverse effects on existing business relationships with suppliers and customers;
|
| |
●
|
risks associated with new ventures with respect to which we have little or no prior experience; and
|
| |
●
|
potential loss of key employees of purchased organizations.
|
We cannot assure you that we would be successful in overcoming problems encountered in connection with any acquisitions, and our inability to do so could disrupt our operations and adversely affect our business.
Failure to maintain effective internal controls over financial reporting may lead investors and other users to lose confidence in our financial data.
Maintaining effective internal controls over financial reporting is necessary for us to produce reliable financial statements. In evaluating the effectiveness of its internal controls over financial reporting in connection with the preparation of our quarterly report as of and for the three and six months ended June 30, 2012, management concluded that there was a material weakness in internal control over financial reporting related to accounting for embedded derivatives associated with certain convertible debt and warrants to purchase common stock. This material weakness led to the need for the restatement of the Company’s financial statements for the years ended December 31, 2009 through 2011 and for the first quarter of 2012 and the failure of the Company to file its Quarterly Report on Form 10-Q for the interim period ended June 30, 2012 on a timely basis.
We are in the process of remediating this material weakness by, among other things, augmenting our professional staff, providing additional training for our accounting staff, implementing and modifying certain accounting procedures, and seeking assistance from third parties with respect to complex technical accounting issues. If we fail to remediate this material weakness or fail to otherwise maintain effective controls over financial reporting in the future, it could result in a material misstatement of our financial statements that would not be prevented or detected on a timely basis and which could cause investors and other users to lose confidence in our financial statements.
Our compliance with the Sarbanes-Oxley Act of 2002 and SEC rules concerning internal controls may be time consuming, difficult and costly, and the failure to achieve and maintain effective internal controls in accordance with Section 404 of the Sarbanes-Oxley Act could have a material adverse effect on our ability to produce accurate financial statements and on our stock price.
Under SEC regulations adopted pursuant to Section 404 of the Sarbanes-Oxley Act of 2002, we are required to maintain internal controls over financial reporting and to report any material weaknesses in such internal controls. In addition, we anticipate that at some point in the near future, we will be required to furnish a report by our management on our internal control over financial reporting that includes a statement that our independent auditors have issued an attestation report on management’s assessment of internal control over financial reporting. While we have spent considerable time and effort in designing, documenting and testing our internal control procedures, we may need to spend additional financial and other resources improving our processes, which may result in increased general and administrative expenses and may shift management time and attention from revenue-generating activities to compliance activities. Despite our efforts, we can provide no assurance as to our independent auditor’s conclusion with respect to the effectiveness of our internal control over financial reporting.
If we fail to comply in a timely manner with the requirements of Section 404 of the Sarbanes-Oxley Act of 2002 regarding internal control over financial reporting or to remedy any material weaknesses in our internal controls that we may identify, such failure could result in material misstatements in our financial statements, cause investors to lose confidence in our reported financial information, limit our ability to raise needed capital and have a negative effect on the trading price of our common stock.
We may not be able to secure additional financing on favorable terms, or at all, to meet our future capital needs.
In the future, we may require additional capital to respond to business opportunities, challenges, acquisitions or unforeseen circumstances and may determine to engage in equity or debt financings or enter into credit facilities for other reasons. We may not be able to secure additional debt or equity financing in a timely basis or on favorable terms, or at all. Any debt financing obtained by us in the future could involve restrictive covenants relating to our capital raising activities and other financial and operational matters, which may make it more difficult for us to obtain additional capital and to pursue business opportunities. If we raise additional funds through further issuances of equity, convertible debt securities or other securities convertible into equity, our existing stockholders could suffer significant dilution in their percentage ownership of our company, and any new equity securities we issue could have rights, preferences and privileges senior to those of holders of our common stock. If we are unable to obtain adequate financing or financing on terms satisfactory to us, when we require it, our ability to continue to grow or support our business and to respond to business challenges could be significantly limited.
Risks Related to Our Common Stock
Our principal stockholder exerts substantial influence over us.
Vicis Capital Master Fund, or Vicis, owns approximately 84% of the outstanding shares of our common stock as of December 31, 2011. Consequently, Vicis is able to exert substantial influence over our company and control matters requiring approval by our stockholders, including the election of all our directors, approving any amendments to our certificate of incorporation, increasing our authorized capital stock, effecting a merger or sale of our assets and determining the number of shares available for issuance under our stock plans. As a result of Vicis’ control, no change of control of our company can occur without Vicis’ consent.
Vicis’ voting control may discourage transactions involving a change of control of our company, including transactions in which you as a holder of our common stock might otherwise receive a premium for your shares over the then current market price. Vicis is not prohibited from selling a controlling interest in our company to a third party and may do so without stockholder approval and without providing for a purchase of any stockholder’ shares of common stock. Accordingly, shares of common stock may be worth less than they would be if Vicis did not maintain voting control over us.
We may issue additional common stock in the future, which would dilute our existing stockholders.
In the future, we may issue our previously authorized and unissued securities, including shares of our common stock or securities convertible into or exchangeable for our common stock, resulting in the dilution of the ownership interests of our stockholders. We are authorized under our amended and restated certificate of incorporation to issue 100,000,000 shares of common stock and 5,000,000 shares of preferred stock with such designations, preferences, and rights as may be determined by our Board of Directors. As of March 6, 2012, there were 16,572,384 shares of our common stock issued and outstanding and there were no shares of our preferred stock issued and outstanding.
While we filed with the Securities and Exchange Commission in August 2011 a registration statement on Form S-1 for a proposed public offering of our common stock, we currently do not have any commitments for funding. In addition, we may also issue additional shares of our common stock or securities convertible into or exchangeable for our common stock in connection with the hiring of personnel, future acquisitions, future private placements of our securities for capital raising purposes or for other business purposes. Future issuances of our common stock, or the perception that such issuances could occur, could have a material adverse effect on the price of our common stock.
The market price of our common stock may be volatile, which could result in substantial losses for investors.
The market price of our common stock is likely to be volatile and could fluctuate widely in response to various factors, many of which are beyond our control, including the following:
| |
●
|
our ability to execute our business plan;
|
| |
●
|
the gain or loss of significant orders;
|
| |
●
|
volume and timing of customer orders;
|
| |
●
|
actual or anticipated changes in our operating results;
|
| |
●
|
changes in expectations relating to our products, plans and strategic position or those of our competitors or customers;
|
| |
●
|
market conditions and trends within the utilities industry and the smart grid market;
|
| |
●
|
introductions of new products of new pricing policies by us or by our competitors;
|
| |
●
|
the gain or loss of significant customers;
|
| |
●
|
industry developments;
|
| |
●
|
regulatory, legislative or other developments affecting us or the utilities industry in general or the smart grid market in particular;
|
| |
●
|
economic and other external factors;
|
| |
●
|
general global economic and political instability;
|
| |
●
|
changes in laws or regulations affecting the utilities industry;
|
| |
●
|
announcements of technological innovations or new products by us or our competitors;
|
| |
●
|
acquisitions or strategic alliances by us or by our competitors;
|
| |
●
|
litigation involving us, the utilities industry or the smart grid market;
|
| |
●
|
recruitment or departure of key personnel;
|
| |
●
|
future sales of our common stock;
|
| |
●
|
price and volume fluctuations it the overall stock market from time to time;
|
| |
●
|
changes in investor perception;
|
| |
●
|
the level and quality of any research analyst coverage of our common stock;
|
| |
●
|
changes in earnings estimates or investment recommendations by securities analysts;
|
| |
●
|
the financial guidance we may provide to the public, any changes in such guidance or our failure to meet such guidance; and
|
| |
●
|
trading volume of our common stock or the sale of stock by our parent, management team or directors.
|
In addition, the securities markets have experienced extreme price and volume fluctuations that often have been unrelated or disproportionate to the operating performance of particular companies. Public announcements by various companies concerning, among other things, their performance, accounting practices or legal problems could cause the market price of our common stock to decline regardless of our actual operating performance.
Future sales of common stock by Vicis or others or other dilutive events may adversely affect the market price of our common stock, even if our business is doing well.
Our existing stockholders could sell any or all of the shares of common stock owned by them from time to time for any reason. Future sales of substantial amounts of our common stock in the public market, or the perception that such sales could occur, could adversely affect prevailing trading prices of our common stock and could impair our ability to raise capital through future offerings of equity or equity-related securities. We cannot predict what effect, if any, future sales of our common stock, or the availability of shares for future sales, will have on the market price of our stock. As of December 31, 2011, we had the following outstanding securities:
| |
●
|
Approximately 16.6 million shares of common stock outstanding;
|
| |
●
|
Approximately 2.7 million shares of common stock issuable upon the exercise of then outstanding stock options at a weighted average exercise price of $8.16 per share;
|
| |
●
|
Approximately 1.1 million shares of common stock issuable upon the exercise of then outstanding warrants at a weighted average exercise price of $16.61 per share; and
|
| |
●
|
Approximately 725,000 shares of common stock reserved for issuance under our 2000 Equity Incentive Plan and 2002 Non-Employee Directors Stock Option Plan.
|
We do not expect to pay any dividends for the foreseeable future; hence stockholders must look solely to appreciation of our common stock to realize a gain on their investments.
We have never declared or paid cash dividends on our common stock, and we do not anticipate doing so in the foreseeable future. We currently intend to retain future earnings, if any, to fund our operations and support our growth strategies. Any determination to pay dividends in the future will be made at the discretion of our Board of Directors and will depend on our results of operations, financial conditions, contractual restrictions, restrictions imposed by applicable law, capital requirements and other factors our Board of Directors deems relevant. Accordingly, stockholders must look solely to appreciation of our common stock to realize a gain on their investment. This appreciation may not occur.
Our ability to use U.S. net operating loss carryforwards might be limited, subjecting our corporate income to earlier taxation.
At December 31, 2011, we had available approximately $68.3 million of net operating loss carryforwards, for U.S. income tax purposes which expire in the years 2016 through 2030. However, due to changes in stock ownership resulting from historical investments provided by Vicis, we expect that the use of the U.S. net operating loss carryforwards are significantly limited under Section 382 of the Internal Revenue Code. As such, approximately $61.4 million of our net operating loss carryforwards will expire and will not be available to use against future tax liabilities. In addition, our ability to utilize the current net operating loss carryforwards might be further limited by the issuance of common stock in future offerings. To the extent our use of net operating loss carryforwards is significantly limited, our income could be subject to corporate income tax earlier than it would if we were able to use net operating loss carryforwards, which could result in lower profits.
ITEM 1B. UNRESOLVED STAFF COMMENTS
Not applicable.
ITEM 2. PROPERTIES
We do not own any real property. We currently lease approximately 28,000 square feet of office space in Newton, Massachusetts. Our leases expire on December 31, 2012. We believe that our facilities and future plans to lease are suitable and adequate for our present needs, and we periodically evaluate whether additional facilities are necessary.
ITEM 3. LEGAL PROCEEDINGS
We are not involved in any pending legal proceedings that we anticipate would result in a material adverse effect on our business or operations.
ITEM 4. MINE SAFETY DISCLOSURES
Not applicable.
PART II
ITEM 5. MARKET FOR REGISTRANTS COMMON EQUITY, RELATED STOCKHOLDER MATTERS AND ISSUER PURCHASES OF EQUITY SECURITIES
Our common stock has been listed on the NASDAQ Capital Market under the symbol “AMBT” since August 3, 2011. Prior to August 3, 2011, our common stock was quoted on the OTC Bulletin Board under the symbol “ABTG.”
Although trading in our common stock has occurred on a relatively consistent basis, the volume of shares traded has been sporadic. There can be no assurance that an established trading market will develop, that the current market will be maintained or that a liquid market for our common stock will be available in the future. Investors should not rely on historical stock price performance as an indication of future stock price performance.
The following table shows the quarterly high and low bid prices or sales prices for our common stock over the last two completed fiscal years and subsequent interim periods, as quoted on the OTC Bulletin Board (prior to August 3, 2011) and as reported on the NASDAQ Capital Market (beginning on August 3, 2011). In the case of OTC Bulletin Board quotes, the prices represent quotations by dealers without adjustments for retail mark-ups, mark-downs or commissions and may not represent actual transactions. The prices have been adjusted to reflect the 1- for -100 reverse stock split of our common stock that became effective on July 18, 2011.
| |
|
Low
|
|
|
High
|
|
|
Year Ended December 31, 2011
|
|
|
|
|
|
|
|
Fourth Quarter
|
|
$
|
4.55
|
|
|
$
|
8.40
|
|
|
Third Quarter
|
|
|
5.70
|
|
|
|
13.98
|
|
|
Second Quarter
|
|
|
7.00
|
|
|
|
9.50
|
|
|
First Quarter
|
|
|
7.60
|
|
|
|
11.90
|
|
| |
|
|
|
|
|
|
|
Year Ended December 31, 2010
|
|
|
|
|
|
|
|
Fourth Quarter
|
|
|
8.00
|
|
|
|
15.30
|
|
|
Third Quarter
|
|
|
6.00
|
|
|
|
10.40
|
|
|
Second Quarter
|
|
|
6.20
|
|
|
|
10.70
|
|
|
First Quarter
|
|
|
10.10
|
|
|
|
20.00
|
|
As of December 31, 2011, there were 137 holders of record of our common stock. Other than our shares held by Vicis, a significant number of shares of our common stock are held in either nominee name or street name brokerage accounts, and consequently, we are unable to determine the number of beneficial owners of our stock.
DIVIDEND POLICY
We have paid no dividends on our common stock and do not expect to pay cash dividends in the foreseeable future. We plan to retain all earnings to provide funds for the growth of our company. In the future, our Board of Directors will decide whether to declare and pay dividends based upon our earnings, financial condition, capital requirements and other factors that our Board of Directors may consider relevant. We are not under any contractual restriction as to present or future ability to pay dividends.
ISSUER PURCHASES OF EQUITY SECURITIES
We do not have a stock repurchase program for our common stock.
ITEM 6. SELECTED FINANCIAL DATA
As discussed in the Explanatory Note to this Amended Filing, the Company is amending and restating its audited financial statements and related disclosures for all periods presented in this Item. The following financial data should be read together with our restated financial statements and related notes and restated “Management’s Discussion and Analysis of Financial Condition and Results of Operations” appearing elsewhere in this Amended Filing. We have derived the following restated statement of operations data and cash flow data for the years ended December 31, 2009, 2010 and 2011 and the restated balance sheet data as of December 31, 2010 and 2011 from our restated audited financial statements included elsewhere in this Amended Filing. Share and per share information have been adjusted to reflect the 1-for-100 reverse stock split of our common stock that became effective on July 18, 2011. Our historical results are not necessarily indicative of our results to be expected in any future period.
| |
|
Years Ended December 31,
|
|
| |
|
2007
|
|
|
2008
|
|
|
2009
|
|
|
2010
|
|
|
2011
|
|
| |
|
(Restated)
|
|
|
(Restated)
|
|
|
(Restated)
|
|
|
(Restated)
|
|
|
(Restated)
|
|
| |
|
(In thousands, except per share data)
|
|
|
STATEMENT OF OPERATIONS DATA:
|
|
|
|
|
|
|
|
|
|
|
|
|
|
|
|
|
Total revenue
|
|
$ |
2,265 |
|
|
$ |
12,622 |
|
|
$ |
2,185 |
|
|
$ |
20,226 |
|
|
$ |
62,112 |
|
|
Cost of goods sold
|
|
|
1,806 |
|
|
|
9,942 |
|
|
|
1,836 |
|
|
|
12,023 |
|
|
|
35,274 |
|
|
Gross profit
|
|
|
459 |
|
|
|
2,680 |
|
|
|
349 |
|
|
|
8,203 |
|
|
|
26,838 |
|
| |
|
|
|
|
|
|
|
|
|
|
|
|
|
|
|
|
|
|
|
|
|
Operating expenses:
|
|
|
|
|
|
|
|
|
|
|
|
|
|
|
|
|
|
|
|
|
|
Research and development expenses
|
|
|
3,655 |
|
|
|
4,320 |
|
|
|
4,871 |
|
|
|
6,222 |
|
|
|
11,665 |
|
|
Selling, general and administrative expenses
|
|
|
3,984 |
|
|
|
3,544 |
|
|
|
4,392 |
|
|
|
5,060 |
|
|
|
8,244 |
|
|
Total operating expenses
|
|
|
7,639 |
|
|
|
7,864 |
|
|
|
9,263 |
|
|
|
11,282 |
|
|
|
19,909 |
|
| |
|
|
|
|
|
|
|
|
|
|
|
|
|
|
|
|
|
|
|
|
|
Operating (loss) income
|
|
|
(7,180 |
) |
|
|
(5,184 |
) |
|
|
(8,914 |
) |
|
|
(3,079 |
) |
|
|
6,929 |
|
| |
|
|
|
|
|
|
|
|
|
|
|
|
|
|
|
|
|
|
|
|
|
Interest (expense) income, net
|
|
|
(3,705 |
) |
|
|
(2,349 |
) |
|
|
(588 |
) |
|
|
(30 |
) |
|
|
19 |
|
|
Amortization of deferred financing costs
|
|
|
(480 |
) |
|
|
- |
|
|
|
- |
|
|
|
- |
|
|
|
- |
|
|
Amortization of debt discount
|
|
|
(4,234 |
) |
|
|
(3,998 |
) |
|
|
(3,651 |
) |
|
|
- |
|
|
|
- |
|
|
Mark-to-market adjustment of
warrant liability
|
|
|
5,502 |
|
|
|
(973 |
) |
|
|
(7,029 |
) |
|
|
2,740 |
|
|
|
3,306 |
|
|
Mark-to-market adjustment of derivative liability
|
|
|
1,198 |
|
|
|
(2,851 |
) |
|
|
(102,070 |
) |
|
|
5,434 |
|
|
|
- |
|
|
Gain (loss) on conversion and extinguishment of debt
|
|
|
- |
|
|
|
- |
|
|
|
5,723 |
|
|
|
(355 |
) |
|
|
- |
|
|
Other income (expense), net
|
|
|
175 |
|
|
|
(118 |
) |
|
|
(31 |
) |
|
|
(6 |
) |
|
|
- |
|
|
Total other (loss) income
|
|
|
(1,544 |
) |
|
|
(10,289 |
) |
|
|
(107,646 |
) |
|
|
7,783 |
|
|
|
3,325 |
|
| |
|
|
|
|
|
|
|
|
|
|
|
|
|
|
|
|
|
|
|
|
|
Provision for income taxes
|
|
|
- |
|
|
|
- |
|
|
|
- |
|
|
|
- |
|
|
|
204 |
|
| |
|
|
|
|
|
|
|
|
|
|
|
|
|
|
|
|
|
|
|
|
|
Net (loss) income
|
|
$ |
(8,724 |
) |
|
$ |
(15,473 |
) |
|
$ |
(116,560 |
) |
|
$ |
4,704 |
|
|
$ |
10,050 |
|
| |
|
|
|
|
|
|
|
|
|
|
|
|
|
|
|
|
|
|
|
|
|
Net (loss) income per share (basic)
|
|
$ |
(3.63 |
) |
|
$ |
(5.13 |
) |
|
$ |
(14.77 |
) |
|
$ |
0.30 |
|
|
$ |
0.61 |
|
|
Net (loss) income per share (diluted)
|
|
$ |
(3.63 |
) |
|
$ |
(5.13 |
) |
|
$ |
(14.77 |
) |
|
$ |
0.29 |
|
|
$ |
0.59 |
|
| |
|
|
|
|
|
|
|
|
|
|
|
|
|
|
|
|
|
|
|
|
|
Weighted average shares used in computing basic net (loss) income per share
|
|
|
2,404 |
|
|
|
3,015 |
|
|
|
7,891 |
|
|
|
15,495 |
|
|
|
16,515 |
|
|
Weighted average shares used in computing diluted net (loss) income per share
|
|
|
2,404 |
|
|
|
3,015 |
|
|
|
7,891 |
|
|
|
15,998 |
|
|
|
16,905 |
|
| |
|
|
|
|
|
|
|
|
|
|
|
|
|
|
|
|
|
|
|
|
| |
|
|
|
|
|
|
|
|
|
|
|
|
|
|
|
|
|
|
|
|
|
CASH FLOW DATA:
|
|
|
|
|
|
|
|
|
|
|
|
|
|
|
|
|
|
|
|
|
|
Cash flows (used in) provided by operating activities
|
|
|
(6,697 |
) |
|
|
(5,549 |
) |
|
|
(7,720 |
) |
|
|
(1,592 |
) |
|
|
12,069 |
|
|
Cash flows provided by (used in) investing activities
|
|
|
50 |
|
|
|
(576 |
) |
|
|
(269 |
) |
|
|
(527 |
) |
|
|
(962 |
) |
|
Cash flows provided by (used in) financing activities
|
|
|
4,807 |
|
|
|
13,591 |
|
|
|
964 |
|
|
|
8,118 |
|
|
|
(129 |
) |
| |
|
As of December 31,
|
|
| |
|
2007 |
|
|
2008 |
|
|
2009 |
|
|
2010 |
|
|
2011 |
|
| |
|
(Restated)
|
|
|
(Restated)
|
|
|
(Restated)
|
|
|
(Restated)
|
|
|
(Restated)
|
|
| |
|
(In thousands)
|
|
|
BALANCE SHEET DATA:
|
|
|
|
|
|
|
|
|
|
|
|
|
|
|
|
|
|
|
|
|
|
Cash, cash equivalents and marketable securities
|
|
$ |
546 |
|
|
$ |
8,137 |
|
|
$ |
987 |
|
|
$ |
6,987 |
|
|
$ |
17,965 |
|
|
Total assets
|
|
|
1,917 |
|
|
|
10,622 |
|
|
|
3,393 |
|
|
|
10,573 |
|
|
|
21,874 |
|
|
Working capital, net (1)
|
|
|
(254 |
) |
|
|
7,687 |
|
|
|
(233 |
) |
|
|
5,437 |
|
|
|
14,993 |
|
|
Warrant and derivative liability (current & long-term portion)
|
|
|
7,190 |
|
|
|
17,099 |
|
|
|
95,861 |
|
|
|
4,353 |
|
|
|
671 |
|
|
Convertible debt, net of discounts (current & long-term portion)
|
|
|
1,971 |
|
|
|
5,865 |
|
|
|
8,196 |
|
|
|
- |
|
|
|
- |
|
|
Total stockholders' (deficit) equity
|
|
|
(8,852 |
) |
|
|
(14,756 |
) |
|
|
(103,784 |
) |
|
|
1,643 |
|
|
|
15,861 |
|
| |
|
|
|
|
|
|
|
|
|
|
|
|
|
|
|
|
|
|
|
|
|
(1) Excluding current portion of convertible debt and warrant liabilities
|
|
|
|
|
|
|
|
|
|
|
|
|
|
|
|
|
|
|
|
|
ITEM 7. RESTATED MANAGEMENT DISCUSSION AND ANALYSIS OF FINANCIAL CONDITION AND RESULTS OF OPERATION.
Restatement
As discussed in the Explanatory Note to this Amended Filing and in Note 2 to the accompanying restated financial statements, we are amending and restating our audited consolidated financial statements and related disclosures for all periods presented in this Amended Filing. The following discussion and analysis of our financial condition and results of operations incorporates the restated amounts. For this reason, the data set forth in this section may not be comparable to the discussion and data in our previously filed Annual Report on Form 10-K for the fiscal year ended December 31, 2011.
The following discussion should be read in conjunction with our restated financial statements and the notes related to those statements. Some of our discussion is forward-looking and involves risks and uncertainties. For information regarding risk factors that could have a material adverse effect on our business, refer to the “risk factors” section of this Amended Filing.
Overview
We are a leading provider of a smart grid communications platform that enables utilities to effectively deploy, integrate and communicate with multiple devices creating smart grid applications within the electric power grid. Our smart grid communications platform significantly improves the ability of utilities to use advanced technologies to upgrade their electric power grids, effectively making the grids more intelligent.
Company History
We were incorporated in 1996 in the state of Delaware. Through the third quarter of 2008, we were a development stage company. We are focused on the development of a communications platform that meets the needs of utilities, including specifically for the implementation of smart grid applications.
On July 18, 2011, we implemented a reverse stock split of our issued and outstanding shares of common stock at a ratio of 1-for 100 shares (the “Reverse Split”). The Reverse Split became effective on July 18, 2011 and has been reflected in this Amended Filing. On August 3, 2011, our common stock began to trade on the NASDAQ Capital Market under our new ticker symbol “AMBT.”
Duke Energy Relationship
Since 2005, we have maintained a strategic relationship with Duke Energy. The utility is actively deploying our communications nodes and is licensing our AmbientNMS® for its deployment in Ohio. We believe that we are the predominant provider of communications nodes and network management system software for Duke Energy’s Ohio deployment. With what we believe is one of the most forward-looking smart grid initiatives in North America, Duke Energy has announced plans to invest $1 billion over the next five years in smart grid equipment for its service territories, including Ohio, Indiana, Kentucky and the Carolinas
We believe that we have demonstrated that our technology is secure, two-way, flexible, open, scalable, reliable and cost-effective through the total deployment of approximately 105,000 communications nodes in the field with Duke Energy, and we believe that Duke Energy will continue to predominantly use our communications platform for the remainder of its Ohio smart grid deployment. Furthermore, Duke Energy’s pilot deployment of approximately 3,000 communications nodes in the Carolinas predominantly uses our communications platform as well. Throughout the past five years, we have worked with Duke Energy to develop our communications platform, which has enabled Duke Energy’s ability to rapidly deploy its smart grid initiatives. Duke Energy has accelerated its historical deployment rates and is presently deploying thousands of our communications nodes each month.
We believe that we have an opportunity to grow our business with Duke Energy. In addition to the 130,000 communications nodes scheduled for deployment in Ohio, we estimate that Duke Energy could potentially require thousands of communications nodes if it implements a full deployment of smart grid communications nodes in Indiana, Kentucky or the Carolinas.
Since we established our relationship with Duke Energy, we have been focused on developing our technology to meet the needs of their smart grid communications platform. Based upon the success of the relationship and our ability to prove our technology, we have recently begun to expand our infrastructure to focus on new business development, marketing and sales programs and further technology development in order to expand our customer base, and we expect to increase investment in our marketing and sales efforts over the next twelve months.
In July 2011, Duke Energy and Progress Energy closed their merger. Together, Duke Energy and Progress Energy have committed to spend a combined $1.5 billion in smart grid initiatives, partially funded by approximately $400 million in total grants awarded to them in 2010 under the ARRA and required to be spent by 2013. If the combined company of Duke Energy and Progress Energy adopts Duke Energy’s deployment strategy relating to smart grid initiatives, we believe there could be further opportunity with the combined entity
Revenue History
We have grown total revenue from $2.2 million in 2009 to $20.2 million in 2010 and to $62.1 million in 2011 due to increased sales of our communications nodes to Duke Energy. Our total revenue of $2.2 million in 2009 declined from $12.6 million in 2008 due mainly to the impact of the introduction of the ARRA. Although the ARRA was passed in September 2009, by late 2008 and early 2009, there was widespread speculation that a significant amount of funding would be made available for smart grid related initiatives. As a result, many utilities with smart grid projects underway, including Duke Energy, substantially slowed their spending until there was further clarity regarding the amount of funding available under the federal program. Furthermore, the language of the Smart Grid Investment Grants, which are part of the ARRA, also provided initial guidance regarding certain technical criteria required for grant eligibility. As such, utilities needed further clarity that the technology in their smart grid programs would qualify for funding. As soon as the ARRA was passed in September 2009, sales of our communications nodes to Duke Energy increased significantly as Duke Energy resumed its smart grid implementation in Ohio. Correspondingly, our total revenue realized for the end of 2009 also began to increase. This phenomenon impacted revenue trends across the entire smart grid sector.
Backlog
We define our backlog as products that we are obligated to deliver based on firm commitments relating to purchase orders received from customers, currently solely Duke Energy. As of December 31, 2011, we had backlog of approximately $35 million.
Critical Accounting Policies and Use of Estimates
The discussion and analysis of our financial condition and results of operations are based upon our financial statements, which have been prepared in accordance with generally accepted accounting principles in the United States. The preparation of these financial statements requires management to make estimates and judgments that affect the reported amounts of assets, liabilities, revenues and expenses, and related disclosure of contingent assets and liabilities. On an on-going basis, we evaluate our estimates, including those related to revenue recognition, bad debts, investments, intangible assets and income taxes. Our estimates are based on historical experience and on various other assumptions that are believed to be reasonable under the circumstances. Actual results may differ from these estimates.
We have identified the accounting policies below as critical to our business operations and the understanding of our results of operations.
Revenue Recognition
Total revenue consists primarily of sales of hardware, software, and maintenance services. The Company recognizes revenue when persuasive evidence of an arrangement exists, delivery has occurred, the sales price is fixed or determinable, and collection is reasonably assured. Product is considered delivered to the customer once it has been shipped and title and risk of loss have been transferred. For most of the Company’s product sales, these criteria are met at the time the product is shipped. The Company records deferred revenue when it receives payments in advance of the delivery of products or the performance of services.
Hardware sales consist of our Ambient Smart Grid® communications nodes are physical boxes that contain the hardware and embedded software needed for communications and data collection in support of smart grid assets. The system software embedded in our communications nodes is used solely in connection with the operation of the physical boxes.
Our proprietary software AmbientNMS® is our smart grid network management system that controls the large numbers of communications nodes, devices and customers on a smart grid. NMS software is offered on a stand-alone basis.
We generally include a period of free maintenance services beginning from the sale of the communication nodes and NMS Software. As such, we recognize a portion of the revenue from the sales of our products upon delivery to the customer. The revenue allocated to the free period of maintenance services is deferred and recognized ratably over the period of performance.
We offer additional software maintenance service, on a fee basis, that entitles the purchasers of our products and AmbientNMS® software to postcontract customer support including help desk support, unspecified updates and upgrades to our products on a when-and-if available basis. Maintenance services are recognized ratably over the period of performance.
The Company recognizes revenue from the sale of (i) hardware products and (ii) software bundled with hardware that is essential to the functionality of the hardware in accordance with revenue recognition for multiple element arrangements. The Company recognizes revenue in accordance with applicable industry specific software accounting guidance for (i) standalone sales of software products, (ii) maintenance renewals, and (iii) sales of software bundled with hardware not essential to the functionality of the hardware.
Revenue Recognition for Arrangements with Multiple Deliverables
In October 2009, the FASB issued ASU No. 2009-13, Multiple-Deliverable Revenue Arrangements, (amendments to ASC Topic 605, Revenue Recognition) (‘‘ASU 2009-13’’) (formerly EITF Issue 08-1) and ASU No. 2009-14, Certain Arrangements That Include Software Elements, (amendments to FASB ASC Topic 985, Software) (‘‘ASU 2009-14’’) (formerly EITF 09-3). ASU 2009-13 eliminates the residual method and requires arrangement consideration to be allocated using the relative selling price method, which requires entities to allocate revenue in an arrangement using the best estimated selling price ("BESP") of each element when a vendor does not have vendor-specific objective evidence of selling price ("VSOE") or third party evidence of selling price ("TPE"). ASU 2009-14 removes tangible products from the scope of software revenue guidance and provides guidance on determining whether software deliverables in an arrangement that includes a tangible product are within the scope of the software revenue guidance. ASU 2009-13 and ASU 2009-14 are effective for arrangements entered into or materially modified in fiscal years beginning on or after June 15, 2010. The Company adopted ASU 2009-13 and 2009-14 effective January 1, 2011
We evaluate each deliverable in an arrangement to determine whether it should be accounted for as a separate unit of accounting. The delivered item or items shall be considered a separate unit of accounting if it has standalone value to the customer and there is no customer-negotiated refunds or return rights.
We allocate the total arrangement consideration to each unit of accounting in a multiple-element arrangement based on its relative selling price, and include our bundled hardware and software component as one unit of accounting and the free period of maintenance as a separate unit of accounting. The Company uses a hierarchy to determine the selling price to be used for allocating revenue to each of the deliverables. We determine the selling price for each deliverable using vendor specific objective evidence (VSOE), if it exists or third party evidence (TPE) if VSOE does not exist. If neither VSOE nor TPE of selling price exists for a deliverable, we use our best estimate of selling price (BESP) for that deliverable. Revenue allocated to each element is then recognized when the basic revenue recognition criteria are met for each element.
We determine VSOE of a deliverable based on the price at which we sell the deliverable on a standalone basis to third parties or from the stated renewal rate for the elements contained in the initial arrangement. VSOE has been established for our software maintenance element. When VSOE cannot be established for all deliverables in an arrangement with multiple elements, we attempt to estimate the selling price of each element based on TPE. When we are unable to establish a selling price using VSOE or TPE, we establish the BESP in our allocation of arrangement consideration. The objective of BESP is to determine the price at which we would transact a sale if the product or service were sold on a standalone basis. BESP has been established for our bundled hardware and software portion of the arrangement.
When establishing BESP the Company considers multiple factors including, but not limited to, the relative value of the features and functionality being delivered to the customer, and general pricing practices. Based on our analysis of pricing stated in contractual arrangements for our hardware products in historical multiple-element transactions, we have concluded that we typically price our hardware and embedded software at the contractually agreed upon amounts. Therefore, we have determined that, for our hardware and embedded software for which VSOE or TPE is not available, our BESP is generally comprised of prices based on our contractually agreed upon rates. We have established an annual review process around VSOE, TPE and BESP.
The Company accounts for multiple element arrangements that consist only of software or software-related products, including the sale of maintenance services to previously sold software, in accordance with industry specific software accounting guidance. For such multiple element software transactions, revenue is allocated to each element based on the residual method when VSOE has been established for the undelivered element. If the Company cannot objectively determine the VSOE of any undelivered element included in such multiple-element arrangements, the Company defers revenue until VSOE is established for any remaining undelivered elements, or all elements are delivered and services have been performed.
Inventory Valuation. We value inventory at the lower of cost or market determined on a first-in, first-out basis. Certain factors may impact the net realizable value of our inventory, including technological changes, market demand, new product introductions and significant changes to our cost structure. We make estimates of reserves for obsolescence based on the current product mix on hand and its expected net realizable value. If actual market conditions are less favorable or other factors arise that are significantly different than those anticipated by us, additional inventory write-downs or increases in obsolescence reserves may be required. We consider lower of cost or market adjustments and inventory reserves as an adjustment to the cost basis of the underlying inventory. Accordingly, we do not record favorable changes in market conditions to inventory in subsequent periods.
Software Development Costs. We have historically expensed costs incurred in the research and development of new software products and enhancements to existing software products as incurred. After we establish technological feasibility, we capitalize additional development costs. No software development costs have been capitalized as of December 31, 2010 or 2011.
Stock-Based Compensation. We account for stock-based compensation in accordance with accounting guidance now codified as Financial Accounting Standards Board, or FASB, Accounting Standards Codification, or ASC, 718, “Compensation — Stock Compensation (formerly known as SFAS No. 123(R)).” Under the fair value recognition provision of ASC 718, stock-based compensation cost is estimated at the grant date based on the fair value of the award. We estimate the fair value of stock options granted using the Black-Scholes option pricing model. Key input assumptions used to estimate the fair value of stock options include the exercise price of the award, the expected option term, the expected volatility of our stock price over the option’s expected term, the risk-free interest rate over the stock option’s expected term and the annual dividend yield.
On December 20, 2011, the Compensation Committee of the Board of Directors approved grants of options to purchase 960,000 shares of our common stock under the Company’s 2000 Equity Incentive Plan to senior officers. Options as to one third of such shares vested upon grant at a per share exercise price of $6.30. Options as to the balance of such shares are scheduled to vest on a quarterly basis, in eight equal quarterly installments at the end of each quarter, beginning with the quarter ending March 31, 2013, with half of the option grants exercisable at a per share exercise price of $6.75 and the remaining half at $7.25. In addition, options to purchase 394,000 shares of our common stock were granted to the Board of Directors and Advisory Board members which immediately vested as well. As a result of the immediate vesting of a portion of the options granted to senior executives and the options granted to the Board of Directors and Advisory Board members, we recorded a stock based compensation charge of approximately $1.9 million during the fourth quarter of 2011.
Fair Value of Embedded Derivatives and Warrants. Embedded Derivatives and Warrants are recorded as liabilities at their estimated fair value at the date of issuance, with subsequent changes in estimated fair value recorded in other income (expense) in the statement of operations in each subsequent period.
Fair value of the Warrants is determined by management using a multiple scenario, probability-weighted option-pricing model using the following inputs: the fair value of the underlying common stock at the valuation measurement date; the risk-free interest rates; the expected dividend rates; the remaining contractual terms of the warrants; the expected volatility of the price of the underlying common stock; and the probability of certain events occurring.
The fair value of Embedded Derivatives is determined by management using a Monte Carlo simulation analysis taking into account various inputs including the fair value of the underlying common stock at the valuation measurement date; the risk-free interest rates; the expected dividend rates; credit-risk spreads; time to maturity; the expected volatility of the price of the underlying common stock; and the probability of various events or other options occurring.
The assumptions used in calculating the estimated fair value of the Embedded Derivatives and Warrants represent our best estimates; however, these estimates involve inherent uncertainties and the application of management judgment. As a result, if factors change and different assumptions are used, the Embedded Derivative and Warrant liabilities and the change in their estimated fair values could be materially different.
Debt Discount and Amortization of Debt Discount. Debt discount represents the fair value of Embedded Derivatives and Warrants. Debt discount is amortized over the term of the debt using the effective interest method where applicable. The amortization of debt discount is included as a component of other income (expense) in the accompanying statements of operations. Upon conversion of the Notes, the unamortized discount is recognized as part of the debt extinguishment gain or loss.
Deferred Income Taxes. We recognize deferred income taxes for the tax consequences of “temporary differences” by applying enacted statutory rates applicable to future years to differences between the financial statement carrying amounts and the tax basis of existing assets and liabilities. At December 31, 2011, our deferred income tax assets consisted primarily of net operating loss carryforwards and stock-based compensation charges that have been fully offset with a valuation allowance due to the uncertainty that a tax benefit will be realized from the assets in the future. At December 31, 2011, we had available approximately $68.3 million of net operating loss carryforwards, for U.S. income tax purposes which expire in the years 2016 through 2030. However, due to changes in stock ownership resulting from historical investments, the use of the U.S. net operating loss carryforwards are significantly limited under Section 382 of the Internal Revenue Code. As such, approximately $61.4 million of our net operating loss carryforwards will expire and will not be available to use against future tax liabilities.
Warranties. We account for our warranties under the FASB ASC 450, “Contingencies.” Our current standard product warranty includes a one-year warranty period for defects in material and workmanship. Due to the limited deployment of products, we had not historically accrued for the cost of warranty obligations and expensed any costs associated with repairing or replacing defective product as incurred. However, due to significantly increased sales volume during 2011, we began accruing a liability of approximately 0.2% of current communications node revenues for the estimated future costs of meeting our warranty obligation, based on our actual historical return rate of products within the one-year warranty period. We make and revise this estimate based on the number of communications nodes delivered and our historical experience with warranty claims. We continually monitor the rate of actual product returns and the quality of our products including the quality of the products produced by our U.S.-based contract manufacturer in China.
We engage in product quality programs and processes, including monitoring and evaluating the quality of component suppliers, in an effort to ensure the quality of our products and reduce our warranty exposure. The warranty obligation will be affected not only by product failure rates, but also the costs to repair or replace failed products and potential service and delivery costs incurred in correcting a product failure. If our actual product failure rates, repair or replacement costs, or service or delivery costs differ from these estimates, accrued warranty costs would be adjusted in the period that such events or costs become known.
Our software license agreements generally include provisions for indemnifying customers against liabilities if our software infringes upon a third party’s intellectual property rights. We have not provided for any reserves for such warranty liabilities. Our software license agreements also generally include a warranty that our software will substantially operate as described in the applicable program documentation. We also warrant that we will perform services in a manner consistent with industry standards. To date, we have not incurred any material costs associated with these product and service performance warranties, and as such we have not provided for any reserves for any such warranty liabilities in our operating results.
RESULTS OF OPERATIONS
Comparison of the Year Ended December 31, 2011 and the Year Ended December 31, 2010
Total Revenue. Total revenue for 2011 was $62.1 million compared to $20.2 million in 2010, representing an increase of approximately 207%. The increase in total revenue for 2011 compared with 2010 primarily reflected an increase in sales volume of our communications nodes delivered as part of Duke Energy’s Ohio smart grid initiative.
Costs of Goods Sold. Cost of goods sold for 2011 was $35.3 million compared to $12.0 million in 2010. The increase in cost of goods sold during 2011 primarily reflected an increase in sales volume to Duke Energy. Cost of goods sold includes all costs related to the manufacture of our products by our contract manufacturer, accruals for warranty and other overhead costs. Our contract manufacturer is responsible for substantially all aspects of manufacturing, including procuring most of the key components required for assembly. Included in cost of goods sold in 2011 was approximately $250,000 of stock-based compensation relating to immediately vesting stock options granted to certain employees.
Gross Profit. Gross profit for 2011 was $26.8 million compared to $8.2 million in 2010, an increase of approximately 227%. Gross margin for 2011 increased slightly to approximately 43% compared to approximately 41% for 2010. The increase in the gross margin for 2011 compared with 2010 was due to lower manufacturing costs resulting from increased volumes at our contract manufacturer and increased efforts in overall cost reduction programs.
Research and Development Expenses. Research and development expenses were approximately $11.7 million for 2011 compared to approximately $6.2 million in 2010. The increase in research and development during 2011 was primarily due to increased personnel and consultant expenses required for the continued development of our communications nodes, enhancements of our AmbientNMS®, and other product development efforts. In addition, included in research and development expenses in 2011 was approximately $341,000 of stock-based compensation relating to immediately vesting stock options granted to certain employees. We believe that our continued development efforts are critical to our strategic objectives of enhancing our technology while simultaneously reducing costs. We expect that our research and development expenses will increase in 2012 as we continue to develop and improve our communications platform.
Selling, General and Administrative Expenses. Selling, general and administrative expenses for 2011 were approximately $8.2 million compared to $5.1 million for 2010. The increase in selling, general and administrative expenses for 2011 compared with 2010 was due to an increase in personnel and related costs, increased efforts to market and commercialize our communications platform and increased costs associated with additional administrative personnel. In addition, included in selling, general and administrative expenses in 2011 was approximately $1.3 million of stock-based compensation relating to immediately vesting stock options granted to certain employees and the Board of Directors. Selling, general and administrative expenses consisted primarily of salaries and other related costs for personnel in executive and other administrative functions. Other significant costs included professional fees for legal, accounting and other services. In 2012, we expect our selling, general and administrative expenses to increase as we continue to increase our efforts to market and commercialize our communication platform.
Interest Income and Expense. Net interest income for 2011 was approximately $19,000 compared to net interest expense of approximately $30,000 in 2010. Interest expense in 2010 related primarily to our Notes, which were converted to common stock in January 2010.
Mark-to-Market Adjustment of Embedded Derivatives and Warrants. We recorded a non-cash gain of approximately $5.4 million representing the change in fair value of Embedded Derivatives immediately prior to their conversion during January 2010. In addition, we recorded a non-cash gain of approximately $2.7 million associated with the change in fair value of the Warrants for the year ended December 31, 2010.
As a result of the conversion of all the Notes in 2010, there was no impact relating to any changes in fair value of Embedded Derivatives during the year ended December 31, 2011, and since a portion of the Warrants were still outstanding as of December 31, 2011, we recorded non-cash gain of approximately $3.3 million associated with the change in fair value associated with the Warrants during the year ended December 31, 2011.
Loss on Extinguishment of Debt. In January 2010, the remaining $10 million in principal amount of our Notes was converted into common stock. Although the Notes were converted into shares of common stock in accordance with the conversion feature of the Notes, ASC 470 requires that extinguishment accounting is required if the conversion right of the host instrument has been bifurcated under ASC 815. As such, we recorded a non-cash loss on the extinguishment of debt of approximately $355,000 during the year ended December 31, 2010.
Provision for Income Taxes. The provision for income taxes in 2011 consisted of alternative minimum taxes (AMT), resulting from the following (1) stock-based compensation expense is not deductible for income tax purposes ( regular or AMT) and (2) AMT net operating loss carryfowards are limited by statute to offset 90% of AMT income.
Comparison of the Year Ended December 31, 2010 and the Year Ended December 31, 2009
Total Revenue. Total revenue for 2010 was $20.2 million compared with $2.2 million for 2009. Total revenue for each of 2009 and 2010 represented the sale of products and license of software to, and maintenance fees from, Duke Energy. The increase in total revenue for 2010 compared with 2009 primarily reflected an increase in the number of communications nodes delivered as part of Duke Energy’s Ohio smart grid initiative.
Costs of Goods Sold. Cost of goods sold for 2010 was $12.0 million compared with $1.8 million for 2009. The increase in cost of goods sold during 2010 primarily reflected the increase in sales volume to Duke Energy. Cost of goods sold included all costs related to the manufacture of our products by a contract manufacturer. The contract manufacturer is responsible for all aspects of manufacturing, including procuring most of the key components required for assembly. Additionally, we recorded approximately $152,000 in charges associated with the write-off of obsolete inventory during 2009.
Our policy is to accrue anticipated warranty costs based upon historical percentages of items returned for repair within one year of the initial sale. Because the repair rate of products under warranty had been minimal, we had not established an historical percentage and, therefore did not provide any warranty liability reserves for the years ended December 31, 2010 and 2009.
Gross Profit. Gross profit for 2010 was $8.2 million compared with $349,000 for 2009. Gross margin for 2010 increased to approximately 41% compared with approximately 16% for 2009. The increase in the gross margin for 2010 compared with 2009 was a reflection of the maturing of our product offering and more stable manufacturing costs, our enhanced ability to plan production and scale based on increased lead-time and transparency in the forecasting and purchasing process of our customer, and a stable and productive relationship with our contract manufacturer.
Research and Development Expenses. Research and development expenses were approximately $6.2 million for 2010 compared with $4.9 million for 2009. Research and development expenses were incurred primarily in designing, developing and field testing our smart grid communications platform and consisted primarily of salaries and related expenses for personnel, contract design and testing services, supplies used and consulting and license fees paid to third parties. The increase in research and development during 2010 was primarily due to increased personnel and consultant expenses required for the continued development of our fourth generation communications nodes and enhancement of our AmbientNMS®. We believe that our continued development efforts are critical to our strategic objectives of enhancing our technology while simultaneously reducing costs.
Selling, General and Administrative Expenses. Selling, general and administrative expenses for 2010 were approximately $5.1 million compared with $4.4 million for 2009. The selling, general and administrative expenses consisted primarily of salaries and other related costs for personnel in executive and other administrative functions. Other significant costs included professional fees for legal, accounting and other services. The increase in selling, general and administrative expenses for 2010 compared with 2009 was due to increased efforts to market and commercialize our communications platform.
Interest Income and Expense. During 2009, we incurred total interest expense of approximately $587,000, associated with cash interest incurred on our Notes. Since the remaining principal of the Notes were converted in January 2010, interest expense declined significantly in 2010.
Mark-to-Market Adjustment of Embedded Derivatives and Warrants. During 2009, our stock price appreciated significantly throughout the year. As a result, the fair value of the Embedded Derivatives as well as the fair value of the Warrants increased substantially, and we recorded a non-cash charge of approximately $109.1 million to reflect the increase in these liabilities for the year ended December 31, 2009. For the year ended December 31, 2010, we recorded a non-cash gain of approximately $5.4 million representing the change in fair value of Embedded Derivatives associated with the Notes immediately prior to their conversion in January 2010 and a non-cash gain of approximately $2.7 million associated with the change in fair value of the Warrants.
Gain on Extinguishment of Debt. In August 2009, $2.5 million in principal amount of our Notes was converted into common stock. Although the Notes were converted into shares of common stock in accordance with the conversion feature of the Notes, ASC 470 requires that extinguishment accounting is required if the conversion right of the host instrument has been bifurcated under ASC 815. As such, we recorded a non-cash gain on extinguishment of approximately $5.7 million during the year ended December 31, 2009. In January 2010, the remaining $10 million in principal amount of our Notes was converted into common stock, which resulted in a non-cash loss on the extinguishment of debt of approximately $355,000 during the year ended December 31, 2010.
Amortization of Debt Discount. Amortization of debt discount was approximately $3.7 million for the year ended December 31, 2009. Since all of the outstanding Notes were converted in early January of 2010, no further amortization of debt discount was recorded.
Liquidity and Capital Resources
Since inception, we have primarily funded our operations with proceeds from the sale of our securities and, most recently, with revenue from sales of our products. At December 31, 2011, we had working capital of $14.3 million, including cash and cash equivalents of $18.0 million.
Net cash used in operating activities during the years ended December 31, 2009 and 2010 was approximately $7.7 million and $1.6 million, respectively and net cash provided by operating activities during 2011 was approximately $12.1 million. Cash used in operations for the years ended December 31, 2009 and 2010 was primarily due to funding operating losses attributed to spending in research and development and general and administrative expenses associated with the development of our technologies and products and to support the growth of our business. Net cash provided by operating activities in 2011 was primarily due to an increase in product revenue of approximately $41.9 million over the corresponding period in 2010, thereby significantly increasing gross profit and generating cash to pay our ongoing operating expenses.
Net cash used in investing activities during the years ended December 31, 2009, 2010 and 2011 was approximately $269,000, $527,000 and $962,000, respectively. Net cash used in investing activities for all periods was primarily for the purchase of equipment supporting out research and development efforts as well as furniture, fixtures and computer equipment associated with the growth in personnel.
Net cash provided by financing activities during the years ended December 31, 2009 and 2010 was approximately $964,000 and $8.1 million, respectively. Net cash used in financing activities for the year ended December 31, 2011 was approximately $129,000. Net cash provided by financing activities during 2009 and 2010 consisted primary of sales of our securities. Net cash used in financing activities during 2011 consisted primarily of proceeds from the exercise of common stock warrants and stock options offset by costs incurred to date associated with our planned public offering of our common stock as originally announced on August 19, 2011.
We believe that our business plan will provide sufficient liquidity to fund our operating needs for the next 12 months. However, there are factors that can impact our ability continue to fund our operating needs, including:
| |
●
|
Our ability to maintain product pricing as expected, particularly in light of increased competition and its unknown effects on market dynamics;
|
| |
●
|
Our and our contract manufacturer’s ability to reduce manufacturing costs as expected;
|
| |
●
|
Our ability to expand sales volume, which is highly dependent on the smart grid implementation plans of Duke Energy and other utilities; and
|
| |
●
|
The need for us to continue to invest in operating activities in order to remain competitive or acquire other businesses and technologies in order to complement our products, expand the breadth of our business, enhance our technical capabilities or otherwise offer growth opportunities.
|
If we cannot effectively manage these factors, we may need to raise additional capital in order to fund our operating needs. If we are unable to obtain adequate financing or financing on terms satisfactory to us when we require it, our ability to continue to grow or support our business and to respond to business challenges could be significantly limited.
Off-Balance Sheet Arrangements
As of December 31, 2010 and 2011, we did not have any relationships with unconsolidated entities or financial partnerships, such as entities often referred to as structured finance or special purpose entities, which would have been established for the purpose of facilitating off-balance sheet arrangements or other contractually narrow or limited purposes. Other than our operating leases for office space and certain other capital lease obligations, we do not engage in off-balance sheet financing arrangements. In addition, we do not engage in trading activities involving non-exchange traded contracts. As such, we are not materially exposed to any financing, liquidity, market or credit risk that could arise if we had engaged in these relationships.
Contractual Obligations and Commitments
The following table summarizes our contractual obligations as of December 31, 2011 and the effect such obligations are expected to have on our liquidity and cash flow in future periods:
|
(in thousands)
|
|
Payments Due By Period
|
|
|
Contractual Obligations
|
|
Total
|
|
|
Less Than
1 Year
|
|
|
1 – 3
Years
|
|
|
3 – 5
Years
|
|
|
More Than
5 years
|
|
|
Operating Lease Obligations
|
|
|
558
|
|
|
|
558
|
|
|
|
0
|
|
|
|
0
|
|
|
|
0
|
|
|
Total
|
|
$
|
558
|
|
|
$
|
558
|
|
|
$
|
0
|
|
|
$
|
0
|
|
|
$
|
0
|
|
Recently Issued Accounting Pronouncements
On January 1, 2011, we adopted Accounting Statement Update (ASU) 2009-13 (ASU 2009-13),“Revenue Recognition (Topic 605): Multiple-Deliverable Revenue Arrangements,” which eliminates the residual method of allocation, and instead requires companies to use the relative selling price method when allocating revenue in a multiple deliverable arrangement. When applying the relative selling price method, the selling price for each deliverable shall be determined using vendor specific objective evidence of selling price, if it exists and otherwise using third-party evidence of selling price. If neither vendor specific objective evidence nor third-party evidence of selling price exists for a deliverable, companies shall use their best estimate of the selling price for that deliverable when applying the relative selling price method. We elected to adopt this guidance prospectively for all revenue arrangements entered into or materially modified after the date of adoption. The adoption of ASU 2009-13 did not have a material effect on our financial position, results of operations or cash flows.
On January 1, 2011, we adopted ASU 2010-17 (ASU 2010-17), "Revenue Recognition-Milestone Method (Topic 605): Milestone Method of Revenue Recognition." The amendments in this Update are effective on a prospective basis for milestones achieved in fiscal 2011 and thereafter. Our adoption of ASU 2010-17 did not have a material effect on our financial position, results of operations or cash flows.
In May 2011, the Financial Accounting Standards Board (FASB) issued ASU No. 2011-04: Fair Value Measurement (Topic 820): Amendments to Achieve Common Fair Value Measurement and Disclosure Requirements in U.S. GAAP and IFRSs (ASU 2011-04). ASU 2011-04 clarifies application of fair value measurement and disclosure requirements and is effective for annual periods beginning after December 15, 2011. We do not expect that the provisions of ASU 2011-04 will have a material effect on our financial position and results of operations.
In June 2011, the FASB issued ASU No. 2011-05: Comprehensive Income (Topic 220): Presentation of Comprehensive Income (ASU 2011-05). ASU 2011-05 provides that an entity that reports items of other comprehensive income has the option to present comprehensive income in either one continuous financial statement or two consecutive financial statements. ASU 2011-05 is effective for annual periods beginning after December 15, 2011. We do not expect ASU 2011-05 to have any material impact on our financial position and results of operations.
In September 2011, the FASB issued ASU 2011-08 (ASU 2011-08), “Intangibles Goodwill and Other (Topic 350): Testing Goodwill for Impairment” ASU 2011-08 updated the guidance on the periodic testing of goodwill for impairment. The updated guidance gives companies the option to perform a qualitative assessment to determine whether it is more likely than not that the fair value of a reporting unit is less than its carrying amount. The amendment is intended to reduce the cost and complexity of the annual goodwill impairment test by providing entities an option to perform a qualitative assessment to determine whether further impairment testing is necessary. The update ASU 2011-08 is effective for fiscal years beginning after December 15, 2011, with early adoption permitted. We do not expect ASU 2011-08 to have a material effect on our financial position, results of operation or cash flows
We do not believe that any other recently issued, but not yet effective, accounting standard if currently adopted would have a material effect on our accompanying financial statements.
ITEM 7A. QUANTITAVE AND QUALITATIVE DISCLOSURES ABOUT MARKET RISK
Market risk is a broad term for the risk of economic loss due to adverse changes in the fair value of a financial instrument. These changes may be the result of various factors, including interest rates, foreign exchange rates, commodity prices and/or equity prices. In the normal course of doing business, we may be exposed to the risks associated with foreign currency exchange rates and changes in interest rates.
Foreign Currency Exchange Risk. We bill our customers predominately in U.S. dollars and receive payment predominately in U.S. dollars. Additionally, although our products are manufactured by our contract manufacturer in China, we pay our obligations to it in U.S. dollars. Accordingly, our results of operations and cash flows are not materially subject to fluctuations due to changes in foreign currency exchange rates. If we increase sales of our products outside of the United States, our contracts with foreign customers may be denominated in foreign currency and may become subject to changes in currency exchange rates.
Interest Rate Sensitivity. Interest income and expense are sensitive to changes in the general level of U.S. interest rates. However, based on the nature and current level of our investments, which are cash and cash equivalents, we believe there is no material risk of exposure.
Seasonality. Historically, we have not experienced significant seasonal fluctuations or variations in sales. Since our communications nodes are physical devices that are manually installed by utilities, weather conditions may temporarily impact the timing of deployment. However, we do not expect that adverse weather conditions will result in substantial fluctuations or variations of sales in any particular reporting period.
ITEM 8. FINANCIAL STATEMENTS AND SUPPLEMENTARY DATA
The information called for by Item 8 is included following the "Index to Financial Statements" on page F-1 contained in this Amended Filing.
ITEM 9. CHANGES IN AND DISAGREEMENTS WITH ACCOUNTANTS ON ACCOUNTING AND FINANCIAL DISCLOSURE
None
ITEM 9A. CONTROLS AND PROCEDURES - RESTATED
EVALUATION OF DISCLOSURE CONTROLS AND PROCEDURES.
We maintain disclosure controls and procedures that are designed to provide reasonable assurance that information required to be disclosed in our Exchange Act reports is recorded, processed, summarized and reported within the time periods specified in the SEC's rules and forms, and that such information is accumulated and communicated to management, including our Chief Executive Officer and our Chief Financial Officer to allow timely decisions regarding required disclosure based on the definition of "disclosure controls and procedures" in Rule 13a-15(e).
At the time that our Annual Report on Form 10-K for the year ended December 31, 2011 was filed on March 6, 2012, our Chief Executive Officer and Chief Financial Officer concluded that our disclosure controls and procedures were effective to provide such reasonable assurance as of December 31, 2011. Subsequent to that evaluation, our management, including our Chief Executive Officer and Chief Financial Officer, concluded that our disclosure controls and procedures were not effective to provide such reasonable assurance as of December 31, 2011 because of a material weakness in our internal control over financial reporting described below under the heading Management’s Report on Internal Control Over Financial Reporting. Notwithstanding the material weakness described below, management, based upon the work performed during the restatement process, has concluded that our financial statements in this Amended Annual Report on Form 10K/A are fairly stated in all material respects in accordance with generally accepted accounting principles for each of the periods presented herein.
MANAGEMENT’S REPORT ON INTERNAL CONTROL OVER FINANCIAL REPORTING (RESTATED)
Management is responsible for establishing and maintaining adequate internal control over financial reporting, as such term is defined in Rule 13a-15(f) or Rule 15d-15(f) of the Exchange Act. Our internal control over financial reporting is a process designed to provide reasonable assurance regarding the reliability of financial reporting and the preparation of financial statements prepared for external purposes in accordance with generally accepted accounting principles. Our internal control over financial reporting includes those policies and procedures that (a) pertain to the maintenance of records that, in reasonable detail, accurately and fairly reflect the transactions and disposition of the company’s assets; (b) provide reasonable assurance that transactions are recorded as necessary to permit preparation of financial statements in accordance with generally accepted accounting principles, and that receipts and expenditures are being made only in accordance with authorizations of management and the directors of the company; and (c) provide reasonable assurance regarding prevention or timely detection of unauthorized acquisition, use or disposition of the company’s assets that could have a material effect on the financial statements.
Because of its inherent limitations, internal control over financial reporting may not prevent or detect misstatements. Also, projections of any evaluation of effectiveness to future periods are subject to the risk that controls may become inadequate because of changes in conditions, or that the degree of compliance with the policies or procedures may deteriorate.
Management, including our Chief Executive Officer and Chief Financial Officer, assessed the effectiveness of our internal control over financial reporting as of December 31, 2011. In making its assessment, management used the criteria set forth by the Committee of Sponsoring Organizations of the Treadway Commission in Internal Control-Integrated Framework (“COSO criteria”).
A material weakness is a deficiency, or a combination of deficiencies, in internal control over financial reporting, such that there is a reasonable possibility that a material misstatement of the company’s annual or interim financial statements will not be prevented or detected on a timely basis.
In Management’s Report on Internal Control Over Financial Reporting included in our original Annual Report on Form 10-K for the year ended December 31, 2011, management, including our Chief Executive Officer and Chief Financial Officer, concluded that we maintained effective internal control over financial reporting as of December 31, 2011. In connection with the restatement discussed in Note 2 to our consolidated financial statements in this Amended Annual Report on Form 10-K/A, management, including our Chief Executive Officer and Chief Financial Officer, reassessed the effectiveness of our internal control over financial reporting as of December 31, 2011. Based on this reassessment using the COSO criteria, management has concluded that we did not maintain effective internal control over financial reporting as of December 31, 2011 because of a material weakness relating to (1) our accounting for embedded derivatives associated with certain convertible debt and warrants to purchase common stock, (2) the valuation of stock based compensation, and (3) the selection of appropriate revenue recognition accounting guidance relating to certain customer contracts. This material weakness resulted in a material misstatement of our liabilities, non-cash expenses relating to the changes in fair value of common stock warrants and embedded derivatives and accumulated deficit accounts and related financial disclosures and the restatement of our consolidated financial statements for the years ended December 31, 2009, 2010 and 2011, and the unaudited interim financial statements for the quarters ended March 31, June 30, and September 30 for such years as discussed in Note 2 to our consolidated financial statements included in this Annual Report on Form 10-K/A. Additionally, this deficiency could result in misstatements of the aforementioned accounts and disclosures that would result in a material misstatement of the financial statements that would not be prevented or detected.
Restatement of Consolidated Financial Statements
In connection with the preparation of Form 10-Q for the quarter ended June 30, 2012, management of the Company concluded that certain previously filed financial statements did not properly account for embedded derivative features of certain historical debt and warrants issued by the Company, which are described in detail below.
Convertible Debt: Certain historical convertible notes (the “Notes”) issued by the Company were previously recorded at their discounted face value. The discounts were comprised of both beneficial conversion features associated with the Notes and the fair value of warrants issued in connection with the Notes. However, the Notes contained certain features, including anti-dilution price protection and others that, in accordance with ASC-815, Derivatives and Hedging (“ASC 815”), should have been bifurcated from the host contract and accounted for as a derivative instrument (the “Embedded Derivatives”). Such Embedded Derivatives are recorded as a separate liability at their fair value on the date of issuance, and as a corresponding discount to the Notes which is amortized as interest expense over the term of the Notes. Changes in the fair values of these instruments require adjustments to the amount of the liabilities recorded on the Company’s balance sheet, and the corresponding gain or loss is required to be recorded in the Company’s statement of operations, as long as the Notes are outstanding.
Warrants: In connection with issuing the Notes, as well as in connection with other financing transactions, the Company issued warrants to purchase common stock (collectively, the “Warrants”). The Company had previously classified the value of the Warrants as equity. After further review, the Company determined that these instruments should have been classified as liabilities in accordance with ASC 815, due primarily to an anti-dilution price protection feature. Changes in the fair values of these instruments require adjustments to the amount of the liabilities recorded on the Company’s balance sheet, and the corresponding gain or loss is required to be recorded in the Company’s statement of operations.
Stock-based Compensation: The Company had previously used volatility assumptions based on the historical volatility of the price of the Company's common stock, which, based on the historical trading activity of the stock, resulted in inflated price volatilities that were not necessarily indicative of the expected volatility and were substantially higher than other peer-industry companies. Upon further review of the volatility assumptions, the Company determined that it was more appropriate to use an expected volatility based on the volatilities of its industry peer group. Such an approach was used to determine appropriate volatility assumptions for valuation purposes of the Embedded Derivatives and Warrants. As a result, assumed volatilities are lower than those previously used, which reduces stock-based compensation expense.
In addition to the adjustments listed above, the Company recorded immaterial adjustments to revenue to account for the deferral of maintenance revenue arising from the initial period of free maintenance provided upon shipment of our communication nodes.
All of the necessary adjustments relating to the Notes and Warrants are non-cash in nature and do not impact the Company’s total cash flows from operating, investing and financing activities. The adjustments are primarily related to complex accounting requirements of certain characteristics of the Notes and Warrants that require the recording of debt discounts and related amortization, mark-to-market adjustments in the fair value of Warrants and Embedded Derivatives and gains or losses associated with the extinguishment of debt under certain circumstances.
Remediation Plan
We are in the process of remediating this material weakness by, among other things, augmenting our professional staff, providing additional training for our accounting staff, implementing and modifying certain accounting procedures, and seeking assistance from third parties with respect to complex technical accounting issues. If we fail to remediate this material weakness or fail to otherwise maintain effective controls over financial reporting in the future, it could result in a material misstatement of our financial statements that would not be prevented or detected on a timely basis and which could cause investors and other users to lose confidence in our financial statements.
Management believes the foregoing efforts will effectively remediate the material weakness. As the Company continues to evaluate and work to improve its internal control over financial reporting, management may execute additional measures to address potential control deficiencies or modify the remediation plan described above. Management will continue to review and make necessary changes to the overall design of the Company’s internal control.
Changes in Internal Control over Financial Reporting
During our fourth quarter ended December 31, 2011, there were no changes made in our internal control over financial reporting (as such term is defined in Rules 13a-15(f) and 15d-15(f) of the Exchange Act) that have materially affected, or are reasonably likely to materially affect, the Company’s internal control over financial reporting.
ITEM 9B. OTHER INFORMATION
None.
ITEM 10. DIRECTORS, EXECUTIVE OFFICERS AND CORPORATE GOVERNANCE
The following table sets forth certain information regarding our Directors and Executive Officers. The age of each Director and Executive Officer listed below is given as of September 24, 2012:
|
Name
|
|
Age
|
|
Position
|
|
|
|
John J. Joyce (1)
|
|
|
60
|
|
Chairman of the Board, Chief Executive Officer, President and Director
|
|
|
|
Ramdas Rao
|
|
|
47
|
|
Chief Technology Officer and Senior Vice President
|
|
|
|
Mark L. Fidler
|
|
|
41
|
|
Chief Financial Officer, Treasurer and Vice President
|
|
|
|
Michael Widland (2)
|
|
|
71
|
|
Director
|
|
|
|
D. Howard Pierce (3)(4)
|
|
|
71
|
|
Director
|
|
|
|
Thomas Michael Higgins (3) (4)
|
|
|
57
|
|
Director
|
|
|
|
Shad L. Stastney (1)
|
|
|
43
|
|
Director
|
|
|
|
Francesca E. Scarito (2)(3)
|
|
|
48
|
|
Director
|
|
|
|
(1)
|
Member of the Finance Committee
|
|
(2)
|
Member of the Compensation Committee
|
|
(3)
|
Member of the Audit Committee
|
|
(4)
|
Member of the Nominating and Corporate Governance Committee
|
John J. Joyce has been the Chairman of the Board of Directors, Chief Executive Officer, and President since September 2001, and served as our Chief Operating Officer from November 2000 through August 2001. Since September 2010, Mr. Joyce has served on the Finance Committee. Prior to August 2011, Mr. Joyce also served as our Treasurer. From September 1996 to October 2000, Mr. Joyce served as Senior Vice President of ABB Financial Services Inc. and President of ABB Financial Consulting, the Americas, where he also led the global energy consulting practice within Financial Services. Mr. Joyce developed the Americas branch of ABB Financial Consulting, the financial management consultancy business of ABB Financial Services. From December 1993 to August 1996, Mr. Joyce served with The Capital Markets & Treasury Practice of Price Waterhouse LLP. Returning to the firm he had previously served for more than five years in the general audit practice, Mr. Joyce assumed the responsibilities of Manager, in which he advised corporations on a variety of business issues and strategies. Mr. Joyce was promoted to Director in June 1995. Mr. Joyce brings to our board significant experience in the energy industry and a deep knowledge of our business and our customers, and contributes a perspective based on his previous career in both finance and accounting.
Ramdas Rao has been our Chief Technology Officer since September 2006 and Senior Vice President since October 2010, has served as our Chief Technology Officer since July 2006 and served as our Chief Network Architect from September 2000 through July 2006. From March 2000 until September 2000, Mr. Rao was the Chief Information Officer at Mullen, a large advertising agency in North America. From November 1995 until February 2000, he was the President and Co-Founder of Gaialinks Inc., a company engaged in the development of network management software tools and providing network analysis and consulting services for large heterogeneous, multi-vendor, multi-protocol networks and systems. From January 1990 through November 1995, he was affiliated with Boston University where he was Associate Director (from January 1995 through November 1995) and a Network Systems Manager (from July 1990 through December 1994).
Mark L. Fidler has been our Principal Financial Officer and Vice President since June 2011 and our Chief Financial Officer since August 4, 2011. Mr. Fidler has also served as our Treasurer since August 15, 2011. Prior to joining our company, Mr. Fidler spent ten years at Evergreen Solar Inc. in positions of increasing responsibility, first as Corporate Controller from 2001 to 2006 and most recently as Vice President of Finance and Treasurer. While at Evergreen Solar, Mr. Fidler was responsible for developing and implementing corporate-wide accounting and finance infrastructure and internal controls to support the Company’s world-wide expansion to over $330 million in revenue. Mr. Fidler also was responsible for worldwide information technology and Investor Relations and played key roles in securing almost $1 billion in financing during his tenure with Evergreen Solar. Prior to his tenure at Evergreen Solar, Mr. Fidler held various senior finance roles at The Boston Consulting Group from 1998 to 2001 and Hampshire Chemical, a division of Dow Chemical, from 1996 to 1998. From 1992 to 1995, Mr. Fidler was with the audit practice of Coopers & Lybrand.
Michael L. Widland has served on our Board of Directors since November 2000 and serves on the Compensation Committee as its chair (since March 2001). Mr. Widland has been actively practicing law since 1965 and is presently a partner at Shipman & Goodwin LLP of Stamford, Connecticut. Mr. Widland practices in the areas of commercial and corporate transactions, including financing. He is a former Connecticut Chairman of the Public Contract Section and Business Law Section of the American Bar Association and a member of the Association of Commercial Finance Attorneys. Mr. Widland’s academic degrees combined with his extensive professional experience in corporate law provide our board with valuable resources in its work to ensure that we comply with rules and regulations applicable to us.
D. Howard Pierce has served on our Board of Directors since November 2004 and serves on the Audit Committee (since November 2004) and Nominating and Corporate Governance Committee as its chair (since July 2011). Until his retirement in June 2001, he served as President and CEO of ABB, Inc., a $5 billion U.S. subsidiary of global industrial, energy and automation provider ABB, Ltd. Prior to assuming leadership of ABB, Inc., Mr. Pierce served in a number of key executive positions, including President of ABB’s Steam Power Plants and Environmental Systems and President of ABB China Ltd. In addition to serving on our board, Mr. Pierce serves on the board of directors of Harsco Corporation, a publicly traded, New York Stock Exchange-listed company, where he also serves as chairman of the Audit and Compensation Committees. Mr. Pierce’s executive experience in the international business community with a specific focus on serving the utility industry while at ABB provides our board with a business perspective and insight that is beneficial to our company.
Thomas Michael Higgins has served on our Board of Directors since September 2006 and serves on the Audit Committee as its chair (since September 2006) and the Nominating and Corporate Governance Committee (since July 2011). Mr. Higgins has served as the Senior Vice President of Finance and Chief Financial Officer of the College Board since June 2003. Prior to the College Board, Mr. Higgins was a partner in the New York City accounting firm of Silverman Linden Higgins LLP from February 1993 to June 2003. Mr. Higgins also worked in the New Jersey offices of Coopers & Lybrand LLP from January 1992 to January 1993 and at Ernst & Young LLP from 1977 to 1991. Mr. Higgins is a member of the American Institute of Certified Public Accountants as well as the New Jersey and New York State Society of Certified Public Accountants. Mr. Higgins’ extensive experience as a certified public accountant was instrumental in his appointment to the Audit Committee and provides our board with a critical accounting perspective.
Shad L. Stastney has served on our Board of Directors since June 2008. He has also served on the Finance Committee since September 2010 and as its chair since August 2011. Mr. Stastney is a founding partner of Vicis Capital, LLC, the investment advisor to Vicis Capital Master Fund, or Vicis, a multi-strategy hedge fund. Mr. Stastney has served as Chief Operating Officer of Vicis Capital since June 2004. Prior to Vicis Capital, from July 2001 through May 2004, Mr. Stastney served in the same capacity at Victus Capital. Before Victus Capital, Mr. Stastney was a Director at Credit Suisse First Boston in New York. Mr. Stastney currently serves on the boards of directors of China Hydroelectric Corp., China New Energy Group Company, OptimizeRx Corporation, The Amacore Group, Inc., Master Silicon Carbide Industries, Inc., Deer Valley Corporation, Infusion Brands International, Inc., and Zurvita Holdings, Inc. and formerly served on the board of MDWerks, Inc. and Medical Solutions Management, Inc. Mr. Stastney’s background and experience provide management and the Board with significant experience in growing companies.
Francesca E. Scarito has served on our Board of Directors since June 2011 and serves on the Audit Committee (since July 2011) and Compensation Committee (since July 2011). Ms. Scarito is President of RS Finance & Consulting, LLC, a boutique investment bank located in Boston, Massachusetts. Ms. Scarito has been an investment banker for over 20 years and has extensive experience in private capital, equity capital markets and mergers and acquisitions. Prior to joining RS Finance & Consulting, LLC in April 2009, Ms. Scarito was a Managing Director of Canaccord Adams Inc. from May 2007 through October 2008. Ms. Scarito also was a Managing Director at Legacy Partners Group LLC from July 2004 through February 2007 and at its successor Friedman Billings Ramsey from February 2007 through April 2007. Ms. Scarito’s extensive experience advising corporate executives and boards of directors on strategic initiatives, financings and capital markets strategy make her a valuable, objective resource for our company on these matters.
Our executive officers are appointed by, and serve at the discretion of, our Board of Directors. There are no family relationships between any of the above executive officers or directors or any other person nominated or chosen to become an executive officer or a director. Pursuant to the terms of the employment agreement between us and Mr. Joyce, so long as the employment agreement remains in effect, Mr. Joyce will be nominated to the Board of Directors as part of management’s slate of directors. Additionally, pursuant to the terms of a securities purchase agreement, dated July 31, 2007, between us and Vicis, so long as Vicis’ fully diluted ownership of the company is 10% or greater, Vicis is entitled to designate one member to our Board of Directors
Board of Directors
Our Board of Directors currently consists of six directors. All directors hold office until the next annual meeting of stockholders. At each annual meeting of stockholders, the successors to directors whose terms then expire are elected to serve from the time of election and qualification until the next annual meeting following election
Board Committees
Our Board of Directors has established an Audit Committee, a Compensation Committee and a Nominating and Corporate Governance Committee, with each comprised of independent directors. Our Board of Directors has also established a Finance Committee. Each committee operates under a charter that has been approved by our Board of Directors. Copies of our committee charters are available on the investor relations section of our website, which is located at www.ambientcorp.com.
Audit Committee
The members of our Audit Committee are Messrs. Higgins and Pierce and Ms. Scarito. Mr. Higgins is the chair of the Audit Committee, is independent as defined in the listing standards of The Nasdaq Stock Market, and is also an “Audit Committee financial expert,” as defined in applicable SEC rules.
SECTION 16(a) BENEFICIAL OWNERSHIP REPORTING COMPLIANCE
Section 16(a) of the Securities Exchange Act of 1934, as amended (the “Exchange Act”), requires officers and directors of the Company and persons who beneficially own more than ten percent (10%) of the Common Stock outstanding to file initial statements of beneficial ownership of Common Stock (Form 3) and statements of changes in beneficial ownership of Common Stock (Forms 4 or 5) with the SEC. Officers, directors and greater than 10% stockholders are required by SEC regulation to furnish the Company with copies of all such forms they file.
Based solely on review of the copies of such forms received by the Company with respect to 2011, or written representations from certain reporting persons, each of Mark Fidler, our Chief Financial Officer and Francesca E. Scarito, one of our non-employee-directors, failed to file on a timely basis their respective Forms 3 which were filed on August 11, 2011, in the case of Mark Fidler, and August 9, 2011, in the case of Francesca Scarito.
Code of Business Conduct and Ethics
Our Board of Directors has adopted a written Code of Business Conduct and Ethics that applies to our directors, officers and employees, including our principal executive officer, principal financial officer, principal accounting officer or controller, and persons performing similar functions. A copy of our Code of Business Conduct and Ethics is posted on the investor relations section of our website, which is located at www.ambientcorp.com. We intend to post on our website any amendments to the Code of Business Conduct and Ethics, or any waiver of its requirements.
We will provide a copy of the Code of Business Conduct and Ethics to any person without charge, upon request in writing to Ambient Corporation, 7 Wells Avenue, Suite 11, Newton, MA 02459. Attn: Secretary.
ITEM 11. EXECUTIVE COMPENSATION
The following table sets forth the total compensation received for services rendered in all capacities to our company for the last three fiscal years, which was awarded to, earned by, or paid to our Chief Executive Officer, Chief Financial Officer and each of our other most highly compensated executive officers whose total compensation exceeded $100,000 during 2011, which we refer to collectively as our "Named Executive Officers."
SUMMARY COMPENSATION TABLE
| |
|
|
Salary
|
|
|
Bonus
|
|
|
Option Awards
|
|
|
Other
Compensation |
|
|
|
|
|
Name and Principal Position
|
Year
|
|
($)
|
|
|
($)
|
|
|
($)(1)
|
|
|
($)(3) |
|
|
Total ($)
|
|
| |
|
|
|
|
|
|
|
|
|
|
|
|
|
|
|
|
|
John J. Joyce,
|
2011
|
|
|
380,956 |
|
|
|
150,000 |
|
|
|
1,050,159 |
|
|
35,894 |
|
|
|
1,617,009 |
|
|
Chairman of the Board, Chief Executive Officer, President and Director
|
2010
|
|
|
341,419 |
|
|
|
60,000 |
|
|
|
719,061 |
|
|
31,481 |
|
|
|
1,151,961 |
|
| |
2009
|
|
|
330,602 |
|
|
|
50,000 |
|
|
|
94,028 |
|
|
30,767 |
|
|
|
505,397 |
|
| |
|
|
|
|
|
|
|
|
|
|
|
|
|
|
|
|
|
|
|
|
| |
|
|
|
|
|
|
|
|
|
|
|
|
|
|
|
|
|
|
|
|
|
Ramadas Rao,
|
2011
|
|
|
278,231 |
|
|
|
120,000 |
|
|
|
1,050,159 |
|
|
11,500 |
|
|
|
1,459,890 |
|
|
Chief Technology Officer and Senior Vice President
|
2010
|
|
|
250,000 |
|
|
|
50,000 |
|
|
|
653,692 |
|
|
9,865 |
|
|
|
963,557 |
|
| |
2009
|
|
|
241,170 |
|
|
|
50,000 |
|
|
|
94,028 |
|
|
8,135 |
|
|
|
393,333 |
|
| |
|
|
|
|
|
|
|
|
|
|
|
|
|
|
|
|
|
|
|
|
|
Mark L. Fidler, (2)
|
2011
|
|
|
132,692 |
|
|
|
40,000 |
|
|
|
349,836 |
|
|
— |
|
|
|
522,528 |
|
|
Chief Financial Officer, Treasurer and Vice President
|
|
|
|
|
|
|
|
|
|
|
|
|
|
|
|
|
|
|
|
|
|
(1)
|
Amounts in this column reflect the aggregate grant date fair value computed in accordance with FASB ASC 718 with respect to employee stock options granted under our 2000 Equity Incentive Plan. The assumptions used to calculate the fair value of stock option grant are set forth in Note 10 (Stock Based Compensation) to our restated financial statements, which are included in this Amended Annual Report on Form 10-K/A.
|
| (2) |
Mark L. Fidler joined us as our Principal Financial Officer and Vice President in June 2011 and became our Chief Financial Officer effective as of August 4, 2011. Mr. Fidler is also our Treasurer.
|
| (3) |
Represents the Company’s matching contribution to the Company’s Simple IRA Plan and, for John J. Joyce, three weeks paid vacation time, the payout of which is not generally available to our salaried employees.
|
Grants of Plan-Based Awards for Year Ended December 31, 2011
The following table sets forth information on grants of plan-based awards in 2011 to our Named Executive Officers.
| Name |
|
|
|
|
|
|
|
| |
|
|
|
|
|
|
|
|
John J. Joyce,
|
12/20/2011
|
|
|
340,000 |
|
|
|
1,050,159 |
|
|
Chairman of the Board, Chief Executive Officer, President and Director
|
|
|
|
|
|
|
|
|
|
|
Ramdas Rao,
|
12/20/2011
|
|
|
340,000 |
|
|
|
1,050,159 |
|
|
Chief Technology Officer and Senior Vice President
|
|
|
|
|
|
|
|
|
|
|
Mark L. Fidler,
|
6/20/2011
|
|
|
20,000 |
|
|
|
86,588 |
|
|
Chief Financial Officer, Treasurer and Vice President
|
8/4/2011
|
|
|
30,000 |
|
|
|
170,587 |
|
| |
12/20/2011
|
|
|
30,000 |
|
|
|
92,661 |
|
Outstanding Equity Awards at December 31, 2011
The following table sets forth information concerning equity awards held by each of our Named Executive Officers as of December 31, 2011.
|
Name
|
|
Number of Securities Underlying Options (#) Exercisable
|
|
|
Number of Securities Underlying Options (#) Unexercisable
|
|
|
Option Exercise Price ($)
|
|
Option Expiration Date
|
| |
|
|
|
|
|
|
|
|
|
|
|
John J. Joyce,
|
|
|
3,750 |
|
|
|
|
|
$ |
10.00 |
|
9/11/2012
|
|
Chairman of the Board, Chief Executive Officer, President and Director
|
|
|
10,000 |
|
|
|
|
|
$ |
20.00 |
|
1/26/2014
|
| |
|
|
5,000 |
|
|
|
|
|
$ |
30.00 |
|
7/20/2014
|
| |
|
|
5,000 |
|
|
|
|
|
$ |
50.00 |
|
7/20/2014
|
| |
|
|
25,000 |
|
|
|
|
|
$ |
4.50 |
|
11/15/2017
|
| |
|
|
45,000 |
|
|
|
|
|
$ |
3.50 |
|
1/13/2019
|
| |
|
|
82,500 |
|
|
|
27,500 |
|
|
$ |
12.00 |
|
10/18/2020
|
| |
|
|
113,334 |
|
|
|
|
|
|
$ |
6.30 |
|
12/20/2021
|
| |
|
|
|
|
|
|
113,333 |
|
|
$ |
6.75 |
|
12/20/2021
|
| |
|
|
|
|
|
|
113,333 |
|
|
$ |
7.25 |
|
12/20/2021
|
| |
|
|
|
|
|
|
|
|
|
|
|
|
|
|
Ramadas Rao,
|
|
|
10,000 |
|
|
|
|
|
|
$ |
20.00 |
|
1/15/2012
|
|
Chief Technology Officer and Senior Vice President
|
|
|
2,000 |
|
|
|
|
|
|
$ |
20.00 |
|
9/11/2012
|
| |
|
|
8,000 |
|
|
|
|
|
|
$ |
20.00 |
|
1/26/2014
|
| |
|
|
3,750 |
|
|
|
|
|
|
$ |
20.00 |
|
8/11/2014
|
| |
|
|
3,750 |
|
|
|
|
|
|
$ |
20.00 |
|
8/11/2014
|
| |
|
|
10,000 |
|
|
|
|
|
|
$ |
4.50 |
|
11/15/2017
|
| |
|
|
45,000 |
|
|
|
|
|
|
$ |
3.50 |
|
1/13/2019
|
| |
|
|
75,000 |
|
|
|
25,000 |
|
|
$ |
12.00 |
|
10/18/2020
|
| |
|
|
113,334 |
|
|
|
|
|
|
$ |
6.30 |
|
12/20/2021
|
| |
|
|
|
|
|
|
113,333 |
|
|
$ |
6.75 |
|
12/20/2021
|
| |
|
|
|
|
|
|
113,333 |
|
|
$ |
7.25 |
|
12/20/2021
|
| |
|
|
|
|
|
|
|
|
|
|
|
|
|
|
Mark L. Fidler
|
|
|
5,000 |
|
|
|
15,000 |
|
|
$ |
7.50 |
|
6/20/2021
|
| Chief Financial Officer, Treasurer and Vice President |
|
|
5,000 |
|
|
|
25,000 |
|
|
$ |
10.40 |
|
8/4/2021
|
| |
|
|
10,000 |
|
|
|
|
|
|
$ |
6.30 |
|
12/20/2021
|
| |
|
|
|
|
|
|
10,000 |
|
|
$ |
6.75 |
|
12/20/2021
|
| |
|
|
|
|
|
|
10,000 |
|
|
$ |
7.25 |
|
12/20/2021
|
Option Exercises and Stock Vested in 2011
None of our Named Executive Officers acquired shares upon exercise of options, or had any stock awards vest, during 2011.
Employment Agreements
We and John J. Joyce entered into an amended and restated employment agreement dated as of December 30, 2008 pursuant to which Mr. Joyce serves as our Chief Executive Officer. Under the agreement, Mr. Joyce is entitled to be paid an annual salary, which in 2011 was $379,500, subject to an annual review and adjustments. By its terms, the agreement provided for an initial term ending December 31, 2010. After expiration of the initial term, the agreement automatically renews for successive two-year terms unless terminated by us upon written notice given not less than 90 days prior to the expiration of the then-current term. As no such notice has been given, the agreement remains in effect through December 31, 2012. The agreement also contains certain provisions for early termination, including in the event of a change in control, which may result in a severance payment equal to two years of base salary then in effect and the continuation of certain benefits. These severance benefits are discussed in more detail below under “Potential Payments upon Change of Control or Termination following a Change of Control.”
We and Ramdas Rao entered into an amended and restated employment agreement dated as of June 2, 2008, pursuant to which Mr. Rao serves as our Senior Vice President and Chief Technology Officer. Under the agreement for 2011, Mr. Rao was entitled to be paid an annual salary of $250,000, which was adjusted to $280,000 as of June 1, 2011. The employment agreement had an initial term that extended through December 31, 2009, subject to renewal for successive one-year terms unless either party gives notice of that party’s election to not renew to the other at least 60 days prior to the expiration of the then-current term. The agreement also contains certain provisions for early termination, which may result in a severance payment equal to one year of base salary then in effect. These severance benefits are discussed in more detail below under “Potential Payments upon Change of Control or Termination following a Change of Control.”
Mark L. Fidler joined us as our Principal Financial Officer and Vice President in June 2011 and became our Chief Financial Officer effective as of August 4, 2011. Mr. Fidler is also our Treasurer. Mr. Fidler receives an annual salary of $250,000, and he received a signing bonus of $12,500. We also granted to Mr. Fidler a stock option to purchase 20,000 shares of common stock under our 2000 Equity Incentive Plan at an exercise price of $7.50 per share, which options will vest in equal installments of 1,667 shares at the end of each 90 day period, with the first installment vesting on September 27, 2011. When Mr. Fidler became Chief Financial Officer, we entered into an employment agreement with Mr. Fidler, paid him an additional $12,500 bonus and granted him an additional stock option to purchase 30,000 shares of common stock at an exercise price of $10.40 per share, which options will vest in equal installments of 2,500 shares at the end of each 90 day period, with the first installment vesting on October 31, 2011. The agreement also contains certain provisions for early termination, which may result in a severance payment equal to one year of base salary then in effect.
Each of these agreements includes certain confidentiality and non-compete provisions that prohibit the executive from competing with us for one year, or soliciting our employees for one year, following the termination of his employment.
Potential Payments upon Change of Control or Termination following a Change of Control
Automatic Acceleration of Vesting Following a Change of Control. The following table summarizes the intrinsic value (that is, the value based upon our closing stock price on December 31, 2011 of $4.63, less any applicable exercise price) of stock options of our Named Executive Officers that would become exercisable or vested as a result of a change of control as of December 31, 2011:
| |
|
|
|
280G exciseTax and Gross-up Payment($) |
|
|
|
John J. Joyce
|
|
— |
|
|
—
|
|
—
|
| Ramdas Rao |
|
— |
|
|
—
|
|
—
|
|
Mark L Fidler
|
|
— |
|
|
—
|
|
—
|
Automatic Acceleration of Vesting upon an Involuntary Termination Following a Change of Control. Assuming the employment of our Named Executive Officers was terminated involuntarily and without cause, or such officers resigned with good reason, during the 12 months following a change of control occurring on December 31, 2011, in accordance with the terms of the employment agreements with the Named Executive Officers, our Named Executive Officers would be entitled to cash payments in the amounts set forth opposite their names in the below table, subject to any deferrals required under Section 409A of the Internal Revenue Code of 1986, as amended, or the Code, as well as acceleration of vesting for outstanding equity awards, as set forth in the below table. The following table summarizes the value of compensation and benefits payable and intrinsic value (that is, the value based upon our closing stock price on December 31, 2011 of $4.63, less any applicable exercise price) of stock options that would become exercisable or vested as a result of a termination occurring immediately following a change of control as of December 31, 2010.
| |
|
|
|
|
|
|
|
|
|
|
|
Total
|
| |
|
|
|
|
|
|
|
Accrued
|
|
Value of
|
|
Payments and
|
| |
|
|
|
|
|
Continuation
|
|
Vacation
|
|
Unvested
|
|
Value of
|
| |
|
Base Salary
|
|
Bonus
|
|
of Benefits
|
|
Pay
|
|
Stock Options
|
|
Equity Awards
|
| |
|
($)
|
|
($)
|
|
($)
|
|
($)
|
|
($)
|
|
($)
|
| |
|
|
|
|
|
|
|
|
|
|
|
|
|
|
|
|
|
|
|
|
|
|
|
|
|
John J. Joyce, Chairman of the Board, Chief Executive Officer, President and Director
|
|
|
759,000
|
|
|
|
—
|
|
|
|
64,220
|
|
|
|
14,596
|
|
|
|
—
|
|
|
|
837,816
|
|
|
Ramdas Rao, Chief Technology Officer and Senior Vice President
|
|
|
280,000
|
|
|
|
— |
|
|
|
14,813
|
|
|
|
2,714
|
|
|
|
— |
|
|
|
297,527
|
|
|
Mark L. Fidler, Chief Financial Officer, Treasurer and Vice President
|
|
|
250,000
|
|
|
|
— |
|
|
|
14,813
|
|
|
|
4,808
|
|
|
|
— |
|
|
|
269,621 |
|
| |
|
|
|
|
|
|
|
|
|
|
|
|
|
|
|
|
|
|
|
|
|
|
|
|
Risk Assessment of Compensation Policies and Practices
Our board of directors is responsible for reviewing our policies and practices with respect to risk assessment and risk management. In certain circumstances, board committees assist our board of directors in fulfilling its oversight role in certain areas of risk. For example, pursuant to its charter, the audit committee reviews our policies with respect to risk assessment and risk management associated with the accumulation, reporting and disclosure of our quarterly and annual historical financial information.
We have assessed the compensation policies and practices with respect to our employees, including our executive officers, and have concluded that they do not create risks that are reasonably likely to have a material adverse effect on our company. We will continue to monitor our compensation policies and practices to determine whether the incentives they create meet our risk management objectives.
Director Compensation
We paid each independent director $15,000 per annum for service on our Board of Directors in 2011. In addition, the Chairman of the Audit Committee received $11,000, and the Chairman of the Compensation Committee received $4,000.
The following table summarizes data concerning the compensation of our non-employee directors for the year ended December 31, 2011.
| |
|
Fees Earned or
|
|
|
Option
|
|
|
|
|
| |
|
Paid in Cash
|
|
|
Awards
|
|
|
Total
|
|
|
Director Name
|
|
($)
|
|
|
($)(1)
|
|
|
($)
|
|
| |
|
|
|
|
|
|
|
|
|
|
|
|
|
Michael L. Widland
|
|
|
19,000
|
|
|
|
200,683
|
(2)
|
|
|
219,683
|
|
|
D. Howard Pierce
|
|
|
15,000
|
|
|
|
200,683
|
(2)
|
|
|
215,683
|
|
|
Thomas Michael Higgins
|
|
|
26,000
|
|
|
|
200,683
|
(2)
|
|
|
226,683
|
|
|
Francesca E. Scarito
|
|
|
3,750
|
|
|
|
250,319
|
(2)(3)
|
|
|
254,069
|
|
|
Shad L. Stastney
|
|
|
—
|
|
|
|
—
|
|
|
|
—
|
|
| |
(1)
|
Amounts in this column reflect the aggregate grant date fair value computed in accordance with FASB ASC 718 with respect to stock options granted during 2011 under our 2002 Non-Employee Directors Stock Option Plan. The assumptions used to calculate the fair value of stock options granted are set forth in the notes to our financial statements, which are included in this Annual Report on Form 10K.
|
| |
(2)
|
Represents the grant date fair value of 90,000 stock options, 30,000 of which were granted at an exercise price of $6.30, 30,000 of which were granted at an exercise price of $6.75 and 30,000 of which were granted at an exercise price of $7.25.
|
| |
(3)
|
Ms. Scarito received 20,000 stock options upon her appointment to the Board of Directors at an exercise price of $5.83.
|
Compensation Committee Interlocks and Insider Participation
During 2011, our Compensation Committee consisted of Mr.Widland. In July of 2011, Ms. Scarito joined our Compensation Committee. Mr. Widland and Ms. Scarito have not at any time in the last year been one of our officers or employees; however, Mr. Widland is a partner of Shipman & Goodwin LLP, a law firm which provides legal services to our company from time to time. Please see “Certain Relationships and Related Party Transactions” for more information about our relationship with Shipman & Goodwin LLP. None of our executive officers has served as a member of the Board of Directors, or as a member of the compensation or similar committee, of any entity that has one or more executive officers who served on our Board of Directors or Compensation Committee during the year ended December 31, 2011.
ITEM 12. SECURITY OWNERSHIP OF CERTAIN BENEFICIAL OWNERS AND MANAGEMENT AND RELATED STOCKHOLDER MATTERS
The following table sets forth certain information, as of September 24, 2012, concerning the ownership of our common stock by: (a) each person who, to our knowledge, beneficially owned on that date more than 5% of our outstanding common stock; (b) each of our Directors and the Named Executive Officers; and (c) all of our current Directors and executive officers as a group.
|
Name of Beneficial Owner (1)
|
|
Number of Shares Beneficially Owned (2)
|
|
|
Percent of Common Stock (2)
|
|
|
Directors and Executive Officers:
|
|
|
|
|
|
|
|
|
| |
|
|
|
|
|
|
|
|
|
John J. Joyce, Chairman of the Board, Chief Executive Officer, President and Director
|
|
|
322,734
|
(3)
|
|
|
1.8
|
%
|
| |
|
|
|
|
|
|
|
|
|
Ramdas Rao, Chief Technology Officer and Senior Vice President
|
|
|
293,984
|
(4)
|
|
|
1.6
|
%
|
| |
|
|
|
|
|
|
|
|
|
Mark L. Fidler, Chief Financial Officer, Treasurer and Vice President
|
|
|
30,833
|
(5)
|
|
|
* |
|
| |
|
|
|
|
|
|
|
|
|
Michael Widland, Director
|
|
|
169,733
|
(6)
|
|
|
*
|
|
| |
|
|
|
|
|
|
|
|
|
D. Howard Pierce, Director
|
|
|
168,000
|
(7)
|
|
|
*
|
|
| |
|
|
|
|
|
|
|
|
|
Thomas Higgins, Director
|
|
|
166,000
|
(8)
|
|
|
*
|
|
| |
|
|
|
|
|
|
|
|
|
Francesca E. Scarito, Director
|
|
|
110,000
|
(9)
|
|
|
* |
|
| |
|
|
|
|
|
|
|
|
|
Shad L. Stastney, Director
|
|
|
––
|
|
|
|
*
|
|
| |
|
|
|
|
|
|
|
|
|
All Directors and executive officers as a group (8 persons) (10)
|
|
|
1,261,284
|
|
|
|
7.0
|
%
|
| |
|
|
|
|
|
|
|
|
| 5% Stockholders: |
|
|
|
|
|
|
|
|
| |
|
|
|
|
|
|
|
|
|
Vicis Capital Master Fund
|
|
|
13,860,917
|
(11)
|
|
|
80.5
|
%
|
* Indicates less than 1%.
|
(1)
|
Unless otherwise indicated, the address of each person listed is c/o Ambient Corporation, 7 Wells Avenue, Newton, Massachusetts 02459.
|
|
(2)
|
Beneficial ownership is determined in accordance with the rules of the SEC and generally includes voting or investment power with respect to securities. In accordance with SEC rules, shares of common stock issuable upon the exercise of options or warrants that are currently exercisable or that become exercisable within 60 days following September 24, 2012 are deemed to be beneficially owned by, and outstanding with respect to, the holder of such option or warrant. Except as indicated by footnote, and subject to community property laws where applicable, to our knowledge, each person listed is believed to have sole voting and investment power with respect to all shares of common stock beneficially owned by such person.
|
|
(3)
|
Represents (i) 9,400 shares of common stock, and (ii) 313,334 shares of common stock issuable upon the exercise of vested options issued under our 2000 Equity Incentive Plan. Does not include 226,666 shares of common stock issuable upon exercise of unvested options issued under our 2000 Equity Incentive Plan.
|
| |
|
|
(4)
|
Represents (i) 10,150 shares of common stock, and (ii) 283,834 shares of common stock issuable upon the exercise of vested options issued under our 2000 Equity Incentive Plan. Does not include 226,666 shares of common stock issuable upon exercise of unvested options issued under our 2000 Equity Incentive Plan.
|
| (5) |
Represents 30,833 shares of common stock issuable upon exercise of vested options issued under our 2000 Equity Incentive Plan. Does not include 49,167 shares of common stock issuable upon exercise of unvested options issued under our 2000 Equity Incentive Plan.
|
|
(6)
|
Represents (i) 1,333 shares of common stock, and (ii) 168,400 shares of common stock issuable upon the exercise of vested options issued under our 2002 Directors Plan.
|
|
(7)
|
Represents (i) 2,000 shares of common stock, and (ii) 166,000 shares of common stock issuable upon the exercise of vested options issued under our 2002 Directors Plan.
|
|
(8)
|
Represents 166,000 shares of common stock issuable upon exercise of vested options issued under our 2002 Directors Plan.
|
| |
|
| (9) |
Represents 110,000 shares of common stock issuable upon exercise of vested options issued under our 2002 Directors Plan.
|
|
(10)
|
Represents (i) 22,883 shares of common stock, (ii) 628,001 shares of common stock issuable upon exercise of vested options issued under our 2000 Equity Incentive Plan, and (iii) 610,400 shares of common stock issuable upon exercise of vested options issued under the 2002 Directors Plan. Does not include 502,499 shares of common stock issuable upon exercise of unvested options issued under our 2000 Equity Incentive Plan.
|
|
(11)
|
Represents (i) 13,297,084 shares of common stock, and (ii) 563,833 shares of common stock issuable upon exercise of warrants. All securities are held directly by Vicis Capital Master Fund, for which Vicis Capital LLC acts as investment advisor. Vicis Capital LLC may be deemed to beneficially own shares held by Vicis Capital Master Fund and any shares issuable to Vicis Capital Master Fund upon exercise of the warrants within the meaning of Rule 13d-3 of the Securities Exchange Act of 1934, as amended, by virtue of the voting and dispositive power over such shares granted by Vicis Capital Master Fund to Vicis Capital LLC. The voting and dispositive power granted to Vicis Capital LLC by Vicis Capital Master Fund may be revoked at any time. Vicis Capital LLC disclaims beneficial ownership of any shares reported herein. Shad L. Stastney, a member of our Board of Directors and a founder and principal of Vicis Capital LLC, John Succo and Sky Lucas share voting and dispositive control of these securities. No single natural person can exercise voting or investment power with respect to the securities owed by Vicis Capital Master Fund and investment decisions with respect to these securities are made by a majority of these persons.
|
EQUITY COMPENSATION PLAN INFORMATION
The following table sets forth, as of December 31, 2011, certain information relating to the Company’s equity compensation plans:
|
Plan Category
|
|
Number of
securities to
be issued
upon
exercise of
outstanding
options,
warrants and
rights
(a)
|
|
|
Weighted-
average
exercise price of
outstanding
options,
warrants
and rights
(b)
|
|
|
Number of
securities
remaining
available for
issuance
(c)
|
|
|
Equity compensation plan approved by security holders
|
|
|
3,858,357
|
|
|
$
|
10.63
|
|
|
|
725,258
|
(2)
|
|
Equity compensation plan not approved by security holders
|
|
|
15,000
|
(1)
|
|
$
|
12.10
|
|
|
|
––
|
|
|
Total
|
|
|
3,873,357
|
|
|
$
|
10.63
|
|
|
|
725,258
|
|
|
(1)
|
Comprised of (i) 10,000 shares of Common Stock issuable upon the exercise of non-plan options issued in October 2010 to a consultant and are exercisable through October 18, 2016, at a per share exercise price of $12.00 and (ii) 5,000 shares of Common Stock issuable upon the exercise of non-plan options issued in October 2010 to a consultant and are exercisable through October 20, 2016, at a per share exercise price of $12.30.
|
|
(2)
|
Comprised of (i) 588,058 shares of Common Stock available for issuances under the Company’s 2000 Equity Incentive Plan, and (ii) 137,200 shares of Common Stock available for issuances under the 2002 Directors Plan.
|
ITEM 13. CERTAIN RELATIONSHIPS AND RELATED TRANSACTIONS AND DIRECTOR INDEPENDENCE
Director Relationships
We retain the law firm of Shipman & Goodwin LLP, of which Mr. Michael Widland, a non-employee director and chair of the Compensation Committee, is a partner, to perform legal services from time to time. We paid Shipman & Goodwin $57,161 and $394,153 for legal services rendered during 2010 and 2011, respectively.
Mr. Shad Stastney, a director, is a founding partner of Vicis Capital Master Fund, which holds, approximately 84% of our outstanding stock. The shares are held directly by Vicis Capital Master Fund, for which Vicis Capital LLC acts as investment advisor. Vicis Capital LLC may be deemed to beneficially own the shares within the meaning of Rule 13d-3 of the Securities Exchange Act of 1934, as amended, by virtue of the voting and dispositive power over such shares granted by Vicis Capital Master Fund to Vicis Capital LLC. The voting and dispositive power granted to Vicis Capital LLC by Vicis Capital Master Fund may be revoked at any time.
Registration Rights
In connection with the purchase of certain of our securities, we have granted Vicis registration rights for our common stock, including shares which may be issued upon conversion of debentures or exercise of warrants.
These registration rights are set forth in the registration rights agreement, dated July 31, 2007, as amended on November 1, 2007, January 15, 2008, April 23, 2008 and November 21, 2008, and the registration rights agreement dated November 16, 2009, in each case, between us and Vicis and, in some circumstances, in warrants issued by us. The following description of the terms of the registration rights agreements and amendments is intended as a summary only and is qualified in its entirety by reference to the registration rights agreements and amendments filed as exhibits to this Amended Annual Report on Form 10-K/A.
Demand Registration Rights. At any time after the expiration of the lock-up agreement with Vicis (see “Shares Eligible for Future Sale — Lock-up Agreements”) Vicis may, pursuant to a registration rights agreement dated July 31, 2007, which was amended by a debenture amendment agreement, dated November 21, 2008 between us and Vicis and a registration rights agreement dated November 16, 2009 between us and Vicis, request that we register certain registrable shares, including shares issuable upon conversion of notes and exercise of warrants, for sale under the Securities Act. Pursuant to this agreement, we will be required to file a registration statement covering such registrable securities within 120 days of Vicis’ request.
Piggyback Registration Rights. In the event that we propose to register any of our securities under the Securities Act (except for the registration of securities to be offered pursuant to an employee benefit plan on Form S-8 or pursuant to a registration made on Form S-4 or any successor forms then in effect), we are required to include in these registrations all securities with respect to which we have received written requests for inclusion under our registration rights agreements, subject to certain limitations.
Expenses of Registration. We will pay all registration expenses, other than underwriting discounts and commissions and any transfer taxes related to any registration.
Indemnification. The registration rights agreements contain indemnification provisions pursuant to which we are obligated to indemnify the selling stockholders and any person who might be deemed to control any selling stockholder in the event of violation of securities laws or untrue or alleged untrue statement of material fact attributable to us contained in the registration statement, any prospectus or form of prospectus or in any amendment or supplement thereto. The registration rights agreements require that, as a condition to including their securities in any registration statement filed pursuant to demand or piggyback registration rights, the selling stockholders indemnify us for material misstatements or omissions attributable to them.
Additionally, the holders of certain warrants are entitled to registration rights with respect to the shares of our common stock issuable upon exercise of the warrants. Pursuant to the terms of these warrants, in the event that we propose to register any of our securities under the Securities Act (other than on a registration statement on Form S-4, S-8 or other limited purpose form), we are required, subject to certain limitations, to include in the registration statement all shares of our common stock issuable upon exercise of the warrants with respect to which we have received written requests for inclusion of such shares under our warrants. As of December 31, 2011, an aggregate amount of 1,123,484 shares of our common stock issuable upon exercise of warrants contain these registration rights
Employment Agreements
We have entered into employment agreements with Messrs. Joyce, Rao and Fidler. See “Executive Compensation — Employment Agreements” for additional information.
Policy for Approval of Related Party Transactions
The charter of our Audit Committee requires it to review our policies and procedures for reviewing and approving or ratifying “related person transactions” and to recommend any changes to our Board of Directors. In accordance with NASDAQ rules, the Audit Committee must conduct appropriate review and oversight of all related person transactions for potential conflict of interest situations on an ongoing basis. The Audit Committee has not adopted policies or procedures for review of, or standards for approval of, these transactions.
Director Independence
Our Board of Directors has determined that four of our six directors are independent directors within the meaning of the independence requirements of the NASDAQ Listing Rules. The independent directors are Messrs. Pierce, Higgins, Widland and Ms. Scarito.
ITEM 14. PRINCIPAL ACCOUNTANT FEES AND SERVICES
The following table summarizes fees for professional services rendered by Rotenberg, Meril, Solomon, Bertiger, & Guttilla, P.C. for the audit of the Company’s annual financial statements for 2010 and 2011:
|
Type of Service/Fee
|
|
2010
|
|
|
2011
|
|
|
Audit Fees (1)
|
|
$
|
105,000
|
|
|
$
|
105,000
|
|
|
Audit Related Fees (2)
|
|
|
16,121
|
|
|
|
43,085
|
|
|
Tax Fees
|
|
|
––
|
|
|
|
––
|
|
|
All Other Fees (3)
|
|
|
––
|
|
|
|
20,000
|
|
|
Total
|
|
$
|
121,121
|
|
|
$
|
168,085
|
|
_____________
|
(1)
|
Audit Fees consist of fees for professional services rendered for the audit of our financial statements included in the Annual Report on Form 10-K and the review of the interim financial statements included in the Quarterly Reports on Form 10-Q, and for the services that are normally provided in connection with regulatory filings or engagements.
|
|
(2)
|
Audit Related Fees consist of assurance and related services that were reasonably related to the performance of the audit or review of the Company’s financial statements. In 2011, these fees were related to the proxy and registrations statements. In 2010, these fees were for services related to the proxy, registration statements and a comment letter received from the SEC.
|
|
(3)
|
All Other Fees consist of fees for professional services rendered regarding the calculation of the Internal Revenue Service Section 382 limitation and determination of the amount of net operating loss carryforwards that are available.
|
The Audit Committee reviews non-audit services rendered for each year and determines whether such services are compatible with maintaining auditor independence. The Audit Committee’s policy is to pre-approve all audit services and all non-audit services that the Company’s independent public accountants are permitted to perform for the Company under applicable federal securities regulations. As permitted by the applicable regulations, the Audit Committee’s policy utilizes a combination of specific pre-approval on a case-by-case basis of individual engagements of the independent public accountants and general pre-approval of certain categories of engagements up to predetermined dollar thresholds that are reviewed annually by the Audit Committee.
PART IV
ITEM 15. EXHIBITS AND RESTATED FINANCIAL STATEMENT SCHEDULES
|
(a)
|
(1)
|
Financial Statements:
|
| |
Report of Independent Registered Public Accounting Firm
|
|
|
|
|
| |
|
|
|
|
|
| |
RESTATED FINANCIAL STATEMENTS:
|
|
|
|
|
| |
|
|
|
|
|
| |
Balance Sheets as of December 31, 2011 and 2010
|
|
|
|
|
| |
|
|
|
|
|
| |
Statements of Operations for the Years Ended December 31, 2011, 2010 and 2009
|
|
|
|
|
| |
|
|
|
|
|
| |
Statements of Changes in Stockholders’ Equity (Deficit) for the Years Ended December 31, 2011, 2010 and 2009
|
|
|
|
|
| |
|
|
|
|
|
| |
Statements of Cash Flows for the Years Ended December 31, 2011, 2010 and 2009
|
|
|
|
|
| |
|
|
|
|
|
| |
Notes to Financial Statements
|
|
|
|
|
| Exhibit Number |
|
Description |
| |
|
|
|
3
|
.1
|
|
Restated Certificate of Incorporation of Ambient Corporation, as amended (filed as Exhibit 3.1 to the Quarterly Report of Ambient Corporation on Form 10-Q for the three month period ended June 30, 2011, filed August 10, 2011).(1)
|
|
3
|
.2
|
|
Bylaws of Ambient Corporation (previously filed)
|
|
4
|
.1
|
|
Specimen Stock Certificate (previously filed)
|
|
4
|
.2
|
|
Common Stock Purchase Warrant (Series A) (filed as Exhibit 4.2 to the Current Report of Ambient Corporation on Form 8-K, filed July 31, 2007).(1)
|
|
4
|
.3
|
|
Common Stock Purchase Warrant (Series B) (filed as Exhibit 4.3 to the Current Report of Ambient Corporation on Form 8-K, filed July 31, 2007).(1)
|
|
4
|
.4
|
|
Common Stock Purchase Warrant (Series C) (filed as Exhibit 4.2 to the Current Report of Ambient Corporation on Form 8-K, filed July 31, 2007).(1)
|
|
4
|
.5
|
|
Common Stock Purchase Warrant (Series D) (filed as Exhibit 4.3 to the Current Report of Ambient Corporation on Form 8-K, filed November 5, 2007).(1)
|
|
4
|
.6
|
|
Common Stock Purchase Warrant (Series E) (filed as Exhibit 4.2 to the Current Report of Ambient Corporation on Form 8-K, filed January 17, 2008).(1)
|
|
4
|
.7
|
|
Warrant issued as of April 23, 2008 (filed as Exhibit 4.1 to the Quarterly Report of Ambient Corporation on Form 10-Q for the three month period ended June 30, 2008, filed August 14, 2008).(1)
|
|
4
|
.8
|
|
Common Stock Purchase Warrant (Series G) (filed as Exhibit 4.1 to the Quarterly Report of Ambient Corporation on Form 10-Q for the three month period ended September 30, 2009, filed November 16, 2009).(1)
|
|
10
|
.1
|
|
Ambient Corporation 2000 Equity Incentive Plan (filed as Appendix A to the Definitive Information Statement of Ambient Corporation on Schedule 14C, filed December 24, 2009).(1)+
|
|
10
|
.2
|
|
Ambient Corporation 2002 Non-Employee Directors Stock Option Plan (filed as Appendix B to the Definitive Information Statement of Ambient Corporation on Schedule 14C, filed December 24, 2009).(1)
|
|
10
|
.3
|
|
Amended and Restated Employment Agreement effective as of December 30, 2008 between Ambient Corporation and John Joyce (filed as Exhibit 10.4 to the Quarterly Report of Ambient Corporation on Form 10-Q for the three month period ended March 31, 2008, filed May 15, 2008).(1)+
|
|
10
|
.4
|
|
Amended and Restated Employment Agreement effective as of June 2, 2008 between Ambient Corporation and Ramdas Rao (filed as Exhibit 10.5 to the Quarterly Report of Ambient Corporation on Form 10-Q for the three month period ended March 31, 2008, filed May 15, 2008).(1)+
|
|
10
|
.5
|
|
Employment Agreement effective as of August 4, 2011 between Ambient Corporation and Mark L. Fidler (filed as Exhibit 10.1 to the Current Report of Ambient Corporation on Form 8-K, filed on August 8, 2011).(1)+
|
|
10
|
.6
|
|
Securities Purchase Agreement dated as of May 26, 2006 among Ambient Corporation and certain investors (filed as Exhibit 10.8 to the Registration Statement of Ambient Corporation on Form SB-2, filed June 8, 2006, as File No. 333-134872).(1)
|
|
10
|
.7
|
|
Registration Rights Agreement dated as of May 26, 2006 among Ambient Corporation and certain investors (filed as Exhibit 10.9 to the Registration Statement of Ambient Corporation on Form SB-2, filed June 8, 2006, as File No. 333-134872).(1)
|
|
10
|
.8
|
|
Registration Rights Agreement, dated as of July 31, 2007, between Ambient Corporation and Vicis Capital Master Fund (filed as Exhibit 10.1 to the Current Report of Ambient Corporation on Form 8-K, filed on July 31, 2007).(1)
|
|
10
|
.9
|
|
Securities Purchase Agreement, dated as of July 31, 2007 between Ambient Corporation and Vicis Capital Master Fund (filed as Exhibit 10.2 to the Current Report of Ambient Corporation on Form 8-K, filed on July 31, 2007).(1)
|
|
10
|
.10
|
|
Security Agreement, dated as of July 31, 2007 between Ambient Corporation and Vicis Capital Master Fund (filed as Exhibit 10.3 to the Current Report of Ambient Corporation on Form 8-K, filed on July 31, 2007).(1)
|
|
10
|
.11
|
|
Securities Purchase Agreement dated as of November 1, 2007, between Ambient Corporation and Vicis Capital Master Fund (filed as Exhibit 10.1 to the Current Report of Ambient Corporation on Form 8-K, filed on November 5, 2007).(1)
|
|
10
|
.12
|
|
First Amendment dated as of November 1, 2007 to Registration Rights Agreement, dated as of July 31, 2007, between Ambient and Vicis Capital Master Fund (filed as Exhibit 10.2 to the Current Report of Ambient Corporation on Form 8-K, filed on November 5, 2007).(1)
|
|
10
|
.13
|
|
First Amendment dated as of November 1, 2007 to Securities Purchase Agreement, dated as of July 31, 2007 between Ambient Corporation and Vicis Capital Master Fund (filed as Exhibit 10.3 to the Current Report of Ambient Corporation on Form 8-K, filed on November 5, 2007).(1)
|
|
10
|
.14
|
|
Securities Purchase Agreement dated as of January 15, 2008, between Ambient Corporation and Vicis Capital Master Fund (filed as Exhibit 10.1 to the Current Report of Ambient Corporation on Form 8-K, filed on January 17, 2008).(1)
|
|
10
|
.15
|
|
Second Amendment dated as of January 15, 2008 to Registration Rights Agreement, dated as of July 31, 2007, between Ambient Corporation and Vicis Capital Master Fund (filed as Exhibit 10.2 to the Current Report of Ambient Corporation on Form 8-K, filed on January 17, 2008).(1)
|
|
10
|
.16
|
|
First Amendment dated as of January 15, 2008 to Securities Purchase Agreement, dated as of November 1, 2007 between Ambient Corporation and Vicis Capital Master Fund (filed as Exhibit 10.3 to the Current Report of Ambient Corporation on Form 8-K, filed on January 17, 2008).(1)
|
|
10
|
.17
|
|
Second Amendment dated as of January 15, 2008 to Securities Purchase Agreement, dated as of July 31, 2007 between Ambient Corporation and Vicis Capital Master Fund (filed as Exhibit 10.4 to the Current Report of Ambient Corporation on Form 8-K, filed on January 17, 2008).(1)
|
|
10
|
.18
|
|
Securities Purchase Agreement dated as of April 23, 2008 between Ambient Corporation and Vicis Capital Master Fund (filed as Exhibit 10.1 to the Quarterly Report of Ambient Corporation on Form 10-Q for the three month period ended June 30, 2008, filed August 14, 2008).(1)
|
|
10
|
.19
|
|
Amendment and Waiver dated as of April 23, 2008 between Ambient Corporation and Vicis Capital Master Fund (filed as Exhibit 10.2 to the Quarterly Report of Ambient Corporation on Form 10-Q for the three month period ended June 30, 2008, filed August 14, 2008).(1)
|
|
10
|
.20
|
|
Debenture Amendment Agreement dated as of November 21, 2008 between Ambient Corporation and Vicis Capital Master Fund (filed as Exhibit 10.1 to the Current Report of Ambient Corporation on Form 8-K, filed November 24, 2008).(1)
|
|
10
|
.21
|
|
Securities Purchase Agreement, dated as of November 16, 2009 between Ambient Corporation and Vicis Capital Master Fund (filed as Exhibit 10.2 to the Quarterly Report of Ambient Corporation on Form 10-Q for the three month period ended September 30, 2009, filed November 16, 2009).(1)
|
|
10
|
.22
|
|
Registration Rights Agreement, dated as of November 16, 2009 between Ambient Corporation and Vicis Capital Master Fund (filed as Exhibit 10.3 to the Quarterly Report of Ambient Corporation on Form 10-Q for the three month period ended September 30, 2009, filed November 16, 2009).(1)
|
|
10
|
.23
|
|
Amendment to Securities Purchase Agreement dated as of January 15, 2010, between Ambient and Vicis Capital Master Fund (filed as Exhibit 10.26 to the Annual Report of Ambient Corporation on Form 10-K for the year ended December 31, 2009, filed March 31, 2010).(1)
|
|
10
|
.24
|
|
Commercial Deployment Agreement dated as of March 31, 2008 between Ambient Corporation and Duke Energy Carolinas, LLC (filed as Exhibit 10.1 to the Quarterly Report of Ambient Corporation on Form 10-Q for the three month period ended March 31, 2008, filed May 15, 2008). (Pursuant to Rule 24b-2 under the Securities Exchange Act of 1934, the registrant has requested confidential treatment of the portion of this exhibit deleted from the filed copy).(1)
|
|
10
|
.25
|
|
Master Supply and Alliance Agreement dated as of February 17, 2009 between Ambient Corporation and Bel Fuse Inc. (Pursuant to Rule 24b-2 under the Securities Exchange Act of 1934, the registrant has requested confidential treatment of the portion of this exhibit deleted from the filed copy) (previously filed).
|
|
10
|
.26
|
|
Product Sales, Services & Software Agreement between Ambient Corporation and Duke Energy business Services LLC on its own behalf and as agent for and on behalf of Duke Energy Carolinas, LLC, Duke Energy Indiana, Inc, Duke Energy Ohio, Inc., Duke Energy Kentucky, Inc., and certain after acquired affiliates (filed as Exhibit 10.1 to the Quarterly Report of Ambient Corporation on Form 10-Q for the three month period ended September 30, 2009, filed November 16, 2009). (Pursuant to Rule 24b-2 under the Securities Exchange Act of 1934, the registrant has requested confidential treatment of portions of this exhibit deleted from the filed copy.)(1)
|
|
10
|
.27
|
|
Office Lease Agreement dated as of May 21, 2009, between Ambient Corporation and NS 7/57 Acquisition LLC (filed as Exhibit 10.1 to the Quarterly Report of Ambient Corporation on Form 10-Q for the three month period ended June 30, 2009, filed August 7, 2009).(1)
|
|
14
|
|
|
Code of Business Conduct and Ethics (filed as Exhibit 14.1 to the Current Report of Ambient Corporation on
Form 8-K, filed August 2, 2011).(1)
|
|
23
|
|
|
Consent of Rotenberg Meril Solomon Bertiger & Guttilla, P.C.
|
|
31
|
.1
|
|
Certification of Chief Executive Officer pursuant to Rule 13a-14(a) of the Securities Exchange Act of 1934, as amended.
|
|
31
|
.2
|
|
Certification of Chief Financial Officer pursuant to Rule 13a-14(a) of the Securities Exchange Act of 1934, as amended.
|
|
32
|
|
|
Certification of Chief Executive Officer and Chief Financial Officer, as adopted pursuant to Section 906 of the Sarbanes-Oxley Act of 2002.
|
|
101
|
.INS*
|
|
XBRL Instance Document
|
|
101
|
.SCH*
|
|
XBRL Taxonomy Extension Schema
|
|
101
|
.CAL*
|
|
XBRL Taxonomy Extension Calculation Linkbase
|
|
101
|
.DEF*
|
|
XBRL Taxonomy Extension Definition Linkbase
|
|
101
|
.LAB*
|
|
XBRL Taxonomy Extension Label Linkbase
|
|
101
|
.PRE*
|
|
XBRL Taxonomy Extension Presentation Linkbase
|
|
+
|
|
Management Agreement
|
|
*
|
|
Pursuant to Rule 406T of Regulation S-T, these interactive data files are deemed not filed or part of a registration statement or prospectus for purposes of Sections 11 or 12 of the Securities Act of 1933 or Section 18 of the Securities Exchange Act of 1934 and otherwise are not subject to liability.
|
|
(1)
|
|
Incorporated by reference
|
Pursuant to the requirements of the Securities Exchange Act of 1934, the registrant has caused this report to be signed on its behalf by the undersigned, thereunto duly authorized.
|
AMBIENT CORPORATION
|
|
|
|
|
(Registrant)
|
|
|
|
| |
|
|
|
|
By:
|
/s/ John J. Joyce
|
|
By:
|
/s/ Mark Fidler
|
|
| |
John J. Joyce
|
|
|
Mark Fidler,
|
|
| |
President and Chief Executive Officer
|
|
|
Vice President and Chief Financial Officer
|
|
| |
(Principal Executive Officer)
|
|
|
(Principal Financial and Accounting Officer)
|
|
| |
|
|
|
|
|
|
Date:
|
September 24, 2012
|
|
Date:
|
|
|
Pursuant to requirements with the Securities Exchange Act of 1934, this report has been signed below by the following persons on behalf of the registrant and in the capacities and on the dates indicated.
|
Signature
|
Title
|
Date
|
| |
|
|
|
/s/ John J. Joyce
|
PRESIDENT, CHIEF EXECUTIVE OFFICER, CHAIRMAN OF THE BOARD
|
|
| John J. Joyce |
and DIRECTOR (Principal Executive Officer) |
|
| |
|
|
|
/s/ Mark L. Fidler
|
VICE PRESIDENT, CHIEF FINANCIAL OFFICER and TREASURER
|
|
| Mark L. Fidler |
(Principal Financial Officer and Principal Accounting Officer) |
|
| |
|
|
|
/s/ Michael L. Widland
|
DIRECTOR
|
|
|
Michael L. Widland
|
|
|
| |
|
|
|
/s/ D. Howard Pierce
|
DIRECTOR
|
|
|
D. Howard Pierce
|
|
|
| |
|
|
|
/s/ Thomas Michael Higgins
|
DIRECTOR
|
|
|
Thomas Michael Higgins
|
|
|
| |
|
|
|
/s/ Shad L. Stastney
|
DIRECTOR
|
|
|
Shad L. Stastney
|
|
|
| |
|
|
|
/s/ Francesca E. Scarito
|
DIRECTOR
|
|
|
Francesca E. Scarito
|
|
|
AMBIENT CORPORATION
INDEX TO RESTATED FINANCIAL STATEMENTS
| |
|
Page
|
|
| |
|
|
|
|
|
Report of Independent Registered Public Accounting Firm
|
|
|
F-2
|
|
| |
|
|
|
|
|
Restated Financial Statements
|
|
|
|
|
| |
|
|
|
|
|
Balance Sheets
|
|
|
F-3
|
|
| |
|
|
|
|
|
Statements of Operations
|
|
|
F-4
|
|
| |
|
|
|
|
|
Statement of Changes in Stockholders’ Equity (Deficit)
|
|
|
F-5
|
|
| |
|
|
|
|
|
Statements of Cash Flows
|
|
|
F-6
|
|
| |
|
|
|
|
|
Notes to Restated Financial Statements
|
|
|
F-7
|
|
REPORT OF INDEPENDENT REGISTERED PUBLIC ACCOUNTING FIRM
To the Board of Directors and Stockholders of
Ambient Corporation
We have audited the accompanying balance sheets of Ambient Corporation (the “Company”) as of December 31, 2010 and 2011, and the related statements of operations, changes in stockholders’ equity (deficit) and cash flows for the years ended December 31, 2009, 2010 and 2011. The financial statements are the responsibility of the Company’s management. Our responsibility is to express an opinion on these financial statements based on our audits.
We conducted our audits in accordance with the standards of the Public Company Accounting Oversight Board (United States). Those standards require that we plan and perform the audit to obtain reasonable assurance about whether the financial statements are free of material misstatement. The Company is not required to have, nor were we engaged to perform, an audit of its internal control over financial reporting. Our audits included consideration of internal control over financial reporting as a basis for designing audit procedures that are appropriate in the circumstances, but not for the purpose of expressing an opinion on the effectiveness of the Company’s internal control over financial reporting. Accordingly, we express no such opinion. An audit also includes examining, on a test basis, evidence supporting the amounts and disclosures in the financial statements, assessing the accounting principles used and significant estimates made by management, as well as evaluating the overall financial statement presentation. We believe that our audits provide a reasonable basis for our opinion.
In our opinion, the financial statements referred to above present fairly, in all material respects, the financial position of the Company as of December 31, 2010 and 2011 and the results of their operations and cash flows for the years ended December 31, 2009, 2010 and 2011 in conformity with accounting principles generally accepted in the United States of America.
As discussed in Note 2, the Company has restated the balance sheets as of December 31, 2010 and 2011 and the related statements of operations, changes in stockholders’ equity (deficit) and cash flows for the years ended December 31, 2009, 2010 and 2011.
/s/ ROTENBERG MERIL SOLOMON BERTIGER & GUTTILLA, P.C.
ROTENBERG MERIL SOLOMON BERTIGER & GUTTILLA, P.C.
Saddle Brook, New Jersey
March 6, 2012, except for Notes 2, 3, 4, 8, 9, 10, 11, and 12 as to which the date is September 24, 2012
AMBIENT CORPORATION
BALANCE SHEETS
(in thousands, except share data)
| |
|
December 31,
|
|
|
December 31,
|
|
| |
|
2011
|
|
|
2010
|
|
|
Assets
|
|
(Restated)
|
|
|
(Restated)
|
|
|
Current assets:
|
|
|
|
|
|
|
|
Cash and cash equivalents
|
|
$ |
17,965 |
|
|
$ |
6,987 |
|
|
Accounts receivable
|
|
|
284 |
|
|
|
1,731 |
|
|
Inventory
|
|
|
1,460 |
|
|
|
834 |
|
|
Prepaid expenses and other current assets
|
|
|
527 |
|
|
|
276 |
|
|
Total current assets
|
|
|
20,236 |
|
|
|
9,828 |
|
| |
|
|
|
|
|
|
|
|
|
Property and equipment, net
|
|
|
1,249 |
|
|
|
745 |
|
|
Deferred finance charges
|
|
|
389 |
|
|
|
- |
|
| |
|
|
|
|
|
|
|
|
|
Total assets
|
|
|
21,874 |
|
|
|
10,573 |
|
| |
|
|
|
|
|
|
|
|
|
Liabilities and Stockholders' Equity
|
|
|
|
|
|
|
|
|
|
Current liabilities:
|
|
|
|
|
|
|
|
|
|
Accounts payable
|
|
$ |
3,920 |
|
|
$ |
3,608 |
|
|
Accrued expenses and other current liabilities (including related party interest of $0 and $244, respectively)
|
|
|
714 |
|
|
|
633 |
|
|
Deferred revenue
|
|
|
453 |
|
|
|
140 |
|
|
Accrued warranty
|
|
|
115 |
|
|
|
- |
|
|
Income taxes payable
|
|
|
41 |
|
|
|
- |
|
|
Capital lease obligations
|
|
|
- |
|
|
|
10 |
|
|
Warrant liability, current portion
|
|
|
671 |
|
|
|
2,785 |
|
| |
|
|
|
|
|
|
|
|
| |
|
|
|
|
|
|
|
|
|
Total current liabilities
|
|
|
5,914 |
|
|
|
7,176 |
|
| |
|
|
|
|
|
|
|
|
|
Non-current liabilities
|
|
|
|
|
|
|
|
|
|
Deferred rent
|
|
|
99 |
|
|
|
186 |
|
|
Warrant liability, net of current
|
|
|
- |
|
|
|
1,568 |
|
| |
|
|
|
|
|
|
|
|
| |
|
|
|
|
|
|
|
|
|
Total liabilities
|
|
$ |
6,013 |
|
|
$ |
8,930 |
|
| |
|
|
|
|
|
|
|
|
|
Commitments
|
|
|
|
|
|
|
|
|
| |
|
|
|
|
|
|
|
|
|
Stockholders' Equity:
|
|
|
|
|
|
|
|
|
|
Common stock, $0.001 par value;
|
|
|
|
|
|
|
|
|
|
100,000,000 and 20,000,000 shares authorized;
|
|
|
|
|
|
|
|
|
|
16,567,384 and 16,493,764 shares issued; and
|
|
|
|
|
|
|
|
|
|
16,557,384 and 16,483,764 shares outstanding, respectively
|
|
|
17 |
|
|
|
16 |
|
|
Additional paid-in capital
|
|
|
237,421 |
|
|
|
233,254 |
|
|
Accumulated deficit
|
|
|
(221,377 |
) |
|
|
(231,427 |
) |
|
Less: treasury stock; 10,000 shares at cost
|
|
|
(200 |
) |
|
|
(200 |
) |
|
Total stockholders' equity
|
|
|
15,861 |
|
|
|
1,643 |
|
| |
|
|
|
|
|
|
|
|
|
Total liabilities and stockholders' equity
|
|
$ |
21,874 |
|
|
$ |
10,573 |
|
See Notes to Restated Financial Statements.
AMBIENT CORPORATION
STATEMENTS OF OPERATIONS
(in thousands, except per share data)
| |
|
Years Ended December 31,
|
|
| |
|
2011
|
|
|
2010
|
|
|
2009
|
|
| |
|
(Restated)
|
|
|
(Restated)
|
|
|
(Restated)
|
|
| |
|
|
|
|
|
|
|
|
|
|
Total revenue
|
|
$ |
62,112 |
|
|
$ |
20,226 |
|
|
$ |
2,185 |
|
|
Cost of goods sold
|
|
|
35,274 |
|
|
|
12,023 |
|
|
|
1,836 |
|
|
Gross profit
|
|
|
26,838 |
|
|
|
8,203 |
|
|
|
349 |
|
| |
|
|
|
|
|
|
|
|
|
|
|
|
|
Operating expenses:
|
|
|
|
|
|
|
|
|
|
|
|
|
|
Research and development expenses
|
|
|
11,665 |
|
|
|
6,222 |
|
|
|
4,871 |
|
|
Selling, general and administrative expenses
|
|
|
8,244 |
|
|
|
5,060 |
|
|
|
4,392 |
|
|
Total operating expenses
|
|
|
19,909 |
|
|
|
11,282 |
|
|
|
9,263 |
|
| |
|
|
|
|
|
|
|
|
|
|
|
|
|
Operating income (loss)
|
|
|
6,929 |
|
|
|
(3,079 |
) |
|
|
(8,914 |
) |
| |
|
|
|
|
|
|
|
|
|
|
|
|
|
Interest income (expense), net
|
|
|
19 |
|
|
|
(30 |
) |
|
|
(587 |
) |
|
Amortization of debt discount
|
|
|
- |
|
|
|
- |
|
|
|
(3,651 |
) |
|
Mark-to-market adjustment of warrant liability
|
|
|
3,306 |
|
|
|
2,740 |
|
|
|
(7,029 |
) |
|
Mark-to-market adjustment of derivative liability
|
|
|
- |
|
|
|
5,434 |
|
|
|
(102,070 |
) |
|
(Loss) gain on conversion and extinguishment of debt
|
|
|
- |
|
|
|
(355 |
) |
|
|
5,723 |
|
|
Other expense, net
|
|
|
- |
|
|
|
(6 |
) |
|
|
(32 |
) |
|
Total other income
|
|
|
3,325 |
|
|
|
7,783 |
|
|
|
(107,646 |
) |
| |
|
|
|
|
|
|
|
|
|
|
|
|
|
Income (loss) before taxes
|
|
|
10,254 |
|
|
|
4,704 |
|
|
|
(116,560 |
) |
| |
|
|
|
|
|
|
|
|
|
|
|
|
|
Provision for income taxes
|
|
|
204 |
|
|
|
- |
|
|
|
- |
|
| |
|
|
|
|
|
|
|
|
|
|
|
|
|
Net income (loss)
|
|
$ |
10,050 |
|
|
$ |
4,704 |
|
|
$ |
(116,560 |
) |
| |
|
|
|
|
|
|
|
|
|
|
|
|
|
Net income (loss) per share (basic)
|
|
$ |
0.61 |
|
|
$ |
0.30 |
|
|
$ |
(14.77 |
) |
|
Net income (loss) per share (diluted)
|
|
$ |
0.59 |
|
|
$ |
0.29 |
|
|
$ |
(14.77 |
) |
| |
|
|
|
|
|
|
|
|
|
|
|
|
|
Weighted average shares used in computing basic net income/(loss) per share
|
|
|
16,515 |
|
|
|
15,495 |
|
|
|
7,891 |
|
|
Weighted average shares used in computing diluted net income/(loss) per share
|
|
|
16,905 |
|
|
|
15,998 |
|
|
|
7,891 |
|
See Notes to Restated Financial Statements.
AMBIENT CORPORATION
STATEMENT OF CHANGES IN STOCKHOLDERS' EQUITY (DEFICIT)
(in thousands, except share data)
| |
|
|
|
|
|
|
|
Additional
|
|
|
|
|
|
|
|
|
|
|
| |
|
Common Stock
|
|
|
Paid-in
|
|
|
Treasury
|
|
|
Accumulated
|
|
|
|
|
| |
|
Shares
|
|
|
Amount
|
|
|
Capital
|
|
|
Stock
|
|
|
Deficit
|
|
|
Total
|
|
| |
|
|
|
|
|
|
|
|
|
|
|
|
|
|
|
|
|
|
|
Balance - January 1, 2009 (Restated)
|
|
|
7,189,808 |
|
|
$ |
7 |
|
|
$ |
105,008 |
|
|
$ |
(200 |
) |
|
$ |
(119,571 |
) |
|
$ |
(14,756 |
) |
| |
|
|
|
|
|
|
|
|
|
|
|
|
|
|
|
|
|
|
|
|
|
|
|
|
|
Common stock issued upon exercise of warrants
|
|
|
116,422 |
|
|
|
|
|
|
|
2,319 |
|
|
|
|
|
|
|
|
|
|
|
2,319 |
|
|
Common stock issued upon exercise of options
|
|
|
7,500 |
|
|
|
|
|
|
|
24 |
|
|
|
|
|
|
|
|
|
|
|
24 |
|
|
Common stock issued upon conversion of convertible debt
|
|
|
1,666,667 |
|
|
|
2 |
|
|
|
24,565 |
|
|
|
|
|
|
|
|
|
|
|
24,567 |
|
|
Stock-based compensation expense
|
|
|
|
|
|
|
|
|
|
|
622 |
|
|
|
|
|
|
|
|
|
|
|
622 |
|
|
Net loss
|
|
|
|
|
|
|
|
|
|
|
|
|
|
|
|
|
|
|
(116,560 |
) |
|
|
(116,560 |
) |
|
Balance - December 31, 2009 (Restated)
|
|
|
8,980,397 |
|
|
$ |
9 |
|
|
$ |
132,538 |
|
|
$ |
(200 |
) |
|
$ |
(236,131 |
) |
|
$ |
(103,784 |
) |
| |
|
|
|
|
|
|
|
|
|
|
|
|
|
|
|
|
|
|
|
|
|
|
|
|
|
Common stock issued upon exercise of warrants
|
|
|
28,590 |
|
|
|
|
|
|
|
314 |
|
|
|
|
|
|
|
|
|
|
|
314 |
|
|
Common stock issued upon exercise of options
|
|
|
8,110 |
|
|
|
|
|
|
|
32 |
|
|
|
|
|
|
|
|
|
|
|
32 |
|
|
Proceeds from sale of common stock
|
|
|
800,000 |
|
|
|
|
|
|
|
6,588 |
|
|
|
|
|
|
|
|
|
|
|
6,588 |
|
|
Common stock issued upon conversion of convertible debt
|
|
|
6,666,667 |
|
|
|
7 |
|
|
|
93,326 |
|
|
|
|
|
|
|
|
|
|
|
93,333 |
|
|
Stock-based compensation expense
|
|
|
|
|
|
|
|
|
|
|
456 |
|
|
|
|
|
|
|
|
|
|
|
456 |
|
|
Net income
|
|
|
|
|
|
|
|
|
|
|
|
|
|
|
|
|
|
|
4,704 |
|
|
|
4,704 |
|
|
Balance - December 31, 2010 (Restated)
|
|
|
16,483,764 |
|
|
$ |
16 |
|
|
$ |
233,254 |
|
|
$ |
(200 |
) |
|
$ |
(231,427 |
) |
|
$ |
1,643 |
|
| |
|
|
|
|
|
|
|
|
|
|
|
|
|
|
|
|
|
|
|
|
|
|
|
|
|
Common stock issued upon exercise of warrants
|
|
|
68,538 |
|
|
|
1 |
|
|
|
615 |
|
|
|
|
|
|
|
|
|
|
|
616 |
|
|
Common stock issued upon exercise of options
|
|
|
5,082 |
|
|
|
|
|
|
|
30 |
|
|
|
|
|
|
|
|
|
|
|
30 |
|
|
Stock-based compensation expense
|
|
|
|
|
|
|
|
|
|
|
3,522 |
|
|
|
|
|
|
|
|
|
|
|
3,522 |
|
|
Net income
|
|
|
|
|
|
|
|
|
|
|
|
|
|
|
|
|
|
|
10,050 |
|
|
|
10,050 |
|
|
Balance - December 31, 2011 (Restated)
|
|
|
16,557,384 |
|
|
$ |
17 |
|
|
$ |
237,421 |
|
|
$ |
(200 |
) |
|
$ |
(221,377 |
) |
|
$ |
15,861 |
|
See Notes to Restated Financial Statements.
AMBIENT CORPORATION
STATEMENTS OF CASH FLOWS
(in thousands)
| |
|
Years Ended December 31,
|
|
| |
|
2011
|
|
|
2010
|
|
|
2009
|
|
| |
|
(Restated)
|
|
|
(Restated)
|
|
|
(Restated)
|
|
|
CASH FLOWS FROM OPERATING ACTIVITIES
|
|
|
|
|
|
|
|
|
|
|
Net income (loss)
|
|
$ |
10,050 |
|
|
$ |
4,704 |
|
|
$ |
(116,560 |
) |
|
Adjustments to reconcile net income (loss) to net cash provided by (used in) operating activities:
|
|
|
|
|
|
|
|
|
|
|
Depreciation and amortization
|
|
|
458 |
|
|
|
380 |
|
|
|
302 |
|
|
Amortization of debt discount
|
|
|
- |
|
|
|
- |
|
|
|
3,651 |
|
|
Stock-based compensation
|
|
|
3,522 |
|
|
|
454 |
|
|
|
622 |
|
|
Loss/(gain) on conversion and extinguishment of debt
|
|
|
- |
|
|
|
355 |
|
|
|
(5,723 |
) |
|
Mark-to-market adjustment of warrant liability
|
|
|
(3,306 |
) |
|
|
(2,740 |
) |
|
|
7,029 |
|
|
Mark-to-market adjustment of derivative liability
|
|
|
- |
|
|
|
(5,434 |
) |
|
|
102,070 |
|
|
Loss on disposal of fixed assets
|
|
|
- |
|
|
|
6 |
|
|
|
32 |
|
|
Changes in operating assets and liabilities:
|
|
|
|
|
|
|
|
|
|
|
|
|
|
Accounts receivable
|
|
|
1,447 |
|
|
|
(492 |
) |
|
|
430 |
|
|
Inventory
|
|
|
(626 |
) |
|
|
(473 |
) |
|
|
(263 |
) |
|
Prepaid expenses and other current assets
|
|
|
(251 |
) |
|
|
(74 |
) |
|
|
(28 |
) |
|
Accounts payable
|
|
|
312 |
|
|
|
1,592 |
|
|
|
682 |
|
|
Deferred rent
|
|
|
(87 |
) |
|
|
101 |
|
|
|
85 |
|
|
Accrued warranty
|
|
|
115 |
|
|
|
- |
|
|
|
- |
|
|
Accrued expenses and other current liabilities
|
|
|
81 |
|
|
|
56 |
|
|
|
(108 |
) |
|
Income taxes payable
|
|
|
41 |
|
|
|
- |
|
|
|
- |
|
|
Deferred revenue
|
|
|
313 |
|
|
|
(27 |
) |
|
|
59 |
|
|
Net cash provided by (used in) operating activities
|
|
|
12,069 |
|
|
|
(1,592 |
) |
|
|
(7,720 |
) |
| |
|
|
|
|
|
|
|
|
|
|
|
|
|
CASH FLOWS FROM INVESTING ACTIVITIES
|
|
|
|
|
|
|
|
|
|
|
|
|
|
Redemption of marketable securities
|
|
|
- |
|
|
|
- |
|
|
|
125 |
|
|
Purchases of property and equipment
|
|
|
(962 |
) |
|
|
(527 |
) |
|
|
(394 |
) |
|
Net cash used in investing activities
|
|
|
(962 |
) |
|
|
(527 |
) |
|
|
(269 |
) |
| |
|
|
|
|
|
|
|
|
|
|
|
|
|
CASH FLOWS FROM FINANCING ACTIVITES
|
|
|
|
|
|
|
|
|
|
|
|
|
|
Proceeds from issuance of common stock
|
|
|
- |
|
|
|
8,000 |
|
|
|
976 |
|
|
Deferred finance charges
|
|
|
(389 |
) |
|
|
- |
|
|
|
- |
|
|
Proceeds from exercise of warrants
|
|
|
240 |
|
|
|
100 |
|
|
|
- |
|
|
Proceeds from exercise of stock options
|
|
|
30 |
|
|
|
32 |
|
|
|
- |
|
|
Payments of capitalized lease obligations
|
|
|
(10 |
) |
|
|
(13 |
) |
|
|
(12 |
) |
|
Net cash (used in) provided by financing activities
|
|
|
(129 |
) |
|
|
8,119 |
|
|
|
964 |
|
| |
|
|
|
|
|
|
|
|
|
|
|
|
|
INCREASE (DECREASE) IN CASH AND CASH EQUIVALENTS
|
|
|
10,978 |
|
|
|
6,000 |
|
|
|
(7,025 |
) |
| |
|
|
|
|
|
|
|
|
|
|
- |
|
|
CASH AND CASH EQUIVALENTS - BEGINNING OF YEAR
|
|
|
6,987 |
|
|
|
987 |
|
|
|
8,012 |
|
| |
|
|
|
|
|
|
|
|
|
|
|
|
|
CASH AND CASH EQUIVALENTS - END OF YEAR
|
|
$ |
17,965 |
|
|
$ |
6,987 |
|
|
$ |
987 |
|
| |
|
|
|
|
|
|
|
|
|
|
|
|
|
Non-cash financing and investing activities:
|
|
|
|
|
|
|
|
|
|
|
|
|
|
Issuance of common stock in connection with conversion of debt
|
|
$ |
- |
|
|
$ |
10,000 |
|
|
$ |
2,500 |
|
| |
|
|
|
|
|
|
|
|
|
|
|
|
|
Supplemental disclosures of cash flow information:
|
|
|
|
|
|
|
|
|
|
|
|
|
|
Interest paid
|
|
$ |
246 |
|
|
$ |
226 |
|
|
$ |
675 |
|
|
Income taxes paid
|
|
$ |
163 |
|
|
$ |
- |
|
|
$ |
- |
|
See Notes to Restated Financial Statements.
AMBIENT CORPORATION
|
NOTES TO RESTATED FINANCIAL STATEMENTS
|
NOTE 1 - DESCRIPTION OF BUSINESS
Ambient Corporation (“Ambient,” the “Company,” “we or “us”) is a Delaware corporation incorporated on June 26, 1996 and is a leading provider of a smart grid communications platform that enables utilities to effectively deploy, integrate and communicate with multiple devices creating smart grid applications within the electric power distribution grid. The Ambient Smart Grid® communications platform, which includes hardware, software and firmware, provides the network platform to effectively manage smart grid applications. The Company’s innovative communications platform enables utilities to deploy and integrate multiple smart grid applications and technologies, in parallel on a single communications infrastructure, supporting smart metering, distribution automation, distribution management, demand response, distributed generation and more.
The Company’s long-standing relationship with Duke Energy, which it believes has one of the most forward-looking smart grid investment initiatives in North America, has led to rapid growth in the Company’s business. The Company entered into a long-term agreement in September 2009 with Duke Energy, currently its sole customer, to supply Duke Energy with their Ambient Smart Grid® communications nodes through 2015 and license our AmbientNMS®.
On July 18, 2011, the Company implemented a reverse stock split of its outstanding shares of common stock at a ratio of 1-for-100 shares. The reverse stock split has been reflected in this Amended Filing. See Note 10.
NOTE 2 – RESTATEMENT OF FINANCIAL STATEMENTS
Background of Restatement
In connection with the preparation of Form 10-Q for the quarter ended June 30, 2012, management of the Company concluded that certain previously filed financial statements did not properly account for embedded derivative features of certain historical debt and warrants issued by the Company, which are described in detail below.
Convertible Debt: Certain historical convertible notes (the “Notes”) issued by the Company were previously recorded at their discounted face value. The discounts were comprised of both beneficial conversion features associated with the Notes and the fair value of warrants issued in connection with the Notes. However, the Notes contained certain features, including anti-dilution price protection and others that, in accordance with ASC-815, Derivatives and Hedging (“ASC 815”), should have been bifurcated from the host contract and accounted for as a derivative instrument (the “Embedded Derivatives”). Such Embedded Derivatives are recorded as a separate liability at their fair value on the date of issuance, and as a corresponding discount to the Notes which is amortized as interest expense over the term of the Notes. Changes in the fair values of these instruments require adjustments to the amount of the liabilities recorded on the Company’s balance sheet, and the corresponding gain or loss is required to be recorded in the Company’s statement of operations, as long as the Notes are outstanding.
Warrants: In connection with issuing the Notes, as well as in connection with other financing transactions, the Company issued warrants to purchase common stock (collectively, the “Warrants”). The Company had previously classified the value of the Warrants as equity. After further review, the Company determined that these instruments should have been classified as liabilities in accordance with ASC 815, due primarily to an anti-dilution price protection feature. Changes in the fair values of these instruments require adjustments to the amount of the liabilities recorded on the Company’s balance sheet, and the corresponding gain or loss is required to be recorded in the Company’s statement of operations.
Stock-based Compensation: The Company had previously used volatility assumptions based on the historical volatility of the price of the Company's common stock, which, based on the historical trading activity of the stock, resulted in inflated price volatilities that were not necessarily indicative of the expected volatility and were substantially higher than other peer-industry companies. Upon further review of the volatility assumptions, the Company determined that it was more appropriate to use an expected volatility based on the volatilities of its industry peer group. Such an approach was used to determine appropriate volatility assumptions for valuation purposes of the Embedded Derivatives and Warrants. As a result, assumed volatilities are lower than those previously used, which reduces stock-based compensation expense.
In addition to the adjustments listed above, the Company recorded immaterial adjustments to revenue to account for the deferral of maintenance revenue arising from the initial period of free maintenance provided upon shipment of our communication nodes.
All of the necessary adjustments relating to the Notes and Warrants are non-cash in nature and do not impact the Company’s total cash flows from operating, investing and financing activities. The adjustments are primarily related to complex accounting requirements of certain characteristics of the Notes and Warrants that require the recording of debt discounts and related amortization, mark-to-market adjustments in the fair value of Warrants and Embedded Derivatives and gains or losses associated with the extinguishment of debt under certain circumstances.
As a result of these cumulative adjustments, as of December 31, 2011, accumulated deficit increased from $138.7 million to $221.4 million and additional paid in capital increased from $155.7 million to $237.4 million. At December 31, 2011, the net impact of the cumulative adjustments reduced overall stockholders’ equity by approximately $1.1 million. Since all of the Notes were either paid off or converted by early 2010 and many of the Warrants were either exercised or expired by the end of 2011, the estimated impact of accounting for these instruments in 2012 and for future periods is expected to be immaterial.
The tables below details the impact of the restatements on the Company’s Balance Sheets as of December 31, 2011 and December 31, 2010:
| |
|
December 31, 2011
|
|
|
|
December 31, 2010
|
|
| (in thousands) |
|
As Reported
|
|
|
Adjustments
|
|
|
Restated
|
|
|
As Reported
|
|
|
Adjustments
|
|
|
Restated
|
|
| |
|
|
|
|
|
|
|
|
|
|
|
|
|
|
|
|
|
|
|
ASSETS
|
|
|
|
|
|
|
|
|
|
|
|
|
|
|
|
|
|
|
|
CURRENT ASSETS
|
|
|
|
|
|
|
|
|
|
|
|
|
|
|
|
|
|
|
|
Cash and cash equivalents
|
|
$ |
17,965 |
|
|
$ |
- |
|
|
$ |
17,965 |
|
|
$ |
6,987 |
|
|
$ |
- |
|
|
$ |
6,987 |
|
|
Accounts receivable
|
|
|
284 |
|
|
|
- |
|
|
|
284 |
|
|
|
1,731 |
|
|
|
- |
|
|
|
1,731 |
|
|
Inventory
|
|
|
1,460 |
|
|
|
- |
|
|
|
1,460 |
|
|
|
834 |
|
|
|
- |
|
|
|
834 |
|
|
Prepaid expenses and other current assets
|
|
|
527 |
|
|
|
- |
|
|
|
527 |
|
|
|
276 |
|
|
|
- |
|
|
|
276 |
|
| |
|
|
|
|
|
|
|
|
|
|
|
|
|
|
|
|
|
|
|
|
|
|
|
|
|
Total current assets
|
|
|
20,236 |
|
|
|
- |
|
|
|
20,236 |
|
|
|
9,828 |
|
|
|
- |
|
|
|
9,828 |
|
| |
|
|
|
|
|
|
|
|
|
|
|
|
|
|
|
|
|
|
|
|
|
|
|
|
|
Property and equipment, net
|
|
|
1,249 |
|
|
|
- |
|
|
|
1,249 |
|
|
|
745 |
|
|
|
- |
|
|
|
745 |
|
|
Deferred financing costs, net
|
|
|
389 |
|
|
|
- |
|
|
|
389 |
|
|
|
- |
|
|
|
- |
|
|
|
- |
|
| |
|
|
|
|
|
|
|
|
|
|
|
|
|
|
|
|
|
|
|
|
|
|
|
|
|
Total assets
|
|
$ |
21,874 |
|
|
$ |
- |
|
|
$ |
21,874 |
|
|
$ |
10,573 |
|
|
$ |
- |
|
|
$ |
10,573 |
|
| |
|
|
|
|
|
|
|
|
|
|
|
|
|
|
|
|
|
|
|
|
|
|
|
|
|
LIABILITIES AND STOCKHOLDERS' EQUITY
|
|
|
|
|
|
|
|
|
|
|
|
|
|
|
|
|
|
|
|
|
|
|
|
|
|
CURRENT LIABILITIES
|
|
|
|
|
|
|
|
|
|
|
|
|
|
|
|
|
|
|
|
|
|
|
|
|
|
Accounts payable
|
|
$ |
3,920 |
|
|
$ |
- |
|
|
$ |
3,920 |
|
|
$ |
3,608 |
|
|
$ |
- |
|
|
$ |
3,608 |
|
|
Accrued expenses and other current liabilities
|
|
|
714 |
|
|
|
- |
|
|
|
714 |
|
|
|
633 |
|
|
|
- |
|
|
|
633 |
|
|
Deferred revenue
|
|
|
119 |
|
|
|
334 |
|
|
|
453 |
|
|
|
- |
|
|
|
140 |
|
|
|
140 |
|
|
Accrued warranty
|
|
|
115 |
|
|
|
- |
|
|
|
115 |
|
|
|
- |
|
|
|
- |
|
|
|
- |
|
|
Income taxes payable
|
|
|
41 |
|
|
|
- |
|
|
|
41 |
|
|
|
- |
|
|
|
- |
|
|
|
- |
|
|
Capital lease obligations, current portion
|
|
|
- |
|
|
|
- |
|
|
|
- |
|
|
|
10 |
|
|
|
- |
|
|
|
10 |
|
|
Warrant liability, current
|
|
|
- |
|
|
|
671 |
|
|
|
671 |
|
|
|
- |
|
|
|
2,785 |
|
|
|
2,785 |
|
| |
|
|
|
|
|
|
|
|
|
|
|
|
|
|
|
|
|
|
|
|
|
|
|
|
|
Total current liabilities
|
|
|
4,909 |
|
|
|
1,005 |
|
|
|
5,914 |
|
|
|
4,251 |
|
|
|
2,925 |
|
|
|
7,176 |
|
| |
|
|
|
|
|
|
|
|
|
|
|
|
|
|
|
|
|
|
|
|
|
|
|
|
|
NON-CURRENT LIABILITIES
|
|
|
|
|
|
|
|
|
|
|
|
|
|
|
|
|
|
|
|
|
|
|
|
|
|
Deferred rent
|
|
|
99 |
|
|
|
- |
|
|
|
99 |
|
|
|
186 |
|
|
|
- |
|
|
|
186 |
|
|
Warrant liability, net of current
|
|
|
- |
|
|
|
- |
|
|
|
- |
|
|
|
- |
|
|
|
1,568 |
|
|
|
1,568 |
|
| |
|
|
|
|
|
|
|
|
|
|
|
|
|
|
|
|
|
|
|
|
|
|
|
|
|
Total liabilities
|
|
|
5,008 |
|
|
|
1,005 |
|
|
|
6,013 |
|
|
|
4,437 |
|
|
|
4,493 |
|
|
|
8,930 |
|
| |
|
|
|
|
|
|
|
|
|
|
|
|
|
|
|
|
|
|
|
|
|
|
|
|
|
COMMITMENTS AND CONTINGENCIES
|
|
|
|
|
|
|
|
|
|
|
|
|
|
|
|
|
|
|
|
|
|
|
|
|
| |
|
|
|
|
|
|
|
|
|
|
|
|
|
|
|
|
|
|
|
|
|
|
|
|
|
STOCKHOLDERS' EQUITY
|
|
|
|
|
|
|
|
|
|
|
|
|
|
|
|
|
|
|
|
|
|
|
|
|
|
Common stock, $.001 par value;
|
|
|
|
|
|
|
|
|
|
|
|
|
|
|
|
|
|
|
|
|
|
|
|
|
|
100,000,000 and 20,000,000 shares authorized;
|
|
|
|
|
|
|
|
|
|
|
|
|
|
|
|
|
|
|
|
|
|
|
|
|
|
16,567,384 and 16,493,764 shares issued; and
|
|
|
|
|
|
|
|
|
|
|
|
|
|
|
|
|
|
|
|
|
|
|
|
|
|
16,557,384 and 16,483,764 shares outstanding, respectively
|
|
|
17 |
|
|
|
- |
|
|
|
17 |
|
|
|
16 |
|
|
|
- |
|
|
|
16 |
|
|
Additional paid-in capital
|
|
|
155,707 |
|
|
|
81,714 |
|
|
|
237,421 |
|
|
|
149,748 |
|
|
|
83,506 |
|
|
|
233,254 |
|
|
Accumulated deficit
|
|
|
(138,658 |
) |
|
|
(82,719 |
) |
|
|
(221,377 |
) |
|
|
(143,428 |
) |
|
|
(87,999 |
) |
|
|
(231,427 |
) |
|
Less: treasury stock; 10,000 shares at cost
|
|
|
(200 |
) |
|
|
- |
|
|
|
(200 |
) |
|
|
(200 |
) |
|
|
- |
|
|
|
(200 |
) |
| |
|
|
|
|
|
|
|
|
|
|
|
|
|
|
|
|
|
|
|
|
|
|
|
|
|
Total stockholders' equity
|
|
|
16,866 |
|
|
|
(1,005 |
) |
|
|
15,861 |
|
|
|
6,136 |
|
|
|
(4,493 |
) |
|
|
1,643 |
|
| |
|
|
|
|
|
|
|
|
|
|
|
|
|
|
|
|
|
|
|
|
|
|
|
|
|
Total liabilities and stockholders' equity
|
|
$ |
21,874 |
|
|
$ |
- |
|
|
$ |
21,874 |
|
|
$ |
10,573 |
|
|
$ |
- |
|
|
$ |
10,573 |
|
The following table details the impact of the restatements on the Company’s Statements of Operations for the years ended December 31, 2011, 2010 and 2009:
| |
|
Year Ended December 31, 2011
|
|
|
Year Ended December 31, 2010
|
|
|
Year Ended December 31, 2009
|
|
| (in thousands, except per Share data) |
|
As Reported
|
|
|
Adjustment
|
|
|
Restated
|
|
|
As Reported
|
|
|
Adjustment
|
|
|
Restated
|
|
|
As Reported
|
|
|
Adjustment
|
|
|
Restated
|
|
| |
|
|
|
|
|
|
|
|
|
|
|
|
|
|
|
|
|
|
|
|
|
|
|
|
|
|
|
|
Total revenue
|
|
$ |
62,306 |
|
|
$ |
(194 |
) |
|
$ |
62,112 |
|
|
$ |
20,358 |
|
|
$ |
(132 |
) |
|
$ |
20,226 |
|
|
$ |
2,193 |
|
|
$ |
(8 |
) |
|
$ |
2,185 |
|
|
Cost of goods sold
|
|
|
35,490 |
|
|
|
(216 |
) |
|
|
35,274 |
|
|
|
12,023 |
|
|
|
- |
|
|
|
12,023 |
|
|
|
1,836 |
|
|
|
- |
|
|
|
1,836 |
|
|
Gross profit
|
|
|
26,816 |
|
|
|
22 |
|
|
|
26,838 |
|
|
|
8,335 |
|
|
|
(132 |
) |
|
|
8,203 |
|
|
|
357 |
|
|
|
(8 |
) |
|
|
349 |
|
| |
|
|
|
|
|
|
|
|
|
|
|
|
|
|
|
|
|
|
|
|
|
|
|
|
|
|
|
|
|
|
|
|
|
|
|
|
|
Operating expenses:
|
|
|
|
|
|
|
|
|
|
|
|
|
|
|
|
|
|
|
|
|
|
|
|
|
|
|
|
|
|
|
|
|
|
|
|
|
|
Research and development expenses
|
|
|
12,223 |
|
|
|
(558 |
) |
|
|
11,665 |
|
|
|
6,314 |
|
|
|
(92 |
) |
|
|
6,222 |
|
|
|
4,946 |
|
|
|
(75 |
) |
|
|
4,871 |
|
|
Selling, general and administrative expenses
|
|
|
9,638 |
|
|
|
(1,394 |
) |
|
|
8,244 |
|
|
|
5,239 |
|
|
|
(179 |
) |
|
|
5,060 |
|
|
|
4,662 |
|
|
|
(270 |
) |
|
|
4,392 |
|
| |
|
|
|
|
|
|
|
|
|
|
|
|
|
|
|
|
|
|
|
|
|
|
|
|
|
|
|
|
|
|
|
|
|
|
|
|
|
Total operating expenses
|
|
|
21,861 |
|
|
|
(1,952 |
) |
|
|
19,909 |
|
|
|
11,553 |
|
|
|
(271 |
) |
|
|
11,282 |
|
|
|
9,608 |
|
|
|
(345 |
) |
|
|
9,263 |
|
| |
|
|
|
|
|
|
|
|
|
|
|
|
|
|
|
|
|
|
|
|
|
|
|
|
|
|
|
|
|
|
|
|
|
|
|
|
|
Operating income (loss)
|
|
|
4,955 |
|
|
|
1,974 |
|
|
|
6,929 |
|
|
|
(3,218 |
) |
|
|
139 |
|
|
|
(3,079 |
) |
|
|
(9,251 |
) |
|
|
337 |
|
|
|
(8,914 |
) |
| |
|
|
|
|
|
|
|
|
|
|
|
|
|
|
|
|
|
|
|
|
|
|
|
|
|
|
|
|
|
|
|
|
|
|
|
|
|
Interest income (expense), net
|
|
|
19 |
|
|
|
- |
|
|
|
19 |
|
|
|
(214 |
) |
|
|
184 |
|
|
|
(30 |
) |
|
|
(1,734 |
) |
|
|
1,147 |
|
|
|
(587 |
) |
|
Amortization of beneficial conversion feature of convertible debt
|
|
|
- |
|
|
|
- |
|
|
|
- |
|
|
|
- |
|
|
|
- |
|
|
|
- |
|
|
|
(3,229 |
) |
|
|
3,229 |
|
|
|
- |
|
|
Amortization of debt discount
|
|
|
- |
|
|
|
- |
|
|
|
- |
|
|
|
- |
|
|
|
- |
|
|
|
- |
|
|
|
- |
|
|
|
(3,651 |
) |
|
|
(3,651 |
) |
|
Mark-to-market adjustment of warrant liability
|
|
|
- |
|
|
|
3,306 |
|
|
|
3,306 |
|
|
|
- |
|
|
|
2,740 |
|
|
|
2,740 |
|
|
|
- |
|
|
|
(7,029 |
) |
|
|
(7,029 |
) |
|
Mark-to-market adjustment of derivative liability
|
|
|
- |
|
|
|
- |
|
|
|
- |
|
|
|
- |
|
|
|
5,434 |
|
|
|
5,434 |
|
|
|
- |
|
|
|
(102,070 |
) |
|
|
(102,070 |
) |
|
Gain (loss) on conversion and extinguishment of debt
|
|
|
- |
|
|
|
- |
|
|
|
- |
|
|
|
252 |
|
|
|
(607 |
) |
|
|
(355 |
) |
|
|
- |
|
|
|
5,723 |
|
|
|
5,723 |
|
|
Other expense, net
|
|
|
- |
|
|
|
- |
|
|
|
- |
|
|
|
(6 |
) |
|
|
- |
|
|
|
(6 |
) |
|
|
(32 |
) |
|
|
- |
|
|
|
(32 |
) |
|
Total other income (loss)
|
|
|
19 |
|
|
|
3,306 |
|
|
|
3,325 |
|
|
|
32 |
|
|
|
7,751 |
|
|
|
7,783 |
|
|
|
(4,995 |
) |
|
|
(102,651 |
) |
|
|
(107,646 |
) |
| |
|
|
|
|
|
|
|
|
|
|
|
|
|
|
|
|
|
|
|
|
|
|
|
|
|
|
|
|
|
|
|
|
|
|
|
|
|
Income (loss) before taxes
|
|
|
4,974 |
|
|
|
5,280 |
|
|
|
10,254 |
|
|
|
(3,186 |
) |
|
|
7,890 |
|
|
|
4,704 |
|
|
|
(14,246 |
) |
|
|
(102,314 |
) |
|
|
(116,560 |
) |
| |
|
|
|
|
|
|
|
|
|
|
|
|
|
|
|
|
|
|
|
|
|
|
|
|
|
|
|
|
|
|
|
|
|
|
|
|
|
Provision for income taxes
|
|
|
204 |
|
|
|
- |
|
|
|
204 |
|
|
|
- |
|
|
|
- |
|
|
|
- |
|
|
|
- |
|
|
|
- |
|
|
|
- |
|
| |
|
|
|
|
|
|
|
|
|
|
|
|
|
|
|
|
|
|
|
|
|
|
|
|
|
|
|
|
|
|
|
|
|
|
|
|
|
Net income (loss)
|
|
$ |
4,770 |
|
|
$ |
5,280 |
|
|
$ |
10,050 |
|
|
$ |
(3,186 |
) |
|
$ |
7,890 |
|
|
$ |
4,704 |
|
|
$ |
(14,246 |
) |
|
$ |
(102,314 |
) |
|
$ |
(116,560 |
) |
| |
|
|
|
|
|
|
|
|
|
|
|
|
|
|
|
|
|
|
|
|
|
|
|
|
|
|
|
|
|
|
|
|
|
|
|
|
|
Net income (loss) per share (basic)
|
|
$ |
0.29 |
|
|
$ |
0.32 |
|
|
$ |
0.61 |
|
|
$ |
(0.21 |
) |
|
$ |
0.51 |
|
|
$ |
0.30 |
|
|
$ |
(1.81 |
) |
|
$ |
(12.97 |
) |
|
$ |
(14.77 |
) |
|
Net income (loss) per share (diluted)
|
|
$ |
0.28 |
|
|
$ |
0.31 |
|
|
$ |
0.59 |
|
|
$ |
(0.21 |
) |
|
$ |
0.50 |
|
|
$ |
0.29 |
|
|
$ |
(1.81 |
) |
|
$ |
(12.97 |
) |
|
$ |
(14.77 |
) |
| |
|
|
|
|
|
|
|
|
|
|
|
|
|
|
|
|
|
|
|
|
|
|
|
|
|
|
|
|
|
|
|
|
|
|
|
|
|
Weighted average shares used in computing basic net income (loss) per share
|
|
|
16,515 |
|
|
|
16,515 |
|
|
|
16,515 |
|
|
|
15,495 |
|
|
|
15,495 |
|
|
|
15,495 |
|
|
|
7,891 |
|
|
|
7,891 |
|
|
|
7,891 |
|
|
Weighted average shares used in computing diluted net income (loss) per share
|
|
|
16,905 |
|
|
|
16,905 |
|
|
|
16,905 |
|
|
|
15,495 |
|
|
|
15,998 |
|
|
|
15,998 |
|
|
|
7,891 |
|
|
|
7,891 |
|
|
|
7,891 |
|
| |
|
|
|
|
|
|
|
|
|
|
|
|
|
|
|
|
|
|
|
|
|
|
|
|
|
|
|
|
|
|
|
|
|
|
|
|
The following table details the impact of the restatements of the Company’s Statements of Stockholders’ Equity for the years ended December 31, 2009, 2010 and 2011, respectively:
| |
|
|
|
|
|
|
|
Additional
|
|
|
|
|
|
|
|
|
|
|
|
|
|
|
|
|
|
(in thousands)
|
|
Common Stock
|
|
|
Paid-in
|
|
|
Treasury
|
|
|
Accumulated
|
|
|
|
|
|
|
|
|
Total
|
|
| |
|
Shares
|
|
|
Amount
|
|
|
Capital
|
|
|
Stock
|
|
|
Deficit
|
|
|
Total
|
|
|
Adjustments
|
|
|
(Restated)
|
|
| |
|
|
|
|
|
|
|
|
|
|
|
|
|
|
|
|
|
|
|
|
|
|
|
|
|
Balance -January 1, 2009 (Restated)
|
|
|
7,189,808 |
|
|
$ |
7 |
|
|
$ |
133,643 |
|
|
$ |
(200 |
) |
|
$ |
(125,996 |
) |
|
$ |
7,454 |
|
|
(1)$ |
(22,210 |
) |
|
$ |
(14,756 |
) |
| |
|
|
|
|
|
|
|
|
|
|
|
|
|
|
|
|
|
|
|
|
|
|
|
|
|
|
|
|
|
|
|
|
|
Common stock issued upon exercise of warrants
|
|
|
116,422 |
|
|
|
|
|
|
|
952 |
|
|
|
|
|
|
|
|
|
|
|
952 |
|
|
|
1,367 |
|
|
|
2,319 |
|
|
Common stock issued upon exercise of options
|
|
|
7,500 |
|
|
|
|
|
|
|
24 |
|
|
|
|
|
|
|
|
|
|
|
24 |
|
|
|
- |
|
|
|
24 |
|
|
Common stock issued upon conversion of convertible debt
|
|
|
1,666,667 |
|
|
|
2 |
|
|
|
2,498 |
|
|
|
|
|
|
|
|
|
|
|
2,500 |
|
|
|
22,067 |
|
|
|
24,567 |
|
|
Remeasurement of beneficial conversion feature of convertible promissory note
|
|
|
|
|
|
|
|
|
|
|
(8,333 |
) |
|
|
|
|
|
|
|
|
|
|
(8,333 |
) |
|
|
8,333 |
|
|
|
- |
|
|
Warrant repricing
|
|
|
|
|
|
|
|
|
|
|
1,147 |
|
|
|
|
|
|
|
|
|
|
|
1,147 |
|
|
|
(1,147 |
) |
|
|
- |
|
|
Stock-based compensation expense
|
|
|
|
|
|
|
|
|
|
|
967 |
|
|
|
|
|
|
|
|
|
|
|
967 |
|
|
|
(345 |
) |
|
|
622 |
|
|
Net loss
|
|
|
|
|
|
|
|
|
|
|
|
|
|
|
|
|
|
|
(14,246 |
) |
|
|
(14,246 |
) |
|
|
(102,314 |
) |
|
|
(116,560 |
) |
|
Balance - December 31, 2009 (Restated)
|
|
|
8,980,397 |
|
|
|
9 |
|
|
|
130,898 |
|
|
|
(200 |
) |
|
|
(140,242 |
) |
|
|
(9,535 |
) |
|
|
(94,249 |
) |
|
|
(103,784 |
) |
| |
|
|
|
|
|
|
|
|
|
|
|
|
|
|
|
|
|
|
|
|
|
|
|
|
|
|
|
|
|
|
|
|
|
Common stock issued upon exercise of warrants
|
|
|
28,590 |
|
|
|
|
|
|
|
100 |
|
|
|
|
|
|
|
|
|
|
|
100 |
|
|
|
214 |
|
|
|
314 |
|
|
Common stock issued upon exercise of options
|
|
|
8,110 |
|
|
|
|
|
|
|
32 |
|
|
|
|
|
|
|
|
|
|
|
32 |
|
|
|
- |
|
|
|
32 |
|
|
Proceeds from sale of common stock
|
|
|
800,000 |
|
|
|
|
|
|
|
8,000 |
|
|
|
|
|
|
|
|
|
|
|
8,000 |
|
|
|
(1,412 |
) |
|
|
6,588 |
|
|
Common stock issued upon conversion of convertible debt
|
|
|
6,666,667 |
|
|
|
7 |
|
|
|
9,993 |
|
|
|
|
|
|
|
|
|
|
|
10,000 |
|
|
|
83,333 |
|
|
|
93,333 |
|
|
Stock-based compensation expense
|
|
|
|
|
|
|
|
|
|
|
725 |
|
|
|
|
|
|
|
|
|
|
|
725 |
|
|
|
(269 |
) |
|
|
456 |
|
|
Net loss
|
|
|
|
|
|
|
|
|
|
|
|
|
|
|
|
|
|
|
(3,186 |
) |
|
|
(3,186 |
) |
|
|
7,890 |
|
|
|
4,704 |
|
|
Balance - December 31, 2010 (Restated)
|
|
|
16,483,764 |
|
|
|
16 |
|
|
|
149,748 |
|
|
|
(200 |
) |
|
|
(143,428 |
) |
|
|
6,136 |
|
|
|
(4,493 |
) |
|
|
1,643 |
|
| |
|
|
|
|
|
|
|
|
|
|
|
|
|
|
|
|
|
|
|
|
|
|
|
|
|
|
|
|
|
|
|
|
|
Common stock issued upon exercise of warrants
|
|
|
68,538 |
|
|
|
1 |
|
|
|
239 |
|
|
|
|
|
|
|
|
|
|
|
240 |
|
|
|
376 |
|
|
|
616 |
|
|
Common stock issued upon exercise of options
|
|
|
5,082 |
|
|
|
|
|
|
|
30 |
|
|
|
|
|
|
|
|
|
|
|
30 |
|
|
|
- |
|
|
|
30 |
|
|
Stock-based compensation expense
|
|
|
|
|
|
|
|
|
|
|
5,690 |
|
|
|
|
|
|
|
|
|
|
|
5,690 |
|
|
|
(2,168 |
) |
|
|
3,522 |
|
|
Net income
|
|
|
|
|
|
|
|
|
|
|
|
|
|
|
|
|
|
|
4,770 |
|
|
|
4,770 |
|
|
|
5,280 |
|
|
|
10,050 |
|
|
Balance - December 31, 2011 (Restated)
|
|
|
16,557,384 |
|
|
$ |
17 |
|
|
$ |
155,707 |
|
|
$ |
(200 |
) |
|
$ |
(138,658 |
) |
|
$ |
16,866 |
|
|
$ |
(1,005 |
) |
|
$ |
15,861 |
|
|
(1)
|
The cumulative adjustments prior to January 1, 2009 includes a $6.4 million decrease to accumulated deficit and a $28.6 decrease to additional paid in capital.
|
The following table details the impact of the restatements on the Company’s Statements of Cash Flows for the years ended December 31, 2011, 2010 and 2009:
| (in thousands) |
|
Year Ended December 31, 2011
|
|
|
Year Ended December 31, 2010
|
|
|
Year Ended December 31, 2009
|
|
| |
|
As Reported
|
|
|
Adjustments
|
|
|
Restated
|
|
|
As Reported
|
|
|
Adjustments
|
|
|
Restated
|
|
|
As Reported
|
|
|
Adjustments
|
|
|
Restated
|
|
|
CASH FLOWS FROM OPERATING ACTIVITIES
|
|
|
|
|
|
|
|
|
|
|
|
|
|
|
|
|
|
|
|
|
|
|
|
|
|
|
|
|
Net income (loss)
|
|
$ |
4,770 |
|
|
$ |
5,280 |
|
|
$ |
10,050 |
|
|
$ |
(3,186 |
) |
|
$ |
7,890 |
|
|
$ |
4,704 |
|
|
$ |
(14,246 |
) |
|
$ |
(102,314 |
) |
|
$ |
(116,560 |
) |
|
Adjustments to reconcile net
income (loss) to net cash provided by (used in) operating activities:
|
|
|
|
|
|
|
|
|
|
|
|
|
|
|
|
|
|
|
|
|
|
|
|
|
|
|
|
|
|
|
|
|
|
|
|
|
|
Depreciation and amortization
|
|
|
458 |
|
|
|
- |
|
|
|
458 |
|
|
|
380 |
|
|
|
- |
|
|
|
380 |
|
|
|
302 |
|
|
|
- |
|
|
|
302 |
|
|
Amortization of debt discount and deferred financing costs
|
|
|
- |
|
|
|
- |
|
|
|
- |
|
|
|
- |
|
|
|
- |
|
|
|
- |
|
|
|
- |
|
|
|
3,651 |
|
|
|
3,651 |
|
|
Amortization of beneficial conversion feature of convertible debt
|
|
|
- |
|
|
|
- |
|
|
|
- |
|
|
|
184 |
|
|
|
(184 |
) |
|
|
- |
|
|
|
3,229 |
|
|
|
(3,229 |
) |
|
|
- |
|
|
Non cash interest related to warrant repricing
|
|
|
- |
|
|
|
|
|
|
|
- |
|
|
|
- |
|
|
|
|
|
|
|
- |
|
|
|
1,147 |
|
|
|
(1,147 |
) |
|
|
- |
|
|
Stock-based compensation
|
|
|
5,690 |
|
|
|
(2,168 |
) |
|
|
3,522 |
|
|
|
725 |
|
|
|
(271 |
) |
|
|
454 |
|
|
|
967 |
|
|
|
(345 |
) |
|
|
622 |
|
|
(Loss) gain on conversion and extinguishment of debt
|
|
|
- |
|
|
|
- |
|
|
|
- |
|
|
|
(252 |
) |
|
|
607 |
|
|
|
355 |
|
|
|
- |
|
|
|
(5,723 |
) |
|
|
(5,723 |
) |
|
Mark-to-market adjustment of warrant liability
|
|
|
|
|
|
|
(3,306 |
) |
|
|
(3,306 |
) |
|
|
|
|
|
|
(2,740 |
) |
|
|
(2,740 |
) |
|
|
- |
|
|
|
7,029 |
|
|
|
7,029 |
|
|
Mark-to-market adjustment of derivative liability
|
|
|
- |
|
|
|
- |
|
|
|
- |
|
|
|
- |
|
|
|
(5,434 |
) |
|
|
(5,434 |
) |
|
|
|
|
|
|
102,070 |
|
|
|
102,070 |
|
|
Loss on disposal of fixed assets
|
|
|
- |
|
|
|
- |
|
|
|
- |
|
|
|
6 |
|
|
|
- |
|
|
|
6 |
|
|
|
32 |
|
|
|
- |
|
|
|
32 |
|
|
Changes in operating assets and liabilities:
|
|
|
|
|
|
|
|
|
|
|
|
|
|
|
|
|
|
|
|
|
|
|
|
|
|
|
|
|
|
|
|
|
|
|
|
|
|
Accounts receivable
|
|
|
1,447 |
|
|
|
- |
|
|
|
1,447 |
|
|
|
(492 |
) |
|
|
- |
|
|
|
(492 |
) |
|
|
430 |
|
|
|
- |
|
|
|
430 |
|
|
Inventory
|
|
|
(626 |
) |
|
|
- |
|
|
|
(626 |
) |
|
|
(473 |
) |
|
|
- |
|
|
|
(473 |
) |
|
|
(263 |
) |
|
|
- |
|
|
|
(263 |
) |
|
Prepaid expenses and other current assets
|
|
|
(251 |
) |
|
|
- |
|
|
|
(251 |
) |
|
|
(74 |
) |
|
|
- |
|
|
|
(74 |
) |
|
|
(28 |
) |
|
|
- |
|
|
|
(28 |
) |
|
Accounts payable
|
|
|
312 |
|
|
|
- |
|
|
|
312 |
|
|
|
1,592 |
|
|
|
- |
|
|
|
1,592 |
|
|
|
682 |
|
|
|
- |
|
|
|
682 |
|
|
Accrued expenses and other current liabilities
|
|
|
81 |
|
|
|
|
|
|
|
81 |
|
|
|
56 |
|
|
|
|
|
|
|
56 |
|
|
|
(108 |
) |
|
|
|
|
|
|
(108 |
) |
|
Deferred revenue
|
|
|
119 |
|
|
|
194 |
|
|
|
313 |
|
|
|
(159 |
) |
|
|
132 |
|
|
|
(27 |
) |
|
|
51 |
|
|
|
8 |
|
|
|
59 |
|
|
Accrued warranty
|
|
|
115 |
|
|
|
- |
|
|
|
115 |
|
|
|
- |
|
|
|
- |
|
|
|
- |
|
|
|
- |
|
|
|
- |
|
|
|
- |
|
|
Income taxes payable
|
|
|
41 |
|
|
|
- |
|
|
|
41 |
|
|
|
- |
|
|
|
- |
|
|
|
- |
|
|
|
- |
|
|
|
- |
|
|
|
- |
|
|
Deferred rent
|
|
|
(87 |
) |
|
|
- |
|
|
|
(87 |
) |
|
|
101 |
|
|
|
- |
|
|
|
101 |
|
|
|
85 |
|
|
|
- |
|
|
|
85 |
|
| |
|
|
|
|
|
|
|
|
|
|
|
|
|
|
|
|
|
|
|
|
|
|
|
|
|
|
|
|
|
|
|
|
|
|
|
|
|
Net cash provided by (used in) operating activities
|
|
|
12,069 |
|
|
|
- |
|
|
|
12,069 |
|
|
|
(1,592 |
) |
|
|
- |
|
|
|
(1,592 |
) |
|
|
(7,720 |
) |
|
|
- |
|
|
|
(7,720 |
) |
| |
|
|
|
|
|
|
|
|
|
|
|
|
|
|
|
|
|
|
|
|
|
|
|
|
|
|
|
|
|
|
|
|
|
|
|
|
|
CASH FLOWS FROM INVESTING ACTIVITIES
|
|
|
|
|
|
|
|
|
|
|
|
|
|
|
|
|
|
|
|
|
|
|
|
|
|
|
|
|
|
|
|
|
|
|
|
|
|
Redemption of marketable securities
|
|
|
- |
|
|
|
- |
|
|
|
- |
|
|
|
- |
|
|
|
- |
|
|
|
- |
|
|
|
125 |
|
|
|
- |
|
|
|
125 |
|
|
Purchases of property and equipment
|
|
|
(962 |
) |
|
|
- |
|
|
|
(962 |
) |
|
|
(527 |
) |
|
|
- |
|
|
|
(527 |
) |
|
|
(394 |
) |
|
|
- |
|
|
|
(394 |
) |
|
Net cash used in investing activities
|
|
|
(962 |
) |
|
|
- |
|
|
|
(962 |
) |
|
|
(527 |
) |
|
|
- |
|
|
|
(527 |
) |
|
|
(269 |
) |
|
|
- |
|
|
|
(269 |
) |
| |
|
|
|
|
|
|
|
|
|
|
|
|
|
|
|
|
|
|
|
|
|
|
|
|
|
|
|
|
|
|
|
|
|
|
|
|
|
CASH FLOWS FROM FINANCING ACTIVITES
|
|
|
|
|
|
|
|
|
|
|
|
|
|
|
|
|
|
|
|
|
|
|
|
|
|
|
|
|
|
|
|
|
|
|
|
|
|
Proceeds from issuance of common stock
|
|
|
- |
|
|
|
- |
|
|
|
- |
|
|
|
8,000 |
|
|
|
- |
|
|
|
8,000 |
|
|
|
976 |
|
|
|
- |
|
|
|
976 |
|
|
Deferred finance charges
|
|
|
(389 |
) |
|
|
- |
|
|
|
(389 |
) |
|
|
- |
|
|
|
- |
|
|
|
- |
|
|
|
- |
|
|
|
- |
|
|
|
- |
|
|
Proceeds from exercise of warrants
|
|
|
240 |
|
|
|
- |
|
|
|
240 |
|
|
|
100 |
|
|
|
- |
|
|
|
100 |
|
|
|
- |
|
|
|
- |
|
|
|
- |
|
|
Proceeds from exercise of stock options
|
|
|
30 |
|
|
|
- |
|
|
|
30 |
|
|
|
32 |
|
|
|
- |
|
|
|
32 |
|
|
|
- |
|
|
|
- |
|
|
|
- |
|
|
Payments of capitalized lease obligations
|
|
|
(10 |
) |
|
|
- |
|
|
|
(10 |
) |
|
|
(13 |
) |
|
|
- |
|
|
|
(13 |
) |
|
|
(12 |
) |
|
|
- |
|
|
|
(12 |
) |
|
Net cash (used in) provided by financing activities
|
|
|
(129 |
) |
|
|
- |
|
|
|
(129 |
) |
|
|
8,119 |
|
|
|
- |
|
|
|
8,119 |
|
|
|
964 |
|
|
|
- |
|
|
|
964 |
|
| |
|
|
|
|
|
|
|
|
|
|
|
|
|
|
|
|
|
|
|
|
|
|
|
|
|
|
|
|
|
|
|
|
|
|
|
|
|
INCREASE (DECREASE) IN CASH AND CASH EQUIVALENTS
|
|
|
10,978 |
|
|
|
- |
|
|
|
10,978 |
|
|
|
6,000 |
|
|
|
- |
|
|
|
6,000 |
|
|
|
(7,025 |
) |
|
|
- |
|
|
|
(7,025 |
) |
| |
|
|
|
|
|
|
|
|
|
|
|
|
|
|
|
|
|
|
|
|
|
|
|
|
|
|
|
|
|
|
|
|
|
|
|
|
|
CASH AND CASH EQUIVALENTS - BEGINNING OF YEAR
|
|
|
6,987 |
|
|
|
- |
|
|
|
6,987 |
|
|
|
987 |
|
|
|
- |
|
|
|
987 |
|
|
|
8,012 |
|
|
|
- |
|
|
|
8,012 |
|
| |
|
|
|
|
|
|
|
|
|
|
|
|
|
|
|
|
|
|
|
|
|
|
|
|
|
|
|
|
|
|
|
|
|
|
|
|
|
CASH AND CASH EQUIVALENTS - END OF YEAR
|
|
$ |
17,965 |
|
|
$ |
- |
|
|
$ |
17,965 |
|
|
$ |
6,987 |
|
|
|
- |
|
|
$ |
6,987 |
|
|
$ |
987 |
|
|
$ |
- |
|
|
$ |
987 |
|
| |
|
|
|
|
|
|
|
|
|
|
|
|
|
|
|
|
|
|
|
|
|
|
|
|
|
|
|
|
|
|
|
|
|
|
|
|
| |
|
|
|
|
|
|
|
|
|
|
|
|
|
|
|
|
|
|
|
|
|
|
|
|
|
|
|
|
|
|
|
|
|
|
|
|
|
Non-cash financing and investing activities:
|
|
|
|
|
|
|
|
|
|
|
|
|
|
|
|
|
|
|
|
|
|
|
|
|
|
|
|
|
|
|
|
|
|
|
|
|
|
Issuance of common stock in connection with conversion of debt
|
|
$ |
- |
|
|
$ |
- |
|
|
$ |
- |
|
|
$ |
10,000 |
|
|
$ |
- |
|
|
$ |
10,000 |
|
|
$ |
2,500 |
|
|
$ |
- |
|
|
$ |
2,500 |
|
| |
|
|
|
|
|
|
|
|
|
|
|
|
|
|
|
|
|
|
|
|
|
|
|
|
|
|
|
|
|
|
|
|
|
|
|
|
|
Supplemental disclosure of cash flow information
|
|
|
|
|
|
|
|
|
|
|
|
|
|
|
|
|
|
|
|
|
|
|
|
|
|
|
|
|
|
|
|
|
|
|
|
|
|
Interest paid
|
|
$ |
246 |
|
$ |
|
- |
|
|
$ |
246 |
|
|
$ |
226 |
|
|
$ |
- |
|
|
$ |
226 |
|
|
$ |
675 |
|
|
$ |
- |
|
|
$ |
675 |
|
|
Income taxes paid
|
|
$ |
163 |
|
$ |
|
- |
|
|
$ |
163 |
|
|
$ |
- |
|
|
$ |
- |
|
|
$ |
- |
|
|
$ |
- |
|
|
$ |
- |
|
|
$ |
- |
|
The following table details the impact of the restatements on the Company’s Balance Sheets as of March 31, June 30, and September 30, 2011, respectively:
| |
|
As of March 31, 2011
(unaudited)
|
|
|
As of June 30, 2011
(unaudited)
|
|
|
As of September 30, 2011
(unaudited)
|
|
|
(in thousands)
|
|
As Reported
|
|
|
Adjustments
|
|
|
Restated
|
|
|
As Reported
|
|
|
Adjustments
|
|
|
Restated
|
|
|
As Reported
|
|
|
Adjustments
|
|
|
Restated
|
|
| |
|
|
|
|
|
|
|
|
|
|
|
|
|
|
|
|
|
|
|
|
|
|
|
|
|
|
|
|
ASSETS
|
|
|
|
|
|
|
|
|
|
|
|
|
|
|
|
|
|
|
|
|
|
|
|
|
|
|
|
|
CURRENT ASSETS
|
|
|
|
|
|
|
|
|
|
|
|
|
|
|
|
|
|
|
|
|
|
|
|
|
|
|
|
|
Cash and cash equivalents
|
|
$ |
8,729 |
|
|
$ |
- |
|
|
$ |
8,729 |
|
|
$ |
12,545 |
|
|
$ |
- |
|
|
$ |
12,545 |
|
|
$ |
14,846 |
|
|
$ |
- |
|
|
$ |
14,846 |
|
|
Accounts receivable
|
|
|
1,589 |
|
|
|
- |
|
|
|
1,589 |
|
|
|
478 |
|
|
|
- |
|
|
|
478 |
|
|
|
352 |
|
|
|
- |
|
|
|
352 |
|
|
Inventory
|
|
|
965 |
|
|
|
- |
|
|
|
965 |
|
|
|
2,452 |
|
|
|
- |
|
|
|
2,452 |
|
|
|
2,716 |
|
|
|
- |
|
|
|
2,716 |
|
|
Prepaid expenses and other current assets
|
|
|
266 |
|
|
|
- |
|
|
|
266 |
|
|
|
274 |
|
|
|
- |
|
|
|
274 |
|
|
|
173 |
|
|
|
- |
|
|
|
173 |
|
| |
|
|
|
|
|
|
|
|
|
|
|
|
|
|
|
|
|
|
|
|
|
|
|
|
|
|
|
|
|
|
|
|
|
|
|
|
|
Total current assets
|
|
|
11,549 |
|
|
|
- |
|
|
|
11,549 |
|
|
|
15,749 |
|
|
|
- |
|
|
|
15,749 |
|
|
|
18,087 |
|
|
|
- |
|
|
|
18,087 |
|
| |
|
|
|
|
|
|
|
|
|
|
|
|
|
|
|
|
|
|
|
|
|
|
|
|
|
|
|
|
|
|
|
|
|
|
|
|
|
Property and equipment, net
|
|
|
1,002 |
|
|
|
- |
|
|
|
1,002 |
|
|
|
1,049 |
|
|
|
- |
|
|
|
1,049 |
|
|
|
1,197 |
|
|
|
- |
|
|
|
1,197 |
|
|
Deferred financing costs, net
|
|
|
- |
|
|
|
- |
|
|
|
- |
|
|
|
- |
|
|
|
- |
|
|
|
- |
|
|
|
421 |
|
|
|
- |
|
|
|
421 |
|
| |
|
|
|
|
|
|
|
|
|
|
|
|
|
|
|
|
|
|
|
|
|
|
|
|
|
|
|
|
|
|
|
|
|
|
|
|
|
Total assets
|
|
$ |
12,551 |
|
|
$ |
- |
|
|
$ |
12,551 |
|
|
$ |
16,798 |
|
|
$ |
- |
|
|
$ |
16,798 |
|
|
$ |
19,705 |
|
|
$ |
- |
|
|
$ |
19,705 |
|
| |
|
|
|
|
|
|
|
|
|
|
|
|
|
|
|
|
|
|
|
|
|
|
|
|
|
|
|
|
|
|
|
|
|
|
|
|
|
LIABILITIES AND STOCKHOLDERS' EQUITY
|
|
|
|
|
|
|
|
|
|
|
|
|
|
|
|
|
|
|
|
|
|
|
|
|
|
|
|
|
|
|
|
|
|
|
|
|
|
CURRENT LIABILITIES
|
|
|
|
|
|
|
|
|
|
|
|
|
|
|
|
|
|
|
|
|
|
|
|
|
|
|
|
|
|
|
|
|
|
|
|
|
|
Accounts payable
|
|
$ |
3,604 |
|
|
$ |
- |
|
|
$ |
3,604 |
|
|
$ |
4,630 |
|
|
$ |
- |
|
|
$ |
4,630 |
|
|
$ |
4,185 |
|
|
$ |
- |
|
|
$ |
4,185 |
|
|
Accrued expenses and other current liabilities
|
|
|
740 |
|
|
|
- |
|
|
|
740 |
|
|
|
696 |
|
|
|
- |
|
|
|
696 |
|
|
|
981 |
|
|
|
- |
|
|
|
981 |
|
|
Deferred revenue
|
|
|
104 |
|
|
|
198 |
|
|
|
302 |
|
|
|
107 |
|
|
|
270 |
|
|
|
377 |
|
|
|
103 |
|
|
|
314 |
|
|
|
417 |
|
|
Income taxes payable
|
|
|
28 |
|
|
|
- |
|
|
|
28 |
|
|
|
109 |
|
|
|
- |
|
|
|
109 |
|
|
|
- |
|
|
|
- |
|
|
|
- |
|
|
Capital lease obligations, current portion
|
|
|
7 |
|
|
|
- |
|
|
|
7 |
|
|
|
4 |
|
|
|
- |
|
|
|
4 |
|
|
|
- |
|
|
|
- |
|
|
|
- |
|
|
Warrant liability, current
|
|
|
- |
|
|
|
2,176 |
|
|
|
2,176 |
|
|
|
- |
|
|
|
1,645 |
|
|
|
1,645 |
|
|
|
- |
|
|
|
1,873 |
|
|
|
1,873 |
|
| |
|
|
|
|
|
|
|
|
|
|
|
|
|
|
|
|
|
|
|
|
|
|
|
|
|
|
|
|
|
|
|
|
|
|
|
|
|
Total current liabilities
|
|
|
4,483 |
|
|
|
2,374 |
|
|
|
6,857 |
|
|
|
5,546 |
|
|
|
1,915 |
|
|
|
7,461 |
|
|
|
5,269 |
|
|
|
2,187 |
|
|
|
7,456 |
|
| |
|
|
|
|
|
|
|
|
|
|
|
|
|
|
|
|
|
|
|
|
|
|
|
|
|
|
|
|
|
|
|
|
|
|
|
|
|
NON-CURRENT LIABILITIES
|
|
|
|
|
|
|
|
|
|
|
|
|
|
|
|
|
|
|
|
|
|
|
|
|
|
|
|
|
|
|
|
|
|
|
|
|
|
Deferred rent
|
|
|
164 |
|
|
|
- |
|
|
|
164 |
|
|
|
143 |
|
|
|
- |
|
|
|
143 |
|
|
|
121 |
|
|
|
- |
|
|
|
121 |
|
|
Warrant liability, net of current
|
|
|
- |
|
|
|
1,093 |
|
|
|
1,093 |
|
|
|
- |
|
|
|
625 |
|
|
|
625 |
|
|
|
- |
|
|
|
580 |
|
|
|
580 |
|
| |
|
|
|
|
|
|
|
|
|
|
|
|
|
|
|
|
|
|
|
|
|
|
|
|
|
|
|
|
|
|
|
|
|
|
|
|
|
Total liabilities
|
|
|
4,647 |
|
|
|
3,467 |
|
|
|
8,114 |
|
|
|
5,689 |
|
|
|
2,540 |
|
|
|
8,229 |
|
|
|
5,390 |
|
|
|
2,767 |
|
|
|
8,157 |
|
| |
|
|
|
|
|
|
|
|
|
|
|
|
|
|
|
|
|
|
|
|
|
|
|
|
|
|
|
|
|
|
|
|
|
|
|
|
|
COMMITMENTS AND CONTINGENCIES
|
|
|
|
|
|
|
|
|
|
|
|
|
|
|
|
|
|
|
|
|
|
|
|
|
|
|
|
|
|
|
|
|
|
|
|
|
| |
|
|
|
|
|
|
|
|
|
|
|
|
|
|
|
|
|
|
|
|
|
|
|
|
|
|
|
|
|
|
|
|
|
|
|
|
|
STOCKHOLDERS' EQUITY
|
|
|
|
|
|
|
|
|
|
|
|
|
|
|
|
|
|
|
|
|
|
|
|
|
|
|
|
|
|
|
|
|
|
|
|
|
|
Common stock, $.001 par value;
|
|
|
|
|
|
|
|
|
|
|
|
|
|
|
|
|
|
|
|
|
|
|
|
|
|
|
|
|
|
|
|
|
|
|
|
|
|
20,000,000, 100,000,000 and 100,000,000 shares authorized;
|
|
|
|
|
|
|
|
|
|
|
|
|
|
|
|
|
|
|
|
|
|
|
|
|
|
|
|
|
|
|
|
|
|
|
|
|
|
16,503,014, 16,532,228 and 16,539,062 shares issued; and
|
|
|
|
|
|
|
|
|
|
|
|
|
|
|
|
|
|
|
|
|
|
|
|
|
|
|
|
|
|
|
|
|
|
|
|
|
|
16,493,014, 16,522,228 and 16,529,062 shares outstanding, respectively
|
|
|
16 |
|
|
|
- |
|
|
|
16 |
|
|
|
16 |
|
|
|
- |
|
|
|
16 |
|
|
|
17 |
|
|
|
- |
|
|
|
17 |
|
|
Additional paid-in capital
|
|
|
150,432 |
|
|
|
83,276 |
|
|
|
233,708 |
|
|
|
151,190 |
|
|
|
83,148 |
|
|
|
234,338 |
|
|
|
151,938 |
|
|
|
82,949 |
|
|
|
234,887 |
|
|
Accumulated deficit
|
|
|
(142,344 |
) |
|
|
(86,743 |
) |
|
|
(229,087 |
) |
|
|
(139,897 |
) |
|
|
(85,688 |
) |
|
|
(225,585 |
) |
|
|
(137,440 |
) |
|
|
(85,716 |
) |
|
|
(223,156 |
) |
|
Less: treasury stock; 10,000 shares at cost
|
|
|
(200 |
) |
|
|
- |
|
|
|
(200 |
) |
|
|
(200 |
) |
|
|
- |
|
|
|
(200 |
) |
|
|
(200 |
) |
|
|
- |
|
|
|
(200 |
) |
| |
|
|
|
|
|
|
|
|
|
|
|
|
|
|
|
|
|
|
|
|
|
|
|
|
|
|
|
|
|
|
|
|
|
|
|
|
|
Total stockholders' equity
|
|
|
7,904 |
|
|
|
(3,467 |
) |
|
|
4,437 |
|
|
|
11,109 |
|
|
|
(2,540 |
) |
|
|
8,569 |
|
|
|
14,315 |
|
|
|
(2,767 |
) |
|
|
11,548 |
|
| |
|
|
|
|
|
|
|
|
|
|
|
|
|
|
|
|
|
|
|
|
|
|
|
|
|
|
|
|
|
|
|
|
|
|
|
|
|
Total liabilities and stockholders' equity
|
|
$ |
12,551 |
|
|
$ |
- |
|
|
$ |
12,551 |
|
|
$ |
16,798 |
|
|
$ |
- |
|
|
$ |
16,798 |
|
|
$ |
19,705 |
|
|
$ |
- |
|
|
$ |
19,705 |
|
The following table details the impact of the restatements on the Company’s Statements of Operations for the three, six and nine months ended as of March 31, June 30, and September 30, 2011 respectively:
| |
|
Three Months Ended March 31, 2011
(unaudited)
|
|
|
Three Months Ended June 30, 2011
(unaudited)
|
|
|
Six Months Ended June 30, 2011
(unaudited)
|
|
|
Three Months Ended September 30, 2011
(unaudited)
|
|
|
Nine Months Ended September 30, 2011
(unaudited)
|
|
|
(in thousands, except per share data)
|
|
As Reported
|
|
|
Adjustment
|
|
|
Restated
|
|
|
As Reported
|
|
|
Adjustment
|
|
|
Restated
|
|
|
As Reported
|
|
|
Adjustment
|
|
|
Restated
|
|
|
As Reported
|
|
|
Adjustment
|
|
|
Restated
|
|
|
As Reported
|
|
|
Adjustment
|
|
|
Restated
|
|
| |
|
|
|
|
|
|
|
|
|
|
|
|
|
|
|
|
|
|
|
|
|
|
|
|
|
|
|
|
|
|
|
|
|
|
|
|
|
|
|
|
|
|
|
|
|
|
Total revenue
|
|
$ |
12,006 |
|
|
$ |
(58 |
) |
|
$ |
11,948 |
|
|
$ |
15,986 |
|
|
$ |
(72 |
) |
|
$ |
15,914 |
|
|
$ |
27,992 |
|
|
$ |
(130 |
) |
|
$ |
27,862 |
|
|
$ |
16,960 |
|
|
$ |
(44 |
) |
|
$ |
16,916 |
|
|
$ |
44,952 |
|
|
$ |
(174 |
) |
|
$ |
44,778 |
|
|
Cost of goods sold
|
|
|
6,801 |
|
|
|
- |
|
|
|
6,801 |
|
|
|
9,162 |
|
|
|
(22 |
) |
|
|
9,140 |
|
|
|
15,963 |
|
|
|
(22 |
) |
|
|
15,941 |
|
|
|
9,447 |
|
|
|
(27 |
) |
|
|
9,420 |
|
|
|
25,410 |
|
|
|
(49 |
) |
|
|
25,361 |
|
|
Gross profit
|
|
|
5,205 |
|
|
|
(58 |
) |
|
|
5,147 |
|
|
|
6,824 |
|
|
|
(50 |
) |
|
|
6,774 |
|
|
|
12,029 |
|
|
|
(108 |
) |
|
|
11,921 |
|
|
|
7,513 |
|
|
|
(17 |
) |
|
|
7,496 |
|
|
|
19,542 |
|
|
|
(125 |
) |
|
|
19,417 |
|
| |
|
|
|
|
|
|
|
|
|
|
|
|
|
|
|
|
|
|
|
|
|
|
|
|
|
|
|
|
|
|
|
|
|
|
|
|
|
|
|
|
|
|
|
|
|
|
|
|
|
|
|
|
|
|
|
|
|
|
|
|
|
Operating expenses:
|
|
|
|
|
|
|
|
|
|
|
|
|
|
|
|
|
|
|
|
|
|
|
|
|
|
|
|
|
|
|
|
|
|
|
|
|
|
|
|
|
|
|
|
|
|
|
|
|
|
|
|
|
|
|
|
|
|
|
|
|
|
Research and development expenses
|
|
|
2,088 |
|
|
|
(89 |
) |
|
|
1,999 |
|
|
|
2,805 |
|
|
|
(86 |
) |
|
|
2,719 |
|
|
|
4,893 |
|
|
|
(175 |
) |
|
|
4,718 |
|
|
|
3,053 |
|
|
|
(100 |
) |
|
|
2,953 |
|
|
|
7,946 |
|
|
|
(275 |
) |
|
|
7,671 |
|
|
Selling, general and administrative expenses
|
|
|
2,011 |
|
|
|
(175 |
) |
|
|
1,836 |
|
|
|
1,496 |
|
|
|
(147 |
) |
|
|
1,349 |
|
|
|
3,507 |
|
|
|
(322 |
) |
|
|
3,185 |
|
|
|
1,956 |
|
|
|
(170 |
) |
|
|
1,786 |
|
|
|
5,463 |
|
|
|
(492 |
) |
|
|
4,971 |
|
| |
|
|
|
|
|
|
|
|
|
|
|
|
|
|
|
|
|
|
|
|
|
|
|
|
|
|
|
|
|
|
|
|
|
|
|
|
|
|
|
|
|
|
|
|
|
|
|
|
|
|
|
|
|
|
|
|
|
|
|
|
|
Total operating expenses
|
|
|
4,099 |
|
|
|
(264 |
) |
|
|
3,835 |
|
|
|
4,301 |
|
|
|
(233 |
) |
|
|
4,068 |
|
|
|
8,400 |
|
|
|
(497 |
) |
|
|
7,903 |
|
|
|
5,009 |
|
|
|
(270 |
) |
|
|
4,739 |
|
|
|
13,409 |
|
|
|
(767 |
) |
|
|
12,642 |
|
| |
|
|
|
|
|
|
|
|
|
|
|
|
|
|
|
|
|
|
|
|
|
|
|
|
|
|
|
|
|
|
|
|
|
|
|
|
|
|
|
|
|
|
|
|
|
|
|
|
|
|
|
|
|
|
|
|
|
|
|
|
|
Operating income/(loss)
|
|
|
1,106 |
|
|
|
206 |
|
|
|
1,312 |
|
|
|
2,523 |
|
|
|
183 |
|
|
|
2,706 |
|
|
|
3,629 |
|
|
|
389 |
|
|
|
4,018 |
|
|
|
2,504 |
|
|
|
253 |
|
|
|
2,757 |
|
|
|
6,133 |
|
|
|
642 |
|
|
|
6,775 |
|
| |
|
|
|
|
|
|
|
|
|
|
|
|
|
|
|
|
|
|
|
|
|
|
|
|
|
|
|
|
|
|
|
|
|
|
|
|
|
|
|
|
|
|
|
|
|
|
|
|
|
|
|
|
|
|
|
|
|
|
|
|
|
Interest income (expense), net
|
|
|
6 |
|
|
|
- |
|
|
|
6 |
|
|
|
6 |
|
|
|
- |
|
|
|
6 |
|
|
|
12 |
|
|
|
- |
|
|
|
12 |
|
|
|
5 |
|
|
|
- |
|
|
|
5 |
|
|
|
17 |
|
|
|
- |
|
|
|
17 |
|
|
Mark-to-market adjustment of warrant liability
|
|
|
- |
|
|
|
1,050 |
|
|
|
1,050 |
|
|
|
- |
|
|
|
872 |
|
|
|
872 |
|
|
|
- |
|
|
|
1,922 |
|
|
|
1,922 |
|
|
|
- |
|
|
|
(281 |
) |
|
|
(281 |
) |
|
|
- |
|
|
|
1,641 |
|
|
|
1,641 |
|
|
Total other income
|
|
|
6 |
|
|
|
1,050 |
|
|
|
1,056 |
|
|
|
6 |
|
|
|
872 |
|
|
|
878 |
|
|
|
12 |
|
|
|
1,922 |
|
|
|
1,934 |
|
|
|
5 |
|
|
|
(281 |
) |
|
|
(276 |
) |
|
|
17 |
|
|
|
1,641 |
|
|
|
1,658 |
|
| |
|
|
|
|
|
|
|
|
|
|
|
|
|
|
|
|
|
|
|
|
|
|
|
|
|
|
|
|
|
|
|
|
|
|
|
|
|
|
|
|
|
|
|
|
|
|
|
|
|
|
|
|
|
|
|
|
|
|
|
|
|
Income/(loss) before taxes
|
|
|
1,112 |
|
|
|
1,256 |
|
|
|
2,368 |
|
|
|
2,529 |
|
|
|
1,055 |
|
|
|
3,584 |
|
|
|
3,641 |
|
|
|
2,311 |
|
|
|
5,952 |
|
|
|
2,509 |
|
|
|
(28 |
) |
|
|
2,481 |
|
|
|
6,150 |
|
|
|
2,283 |
|
|
|
8,433 |
|
| |
|
|
|
|
|
|
|
|
|
|
|
|
|
|
|
|
|
|
|
|
|
|
|
|
|
|
|
|
|
|
|
|
|
|
|
|
|
|
|
|
|
|
|
|
|
|
|
|
|
|
|
|
|
|
|
|
|
|
|
|
|
Provision for income taxes
|
|
|
28 |
|
|
|
- |
|
|
|
28 |
|
|
|
81 |
|
|
|
- |
|
|
|
81 |
|
|
|
109 |
|
|
|
- |
|
|
|
109 |
|
|
|
54 |
|
|
|
- |
|
|
|
54 |
|
|
|
163 |
|
|
|
- |
|
|
|
163 |
|
| |
|
|
|
|
|
|
|
|
|
|
|
|
|
|
|
|
|
|
|
|
|
|
|
|
|
|
|
|
|
|
|
|
|
|
|
|
|
|
|
|
|
|
|
|
|
|
|
|
|
|
|
|
|
|
|
|
|
|
|
|
|
Net income and comprehensive income
|
|
$ |
1,084 |
|
|
$ |
1,256 |
|
|
$ |
2,340 |
|
|
$ |
2,448 |
|
|
$ |
1,055 |
|
|
$ |
3,503 |
|
|
$ |
3,532 |
|
|
$ |
2,311 |
|
|
$ |
5,843 |
|
|
$ |
2,455 |
|
|
$ |
(28 |
) |
|
$ |
2,427 |
|
|
$ |
5,987 |
|
|
$ |
2,283 |
|
|
$ |
8,270 |
|
| |
|
|
|
|
|
|
|
|
|
|
|
|
|
|
|
|
|
|
|
|
|
|
|
|
|
|
|
|
|
|
|
|
|
|
|
|
|
|
|
|
|
|
|
|
|
|
|
|
|
|
|
|
|
|
|
|
|
|
|
|
|
Net income per share (basic)
|
|
$ |
0.07 |
|
|
$ |
0.08 |
|
|
$ |
0.14 |
|
|
$ |
0.15 |
|
|
$ |
0.06 |
|
|
$ |
0.21 |
|
|
$ |
0.21 |
|
|
$ |
0.14 |
|
|
$ |
0.35 |
|
|
$ |
0.15 |
|
|
$ |
(0.00 |
) |
|
$ |
0.15 |
|
|
$ |
0.36 |
|
|
$ |
0.14 |
|
|
$ |
0.50 |
|
|
Net income per share (diluted)
|
|
$ |
0.06 |
|
|
$ |
0.07 |
|
|
$ |
0.14 |
|
|
$ |
0.14 |
|
|
$ |
0.06 |
|
|
$ |
0.21 |
|
|
$ |
0.21 |
|
|
$ |
0.14 |
|
|
$ |
0.35 |
|
|
$ |
0.14 |
|
|
$ |
(0.00 |
) |
|
$ |
0.14 |
|
|
$ |
0.35 |
|
|
$ |
0.13 |
|
|
$ |
0.49 |
|
| |
|
|
|
|
|
|
|
|
|
|
|
|
|
|
|
|
|
|
|
|
|
|
|
|
|
|
|
|
|
|
|
|
|
|
|
|
|
|
|
|
|
|
|
|
|
|
|
|
|
|
|
|
|
|
|
|
|
|
|
|
|
Weighted average shares used in computing basic net income per share
|
|
|
16,486 |
|
|
|
16,486 |
|
|
|
16,486 |
|
|
|
16,505 |
|
|
|
16,505 |
|
|
|
16,505 |
|
|
|
16,496 |
|
|
|
16,496 |
|
|
|
16,496 |
|
|
|
16,526 |
|
|
|
16,526 |
|
|
|
16,526 |
|
|
|
16,506 |
|
|
|
16,506 |
|
|
|
16,506 |
|
|
Weighted average shares used in computing diluted net income per share
|
|
|
16,946 |
|
|
|
16,946 |
|
|
|
16,946 |
|
|
|
16,909 |
|
|
|
16,909 |
|
|
|
16,909 |
|
|
|
16,936 |
|
|
|
16,936 |
|
|
|
16,936 |
|
|
|
16,950 |
|
|
|
16,950 |
|
|
|
16,950 |
|
|
|
16,927 |
|
|
|
16,927 |
|
|
|
16,927 |
|
The following table details the impact of the restatements of the Company’s Statements of Cash Flows for the three, six and nine months ended as of March 31, June 30, and September 30, 2011 respectively:
|
(in thousands)
|
|
Three Months Ended March 31, 2011
(unaudited)
|
|
|
Six Months Ended June 30, 2011
(unaudited)
|
|
|
Nine Months Ended September 30, 2011
(unaudited)
|
|
| |
|
As Reported
|
|
|
Adjustments
|
|
|
Restated
|
|
|
As Reported
|
|
|
Adjustments
|
|
|
Restated
|
|
|
As Reported
|
|
|
Adjustments
|
|
|
Restated
|
|
| |
|
|
|
|
|
|
|
|
|
|
|
|
|
|
|
|
|
|
|
|
|
|
|
|
|
|
|
|
CASH FLOWS FROM OPERATING ACTIVITIES
|
|
|
|
|
|
|
|
|
|
|
|
|
|
|
|
|
|
|
|
|
|
|
|
|
|
|
|
|
Net income
|
|
$ |
1,084 |
|
|
$ |
1,256 |
|
|
$ |
2,340 |
|
|
$ |
3,532 |
|
|
$ |
2,311 |
|
|
$ |
5,843 |
|
|
$ |
5,987 |
|
|
$ |
2,283 |
|
|
$ |
8,270 |
|
|
Adjustments to reconcile net
income to net
cash provided by operating activities:
|
|
|
|
|
|
|
|
|
|
|
|
|
|
|
|
|
|
|
|
|
|
|
|
|
|
|
|
|
|
|
|
|
|
|
|
|
|
Depreciation and amortization
|
|
|
97 |
|
|
|
- |
|
|
|
97 |
|
|
|
206 |
|
|
|
- |
|
|
|
206 |
|
|
|
328 |
|
|
|
- |
|
|
|
328 |
|
|
Stock-based compensation
|
|
|
652 |
|
|
|
(264 |
) |
|
|
388 |
|
|
|
1,306 |
|
|
|
(519 |
) |
|
|
787 |
|
|
|
2,020 |
|
|
|
(816 |
) |
|
|
1,204 |
|
|
Mark-to-market adjustment of warrant liability
|
|
|
- |
|
|
|
(1,050 |
) |
|
|
(1,050 |
) |
|
|
- |
|
|
|
(1,922 |
) |
|
|
(1,922 |
) |
|
|
- |
|
|
|
(1,641 |
) |
|
|
(1,641 |
) |
|
Changes in operating assets and liabilities:
|
|
|
|
|
|
|
|
|
|
|
|
|
|
|
|
|
|
|
|
|
|
|
|
|
|
|
|
|
|
|
|
|
|
|
|
|
|
Accounts receivable
|
|
|
142 |
|
|
|
- |
|
|
|
142 |
|
|
|
1,253 |
|
|
|
- |
|
|
|
1,253 |
|
|
|
1,379 |
|
|
|
- |
|
|
|
1,379 |
|
|
Inventory
|
|
|
(131 |
) |
|
|
- |
|
|
|
(131 |
) |
|
|
(1,618 |
) |
|
|
- |
|
|
|
(1,618 |
) |
|
|
(1,882 |
) |
|
|
- |
|
|
|
(1,882 |
) |
|
Prepaid expenses and other current assets
|
|
|
10 |
|
|
|
- |
|
|
|
10 |
|
|
|
2 |
|
|
|
- |
|
|
|
2 |
|
|
|
103 |
|
|
|
- |
|
|
|
103 |
|
|
Accounts payable
|
|
|
(5 |
) |
|
|
- |
|
|
|
(5 |
) |
|
|
1,022 |
|
|
|
- |
|
|
|
1,022 |
|
|
|
577 |
|
|
|
- |
|
|
|
577 |
|
|
Accrued expenses and other current liabilities
|
|
|
107 |
|
|
|
- |
|
|
|
107 |
|
|
|
64 |
|
|
|
- |
|
|
|
64 |
|
|
|
349 |
|
|
|
- |
|
|
|
349 |
|
|
Deferred revenue
|
|
|
104 |
|
|
|
58 |
|
|
|
162 |
|
|
|
107 |
|
|
|
130 |
|
|
|
237 |
|
|
|
103 |
|
|
|
174 |
|
|
|
277 |
|
|
Income taxes payable
|
|
|
28 |
|
|
|
- |
|
|
|
28 |
|
|
|
109 |
|
|
|
- |
|
|
|
109 |
|
|
|
- |
|
|
|
- |
|
|
|
- |
|
|
Deferred rent
|
|
|
(21 |
) |
|
|
- |
|
|
|
(21 |
) |
|
|
(43 |
) |
|
|
- |
|
|
|
(43 |
) |
|
|
(65 |
) |
|
|
- |
|
|
|
(65 |
) |
| |
|
|
|
|
|
|
|
|
|
|
|
|
|
|
|
|
|
|
|
|
|
|
|
|
|
|
|
|
|
|
|
|
|
|
|
|
|
Net cash provided by operating activities
|
|
|
2,067 |
|
|
|
- |
|
|
|
2,067 |
|
|
|
5,940 |
|
|
|
- |
|
|
|
5,940 |
|
|
|
8,899 |
|
|
|
- |
|
|
|
8,899 |
|
| |
|
|
|
|
|
|
|
|
|
|
|
|
|
|
|
|
|
|
|
|
|
|
|
|
|
|
|
|
|
|
|
|
|
|
|
|
|
CASH FLOWS FROM INVESTING ACTIVITIES
|
|
|
|
|
|
|
|
|
|
|
|
|
|
|
|
|
|
|
|
|
|
|
|
|
|
|
|
|
|
|
|
|
|
|
|
|
|
Purchases of property and equipment
|
|
|
(354 |
) |
|
|
- |
|
|
|
(354 |
) |
|
|
(511 |
) |
|
|
- |
|
|
|
(511 |
) |
|
|
(780 |
) |
|
|
- |
|
|
|
(780 |
) |
|
Net cash used in investing activities
|
|
|
(354 |
) |
|
|
- |
|
|
|
(354 |
) |
|
|
(511 |
) |
|
|
- |
|
|
|
(511 |
) |
|
|
(780 |
) |
|
|
- |
|
|
|
(780 |
) |
| |
|
|
|
|
|
|
|
|
|
|
|
|
|
|
|
|
|
|
|
|
|
|
|
|
|
|
|
|
|
|
|
|
|
|
|
|
|
CASH FLOWS FROM FINANCING ACTIVITES
|
|
|
|
|
|
|
|
|
|
|
|
|
|
|
|
|
|
|
|
|
|
|
|
|
|
|
|
|
|
|
|
|
|
|
|
|
|
Deferred finance charges
|
|
|
- |
|
|
|
- |
|
|
|
- |
|
|
|
- |
|
|
|
- |
|
|
|
- |
|
|
|
(421 |
) |
|
|
- |
|
|
|
(421 |
) |
|
Proceeds from exercise of warrants
|
|
|
16 |
|
|
|
- |
|
|
|
16 |
|
|
|
106 |
|
|
|
- |
|
|
|
106 |
|
|
|
140 |
|
|
|
- |
|
|
|
140 |
|
|
Proceeds from exercise of stock options
|
|
|
16 |
|
|
|
- |
|
|
|
16 |
|
|
|
30 |
|
|
|
- |
|
|
|
30 |
|
|
|
31 |
|
|
|
- |
|
|
|
31 |
|
|
Payments of capitalized lease obligations
|
|
|
(3 |
) |
|
|
- |
|
|
|
(3 |
) |
|
|
(7 |
) |
|
|
- |
|
|
|
(7 |
) |
|
|
(10 |
) |
|
|
- |
|
|
|
(10 |
) |
|
Net cash provided by (used in) financing activities
|
|
|
29 |
|
|
|
- |
|
|
|
29 |
|
|
|
129 |
|
|
|
- |
|
|
|
129 |
|
|
|
(260 |
) |
|
|
- |
|
|
|
(260 |
) |
| |
|
|
|
|
|
|
|
|
|
|
|
|
|
|
|
|
|
|
|
|
|
|
|
|
|
|
|
|
|
|
|
|
|
|
|
|
|
(DECREASE) INCREASE IN CASH AND CASH EQUIVALENTS
|
|
|
1,742 |
|
|
|
- |
|
|
|
1,742 |
|
|
|
5,558 |
|
|
|
- |
|
|
|
5,558 |
|
|
|
7,859 |
|
|
|
- |
|
|
|
7,859 |
|
| |
|
|
|
|
|
|
|
|
|
|
|
|
|
|
|
|
|
|
|
|
|
|
|
|
|
|
|
|
|
|
|
|
|
|
|
|
|
CASH AND CASH EQUIVALENTS - BEGINNING OF YEAR
|
|
|
6,987 |
|
|
|
- |
|
|
|
6,987 |
|
|
|
6,987 |
|
|
|
- |
|
|
|
6,987 |
|
|
|
6,987 |
|
|
|
- |
|
|
|
6,987 |
|
| |
|
|
|
|
|
|
|
|
|
|
|
|
|
|
|
|
|
|
|
|
|
|
|
|
|
|
|
|
|
|
|
|
|
|
|
|
|
CASH AND CASH EQUIVALENTS - END OF YEAR
|
|
$ |
8,729 |
|
|
$ |
- |
|
|
$ |
8,729 |
|
|
$ |
12,545 |
|
|
$ |
- |
|
|
$ |
12,545 |
|
|
$ |
14,846 |
|
|
$ |
- |
|
|
$ |
14,846 |
|
| |
|
|
|
|
|
|
|
|
|
|
|
|
|
|
|
|
|
|
|
|
|
|
|
|
|
|
|
|
|
|
|
|
|
|
|
|
| |
|
|
|
|
|
|
|
|
|
|
|
|
|
|
|
|
|
|
|
|
|
|
|
|
|
|
|
|
|
|
|
|
|
|
|
|
|
Supplemental disclosures of cash flow information:
|
|
|
|
|
|
|
|
|
|
|
|
|
|
|
|
|
|
|
|
|
|
|
|
|
|
|
|
|
|
|
|
|
|
|
|
|
|
Interest paid
|
|
$ |
1 |
|
|
$ |
- |
|
|
$ |
1 |
|
|
$ |
246 |
|
|
$ |
- |
|
|
$ |
246 |
|
|
$ |
246 |
|
|
$ |
- |
|
|
$ |
246 |
|
|
Income taxes paid
|
|
$ |
- |
|
|
$ |
- |
|
|
$ |
- |
|
|
$ |
- |
|
|
$ |
- |
|
|
$ |
- |
|
|
$ |
163 |
|
|
$ |
- |
|
|
$ |
163 |
|
The following table details the impact of the restatements on the Company’s Balance Sheets as of March 31, June 30, and September 30, 2010 respectively:
| |
|
March 31, 2010
(unaudited)
|
|
|
June 30, 2010
(unaudited)
|
|
|
September 30, 2010
(unaudited)
|
|
| (in thousands) |
|
As Reported
|
|
|
Adjustments
|
|
|
Restated
|
|
|
As Reported
|
|
|
Adjustments
|
|
|
Restated
|
|
|
As Reported
|
|
|
Adjustments
|
|
|
Restated
|
|
| |
|
|
|
|
|
|
|
|
|
|
|
|
|
|
|
|
|
|
|
|
|
|
|
|
|
|
|
|
ASSETS
|
|
|
|
|
|
|
|
|
|
|
|
|
|
|
|
|
|
|
|
|
|
|
|
|
|
|
|
|
CURRENT ASSETS
|
|
|
|
|
|
|
|
|
|
|
|
|
|
|
|
|
|
|
|
|
|
|
|
|
|
|
|
|
Cash and cash equivalents
|
|
$ |
835 |
|
|
$ |
- |
|
|
$ |
835 |
|
|
$ |
1,374 |
|
|
$ |
- |
|
|
$ |
1,374 |
|
|
$ |
1,041 |
|
|
$ |
- |
|
|
$ |
1,041 |
|
|
Accounts receivable
|
|
|
57 |
|
|
|
- |
|
|
|
57 |
|
|
|
150 |
|
|
|
- |
|
|
|
150 |
|
|
|
1,359 |
|
|
|
- |
|
|
|
1,359 |
|
|
Inventory
|
|
|
812 |
|
|
|
- |
|
|
|
812 |
|
|
|
633 |
|
|
|
- |
|
|
|
633 |
|
|
|
769 |
|
|
|
- |
|
|
|
769 |
|
|
Prepaid expenses and other current assets
|
|
|
204 |
|
|
|
- |
|
|
|
204 |
|
|
|
200 |
|
|
|
- |
|
|
|
200 |
|
|
|
166 |
|
|
|
- |
|
|
|
166 |
|
| |
|
|
|
|
|
|
|
|
|
|
|
|
|
|
|
|
|
|
|
|
|
|
|
|
|
|
|
|
|
|
|
|
|
|
|
|
|
Total current assets
|
|
|
1,908 |
|
|
|
- |
|
|
|
1,908 |
|
|
|
2,357 |
|
|
|
- |
|
|
|
2,357 |
|
|
|
3,335 |
|
|
|
- |
|
|
|
3,335 |
|
| |
|
|
|
|
|
|
|
|
|
|
|
|
|
|
|
|
|
|
|
|
|
|
|
|
|
|
|
|
|
|
|
|
|
|
|
|
|
Property and equipment, net
|
|
|
688 |
|
|
|
- |
|
|
|
688 |
|
|
|
684 |
|
|
|
- |
|
|
|
684 |
|
|
|
698 |
|
|
|
- |
|
|
|
698 |
|
| |
|
|
|
|
|
|
|
|
|
|
|
|
|
|
|
|
|
|
|
|
|
|
|
|
|
|
|
|
|
|
|
|
|
|
|
|
|
Total assets
|
|
$ |
2,596 |
|
|
$ |
- |
|
|
$ |
2,596 |
|
|
$ |
3,041 |
|
|
$ |
- |
|
|
$ |
3,041 |
|
|
$ |
4,033 |
|
|
$ |
- |
|
|
$ |
4,033 |
|
| |
|
|
|
|
|
|
|
|
|
|
|
|
|
|
|
|
|
|
|
|
|
|
|
|
|
|
|
|
|
|
|
|
|
|
|
|
|
LIABILITIES AND STOCKHOLDERS' EQUITY
|
|
|
|
|
|
|
|
|
|
|
|
|
|
|
|
|
|
|
|
|
|
|
|
|
|
|
|
|
|
|
|
|
|
|
|
|
|
CURRENT LIABILITIES
|
|
|
|
|
|
|
|
|
|
|
|
|
|
|
|
|
|
|
|
|
|
|
|
|
|
|
|
|
|
|
|
|
|
|
|
|
|
Accounts payable
|
|
$ |
1,698 |
|
|
$ |
- |
|
|
$ |
1,698 |
|
|
$ |
1,792 |
|
|
$ |
- |
|
|
$ |
1,792 |
|
|
$ |
2,640 |
|
|
$ |
- |
|
|
$ |
2,640 |
|
|
Accrued expenses and other current liabilities
|
|
|
1,020 |
|
|
|
- |
|
|
|
1,020 |
|
|
|
925 |
|
|
|
- |
|
|
|
925 |
|
|
|
849 |
|
|
|
- |
|
|
|
849 |
|
|
Deferred revenue
|
|
|
57 |
|
|
|
20 |
|
|
|
77 |
|
|
|
38 |
|
|
|
56 |
|
|
|
94 |
|
|
|
19 |
|
|
|
84 |
|
|
|
103 |
|
|
Income taxes payable
|
|
|
- |
|
|
|
- |
|
|
|
- |
|
|
|
- |
|
|
|
- |
|
|
|
- |
|
|
|
- |
|
|
|
- |
|
|
|
- |
|
|
Capital lease obligations, current portion
|
|
|
13 |
|
|
|
- |
|
|
|
13 |
|
|
|
13 |
|
|
|
- |
|
|
|
13 |
|
|
|
14 |
|
|
|
- |
|
|
|
14 |
|
|
Warrant liability, current
|
|
|
- |
|
|
|
3,096 |
|
|
|
3,096 |
|
|
|
- |
|
|
|
1,381 |
|
|
|
1,381 |
|
|
|
- |
|
|
|
1,816 |
|
|
|
1,816 |
|
| |
|
|
|
|
|
|
|
|
|
|
|
|
|
|
|
|
|
|
|
|
|
|
|
|
|
|
|
|
|
|
|
|
|
|
|
|
|
Total current liabilities
|
|
|
2,788 |
|
|
|
3,116 |
|
|
|
5,904 |
|
|
|
2,768 |
|
|
|
1,437 |
|
|
|
4,205 |
|
|
|
3,522 |
|
|
|
1,900 |
|
|
|
5,422 |
|
| |
|
|
|
|
|
|
|
|
|
|
|
|
|
|
|
|
|
|
|
|
|
|
|
|
|
|
|
|
|
|
|
|
|
|
|
|
|
NON-CURRENT LIABILITIES
|
|
|
|
|
|
|
|
|
|
|
|
|
|
|
|
|
|
|
|
|
|
|
|
|
|
|
|
|
|
|
|
|
|
|
|
|
|
Deferred rent
|
|
|
142 |
|
|
|
- |
|
|
|
142 |
|
|
|
160 |
|
|
|
- |
|
|
|
160 |
|
|
|
178 |
|
|
|
- |
|
|
|
178 |
|
| Capital lease, less current portion |
|
|
7 |
|
|
|
- |
|
|
|
7 |
|
|
|
4 |
|
|
|
- |
|
|
|
4 |
|
|
|
- |
|
|
|
- |
|
|
|
|
- |
|
Warrant liability, net of current
|
|
|
- |
|
|
|
515 |
|
|
|
515 |
|
|
|
- |
|
|
|
88 |
|
|
|
88 |
|
|
|
- |
|
|
|
927 |
|
|
|
927 |
|
| |
|
|
|
|
|
|
|
|
|
|
|
|
|
|
|
|
|
|
|
|
|
|
|
|
|
|
|
|
|
|
|
|
|
|
|
|
|
Total liabilities
|
|
|
2,937 |
|
|
|
3,631 |
|
|
|
6,568 |
|
|
|
2,932 |
|
|
|
1,525 |
|
|
|
4,457 |
|
|
|
3,700 |
|
|
|
2,827 |
|
|
|
6,527 |
|
| |
|
|
|
|
|
|
|
|
|
|
|
|
|
|
|
|
|
|
|
|
|
|
|
|
|
|
|
|
|
|
|
|
|
|
|
|
|
COMMITMENTS AND CONTINGENCIES
|
|
|
|
|
|
|
|
|
|
|
|
|
|
|
|
|
|
|
|
|
|
|
|
|
|
|
|
|
|
|
|
|
|
|
|
|
| |
|
|
|
|
|
|
|
|
|
|
|
|
|
|
|
|
|
|
|
|
|
|
|
|
|
|
|
|
|
|
|
|
|
|
|
|
|
STOCKHOLDERS' (DEFICIT) EQUITY
|
|
|
|
|
|
|
|
|
|
|
|
|
|
|
|
|
|
|
|
|
|
|
|
|
|
|
|
|
|
|
|
|
|
|
|
|
|
Common stock, $.001 par value;
|
|
|
|
|
|
|
|
|
|
|
|
|
|
|
|
|
|
|
|
|
|
|
|
|
|
|
|
|
|
|
|
|
|
|
|
|
|
20,000,000 shares authorized;
|
|
|
|
|
|
|
|
|
|
|
|
|
|
|
|
|
|
|
|
|
|
|
|
|
|
|
|
|
|
|
|
|
|
|
|
|
15,830,754, 15,941,904 and 15,991,904 shares issued; and
|
|
|
|
|
|
|
|
|
|
|
|
|
|
|
|
|
|
|
|
|
|
|
|
|
|
|
|
|
|
|
|
|
|
|
|
|
|
15,820,754, 15,931,904 and 15,981,904 shares outstanding, respectively
|
|
|
16 |
|
|
|
- |
|
|
|
16 |
|
|
|
16 |
|
|
|
- |
|
|
|
16 |
|
|
|
16 |
|
|
|
- |
|
|
|
16 |
|
|
Additional paid-in capital
|
|
|
142,506 |
|
|
|
84,770 |
|
|
|
227,276 |
|
|
|
143,552 |
|
|
|
84,701 |
|
|
|
228,253 |
|
|
|
144,089 |
|
|
|
84,630 |
|
|
|
228,719 |
|
|
Accumulated deficit
|
|
|
(142,663 |
) |
|
|
(88,401 |
) |
|
|
(231,064 |
) |
|
|
(143,259 |
) |
|
|
(86,226 |
) |
|
|
(229,485 |
) |
|
|
(143,572 |
) |
|
|
(87,457 |
) |
|
|
(231,029 |
) |
|
Less: treasury stock; 10,000 shares at cost
|
|
|
(200 |
) |
|
|
- |
|
|
|
(200 |
) |
|
|
(200 |
) |
|
|
- |
|
|
|
(200 |
) |
|
|
(200 |
) |
|
|
- |
|
|
|
(200 |
) |
| |
|
|
|
|
|
|
|
|
|
|
|
|
|
|
|
|
|
|
|
|
|
|
|
|
|
|
|
|
|
|
|
|
|
|
|
|
|
Total stockholders' (deficit) equity
|
|
|
(341 |
) |
|
|
(3,631 |
) |
|
|
(3,972 |
) |
|
|
109 |
|
|
|
(1,525 |
) |
|
|
(1,416 |
) |
|
|
333 |
|
|
|
(2,827 |
) |
|
|
(2,494 |
) |
| |
|
|
|
|
|
|
|
|
|
|
|
|
|
|
|
|
|
|
|
|
|
|
|
|
|
|
|
|
|
|
|
|
|
|
|
|
|
Total liabilities and stockholders' (deficit) equity
|
|
$ |
2,596 |
|
|
$ |
- |
|
|
$ |
2,596 |
|
|
$ |
3,041 |
|
|
$ |
- |
|
|
$ |
3,041 |
|
|
$ |
4,033 |
|
|
$ |
- |
|
|
$ |
4,033 |
|
The following table details the impact of the restatements on the Company’s Statements of Operations for the three, six and nine months ended as of March 31, June 30, and September 30, 2010, respectively:
| |
|
Three Months Ended March 31, 2010
(unaudited)
|
|
|
Three Months Ended June 30, 2010
(unaudited)
|
|
|
Six Months Ended June 30, 2010
(unaudited)
|
|
|
Three Months Ended September 30, 2010
(unaudited)
|
|
|
Nine Months Ended September 30, 2010
(unaudited)
|
|
|
(in thousands, except per share data)
|
|
As Reported
|
|
|
Adjustment
|
|
|
Restated
|
|
|
As Reported
|
|
|
Adjustment
|
|
|
Restated
|
|
|
As Reported
|
|
|
Adjustment
|
|
|
Restated
|
|
|
As Reported
|
|
|
Adjustment
|
|
|
Restated
|
|
|
As Reported
|
|
|
Adjustment
|
|
|
Restated
|
|
| |
|
|
|
|
|
|
|
|
|
|
|
|
|
|
|
|
|
|
|
|
|
|
|
|
|
|
|
|
|
|
|
|
|
|
|
|
|
|
|
|
|
|
|
|
|
| |
|
|
|
|
|
|
|
|
|
|
|
|
|
|
|
|
|
|
|
|
|
|
|
|
|
|
|
|
|
|
|
|
|
|
|
|
|
|
|
|
|
|
|
|
|
|
Total revenue
|
|
$ |
1,684 |
|
|
$ |
(12 |
) |
|
$ |
1,672 |
|
|
$ |
4,574 |
|
|
$ |
(36 |
) |
|
$ |
4,538 |
|
|
$ |
6,258 |
|
|
$ |
(48 |
) |
|
$ |
6,210 |
|
|
$ |
4,976 |
|
|
$ |
(28 |
) |
|
$ |
4,948 |
|
|
$ |
11,234 |
|
|
$ |
(76 |
) |
|
$ |
11,158 |
|
|
Cost of goods sold
|
|
|
1,141 |
|
|
|
- |
|
|
|
1,141 |
|
|
|
2,641 |
|
|
|
- |
|
|
|
2,641 |
|
|
|
3,782 |
|
|
|
- |
|
|
|
3,782 |
|
|
|
2,998 |
|
|
|
- |
|
|
|
2,998 |
|
|
|
6,780 |
|
|
|
- |
|
|
|
6,780 |
|
|
Gross profit
|
|
|
543 |
|
|
|
(12 |
) |
|
|
531 |
|
|
|
1,933 |
|
|
|
(36 |
) |
|
|
1,897 |
|
|
|
2,476 |
|
|
|
(48 |
) |
|
|
2,428 |
|
|
|
1,978 |
|
|
|
(28 |
) |
|
|
1,950 |
|
|
|
4,454 |
|
|
|
(76 |
) |
|
|
4,378 |
|
| |
|
|
|
|
|
|
|
|
|
|
|
|
|
|
|
|
|
|
|
|
|
|
|
|
|
|
|
|
|
|
|
|
|
|
|
|
|
|
|
|
|
|
|
|
|
|
|
|
|
|
|
|
|
|
|
|
|
|
|
|
|
Operating expenses:
|
|
|
|
|
|
|
|
|
|
|
|
|
|
|
|
|
|
|
|
|
|
|
|
|
|
|
|
|
|
|
|
|
|
|
|
|
|
|
|
|
|
|
|
|
|
|
|
|
|
|
|
|
|
|
|
|
|
|
|
|
|
Research and development expenses
|
|
|
1,577 |
|
|
|
- |
|
|
|
1,577 |
|
|
|
1,398 |
|
|
|
(1 |
) |
|
|
1,397 |
|
|
|
2,975 |
|
|
|
(1 |
) |
|
|
2,974 |
|
|
|
1,273 |
|
|
|
(1 |
) |
|
|
1,272 |
|
|
|
4,248 |
|
|
|
(2 |
) |
|
|
4,246 |
|
|
Selling, general and administrative expenses
|
|
|
1,175 |
|
|
|
- |
|
|
|
1,175 |
|
|
|
1,130 |
|
|
|
- |
|
|
|
1,130 |
|
|
|
2,305 |
|
|
|
- |
|
|
|
2,305 |
|
|
|
1,270 |
|
|
|
(2 |
) |
|
|
1,268 |
|
|
|
3,575 |
|
|
|
(2 |
) |
|
|
3,573 |
|
| |
|
|
|
|
|
|
|
|
|
|
|
|
|
|
|
|
|
|
|
|
|
|
|
|
|
|
|
|
|
|
|
|
|
|
|
|
|
|
|
|
|
|
|
|
|
|
|
|
|
|
|
|
|
|
|
|
|
|
|
|
|
Total operating expenses
|
|
|
2,752 |
|
|
|
- |
|
|
|
2,752 |
|
|
|
2,528 |
|
|
|
(1 |
) |
|
|
2,527 |
|
|
|
5,280 |
|
|
|
(1 |
) |
|
|
5,279 |
|
|
|
2,543 |
|
|
|
(3 |
) |
|
|
2,540 |
|
|
|
7,823 |
|
|
|
(4 |
) |
|
|
7,819 |
|
| |
|
|
|
|
|
|
|
|
|
|
|
|
|
|
|
|
|
|
|
|
|
|
|
|
|
|
|
|
|
|
|
|
|
|
|
|
|
|
|
|
|
|
|
|
|
|
|
|
|
|
|
|
|
|
|
|
|
|
|
|
|
Operating loss
|
|
|
(2,209 |
) |
|
|
(12 |
) |
|
|
(2,221 |
) |
|
|
(595 |
) |
|
|
(35 |
) |
|
|
(630 |
) |
|
|
(2,804 |
) |
|
|
(47 |
) |
|
|
(2,851 |
) |
|
|
(565 |
) |
|
|
(25 |
) |
|
|
(590 |
) |
|
|
(3,369 |
) |
|
|
(72 |
) |
|
|
(3,441 |
) |
| |
|
|
|
|
|
|
|
|
|
|
|
|
|
|
|
|
|
|
|
|
|
|
|
|
|
|
|
|
|
|
|
|
|
|
|
|
|
|
|
|
|
|
|
|
|
|
|
|
|
|
|
|
|
|
|
|
|
|
|
|
|
Interest expense, net
|
|
|
(213 |
) |
|
|
184 |
|
|
|
(29 |
) |
|
|
- |
|
|
|
- |
|
|
|
- |
|
|
|
(213 |
) |
|
|
184 |
|
|
|
(29 |
) |
|
|
- |
|
|
|
- |
|
|
|
- |
|
|
|
(213 |
) |
|
|
184 |
|
|
|
(29 |
) |
|
Mark-to-market adjustment of warrant liability
|
|
|
- |
|
|
|
2,489 |
|
|
|
2,489 |
|
|
|
- |
|
|
|
2,210 |
|
|
|
2,210 |
|
|
|
- |
|
|
|
4,699 |
|
|
|
4,699 |
|
|
|
- |
|
|
|
(1,206 |
) |
|
|
(1,206 |
) |
|
|
- |
|
|
|
3,493 |
|
|
|
3,493 |
|
|
Mark-to-market adjustment of derivative liability
|
|
|
- |
|
|
|
5,434 |
|
|
|
5,434 |
|
|
|
- |
|
|
|
- |
|
|
|
- |
|
|
|
- |
|
|
|
5,434 |
|
|
|
5,434 |
|
|
|
- |
|
|
|
- |
|
|
|
- |
|
|
|
- |
|
|
|
5,434 |
|
|
|
5,434 |
|
|
Gain (loss) on conversion and extinguishment of debt
|
|
|
- |
|
|
|
(607 |
) |
|
|
(607 |
) |
|
|
- |
|
|
|
- |
|
|
|
- |
|
|
|
- |
|
|
|
(607 |
) |
|
|
(607 |
) |
|
|
252 |
|
|
|
- |
|
|
|
252 |
|
|
|
252 |
|
|
|
(607 |
) |
|
|
(355 |
) |
|
Total other income
|
|
|
(213 |
) |
|
|
7,500 |
|
|
|
7,287 |
|
|
|
- |
|
|
|
2,210 |
|
|
|
2,210 |
|
|
|
(213 |
) |
|
|
9,710 |
|
|
|
9,497 |
|
|
|
252 |
|
|
|
(1,206 |
) |
|
|
(954 |
) |
|
|
39 |
|
|
|
8,504 |
|
|
|
8,543 |
|
| |
|
|
|
|
|
|
|
|
|
|
|
|
|
|
|
|
|
|
|
|
|
|
|
|
|
|
|
|
|
|
|
|
|
|
|
|
|
|
|
|
|
|
|
|
|
|
|
|
|
|
|
|
|
|
|
|
|
|
|
|
|
Income (loss) before taxes
|
|
|
(2,422 |
) |
|
|
7,488 |
|
|
|
5,067 |
|
|
|
(595 |
) |
|
|
2,175 |
|
|
|
1,580 |
|
|
|
(3,017 |
) |
|
|
9,663 |
|
|
|
6,646 |
|
|
|
(313 |
) |
|
|
(1,231 |
) |
|
|
(1,544 |
) |
|
|
(3,330 |
) |
|
|
8,432 |
|
|
|
5,102 |
|
| |
|
|
|
|
|
|
|
|
|
|
|
|
|
|
|
|
|
|
|
|
|
|
|
|
|
|
|
|
|
|
|
|
|
|
|
|
|
|
|
|
|
|
|
|
|
|
|
|
|
|
|
|
|
|
|
|
|
|
|
|
|
Provision for income taxes
|
|
|
- |
|
|
|
- |
|
|
|
- |
|
|
|
- |
|
|
|
- |
|
|
|
- |
|
|
|
- |
|
|
|
- |
|
|
|
- |
|
|
|
- |
|
|
|
- |
|
|
|
- |
|
|
|
- |
|
|
|
- |
|
|
|
- |
|
| |
|
|
|
|
|
|
|
|
|
|
|
|
|
|
|
|
|
|
|
|
|
|
|
|
|
|
|
|
|
|
|
|
|
|
|
|
|
|
|
|
|
|
|
|
|
|
|
|
|
|
|
|
|
|
|
|
|
|
|
|
|
Net (loss) income
|
|
$ |
(2,422 |
) |
|
$ |
7,488 |
|
|
$ |
5,066 |
|
|
$ |
(595 |
) |
|
$ |
2,175 |
|
|
$ |
1,580 |
|
|
$ |
(3,017 |
) |
|
$ |
9,663 |
|
|
$ |
6,646 |
|
|
$ |
(313 |
) |
|
$ |
(1,231 |
) |
|
$ |
(1,544 |
) |
|
$ |
(3,330 |
) |
|
$ |
8,432 |
|
|
$ |
5,102 |
|
| |
|
|
|
|
|
|
|
|
|
|
|
|
|
|
|
|
|
|
|
|
|
|
|
|
|
|
|
|
|
|
|
|
|
|
|
|
|
|
|
|
|
|
|
|
|
|
|
|
|
|
|
|
|
|
|
|
|
|
|
|
|
Net (loss) income per share (basic)
|
|
$ |
(0.17 |
) |
|
$ |
0.53 |
|
|
$ |
0.36 |
|
|
$ |
(0.04 |
) |
|
$ |
0.14 |
|
|
$ |
0.10 |
|
|
$ |
(0.20 |
) |
|
$ |
0.64 |
|
|
$ |
0.44 |
|
|
$ |
(0.02 |
) |
|
$ |
(0.08 |
) |
|
$ |
(0.10 |
) |
|
$ |
(0.22 |
) |
|
$ |
0.55 |
|
|
$ |
0.33 |
|
|
Net (loss) income per share (diluted)
|
|
$ |
(0.17 |
) |
|
$ |
0.51 |
|
|
$ |
0.34 |
|
|
$ |
(0.04 |
) |
|
$ |
0.13 |
|
|
$ |
0.10 |
|
|
$ |
(0.20 |
) |
|
$ |
0.62 |
|
|
$ |
0.43 |
|
|
$ |
(0.02 |
) |
|
$ |
(0.08 |
) |
|
$ |
(0.10 |
) |
|
$ |
(0.22 |
) |
|
$ |
0.53 |
|
|
$ |
0.32 |
|
| |
|
|
|
|
|
|
|
|
|
|
|
|
|
|
|
|
|
|
|
|
|
|
|
|
|
|
|
|
|
|
|
|
|
|
|
|
|
|
|
|
|
|
|
|
|
|
|
|
|
|
|
|
|
|
|
|
|
|
|
|
|
Weighted average shares used in computing basic net (loss) income per share
|
|
|
14,162 |
|
|
|
14,162 |
|
|
|
14,162 |
|
|
|
15,871 |
|
|
|
15,871 |
|
|
|
15,871 |
|
|
|
15,022 |
|
|
|
15,022 |
|
|
|
15,022 |
|
|
|
15,932 |
|
|
|
15,932 |
|
|
|
15,932 |
|
|
|
15,328 |
|
|
|
15,328 |
|
|
|
15,328 |
|
|
Weighted average shares used in computing diluted net (loss) income per share
|
|
|
14,162 |
|
|
|
14,709 |
|
|
|
14,709 |
|
|
|
15,871 |
|
|
|
16,298 |
|
|
|
16,298 |
|
|
|
15,022 |
|
|
|
15,530 |
|
|
|
15,530 |
|
|
|
15,932 |
|
|
|
15,932 |
|
|
|
15,932 |
|
|
|
15,328 |
|
|
|
15,823 |
|
|
|
15,823 |
|
The following table details the impact of the restatements on the Company’s Statements of Cash Flows for the three, six, and nine months ended as of March 31, June 30, and September 30, 2010, respectively:
|
(in thousands)
|
|
For the Three Months Ended March 31, 2010
(unaudited)
|
|
|
Six Months Ended June 30, 2010
(unaudited)
|
|
|
Nine Months Ended September 30, 2010
(unaudited)
|
|
| |
|
As Reported
|
|
|
Adjustments
|
|
|
Restated
|
|
|
As Reported
|
|
|
Adjustments
|
|
|
Restated
|
|
|
As Reported
|
|
|
Adjustments
|
|
|
Restated
|
|
| |
|
|
|
|
|
|
|
|
|
|
|
|
|
|
|
|
|
|
|
|
|
|
|
|
|
|
|
|
CASH FLOWS FROM OPERATING ACTIVITIES
|
|
|
|
|
|
|
|
|
|
|
|
|
|
|
|
|
|
|
|
|
|
|
|
|
|
|
|
|
Net (loss) income
|
|
$ |
(2,421 |
) |
|
$ |
7,488 |
|
|
$ |
5,067 |
|
|
$ |
(3,017 |
) |
|
$ |
9,663 |
|
|
$ |
6,646 |
|
|
$ |
(3,330 |
) |
|
$ |
8,432 |
|
|
$ |
5,102 |
|
|
Adjustments to reconcile net (loss) income to net cash (used in) provided by operating activities:
|
|
|
|
|
|
|
|
|
|
|
|
|
|
|
|
|
|
|
|
|
|
|
|
|
|
|
|
|
|
|
|
|
|
|
|
|
|
Depreciation and amortization
|
|
|
86 |
|
|
|
- |
|
|
|
86 |
|
|
|
182 |
|
|
|
- |
|
|
|
182 |
|
|
|
272 |
|
|
|
- |
|
|
|
272 |
|
|
Amortization of beneficial conversion feature of convertible debt
|
|
|
184 |
|
|
|
(184 |
) |
|
|
- |
|
|
|
184 |
|
|
|
(184 |
) |
|
|
- |
|
|
|
184 |
|
|
|
(184 |
) |
|
|
- |
|
|
Stock-based compensation
|
|
|
30 |
|
|
|
0 |
|
|
|
30 |
|
|
|
35 |
|
|
|
(1 |
) |
|
|
34 |
|
|
|
72 |
|
|
|
(4 |
) |
|
|
68 |
|
|
Gain (loss) on conversion and extinguishment of debt
|
|
|
- |
|
|
|
607 |
|
|
|
607 |
|
|
|
- |
|
|
|
607 |
|
|
|
607 |
|
|
|
(252 |
) |
|
|
607 |
|
|
|
355 |
|
|
Mark-to-market adjustment of warrant liability
|
|
|
- |
|
|
|
(2,489 |
) |
|
|
(2,489 |
) |
|
|
- |
|
|
|
(4,699 |
) |
|
|
(4,699 |
) |
|
|
- |
|
|
|
(3,493 |
) |
|
|
(3,493 |
) |
|
Mark-to-market adjustment of derivative liability
|
|
|
- |
|
|
|
(5,434 |
) |
|
|
(5,434 |
) |
|
|
- |
|
|
|
(5,434 |
) |
|
|
(5,434 |
) |
|
|
- |
|
|
|
(5,434 |
) |
|
|
(5,434 |
) |
|
Changes in operating assets and liabilities:
|
|
|
|
|
|
|
|
|
|
|
|
|
|
|
|
|
|
|
|
|
|
|
|
|
|
|
|
|
|
|
|
|
|
|
|
|
|
Accounts receivable
|
|
|
841 |
|
|
|
- |
|
|
|
841 |
|
|
|
748 |
|
|
|
- |
|
|
|
748 |
|
|
|
(290 |
) |
|
|
- |
|
|
|
(290 |
) |
|
Inventory
|
|
|
(451 |
) |
|
|
- |
|
|
|
(451 |
) |
|
|
(271 |
) |
|
|
- |
|
|
|
(271 |
) |
|
|
(408 |
) |
|
|
- |
|
|
|
(408 |
) |
|
Prepaid expenses and other current assets
|
|
|
(1 |
) |
|
|
- |
|
|
|
(1 |
) |
|
|
3 |
|
|
|
- |
|
|
|
3 |
|
|
|
36 |
|
|
|
- |
|
|
|
36 |
|
|
Accounts payable
|
|
|
23 |
|
|
|
- |
|
|
|
23 |
|
|
|
117 |
|
|
|
- |
|
|
|
117 |
|
|
|
794 |
|
|
|
- |
|
|
|
794 |
|
|
Accrued expenses and other current liabilities
|
|
|
191 |
|
|
|
- |
|
|
|
191 |
|
|
|
96 |
|
|
|
- |
|
|
|
96 |
|
|
|
272 |
|
|
|
- |
|
|
|
272 |
|
|
Deferred revenue
|
|
|
(102 |
) |
|
|
12 |
|
|
|
(90 |
) |
|
|
(121 |
) |
|
|
48 |
|
|
|
(73 |
) |
|
|
(140 |
) |
|
|
76 |
|
|
|
(64 |
) |
|
Deferred rent
|
|
|
57 |
|
|
|
- |
|
|
|
57 |
|
|
|
75 |
|
|
|
- |
|
|
|
75 |
|
|
|
94 |
|
|
|
- |
|
|
|
94 |
|
| |
|
|
|
|
|
|
|
|
|
|
|
|
|
|
|
|
|
|
|
|
|
|
|
|
|
|
|
|
|
|
|
|
|
|
|
|
|
Net cash used in operating activities
|
|
|
(1,563 |
) |
|
|
- |
|
|
|
(1,563 |
) |
|
|
(1,969 |
) |
|
|
- |
|
|
|
(1,969 |
) |
|
|
(2,696 |
) |
|
|
- |
|
|
|
(2,696 |
) |
| |
|
|
|
|
|
|
|
|
|
|
|
|
|
|
|
|
|
|
|
|
|
|
|
|
|
|
|
|
|
|
|
|
|
|
|
|
|
CASH FLOWS FROM INVESTING ACTIVITIES
|
|
|
|
|
|
|
|
|
|
|
|
|
|
|
|
|
|
|
|
|
|
|
|
|
|
|
|
|
|
|
|
|
|
|
|
|
|
Purchases of property and equipment
|
|
|
(170 |
) |
|
|
- |
|
|
|
(170 |
) |
|
|
(263 |
) |
|
|
- |
|
|
|
(263 |
) |
|
|
(367 |
) |
|
|
- |
|
|
|
(367 |
) |
|
Net cash used in investing activities
|
|
|
(170 |
) |
|
|
- |
|
|
|
(170 |
) |
|
|
(263 |
) |
|
|
- |
|
|
|
(263 |
) |
|
|
(367 |
) |
|
|
- |
|
|
|
(367 |
) |
| |
|
|
|
|
|
|
|
|
|
|
|
|
|
|
|
|
|
|
|
|
|
|
|
|
|
|
|
|
|
|
|
|
|
|
|
|
|
CASH FLOWS FROM FINANCING ACTIVITES
|
|
|
|
|
|
|
|
|
|
|
|
|
|
|
|
|
|
|
|
|
|
|
|
|
|
|
|
|
|
|
|
|
|
|
|
|
|
Proceeds from issuance of common stock
|
|
|
1,500 |
|
|
|
- |
|
|
|
1,500 |
|
|
|
2,500 |
|
|
|
- |
|
|
|
2,500 |
|
|
|
3,000 |
|
|
|
- |
|
|
|
3,000 |
|
|
Proceeds from exercise of warrants
|
|
|
75 |
|
|
|
- |
|
|
|
75 |
|
|
|
100 |
|
|
|
- |
|
|
|
100 |
|
|
|
100 |
|
|
|
- |
|
|
|
100 |
|
|
Proceeds from exercise of stock options
|
|
|
9 |
|
|
|
- |
|
|
|
9 |
|
|
|
25 |
|
|
|
- |
|
|
|
25 |
|
|
|
26 |
|
|
|
- |
|
|
|
26 |
|
|
Payments of capitalized lease obligations
|
|
|
(3 |
) |
|
|
- |
|
|
|
(3 |
) |
|
|
(6 |
) |
|
|
- |
|
|
|
(6 |
) |
|
|
(9 |
) |
|
|
- |
|
|
|
(9 |
) |
|
Net cash provided by financing activities
|
|
|
1,581 |
|
|
|
- |
|
|
|
1,581 |
|
|
|
2,619 |
|
|
|
- |
|
|
|
2,619 |
|
|
|
3,117 |
|
|
|
- |
|
|
|
3,117 |
|
| |
|
|
|
|
|
|
|
|
|
|
|
|
|
|
|
|
|
|
|
|
|
|
|
|
|
|
|
|
|
|
|
|
|
|
|
|
|
(DECREASE) INCREASE IN CASH AND CASH EQUIVALENTS
|
|
|
(152 |
) |
|
|
- |
|
|
|
(152 |
) |
|
|
387 |
|
|
|
- |
|
|
|
387 |
|
|
|
54 |
|
|
|
- |
|
|
|
54 |
|
| |
|
|
|
|
|
|
|
|
|
|
|
|
|
|
|
|
|
|
|
|
|
|
|
|
|
|
|
|
|
|
|
|
|
|
|
|
|
CASH AND CASH EQUIVALENTS - BEGINNING OF YEAR
|
|
|
987 |
|
|
|
- |
|
|
|
987 |
|
|
|
987 |
|
|
|
- |
|
|
|
987 |
|
|
|
987 |
|
|
|
- |
|
|
|
987 |
|
| |
|
|
|
|
|
|
|
|
|
|
|
|
|
|
|
|
|
|
|
|
|
|
|
|
|
|
|
|
|
|
|
|
|
|
|
|
|
CASH AND CASH EQUIVALENTS - END OF YEAR
|
|
$ |
835 |
|
|
$ |
- |
|
|
$ |
835 |
|
|
$ |
1,374 |
|
|
$ |
- |
|
|
$ |
1,374 |
|
|
$ |
1,041 |
|
|
$ |
- |
|
|
$ |
1,041 |
|
| |
|
|
|
|
|
|
|
|
|
|
|
|
|
|
|
|
|
|
|
|
|
|
|
|
|
|
|
|
|
|
|
|
|
|
|
|
| |
|
|
|
|
|
|
|
|
|
|
|
|
|
|
|
|
|
|
|
|
|
|
|
|
|
|
|
|
|
|
|
|
|
|
|
|
|
Non-cash financing and investing activities:
|
|
|
|
|
|
|
|
|
|
|
|
|
|
|
|
|
|
|
|
|
|
|
|
|
|
|
|
|
|
|
|
|
|
|
|
|
|
Issuance of common stock in connection with conversion of debt
|
|
$ |
10,000 |
|
|
$ |
- |
|
|
$ |
10,000 |
|
|
$ |
10,000 |
|
|
$ |
- |
|
|
$ |
10,000 |
|
|
$ |
10,000 |
|
|
$ |
- |
|
|
$ |
10,000 |
|
| |
|
|
|
|
|
|
|
|
|
|
|
|
|
|
|
|
|
|
|
|
|
|
|
|
|
|
|
|
|
|
|
|
|
|
|
|
|
Supplemental disclosures of cash flow information:
|
|
|
|
|
|
|
|
|
|
|
|
|
|
|
|
|
|
|
|
|
|
|
|
|
|
|
|
|
|
|
|
|
|
|
|
|
|
Interest paid
|
|
$ |
1 |
|
|
$ |
- |
|
|
$ |
1 |
|
|
$ |
1 |
|
|
$ |
- |
|
|
$ |
1 |
|
|
$ |
1 |
|
|
$ |
- |
|
|
$ |
1 |
|
NOTE 3 - SUMMARY OF SIGNIFICANT ACCOUNTING POLICIES
PRINCIPLES OF CONSOLIDATION
During 2011, the Company’s only wholly-owned subsidiary, Insulated Connections Corporation Limited, was dissolved and is no longer consolidated in the Company’s financial statements. Prior to its dissolution in 2011, the financial statements included the accounts of Insulated Connections Corporation Limited, though the subsidiary had been inactive since 2001.
USE OF ESTIMATES
The preparation of financial statements in conformity with generally accepted accounting principles requires management to make estimates and assumptions that affect the reported amounts of assets and liabilities, disclosure of contingent assets and liabilities at the date of the financial statements and the reported amounts of revenue and expenses during the reporting period. Actual results could differ from those estimates. The Company bases its estimates on historical experience and various other factors believed to be reasonable under the circumstances, the results of which form the basis for making judgments about the carrying value of assets and liabilities that are not readily apparent from other sources. Some of these estimates can be subjective and complex and, consequently, actual results may differ from these estimates under different assumptions or conditions. For any given estimate or assumption made by the Company’s management, there may be other estimates or assumptions that are as reasonable. The Company believes that, given the current facts and circumstances, it is unlikely that applying any such other reasonable estimate or assumption would materially impact the financial statements.
CASH AND CASH EQUIVALENTS
The Company considers all highly liquid investments with maturities of three months or less from the date of purchase and whose carrying amount approximates fair value to be cash equivalents.
FAIR VALUE OF FINANCIAL INSTRUMENTS
We account for certain assets and liabilities at fair value. The hierarchy below lists three levels of fair value based on the extent to which input used in measuring fair value are observable in the market. We categorize each of our fair value measurements in one of these three levels based on the lowest level of input that is significant to the fair value measurement in its entirety. These levels are:
| ● |
Level 1 - Quoted prices in active markets for identical assets or liabilities. |
| ● |
Level 2 - Observable inputs other than Level 1 prices, such as quoted prices for similar assets or liabilities; quoted prices in markets that are not active; or other inputs that are observable or can be corroborated by observable market data for substantially the full term of the assets or liabilities, which include certificates of deposits and money market funds.
|
| ● |
Level 3 - Unobservable inputs that are supported by little or no market activity and that are significant to the fair value of the assets or liabilities, including liabilities resulting from embedded derivatives associated with certain warrants to purchase common stock (see Note 9).
|
STOCK-BASED COMPENSATION
The Company accounts for stock-based compensation in accordance with accounting guidance now codified as Financial Accounting Standards Board (“FASB”) Accounting Standards Codification (“ASC”) 718, “Compensation – Stock Compensation.” Under the fair value recognition provision of financial stock-based compensation cost is estimated at the grant date based on the fair value of the award. The Company estimates the fair value of stock options granted using the Black-Scholes-Merton option pricing model.
NET INCOME (LOSS) PER SHARE
The Company computes net income (loss) per common share in accordance with the Earning Per Share topic of the FASB ASC. Basic net income (loss) per share (EPS) is computed by dividing net income (loss) available to common stockholders by the weighted-average number of common shares outstanding during the period. Diluted net income (loss) per share adjusts basic net income (loss) per share for the effects of convertible securities, stock options and other potentially dilutive instruments, only in the periods in which such effect is dilutive.
The following is a reconciliation of the denominators of basic and diluted earnings per share computations:
(in thousands)
| |
|
2009
|
|
|
2010
|
|
|
2011
|
|
| |
|
|
|
|
|
|
|
|
|
|
Weighted average shares outstanding used to compute basic earnings per share
|
|
|
7,891 |
|
|
|
15,495 |
|
|
|
16,515 |
|
| |
|
|
|
|
|
|
|
|
|
|
|
|
|
Effect of dilutive stock options and warrants
|
|
|
- |
|
|
|
503 |
|
|
|
390 |
|
| |
|
|
|
|
|
|
|
|
|
|
|
|
|
Weighted average shares outstanding and dilutive securities used to compute dilutive earnings per share
|
|
|
7,891 |
|
|
|
15,998 |
|
|
|
16,905 |
|
The following securities have been excluded from the calculation of net income (loss) per share, as their effect would be anti-dilutive.
|
(in thousands)
|
|
2009
|
|
|
2010
|
|
|
2011
|
|
|
Stock options
|
|
|
585 |
|
|
|
771 |
|
|
|
747 |
|
|
Warrants
|
|
|
788 |
|
|
|
1,168 |
|
|
|
800 |
|
|
Convertible debentures
|
|
|
6,667 |
|
|
|
---- |
|
|
|
---- |
|
| |
|
|
8,040 |
|
|
|
1,939 |
|
|
|
1,547 |
|
PROPERTY AND EQUIPMENT
Property and equipment are recorded at cost and depreciated using the straight-line method over the estimated useful lives of the assets, which range from one to five years. Upon retirement or disposal, the cost of the disposed asset and the related accumulated depreciation are removed from the accounts and any gain or loss is reflected in net income or loss.
REVENUE RECOGNITION - RESTATED
Revenue Recognition.
Total revenue consists primarily of sales of hardware, software, and maintenance services. The Company recognizes revenue when persuasive evidence of an arrangement exists, delivery has occurred, the sales price is fixed or determinable, and collection is reasonably assured. Product is considered delivered to the customer once it has been shipped and title and risk of loss have been transferred. For most of the Company’s product sales, these criteria are met at the time the product is shipped. The Company records deferred revenue when it receives payments in advance of the delivery of products or the performance of services.
Hardware sales consist of our Ambient Smart Grid® communications nodes are physical boxes that contain the hardware and embedded software needed for communications and data collection in support of smart grid assets. The system software embedded in our communications nodes is used solely in connection with the operation of the physical boxes.
Our proprietary software AmbientNMS® is our smart grid network management system that controls the large numbers of communications nodes, devices and customers on a smart grid. NMS software is offered on a stand-alone basis.
We generally include a period of free maintenance services beginning from the sale of the communication nodes and NMS Software. As such, we recognize a portion of the revenue from the sales of our products upon delivery to the customer. The revenue allocated to the free period of maintenance services is deferred and recognized ratably over the period of performance.
We offer additional software maintenance service, on a fee basis, that entitles the purchasers of our products and AmbientNMS® software to postcontract customer support including help desk support, unspecified updates and upgrades to our products on a when-and-if available basis. Maintenance services are recognized ratably over the period of performance.
The Company recognizes revenue from the sale of (i) hardware products and (ii) software bundled with hardware that is essential to the functionality of the hardware in accordance with revenue recognition for multiple element arrangements. The Company recognizes revenue in accordance with applicable industry specific software accounting guidance for (i) standalone sales of software products, (ii) maintenance renewals, and (iii) sales of software bundled with hardware not essential to the functionality of the hardware.
Revenue Recognition for Arrangements with Multiple Deliverables
In October 2009, the FASB issued ASU No. 2009-13, Multiple-Deliverable Revenue Arrangements, (amendments to ASC Topic 605, Revenue Recognition) (‘‘ASU 2009-13’’) (formerly EITF Issue 08-1) and ASU No. 2009-14, Certain Arrangements That Include Software Elements, (amendments to FASB ASC Topic 985, Software) (‘‘ASU 2009-14’’) (formerly EITF 09-3). ASU 2009-13 eliminates the residual method and requires arrangement consideration to be allocated using the relative selling price method, which requires entities to allocate revenue in an arrangement using the best estimated selling price ("BESP") of each element when a vendor does not have vendor-specific objective evidence of selling price ("VSOE") or third party evidence of selling price ("TPE"). ASU 2009-14 removes tangible products from the scope of software revenue guidance and provides guidance on determining whether software deliverables in an arrangement that includes a tangible product are within the scope of the software revenue guidance. ASU 2009-13 and ASU 2009-14 are effective for arrangements entered into or materially modified in fiscal years beginning on or after June 15, 2010. The Company adopted ASU 2009-13 and 2009-14 effective January 1, 2011
We evaluate each deliverable in an arrangement to determine whether it should be accounted for as a separate unit of accounting. The delivered item or items shall be considered a separate unit of accounting if it has standalone value to the customer and there is no customer-negotiated refunds or return rights.
We allocate the total arrangement consideration to each unit of accounting in a multiple-element arrangement based on its relative selling price, and include our bundled hardware and software component as one unit of accounting and the free period of maintenance as a separate unit of accounting. The Company uses a hierarchy to determine the selling price to be used for allocating revenue to each of the deliverables. We determine the selling price for each deliverable using vendor specific objective evidence (VSOE), if it exists or third party evidence (TPE) if VSOE does not exist. If neither VSOE nor TPE of selling price exists for a deliverable, we use our best estimate of selling price (BESP) for that deliverable. Revenue allocated to each element is then recognized when the basic revenue recognition criteria are met for each element.
We determine VSOE of a deliverable based on the price at which we sell the deliverable on a standalone basis to third parties or from the stated renewal rate for the elements contained in the initial arrangement. VSOE has been established for our software maintenance element. When VSOE cannot be established for all deliverables in an arrangement with multiple elements, we attempt to estimate the selling price of each element based on TPE. When we are unable to establish a selling price using VSOE or TPE, we establish the BESP in our allocation of arrangement consideration. The objective of BESP is to determine the price at which we would transact a sale if the product or service were sold on a standalone basis. BESP has been established for our bundled hardware and software portion of the arrangement.
When establishing BESP the Company considers multiple factors including, but not limited to, the relative value of the features and functionality being delivered to the customer, and general pricing practices. Based on our analysis of pricing stated in contractual arrangements for our hardware products in historical multiple-element transactions, we have concluded that we typically price our hardware and embedded software at the contractually agreed upon amounts. Therefore, we have determined that, for our hardware and embedded software for which VSOE or TPE is not available, our BESP is generally comprised of prices based on our contractually agreed upon rates. We have established an annual review process around VSOE, TPE and BESP.
The Company accounts for multiple element arrangements that consist only of software or software-related products, including the sale of maintenance services to previously sold software, in accordance with industry specific software accounting guidance. For such multiple element software transactions, revenue is allocated to each element based on the residual method when VSOE has been established for the undelivered element. If the Company cannot objectively determine the VSOE of any undelivered element included in such multiple-element arrangements, the Company defers revenue until VSOE is established for any remaining undelivered elements, or all elements are delivered and services have been performed.
ACCOUNTS RECEIVABLE
Accounts receivable are recorded net of an allowance for doubtful accounts based upon management's analysis of the collectability of the balances. At December 31, 2010 and 2011, the Company believed that no allowance was necessary.
At December 31, 2010 and 2011, one customer accounted for 100% of accounts receivable. See Note 13.
INVENTORY
Inventory is valued at the lower of cost or market determined on the first-in, first-out (FIFO) basis. The value of the inventory is adjusted for estimated obsolescence or unmarketable inventory equal to the difference between the cost of inventory and the estimated market value based upon assumptions about future demand and market conditions.
RESEARCH AND DEVELOPMENT AND PATENT COSTS
Both research and development costs and patent costs are expensed as incurred.
SOFTWARE DEVELOPMENT COSTS
Costs incurred in the research and development of new software products and enhancements to existing software products have historically been expensed as incurred. After technological feasibility is established, additional development costs are capitalized. No software development costs have been capitalized as of December 31, 2010 and 2011.
LEASED EMPLOYEES
The Company had a contract with Insperity, formerly known as Administaff, which is a professional employment organization. Pursuant to this contract, the Company and Insperity were co-employers of the Company’s personnel. Insperity was responsible for paying the salaries and wages of the Company personnel and providing personnel with health, dental and various other types of benefits at favorable rates for which the Company would not otherwise qualify. Insperity paid salaries and wages of the Company’s personnel directly from the Company’s bank accounts, and the Company paid Insperity a fee for its services.
Effective January 1, 2012, the Company terminated its contract with Insperity and currently administers its human resources related activities internally.
INCOME TAXES
The Company accounts for income taxes in accordance with accounting guidance now codified as FASB ASC 740, “Income Taxes,” which requires that the Company recognize deferred tax liabilities and assets based on the differences between the financial statement carrying amounts and the tax bases of assets and liabilities, using enacted tax rates in effect in the years the differences are expected to reverse. Deferred income tax benefit (expense) results from the change in net deferred tax assets or deferred tax liabilities. A valuation allowance is recorded when it is more likely than not that some or all deferred tax assets will not be realized.
The Company has adopted the provisions of FASB ASC 740-10-05, “Accounting for Uncertainties in Income Taxes.” The ASC clarifies the accounting for uncertainty in income taxes recognized in an enterprise's financial statements. The ASC prescribes a recognition threshold and measurement attribute for the financial statement recognition and measurement of a tax position taken or expected to be taken in a tax return. The ASC provides guidance on de-recognition, classification, interest and penalties, accounting in interim periods, disclosure and transition.
WARRANTIES
The Company accounts for its warranties under the FASB ASC 450 “Contingencies.” The Company’s current standard product warranty includes a one-year warranty period for defects in material and workmanship. Due to the limited deployment of products, the Company had not historically accrued for the cost of warranty obligations and expensed any costs associated with repairing or replacing defective product as incurred. However, due to significantly increase sales volume during 2011, the Company began accruing a liability of approximately 0.2% of current communications node revenues for the estimated future costs of meeting its warranty obligations, based on its actual historical return rate of products within the one-year warranty period. The Company makes and revises this estimate based on the number of communications nodes delivered and its historical experience with warranty claims. The Company continually monitors the rate of actual product returns and the quality of its products including the quality of the products produced by its U.S. based contract manufacturer in China.
The Company engages in product quality programs and processes, including monitoring and evaluating the quality of component suppliers, in an effort to ensure the quality of its products and reduce its warranty exposure. The warranty obligation will be affected not only by product failure rates, but also the costs to repair or replace failed products and potential service and delivery costs incurred in correcting a product failure. If the Company’s actual product failure rates, repair or replacement costs, or service or delivery costs differ from these estimates, accrued warranty costs would be adjusted in the period that such events or costs become known.
The following table summarizes the activity of the Company’s warranty accrual for the years ended 2010 and 2011, respectively:
|
(in thousands)
|
|
2010
|
|
|
2011
|
|
|
Balance at beginning of period
|
|
$ |
--- |
|
|
$ |
--- |
|
|
Warranty costs accrued
|
|
|
--- |
|
|
|
115 |
|
|
Warranty costs incurred
|
|
|
--- |
|
|
|
--- |
|
| |
|
|
|
|
|
|
|
|
|
Balance at end of period
|
|
$ |
--- |
|
|
$ |
115 |
|
The Company’s software license agreements also generally include a warranty that the Company's software products will substantially operate as described in the applicable program documentation. The Company also warrants that services the Company performs will be provided in a manner consistent with industry standards. To date, the Company has not incurred any material costs associated with these product and service performance warranties, and as such the Company has not provided for any reserves for any such warranty liabilities in its operating results.
EMBEDDED DERIVATIVES AND WARRANTS
Embedded Derivatives and Warrants are recorded as liabilities at their estimated fair value at the date of issuance, with subsequent changes in estimated fair value recorded in other income (expense) in our statement of operations in each subsequent period.
Fair value of the Warrants is determined by management using a multiple scenario, probability-weighted option-pricing model using the following inputs: the fair value of the underlying common stock at the valuation measurement date; the risk-free interest rates; the expected dividend rates; the remaining contractual terms of the warrants; the expected volatility of the price of the underlying common stock; and the probability of certain events occurring.
The fair value of Embedded Derivatives is determined by management using a Monte Carlo simulation analysis taking into account various inputs including the fair value of the underlying common stock at the valuation measurement date; the risk-free interest rates; the expected dividend rates; credit-risk spreads; time to maturity; the expected volatility of the price of the underlying common stock; and the probability of various events or other options occurring.
The assumptions used in calculating the estimated fair value of the Embedded Derivatives and Warrants represent our best estimates: however, these estimates involve inherent uncertainties and the application of management judgment. As a result, if factors change and different assumptions are used, the derivative and warrant liabilities and the change in their estimated fair values could be materially different.
DEBT DISCOUNT AND AMORTIZATION OF DEBT DISCOUNT
Debt discount represents the fair value of Embedded Derivatives and Warrants determined upon the date of issuance. Debt discount is amortized over the term of the debt using the effective interest method where applicable. The amortization of debt discount is included as a component of other income or expense in the accompanying statements of operations. Upon conversion of the Note, the unamortized discount is recognized as part of the debt extinguishment gain or loss.
IMPAIRMENT OF LONG-LIVED ASSETS
The Company reviews its long-lived assets for impairment whenever events or changes in circumstances indicate that the carrying amount of an asset may not be recoverable from future undiscounted cash flows. Impairment losses are recorded for the excess, if any, of the carrying value over the fair value of the long-lived assets. The Company did not record an impairment charge in 2010 and 2011.
RECENTLY ISSUED ACCOUNTING PRONOUNCEMENTS
On January 1, 2011, the Company adopted Accounting Statement Update (ASU) 2009-13 (ASU 2009-13),“Revenue Recognition (Topic 605): Multiple-Deliverable Revenue Arrangements,” which eliminates the residual method of allocation, and instead requires companies to use the relative selling price method when allocating revenue in a multiple deliverable arrangement. When applying the relative selling price method, the selling price for each deliverable shall be determined using vendor specific objective evidence of selling price, if it exists and otherwise using third-party evidence of selling price. If neither vendor specific objective evidence nor third-party evidence of selling price exists for a deliverable, companies shall use their best estimate of the selling price for that deliverable when applying the relative selling price method. The Company elected to adopt this guidance prospectively for all revenue arrangements entered into or materially modified after the date of adoption. The adoption of ASU 2009-13 did not have a material effect on the Company’s financial position, results of operations or cash flows.
On January 1, 2011, the Company adopted ASU 2010-17 (ASU 2010-17), "Revenue Recognition-Milestone Method (Topic 605): Milestone Method of Revenue Recognition." The amendments in this Update are effective on a prospective basis for milestones achieved in fiscal 2011 and thereafter. The Company’s adoption of ASU 2010-17 did not have a material effect on its financial position, results of operations or cash flows.
In May 2011, the Financial Accounting Standards Board (FASB) issued ASU No. 2011-04: Fair Value Measurement (Topic 820): Amendments to Achieve Common Fair Value Measurement and Disclosure Requirements in U.S. GAAP and IFRSs (ASU 2011-04). ASU 2011-04 clarifies application of fair value measurement and disclosure requirements and is effective for annual periods beginning after December 15, 2011. The Company does not expect that the provisions of ASU 2011-04 will have a material effect on its financial position and results of operations.
In June 2011, the FASB issued ASU No. 2011-05: Comprehensive Income (Topic 220): Presentation of Comprehensive Income (ASU 2011-05). ASU 2011-05 provides that an entity that reports items of other comprehensive income has the option to present comprehensive income in either one continuous financial statement or two consecutive financial statements. ASU 2011-05 is effective for annual periods beginning after December 15, 2011. The Company does not expect ASU 2011-05 to have any material impact on its financial position and results of operations.
In September 2011, the FASB issued ASU 2011-08 (ASU 2011-08), “Intangibles Goodwill and Other (Topic 350): Testing Goodwill for Impairment” ASU 2011-08 updated the guidance on the periodic testing of goodwill for impairment. The updated guidance gives companies the option to perform a qualitative assessment to determine whether it is more likely than not that the fair value of a reporting unit is less than its carrying amount. The amendment is intended to reduce the cost and complexity of the annual goodwill impairment test by providing entities an option to perform a qualitative assessment to determine whether further impairment testing is necessary. The update ASU 2011-08 is effective for fiscal years beginning after December 15, 2011, with early adoption permitted. The Company does not expect ASU 2011-08 to have a material effect on the Company’s financial position, results of operation or cash flows.
The Company does not believe that any other recently issued, but not yet effective, accounting standard if currently adopted would have a material effect on the accompanying financial statements.
NOTE 4 – FAIR VALUE OF FINANCIAL INSTRUMENTS
We account for certain assets and liabilities at fair value. We categorize each of our fair value measurements in one of these three levels based on the lowest level of input that is significant to the fair value measurement in its entirety.
The following table provides the assets and liabilities at fair value measured on a recurring basis as of December 31, 2011 and December 31, 2010:
| (in thousands) |
|
December 31, 2011 |
| |
|
Total
Carrying Value
|
|
|
Quoted Prices in Active Markets
Level 1
|
|
|
Using Significant Other Observable Inputs
Level 2
|
|
|
Using Significant Unobservable Inputs
Level 3
|
|
|
Assets:
|
|
|
|
|
|
|
|
|
|
|
|
|
|
Cash and cash equivalents:
|
|
|
|
|
|
|
|
|
|
|
|
|
|
Money market funds and certificates of deposits
|
|
$ |
17,622 |
|
|
$ |
- |
|
|
$ |
17,622 |
|
|
$ |
- |
|
|
Total assets
|
|
|
17,622 |
|
|
|
- |
|
|
|
17,622 |
|
|
|
- |
|
|
Current liabilities:
|
|
|
|
|
|
|
|
|
|
|
|
|
|
|
|
|
|
Warrant liabilities
|
|
|
671 |
|
|
|
- |
|
|
|
- |
|
|
|
671 |
|
| |
|
|
|
|
|
|
|
|
|
|
|
|
|
|
|
|
|
Total liabilitities
|
|
$ |
671 |
|
|
$ |
- |
|
|
$ |
- |
|
|
$ |
671 |
|
| |
|
December 31, 2010 |
|
| (in thousands) |
|
|
Total
Carrying Value
|
|
|
|
Quoted Prices in Active Markets
Level 1
|
|
|
|
Using Significant Other Observable Inputs
Level 2
|
|
|
|
Using Significant Unobservable Inputs
Level 3
|
|
|
Assets:
|
|
|
|
|
|
|
|
|
|
|
|
|
|
|
|
|
|
Cash and cash equivalents:
|
|
|
|
|
|
|
|
|
|
|
|
|
|
|
|
|
|
Money market funds and certificates of deposits
|
|
|
2,821 |
|
|
|
- |
|
|
|
2,821 |
|
|
|
- |
|
|
Total assets
|
|
|
2,821 |
|
|
|
- |
|
|
|
2,821 |
|
|
|
- |
|
|
Current liabilities:
|
|
|
|
|
|
|
|
|
|
|
|
|
|
|
|
|
|
Warrant liabilities
|
|
|
2,785 |
|
|
|
- |
|
|
|
- |
|
|
|
2,785 |
|
|
Long term liabilities:
|
|
|
|
|
|
|
|
|
|
|
|
|
|
|
|
|
|
Warrant liabilities
|
|
|
1,568 |
|
|
|
- |
|
|
|
- |
|
|
|
1,568 |
|
| |
|
|
|
|
|
|
|
|
|
|
|
|
|
|
|
|
|
Total liabilitities
|
|
$ |
4,353 |
|
|
$ |
- |
|
|
$ |
- |
|
|
$ |
4,353 |
|
NOTE 5 – INVENTORY
Finished goods primarily consists of shipments in transit which represent the cost of finished goods inventory shipped for which title has not yet passed to the customer. Inventory consisted of the following at December 31, 2010 and 2011:
|
(in thousands)
|
December 31,
|
|
| |
2010
|
|
2011
|
|
|
Raw material
|
$
|
139
|
|
$
|
--
|
|
|
Finished goods
|
|
695
|
|
|
1,460
|
|
| |
$
|
834
|
|
$
|
1,460
|
|
NOTE 6 - PROPERTY AND EQUIPMENT
Property and equipment consisted of the following at December 31, 2010 and 2011:
|
(in thousands)
|
|
December 31,
|
|
| |
|
2010
|
|
2011
|
|
|
Computers
|
|
$
|
311
|
|
$
|
654
|
|
|
Software
|
|
|
505
|
|
|
657
|
|
|
Software (capital lease)
|
|
|
30
|
|
|
--
|
|
|
Machinery and equipment
|
|
|
626
|
|
|
975
|
|
|
Furniture and office equipment
|
|
|
195
|
|
|
248
|
|
| |
|
|
1,667
|
|
|
2,534
|
|
|
Less – accumulated depreciation
|
|
|
922
|
|
|
1,285
|
|
| |
|
$
|
745
|
|
$
|
1,249
|
|
Depreciation expense was approximately $303,000, $380,000 and $458,000 for the years ended December 31, 2009, 2010 and 2011, respectively.
NOTE 7 - ACCRUED EXPENSES AND OTHER CURRENT LIABILITIES
|
(in thousands)
|
December 31,
|
|
| |
2010
|
|
2011
|
|
|
Accrued interest
|
$
|
244
|
|
$
|
--
|
|
|
Accrued compensation and benefits
|
|
124
|
|
|
391
|
|
|
Accrued professional fees
|
|
31
|
|
|
16
|
|
|
Accrued freight
|
|
152
|
|
|
140
|
|
| Accrued taxes |
|
15 |
|
|
43 |
|
|
Other accrued liabilities
|
|
67
|
|
|
124
|
|
| |
$
|
633
|
|
$
|
714
|
|
Accrued interest represented amounts owed to Vicis Capital Master Fund ("Vicis" or "Investor") on secured convertible promissory notes. See Note 8.
NOTE 8 - CONVERTIBLE DEBT - RESTATED
Securities Purchase Agreements
July 2007 Purchase Agreement
In July 2007, the Company entered into a Securities Purchase Agreement (the "July 2007 Purchase Agreement") with Vicis, pursuant to which Vicis purchased the Company’s Secured Convertible Promissory Note in aggregate principal amount of $7.5 million (the “July 2007 Note”). The July 2007 Note had a term of three years and was scheduled to become due on July 31, 2010. The outstanding principal amount of the July 2007 Note was convertible at the option of the holder into shares of the Company’s common stock at an initial conversion price of $7.50 per share, subject to certain adjustments. The July 2007 Note was secured by substantially all of the assets of the Company. In January 2010, the July 2007 Note was converted into 5.0 million shares of common stock.
Pursuant to the July 2007 Purchase Agreement, the Company issued to Vicis warrants to purchase 1.5 million shares of common stock, exercisable through July 31, 2012, at original exercise prices between $6.00 and $7.50 per share. All of these warrants were exercised in November 2008. In addition, the Company paid fees to a registered broker dealer of $570,000 and issued warrants to purchase up to 173,500 shares of the Company's common stock at an original per share exercise price of $7.50 (all of the warrants issued in connection with the July 2007 Note referred to as the “July 2007 Warrants”).
The July 2007 Note contained certain features, including anti-dilution price protection, net cash settlement options under certain circumstances and others features that, in accordance with ASC-815, Derivatives and Hedging (“ASC 815”), required bifurcation from the host contract and must be accounted for as a derivative instrument (the “July 2007 Embedded Derivatives”). The July 2007 Embedded Derivatives are recorded as a separate liability at their fair value on the date of issuance, and as a corresponding discount to the July 2007 Note that is amortized as interest expense over the term of the July 2007 Note. The fair value of July 2007 Embedded Derivatives was determined by management using a Monte Carlo simulation analysis taking into account various inputs including the fair value of the underlying common stock at the valuation measurement date; the risk-free interest rates; the expected dividend rates; credit-risk spreads; time to maturity; the expected volatility of the price of the underlying common stock; and the probability of various events or other options occurring.
Furthermore, the July 2007 Warrants are classified as liabilities in accordance with ASC 815, due primarily to an anti-dilution price protection feature. Such Warrants are recorded as a separate liability at their fair value on the date of issuance, and as a corresponding discount to the July 2007 Note that is amortized to interest expense over the term of the July 2007 Note. The fair value of the July 2007 Warrants was determined by management using a multiple scenario, probability-weighted option-pricing model using the following inputs: the fair value of the underlying common stock at the valuation measurement date; the risk-free interest rates; the expected dividend rates; the remaining contractual terms of the warrants; the expected volatility of the price of the underlying common stock; and the probability of certain events occurring.
The combined fair value of the July 2007 Embedded Derivatives and July 2007 Warrants at the time of the issuance of the July 2007 Note was approximately $9.5 million. Since the total debt discount cannot exceed the face value of the July 2007 Note, $7.5 million of the combined fair value of the July 2007 Embedded Derivative and the July 2007 Warrants was recorded as debt discount with the remainder $2.0 million immediately charged to interest expense. Furthermore, transaction costs were expensed as the net carrying amount of the July 2007 Note was $0. The $7.5 million in debt discount is amortized as interest expense over the term of the July 2007 Note. Since the July 2007 Note was converted into common stock in January 2010, no carrying value of the July 2007 Note remained as of December 31, 2010.
November 2007 Purchase Agreement
In November 2007, the Company entered into a Securities Purchase Agreement (the "November 2007 Purchase Agreement") with Vicis, pursuant to which Vicis purchased the Company’s Secured Convertible Promissory Note in aggregate principal amount of $2.5 million (the “November 2007 Note”). The November 2007 Note had a term of three years and was scheduled to become due on November 1, 2010. The outstanding principal amount of the November 2007 Note was convertible at the option of the holder into shares of the Company’s common stock at an initial conversion price of $4.50 per share, subject to certain adjustments. The November 2007 Note was secured by substantially all of the assets of the Company. In January 2010, the November 2007 Note was converted into approximately 1.7 million shares of common stock.
Pursuant to the November 2007 Purchase Agreement, the Company issued to Vicis warrants to purchase 833,333 shares of common stock, exercisable through October 31, 2012, at original exercise prices between $4.50 and $5.00 per share. All of these warrants were exercised in November 2008. In addition, the Company issued to a registered broker dealer warrants to purchase up to 116,667 shares of the Company's common stock at an original per share exercise price of $4.50 (all of the warrants issued in connection with the November 2007 Note referred to as the “November 2007 Warrants”).
The terms and features of the November 2007 Note were substantially the same as the July 2007 Note which therefore required bifurcation from the host contract. Certain embedded derivatives (the “November 2007 Embedded Derivatives”) were accounted for separately as a derivative liability and corresponding debt discount. The fair value of November 2007 Embedded Derivatives was determined by management using the same methodology as the July 2007 Embedded Derivatives.
Similarly, since the November 2007 Warrants have the same terms and features as the July 2007 Warrants, the accounting treatment of the November 2007 Warrants is identical to the July 2007 Warrants. The fair value of the November 2007 Warrants was determined by management using the same methodology as the July 2007 Warrants.
The combined fair value of the November 2007 Embedded Derivatives and November 2007 Warrants at the time of the issuance of the November 2007 Note was approximately $2.0 million and were amortized as interest expense over the term of the November 2007 Note. Therefore, at the time of issuance, the net carrying value of the November 2007 Note was approximately $500,000. Since the November 2007 Note was converted into common stock in January 2010, no carrying value of the November 2007 Note remained as of December 31, 2010.
January 2008 Purchase Agreement
In January 2008, the Company entered into a Securities Purchase Agreement (the "January 2008 Purchase Agreement") with Vicis, pursuant to which Vicis purchased the Company’s Secured Convertible Promissory Note in aggregate principal amount of $2.5 million (the “January 2008 Note”). The January 2008 Note had a term of three years and was scheduled to become due on January 15, 2011. The outstanding principal amount of the January 2008 Note was convertible at the option of the holder into shares of the Company’s common stock at an initial conversion price of $3.50 per share, subject to certain adjustments. The January 2008 Note was secured by substantially all of the assets of the Company. In August 2009, the January 2008 Note was converted into approximately 1.7 million shares of common stock.
Pursuant to the January 2008 Purchase Agreement, the Company issued to Vicis warrants to purchase 1.1 million shares of common stock, exercisable through January 15, 2013, at an original exercise price of $3.50 per share. All of these warrants were exercised in November 2008. In addition, the Company issued to a registered broker dealer warrants to purchase up to 150,000 shares of the Company's common stock at an original per share exercise price of $3.50 (all of the warrants issued in connection with the January 2008 Note referred to as the “January 2008 Warrants”).
The terms and features of the January 2008 Note were substantially the same as the July 2007 Note and November 2007 Note which therefore required bifurcation from the host contract. Certain embedded derivatives (the “January 2008 Embedded Derivatives”) were accounted for separately as a derivative liability and corresponding debt discount. The fair value of January 2008 Embedded Derivatives was determined by management using the same methodology as the July 2007 and November 2007 Embedded Derivatives.
Similarly, since the January 2008 Warrants have the same terms and features as the July 2007 Warrants and November 2007 Warrants, the accounting treatment of the January 2008 Warrants is identical to the July 2007 Warrants and November 2007 Warrants. The fair value of the January 2008 Warrants was determined by management using the same methodology as the July 2007 Warrants and the November 2007Warrants.
The combined fair value of the January 2008 Embedded Derivatives and January 2008 Warrants at the time of the issuance of the January 2008 Note was approximately $4.2 million. Since the total debt discount cannot exceed the face value of the January 2008 Note, $2.5 million of the combined fair value of the January 2008 Embedded Derivative and the January 2008 Warrants was recorded as debt discount with the remainder $1.7 million immediately charged to interest expense. The $2.5 million in debt discount was amortized as interest expense over the term of the January 2008 Note. Therefore, at the time of issuance, the net carrying value of the January 2008 Note was $0. Since the January 2008 Note was converted into common stock in January 2010, no carrying value of the January 2008 Note remained as of December 31, 2010.
Amortization of Debt Discounts and Changes in Fair Value of Embedded Derivative Liabilities
Amortization of debt discounts associated with the July 2007 Note, November 2007 Note and January 2008 Note (collectively, the ‘Notes”) totaled $3.7 million for the year ended December 31, 2009. In addition, a non-cash loss of approximately $102.1 million was recorded for the year ended December 31, 2009, relating to changes in fair value of the Embedded Derivatives associated with the Notes discussed above, which was driven primarily by the substantial appreciation in the Company’s stock price during the year, significantly increasing the fair value of the Embedded Derivatives.
As a result of the conversion of all the Notes in early 2010, there was no impact relating to changes in fair value of Embedded Derivatives during the year ended December 31, 2011.
Note Conversions
In August 2009, the January 2008 Note, as amended, was converted into 1.7 million shares of the Company’s common stock. Although the January 2008 Note was converted into shares of common stock in accordance with the conversion feature of the Notes, ASC 470 requires that extinguishment accounting is required if the conversion right of the host instrument has been bifurcated and recorded as a separate derivative liability under ASC 815. According to ASC 470-50, the difference between the reacquisition price and the net carrying value of extinguished debt should be recognized currently as income in the period of extinguishment as a loss or gain and identified as a separate item. When the debt is reacquired through the issuance of a company’s own stock, the reacquisition price is the fair value of the common stock issued. Since the conversion option of the January 2008 Note had been bifurcated and separately accounted for as a liability, extinguishment accounting was applied to the conversion of the January 2008 Note in accordance with ASC 470-50. As such, we recorded a non-cash gain on the extinguishment of debt of approximately $5.7 million during the year ended December 31, 2009.
In January 2010, both the July 2007 Note and November 2007 Note, as amended, were converted into approximately 6.7 million shares of the Company’s common stock. Although the July 2007 Note and the November 2007 Note were converted into shares of common stock in accordance with the conversion feature of the Notes, ASC 470 requires that extinguishment accounting is required if the conversion right of the host instrument has been bifurcated and recorded as a separate derivative liability under ASC 815. According to ASC 470-50, the difference between the reacquisition price and the net carrying value of extinguished debt should be recognized currently as income in the period of extinguishment as a gain or loss and identified as a separate item. When the debt is reacquired through the issuance of a company’s own stock, the reacquisition price is the fair value of the common stock issued. Since the conversion option of the July 2007 Note and the November 2007 Note had been bifurcated and separately accounted for as liabilities, extinguishment accounting was applied to the conversion of the July 2007 Note and the November 2007 Note in accordance with ASC 470-50. As such, we recorded a loss on the extinguishment of debt of approximately $355,000 during the year ended December 31, 2010.
NOTE 9 – EMBEDDED DERIVATIVES AND WARRANT LIABILITIES – RESTATED
In connection with issuing the Notes, as well as in connection with other financing transactions (see Note 8), we issued warrants to purchase common stock (collectively, the “Warrants”) which have been classified as liabilities in accordance with ASC 815, due primarily to an anti-dilution price protection feature. Changes in the fair values of these instruments require adjustments to the amount of the liabilities recorded on the Company’s balance sheet, and the corresponding gain or loss is required to be recorded in the Company’s statement of operations.
Fair value of the Warrants is determined by management using a multiple scenario, probability-weighted option-pricing model using the following inputs: the fair value of the underlying common stock at the valuation measurement date; the risk-free interest rates; the expected dividend rates; the remaining contractual terms of the warrants; the expected volatility of the price of the underlying common stock; and the probability of certain events occurring.
The fair value of Embedded Derivatives is determined by management using a Monte Carlo simulation analysis taking into account various inputs including the fair value of the underlying common stock at the valuation measurement date; the risk-free interest rates; the expected dividend rates; credit-risk spreads; time to maturity; the expected volatility of the price of the underlying common stock; and the probability of various events or other options occurring.
The assumptions used by the Company to determine fair value for the Warrants are summarized in the following tables:
| |
|
2009
|
|
|
2010
|
|
|
2011
|
|
| |
|
|
|
|
|
|
|
|
|
|
Risk free interest rate
|
|
|
2.2 |
% |
|
|
1.8 |
% |
|
|
1.7 |
% |
|
Expected life (yrs)
|
|
|
1.4-3.3 |
|
|
|
0.4-2.3 |
|
|
|
0.1-1.3 |
|
|
Expected volatility
|
|
|
67.5 |
% |
|
|
65.7 |
% |
|
|
62.3 |
% |
|
Dividend yield
|
|
|
0 |
% |
|
|
0 |
% |
|
|
0 |
% |
|
Underlying stock price
|
|
$ |
14.90 |
|
|
$ |
10.20 |
|
|
$ |
4.63 |
|
The assumptions used by the Company to determine fair value for the Embedded Derivatives are summarized in the following tables:
| |
|
2009
|
|
|
2010
|
|
| |
|
|
|
|
|
|
|
Risk free interest rate
|
|
|
0.31-0.44 |
% |
|
|
0.31-0.44 |
% |
|
Expected life (yrs)
|
|
|
0.58-0.84 |
|
|
|
0.58-0.84 |
|
|
Expected volatility
|
|
|
55-67 |
% |
|
|
55-67 |
% |
|
Dividend yield
|
|
|
0 |
% |
|
|
0 |
% |
| Credit spread |
|
|
10 |
% |
|
|
10 |
% |
|
Underlying stock price
|
|
$ |
14.90 |
|
|
$ |
10.20 |
|
The following table summarizes the changes in the estimated fair value of our warrant and derivative liabilities for the years ended December 31, 2009, 2010 and 2011 (in thousands).
| |
|
Warrant
|
|
|
Derivative
|
|
| |
|
Liability
|
|
|
Liability
|
|
| |
|
|
|
|
|
|
|
Beginning balance January 1, 2009
|
|
$ |
235 |
|
|
$ |
16,864 |
|
|
Mark-to-Market adjustment
|
|
|
7,029 |
|
|
|
102,070 |
|
|
Exercise of warrants
|
|
|
(1,367 |
) |
|
|
- |
|
|
Conversion of notes
|
|
|
- |
|
|
|
(28,970 |
) |
|
Ending balance as of December 31, 2009
|
|
|
5,897 |
|
|
|
89,964 |
|
|
Mark-to-Market adjustment
|
|
|
(2,740 |
) |
|
|
(5,434 |
) |
|
Exercise of warrants
|
|
|
(214 |
) |
|
|
- |
|
|
Issuance of warrants
|
|
|
1,410 |
|
|
|
- |
|
|
Conversion of notes
|
|
|
- |
|
|
|
(84,530 |
) |
|
Ending Balance as of December 31, 2010
|
|
|
4,353 |
|
|
|
- |
|
|
Mark-to-Market adjustment
|
|
|
(3,306 |
) |
|
|
- |
|
|
Exercise of warrants
|
|
|
(376 |
) |
|
|
- |
|
|
Ending balance as of December 31, 2011
|
|
$ |
671 |
|
|
$ |
- |
|
| |
|
|
|
|
|
|
|
|
NOTE 10 - STOCKHOLDERS' EQUITY – RESTATED
The Company has two classes of capital stock: common and preferred. As of December 31, 2011, the Company had 100,000,000 shares of common stock authorized and 5,000,000 shares of preferred stock authorized both at $0.001 par value per share.
On July 18, 2011, the Company filed a Certificate of Amendment to its Restated Certificate of Incorporation effecting a reverse stock split of its outstanding shares of common stock at a ratio of 1-for-100 shares (the “Reverse Split”). The Certificate of Amendment provided that each 100 outstanding shares of the Company’s common stock would be exchanged and combined, automatically, without further action, into one share of common stock. Following the implementation of the Reverse Split, the number of authorized shares of common stock that we are authorized to issue from time to time is 100,000,000 shares. The Reverse Split became effective on July 18, 2011 and has been reflected in this Amended Filing. On August 3, 2011, our common stock began to trade on the NASDAQ Capital Market under our new ticker symbol “AMBT.”
Warrants
In addition to the Warrants issued in connection with the Notes above, the Company issued warrants to purchase common stock in connection with other separate financing activities during 2009 and 2010.
In November 2009, we and Vicis entered into an agreement (“2009 Escrow Agreement”), which was subsequently amended in January 2010, pursuant to which Vicis deposited into an escrow account $8.0 million to be drawn upon, from time to time, as our cash balances fell below $1.5 million (the ‘‘Cash Balance Condition Precedent”). We were entitled to receive $500,000 from the account in consideration of which we would issue to Vicis 50,000 shares of common stock and warrants to purchase 50,000 shares of common stock. Between January and December 2010, we completed six draw-downs in the amount of the $3.0 million and issued 300,000 shares of our common stock and warrants to purchase 300,000 shares of common stock at an exercise price of $25.00 per share expiring on various dates through December 29, 2012.
On December 30, 2010, we and Vicis further amended the 2009 Escrow Agreement (“Second Amendment”) pursuant to which Vicis allowed us to draw the remaining $5.0 million in the escrow account, despite the fact that the Cash Balance Condition Precedent had not been met. In consideration of the Second Amendment and drawdown of the $5.0 million in escrow, we issued to Vicis 500,000 shares of our common stock as well as warrants to purchase, over a two year period from the date of issuance, an additional 500,000 shares of common stock with an exercise price of $20.00 per share.
The following table summarizes the warrants outstanding as of December 31, 2010 and 2011, respectively:
| |
|
December 31,
|
|
| Exercise Price |
|
|
2010
|
|
|
2011
|
|
| $ |
3.50
|
|
|
|
384,522 |
|
|
|
315,984 |
|
| $ |
7.50
|
|
|
|
7,500 |
|
|
|
7,500 |
|
| $ |
20.00
|
|
|
|
500,000 |
|
|
|
500,000 |
|
| $ |
25.00 |
|
|
|
667,667 |
|
|
|
300,000 |
|
| |
|
|
|
|
1,559,689 |
|
|
|
1,123,484 |
|
| |
|
|
|
|
|
|
|
|
|
|
| Weighted average exercise price |
|
|
|
$ |
18.01 |
|
|
$ |
16.61 |
|
| |
|
|
|
|
|
|
|
|
|
|
| Vicis warrants |
|
|
|
|
955,033 |
|
|
|
955,033 |
|
| Weighted average exercise price |
|
|
|
$ |
18.89 |
|
|
$ |
18.89 |
|
NOTE 11 - STOCK-BASED COMPENSATION – RESTATED
The following table presents stock-based compensation expense included in the Company’s statements of operations for the years ended December 31, 2009, 2010 and 2011:
| (in thousands) |
|
Year Ended December 31,
|
|
| |
|
2009
|
|
|
2010
|
|
|
2011
|
|
|
Cost of goods sold
|
|
$ |
- |
|
|
$ |
- |
|
|
$ |
357 |
|
|
Research and development
|
|
|
136 |
|
|
|
151 |
|
|
|
891 |
|
|
Selling, general and administrative expenses
|
|
|
486 |
|
|
|
305 |
|
|
|
2,274 |
|
| |
|
$ |
622 |
|
|
$ |
456 |
|
|
$ |
3,522 |
|
Stock Incentive Plans
In November 2000, the Company adopted the 2000 Equity Incentive Plan (the "2000 Incentive Plan"). The 2000 Incentive Plan provides for the grant of incentive stock options, nonqualified stock options, stock appreciation rights, restricted stock, bonus stock, awards in lieu of cash obligations, other stock-based awards and performance units. On August 15, 2011, the Board of Directors of the Company approved an amendment to the Company’s 2000 Incentive Plan to increase the number of shares of the Company’s common stock available for issuance under the 2000 Incentive Plan from 1,100,000 to 2,750,000 shares. By written consent, the holder of a majority of the shares of outstanding common stock of the Company approved the amendment for such increase.
In December 2002, the Company adopted the 2002 Non-Employee Directors Stock Option Plan (the "2002 Directors Plan") providing for the issuance of shares of Common Stock to non-employee directors. Under the 2002 Directors Plan, only non-qualified options may be issued, and they will be exercisable for a period of six years from the date of grant. On August 15, 2011, the Board of Directors of the Company also approved an amendment to the Company’s 2002 Directors Plan to increase the number of shares of the Company’s common stock available for issuance under the 2002 Directors Plan from 250,000 to 750,000 shares. By written consent, the holder of a majority of the shares of outstanding common stock of the Company approved the amendment for such increase.
In addition to the options granted under the stock option plans discussed above (the "Plans”), the Company has issued options outside of the Plans, pursuant to various employment, consulting and separation agreements (referred to as “Non-plan” stock options).
Option activity for 2009, 2010 and 2011 is summarized as follows:
| |
|
Plan
|
|
|
Non-plan
|
|
|
Total
|
|
|
Price
|
|
| |
|
|
|
|
|
|
|
|
|
|
|
|
|
Options outstanding, January 1, 2009
|
|
|
286,120 |
|
|
|
37,750 |
|
|
|
323,870 |
|
|
$ |
17.00 |
|
|
Granted
|
|
|
274,500 |
|
|
|
--- |
|
|
|
274,500 |
|
|
|
4.00 |
|
|
Exercised
|
|
|
(7,500 |
) |
|
|
--- |
|
|
|
(7,500 |
) |
|
|
6.00 |
|
|
Forfeited
|
|
|
(4,000 |
) |
|
|
(1,500 |
) |
|
|
(5,500 |
) |
|
|
13.00 |
|
| |
|
|
|
|
|
|
|
|
|
|
|
|
|
|
|
|
|
Options outstanding, January 1, 2010
|
|
|
549,120 |
|
|
|
36,250 |
|
|
|
585,370 |
|
|
|
11.00 |
|
|
Granted
|
|
|
581,450 |
|
|
|
15,000 |
|
|
|
596,450 |
|
|
|
10.40 |
|
|
Exercised
|
|
|
(6,860 |
) |
|
|
–– |
|
|
|
(6,860 |
) |
|
|
4.00 |
|
|
Forfeited
|
|
|
(45,495 |
) |
|
|
--- |
|
|
|
(45,495 |
) |
|
|
13.00 |
|
|
|
|
|
|
|
|
|
|
|
|
|
|
|
|
|
|
|
|
Options outstanding, January 1, 2011
|
|
|
1,078,215 |
|
|
|
51,250 |
|
|
|
1,129,465 |
|
|
|
11.40 |
|
|
Granted
|
|
|
1,698,075 |
|
|
|
-- |
|
|
|
1,698,075 |
|
|
|
6.70 |
|
|
Exercised
|
|
|
(8,250 |
) |
|
|
–– |
|
|
|
(8,250 |
) |
|
|
2.56 |
|
|
Forfeited
|
|
|
(33,167 |
) |
|
|
(36,250 |
) |
|
|
(69,417 |
) |
|
|
26.46 |
|
|
|
|
|
|
|
|
|
|
|
|
|
|
|
|
|
|
|
|
Options outstanding, December 31, 2011
|
|
|
2,734,873 |
|
|
|
15,000 |
|
|
|
2,749,873 |
|
|
$ |
8.16 |
|
|
|
|
|
|
|
|
|
|
|
|
|
|
|
|
|
|
|
|
Shares of Common Stock available for
|
|
|
|
|
|
|
|
|
|
|
|
|
|
|
|
|
|
future grant under the plans
|
|
|
725,258 |
|
|
|
|
|
|
|
|
|
|
|
|
|
| |
|
|
|
|
|
|
|
|
|
|
|
|
|
|
|
|
|
Aggregate intrinsic value
|
|
$ |
300,973 |
|
|
$ |
--- |
|
|
$ |
300,973 |
|
|
|
|
|
The aggregate intrinsic value was calculated based on the positive difference between the closing market price of the Company’s Common Stock and the exercise price of the underlying options.
The following table summarizes information about stock options outstanding at December 31, 2011:
| |
|
|
|
Weighted Average
|
|
|
Options Exercisable
|
|
| |
|
|
|
Remaining
|
|
|
Weighted Average
|
|
| |
|
Number
|
|
Contractual
|
|
|
Exercise
|
|
|
Number
|
|
|
Exercise
|
|
|
Ranges of price
|
|
Outstanding
|
|
Life (yrs)
|
|
|
Price
|
|
|
Exercisable
|
|
|
Price
|
|
| $ 3.00-4.50 |
|
340,065
|
|
|
5.96
|
|
|
$
|
3.74
|
|
|
|
340,065
|
|
|
$
|
3.74
|
|
| $ 5.00-7.51 |
|
1,652,575
|
|
|
9.04
|
|
|
$
|
6.60
|
|
|
|
722,877
|
|
|
$
|
6.52
|
|
| $ 8.00-12.30 |
|
622,733
|
|
|
7.90
|
|
|
$
|
11.83
|
|
|
|
318,610
|
|
|
$
|
11.95
|
|
| $ 15.00-20.00 |
|
120,000
|
|
|
2.80
|
|
|
$
|
19.76
|
|
|
|
120,000
|
|
|
$
|
19.76
|
|
| $ 25.00-30.00 |
|
9,500
|
|
|
3.50
|
|
|
$
|
27.63
|
|
|
|
9,500
|
|
|
$
|
27.63
|
|
| $ 50.00 |
|
5,000
|
|
|
2.61
|
|
|
$
|
50.00
|
|
|
|
5,000
|
|
|
$
|
50.00
|
|
| $ 3.00-50.00 |
|
2,749,873
|
|
|
8.09
|
|
|
$
|
8.16
|
|
|
|
1,516,052
|
|
|
$
|
8.36
|
|
Share based compensation - The fair values of stock options granted were estimated using the Black-Scholes option-pricing model with the following assumptions:
| |
|
2009
|
|
|
2010
|
|
|
2011
|
|
|
Risk free interest rate
|
|
|
2.2 |
% |
|
|
1.8 |
% |
|
|
1.7 |
% |
|
Expected life
|
|
|
3.50 – 5.75 |
|
|
|
3.5 -5.75 |
|
|
|
3.0 -6.0 |
|
|
Expected volatility
|
|
|
67.5 |
% |
|
|
65.7 |
% |
|
|
62.3 |
% |
|
Dividend yield
|
|
|
--- |
|
|
|
–– |
|
|
|
–– |
|
| |
|
|
|
|
|
|
|
|
|
|
|
|
|
Weighted-average grant date fair value per share
|
|
$ |
3.50 |
|
|
$ |
$10.40 |
|
|
$ |
4.33 |
|
On December 20, 2011, the Compensation Committee of the Board of Directors approved grants of options to purchase 960,000 shares of our common stock under the Company’s 2000 Equity Incentive Plan to senior officers. Options as to one third of such shares vested upon grant at a per share exercise price of $6.30. Options as to the balance of such shares are scheduled to vest on a quarterly basis, in eight equal quarterly installments at the end of each quarter, beginning with the quarter ending March 31, 2013, with half of the option grants exercisable at a per share exercise price of $6.75 and the remaining half at $7.25. In addition, options to purchase 394,000 shares of common stock were granted to the Board of Directors and Advisory Board members, which immediately vested as well. As a result of the immediate vesting of a portion of the options granted to senior executives and the options granted to the Board of Directors and Advisory Board members, the Company recorded a stock-based compensation charge of approximately $1.9 million during the fourth quarter of 2011.
As of December 31, 2011, there was $5.4 million of unrecognized compensation cost related to non-vested options granted. That cost is expected to be recognized over a weighted-average period of 18.8 months.
NOTE 12 - INCOME TAXES - RESTATED
The provision for income taxes at December 31, 2011 was comprised of federal alternative minimum tax.
At December 31, 2011, the Company had available $68.3 million of net operating loss carry forwards, for U.S. income tax purposes which expire in the years 2016 through 2030. However, due to changes in stock ownership, the use of the U.S. net operating loss carry forwards is limited under Section 382 of the Internal Revenue Code. As such, approximately $61.4 million of these net operating loss carry forwards will expire and will not be available to use against future tax liabilities. The Company has ceased its foreign operations and has abandoned the foreign net operating loss carry forwards.
Due to the uncertainty of their realization, no income tax benefit has been recorded by the Company for these loss carry forwards as valuation allowances have been established for any such benefits.
Significant components of the Company's deferred tax assets are as follows:
|
(in thousands)
|
|
December 31,
|
|
|
|
|
2010
|
|
|
2011
|
|
|
Net operating loss carry forwards
|
|
$
|
6,828
|
|
|
$
|
2,775
|
|
|
Stock based compensation
|
|
|
1,025
|
|
|
|
2,004
|
|
|
Other
|
|
|
615
|
|
|
|
459
|
|
|
Total deferred tax assets
|
|
|
8,468
|
|
|
|
5,238
|
|
|
Valuation allowance
|
|
|
(8,468
|
)
|
|
|
(5,238
|
)
|
|
Net deferred tax assets
|
|
$
|
––
|
|
|
$
|
––
|
|
The decrease in the valuation allowance was due primarily to the offset of net operating losses against taxable income in 2011and the effects of accrued expenses and depreciation and amortization net of increases in stock based compensation.
The following is a reconciliation of the federal statutory tax rate of 35% for 2009, 2010 and 2011, with the provision for income taxes:
|
|
|
December 31, |
|
|
|
|
2009 |
|
2010
|
|
|
2011
|
|
|
Statutory tax rate
|
|
|
(35 |
%) |
|
(35
|
%)
|
|
|
35
|
%
|
|
Net operating loss carry forward
|
|
|
--
|
|
|
|
|
|
|
(35 |
) |
|
Valuation allowance
|
|
|
35
|
|
|
35
|
|
|
|
--
|
|
| Alternative minimum tax |
|
|
|
|
|
|
|
|
|
2 |
|
|
Effective federal tax rate
|
|
|
0 |
% |
|
0
|
%
|
|
|
2
|
%
|
At December 31, 2010 and 2011, the Company had no material unrecognized tax benefits, and no adjustments to liabilities or operations were required. The Company does not expect that its unrecognized tax benefits will materially increase within the next twelve months. The Company did not recognize any interest or penalties related to uncertain tax positions at December 31, 2010 and 2011.
The Company files U.S. and state income tax returns in jurisdictions with varying statutes of limitations. The 2008 through 2011 tax years generally remain subject to examination by federal and most state tax authorities.
NOTE 13 - CONCENTRATION OF CREDIT RISK AND SIGNIFICANT CUSTOMER
Financial instruments that potentially subject the Company to significant concentrations of credit risk consist principally of cash and cash equivalents, and accounts receivable. The Company places its cash and cash equivalents with high quality financial institutions. With respect to accounts receivable, such receivables are entirely from Duke Energy, comprising all of the Company’s revenues. This customer concentration increases the Company’s exposure to credit risk since the financial insolvency of this customer could have a significant impact on its liquidity and results of operations.
The Company utilizes one contract manufacturer for all of its production requirements. The Company’s products are manufactured in China by a U.S.-based company that also performs services for numerous other companies. The Company depends on its manufacturer to maintain high levels of productivity and satisfactory delivery schedules. The Company’s reliance on its manufacturer reduces its control over the manufacturing process, exposing the Company to risks, including reduced control over quality assurance, product costs and product supply.
NOTE 14 - OPERATING LEASES
The Company does not own any real property. The Company currently leases approximately 28,000 square feet of office space in Newton, Massachusetts. The Company’s leases expire on December 31, 2012.
Deferred rent represents the cumulative excess of the straight-lined rent expense over cash paid for rent. The amount of deferred rent remaining on the Company’s balance sheet as of December 31, 2011 was approximately $100,000, which will be fully amortized to rent expense during 2012. Total minimum rental payments for 2012 are approximately $558,000. Rent expense for 2009, 2010 and 2011 was $290,430, $308,015, and $347,679, respectively.
NOTE 15 – RETIREMENT PLANS
Through December 31, 2011, the Company maintained a SIMPLE IRA plan for the benefit of its employees. The Company made contributions to the plan in the amount of 3% of compensation, but such contributions could not exceed the amount of the employee's contribution. The Company's contributions for 2009, 2010 and 2011 were $69,378, $96,492, and $123,060, respectively.
Effective January 1, 2012, the Company established a 401(k) plan for eligible employees. Under the provision of the plan, eligible employees may voluntarily contribute a portion of their compensation up to the statutory limit. The Company’s 401(k) plan provides for a matching contribution of up to 4% of participating employee compensation.
NOTE 16 – RELATED PARTY TRANSACTIONS
The Company retains the services of a law firm to perform legal services from time to time. One of the partners of the firm is a non-employee director of the Company. Legal fees incurred amounted to $88,797, $57,161 and $394,153 for 2009, 2010 and 2011, respectively.
NOTE 17 - SUBSEQUENT EVENTS
None.
EXHIBIT INDEX
| Exhibit Number |
|
Description |
| |
|
|
|
3
|
.1
|
|
Restated Certificate of Incorporation of Ambient Corporation, as amended (filed as Exhibit 3.1 to the Quarterly Report of Ambient Corporation on Form 10-Q for the three month period ended June 30, 2011, filed August 10, 2011).(1)
|
|
3
|
.2
|
|
Bylaws of Ambient Corporation (previously filed)
|
|
4
|
.1
|
|
Specimen Stock Certificate (previously filed)
|
|
4
|
.2
|
|
Common Stock Purchase Warrant (Series A) (filed as Exhibit 4.2 to the Current Report of Ambient Corporation on Form 8-K, filed July 31, 2007).(1)
|
|
4
|
.3
|
|
Common Stock Purchase Warrant (Series B) (filed as Exhibit 4.3 to the Current Report of Ambient Corporation on Form 8-K, filed July 31, 2007).(1)
|
|
4
|
.4
|
|
Common Stock Purchase Warrant (Series C) (filed as Exhibit 4.2 to the Current Report of Ambient Corporation on Form 8-K, filed July 31, 2007).(1)
|
|
4
|
.5
|
|
Common Stock Purchase Warrant (Series D) (filed as Exhibit 4.3 to the Current Report of Ambient Corporation on Form 8-K, filed November 5, 2007).(1)
|
|
4
|
.6
|
|
Common Stock Purchase Warrant (Series E) (filed as Exhibit 4.2 to the Current Report of Ambient Corporation on Form 8-K, filed January 17, 2008).(1)
|
|
4
|
.7
|
|
Warrant issued as of April 23, 2008 (filed as Exhibit 4.1 to the Quarterly Report of Ambient Corporation on Form 10-Q for the three month period ended June 30, 2008, filed August 14, 2008).(1)
|
|
4
|
.8
|
|
Common Stock Purchase Warrant (Series G) (filed as Exhibit 4.1 to the Quarterly Report of Ambient Corporation on Form 10-Q for the three month period ended September 30, 2009, filed November 16, 2009).(1)
|
|
10
|
.1
|
|
Ambient Corporation 2000 Equity Incentive Plan (filed as Appendix A to the Definitive Information Statement of Ambient Corporation on Schedule 14C, filed December 24, 2009).(1)+
|
|
10
|
.2
|
|
Ambient Corporation 2002 Non-Employee Directors Stock Option Plan (filed as Appendix B to the Definitive Information Statement of Ambient Corporation on Schedule 14C, filed December 24, 2009).(1)
|
|
10
|
.3
|
|
Amended and Restated Employment Agreement effective as of December 30, 2008 between Ambient Corporation and John Joyce (filed as Exhibit 10.4 to the Quarterly Report of Ambient Corporation on Form 10-Q for the three month period ended March 31, 2008, filed May 15, 2008).(1)+
|
|
10
|
.4
|
|
Amended and Restated Employment Agreement effective as of June 2, 2008 between Ambient Corporation and Ramdas Rao (filed as Exhibit 10.5 to the Quarterly Report of Ambient Corporation on Form 10-Q for the three month period ended March 31, 2008, filed May 15, 2008).(1)+
|
|
10
|
.5
|
|
Employment Agreement effective as of August 4, 2011 between Ambient Corporation and Mark L. Fidler (filed as Exhibit 10.1 to the Current Report of Ambient Corporation on Form 8-K, filed on August 8, 2011).(1)+
|
|
10
|
.6
|
|
Securities Purchase Agreement dated as of May 26, 2006 among Ambient Corporation and certain investors (filed as Exhibit 10.8 to the Registration Statement of Ambient Corporation on Form SB-2, filed June 8, 2006, as File No. 333-134872).(1)
|
|
10
|
.7
|
|
Registration Rights Agreement dated as of May 26, 2006 among Ambient Corporation and certain investors (filed as Exhibit 10.9 to the Registration Statement of Ambient Corporation on Form SB-2, filed June 8, 2006, as File No. 333-134872).(1)
|
|
10
|
.8
|
|
Registration Rights Agreement, dated as of July 31, 2007, between Ambient Corporation and Vicis Capital Master Fund (filed as Exhibit 10.1 to the Current Report of Ambient Corporation on Form 8-K, filed on July 31, 2007).(1)
|
|
10
|
.9
|
|
Securities Purchase Agreement, dated as of July 31, 2007 between Ambient Corporation and Vicis Capital Master Fund (filed as Exhibit 10.2 to the Current Report of Ambient Corporation on Form 8-K, filed on July 31, 2007).(1)
|
|
10
|
.10
|
|
Security Agreement, dated as of July 31, 2007 between Ambient Corporation and Vicis Capital Master Fund (filed as Exhibit 10.3 to the Current Report of Ambient Corporation on Form 8-K, filed on July 31, 2007).(1)
|
|
10
|
.11
|
|
Securities Purchase Agreement dated as of November 1, 2007, between Ambient Corporation and Vicis Capital Master Fund (filed as Exhibit 10.1 to the Current Report of Ambient Corporation on Form 8-K, filed on November 5, 2007).(1)
|
|
10
|
.12
|
|
First Amendment dated as of November 1, 2007 to Registration Rights Agreement, dated as of July 31, 2007, between Ambient and Vicis Capital Master Fund (filed as Exhibit 10.2 to the Current Report of Ambient Corporation on Form 8-K, filed on November 5, 2007).(1)
|
|
10
|
.13
|
|
First Amendment dated as of November 1, 2007 to Securities Purchase Agreement, dated as of July 31, 2007 between Ambient Corporation and Vicis Capital Master Fund (filed as Exhibit 10.3 to the Current Report of Ambient Corporation on Form 8-K, filed on November 5, 2007).(1)
|
|
10
|
.14
|
|
Securities Purchase Agreement dated as of January 15, 2008, between Ambient Corporation and Vicis Capital Master Fund (filed as Exhibit 10.1 to the Current Report of Ambient Corporation on Form 8-K, filed on January 17, 2008).(1)
|
|
10
|
.15
|
|
Second Amendment dated as of January 15, 2008 to Registration Rights Agreement, dated as of July 31, 2007, between Ambient Corporation and Vicis Capital Master Fund (filed as Exhibit 10.2 to the Current Report of Ambient Corporation on Form 8-K, filed on January 17, 2008).(1)
|
|
10
|
.16
|
|
First Amendment dated as of January 15, 2008 to Securities Purchase Agreement, dated as of November 1, 2007 between Ambient Corporation and Vicis Capital Master Fund (filed as Exhibit 10.3 to the Current Report of Ambient Corporation on Form 8-K, filed on January 17, 2008).(1)
|
|
10
|
.17
|
|
Second Amendment dated as of January 15, 2008 to Securities Purchase Agreement, dated as of July 31, 2007 between Ambient Corporation and Vicis Capital Master Fund (filed as Exhibit 10.4 to the Current Report of Ambient Corporation on Form 8-K, filed on January 17, 2008).(1)
|
|
10
|
.18
|
|
Securities Purchase Agreement dated as of April 23, 2008 between Ambient Corporation and Vicis Capital Master Fund (filed as Exhibit 10.1 to the Quarterly Report of Ambient Corporation on Form 10-Q for the three month period ended June 30, 2008, filed August 14, 2008).(1)
|
|
10
|
.19
|
|
Amendment and Waiver dated as of April 23, 2008 between Ambient Corporation and Vicis Capital Master Fund (filed as Exhibit 10.2 to the Quarterly Report of Ambient Corporation on Form 10-Q for the three month period ended June 30, 2008, filed August 14, 2008).(1)
|
|
10
|
.20
|
|
Debenture Amendment Agreement dated as of November 21, 2008 between Ambient Corporation and Vicis Capital Master Fund (filed as Exhibit 10.1 to the Current Report of Ambient Corporation on Form 8-K, filed November 24, 2008).(1)
|
|
10
|
.21
|
|
Securities Purchase Agreement, dated as of November 16, 2009 between Ambient Corporation and Vicis Capital Master Fund (filed as Exhibit 10.2 to the Quarterly Report of Ambient Corporation on Form 10-Q for the three month period ended September 30, 2009, filed November 16, 2009).(1)
|
|
10
|
.22
|
|
Registration Rights Agreement, dated as of November 16, 2009 between Ambient Corporation and Vicis Capital Master Fund (filed as Exhibit 10.3 to the Quarterly Report of Ambient Corporation on Form 10-Q for the three month period ended September 30, 2009, filed November 16, 2009).(1)
|
|
10
|
.23
|
|
Amendment to Securities Purchase Agreement dated as of January 15, 2010, between Ambient and Vicis Capital Master Fund (filed as Exhibit 10.26 to the Annual Report of Ambient Corporation on Form 10-K for the year ended December 31, 2009, filed March 31, 2010).(1)
|
|
10
|
.24
|
|
Commercial Deployment Agreement dated as of March 31, 2008 between Ambient Corporation and Duke Energy Carolinas, LLC (filed as Exhibit 10.1 to the Quarterly Report of Ambient Corporation on Form 10-Q for the three month period ended March 31, 2008, filed May 15, 2008). (Pursuant to Rule 24b-2 under the Securities Exchange Act of 1934, the registrant has requested confidential treatment of the portion of this exhibit deleted from the filed copy).(1)
|
|
10
|
.25
|
|
Master Supply and Alliance Agreement dated as of February 17, 2009 between Ambient Corporation and Bel Fuse Inc. (Pursuant to Rule 24b-2 under the Securities Exchange Act of 1934, the registrant has requested confidential treatment of the portion of this exhibit deleted from the filed copy).
|
|
10
|
.26
|
|
Product Sales, Services & Software Agreement between Ambient Corporation and Duke Energy business Services LLC on its own behalf and as agent for and on behalf of Duke Energy Carolinas, LLC, Duke Energy Indiana, Inc, Duke Energy Ohio, Inc., Duke Energy Kentucky, Inc., and certain after acquired affiliates (filed as Exhibit 10.1 to the Quarterly Report of Ambient Corporation on Form 10-Q for the three month period ended September 30, 2009, filed November 16, 2009). (Pursuant to Rule 24b-2 under the Securities Exchange Act of 1934, the registrant has requested confidential treatment of portions of this exhibit deleted from the filed copy.)(1)
|
|
10
|
.27
|
|
Office Lease Agreement dated as of May 21, 2009, between Ambient Corporation and NS 7/57 Acquisition LLC (filed as Exhibit 10.1 to the Quarterly Report of Ambient Corporation on Form 10-Q for the three month period ended June 30, 2009, filed August 7, 2009).(1)
|
|
14
|
|
|
Code of Business Conduct and Ethics (filed as Exhibit 14.1 to the Current Report of Ambient Corporation on
Form 8-K, filed August 2, 2011).(1)
|
|
23
|
|
|
Consent of Rotenberg Meril Solomon Bertiger & Guttilla, P.C.
|
|
31
|
.1
|
|
Certification of Chief Executive Officer pursuant to Rule 13a-14(a) of the Securities Exchange Act of 1934, as amended.
|
|
31
|
.2
|
|
Certification of Chief Financial Officer pursuant to Rule 13a-14(a) of the Securities Exchange Act of 1934, as amended.
|
|
32
|
|
|
Certification of Chief Executive Officer and Chief Financial Officer, as adopted pursuant to Section 906 of the Sarbanes-Oxley Act of 2002.
|
|
101
|
.INS*
|
|
XBRL Instance Document
|
|
101
|
.SCH*
|
|
XBRL Taxonomy Extension Schema
|
|
101
|
.CAL*
|
|
XBRL Taxonomy Extension Calculation Linkbase
|
|
101
|
.DEF*
|
|
XBRL Taxonomy Extension Definition Linkbase
|
|
101
|
.LAB*
|
|
XBRL Taxonomy Extension Label Linkbase
|
|
101
|
.PRE*
|
|
XBRL Taxonomy Extension Presentation Linkbase
|
|
+
|
|
Management Agreement
|
|
*
|
|
Pursuant to Rule 406T of Regulation S-T, these interactive data files are deemed not filed or part of a registration statement or prospectus for purposes of Sections 11 or 12 of the Securities Act of 1933 or Section 18 of the Securities Exchange Act of 1934 and otherwise are not subject to liability.
|
|
(1)
|
|
Incorporated by reference
|
Exhibit 23
CONSENT OF INDEPENDENT ACCOUNTANTS TO THE COMPANY’S REGISTRATION STATEMENT ON FORM S-8
We hereby consent to the incorporation by reference in the Post-Effective Amendment No. 2 to Registration Statement on Form S-8 (333-112569) and the Registration Statement on Form S-8 (333-177179) of Ambient Corporation of our report dated September 21, 2012 relating to the financial statements which appears in this Amendment No. 1 to Annual Report on Form 10-K/A.
/s/ Rotenberg Meril Solomon Bertiger & Guttilla, P.C.
Rotenberg Meril Solomon Bertiger & Guttilla, P.C.
Certified Public Accountants
Saddle Brook NJ
September 24, 2012
RULE 13a-14(a) CERTIFICATION
I, John J. Joyce, certify that:
|
1.
|
I have reviewed this Amended Annual Report on Form 10-K/A for the year ended December 31, 2011 of Ambient Corporation;
|
|
2.
|
Based on my knowledge, this report does not contain any untrue statement of a material fact or omit to state a material fact necessary to make the statements made, in light of the circumstances under which such statements were made, not misleading with respect to the period covered by this report;
|
|
3.
|
Based on my knowledge, the financial statements, and other financial information included in this report, fairly present in all material respects the financial condition, results of operations and cash flows of the registrant as of, and for, the periods presented in this report;
|
|
4.
|
The registrant’s other certifying officer and I are responsible for establishing and maintaining disclosure controls and procedures (as defined in Exchange Act Rules 13a-15(e) and 15d-15(e)) and internal control over financial reporting (as defined in Exchange Act Rules 13a-15(f) and 15d-15(f)) for the registrant and have:
|
| |
a)
|
Designed such disclosure controls and procedures, or caused such disclosure controls and procedures to be designed under our supervision, to ensure that material information relating to the registrant, including its consolidated subsidiaries, is made known to us by others within those entities, particularly during the period in which this report is being prepared;
|
| |
b)
|
Designed such internal control over financial reporting, or caused such internal control over financial reporting to be designed under our supervision, to provide reasonable assurance regarding the reliability of financial reporting and the preparation of financial statements for external purposes in accordance with generally accepted accounting principles;
|
| |
c)
|
Evaluated the effectiveness of the registrant's disclosure controls and procedures and presented in this report our conclusions about the effectiveness of the disclosure controls and procedures, as of end of the period covered by this report based on such evaluation; and
|
| |
d)
|
Disclosed in this report any change in the registrant's internal control over financial reporting that occurred during the registrant's most recent fiscal quarter (the registrant's fourth fiscal quarter in the case of an annual report) that has materially affected, or is reasonably likely to materially affect, the registrant's internal control over financial reporting; and
|
|
5.
|
The registrant’s other certifying officer and I have disclosed, based on our most recent evaluation of internal control over financial reporting, to the registrant's auditors and the Audit Committee of registrant's board of directors (or persons performing the equivalent functions):
|
| |
a)
|
All significant deficiencies and material weaknesses in the design or operation of internal control over financial reporting which are reasonably likely to adversely affect the registrant's ability to record, process, summarize and report financial information; and
|
| |
b)
|
Any fraud, whether or not material, that involves management or other employees who have a significant role in the registrant's internal control over financial reporting.
|
September 24, 2012
| |
By:
|
/s/ J ohn J. J oyce
|
|
| |
|
John J. Joyce
|
|
| |
|
President and Chief Executive Officer
(Principal Executive Officer)
|
|
EXHIBIT 31.2
RULE 13a-14(a) CERTIFICATION
I, Mark L. Fidler, certify that:
|
1.
|
I have reviewed this Amended Annual Report on Form 10-K/A for the year ended December 31, 2011 of Ambient Corporation;
|
|
2.
|
Based on my knowledge, this report does not contain any untrue statement of a material fact or omit to state a material fact necessary to make the statements made, in light of the circumstances under which such statements were made, not misleading with respect to the period covered by this report;
|
|
3.
|
Based on my knowledge, the financial statements, and other financial information included in this report, fairly present in all material respects the financial condition, results of operations and cash flows of the registrant as of, and for, the periods presented in this report;
|
|
4.
|
The registrant’s other certifying officer and I are responsible for establishing and maintaining disclosure controls and procedures (as defined in Exchange Act Rules 13a-15(e) and 15d-15(e)) and internal control over financial reporting (as defined in Exchange Act Rules 13a-15(f) and 15d-15(f)) for the registrant and have:
|
| |
a)
|
Designed such disclosure controls and procedures, or caused such disclosure controls and procedures to be designed under our supervision, to ensure that material information relating to the registrant, including its consolidated subsidiaries, is made known to us by others within those entities, particularly during the period in which this report is being prepared;
|
| |
b)
|
Designed such internal control over financial reporting, or caused such internal control over financial reporting to be designed under our supervision, to provide reasonable assurance regarding the reliability of financial reporting and the preparation of financial statements for external purposes in accordance with generally accepted accounting principles;
|
| |
c)
|
Evaluated the effectiveness of the registrant's disclosure controls and procedures and presented in this report our conclusions about the effectiveness of the disclosure controls and procedures, as of end of the period covered by this report based on such evaluation; and
|
| |
d)
|
Disclosed in this report any change in the registrant's internal control over financial reporting that occurred during the registrant's most recent fiscal quarter (the registrant's fourth fiscal quarter in the case of an annual report) that has materially affected, or is reasonably likely to materially affect, the registrant's internal control over financial reporting; and
|
|
5.
|
The registrant’s other certifying officer and I have disclosed, based on our most recent evaluation of internal control over financial reporting, to the registrant's auditors and the Audit Committee of registrant's board of directors (or persons performing the equivalent functions):
|
| |
a)
|
All significant deficiencies and material weaknesses in the design or operation of internal control over financial reporting which are reasonably likely to adversely affect the registrant's ability to record, process, summarize and report financial information; and
|
| |
b)
|
Any fraud, whether or not material, that involves management or other employees who have a significant role in the registrant's internal control over financial reporting.
|
September 24, 2012
| |
By:
|
/s/ Mark L. Fidler
|
|
| |
|
Mark L. Fidler
|
|
| |
|
Vice President, Chief Financial Officer and Treasurer
(Principal Financial Officer and
Accounting Officer)
|
|
EXHIBIT 32
CERTIFICATION PURSUANT TO 18 U.S.C. SECTION 1350 (AS ADOPTED PURSUANT TO SECTION 906 OF THE
SARBANES-OXLEY ACT OF 2002)
In connection with the Annual Report of Ambient Corporation (the "Company") on Form 10-K/A for the year ended December 31, 2011 (the "Amended Report") filed with the Securities and Exchange Commission, we, John J. Joyce, President and Chief Executive Officer of the Company, and Mark L. Fidler, Vice President, Chief Financial Officer and Treasurer of the Company, certify, pursuant to 18 U.S.C. Section 1350, as adopted pursuant to Section 906 of the Sarbanes-Oxley Act of 2002, that to the best of our knowledge:
1. The Amended Report fully complies with the requirements of Section 13(a) or 15(d) of the Securities Exchange Act of 1934, as amended; and
2. The information contained in the Amended Report fairly presents, in all material respects, the financial condition and results of operations of the Company as of the dates and for the periods presented in the Amended Report.
Date: September 24, 2012
| |
|
|
|
| |
|
|
|
| |
By:
|
/s/ J ohn J. J oyce
|
|
| |
|
John J. Joyce
|
|
| |
|
President and Chief Executive Officer
|
|
| |
|
|
|
| |
By:
|
/s/ Mark L. Fidler
|
|
| |
|
Mark L. Fidler
|
|
| |
|
Vice President, Chief Financial Officer and Treasurer
|
|
A certification furnished pursuant to this Item will not be deemed “filed” for purposes of section 18 of the Exchange Act (15 U.S.C. 78r), or otherwise subject to the liability of that section. Such certification will not be deemed to be incorporated by reference into any filing under the Securities Act or the Exchange Act, except to the extent that the registrant specifically incorporates it by reference.
UNITED STATES
SECURITIES AND EXCHANGE COMMISSION
Washington, D.C. 20549
FORM 10-Q/A
(Amendment No. 1)
þ QUARTERLY REPORT PURSUANT TO SECTION 13 OR 15(d) OF THE SECURITIES EXCHANGE ACT OF 1934
For the quarterly period ended: March 31, 2012
or
¨ TRANSITION REPORT PURSUANT TO SECTION 13 OR 15(d) OF THE SECURITIES EXCHANGE ACT OF 1934
For the transition period from: _____________ to _____________
Commission File Number: 001-35259
AMBIENT CORPORATION
(Exact name of registrant as specified in its charter)
|
Delaware
|
|
98-0166007
|
|
(State or Other Jurisdiction of Incorporation)
|
|
(I.R.S. Employer Identification No.)
|
7 WELLS AVENUE, NEWTON, MASSACHUSETTS 02459
(Address of Principal Executive Office) (Zip Code)
617-332-0004
(Registrant’s telephone number, including area code)
N/A
(Former name, former address and former fiscal year, if changed since last report)
Indicate by check mark whether the registrant (1) has filed all reports required to be filed by Section 13 or 15(d) of the Securities Exchange Act of 1934 during the preceding 12 months (or for such shorter period that the registrant was required to file such reports), and (2) has been subject to such filing requirements for the past 90 days. Yes o No þ
Indicate by check mark whether the registrant has submitted electronically and posted on its corporate Web site, if any, every Interactive Data File required to be submitted and posted pursuant to Rule 405 of Regulation S-T (§232.405 of this chapter) during the preceding 12 months (or for such shorter period that the registrant was required to submit and post such files). Yes o No þ
Indicate by check mark whether the registrant is a large accelerated filer, an accelerated filer, a non-accelerated filer, or a smaller reporting company.
|
Large accelerated filer
|
o
|
Accelerated filer
|
o
|
|
Non-accelerated filer
|
o
|
Smaller reporting company
|
þ
|
Indicate by check mark whether the registrant is a shell company (as defined in Rule 12b-2 of the Act). Yes ¨ No þ
As of September 21, 2012, there were 16,663,720 shares of issuer's common stock, par value $0.001 per share, outstanding.
We are filing this Amended Quarterly Report on Form 10-Q/A (the “Amended Filing”) to our Quarterly Report on Form 10-Q for the quarter ended March 31, 2012, which was originally filed with the Securities and Exchange Commission (“SEC”) on May 14, 2012 (the “Original Filing”), to amend and restate our unaudited financial statements and related disclosures for the three months ended March 31, 2012 and March 31, 2011 as discussed below and in Note 2 to the accompanying restated financial statements and to amend certain other Items in the Original Filing as listed in “Items Amended in this Filing” below, as a result of the restatement of our financial statements.
Background of Restatement
In connection with the preparation of Form 10-Q for the quarter ended June 30, 2012, management of the Company concluded that certain previously filed financial statements did not properly account for embedded derivative features of certain historical debt and warrants issued by the Company, which are described in detail below.
Convertible Debt: Certain historical convertible notes (the “Notes”) issued by the Company were previously recorded at their discounted face value. The discounts were comprised of both beneficial conversion features associated with the Notes and the fair value of warrants issued in connection with the Notes. However, the Notes contained certain features, including anti-dilution price protection and others that, in accordance with ASC-815, Derivatives and Hedging (“ASC 815”), should have been bifurcated from the host contract and accounted for as a derivative instrument (the “Embedded Derivatives”). Such Embedded Derivatives are recorded as a separate liability at their fair value on the date of issuance, and as a corresponding discount to the Notes which is amortized as interest expense over the term of the Notes. Changes in the fair values of these instruments require adjustments to the amount of the liabilities recorded on the Company’s balance sheet, and the corresponding gain or loss is required to be recorded in the Company’s statement of operations and comprehensive income, as long as the Notes are outstanding.
Warrants: In connection with issuing the Notes, as well as in connection with other financing transactions, the Company issued warrants to purchase common stock (collectively, the “Warrants”). The Company had previously classified the value of the Warrants as equity. After further review, the Company determined that these instruments should have been classified as liabilities in accordance with ASC 815, due primarily to an anti-dilution price protection feature. Changes in the fair values of these instruments require adjustments to the amount of the liabilities recorded on the Company’s balance sheet, and the corresponding gain or loss is required to be recorded in the Company’s statement of operations and comprehensive income .
Stock-based Compensation: The Company had previously used volatility assumptions based on the historical volatility of the price of the Company's common stock, which, based on the historical trading activity of the stock, resulted in inflated price volatilities that were not necessarily indicative of the expected volatility and were substantially higher than other peer-industry companies. Upon further review of the volatility assumptions, the Company determined that it was more appropriate to use an expected volatility based on the volatilities of its industry peer group. Such an approach was used to determine appropriate volatility assumptions for valuation purposes of the Embedded Derivatives and Warrants. As a result, assumed volatilities are lower than those previously used, which reduces stock-based compensation expense.
In addition to the adjustments listed above, the Company recorded immaterial adjustments to revenue to account for the deferral of maintenance revenue arising from the initial period of free maintenance provided upon shipment of our communication nodes.
All of the necessary adjustments relating to the Notes and Warrants are non-cash in nature and do not impact the Company’s total cash flows from operating, investing and financing activities. The adjustments are primarily related to complex accounting requirements of certain characteristics of the Notes and Warrants that require the recording of debt discounts and related amortization, mark-to-market adjustments in the fair value of Warrants and Embedded Derivatives and gains or losses associated with the extinguishment of debt under certain circumstances.
As a result of these cumulative adjustments, as of March 31, 2012, accumulated deficit increased from $139.0 million to $221.6 million and additional paid in capital increased from $156.6 million to $238.1 million. At March 31, 2012, the net impact of the cumulative adjustments decreased overall stockholders’ equity by approximately $1.1 million. Since all of the Notes were either paid off or converted by early 2010 and many of the Warrants were either exercised or expired by the end of 2011, the estimated impact of accounting for these instruments in 2012 and for future periods is expected to be immaterial.
Detailed discussion of the impact on our financial statements and related accounting associated with the Notes and Warrants are contained in the financial statements contained in Part I of this Amended Filing.
Internal Control Consideration
Our management has determined that there was a control deficiency in our internal control over financial reporting that constitutes a material weakness, as discussed in Part I — Item 4 of this Amended Filing. A material weakness is a deficiency, or combination of control deficiencies, in internal control over financial reporting, such that there is a reasonable possibility that a material misstatement of the annual or interim consolidated financial statements will not be prevented or detected on a timely basis. For a discussion of management’s consideration of our disclosure controls and procedures and the material weakness identified, see Part I — Item 4 included in this Amended Filing.
Items Amended in This Filing
For the convenience of the reader, this Amended Filing sets forth the Original Filing, as modified and superseded where necessary to reflect the restatement. The following items have been amended as a result of, and to reflect, the restatement:
|
●
|
Part I – Item 1. Restated Financial Statements;
|
|
●
|
Part I – Item 2. Restated Management’s Discussion and Analysis of Financial Condition and Results of Operations; and
|
|
●
|
Part I – Item 4. Controls and Procedures- Restated
|
In accordance with applicable SEC rules, this Amended Filing includes new certifications required by Rule 13a-14 under the Securities and Exchange Act of 1934 (“Exchange Act”) from our Chief Executive Officer and Chief Financial Officer dated as of the date of filing of this Amended Filing.
Table of Contents
| |
|
|
PAGE
|
|
| PART I – FINANCIAL INFORMATION |
| |
|
|
|
|
|
|
Item 1.
|
Restated Financial Statements
|
|
|
4 |
|
| |
|
|
|
|
|
| |
Balance Sheets as of March 31, 2012 (Unaudited) and December 31, 2011
|
|
|
4 |
|
| |
|
|
|
|
|
| |
Statements of Operations and Comprehensive Income for the three months ended March 31, 2012 and 2011 (Unaudited)
|
|
|
5 |
|
| |
|
|
|
|
|
| |
Statements of Cash Flows for the three months ended March 31, 2012 and 2011 (Unaudited)
|
|
|
6 |
|
| |
|
|
|
|
|
| |
Notes to the Unaudited Restated Financial Statements
|
|
|
7 |
|
| |
|
|
|
|
|
|
Item 2.
|
Restated Management's Discussion and Analysis of Financial Condition and Results of Operation
|
|
|
15 |
|
| |
|
|
|
|
|
|
Item 4.
|
Controls and Procedures - Restated
|
|
|
18 |
|
| |
|
|
|
|
|
| PART II – OTHER INFORMATION |
| |
|
|
|
|
|
| Item 2. |
Unregistered Sales of Equity Securities and Use of Proceeds
|
|
|
19 |
|
| |
|
|
|
|
|
|
Item 6.
|
Exhibits
|
|
|
19 |
|
| |
|
|
|
|
|
|
SIGNATURES
|
|
|
20 |
|
FORWARD LOOKING STATEMENTS
The following discussion should be read in conjunction with the financial statements and related notes contained elsewhere in this quarterly report on Form 10-Q. We make forward-looking statements in this report, in other materials we file with the Securities and Exchange Commission (the “SEC”) or that we otherwise release to the public, and on our website. In addition, our senior management might make forward-looking statements orally to analysts, investors, the media, and others. These statements are “forward-looking statements” within the meaning of Section 27A of the Securities Act of 1933, as amended, and 21E of the Securities Exchange Act of 1934, as amended. Statements concerning our future operations, prospects, strategies, financial condition, future economic performance (including growth and earnings) and demand for our products and services, and other statements of our plans, beliefs, or expectations, including the statements contained in Item 2, “Management’s Discussion and Analysis of Financial Condition and Results of Operations” regarding our future plans, strategies and expectations are forward-looking statements. In some cases these statements are identifiable through the use of words such as “anticipate,” “believe,” “estimate,” “predict,” “expect,” “intend,” “plan,” “project,” “target,” “continue,” “can,” “could,” “may,” “should,” “will,” “would,” and similar expressions. You are cautioned not to place undue reliance on these forward-looking statements because these forward-looking statements we make are not guarantees of future performance and are subject to various assumptions, risks, and other factors that could cause actual results to differ materially from those suggested by these forward-looking statements. Thus, our ability to predict results or the actual effect of our future plans or strategies is inherently uncertain. Factors which could have a material adverse effect on our operations and future prospects include, but are not limited to, our ability to retain and attract customers, particularly in light of our dependence on a single customer for substantially all of our revenue; our expectations regarding our expenses and revenue, including our expectations that our research and development expenses and selling, general and administrative expenses may increase in absolute dollars; our material weakness in internal control over financial reporting; anticipated trends and challenges in our business and the markets in which we operate, including the market for smart grid technologies; our expectations regarding competition as more and larger companies enter our markets and as existing competitors improve or expand their product offerings; our plans for future products and enhancements of existing products; our anticipated cash needs and our estimates regarding our capital requirements; and our anticipated growth strategies. These risks and uncertainties, together with the other risks described from time to time in reports and documents that we file with the SEC, should be considered in evaluating forward-looking statements. Although we believe that the expectations reflected in the forward-looking statements are reasonable, we cannot guarantee future results, performance or achievements. Indeed, it is likely that some of our assumptions will prove to be incorrect. Our actual results and financial position will vary from those projected or implied in the forward-looking statements and the variances may be material. Moreover, we do not assume the responsibility for the accuracy and completeness of these forward-looking statements. We expressly disclaim any obligation to update or revise any forward-looking statements, whether as a result of new information, future events, or otherwise, except as required by law.
AMBIENT CORPORATION
BALANCE SHEETS
(in thousands, except share and per share data)
| |
|
March 31,
|
|
|
December 31,
|
|
| |
|
2012
|
|
|
2011
|
|
| |
|
(Restated)
|
|
|
(Restated)
|
|
|
Assets
|
|
(unaudited)
|
|
|
|
|
|
Current assets:
|
|
|
|
|
|
|
|
Cash and cash equivalents
|
|
$ |
18,708 |
|
|
$ |
17,965 |
|
|
Accounts receivable
|
|
|
1,543 |
|
|
|
284 |
|
|
Inventory
|
|
|
663 |
|
|
|
1,460 |
|
|
Prepaid expenses and other current assets
|
|
|
400 |
|
|
|
527 |
|
|
Total current assets
|
|
|
21,314 |
|
|
|
20,236 |
|
| |
|
|
|
|
|
|
|
|
|
Property and equipment, net
|
|
|
1,198 |
|
|
|
1,249 |
|
|
Deferred finance costs
|
|
|
- |
|
|
|
389 |
|
| |
|
|
|
|
|
|
|
|
|
Total assets
|
|
$ |
22,512 |
|
|
$ |
21,874 |
|
| |
|
|
|
|
|
|
|
|
|
Liabilities and Stockholders' Equity
|
|
|
|
|
|
|
|
|
|
Current liabilities:
|
|
|
|
|
|
|
|
|
|
Accounts payable
|
|
$ |
3,283 |
|
|
$ |
3,920 |
|
|
Accrued expenses and other current liabilities
|
|
|
1,098 |
|
|
|
714 |
|
|
Deferred revenue
|
|
|
576 |
|
|
|
453 |
|
|
Accrued warranty
|
|
|
115 |
|
|
|
115 |
|
|
Income taxes payable
|
|
|
- |
|
|
|
41 |
|
|
Warrant liabilities, current portion
|
|
|
781 |
|
|
|
671 |
|
|
Total current liabilities
|
|
|
5,853 |
|
|
|
5,914 |
|
|
Non-current liabilities
|
|
|
|
|
|
|
|
|
|
Deferred rent
|
|
|
75 |
|
|
|
99 |
|
| |
|
|
|
|
|
|
|
|
|
Total liabilities
|
|
|
5,928 |
|
|
|
6,013 |
|
| |
|
|
|
|
|
|
|
|
| |
|
|
|
|
|
|
|
|
|
Stockholders' Equity:
|
|
|
|
|
|
|
|
|
|
Common stock, $0.001 par value;
|
|
|
|
|
|
|
|
|
|
100,000,000 shares authorized;
|
|
|
|
|
|
|
|
|
|
16,607,384 and 16,567,384 shares issued; and
|
|
|
|
|
|
|
|
|
|
16,607,384 and 16,557,384 shares outstanding, respectively
|
|
|
17 |
|
|
|
17 |
|
|
Additional paid-in capital
|
|
|
238,128 |
|
|
|
237,421 |
|
|
Accumulated deficit
|
|
|
(221,561 |
) |
|
|
(221,377 |
) |
|
Less: treasury stock; 0 and 10,000 shares at cost
|
|
|
- |
|
|
|
(200 |
) |
|
Total stockholders' equity
|
|
|
16,584 |
|
|
|
15,861 |
|
| |
|
|
|
|
|
|
|
|
|
Total liabilities and stockholders' equity
|
|
$ |
22,512 |
|
|
$ |
21,874 |
|
The accompanying notes are an integral part of these restated financial statements.
AMBIENT CORPORATION
STATEMENTS OF OPERATIONS AND COMPREHENSIVE INCOME
(UNAUDITED)
(in thousands, except per share data)
| |
|
March 31,
|
|
|
March 31,
|
|
| |
|
2012
|
|
|
2011
|
|
| |
|
(Restated)
|
|
|
(Restated)
|
|
| |
|
|
|
|
|
|
|
Total revenue
|
|
$ |
13,275 |
|
|
$ |
11,948 |
|
|
Cost of goods sold
|
|
|
7,482 |
|
|
|
6,801 |
|
|
Gross profit
|
|
|
5,793 |
|
|
|
5,147 |
|
| |
|
|
|
|
|
|
|
|
|
Operating expenses:
|
|
|
|
|
|
|
|
|
|
Research and development expenses
|
|
|
3,346 |
|
|
|
1,999 |
|
|
Selling, general and administrative expenses
|
|
|
2,128 |
|
|
|
1,836 |
|
|
Write-off of deferred financing costs
|
|
|
389 |
|
|
|
- |
|
|
Total operating expenses
|
|
|
5,863 |
|
|
|
3,835 |
|
| |
|
|
|
|
|
|
|
|
|
Operating (loss) income
|
|
|
(70 |
) |
|
|
1,312 |
|
| |
|
|
|
|
|
|
|
|
|
Interest income, net
|
|
|
2 |
|
|
|
6 |
|
|
Mark-to-market adjustment of warrant liability
|
|
|
(189 |
) |
|
|
1,050 |
|
|
Other income
|
|
|
73 |
|
|
|
- |
|
|
Total other (expense) income
|
|
|
(114 |
) |
|
|
1,056 |
|
| |
|
|
|
|
|
|
|
|
|
(Loss) income before taxes
|
|
|
(184 |
) |
|
|
2,368 |
|
| |
|
|
|
|
|
|
|
|
|
Provision for income taxes
|
|
|
- |
|
|
|
28 |
|
| |
|
|
|
|
|
|
|
|
|
Net (loss) income and comprehensive (loss) income
|
|
$ |
(184 |
) |
|
$ |
2,340 |
|
| |
|
|
|
|
|
|
|
|
|
Net (loss) income per share (basic)
|
|
$ |
(0.01 |
) |
|
$ |
0.14 |
|
|
Net (loss) income per share (diluted)
|
|
$ |
(0.01 |
) |
|
$ |
0.14 |
|
| |
|
|
|
|
|
|
|
|
|
Weighted average shares used in computing basic net (loss) income per share
|
|
|
16,570 |
|
|
|
16,486 |
|
|
Weighted average shares used in computing diluted net (loss) income per share
|
|
|
16,570 |
|
|
|
16,946 |
|
The accompanying notes are an integral part of these restated financial statements.
AMBIENT CORPORATION
STATEMENTS OF CASH FLOWS
(UNAUDITED)
(in thousands)
| |
|
March 31,
|
|
|
March 31,
|
|
| |
|
2012
|
|
|
2011
|
|
| |
|
(Restated)
|
|
|
|
|
| |
|
|
|
|
|
|
|
CASH FLOWS FROM OPERATING ACTIVITIES
|
|
|
|
|
|
|
|
Net (loss) income
|
|
$ |
(184 |
) |
|
$ |
2,340 |
|
|
Adjustments to reconcile net (loss) income to net cash provided by operating activities:
|
|
|
|
|
|
|
|
|
|
Depreciation and amortization
|
|
|
117 |
|
|
|
97 |
|
|
Stock-based compensation
|
|
|
653 |
|
|
|
388 |
|
|
Write-off of deferred finance costs
|
|
|
389 |
|
|
|
- |
|
|
Mark-to-market adjustment of warrant liability
|
|
|
189 |
|
|
|
(1,050 |
) |
|
Changes in operating assets and liabilities:
|
|
|
|
|
|
|
|
|
|
Accounts receivable
|
|
|
(1,259 |
) |
|
|
142 |
|
|
Inventory
|
|
|
797 |
|
|
|
(131 |
) |
|
Prepaid expenses and other current assets
|
|
|
127 |
|
|
|
10 |
|
|
Accounts payable
|
|
|
(637 |
) |
|
|
(5 |
) |
|
Deferred rent
|
|
|
(24 |
) |
|
|
(21 |
) |
|
Accrued warranty
|
|
|
- |
|
|
|
- |
|
|
Accrued expenses and other current liabilities
|
|
|
384 |
|
|
|
107 |
|
|
Income taxes payable
|
|
|
(41 |
) |
|
|
28 |
|
|
Deferred revenue
|
|
|
123 |
|
|
|
162 |
|
|
Net cash provided by operating activities
|
|
|
634 |
|
|
|
2,067 |
|
| |
|
|
|
|
|
|
|
|
|
CASH FLOWS FROM INVESTING ACTIVITIES
|
|
|
|
|
|
|
|
|
|
Purchases of property and equipment
|
|
|
(66 |
) |
|
|
(354 |
) |
|
Net cash used in investing activities
|
|
|
(66 |
) |
|
|
(354 |
) |
| |
|
|
|
|
|
|
|
|
|
CASH FLOWS FROM FINANCING ACTIVITES
|
|
|
|
|
|
|
|
|
|
Proceeds from exercise of warrants
|
|
|
175 |
|
|
|
16 |
|
|
Proceeds from exercise of stock options
|
|
|
- |
|
|
|
16 |
|
|
Payments of capitalized lease obligations
|
|
|
- |
|
|
|
(3 |
) |
|
Net cash provided by financing activities
|
|
|
175 |
|
|
|
29 |
|
| |
|
|
|
|
|
|
|
|
|
INCREASE IN CASH AND CASH EQUIVALENTS
|
|
|
743 |
|
|
|
1,742 |
|
| |
|
|
|
|
|
|
|
|
|
CASH AND CASH EQUIVALENTS - BEGINNING OF PERIOD
|
|
|
17,965 |
|
|
|
6,987 |
|
| |
|
|
|
|
|
|
|
|
|
CASH AND CASH EQUIVALENTS - END OF PERIOD
|
|
$ |
18,708 |
|
|
$ |
8,729 |
|
| |
|
|
|
|
|
|
|
|
|
Supplemental disclosures of cash flow information:
|
|
|
|
|
|
|
|
|
|
Interest paid
|
|
$ |
- |
|
|
$ |
1 |
|
|
Income taxes paid
|
|
$ |
54 |
|
|
$ |
- |
|
The accompanying notes are an integral part of these restated financial statements.
AMBIENT CORPORATION
NOTES TO THE UNAUDITED RESTATED CONSOLIDATED FINANCIAL STATEMENTS
NOTE 1 - BASIS OF PRESENTATION
The accompanying unaudited financial statements of Ambient Corporation (the “Company,” “we” or “our”) have been prepared in accordance with accounting principles generally accepted in the United States of America (“GAAP”) for interim financial information and with Article 8-03 of Regulation S-X. Accordingly, they do not include all of the information and notes required by GAAP for complete financial statements. In the opinion of management, all adjustments (consisting of normal recurring accruals) considered necessary for a fair statement have been included. Operating results for the three months ended March 31, 2012 are not necessarily indicative of the results that may be expected for the full year ending December 31, 2012.
These unaudited financial statements should be read in conjunction with the audited financial statements and notes thereto included in our Amendment No. 1 to Annual Report on Form 10-K/A for the year ended December 31, 2011 that is being concurrently filed with the Securities and Exchange Commission.
We are a leading provider of a smart grid communications platform that enables utilities to effectively deploy, integrate and communicate with multiple smart grid applications within the electric power distribution grid. The Ambient Smart Grid® communications platform, which includes hardware, software and firmware, provides the network platform to effectively manage the distribution network and individual smart grid applications. Our innovative communications platform enables utilities to deploy and integrate multiple smart grid applications and technologies, in parallel on a single communications infrastructure, supporting smart metering, distribution automation, distribution management, demand response, distributed generation and more.
Our long-standing relationship with Duke Energy, which we believe has one of the most forward-looking smart grid investment initiatives in North America, has led to rapid growth in our business. We entered into a long-term agreement in September 2009 with Duke Energy, currently our sole customer, to supply them with our Ambient Smart Grid® communications nodes and license our AmbientNMS® through 2015.
On July 18, 2011, we implemented a reverse stock split of our issued and outstanding shares of common stock at a ratio of 1-for 100 shares (the “Reverse Split”). The Reverse Split became effective on July 18, 2011 and has been reflected in this Quarterly Report on Form 10-Q.
NOTE 2 – RESTATEMENT OF FINANCIAL STATEMENTS
Background of Restatement
In connection with the preparation of Form 10-Q for the quarter ended June 30, 2012, management of the Company concluded that certain previously filed financial statements did not properly account for embedded derivative features of certain historical debt and warrants issued by the Company, which are described in detail below.
Convertible Debt: Certain historical convertible notes (the “Notes”) issued by the Company were previously recorded at their discounted face value. The discounts were comprised of both beneficial conversion features associated with the Notes and the fair value of warrants issued in connection with the Notes. However, the Notes contained certain features, including anti-dilution price protection and others that, in accordance with ASC-815, Derivatives and Hedging (“ASC 815”), should have been bifurcated from the host contract and accounted for as a derivative instrument (the “Embedded Derivatives”). Such Embedded Derivatives are recorded as a separate liability at their fair value on the date of issuance, and as a corresponding discount to the Notes which is amortized as interest expense over the term of the Notes. Changes in the fair values of these instruments require adjustments to the amount of the liabilities recorded on the Company’s balance sheet, and the corresponding gain or loss is required to be recorded in the Company’s statement of operations and comprehensive income, as long as the Notes are outstanding.
Warrants: In connection with issuing the Notes, as well as in connection with other financing transactions, the Company issued warrants to purchase common stock (collectively, the “Warrants”). The Company had previously classified the value of the Warrants as equity. After further review, the Company determined that these instruments should have been classified as liabilities in accordance with ASC 815, due primarily to an anti-dilution price protection feature. Changes in the fair values of these instruments require adjustments to the amount of the liabilities recorded on the Company’s balance sheet, and the corresponding gain or loss is required to be recorded in the Company’s statement of operations and comprehensive income.
Stock-based Compensation: The Company had previously used volatility assumptions based on the historical volatility of the price of the Company's common stock, which, based on the historical trading activity of the stock, resulted in inflated price volatilities that were not necessarily indicative of the expected volatility and were substantially higher than other peer-industry companies. Upon further review of the volatility assumptions, the Company determined that it was more appropriate to use an expected volatility based on the volatilities of its industry peer group. Such an approach was used to determine appropriate volatility assumptions for valuation purposes of the Embedded Derivatives and Warrants. As a result, assumed volatilities are lower than those previously used, which reduces stock-based compensation expense.
In addition to the adjustments listed above, the Company recorded immaterial adjustments to revenue to account for the deferral of maintenance revenue arising from the initial period of free maintenance provided upon shipment of our communication nodes.
All of the necessary adjustments relating to the Notes and Warrants are non-cash in nature and do not impact the Company’s total cash flows from operating, investing and financing activities. The adjustments are primarily related to complex accounting requirements of certain characteristics of the Notes and Warrants that require the recording of debt discounts and related amortization, mark-to-market adjustments in the fair value of Warrants and Embedded Derivatives and gains or losses associated with the extinguishment of debt under certain circumstances.
The following table details the impact of the restatements on the Company’s balance sheets as of March 31, 2012 and December 31, 2011, respectively:
| |
|
March 31, 2012
(unaudited)
|
|
|
December 31, 2011
|
|
| (in thousands) |
|
As Reported
|
|
|
Adjustments
|
|
|
Restated
|
|
|
As Reported
|
|
|
Adjustments
|
|
|
Restated
|
|
| |
|
|
|
|
|
|
|
|
|
|
|
|
|
|
|
|
|
|
|
ASSETS
|
|
|
|
|
|
|
|
|
|
|
|
|
|
|
|
|
|
|
|
CURRENT ASSETS
|
|
|
|
|
|
|
|
|
|
|
|
|
|
|
|
|
|
|
|
Cash and cash equivalents
|
|
$ |
18,708 |
|
|
$ |
- |
|
|
$ |
18,708 |
|
|
$ |
17,965 |
|
|
|
- |
|
|
|
17,965 |
|
|
Accounts receivable
|
|
|
1,543 |
|
|
|
- |
|
|
|
1,543 |
|
|
|
284 |
|
|
|
- |
|
|
|
284 |
|
|
Inventory
|
|
|
663 |
|
|
|
- |
|
|
|
663 |
|
|
|
1,460 |
|
|
|
- |
|
|
|
1,460 |
|
|
Prepaid expenses and other current assets
|
|
|
400 |
|
|
|
- |
|
|
|
400 |
|
|
|
527 |
|
|
|
- |
|
|
|
527 |
|
| |
|
|
|
|
|
|
|
|
|
|
|
|
|
|
|
|
|
|
|
|
|
|
|
|
|
Total current assets
|
|
|
21,314 |
|
|
|
- |
|
|
|
21,314 |
|
|
|
20,236 |
|
|
|
- |
|
|
|
20,236 |
|
| |
|
|
|
|
|
|
|
|
|
|
|
|
|
|
|
|
|
|
|
|
|
|
|
|
|
Property and equipment, net
|
|
|
1,198 |
|
|
|
- |
|
|
|
1,198 |
|
|
|
1,249 |
|
|
|
- |
|
|
|
1,249 |
|
|
Deferred financing costs, net
|
|
|
- |
|
|
|
- |
|
|
|
- |
|
|
|
389 |
|
|
|
- |
|
|
|
389 |
|
| |
|
|
|
|
|
|
|
|
|
|
|
|
|
|
|
|
|
|
|
|
|
|
|
|
|
Total assets
|
|
$ |
22,512 |
|
|
$ |
- |
|
|
$ |
22,512 |
|
|
$ |
21,874 |
|
|
$ |
- |
|
|
$ |
21,874 |
|
| |
|
|
|
|
|
|
|
|
|
|
|
|
|
|
|
|
|
|
|
|
|
|
|
|
|
LIABILITIES AND STOCKHOLDERS' EQUITY
|
|
|
|
|
|
|
|
|
|
|
|
|
|
|
|
|
|
|
|
|
|
|
|
|
|
CURRENT LIABILITIES
|
|
|
|
|
|
|
|
|
|
|
|
|
|
|
|
|
|
|
|
|
|
|
|
|
|
Accounts payable
|
|
$ |
3,283 |
|
|
$ |
- |
|
|
$ |
3,283 |
|
|
$ |
3,920 |
|
|
$ |
- |
|
|
$ |
3,920 |
|
|
Accrued expenses and other current
liabilities
|
|
|
1,098 |
|
|
|
- |
|
|
|
1,098 |
|
|
|
714 |
|
|
|
- |
|
|
|
714 |
|
|
Deferred revenue
|
|
|
268 |
|
|
|
308 |
|
|
|
576 |
|
|
|
119 |
|
|
|
334 |
|
|
|
453 |
|
|
Accrued warranty
|
|
|
115 |
|
|
|
- |
|
|
|
115 |
|
|
|
115 |
|
|
|
- |
|
|
|
115 |
|
|
Income taxes payable
|
|
|
- |
|
|
|
- |
|
|
|
- |
|
|
|
41 |
|
|
|
- |
|
|
|
41 |
|
|
Warrant liability, current
|
|
|
- |
|
|
|
781 |
|
|
|
781 |
|
|
|
- |
|
|
|
671 |
|
|
|
671 |
|
| |
|
|
|
|
|
|
|
|
|
|
|
|
|
|
|
|
|
|
|
|
|
|
|
|
|
Total current liabilities
|
|
|
4,764 |
|
|
|
1,089 |
|
|
|
5,853 |
|
|
|
4,909 |
|
|
|
1,005 |
|
|
|
5,914 |
|
| |
|
|
|
|
|
|
|
|
|
|
|
|
|
|
|
|
|
|
|
|
|
|
|
|
|
NON-CURRENT LIABILITIES
|
|
|
|
|
|
|
|
|
|
|
|
|
|
|
|
|
|
|
|
|
|
|
|
|
|
Deferred rent
|
|
|
75 |
|
|
|
- |
|
|
|
75 |
|
|
|
99 |
|
|
|
- |
|
|
|
99 |
|
| |
|
|
|
|
|
|
|
|
|
|
|
|
|
|
|
|
|
|
|
|
|
|
|
|
|
Total liabilities
|
|
|
4,839 |
|
|
|
1,089 |
|
|
|
5,928 |
|
|
|
5,008 |
|
|
|
1,005 |
|
|
|
6,013 |
|
| |
|
|
|
|
|
|
|
|
|
|
|
|
|
|
|
|
|
|
|
|
|
|
|
|
|
COMMITMENTS AND CONTINGENCIES
|
|
|
|
|
|
|
|
|
|
|
|
|
|
|
|
|
|
|
|
|
|
|
|
|
| |
|
|
|
|
|
|
|
|
|
|
|
|
|
|
|
|
|
|
|
|
|
|
|
|
|
STOCKHOLDERS' EQUITY
|
|
|
|
|
|
|
|
|
|
|
|
|
|
|
|
|
|
|
|
|
|
|
|
|
|
Common stock, $.001 par value;
|
|
|
|
|
|
|
|
|
|
|
|
|
|
|
|
|
|
|
|
|
|
|
|
|
|
100,000,000 shares authorized;
|
|
|
|
|
|
|
|
|
|
|
|
|
|
|
|
|
|
|
|
|
|
|
|
|
|
16,607,384 and 16,567,384 shares issued;
|
|
|
|
|
|
|
|
|
|
|
|
|
|
|
|
|
|
|
|
|
|
|
|
|
|
and 16,607,384 and 16,557,384 shares
outstanding, respectively
|
|
|
17 |
|
|
|
- |
|
|
|
17 |
|
|
|
17 |
|
|
|
- |
|
|
|
17 |
|
|
Additional paid-in capital
|
|
|
156,647 |
|
|
|
81,481 |
|
|
|
238,128 |
|
|
|
155,707 |
|
|
|
81,714 |
|
|
|
237,421 |
|
|
Accumulated deficit
|
|
|
(138,991 |
) |
|
|
(82,570 |
) |
|
|
(221,561 |
) |
|
|
(138,658 |
) |
|
|
(82,719 |
) |
|
|
(221,377 |
) |
|
Less: treasury stock; 0 and 10,000 shares
at cost
|
|
|
- |
|
|
|
- |
|
|
|
- |
|
|
|
(200 |
) |
|
|
- |
|
|
|
(200 |
) |
| |
|
|
|
|
|
|
|
|
|
|
|
|
|
|
|
|
|
|
|
|
|
|
|
|
|
Total stockholders' equity
|
|
|
17,673 |
|
|
|
(1,089 |
) |
|
|
16,584 |
|
|
|
16,866 |
|
|
|
(1,005 |
) |
|
|
15,861 |
|
| |
|
|
|
|
|
|
|
|
|
|
|
|
|
|
|
|
|
|
|
|
|
|
|
|
|
Total liabilities and stockholders'
equity
|
|
$ |
22,512 |
|
|
$ |
- |
|
|
$ |
22,512 |
|
|
$ |
21,874 |
|
|
$ |
- |
|
|
$ |
21,874 |
|
The following table details the impact of the restatements on the Company’s statements of operations and comprehensive income for the three months ended March 31, 2012 and March 31, 2011, respectively:
| |
|
Three Months Ended March 31, 2012
(unaudited)
|
|
|
Three Months Ended March 31, 2011
(unaudited)
|
|
| (in thousands, except per share data) |
|
As Reported
|
|
|
Adjustment
|
|
|
Restated
|
|
|
As Reported
|
|
|
Adjustment
|
|
|
Restated
|
|
| |
|
|
|
|
|
|
|
|
|
|
|
|
|
|
|
|
|
|
|
Total revenue
|
|
$ |
13,249 |
|
|
$ |
26 |
|
|
$ |
13,275 |
|
|
$ |
12,006 |
|
|
$ |
(58 |
) |
|
$ |
11,948 |
|
|
Cost of goods sold
|
|
|
7,519 |
|
|
|
(37 |
) |
|
|
7,482 |
|
|
|
6,801 |
|
|
|
- |
|
|
|
6,801 |
|
|
Gross profit
|
|
|
5,730 |
|
|
|
63 |
|
|
|
5,793 |
|
|
|
5,205 |
|
|
|
(58 |
) |
|
|
5,147 |
|
| |
|
|
|
|
|
|
|
|
|
|
|
|
|
|
|
|
|
|
|
|
|
|
|
|
|
Operating expenses:
|
|
|
|
|
|
|
|
|
|
|
|
|
|
|
|
|
|
|
|
|
|
|
|
|
|
Research and development expenses
|
|
|
3,455 |
|
|
|
(109 |
) |
|
|
3,346 |
|
|
|
2,088 |
|
|
|
(89 |
) |
|
|
1,999 |
|
|
Selling, general and administrative
expenses
|
|
|
2,294 |
|
|
|
(166 |
) |
|
|
2,128 |
|
|
|
2,011 |
|
|
|
(175 |
) |
|
|
1,836 |
|
|
Write-off of deferred financing expenses
|
|
|
389 |
|
|
|
- |
|
|
|
389 |
|
|
|
- |
|
|
|
- |
|
|
|
- |
|
| |
|
|
|
|
|
|
|
|
|
|
|
|
|
|
|
|
|
|
|
|
|
|
|
|
|
Total operating expenses
|
|
|
6,138 |
|
|
|
(275 |
) |
|
|
5,863 |
|
|
|
4,099 |
|
|
|
(264 |
) |
|
|
3,835 |
|
| |
|
|
|
|
|
|
|
|
|
|
|
|
|
|
|
|
|
|
|
|
|
|
|
|
|
Operating (loss) income
|
|
|
(408 |
) |
|
|
338 |
|
|
|
(70 |
) |
|
|
1,106 |
|
|
|
206 |
|
|
|
1,312 |
|
| |
|
|
|
|
|
|
|
|
|
|
|
|
|
|
|
|
|
|
|
|
|
|
|
|
|
Interest income, net
|
|
|
2 |
|
|
|
- |
|
|
|
2 |
|
|
|
6 |
|
|
|
- |
|
|
|
6 |
|
|
Mark-to-market adjustment of warrant liability
|
|
|
- |
|
|
|
(189 |
) |
|
|
(189 |
) |
|
|
- |
|
|
|
1,050 |
|
|
|
1,050 |
|
|
Other income, net
|
|
|
73 |
|
|
|
- |
|
|
|
73 |
|
|
|
- |
|
|
|
- |
|
|
|
- |
|
|
Total other income (loss)
|
|
|
75 |
|
|
|
(189 |
) |
|
|
(114 |
) |
|
|
6 |
|
|
|
1,050 |
|
|
|
1,056 |
|
| |
|
|
|
|
|
|
|
|
|
|
|
|
|
|
|
|
|
|
|
|
|
|
|
|
|
(Loss) income before taxes
|
|
|
(333 |
) |
|
|
149 |
|
|
|
(184 |
) |
|
|
1,112 |
|
|
|
1,256 |
|
|
|
2,368 |
|
| |
|
|
|
|
|
|
|
|
|
|
|
|
|
|
|
|
|
|
|
|
|
|
|
|
|
Provision for income taxes
|
|
|
- |
|
|
|
- |
|
|
|
- |
|
|
|
28 |
|
|
|
- |
|
|
|
28 |
|
| |
|
|
|
|
|
|
|
|
|
|
|
|
|
|
|
|
|
|
|
|
|
|
|
|
|
Net (loss) income and comprehensive (loss)
income
|
|
$ |
(333 |
) |
|
$ |
149 |
|
|
$ |
(184 |
) |
|
$ |
1,084 |
|
|
$ |
1,256 |
|
|
$ |
2,340 |
|
| |
|
|
|
|
|
|
|
|
|
|
|
|
|
|
|
|
|
|
|
|
|
|
|
|
|
Net (loss) income per share (basic)
|
|
$ |
(0.02 |
) |
|
$ |
0.01 |
|
|
$ |
(0.01 |
) |
|
$ |
0.07 |
|
|
$ |
0.08 |
|
|
$ |
0.14 |
|
|
Net (loss) income per share (diluted)
|
|
$ |
(0.02 |
) |
|
$ |
0.01 |
|
|
$ |
(0.01 |
) |
|
$ |
0.06 |
|
|
$ |
0.07 |
|
|
$ |
0.14 |
|
| |
|
|
|
|
|
|
|
|
|
|
|
|
|
|
|
|
|
|
|
|
|
|
|
|
|
Weighted average shares used in computing
basic net (loss) income per share
|
|
|
16,570 |
|
|
|
16,570 |
|
|
|
16,570 |
|
|
|
16,486 |
|
|
|
16,486 |
|
|
|
16,486 |
|
|
Weighted average shares used in computing
diluted net (loss) income per share
|
|
|
16,570 |
|
|
|
16,570 |
|
|
|
16,570 |
|
|
|
16,946 |
|
|
|
16,946 |
|
|
|
16,946 |
|
The following table details the impact of the restatements on the Company’s statements of cash flows for the three months ended March 31, 2012 and March 31, 2011, respectively:
| |
|
Three Months Ended March 31, 2012
(unaudited)
|
|
|
Three Months Ended March 31, 2011
(unaudited)
|
|
| (in thousands) |
|
As Reported
|
|
|
Adjustments
|
|
|
Restated
|
|
|
As Reported
|
|
|
Adjustments
|
|
|
Restated
|
|
| |
|
|
|
|
|
|
|
|
|
|
|
|
|
|
|
|
|
|
|
CASH FLOWS FROM OPERATING ACTIVITIES
|
|
|
|
|
|
|
|
|
|
|
|
|
|
|
|
|
|
|
|
Net (loss) income
|
|
$ |
(333 |
) |
|
$ |
149 |
|
|
$ |
(184 |
) |
|
$ |
1,084 |
|
|
$ |
1,256 |
|
|
$ |
2,340 |
|
|
Adjustments to reconcile net (loss) income
to net cash provided by operating activities:
|
|
|
|
|
|
|
|
|
|
|
|
|
|
|
|
|
|
|
|
|
|
|
|
|
| Depreciation and amortization |
|
|
117 |
|
|
|
- |
|
|
|
117 |
|
|
|
97 |
|
|
|
- |
|
|
|
97 |
|
|
Write-off of deferred finance charges
|
|
|
389 |
|
|
|
- |
|
|
|
389 |
|
|
|
- |
|
|
|
- |
|
|
|
- |
|
|
Stock-based compensation
|
|
|
965 |
|
|
|
(312 |
) |
|
|
653 |
|
|
|
652 |
|
|
|
(264 |
) |
|
|
388 |
|
|
Mark-to-market adjustment of warrant
liability
|
|
|
- |
|
|
|
189 |
|
|
|
189 |
|
|
|
- |
|
|
|
(1,050 |
) |
|
|
(1,050 |
) |
|
Changes in operating assets and liabilities:
|
|
|
|
|
|
|
|
|
|
|
|
|
|
|
|
|
|
|
|
|
|
|
|
|
|
Accounts receivable
|
|
|
(1,259 |
) |
|
|
- |
|
|
|
(1,259 |
) |
|
|
142 |
|
|
|
- |
|
|
|
142 |
|
|
Inventory
|
|
|
797 |
|
|
|
- |
|
|
|
797 |
|
|
|
(131 |
) |
|
|
- |
|
|
|
(131 |
) |
|
Prepaid expenses and other current
assets
|
|
|
127 |
|
|
|
- |
|
|
|
127 |
|
|
|
10 |
|
|
|
- |
|
|
|
10 |
|
|
Accounts payable
|
|
|
(637 |
) |
|
|
- |
|
|
|
(637 |
) |
|
|
(5 |
) |
|
|
- |
|
|
|
(5 |
) |
|
Accrued expenses and other current
liabilities
|
|
|
384 |
|
|
|
- |
|
|
|
384 |
|
|
|
107 |
|
|
|
- |
|
|
|
107 |
|
|
Deferred revenue
|
|
|
149 |
|
|
|
(26 |
) |
|
|
123 |
|
|
|
104 |
|
|
|
58 |
|
|
|
162 |
|
|
Accrued warranty
|
|
|
- |
|
|
|
- |
|
|
|
- |
|
|
|
|
|
|
|
|
|
|
|
- |
|
|
Income taxes payable
|
|
|
(41 |
) |
|
|
- |
|
|
|
(41 |
) |
|
|
28 |
|
|
|
- |
|
|
|
28 |
|
|
Deferred rent
|
|
|
(24 |
) |
|
|
- |
|
|
|
(24 |
) |
|
|
(21 |
) |
|
|
- |
|
|
|
(21 |
) |
| |
|
|
|
|
|
|
|
|
|
|
|
|
|
|
|
|
|
|
|
|
|
|
|
|
|
Net cash provided by operating activities
|
|
|
634 |
|
|
|
- |
|
|
|
634 |
|
|
|
2,067 |
|
|
|
- |
|
|
|
2,067 |
|
| |
|
|
|
|
|
|
|
|
|
|
|
|
|
|
|
|
|
|
|
|
|
|
|
|
|
CASH FLOWS FROM INVESTING ACTIVITIES
|
|
|
|
|
|
|
|
|
|
|
|
|
|
|
|
|
|
|
|
|
|
|
|
|
|
Purchases of property and equipment
|
|
|
(66 |
) |
|
|
- |
|
|
|
(66 |
) |
|
|
(354 |
) |
|
|
- |
|
|
|
(354 |
) |
|
Net cash used in investing activities
|
|
|
(66 |
) |
|
|
- |
|
|
|
(66 |
) |
|
|
(354 |
) |
|
|
- |
|
|
|
(354 |
) |
| |
|
|
|
|
|
|
|
|
|
|
|
|
|
|
|
|
|
|
|
|
|
|
|
|
|
CASH FLOWS FROM FINANCING ACTIVITES
|
|
|
|
|
|
|
|
|
|
|
|
|
|
|
|
|
|
|
|
|
|
|
|
|
|
Proceeds from exercise of warrants
|
|
|
175 |
|
|
|
- |
|
|
|
175 |
|
|
|
16 |
|
|
|
- |
|
|
|
16 |
|
|
Proceeds from exercise of stock options
|
|
|
- |
|
|
|
- |
|
|
|
- |
|
|
|
16 |
|
|
|
- |
|
|
|
16 |
|
|
Payments of capitalized lease obligations
|
|
|
- |
|
|
|
- |
|
|
|
- |
|
|
|
(3 |
) |
|
|
- |
|
|
|
(3 |
) |
|
Net cash provided by financing activities
|
|
|
175 |
|
|
|
- |
|
|
|
175 |
|
|
|
29 |
|
|
|
- |
|
|
|
29 |
|
| |
|
|
|
|
|
|
|
|
|
|
|
|
|
|
|
|
|
|
|
|
|
|
|
|
|
INCREASE IN CASH AND CASH EQUIVALENTS
|
|
|
743 |
|
|
|
- |
|
|
|
743 |
|
|
|
1,742 |
|
|
|
- |
|
|
|
1,742 |
|
| |
|
|
|
|
|
|
|
|
|
|
|
|
|
|
|
|
|
|
|
|
|
|
|
|
|
CASH AND CASH EQUIVALENTS - BEGINNING OF YEAR
|
|
|
17,965 |
|
|
|
- |
|
|
|
17,965 |
|
|
|
6,987 |
|
|
|
- |
|
|
|
6,987 |
|
| |
|
|
|
|
|
|
|
|
|
|
|
|
|
|
|
|
|
|
|
|
|
|
|
|
|
CASH AND CASH EQUIVALENTS - END OF YEAR
|
|
$ |
18,708 |
|
|
$ |
- |
|
|
$ |
18,708 |
|
|
$ |
8,729 |
|
|
$ |
- |
|
|
$ |
8,729 |
|
| |
|
|
|
|
|
|
|
|
|
|
|
|
|
|
|
|
|
|
|
|
|
|
|
|
| Supplemental disclosures of cashflow information: |
|
|
|
|
|
|
|
|
|
|
|
|
|
|
|
|
|
|
|
|
|
|
|
|
|
Interest paid
|
|
$ |
- |
|
|
$ |
- |
|
|
$ |
- |
|
|
$ |
1 |
|
|
$ |
- |
|
|
$ |
1 |
|
|
Income taxes paid
|
|
$ |
54 |
|
|
$ |
- |
|
|
$ |
54 |
|
|
$ |
- |
|
|
$ |
- |
|
|
$ |
- |
|
NOTE 3 - RECENTLY ISSUED ACCOUNTING PRONOUNCEMENTS
In June 2011, the Financial Accounting Standards Board (FASB) issued Accounting Statements Update (ASU) No. 2011-05: Comprehensive Income (Topic 220): Presentation of Comprehensive Income (ASU 2011-05). ASU 2011-05 provides that an entity that reports items of other comprehensive income has the option to present comprehensive income in either one continuous financial statement or two consecutive financial statements. ASU 2011-05 is effective for annual periods beginning after December 15, 2011. The Company adopted ASU 2011-05 on January 1, 2012 and reports items of other comprehensive income in one continuous financial statement in the Statement of Operations and Other Comprehensive Income.
In September 2011, the FASB issued ASU 2011-08 (ASU 2011-08), “Intangibles Goodwill and Other (Topic 350): Testing Goodwill for Impairment” ASU 2011-08 updated the guidance on the periodic testing of goodwill for impairment. The updated guidance gives companies the option to perform a qualitative assessment to determine whether it is more likely than not that the fair value of a reporting unit is less than its carrying amount. The amendment is intended to reduce the cost and complexity of the annual goodwill impairment test by providing entities an option to perform a qualitative assessment to determine whether further impairment testing is necessary. The update ASU 2011-08 is effective for fiscal years beginning after December 15, 2011, with early adoption permitted. We do not expect ASU 2011-08 to have a material effect on our financial position, results of operation or cash flows.
We do not believe that any other recently issued, but not yet effective, accounting standard if currently adopted would have a material effect on the accompanying financial statements.
NOTE 4 - FAIR VALUE OF FINANCIAL INSTRUMENTS - RESTATED
We account for certain assets and liabilities at fair value. The hierarchy below lists three levels of fair value based on the extent to which inputs used in measuring fair value are observable in the market. We categorize each of our fair value measurements in one of these three levels based on the lowest level of input that is significant to the fair value measurement in its entirety. These levels are.
| ● |
Level 1 - Quoted prices in active markets for identical assets or liabilities.
|
| ● |
Level 2 - Observable inputs other than Level 1 prices, such as quoted prices for similar assets or liabilities; quoted prices in markets that are not active; or other inputs that are observable or can be corroborated by observable market data for substantially the full term of the assets or liabilities which include certificates of deposits and money markets funds.
|
| ● |
Level 3 - Unobservable inputs that are supported by little or no market activity and that are significant to the fair value of the assets or liabilities, including liabilities resulting from embedded derivatives associated with certain warrants to purchase common stock (see Note 11).
|
The following table provides the assets and liabilities at fair value measured on a recurring basis as of March 31, 2012 and December 31, 2011:
| |
|
March 31, 2012
(unaudited)
|
|
| |
|
Total Carrying Value
|
|
|
Quoted Prices in Active Markets
|
|
|
Using Significant Other Observable Inputs
|
|
|
Using Significant Unobservable Inputs
|
|
|
(in thousands)
|
|
|
|
|
(Level 1)
|
|
|
(Level 2)
|
|
|
(Level 3)
|
|
|
Assets:
|
|
|
|
|
|
|
|
|
|
|
|
|
|
Cash and cash equivalents:
|
|
|
|
|
|
|
|
|
|
|
|
|
|
Money market funds and certificates of deposit
|
|
$ |
18,463 |
|
|
$ |
- |
|
|
18,463 |
|
|
- |
|
|
Total assets
|
|
|
18,463 |
|
|
|
- |
|
|
|
18,463 |
|
|
|
- |
|
|
Current liabilities:
|
|
|
|
|
|
|
|
|
|
|
|
|
|
|
|
|
|
Warrant liabilities
|
|
|
781 |
|
|
|
- |
|
|
|
- |
|
|
|
781 |
|
| |
|
|
|
|
|
|
|
|
|
|
|
|
|
|
|
|
|
Total liabilities
|
|
$ |
781 |
|
|
$ |
- |
|
|
$ |
- |
|
|
$ |
781 |
|
| |
|
|
|
|
|
|
|
|
|
|
|
|
|
|
|
|
| |
|
December 31, 2011
|
|
|
(in thousands)
|
|
Total Carrying Value
|
|
|
Quoted Prices in Active Markets
|
|
|
Using Significant Other Observable Inputs
|
|
|
Using Significant Unobservable Inputs
|
|
| |
|
|
|
|
|
(Level 1)
|
|
|
(Level 2)
|
|
|
(Level 3)
|
|
|
Assets:
|
|
|
|
|
|
|
|
|
|
|
|
|
|
|
|
|
|
Cash and cash equivalents:
|
|
|
|
|
|
|
|
|
|
|
|
|
|
|
|
|
|
Money market funds and certificates of deposit
|
|
$ |
17,622 |
|
|
$ |
- |
|
|
|
17,622 |
|
|
|
- |
|
|
Total assets
|
|
|
17,622 |
|
|
|
- |
|
|
|
17,622 |
|
|
|
- |
|
|
Current liabilities:
|
|
|
|
|
|
|
|
|
|
|
|
|
|
|
|
|
|
Warrant liabilities
|
|
|
671 |
|
|
|
- |
|
|
|
- |
|
|
|
671 |
|
| |
|
|
|
|
|
|
|
|
|
|
|
|
|
|
|
|
|
Total liabilities
|
|
$ |
671 |
|
|
$ |
- |
|
|
$ |
- |
|
|
$ |
671 |
|
NOTE 5 - STOCK-BASED COMPENSATION
The following table presents stock-based compensation expense included in our statements of operations and comprehensive income for the three months ended March 31, 2012 and 2011 (unaudited):
| |
|
Three Months Ended
|
|
| |
|
March 31,
|
|
| |
|
2012
|
|
|
2011
|
|
| (in thousands) |
|
(Restated)
|
|
|
(Restated)
|
|
| |
|
|
|
|
|
|
|
Cost of goods sold
|
|
$ |
78 |
|
|
$ |
- |
|
|
Research and development
|
|
|
229 |
|
|
|
130 |
|
|
Selling, general and administrative expenses
|
|
|
346 |
|
|
|
258 |
|
| |
|
$ |
653 |
|
|
$ |
388 |
|
NOTE 6 - NET (LOSS) INCOME PER SHARE
Basic earnings per share are computed based on the weighted-average number of shares of our common stock outstanding. Diluted earnings per share are computed based on the weighted-average number of shares of our common stock, including common stock equivalents outstanding. Certain common shares consisting of stock options and warrants that would have an anti-dilutive effect were not included in the diluted earnings per share attributable to common stockholders for the three months ended March 31, 2012 and 2011.
The following is a reconciliation of the denominators of the basic and diluted earnings per share computations (unaudited):
| |
|
Three Months Ended
|
|
| (in thousands) |
|
March 31,
|
|
| |
|
2012
|
|
|
2011
|
|
|
Weighted average shares outstanding used to compute basic earnings per share
|
|
|
16,570 |
|
|
|
16,486 |
|
| |
|
|
|
|
|
|
|
|
|
Effect of dilutive stock options and warrants
|
|
|
- |
|
|
|
460 |
|
| |
|
|
|
|
|
|
|
|
|
Weighted average shares outstanding and dilutive securities used to compute dilutive earnings per share
|
|
|
16,570 |
|
|
|
16,946 |
|
For the three months ended March 31, 2012 and 2011, there were approximately 3.2 million and 1.9 million, respectively, shares of outstanding potential common stock equivalents which were excluded from the computation of diluted earnings per share because the effect would have been anti-dilutive.
NOTE 7 - SALES AND CUSTOMER CONCENTRATION
Total revenues for the three months ended March 31, 2012 and 2011 was as follows (unaudited):
| |
|
Three Months Ended
March 31,
|
|
| |
|
2012
|
|
|
2011
|
|
|
(in thousands)
|
|
(restated) |
(restated) |
|
| |
|
|
|
|
|
|
|
Products
|
|
$
|
13,155
|
|
|
$
|
11,914
|
|
|
Software maintenance
|
|
|
120
|
|
|
|
34
|
|
|
Total revenue
|
|
$
|
13,275
|
|
|
$
|
11,948
|
|
Duke Energy accounted for 100% of the product and software maintenance revenue for the 2012 and 2011 periods and 100% of the accounts receivable balance at March 31, 2012 and December 31, 2011.
NOTE 8 - INVENTORY
Inventory is valued at the lower of cost or market and is determined on first-in-first-out method (FIFO) basis. Market is determined as the replacement cost for direct materials and the net realizable value for finished goods. At March 31, 2012 and December 31, 2011, inventory of $663,000 and $1.5 million, respectively, consisted of shipments in transit, which represents the cost of finished goods inventory shipped for which title has not yet passed to our customer. The value of inventory is adjusted for estimated obsolescence or unmarketable inventory equal to the difference between the cost of inventory and the estimated market value based upon assumptions about future demand and market conditions.
NOTE 9 - PRODUCT WARRANTY
The Company’s current standard product warranty includes a one-year warranty period for defects in material and craftsmanship under certain circumstances as specified in customer contracts. Due to the limited deployment of products, the Company did not historically accrue for the cost of warranty obligations and expensed any costs associated with repairing or replacing defective product as incurred. During the third quarter of 2011, the Company began accruing a liability of approximately 0.2% of current communications node revenues for the estimated future costs of meeting its warranty obligations, based on its actual historical return rate of products within the one-year warranty period. The Company makes and revises this estimate based on the number of communications nodes delivered and its historical experience with warranty claims. The Company continually monitors the quality of its products including the quality of the products produced by its U.S.-based contract manufacturer in China.
The Company engages in product quality programs and processes, including monitoring and evaluating the quality of component suppliers, in an effort to ensure the quality of its products and reduce its warranty exposure. The warranty obligation will be affected not only by product failure rates, but also the costs to repair or replace failed products and potential service and delivery costs incurred in correcting a product failure. If the Company’s actual product failure rates, repair or replacement costs, or service or delivery costs differ from these estimates, accrued warranty costs would be adjusted in the period that such events or costs become known.
The following table summarizes the activity of the Company’s warranty accrual for the three months ended March 31, 2012 and 2011 (unaudited):
| |
|
Three Months Ended
March 31,
|
|
| |
|
2012
|
|
|
2011
|
|
|
(in thousands)
|
|
|
|
| |
|
|
|
|
|
|
|
Balance at beginning of period
|
|
$
|
115 |
|
|
$
|
|
|
|
Warranty costs accrued, net
|
|
|
22 |
|
|
|
|
|
|
|
|
|
(22
|
) |
|
|
-
|
|
| |
|
|
|
|
|
|
|
|
|
Balance at end of period
|
|
$
|
115 |
|
|
$
|
|
|
NOTE 10 - INCOME TAXES
The provision for income taxes at March 31, 2011 was comprised of federal alternative minimum tax. Significant components of deferred tax assets include net operating loss carryforwards and stock-based compensation. Due to the uncertainty of their realization, we have not recorded any income tax benefit as we have established valuation allowances for any such benefits.
NOTE 11 – WARRANT LIABILITIES - RESTATED
In connection with issuing the Notes, as well as in connection with other financing transactions, we issued Warrants which have been classified as liabilities in accordance with ASC 815, due primarily to an anti-dilution price protection feature. Changes in the fair values of these instruments require adjustments to the amount of the liabilities recorded on the Company’s balance sheet, and the corresponding gain or loss is required to be recorded in the Company’s statement of operations and comprehensive income. As such, we recorded a gain of $1.1 million for the three months ended March 31, 2011 and a loss of approximately $189,000 for the three months ended March 31, 2012. As of December 31, 2011 and March 31, 2012, warrant liabilities totaled approximately $671,000 and $781,000, respectively.
Fair value of the Warrants is determined by management using a multiple scenario, probability-weighted option-pricing model using the following inputs: the fair value of the underlying common stock at the valuation measurement date; the risk-free interest rates; the expected dividend rates; the remaining contractual terms of the warrants; the expected volatility of the price of the underlying common stock; and the probability of certain events occurring.
The assumptions used by the Company to determine fair value for the Warrants as of March 31, 2012 and December 31, 2011 are summarized in the following tables:
| |
|
March 31,
2012
|
|
|
December 31, 2011
|
|
| |
|
(unaudited) |
|
|
|
|
|
Risk free interest rate
|
|
|
1.5 |
% |
|
|
1.7 |
% |
|
Expected life (yrs)
|
|
|
0.2-1.1 |
|
|
|
0.1-1.3 |
|
|
Expected volatility
|
|
|
62.3 |
% |
|
|
62.3 |
% |
|
Dividend yield
|
|
|
0 |
% |
|
|
0 |
% |
|
Underlying stock price
|
|
$ |
5.01 |
|
|
$ |
4.63 |
|
The following table summarizes the changes in the estimated fair value of our warrant liabilities for the three months ended March 31, 2012 and 2011 (unaudited):
| |
|
Three Months Ended
March 31,
|
|
| |
|
2012
|
|
|
2011
|
|
|
(in thousands)
|
|
|
|
| |
|
|
|
|
|
|
|
Beginning balance
|
|
$
|
671 |
|
|
$
|
|
|
Mark-to-market adjustment
|
|
|
189 |
|
|
|
|
) |
|
|
|
|
(79
|
) |
|
|
(34
|
) |
| |
|
|
|
|
|
|
|
|
|
Ending balance
|
|
$
|
781 |
|
|
$
|
|
|
NOTE 12 - STOCKHOLDERS' EQUITY
Employee Stock Options
For the three months ended March 31, 2012, the Company issued a total of 27,000 stock options from its 2000 Equity Incentive Plan at exercise prices between $4.62 and $5.50 per share and no shares of the Company’s common stock were issued upon exercise of stock options.
For the three months ended March 31, 2012, the Company issued 50,000 shares of common stock upon the exercise of warrants for total proceeds of $175,000.
As of March 31, 2012, the Company had 923,484 warrants outstanding with a weighted average exercise price of approximately $15.96 per share, of which 805,033 are held by Vicis Master Capital Fund with a weighted average exercise price of approximately $17.75 per share. Approximately 150,000 warrants expired during the three months ended March 31, 2012.
In March 2012, the Company’s Board of Directors authorized the retirement of 10,000 shares of treasury stock. As such, all shares of treasury stock were retired and resumed the status of authorized and unissued shares of common stock.
NOTE 13 - DEFERRED FINANCING COSTS
In August 2011, the Company filed a Form S-1 registration statement with the Securities and Exchange Commission for a proposed public offering of the Company’s common stock (the “S-1 Registration Statement”), for which the Company had incurred approximately $389,000 in expenses as of December 31, 2011. Such costs had been capitalized and were to be charged to additional paid in capital upon completion of the Company’s proposed public offering. In April 2012, the Company voluntarily filed an application with the Securities and Exchange Commission requesting the withdrawal of the S-1 Registration Statement. The Company requested withdrawal of the registration statement based on current market conditions and management’s ensuing determination to not proceed with the contemplated offering at this time. Accordingly, previously capitalized deferred financing costs of approximately $389,000 were written off as of March 31, 2012.
NOTE 14 - SUBSEQUENT EVENTS
None.
ITEM 2. RESTATED MANAGEMENT'S DISCUSSION AND ANALYSIS OF FINANCIAL CONDITION AND RESULTS OF OPERATION
RESTATEMENT
As discussed in the Explanatory Note and in Note 2 of the Notes to the Unaudited Financial Statements in this Amended Filing, we are amending and restating our unaudited financial statements and related disclosures for all periods presented in this Amended Filing. The following discussion and analysis of our financial condition and results of operations incorporates the restated amounts. For this reason, the data set forth in this section may not be comparable to discussion and data in our previously filed Quarterly Report on Form 10-Q for the three months ended March 31, 2012.
The following discussion should be read in conjunction with our financial statements and the notes thereto. Some of our discussion is forward-looking and involves risks and uncertainties. For information regarding risk factors that could have a material adverse effect on our business, refer to the risk factors section of our Amendment No. 1 to our Annual Report for the year ended December 31, 2011 on form 10-K/A that is being concurrently filed with the SEC.
OVERVIEW
We are a leading provider of a smart grid communications platform that enables utilities to effectively deploy, integrate and communicate with multiple smart grid applications within the electric power grid. Our smart grid communications platform significantly improves the ability of utilities to use advanced technologies to upgrade their electric power grids, effectively making the grids more intelligent.
The term “smart grid” refers to the use of advanced technologies to upgrade the electric power grid, or the grid, effectively making the grid more intelligent and efficient. The grid was largely designed and built decades ago to reliably distribute electricity from generators to customers in a manner resulting in sizable capital investments and operating costs. A number of factors are increasingly straining the grid, including rapidly growing electricity demand, two-way power flow, the implementation of renewable and distributed energy sources and advanced pricing plans. As such, the aging grid is prone to reliability, security, availability and power quality issues, costing utilities and consumers billions of dollars each year. Technology is now revolutionizing the grid and transforming it into an efficient, communicating energy service platform. We believe that the smart grid will address the current shortcomings of the grid and deliver significant benefits to utilities and consumers of energy, including reduced costs, increased power reliability and quality, accommodation of renewable energy technologies, consumer empowerment over energy consumption and a platform for continued integration of new technologies.
The Ambient Smart Grid® communications platform, which includes hardware, software and firmware, enables utilities to effectively manage smart grid applications. Our communications platform provides utilities with a secure, two-way, flexible and open Internet protocol, or IP, architecture that efficiently networks smart grid applications and different technologies within each application and supports multiple communications technologies currently used by utilities, such as Wi-Fi, radio frequency, cellular technologies, power line communications, serial and Ethernet. Today, our communications platform enables the simultaneous integration and parallel communication of multiple smart grid applications provided by a variety of vendors, including smart metering, distribution automation, distribution management, and demand response. We believe that the Ambient Smart Grid® communications platform delivers significant benefits to utilities, including support of a single network; an open, scalable and interoperable platform; preservation of utility investments; third-party application hosting; remote and distributed intelligence; secure communications; and reduced overall implementation and operating costs.
The Ambient Smart Grid® products and services include communications nodes; a network management system, AmbientNMS®; integrated applications; and maintenance and consulting services. The communications nodes, our principal product, are physical boxes that contain the hardware and software needed for communications and data collection in support of smart grid assets. We have configured our communications nodes to act as individual data processors and collectors that receive signals from other networked devices, enabling smart grid applications. Duke Energy, our marquee customer, has deployed approximately 105,000 of our communications nodes that receive data from smart electric and gas meters, using a variety of communications technologies, and process and transmit these data to the utility back office over a cellular carrier network for further processing. Furthermore, our communications nodes also accommodate integrated applications that include our own developed technology and third-party technology, thereby substantially increasing their functionality. By enabling such system interoperability, our communications platform both reduces implementation and ongoing communications costs and improves overall power management efficiencies. We believe that, to date, no other single solution or technology has provided the necessary flexibility in a cost-effective manner and proven at commercial scale, enabling a comprehensive digital communications platform while leveraging standards-based technologies. We developed our communications platform to specifically fill this void.
Our long-standing relationship with our marquee customer, which we believe has one of the most forward-looking smart grid initiatives in North America, has led to rapid growth in our business, and we entered into a long-term agreement in September 2009 with them to supply the utility with our Ambient Smart Grid® communications platform and license our AmbientNMS® through 2015. We increased revenue from $2.2 million in 2009 to $20.2 million in 2010 to $62.1 million in 2011. As of March 31, 2012, we had backlog of approximately $29 million. We believe that there are opportunities for additional sales of our products and services with Duke Energy.
We intend to leverage our success with our marquee customer to secure additional customers in the global utility marketplace. We have recently hired senior-level personnel as well as substantially increased our investment in marketing and sales in order to intensify our efforts in securing new customers, and we expect to continue to invest substantially in our marketing and sales efforts for the foreseeable future. As a result of our recent increased marketing and sales activities, we have engaged with several utilities, and we are in active discussions regarding potential pilot programs utilizing our technology.
On July 18, 2011, we implemented a reverse stock split of our issued and outstanding shares of common stock at a ratio of 1-for 100 shares (the “Reverse Split”). The Reverse Split became effective on July 18, 2011 and has been reflected in this Quarterly Report on Form 10-Q. On August 3, 2011, our common stock began to trade on the NASDAQ Capital Market under our new ticker symbol “AMBT.”
Our business success in the immediate future will depend largely on our ability to execute on our agreement with Duke Energy and their continual expansion of their existing deployments, as well as our ability to successfully expand our customer base as a result of our investments in sales and marketing. We anticipate that we will continue to collaborate with Duke Energy and continue to support their grid-modernization programs. Notwithstanding the above, we recognize that Duke Energy could alter their vision regarding the common communications infrastructure, determine that a competing company offers a more desirable product, or slow its deployments indefinitely, significantly affecting our prospects and outlook. Additionally, we are unable at this time to assess the effects, if any, that the merger between Duke Energy and Progress Energy, which was completed in July 2012, will have on the continuation and/or expansion of our deployment by the new combined company following the merger. No assurance can be provided that the post-merger entity will continue with or expand the current deployments at Duke Energy.
RESULTS OF OPERATIONS
COMPARISON OF THE THREE MONTHS ENDED MARCH 31, 2012 TO THE THREE MONTHS ENDED MARCH 31, 2011
Total Revenue. Total revenue for the three months ended March 31, 2012 was approximately $13.3 million, representing an increase of approximately 11% from approximately $11.9 million for the same period in 2011. The increase in total revenue during the three months ended March 31, 2012 as compared to the same period in 2011 reflected an increase in the number of communications nodes delivered to our marquee customer as part of its Ohio smart grid initiative and to a lesser extent increased software maintenance fees related to our AmbientNMS®.
Cost of Goods Sold. Cost of goods sold for the three months ended March 31, 2012 was approximately $7.5 million, representing an increase of approximately $681,000 from approximately $6.8 million for the corresponding period in 2011. The increase in cost of goods sold during the three months ended March 31, 2012 as compared to the same period in 2011 was due primarily to the increase in sales volume.
Gross Profit. Gross profit for the three months ended March 31, 2012 was approximately $5.8 million, representing an increase of $646,000 from approximately $5.1 million for the corresponding period in 2011. Our overall gross margin for each of the three months ended March 31, 2012 and 2011 was approximately 44% and 43% respectively. Gross margins were stable based upon the commercial scale achieved with our marquee customer.
Research and Development Expenses. Research and development expenses for the three months ended March 31, 2012 were approximately $3.3 million, representing an increase of $1.3 million from approximately $2.0 million for the corresponding period in 2011. The increase in research and development during the three months ended March 31, 2012 as compared to the same period in 2011 was due primarily to increased personnel expenses for the continued development of our communications platform, including enhancements to our AmbientNMS® software. We believe that our continued development efforts are critical to our strategic objectives of enhancing our technology while reducing costs, and therefore, we expect that our research and development expenses will increase over the next twelve months as we continue to focus our efforts on developing more robust solutions and providing additional value-added functionality for the Ambient Smart Grid® communications platform. Research and development expenses consisted of expenses incurred primarily in designing, prototyping and field testing our smart grid communications platform. These expenses consisted primarily of salaries and related expenses for personnel, contract design and testing services, supplies used, and consulting and license fees paid to third parties.
Selling, General and Administrative Expenses. Selling, general and administrative expenses for the three months ended March 31, 2012 were approximately $2.1 million, representing an increase of approximately $292,000 from approximately $1.8 million for the corresponding period in 2011. The increase in selling, general and administrative expenses during the three months ended March 31, 2012 as compared to the same period in 2011 was due primarily to increased personnel costs and increased activity regarding our efforts to market the Ambient Smart Grid® communications platform. Selling, general and administrative expenses consisted primarily of salaries and other related costs for personnel in executive, marketing and sales and other administrative functions. Other significant costs included professional fees for legal, accounting and other services. We expect that selling, general and administrative expenses will increase over the next twelve months as we hire additional personnel, increase activity associated with business development, and increase activity associated with marketing programs targeted at increasing our overall brand awareness and securing additional customers.
Write-off of Deferred Financing Costs. In August 2011, we filed a Form S-1 registration statement with the Securities and Exchange Commission for a proposed public offering of our common stock, for which we had incurred approximately $389,000 in expenses as of December 31, 2011. Such costs were capitalized and were to be charged to additional paid-in capital upon completion of our proposed public offering. In April 2012, we voluntarily filed an application with the Securities and Exchange Commission requesting the withdrawal of such registration statement. We requested withdrawal of the registration statement based on current market conditions and management’s ensuing determination to not proceed with the contemplated offering at this time. Accordingly, previously capitalized deferred financing costs of approximately $389,000 were written off as of March 31, 2012.
Mark to Market Adjustment of Warrant Liability. Changes in the fair value of warrant liabilities resulted in a loss of approximately $189,000 and a gain of approximately $1.1 million for the three months ended March 31, 2012 and 2011, respectively.
Interest Income, net and Other Income. Interest income for the three months ended March 31, 2012 was approximately $2,000 compared to net interest income of approximately $6,000 for the corresponding period in 2011. Other income for the three months ended March 31, 2012 was approximately $73,000, representing primarily the partial recovery of loans made by us to an unrelated company during 2000 and 2001, which had been previously written off in 2001.
Provision for Income Taxes. As a result of our net income of approximately $2.3 million for the three months ended March 31, 2011, we recorded a provision for income taxes of approximately $28,000 primarily reflecting federal alternative minimum taxes.
LIQUIDITY AND CAPITAL RESOURCES
Since inception, we have funded our operations primarily through the sale of our securities and, more recently, through revenue generated from sales of our products. At March 31, 2012, we had working capital of approximately $15.5 million, including cash and cash equivalents of approximately $18.7 million. Our cash and cash equivalents were approximately $18.0 million as of December 31, 2011.
Net cash provided by operating activities was approximately $634,000 for the three months ended March 31, 2012 as compared to approximately $2.1 million for the same period in 2011. The decrease in cash provided by operating activities was due primarily to increased operating expenses incurred relating to the increase in investments made in research and development and sales and marketing.
Net cash used in investing activities for the three months ended March 31, 2012 was approximately $66,000 as compared to approximately $354,000 for the same period in 2011. Net cash used in investing activities was for additions of fixed assets.
Net cash provided by financing activities for the three months ended March 31, 2012 was approximately $175,000 as compared to approximately $29,000 for the same period in 2011. For the three months ended March 31, 2012, net cash provided by financing activities consisted of proceeds from exercises of warrants. Net cash provided by financing activities for the three months ended March 31, 2011 consisted primarily of proceeds from exercises of stock options and warrants.
We believe that our business plan provides sufficient liquidity to fund our operating needs for the next 12 months. However, there are factors that can impact our ability to continue to fund our operating needs, including:
|
●
|
Our ability to maintain product pricing as expected, particularly in light of increased competition and its unknown effects on market dynamics;
|
|
●
|
Our and our contract manufacturer’s ability to reduce manufacturing costs as expected;
|
|
●
|
Our ability to expand sales volume, which is highly dependent on the smart grid implementation plans of Duke Energy and other utilities; and
|
|
●
|
The need for us to continue to invest in operating activities in order to remain competitive or acquire other businesses and technologies in order to complement our products, expand the breadth of our business, enhance our technical capabilities, or otherwise offer growth opportunities.
|
If we cannot effectively manage these factors, we may need to raise additional capital in order to fund our operating needs. If we are unable to obtain adequate financing or financing on terms satisfactory to us when we require it, our ability to continue to grow or support our business and to respond to business challenges could be significantly limited.
ITEM 4. CONTROLS AND PROCEDURES - RESTATED
We maintain disclosure controls and procedures that are designed to provide reasonable assurance that information required to be disclosed in our Exchange Act reports is recorded, processed, summarized and reported within the time periods specified in the SEC's rules and forms, and that such information is accumulated and communicated to management, including our Chief Executive Officer and our Chief Financial Officer to allow timely decisions regarding required disclosure based closely on the definition of "disclosure controls and procedures" in Rule 13a-15(e).
At the time that our Quarterly Report on Form 10-Q for the three months ended March 31, 2012 was filed on May 14, 2012, our Chief Executive Officer and Chief Financial Officer concluded that our disclosure controls and procedures were effective to provide such reasonable assurance as of March 31, 2012. Subsequent to that evaluation, our management, including our Chief Executive Officer and Chief Financial Officer, concluded that our disclosure controls and procedures were not effective to provide such reasonable assurance as of March 31, 2012 because of a material weakness in our internal control over financial reporting. The material weakness is described in detail in our Amended Annual Report on Form 10-K/A filed simultaneously with this Amended Filing. Not withstanding such material weakness, management, based upon the work performed during the restatement process, as described in the Explanatory Note and in Note 2 to the Notes to the Unaudited Restated Financial Statements, has concluded that our financial statements for the periods included in this Amended Quarterly Report on Form 10-Q are fairly stated in all material respects in accordance with generally accepted accounting principles for each of the periods presented herein.
Remediation Plan
We are in the process of remediating this material weakness by, among other things, augmenting our professional staff, providing additional training for our accounting staff, implementing and modifying certain accounting procedures, and seeking assistance from third parties with respect to complex technical accounting issues. If we fail to remediate this material weakness or fail to otherwise maintain effective controls over financial reporting in the future, it could result in a material misstatement of our financial statements that would not be prevented or detected on a timely basis and which could cause investors and other users to lose confidence in our financial statements.
Management believes the foregoing efforts will effectively remediate the material weakness. As the Company continues to evaluate and work to improve its internal control over financial reporting, management may execute additional measures to address potential control deficiencies or modify the remediation plan described above. Management will continue to review and make necessary changes to the overall design of the Company’s internal control.
Changes in Internal Control over Financial Reporting
During the quarter ended March 31, 2012, there were no changes made in our internal control over financial reporting (as such term is defined in Rules 13a-15(f) and 15d-15(f) of the Exchange Act) that have materially affected, or are reasonably likely to materially affect, the Company’s internal control over financial reporting.
PART II - OTHER INFORMATION
ITEM 2. UNREGISTERED SALES OF EQUITY SECURITIES AND USE OF PROCEEDS
A single warrant holder exercised an outstanding warrant on February 10, 2012 for 15,000 shares of Common Stock, on March 8, 2012 for 15,000 shares of Common Stock and on March 30, 2012 for 20,000 shares of Common Stock, in each case for $3.50 cash per share for a total consideration of $175,000. The Company issued such shares in reliance upon the exemption from the registration requirements of the Securities Act of 1933 as amended, under Section 4(2) of the Securities Act.
In claiming the exemption under Section 4(2), the Company relied in part on the following facts: (1) the offers and sales involved one warrant holder; (2) the warrant holder had access to information regarding the Company; and (3) the warrant holder represented that he (a) was an accredited investor; and (b) acquired the shares for his own account in a transaction not involving any general solicitation or general advertising, and not with a view to the distribution thereof.
ITEM 6. EXHIBITS
|
Exhibit No.
|
|
Description
|
| |
|
|
|
31.1
|
|
Certification of Chief Executive Officer pursuant to Rule 13a-14(a) of the Securities Exchange Act of 1934, as amended.
|
| |
|
|
|
31.2
|
|
Certification of Chief Financial Officer pursuant to Rule 13a-14(a) of the Securities Exchange Act of 1934, as amended.
|
| |
|
|
|
32
|
|
Certification of Chief Executive Officer and Chief Financial Officer, as adopted pursuant to Section 906 of the Sarbanes-Oxley Act of 2002.
|
| |
|
|
|
101.INS*
|
|
XBRL Instance Document
|
| |
|
|
|
101.SCH*
|
|
XBRL Taxonomy Extension Schema
|
| |
|
|
|
101.CAL*
|
|
XBRL Taxonomy Extension Calculation Linkbase
|
| |
|
|
|
101.DEF*
|
|
XBRL Taxonomy Extension Definition Linkbase
|
| |
|
|
|
101.LAB*
|
|
XBRL Taxonomy Extension Label Linkbase
|
| |
|
|
|
101.PRE*
|
|
XBRL Taxonomy Extension Presentation Linkbase
|
|
*
|
Pursuant to Rule 406T of Regulation S-T, these interactive data files are deemed not filed or part of a registration statement or prospectus for purposes of Sections 11 or 12 of the Securities Act of 1933 or Section 18 of the Securities Exchange Act of 1934 and otherwise are not subject to liability.
|
SIGNATURES
Pursuant to the requirements of the Securities Exchange Act of 1934 the registrant has duly caused this report to be signed on its behalf by the undersigned thereunto duly authorized.
|
AMBIENT CORPORATION
|
|
|
|
|
(Registrant)
|
|
|
|
| |
|
|
|
|
By:
|
/s/ John J. Joyce
|
|
By:
|
/s/ Mark L. Fidler
|
|
| |
John J. Joyce,
|
|
|
Mark L. Fidler,
|
|
| |
President and Chief Executive Officer
|
|
|
Vice President, Chief Financial Officer and Treasurer
|
|
| |
(Principal Executive Officer)
|
|
|
(Principal Financial Officer and Principal Accounting Officer)
|
|
| |
|
|
|
|
|
|
Date:
|
September 24, 2012
|
|
Date:
|
September 24, 2012
|
|
|
Exhibit No.
|
|
Description
|
| |
|
|
|
31.1
|
|
Certification of Chief Executive Officer pursuant to Rule 13a-14(a) of the Securities Exchange Act of 1934, as amended.
|
| |
|
|
|
31.2
|
|
Certification of Chief Financial Officer pursuant to Rule 13a-14(a) of the Securities Exchange Act of 1934, as amended.
|
| |
|
|
|
32
|
|
Certification of Chief Executive Officer and Chief Financial Officer, as adopted pursuant to Section 906 of the Sarbanes-Oxley Act of 2002.
|
| |
|
|
|
101.INS*
|
|
XBRL Instance Document
|
| |
|
|
|
101.SCH*
|
|
XBRL Taxonomy Extension Schema
|
| |
|
|
|
101.CAL*
|
|
XBRL Taxonomy Extension Calculation Linkbase
|
| |
|
|
|
101.DEF*
|
|
XBRL Taxonomy Extension Definition Linkbase
|
| |
|
|
|
101.LAB*
|
|
XBRL Taxonomy Extension Label Linkbase
|
| |
|
|
|
101.PRE*
|
|
XBRL Taxonomy Extension Presentation Linkbase
|
|
*
|
Pursuant to Rule 406T of Regulation S-T, these interactive data files are deemed not filed or part of a registration statement or prospectus for purposes of Sections 11 or 12 of the Securities Act of 1933 or Section 18 of the Securities Exchange Act of 1934 and otherwise are not subject to liability.
|
RULE 13a-14(a) CERTIFICATION
I, John J. Joyce, certify that:
|
1.
|
I have reviewed this Amended Quarterly Report on Form 10-Q/A for the quarter ended March 31, 2012 of Ambient Corporation;
|
|
2.
|
Based on my knowledge, this report does not contain any untrue statement of a material fact or omit to state a material fact necessary to make the statements made, in light of the circumstances under which such statements were made, not misleading with respect to the period covered by this report;
|
|
3.
|
Based on my knowledge, the financial statements, and other financial information included in this report, fairly present in all material respects the financial condition, results of operations and cash flows of the registrant as of, and for, the periods presented in this report;
|
|
4.
|
The registrant’s other certifying officer and I are responsible for establishing and maintaining disclosure controls and procedures (as defined in Exchange Act Rules 13a-15(e) and 15d-15(e)) and internal control over financial reporting (as defined in Exchange Act Rules 13a-15(f) and 15d-15(f)) for the registrant and have:
|
| |
a)
|
Designed such disclosure controls and procedures, or caused such disclosure controls and procedures to be designed under our supervision, to ensure that material information relating to the registrant, including its consolidated subsidiaries, is made known to us by others within those entities, particularly during the period in which this report is being prepared;
|
| |
b)
|
Designed such internal control over financial reporting, or caused such internal control over financial reporting to be designed under our supervision, to provide reasonable assurance regarding the reliability of financial reporting and the preparation of financial statements for external purposes in accordance with generally accepted accounting principles;
|
| |
c)
|
Evaluated the effectiveness of the registrant's disclosure controls and procedures and presented in this report our conclusions about the effectiveness of the disclosure controls and procedures, as of end of the period covered by this report based on such evaluation; and
|
| |
d)
|
Disclosed in this report any change in the registrant's internal control over financial reporting that occurred during the registrant's most recent fiscal quarter (the registrant's fourth fiscal quarter in the case of an annual report) that has materially affected, or is reasonably likely to materially affect, the registrant's internal control over financial reporting; and
|
|
5.
|
The registrant’s other certifying officer and I have disclosed, based on our most recent evaluation of internal control over financial reporting, to the registrant's auditors and the audit committee of registrant's board of directors (or persons performing the equivalent functions):
|
| |
a)
|
All significant deficiencies and material weaknesses in the design or operation of internal control over financial reporting which are reasonably likely to adversely affect the registrant's ability to record, process, summarize and report financial information; and
|
| |
b)
|
Any fraud, whether or not material, that involves management or other employees who have a significant role in the registrant's internal control over financial reporting.
|
September 24, 2012
| |
By:
|
/s/ John J. Joyce
|
|
| |
|
John J. Joyce
|
|
| |
|
President and Chief Executive Officer
(Principal Executive Officer)
|
|
EXHIBIT 31.2
RULE 13a-14(a) CERTIFICATION
I, Mark L. Fidler, certify that:
|
1.
|
I have reviewed this Amended Quarterly Report on Form 10-Q/A for the quarter ended March 31, 2012 of Ambient Corporation;
|
|
2.
|
Based on my knowledge, this report does not contain any untrue statement of a material fact or omit to state a material fact necessary to make the statements made, in light of the circumstances under which such statements were made, not misleading with respect to the period covered by this report;
|
|
3.
|
Based on my knowledge, the financial statements, and other financial information included in this report, fairly present in all material respects the financial condition, results of operations and cash flows of the registrant as of, and for, the periods presented in this report;
|
|
4.
|
The registrant’s other certifying officer and I are responsible for establishing and maintaining disclosure controls and procedures (as defined in Exchange Act Rules 13a-15(e) and 15d-15(e)) and internal control over financial reporting (as defined in Exchange Act Rules 13a-15(f) and 15d-15(f)) for the registrant and have:
|
| |
a)
|
Designed such disclosure controls and procedures, or caused such disclosure controls and procedures to be designed under our supervision, to ensure that material information relating to the registrant, including its consolidated subsidiaries, is made known to us by others within those entities, particularly during the period in which this report is being prepared;
|
| |
b)
|
Designed such internal control over financial reporting, or caused such internal control over financial reporting to be designed under our supervision, to provide reasonable assurance regarding the reliability of financial reporting and the preparation of financial statements for external purposes in accordance with generally accepted accounting principles;
|
| |
c)
|
Evaluated the effectiveness of the registrant's disclosure controls and procedures and presented in this report our conclusions about the effectiveness of the disclosure controls and procedures, as of end of the period covered by this report based on such evaluation; and
|
| |
d)
|
Disclosed in this report any change in the registrant's internal control over financial reporting that occurred during the registrant's most recent fiscal quarter (the registrant's fourth fiscal quarter in the case of an annual report) that has materially affected, or is reasonably likely to materially affect, the registrant's internal control over financial reporting; and
|
|
5.
|
The registrant’s other certifying officer and I have disclosed, based on our most recent evaluation of internal control over financial reporting, to the registrant's auditors and the audit committee of registrant's board of directors (or persons performing the equivalent functions):
|
| |
a)
|
All significant deficiencies and material weaknesses in the design or operation of internal control over financial reporting which are reasonably likely to adversely affect the registrant's ability to record, process, summarize and report financial information; and
|
| |
b)
|
Any fraud, whether or not material, that involves management or other employees who have a significant role in the registrant's internal control over financial reporting.
|
September 24, 2012
| |
By:
|
/s/ Mark L. Fidler
|
|
| |
|
Mark L. Fidler
|
|
| |
|
Vice President, Chief Financial Officer and Treasurer
(Principal Financial Officer and
Accounting Officer)
|
|
EXHIBIT 32
CERTIFICATION PURSUANT TO 18 U.S.C. SECTION 1350 (AS ADOPTED PURSUANT TO SECTION 906 OF THE
SARBANES-OXLEY ACT OF 2002)
In connection with the Amended Quarterly Report of Ambient Corporation (the "Company") on Form 10-Q/A for the quarter ended March 31, 2012 (the "Amended Report") filed with the Securities and Exchange Commission, we, John J. Joyce, President and Chief Executive Officer of the Company and Mark L. Fidler, Vice President, Chief Financial Officer and Treasurer of the Company, certify, pursuant to 18 U.S.C. Section 1350, as adopted pursuant to Section 906 of the Sarbanes-Oxley Act of 2002, that to the best of our knowledge:
1. The Amended Report fully complies with the requirements of Section 13(a) or 15(d) of the Securities Exchange Act of 1934, as amended; and
2. The information contained in the Amended Report fairly presents, in all material respects, the financial condition and results of operations of the Company as of the dates and for the periods presented in the Amended Report.
Date: September 24, 2012
| |
|
|
|
| |
|
|
|
| |
By:
|
/s/ John J. Joyce
|
|
| |
|
John J. Joyce
|
|
| |
|
President and Chief Executive Officer
|
|
| |
|
|
|
| |
By:
|
/s/ Mark L. Fidler
|
|
| |
|
Mark L. Fidler
|
|
| |
|
Vice President, Chief Financial Officer and Treasurer
|
|
A certification furnished pursuant to this Item will not be deemed “filed” for purposes of section 18 of the Exchange Act (15 U.S.C. 78r), or otherwise subject to the liability of that section. Such certification will not be deemed to be incorporated by reference into any filing under the Securities Act or the Exchange Act, except to the extent that the registrant specifically incorporates it by reference.
UNITED STATES
SECURITIES AND EXCHANGE COMMISSION
Washington, D.C. 20549
FORM 10-Q
þ QUARTERLY REPORT PURSUANT TO SECTION 13 OR 15(d) OF THE SECURITIES EXCHANGE ACT OF 1934
For the quarterly period ended: June 30, 2012
or
¨ TRANSITION REPORT PURSUANT TO SECTION 13 OR 15(d) OF THE SECURITIES EXCHANGE ACT OF 1934
For the transition period from: _____________ to _____________
Commission File Number: 001-35259
AMBIENT CORPORATION
(Exact name of registrant as specified in its charter)
|
Delaware
|
|
98-0166007
|
|
(State or Other Jurisdiction of Incorporation)
|
|
(I.R.S. Employer Identification No.)
|
7 WELLS AVENUE, NEWTON, MASSACHUSETTS 02459
(Address of Principal Executive Office) (Zip Code)
617-332-0004
(Registrant’s telephone number, including area code)
N/A
(Former name, former address and former fiscal year, if changed since last report)
Indicate by check mark whether the registrant (1) has filed all reports required to be filed by Section 13 or 15(d) of the Securities Exchange Act of 1934 during the preceding 12 months (or for such shorter period that the registrant was required to file such reports), and (2) has been subject to such filing requirements for the past 90 days. Yes þ No ¨
Indicate by check mark whether the registrant has submitted electronically and posted on its corporate Web site, if any, every Interactive Data File required to be submitted and posted pursuant to Rule 405 of Regulation S-T (§232.405 of this chapter) during the preceding 12 months (or for such shorter period that the registrant was required to submit and post such files). Yes þ No o
Indicate by check mark whether the registrant is a large accelerated filer, an accelerated filer, a non-accelerated filer, or a smaller reporting company.
|
Large accelerated filer
|
o
|
Accelerated filer
|
o
|
|
Non-accelerated filer
|
o
|
Smaller reporting company
|
þ
|
Indicate by check mark whether the registrant is a shell company (as defined in Rule 12b-2 of the Act). Yes ¨ No þ
As of September 21, 2012, there were 16,663,720 shares of issuer's common stock, par value $0.001 per share, outstanding.
Table of Contents
| |
|
|
PAGE
|
|
|
PART I – FINANCIAL INFORMATION
|
| |
|
|
|
|
|
|
Item 1.
|
Financial Statements
|
|
|
4
|
|
| |
|
|
|
|
|
| |
Balance Sheets as of June 30, 2012 (Unaudited) and December 31, 2011
|
|
|
4
|
|
| |
|
|
|
|
|
| |
Statements of Operations and Comprehensive Income for the three and six months ended June 30, 2012 and 2011 (Unaudited)
|
|
|
5
|
|
| |
|
|
|
|
|
| |
Statements of Cash Flows for the six months ended June 30, 2012 and 2011 (Unaudited)
|
|
|
6
|
|
| |
|
|
|
|
|
| |
Notes to the Unaudited Financial Statements
|
|
|
7
|
|
| |
|
|
|
|
|
|
Item 2.
|
Management's Discussion and Analysis of Financial Condition and Results of Operation
|
|
|
16
|
|
| |
|
|
|
|
|
|
Item 4.
|
Controls and Procedures
|
|
|
19
|
|
| |
|
|
|
|
|
|
PART II – OTHER INFORMATION
|
| |
|
|
|
|
|
|
Item 2.
|
Unregistered Sales of Equity Securities and Use of Proceeds
|
|
|
20
|
|
| |
|
|
|
|
|
|
Item 6.
|
Exhibits
|
|
|
20
|
|
| |
|
|
|
|
|
|
SIGNATURES
|
|
|
21
|
|
FORWARD LOOKING STATEMENTS
The following discussion should be read in conjunction with the financial statements and related notes contained elsewhere in this quarterly report on Form 10-Q. We make forward-looking statements in this report, in other materials we file with the Securities and Exchange Commission (the “SEC”) or that we otherwise release to the public, and on our website. In addition, our senior management might make forward-looking statements orally to analysts, investors, the media, and others. These statements are “forward-looking statements” within the meaning of Section 27A of the Securities Act of 1933, as amended, and 21E of the Securities Exchange Act of 1934, as amended. Statements concerning our future operations, prospects, strategies, financial condition, future economic performance (including growth and earnings) and demand for our products and services, and other statements of our plans, beliefs, or expectations, including the statements contained in Item 2, “Management’s Discussion and Analysis of Financial Condition and Results of Operations” regarding our future plans, strategies and expectations are forward-looking statements. In some cases these statements are identifiable through the use of words such as “anticipate,” “believe,” “estimate,” “predict,” “expect,” “intend,” “plan,” “project,” “target,” “continue,” “can,” “could,” “may,” “should,” “will,” “would,” and similar expressions. You are cautioned not to place undue reliance on these forward-looking statements because these forward-looking statements we make are not guarantees of future performance and are subject to various assumptions, risks, and other factors that could cause actual results to differ materially from those suggested by these forward-looking statements. Thus, our ability to predict results or the actual effect of our future plans or strategies is inherently uncertain. Factors which could have a material adverse effect on our operations and future prospects include, but are not limited to, our ability to retain and attract customers, particularly in light of our dependence on a single customer for substantially all of our revenue; our expectations regarding our expenses and revenue, including our expectations that our research and development expenses and selling, general and administrative expenses may increase in absolute dollars; our material weakness in internal control over financial reporting; anticipated trends and challenges in our business and the markets in which we operate, including the market for smart grid technologies; our expectations regarding competition as more and larger companies enter our markets and as existing competitors improve or expand their product offerings; our plans for future products and enhancements of existing products; our anticipated cash needs and our estimates regarding our capital requirements; and our anticipated growth strategies. These risks and uncertainties, together with the other risks described from time to time in reports and documents that we file with the SEC, should be considered in evaluating forward-looking statements. Although we believe that the expectations reflected in the forward-looking statements are reasonable, we cannot guarantee future results, performance or achievements. Indeed, it is likely that some of our assumptions will prove to be incorrect. Our actual results and financial position will vary from those projected or implied in the forward-looking statements and the variances may be material. Moreover, we do not assume the responsibility for the accuracy and completeness of these forward-looking statements. We expressly disclaim any obligation to update or revise any forward-looking statements, whether as a result of new information, future events, or otherwise, except as required by law.
AMBIENT CORPORATION
BALANCE SHEETS
(in thousands, except share and per share data)
| |
|
June 30,
|
|
|
December 31,
|
|
| |
|
2012
|
|
|
2011
|
|
|
Assets
|
|
(unaudited)
|
|
|
(Restated)
|
|
|
Current assets:
|
|
|
|
|
|
|
|
Cash and cash equivalents
|
|
$
|
16,475
|
|
|
$
|
17,965
|
|
|
Accounts receivable
|
|
|
2,955
|
|
|
|
284
|
|
|
Inventory
|
|
|
777
|
|
|
|
1,460
|
|
|
Prepaid expenses and other current assets
|
|
|
249
|
|
|
|
527
|
|
|
Total current assets
|
|
|
20,456
|
|
|
|
20,236
|
|
| |
|
|
|
|
|
|
|
|
|
Property and equipment, net
|
|
|
1,274
|
|
|
|
1,249
|
|
|
Deferred finance costs
|
|
|
-
|
|
|
|
389
|
|
| |
|
|
|
|
|
|
|
|
|
Total assets
|
|
$
|
21,730
|
|
|
$
|
21,874
|
|
| |
|
|
|
|
|
|
|
|
|
Liabilities and Stockholders' Equity
|
|
|
|
|
|
|
|
|
|
Current liabilities:
|
|
|
|
|
|
|
|
|
|
Accounts payable
|
|
$
|
3,257
|
|
|
$
|
3,920
|
|
|
Accrued expenses and other current liabilities
|
|
|
1,034
|
|
|
|
714
|
|
|
Deferred revenue
|
|
|
587
|
|
|
|
453
|
|
|
Accrued warranty
|
|
|
118
|
|
|
|
115
|
|
|
Income taxes payable
|
|
|
-
|
|
|
|
41
|
|
|
Warrant liability
|
|
|
531
|
|
|
|
671
|
|
|
Total current liabilities
|
|
|
5,527
|
|
|
|
5,914
|
|
|
Non-current liabilities
|
|
|
|
|
|
|
|
|
|
Deferred rent
|
|
|
-
|
|
|
|
99
|
|
|
Total liabilities
|
|
|
5,527
|
|
|
|
6,013
|
|
| |
|
|
|
|
|
|
|
|
|
Stockholders' Equity:
|
|
|
|
|
|
|
|
|
|
Common stock, $0.001 par value;
|
|
|
|
|
|
|
|
|
|
100,000,000 shares authorized;
|
|
|
|
|
|
|
|
|
|
16,628,325 and 16,567,384 shares issued; and
|
|
|
|
|
|
|
|
|
|
16,628,325 and 16,557,384 shares outstanding, respectively
|
|
|
17
|
|
|
|
17
|
|
|
Additional paid-in capital
|
|
|
238,891
|
|
|
|
237,421
|
|
|
Accumulated deficit
|
|
|
(222,705
|
)
|
|
|
(221,377
|
)
|
|
Less: treasury stock; 0 and 10,000 shares at cost
|
|
|
-
|
|
|
|
(200
|
)
|
|
Total stockholders' equity
|
|
|
16,203
|
|
|
|
15,861
|
|
| |
|
|
|
|
|
|
|
|
|
Total liabilities and stockholders' equity
|
|
$
|
21,730
|
|
|
$
|
21,874
|
|
The accompanying notes are an integral part of these financial statements.
AMBIENT CORPORATION
STATEMENTS OF OPERATIONS AND COMPREHENSIVE INCOME
(UNAUDITED)
(in thousands, except per share data)
| |
|
Three Months Ended June 30,
|
|
|
Six Months Ended June 30,
|
|
| |
|
2012
|
|
|
2011
|
|
|
2012
|
|
|
2011
|
|
| |
|
|
|
|
(Restated)
|
|
|
|
|
|
(Restated)
|
|
| |
|
|
|
|
|
|
|
|
|
|
|
|
|
Total revenue
|
|
$ |
9,956 |
|
|
$ |
15,914 |
|
|
$ |
23,231 |
|
|
$ |
27,862 |
|
|
Cost of goods sold
|
|
|
5,652 |
|
|
|
9,140 |
|
|
|
13,134 |
|
|
|
15,941 |
|
|
Gross profit
|
|
|
4,304 |
|
|
|
6,774 |
|
|
|
10,097 |
|
|
|
11,921 |
|
| |
|
|
|
|
|
|
|
|
|
|
|
|
|
|
|
|
|
Operating expenses:
|
|
|
|
|
|
|
|
|
|
|
|
|
|
|
|
|
|
Research and development expenses
|
|
|
3,605 |
|
|
|
2,719 |
|
|
|
6,951 |
|
|
|
4,718 |
|
|
Selling, general and administrative expenses
|
|
|
2,116 |
|
|
|
1,349 |
|
|
|
4,244 |
|
|
|
3,185 |
|
|
Write-off of deferred financing costs
|
|
|
- |
|
|
|
- |
|
|
|
389 |
|
|
|
- |
|
|
Total operating expenses
|
|
|
5,721 |
|
|
|
4,068 |
|
|
|
11,584 |
|
|
|
7,903 |
|
| |
|
|
|
|
|
|
|
|
|
|
|
|
|
|
|
|
|
Operating (loss) income
|
|
|
(1,417 |
) |
|
|
2,706 |
|
|
|
(1,487 |
) |
|
|
4,018 |
|
| |
|
|
|
|
|
|
|
|
|
|
|
|
|
|
|
|
|
Interest income, net
|
|
|
2 |
|
|
|
6 |
|
|
|
4 |
|
|
|
12 |
|
|
Mark-to-market adjustment of warrant liability
|
|
|
180 |
|
|
|
872 |
|
|
|
(9 |
) |
|
|
1,922 |
|
|
Other income
|
|
|
91 |
|
|
|
- |
|
|
|
164 |
|
|
|
- |
|
|
Total other income
|
|
|
273 |
|
|
|
878 |
|
|
|
159 |
|
|
|
1,934 |
|
| |
|
|
|
|
|
|
|
|
|
|
|
|
|
|
|
|
|
(Loss) income before taxes
|
|
|
(1,144 |
) |
|
|
3,584 |
|
|
|
(1,328 |
) |
|
|
5,952 |
|
| |
|
|
|
|
|
|
|
|
|
|
|
|
|
|
|
|
|
Provision for income taxes
|
|
|
- |
|
|
|
81 |
|
|
|
- |
|
|
|
109 |
|
| |
|
|
|
|
|
|
|
|
|
|
|
|
|
|
|
|
|
Net (loss) income and comprehensive (loss) income
|
|
$ |
(1,144 |
) |
|
$ |
3,503 |
|
|
$ |
(1,328 |
) |
|
$ |
5,843 |
|
| |
|
|
|
|
|
|
|
|
|
|
|
|
|
|
|
|
|
Net (loss) income per share (basic)
|
|
$ |
(0.07 |
) |
|
$ |
0.21 |
|
|
$ |
(0.08 |
) |
|
$ |
0.35 |
|
|
Net (loss) income per share (diluted)
|
|
$ |
(0.07 |
) |
|
$ |
0.21 |
|
|
$ |
(0.08 |
) |
|
$ |
0.35 |
|
| |
|
|
|
|
|
|
|
|
|
|
|
|
|
|
|
|
|
Weighted average shares used in computing basic net (loss) income per share
|
|
|
16,615 |
|
|
|
16,505 |
|
|
|
16,592 |
|
|
|
16,496 |
|
|
Weighted average shares used in computing diluted net (loss) income per share
|
|
|
16,615 |
|
|
|
16,909 |
|
|
|
16,592 |
|
|
|
16,936 |
|
| |
|
|
|
|
|
|
|
|
|
|
|
|
|
|
|
|
The accompanying notes are an integral part of these financial statements.
AMBIENT CORPORATION
STATEMENTS OF CASH FLOWS
(UNAUDITED)
(in thousands)
| |
|
June 30,
|
|
|
June 30,
|
|
| |
|
2012
|
|
|
2011
|
|
| |
|
|
|
|
(Restated)
|
|
|
CASH FLOWS FROM OPERATING ACTIVITIES
|
|
|
|
|
|
|
|
Net (loss) income
|
|
$ |
(1,328 |
) |
|
$ |
5,843 |
|
|
Adjustments to reconcile net (loss) income to net cash provided by operating activities:
|
|
|
|
|
|
|
|
|
|
Depreciation and amortization
|
|
|
259 |
|
|
|
206 |
|
|
Amortization of beneficial conversion feature of convertible debt
|
|
|
|
|
|
|
- |
|
|
Stock-based compensation
|
|
|
1,272 |
|
|
|
787 |
|
|
Write-off of deferred finance costs
|
|
|
389 |
|
|
|
- |
|
|
Mark-to-market adjustment of warrant liability
|
|
|
9 |
|
|
|
(1,922 |
) |
|
Changes in operating assets and liabilities:
|
|
|
|
|
|
|
- |
|
|
Accounts receivable
|
|
|
(2,671 |
) |
|
|
1,253 |
|
|
Inventory
|
|
|
683 |
|
|
|
(1,618 |
) |
|
Prepaid expenses and other current assets
|
|
|
278 |
|
|
|
2 |
|
|
Accounts payable
|
|
|
(663 |
) |
|
|
1,022 |
|
|
Deferred rent
|
|
|
(50 |
) |
|
|
(43 |
) |
|
Accrued warranty
|
|
|
3 |
|
|
|
- |
|
|
Accrued expenses and other current liabilities
|
|
|
271 |
|
|
|
64 |
|
|
Income taxes payable
|
|
|
(41 |
) |
|
|
109 |
|
|
Deferred revenue
|
|
|
134 |
|
|
|
237 |
|
|
Net cash (used)/provided by operating activities
|
|
|
(1,455 |
) |
|
|
5,940 |
|
| |
|
|
|
|
|
|
|
|
|
CASH FLOWS FROM INVESTING ACTIVITIES
|
|
|
|
|
|
|
|
|
|
Purchases of property and equipment
|
|
|
(284 |
) |
|
|
(511 |
) |
|
Net cash used in investing activities
|
|
|
(284 |
) |
|
|
(511 |
) |
| |
|
|
|
|
|
|
|
|
|
CASH FLOWS FROM FINANCING ACTIVITES
|
|
|
|
|
|
|
|
|
|
Proceeds from exercise of warrants
|
|
|
245 |
|
|
|
106 |
|
|
Proceeds from exercise of stock options
|
|
|
4 |
|
|
|
30 |
|
|
Payments of capitalized lease obligations
|
|
|
- |
|
|
|
(7 |
) |
|
Net cash provided by financing activities
|
|
|
249 |
|
|
|
129 |
|
| |
|
|
|
|
|
|
|
|
|
(DECREASE)/INCREASE IN CASH AND CASH EQUIVALENTS
|
|
|
(1,491 |
) |
|
|
5,558 |
|
| |
|
|
|
|
|
|
|
|
|
CASH AND CASH EQUIVALENTS - BEGINNING OF PERIOD
|
|
|
17,965 |
|
|
|
6,987 |
|
| |
|
|
|
|
|
|
|
|
|
CASH AND CASH EQUIVALENTS - END OF PERIOD
|
|
$ |
16,475 |
|
|
$ |
12,545 |
|
| |
|
|
|
|
|
|
|
|
|
Supplemental disclosures of cash flow information:
|
|
|
|
|
|
|
|
|
|
Interest paid
|
|
$ |
- |
|
|
$ |
246 |
|
|
Income taxes paid
|
|
$ |
54 |
|
|
$ |
- |
|
The accompanying notes are an integral part of these financial statements.
AMBIENT CORPORATION
NOTES TO THE UNAUDITED CONSOLIDATED FINANCIAL STATEMENTS
NOTE 1 - BASIS OF PRESENTATION
The accompanying unaudited financial statements of Ambient Corporation (the “Company,” “we” or “our”) have been prepared in accordance with accounting principles generally accepted in the United States of America (“GAAP”) for interim financial information and with Article 8-03 of Regulation S-X. Accordingly, they do not include all of the information and notes required by GAAP for complete financial statements. In the opinion of management, all adjustments (consisting of normal recurring accruals) considered necessary for a fair statement have been included. Operating results for the six months ended June 30, 2012 are not necessarily indicative of the results that may be expected for the full year ending December 31, 2012.
These unaudited financial statements should be read in conjunction with the audited financial statements and notes thereto included in our Amendment No. 1 to Annual Report on Form 10-K/A for the year ended December 31, 2011, as filed with the Securities and Exchange Commission.
We are a leading provider of a smart grid communications platform that enables utilities to effectively deploy, integrate and communicate with multiple smart grid applications within the electric power distribution grid. The Ambient Smart Grid® communications platform, which includes hardware, software and firmware, provides the network platform to effectively manage the distribution network and individual smart grid applications. Our innovative communications platform enables utilities to deploy and integrate multiple smart grid applications and technologies, in parallel on a single communications infrastructure, supporting smart metering, distribution automation, distribution management, demand response, distributed generation and more.
Our long-standing relationship with Duke Energy, which we believe has one of the most forward-looking smart grid investment initiatives in North America, has led to rapid growth in our business, and we entered into a long-term agreement in September 2009 with them to supply them with our Ambient Smart Grid® communications nodes and license our AmbientNMS® through 2015.
On July 18, 2011, we implemented a reverse stock split of our issued and outstanding shares of common stock at a ratio of 1-for 100 shares (the “Reverse Split”). The Reverse Split became effective on July 18, 2011 and has been reflected in this Quarterly Report on Form 10-Q.
NOTE 2 – RESTATEMENT OF FINANCIAL STATEMENTS
Background of Restatement
In connection with the preparation of Form 10-Q for the quarter ended June 30, 2012, management of the Company concluded that certain previously filed financial statements did not properly account for embedded derivative features of certain historical debt and warrants issued by the Company, which are described in detail below.
Convertible Debt: Certain historical convertible notes (the “Notes”) issued by the Company were previously recorded at their discounted face value. The discounts were comprised of both beneficial conversion features associated with the Notes and the fair value of warrants issued in connection with the Notes. However, the Notes contained certain features, including anti-dilution price protection and others that, in accordance with ASC-815, Derivatives and Hedging (“ASC 815”), should have been bifurcated from the host contract and accounted for as a derivative instrument (the “Embedded Derivatives”). Such Embedded Derivatives are recorded as a separate liability at their fair value on the date of issuance, and as a corresponding discount to the Notes which is amortized as interest expense over the term of the Notes. Changes in the fair values of these instruments require adjustments to the amount of the liabilities recorded on the Company’s balance sheet, and the corresponding gain or loss is required to be recorded in the Company’s statement of operations, and comprehensive income as long as the Notes are outstanding.
Warrants: In connection with issuing the Notes, as well as in connection with other financing transactions, the Company issued warrants to purchase common stock (collectively, the “Warrants”). The Company had previously classified the value of the Warrants as equity. After further review, the Company determined that these instruments should have been classified as liabilities in accordance with ASC 815, due primarily to an anti-dilution price protection feature. Changes in the fair values of these instruments require adjustments to the amount of the liabilities recorded on the Company’s balance sheet, and the corresponding gain or loss is required to be recorded in the Company’s statement of operations and comprehensive income.
Stock-based Compensation: The Company had previously used volatility assumptions based on the historical volatility of the price of the Company's common stock, which, based on the historical trading activity of the stock, resulted in inflated price volatilities that were not necessarily indicative of the expected volatility and were substantially higher than other peer-industry companies. Upon further review of the volatility assumptions, the Company determined that it was more appropriate to use an expected volatility based on the volatilities of its industry peer group. Such an approach was used to determine appropriate volatility assumptions for valuation purposes of the Embedded Derivatives and Warrants. As a result, assumed volatilities are lower than those previously used, which reduces stock-based compensation expense.
In addition to the adjustments listed above, the Company recorded immaterial adjustments to revenue to account for the deferral of maintenance revenue arising from the initial period of free maintenance provided upon shipment of our communication nodes.
All of the necessary adjustments relating to the Notes and Warrants are non-cash in nature and do not impact the Company’s total cash flows from operating, investing and financing activities. The adjustments are primarily related to complex accounting requirements of certain characteristics of the Notes and Warrants that require the recording of debt discounts and related amortization, mark-to-market adjustments in the fair value of Warrants and Embedded Derivatives and gains or losses associated with the extinguishment of debt under certain circumstances.
As a result of these cumulative adjustments, as of December 31, 2011, accumulated deficit increased from $138.7 million to $221.4 million and additional paid in capital increased from $155.7 million to $237.4 million. At December 31, 2011, the net impact of the cumulative adjustments was approximately $1.0 million to overall stockholders’ equity.
The following table presents the balance sheet at December 31, 2011 as reported in our Form 10-K filed on March 6, 2012, compared to the restated accounts as reported in our Form 10-K/A filed on September 24, 2012:
| (in thousands) |
|
For the year ended December 31, 2011
|
|
| |
|
As Reported
|
|
|
Adjustments
|
|
|
Restated
|
|
|
ASSETS
|
|
|
|
|
|
|
|
|
|
|
CURRENT ASSETS
|
|
|
|
|
|
|
|
|
|
|
Cash and cash equivalents
|
|
$ |
17,965 |
|
|
$ |
- |
|
|
$ |
17,965 |
|
|
Accounts receivable
|
|
|
284 |
|
|
|
- |
|
|
|
284 |
|
|
Inventory
|
|
|
1,460 |
|
|
|
- |
|
|
|
1,460 |
|
|
Prepaid expenses and other current assets
|
|
|
527 |
|
|
|
- |
|
|
|
527 |
|
| |
|
|
|
|
|
|
|
|
|
|
|
|
|
Total current assets
|
|
|
20,236 |
|
|
|
- |
|
|
|
20,236 |
|
| |
|
|
|
|
|
|
|
|
|
|
|
|
|
Property and equipment, net
|
|
|
1,249 |
|
|
|
- |
|
|
|
1,249 |
|
|
Deferred financing costs, net
|
|
|
389 |
|
|
|
- |
|
|
|
389 |
|
| |
|
|
|
|
|
|
|
|
|
|
|
|
|
Total assets
|
|
$ |
21,874 |
|
|
$ |
- |
|
|
$ |
21,874 |
|
| |
|
|
|
|
|
|
|
|
|
|
|
|
|
LIABILITIES AND STOCKHOLDERS' EQUITY
|
|
|
|
|
|
|
|
|
|
|
|
|
|
CURRENT LIABILITIES
|
|
|
|
|
|
|
|
|
|
|
|
|
|
Accounts payable
|
|
$ |
3,920 |
|
|
$ |
- |
|
|
$ |
3,920 |
|
|
Accrued expenses and other current liabilities
|
|
|
714 |
|
|
|
- |
|
|
|
714 |
|
|
Deferred revenue
|
|
|
119 |
|
|
|
334 |
|
|
|
453 |
|
|
Accrued warranty
|
|
|
115 |
|
|
|
- |
|
|
|
115 |
|
|
Income taxes payable
|
|
|
41 |
|
|
|
- |
|
|
|
41 |
|
|
Warrant liability
|
|
|
- |
|
|
|
671 |
|
|
|
671 |
|
| |
|
|
|
|
|
|
|
|
|
|
|
|
|
Total current liabilities
|
|
|
4,909 |
|
|
|
1,005 |
|
|
|
5,914 |
|
| |
|
|
|
|
|
|
|
|
|
|
|
|
|
NON-CURRENT LIABILITIES
|
|
|
|
|
|
|
|
|
|
|
|
|
|
Deferred rent
|
|
|
99 |
|
|
|
- |
|
|
|
99 |
|
| |
|
|
|
|
|
|
|
|
|
|
|
|
|
Total liabilities
|
|
|
5,008 |
|
|
|
1,005 |
|
|
|
6,013 |
|
| |
|
|
|
|
|
|
|
|
|
|
|
|
|
COMMITMENTS AND CONTINGENCIES
|
|
|
|
|
|
|
|
|
|
|
|
|
| |
|
|
|
|
|
|
|
|
|
|
|
|
|
STOCKHOLDERS' EQUITY
|
|
|
|
|
|
|
|
|
|
|
|
|
|
Common stock, $.001 par value;
|
|
|
|
|
|
|
|
|
|
|
|
|
|
100,000,000 shares authorized;
|
|
|
|
|
|
|
|
|
|
|
|
|
|
16,567,384 shares issued; and
|
|
|
|
|
|
|
|
|
|
|
|
|
|
16,557,384 shares outstanding
|
|
|
17 |
|
|
|
- |
|
|
|
17 |
|
|
Additional paid-in capital
|
|
|
155,707 |
|
|
|
81,714 |
|
|
|
237,421 |
|
|
Accumulated deficit
|
|
|
(138,658 |
) |
|
|
(82,719 |
) |
|
|
(221,377 |
) |
|
Less: treasury stock; 10,000 shares at cost
|
|
|
(200 |
) |
|
|
- |
|
|
|
(200 |
) |
| |
|
|
|
|
|
|
|
|
|
|
|
|
|
Total stockholders' equity
|
|
|
16,866 |
|
|
|
(1,005 |
) |
|
|
15,861 |
|
| |
|
|
|
|
|
|
|
|
|
|
|
|
|
Total liabilities and stockholders' equity
|
|
$ |
21,874 |
|
|
$ |
- |
|
|
$ |
21,874 |
|
The following table presents the statements of operations and comprehensive income for the three and six months ended June 30, 2011, as reported in our Form 10-Q filed on August 10, 2011, compared to the restated accounts as reported in our Form 10-K/A filed on September 24, 2012:
|
(in thousands, except per share data)
|
|
Three Months Ended June 30, 2011
(unaudited)
|
|
|
Six Months Ended June 30, 2011
(unaudited)
|
|
| |
|
As Reported
|
|
|
Adjustment
|
|
|
Restated
|
|
|
As Reported
|
|
|
Adjustment
|
|
|
Restated
|
|
| |
|
|
|
|
|
|
|
|
|
|
|
|
|
|
|
|
|
|
|
Total revenue
|
|
$ |
15,986 |
|
|
$ |
(72 |
) |
|
$ |
15,914 |
|
|
$ |
27,992 |
|
|
$ |
(130 |
) |
|
$ |
27,862 |
|
|
Cost of goods sold
|
|
|
9,162 |
|
|
|
(22 |
) |
|
|
9,140 |
|
|
|
15,963 |
|
|
|
(22 |
) |
|
|
15,941 |
|
|
Gross profit
|
|
|
6,824 |
|
|
|
(50 |
) |
|
|
6,774 |
|
|
|
12,029 |
|
|
|
(108 |
) |
|
|
11,921 |
|
| |
|
|
|
|
|
|
|
|
|
|
|
|
|
|
|
|
|
|
|
|
|
|
|
|
|
Operating expenses:
|
|
|
|
|
|
|
|
|
|
|
|
|
|
|
|
|
|
|
|
|
|
|
|
|
|
Research and development expenses
|
|
|
2,805 |
|
|
|
(86 |
) |
|
|
2,719 |
|
|
|
4,893 |
|
|
|
(175 |
) |
|
|
4,718 |
|
|
Selling, general and administrative expenses
|
|
|
1,496 |
|
|
|
(147 |
) |
|
|
1,349 |
|
|
|
3,507 |
|
|
|
(322 |
) |
|
|
3,185 |
|
| |
|
|
|
|
|
|
|
|
|
|
|
|
|
|
|
|
|
|
|
|
|
|
|
|
|
Total operating expenses
|
|
|
4,301 |
|
|
|
(233 |
) |
|
|
4,068 |
|
|
|
8,400 |
|
|
|
(497 |
) |
|
|
7,903 |
|
| |
|
|
|
|
|
|
|
|
|
|
|
|
|
|
|
|
|
|
|
|
|
|
|
|
|
Operating income
|
|
|
2,523 |
|
|
|
183 |
|
|
|
2,706 |
|
|
|
3,629 |
|
|
|
389 |
|
|
|
4,018 |
|
| |
|
|
|
|
|
|
|
|
|
|
|
|
|
|
|
|
|
|
|
|
|
|
|
|
|
Interest income, net
|
|
|
6 |
|
|
|
- |
|
|
|
6 |
|
|
|
12 |
|
|
|
- |
|
|
|
12 |
|
|
Mark-to-market adjustment of warrant liability
|
|
|
- |
|
|
|
872 |
|
|
|
872 |
|
|
|
- |
|
|
|
1,922 |
|
|
|
1,922 |
|
|
Total other income
|
|
|
6 |
|
|
|
872 |
|
|
|
878 |
|
|
|
12 |
|
|
|
1,922 |
|
|
|
1,934 |
|
| |
|
|
|
|
|
|
|
|
|
|
|
|
|
|
|
|
|
|
|
|
|
|
|
|
|
Income before taxes
|
|
|
2,529 |
|
|
|
1,055 |
|
|
|
3,584 |
|
|
|
3,641 |
|
|
|
2,311 |
|
|
|
5,952 |
|
| |
|
|
|
|
|
|
|
|
|
|
|
|
|
|
|
|
|
|
|
|
|
|
|
|
|
Provision for income taxes
|
|
|
81 |
|
|
|
- |
|
|
|
81 |
|
|
|
109 |
|
|
|
- |
|
|
|
109 |
|
| |
|
|
|
|
|
|
|
|
|
|
|
|
|
|
|
|
|
|
|
|
|
|
|
|
|
Net income and comprehensive income
|
|
$ |
2,448 |
|
|
$ |
1,055 |
|
|
$ |
3,503 |
|
|
$ |
3,532 |
|
|
$ |
2,311 |
|
|
$ |
5,843 |
|
| |
|
|
|
|
|
|
|
|
|
|
|
|
|
|
|
|
|
|
|
|
|
|
|
|
|
Net income per share (basic)
|
|
$ |
0.15 |
|
|
$ |
0.06 |
|
|
$ |
0.21 |
|
|
$ |
0.21 |
|
|
$ |
0.14 |
|
|
$ |
0.35 |
|
|
Net income per share (diluted)
|
|
$ |
0.14 |
|
|
$ |
0.06 |
|
|
$ |
0.21 |
|
|
$ |
0.21 |
|
|
$ |
0.14 |
|
|
$ |
0.35 |
|
| |
|
|
|
|
|
|
|
|
|
|
|
|
|
|
|
|
|
|
|
|
|
|
|
|
|
Weighted average shares used in computing basic net income per share
|
|
|
16,505 |
|
|
|
16,505 |
|
|
|
16,505 |
|
|
|
16,496 |
|
|
|
16,496 |
|
|
|
16,496 |
|
|
Weighted average shares used in computing diluted net income per share
|
|
|
16,909 |
|
|
|
16,909 |
|
|
|
16,909 |
|
|
|
16,936 |
|
|
|
16,936 |
|
|
|
16,936 |
|
The following table presents the statements of cash flows for the six months ended June 30, 2011, as reported in our Form 10-Q filed on August 10, 2011, compared to the restated accounts as reported in our Form 10-K/A filed on September 24, 2012:
| |
|
Six Months Ended June 30, 2011
(unaudited)
|
|
| |
|
As Reported
|
|
|
Adjustments
|
|
|
Restated
|
|
|
CASH FLOWS FROM OPERATING ACTIVITIES
|
|
|
|
|
|
|
|
|
|
|
Net income
|
|
$ |
3,532 |
|
|
$ |
2,311 |
|
|
$ |
5,843 |
|
|
Adjustments to reconcile net income to net cash provided by operating activities:
|
|
|
|
|
|
|
|
|
|
|
|
|
|
Depreciation and amortization
|
|
|
206 |
|
|
|
- |
|
|
|
206 |
|
|
Stock-based compensation
|
|
|
1,306 |
|
|
|
(519 |
) |
|
|
787 |
|
|
Mark-to-market adjustment of warrant liability
|
|
|
|
|
|
|
(1,922 |
) |
|
|
(1,922 |
) |
|
Changes in operating assets and liabilities:
|
|
|
|
|
|
|
|
|
|
|
|
|
|
Accounts receivable
|
|
|
1,253 |
|
|
|
- |
|
|
|
1,253 |
|
|
Inventory
|
|
|
(1,618 |
) |
|
|
- |
|
|
|
(1,618 |
) |
|
Prepaid expenses and other current assets
|
|
|
2 |
|
|
|
- |
|
|
|
2 |
|
|
Accounts payable
|
|
|
1,022 |
|
|
|
- |
|
|
|
1,022 |
|
|
Accrued expenses and other current liabilities
|
|
|
64 |
|
|
|
- |
|
|
|
64 |
|
|
Deferred revenue
|
|
|
107 |
|
|
|
130 |
|
|
|
237 |
|
|
Income taxes payable
|
|
|
109 |
|
|
|
- |
|
|
|
109 |
|
|
Deferred rent
|
|
|
(43 |
) |
|
|
- |
|
|
|
(43 |
) |
| |
|
|
|
|
|
|
|
|
|
|
|
|
|
Net cash provided by operating activities
|
|
|
5,940 |
|
|
|
- |
|
|
|
5,940 |
|
| |
|
|
|
|
|
|
|
|
|
|
|
|
|
CASH FLOWS FROM INVESTING ACTIVITIES
|
|
|
|
|
|
|
|
|
|
|
|
|
|
Purchases of property and equipment
|
|
|
(511 |
) |
|
|
- |
|
|
|
(511 |
) |
|
Net cash used in investing activities
|
|
|
(511 |
) |
|
|
- |
|
|
|
(511 |
) |
| |
|
|
|
|
|
|
|
|
|
|
|
|
|
CASH FLOWS FROM FINANCING ACTIVITES
|
|
|
|
|
|
|
|
|
|
|
|
|
|
Proceeds from exercise of warrants
|
|
|
106 |
|
|
|
- |
|
|
|
106 |
|
|
Proceeds from exercise of stock options
|
|
|
30 |
|
|
|
- |
|
|
|
30 |
|
|
Payments of capitalized lease obligations
|
|
|
(7 |
) |
|
|
- |
|
|
|
(7 |
) |
|
Net cash provided by financing activities
|
|
|
129 |
|
|
|
- |
|
|
|
129 |
|
| |
|
|
|
|
|
|
|
|
|
|
|
|
|
INCREASE IN CASH AND CASH EQUIVALENTS
|
|
|
5,558 |
|
|
|
- |
|
|
|
5,558 |
|
| |
|
|
|
|
|
|
|
|
|
|
|
|
|
CASH AND CASH EQUIVALENTS - BEGINNING OF YEAR
|
|
|
6,987 |
|
|
|
- |
|
|
|
6,987 |
|
| |
|
|
|
|
|
|
|
|
|
|
|
|
|
CASH AND CASH EQUIVALENTS - END OF YEAR
|
|
$ |
12,545 |
|
|
$ |
- |
|
|
$ |
12,545 |
|
| |
|
|
|
|
|
|
|
|
|
|
|
|
| Supplemental disclosures of cash flow information: |
|
|
|
|
|
|
|
|
|
|
|
|
|
Interest paid
|
|
$ |
246 |
|
|
|
|
|
|
$ |
246 |
|
NOTE 3 - RECENTLY ISSUED ACCOUNTING PRONOUNCEMENTS
In June 2011, the Financial Accounting Standards Board (FASB) issued Accounting Statements Update (ASU) No. 2011-05: Comprehensive Income (Topic 220): Presentation of Comprehensive Income (ASU 2011-05). ASU 2011-05 provides that an entity that reports items of other comprehensive income has the option to present comprehensive income in either one continuous financial statement or two consecutive financial statements. ASU 2011-05 is effective for annual periods beginning after December 15, 2011. The Company adopted ASU 2011-05 on January 1, 2012 and reports items of other comprehensive income in one continuous financial statement in the Statement of Operations and Other Comprehensive Income.
We do not believe that any other recently issued, but not yet effective, accounting standard if currently adopted would have a material effect on the accompanying financial statements.
NOTE 4 - FAIR VALUE OF FINANCIAL INSTRUMENTS
We account for certain assets and liabilities at fair value. The hierarchy below lists three levels of fair value based on the extent to which inputs used in measuring fair value are observable in the market. We categorize each of our fair value measurements in one of these three levels based on the lowest level of input that is significant to the fair value measurement in its entirety. These levels are.
|
|
●
|
Level 1 - Quoted prices in active markets for identical assets or liabilities.
|
|
|
●
|
Level 2 - Observable inputs other than Level 1 prices, such as quoted prices for similar assets or liabilities; quoted prices in markets that are not active; or other inputs that are observable or can be corroborated by observable market data for substantially the full term of the assets or liabilities which include certificates of deposits and money market funds.
|
|
|
●
|
Level 3 - Unobservable inputs that are supported by little or no market activity and that are significant to the fair value of the assets or liabilities, including liabilities resulting from embedded derivatives associated with certain warrants to purchase common stock (see Note 12).
|
The following table provides the assets and liabilities at fair value measured on a recurring basis as of June 30, 2012 and December 31, 2011:
|
(in thousands)
|
|
June 30, 2012
(unaudited)
|
|
| |
|
Total Carrying Value
|
|
|
Quoted Prices in Active Markets
|
|
|
Using Significant Other Observable Inputs
|
|
|
Using Significant Unobservable Inputs
|
|
| |
|
|
|
|
(Level 1)
|
|
|
(Level 2)
|
|
|
(Level 3)
|
|
| |
|
|
|
|
|
|
|
|
|
|
|
|
|
Assets:
|
|
|
|
|
|
|
|
|
|
|
|
|
|
Cash and cash equivalents:
|
|
|
|
|
|
|
|
|
|
|
|
|
|
Money market funds and certificates of deposits
|
|
$ |
17,106 |
|
|
$ |
- |
|
|
$ |
17,106 |
|
|
$ |
- |
|
|
Total assets
|
|
|
17,106 |
|
|
|
- |
|
|
|
17,106 |
|
|
|
- |
|
| |
|
|
|
|
|
|
|
|
|
|
|
|
|
|
|
|
|
Current liabilities:
|
|
|
|
|
|
|
|
|
|
|
|
|
|
|
|
|
|
Warrant liabilities
|
|
|
531 |
|
|
|
- |
|
|
|
- |
|
|
|
531 |
|
|
Total liabilities
|
|
$ |
531 |
|
|
$ |
- |
|
|
$ |
- |
|
|
$ |
531 |
|
| |
|
|
|
|
|
|
|
|
|
|
|
|
|
|
|
|
| |
|
|
|
|
|
|
|
|
|
|
|
|
|
|
|
|
| |
|
|
|
|
|
|
|
|
|
|
|
|
|
|
|
|
|
(in thousands)
|
|
December 31, 2011
(Restated)
|
|
| |
|
Total Carrying Value
|
|
|
Quoted Prices in Active Markets
|
|
|
Using Significant Other Observable Inputs
|
|
|
Using Significant Unobservable Inputs
|
|
| |
|
|
|
|
|
(Level 1)
|
|
|
(Level 2)
|
|
|
(Level 3)
|
|
| |
|
|
|
|
|
|
|
|
|
|
|
|
|
|
|
|
|
Assets:
|
|
|
|
|
|
|
|
|
|
|
|
|
|
|
|
|
|
Cash and cash equivalents:
|
|
|
|
|
|
|
|
|
|
|
|
|
|
|
|
|
|
Money market funds and certificates of deposits
|
|
$ |
17,622 |
|
|
$ |
- |
|
|
$ |
17,622 |
|
|
$ |
- |
|
|
Total assets
|
|
|
17,622 |
|
|
|
- |
|
|
|
17,622 |
|
|
|
- |
|
| |
|
|
|
|
|
|
|
|
|
|
|
|
|
|
|
|
|
Current liabilities:
|
|
|
|
|
|
|
|
|
|
|
|
|
|
|
|
|
|
Warrant liabilities
|
|
|
671 |
|
|
|
- |
|
|
|
- |
|
|
|
671 |
|
|
Total liabilities
|
|
$ |
671 |
|
|
$ |
- |
|
|
$ |
- |
|
|
$ |
671 |
|
NOTE 5 - STOCK-BASED COMPENSATION
The following table presents stock-based compensation expense included in our statements of operations for the three and six months ended June 30, 2012 and 2011 (unaudited):
| |
|
Three Months Ended
|
|
|
Six Months Ended
|
|
|
(in thousands)
|
|
June 30,
|
|
|
June 30,
|
|
| |
|
2012
|
|
|
2011
|
|
|
2012
|
|
|
2011
|
|
| |
|
(restated)
|
|
|
(restated)
|
|
| |
|
|
|
|
|
|
|
|
|
|
|
|
|
Cost of goods sold
|
|
$ |
72 |
|
|
$ |
34 |
|
|
$ |
150 |
|
|
$ |
34 |
|
|
Research and development
|
|
|
210 |
|
|
|
134 |
|
|
|
439 |
|
|
|
264 |
|
|
Selling, general and administrative expenses
|
|
|
337 |
|
|
|
230 |
|
|
|
683 |
|
|
|
488 |
|
| |
|
$ |
619 |
|
|
$ |
398 |
|
|
$ |
1,272 |
|
|
$ |
786 |
|
NOTE 6 - NET (LOSS) INCOME PER SHARE
Basic earnings per share are computed based on the weighted-average number of shares of our common stock outstanding. Diluted earnings per share are computed based on the weighted-average number of shares of our common stock, including common stock equivalents outstanding. Certain common shares consisting of stock options and warrants that would have an anti-dilutive effect were not included in the diluted earnings per share attributable to common stockholders for the three and six months ended June 30, 2012 and 2011.
The following is a reconciliation of the denominators of the basic and diluted earnings per share computations (unaudited):
| |
|
Three Months Ended
|
|
|
Six Months Ended
|
|
| |
|
June 30,
|
|
|
June 30,
|
|
|
(in thousands)
|
|
2012
|
|
|
2011
|
|
|
2012
|
|
|
2011
|
|
| |
|
|
|
|
|
|
| |
|
|
|
|
|
|
|
|
|
|
|
|
|
Weighted average shares outstanding used to compute basic earnings per share
|
|
|
16,615 |
|
|
|
16,505 |
|
|
|
16,592 |
|
|
|
16,496 |
|
| |
|
|
|
|
|
|
|
|
|
|
|
|
|
|
|
|
|
Effect of dilutive stock options and warrants
|
|
|
- |
|
|
|
404 |
|
|
|
- |
|
|
|
440 |
|
| |
|
|
|
|
|
|
|
|
|
|
|
|
|
|
|
|
|
Weighted average shares outstanding and dilutive securities used to compute dilutive earnings per share
|
|
|
16,615 |
|
|
|
16,909 |
|
|
|
16,592 |
|
|
|
16,936 |
|
| |
|
|
|
|
|
|
|
|
|
|
|
|
|
|
|
|
Anti-dilutive shares excluded from shares used to compute dilutive earnings per share
|
|
|
2,321 |
|
|
|
987 |
|
|
|
2,714 |
|
|
|
1,630 |
|
NOTE 7 - SALES AND CUSTOMER CONCENTRATION
Total revenue for the three and six months ended June 30, 2012 and 2011 was as follows (unaudited):
| |
|
Three Months Ended
|
|
|
Six Months Ended
|
|
|
(in thousands)
|
|
June 30,
|
|
|
June 30,
|
|
| |
|
2012
|
|
|
2011
|
|
|
2012
|
|
|
2011
|
|
| |
|
|
|
|
|
|
|
|
|
|
|
|
|
Products
|
|
$ |
9,790 |
|
|
$ |
15,867 |
|
|
$ |
22,945 |
|
|
$ |
27,780 |
|
|
Software maintenance
|
|
|
166 |
|
|
|
47 |
|
|
|
286 |
|
|
|
82 |
|
|
Total revenue
|
|
$ |
9,956 |
|
|
$ |
15,914 |
|
|
$ |
23,231 |
|
|
$ |
27,862 |
|
Duke Energy accounted for substantially all of the product and software maintenance revenue for the 2012 and 2011 periods and substantially all of the accounts receivable balance at June 30, 2012 and December 31, 2011.
NOTE 8 - INVENTORY
Inventory is valued at the lower of cost or market and is determined on first-in-first-out method (FIFO) basis. Market is determined as the replacement cost for direct materials and the net realizable value for finished goods. At June 30, 2012 and December 31, 2011, inventory of approximately $777,000 and $1.5 million, respectively, consisted of shipments in transit, which represents the cost of finished goods inventory shipped for which title has not yet passed to our customer. The value of inventory is adjusted for estimated obsolescence or unmarketable inventory equal to the difference between the cost of inventory and the estimated market value based upon assumptions about future demand and market conditions.
NOTE 9 - PRODUCT WARRANTY
The Company’s current standard product warranty includes a one-year warranty period for defects in material and craftsmanship under certain circumstances as specified in customer contracts. Due to the limited deployment of products, the Company did not historically accrue for the cost of warranty obligations and expensed any costs associated with repairing or replacing defective product as incurred. During the third quarter of 2011, the Company began accruing a liability of approximately 0.2% of current communications node revenues for the estimated future costs of meeting its warranty obligations, based on its actual historical return rate of products within the one-year warranty period. The Company makes and revises this estimate based on the number of communications nodes delivered and its historical experience with warranty claims. The Company continually monitors the quality of its products including the quality of the products produced by its U.S.-based contract manufacturer in China.
The Company engages in product quality programs and processes, including monitoring and evaluating the quality of component suppliers, in an effort to ensure the quality of its products and reduce its warranty exposure. The warranty obligation will be affected not only by product failure rates, but also the costs to repair or replace failed products and potential service and delivery costs incurred in correcting a product failure. If the Company’s actual product failure rates, repair or replacement costs, or service or delivery costs differ from these estimates, accrued warranty costs would be adjusted in the period that such events or costs become known.
The following table summarizes the activity of the Company’s warranty accrual for the six months ended June 30, 2012 and total year December 31, 2011:
| |
|
June 30,
|
|
|
December 31,
|
|
|
(in thousands)
|
|
2012
|
|
|
2011
|
|
| |
|
(unaudited)
|
|
|
|
|
| |
|
|
|
|
|
|
|
Balance at beginning of period
|
|
$ |
115 |
|
|
$ |
- |
|
|
Warranty costs accrued, net
|
|
|
37 |
|
|
|
115 |
|
|
Warrant costs incurred
|
|
|
(34 |
) |
|
|
- |
|
|
Balance at end of period
|
|
$ |
118 |
|
|
$ |
115 |
|
NOTE 10 – ACCRUED EXPENSES AND OTHER CURRENT LIABILITIES
| |
|
June 30,
|
|
|
December 31,
|
|
|
(in thousands)
|
|
2012
|
|
|
2011
|
|
| |
|
(unaudited)
|
|
|
|
|
| |
|
|
|
|
|
|
|
Accrued compensation and benefits
|
|
$ |
783 |
|
|
$ |
391 |
|
|
Accrued professional services
|
|
|
142 |
|
|
|
16 |
|
|
Accrued freight
|
|
|
- |
|
|
|
140 |
|
|
Accrued taxes
|
|
|
25 |
|
|
|
43 |
|
| Other accrued liabilities |
|
|
84 |
|
|
|
124 |
|
| |
|
$ |
1,034 |
|
|
$ |
714 |
|
The provision for income taxes at June 30, 2011 was comprised of federal alternative minimum tax. Significant components of deferred tax assets include net operating loss carryforwards and stock-based compensation. Due to the uncertainty of their realization, we have not recorded any income tax benefit as we have established valuation allowances for any such benefits.
NOTE 12 –WARRANT LIABILITIES
In connection with issuing the Notes, as well as in connection with other financing transactions, we issued Warrants which have been classified as liabilities in accordance with ASC 815, due primarily to an anti-dilution price protection feature. Changes in the fair values of these instruments require adjustments to the amount of the liabilities recorded on the Company’s balance sheet, and the corresponding gain or loss is required to be recorded in the Company’s statement of operations and comprehensive income. As such, we recorded a gain of approximately $872,000 and $1.9 million for the three and six months ended June 30, 2011, respectively, and a gain of approximately $180,000 and a loss of approximately $9,000 for the three and six months ended June 30, 2012, respectively. As of December 31, 2011 and June 30, 2012, warrant liabilities totaled approximately $671,000 million and $531,000, respectively.
Fair value of the Warrants is determined by management using a multiple scenario, probability-weighted option-pricing model using the following inputs: the fair value of the underlying common stock at the valuation measurement date; the risk-free interest rates; the expected dividend rates; the remaining contractual terms of the warrants; the expected volatility of the price of the underlying common stock; and the probability of certain events occurring.
The assumptions used by the Company to determine fair value for the Warrants as of June 30, 2012 and December 31, 2011 are summarized in the following tables:
| |
|
June 30,
2012
|
|
|
December 31, 2011
|
|
| |
|
(unaudited) |
|
|
|
|
|
Risk free interest rate
|
|
|
1.5 |
% |
|
|
1.7 |
% |
|
Expected life (yrs)
|
|
|
0.1-0.8 |
|
|
|
0.1-1.3 |
|
|
Expected volatility
|
|
|
62.3 |
% |
|
|
62.3 |
% |
|
Dividend yield
|
|
|
0 |
% |
|
|
0 |
% |
|
Underlying stock price
|
|
$ |
5.47 |
|
|
$ |
4.63 |
|
The following table summarizes the changes in the estimated fair value of our warrant liabilities (unaudited):
| |
|
Warrant
|
|
| (in thousands) |
|
Liability
|
|
| |
|
|
|
|
Ending balance as of December 31, 2011
|
|
$ |
671 |
|
|
Mark-to-Market adjustment
|
|
|
9 |
|
|
Exercise of warrants
|
|
|
(149 |
) |
|
Ending balance as of June 30, 2012 (unaudited)
|
|
$ |
531 |
|
| |
|
|
|
|
NOTE 13 - STOCKHOLDERS' EQUITY
Employee Stock Options
For the six months ended June 30, 2012, the Company issued a total of 183,000 stock options from its 2000 Equity Incentive Plan at exercise prices between $4.39 and $6.90 per share and we issued a total of 941 shares of our common stock upon the exercise of stock options for total proceeds of $4,400.
Warrant Exercises
For the six months ended June 30, 2012, the Company issued 70,000 shares of common stock upon the exercise of warrants for total proceeds of $245,000.
As of June 30, 2012, the Company had 803,484 warrants outstanding with a weighted average exercise price of approximately $15.14 per share, of which 563,833 are held by Vicis Master Capital Fund with a weighted average exercise price of approximately $20.04 per share. Approximately 250,000 unexercised warrants expired during the six months ended June 30, 2012.
Treasury Stock
In March 2012, the Company’s Board of Directors authorized the retirement of 10,000 shares of treasury stock. As such, all shares of treasury stock were retired and resumed the status of authorized and unissued shares of common stock.
Adoption of the 2012 Stock Incentive Plan
At the Company’s Annual Meeting held on June 7, 2012, stockholders approved the adoption of the Company's 2012 Stock Incentive Plan. A total of 4,000,000 shares of Common Stock have been reserved for issuance under the 2012 Stock Incentive Plan. As of June 30, 2012, no awards were granted under the 2012 Stock Incentive Plan.
NOTE 14 - DEFERRED FINANCING COSTS
In August 2011, the Company filed a Form S-1 registration statement with the Securities and Exchange Commission for a proposed public offering of the Company’s common stock (the “S-1 Registration Statement”), for which the Company had incurred approximately $389,000 in expenses as of December 31, 2011. Such costs had been capitalized and were to be charged to additional paid in capital upon completion of the Company’s proposed public offering. In April 2012, the Company voluntarily filed an application with the Securities and Exchange Commission requesting the withdrawal of the S-1 Registration Statement. The Company requested withdrawal of the registration statement based on current market conditions and management’s ensuing determination to not proceed with the contemplated offering at this time. Accordingly, previously capitalized deferred financing costs of approximately $389,000 were written off.
NOTE 15 - SUBSEQUENT EVENTS
None.
ITEM 2. MANAGEMENT'S DISCUSSION AND ANALYSIS OF FINANCIAL CONDITION AND RESULTS OF OPERATION
As discussed in Note 2 of the Notes to the Audited Financial Statements of our Amended Annual Report on Form 10K/A for the year ended December 31, 2011, we are amending and restating our unaudited financial statements and related disclosures for all periods presented in that amended filing. The following discussion and analysis of our financial condition and results of operations incorporates the restated amounts.
The following discussion should be read in conjunction with our financial statements and the notes thereto. Some of our discussion is forward-looking and involves risks and uncertainties. For information regarding risk factors that could have a material adverse effect on our business, refer to the risk factors section of our Amendment No. 1 to our Annual Report on Form 10-K/A for the year ended December 31, 2011 that is being concurrently filed with the SEC.
OVERVIEW
We are a leading provider of a smart grid communications platform that enables utilities to effectively deploy, integrate and communicate with multiple smart grid applications within the electric power grid. Our smart grid communications platform significantly improves the ability of utilities to use advanced technologies to upgrade their electric power grids, effectively making the grids more intelligent.
The term “smart grid” refers to the use of advanced technologies to upgrade the electric power grid, or the grid, effectively making the grid more intelligent and efficient. The grid was largely designed and built decades ago to reliably distribute electricity from generators to customers in a manner resulting in sizable capital investments and operating costs. A number of factors are increasingly straining the grid, including rapidly growing electricity demand, two-way power flow, the implementation of renewable and distributed energy sources and advanced pricing plans. As such, the aging grid is prone to reliability, security, and power quality issues, costing utilities and consumers billions of dollars each year. Technology is now revolutionizing the grid and transforming it into an efficient, communicating energy service platform. We believe that the smart grid will address the current shortcomings of the grid and deliver significant benefits to utilities and consumers of energy, including reduced costs, increased power reliability and quality, accommodation of renewable energy technologies, consumer empowerment over energy consumption and a platform for continued integration of new technologies.
The Ambient Smart Grid® communications platform, which includes hardware, software and firmware, enables utilities to effectively manage smart grid applications. Our communications platform provides utilities with a secure, two-way, flexible and open Internet protocol, or IP, architecture that efficiently networks smart grid applications and different technologies within each application and supports multiple communications technologies currently used by utilities, such as Wi-Fi, radio frequency, cellular technologies, power line communications, serial and Ethernet. Today, our communications platform enables the simultaneous integration and parallel communication of multiple smart grid applications provided by a variety of vendors, including smart metering, distribution automation, distribution management, and demand response. We believe that the Ambient Smart Grid® communications platform delivers significant benefits to utilities, including support of a single network; an open, scalable and interoperable platform; preservation of utility investments; third-party application hosting; remote and distributed intelligence; secure communications; and reduced overall implementation and operating costs.
The Ambient Smart Grid® products and services include communications nodes; a network management system, AmbientNMS®; integrated applications; and maintenance and consulting services. The communications nodes, our principal product, are physical boxes that contain the hardware and software needed for communications and data collection in support of smart grid assets. We have configured our communications nodes to act as individual data processors and collectors that receive signals from other networked devices, enabling smart grid applications. To date, Duke Energy, our marquee customer, has deployed approximately 105,000 of our communications nodes that receive data from smart electric and gas meters, using a variety of communications technologies, and process and transmit these data to the utility back office over a cellular carrier network for further processing. Furthermore, our communications nodes also accommodate integrated applications that include our own developed technology and third-party technology, thereby substantially increasing their functionality. By enabling such system interoperability, our communications platform both reduces implementation and ongoing communications costs and improves overall power management efficiencies. We believe that, to date, no other single solution or technology has provided the necessary flexibility in a cost-effective manner and proven at commercial scale, enabling a comprehensive digital communications platform while leveraging standards-based technologies. We developed our communications platform to specifically fill this void.
Our long-standing relationship with our marquee customer, which we believe has one of the most forward-looking smart grid initiatives in North America, has led to rapid growth in our business, and we entered into a long-term agreement in September 2009 with our marquee customer to supply the utility with our Ambient Smart Grid® communications platform and license our AmbientNMS® through 2015. We increased revenue from $2.2 million in 2009 to $20.2 million in 2010 to $62.1 million in 2011. As of June 30, 2012, we had backlog of approximately $19 million. We believe there continues to be opportunities for additional sales of our products and services with Duke Energy.
We intend to leverage our success with our marquee customer to secure additional customers in the global utility marketplace. We have recently hired senior-level personnel as well as substantially increased our investment in marketing and sales in order to intensify our efforts in securing new customers, and we expect to continue to invest substantially in our marketing and sales efforts for the foreseeable future. As a result of our recently increased marketing and sales activities, we have engaged with several utilities, and we are in active discussions regarding potential target and pilot programs utilizing our technology to address specific challenges and issues of individual utilities and distribution companies.
Our business success in the immediate future will depend largely on our ability to execute on our agreement with Duke Energy and their continual expansion of their existing deployments, as well as our ability to successfully expand our customer base as a result of our investments in sales and marketing. We anticipate that we will continue to collaborate with Duke Energy and continue to support their grid-modernization programs. Notwithstanding the above, we recognize the utility could alter its vision regarding the common communications infrastructure, determine that a competing company offers a more desirable product, or slow its deployments indefinitely, significantly affecting our prospects and outlook. Additionally, we are unable at this time to assess the effects, if any, that the merger between Duke Energy and Progress Energy, which was finalized in July 2012, will have on the continuation and/or expansion of our deployment by the new combined company following the merger. No assurance can be provided that the post-merger entity will continue with or expand the current deployments.
On July 18, 2011, we implemented a reverse stock split of our issued and outstanding shares of common stock at a ratio of 1-for 100 shares (the “Reverse Split”). The Reverse Split became effective on July 18, 2011 and has been reflected in this Quarterly Report on Form 10-Q. On August 3, 2011, our common stock began to trade on the NASDAQ Capital Market under our new ticker symbol “AMBT.”
RESULTS OF OPERATIONS
COMPARISON OF THE THREE AND SIX MONTHS ENDED JUNE 30, 2012 TO THE THREE AND SIX MONTHS ENDED JUNE 30, 2011
Total Revenue. Total revenue for the three months ended June 30, 2012 was approximately $10.0 million, representing a decrease of approximately 37% from approximately $15.9 million for the same period in 2011. Total revenue for the six months ended June 30, 2012 was approximately $23.2 million, representing a decrease of approximately 17% from approximately $27.9 million for the same period in 2011. The decrease in total revenue during the three months and six months ended June 30, 2012 as compared to the same periods in 2011 is primarily attributable to our marquee customer's decision to extend the delivery schedule of communications nodes for which they have contracted beyond the originally contemplated delivery time frame.
Cost of Goods Sold. Cost of goods sold for the three months ended June 30, 2012 was approximately $5.7 million, representing a decrease of approximately 38% from approximately $9.1 million for the corresponding period in 2011. Total cost of goods sold for the six months ended June 30, 2012 was approximately $13.1 million, representing a decrease of 18% from approximately $15.9 million for the corresponding period in 2011. The decrease in cost of goods sold during the three and six months ended June 30, 2012 as compared to the same periods in 2011 was due primarily to the decrease in sales volume.
Gross Profit. Gross profit for the three months ended June 30, 2012 was approximately $4.3 million, representing a decrease of $2.5 million from approximately $6.8 million for the corresponding period in 2011. Gross profit for the six months ended June 30, 2012 was approximately $10.1 million, representing a decrease of $1.8 million from approximately $11.9 million for the corresponding period in 2011. Our overall gross margin for each of the three and six months ended June 30, 2012 and 2011 was approximately 43%. Gross margins were stable based upon the commercial scale achieved over the past 18 months.
Research and Development Expenses. Research and development expenses for the three months ended June 30, 2012 were approximately $3.6 million, representing an increase of approximately $900,000 from approximately $2.7 million for the corresponding period in 2011. Research and development expenses for the six months ended June 30, 2012 were approximately $6.9 million, representing an increase of $2.2 million from approximately $4.7 million for the corresponding period in 2011. The increase in research and development during the three and six months ended June 30, 2012 as compared to the same periods in 2011 was due primarily to increased personnel and consultant expenses necessary for the continued development of the Company's communication nodes, enhancements to our AmbientNMS® software, and other product development efforts. We believe that our continued development efforts are critical to our strategic objectives of enhancing our technology while reducing costs, and therefore, we expect that our research and development expenses will increase over the next twelve months as we continue to focus our efforts on developing more robust solutions and providing additional value-added functionality for the Ambient Smart Grid® communications platform. Research and development expenses consisted of expenses incurred primarily in designing, prototyping and field testing our smart grid communications platform. These expenses consisted primarily of salaries and related expenses for personnel, contract design and testing services, supplies used, and consulting and license fees paid to third parties.
Selling, General and Administrative Expenses. Selling, general and administrative expenses for the three months ended June 30, 2012 were approximately $2.1 million, representing an increase of approximately $800,000 from approximately $1.3 million for the corresponding period in 2011. Selling, general and administrative expenses for the six months ended June 30, 2012 were approximately $4.2 million, representing an increase of approximately $1.0 million from approximately $3.2 million for the corresponding period in 2011. The increase in selling, general and administrative expenses during the three and six months ended June 30, 2012 as compared to the same periods in 2011 was due primarily to increased personnel costs and increased activity regarding our efforts to market the Ambient Smart Grid® communications platform. Selling, general and administrative expenses consisted primarily of salaries and other related costs for personnel in executive, marketing and sales and other administrative functions. Other significant costs included professional fees for legal, accounting and other services. We expect that selling, general and administrative expenses will increase over the next twelve months as we hire additional personnel, increase activity associated with business development, and increase activity associated with marketing programs targeted at increasing our overall brand awareness and securing additional customers.
Write-off of Deferred Financing Costs. In August 2011, we filed a Form S-1 registration statement with the Securities and Exchange Commission for a proposed public offering of our common stock, for which we had incurred approximately $389,000 in expenses as of December 31, 2011. Such costs were capitalized and were to be charged to additional paid-in capital upon completion of our proposed public offering. In April 2012, we voluntarily filed an application with the Securities and Exchange Commission requesting the withdrawal of such registration statement. We requested withdrawal of the registration statement based on current market conditions and management’s ensuing determination to not proceed with the contemplated offering at this time. Accordingly, previously capitalized deferred financing costs of approximately $389,000 were written off.
Interest Income, net and Other Income. Interest income for the three months ended June 30, 2012 was approximately $2,000 compared to net interest income of approximately $6,000 for the corresponding period in 2011. Interest income for the six months ended June 30, 2012 was approximately $4,000 compared to net interest income of approximately $12,000 for the corresponding period in 2011. Other income for the six months ended June 30, 2012 was approximately $164,000, representing primarily the partial recovery of loans made by us to an unrelated company during 2000 and 2001, which had been previously written off in 2001.
Mark-to-Market Adjustment of Warrant Liability. Changes in the fair value of warrant liabilities resulted in a gain of $872,000 and $1.9 million for the three and six months ended June 30, 2011, respectively, and a non-cash gain of approximately $180,000 and a non-cash loss of approximately $9,000 for the three and six months ended June 30, 2012, respectively.
Provision for Income Taxes. As a result of our net income of approximately $3.5 million and $5.8 million for the three and six months ended June 30, 2011 respectively, we recorded a provision for income taxes of approximately $81,000 and $109,000 for the same periods, primarily reflecting federal alternative minimum taxes.
LIQUIDITY AND CAPITAL RESOURCES
Since inception, we have funded our operations primarily through the sale of our securities and, more recently, through revenue generated from sales of our products. At June 30, 2012, we had working capital of approximately $14.9 million, including cash and cash equivalents of approximately $16.5 million. Our cash and cash equivalents were approximately $18.0 million as of December 31, 2011.
Net cash used in operating activities was approximately $1.5 million for the six months ended June 30, 2012 as compared net cash provided by operating activities of approximately $5.9 million for the same period in 2011. Cash used in operating activities during 2012 was due primarily to net loss of $1.3 million (offset by stock-based compensation expense of $1.3 million) and an increase in working capital needs resulting from increased accounts receivable of approximately $2.7 million (which was subsequently collected during the first week in July 2012).
Net cash used in investing activities for the six months ended June 30, 2012 was approximately $284,000 as compared to approximately $511,000 for the same period in 2011. Net cash used in investing activities was for additions of fixed assets.
Net cash provided by financing activities for the six months ended June 30, 2012 was approximately $249,000 as compared to approximately $129,000 for the same period in 2011. For the six months ended June 30, 2012 and 2011, net cash provided by financing activities consisted primarily of proceeds from exercises of warrants and stock options.
We believe that our business plan provides sufficient liquidity to fund our operating needs for the next 12 months. However, there are factors that can impact our ability to continue to fund our operating needs, including:
|
●
|
Our ability to maintain product pricing as expected, particularly in light of increased competition and its unknown effects on market dynamics;
|
|
●
|
Our and our contract manufacturer’s ability to reduce manufacturing costs as expected;
|
|
●
|
Our ability to expand sales volume, which is highly dependent on the smart grid implementation plans of Duke Energy and other utilities; and
|
|
●
|
The need for us to continue to invest in operating activities in order to remain competitive or acquire other businesses and technologies in order to complement our products, expand the breadth of our business, enhance our technical capabilities, or otherwise offer growth opportunities.
|
If we cannot effectively manage these factors, we may need to raise additional capital in order to fund our operating needs. If we are unable to obtain adequate financing or financing on terms satisfactory to us when we require it, our ability to continue to grow or support our business and to respond to business challenges could be significantly limited.
ITEM 4. CONTROLS AND PROCEDURES
We maintain disclosure controls and procedures that are designed to provide reasonable assurance that information required to be disclosed in our Exchange Act reports is recorded, processed, summarized and reported within the time periods specified in the SEC's rules and forms, and that such information is accumulated and communicated to management, including our Chief Executive Officer and our Chief Financial Officer to allow timely decisions regarding required disclosure based closely on the definition of "disclosure controls and procedures" in Rule 13a-15(e).
As of the end of the period covered by this report, we carried out an evaluation, under the supervision and with participation of management, including our Chief Executive Officer and our Chief Financial Officer, of the effectiveness of the design and operation of our disclosure controls and procedures. Based on the foregoing, our Chief Executive Officer and Chief Financial Officer concluded that our disclosure controls and procedures were not effective to provide such reasonable assurance because of a material weakness in our internal control over financial reporting. The material weakness is described in detail in our Amended Annual Report on Form 10-K/A filed simultaneously with this Form 10-Q. Notwithstanding such material weakness, management, based upon the work performed during the restatement process described in Note 2 of the Notes to the Unaudited Financial Statements, has concluded that our financial statements for the periods included in this Quarterly Report on Form 10-Q are fairly stated in all material respects in accordance with generally accepted accounting principles for each of the periods presented herein.
Remediation Plan
We are in the process of remediating this material weakness by, among other things, augmenting our professional staff, providing additional training for our accounting staff, implementing and modifying certain accounting procedures, and seeking assistance from third parties with respect to complex technical accounting issues. If we fail to remediate this material weakness or fail to otherwise maintain effective controls over financial reporting in the future, it could result in a material misstatement of our financial statements that would not be prevented or detected on a timely basis and which could cause investors and other users to lose confidence in our financial statements.
Management believes the foregoing efforts will effectively remediate the material weakness. As the Company continues to evaluate and work to improve its internal control over financial reporting, management may execute additional measures to address potential control deficiencies or modify the remediation plan described above. Management will continue to review and make necessary changes to the overall design of the Company’s internal control.
Changes in Internal Control over Financial Reporting
During the quarter ended June 30 2012, there were no changes made in our internal control over financial reporting (as such term is defined in Rule 13a-15(f) of the Exchange Act) that have materially affected, or are reasonably likely to materially affect, the Company’s internal control over financial reporting.
PART II - OTHER INFORMATION
ITEM 2. UNREGISTERED SALES OF EQUITY SECURITIES AND USE OF PROCEEDS
A single warrant holder exercised an outstanding warrant on May 29, 2012 for 20,000 shares of Common Stock for $3.50 cash per share for a total consideration of $70,000. The Company issued such shares in reliance upon the exemption from the registration requirements of the Securities Act of 1933 as amended, under Section 4(2) of the Securities Act.
In claiming the exemption under Section 4(2), the Company relied in part on the following facts: (1) the offers and sales involved one warrant holder; (2) the warrant holder had access to information regarding the Company; and (3) the warrant holder represented that he (a) was an accredited investor; and (b) acquired the shares for his own account in a transaction not involving any general solicitation or general advertising, and not with a view to the distribution thereof.
ITEM 6. EXHIBITS
|
Exhibit No.
|
|
Description
|
| |
|
|
|
31.1
|
|
Certification of Chief Executive Officer pursuant to Rule 13a-14(a) of the Securities Exchange Act of 1934, as amended.
|
| |
|
|
|
31.2
|
|
Certification of Chief Financial Officer pursuant to Rule 13a-14(a) of the Securities Exchange Act of 1934, as amended.
|
| |
|
|
|
32
|
|
Certification of Chief Executive Officer and Chief Financial Officer, as adopted pursuant to Section 906 of the Sarbanes-Oxley Act of 2002.
|
| |
|
|
|
101.INS*
|
|
XBRL Instance Document
|
| |
|
|
|
101.SCH*
|
|
XBRL Taxonomy Extension Schema
|
| |
|
|
|
101.CAL*
|
|
XBRL Taxonomy Extension Calculation Linkbase
|
| |
|
|
|
101.DEF*
|
|
XBRL Taxonomy Extension Definition Linkbase
|
| |
|
|
|
101.LAB*
|
|
XBRL Taxonomy Extension Label Linkbase
|
| |
|
|
|
101.PRE*
|
|
XBRL Taxonomy Extension Presentation Linkbase
|
|
*
|
Pursuant to Rule 406T of Regulation S-T, these interactive data files are deemed not filed or part of a registration statement or prospectus for purposes of Sections 11 or 12 of the Securities Act of 1933 or Section 18 of the Securities Exchange Act of 1934 and otherwise are not subject to liability.
|
SIGNATURES
Pursuant to the requirements of the Securities Exchange Act of 1934 the registrant has duly caused this report to be signed on its behalf by the undersigned thereunto duly authorized.
|
AMBIENT CORPORATION
|
|
|
|
|
(Registrant)
|
|
|
|
| |
|
|
|
|
By:
|
/s/ John J. Joyce
|
|
By:
|
/s/ Mark L. Fidler
|
|
| |
John J. Joyce,
|
|
|
Mark L. Fidler,
|
|
| |
President and Chief Executive Officer
|
|
|
Vice President, Chief Financial Officer and Treasurer
|
|
| |
(Principal Executive Officer)
|
|
|
(Principal Financial Officer and Principal Accounting Officer)
|
|
| |
|
|
|
|
|
|
Date:
|
September 24, 2012
|
|
Date:
|
September 24, 2012
|
|
EXHIBIT INDEX
|
Exhibit No.
|
|
Description
|
| |
|
|
|
31.1
|
|
Certification of Chief Executive Officer pursuant to Rule 13a-14(a) of the Securities Exchange Act of 1934, as amended.
|
| |
|
|
|
31.2
|
|
Certification of Chief Financial Officer pursuant to Rule 13a-14(a) of the Securities Exchange Act of 1934, as amended.
|
| |
|
|
|
32
|
|
Certification of Chief Executive Officer and Chief Financial Officer, as adopted pursuant to Section 906 of the Sarbanes-Oxley Act of 2002.
|
| |
|
|
|
101.INS*
|
|
XBRL Instance Document
|
| |
|
|
|
101.SCH*
|
|
XBRL Taxonomy Extension Schema
|
| |
|
|
|
101.CAL*
|
|
XBRL Taxonomy Extension Calculation Linkbase
|
| |
|
|
|
101.DEF*
|
|
XBRL Taxonomy Extension Definition Linkbase
|
| |
|
|
|
101.LAB*
|
|
XBRL Taxonomy Extension Label Linkbase
|
| |
|
|
|
101.PRE*
|
|
XBRL Taxonomy Extension Presentation Linkbase
|
|
*
|
Pursuant to Rule 406T of Regulation S-T, these interactive data files are deemed not filed or part of a registration statement or prospectus for purposes of Sections 11 or 12 of the Securities Act of 1933 or Section 18 of the Securities Exchange Act of 1934 and otherwise are not subject to liability.
|
RULE 13a-14(a) CERTIFICATION
I, John J. Joyce, certify that:
|
1.
|
I have reviewed this Quarterly Report on Form 10-Q for the quarter ended June 30, 2012 of Ambient Corporation;
|
|
2.
|
Based on my knowledge, this report does not contain any untrue statement of a material fact or omit to state a material fact necessary to make the statements made, in light of the circumstances under which such statements were made, not misleading with respect to the period covered by this report;
|
|
3.
|
Based on my knowledge, the financial statements, and other financial information included in this report, fairly present in all material respects the financial condition, results of operations and cash flows of the registrant as of, and for, the periods presented in this report;
|
|
4.
|
The registrant’s other certifying officer and I are responsible for establishing and maintaining disclosure controls and procedures (as defined in Exchange Act Rules 13a-15(e) and 15d-15(e)) and internal control over financial reporting (as defined in Exchange Act Rules 13a-15(f) and 15d-15(f)) for the registrant and have:
|
| |
a)
|
Designed such disclosure controls and procedures, or caused such disclosure controls and procedures to be designed under our supervision, to ensure that material information relating to the registrant, including its consolidated subsidiaries, is made known to us by others within those entities, particularly during the period in which this report is being prepared;
|
| |
b)
|
Designed such internal control over financial reporting, or caused such internal control over financial reporting to be designed under our supervision, to provide reasonable assurance regarding the reliability of financial reporting and the preparation of financial statements for external purposes in accordance with generally accepted accounting principles;
|
| |
c)
|
Evaluated the effectiveness of the registrant's disclosure controls and procedures and presented in this report our conclusions about the effectiveness of the disclosure controls and procedures, as of end of the period covered by this report based on such evaluation; and
|
| |
d)
|
Disclosed in this report any change in the registrant's internal control over financial reporting that occurred during the registrant's most recent fiscal quarter (the registrant's fourth fiscal quarter in the case of an annual report) that has materially affected, or is reasonably likely to materially affect, the registrant's internal control over financial reporting; and
|
|
5.
|
The registrant’s other certifying officer and I have disclosed, based on our most recent evaluation of internal control over financial reporting, to the registrant's auditors and the audit committee of registrant's board of directors (or persons performing the equivalent functions):
|
| |
a)
|
All significant deficiencies and material weaknesses in the design or operation of internal control over financial reporting which are reasonably likely to adversely affect the registrant's ability to record, process, summarize and report financial information; and
|
| |
b)
|
Any fraud, whether or not material, that involves management or other employees who have a significant role in the registrant's internal control over financial reporting.
|
September 24, 2012
| |
By:
|
/s/ John J. Joyce
|
|
| |
|
John J. Joyce
|
|
| |
|
President and Chief Executive Officer
(Principal Executive Officer)
|
|
EXHIBIT 31.2
RULE 13a-14(a) CERTIFICATION
I, Mark L. Fidler, certify that:
|
1.
|
I have reviewed this Quarterly Report on Form 10-Q for the quarter ended June 30, 2012 of Ambient Corporation;
|
|
2.
|
Based on my knowledge, this report does not contain any untrue statement of a material fact or omit to state a material fact necessary to make the statements made, in light of the circumstances under which such statements were made, not misleading with respect to the period covered by this report;
|
|
3.
|
Based on my knowledge, the financial statements, and other financial information included in this report, fairly present in all material respects the financial condition, results of operations and cash flows of the registrant as of, and for, the periods presented in this report;
|
|
4.
|
The registrant’s other certifying officer and I are responsible for establishing and maintaining disclosure controls and procedures (as defined in Exchange Act Rules 13a-15(e) and 15d-15(e)) and internal control over financial reporting (as defined in Exchange Act Rules 13a-15(f) and 15d-15(f)) for the registrant and have:
|
| |
a)
|
Designed such disclosure controls and procedures, or caused such disclosure controls and procedures to be designed under our supervision, to ensure that material information relating to the registrant, including its consolidated subsidiaries, is made known to us by others within those entities, particularly during the period in which this report is being prepared;
|
| |
b)
|
Designed such internal control over financial reporting, or caused such internal control over financial reporting to be designed under our supervision, to provide reasonable assurance regarding the reliability of financial reporting and the preparation of financial statements for external purposes in accordance with generally accepted accounting principles;
|
| |
c)
|
Evaluated the effectiveness of the registrant's disclosure controls and procedures and presented in this report our conclusions about the effectiveness of the disclosure controls and procedures, as of end of the period covered by this report based on such evaluation; and
|
| |
d)
|
Disclosed in this report any change in the registrant's internal control over financial reporting that occurred during the registrant's most recent fiscal quarter (the registrant's fourth fiscal quarter in the case of an annual report) that has materially affected, or is reasonably likely to materially affect, the registrant's internal control over financial reporting; and
|
|
5.
|
The registrant’s other certifying officer and I have disclosed, based on our most recent evaluation of internal control over financial reporting, to the registrant's auditors and the audit committee of registrant's board of directors (or persons performing the equivalent functions):
|
| |
a)
|
All significant deficiencies and material weaknesses in the design or operation of internal control over financial reporting which are reasonably likely to adversely affect the registrant's ability to record, process, summarize and report financial information; and
|
| |
b)
|
Any fraud, whether or not material, that involves management or other employees who have a significant role in the registrant's internal control over financial reporting.
|
September 24, 2012
| |
By:
|
/s/ Mark L. Fidler
|
|
| |
|
Mark L. Fidler
|
|
| |
|
Vice President, Chief Financial Officer and Treasurer
(Principal Financial Officer and
Accounting Officer)
|
|
EXHIBIT 32
CERTIFICATION PURSUANT TO 18 U.S.C. SECTION 1350 (AS ADOPTED PURSUANT TO SECTION 906 OF THE
SARBANES-OXLEY ACT OF 2002)
In connection with the Quarterly Report of Ambient Corporation (the "Company") on Form 10-Q for the quarter ended June 30, 2012 (the "Report") filed with the Securities and Exchange Commission, we, John J. Joyce, President and Chief Executive Officer of the Company and Mark L. Fidler, Vice President, Chief Financial Officer and Treasurer of the Company, certify, pursuant to 18 U.S.C. Section 1350, as adopted pursuant to Section 906 of the Sarbanes-Oxley Act of 2002, that to the best of our knowledge:
1. The Report fully complies with the requirements of Section 13(a) or 15(d) of the Securities Exchange Act of 1934, as amended; and
2. The information contained in the Report fairly presents, in all material respects, the financial condition and results of operations of the Company as of the dates and for the periods presented in the Report.
Date: September 24, 2012
| |
|
|
|
| |
|
|
|
| |
By:
|
/s/ John J. Joyce
|
|
| |
|
John J. Joyce
|
|
| |
|
President and Chief Executive Officer
|
|
| |
|
|
|
| |
By:
|
/s/ Mark L. Fidler
|
|
| |
|
Mark L. Fidler
|
|
| |
|
Vice President, Chief Financial Officer and Treasurer
|
|
A certification furnished pursuant to this Item will not be deemed “filed” for purposes of section 18 of the Exchange Act (15 U.S.C. 78r), or otherwise subject to the liability of that section. Such certification will not be deemed to be incorporated by reference into any filing under the Securities Act or the Exchange Act, except to the extent that the registrant specifically incorporates it by reference.
UNITED STATES
SECURITIES AND EXCHANGE COMMISSION
WASHINGTON, D.C. 20549
FORM 8-K
CURRENT REPORT
PURSUANT TO SECTION 13 OR 15(d) OF THE SECURITIES EXCHANGE ACT OF 1934
Date of report (Date of earliest event reported): September 24, 2012
AMBIENT CORPORATION
(Exact name of registrant as specified in its charter)
|
Delaware
|
|
0-23723
|
|
98-0166007
|
|
(State or other jurisdiction of incorporation)
|
|
(Commission File Number)
|
|
(IRS Employer Identification No.)
|
7 WELLS AVENUE, SUITE 11, NEWTON, MASSACHUSETTS, 02459
(Address of principal executive offices, including Zip Code)
617- 332-0004
(Registrant's telephone number, including area code)
(Former name or former address, if changed since last report.)
Check the appropriate box below if the Form 8-K filing is intended to simultaneously satisfy the filing obligation of the registrant under any of the following provisions (see General Instruction A.2. below):
o Written communications pursuant to Rule 425 under the Securities Act (17 CFR 230.425)
o Soliciting material pursuant to Rule 14a-12 under the Exchange Act (17 CFR 240.14a-12)
o Pre-commencement communications pursuant to Rule 14d-2(b) under the Exchange Act (17 CFR 240.14d-2(b))
o Pre-commencement communications pursuant to Rule 13e-4(c) under the Exchange Act (17 CFR 240.13e-4(c))
ITEM 2.02 RESULTS OF OPERATIONS AND FINANCIAL CONDITION
On September 24, 2012, Ambient Corporation (the “Company”) issued a press release announcing its results of operations and financial condition for the three and six months ended June 30, 2012. A copy of the press release is attached hereto as Exhibit 99.1 to this Current Report on Form 8-K and incorporated herein by reference.
In accordance with General Instruction B.2 of Form 8-K, the information in this Current Report on Form 8-K under this heading, including the related Exhibit 99.1, shall not be deemed “filed” for purposes of Section 18 of the Securities Exchange Act of 1934, as amended, or otherwise subject to the liabilities of that section, nor shall it be deemed incorporated by reference in any filing under the Securities Act of 1933, as amended, except as shall be expressly set forth in such a filing.
ITEM 9.01 FINANCIAL STATEMENTS AND EXHIBITS.
(d) Exhibits.
|
99.1
|
Press Release of Ambient Corporation dated September 24, 2012.
|
SIGNATURES
Pursuant to the requirements of the Securities Exchange Act of 1934, the registrant has duly caused this report to be signed on its behalf by the undersigned hereunto duly authorized.
| |
AMBIENT CORPORATION
|
|
| |
|
|
|
|
Dated: September 24, 2012
|
By:
|
/s/ John J. Joyce
|
|
| |
|
John J. Joyce
|
|
| |
|
Chief Executive Officer
|
|
Exhibit 99.1
Investor Contact
Michael W. McCarthy
mmccarthy@ambientcorp.com
(617) 614-6906
Media Contact
Joanna Hamblin
jhamblin@ambientcorp.com
(617) 614-6793
Ambient Corporation Reports Results for the Second Quarter of 2012
Newton, MA, September 24, 2012 – Ambient Corporation (NASDAQ: AMBT), provider of a secure, flexible and scalable smart grid communications and applications platform, announced today financial results for the second quarter ended June 30, 2012.
Total revenue for the three months ended June 30, 2012 was approximately $10.0 million, representing a decrease of approximately 37% from approximately $15.9 million for the same period in 2011. Total revenue for the six months ended June 30, 2012 was approximately $23.2 million, representing a decrease of approximately 17% from approximately $27.9 million for the same period in 2011. The decrease in total revenue during the three months and six months ended June 30, 2012 as compared to the same periods in 2011 is attributable primarily to the Company’s marquee customer’s decision to extend the delivery schedule of communications nodes, for which they have contracted, beyond the originally contemplated delivery time frame.
Gross margin for each of the three and six months ended June 30, 2012 and 2011 was approximately 43%. Gross margins were stable based upon the commercial scale achieved over the past 18 months.
In commenting on Ambient’s performance, President and Chief Executive Officer, John J. Joyce, highlighted, “Following the need to delay the filing of our financial results for the first half of the fiscal year, we are pleased to be able to announce that we continue to make significant strides in our sales and marketing efforts, where substantial investments have been made since the start of this year. As a result of our focus in this area, we are very encouraged by the interest expressed in our platform and product base from our growing target market.”
Mr. Joyce concluded, “Equally important to our investment in sales and marketing activities is the advancement in new product development. Armed with a wider array of critical customer input, Ambient is leveraging its proven performance in the field together with its unique hardware and software platforms to provide economic value-added solutions that address the particular needs of utilities across the Americas and Europe. It is important to note that that the need to amend previous filings has not distracted us from our mission to deliver best in breed product and technology to our target market.”
Research and development expenses for the three months ended June 30, 2012 were approximately $3.6 million, representing an increase of approximately $900,000 from approximately $2.7 million for the corresponding period in 2011. Research and development expenses for the six months ended June 30, 2012 were approximately $6.9 million, representing an increase of $2.2 million from approximately $4.7 million for the corresponding period in 2011. The increase in research and development during the second quarter of 2012 was attributable to additional personnel and consultant expenses necessary for the continued development of the Company’s communication nodes, enhancements of the AmbientNMS® (Network Management System), and other product development efforts.
Selling, general and administrative expenses for the three months ended June 30, 2012 were approximately $2.1 million, representing an increase of approximately $800,000 from approximately $1.3 million for the corresponding period in 2011. Selling, general and administrative expenses for the six months ended June 30, 2012 were approximately $4.2 million, representing an increase of approximately $1.0 million from approximately $3.2 million for the corresponding period in 2011. The increase in selling, general and administrative expenses in the second quarter of 2012 resulted from an increase in personnel and related costs and increased efforts to market the Company’s communications platform.
Net loss for the three and six months ended June 2012 was approximately $1.1 million, or $0.07 per share, and $1.3 million, or $0.08 per share, respectively, compared to net income of approximately $3.5 million, or $0.21 per share, and $5.8 million, or $0.35 per share, for the same periods in 2011. Non-cash expenses included in net loss totaled approximately $1.9 million during the six months ended June 30, 2012, consisting of depreciation expense, stock-based compensation expense and write-off of deferred finance costs.
Cash and cash equivalents totaled $16.5 million as of June 30, 2012, compared to $18.0 million at December 31, 2011. Total working capital was $14.9 million as of June 30, 2012, compared to $14.3 million at December 31, 2011.
As previously announced on August 14, 2012, the Company delayed the filing of its Quarterly Report on Form 10-Q for the three and six months ended June 30, 2012. The filing was delayed due to the Company’s determination that certain previously filed financial statements of the Company did not properly account for embedded derivative features of certain convertible debt and warrants to purchase common stock previously issued by the Company. To correct these accounting classification errors, the Company has filed an Amended Annual Report on Form 10-K/A for the year ended December 31, 2011, and an Amended Quarterly Report on Form 10-Q/A for the quarter ended March 31, 2012 on September 24, 2012.
About Ambient Corporation
Ambient designs, develops and sells the Ambient Smart Grid® communications platform. The Ambient Smart Grid products and services include communications nodes; a network management system, AmbientNMS®; integrated applications; and maintenance and consulting services. Using open standards-based technologies along with in-depth industry experience, Ambient provides utilities with solutions for their smart grid initiatives. Headquartered in Newton, MA, Ambient is a publicly traded company (NASDAQ: AMBT). More information on Ambient is available at www.ambientcorp.com.
Except for historical information, this press release contains statements that may be deemed to be “forward-looking statements” made pursuant to the safe harbor provisions of the Private Securities Litigation Reform Act of 1995. These include statements relating to the diversification of our customer base, further development and marketing of our communications platform and cultivating projects with potential customers, among others. These forward-looking statements are based upon our current expectations, estimates and projections about our business and our industry and reflect our beliefs and assumptions based upon information available to us at the date of this release. We caution readers that forward-looking statements are predictions based on our current expectations about future events. These forward-looking statements are not guarantees of future performance and are subject to risks, uncertainties and assumptions that are difficult to predict. Our actual results, performance or achievements could differ materially from those expressed or implied by the forward-looking statements as a result of a number of factors, which could have a material adverse effect on our operations and future prospects including, but not limited to, our ability to retain and attract customers, particularly in light of our dependence on a single customer for substantially all of our revenue; our expectations regarding our expenses and revenue, including our expectations that our research and development expenses and selling, general and administrative expenses may increase in absolute dollars; our material weakness in internal control over financial reporting; anticipated trends and challenges in our business and the markets in which we operate, including the market for smart grid technologies; our expectations regarding competition as more and larger companies enter our markets and as existing competitors improve or expand their product offerings; our plans for future products and enhancements of existing products; our anticipated cash needs and our estimates regarding our capital requirements; and our anticipated growth strategies. We undertake no obligation to publicly update or revise any forward-looking statements. Further information on the company’s risks and uncertainties is available in our filings with the Securities and Exchange Commission.
Ambient®, Ambient Smart Grid® and AmbientNMS® are registered trademarks of Ambient Corporation with the U.S. Patent and Trademark Office.
# # #