© Mercury Systems, Inc. WEBCAST LOGIN AT WWW.MRCY.COM/INVESTOR WEBCAST REPLAY AVAILABLE BY 7:00 P.M. ET FEBRUARY 4, 2025 Bill Ballhaus Chairman and CEO David Farnsworth Executive Vice President and CFO February 4, 2025, 5:00 pm ET SECOND QUARTER FISCAL YEAR 2025 FINANCIAL RESULTS 1
© Mercury Systems, Inc. /Mercury Proprietary/No Tech Data/ Forward-looking safe harbor statement This presentation contains certain forward-looking statements, as that term is defined in the Private Securities Litigation Reform Act of 1995, including those relating to the Company's focus on enhanced execution of the Company's strategic plan under a refreshed Board and leadership team. You can identify these statements by the words “may,” “will,” “could,” “should,” “would,” “plans,” “expects,” “anticipates,” “continue,” “estimate,” “project,” “intend,” “likely,” “forecast,” “probable,” “potential,” and similar expressions. These forward-looking statements involve risks and uncertainties that could cause actual results to differ materially from those projected or anticipated. Such risks and uncertainties include, but are not limited to, continued funding of defense programs, the timing and amounts of such funding, general economic and business conditions, including unforeseen weakness in the Company’s markets, effects of any U.S. federal government shutdown or extended continuing resolution, effects of geopolitical unrest and regional conflicts, competition, changes in technology and methods of marketing, delays in or cost increases related to completing development, engineering and manufacturing programs, changes in customer order patterns, changes in product mix, continued success in technological advances and delivering technological innovations, changes in, or in the U.S. government’s interpretation of, federal export control or procurement rules and regulations, including tariffs, changes in, or in the interpretation or enforcement of, environmental rules and regulations, market acceptance of the Company's products, shortages in or delays in receiving components, supply chain delays or volatility for critical components, production delays or unanticipated expenses including due to quality issues or manufacturing execution issues, adherence to required manufacturing standards, capacity underutilization, increases in scrap or inventory write-offs, failure to achieve or maintain manufacturing quality certifications, such as AS9100, the impact of supply chain disruption, inflation and labor shortages, among other things, on program execution and the resulting effect on customer satisfaction, inability to fully realize the expected benefits from acquisitions, restructurings, and operational efficiency initiatives or delays in realizing such benefits, challenges in integrating acquired businesses and achieving anticipated synergies, effects of shareholder activism, increases in interest rates, changes to industrial security and cyber-security regulations and requirements and impacts from any cyber or insider threat events, changes in tax rates or tax regulations, such as the deductibility of internal research and development, changes to interest rate swaps or other cash flow hedging arrangements, changes to generally accepted accounting principles, difficulties in retaining key employees and customers, litigation, including the dispute arising with the former CEO over his resignation, unanticipated costs under fixed-price service and system integration engagements, and various other factors beyond our control. These risks and uncertainties also include such additional risk factors as are discussed in the Company's filings with the U.S. Securities and Exchange Commission, including its Annual Report on Form 10-K for the fiscal year ended June 28, 2024 and subsequent Quarterly Reports on Form 10-Q and Current Reports on Form 8-K. The Company cautions readers not to place undue reliance upon any such forward-looking statements, which speak only as of the date made. The Company undertakes no obligation to update any forward-looking statement to reflect events or circumstances after the date on which such statement is made. Use of Non-GAAP (Generally Accepted Accounting Principles) Financial Measures In addition to reporting financial results in accordance with generally accepted accounting principles, or GAAP, the Company provides adjusted EBITDA, adjusted income, adjusted EPS, and free cash flow, which are non-GAAP financial measures. Adjusted EBITDA, adjusted income, and adjusted EPS exclude certain non-cash and other specified charges. The Company believes these non- GAAP financial measures are useful to help investors better understand its past financial performance and prospects for the future. However, these non-GAAP measures should not be considered in isolation or as a substitute for financial information provided in accordance with GAAP. Management believes these non-GAAP measures assist in providing a more complete understanding of the Company’s underlying operational results and trends, and management uses these measures along with the corresponding GAAP financial measures to manage the Company’s business, to evaluate its performance compared to prior periods and the marketplace, and to establish operational goals. A reconciliation of GAAP to non-GAAP financial results discussed in this presentation is contained in the Appendix hereto. 2
© Mercury Systems, Inc. /Mercury Proprietary/No Tech Data/ Today’s call ▪ Opening remarks on business and results ▪ Update on our four focus areas ▪ Performance expectations for FY25 and beyond ▪ Q&A 3
© Mercury Systems, Inc. /Mercury Proprietary/No Tech Data/ Business and results ▪ Confidence in strategic positioning and our expectations to deliver predictable organic growth with expanding margins and robust free cash flow. ▪ Revenue up 13% year over year with adjusted EBITDA of $22M (9.9% margin). ▪ Record free cash flow of $82M, up $44M year over year. Ended Q2 with $243M of cash on hand. ▪ Record backlog of $1.4 billion. Trailing twelve-month book to bill of 1.12x. ▪ Solid execution across our broad portfolio of production and development programs. ▪ Reduced operating expense driving positive operating leverage. ▪ Continued progress on free cash flow drivers, with net working capital down $115 million year- over-year. 4
© Mercury Systems, Inc. /Mercury Proprietary/No Tech Data/ Delivering predictable performance ▪ Progress mitigating what we believe to be predominantly transitory impacts. ▪ Lowest level of net EAC change impacts in the last few years. This reflects progress in maturing our processes in program management, engineering, and operations. ▪ Continued progress ramping production in our common processing architecture product area. ‒ Expect to have full capacity available as we progress through the second half of the year. ‒ Notable take-away in Q2 from a processor-board competitor that couldn’t meet a subset of the security requirements provided by our common processing architecture. ▪ Accelerated customer deliveries driving a $29M or 31% year over year increase in point in time revenue, primarily from pull-forward deliveries and revenue from Q3. 5
© Mercury Systems, Inc. /Mercury Proprietary/No Tech Data/ Driving organic growth ▪ Q2 bookings of $242 million resulted in record backlog of $1.4 billion. ▪ Over 80% of trailing twelve-month bookings were production in nature. Recently announced workforce restructuring to align our team composition with increased production mix. ▪ Multiple competitive wins highlighting what we believe to be our technological differentiation. ▪ We believe our unique capabilities providing mission-critical processing at the edge align well with customer priorities within key growth markets. 6
© Mercury Systems, Inc. /Mercury Proprietary/No Tech Data/ Expanding margins ▪ Remain focused on the following levers in our efforts to achieve targeted adjusted EBITDA margins in the low to mid 20% range: ‒ Executing on development programs and minimizing cost growth impacts. ‒ Getting back toward a more historical 20/80 mix of development to production programs. ‒ Driving organic growth to generate positive operating leverage. ‒ Achieving cost efficiencies. ▪ Q2 adjusted EBITDA margin in line with expectations and indicative of progress on each of these levers. ▪ Q2 gross margin was in line with expectations driven by backlog entering FY25. ▪ Expect backlog margin to increase as we believe new bookings are in-line with our targeted margin profile. ▪ Operating expenses down significantly year-over-year driven by actions to streamline and focus operations. 7
© Mercury Systems, Inc. /Mercury Proprietary/No Tech Data/ Driving improved free cash flow conversion and release ▪ Progress on drivers of free cash flow. Net working capital is at the lowest level since Q3 of FY22. ▪ FCF over the last three quarters is approximately $122M, and net debt is down to $349M the lowest level since Q2 of FY22. ▪ Focused on continued reduction in working capital and improving free cash flow performance. 8
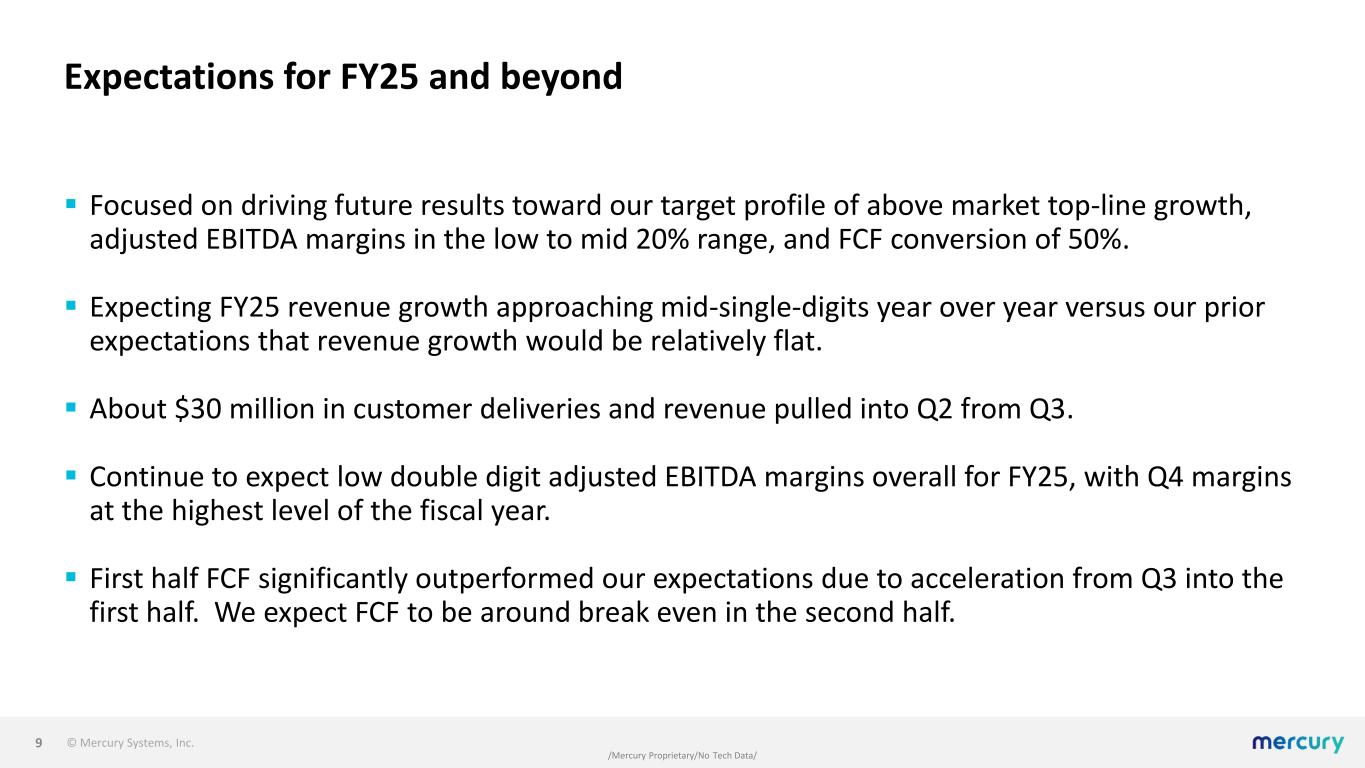
© Mercury Systems, Inc. /Mercury Proprietary/No Tech Data/ Expectations for FY25 and beyond ▪ Focused on driving future results toward our target profile of above market top-line growth, adjusted EBITDA margins in the low to mid 20% range, and FCF conversion of 50%. ▪ Expecting FY25 revenue growth approaching mid-single-digits year over year versus our prior expectations that revenue growth would be relatively flat. ▪ About $30 million in customer deliveries and revenue pulled into Q2 from Q3. ▪ Continue to expect low double digit adjusted EBITDA margins overall for FY25, with Q4 margins at the highest level of the fiscal year. ▪ First half FCF significantly outperformed our expectations due to acceleration from Q3 into the first half. We expect FCF to be around break even in the second half. 9
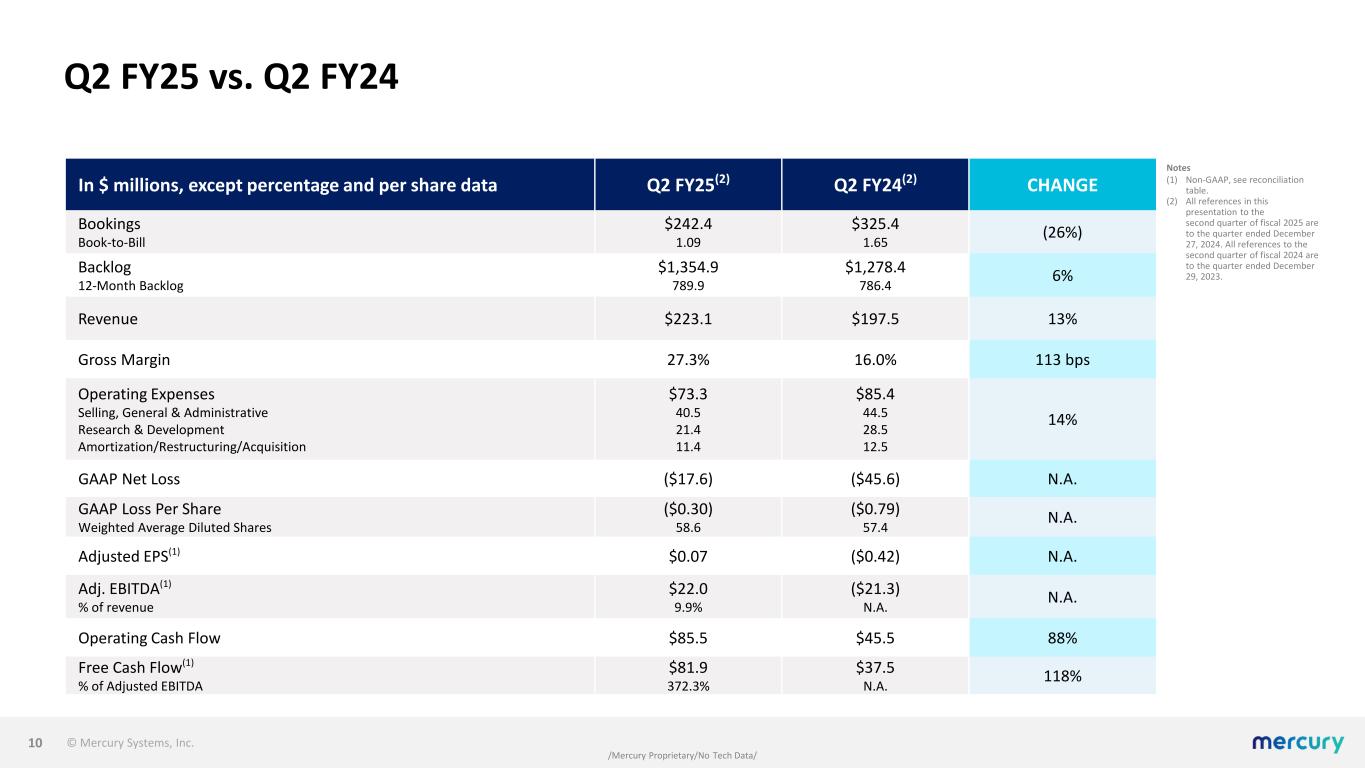
© Mercury Systems, Inc. /Mercury Proprietary/No Tech Data/ Q2 FY25 vs. Q2 FY24 10 In $ millions, except percentage and per share data Q2 FY25(2) Q2 FY24(2) CHANGE Bookings Book-to-Bill $242.4 1.09 $325.4 1.65 (26%) Backlog 12-Month Backlog $1,354.9 789.9 $1,278.4 786.4 6% Revenue $223.1 $197.5 13% Gross Margin 27.3% 16.0% 113 bps Operating Expenses Selling, General & Administrative Research & Development Amortization/Restructuring/Acquisition $73.3 40.5 21.4 11.4 $85.4 44.5 28.5 12.5 14% GAAP Net Loss ($17.6) ($45.6) N.A. GAAP Loss Per Share Weighted Average Diluted Shares ($0.30) 58.6 ($0.79) 57.4 N.A. Adjusted EPS(1) $0.07 ($0.42) N.A. Adj. EBITDA(1) % of revenue $22.0 9.9% ($21.3) N.A. N.A. Operating Cash Flow $85.5 $45.5 88% Free Cash Flow(1) % of Adjusted EBITDA $81.9 372.3% $37.5 N.A. 118% Notes (1) Non-GAAP, see reconciliation table. (2) All references in this presentation to the second quarter of fiscal 2025 are to the quarter ended December 27, 2024. All references to the second quarter of fiscal 2024 are to the quarter ended December 29, 2023.
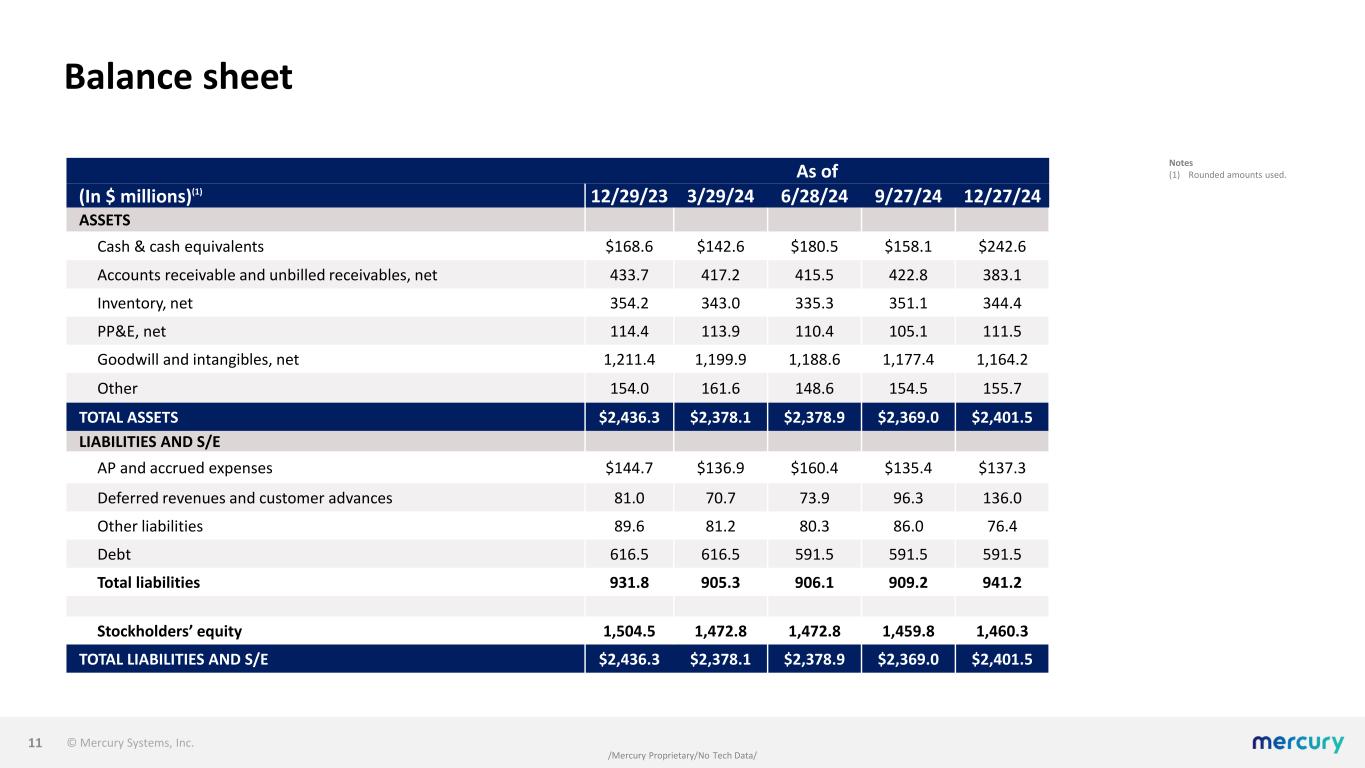
© Mercury Systems, Inc. /Mercury Proprietary/No Tech Data/ Balance sheet 11 As of (In $ millions)(1) 12/29/23 3/29/24 6/28/24 9/27/24 12/27/24 ASSETS Cash & cash equivalents $168.6 $142.6 $180.5 $158.1 $242.6 Accounts receivable and unbilled receivables, net 433.7 417.2 415.5 422.8 383.1 Inventory, net 354.2 343.0 335.3 351.1 344.4 PP&E, net 114.4 113.9 110.4 105.1 111.5 Goodwill and intangibles, net 1,211.4 1,199.9 1,188.6 1,177.4 1,164.2 Other 154.0 161.6 148.6 154.5 155.7 TOTAL ASSETS $2,436.3 $2,378.1 $2,378.9 $2,369.0 $2,401.5 LIABILITIES AND S/E AP and accrued expenses $144.7 $136.9 $160.4 $135.4 $137.3 Deferred revenues and customer advances 81.0 70.7 73.9 96.3 136.0 Other liabilities 89.6 81.2 80.3 86.0 76.4 Debt 616.5 616.5 591.5 591.5 591.5 Total liabilities 931.8 905.3 906.1 909.2 941.2 Stockholders’ equity 1,504.5 1,472.8 1,472.8 1,459.8 1,460.3 TOTAL LIABILITIES AND S/E $2,436.3 $2,378.1 $2,378.9 $2,369.0 $2,401.5 Notes (1) Rounded amounts used.
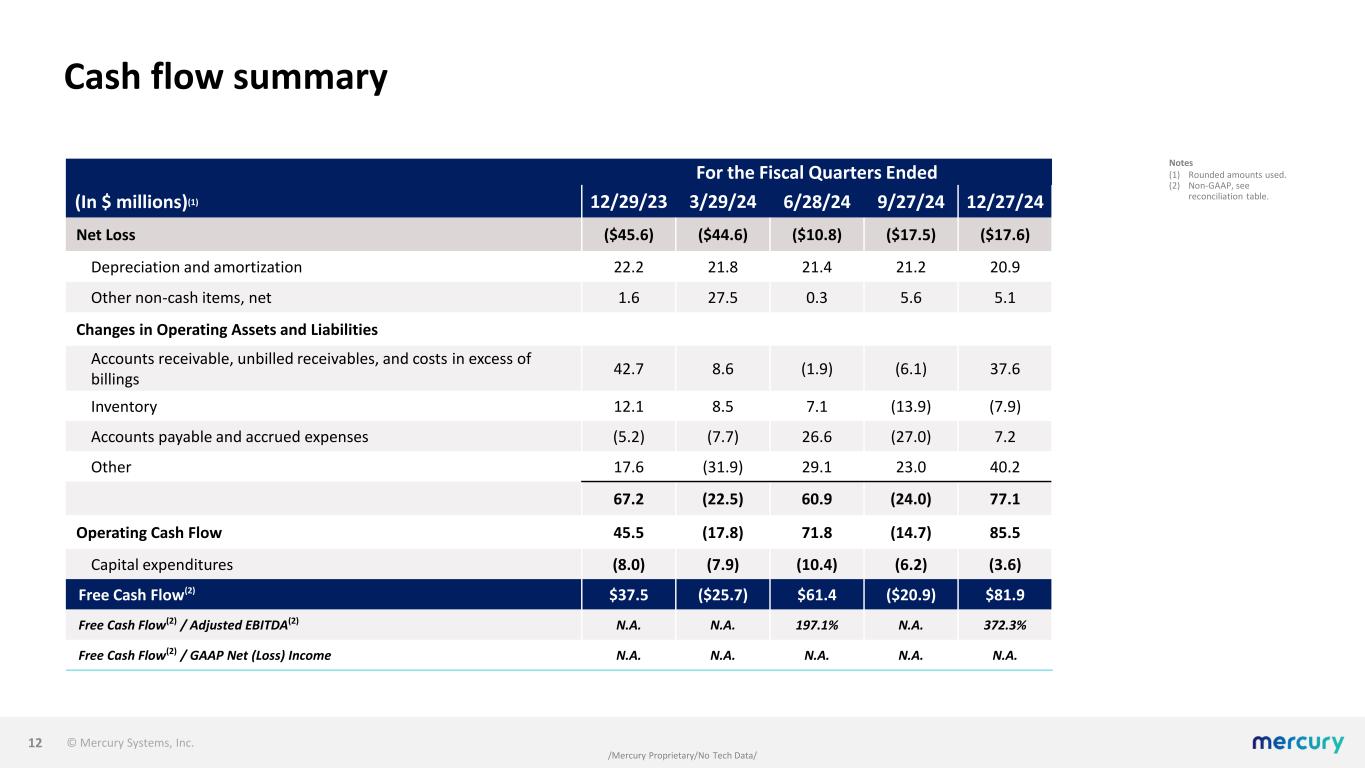
© Mercury Systems, Inc. /Mercury Proprietary/No Tech Data/ Cash flow summary 12 Notes (1) Rounded amounts used. (2) Non-GAAP, see reconciliation table. For the Fiscal Quarters Ended (In $ millions)(1) 12/29/23 3/29/24 6/28/24 9/27/24 12/27/24 Net Loss ($45.6) ($44.6) ($10.8) ($17.5) ($17.6) Depreciation and amortization 22.2 21.8 21.4 21.2 20.9 Other non-cash items, net 1.6 27.5 0.3 5.6 5.1 Changes in Operating Assets and Liabilities Accounts receivable, unbilled receivables, and costs in excess of billings 42.7 8.6 (1.9) (6.1) 37.6 Inventory 12.1 8.5 7.1 (13.9) (7.9) Accounts payable and accrued expenses (5.2) (7.7) 26.6 (27.0) 7.2 Other 17.6 (31.9) 29.1 23.0 40.2 67.2 (22.5) 60.9 (24.0) 77.1 Operating Cash Flow 45.5 (17.8) 71.8 (14.7) 85.5 Capital expenditures (8.0) (7.9) (10.4) (6.2) (3.6) Free Cash Flow(2) $37.5 ($25.7) $61.4 ($20.9) $81.9 Free Cash Flow(2) / Adjusted EBITDA(2) N.A. N.A. 197.1% N.A. 372.3% Free Cash Flow(2) / GAAP Net (Loss) Income N.A. N.A. N.A. N.A. N.A.
© Mercury Systems, Inc. APPENDIX
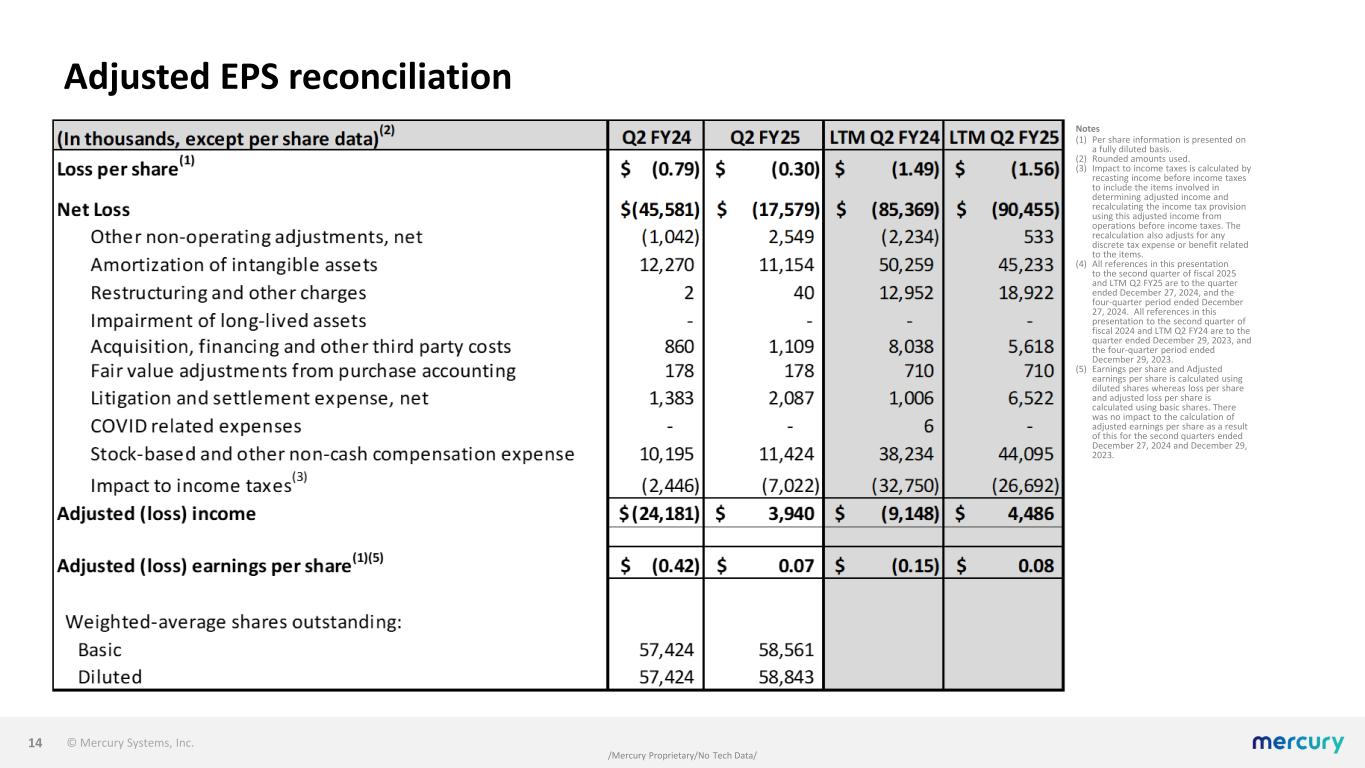
© Mercury Systems, Inc. /Mercury Proprietary/No Tech Data/ Adjusted EPS reconciliation 14 Notes (1) Per share information is presented on a fully diluted basis. (2) Rounded amounts used. (3) Impact to income taxes is calculated by recasting income before income taxes to include the items involved in determining adjusted income and recalculating the income tax provision using this adjusted income from operations before income taxes. The recalculation also adjusts for any discrete tax expense or benefit related to the items. (4) All references in this presentation to the second quarter of fiscal 2025 and LTM Q2 FY25 are to the quarter ended December 27, 2024, and the four-quarter period ended December 27, 2024. All references in this presentation to the second quarter of fiscal 2024 and LTM Q2 FY24 are to the quarter ended December 29, 2023, and the four-quarter period ended December 29, 2023. (5) Earnings per share and Adjusted earnings per share is calculated using diluted shares whereas loss per share and adjusted loss per share is calculated using basic shares. There was no impact to the calculation of adjusted earnings per share as a result of this for the second quarters ended December 27, 2024 and December 29, 2023.
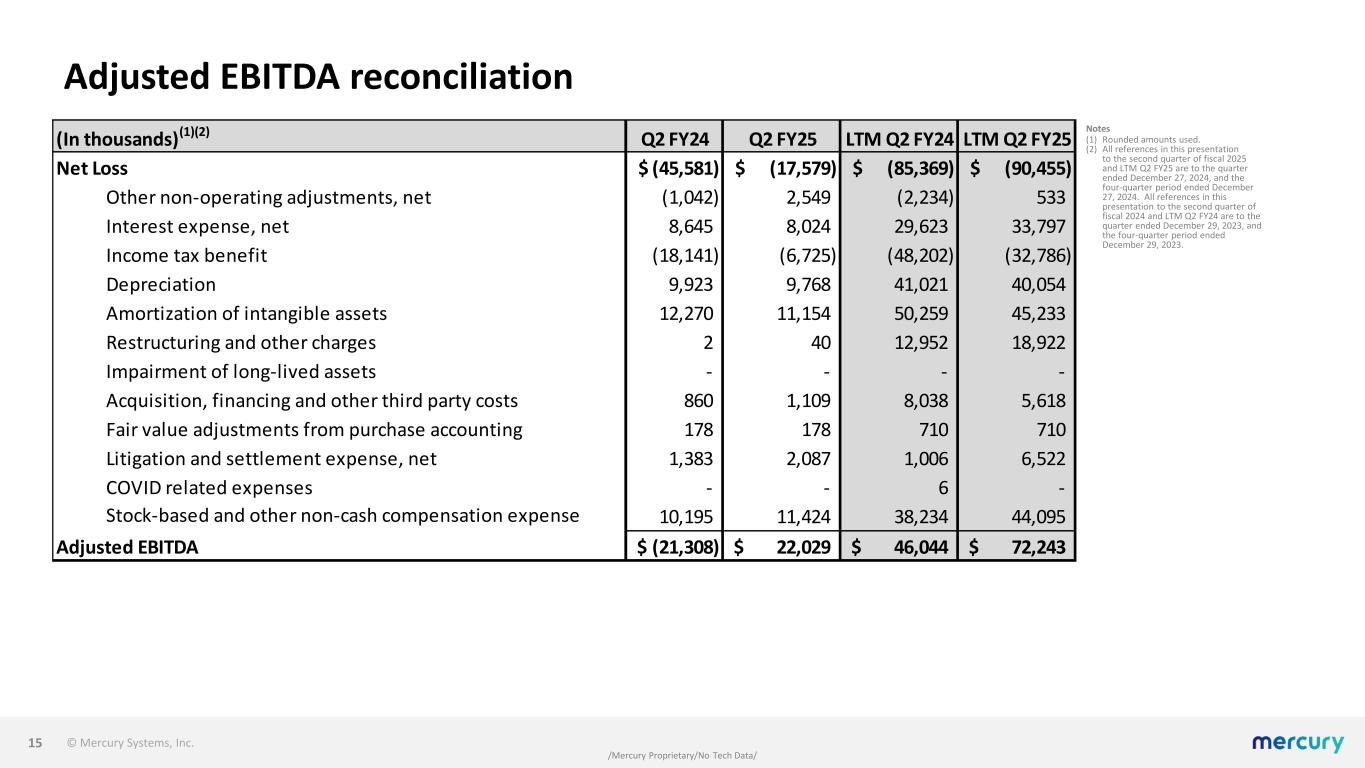
© Mercury Systems, Inc. /Mercury Proprietary/No Tech Data/ Adjusted EBITDA reconciliation 15 Notes (1) Rounded amounts used. (2) All references in this presentation to the second quarter of fiscal 2025 and LTM Q2 FY25 are to the quarter ended December 27, 2024, and the four-quarter period ended December 27, 2024. All references in this presentation to the second quarter of fiscal 2024 and LTM Q2 FY24 are to the quarter ended December 29, 2023, and the four-quarter period ended December 29, 2023. (In thousands)(1)(2) Q2 FY24 Q2 FY25 LTM Q2 FY24 LTM Q2 FY25 Net Loss (45,581)$ (17,579)$ (85,369)$ (90,455)$ Other non-operating adjustments, net (1,042) 2,549 (2,234) 533 Interest expense, net 8,645 8,024 29,623 33,797 Income tax benefit (18,141) (6,725) (48,202) (32,786) Depreciation 9,923 9,768 41,021 40,054 Amortization of intangible assets 12,270 11,154 50,259 45,233 Restructuring and other charges 2 40 12,952 18,922 Impairment of long-lived assets - - - - Acquisition, financing and other third party costs 860 1,109 8,038 5,618 Fair value adjustments from purchase accounting 178 178 710 710 Litigation and settlement expense, net 1,383 2,087 1,006 6,522 COVID related expenses - - 6 - Stock-based and other non-cash compensation expense 10,195 11,424 38,234 44,095 Adjusted EBITDA (21,308)$ 22,029$ 46,044$ 72,243$
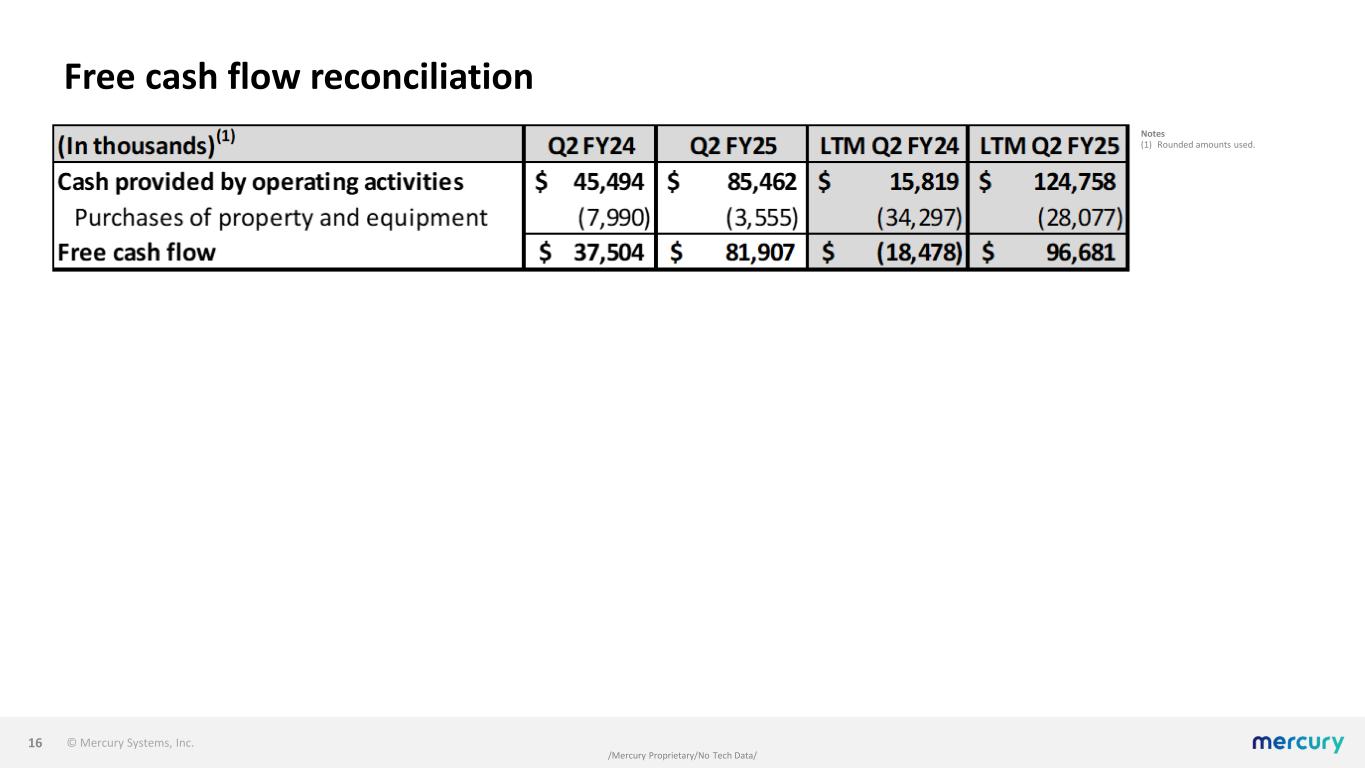
© Mercury Systems, Inc. /Mercury Proprietary/No Tech Data/ Free cash flow reconciliation 16 Notes (1) Rounded amounts used.