© Mercury Systems, Inc. WEBCAST LOGIN AT WWW.MRCY.COM/INVESTOR WEBCAST REPLAY AVAILABLE BY 7:00 P.M. ET AUGUST 18, 2026 Bill Ballhaus Chairman and CEO David Farnsworth Executive Vice President and CFO August 18, 2026, 5:00 pm ET FOURTH QUARTER AND FISCAL YEAR 2026 FINANCIAL RESULTS 1
© Mercury Systems, Inc. /Mercury Proprietary/No Tech Data/ Forward-looking safe harbor statement This presentation contains certain forward-looking statements, as that term is defined in the Private Securities Litigation Reform Act of 1995, including those relating to the Company's focus on enhanced execution of the Company's strategic plan. You can identify these statements by the words “may,” “will,” “could,” “should,” “would,” “plans,” “expects,” “anticipates,” “continue,” “estimate,” “project,” “intend,” “likely,” “forecast,” “probable,” “potential,” and similar expressions. These forward-looking statements involve risks and uncertainties that could cause actual results to differ materially from those projected or anticipated. Such risks and uncertainties include, but are not limited to, cost increases, our inability to increase production and deliver products on time and with appropriate quality, continued funding of defense programs, the timing and amounts of such funding, general economic and business conditions, including unforeseen weakness in the Company’s markets, effects of any U.S. federal government shutdown or extended continuing resolution, effects of increasingly volatile geopolitical events and regional conflicts, competition, changes in technology and methods of marketing, delays in or cost increases related to completing development, engineering and manufacturing programs, changes in customer order patterns, changes in product mix, continued success in technological advances and delivering technological innovations, changes in, or in the U.S. government’s interpretation of, federal export control or procurement rules and regulations, including tariffs, changes in, or in the interpretation or enforcement of, environmental rules and regulations, market acceptance of the Company's products, shortages or delays in receiving components, supply chain delays or volatility for critical components, production delays or unanticipated expenses including due to quality issues or manufacturing execution issues, failure to meet contractual performance specifications, adherence to required manufacturing standards, capacity underutilization, increases in scrap or inventory write-offs, failure to achieve or maintain manufacturing quality certifications, such as AS9100, failure to achieve or maintain qualified business systems, such as those required by the DFARS, adverse findings in government audits or investigations, the impact of supply chain disruption, inflation and labor shortages, among other things, on program execution and the resulting effect on customer satisfaction, inability to fully realize the expected benefits from acquisitions, restructurings and operational efficiency initiatives or delays in realizing such benefits, challenges in integrating acquired businesses and achieving anticipated synergies, effects of shareholder activism, increases in interest rates, changes to industrial security and cyber-security regulations and requirements and impacts from any cyber or insider threat events, including the risks from heightened, persistent, and increasingly sophisticated nation-state level cyberattacks and emerging threats associated with agentic AI-enabled cyber tools, changes in tax rates or tax regulations, changes to interest rate swaps or other cash flow hedging arrangements, changes to generally accepted accounting principles, difficulties in retaining key employees and customers, litigation, including the state law claim related to our settled federal securities class action lawsuit, unanticipated costs under fixed-price service and system integration engagements, and various other factors beyond our control. These risks and uncertainties also include such additional risk factors as are discussed in the Company's filings with the U.S. Securities and Exchange Commission, including its Annual Report on Form 10-K for the fiscal year ended July 3, 2026 and subsequent Quarterly Reports on Form 10-Q and Current Reports on Form 8-K. The Company cautions readers not to place undue reliance upon any such forward-looking statements, which speak only as of the date made. The Company undertakes no obligation to update any forward-looking statement to reflect events or circumstances after the date on which such statement is made. Use of Non-GAAP (Generally Accepted Accounting Principles) Financial Measures In addition to reporting financial results in accordance with generally accepted accounting principles, or GAAP, the Company provides adjusted EBITDA, adjusted income, adjusted EPS, and free cash flow, which are non-GAAP financial measures. Adjusted EBITDA, adjusted income, and adjusted EPS exclude certain non-cash and other specified charges. The Company believes these non- GAAP financial measures are useful to help investors better understand its past financial performance and prospects for the future. However, these non-GAAP measures should not be considered in isolation or as a substitute for financial information provided in accordance with GAAP. Management believes these non-GAAP measures assist in providing a more complete understanding of the Company’s underlying operational results and trends, and management uses these measures along with the corresponding GAAP financial measures to manage the Company’s business, to evaluate its performance compared to prior periods and the marketplace, and to establish operational goals. A reconciliation of GAAP to non-GAAP financial results discussed in this presentation is contained in the Appendix hereto. 2
© Mercury Systems, Inc. /Mercury Proprietary/No Tech Data/ Today’s call ▪ Opening remarks on business and results ▪ Update on our four priorities ▪ Performance expectations for FY27 and beyond ▪ Q&A 3
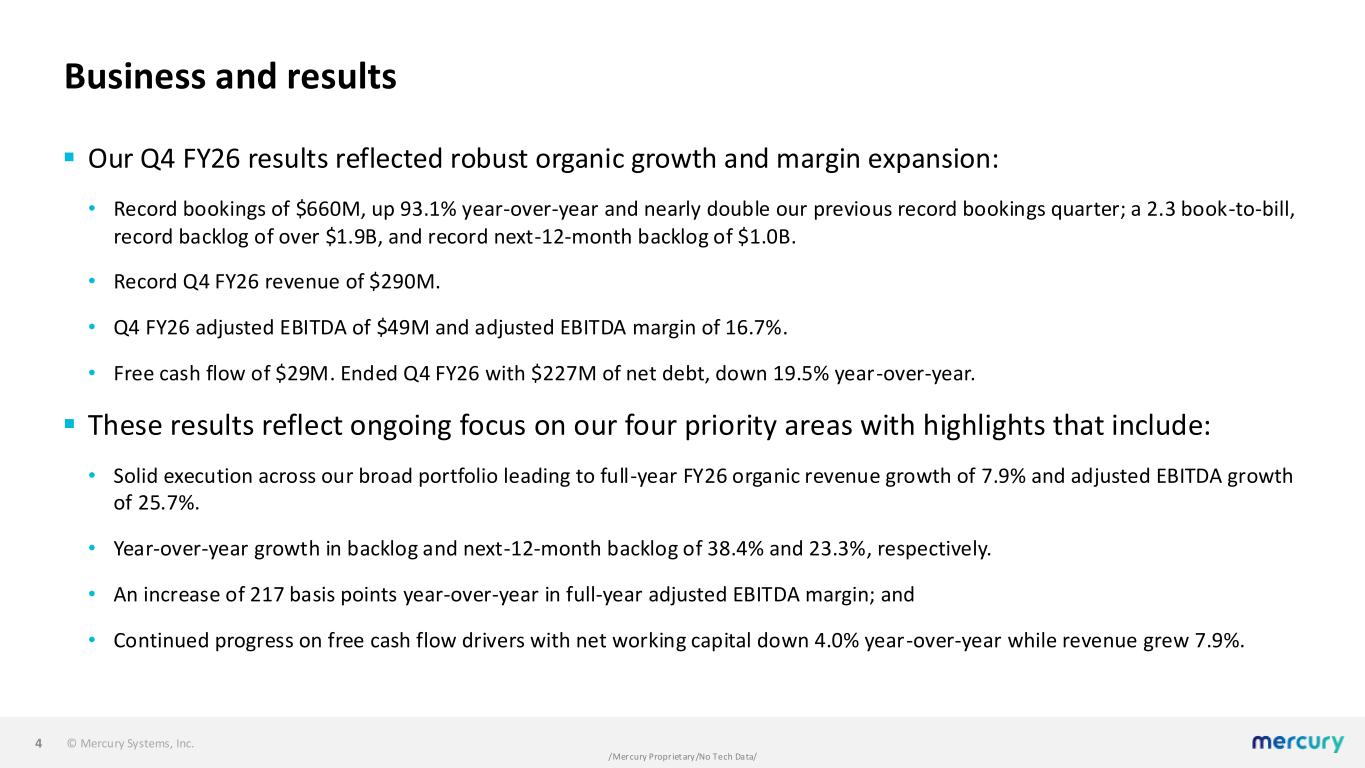
© Mercury Systems, Inc. /Mercury Proprietary/No Tech Data/ Business and results ▪ Our Q4 FY26 results reflected robust organic growth and margin expansion: • Record bookings of $660M, up 93.1% year-over-year and nearly double our previous record bookings quarter; a 2.3 book-to-bill, record backlog of over $1.9B, and record next-12-month backlog of $1.0B. • Record Q4 FY26 revenue of $290M. • Q4 FY26 adjusted EBITDA of $49M and adjusted EBITDA margin of 16.7%. • Free cash flow of $29M. Ended Q4 FY26 with $227M of net debt, down 19.5% year-over-year. ▪ These results reflect ongoing focus on our four priority areas with highlights that include: • Solid execution across our broad portfolio leading to full-year FY26 organic revenue growth of 7.9% and adjusted EBITDA growth of 25.7%. • Year-over-year growth in backlog and next-12-month backlog of 38.4% and 23.3%, respectively. • An increase of 217 basis points year-over-year in full-year adjusted EBITDA margin; and • Continued progress on free cash flow drivers with net working capital down 4.0% year-over-year while revenue grew 7.9%. 4
© Mercury Systems, Inc. /Mercury Proprietary/No Tech Data/ Driving performance excellence ▪ Focused on sound execution on development programs, delivering for our customers across our portfolio, and scaling efficiently on numerous programs transitioning to higher volume production. • In Q4, we ramped up across a number of programs and generated record quarterly revenue. • Our over time revenue in Q4, up 23.6% year-over-year, was the highest in 15 quarters, driven largely by the receipt of material which we believe is an indicator that we are better aligning our supply chain with the increased organic growth we are seeing in several areas across the business. ▪ Our domestic revenue, representing approximately 85.8% of our FY26 revenue, grew 13.0% organically year-over-year. ▪ Continue efforts to expand capacity, increase automation, and consolidate sub-scale sites in our ongoing efforts to drive scalability and efficiency: • Recently announced a strategic agreement with Palantir to leverage AI software to enhance material planning and factory operations in an effort to improve backlog conversion and deliver critical technologies to the warfighter. 5
© Mercury Systems, Inc. /Mercury Proprietary/No Tech Data/ Driving organic growth ▪ Record quarter with $660M of bookings resulting in record fiscal year bookings of $1.5B, up 49.8% year- over-year, and a book-to-bill of 1.57 for the year. • Record total backlog approaching $2.0B is also providing enhanced visibility as we enter FY27 and into FY28. ▪ Strength in Q4 bookings was broad-based, with significant production awards across our products and solutions in Common Processing Architecture (CPA), effectors, airborne applications, space and missile defense. • Largest quarter ever for CPA bookings which we believe reflects the differentiation of our CPA solutions and reinforces our confidence in the growth prospects of this area. • The quarter also included significant bookings related to securing memory to support future production requirements across a number of advanced defense platforms. • Beginning to see the favorable impacts of the defense budgetary environment leading to a number of multi-year customer commitments. ▪ Continue to see the potential for higher demand on multiple programs across our portfolio, including space, munitions, missile defense, and our CPA, driven by increased defense budgets globally and domestic priorities. 6
© Mercury Systems, Inc. /Mercury Proprietary/No Tech Data/ Expanding margins ▪ In our efforts to progress toward our targeted adjusted EBITDA margins in the low to mid 20% range, we remain focused on the following drivers: • Backlog margin expansion as we convert low-margin backlog and add new bookings aligned with our target margin profile. • Ongoing initiatives to further simplify, automate, and optimize our operations. • Driving organic growth to increase positive operating leverage. ▪ Gross margin for FY26 of 28.6% was up 70 basis points year-over-year, consistent with our expectation that average backlog margin will continue to increase as we convert legacy lower-margin backlog and bring in new bookings that we believe will be in line with our targeted margin profile. ▪ FY26 operating expenses are down year-over-year as a percent of our revenue reflecting our ongoing focus to drive efficiencies and enable positive operating leverage as we accelerate organic growth. ▪ Full year adjusted EBITDA margin of 15.3% was in line with our expectations and up 217 basis points year-over-year. 7
© Mercury Systems, Inc. /Mercury Proprietary/No Tech Data/ Driving improved free cash flow conversion and release ▪ Continue to make progress on drivers of free cash flow. Net working capital at approximately $431M is down $18M year-over-year. ▪ Full year free cash flow of $68M led to net debt of $227M at the end of Q4, which we reduced by $55M year-over-year. ▪ Continuous improvement related to program execution, demand planning, and supply chain management, along with strong balance sheet flexibility, positions us well to drive organic growth and capitalize on any additional potential market tailwinds. 8
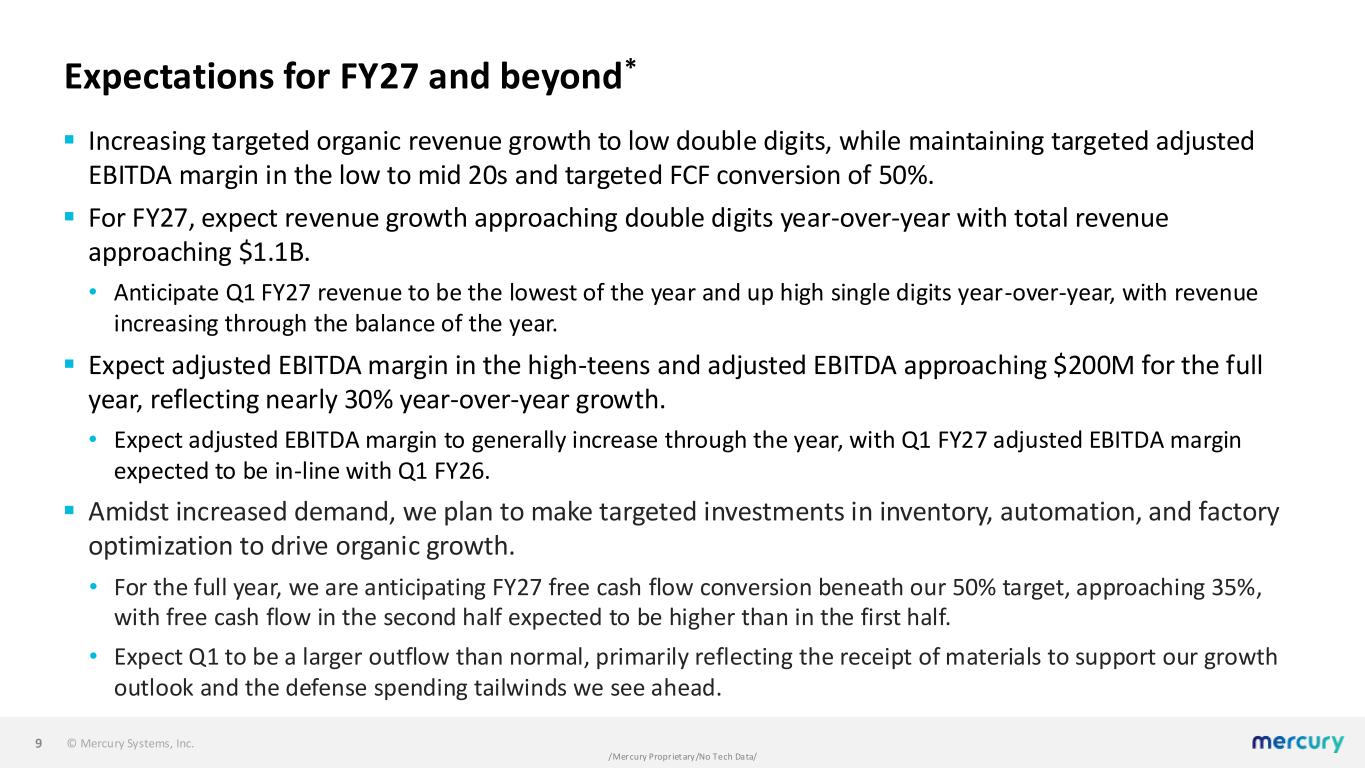
© Mercury Systems, Inc. /Mercury Proprietary/No Tech Data/ Expectations for FY27 and beyond* ▪ Increasing targeted organic revenue growth to low double digits, while maintaining targeted adjusted EBITDA margin in the low to mid 20s and targeted FCF conversion of 50%. ▪ For FY27, expect revenue growth approaching double digits year-over-year with total revenue approaching $1.1B. • Anticipate Q1 FY27 revenue to be the lowest of the year and up high single digits year-over-year, with revenue increasing through the balance of the year. ▪ Expect adjusted EBITDA margin in the high-teens and adjusted EBITDA approaching $200M for the full year, reflecting nearly 30% year-over-year growth. • Expect adjusted EBITDA margin to generally increase through the year, with Q1 FY27 adjusted EBITDA margin expected to be in-line with Q1 FY26. ▪ Amidst increased demand, we plan to make targeted investments in inventory, automation, and factory optimization to drive organic growth. • For the full year, we are anticipating FY27 free cash flow conversion beneath our 50% target, approaching 35%, with free cash flow in the second half expected to be higher than in the first half. • Expect Q1 to be a larger outflow than normal, primarily reflecting the receipt of materials to support our growth outlook and the defense spending tailwinds we see ahead. 9
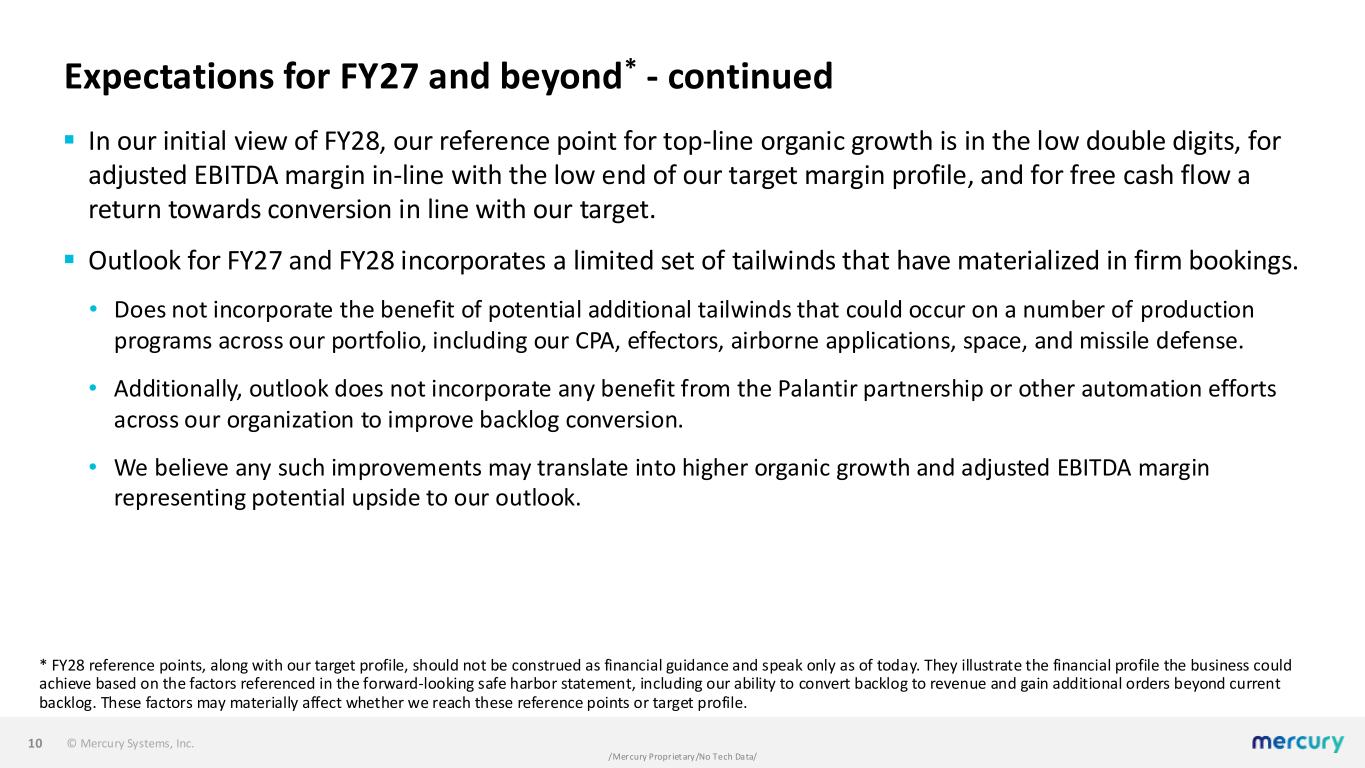
© Mercury Systems, Inc. /Mercury Proprietary/No Tech Data/ Expectations for FY27 and beyond* - continued ▪ In our initial view of FY28, our reference point for top-line organic growth is in the low double digits, for adjusted EBITDA margin in-line with the low end of our target margin profile, and for free cash flow a return towards conversion in line with our target. ▪ Outlook for FY27 and FY28 incorporates a limited set of tailwinds that have materialized in firm bookings. • Does not incorporate the benefit of potential additional tailwinds that could occur on a number of production programs across our portfolio, including our CPA, effectors, airborne applications, space, and missile defense. • Additionally, outlook does not incorporate any benefit from the Palantir partnership or other automation efforts across our organization to improve backlog conversion. • We believe any such improvements may translate into higher organic growth and adjusted EBITDA margin representing potential upside to our outlook. 10 * FY28 reference points, along with our target profile, should not be construed as financial guidance and speak only as of today. They illustrate the financial profile the business could achieve based on the factors referenced in the forward-looking safe harbor statement, including our ability to convert backlog to revenue and gain additional orders beyond current backlog. These factors may materially affect whether we reach these reference points or target profile.
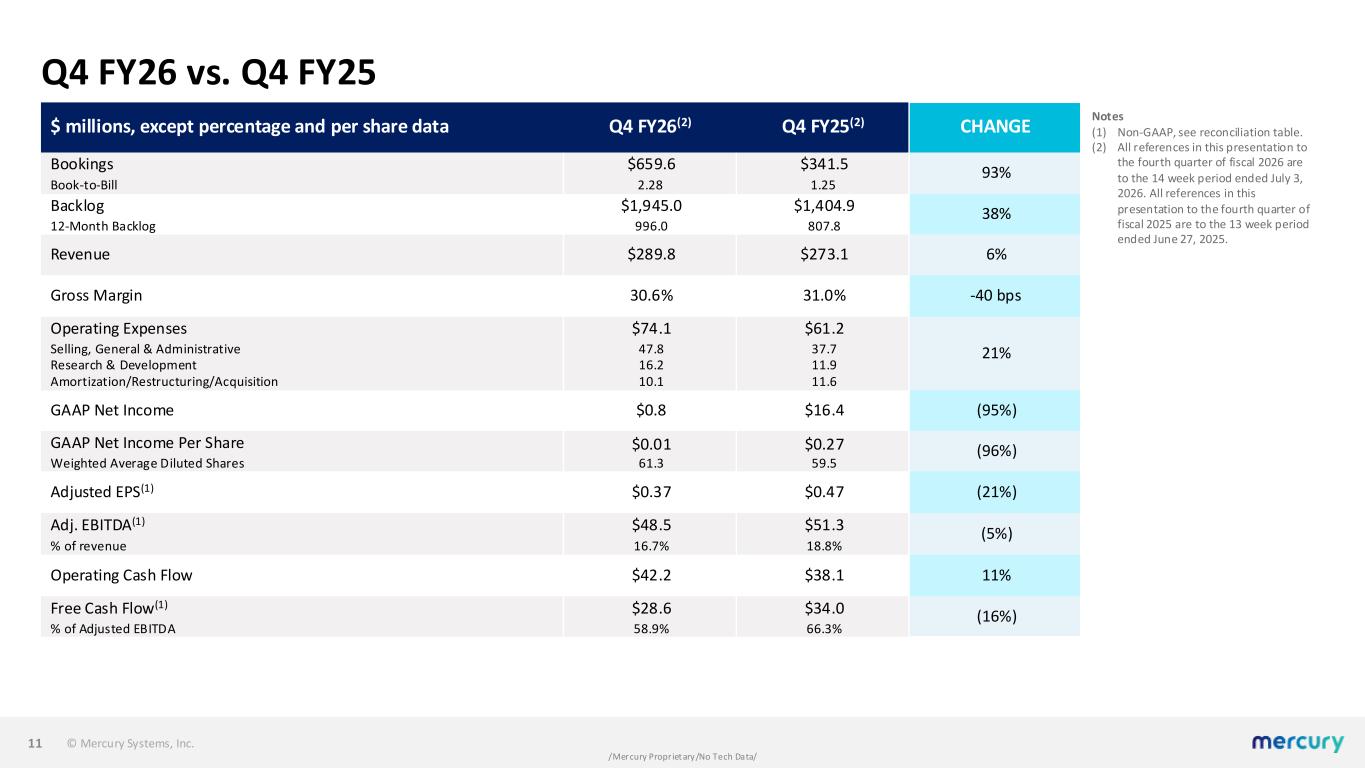
© Mercury Systems, Inc. /Mercury Proprietary/No Tech Data/ Q4 FY26 vs. Q4 FY25 11 $ millions, except percentage and per share data Q4 FY26(2) Q4 FY25(2) CHANGE Bookings $659.6 $341.5 93% Book-to-Bill 2.28 1.25 Backlog $1,945.0 $1,404.9 38% 12-Month Backlog 996.0 807.8 Revenue $289.8 $273.1 6% Gross Margin 30.6% 31.0% -40 bps Operating Expenses $74.1 $61.2 21%Selling, General & Administrative 47.8 37.7 Research & Development 16.2 11.9 Amortization/Restructuring/Acquisition 10.1 11.6 GAAP Net Income $0.8 $16.4 (95%) GAAP Net Income Per Share $0.01 $0.27 (96%) Weighted Average Diluted Shares 61.3 59.5 Adjusted EPS(1) $0.37 $0.47 (21%) Adj. EBITDA(1) $48.5 $51.3 (5%) % of revenue 16.7% 18.8% Operating Cash Flow $42.2 $38.1 11% Free Cash Flow(1) $28.6 $34.0 (16%) % of Adjusted EBITDA 58.9% 66.3% Notes (1) Non-GAAP, see reconciliation table. (2) All references in this presentation to the fourth quarter of fiscal 2026 are to the 14 week period ended July 3, 2026. All references in this presentation to the fourth quarter of fiscal 2025 are to the 13 week period ended June 27, 2025.
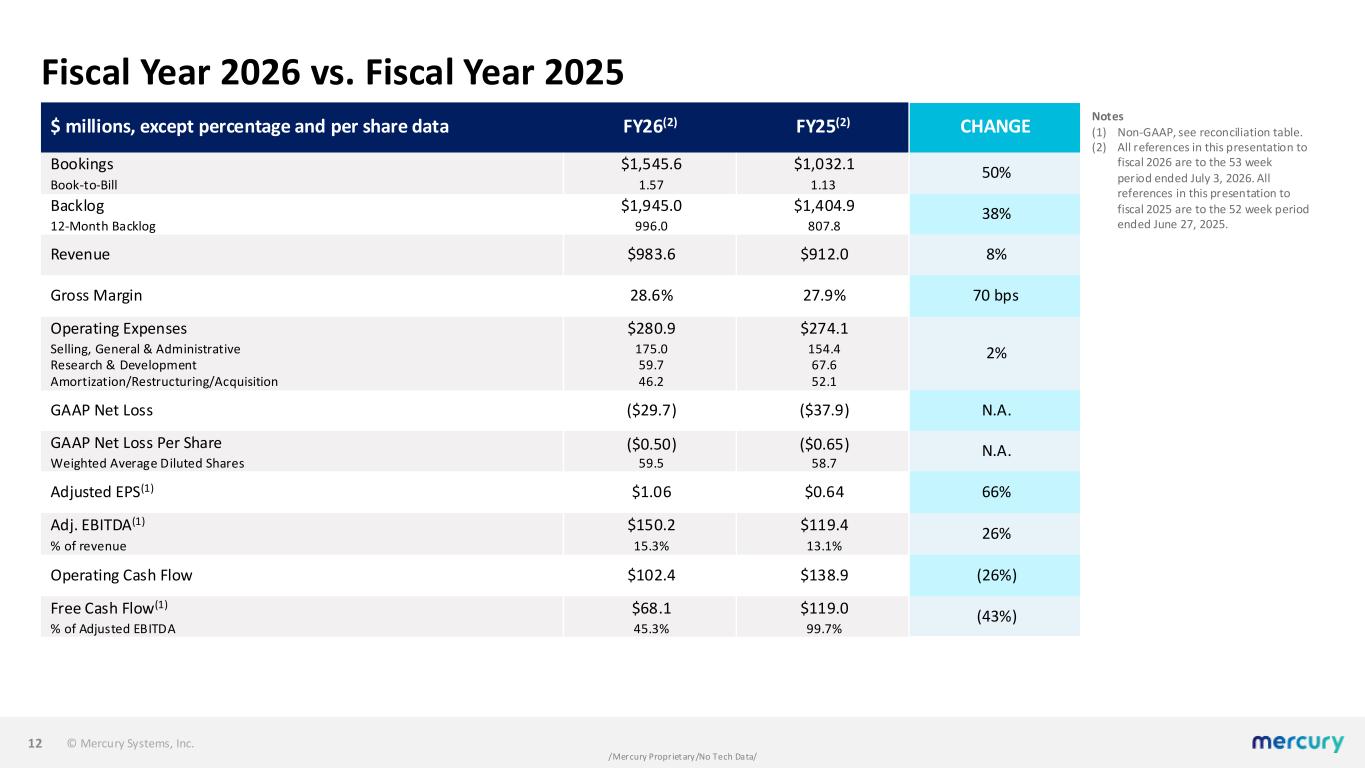
© Mercury Systems, Inc. /Mercury Proprietary/No Tech Data/ 12 $ millions, except percentage and per share data FY26(2) FY25(2) CHANGE Bookings $1,545.6 $1,032.1 50% Book-to-Bill 1.57 1.13 Backlog $1,945.0 $1,404.9 38% 12-Month Backlog 996.0 807.8 Revenue $983.6 $912.0 8% Gross Margin 28.6% 27.9% 70 bps Operating Expenses $280.9 $274.1 2%Selling, General & Administrative 175.0 154.4 Research & Development 59.7 67.6 Amortization/Restructuring/Acquisition 46.2 52.1 GAAP Net Loss ($29.7) ($37.9) N.A. GAAP Net Loss Per Share ($0.50) ($0.65) N.A. Weighted Average Diluted Shares 59.5 58.7 Adjusted EPS(1) $1.06 $0.64 66% Adj. EBITDA(1) $150.2 $119.4 26% % of revenue 15.3% 13.1% Operating Cash Flow $102.4 $138.9 (26%) Free Cash Flow(1) $68.1 $119.0 (43%) % of Adjusted EBITDA 45.3% 99.7% Notes (1) Non-GAAP, see reconciliation table. (2) All references in this presentation to fiscal 2026 are to the 53 week period ended July 3, 2026. All references in this presentation to fiscal 2025 are to the 52 week period ended June 27, 2025. Fiscal Year 2026 vs. Fiscal Year 2025
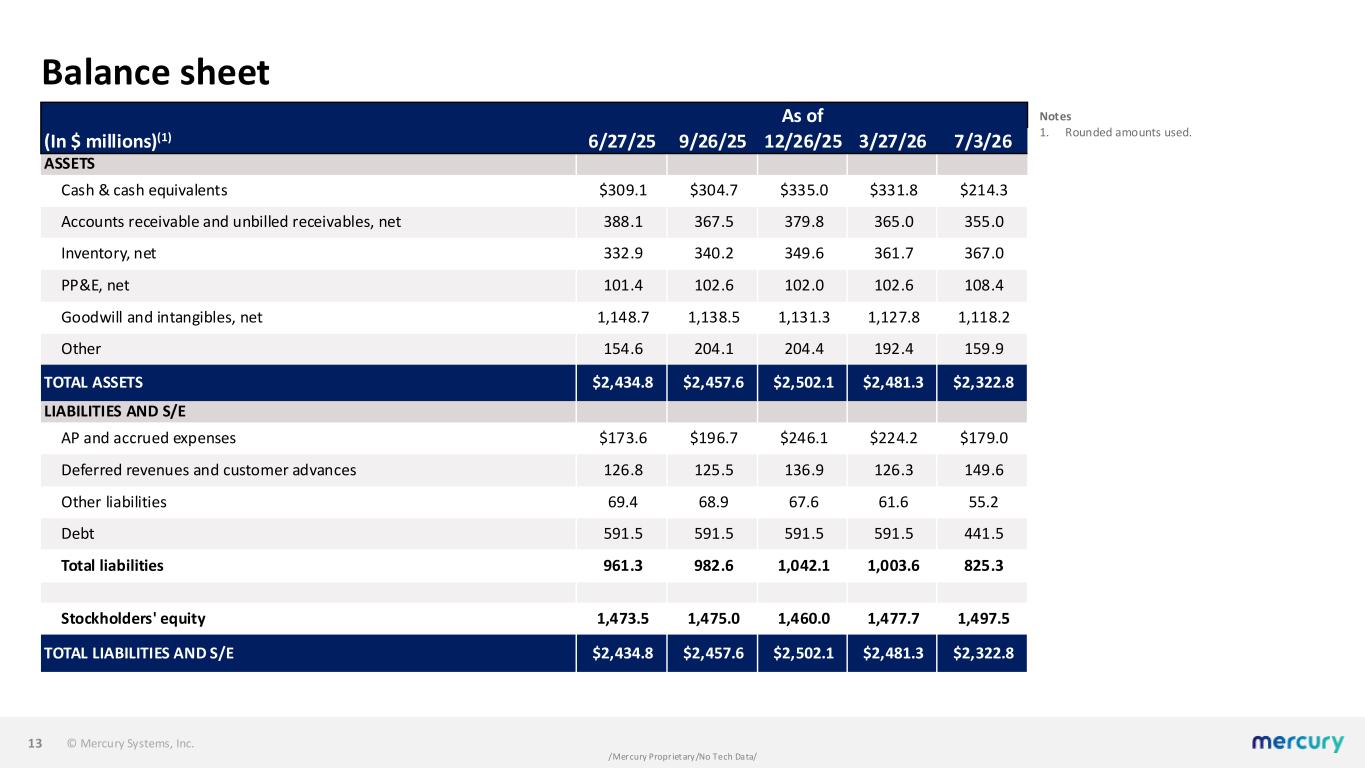
© Mercury Systems, Inc. /Mercury Proprietary/No Tech Data/ Balance sheet 13 Notes 1. Rounded amounts used. As of (In $ millions)(1) 6/27/25 9/26/25 12/26/25 3/27/26 7/3/26 ASSETS Cash & cash equivalents $309.1 $304.7 $335.0 $331.8 $214.3 Accounts receivable and unbilled receivables, net 388.1 367.5 379.8 365.0 355.0 Inventory, net 332.9 340.2 349.6 361.7 367.0 PP&E, net 101.4 102.6 102.0 102.6 108.4 Goodwill and intangibles, net 1,148.7 1,138.5 1,131.3 1,127.8 1,118.2 Other 154.6 204.1 204.4 192.4 159.9 TOTAL ASSETS $2,434.8 $2,457.6 $2,502.1 $2,481.3 $2,322.8 LIABILITIES AND S/E AP and accrued expenses $173.6 $196.7 $246.1 $224.2 $179.0 Deferred revenues and customer advances 126.8 125.5 136.9 126.3 149.6 Other liabilities 69.4 68.9 67.6 61.6 55.2 Debt 591.5 591.5 591.5 591.5 441.5 Total liabilities 961.3 982.6 1,042.1 1,003.6 825.3 Stockholders' equity 1,473.5 1,475.0 1,460.0 1,477.7 1,497.5 TOTAL LIABILITIES AND S/E $2,434.8 $2,457.6 $2,502.1 $2,481.3 $2,322.8
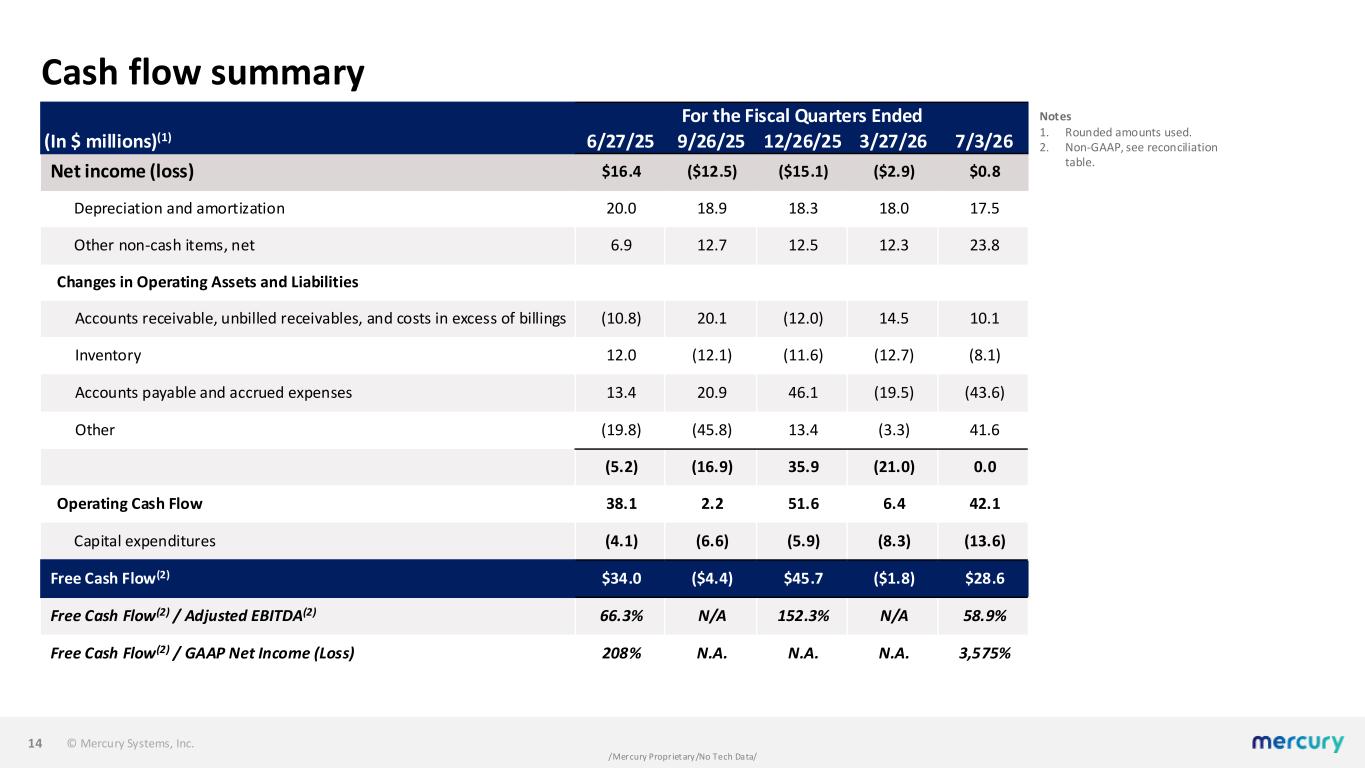
© Mercury Systems, Inc. /Mercury Proprietary/No Tech Data/ Cash flow summary 14 Notes 1. Rounded amounts used. 2. Non-GAAP, see reconciliation table. For the Fiscal Quarters Ended (In $ millions)(1) 6/27/25 9/26/25 12/26/25 3/27/26 7/3/26 Net income (loss) $16.4 ($12.5) ($15.1) ($2.9) $0.8 Depreciation and amortization 20.0 18.9 18.3 18.0 17.5 Other non-cash items, net 6.9 12.7 12.5 12.3 23.8 Changes in Operating Assets and Liabilities Accounts receivable, unbilled receivables, and costs in excess of billings (10.8) 20.1 (12.0) 14.5 10.1 Inventory 12.0 (12.1) (11.6) (12.7) (8.1) Accounts payable and accrued expenses 13.4 20.9 46.1 (19.5) (43.6) Other (19.8) (45.8) 13.4 (3.3) 41.6 (5.2) (16.9) 35.9 (21.0) 0.0 Operating Cash Flow 38.1 2.2 51.6 6.4 42.1 Capital expenditures (4.1) (6.6) (5.9) (8.3) (13.6) Free Cash Flow(2) $34.0 ($4.4) $45.7 ($1.8) $28.6 Free Cash Flow(2) / Adjusted EBITDA(2) 66.3% N/A 152.3% N/A 58.9% Free Cash Flow(2) / GAAP Net Income (Loss) 208% N.A. N.A. N.A. 3,575%
© Mercury Systems, Inc. APPENDIX
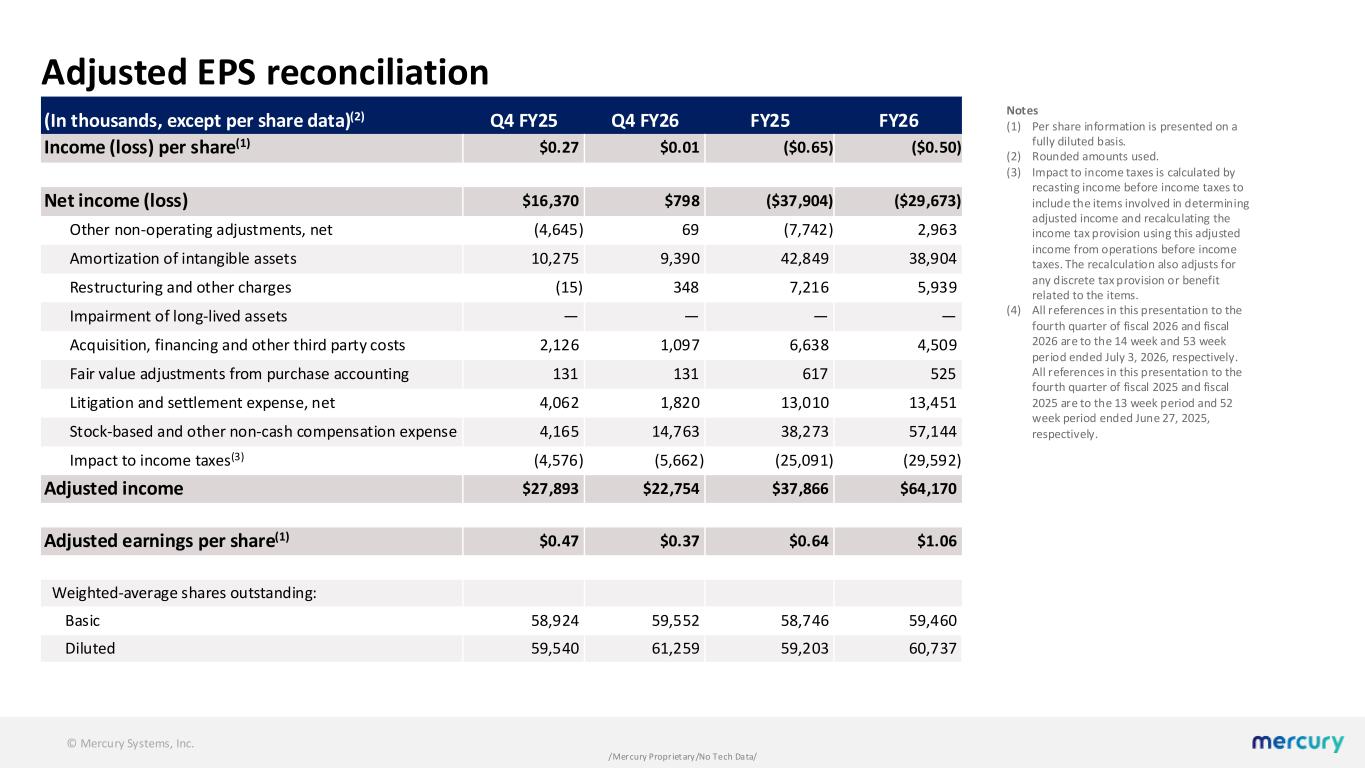
© Mercury Systems, Inc. /Mercury Proprietary/No Tech Data/ Adjusted EPS reconciliation Notes (1) Per share information is presented on a fully diluted basis. (2) Rounded amounts used. (3) Impact to income taxes is calculated by recasting income before income taxes to include the items involved in determining adjusted income and recalculating the income tax provision using this adjusted income from operations before income taxes. The recalculation also adjusts for any discrete tax provision or benefit related to the items. (4) All references in this presentation to the fourth quarter of fiscal 2026 and fiscal 2026 are to the 14 week and 53 week period ended July 3, 2026, respectively. All references in this presentation to the fourth quarter of fiscal 2025 and fiscal 2025 are to the 13 week period and 52 week period ended June 27, 2025, respectively. (In thousands, except per share data)(2) Q4 FY25 Q4 FY26 FY25 FY26 Income (loss) per share(1) $0.27 $0.01 ($0.65) ($0.50) Net income (loss) $16,370 $798 ($37,904) ($29,673) Other non-operating adjustments, net (4,645) 69 (7,742) 2,963 Amortization of intangible assets 10,275 9,390 42,849 38,904 Restructuring and other charges (15) 348 7,216 5,939 Impairment of long-lived assets — — — — Acquisition, financing and other third party costs 2,126 1,097 6,638 4,509 Fair value adjustments from purchase accounting 131 131 617 525 Litigation and settlement expense, net 4,062 1,820 13,010 13,451 Stock-based and other non-cash compensation expense 4,165 14,763 38,273 57,144 Impact to income taxes(3) (4,576) (5,662) (25,091) (29,592) Adjusted income $27,893 $22,754 $37,866 $64,170 Adjusted earnings per share(1) $0.47 $0.37 $0.64 $1.06 Weighted-average shares outstanding: Basic 58,924 59,552 58,746 59,460 Diluted 59,540 61,259 59,203 60,737
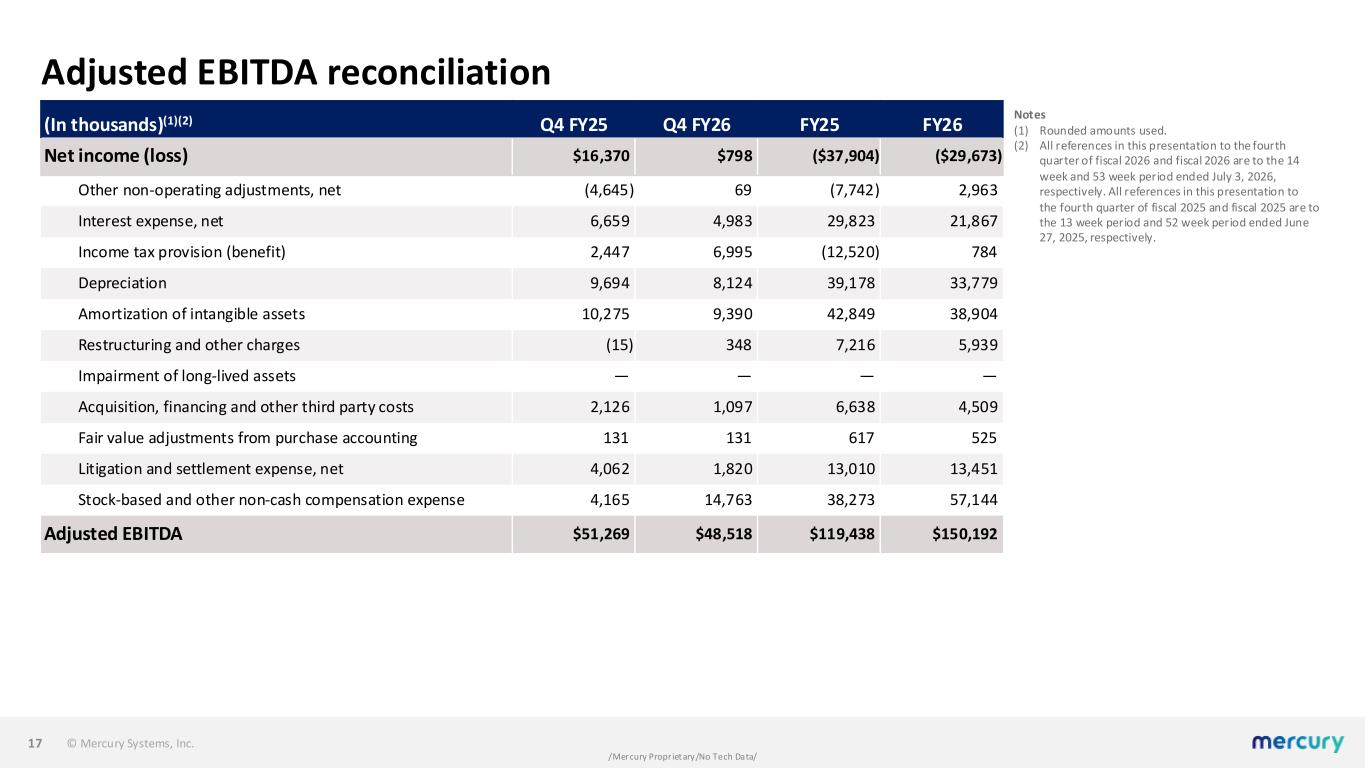
© Mercury Systems, Inc. /Mercury Proprietary/No Tech Data/ Adjusted EBITDA reconciliation 17 Notes (1) Rounded amounts used. (2) All references in this presentation to the fourth quarter of fiscal 2026 and fiscal 2026 are to the 14 week and 53 week period ended July 3, 2026, respectively. All references in this presentation to the fourth quarter of fiscal 2025 and fiscal 2025 are to the 13 week period and 52 week period ended June 27, 2025, respectively. (In thousands)(1)(2) Q4 FY25 Q4 FY26 FY25 FY26 Net income (loss) $16,370 $798 ($37,904) ($29,673) Other non-operating adjustments, net (4,645) 69 (7,742) 2,963 Interest expense, net 6,659 4,983 29,823 21,867 Income tax provision (benefit) 2,447 6,995 (12,520) 784 Depreciation 9,694 8,124 39,178 33,779 Amortization of intangible assets 10,275 9,390 42,849 38,904 Restructuring and other charges (15) 348 7,216 5,939 Impairment of long-lived assets — — — — Acquisition, financing and other third party costs 2,126 1,097 6,638 4,509 Fair value adjustments from purchase accounting 131 131 617 525 Litigation and settlement expense, net 4,062 1,820 13,010 13,451 Stock-based and other non-cash compensation expense 4,165 14,763 38,273 57,144 Adjusted EBITDA $51,269 $48,518 $119,438 $150,192
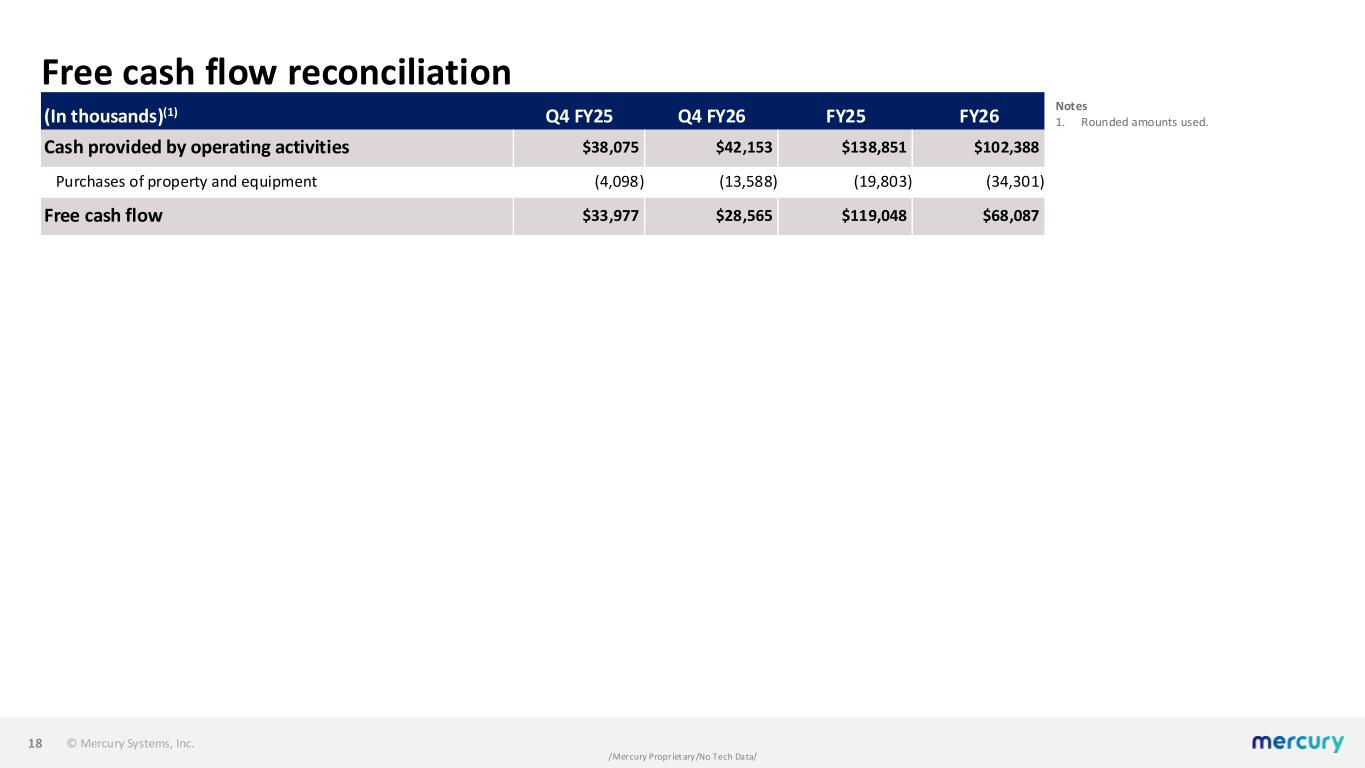
© Mercury Systems, Inc. /Mercury Proprietary/No Tech Data/ Free cash flow reconciliation 18 Notes 1. Rounded amounts used.(In thousands)(1) Q4 FY25 Q4 FY26 FY25 FY26 Cash provided by operating activities $38,075 $42,153 $138,851 $102,388 Purchases of property and equipment (4,098) (13,588) (19,803) (34,301) Free cash flow $33,977 $28,565 $119,048 $68,087