Indicate by check mark whether the registrant by furnishing the information contained in this Form is also thereby furnishing the information to the Commission pursuant to Rule 12g3-2(b) under the Securities Exchange Act of 1934.
Yes _______ No ___X____
 |
1Q26 RESULT |
São Paulo, May 13, 2026 - Companhia Siderúrgica Nacional (“CSN”) (B3: CSNA3; NYSE: SID) today reports its results for the first quarter of 2026 (1Q26), presented in Brazilian reais. The Company’s consolidated financial statements have been prepared in accordance with accounting practices adopted in Brazil, issued by the Brazilian Accounting Pronouncements Committee (“CPC”), approved by the Brazilian Securities and Exchange Commission of Brazil (“CVM”) and the Federal Accounting Council (“CFC”), as well as with the International Financial Reporting Standards (“IFRS”) issued by the International Accounting Standards Board (“IASB”).
The comments below address the Company’s consolidated results for the first quarter of 2026 (1Q26). Comparative analyses are presented against the fourth quarter of 2025 (4Q25) and the first quarter of 2025 (1Q25). For reference, the U.S. dollar exchange rate was R$ 5.74 on March 31, 2025, R$ 5.50 on December 31, 2025, and R$ 5.22 on March 31, 2026.
1Q26 Operating and Financial Highlights
For more information, access our website: https://ri.csn.com.br/ | 2 |
| | 1Q26 RESULT |
Consolidated Highlights
¹ Adjusted EBITDA is calculated based on net income (loss), plus depreciation and amortization, income taxes, net financial result, equity income, other operating income/expenses, and includes the proportional consolidation of 37.49% of the EBITDA of jointly controlled subsidiary MRS Logística, as well as the residual cost from the sale of assets of the Tora Group.
² Adjusted EBITDA Margin is calculated as Adjusted EBITDA divided by Managerial Net Revenue.
³ Adjusted Net Debt and Adjusted Cash/Cash Equivalents consider the 37.49% stake in MRS and exclude forfaiting and supplier finance transactions.
4 Leverage calculation considers LTM EBITDA of the Tora Group and Usiminas.
Consolidated Results
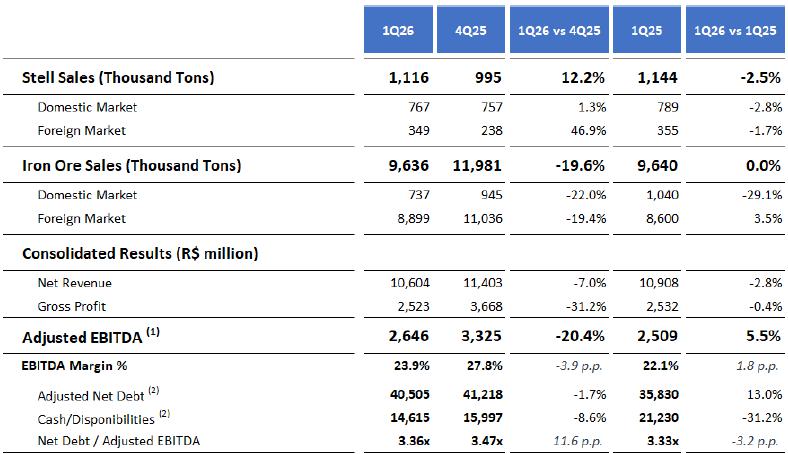
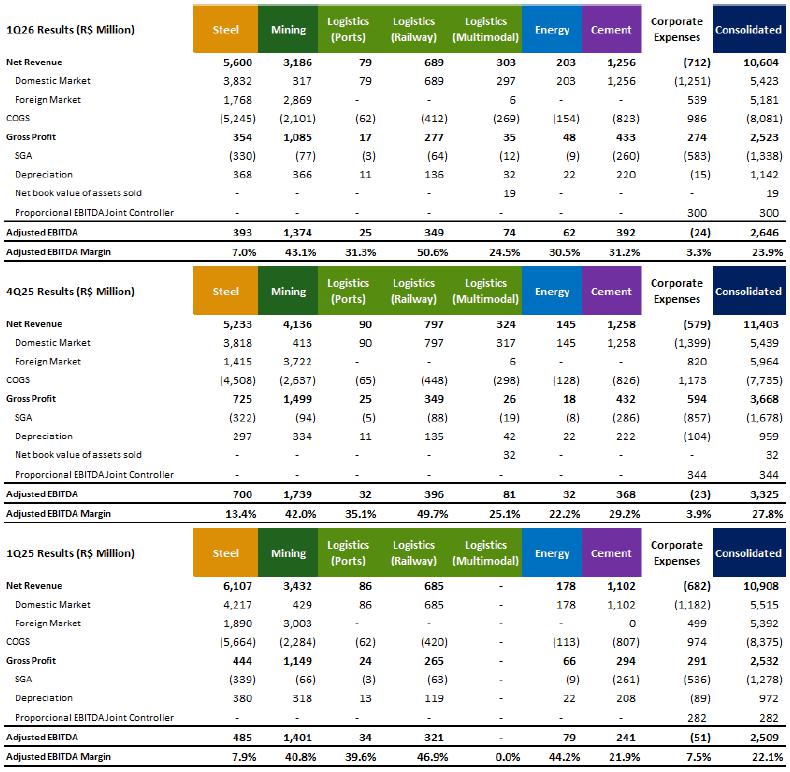
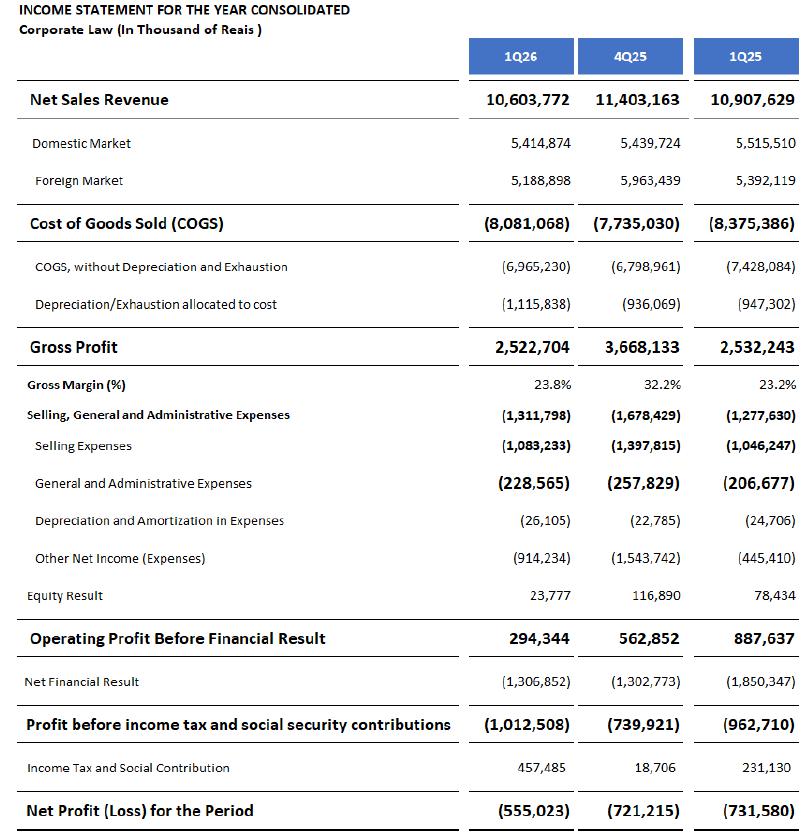
| · | Net Revenue totaled R$ 10,603.8 million in 1Q26, a decrease of 7.0% quarter-over-quarter and 2.8% versus the same period of 2025. This performance reflects the seasonally weaker operating profile of the quarter, marked by heavier rainfall, as well as the impact of exchange-rate fluctuations on mining revenue and a less favorable product mix in the steel segment. |
| · | In 1Q26, Cost of Goods Sold amounted to R$ 8,081.1 million, an increase of 4.5% versus the previous quarter, mainly reflecting higher steel sales volumes and the impact of raw-material costs. Compared with 1Q25, COGS declined 3.5%, reflecting the effect of exchange-rate fluctuations on U.S. dollar-denominated costs. |
| · | Gross Profit totaled R$ 2,522.7 million in 1Q26, with a gross margin of 23.8%, a decline of 8.4 p.p. versus 4Q25, in line with the quarter’s seasonal profile and the higher costs recorded during the period. Compared with the same period of 2025, the Company posted a 0.6 p.p. improvement in gross margin, reflecting tighter cost control and the impact of exchange-rate fluctuations on certain U.S. dollar-denominated inputs. |
| · | Selling, General and Administrative Expenses (SG&A) totaled R$ 1,337.9 million in 1Q26, representing a sharp 20.3% decline versus 4Q25, primarily as a result of mining seasonality with lower shipment volumes. Year-over-year, SG&A expenses posted an increase of 4.7%, reflecting higher freight costs during the period and the consolidation of the multimodal segment, which more than offset the Company’s ongoing cost-discipline efforts. |
| · | The Other Operating Income and Expenses line was negative by R$ 914.2 million in 1Q26, representing a 40.8% reduction versus 4Q25, as year-end results were heavily affected by non-recurring events related to operational idleness associated with the maintenance shutdown of blast furnace No. 2 (BF2), as well as by a greater impact from foreign-exchange and iron ore hedge transactions. Versus 1Q25, however, the line declined by 105.2%, due to larger inventory-related impacts that remained associated with the BF2 maintenance shutdown. |
For more information, access our website: https://ri.csn.com.br/ | 3 |
| | 1Q26 RESULT |
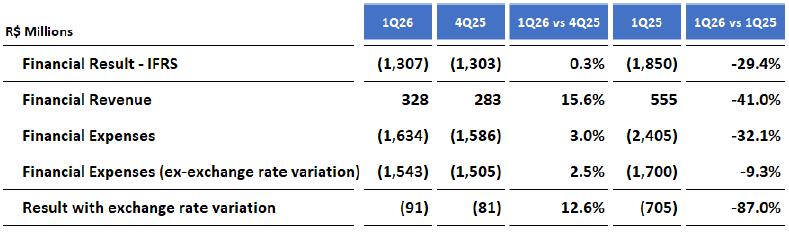
| · | Financial Result was negative by R$ 1,306.9 million in 1Q26, remaining broadly stable versus the previous quarter, but showing an improvement of 29.4% compared with 1Q25, reflecting the lower impact of exchange-rate fluctuations on overseas investments. |
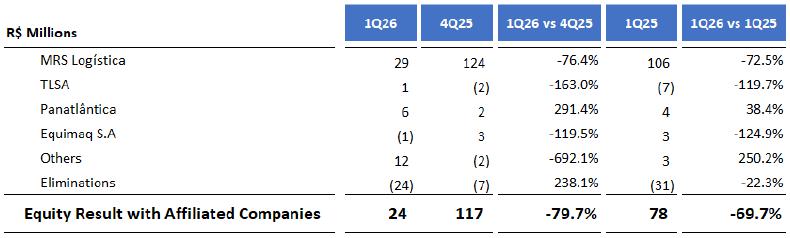
| · | Equity Income declined 79.7% quarter-over-quarter in 1Q26, to R$ 23.8 million, in line with the seasonal profile of the operation and the lower contribution from MRS during the period. Compared with 1Q25, equity income also declined sharply, by 69.7%, reflecting not only seasonality but also MRS’s higher financial expenses and the recognition of deferred taxes during the quarter. |
| · | CSN reported a Net Loss of R$ 555.0 million in 1Q26, which represents an improvement both in relation to the loss recorded in the previous quarter and in relation to the performance in 1Q25, mainly reflecting the impact of deferred income tax constituted in the parent company due to the increase in tax losses. |
For more information, access our website: https://ri.csn.com.br/ | 4 |
| | 1Q26 RESULT |
Adjusted EBITDA
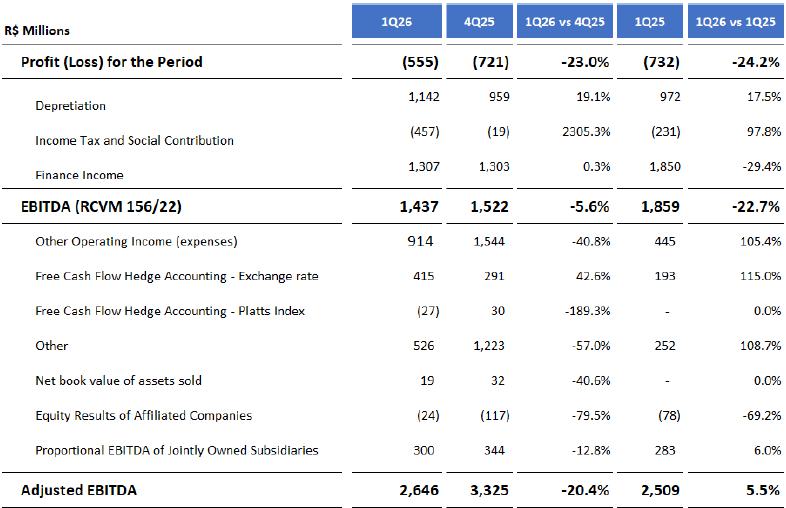
*The Company reports adjusted EBITDA excluding equity income and other operating income (expenses), as it believes these items should not be considered in the calculation of recurring operating cash generation.
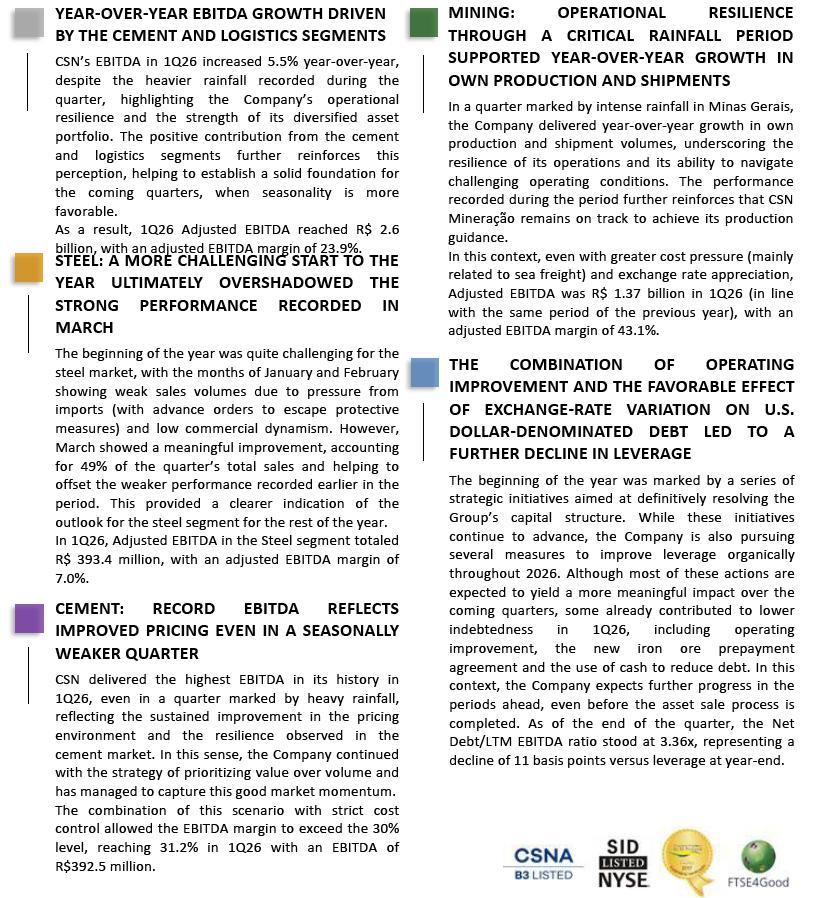
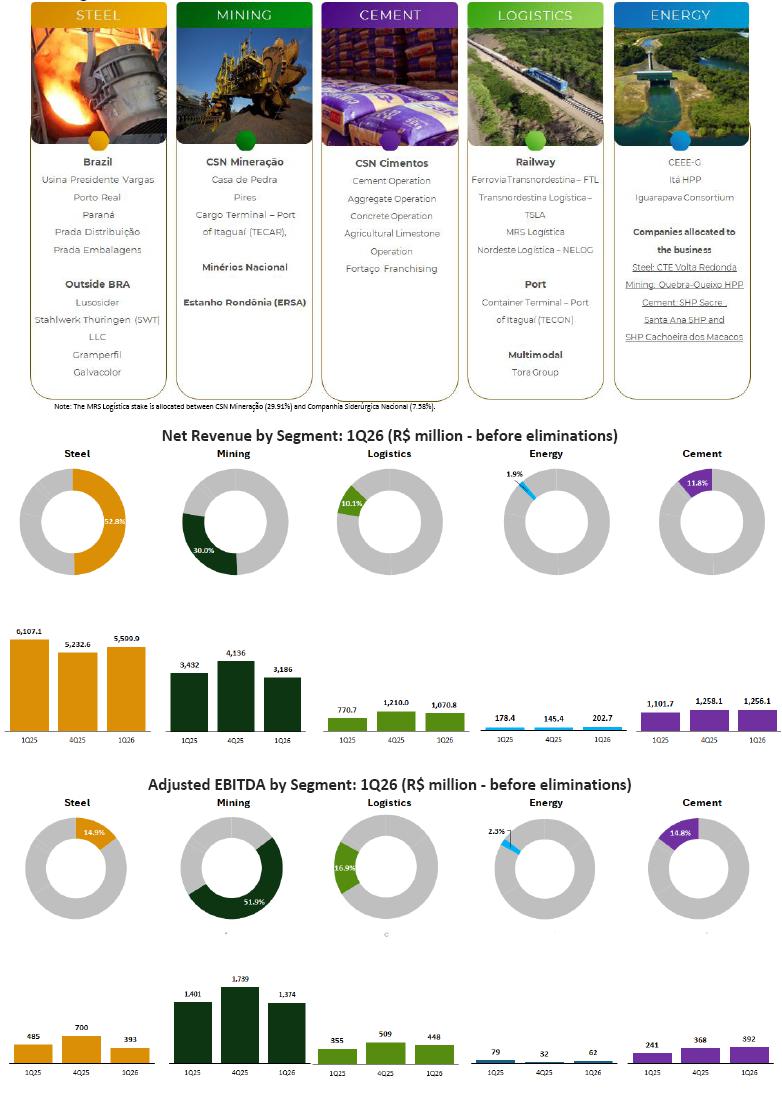
| · | In 1Q26, Adjusted EBITDA reached R$ 2,646.0 million, with an Adjusted EBITDA margin of 23.9%, which represents an annual growth of 1.8 p.p. in profitability and shows that, even in a period with intense rainfall, the Company managed to surpass the previous year's performance. This result also highlights the advantage of having a diversified operation, since those responsible for the growth were the cement and logistics segments. It is worth noting that the cement segment delivered the highest quarterly result in the Company’s history, even in a seasonally weaker quarter, reinforcing its strong operating momentum. Compared with the previous quarter, the adjusted EBITDA margin declined 3.9 p.p., reflecting the seasonal profile of the operation, with heavier rainfall affecting iron ore production, as well as the impact of exchange-rate variation on exported products and the typically softer commercial activity for the steel and cement segments during the period. Looking ahead, it is also important to note that the strong commercial performance seen in the steel industry in March (accounting for half of sales for the entire quarter) can be considered a solid indication of increasing results for 2Q26, which combined with all the efficiency shown by the mining operation and the maintenance of iron ore prices at a high level, should result in a solid future performance. |
For more information, access our website: https://ri.csn.com.br/ | 5 |
| | 1Q26 RESULT |
Adjusted EBITDA (R$ million) and Adjusted Margin¹ (%)
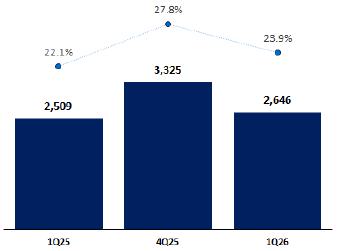
¹ Adjusted EBITDA Margin is calculated as Adjusted EBITDA divided by Adjusted Net Revenue, which considers 100% consolidation of CSN Mineração and the 37.49% stake in MRS.
Free Cash Flow
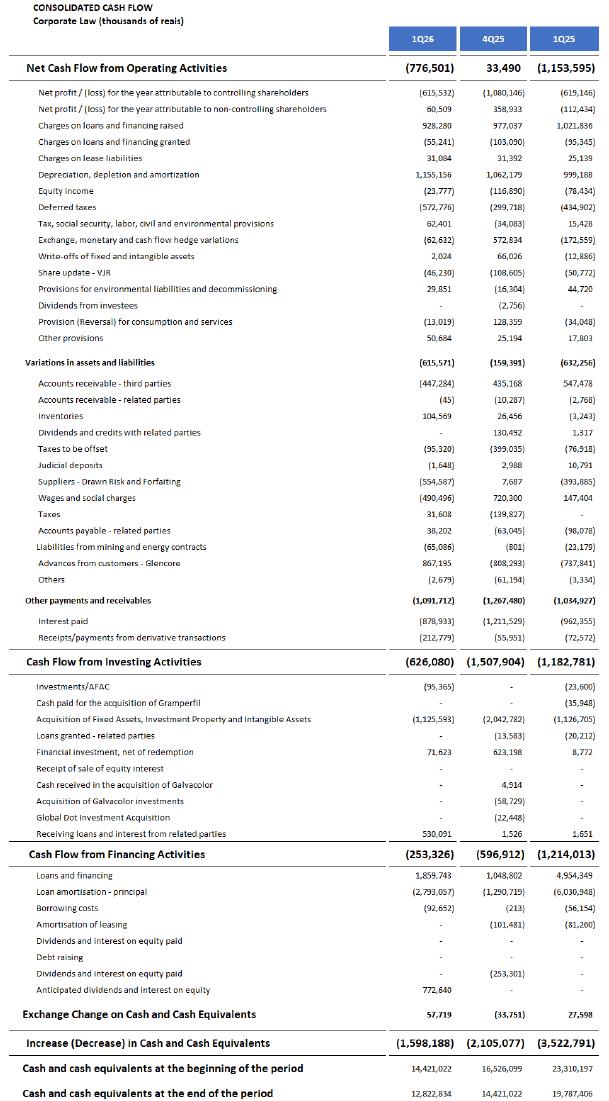
In 1Q26, Free Cash Flow was negative by R$ 1,597.7 million, deteriorating versus the previous quarter. The main drivers of this cash outflow were: (i) seasonality, which led to weaker operating performance; (ii) working capital consumption; (iii) still-elevated financial expenses; and (iv) significant debt amortization during the period, evidencing that the Company has already begun deploying cash to reduce gross debt. Despite this performance, the cash flow outlook for the coming quarters is more favorable, as operating indicators are expected to improve and lower inventory levels should contribute more meaningfully to cash conversion.
Free Cash Flow in 1Q26 (R$ million)
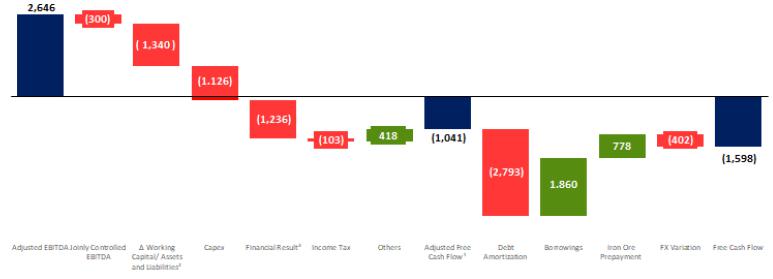
² Adjusted Working Capital is composed of changes in Net Working Capital, plus changes in long-term asset and liability accounts, excluding the net change in income tax and social contribution.
³ Financial Result: considers derivatives, financial expenses directly linked to operating activity, and interest on working capital funding.
Indebtedness
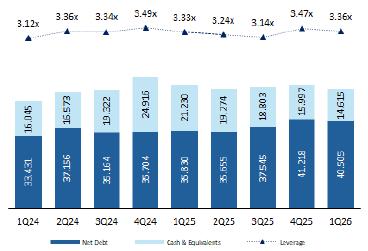
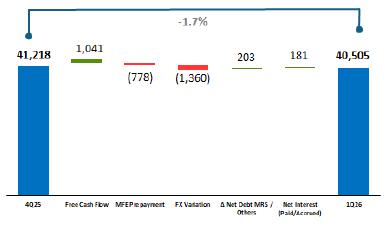
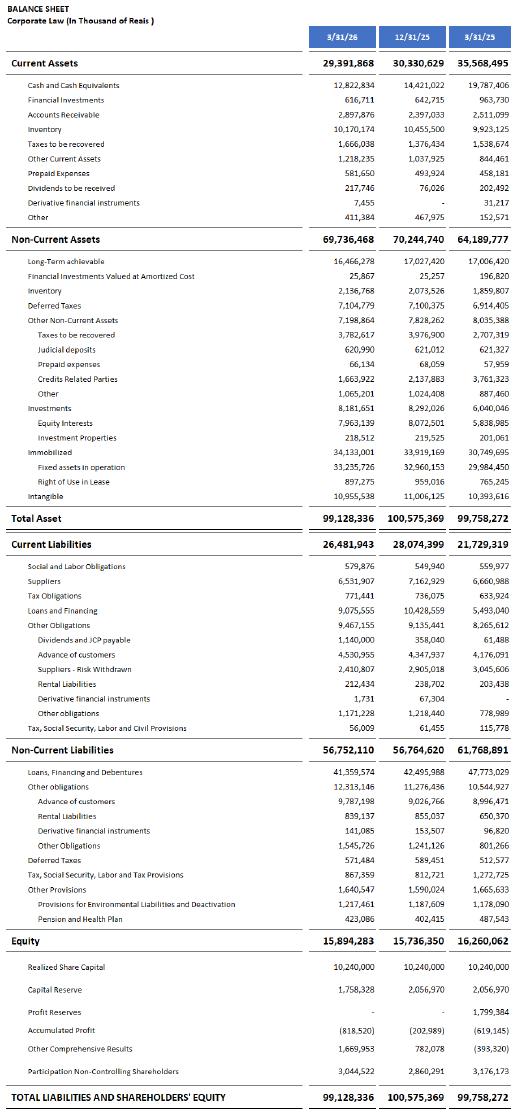
As of March 31, 2026, consolidated net debt totaled R$ 40,505.0 million, while leverage, measured by the Net Debt/LTM EBITDA ratio stood at 3.36x, representing a further decline of 11.6 basis points following the increase recorded in the previous quarter. This performance was supported by the new iron ore prepayment agreement executed to cover part of the amortizations scheduled for this year, as well as by the positive effect of exchange-rate variation on foreign-currency debt. This improvement also shows the efforts made since the beginning of the year in order to definitively resolve the group's capital structure. In this context, the asset sale plan announced on January 15 remains fully on track, with the process attracting more interested parties than originally expected, demonstrating both the attractiveness of the assets and management’s commitment to strengthening the group’s financial profile. As for total cash and cash equivalents, the Company maintained its policy of preserving a robust cash position, ending the quarter with R$ 14.6 billion, an amount sufficient to cover its short-term financial obligations.
For more information, access our website: https://ri.csn.com.br/ | 6 |
| | 1Q26 RESULT |
|
Net Debt and Leverage (R$ billion | x)
|
Net Debt Bridge (R$ billion)
|
¹ Net Debt / EBITDA: debt is calculated using the period-end U.S. dollar exchange rate, while net debt and EBITDA use the average exchange rate for the period. ² Leverage calculation considers Tora’s LTM EBITDA and the Usiminas shares.
CSN remains highly active in its objective of extending the debt amortization profile, with a focus on long-term transactions and the capital markets. Among the main developments early in the year, the key highlight was the bridge loan signed in mid-April with a banking syndicate in the amount of US$ 1.2 billion, with potential expansion up to US$ 1.4 billion. The facility has a five-year term and is intended to anticipate part of the proceeds expected from the asset sale program, with the cement operation serving as the main collateral for the transaction. These funds will be used entirely to reduce short-and-medium-term debt, with the potential to materially change the amortization schedule shown below. In addition, the Company is currently advancing financial structures that will anticipate the refinancing of short-and-medium-term debt, alongside the intended reduction in gross debt through the asset sale program.
Debt Principal Amortization Schedule (R$ million)
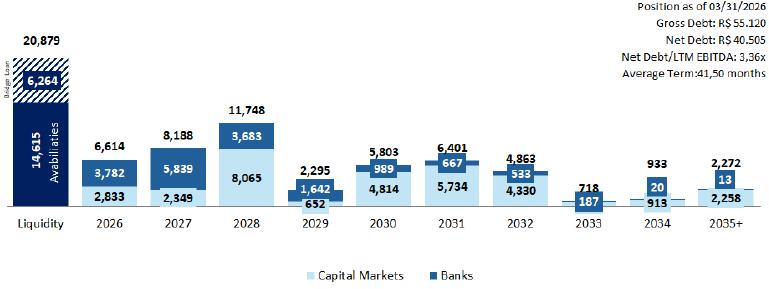
¹ Includes the MRS stake (37.49%).
² Managerial Gross / Net Debt considers the MRS stake (37.49%), excluding accrued interest.
3 Average term after completion of the liability management plan.
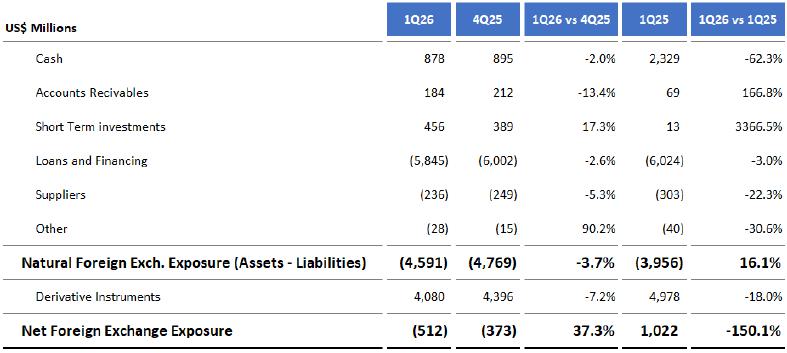
FX Exposure
The accumulated net foreign exchange exposure in the consolidated balance sheet for 1Q26 was negative by US$ 511.7 million, as shown in the table below, in line with the Company’s policy of minimizing the impacts of foreign-exchange volatility on earnings. The hedge accounting adopted by CSN matches projected U.S. dollar export cash flows with future maturities of debt denominated in the same currency. As a result, the foreign-exchange variation of U.S. dollar-denominated debt is temporarily recorded in shareholders’ equity and recognized in profit or loss when the related U.S. dollar export revenues occur.
For more information, access our website: https://ri.csn.com.br/ | 7 |
| | 1Q26 RESULT |
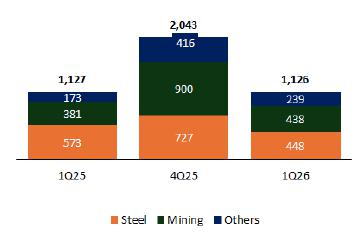
Investments
In 1Q26, investments totaled R$ 1,125.6 million, representing a decrease of 44.9% versus the previous quarter, reflecting lower maintenance disbursements and the Company’s historical pattern of concentrating investments at year-end. Compared with the same period of the prior year, however, total investments remained broadly stable, as the reduction in capital allocated to steel was offset by the progress of strategic projects, particularly those related to investments in P15.
CAPEX (R$ million)
Net Working Capital
Net Working Capital allocated to the business totaled R$ 3,897.7 million in 1Q26, representing an increase of 54.4% versus the previous quarter. This performance reflects higher accounts receivable due to the stronger commercial activity in steel, as well as lower supplier balances driven by the lower volume of third-party iron ore purchases in Mining and lower inventory-related effects. Compared with 1Q25, Net Working Capital posted an even stronger increase of 70.5%, a trend observed over recent quarters that reflects the Company’s operating dynamics, while maintaining levels compatible with business activity and preserving adequate financial management to meet short-term obligations.
For more information, access our website: https://ri.csn.com.br/ | 8 |
| | 1Q26 RESULT |
The calculation of Net Working Capital allocated to the business excludes advances under prepayment contracts, as shown in the table below:
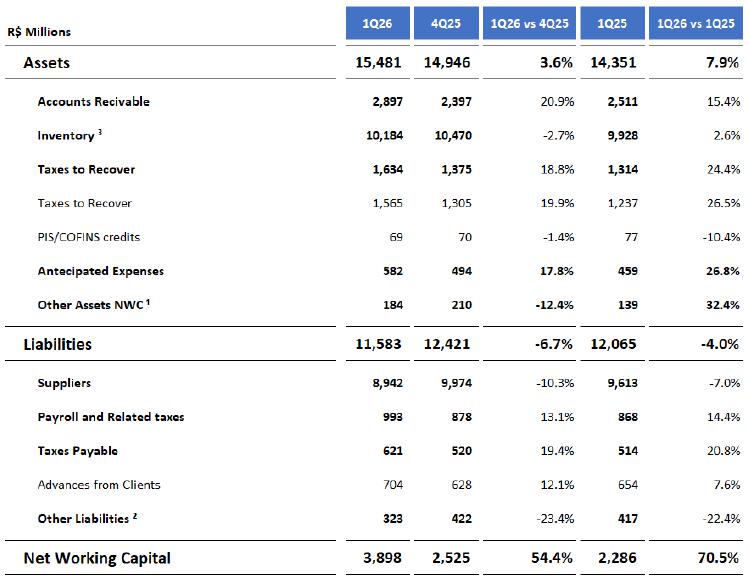
¹ Other NWC Assets: includes advances granted and other receivables.
² Other NWC Liabilities: includes other payables, taxes payable in installments, and other provisions.
³ Inventories: excludes the effect of the provision for inventory losses/write-downs. For DIO calculation, warehouse inventory balances are not considered.
For more information, access our website: https://ri.csn.com.br/ | 9 |
| | 1Q26 RESULT |
Business Segment Results
For more information, access our website: https://ri.csn.com.br/ | 10 |
| | 1Q26 RESULT |
For more information, access our website: https://ri.csn.com.br/ | 11 |
| | 1Q26 RESULT |
Steel Results
According to the World Steel Association (WSA), global crude steel production totaled 459.2 million tons in 1Q26, representing a decrease of 2.3% versus the same period of 2025. China remained the world’s leading producer, with 247.6 million tons, a decrease of 4.6% year-over-year, reflecting the continuation of a more challenging environment for the Chinese steel industry. By contrast, India maintained its growth trajectory, with production of 44.7 million tons, an increase of 10.8% in the period, while the United States posted an increase of 5.7%, reaching 21.0 million tons.
Brazil maintained its prominent position in global steelmaking, remaining among the world’s top 10 crude steel producers, with output of 8.1 million tons, behind only major global producers such as China, India, the United States, Japan, Russia, South Korea, Türkiye and Germany. In South America, the country remained the leading regional producer, accounting for the largest share of the continent’s output in the quarter.
OPERATING AND SALES PERFORMANCE
At Presidente Vargas Steelworks (UPV), slab production totaled 764 thousand tons in 1Q26, a decrease of 3.8% versus 4Q25 and 5.9% versus the same period of the previous year, reflecting not only the seasonally weaker profile of the quarter, but also the ongoing blast furnace maintenance shutdown and the inventory reduction initiative currently underway in the steel segment. Following the same trend, production of flat rolled steel, the Company’s main market, reached 713 thousand tons in 1Q26, representing a decrease of 9.8% and 8.0% versus 4Q25 and 1Q25, respectively.
Long steel production, in turn, totaled 62 thousand tons in 1Q26, remaining stable versus both the previous quarter and the same period of 2025.
Sales Volume (k tons) - Steel
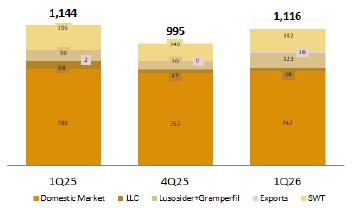
Total sales in 1Q26 reached 1,116 thousand tons, representing an increase of 12.1% versus 4Q25, but a decrease of 2.5% compared with the same period of the previous year. This performance still reflects the pressure exerted by imported material on domestic sales, particularly in the first two months of the quarter, when orders were brought forward in an attempt to avoid protective measures. On the other hand, the increase versus the previous quarter was driven exclusively by March performance, when the first effects of antidumping measures became visible and commercial activity in steel was particularly strong.
Domestic market sales totaled 767 thousand tons in the quarter, a decrease of 2.8% versus 1Q25, but an increase of 1.3% compared with 4Q25. Export sales, in turn, totaled 349 thousand tons, representing an increase of 46.8% versus 4Q25 and a slight decrease of 1.8% versus the same period of the previous year. 1Q26 was marked by the resumption of 16 thousand tons of direct steel exports, a volume higher than the total recorded in all of 2025. The remaining volume sold abroad was handled through the Company’s subsidiaries, namely 28 thousand tons through LLC, 182 thousand tons through SWT, and 123 thousand tons through Lusosider and Gramperfil.
For more information, access our website: https://ri.csn.com.br/ | 12 |
| | 1Q26 RESULT |
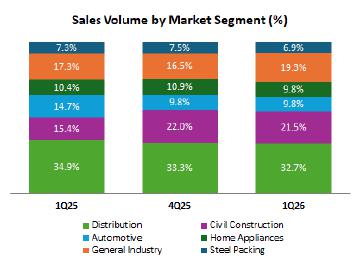
With respect to total sales volume, the main highlight in 1Q26 was the General Industry segment, which posted an increase of 2.8 p.p. in share versus 4Q25 and 2.0 p.p. versus the same period of the previous year, reaching 19.3% of total sales. The remaining segments continued to be affected by competition from imported material, with Packaging (6.9%) being the most impacted over recent quarters, even after the Brazilian government approved the antidumping process for tinplate in August 2025. On a year-over-year basis, the Civil Construction segment stood out the most, with an increase of 6.9 p.p., continuing the trend observed throughout 2025 and reaching 21.5% of the Company’s sales mix in 1Q26. By contrast, the Automakers (9.8%) and Distribution (32.7%) segments posted decreases of 4.9 p.p. and 2.2 p.p., respectively, still reflecting the significant penetration of imported steel. |
 |
In 1Q26, the Brazilian steel market posted mixed dynamics, with positive signs in important steel-consuming sectors, but still under pressure from a challenging competitive environment and high import volumes. According to Instituto Aço Brasil, Brazilian crude steel production totaled 8.1 million tons, a decrease of 3.1% versus 1Q25. In the same period, domestic sales reached 5.1 million tons, representing a year-over-year decrease of 1.1%, while apparent consumption totaled 6.6 million tons, also showing a decrease of 0.8% year-over-year. Imports, in turn, totaled 1.8 million tons, representing an annual increase of 4.2%. It is still too early to conclude whether this performance reflects continued competitive pressure from imports or merely the bringing forward of orders ahead of the implementation of protective measures.
In the automotive sector, an important steel-consuming segment, ANFAVEA reported an improvement in the quarter, with production of 634.7 thousand vehicles, representing an increase of 6.0% versus 1Q25. Total sales reached 625.2 thousand units, an increase of 13.3%, driven by the strong performance recorded in March, which posted the highest production level since the pre-pandemic period.
| · | Net Revenue in the Steel segment reached R$ 5,599.9 million in 1Q26, representing an increase of 7.0% versus the previous quarter, reflecting the commercial improvement observed during the period, particularly in export markets. This increase was supported by higher sales volumes, which more than offset the decrease in average prices resulting from the negative exchange-rate effect during the period. Compared with 1Q25, revenue posted a decrease of 8.3%, driven by the combination of slightly weaker commercial activity, lower average prices due to the exchange-rate effect, and a product mix with lower value added. |
| · | The Average Price in 1Q26 reached R$ 4,827/ton in the domestic market, remaining stable versus 4Q25, but showing a decrease of 8.1% versus 1Q25. During the quarter, the Company had to reverse the price increase implemented in January following a more challenging start to the year, marked by high levels of imported steel in the first two months, gaining volume on products with lower added value in the final sales mix. On the other hand, conditions improved substantially in March, both in terms of pricing and mix, which should support better performance in the coming months. In the foreign market, the average price was negatively impacted by the exchange rate and reached R$ 4,920/ton. |
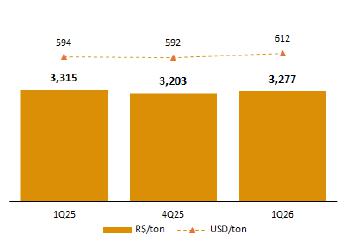
| · | The Slab Cost, in turn, reached R$ 3,277/ton in 1Q26, posting an increase of 2.3% versus the previous quarter, the first increase recorded since 1Q25. Although the Company has consistently demonstrated efficiency and optimization in its production costs, higher energy and fuel costs directly affected slab cost in the quarter. |
For more information, access our website: https://ri.csn.com.br/ | 13 |
| | 1Q26 RESULT |
|
Slab Cost (R$/ton; US$/ton) – Steel
|
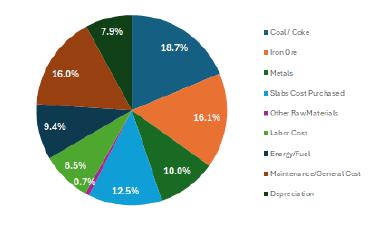
Production Cost - 1Q26 - Steel
|
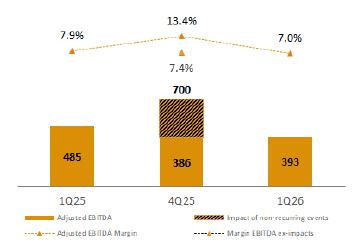
| · | In 1Q26, Adjusted EBITDA in the Steel segment reached R$ 393.4 million, representing a decrease of 18.8% versus 1Q25 and an increase of 1.9% compared with normalized EBITDA excluding non-recurring effects in 4Q25. Adjusted EBITDA margin stood at 7.0%, representing a decrease of 0.9 p.p. versus 1Q25. This decline in profitability still reflects the challenging environment observed in the Brazilian market, particularly when considering the impact of imported material pressure on domestic pricing over the past 12 months. On the other hand, signs of improvement are already visible, and the result posted in March is a clear indication of the positive effect that protective measures may have on competitiveness and pricing for local producers. In this respect, 1Q26 results reflect the pressures faced in 2025 much more than the reality already observed in the domestic market, with stronger volume and prices and operations already pointing towards better profitability. |
Adjusted EBITDA and EBITDA Margin - Steel
Mining Results
1Q26 was marked by a balanced environment in the seaborne iron ore market, with prices remaining supported despite a less robust backdrop for steel demand in China and higher global fuel costs due to the escalation of the conflict in the Middle East. Throughout the quarter, the market saw a combination of inventory restocking by Chinese steelmakers and disciplined global supply, together with seasonal impacts on Brazilian and Australian production due to the rainy season and cyclones, respectively, although at higher volumes than those observed in the same period of 2025. This context contributed to keeping prices relatively stable year-over-year, albeit slightly below the levels seen in the previous quarter. In China, the world’s main iron ore consuming market, crude steel production declined during the period, reflecting continued pressure in the real estate sector and margins that remained under pressure for local steelmakers. Even so, demand for imported iron ore remained resilient, supported by inventory restocking. In addition, Chinese steel exports remained strong, helping offset softer domestic demand. In this context, iron ore prices remained resilient and closed 1Q26 at an average of US$ 104.00/dmt (IODEX Fe61% North China), slightly below the US$ 105.99/dmt recorded in 4Q25 and broadly in line with the level observed in 1Q25 (US$ 103.6/dmt).
For more information, access our website: https://ri.csn.com.br/ | 14 |
| | 1Q26 RESULT |
As for the seaborne freight market, 1Q26 showed signs of deterioration, with the BCI C3 route (Tubarão-Qingdao) posting an average freight rate of US$ 24.83/t, compared with US$ 23.88/t in 4Q25 and US$ 19.48/t in 1Q25. This performance reflected higher freight rates even in a seasonally weaker period, supported by consistent iron ore flows from Brazil and Australia to China, as well as the structural increase in bauxite exports from Guinea, which contributed to longer average sailing distances. On the supply side, temporary vessel removals for maintenance and operational inefficiencies associated with the geopolitical backdrop, particularly in the Middle East, constrained the availability of Capesize vessels. By the end of March, higher fuel prices had become an additional source of pressure on freight costs, pushing the C3 index above US$ 30/t, despite the correction in time-charter rates.
Total Production - Mining (thousand tons)
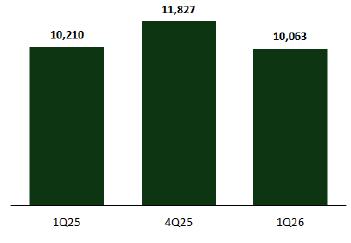
| · | Iron Ore Production (including third-party purchases) reached 10,063 thousand tons in 1Q26, representing a decrease of 14.9% versus 4Q25 and 1.4% versus 1Q25. This performance mainly reflects the typical seasonality between the fourth and first quarters of the year, combined with the heavier rainfall recorded during the period. It is worth noting, however, that own production increased 6.4% year-over-year, demonstrating not only the operational excellence the Company has been achieving, but also the resilience of the operation in periods of heavier rainfall. In other words, the quarter’s result was affected primarily by the reduction in third-party purchases, which was also influenced by the adverse weather conditions seen during the period. |
For more information, access our website: https://ri.csn.com.br/ | 15 |
| | 1Q26 RESULT |
Sales Volume - Mining (thousand tons)
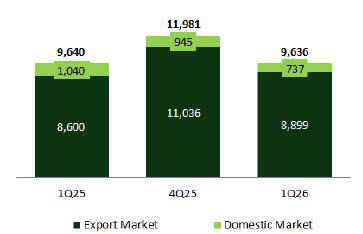
| · | Sales Volume reached 9,636 thousand tons in 1Q26, representing a decrease of 19.6% versus 4Q25, but remaining in line with 1Q25. TECAR posted a new record for shipments in a first quarter, totaling 8,724 thousand tons, representing an increase of 1.4% year-over-year. This performance reinforces the robustness and efficiency of the Company’s logistics infrastructure, which has continued to show consistent progress quarter after quarter. |
| · | In 1Q26, Adjusted Net Revenue totaled R$ 3,186.2 million, representing a decrease of 23.0% versus 4Q25, due to the seasonal profile of the operation and the exchange-rate impact during the period. Compared with the same period of the previous year, the line also posted a decrease of 8.0%, driven exclusively by exchange-rate movements, as volumes and prices remained at similar levels. In this regard, Unit Net Revenue reached US$ 62.6 per ton in 1Q26, remaining virtually stable versus both 4Q25 and 1Q25. On a quarter-over-quarter basis, unit net revenue posted a slight decrease of 1.1% due to higher seaborne freight costs, while on a year-over-year basis, the increase of 1.0% in unit net revenue reflects improved product quality, which more than offset the rise in freight costs. |
| · | Cost of Products Sold (COGS) in Mining totaled R$ 2,101.2 million in 1Q26, representing a decrease of 20.3% versus the previous quarter and reflecting the reduction in sales volume during the period as a result of seasonality, as well as lower purchase volumes. Compared with the same period of 2025, the decrease was 8.0%, mainly as a result of lower purchase volumes and a higher share of own production. C1, in turn, reached US$ 23.1/t in 1Q26, compared with US$ 23.4/t in 4Q25 and US$ 21.0/t in 1Q25. The quarter-over-quarter decrease reflects lower production costs, despite lower volumes, and the negative exchange-rate effect, while the year-over-year increase reflects the impact of currency appreciation and higher logistics costs, partially offset by higher production volumes, which helped dilute fixed costs. |
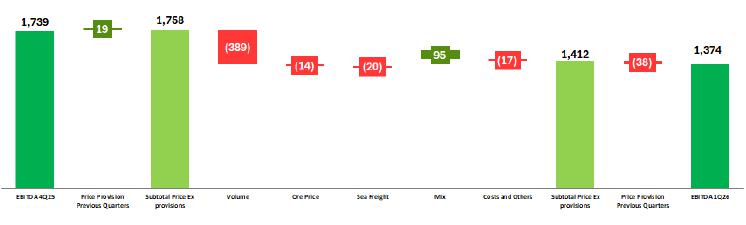
| · | In 1Q26, Adjusted EBITDA in Mining totaled R$ 1,374.3 million, with an adjusted EBITDA margin of 43.1%, representing an expansion of 1.1 p.p. and 2.3 p.p. versus 4Q25 and 1Q25, respectively. This increase in profitability was achieved even in a quarter marked by heavy rainfall and geopolitical conflicts that affected costs. Also contributing to this performance were the maintenance of prices at elevated levels, which offset freight pressure, and the improvement in the mix of exported material, with a greater share of own production. |
For more information, access our website: https://ri.csn.com.br/ | 16 |
| | 1Q26 RESULT |
EBITDA RECONCILIATION CHART
Cement Results
According to the National Union of the Cement Industry (SNIC), the Brazilian cement industry sold 15.9 million tons in 1Q26, representing an increase of 1.8% versus the same period of the previous year. In March alone, sales reached 5.8 million tons, corresponding to an increase of 9.1% versus the same period of 2025. The quarter’s performance reflected resilient domestic demand, supported by a strong labor market, rising wage mass and improving consumer confidence. The sector also benefited from favorable real estate market dynamics and the impact of the Minha Casa Minha Vida program, which continues to be an important driver of cement demand in Brazil. Despite this positive backdrop, the sector continues to monitor sources of pressure such as high interest rates, household indebtedness and delinquency levels, as well as the volatility of energy and logistics costs, especially in light of higher fuel prices and their impact on freight, petroleum coke and other inputs across the production chain.
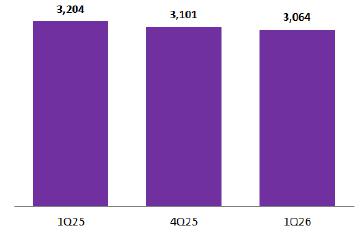
In CSN’s case, the typical seasonality of the period and the heavier incidence of rainfall resulted in a decrease of 1.2% in sales volume in 1Q26 versus the previous quarter and 4.5% versus 1Q25, totaling 3.064 million tons sold in the quarter. This decrease also reflects the Company’s commercial strategy of prioritizing value over volumes, given the more favorable market conditions observed during the period.
Sales Volume - Cement (thousand tons)
| · | In 1Q26, Net Revenue reached R$ 1,256.1 million, remaining in line with the previous quarter, but representing an increase of 14.0% versus 1Q25. This result reflects the improvement in prices observed during the period, particularly after the increases implemented in recent months. The performance is consistent with the more favorable commercial environment seen in the cement market, characterized by resilient demand and higher capacity utilization among local producers. |
For more information, access our website: https://ri.csn.com.br/ | 17 |
| | 1Q26 RESULT |
| · | Cost of Product Sold in the Cement segment totaled R$ 823.4 million in 1Q26, remaining stable versus the previous quarter, but representing an increase of 2.0% versus 1Q25 due to higher raw material and freight costs. |
| · | As a result, Adjusted EBITDA reached R$ 392.5 million in 1Q26, representing an increase of 6.7% versus 4Q25 and 62.7% versus the same period of 2025. This was the highest EBITDA ever recorded in the Company’s history for the segment, highlighting the strength of the operation and the Company’s ability to monetize the business, while reinforcing its competitive advantages through newer plants and a fully vertically integrated management model. Profitability, in turn, posted a quarter-over-quarter expansion of 2.0 p.p. and a year-over-year expansion of 9.4 p.p., surpassing the 30% level with an adjusted EBITDA margin of 31.2% in the period. The result for the quarter reinforces the excellent momentum seen in the segment, establishing the cement operation as an important growth driver for consolidated results in 2026. |
Energy Results
In 1Q26, Net Revenue in the Energy segment reached R$ 202.7 million, representing an increase of 39.4% versus 4Q25 and 13.6% versus 1Q25. Adjusted EBITDA totaled R$ 61.9 million in the quarter, with an adjusted EBITDA margin of 30.5%.
Logistics Results
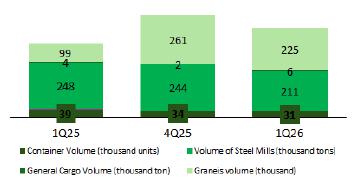
In 2026, the Logistics segment remains one of the main pillars of CSN’s verticalization strategy and one of the group’s key growth drivers. In port operations, volume handled at TECON in 1Q26 totaled 31 thousand container units, an annual decrease of 20.6%; 211 thousand tons of steel products, an annual decrease of 14.9%; 6 thousand tons of general cargo, an annunal increase of 33.1%; and 225 thousand tons of bulk cargo, an annual increase of 126.9%.
Shipment Volume at TECON - Port Logistics
In financial terms, total Net Revenue in the segment reached R$ 1,070.8 million in 1Q26, representing a decrease of 11.5% versus 4Q25, due to seasonal effects associated with heavier rainfall. Rail Logistics posted net revenue of R$ 688.9 million, representing a decrease of 13.5% versus 4Q25, while Multimodal Logistics recorded net revenue of R$ 303.5 million, representing a decrease of 6.3% versus 4Q25. Port Logistics, in turn, posted revenue of R$ 78.7 million in the quarter, representing a decrease of 12.5% versus 4Q25.
Adjusted EBITDA, in turn, totaled R$ 447.7 million in 1Q26, representing a decrease of 12.0% versus 4Q25, with an adjusted EBITDA margin of 41.8%, a decrease of 0.2 p.p. The decrease reflects seasonality and the weather-related impact on the rail mode, which posted Adjusted EBITDA of R$ 348.8 million, representing a decrease of 11.9% versus 4Q25, and a margin of 50.6%, an increase of 0.6 p.p. Even so, the segment maintained an EBITDA margin above 40% in the quarter, underscoring the operational resilience of CSN’s logistics platform and the strength of its integrated model, even amid negative seasonality and adverse weather conditions.
For more information, access our website: https://ri.csn.com.br/ | 18 |
| | 1Q26 RESULT |
ESG - Environmental, Social & Governance
ESG PERFORMANCE - CSN GROUP
In recent years, CSN has adopted a separate and dedicated format for disclosing its ESG initiatives and performance, providing individual access to its ESG indicators and results. This model enables stakeholders to access the main quarterly results and indicators and monitor them more effectively and efficiently. Access is available through the results center on CSN’s IR website: https://ri.csn.com.br/informacoes-financeiras/central-de-resultados/.
The information included in this earnings release has been selected based on its relevance and materiality to the Company. Quantitative indicators are presented in comparison with the period that best reflects each metric for monitoring purposes. Accordingly, some are compared with the same quarter of the previous year, while others are compared with the average of the prior period, ensuring comparability based on seasonality and reporting frequency. Additionally, it is important to note that the ESG Performance Report also incorporates the performance indicators of CSN Cimentos assets acquired in 2022, as well as the assets of Tora Logística, Gramperfil and Galvacolor, acquired in 2025. As a result, some absolute indicators may show significant variations when compared with the previous period.
More detailed historical information on CSN’s performance and initiatives is available in the 2025 Integrated Report, published in April 2026 (https://api.mziq.com/mzfilemanager/v2/d/c13bfd26-0e38-40d4-80f7-8990c9e1d702/6a44cd74-bf97-1d51-0eee-cd27188e9f2f?origin=2). ESG indicators are reviewed annually in connection with the closing of the Integrated Report; accordingly, the information contained in quarterly earnings releases may be subject to adjustments arising from this process.
It is also possible to monitor CSN’s ESG performance in a fast and transparent manner on our website through the following address: https://esg.csn.com.br.
Capital Markets
In the first quarter of 2026, CSN shares declined 31.3%, while the Ibovespa increased 16.3% over the same period. Average daily trading volume of CSNA3 on B3 totaled R$ 125.2 million. On the New York Stock Exchange (NYSE), the Company’s American Depositary Receipts (ADRs) declined 22.5% in 1Q26, while the Dow Jones index declined 3.6%. Average daily trading volume of the ADRs (SID) on the NYSE totaled US$ 9.1 million in 1Q26.
|
1Q26
| |
| Number of shares (thousand) | 1.326.094 |
| Closing Price (R$/share) | 6,14 |
| Closing Price (US$/ADR) | 1,24 |
| Market Capitalization (R$ million) | 8.142 |
| Market Capitalization (US$ million) | 1.644 |
| CSNA3 Performance (BRL) | -31,3% |
| SID Performance (USD) | -22.5% |
| Ibovespa Performance (BRL) | +16,3% |
| Dow Jones Performance (USD) | -3,6% |
| Average Daily Volume (thousand shares) | 15.285 |
| Average Daily Volume (R$ thousand) | 125.230 |
| Average Daily Volume (thousand ADRs) | 5.800 |
| Average Daily Volume (US$ thousand) | 9.115 |
|
Source: Bloomberg
|
For more information, access our website: https://ri.csn.com.br/ | 19 |
| | 1Q26 RESULT |
|
Earnings Conference Call: 1Q26 Earnings Presentation Webcast
|
Investor Relations Team
|
|
Conference call in Portuguese with simultaneous translation into English
|
Antonio Marco Campos Rabello - CFO and Executive Officer of Investor Relations Pedro Gomes de Souza (pedro.gs@csn.com.br) Mayra Favero Celleguin (mayra.celleguin@csn.com.br)
|
|
May 14, 2026
| |
|
11:30 a.m. (Brasília time)
| |
|
10:30 a.m. (New York time)
| |
|
Webinar: click here
|
Some statements contained herein are forward-looking statements that express or imply expected results, performance or events. These statements include future results that may be influenced by historical results and by the statements set forth under “Outlook.” Actual results, performance and events may differ materially from the assumptions and expectations expressed herein and are subject to risks such as: general economic conditions in Brazil and other countries; interest-rate and exchange-rate levels; protective measures in the U.S., Brazil and other countries; changes in laws and regulations; and general competitive factors on a global, regional or national basis.
For more information, access our website: https://ri.csn.com.br/ | 20 |
| | 1Q26 RESULT |
For more information, access our website: https://ri.csn.com.br/ | 21 |
| | 1Q26 RESULT |
For more information, access our website: https://ri.csn.com.br/ | 22 |
| | 1Q26 RESULT |
For more information, access our website: https://ri.csn.com.br/ | 23 |
|
COMPANHIA SIDERÚRGICA NACIONAL | |
|
By: |
/S/ Benjamin Steinbruch
|
|
Benjamin Steinbruch
Chief Executive Officer | |
|
| |
|
By: |
/S/ Antonio Marco Campos Rabello
|
|
Antonio Marco Campos Rabello
Chief Financial and Investor Relations Officer | |
This press release may contain forward-looking statements. These statements are statements that are not historical facts, and are based on management's current view and estimates of future economic circumstances, industry conditions, company performance and financial results. The words "anticipates", "believes", "estimates", "expects", "plans" and similar expressions, as they relate to the company, are intended to identify forward-looking statements. Statements regarding the declaration or payment of dividends, the implementation of principal operating and financing strategies and capital expenditure plans, the direction of future operations and the factors or trends affecting financial condition, liquidity or results of operations are examples of forward-looking statements. Such statements reflect the current views of management and are subject to a number of risks and uncertainties. There is no guarantee that the expected events, trends or results will actually occur. The statements are based on many assumptions and factors, including general economic and market conditions, industry conditions, and operating factors. Any changes in such assumptions or factors could cause actual results to differ materially from current expectations.