Filed Pursuant to Rule 433 of the Securities Act of 1933
Free Writing Prospectus dated November 3, 2025
Relating to the Preliminary Prospectus Supplement dated November 3, 2025
Registration No. 333-284510
On November 3, 2025, Strategy Inc (the “Company”) posted an investor presentation on https://www.strategy.com/stream. A copy of the slides included in the investor presentation and a transcript of the investor presentation are attached hereto as Exhibits A and B, respectively.
The Company has filed with the Securities and Exchange Commission (“SEC”) a registration statement (including a base prospectus), a preliminary prospectus supplement and prospectus supplements to the base prospectus for the offerings to which this communication relates. Before you invest, you should read the preliminary prospectus supplement and prospectus supplements to the base prospectus and other documents incorporated by reference or that the Company has filed with the SEC for more complete information about the Company and the offerings. You may get these documents for free by visiting EDGAR on the SEC website at www.sec.gov or by visiting www.strategy.com.
***
Exhibit A
Investor Presentation STRE (“Stream”) November 2025 Copyright © 2025 Strategy. All Rights Reserved.
Strategy Perpetual Preferred Offering Disclaimer This presentation is neither an offer to sell nor a solicitation of an offer to buy any securities of the Strategy Inc (“Strategy”, the “Company”, “we”, “us” or “our”), and shall not constitute an offer, solicitation, or sale in any jurisdiction in which such offer, solicitation, or sale is unlawful. The Company has filed with the U.S. Securities and Exchange Commission (the “SEC”) a registration statement on Form S-3 (including a prospectus) and a preliminary prospectus supplement to the prospectus for the offering to which this presentation relates. Before you invest, you should read the preliminary prospectus supplement and accompanying prospectus in that registration statement and the documents incorporated by reference or filed as exhibits to the registration statement for more complete information about the Company and this offering. You may obtain these documents and other documents for free by visiting EDGAR on the SEC website. Alternatively, copies of the preliminary prospectus supplement and accompanying prospectus may be obtained from Morgan Stanley & Co. LLC, Attention: Prospectus Department, 180 Varick Street, 2nd Floor, New York, NY 10014, by phone: 1-866-718-1649 or by email: prospectus@morganstanley.com, Barclays Capital Inc., c/o Broadridge Financial Solutions, 1155 Long Island Avenue, Edgewood, NY 11717, by phone 1-888-603-5847, or by email: barclaysprospectus@broadridge.com, or Moelis & Company LLC, 399 Park Avenue 4th Floor, New York, NY 10022, by phone: 1-800-539-9413, or TD Securities (USA) LLC, 1 Vanderbilt Avenue, 11th Floor, New York, NY 10017, by phone: 1-855-495-9846 or by email: TD.ECM_Prospectus@tdsecurities.com. No representation or warranty of any kind (whether express or implied) is given by the Company or any of its affiliates or any of their respective directors, officers, employees, advisors, agents or representatives (and any warranty expressed or implied by law is hereby excluded to the fullest extent possible) as to the accuracy or completeness of the content of this presentation or of any other document or written or oral information supplied at any time by or on behalf of the Company or of any opinions or projections expressed herein or therein (including, without limitation, in respect of the accuracy, completeness, timeliness, or sufficiency of this presentation), nor is any such party under any obligation to update this presentation or correct any inaccuracies or omissions in it which may exist or become apparent. To the maximum extent permitted by law, the Company and its affiliates and their respective directors, officers, employees, advisors, agents and representatives (collectively, the “Representatives”) disclaim any and all liability relating to this presentation and none of the Company nor any of its Representatives shall have any liability to any party for any claim, loss, damage or liability in any way arising from or relating to the use or review of this presentation (including, without limitation, any actions or inactions, reliance or decisions based upon this presentation), any errors in, or omissions from, this presentation (including, without limitation, the correctness, accuracy, completeness, timeliness, sufficiency, quality, pricing, reliability, performance, adequacy, or reasonableness of the information contained in this presentation), or otherwise in connection with this presentation. To the maximum extent permitted by law, none of the Company nor any of its Representatives will be liable, in any event, for any special, indirect, consequential, or punitive loss or damage of any kind arising from, relating to or in connection with this presentation. The Company does not provide, and this presentation does not constitute, any form of legal, accounting, taxation, regulatory, or actuarial advice. Forward Looking Statements. Statements in the document, including those regarding the possible or assumed future or other performance of the Company or its industry or other trend projections, constitute forward-looking statements and are made pursuant to the safe harbor provisions of the U.S. Private Securities Litigation Reform Act of 1995. By their nature, forward-looking statements involve known and unknown risks, uncertainties, assumptions and other factors, including those set forth under the “Risk Factors” in the Company’s annual report on Form 10-K and the Company’s quarterly reports on Form 10-Q and under “Risk Factor Updates” in our Current Report on Form 8-K filed on July 7, 2025, and the preliminary prospectus supplement and registration statement, because they relate to events and depend on circumstances that will occur in the future whether or not outside the control of the Company. Such factors may cause actual results, performance or developments to differ materially from those expressed or implied by such forward-looking statements. Accordingly, there can be no assurance that such forward-looking statements will prove to be correct. You should not place undue reliance on forward-looking statements. They speak only as at the date of this presentation. Past performance does not guarantee or predict future performance. Moreover, the Company and its affiliates and their respective officers, employees and agents do not undertake any obligation to review, update or confirm expectations or estimates or to release any revisions to any forward-looking statements to reflect events that occur or circumstances that arise in relation to the content of the presentation. Market and Industry Data. Unless otherwise indicated, market data and certain industry forecast data used in this presentation were obtained from internal reports, where appropriate, as well as third-party sources and other publicly available information. While the Company believes that each of the publications used throughout this Presentation are prepared by reputable sources, the Company has not independently verified market and industry data from third-party sources. In addition, assumptions and estimates of the Company and its industries’ future performance are necessarily subject to a high degree of uncertainty and risk due to a variety of factors. These and other factors could cause future performance to differ materially from assumptions and estimates. Illustrative Information. This presentation is provided as of the date hereof, does not purport to be all-inclusive or necessarily contain all information that may be of interest to the recipient, and is subject to change, amendment, update, completion, and review without notice. In particular, please note that any illustrative return or dividend information are, at this stage, preliminary estimates only and have not been verified, audited, or subjected to an independent accounting or auditing review. In particular, returns may vary depending on, amongst other factors, market conditions. The Company expressly disclaims any obligations to update the information in this presentation to the fullest extent permitted by applicable law. Any illustrative information included in this presentation is provided solely for illustrative purposes to enhance the reader’s ability to assess our financial and business performance. Such illustrative information has not been verified, audited, or subject to an independent accounting or auditing review and is not indicative of historical, present, or future returns or outcomes. Any returns or outcomes may vary depending on, among other factors, market conditions. There can be no assurance that these illustrative results will result or be achieved, and actual results and outcomes may vary materially from these illustrative examples. A number of defined terms used in this presentation are defined in the Appendix to this presentation. 2
STRE Term Sheet Copyright © 2025 Strategy. All Rights Reserved.
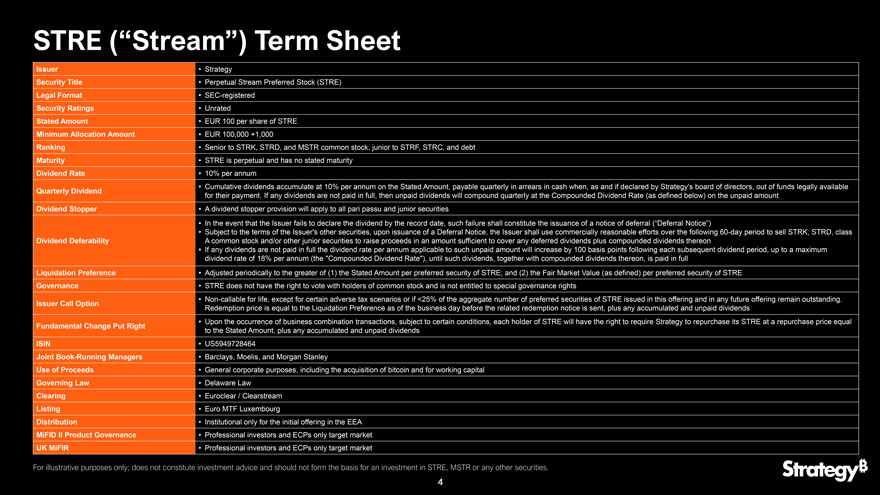
STRE (“Stream”) Term Sheet Issuer • Strategy Security Title • Perpetual Stream Preferred Stock (STRE) Legal Format • SEC-registered Security Ratings • Unrated Stated Amount • EUR 100 per share of STRE Minimum Allocation Amount • EUR 100,000 +1,000 Ranking • Senior to STRK, STRD, and MSTR common stock, junior to STRF, STRC, and debt Maturity • STRE is perpetual and has no stated maturity Dividend Rate • 10% per annum • Cumulative dividends accumulate at 10% per annum on the Stated Amount, payable quarterly in arrears in cash when, as and if declared by Strategy’s board of directors, out of funds legally available Quarterly Dividend for their payment. If any dividends are not paid in full, then unpaid dividends will compound quarterly at the Compounded Dividend Rate (as defined below) on the unpaid amount Dividend Stopper • A dividend stopper provision will apply to all pari passu and junior securities • In the event that the Issuer fails to declare the dividend by the record date, such failure shall constitute the issuance of a notice of deferral (“Deferral Notice”) • Subject to the terms of the Issuer’s other securities, upon issuance of a Deferral Notice, the Issuer shall use commercially reasonable efforts over the following 60-day period to sell STRK, STRD, class Dividend Deferability A common stock and/or other junior securities to raise proceeds in an amount sufficient to cover any deferred dividends plus compounded dividends thereon • If any dividends are not paid in full the dividend rate per annum applicable to such unpaid amount will increase by 100 basis points following each subsequent dividend period, up to a maximum dividend rate of 18% per annum (the “Compounded Dividend Rate”), until such dividends, together with compounded dividends thereon, is paid in full Liquidation Preference • Adjusted periodically to the greater of (1) the Stated Amount per preferred security of STRE; and (2) the Fair Market Value (as defined) per preferred security of STRE Governance • STRE does not have the right to vote with holders of common stock and is not entitled to special governance rights • Non-callable for life, except for certain adverse tax scenarios or if <25% of the aggregate number of preferred securities of STRE issued in this offering and in any future offering remain outstanding. Issuer Call Option Redemption price is equal to the Liquidation Preference as of the business day before the related redemption notice is sent, plus any accumulated and unpaid dividends • Upon the occurrence of business combination transactions, subject to certain conditions, each holder of STRE will have the right to require Strategy to repurchase its STRE at a repurchase price equal Fundamental Change Put Right to the Stated Amount, plus any accumulated and unpaid dividends ISIN • US5949728464 Joint Book-Running Managers • Barclays, Moelis, and Morgan Stanley Use of Proceeds • General corporate purposes, including the acquisition of bitcoin and for working capital Governing Law • Delaware Law Clearing • Euroclear / Clearstream Listing • Euro MTF Luxembourg Distribution • Institutional only for the initial offering in the EEA MiFID II Product Governance • Professional investors and ECPs only target market UK MiFIR • Professional investors and ECPs only target market For illustrative purposes only; does not constitute investment advice and should not form the basis for an investment in STRE, MSTR or any other securities. 4
Company Overview Phong Le President & Chief Executive Officer Copyright © 2025 Strategy. All Rights Reserved.
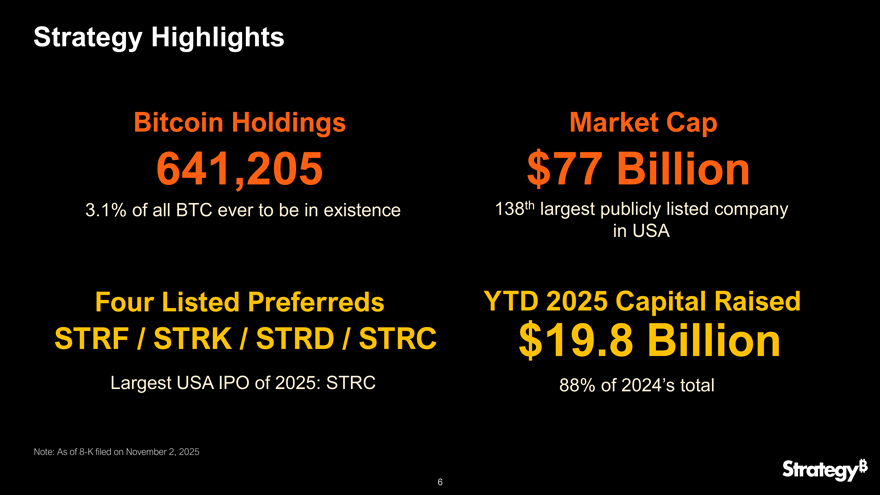
Strategy Highlights Bitcoin Holdings Market Cap 641,205 $77 Billion 3.1% of all BTC ever to be in existence 138th largest publicly listed company in USA Four Listed Preferreds YTD 2025 Capital Raised STRF / STRK / STRD / STRC $19.8 Billion Largest USA IPO of 2025: STRC 88% of 2024’s total Note: As of 8-K filed on November 2, 2025 6
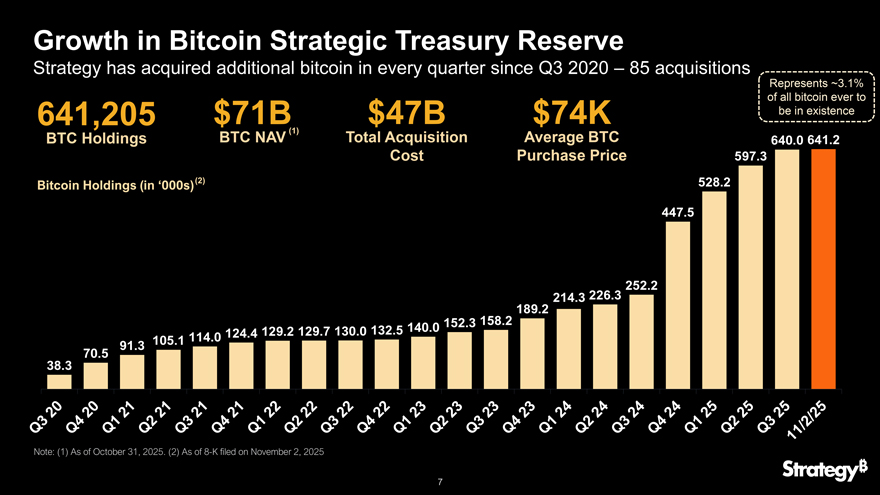
Growth in Bitcoin Strategic Treasury Reserve Strategy has acquired additional bitcoin in every quarter since Q3 2020 – 85 acquisitions Represents ~3.1% of all bitcoin ever to 641,205 $71B $47B $74K be in existence BTC NAV (1) Total Acquisition Average BTC BTC Holdings 640.0 641.2 Cost Purchase Price 597.3 Bitcoin Holdings (in ‘000s)(2) 528.2 447.5 252.2 214.3 226.3 189.2 152.3 158.2 124.4 129.2 129.7 130.0 132.5 140.0 105.1 114.0 91.3 70.5 38.3 Note: (1) As of October 31, 2025. (2) As of 8-K filed on November 2, 2025 7
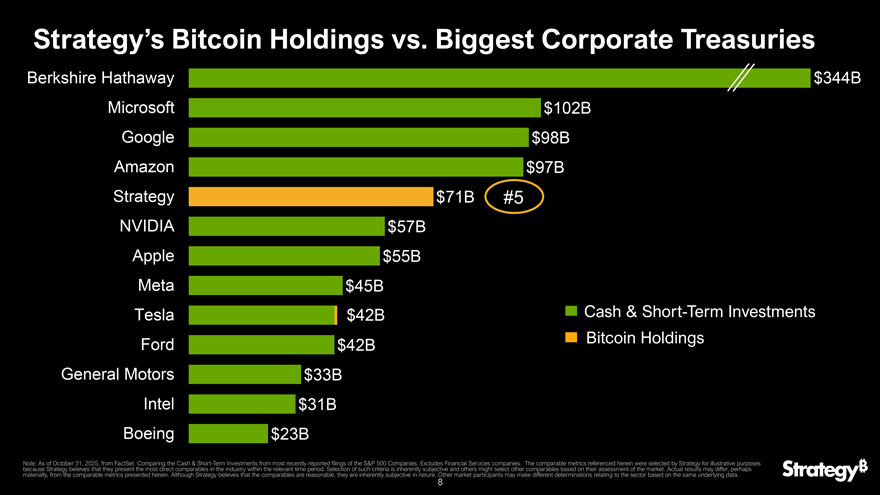
Strategy’s Bitcoin Holdings vs. Biggest Corporate Treasuries Berkshire Hathaway $344B Microsoft $102B Google $98B Amazon $97B Strategy $71B #5 NVIDIA $57B Apple $55B Meta $45B Tesla $42B Cash & Short-Term Investments Ford Bitcoin Holdings $42B General Motors $33B Intel $31B Boeing $23B Note: because As Strategy of October believes 31, 2025, that from they FactSet present. the Comparing most direct the comparables Cash & Short in -Term the industry Investments within from the most relevant recently time period reported . Selection filings of of the such S&P criteria 500 Companies is inherently . Excludes subjective Financial and others Services might companies select other . The comparables comparable based metrics on their referenced assessment herein of were the market selected . Actual by Strategy results for may illustrative differ, perhaps purposes materially, from the comparable metrics presented herein. Although Strategy believes that the comparables are reasonable, they are inherently subjective in nature. Other market participants may make different determinations relating to the sector based on the same underlying data. 8
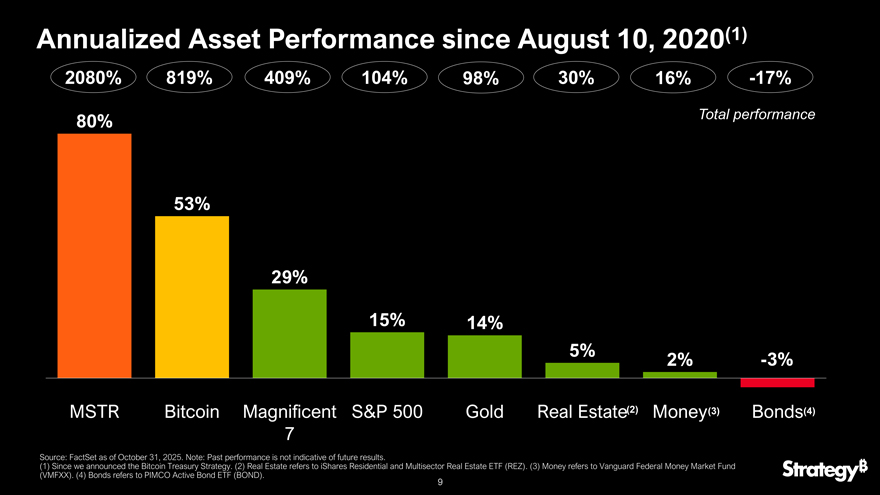
Annualized Asset Performance since August 10, 2020(1) 2080% 819% 409% 104% 98% 30% 16% -17% 80% Total performance 53% 29% 15% 14% 5% -3% 2% MSTR Bitcoin Magnificent S&P 500 Gold Real Estate(2) Money(3) Bonds(4) 7 Source: FactSet as of October 31, 2025. Note: Past performance is not indicative of future results. (1) Since we announced the Bitcoin Treasury Strategy. (2) Real Estate refers to iShares Residential and Multisector Real Estate ETF (REZ). (3) Money refers to Vanguard Federal Money Market Fund (VMFXX). (4) Bonds refers to PIMCO Active Bond ETF (BOND). 9
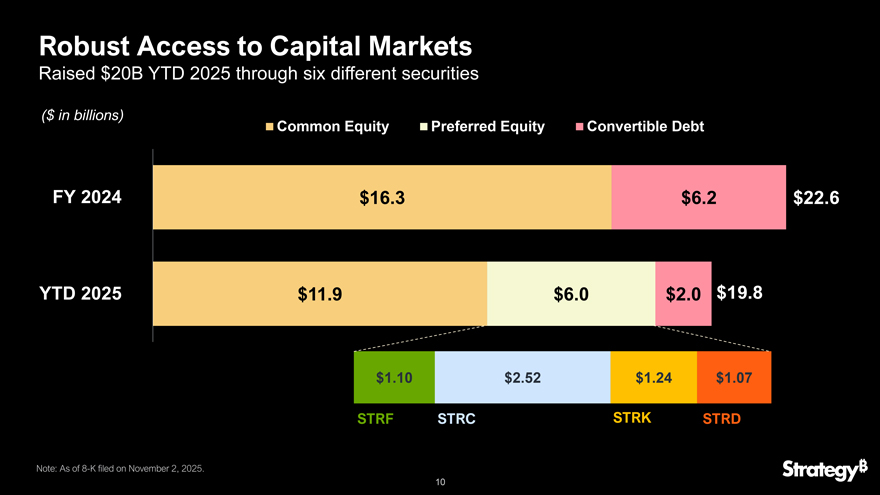
Robust Access to Capital Markets Raised $20B YTD 2025 through six different securities ($ in billions) Common Equity Preferred Equity Convertible Debt FY 2024 $16.3 $6.2 $22.6 YTD 2025 $11.9 $6.0 $2.0 $19.8 $1.10 $2.52 $1.24 $1.07 STRF STRC STRK STRD Note: As of 8-K filed on November 2, 2025. 10
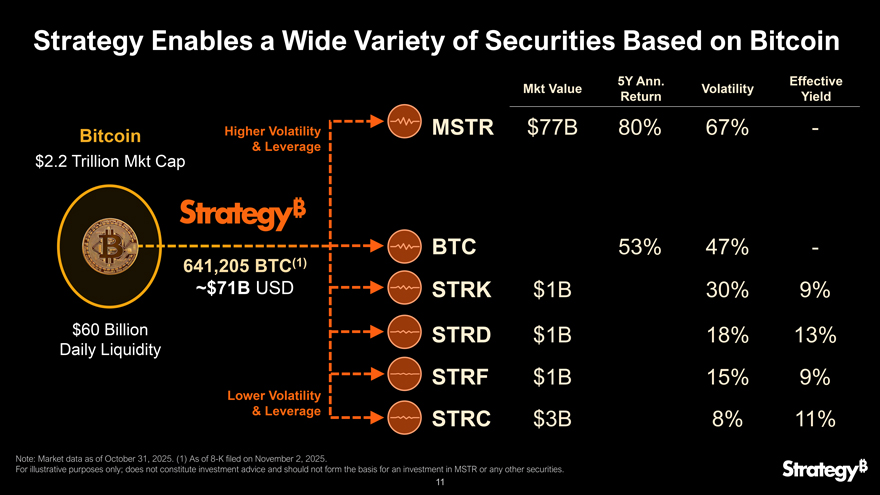
Strategy Enables a Wide Variety of Securities Based on Bitcoin 5Y Ann. Effective Mkt Value Volatility Return Yield Bitcoin Higher Volatility MSTR $77B 80% 67% - & Leverage $2.2 Trillion Mkt Cap BTC 53% 47% - 641,205 BTC(1) ~$71B USD STRK $1B 30% 9% $60 Billion STRD $1B 18% 13% Daily Liquidity STRF $1B 15% 9% Lower Volatility & Leverage STRC $3B 8% 11% Note: Market data as of October 31, 2025. (1) As of 8-K filed on November 2, 2025. For illustrative purposes only; does not constitute investment advice and should not form the basis for an investment in MSTR or any other securities. 11
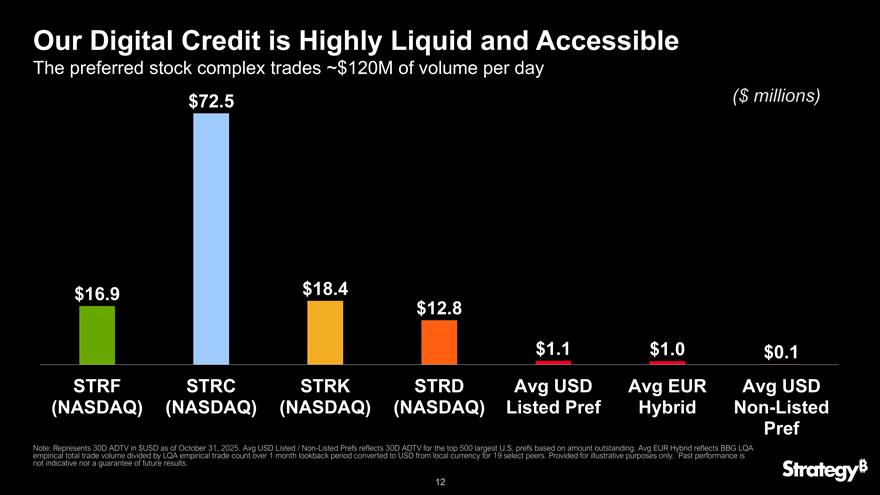
Our Digital Credit is Highly Liquid and Accessible The preferred stock complex trades ~$120M of volume per day $72.5 ($ millions) $16.9 $18.4 $12.8 $1.1 $1.0 $0.1 STRF STRC STRK STRD Avg USD Avg EUR Avg USD (NASDAQ) (NASDAQ) (NASDAQ) (NASDAQ) Listed Pref Hybrid Non-Listed Pref Note: empirical Represents total trade 30D volume ADTV divided in $USD by as LQA of October empirical 31, trade 2025 count . Avg over USD 1 month Listed /lookback Non-Listed period Prefs converted reflects 30D to USD ADTV from for local the top currency 500 largest for 19 U select .S. prefs peers based . Provided on amount for illustrative outstanding purposes . Avg EUR only Hybrid . Past reflects performance BBG LQA is not indicative nor a guarantee of future results. 12
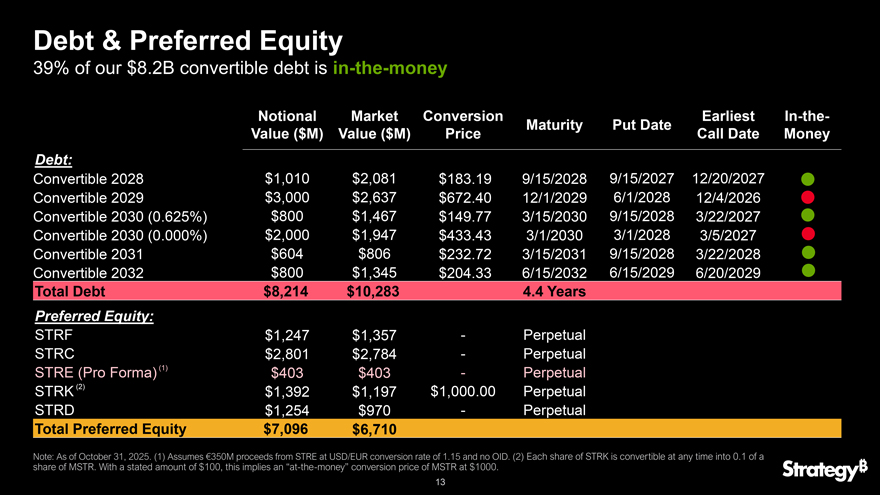
Debt & Preferred Equity 39% of our $8.2B convertible debt is in-the-money Notional Market Conversion Earliest In-the-Maturity Put Date Value ($M) Value ($M) Price Call Date Money Debt: Convertible 2028 $1,010 $2,081 $183.19 9/15/2028 9/15/2027 12/20/2027 Convertible 2029 $3,000 $2,637 $672.40 12/1/2029 6/1/2028 12/4/2026 Convertible 2030 (0.625%) $800 $1,467 $149.77 3/15/2030 9/15/2028 3/22/2027 Convertible 2030 (0.000%) $2,000 $1,947 $433.43 3/1/2030 3/1/2028 3/5/2027 Convertible 2031 $604 $806 $232.72 3/15/2031 9/15/2028 3/22/2028 Convertible 2032 $800 $1,345 $204.33 6/15/2032 6/15/2029 6/20/2029 Total Debt $8,214 $10,283 4.4 Years Preferred Equity: STRF $1,247 $1,357 - Perpetual STRC $2,801 $2,784 - Perpetual STRE (Pro Forma) (1) $403 $403 - Perpetual STRK (2) $1,392 $1,197 $1,000.00 Perpetual STRD $1,254 $970 - Perpetual Total Preferred Equity $7,096 $6,710 Note: As of October 31, 2025. (1) Assumes €350M proceeds from STRE at USD/EUR conversion rate of 1.15 and no OID. (2) Each share of STRK is convertible at any time into 0.1 of a share of MSTR. With a stated amount of $100, this implies an “at-the-money” conversion price of MSTR at $1000. 13
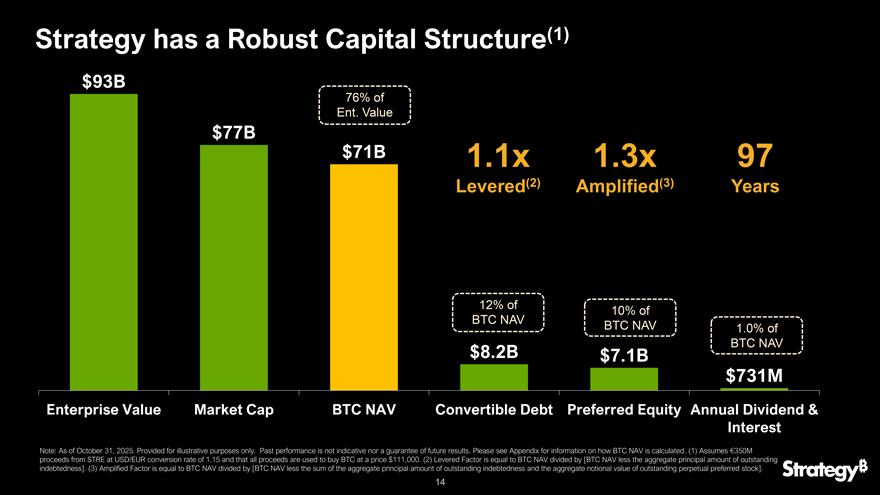
Strategy has a Robust Capital Structure(1) $93B 76% of Ent. Value $77B $71B 1.1x 1.3x 97 Levered(2) Amplified(3) Years 12% of 10% of BTC NAV BTC NAV 1.0% of $8.2B BTC NAV $7.1B $731M Enterprise Value Market Cap BTC NAV Convertible Debt Preferred Equity Annual Dividend & Interest Note: As of October 31, 2025. Provided for illustrative purposes only. Past performance is not indicative nor a guarantee of future results. Please see Appendix for information on how BTC NAV is calculated. (1) Assumes €350M proceeds from STRE at USD/EUR conversion rate of 1.15 and that all proceeds are used to buy BTC at a price $111,000. (2) Levered Factor is equal to BTC NAV divided by [BTC NAV less the aggregate principal amount of outstanding indebtedness]. (3) Amplified Factor is equal to BTC NAV divided by [BTC NAV less the sum of the aggregate principal amount of outstanding indebtedness and the aggregate notional value of outstanding perpetual preferred stock]. 14
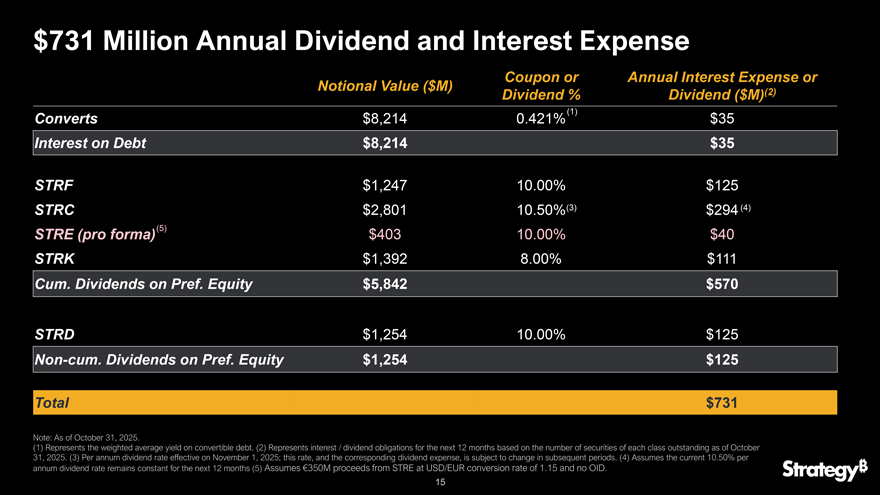
$731 Million Annual Dividend and Interest Expense Coupon or Annual Interest Expense or Notional Value ($M) Dividend % Dividend ($M)(2) (1) Converts $8,214 0.421% $35 Interest on Debt $8,214 $35 STRF $1,247 10.00% $125 STRC $2,801 10.50%(3) $294 (4) STRE (pro forma)(5) $403 10.00% $40 STRK $1,392 8.00% $111 Cum. Dividends on Pref. Equity $5,842 $570 STRD $1,254 10.00% $125 Non-cum. Dividends on Pref. Equity $1,254 $125 Total $731 Note: As of October 31, 2025. (1) Represents the weighted average yield on convertible debt. (2) Represents interest / dividend obligations for the next 12 months based on the number of securities of each class outstanding as of October 31, 2025. (3) Per annum dividend rate effective on November 1, 2025; this rate, and the corresponding dividend expense, is subject to change in subsequent periods. (4) Assumes the current 10.50% per annum dividend rate remains constant for the next 12 months (5) Assumes €350M proceeds from STRE at USD/EUR conversion rate of 1.15 and no OID. 15
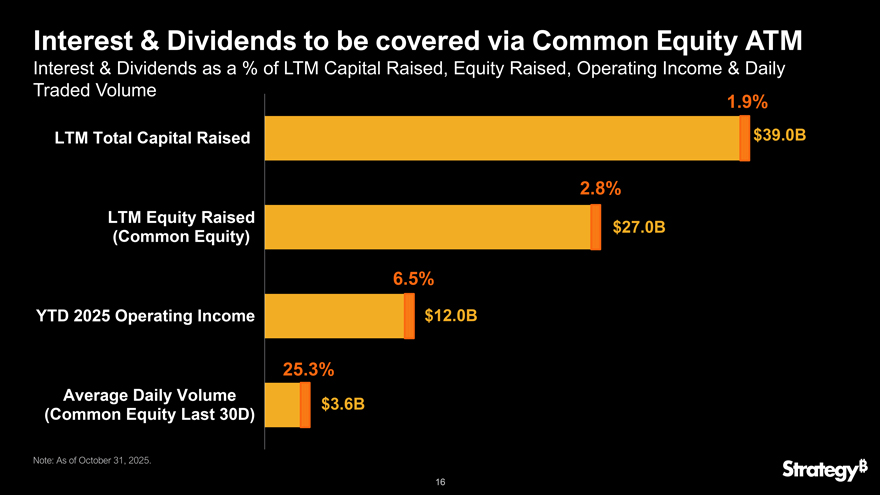
Interest & Dividends to be covered via Common Equity ATM Interest & Dividends as a % of LTM Capital Raised, Equity Raised, Operating Income & Daily Traded Volume 1.9% LTM Total Capital Raised $39.0B 2.8% LTM Equity Raised $27.0B (Common Equity) 6.5% YTD 2025 Operating Income $12.0B 25.3% Average Daily Volume $3.6B (Common Equity Last 30D) Note: As of October 31, 2025. 16
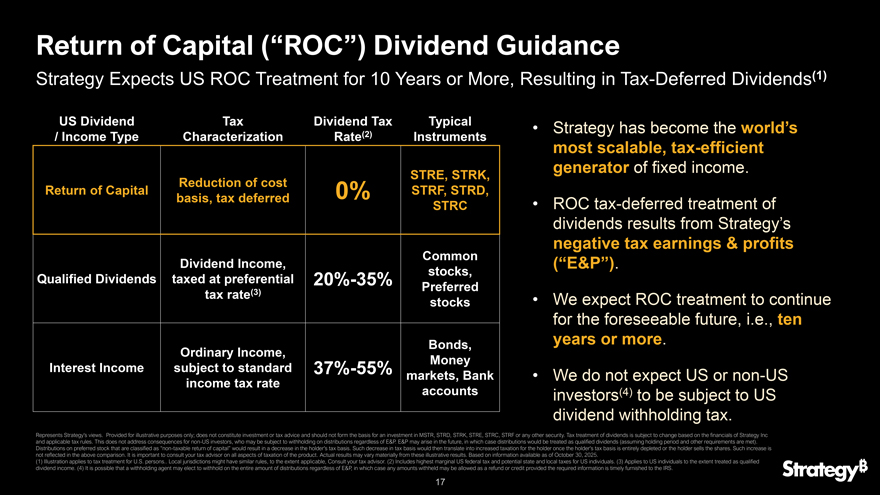
Return of Capital (“ROC”) Dividend Guidance Strategy Expects US ROC Treatment for 10 Years or More, Resulting in Tax-Deferred Dividends(1) US Dividend Tax Dividend Tax Typical • Strategy has become the world’s / Income Type Characterization Rate(2) Instruments most scalable, tax-efficient generator of fixed income. STRE, STRK, Reduction of cost Return of Capital 0% STRF, STRD, basis, tax deferred • ROC tax-deferred treatment of STRC dividends results from Strategy’s negative tax earnings & profits Common Dividend Income, (“E&P”). stocks, Qualified Dividends taxed at preferential 20%-35% Preferred tax rate(3) • We expect ROC treatment to continue stocks for the foreseeable future, i.e., ten Bonds, years or more. Ordinary Income, Money Interest Income subject to standard 37%-55% markets, Bank • We do not expect US or non-US income tax rate accounts investors(4) to be subject to US dividend withholding tax. Represents Strategy’s views. Provided for illustrative purposes only; does not constitute investment or tax advice and should not form the basis for an investment in MSTR, STRD, STRK, STRE, STRC, STRF or any other security. Tax treatment of dividends is subject to change based on the financials of Strategy Inc and applicable tax rules. This does not address consequences for non-US investors, who may be subject to withholding on distributions regardless of E&P. E&P may arise in the future, in which case distributions would be treated as qualified dividends (assuming holding period and other requirements are met). Distributions on preferred stock that are classified as “non-taxable return of capital” would result in a decrease in the holder’s tax basis. Such decrease in tax basis would then translate into increased taxation for the holder once the holder’s tax basis is entirely depleted or the holder sells the shares. Such increase is not reflected in the above comparison. It is important to consult your tax advisor on all aspects of taxation of the product. Actual results may vary materially from these illustrative results. Based on information available as of October 30, 2025. (1) Illustration applies to tax treatment for U.S. persons.. Local jurisdictions might have similar rules, to the extent applicable, Consult your tax advisor. (2) Includes highest marginal US federal tax and potential state and local taxes for US individuals. (3) Applies to US individuals to the extent treated as qualified dividend income. (4) It is possible that a withholding agent may elect to withhold on the entire amount of distributions regardless of E&P, in which case any amounts withheld may be allowed as a refund or credit provided the required information is timely furnished to the IRS. 17
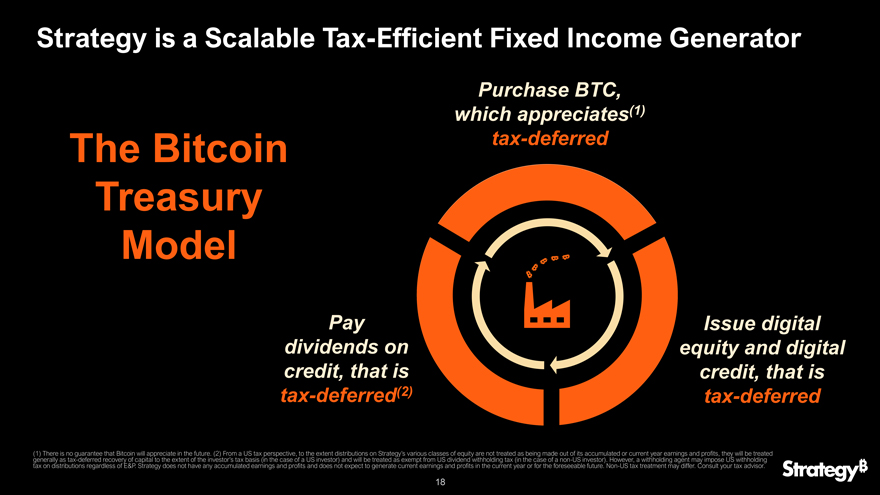
Strategy is a Scalable Tax-Efficient Fixed Income Generator Purchase BTC, which appreciates(1) The Bitcoin tax-deferred Treasury Model Pay Issue digital dividends on equity and digital credit, that is credit, that is tax-deferred(2) tax-deferred (1) generally There as is no tax guarantee -deferred recovery that Bitcoin of capital will appreciate to the extent in the of future the investor’s . (2) From tax a US basis tax (in perspective, the case of to a the US extent investor) distributions and will be on treated Strategy’s as exempt various from classes US dividend of equity withholding are not treated tax (in as the being case made of a out non of -US its investor) accumulated . However, or current a withholding year earnings agent and may profits, impose they US will withholding be treated tax on distributions regardless of E&P. Strategy does not have any accumulated earnings and profits and does not expect to generate current earnings and profits in the current year or for the foreseeable future. Non-US tax treatment may differ. Consult your tax advisor. 18
Stream (“STRE”) Michael Saylor, Executive Chairman Copyright © 2025 Strategy. All Rights Reserved.
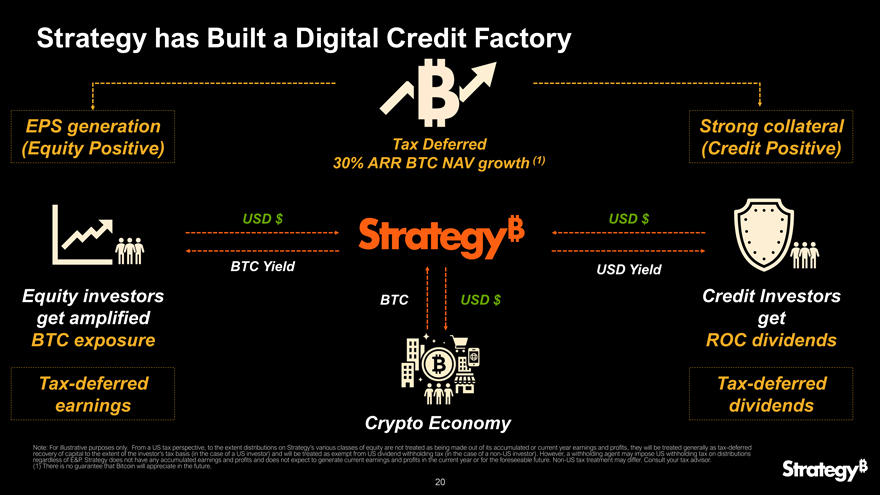
Strategy has Built a Digital Credit Factory
STRE (“Stream”) is a Euro-denominated perpetual, preferred security offering a fixed 10% dividend
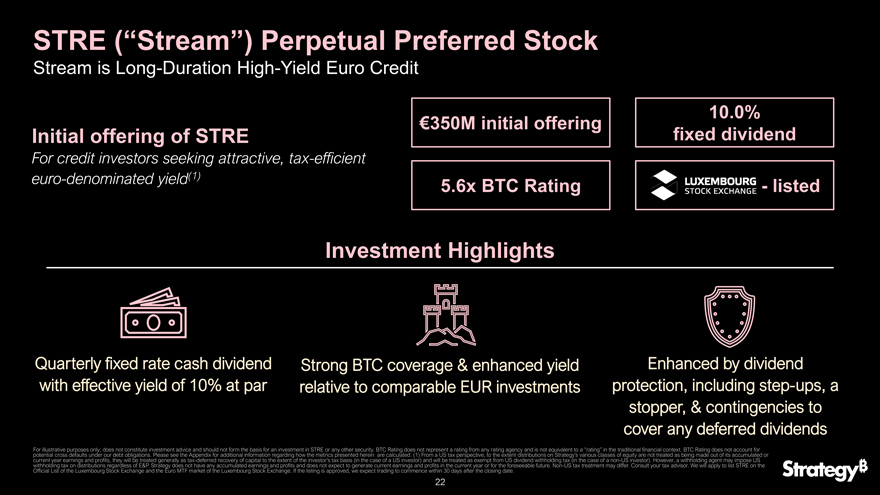
STRE (“Stream”) Perpetual Preferred Stock Stream is Long-Duration High-Yield Euro Credit
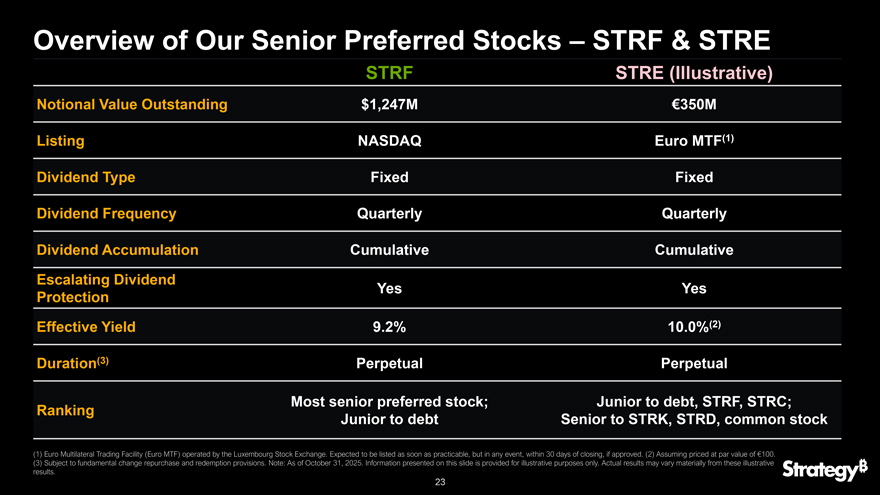
Overview of Our Senior Preferred Stocks – STRF & STRE
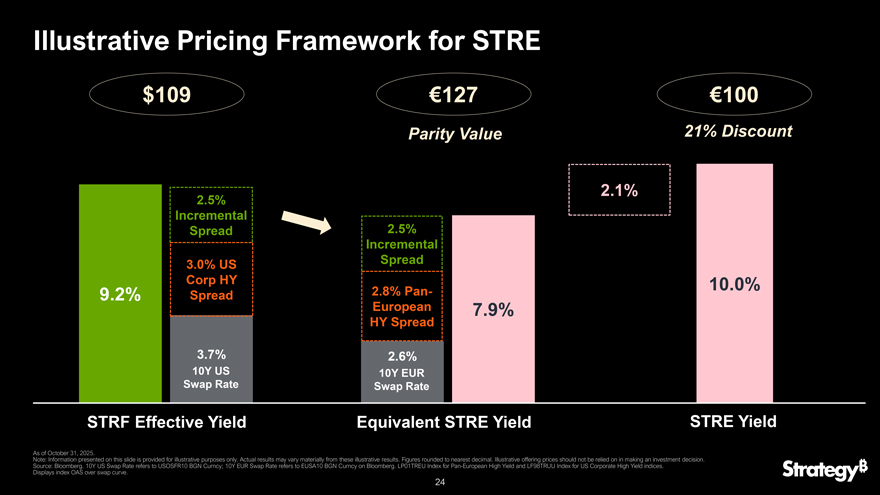
Illustrative Pricing Framework for STRE
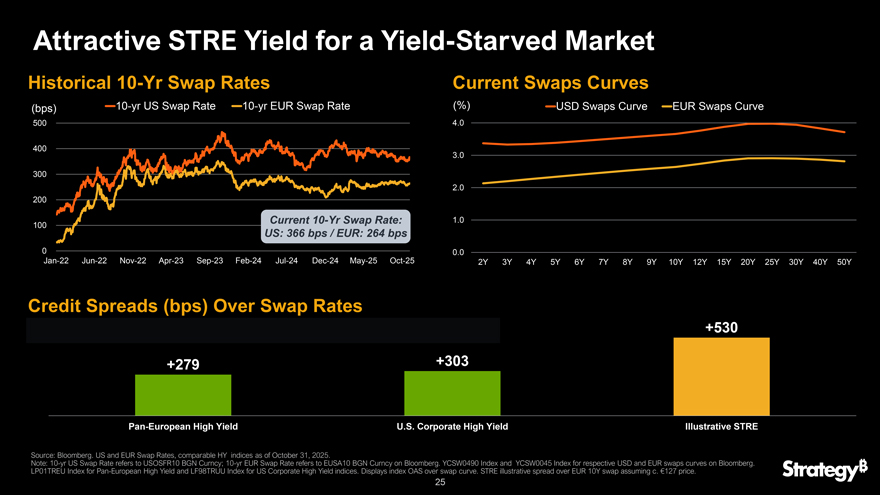
Attractive STRE Yield for a Yield-Starved Market Historical 10-Yr Swap rates (bps) 500 400 300 200 100 0 current 10-Yr Swap Rate: US: 366 bps / EUR: 264 bps Jan-22 Jun-22 Nov-22 Apr-23 Sep-23 Feb-24 Jul-24 Dec-24 May-25 Oct-25 Credit Spreads (bps) Over Swap Rates Current Swaps Curves (%) 4.0 3.0 2.0 1.0 0.0 USD Swaps Curve EUR Swaps Curve 2Y 3Y 4Y 5Y 6Y 7Y 8Y 9Y 10Y 12Y 15Y 20Y 25Y 30Y 40Y 50Y +279 +303 +530 Pan-European High Yield U.S. Corporate High Yield Illustrative STRE Soure: Bloomberg. US and EUR Swap Rates, comparable HY Indices as of October 31, 2025 Note: 10-yr US Swap RAte refers to USOSFR10 BGN Curncy; 10-yr EUR Swap Rate refers to EUSA 10 BGN Curncy on Bloomberg. YCSW0490 Index for respective USD and EUR swaps curves on Bloomberg. LP01TREU Index for Pan European High Yield and LF98TRUU Index for US Corporate High Yield indices. Displays index OAS over swap curve. STRE illustrative spread over EUR 10Y swap assuming c. E127 price. 25
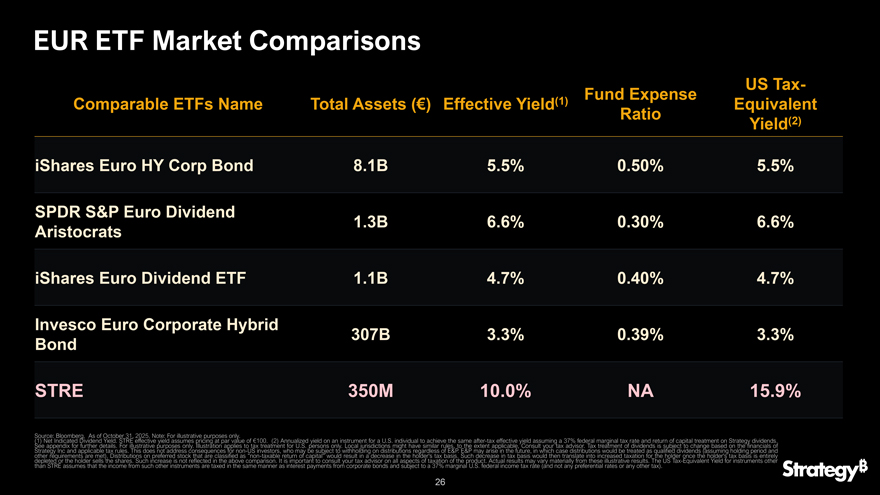
EUR ETF Market Comparisons
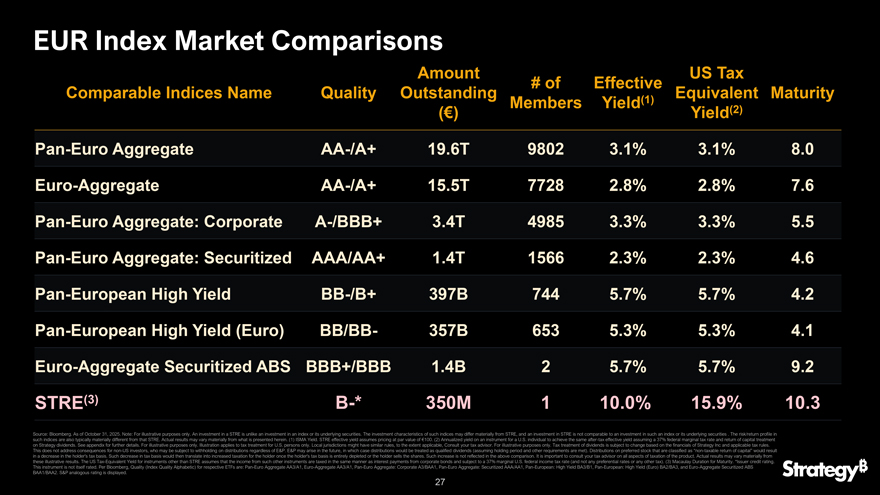
EUR Index Market Comparisons
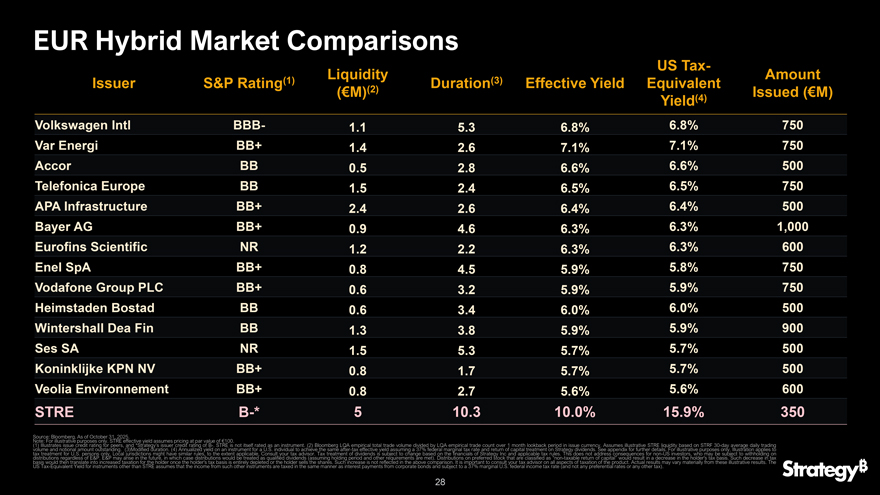
EUR Hybrid Market Comparisons
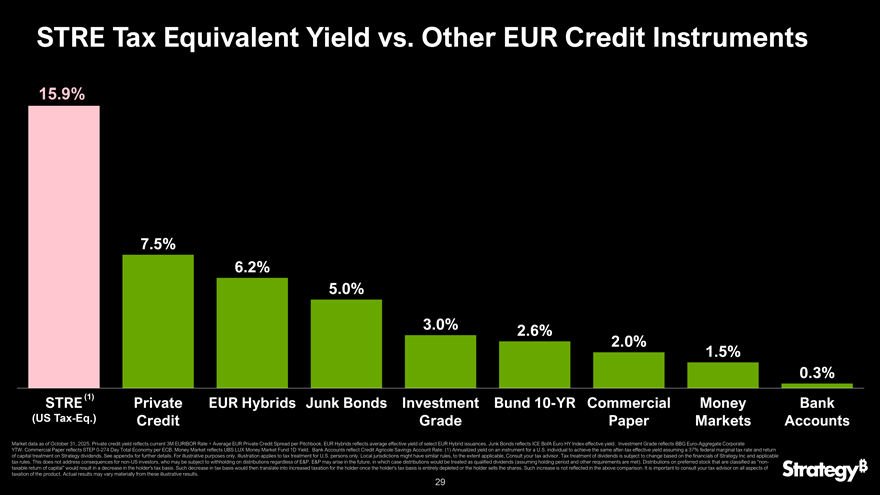
STRE Tax Equivalent Yield vs. Other EUR Credit Instruments
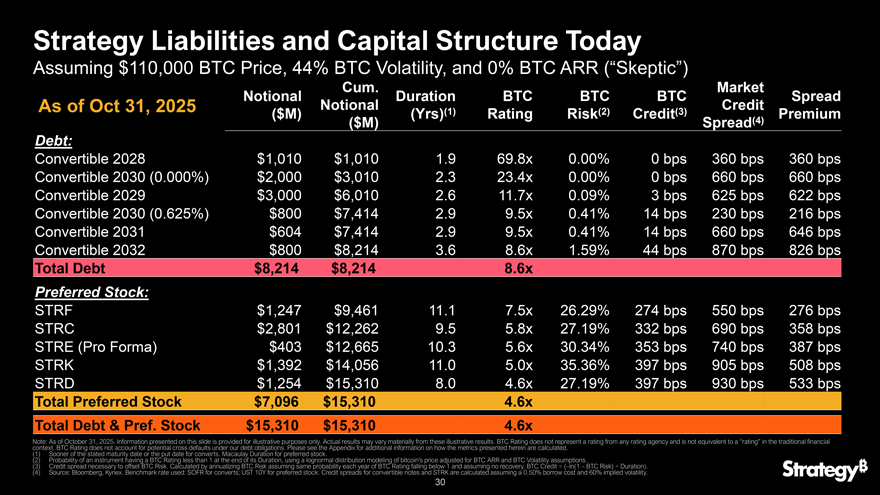
Strategy Liabilities and Capital Structure Today Assuming $110,000 BTC Price, 44% BTC Volatility, and 0% BTC ARR (“Skeptic”)
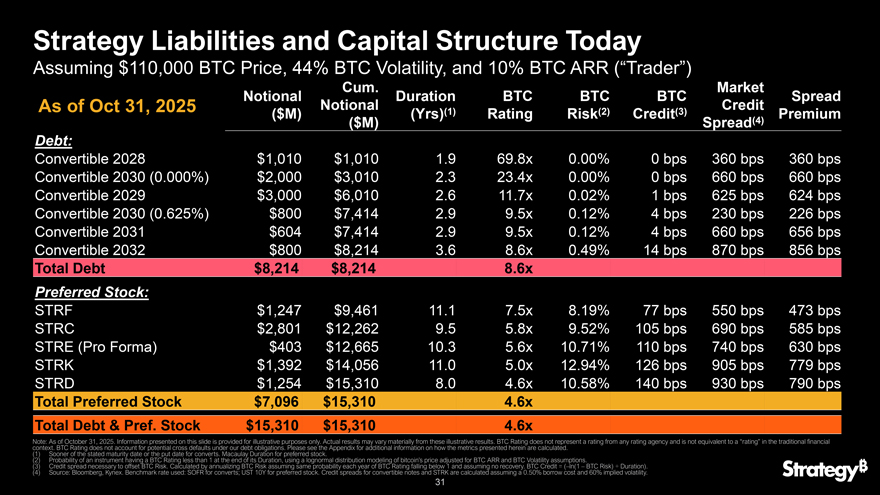
Strategy Liabilities and Capital Structure Today Assuming $110,000 BTC Price, 44% BTC Volatility, and 10% BTC ARR (“Trader”)
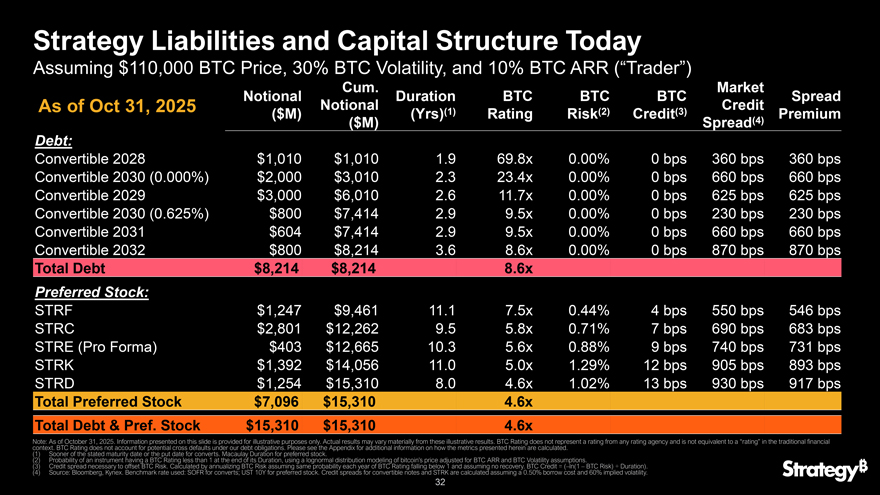
Strategy Liabilities and Capital Structure Today Assuming $110,000 BTC Price, 30% BTC Volatility, and 10% BTC ARR (“Trader”)
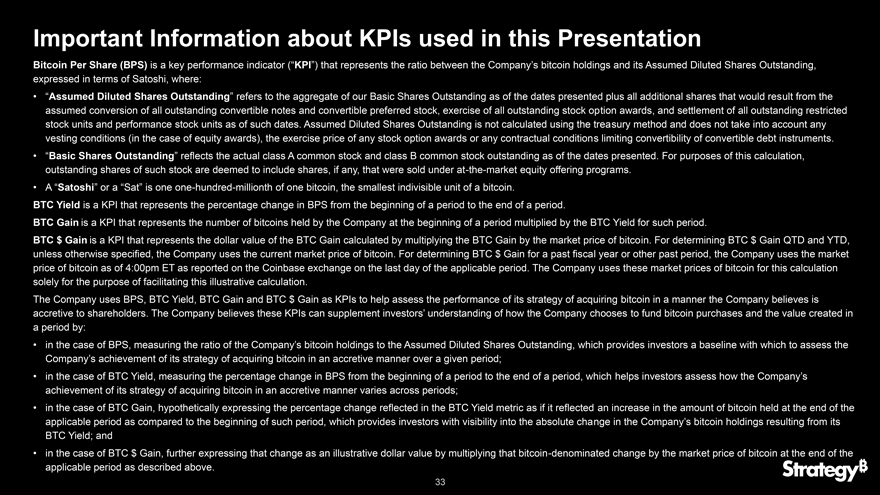
Important Information about KPIs used in this Presentation Bitcoin Per Share (BPS) is a key performance indicator (“KPI”) that represents the ratio between the Company’s bitcoin holdings and its Assumed Diluted Shares Outstanding, expressed in terms of Satoshi, where: • “Assumed Diluted Shares Outstanding” refers to the aggregate of our Basic Shares Outstanding as of the dates presented plus all additional shares that would result from the assumed conversion of all outstanding convertible notes and convertible preferred stock, exercise of all outstanding stock option awards, and settlement of all outstanding restricted stock units and performance stock units as of such dates. Assumed Diluted Shares Outstanding is not calculated using the treasury method and does not take into account any vesting conditions (in the case of equity awards), the exercise price of any stock option awards or any contractual conditions limiting convertibility of convertible debt instruments. • “Basic Shares Outstanding” reflects the actual class A common stock and class B common stock outstanding as of the dates presented. For purposes of this calculation, outstanding shares of such stock are deemed to include shares, if any, that were sold under at-the-market equity offering programs. • A “Satoshi” or a “Sat” is one one-hundred-millionth of one bitcoin, the smallest indivisible unit of a bitcoin. BTC Yield is a KPI that represents the percentage change in BPS from the beginning of a period to the end of a period. BTC Gain is a KPI that represents the number of bitcoins held by the Company at the beginning of a period multiplied by the BTC Yield for such period. BTC $ Gain is a KPI that represents the dollar value of the BTC Gain calculated by multiplying the BTC Gain by the market price of bitcoin. For determining BTC $ Gain QTD and YTD, unless otherwise specified, the Company uses the current market price of bitcoin. For determining BTC $ Gain for a past fiscal year or other past period, the Company uses the market price of bitcoin as of 4:00pm ET as reported on the Coinbase exchange on the last day of the applicable period. The Company uses these market prices of bitcoin for this calculation solely for the purpose of facilitating this illustrative calculation. The Company uses BPS, BTC Yield, BTC Gain and BTC $ Gain as KPIs to help assess the performance of its strategy of acquiring bitcoin in a manner the Company believes is accretive to shareholders. The Company believes these KPIs can supplement investors’ understanding of how the Company chooses to fund bitcoin purchases and the value created in a period by: • in the case of BPS, measuring the ratio of the Company’s bitcoin holdings to the Assumed Diluted Shares Outstanding, which provides investors a baseline with which to assess the Company’s achievement of its strategy of acquiring bitcoin in an accretive manner over a given period; • in the case of BTC Yield, measuring the percentage change in BPS from the beginning of a period to the end of a period, which helps investors assess how the Company’s achievement of its strategy of acquiring bitcoin in an accretive manner varies across periods; • in the case of BTC Gain, hypothetically expressing the percentage change reflected in the BTC Yield metric as if it reflected an increase in the amount of bitcoin held at the end of the applicable period as compared to the beginning of such period, which provides investors with visibility into the absolute change in the Company’s bitcoin holdings resulting from its BTC Yield; and • in the case of BTC $ Gain, further expressing that change as an illustrative dollar value by multiplying that bitcoin-denominated change by the market price of bitcoin at the end of the applicable period as described above.
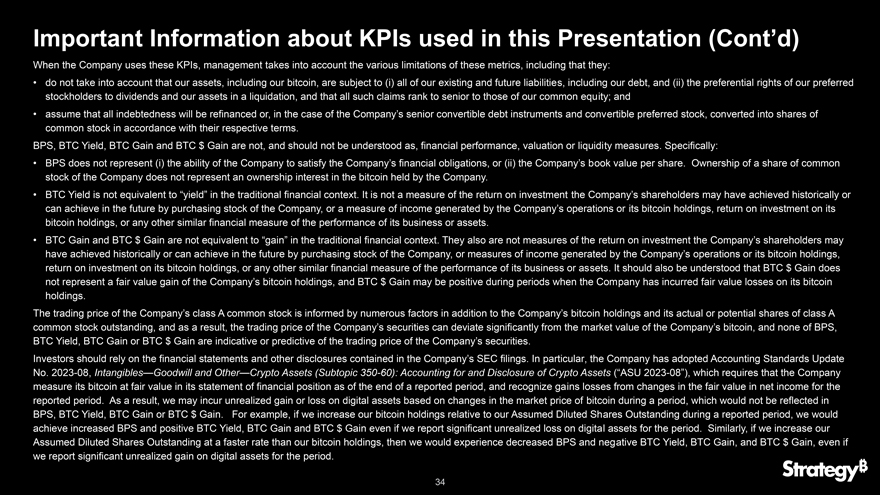
Important Information about KPIs used in this Presentation (Cont’d) When the Company uses these KPIs, management takes into account the various limitations of these metrics, including that they: • do not take into account that our assets, including our bitcoin, are subject to (i) all of our existing and future liabilities, including our debt, and (ii) the preferential rights of our preferred stockholders to dividends and our assets in a liquidation, and that all such claims rank to senior to those of our common equity; and • assume that all indebtedness will be refinanced or, in the case of the Company’s senior convertible debt instruments and convertible preferred stock, converted into shares of common stock in accordance with their respective terms. BPS, BTC Yield, BTC Gain and BTC $ Gain are not, and should not be understood as, financial performance, valuation or liquidity measures. Specifically: • BPS does not represent (i) the ability of the Company to satisfy the Company’s financial obligations, or (ii) the Company’s book value per share. Ownership of a share of common stock of the Company does not represent an ownership interest in the bitcoin held by the Company. • BTC Yield is not equivalent to “yield” in the traditional financial context. It is not a measure of the return on investment the Company’s shareholders may have achieved historically or can achieve in the future by purchasing stock of the Company, or a measure of income generated by the Company’s operations or its bitcoin holdings, return on investment on its bitcoin holdings, or any other similar financial measure of the performance of its business or assets. • BTC Gain and BTC $ Gain are not equivalent to “gain” in the traditional financial context. They also are not measures of the return on investment the Company’s shareholders may have achieved historically or can achieve in the future by purchasing stock of the Company, or measures of income generated by the Company’s operations or its bitcoin holdings, return on investment on its bitcoin holdings, or any other similar financial measure of the performance of its business or assets. It should also be understood that BTC $ Gain does not represent a fair value gain of the Company’s bitcoin holdings, and BTC $ Gain may be positive during periods when the Company has incurred fair value losses on its bitcoin holdings. The trading price of the Company’s class A common stock is informed by numerous factors in addition to the Company’s bitcoin holdings and its actual or potential shares of class A common stock outstanding, and as a result, the trading price of the Company’s securities can deviate significantly from the market value of the Company’s bitcoin, and none of BPS, BTC Yield, BTC Gain or BTC $ Gain are indicative or predictive of the trading price of the Company’s securities. Investors should rely on the financial statements and other disclosures contained in the Company’s SEC filings. In particular, the Company has adopted Accounting Standards Update No. 2023-08, Intangibles—Goodwill and Other—Crypto Assets (Subtopic 350-60): Accounting for and Disclosure of Crypto Assets (“ASU 2023-08”), which requires that the Company measure its bitcoin at fair value in its statement of financial position as of the end of a reported period, and recognize gains losses from changes in the fair value in net income for the reported period. As a result, we may incur unrealized gain or loss on digital assets based on changes in the market price of bitcoin during a period, which would not be reflected in BPS, BTC Yield, BTC Gain or BTC $ Gain. For example, if we increase our bitcoin holdings relative to our Assumed Diluted Shares Outstanding during a reported period, we would achieve increased BPS and positive BTC Yield, BTC Gain and BTC $ Gain even if we report significant unrealized loss on digital assets for the period. Similarly, if we increase our Assumed Diluted Shares Outstanding at a faster rate than our bitcoin holdings, then we would experience decreased BPS and negative BTC Yield, BTC Gain, and BTC $ Gain, even if we report significant unrealized gain on digital assets for the period.
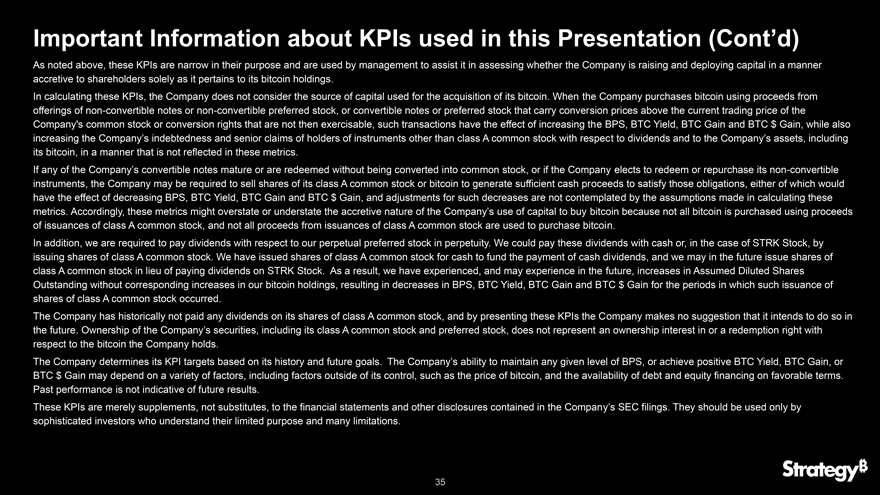
Important Information about KPIs used in this Presentation (Cont’d) As noted above, these KPIs are narrow in their purpose and are used by management to assist it in assessing whether the Company is raising and deploying capital in a manner accretive to shareholders solely as it pertains to its bitcoin holdings. In calculating these KPIs, the Company does not consider the source of capital used for the acquisition of its bitcoin. When the Company purchases bitcoin using proceeds from offerings of non-convertible notes or non-convertible preferred stock, or convertible notes or preferred stock that carry conversion prices above the current trading price of the Company’s common stock or conversion rights that are not then exercisable, such transactions have the effect of increasing the BPS, BTC Yield, BTC Gain and BTC $ Gain, while also increasing the Company’s indebtedness and senior claims of holders of instruments other than class A common stock with respect to dividends and to the Company’s assets, including its bitcoin, in a manner that is not reflected in these metrics. If any of the Company’s convertible notes mature or are redeemed without being converted into common stock, or if the Company elects to redeem or repurchase its non-convertible instruments, the Company may be required to sell shares of its class A common stock or bitcoin to generate sufficient cash proceeds to satisfy those obligations, either of which would have the effect of decreasing BPS, BTC Yield, BTC Gain and BTC $ Gain, and adjustments for such decreases are not contemplated by the assumptions made in calculating these metrics. Accordingly, these metrics might overstate or understate the accretive nature of the Company’s use of capital to buy bitcoin because not all bitcoin is purchased using proceeds of issuances of class A common stock, and not all proceeds from issuances of class A common stock are used to purchase bitcoin. In addition, we are required to pay dividends with respect to our perpetual preferred stock in perpetuity. We could pay these dividends with cash or, in the case of STRK Stock, by issuing shares of class A common stock. We have issued shares of class A common stock for cash to fund the payment of cash dividends, and we may in the future issue shares of class A common stock in lieu of paying dividends on STRK Stock. As a result, we have experienced, and may experience in the future, increases in Assumed Diluted Shares Outstanding without corresponding increases in our bitcoin holdings, resulting in decreases in BPS, BTC Yield, BTC Gain and BTC $ Gain for the periods in which such issuance of shares of class A common stock occurred. The Company has historically not paid any dividends on its shares of class A common stock, and by presenting these KPIs the Company makes no suggestion that it intends to do so in the future. Ownership of the Company’s securities, including its class A common stock and preferred stock, does not represent an ownership interest in or a redemption right with respect to the bitcoin the Company holds. The Company determines its KPI targets based on its history and future goals. The Company’s ability to maintain any given level of BPS, or achieve positive BTC Yield, BTC Gain, or BTC $ Gain may depend on a variety of factors, including factors outside of its control, such as the price of bitcoin, and the availability of debt and equity financing on favorable terms. Past performance is not indicative of future results. These KPIs are merely supplements, not substitutes, to the financial statements and other disclosures contained in the Company’s SEC filings. They should be used only by sophisticated investors who understand their limited purpose and many limitations.
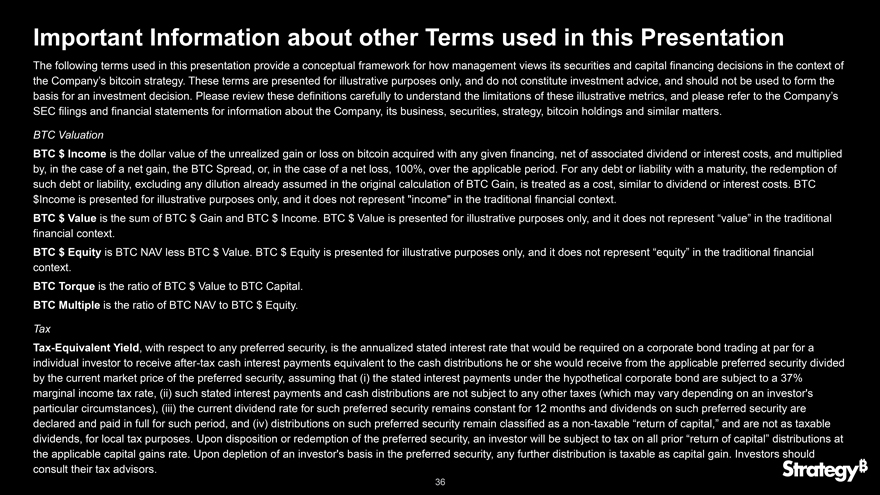
Important Information about other Terms used in this Presentation The following terms used in this presentation provide a conceptual framework for how management views its securities and capital financing decisions in the context of the Company’s bitcoin strategy. These terms are presented for illustrative purposes only, and do not constitute investment advice, and should not be used to form the basis for an investment decision. Please review these definitions carefully to understand the limitations of these illustrative metrics, and please refer to the Company’s SEC filings and financial statements for information about the Company, its business, securities, strategy, bitcoin holdings and similar matters. BTC Valuation BTC $ Income is the dollar value of the unrealized gain or loss on bitcoin acquired with any given financing, net of associated dividend or interest costs, and multiplied by, in the case of a net gain, the BTC Spread, or, in the case of a net loss, 100%, over the applicable period. For any debt or liability with a maturity, the redemption of such debt or liability, excluding any dilution already assumed in the original calculation of BTC Gain, is treated as a cost, similar to dividend or interest costs. BTC $Income is presented for illustrative purposes only, and it does not represent “income” in the traditional financial context. BTC $ Value is the sum of BTC $ Gain and BTC $ Income. BTC $ Value is presented for illustrative purposes only, and it does not represent “value” in the traditional financial context. BTC $ Equity is BTC NAV less BTC $ Value. BTC $ Equity is presented for illustrative purposes only, and it does not represent “equity” in the traditional financial context. BTC Torque is the ratio of BTC $ Value to BTC Capital. BTC Multiple is the ratio of BTC NAV to BTC $ Equity. Tax Tax-Equivalent Yield, with respect to any preferred security, is the annualized stated interest rate that would be required on a corporate bond trading at par for a individual investor to receive after-tax cash interest payments equivalent to the cash distributions he or she would receive from the applicable preferred security divided by the current market price of the preferred security, assuming that (i) the stated interest payments under the hypothetical corporate bond are subject to a 37% marginal income tax rate, (ii) such stated interest payments and cash distributions are not subject to any other taxes (which may vary depending on an investor’s particular circumstances), (iii) the current dividend rate for such preferred security remains constant for 12 months and dividends on such preferred security are declared and paid in full for such period, and (iv) distributions on such preferred security remain classified as a non-taxable “return of capital,” and are not as taxable dividends, for local tax purposes. Upon disposition or redemption of the preferred security, an investor will be subject to tax on all prior “return of capital” distributions at the applicable capital gains rate. Upon depletion of an investor’s basis in the preferred security, any further distribution is taxable as capital gain. Investors should consult their tax advisors. 70109-001 03Nov25 02:20 Page 38
Important Information about other Terms used in this Presentation BTC Credit BTC Rating is the ratio of our Bitcoin NAV and the sum of the notional values of the instruments being rated and all instruments that are senior to and, if any liabilities share an equal claim to our assets, such instruments with a stated maturity date sooner than or that may become due upon an exercise of a repurchase right at the option of the holder sooner than, the liability being rated. BTC Rating does not represent a rating from any rating agency and is not equivalent to a “rating” in the traditional financial context. BTC Rating also does not account for potential cross-defaults under our debt obligations that would result in debt obligations with stated maturities later than the liability being rated becoming due sooner than the liability being rated. This metric is presented for illustrative purposes only and should not form the basis for an investment decision. BTC Risk is the probability of an instrument having a BTC Rating less than 1 at the end of its Duration. This probability is derived from a lognormal distribution modeling of bitcoin’s price, adjusted for BTC ARR and BTC Volatility assumptions. BTC Risk does not represent an actuarial risk rating or a rating from any rating agency, and it is not a risk rating in the traditional financial context. This metric is presented for illustrative purposes only and should not form the basis for an investment decision. Actual results may vary materially from these illustrative results. BTC Credit is the credit spread necessary to offset BTC Risk for a given security. It is calculated by annualizing BTC Risk assuming the same probability each year of the BTC Rating of such security falling below 1 each year and assuming no recovery. This metric is presented for illustrative purposes only and should not form the basis for an investment decision. Duration for a convertible bond is the sooner of the stated maturity date or the date it may become due upon an exercise of a repurchase right at the option of the holder. Duration for a preferred stock is the Macaulay Duration of such preferred stock. Macaulay Duration of a preferred stock is the quotient obtained by dividing the sum of 1 and the Effective Yield of such stock by the Effective Yield of such stock. Effective Yield is the annualized yield on an asset based on its fixed dividend rate and the current price of such asset.
Important Information about other Terms used in this Presentation BTC Forecast BTC ARR is an assumed annualized rate of return on bitcoin expressed as a percentage. This metric is presented for illustrative purposes only, and no prediction as to the price of bitcoin is being made. BTC Volatility is the assumed standard deviation of annual return of bitcoin expressed as a percentage. This metric is presented for illustrative purposes only, and no prediction as to the volatility of bitcoin is being made. BTC Price is the current market price of one bitcoin. BTC Treasury BTC Capital is the proceeds used from capital raised for the purpose of acquiring bitcoin. BTC Spread is the BTC Gain with respect to a given financing represented as a percentage of BTC Capital. BTC Spread is presented for illustrative purposes only, and it does not represent “spread” in the traditional financial context. BTC NAV represents the total number of bitcoin the Company holds as of a specified date multiplied by the current market price of one bitcoin (or the price of one bitcoin as of the date indicated). It does not take into account or include the Company’s indebtedness or the liquidation value of its perpetual preferred stock. As such, it is not equivalent to “net asset value” or “NAV” or any similar metric in the traditional financial context. Although it incorporates the label “NAV,” it is not a measure of either the net asset value of the Company or the value of the bitcoin held by the Company net of indebtedness, perpetual preferred stock liquidation preference and other obligations. Moreover, this Bitcoin NAV metric is not comparable to either net asset value or NAV metrics that may be reported by other companies, including ETFs, ETPs and mutual funds. Investors should rely on the financial statements and other disclosures contained in the Company’s SEC filings. This metric is merely a supplement, not a substitute, to the financial statements and other disclosures contained in the Company’s SEC filings. It should be used only by sophisticated investors who understand its limited purpose and many limitations. mNAV represents a multiple of Bitcoin NAV, as of the specified date, calculated as the Company’s enterprise value (as we define it) divided by Bitcoin NAV. The Company’s enterprise value is calculated as the sum of (A) the total market value of all outstanding MSTR common stock, including class A common stock and class B common stock, calculated by multiplying the number of outstanding shares of class A common stock and class B common stock by the closing price of the class A common stock on the Nasdaq Global Select Market on the applicable date, (B) the aggregate principal amount of the Company’s indebtedness and (C) the aggregate notional value of the Company’s outstanding perpetual preferred stock, less (D) the Company’s most recently reported cash balance value. As with Bitcoin NAV, although mNAV incorporates the label “NAV,” it is not equivalent to “net asset value” or “NAV” or any similar metric in the traditional financial context. Additionally, it is not a measure of the amount by which the enterprise value exceeds net asset value in the traditional financial sense of those terms. Investors should rely on the financial statements and other disclosures contained in the Company’s SEC filings. This metric is merely a supplement, not a substitute, to the financial statements and other disclosures contained in the Company’s SEC filings. It should be used only by sophisticated investors who understand their limited purpose and many limitations. BTC Factor is the ratio of ending BPS to starting BPS in respect of any period.
Additional Information Strategy is not a registered money market fund under the Investment Company Act of 1940, as amended, is not subject to the same protections as a registered money market fund, and does not operate as registered money market fund. Among other things, unlike money market funds, we (i) do not price STRC Stock or other securities based on our net asset value, (ii) are not required to hold any assets to back the STRC Stock, (iii) are not required by regulation to maintain any particular pricing or stable value, and (iv) are not subject to the same liquidity requirements as money market funds. Investors in STRC will not receive the same investor protections as investors in registered money market funds. Strategy is not an exchange traded product (“ETP”) or an exchange-traded fund (“ETF”) registered under the Investment Company Act of 1940, as amended, is not subject to the same rules and regulations as an ETP or an ETF, and does not operate as an ETP or ETF. In particular, unlike spot bitcoin ETPs, we (i) do not seek for our shares of Class A common stock to track the value of the underlying bitcoin we hold before payment of expenses and liabilities, (ii) do not benefit from various exemptions and relief under the Securities Exchange Act of 1934, as amended, including Regulation M, and other securities laws, which enable spot bitcoin ETPs to continuously align the value of their shares to the price of the underlying bitcoin they hold through share creation and redemption, (iii) are a Delaware corporation rather than a statutory trust, and do not operate pursuant to a trust agreement that would require us to pursue one or more stated investment objectives, (iv) are subject to federal income tax at the entity level and the other risk factors applicable to an operating business, such as ours, and (v) are not required to provide daily transparency as to our bitcoin holdings or our daily NAV. This material has been prepared for informational purposes only, and is not intended to provide, and should not be relied on for, tax, legal or accounting advice. No representations are made regarding the tax consequences of any actions taken based on the information provided. Investors should consult their own tax, legal and accounting advisors for any such advice.
Additional Information (Cont’d) Market and Industry Data and Forecasts In this presentation, Strategy presents yield market and industry data and data. This information is based on third-party sources, which Strategy believes to be reliable, however, Strategy has not independently verified data from these sources and cannot guarantee their accuracy or completeness. Additionally, some data in this presentation is based on Strategy’s good faith estimates, which are derived from management’s knowledge of the industry, independent sources and assumptions. Similarly, Strategy believes our internal research is reliable, however, such research has not been verified by any independent sources. Strategy’s estimates involve a number of assumptions which are necessarily subject to risks and unyieldties and are subject to change based upon various factors, including those discussed in Strategy’s most recent Quarterly Report on Form 10-Q filed with the SEC on November 3, 2025 and Strategy’s Current Report on Form 8-K filed with the SEC on November 3, 2025. These and other factors could cause Strategy’s future performance, total addressable market and market expectations to differ materially from Strategy’s assumptions and estimates. Illustrative Information This presentation is provided as of the date hereof, does not purport to be all-inclusive or necessarily contain all information that may be of interest to the recipient, and is subject to change, amendment, update, completion, and review without notice. In particular, please note that any illustrative return or dividend information are, at this stage, preliminary estimates only and have not been verified, audited, or subjected to an independent accounting or auditing review. In particular, returns may vary depending on, amongst other factors, market conditions. Strategy expressly disclaims any obligations to update the information in this presentation to the fullest extent permitted by applicable law. Any illustrative information included in this presentation is provided solely for illustrative purposes to enhance the reader’s ability to assess our financial and business performance. Such illustrative information has not been verified, audited, or subject to an independent accounting or auditing review and is not indicative of historical, present, or future returns or outcomes. Any returns or outcomes may vary depending on, among other factors, market conditions. There can be no assurance that these illustrative results will result or be achieved, and actual results and outcomes may vary materially from these illustrative examples. A number of defined terms used in this presentation are defined in the Appendix to this presentation.
***
Exhibit B
Phong Le:
Hello, everyone. Thanks for joining for our Stream investor presentation. My name is Phong Le. I’m the President and CEO of Strategy, and I’m joined by our Executive Chairman, Michael Saylor.
I’ll quickly walk through the high-level term sheet for Stream. This is an SEC registered security priced at €100 per share of Stream.
This will be senior to two of our other preferreds (Strike, Stride) and MSTR common stock, and junior to our other two preferreds (Strife, Stretch) and our convertible debt.
Stream is perpetual and will pay at a dividend rate of 10% per annum.
There are other dividend stoppers, dividend deferability, liquidation preference details that you can see here.
We plan on offering this and listing it on the Euro MTF exchange in Luxembourg.
Let me start with an overview of the company. Strategy is the first and largest bitcoin treasury company in the world. We have 641,205 bitcoin, which is 3.1% of all bitcoin that will ever be in existence.
Our market cap is currently at around $77 billion, which makes us the 138th largest publicly listed company in the United States. And this year alone, we’ve launched four preferreds in the US - Strife, Strike, Stride, and Stretch. And our most recent one, Stretch (STRC), is the largest IPO so far in the US in 2025 at $2.5 billion. And year to date, we’ve raised nearly $20 billion of capital, and those proceeds have been used to buy bitcoin. And it’s about 88% of what we raised in 2024, and we have a couple months left to go this year.
Every single quarter since we launched our bitcoin treasury company strategy in Q3 2020, we bought bitcoin, 85 acquisitions total, and we intend to continue buying bitcoin into perpetuity.
Those bitcoin purchases have positioned us as the fifth largest treasury in the US, compared to companies like Nvidia, Amazon, Google, Microsoft and we expect that in about a year, we may be the second-largest corporate treasury in the US and our objective is in about five years to be the largest, larger than Berkshire Hathaway, larger than the Mag 7.
Our strategy has been very successful. Since the beginning of our bitcoin treasury company strategy, August 10th, 2020, we’ve seen 80% annualized return on MSTR, making us one of the top performing equities in the US. And more interestingly, our performance has outstripped that of bitcoin by nearly 2x, which [in turn] has been nearly 2x the performance of the Mag 7, which [in turn] has been nearly 2x the performance of S&P 500. As you look at the rest of the asset classes here, we’ve outperformed bonds by essentially infinity.
Our access to the capital markets has been quite robust. I had mentioned we’ve raised $19.8 billion so far this year. We raised $22.6 billion last year. What you’ll see last year, we were primarily focused on convertible debt as our primary leverage instrument. This year, we’ve decreased our reliance on convertible debt, and we really amplified our securities by investing in bitcoin through raising of capital through our preferreds, $6 billion so far. And that’s going to be [the] primary way that we raise capital on a go-forward basis.
So what are we? We’re bitcoin backed - we’re a company that issues bitcoin backed securities, right? And for those who want access to bitcoin with 50% return, 40-50% volatility, they can buy the underlying bitcoin.
What we’ve done with MSTR is through leverage and through amplification, created higher volatility and higher returns, 80% returns, 70% volatility, and that’s been very successful for us as you’ve seen, with the increase in our equity value. But what we found is some investors don’t want more volatility and more returns than bitcoin. They want access to bitcoin, but they want lower volatility, lower returns and better downside, risk.
And that’s why we launched the preferreds this year, four preferreds. The first one was Strike, which is about a billion dollars in market value at this point in time and 30% volatility, 9% [effective] yield. You’ll see we found instrument Stride, Strife, Stretch that have reduced the volatility profile and so similar to an oil refinery or an oil company that refines oil and creates products like kerosene, gasoline, jet fuel, asphalt, Lycra, spandex, Strategy refines bitcoin, and creates bitcoin-backed securities.
And what that’s done for us, is the preferreds that we’ve issued, because of their unique nature, because they’re backed by bitcoin, because they give access to bitcoin with different profiles, they’ve been extremely liquid and extremely accessible in the US market, trading on the Nasdaq. Right. You’ll see here that Strife, Strike, Stride trade on a daily basis, but anywhere between $13 million and $18 million a day. Stretch has been extremely successful and has traded about $72 million a day.
That’s 72x the average U.S. dollar listed preferred. And if you look at the average euro hybrid, it’s about that much more liquid too, 72x and that non-listed preferred in the US is significantly more liquid, 720x more liquid. And so, we expect that as Stream starts to trade in the European market on the Luxembourg [Euro MTF] exchange, our objective is to create similar liquidity profiles that we have in the US market.
If you look at our overall debt and preferred equity structure here, we have 6 convertible notes. As I mentioned, we’re reducing our reliance on these convertible notes as our primary mechanism to raise capital and we’ll start to see these start to mature and equitize over time. Four of them are already in the money, two should be in the money by the time they mature. And so our objective is to reduce our reliance on convertible debt over time, and we’ll increase our reliance here on our preferred equity, which you see. And we’ve, on a pro forma basis, included Stream in here, assuming a €350 million euro issuance.
Our capital structure is quite robust. We have $93 billion in enterprise value, $77 billion in market cap, and $71 billion in bitcoin asset value.
Today, we have about $8.2 billion of convertible debt, which means they’re about 1.1x levered on our convertible debt, and we have $7.1 billion of preferred debt. And we use the term amplification here because this isn’t really leveraged as you would traditionally think. There is a coupon or a dividend payment, but these are perpetual. These are unique in that they never come due. We don’t have to pay them back like we do a convertible note that might have a maturity of four, five, six years.
These never come due, and as a result, we use the term amplification. This is a hybrid. This is not traditional debt, and it looks more like equity. And with this amplification, we’re able to buy bitcoin, pay dividends over time, and ultimately increase Bitcoin Per Share and Bitcoin Yield to our shareholders.
And you’ll see here, there’s about $731 million of pro forma annual dividend interest.
Although that may sound like a large amount for some companies, for us, that’s covered 97 years with our Bitcoin Net Asset Value.
This shows the $731 million of dividend and interest payments. $570 million of that is from our four cumulative preferreds. And Stride, our most junior security, is non-cumulative and has fewer protections to the shareholder.
And so $125 million of those dividends are non-cumulative and can be suspended at any time. And you’ll see at the top of the structure $35 million in interest on our debt. We do intend to be able to pay the dividends on these preferreds. We don’t really intend to use a non-cumulative feature, but this gives you a sense of the seniority in our interest expense.
Another way to think of the $731 million, we get the question a lot, how much coverage do we have on the $731 million? How much at risk are we of not being able to pay the dividend and the interest? And we think it’s pretty low. If you think about $731 million as a percentage of the last 12 months of total capital we’ve raised, it’s less than 2%. And if you look at the last 12 months of equity we’ve raised, it’s less than 3%, and you look at it as the year-to-date 2025 operating income of the business, it’s less than 7%. And if we were to have to, (which we wouldn’t) raise all of the dividends and interest for the year in one day, that’s about 25% of our average daily trading volume.
One important feature of our preferreds because of the unique structure of our bitcoin treasury business is what we call ROC dividends, return of capital (“ROC”). The first four preferreds that we issued in the US have return of capital treatment, meaning, as a company, we produce negative earnings and profits (“E&P”) from a tax basis. And because it’s negative earnings and profits, this is return of capital, which means that the dividends are tax-deferred, until you sell the underlying security.
This is in contrast to qualified dividends, which have a tax rate of 20% to 35%, or interest income, what you might get from a bond or a money market or a bank account, which has 37% to 55% tax rates, when you add in the tax effect of both the federal taxes, state taxes, and local taxes. So we don’t expect for the foreseeable future, 10 years or more, to produce positive E&P. In fact, we’ll run our business to have negative E&P, which means that the ROC dividend guidance that we’re providing will be for greater than 10 years out, and a US investor can expect that the ROC dividends will continue for the foreseeable future for all of our preferreds, including this new one, Stream.
If you’re a European investor, we’re working with the local regulatory bodies to see if we can get similar treatment in Europe and it’s something that we think is important and we’ll pursue.
Those ROC dividends really result in a scalable, tax-efficient fixed income generator. Our bitcoin treasury model, which is unique to Strategy and unique to a company to capitalize on bitcoin, may be the most tax-efficient company in the world.
What does that mean? We issue digital equity and digital credit like Stream and like MSTR, and the proceeds from issuing that equity and credit is tax-deferred.
We can then purchase bitcoin, which sits on our balance sheet.
Any appreciation on that bitcoin, as long as we don’t sell our bitcoin, which we don’t intend to do, is tax-deferred.
And we’re able to pay dividends, ROC dividends on that credit, and that is also tax-deferred. So, we have a triple tax-deferred model.
So with that, I’m going to pass this over to our Executive Chairman, Michael Saylor, to tell you more about Stream.
Michael Saylor:
Thank you, Phong.
I’m delighted to introduce Stream to all of you today.
We are in the business of creating digital credit, and so Strategy could be thought of as a digital credit factory.
In essence, what we’re doing is accumulating a large pool of digital capital, bitcoin, and then we create credit instruments that create U.S. dollar yield, like Stretch and Strife and Stride and Strike, and the credit investors get those ROC dividends, so they’re tax-deferred dividends.
Now it’s a perpetual swap because our equity investors want BTC Yield. So, when we sell the credit, we invest it in bitcoin and we generate more Bitcoin Per Share. That’s what we call BTC Yield.
And as we hold that bitcoin, it appreciates in value and my long-term forecast over the next 20 years is approximately 30% per year ARR.
So, as it appreciates in value, it appreciates tax-deferred.
And the result is we generate tax-deferred earnings for the equity investors while we’re generating tax-deferred dividends for the credit investors.
That is the digital credit factory. Now Stream is the first digital credit instrument we’ve created for the European market. And whereas all of our other credit instruments generated USD yield, Stream is going to generate euro yield.
So what is it? STRE is a euro-denominated perpetual preferred security offering a fixed 10% dividend.
Now that’s very comparable to Strife (STRF), except instead of being $100 par value, it’s €100 par value.
Stream will come out of the gate with a 5.6x BTC Rating. That means for every one euro in Stream [that] we issue, we’ll have 5.6 Euros in collateral in the form of bitcoin.
It will be listed on the Luxembourg [Euro MTF] Stock Exchange. It will pay a quarterly cash dividend, and similar to Strife, it does have protections. If we were to miss a dividend, there is a penalty clause and step up provisions in the dividend rate. And so we’ve worked to create, in essence, a Euro version of STRF for European investors.
We’ve compared the two instruments here on, slide 23.
You can see we have about $1.2 billion of Strife outstanding. We’re targeting €350 million of Stream. Strife’s on the Nasdaq, Stream’s on the Euro MTF. They’re both fixed dividends.
That means that they may trade above par. Strife has traded above par so the price will fluctuate causing the effective yield to fluctuate each day.
They’re both cumulative preferreds.
They both have the escalating dividend protection feature.
The effective yield of Strife right now is 9.2% because it trades above par. The duration of both instruments is perpetual so if you’re looking for a 10% dividend yield forever perpetually, then Stream is a very interesting instrument.
Stream is going to be senior to Strike, senior to Stride, senior to the common stock. It will be junior to our debt instruments, Strife and Stretch.
Here you can see an illustrative pricing framework.
With Strife at $109 right now, that gets you to a 920 basis point effective yield. You can see that that really looks like 300 basis points of spread (that’s the US corporate high yield spread) and a 250 basis point incremental spread above the high yield rate in the US after accounting for the ten year US swap rate.
Now if you were to apply the same spreads in the Stream instrument, well, the European ten year swap rate is 260 basis points.
The Pan-European high yield spread is 280 basis points. So, tacking on 250 basis points of incremental spread implies that the parity value for Stream or the parity yield would be 7.9%.
That means that if Stream were to trade at parity with Strife, it would be a €127 versus a par value of €100.
If we discount it, (and it’s quite likely we will discount it for this deal because it’s an IPO and because Stream is junior to Strife), then you can see that at par value, for example, that represents a 21% discount, that would be a 210-basis point premium over the parity value.
Let’s take another look at that.
You can see the historic 10 year swap rates of the US dollar versus the euro. And, of course, for the most part over the past three years, the US swap rate has been higher than the European swap rate. It’s 366 basis points versus 264 basis points. So, there’s about a 1% difference.
And, of course, if we look at the swaps curve all the way from a 2 year duration to a 50 year duration, the story is that, consistently the US dollar swaps curve is just higher than the European swaps curve. You can see the difference between European high yield and US high yield, and you see that the illustrative Stream spread over the swaps rate is 530 basis points. So we think that Stream looks very attractive, you know, versus European high yield. That looks very attractive versus the European risk free rate as well.
Now we’ve done some other comps. Here, you can see the comparable ETFs in the European market and you can see, the effective yields for these ETFs are anywhere from 3.3% to 6.6%.
They’ve got expense ratios of 39 basis points to 50 basis points.
The US tax equivalent yield will be anywhere from 3.3% to 6.6%.
And, of course, Stream, it’s a 10% effective yield if it comes at par. And, of course, there’s no expenses. We don’t charge expense ratios for any of our credit instruments. And if you’re a US taxpayer with a 37% federal tax rate, the tax-equivalent yield for Stream would be 15.9%.
So it looks to be two times as good on an effective yield basis and perhaps three times as good or three to four times as good on a tax-equivalent yield basis versus other ETFs in the marketplace.
If we look at the broader credit indexes in Europe, the Pan-European aggregate is $19.6 trillion with 9,800 members. The effective yield is 3.1%. The maturity is 8 years.
And, of course, you can see all these effective yields. They’re 2% to 3% for the investment grade. For the high yield, they’re 5.3% to 5.7%.
Stream, of course, is going to be 10% effective yield and almost 16% US tax-equivalent yield. So again, two to three or two to four times more yield depending upon your tax situation.
And the other thing worth pointing out is the maturity. You know, a lot of times the maturity on high yield instruments is shorter, like four years. A lot of instruments are callable or refinanceable.
Stream isn’t callable by us, so it’s a 10.3-year effective maturity. So, if you’re a long duration credit investor, this is 10% effective yield for, you know, for the Macaulay duration of 10.3 years; it’s pretty compelling.
We’ll take a look at hybrids in the European market.
You can see a bunch of B-rated hybrids.
The liquidity of these instruments is a million euros a day. We expect Stream to be much more liquid. If it has the same liquidity profile as Strife, it’ll be five times more liquid.
The duration of those instruments is 3 to 5 years. Stream will be 10. The effective yield of those instruments is a 5% or a 6% handle, for the most part. Stream will be 10%. The tax equivalent yield of Stream, again, 15.9% for US equivalent taxpayer.
So we think that Stream represents a pretty compelling credit offering in the European high yield markets and, you know, it’s so compelling on a duration effective yield and tax-equivalent basis. I mean, the question really becomes, you know, what’s the catch? What’s the risk?
Well, here you’ve got one screen. You can see that Stream’s effect on a tax-equivalent basis is twice as good as the next best thing, private credit. And, you know, money markets in Europe are 1.5%.
And so Stream is going to be the digital credit instrument in Europe, and it should actually cause people to reset their expectations about what is a decent yield for a credit instrument.
In order to help you understand or assess the risk, we’ve included our credit model here in the presentation.
The thing about digital credit is you can do a digital credit risk assessment in real time. If you go to our website strategy.com, there’s a credit tab and in that credit tab, we have our capital structure and every 15 seconds, we feed in the current BTC price. We feed in the rolling BTC volatility, and we give you the ability to put in your own forecast for the next 10 years of volatility and your own forecast for the next 10 years of BTC ARR. How will it perform? So if we take a standard statistical model and we plug in a price of volatility forecast and an ARR forecast, we can arrive at a risk that you will be under collateralized at the end of the duration. And so we call that BTC Risk.
You can see here, if you assume bitcoin’s going up 0% forever, that’s 0% BTC ARR. You’re a skeptic. And if you think that bitcoin’s going to remain volatile (44% vol is the rolling yearly; it’s a rolling, 12-month volatility.) looking back, the average volatility of the last 12 months of bitcoin, and you plug in the current price about $110,000, well, you can see that the risk for these credit instruments and the preferred stack range from 26% to 35% that you’ll be under collateralized at the end of the duration.
You can extract a credit spread that offsets that risk, a fair credit spread that would be our BTC Credit number. And you can see that fair credit spread is anywhere from 270 basis points to 397 basis points.
Now we have plugged in the Market Credit Spread, and you can see the spread premium here. And, of course, even if you’re a skeptic, there’s a very large spread premium over the market credit spread for these instruments. So that’s the first interesting observation.
Now what happens if I assume that bitcoin will go up 10% a year? If you think bitcoin’s going to perform like the S&P index, well, you can see this entire credit model shifts dramatically, and now the risk, falls into the 8% to 12% level.
The credit spreads on the preferred instruments fall to 77 to 126 basis points. And, of course, the market credit spreads haven’t changed, but the spread premium gets to be pretty large.
And, of course, the final slide is what happens if bitcoin appreciates at 10% a year and the volatility continues on its downward trajectory? About five years ago, bitcoin vol was about 85%, and it fell from 85% to 75% to 65% to 55% to 45% over the past five years.
So as the asset class matures and the volatility decreases, you could imagine that on average over the next decade, it would be a 30 vol and a 10% ARR.
If you have that outlook, what you can see is that the risk becomes quite minor and all of these instruments look investment grade, right. You know, all the risk on the bonds go to effectively de minimis and then the risk on the preferreds go to anywhere from 4 to 13 basis point fair credit spreads. So the market right now misunderstands the actual credit risk involved with these instruments, and they’re fairly skeptical on bitcoin as collateral. So that means that the spread premiums are quite wide.
But if you are a credit investor and if you have a positive outlook toward bitcoin, you can see there’s an opportunity here because as bitcoin appreciates in price, the BTC Ratings will increase. As the bitcoin volatility decreases, the BTC Risk will decrease. And, of course, as bitcoin performs, then this asset class matures. So these are all very credit positive things for the asset class and digital credit in general. So with that, we’ve got a few more slides in the deck. They go over the definition of all of our KPIs, and they explain all of the metrics used in the presentation. So feel free to peruse that if you like.
I’ll just summarize with the big picture, which is we think that Stream is a pretty compelling digital credit instrument. It’s the first digital credit we’ve offered in the European market and you can see here, because we’re raising capital in perpetuity and investing it in bitcoin in perpetuity, we can pay higher effective yields, which are to the benefit of the credit investor, and we can [provide] those yields in a ROC dividend, which is to the benefit of the credit investor as well. So I appreciate your time and attention to this today, and, we’ll look forward to answering any questions you might have as you look further at our offering.