
CSC Confidential – Sensitive Information AGENDA CFO COMMENTARY AND FINANCIAL REVIEW THIRD QUARTER 2025 OCTOBER 30 , 2025 .2
This presentation does not constitute an offer or invitation for the sale or purchase of securities and has been prepared solely for informational purposes . This presentation contains forward - looking statements within the meaning of the federal securities laws regarding Columbia Sportswear Company’s business opportunities and anticipated results of operations . Forward - looking statements generally relate to future events or our future financial or operating performance . In some cases, you can identify forward - looking statements because they contain words such as “may,” “might,” “will,” “would,” “should,” “expect,” “plan,” “anticipate,” “could,” “intend,” “target,” “project,” “contemplate,” “believe,” “estimate,” “predict,” “likely,” “potential” or “continue” or the negative of these words or other similar terms or expressions that concern our expectations, strategy, plans or intentions . Unless the context indicates otherwise, the terms "we," "us," "our," "the Company," and "Columbia" refer to Columbia Sportswear Company, together with its wholly owned subsidiaries and entities in which it maintains a controlling financial interest . The Company's expectations, beliefs and projections are expressed in good faith and are believed to have a reasonable basis ; however, each forward - looking statement involves a number of risks and uncertainties, including those set forth in this document, those described in the Company's Annual Report on Form 10 - K and Quarterly Reports on Form 10 - Q under the heading "Risk Factors," and those that have been or may be described in other reports filed by the Company, including reports on Form 8 - K. Potential risks and uncertainties that may affect our future revenues, earnings and performance and could cause the actual results of operations or financial condition of the Company to differ materially from the anticipated results expressed or implied by forward - looking statements in this document include : loss of key customer accounts ; our ability to execute the ACCELERATE Growth Strategy ; our ability to execute and realize costs savings related to our Profit Improvement Plan ; our ability to effectively execute our business strategies, including initiatives to upgrade our business processes and information technology (“IT”) systems and investments in our DTC businesses ; our ability to maintain the strength and security of our IT systems ; the effects of unseasonable weather, including global climate change ; the seasonality of our business and timing of orders ; trends affecting consumer spending, including changes in the level of consumer spending, and retail traffic patterns ; unfavorable economic conditions generally ; the financial health of our customers and retailer consolidation ; higher than expected rates of order cancellations ; changes affecting consumer demand and preferences and fashion trends ; changes in international, federal or state tax, labor and other laws and regulations that affect our business, including changes in corporate tax rates, tariffs, international trade policy and geopolitical tensions, or increasing wage rates ; our ability to attract and retain key personnel ; risks inherent in doing business in foreign markets, including fluctuations in currency exchange rates, global credit market conditions, changes in global regulation and economic and political conditions and disease outbreaks ; volatility in global production and transportation costs and capacity and timing ; our ability to effectively manage our inventory and our wholesale customers' to manage their inventories ; our dependence on third - party manufacturers and suppliers and our ability to source at competitive prices from them or at all ; the effectiveness of our sales and marketing efforts ; business disruptions and acts of terrorism, cyber - attacks or military activities around the globe ; intense competition in the industry ; our ability to establish and protect our intellectual property ; and our ability to develop innovative products . The Company cautions that forward - looking statements are inherently less reliable than historical information . New risks and uncertainties emerge from time to time and it is not possible for the Company to predict all risks and uncertainties that could have an impact on the forward - looking statements contained in this presentation . Nothing in this presentation should be regarded as a representation by any person that the forward - looking statements set forth herein will be achieved or that any of the contemplated results of such forward - looking statements will be achieved . You should not place undue reliance on forward - looking statements, which speak only as of the date they are made . We do not undertake any duty to update any of the forward - looking statements after the date of this document to conform the forward - looking statements to actual results or to changes in our expectations . FORWARD - LOOKING STATEMENTS
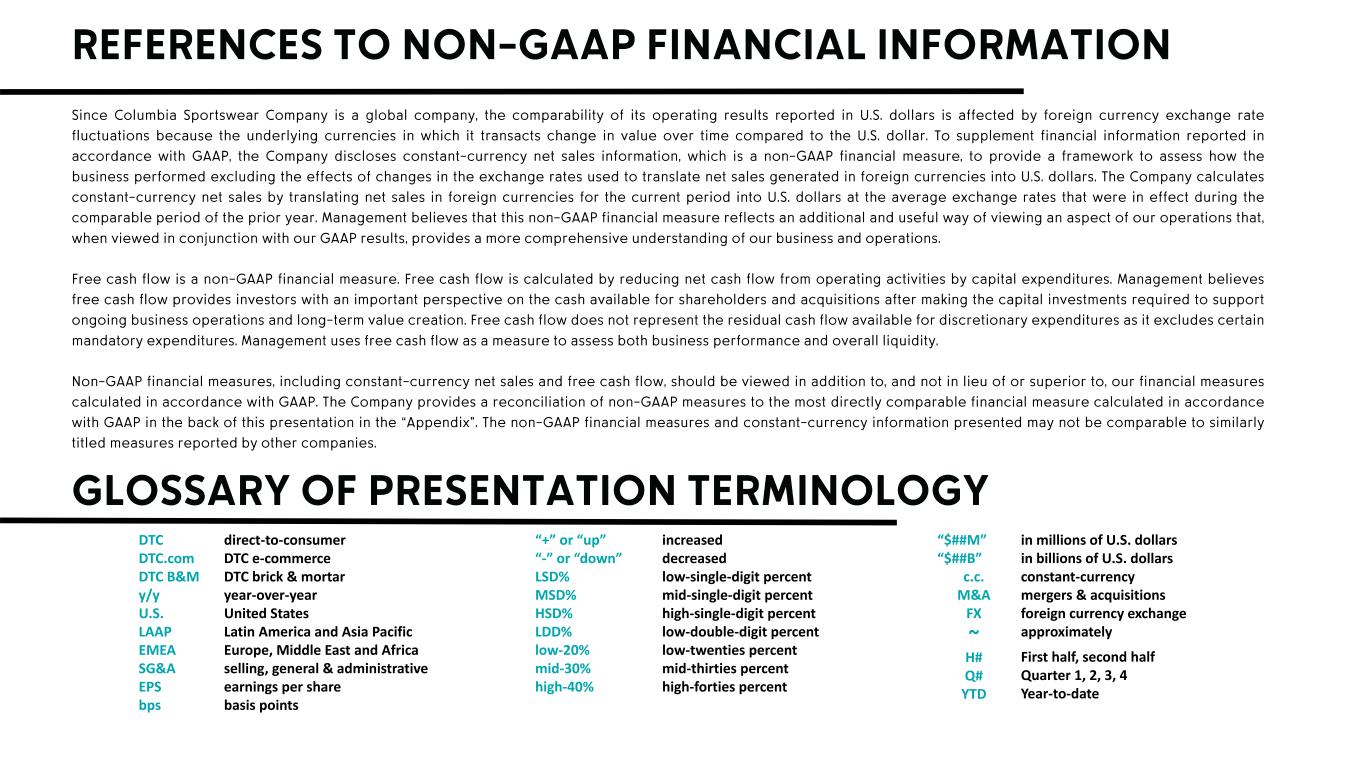
Since Columbia Sportswear Company is a global company, the comparability of its operating results reported in U.S. dollars is affected by foreign currency exchange rate fluctuations because the underlying currencies in which it transacts change in value over time compared to the U.S. dollar . To supplement financial information reported in accordance with GAAP, the Company discloses constant - currency net sales information, which is a non - GAAP financial measure, to provide a framework to assess how the business performed excluding the effects of changes in the exchange rates used to translate net sales generated in foreign currencies into U.S. dollars . The Company calculates constant - currency net sales by translating net sales in foreign currencies for the current period into U.S. dollars at the average exchange rates that were in effect during the comparable period of the prior year . Management believes that this non - GAAP financial measure reflects an additional and useful way of viewing an aspect of our operations that, when viewed in conjunction with our GAAP results, provides a more comprehensive understanding of our business and operations . Free cash flow is a non - GAAP financial measure . Free cash flow is calculated by reducing net cash flow from operating activities by capital expenditures . Management believes free cash flow provides investors with an important perspective on the cash available for shareholders and acquisitions after making the capital investments required to support ongoing business operations and long - term value creation . Free cash flow does not represent the residual cash flow available for discretionary expenditures as it excludes certain mandatory expenditures . Management uses free cash flow as a measure to assess both business performance and overall liquidity . Non - GAAP financial measures, including constant - currency net sales and free cash flow, should be viewed in addition to, and not in lieu of or superior to, our financial measures calculated in accordance with GAAP . The Company provides a reconciliation of non - GAAP measures to the most directly comparable financial measure calculated in accordance with GAAP in the back of this presentation in the “Appendix” . The non - GAAP financial measures and constant - currency information presented may not be comparable to similarly titled measures reported by other companies . REFERENCES TO NON - GAAP FINANCIAL INFORMATION GLOSSARY OF PRESENTATION TERMINOLOGY DTC DTC.com DTC B&M y/y U.S. LAAP EMEA SG&A EPS bps direct-to-consumer DTC e-commerce DTC brick & mortar year-over-year United States Latin America and Asia Pacific Europe, Middle East and Africa selling, general & administrative earnings per share basis points “+” or “up” “-” or “down” LSD% MSD% HSD% LDD% low-20% mid-30% high-40% increased decreased low-single-digit percent mid-single-digit percent high-single-digit percent low-double-digit percent low-twenties percent mid-thirties percent high-forties percent “$##M” “$##B” c.c. M&A FX ~ H# Q# YTD in millions of U.S. dollars in billions of U.S. dollars constant-currency mergers & acquisitions foreign currency exchange approximately First half, second half Quarter 1, 2, 3, 4 Year-to-date

ACCELERATE PROFITABLE GROWTH CREATE ICONIC PRODUCTS Differentiated, Functional, Innovative DRIVE BRAND ENGAGEMENT Increased, Focused Demand Creation Investments ENHANCE CONSUMER EXPERIENCES Invest in Capabilities to Delight and Retain Consumers AMPLIFY MARKETPLACE EXCELLENCE Digitally - Led, Omni - Channel, Global EMPOWER TALENT THAT IS DRIVEN BY OUR CORE VALUES Through a Diverse and Inclusive Workforce W E C O N N E C T A C T I V E P E O P L E W I T H T H E I R P A S S I O N S

CAPITAL ALLOCATION PRIORITIES DEPENDENT UPON OUR FINANCIAL POSITION, MARKET CONDITIONS AND OUR STRATEGIC PRIORITIES, OUR CAPITAL ALLOCATION APPROACH INCLUDES: INVEST IN ORGANIC GROWTH OPPORTUNITIES RETURN AT LEAST 40% OF FREE CASH FLOW TO SHAREHOLDERS OPPORTUNISTIC M&A TO DRIVE LONG - TERM PROFITABLE GROWTH THROUGH DIVIDENDS AND SHARE REPURCHASES OUR GOAL IS TO MAINTAIN OUR STRONG BALANCE SHEET AND DISCIPLINED APPROACH TO CAPITAL ALLOCATION .

CSC Confidential – Sensitive Information Q3’25 FINANCIAL OVERVIEW Q 3 ’25 FINANCIAL RESULTS COMPARED TO Q 3 ’24 Q 3 ’25 Highlights : • Net sales increase reflected strength in most of our international markets, partially offset by underlying weakness in the U.S. • Compared to July 2025 guidance, net sales upside was driven by earlier shipments of Fall ’25 wholesale orders . • Operating margin contraction primarily reflected impairment charges related to prAna and Mountain Hardwear, incremental tariffs, and SG&A expense deleverage . • Exited the quarter with $236 .0M of cash, cash equivalents and short - term investments, and no borrowings . • Inventory was flat y/y in dollar terms and down 5% y/y in units .
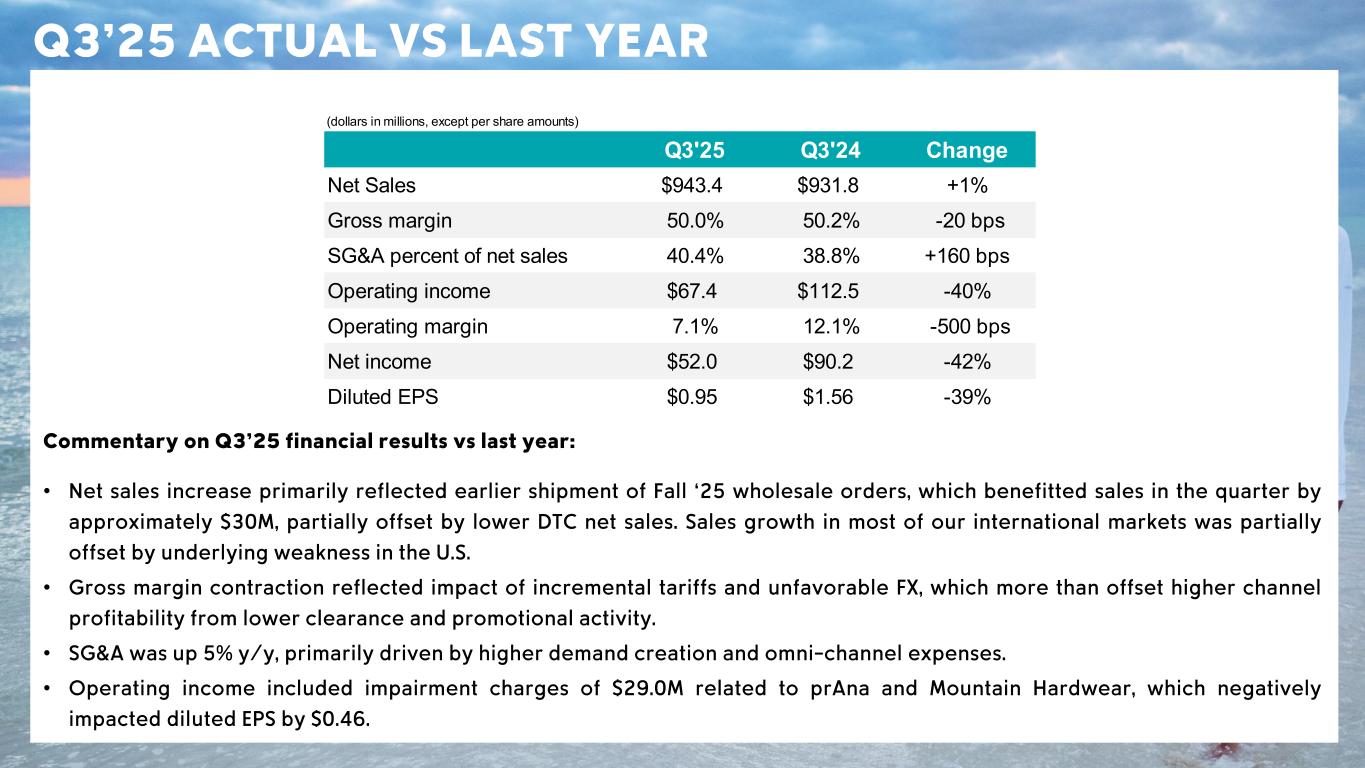
CSC Confidential – Sensitive Information Q3’25 ACTUAL VS LAST YEAR Commentary on Q 3 ’25 financial results vs last year : • Net sales increase primarily reflected earlier shipment of Fall ‘25 wholesale orders, which benefitted sales in the quarter by approximately $30 M, partially offset by lower DTC net sales . Sales growth in most of our international markets was partially offset by underlying weakness in the U.S. • Gross margin contraction reflected impact of incremental tariffs and unfavorable FX, which more than offset higher channel profitability from lower clearance and promotional activity . • SG&A was up 5% y/y, primarily driven by higher demand creation and omni - channel expenses . • Operating income included impairment charges of $29 .0M related to prAna and Mountain Hardwear, which negatively impacted diluted EPS by $0.46 . (dollars in millions, except per share amounts) Q3'25 Q3'24 Change Net Sales $943.4 $931.8 +1% Gross margin 50.0% 50.2% -20 bps SG&A percent of net sales 40.4% 38.8% +160 bps Operating income $67.4 $112.5 -40% Operating margin 7.1% 12.1% -500 bps Net income $52.0 $90.2 -42% Diluted EPS $0.95 $1.56 -39%
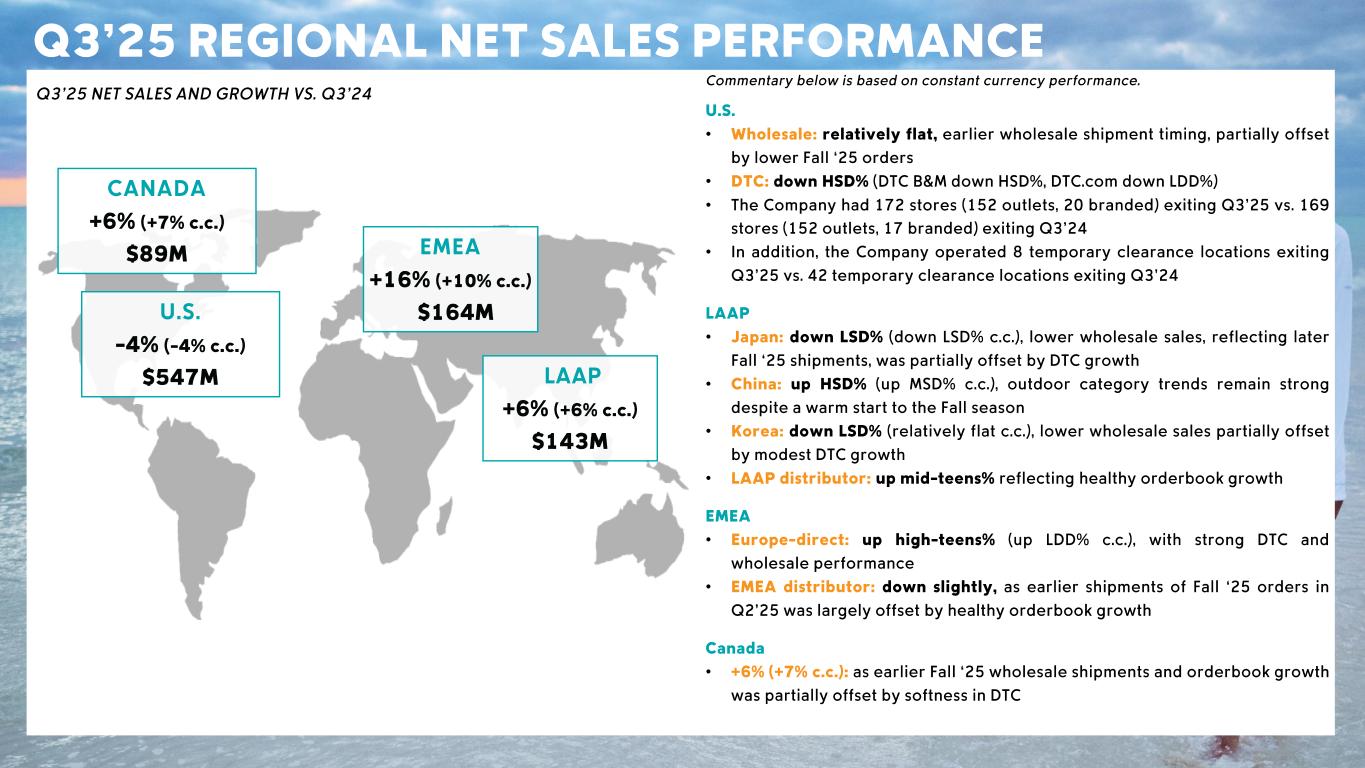
CSC Confidential – Sensitive Information Q3’25 REGIONAL NET SALES PERFORMANCE Commentary below is based on constant currency performance . U.S. • Wholesale : relatively flat, earlier wholesale shipment timing, partially offset by lower Fall ‘25 orders • DTC : down HSD % (DTC B&M down HSD %, DTC .com down LDD %) • The Company had 172 stores (152 outlets, 20 branded) exiting Q 3 ’25 vs . 169 stores (152 outlets, 17 branded) exiting Q 3 ’24 • In addition, the Company operated 8 temporary clearance locations exiting Q 3 ’25 vs . 42 temporary clearance locations exiting Q 3 ’24 LAAP • Japan : down LSD % (down LSD % c .c .), lower wholesale sales, reflecting later Fall ‘25 shipments, was partially offset by DTC growth • China : up HSD % (up MSD% c .c .), outdoor category trends remain strong despite a warm start to the Fall season • Korea : down LSD % (relatively flat c .c .), lower wholesale sales partially offset by modest DTC growth • LAAP distributor : up mid - teens % reflecting healthy orderbook growth EMEA • Europe - direct : up high - teens % (up LDD % c .c .), with strong DTC and wholesale performance • EMEA distributor : down slightly, as earlier shipments of Fall ‘25 orders in Q 2 ’25 was largely offset by healthy orderbook growth Canada • +6 % (+7 % c .c .): as earlier Fall ‘25 wholesale shipments and orderbook growth was partially offset by softness in DTC Q 3 ’25 NET SALES AND GROWTH VS . Q 3 ’24 CANADA +6% (+7% c.c.) $89M U.S. - 4% (- 4% c.c.) $547M EMEA +16 % (+10 % c.c.) $164M LAAP +6% (+6% c.c.) $143M
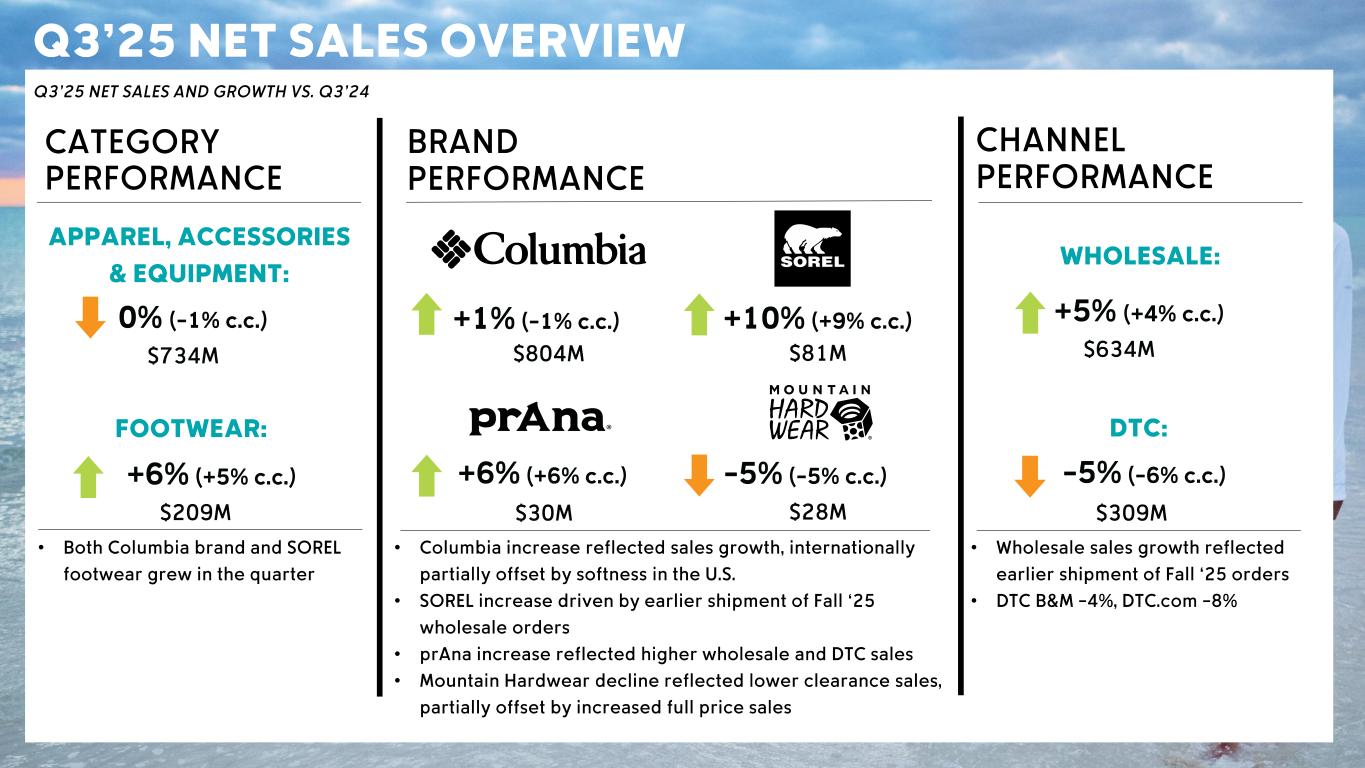
CSC Confidential – Sensitive Information Q3’25 NET SALES OVERVIEW Q 3 ’25 NET SALES AND GROWTH VS . Q 3 ’24 CATEGORY PERFORMANCE CHANNEL PERFORMANCE WHOLESALE: DTC: - 5 % (- 6 % c.c .) $63 4M $309 M +5 % (+4 % c.c .) • Both Columbia brand and SOREL footwear grew in the quarter • Columbia increase reflected sales growth, internationally partially offset by softness in the U.S. • SOREL increase driven by earlier shipment of Fall ‘25 wholesale orders • prAna increase reflected higher wholesale and DTC sales • Mountain Hardwear decline reflected lower clearance sales, partially offset by increased full price sales • Wholesale sales growth reflected earlier shipment of Fall ‘25 orders • DTC B&M - 4%, DTC.com - 8% APPAREL, ACCESSORIES & EQUIPMENT: $734M 0 % (- 1 % c.c .) FOOTWEAR: +6 % (+5 % c.c .) $209 M BRAND PERFORMANCE +1 % (- 1 % c.c .) $804M +10 % (+9 % c.c .) $81 M +6 % (+6 % c.c .) $30M - 5 % (- 5 % c.c .) $28M
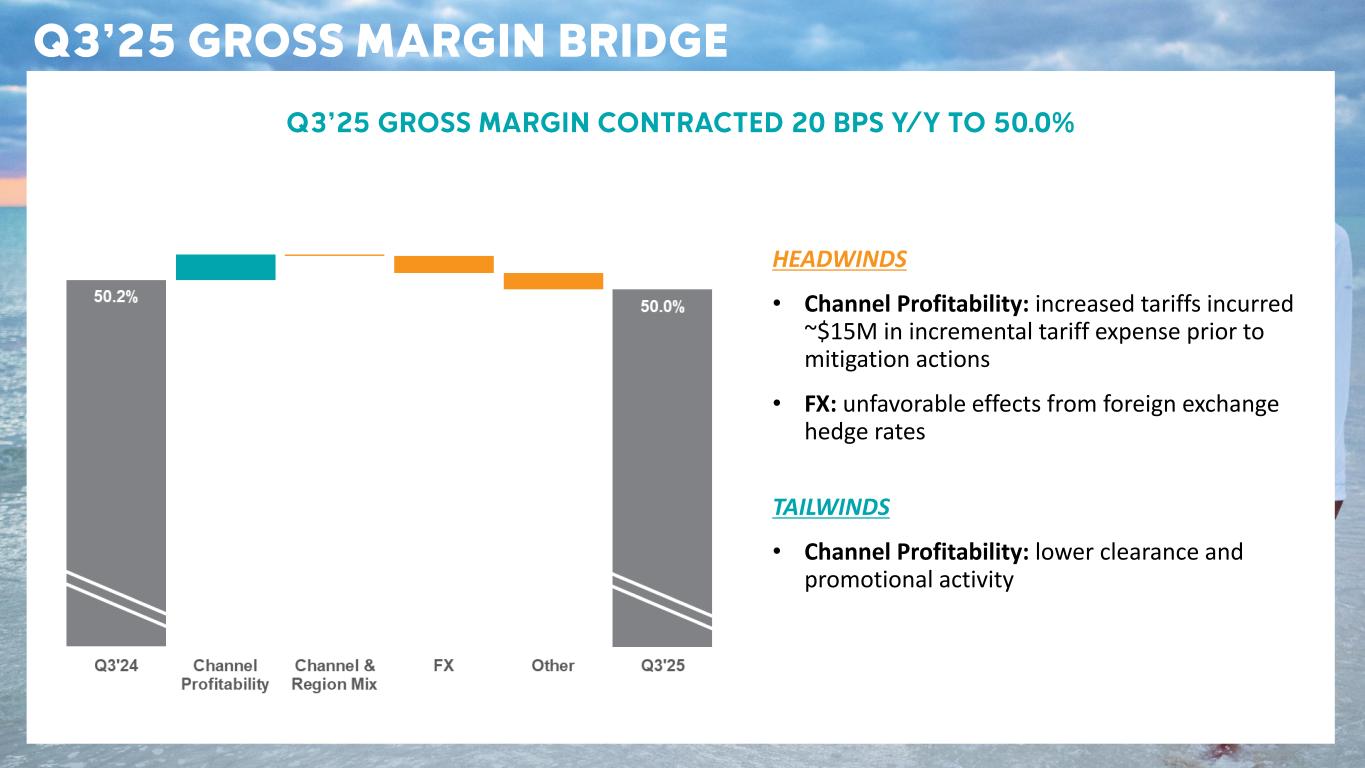
CSC Confidential – Sensitive Information Q3’25 GROSS MARGIN BRIDGE HEADWINDS • Channel Profitability: increased tariffs incurred ~$15M in incremental tariff expense prior to mitigation actions • FX: unfavorable effects from foreign exchange hedge rates TAILWINDS • Channel Profitability: lower clearance and promotional activity Q3’25 GROSS MARGIN CONTRACTED 20 BPS Y/Y TO 50.0%
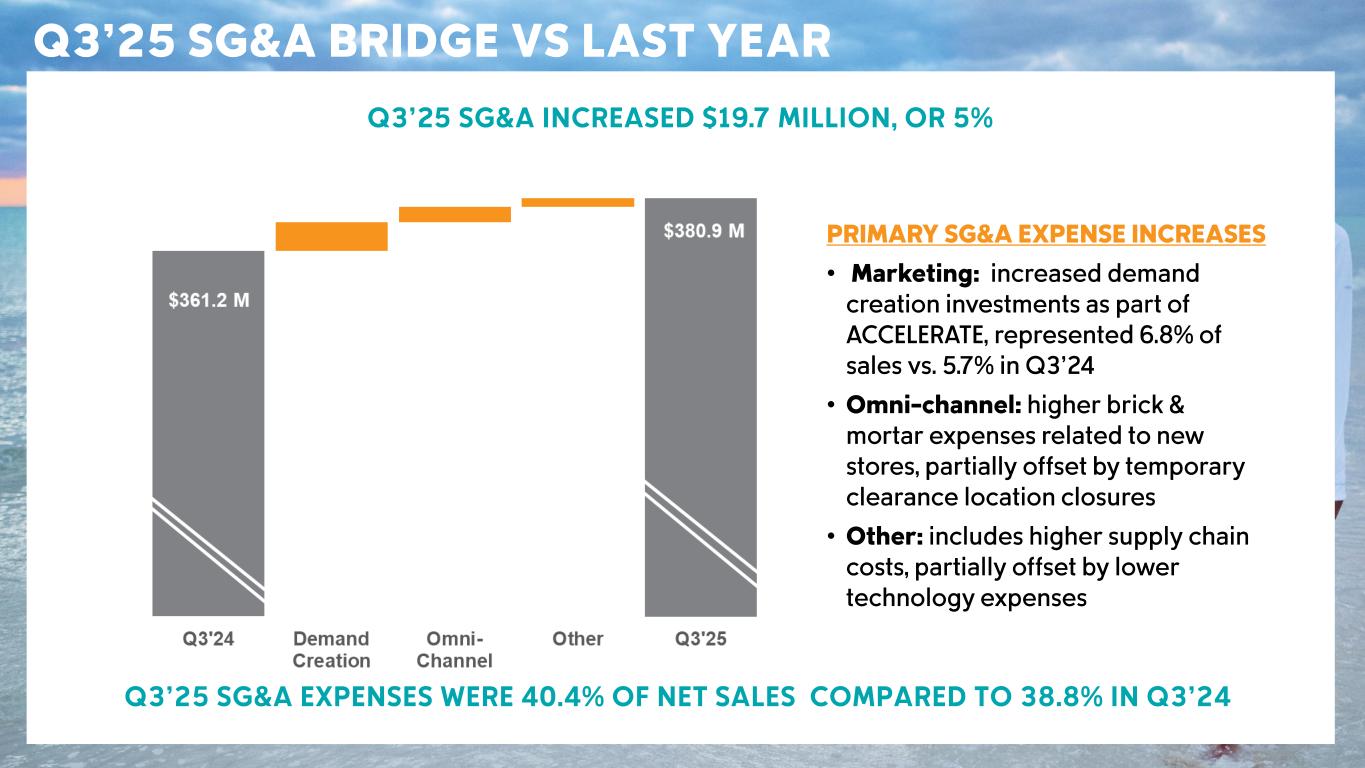
CSC Confidential – Sensitive Information Q3’25 SG&A BRIDGE VS LAST YEAR * Excludes Retail ; **Excludes Advertising Q3’25 SG&A INCREASED $19.7 MILLION, OR 5% PRIMARY SG&A EXPENSE INCREASES • Marketing: increased demand creation investments as part of ACCELERATE, represented 6.8% of sales vs. 5.7% in Q3’24 • Omni - channel: higher brick & mortar expenses related to new stores, partially offset by temporary clearance location closures • Other: includes higher supply chain costs, partially offset by lower technology expenses Q3’25 SG&A EXPENSES WERE 40.4% OF NET SALES COMPARED TO 38.8% IN Q3’24
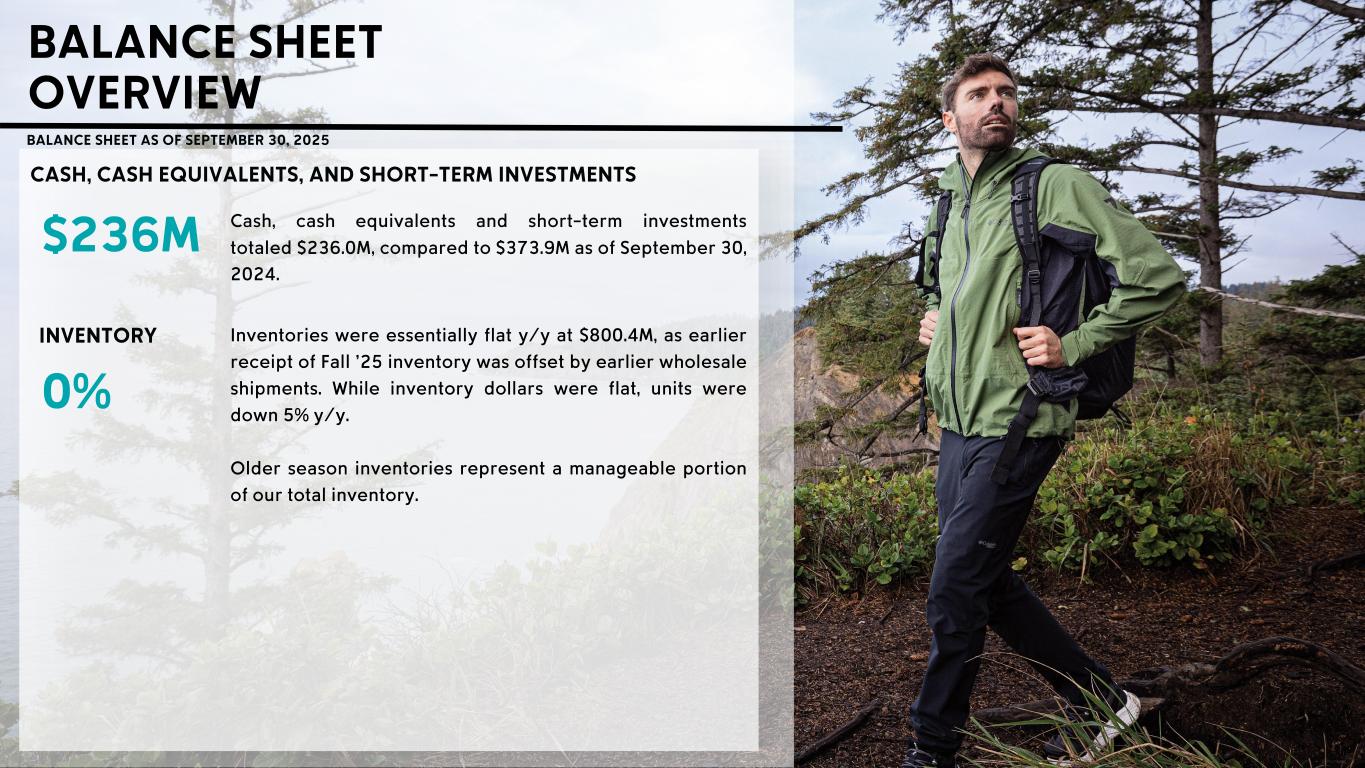
BALANCE SHEET OVERVIEW Cash, cash equivalents and short - term investments totaled $236 .0M, compared to $373 .9M as of September 30 , 2024 . $236 M 0% BALANCE SHEET AS OF SEPTEMBER 30 , 2025 INVENTORY CASH, CASH EQUIVALENTS, AND SHORT - TERM INVESTMENTS Inventories were essentially flat y/y at $800 .4M, as earlier receipt of Fall ’25 inventory was offset by earlier wholesale shipments . While inventory dollars were flat, units were down 5% y/y . Older season inventories represent a manageable portion of our total inventory .
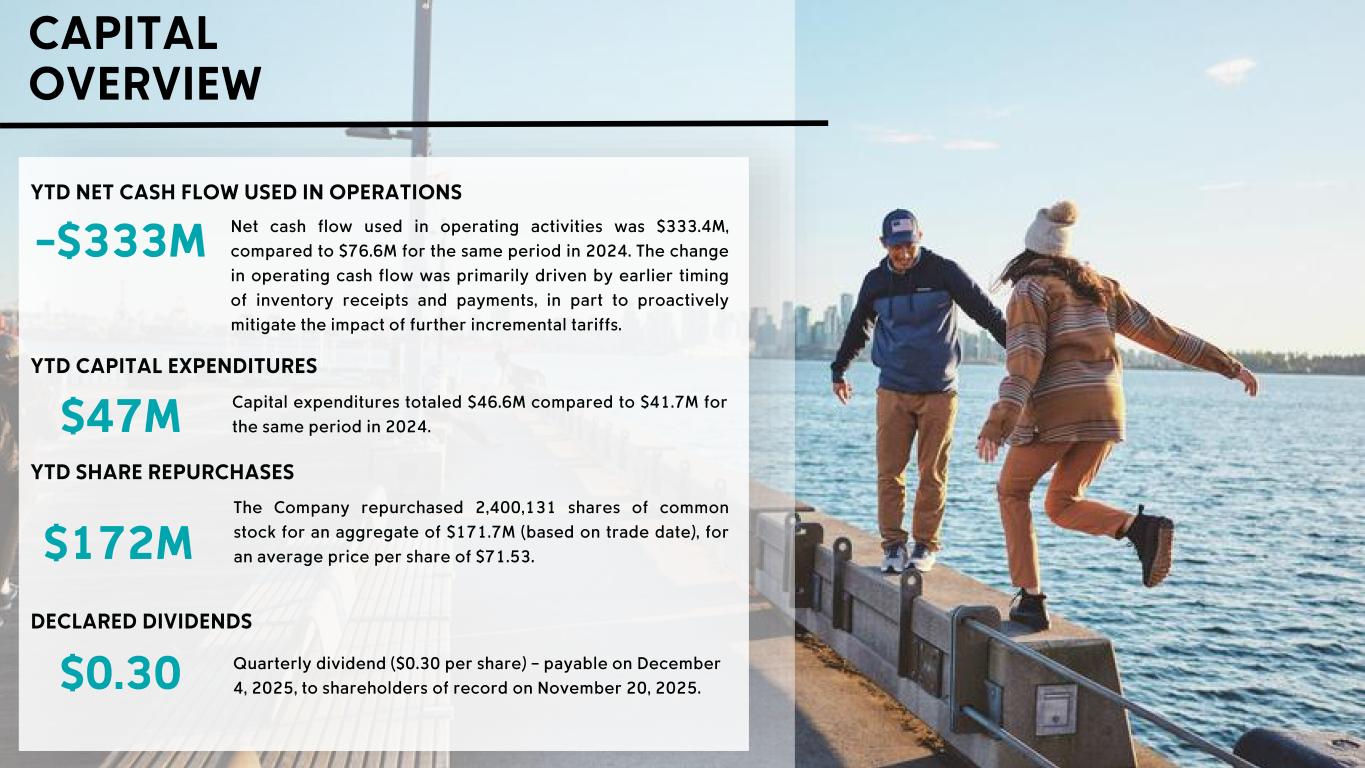
CAPITAL OVERVIEW - $333M Net cash flow used in operating activities was $333 .4M, compared to $76 .6M for the same period in 2024 . The change in operating cash flow was primarily driven by earlier timing of inventory receipts and payments, in part to proactively mitigate the impact of further incremental tariffs . Capital expenditures totaled $46 .6M compared to $41 .7M for the same period in 2024 . $1 72M The Company repurchased 2 ,400 ,131 shares of common stock for an aggregate of $171 .7M (based on trade date), for an average price per share of $71 .53 . YTD SHARE REPURCHASES YTD CAPITAL EXPENDITURES YTD NET CASH FLOW USED IN OPERATIONS $0.30 Quarterly dividend ($0.30 per share) – payable on December 4, 2025, to shareholders of record on November 20, 2025. DECLARED DIVIDENDS $47M
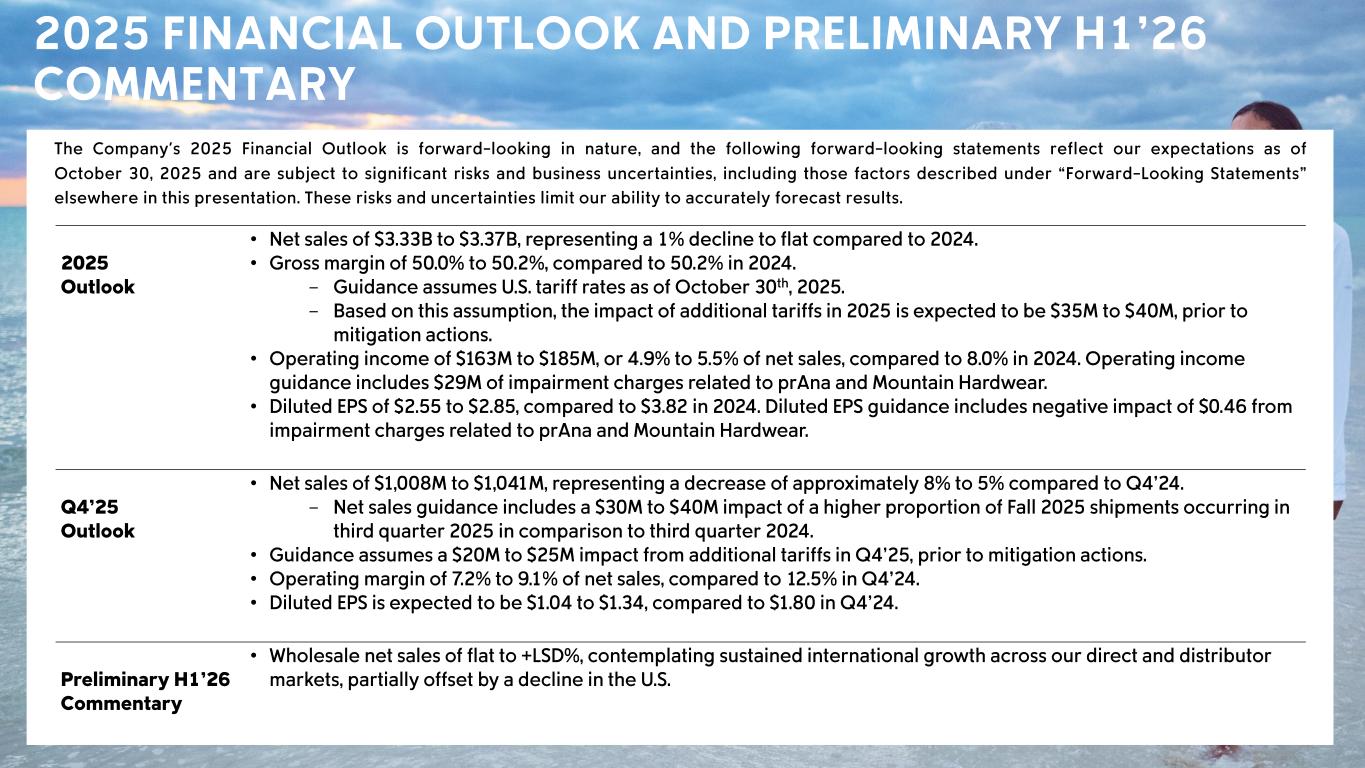
CSC Confidential – Sensitive Information 2025 FINANCIAL OUTLOOK AND PRELIMINARY H1’26 COMMENTARY The Company's 2025 Financial Outlook is forward - looking in nature, and the following forward - looking statements reflect our expectations as of October 30 , 2025 and are subject to significant risks and business uncertain ties, including those factors described under “Forward - Looking Statements” elsewhere in this presentation . These risks and uncertainties limit our ability to accurately forecast results . 2025 Outlook • Net sales of $3.33B to $3.37B, representing a 1% decline to flat compared to 2024. • Gross margin of 50.0% to 50.2%, compared to 50.2% in 2024. - Guidance assumes U.S. tariff rates as of October 30 th, 2025 . - Based on this assumption, the impact of additional tariffs in 2025 is expected to be $35M to $40M, prior to mitigation actions. • Operating income of $163M to $185M, or 4.9% to 5.5% of net sales, compared to 8.0% in 2024. Operating income guidance includes $29M of impairment charges related to prAna and Mountain Hardwear. • Diluted EPS of $2.55 to $2.85, compared to $3.82 in 2024. Diluted EPS guidance includes negative impact of $0.46 from impairment charges related to prAna and Mountain Hardwear. Q4’25 Outlook • Net sales of $1,008M to $1,041M, representing a decrease of approximately 8% to 5% compared to Q4’24. - Net sales guidance includes a $30M to $40M impact of a higher proportion of Fall 2025 shipments occurring in third quarter 2025 in comparison to third quarter 2024. • Guidance assumes a $20M to $25M impact from additional tariffs in Q4’25, prior to mitigation actions. • Operating margin of 7.2% to 9.1% of net sales, compared to 12.5% in Q4’24. • Diluted EPS is expected to be $1.04 to $1.34, compared to $1.80 in Q4’24. Preliminary H1’26 Commentary • Wholesale net sales of flat to +LSD%, contemplating sustained international growth across our direct and distributor markets, partially offset by a decline in the U.S.
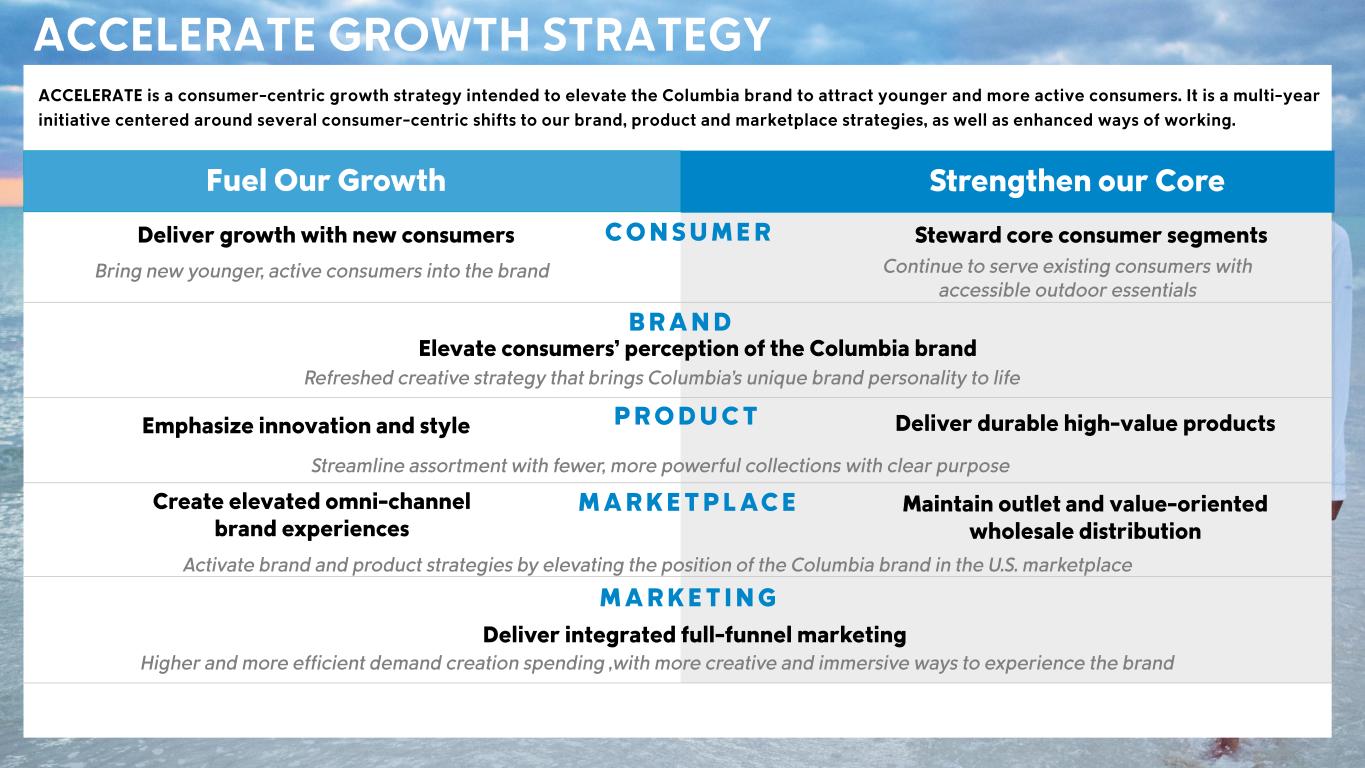
CSC Confidential – Sensitive Information ACCELERATE GROWTH STRATEGY MARKETPLACECreate elevated omni - channel brand experiences Maintain outlet and value - oriented wholesale distribution Activate brand and product strategies by elevating the position of the Columbia brand in the U.S. m arketplace PRODUCTEmphasize innovation and style Deliver durable high - value products Streamline assortment with fewer, more powerful collections with clear purpose BRAND CONSUMER Fuel Our Growth Strengthen our Core Elevate consumers’ perception of the Columbia brand Refreshed creative strategy that brings Columbia’s unique brand personality to life Deliver growth with new consumers Bring new younger, active consumers into the brand Steward core consumer segments Continue to serve existing consumers with accessible outdoor essentials MARKETING Deliver integrated full - funnel marketing Higher and more efficient demand creation spending ,with more creative and immersive ways to experience the brand ACCELERATE is a consumer - centric growth strategy intended to elevate the Columbia brand to attract younger and more active consumers . It is a multi - year initiative centered around several consumer - centric shifts to our brand, product and marketplace strategies, as well as enhanced ways of working .
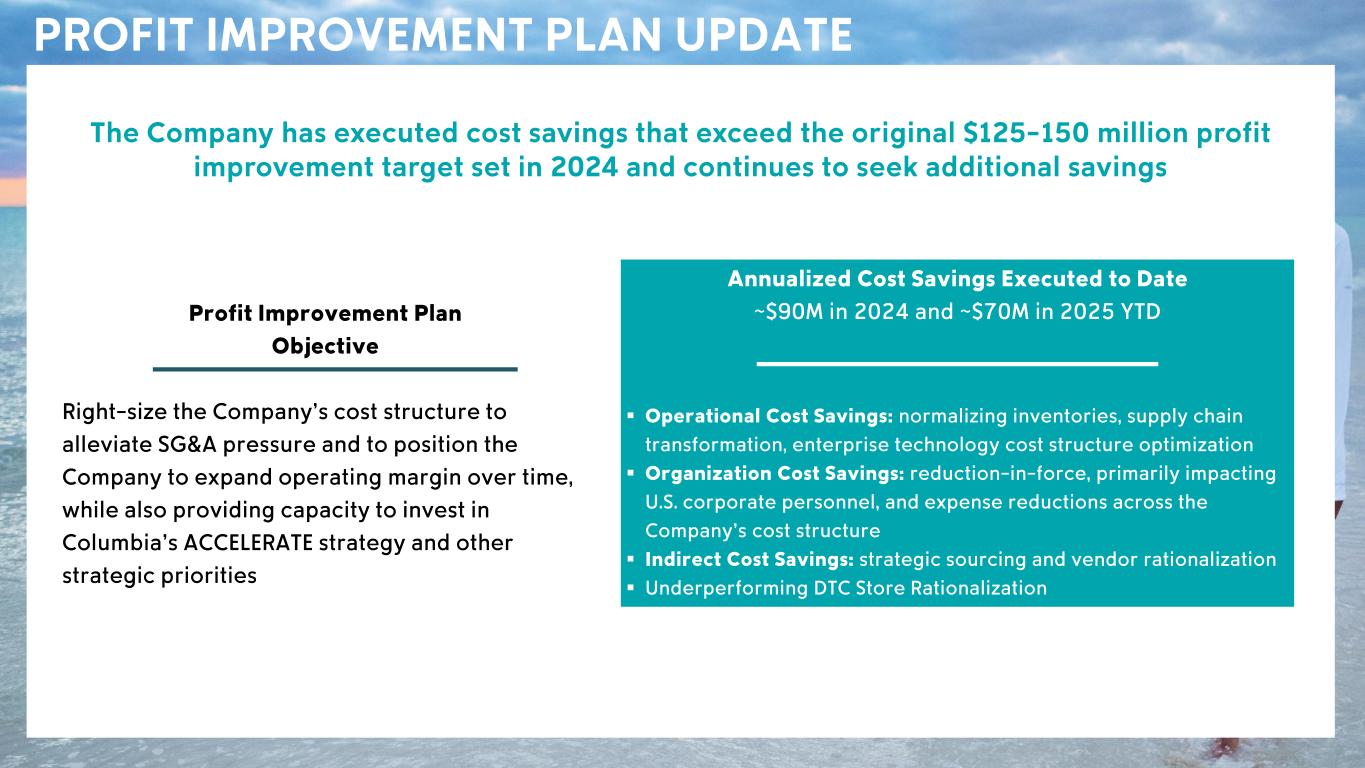
CSC Confidential – Sensitive Information PROFIT IMPROVEMENT PLAN UPDATE The Company has executed cost savings that exceed the original $125 - 150 million profit improvement target set in 2024 and continues to seek additional savings Annualized Cost Savings Executed to Date ~$90M in 2024 and ~$70M in 2025 YTD ▪ Operational Cost Savings: normalizing inventories, supply chain transformation, enterprise technology cost structure optimization ▪ Organization Cost Savings: reduction - in- force, primarily impacting U.S. corporate personnel, and expense reductions across the Company’s cost structure ▪ Indirect Cost Savings: strategic sourcing and vendor rationalization ▪ Underperforming DTC Store Rationalization Profit Improvement Plan Objective Right - size the Company’s cost structure to alleviate SG&A pressure and to position the Company to expand operating margin over time, while also providing capacity to invest in Columbia’s ACCELERATE strategy and other strategic priorities

APPENDIX
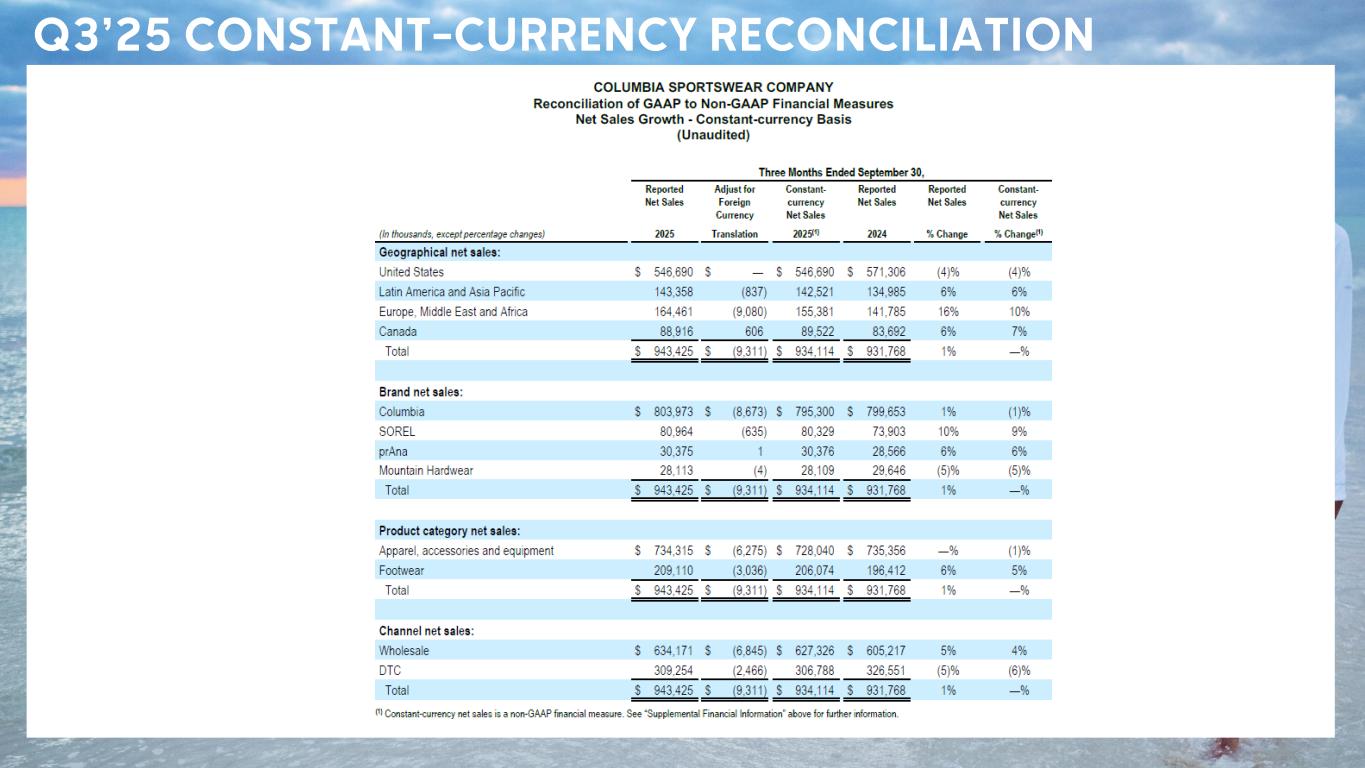
CSC Confidential – Sensitive Information Q3’25 CONSTANT - CURRENCY RECONCILIATION
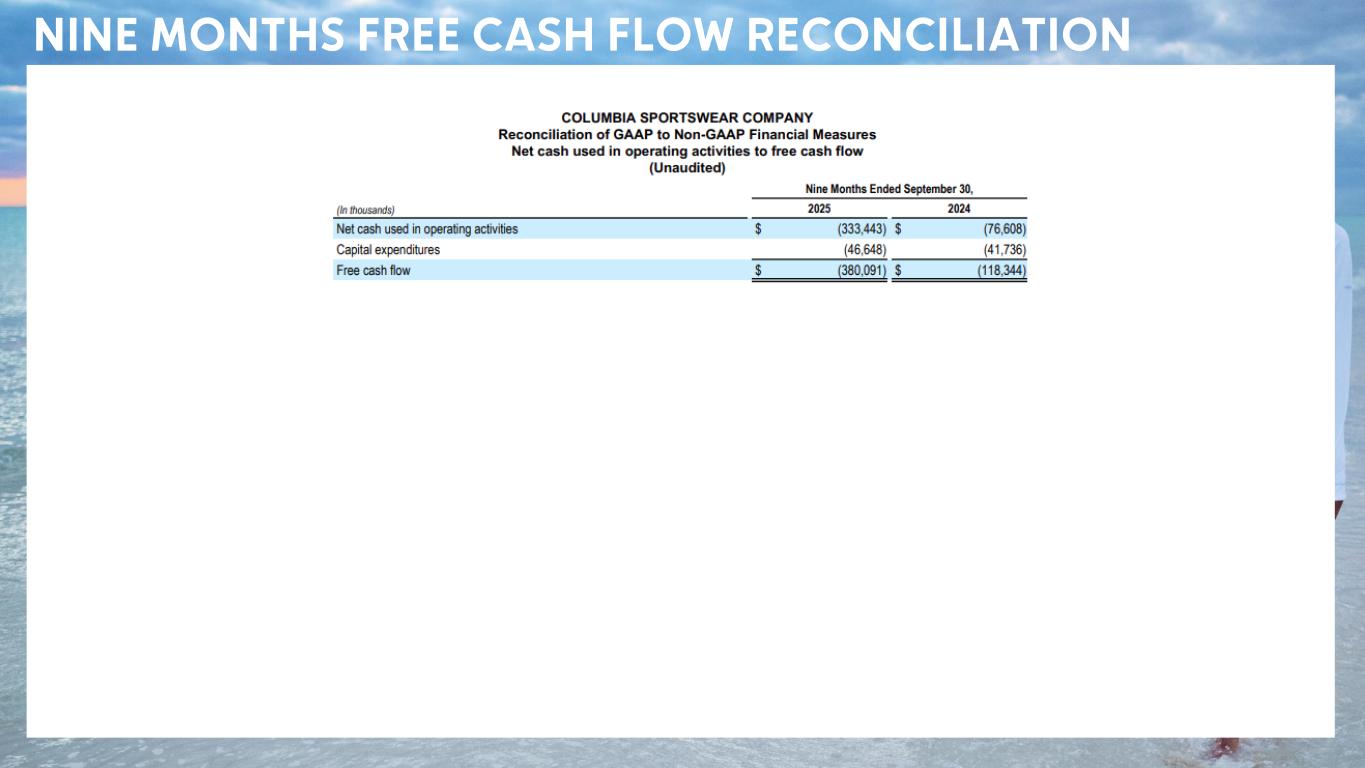
CSC Confidential – Sensitive Information NINE MONTHS FREE CASH FLOW RECONCILIATION
