Cautionary Language Regarding Forward-Looking Statements
This supplemental information package ("Supplement") contains forward-looking statements and information that are based on our management's current expectations as of the date of this Supplement. Statements that are not historical facts are hereby identified as forward-looking statements. Words such as "Outlook," "guide," "forecast," "estimate," "anticipate," "project," "plan," "intend," "believe," "expect," "likely," "predicted," "positioned," and any variations of these words and similar expressions are intended to identify such forward looking statements. Such statements include plans, projections and estimates regarding (1) demand for data and our towers, (2) cash flow growth (including from discontinued operations), (3) our Outlook for full year 2026, including Free Cash Flow from Discontinued Operations, (4) our business model, strategy and strategic position, and the value thereof, (5) revenues from tenant contracts, (6) expenses from existing ground leases, (7) growth of the U.S. market for towers ownership, (8) levels of commitments under our debt instruments, (9) the impact of Sprint Cancellations and DISH Terminations to our operating and financial results, (10) results from the Fiber Business, and (11) closing of the Fiber Strategic Transaction (as defined below).
Such forward-looking statements are subject to certain risks, uncertainties and assumptions, including, but not limited to, prevailing market conditions. Should one or more of these or other risks or uncertainties materialize, or should underlying assumptions prove incorrect, actual results may vary materially from those expected. Crown Castle assumes no obligation to update publicly any forward-looking statements, whether as a result of new information, future events or otherwise. More information about potential risk factors which could affect our results is included in our filings with the Securities and Exchange Commission ("SEC"). Our filings with the SEC are available through the SEC website at www.sec.gov or through our investor relations website at investor.crowncastle.com. We use our investor relations website to disclose information about us that may be deemed to be material. We encourage investors, the media and others interested in us to visit our investor relations website from time to time to review up-to-date information or to sign up for e-mail alerts to be notified when new or updated information is posted on the site.
This Supplement contains certain figures, projections and calculations based in part on management's underlying assumptions. Management believes these assumptions are reasonable; however, other reasonable assumptions could provide differing outputs.
The components of forward looking financial information presented herein may not sum due to rounding. In addition, the sum of quarterly historical information presented herein may not agree to year to date historical information provided herein due to rounding. Throughout this document, percentage calculations, which are based on non-rounded dollar values, may not be able to be recalculated using the dollar values included in this document due to the rounding of those dollar values.
Definitions and reconciliations of non-GAAP financial measures, information regarding segment measures and other information are provided in the Appendix to this Supplement.
As used herein, the term "including" and any variation thereof, means "including without limitation." The use of the word "or" herein is not exclusive.
2
Crown Castle Inc.
Fourth Quarter 2025
COMPANY OVERVIEW
OUTLOOK
FINANCIAL
HIGHLIGHTS
CAPITALIZATION OVERVIEW
APPENDIX
COMPANY PROFILE
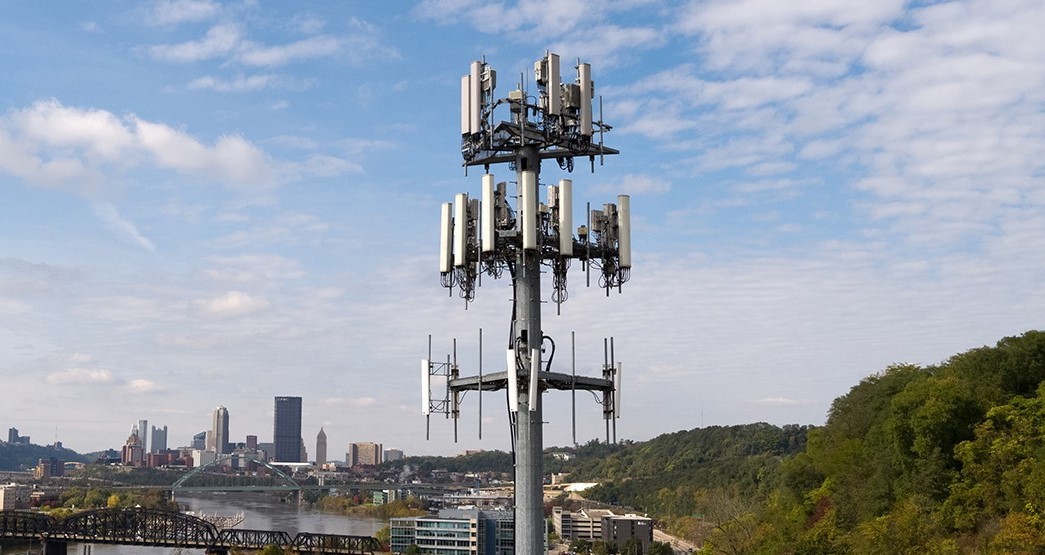
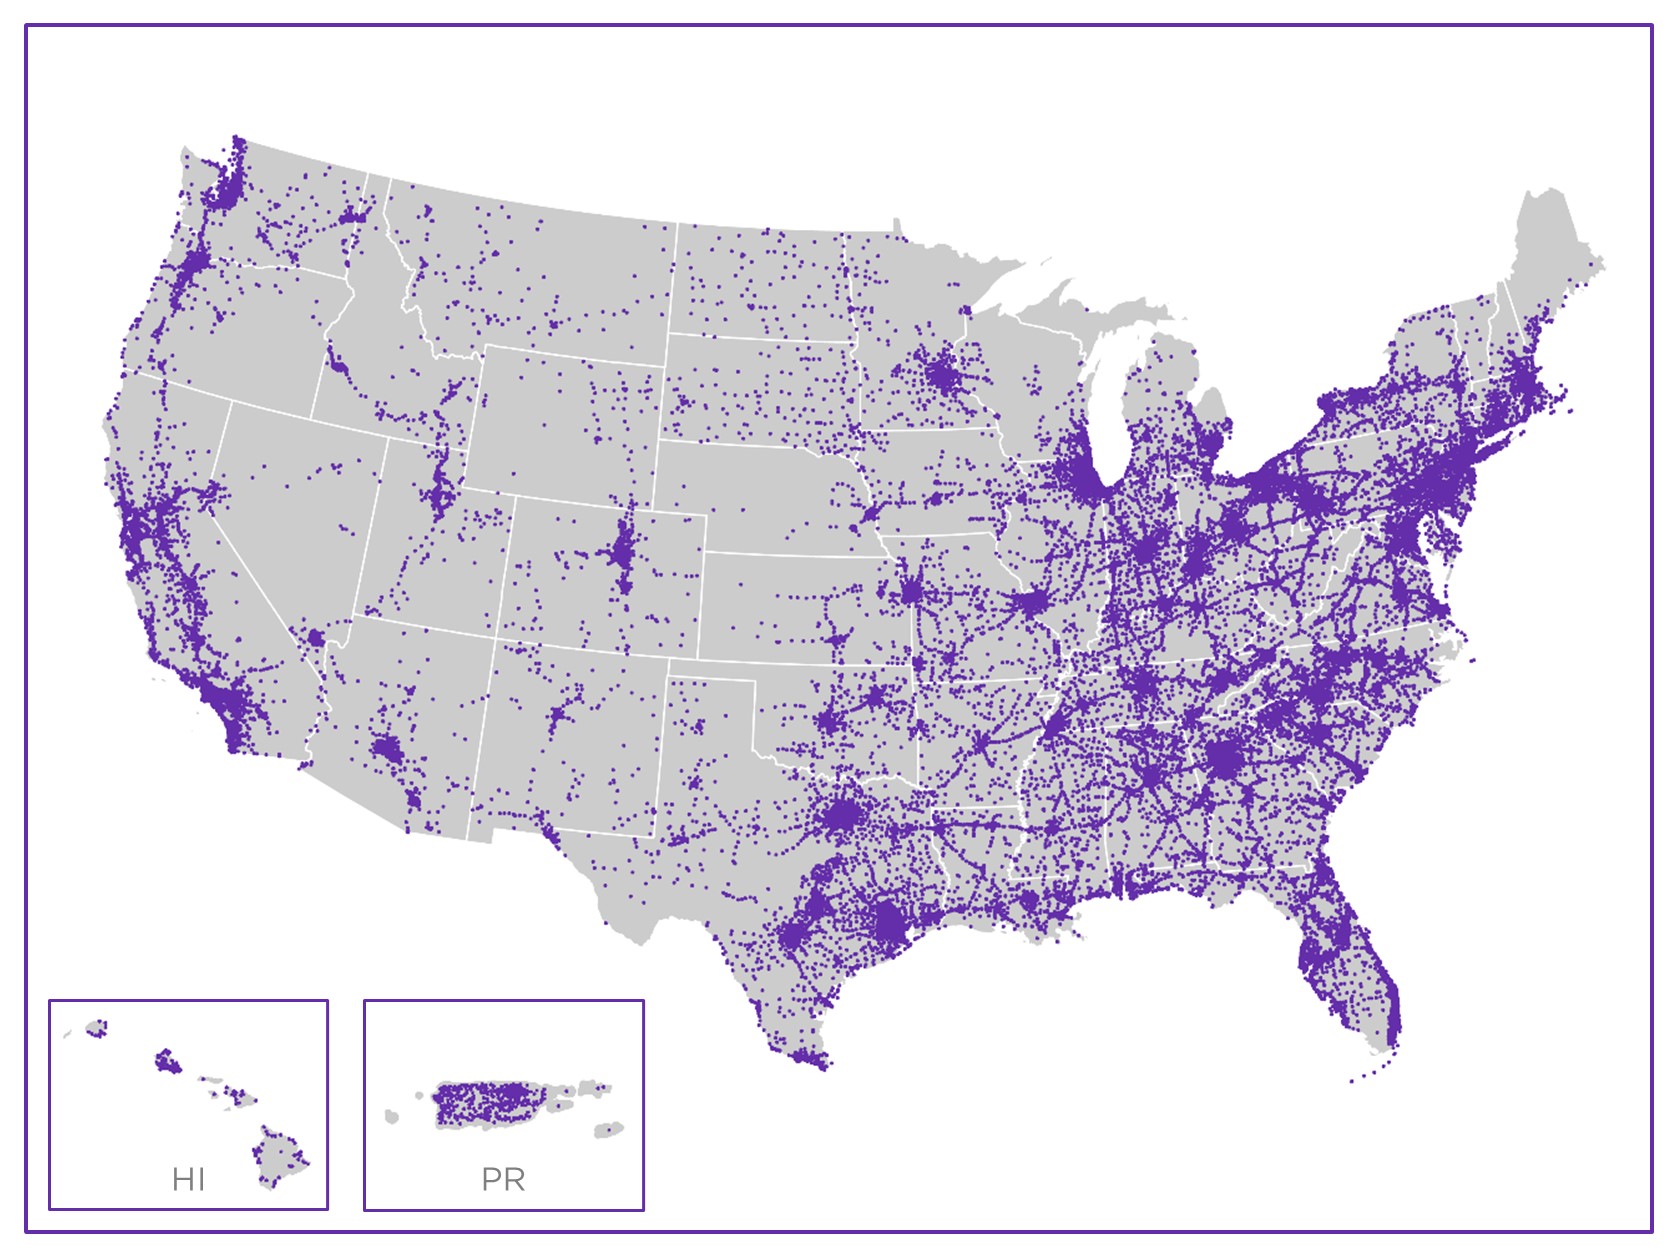
Crown Castle Inc. (to which the terms "Crown Castle," "CCI," "we," "our," "the Company" or "us" as used herein refer) owns, operates and leases shared communications infrastructure that is geographically dispersed throughout the U.S., including (1) approximately 40,000 towers and other structures, such as rooftops (collectively, "towers"), (2) approximately 105,000 small cells on air or under contract and (3) approximately 90,000 route miles of fiber primarily supporting small cells and fiber solutions. We refer to our towers, small cells and fiber assets collectively as "communications infrastructure," and to our customers on our communications infrastructure as "tenants." We provide access, including space or capacity, to our communications infrastructure via long-term contracts in various forms, including lease, license, sublease and service agreements (collectively, "tenant contracts").
Our towers have a significant presence in each of the top 100 basic trading areas, and the majority of our small cells and fiber assets are located in major metropolitan areas, including a presence in most U.S. markets. We seek to increase our site rental revenues by adding more tenants to our existing towers, which we expect to result in significant incremental cash flows due to our low incremental operating costs.
On March 13, 2025, management signed a definitive agreement ("Strategic Fiber Agreement") to sell our small cells and fiber solutions businesses, together with certain supporting assets and personnel ("Fiber Business"), with Zayo Group Holdings Inc. ("Zayo") acquiring the fiber solutions business and EQT Active Core Infrastructure fund ("EQT") acquiring the small cells business ("Strategic Fiber Transaction"). Under the Strategic Fiber Agreement, we will receive $8.5 billion in aggregate, subject to certain closing adjustments. Pending the closing of the Strategic Fiber Transaction, we will continue to operate the Fiber Business in accordance with the Strategic Fiber Agreement.
The results and net assets of the Fiber Business are presented within the financial statements as discontinued operations, with comparable prior periods recast to reflect this change. Following the classification of the Fiber Business as discontinued operations, the Company has one reportable segment that constitutes consolidated results consisting of its towers operations. Unless otherwise noted and other than net income (loss) and net income (loss) per share, all activities and amounts reported below relate to the continuing operations of the Company and exclude activities and amounts related to discontinued operations.
We operate as a Real Estate Investment Trust ("REIT") for U.S. federal income tax purposes.
STRATEGY
As a leading provider of towers in the U.S., our strategy is to create long-term stockholder value via a combination of (1) growing cash flows generated from our existing portfolio of towers, (2) returning a meaningful portion of our cash generated by operating activities to our common stockholders in the form of dividends and share repurchases and (3) investing capital efficiently to grow cash flows. Our strategy is based, in part, on our belief that the U.S. is the most attractive market in the world for towers. We measure our efforts to create "long-term stockholder value" by the combined payments of dividends to stockholders and growth in our per-share results. The key elements of our strategy are to:
•Grow cash flows from our existing towers. We are focused on maximizing the recurring site rental cash flows generated from providing our tenants with long-term access to our towers, which we believe is the core driver of value for our stockholders. Tenant additions or modifications of existing tenant equipment (collectively, "tenant additions") enable our tenants to expand coverage and capacity in order to meet increasing demand for data while generating high incremental returns for our business. We believe our towers provide an efficient and cost-effective solution for our wireless tenants' growing networks that provides an opportunity to generate cash flows and increase stockholder return.
•Return cash generated by operating activities to stockholders in the form of dividends and share repurchases. We believe that distributing a meaningful portion of our cash generated by operating activities appropriately provides stockholders with increased certainty for a portion of expected long-term stockholder value while still allowing us to retain sufficient flexibility to invest in our business and deliver growth. We believe this decision reflects the translation of the high-quality, long-term contractual cash flows of our business into stable capital returns to stockholders.
•Invest capital efficiently to grow cash flows. In addition to adding tenants to our existing towers, we seek to invest our available capital, including the net cash generated by our operating activities and external financing sources, in a manner that will increase long-term stockholder value. These investments include acquisition of land interests, making improvements and structural enhancements to our existing towers, and constructing and acquiring new towers that we expect will generate future cash flow growth and attractive long-term returns by adding tenants to those assets over time.
Our strategy to create long-term stockholder value is based on our belief that there will be considerable future demand for our towers based on the location of our assets and the rapid and continuing growth in the demand for data. We believe that such demand for our towers will continue, will result in growth of our cash flows due to tenant additions on our existing towers, and will create other growth opportunities for us, such as demand for newly constructed or acquired towers, as described above. Further, we seek to augment the long-term value creation associated with growing our recurring site rental cash flows by offering certain ancillary site development services.
3
Crown Castle Inc.
Fourth Quarter 2025
COMPANY OVERVIEW
OUTLOOK
FINANCIAL
HIGHLIGHTS
CAPITALIZATION OVERVIEW
APPENDIX
GENERAL COMPANY INFORMATION
Principal executive offices
8020 Katy Freeway, Houston, TX 77024
Common shares trading symbol
CCI
Stock exchange listing
New York Stock Exchange
Fiscal year ending date
December 31
Fitch - Long-term Issuer Default Rating
BBB+
Moody’s - Long-term Corporate Family Rating
Baa3
Standard & Poor’s - Long-term Local Issuer Credit Rating
BBB
Note: These credit ratings may not reflect the potential risks relating to the structure or trading of the Company’s securities and are provided solely for informational purposes. Credit ratings are not recommendations to buy, sell or hold any security, and may be revised or withdrawn at any time by the issuing organization in its sole discretion. The Company does not undertake any obligation to maintain the ratings or to advise of any change in the ratings. Each agency’s rating should be evaluated independently of any other agency’s rating. An explanation of the significances of the ratings can be obtained from each of the ratings agencies.
TOWER ASSET PORTFOLIO FOOTPRINT
HISTORICAL COMMON STOCK DATA
Three Months Ended
(in millions, except per share amounts)
12/31/24
3/31/25
6/30/25
9/30/25
12/31/25
High price(a)
$
112.14
$
103.85
$
105.66
$
113.18
$
99.35
Low price(a)
$
84.52
$
80.05
$
88.02
$
89.17
$
84.21
Period end closing price(b)
$
86.31
$
100.78
$
100.40
$
95.36
$
88.87
Dividends paid per common share
$
1.57
$
1.57
$
1.06
$
1.06
$
1.06
Volume weighted average price for the period(a)
$
96.68
$
90.59
$
97.91
$
98.81
$
91.00
Common shares outstanding, at period end
435
435
435
435
435
Market value of outstanding common shares, at period end(c)
$
37,514
$
43,884
$
43,721
$
41,529
$
38,702
(a)Based on the sales price, adjusted for common stock dividends, as reported by Bloomberg.
(b)Based on the period end closing price, adjusted for common stock dividends, as reported by Bloomberg.
(c)Calculated as the product of (1) common shares outstanding, at period end and (2) period end closing price, adjusted for common stock dividends, as reported by Bloomberg.
4
Crown Castle Inc.
Fourth Quarter 2025
COMPANY OVERVIEW
OUTLOOK
FINANCIAL
HIGHLIGHTS
CAPITALIZATION OVERVIEW
APPENDIX
EXECUTIVE MANAGEMENT TEAM
Name
Position
Age
Years with Company
Christian H. Hillabrant
President and Chief Executive Officer
60
<1
Sunit Patel
Executive Vice President and Chief Financial Officer
64
<1
Catherine Piche
Executive Vice President and Chief Operating Officer - Towers
55
13(a)
Christopher D. Levendos
Executive Vice President and Chief Operating Officer - Fiber
58
7
Edward B. Adams, Jr.
Executive Vice President and General Counsel
57
9
Daniel K. Schlanger
Executive Vice President and Chief Transformation Officer
52
9
BOARD OF DIRECTORS
Name
Position
Committees
Age
Years as Director
P. Robert Bartolo
Chair
Nominating and Governance, Finance, Fiber Review
54
11
Jason Genrich
Director
Finance, Fiber Review
38
2
Andrea J. Goldsmith
Director
Compensation and Human Capital
61
7
Christian H. Hillabrant
Director
60
<1
Tammy K. Jones
Director
Audit, Nominating and Governance, Finance
60
5
Kevin T. Kabat
Director
Compensation and Human Capital, Nominating and Governance
68
2
Anthony J. Melone
Director
Audit, Nominating and Governance, Fiber Review
65
10
Katherine Motlagh
Director
Audit, Compensation and Human Capital, Finance
51
<1
Kevin A. Stephens
Director
Audit, Compensation and Human Capital, Fiber Review
64
5
Matthew Thornton III
Director
Audit, Compensation and Human Capital, Nominating and Governance
67
5
RESEARCH COVERAGE
Equity Research
Bank of America
Michael Funk
(646) 855-5664
Barclays Brendan Lynch (212) 526-9428
BMO Capital Markets Ari Klein (212) 885-4103
Citigroup Michael Rollins (212) 816-1116
Goldman Sachs
Jim Schneider
(212) 357-2929
Green Street David Guarino (949) 640-8780
HSBC
Luigi Minerva
(207) 991-6928
Jefferies Jonathan Petersen (212) 284-1705
JMP Securities
Greg Miller
(212) 699-2917
JPMorgan
Richard Choe
(212) 622-6708
KeyBanc Brandon Nispel (503) 821-3871
MoffettNathanson Nick Del Deo (212) 519-0025
Morgan Stanley
Benjamin Swinburne
(212) 761-7527
New Street Research Jonathan Chaplin (212) 921-9876
Raymond James Ric Prentiss (727) 567-2567
RBC Capital Markets Jonathan Atkin (415) 633-8589
Scotiabank
Maher Yaghi
(437) 995-5548
TD Cowen
Michael Elias
(646) 562-1358
UBS Batya Levi (212) 713-8824
Wells Fargo Eric Luebchow (312) 630-2386
Wolfe Research Andrew Rosivach (646) 582-9350
Rating Agencies
Fitch
Jeff Danforth
(312) 368-5447
Moody’s
Ranjini Venkatesan
(212) 553-3828
Standard & Poor’s
Allyn Arden
(212) 438-7832
(a)Includes credit for prior service with the Company prior to Ms. Piche's reappointment as Executive Vice President and Chief Operating Officer - Towers of the Company effective October 28, 2024.
5
Crown Castle Inc.
Fourth Quarter 2025
COMPANY OVERVIEW
OUTLOOK
FINANCIAL
HIGHLIGHTS
CAPITALIZATION OVERVIEW
APPENDIX
OUTLOOK
(in millions, except per share amounts)
Full Year 2026 Outlook(a)
Site rental billings(b)
$3,800
to
$3,830
Amortization of prepaid rent
65
to
95
Straight-lined revenues
(75)
to
(45)
Other revenues
15
to
15
Site rental revenues
3,828
to
3,873
Site rental costs of operations(c)
978
to
1,023
Services and other gross margin
90
to
120
Net income (loss)(d)
640
to
920
Net income (loss) per share—diluted(d)
1.48
to
2.12
Adjusted EBITDA(b)
2,665
to
2,715
Depreciation, amortization and accretion
627
to
722
Interest expense and amortization of deferred financing costs, net(e)
832
to
877
Income (loss) from discontinued operations, net of tax(f)
(360)
to
(80)
FFO(b)
1,640
to
1,670
AFFO(b)
1,895
to
1,945
AFFO per share(b)
$4.38
to
$4.49
(a)As issued on February 4, 2026.
(b)See "Non-GAAP Measures and Other Information" for further information and reconciliation of non-GAAP financial measures to net income (loss), including on a per share basis, and for definition of site rental billings.
(c)Exclusive of depreciation, amortization and accretion.
(d)Includes contribution from discontinued operations through June 30, 2026.
(e)See our reconciliation of "Outlook for Components of Interest Expense" for a discussion of non-cash interest expense.
(f)Represents expected results from the Fiber Business, including the estimated loss on disposal, through June 30, 2026.
6
Crown Castle Inc.
Fourth Quarter 2025
COMPANY OVERVIEW
OUTLOOK
FINANCIAL
HIGHLIGHTS
CAPITALIZATION OVERVIEW
APPENDIX
OUTLOOK FOR COMPONENTS OF CHANGES IN SITE RENTAL REVENUES
(dollars in millions; totals may not sum due to rounding)
Full Year 2026 Outlook(a)
Components of changes in site rental revenues:
Prior year site rental billings excluding site rental billings to DISH(b)
$3,701
Prior year site rental billings to DISH(b)
222
Prior year site rental billings(b)
$3,923
Core leasing activity(b)
60
to
70
Escalators
95
to
105
Non-renewals(b)
(35)
to
(25)
Other billings(b)
(5)
to
(5)
Organic Contribution to Site Rental Billings as Adjusted for Impact of Sprint Cancellations and DISH Terminations(b)
115
to
145
Non-renewals associated with Sprint Cancellations(b)
(20)
to
(20)
Non-renewals associated with DISH Terminations(b)
(220)
to
(220)
Organic Contribution to Site Rental Billings(b)
(125)
to
(95)
Straight-lined revenues
(75)
to
(45)
Amortization of prepaid rent
65
to
95
Other revenues
15
to
15
Acquisitions(c)
—
Total site rental revenues
$3,828
to
$3,873
Year-over-year changes in revenues:(d)
Site rental revenues as a percentage of prior year site rental revenues
(4.9)%
Organic Contribution to Site Rental Billings as Adjusted for Impact of Sprint Cancellations and DISH Terminations as a percentage of prior year site rental billings excluding site rental billings to DISH(b)
3.5%
Organic Contribution to Site Rental Billings as Adjusted for Impact of Sprint Cancellations and DISH Terminations as a percentage of prior year site rental billings(b)
3.3%
Organic Contribution to Site Rental Billings as a percentage of prior year site rental billings(b)
(2.8)%
OUTLOOK FOR COMPONENTS OF INTEREST EXPENSE
(in millions)
Full Year 2026 Outlook(a)
Interest expense on debt obligations
$815
to
$855
Amortization of deferred financing costs and adjustments on long-term debt
25
to
35
Capitalized interest
(15)
to
(5)
Interest expense and amortization of deferred financing costs, net
$832
to
$877
(a)As issued on February 4, 2026.
(b)See our definitions of site rental billings, core leasing activity, non-renewals, other billings, Sprint Cancellations, DISH Terminations, Organic Contribution to Site Rental Billings and Organic Contribution to Site Rental Billings as Adjusted for Impact of Sprint Cancellations and DISH Terminations in "Non-GAAP Measures and Other Information."
(c)Represents the contribution from recent acquisitions. The financial impact of recent acquisitions is excluded from Organic Contribution to Site Rental Billings, including as Adjusted for Impact of Sprint Cancellations and DISH Terminations, until the one-year anniversary of such acquisitions.
(d)Calculated based on midpoint of full year 2026 Outlook, where applicable.
7
Crown Castle Inc.
Fourth Quarter 2025
COMPANY OVERVIEW
OUTLOOK
FINANCIAL
HIGHLIGHTS
CAPITALIZATION OVERVIEW
APPENDIX
SUMMARY FINANCIAL HIGHLIGHTS(a)
2024
2025
Twelve Months Ended December 31,
(in millions, except per share amounts; totals may not sum due to rounding)
Q1
Q2
Q3
Q4
Q1
Q2
Q3
Q4
2024
2025
Net revenues:
Site rental
Site rental billings(b)
$
966
$
967
$
995
$
1,006
$
964
$
961
$
996
$
1,002
$
3,934
$
3,923
Amortization of prepaid rent
41
39
39
40
25
23
23
28
160
98
Straight-lined revenues
57
54
28
20
19
20
(11)
(15)
160
12
Other revenues
4
4
4
4
4
4
4
4
15
16
Total site rental
1,068
1,064
1,066
1,070
1,011
1,008
1,012
1,019
4,268
4,049
Services and other
46
43
54
49
50
52
60
53
192
215
Net revenues
$
1,114
$
1,107
$
1,120
$
1,119
$
1,061
$
1,060
$
1,072
$
1,072
$
4,460
$
4,264
Select operating expenses:
Costs of operations(c)
Site rental exclusive of straight-lined expenses
$
227
$
233
$
232
$
227
$
225
$
236
$
235
$
238
$
920
$
934
Straight-lined expenses
16
16
15
15
15
15
15
14
63
58
Total site rental
243
249
247
242
240
251
250
252
983
992
Services and other
29
25
27
26
28
27
30
29
107
113
Total costs of operations
272
274
274
268
268
278
280
281
1,090
1,105
Selling, general and administrative
$
114
$
136
$
93
$
92
$
93
$
99
$
97
$
94
$
435
$
383
Net income (loss)
$
311
$
251
$
303
$
(4,768)
$
(464)
$
291
$
323
$
294
$
(3,903)
$
444
Adjusted EBITDA(b)
754
727
777
777
722
705
718
718
3,035
2,863
Depreciation, amortization and accretion
191
180
181
184
177
175
167
170
736
690
Interest expense and amortization of deferred financing costs, net
226
230
236
240
236
243
247
246
(932)
972
FFO(b)
478
436
466
483
451
429
443
442
1,863
1,764
AFFO(b)
$
484
$
449
$
525
$
523
$
479
$
444
$
490
$
489
$
1,980
$
1,904
Weighted-average common shares outstanding— diluted
435
435
436
435
436
437
437
437
434
437
Net income (loss) per share—diluted
$
0.71
$
0.58
$
0.70
$
(10.97)
$
(1.07)
$
0.67
$
0.74
$
0.67
$
(8.98)
$
1.01
AFFO per share(b)
$
1.11
$
1.03
$
1.20
$
1.20
$
1.10
$
1.02
$
1.12
$
1.12
$
4.55
$
4.36
(a)With the exception of net income (loss) and net income (loss) per share-diluted, amounts are exclusive of the Fiber Business, which is presented in discontinued operations.
(b)See "Non-GAAP Measures and Other Information" for our definition of site rental billings and for further information and reconciliation of non-GAAP financial measures to net income (loss), including on a per share basis.
(c)Exclusive of depreciation, amortization and accretion, which are shown separately.
8
Crown Castle Inc.
Fourth Quarter 2025
COMPANY OVERVIEW
OUTLOOK
FINANCIAL
HIGHLIGHTS
CAPITALIZATION OVERVIEW
APPENDIX
COMPONENTS OF CHANGES IN SITE RENTAL REVENUES(a)
2024
2025
Twelve Months Ended December 31,
(dollars in millions; totals may not sum due to rounding)
Q1
Q2
Q3
Q4
Q1
Q2
Q3
Q4
2024
2025
Components of changes in site rental revenues:
Prior year site rental billings(b)
$
923
$
922
$
952
$
966
$
966
$
966
$
995
$
1,006
$
3,763
$
3,934
Core leasing activity(b)
28
28
27
28
28
28
33
29
110
118
Escalators
23
23
23
24
24
24
24
25
92
96
Non-renewals(b)
(8)
(7)
(8)
(8)
(7)
(7)
(7)
(7)
(31)
(27)
Other billings(b)
—
2
—
(4)
3
—
2
—
(2)
5
Organic Contribution to Site Rental Billings as Adjusted for Impact of Sprint Cancellations(b)
43
45
43
40
49
45
52
47
170
193
Non-renewals associated with Sprint Cancellations(b)
—
—
—
—
(51)
(51)
(51)
(51)
—
(204)
Organic Contribution to Site Rental Billings(b)
43
45
43
40
(2)
(6)
1
(4)
170
(11)
Straight-lined revenues
57
54
28
20
19
20
(11)
(15)
160
12
Amortization of prepaid rent
41
39
39
40
25
23
23
28
160
98
Other revenues
4
4
4
4
4
4
4
4
15
16
Total site rental revenues
$
1,068
$
1,064
$
1,066
$
1,070
$
1,011
$
1,008
$
1,012
$
1,019
$
4,268
$
4,049
Year-over-year changes in revenues:
Site rental revenues as a percentage of prior year site rental revenues
(1.2)
%
(1.5)
%
(0.8)
%
(0.8)
%
(5.3)
%
(5.3)
%
(5.1)
%
(4.8)
%
(1.0)
%
(5.1)
%
Organic Contribution to Site Rental Billings as Adjusted for Impact of Sprint Cancellations as a percentage of prior year site rental billings(b)
4.6
%
4.8
%
4.5
%
4.1
%
5.1
%
4.7
%
5.2
%
4.7
%
4.5
%
4.9
%
Organic Contribution to Site Rental Billings as a percentage of prior year site rental billings(b)
4.6
%
4.8
%
4.5
%
4.1
%
(0.2)
%
(0.6)
%
0.1
%
(0.4)
%
4.5
%
(0.3)
%
(a)The financial impact of the Fiber Business revenues is excluded as these amounts are presented within discontinued operations.
(b)See our definitions of site rental billings, core leasing activity, non-renewals, other billings, Sprint Cancellations, Organic Contribution to Site Rental Billings and Organic Contribution to Site Rental Billings as Adjusted for Impact of Sprint Cancellations in "Non-GAAP Measures and Other Information."
9
Crown Castle Inc.
Fourth Quarter 2025
COMPANY OVERVIEW
OUTLOOK
FINANCIAL
HIGHLIGHTS
CAPITALIZATION OVERVIEW
APPENDIX
SUMMARY OF CAPITAL EXPENDITURES(a)
2024
2025
Twelve Months Ended December 31,
(dollars in millions; totals may not sum due to rounding)
Q1
Q2
Q3
Q4
Q1
Q2
Q3
Q4
2024
2025
Discretionary capital expenditures:
Tower improvements and other capital projects
$
26
$
20
$
21
$
18
$
15
$
17
$
20
$
18
$
84
$
72
Purchases of land interests
13
11
14
20
18
16
16
27
58
77
Total discretionary capital expenditures
39
31
35
38
33
33
36
45
142
149
Sustaining capital expenditures
8
9
6
12
7
7
6
14
34
33
Total capital expenditures
47
40
41
50
40
40
42
59
176
182
Less: Prepaid rent additions(b)
12
8
13
12
10
11
11
11
45
43
Capital expenditures less prepaid rent additions
$
35
$
32
$
28
$
38
$
30
$
29
$
31
$
48
$
131
$
139
PORTFOLIO HIGHLIGHTS(c)
(as of December 31, 2025)
Number of towers (in thousands)(d)
40
Average number of tenants per tower
2.4
Remaining contracted tenant receivables (in billions)(e)
$
27
Weighted average remaining tenant contract term (years)(e)(f)
6
Percent of towers in the Top 50 / 100 Basic Trading Areas
56% / 71%
Percent of ground leased / owned(g)
57% / 43%
Weighted average maturity of ground leases (years)(g)(h)
35
(a)See our definitions of discretionary capital expenditures and sustaining capital expenditures in "Non-GAAP Measures and Other Information." Excludes amounts related to the Fiber Business, which are presented in discontinued operations.
(b)Reflects up-front consideration from long-term tenant contracts (commonly referred to as prepaid rent) that are amortized and recognized as revenue over the associated estimated lease term in accordance with GAAP.
(c)Reflects amounts related to DISH. See the Company's Form 8-K filed January 12, 2026 for additional information.
(d)Excludes third-party land interests.
(e)Relates to continuing operations only and excludes renewal terms at tenants' option.
(f)Weighted by site rental revenues.
(g)Weighted by site rental gross margin exclusive of straight-lined revenues, amortization of prepaid rent and straight-lined expenses.
(h)Includes all renewal terms at the Company's option.
10
Crown Castle Inc.
Fourth Quarter 2025
COMPANY OVERVIEW
OUTLOOK
FINANCIAL
HIGHLIGHTS
CAPITALIZATION OVERVIEW
APPENDIX
CONSOLIDATED RETURN ON INVESTED CAPITAL(a)(b)
(as of December 31, 2025; dollars in millions)
Q4 2025 LQA
Q4 2024 LQA
Adjusted EBITDA(c)
$
2,872
$
3,108
Cash taxes (paid) refunded
(13)
(9)
Adjusted EBITDA less cash taxes paid
$
2,859
$
3,099
Historical gross investment in property and equipment(d)
$
16,979
$
16,838
Historical gross investment in site rental contracts and tenant relationships
4,590
4,589
Historical gross investment in goodwill
5,127
5,127
Consolidated Invested Capital(a)
$
26,696
$
26,554
Consolidated Return on Invested Capital(a)
10.7
%
11.7
%
CASH YIELD ON INVESTED CAPITAL(a)(b)(e)
(as of December 31, 2025; dollars in millions)
Q4 2025 LQA
Q4 2024 LQA
Adjusted Site Rental Gross Margin(c)
$
3,088
$
3,336
Less: Amortization of prepaid rent
(110)
(160)
Add (less): Straight-lined revenues
60
(80)
Add: Straight-lined expenses
43
44
Numerator
$
3,081
$
3,140
Net investment in property and equipment(f)
$
13,652
$
13,547
Investment in site rental contracts and tenant relationships
4,590
4,589
Investment in goodwill(g)
5,351
5,351
Net Invested Capital(a)
$
23,593
$
23,487
Cash Yield on Invested Capital(a)
13.1
%
13.4
%
(a)See "Non-GAAP Measures and Other Information" for further information on, and our definitions of, Consolidated Return on Invested Capital, Consolidated Invested Capital, Cash Yield on Invested Capital, and Net Invested Capital.
(b)Excludes amounts related to the Fiber Business, which are presented in discontinued operations.
(c)See "Non-GAAP Measures and Other Information" for further information and reconciliation of non-GAAP financial measures to net income (loss).
(d)Historical gross investment in property and equipment excludes the impact of construction in process.
(e)Section is equivalent to the historically reported Tower Segment Cash Yield on Invested Capital.
(f)Net investment in property and equipment excludes the impact of construction in process and non-productive assets (such as information technology assets and buildings) and is reduced by the amount of prepaid rent received from tenants.
(g)Investment in goodwill excludes the impact of certain assets and liabilities recorded in connection with acquisitions.
11
Crown Castle Inc.
Fourth Quarter 2025
COMPANY OVERVIEW
OUTLOOK
FINANCIAL
HIGHLIGHTS
CAPITALIZATION OVERVIEW
APPENDIX
TENANT OVERVIEW(a)
(as of December 31, 2025)
Percentage of Q4 2025 LQA Site Rental Revenues
Weighted Average Current Term Remaining(c)
T-Mobile
40%
7
AT&T
27%
3
Verizon
22%
6
All Others Combined
11%
8
Total / Weighted Average
100%
6
ANNUALIZED RENTAL CASH PAYMENTS AT TIME OF RENEWAL(a)(b)(d)
Years Ending December 31,
(as of December 31, 2025; in millions)
2026
2027
2028
2029
2030
T-Mobile
$
26
$
33
$
27
$
24
$
26
AT&T
16
13
775
238
107
Verizon
5
7
31
48
71
All Others Combined
48
37
28
44
59
Total
$
95
$
90
$
861
$
354
$
263
PROJECTED REVENUES FROM TENANT CONTRACTS ASSOCIATED WITH ACTIVE LICENSES(a)(b)(e)
Years Ending December 31,
(as of December 31, 2025; in millions)
2026
2027
2028
2029
2030
Components of site rental revenues:
Site rental billings(f)
$
3,817
$
3,925
$
4,044
$
4,165
$
4,291
Amortization of prepaid rent
77
65
43
27
16
Straight-lined revenues
(58)
(171)
(236)
(207)
(282)
Site rental revenues
$
3,836
$
3,819
$
3,851
$
3,985
$
4,025
(a)Excludes amounts related to the Fiber Business, which are presented in discontinued operations.
(b)Excludes amounts associated with DISH. See the Company's Form 8-K filed January 12, 2026 for additional information.
(c)Weighted by site rental revenues and excludes renewals at the tenants' option.
(d)Reflects lease renewals by year by tenant; dollar amounts represent annualized cash site rental revenues from assumed renewals or extensions as reflected in "Projected Revenues from Tenant Contracts Associated with Active Licenses" below.
(e)Based on tenant licenses in place and active as of December 31, 2025. All tenant licenses are assumed to renew for a new term no later than the respective current term end date, and as such, projected revenues do not reflect the impact of estimated annual churn. CPI-linked tenant contracts are assumed to escalate at 3% per annum.
(f)See "Non-GAAP Measures and Other Information" for our definition of site rental billings.
12
Crown Castle Inc.
Fourth Quarter 2025
COMPANY OVERVIEW
OUTLOOK
FINANCIAL
HIGHLIGHTS
CAPITALIZATION OVERVIEW
APPENDIX
PROJECTED EXPENSES FROM EXISTING GROUND LEASES(a)(b)
Years Ending December 31,
(as of December 31, 2025; in millions)
2026
2027
2028
2029
2030
Components of ground lease expenses:
Ground lease expenses exclusive of straight-lined expenses
$
690
$
703
$
721
$
740
$
761
Straight-lined expenses
47
34
24
13
2
Ground lease expenses
$
737
$
737
$
745
$
753
$
763
SUMMARY OF TOWER PORTFOLIO BY VINTAGE(c)
(as of December 31, 2025; dollars in thousands)
Acquired and Built 2006 and Prior
Acquired and Built 2007 to Present
Cash yield(d)
21
%
10
%
Number of tenants per tower
2.9
2.2
Last quarter annualized average cash site rental revenue per tower(e)
$
139
$
83
Last quarter annualized average site rental gross cash margin per tower(f)
$
119
$
58
Net invested capital per tower(g)
$
567
$
595
Number of towers
11,157
28,647
GROUND INTEREST OVERVIEW
(as of December 31, 2025; dollars in millions)
LQA Cash Site Rental Revenues(e)
Percentage of LQA Cash Site Rental Revenues(e)
LQA Site Rental Gross Cash Margin(f)
Percentage of LQA Site Rental Gross Cash Margin(f)
Number of Towers(h)
Percentage of Towers
Weighted Average Term Remaining (by years)(i)
Less than 10 years
$
433
11
%
$
236
8
%
5,360
14
%
10 to 20 years
$
575
14
%
$
362
12
%
6,106
15
%
Greater than 20 years
$
1,558
40
%
$
1,121
37
%
16,293
41
%
Total leased
$
2,566
65
%
$
1,719
57
%
27,759
70
%
35
Owned
$
1,364
35
%
$
1,280
43
%
12,045
30
%
Total / Average
$
3,930
100
%
$
2,999
100
%
39,804
100
%
(a)Based on existing ground leases as of December 31, 2025. CPI-linked contracts are assumed to escalate at 3% per annum.
(b)Excludes amounts related to the Fiber Business, which are presented in discontinued operations.
(c)All tower portfolio figures are calculated exclusively for the Company's towers and rooftops and do not give effect to other activities.
(d)Cash yield is calculated as last quarter annualized site rental gross margin, exclusive of straight-lined revenues, amortization of prepaid rent, and straight-lined expenses, divided by invested capital net of the amount of prepaid rent received from tenants.
(e)Exclusive of straight-lined revenues and amortization of prepaid rent.
(f)Exclusive of straight-lined revenues, amortization of prepaid rent and straight-lined expenses.
(g)Reflects gross total assets (including incremental capital invested by the Company since time of acquisition or construction completion), less any prepaid rent. Inclusive of invested capital related to land at the tower site.
(h)Excludes third-party land interests.
(i)Includes all renewal terms at the Company's option and weighted by site rental gross margin exclusive of straight-lined revenues, amortization of prepaid rent and straight-lined expenses.
13
Crown Castle Inc.
Fourth Quarter 2025
COMPANY OVERVIEW
OUTLOOK
FINANCIAL
HIGHLIGHTS
CAPITALIZATION OVERVIEW
APPENDIX
CAPITALIZATION OVERVIEW
(as of December 31, 2025; dollars in millions)
Face Value(a)
Fixed vs. Variable
Interest Rate(b)
Maturity
Cash and cash equivalents and restricted cash and cash equivalents(c)
$
274
Senior Secured Notes, Series 2009-1, Class A-2(d)
26
Fixed
9.0%
Aug. 2029
Senior Secured Tower Revenue Notes, Series 2018-2(e)
750
Fixed
4.2%
July 2048
Installment purchase liabilities and finance leases(f)
258
Fixed
Various
Various
Total secured debt
$
1,034
4.4%
2016 Revolver(g)
945
Variable
5.4%
July 2027
2016 Term Loan A(h)
1,056
Variable
5.0%
July 2027
Commercial Paper Notes(i)
1,931
Variable
4.2%
Various
4.450% Senior Notes
900
Fixed
4.5%
Feb. 2026
3.700% Senior Notes
750
Fixed
3.7%
June 2026
1.050% Senior Notes
1,000
Fixed
1.1%
July 2026
2.900% Senior Notes
750
Fixed
2.9%
Mar. 2027
4.000% Senior Notes
500
Fixed
4.0%
Mar. 2027
3.650% Senior Notes
1,000
Fixed
3.7%
Sept. 2027
5.000% Senior Notes
1,000
Fixed
5.0%
Jan. 2028
3.800% Senior Notes
1,000
Fixed
3.8%
Feb. 2028
4.800% Senior Notes
600
Fixed
4.8%
Sept. 2028
4.300% Senior Notes
600
Fixed
4.3%
Feb. 2029
5.600% Senior Notes
750
Fixed
5.6%
June 2029
4.900% Senior Notes
550
Fixed
4.9%
Sept. 2029
3.100% Senior Notes
550
Fixed
3.1%
Nov. 2029
3.300% Senior Notes
750
Fixed
3.3%
July 2030
2.250% Senior Notes
1,100
Fixed
2.3%
Jan. 2031
2.100% Senior Notes
1,000
Fixed
2.1%
Apr. 2031
2.500% Senior Notes
750
Fixed
2.5%
July 2031
5.100% Senior Notes
750
Fixed
5.1%
May 2033
5.800% Senior Notes
750
Fixed
5.8%
Mar. 2034
5.200% Senior Notes
700
Fixed
5.2%
Sept. 2034
2.900% Senior Notes
1,250
Fixed
2.9%
Apr. 2041
4.750% Senior Notes
350
Fixed
4.8%
May 2047
5.200% Senior Notes
400
Fixed
5.2%
Feb. 2049
4.000% Senior Notes
350
Fixed
4.0%
Nov. 2049
4.150% Senior Notes
500
Fixed
4.2%
July 2050
3.250% Senior Notes
900
Fixed
3.3%
Jan. 2051
Total unsecured debt
$
23,432
3.9%
Net Debt(j)
$
24,192
3.9%
Market Capitalization(k)
38,702
Firm Value(l)
$
62,894
(a)Net of required principal amortizations.
(b)Represents the weighted-average stated interest rate, as applicable, exclusive of finance leases and other obligations.
(c)As of December 31, 2025, excludes $34 million associated with discontinued operations relating to the Fiber Business.
(d)The Senior Secured Notes, 2009-1, Class A-2 principal amortizes over a period ending in August 2029.
(e)If the $750 million aggregate principal amount of 4.241% senior secured tower revenue notes ("Tower Revenue Notes, Series 2018-2") is not paid in full on or prior to July 2028, the anticipated repayment date, then the Excess Cash Flow (as defined in the indenture) of the issuers of such notes will be used to repay the principal, and additional interest (of approximately 5% per annum) will accrue on such notes. The Tower Revenue Notes, Series 2018-2 are prepayable at par if voluntarily repaid within eighteen months of the anticipated repayment date; earlier prepayment may require additional consideration.
(f)As of December 31, 2025, reflects $5 million in finance lease obligations (primarily related to vehicles), which excludes $29 million associated with discontinued operations.
(g)As of December 31, 2025, the undrawn availability under the $7.0 billion 2016 Revolver was $6.0 billion. The Company pays a commitment fee on the undrawn available amount, which as of December 31, 2025 ranged from 0.080% to 0.300%, based on the Company's senior unsecured debt rating, per annum.
(h)The 2016 Term Loan A principal amortizes over a period ending in July 2027.
(i)As of December 31, 2025, the Company had $69 million available for issuance under the $2.0 billion unsecured commercial paper program ("CP Program"). The maturities of the Commercial Paper Notes ("CP Notes"), when outstanding, may vary but may not exceed 397 days from the date of issue.
(j)See "Non-GAAP Measures and Other Information" for further information on, and our definition and calculation of, Net Debt.
(k)Market capitalization calculated based on $88.87 closing price and 435 million shares outstanding as of December 31, 2025.
(l)Represents the sum of Net Debt and market capitalization. See "Non-GAAP Measures and Other Information" for further information on, and our definition and calculation of, Net Debt.
14
Crown Castle Inc.
Fourth Quarter 2025
COMPANY OVERVIEW
OUTLOOK
FINANCIAL HIGHLIGHTS
CAPITALIZATION OVERVIEW
APPENDIX
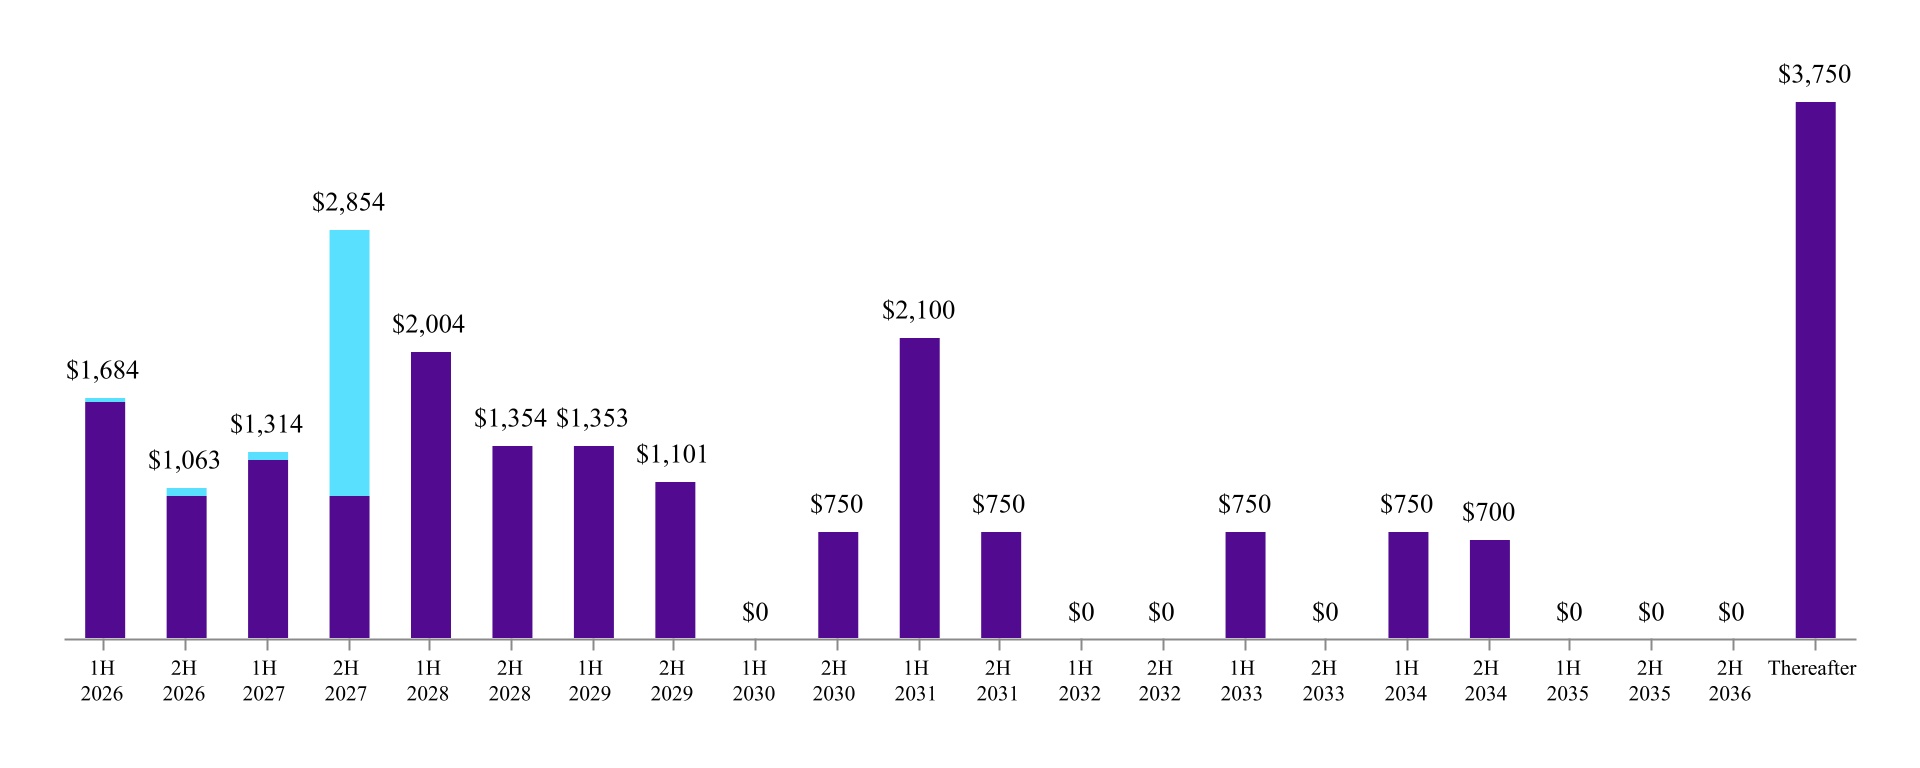
DEBT MATURITY OVERVIEW(a)(b)
(as of December 31, 2025; in millions)
(a)Where applicable, maturities reflect the anticipated repayment date of the Tower Revenue Notes, Series 2018-2; excludes finance leases and other obligations; amounts presented at face value, net of required principal amortizations and repurchases held at the Company.
(b)The $1.9 billion outstanding in CP Notes have been excluded from this overview. Amounts available under the CP Program may be borrowed, repaid and re-borrowed from time to time. We intend to maintain available commitments under our 2016 Revolver in an amount at least equal to the amount of CP Notes outstanding at any point in time.
15
Crown Castle Inc.
First Quarter 2025
COMPANY OVERVIEW
OUTLOOK
FINANCIAL
HIGHLIGHTS
CAPITALIZATION OVERVIEW
APPENDIX
LIQUIDITY OVERVIEW(a)
(in millions)
December 31, 2025
Cash and cash equivalents, and restricted cash and cash equivalents(b)(c)
$
274
Undrawn 2016 Revolver availability(d)
6,015
Total debt and other obligations (current and non-current)(c)(e)
24,337
Total equity (deficit)
(1,635)
SUMMARY OF MAINTENANCE AND FINANCIAL COVENANTS
Debt
Borrower / Issuer
Covenant(f)
Covenant Level Requirement
As of December 31, 2025
Maintenance Financial Covenants(g)
2016 Credit Facility
CCI
Total Net Leverage Ratio
≤ 6.50x
5.9x
2016 Credit Facility
CCI
Total Senior Secured Leverage Ratio
≤ 3.50x
0.2x
2016 Credit Facility
CCI
Consolidated Interest Coverage Ratio(h)
N/A
N/A
Financial covenants requiring excess cash flows to be deposited in a cash trap reserve account and not released
Tower Revenue Notes, Series 2018-2
Crown Castle Towers LLC and its Subsidiaries
Debt Service Coverage Ratio
> 1.75x
(i)
30.4x
2009 Securitized Notes
Pinnacle Towers Acquisition Holdings LLC and its Subsidiaries
Debt Service Coverage Ratio
> 1.30x
(i)
42.8x
Financial covenants restricting ability of relevant issuer to issue additional notes under the applicable indenture
Tower Revenue Notes, Series 2018-2
Crown Castle Towers LLC and its Subsidiaries
Debt Service Coverage Ratio
≥ 2.00x
(j)
30.4x
2009 Securitized Notes
Pinnacle Towers Acquisition Holdings LLC and its Subsidiaries
Debt Service Coverage Ratio
≥ 2.34x
(j)
42.8x
(a)In addition, we have the following sources of liquidity:
i.In March 2024, we established an at-the-market stock offering program ("ATM Program") through which we may, from time to time, issue and sell shares of our common stock having an aggregate gross sales price of up to $750 million to or through sales agents. No shares of common stock have been sold under the ATM Program.
ii.In April 2019, we established a CP Program through which we may issue short term, unsecured CP Notes. Amounts available under the CP Program may be issued, repaid and re-issued from time to time, with the aggregate principal amount of CP Notes outstanding under the CP Program at any time not to exceed $2.0 billion. As of December 31, 2025, there were $1.9 billion CP Notes outstanding under our CP Program. We intend to maintain available commitments under our 2016 Revolver in an amount at least equal to the amount of CP Notes outstanding at any point in time.
(b)Inclusive of $5 million included within "Other assets, net" on our condensed consolidated balance sheet.
(c)Excludes amounts related to the Fiber Business, which are presented in discontinued operations.
(d)Availability at any point in time is subject to reaffirmation of the representations and warranties in, and there being no default under, the credit agreement governing our 2016 Revolver.
(e)See "Non-GAAP Measures and Other Information" for further information on, and reconciliation to, Net Debt.
(f)As defined in the respective debt agreement. In the indentures for the Tower Revenue Notes, Series 2018-2 and the 2009 Securitized Notes, the defined term for Debt Service Coverage Ratio is "DSCR." Total Net Leverage Ratio, Total Senior Secured Leverage Ratio and all DSCR ratios are calculated using the trailing twelve months.
(g)Failure to comply with the financial maintenance covenants would, absent a waiver, result in an event of default under the credit agreement governing our 2016 Credit Facility.
(h)Applicable solely to the extent that the senior unsecured debt rating by any two of S&P, Moody's and Fitch is lower than BBB-, Baa3 or BBB-, respectively. If applicable, the consolidated interest coverage ratio must be greater than or equal to 2.50.
(i)The Tower Revenue Notes, Series 2018-2 and 2009 Securitized Notes also include the potential for amortization events, which could result in applying current and future cash flow to the prepayment of debt with applicable prepayment consideration. An amortization event occurs when the Debt Service Coverage Ratio falls below 1.45x or 1.15x, in each case as described under the indentures for the Tower Revenue Notes, Series 2018-2 or 2009 Securitized Notes, respectively.
(j)Rating Agency Confirmation (as defined in the respective debt agreement) is required.
16
Crown Castle Inc.
First Quarter 2025
COMPANY OVERVIEW
OUTLOOK
FINANCIAL
HIGHLIGHTS
CAPITALIZATION OVERVIEW
APPENDIX
INTEREST RATE EXPOSURE(a)
(as of December 31, 2025; dollars in millions)
Fixed Rate Debt
Floating Rate Debt
Face value of principal outstanding(b)
$20,276
Face value of principal outstanding(b)
$3,932
% of total debt
84%
% of total debt
16%
Weighted average interest rate
3.8%
Weighted average interest rate(c)
4.7%
Upcoming maturities:
2026
2027
Interest rate sensitivity of 25 bps increase in interest rates:
Face value of principal outstanding(b)
$2,650
$2,250
Full year effect(d)
$9.8
Weighted average interest rate
2.95%
3.48%
COMPONENTS OF INTEREST EXPENSE
2024
2025
Twelve Months Ended December 31,
(in millions; totals may not sum due to rounding)
Q1
Q2
Q3
Q4
Q1
Q2
Q3
Q4
2024
2025
Interest expense on debt obligations
$
223
$
227
$
234
$
236
$
233
$
239
$
244
$
241
$
920
$
956
Amortization of deferred financing costs and adjustments on long-term debt
8
8
8
8
8
8
8
8
32
31
Capitalized interest
(5)
(5)
(6)
(4)
(5)
(4)
(5)
(3)
(20)
(15)
Interest expense and amortization of deferred financing costs, net
$
226
$
230
$
236
$
240
$
236
$
243
$
247
$
246
$
932
$
972
(a)Excludes finance leases and other obligations; assumes no default.
(b)Net of required principal amortization.
(c)In June 2021, the Company entered into an amendment to the credit agreement governing our 2016 Credit Facility that provided for, among other things, a reduction to the interest rate spread ("Spread") of up to 0.05% if the Company meets specified annual sustainability targets ("Targets") and an increase to the Spread of up to 0.05% if the Company fails to meet specified annual sustainability thresholds ("Thresholds"). In January 2026, the Company submitted the required documentation and received confirmation from its administrative agent that all Targets were met as of December 31, 2025, and, as such, the Spread reduction is maintained for 2026. The weighted average interest rate reflects the reduced Spread.
(d)Represents incremental interest expense over a 12-month period based on a hypothetical interest rate increase of 25 bps on face value of variable indebtedness outstanding as of December 31, 2025; assumes no debt maturities.
17
Crown Castle Inc.
Fourth Quarter 2025
COMPANY OVERVIEW
OUTLOOK
FINANCIAL
HIGHLIGHTS
CAPITALIZATION OVERVIEW
APPENDIX
CONDENSED CONSOLIDATED BALANCE SHEET (Unaudited)
(in millions, except par values)
December 31, 2025
December 31, 2024
ASSETS
Current assets:
Cash and cash equivalents
$
99
$
100
Restricted cash and cash equivalents
170
170
Receivables, net
172
129
Prepaid expenses
79
74
Deferred site rental receivables
167
164
Other current assets
23
24
Current assets of discontinued operations
434
429
Total current assets
1,144
1,090
Deferred site rental receivables
2,288
2,279
Property and equipment, net
6,273
6,577
Operating lease right-of-use assets
5,473
5,600
Goodwill
5,127
5,127
Other intangible assets, net
861
1,037
Other assets, net
61
58
Non-current assets of discontinued operations
10,291
10,968
Total assets
$
31,518
$
32,736
LIABILITIES AND EQUITY (DEFICIT)
Current liabilities:
Accounts payable
$
71
$
48
Accrued interest
235
244
Deferred revenues
192
141
Other accrued liabilities
168
167
Current maturities of debt and other obligations
2,783
603
Current portion of operating lease liabilities
268
264
Current liabilities of discontinued operations
762
710
Total current liabilities
4,479
2,177
Debt and other long-term obligations
21,554
23,451
Operating lease liabilities
4,961
5,062
Other long-term liabilities
607
645
Non-current liabilities of discontinued operations
1,552
1,534
Total liabilities
33,153
32,869
Commitments and contingencies
Stockholders' equity (deficit):
Common stock, 0.01 par value; 1,200 shares authorized; shares issued and outstanding: December 31, 2025—435 and December 31, 2024—435
4
4
Additional paid-in capital
18,527
18,393
Accumulated other comprehensive income (loss)
(5)
(5)
Dividends/distributions in excess of earnings
(20,161)
(18,525)
Total equity (deficit)
(1,635)
(133)
Total liabilities and equity (deficit)
$
31,518
$
32,736
18
Crown Castle Inc.
Fourth Quarter 2025
COMPANY OVERVIEW
OUTLOOK
FINANCIAL
HIGHLIGHTS
CAPITALIZATION OVERVIEW
APPENDIX
CONDENSED CONSOLIDATED STATEMENT OF OPERATIONS (Unaudited)
Three Months Ended December 31,
Twelve Months Ended December 31,
(in millions, except per share amounts)
2025
2024
2025
2024
Net revenues:
Site rental
$
1,019
$
1,070
$
4,049
$
4,268
Services and other
53
49
215
192
Net revenues
1,072
1,119
4,264
4,460
Operating expenses:
Costs of operations:(a)
Site rental
252
242
992
983
Services and other
29
26
113
107
Selling, general and administrative
94
92
383
435
Asset write-down charges
4
1
11
11
Depreciation, amortization and accretion
170
184
690
736
Restructuring charges
—
3
—
70
Total operating expenses
549
548
2,189
2,342
Operating income (loss)
523
571
2,075
2,118
Interest expense and amortization of deferred financing costs, net
(246)
(240)
(972)
(932)
Interest income
3
5
13
20
Other income (expense)
—
(23)
3
(26)
Income (loss) from continuing operations before income taxes
280
313
1,119
1,180
Benefit (provision) for income taxes
(3)
(4)
(16)
(18)
Income (loss) from continuing operations
$
277
$
309
$
1,103
$
1,162
Discontinued operations:
Income (loss) from discontinued operations before gain (loss) from disposal, net of tax
279
(5,077)
916
(5,065)
Gain (loss) from disposal of discontinued operations
(262)
—
(1,575)
—
Income (loss) from discontinued operations, net of tax
17
(5,077)
(659)
(5,065)
Net income (loss)
$
294
$
(4,768)
$
444
$
(3,903)
Net income (loss), per common share:
Income (loss) from continuing operations, basic
$
0.64
$
0.71
$
2.53
$
2.68
Income (loss) from discontinued operations, basic
$
0.03
$
(11.68)
$
(1.51)
$
(11.66)
Net income (loss)—basic
$
0.67
$
(10.97)
$
1.02
$
(8.98)
Income (loss) from continuing operations, diluted
$
0.63
$
0.71
$
2.52
$
2.68
Income (loss) from discontinued operations, diluted
$
0.04
$
(11.68)
$
(1.51)
$
(11.66)
Net income (loss)—diluted
$
0.67
$
(10.97)
$
1.01
$
(8.98)
Weighted-average common shares outstanding:
Basic
435
435
435
434
Diluted
437
435
437
434
(a)Exclusive of depreciation, amortization and accretion shown separately.
19
Crown Castle Inc.
Fourth Quarter 2025
COMPANY OVERVIEW
OUTLOOK
FINANCIAL
HIGHLIGHTS
CAPITALIZATION OVERVIEW
APPENDIX
CONDENSED CONSOLIDATED STATEMENT OF CASH FLOWS (Unaudited)
Twelve Months Ended December 31,
(in millions)
2025
2024
Cash flows from operating activities:
Net income (loss)
$
444
$
(3,903)
(Income) loss from discontinued operations before (gain) loss from disposal, net of tax
(916)
5,065
(Gain) loss from disposal of discontinued operations
1,575
—
Income (loss) from continuing operations
1,103
1,162
Adjustments to reconcile income (loss) from continuing operations to net cash provided by (used for) operating activities:
Depreciation, amortization and accretion
690
736
Amortization of deferred financing costs and other non-cash interest
32
32
Stock-based compensation expense, net
73
84
Asset write-down charges
11
11
Deferred income tax (benefit) provision
—
4
Restructuring charges, non-cash
—
10
Other non-cash adjustments, net
(4)
23
Net cash provided by (used for) operating activities from discontinued operations
1,185
1,123
Changes in assets and liabilities, excluding the effects of acquisitions:
Increase (decrease) in liabilities
(47)
(164)
Decrease (increase) in assets
14
(78)
Net cash provided by (used for) operating activities
3,057
2,943
Cash flows from investing activities:
Capital expenditures
(182)
(176)
Payments for acquisitions, net of cash acquired
—
(8)
Other investing activities, net
4
9
Net cash provided by (used for) investing activities from discontinued operations
(980)
(1,045)
Net cash provided by (used for) investing activities
(1,158)
(1,220)
Cash flows from financing activities:
Proceeds from issuance of long-term debt
—
1,244
Principal payments on debt and other long-term obligations
(118)
(99)
Purchases and redemptions of long-term debt
(1,200)
(750)
Borrowings under revolving credit facility
1,200
—
Payments under revolving credit facility
(255)
(670)
Net issuances (repayments) under commercial paper program
590
1,341
Payments for financing costs
—
(12)
Purchases of common stock
(23)
(33)
Dividends/distributions paid on common stock
(2,080)
(2,729)
Net cash provided by (used for) financing activities
(1,886)
(1,708)
Net increase (decrease) in cash and cash equivalents and restricted cash and cash equivalents
13
15
Effect of exchange rate changes on cash
—
(1)
Cash and cash equivalents and restricted cash and cash equivalents at beginning of period(a)
295
281
Cash and cash equivalents and restricted cash and cash equivalents at end of period(a)
$
308
$
295
Supplemental disclosure of cash flow information:
Interest paid
$
965
$
895
Income taxes paid (refunded)
$
15
$
10
(a)Inclusive of cash and cash equivalents and restricted cash and cash equivalents included in discontinued operations.
20
Crown Castle Inc.
Fourth Quarter 2025
COMPANY OVERVIEW
OUTLOOK
FINANCIAL
HIGHLIGHTS
CAPITALIZATION OVERVIEW
APPENDIX
NON-GAAP MEASURES AND OTHER INFORMATION
This Supplement includes presentations of Adjusted EBITDA, Adjusted Funds from Operations ("AFFO"), including per share amounts, Funds from Operations ("FFO"), including per share amounts, Organic Contribution to Site Rental Billings, (including as Adjusted for Impact of Sprint Cancellations and as Adjusted for Impact of Sprint Cancellations and DISH Terminations), Adjusted Site Rental Gross Margin, Adjusted Services and Other Gross Margin, Net Debt, Consolidated Return on Invested Capital, Cash Yield on Invested Capital, and Free Cash Flow from Discontinued Operations, which are non-GAAP financial measures. These non-GAAP financial measures are not intended as alternative measures of operating results or cash flow from operations (as determined in accordance with Generally Accepted Accounting Principles ("GAAP")).
Our non-GAAP financial measures may not be comparable to similarly titled measures of other companies, including other companies in the towers sector or other REITs.
In addition, we provide the components of certain GAAP measures, such as site rental revenues and capital expenditures.
Our non-GAAP financial measures are presented as additional information because management believes these measures are useful indicators of the financial performance of our business. Among other things, management believes that:
•Adjusted EBITDA is useful to investors or other interested parties in evaluating our financial performance. Adjusted EBITDA is a financial measure frequently used by management (1) to evaluate the economic productivity of our operations and (2) for purposes of making decisions about allocating resources to, and assessing the performance of, our operations. Management believes that Adjusted EBITDA helps investors or other interested parties meaningfully evaluate and compare the results of our operations (1) from period to period and (2) to our competitors, by removing the impact of our capital structure (primarily interest charges from our outstanding debt) and asset base (primarily depreciation, amortization and accretion) from our financial results. Management also believes Adjusted EBITDA is frequently used by investors or other interested parties in the evaluation of the towers sector and other REITs to measure financial performance without regard to items such as depreciation, amortization and accretion, which can vary depending upon accounting methods and the book value of assets. Adjusted EBITDA should be considered only as a supplement to net income (loss) computed in accordance with GAAP as a measure of our performance.
•AFFO, including per share amounts, is useful to investors or other interested parties in evaluating our financial performance. Management believes that AFFO helps investors or other interested parties meaningfully evaluate our financial performance as it includes (1) the impact of our capital structure (primarily interest expense on our outstanding debt and dividends on our preferred stock (in periods where applicable)) and (2) sustaining capital expenditures, and excludes the impact of our (1) asset base (primarily depreciation, amortization and accretion) and (2) certain non-cash items, including straight-lined revenues and expenses related to fixed escalations and rent free periods. GAAP requires rental revenues and expenses related to leases that contain specified rental increases over the life of the lease to be recognized evenly over the life of the lease. In accordance with GAAP, if payment terms call for fixed escalations or rent free periods, the (1) revenues are recognized on a straight-lined basis over the fixed, non-cancelable term of the tenant contract, and (2) expenses are recognized on a straight-lined basis over the estimated lease term including renewal options that are reasonably certain to be exercised. Management notes that Crown Castle uses AFFO only as a performance measure. AFFO should be considered only as a supplement to net income (loss) computed in accordance with GAAP as a measure of our performance and should not be considered as an alternative to cash flow from operations or as residual cash flow available for discretionary investment.
•FFO, including per share amounts, is useful to investors or other interested parties in evaluating our financial performance. Management believes that FFO may be used by investors or other interested parties as a basis to compare our financial performance with that of other REITs. FFO helps investors or other interested parties meaningfully evaluate financial performance by excluding the impact of our asset base (primarily real estate depreciation, amortization and accretion). FFO is not a key performance indicator used by Crown Castle. FFO should be considered only as a supplement to net income (loss) computed in accordance with GAAP as a measure of our performance and should not be considered as an alternative to cash flow from operations.
•Organic Contribution to Site Rental Billings (also referred to as organic growth) is useful to investors or other interested parties in understanding the components of the year-over-year changes in our site rental revenues computed in accordance with GAAP. Management uses Organic Contribution to Site Rental Billings to assess year-over-year growth rates for our rental activities, to evaluate current performance, to capture trends in rental rates, core leasing activities and tenant non-renewals in our core business, as well as to forecast future results. Separately, we are also disclosing Organic Contribution to Site Rental Billings as Adjusted for Impact of Sprint Cancellations and Organic Contribution to Site Rental Billings as Adjusted for Sprint Cancellations and DISH Terminations, which are outside of ordinary course, to provide further insight into our results of operations and underlying trends. Management believes that identifying the impact of Sprint Cancellations and DISH Terminations provides increased transparency and comparability across periods. Organic Contribution to Site Rental Billings (including as Adjusted for Impact of Sprint Cancellations and as Adjusted for Impact of Sprint Cancellations and DISH Terminations) is not meant as an alternative measure of revenue and should be considered only as a supplement in understanding and assessing the performance of our site rental revenues computed in accordance with GAAP.
21
Crown Castle Inc.
Fourth Quarter 2025
COMPANY OVERVIEW
OUTLOOK
FINANCIAL
HIGHLIGHTS
CAPITALIZATION OVERVIEW
APPENDIX
•Adjusted Site Rental Gross Margin and Adjusted Services and Other Gross Margin are useful to investors or other interested parties in evaluating our financial performance. These measures are used by our management (1) to evaluate the economic productivity of our business, (2) to identify underlying business trends that are impacting our performance, and (3) for purposes of making decisions about allocating resources to, and assessing the performance of, our business. We also believe it helps investors and other interested parties meaningfully evaluate and compare the results of our operations from period to period.
•Net Debt is useful to investors or other interested parties in evaluating our overall debt position and future debt capacity. Management uses Net Debt in assessing our leverage. Net Debt is not meant as an alternative measure of debt and should be considered only as a supplement in understanding and assessing our leverage.
•Consolidated Return on Invested Capital and Cash Yield on Invested Capital are useful to investors or other interested parties in evaluating the financial performance of our assets. Management believes that these metrics are useful in assessing our efficiency at allocating capital to generate returns over time. Consolidated Return on Invested Capital and Cash Yield on Invested Capital are not meant as alternatives to GAAP measures such as revenues, operating income, and certain asset classes (such as property and equipment, site rental contracts and tenant relationships, and goodwill) computed in accordance with GAAP. Such non-GAAP metrics should be considered only as a supplement in understanding and assessing the performance of our assets.
•Free Cash Flow from Discontinued Operations is useful to investors or other interested parties in understanding the net cash flows generated from discontinued operations for a particular period, after taking into consideration capital expenditures for that same period. Such net cash flows are available for reinvestment within discontinued operations or for other use by the Company. Management believes that Free Cash Flow from Discontinued Operations helps investors and other interested parties meaningfully evaluate the liquidity associated with discontinued operations from period to period. Free Cash Flow from Discontinued Operations does not reflect the impact of our capital structure (primarily interest charges on our outstanding debt) and should be considered only as a supplement to: a) Income (loss) from Discontinued Operations, net of tax, computed in accordance with GAAP as a measure of the performance of discontinued operations; and b) the condensed consolidated statement of cash flows prepared in accordance with GAAP as a measure of the cash flows of the Company.
Non-GAAP Financial Measures
Adjusted EBITDA. We define Adjusted EBITDA as net income (loss) plus restructuring charges (credits), asset write-down charges, goodwill impairment charges, acquisition and integration costs, depreciation, amortization and accretion, amortization of prepaid lease purchase price adjustments, interest expense and amortization of deferred financing costs, net, (gains) losses on retirement of long-term obligations, net (gain) loss on interest rate swaps, (gains) losses on foreign currency swaps, impairment of available-for-sale securities, interest income, other (income) expense, (benefit) provision for income taxes, (income) loss from discontinued operations, net of tax, cumulative effect of a change in accounting principle and stock-based compensation expense, net.
AFFO. We define AFFO as FFO before straight-lined revenues, straight-lined expenses, stock-based compensation expense, net, non-cash portion of tax provision, non-real estate related depreciation, amortization and accretion, amortization of non-cash interest expense, other (income) expense, (gains) losses on retirement of long-term obligations, net (gain) loss on interest rate swaps, (gains) losses on foreign currency swaps, impairment of available-for-sale securities, acquisition and integration costs, restructuring charges (credits), cumulative effect of a change in accounting principle and adjustments for noncontrolling interests, less sustaining capital expenditures.
AFFO per share. We define AFFO per share as AFFO divided by diluted weighted-average common shares outstanding.
FFO. We define FFO as net income (loss) plus real estate related depreciation, amortization and accretion, asset write-down charges, goodwill impairment charges, and (income) loss from discontinued operations, net of tax, less noncontrolling interest and cash paid for preferred stock dividends (in periods where applicable), and is a measure of funds from operations attributable to common stockholders.
FFO per share. We define FFO per share as FFO divided by diluted weighted-average common shares outstanding.
Organic Contribution to Site Rental Billings. We define Organic Contribution to Site Rental Billings (also referred to as organic growth) as the sum of the change in site rental revenues related to core leasing activity, escalators and other billings, including those associated with DISH Terminations, less non-renewals of tenant contracts and non-renewals associated with Sprint Cancellations and DISH Terminations. Additionally, Organic Contribution to Site Rental Billings as Adjusted for Impact of Sprint Cancellations reflects Organic Contribution to Site Rental Billings plus non-renewals associated with Sprint Cancellations. Lastly, Organic Contribution to Site Rental Billings as Adjusted for Impact of Sprint Cancellations and DISH Terminations reflects Organic Contribution to Site Rental Billings plus non-renewals associated with Sprint Cancellations, less Organic Contribution to Site Rental Billings associated with DISH Terminations.
Net Debt. We define Net Debt as (1) debt and other long-term obligations and (2) current maturities of debt and other obligations, excluding unamortized adjustments, net, less cash and cash equivalents and restricted cash and cash equivalents.
Consolidated Invested Capital. We define Consolidated Invested Capital as the historical gross investment in (1) property and equipment (excluding the impact of construction in process and write-offs), (2) site rental contracts and tenant relationships and (3) goodwill (excluding impairment charges).
Consolidated Return on Invested Capital. We define Consolidated Return on Invested Capital as Adjusted EBITDA less cash taxes paid divided by Consolidated Invested Capital.
22
Crown Castle Inc.
Fourth Quarter 2025
COMPANY OVERVIEW
OUTLOOK
FINANCIAL
HIGHLIGHTS
CAPITALIZATION OVERVIEW
APPENDIX
Net Invested Capital. We define Net Invested Capital as the investment in (1) property and equipment, excluding the impact of construction in process and non-productive assets (such as information technology assets and buildings) and write-offs, reduced by the amount of prepaid rent received from tenants, (2) site rental contracts and tenant relationships, and (3) goodwill, excluding the impact of certain assets and liabilities recorded in connection with acquisitions and impairment charges.
Cash Yield on Invested Capital. We define Cash Yield on Invested Capital as Adjusted Site Rental Gross Margin adjusted for the impacts of (1) amortization of prepaid rent, (2) straight-lined revenues, and (3) straight-lined expenses divided by Net Invested Capital.
Adjusted Site Rental Gross Margin. We define Adjusted Site Rental Gross Margin as site rental revenues less site rental costs of operations, excluding stock-based compensation expense, net and amortization of prepaid lease purchase price adjustments. This measure is exclusive of depreciation, amortization and accretion, which are shown separately.
Adjusted Services and Other Gross Margin. We define Adjusted Services and Other Gross Margin as services and other revenues less services and other costs of operations, excluding stock-based compensation expense, net.
Free Cash Flow from Discontinued Operations. We define Free Cash Flow from Discontinued Operations as net cash provided by (used for) operating activities from discontinued operations plus net cash provided by (used for) investing activities from discontinued operations. Net cash used for investing activities from discontinued operations primarily comprises capital expenditures associated with discontinued operations.
Other Information
Site rental billings. We define site rental billings as site rental revenues exclusive of the impacts from (1) straight-lined revenues, (2) amortization of prepaid rent in accordance with GAAP, (3) contribution from recent acquisitions until the one-year anniversary of such acquisitions, (4) other revenues, such as tenant cancellation fees, finance charges and other items and (5) amounts related to DISH Terminations, where applicable.
Core leasing activity. We define core leasing activity as site rental revenues growth from tenant additions and renewals or extensions of tenant contracts, exclusive of (1) the impacts from both straight-lined revenues and amortization of prepaid rent in accordance with GAAP, (2) other revenues and (3) amounts related to DISH Terminations, where applicable.
Other billings. We define other billings as the growth or reduction in site rental revenues as a result of non-recurring contractual billings and adjustments, expense recoveries, sales credits and other amounts not captured in core leasing activity, exclusive of amounts related to DISH Terminations, where applicable.
Non-renewals. We define non-renewals of tenant contracts as the reduction in site rental revenues as a result of tenant churn, terminations and, in limited circumstances, reductions of existing lease rates, exclusive of non-renewals associated with Sprint Cancellations and DISH Terminations, where applicable.
Discretionary capital expenditures. We define discretionary capital expenditures relating to continuing operations as those made with respect to activities which we believe exhibit sufficient potential to enhance long-term stockholder value. Discretionary capital expenditures, including with respect to discontinued operations, primarily consist of expansion or development of our communications infrastructure (including capital expenditures related to (1) enhancing communications infrastructure in order to add new tenants for the first time or support subsequent tenant equipment augmentations or (2) modifying the structure of a communications infrastructure asset to accommodate additional tenants) and construction of new communications infrastructure. Discretionary capital expenditures also include purchases of land interests (which primarily relates to land assets under towers as we seek to manage our interests in the land beneath our towers), certain technology-related investments necessary to support and scale future customer demand for our communications infrastructure, and other capital projects.
Sustaining capital expenditures. We define sustaining capital expenditures as those capital expenditures (including with respect to discontinued operations) not otherwise categorized as discretionary capital expenditures, such as (1) maintenance capital expenditures on our communications infrastructure assets that enable our tenants' ongoing quiet enjoyment of the communications infrastructure and (2) ordinary corporate capital expenditures.
Sprint Cancellations. We define Sprint Cancellations as lease cancellations related to the previously disclosed T-Mobile US, Inc. and Sprint network consolidation as described in our press release dated April 19, 2023.
DISH Terminations. We define DISH Terminations as lease terminations related to the previously disclosed notice of default and termination that was sent to DISH Wireless L.L.C. ("DISH") regarding our Master Lease Agreement and related agreements as described in our press release dated January 12, 2026.
Fiber Business. We define Fiber Business as the historically reported Fiber segment, prior to its reclassification to discontinued operations, together with certain supporting assets and personnel. Management has signed the Strategic Fiber Agreement to sell the Fiber Business with EQT Active Core Infrastructure fund ("EQT") acquiring the small cells business and Zayo Group Holdings Inc. ("Zayo") acquiring the fiber solutions business for $8.5 billion in aggregate, subject to certain closing adjustments. The Strategic Fiber Transaction is expected to close in the first half of 2026 subject to certain closing conditions and required government and regulatory approvals. Pending the closing of the Strategic Fiber Transaction, we will continue to operate the Fiber Business in accordance with the Strategic Fiber Agreement.
23
Crown Castle Inc.
Fourth Quarter 2025
COMPANY OVERVIEW
OUTLOOK
FINANCIAL
HIGHLIGHTS
CAPITALIZATION OVERVIEW
APPENDIX
Reconciliation of Historical Adjusted EBITDA:
2024
2025
Twelve Months Ended December 31,
(in millions; totals may not sum due to rounding)
Q1
Q2
Q3
Q4
Q1
Q2
Q3
Q4
2024
2025
Net income (loss)(a)
$
311
$
251
$
303
$
(4,768)
$
(464)
$
291
$
323
$
294
$
(3,903)
$
444
Adjustments to increase (decrease) net income (loss)
Asset write-down charges
6
3
2
1
2
2
3
4
11
11
Depreciation, amortization and accretion
191
180
181
184
177
175
167
170
736
690
Restructuring charges(b)
11
19
38
3
—
—
—
—
70
—
Amortization of prepaid lease purchase price adjustments
4
4
4
4
4
4
4
4
16
15
Interest expense and amortization of deferred financing costs, net(c)
226
230
236
240
236
243
247
246
932
972
Interest income
(4)
(4)
(6)
(5)
(3)
(4)
(3)
(3)
(20)
(13)
Other (income) expense
(2)
(1)
5
23
(1)
(2)
—
—
26
(3)
(Benefit) provision for income taxes
6
5
3
4
5
4
4
3
18
16
Stock-based compensation expense, net
24
26
19
15
18
18
19
17
84
73
(Income) loss from discontinued operations, net of tax(d)
(17)
14
(9)
5,077
748
(26)
(46)
(17)
5,065
659
Adjusted EBITDA(e)(f)
$
754
$
727
$
777
$
777
$
722
$
705
$
718
$
718
$
3,035
$
2,863
Reconciliation of Outlook for Adjusted EBITDA:
(in millions; totals may not sum due to rounding)
Full Year 2026 Outlook(g)
Net income (loss)(h)
$640
to
$920
Adjustments to increase (decrease) net income (loss):
Asset write-down charges
10
to
20
Acquisition and integration costs
(3)
to
3
Depreciation, amortization and accretion
627
to
722
Restructuring charges
25
to
35
Amortization of prepaid lease purchase price adjustments
14
to
16
Interest expense and amortization of deferred financing costs, net(i)
832
to
877
(Gains) losses on retirement of long-term obligations
—
to
—
Interest income
(15)
to
(15)
Other (income) expense
0
to
9
(Benefit) provision for income taxes
11
to
19
Stock-based compensation expense, net
88
to
92
(Income) loss from discontinued operations, net of tax(j)
80
to
360
Adjusted EBITDA(e)(f)
$2,665
to
$2,715
(a)Includes contribution from discontinued operations.
(b)Represents restructuring charges recorded for the periods presented related to (1) the Company's restructuring plan announced in July 2023, as further discussed in the Annual Report on Form 10-K for the fiscal year ended December 31, 2023 ("2023 Restructuring Plan"), and (2) the Company's restructuring plan announced in June 2024, as further discussed in the Annual Report on Form 10-K for the year ended December 31, 2024 ("2024 Restructuring Plan"), as applicable for the respective period. For the three months and full year ended December 31, 2025, there were no charges related to the July 2023 Restructuring Plan or the June 2024 Restructuring Plan. For the full year ended December 31, 2024, there were $9 million and $61 million of restructuring charges related to the July 2023 Restructuring Plan and the June 2024 Restructuring Plan, respectively, relating to continuing operations.
(c)See the reconciliation of "Components of Interest Expense" for a discussion of non-cash interest expense.
(d)Represents results from the Fiber Business, including a loss on disposal of $262 million and $1.6 billion recorded in the three months and full year ended December 31, 2025, respectively.
(e)See discussion and our definition of Adjusted EBITDA in this "Non-GAAP Measures and Other Information."
(f)The above reconciliation excludes line items included in our definition which are not applicable for the periods shown.
(g)As issued on February 4, 2026.
(h)Includes contribution from discontinued operations through June 30, 2026.
(i)See the reconciliation of "Outlook for Components of Interest Expense" for a discussion of non-cash interest expense.
(j)Represents expected results from the Fiber Business, including the estimated loss on disposal, through June 30, 2026.
24
Crown Castle Inc.
Fourth Quarter 2025
COMPANY OVERVIEW
OUTLOOK
FINANCIAL
HIGHLIGHTS
CAPITALIZATION OVERVIEW
APPENDIX
Reconciliation of Historical FFO and AFFO:
(in millions; totals may not sum due to rounding)
2024
2025
Twelve Months Ended December 31,
Q1
Q2
Q3
Q4
Q1
Q2
Q3
Q4
2024
2025
Net income (loss)(a)
$
311
$
251
$
303
$
(4,768)
$
(464)
$
291
$
323
$
294
$
(3,903)
$
444
Real estate related depreciation, amortization and accretion
179
168
170
173
164
162
163
161
690
650
Asset write-down charges
6
3
2
1
2
2
3
4
11
11
(Income) loss from discontinued operations, net of tax(b)
(17)
14
(9)
5,077
748
(26)
(46)
(17)
5,065
659
FFO(c)(d)
$
478
$
436
$
466
$
483
$
451
$
429
$
443
$
442
$
1,863
$
1,764
Weighted-average common shares outstanding—diluted
435
435
436
435
436
437
437
437
434
437
FFO (from above)
$
478
$
436
$
466
$
483
$
451
$
429
$
443
$
442
$
1,863
$
1,764
Adjustments to increase (decrease) FFO:
Straight-lined revenues
(57)
(54)
(28)
(20)
(19)
(20)
11
15
(160)
(12)
Straight-lined expenses
17
17
16
15
15
14
15
14
65
58
Stock-based compensation expense, net
24
26
19
15
18
18
19
17
84
73
Non-cash portion of tax provision
6
—
—
2
5
(5)
2
—
8
1
Non-real estate related depreciation, amortization and accretion
12
12
11
11
13
13
4
9
46
40
Amortization of non-cash interest expense
3
3
2
3
3
4
3
5
12
16
Other (income) expense
(2)
(1)
5
23
(1)
(2)
—
—
26
(3)
Restructuring charges(e)
11
19
38
3
—
—
—
—
70
—
Sustaining capital expenditures
(8)
(9)
(6)
(12)
(7)
(7)
(6)
(14)
(34)
(33)
AFFO(c)(d)
$
484
$
449
$
525
$
523
$
479
$
444
$
490
$
489
$
1,980
$
1,904
Weighted-average common shares outstanding—diluted
435
435
436
435
436
437
437
437
434
437
(a)Includes contribution from discontinued operations.
(b)Represents results from the Fiber Business, including a loss on disposal of $262 million and $1.6 billion recorded in the three months and full year ended December 31, 2025, respectively.
(c)See discussion and our definitions of FFO and AFFO in this "Non-GAAP Measures and Other Information."
(d)The above reconciliation excludes line items included in our definition which are not applicable for the periods shown.
(e)Represents restructuring charges recorded for the periods presented related to the 2023 Restructuring Plan and the 2024 Restructuring Plan, as applicable, for the respective period. For the three months and full year ended December 31, 2025, there were no charges related to the July 2023 Restructuring Plan or the June 2024 Restructuring Plan. For the full year ended December 31, 2024, there were $9 million and $61 million of restructuring charges related to the July 2023 Restructuring Plan and the June 2024 Restructuring Plan, respectively, relating to continuing operations.
25
Crown Castle Inc.
Fourth Quarter 2025
COMPANY OVERVIEW
OUTLOOK
FINANCIAL
HIGHLIGHTS
CAPITALIZATION OVERVIEW
APPENDIX
Reconciliation of Historical FFO and AFFO per share:
(in millions, except per share amounts; totals may not sum due to rounding)
2024
2025
Twelve Months Ended December 31,
Q1
Q2
Q3
Q4
Q1
Q2
Q3
Q4
2024
2025
Net income (loss)(a)
$
0.72
$
0.58
$
0.70
$
(10.97)
$
(1.06)
$
0.67
$
0.74
$
0.67
$
(8.98)
$
1.02
Real estate related depreciation, amortization and accretion
0.41
0.39
0.39
0.40
0.38
0.37
0.37
0.37
1.59
1.49
Asset write-down charges
0.01
0.01
—
—
—
—
0.01
0.01
0.03
0.03
(Income) loss from discontinued operations, net of tax(b)
(0.04)
0.04
(0.02)
11.67
1.72
(0.06)
(0.11)
(0.04)
11.64
1.51
FFO(c)(d)
$
1.10
$
1.00
$
1.07
$
1.11
$
1.03
$
0.98
$
1.01
$
1.01
$
4.28
$
4.04
Weighted-average common shares outstanding—diluted
435
435
436
435
436
437
437
437
434
437
FFO (from above)
$
1.10
$
1.00
$
1.07
$
1.11
$
1.03
$
0.98
$
1.01
$
1.01
$
4.28
$
4.04
Adjustments to increase (decrease) FFO:
Straight-lined revenues
(0.13)
(0.12)
(0.06)
(0.05)
(0.04)
(0.05)
0.03
0.03
(0.37)
(0.03)
Straight-lined expenses
0.04
0.04
0.04
0.03
0.03
0.03
0.03
0.03
0.15
0.13
Stock-based compensation expense, net
0.06
0.06
0.04
0.03
0.04
0.04
0.04
0.04
0.20
0.17
Non-cash portion of tax provision
0.01
—
—
—
0.01
(0.01)
—
—
0.02
—
Non-real estate related depreciation, amortization and accretion
0.03
0.03
0.03
0.03
0.03
0.03
0.01
0.02
0.11
0.09
Amortization of non-cash interest expense
0.01
0.01
—
0.01
0.01
0.01
0.01
0.01
0.03
0.04
Other (income) expense
—
—
0.01
0.05
—
—
—
—
0.06
(0.01)
Restructuring charges(e)
0.03
0.04
0.09
0.01
—
—
—
—
0.16
—
Sustaining capital expenditures
(0.02)
(0.02)
(0.01)
(0.03)
(0.02)
(0.02)
(0.01)
(0.03)
(0.08)
(0.08)
AFFO(c)(d)
$
1.11
$
1.03
$
1.20
$
1.20
$
1.10
$
1.02
$
1.12
$
1.12
$
4.55
$
4.36
Weighted-average common shares outstanding—diluted
435
435
436
435
436
437
437
437
434
437
(a)Includes contribution from discontinued operations.
(b)Represents results from the Fiber Business, including a loss on disposal of $262 million and $1.6 billion recorded in the three months and full year ended December 31, 2025, respectively.
(c)See discussion and our definitions of FFO and AFFO, including per share amounts, in this "Non-GAAP Measures and Other Information."
(d)The above reconciliation excludes line items included in our definition which are not applicable for the periods shown.
(e)Represents restructuring charges recorded for the periods presented related to the 2023 Restructuring Plan and the 2024 Restructuring Plan, as applicable, for the respective period. For the three months and full year ended December 31, 2025, there were no charges related to the July 2023 Restructuring Plan or the June 2024 Restructuring Plan. For the full year ended December 31, 2024, there were $9 million and $61 million of restructuring charges related to the July 2023 Restructuring Plan and the June 2024 Restructuring Plan, respectively, relating to continuing operations.
26
Crown Castle Inc.
Fourth Quarter 2025
COMPANY OVERVIEW
OUTLOOK
FINANCIAL
HIGHLIGHTS
CAPITALIZATION OVERVIEW
APPENDIX
Reconciliation of Outlook for FFO and AFFO:
(in millions, except per share amounts; totals may not sum due to rounding)
Full Year 2026 Outlook(a)
Full Year 2026 Outlook Per Share(a)
Net income (loss)(b)
$640
to
$920
$1.48
to
$2.12
Real estate related depreciation, amortization and accretion
600
to
680
1.39
to
1.57
Asset write-down charges
10
to
20
0.02
to
0.05
(Income) loss from discontinued operations, net of tax(c)
80
to
360
0.18
to
0.83
FFO(d)(e)
$1,640
to
$1,670
$3.79
to
$3.86
Weighted-average common shares outstanding—diluted
433
433
FFO (from above)
$1,640
to
$1,670
$3.79
to
$3.86
Adjustments to increase (decrease) FFO:
Straight-lined revenues
45
to
75
0.10
to
0.17
Straight-lined expenses
45
to
65
0.10
to
0.15
Stock-based compensation expense, net
88
to
92
0.20
to
0.21
Non-cash portion of tax provision
(8)
to
8
(0.02)
to
0.02
Non-real estate related depreciation, amortization and accretion
27
to
42
0.06
to
0.10
Amortization of non-cash interest expense
15
to
25
0.03
to
0.06
Other (income) expense
0
to
9
0.00
to
0.02
(Gains) losses on retirement of long-term obligations
—
to
—
—
to
—
Acquisition and integration costs
(3)
to
3
(0.01)
to
0.01
Restructuring charges
25
to
35
0.06
to
0.08
Sustaining capital expenditures
(45)
to
(25)
(0.10)
to
(0.06)
AFFO(d)(e)
$1,895
to
$1,945
$4.38
to
$4.49
Weighted-average common shares outstanding—diluted
433
433
Reconciliation of Net Debt:
(as of December 31, 2025; dollars in millions)
December 31, 2025
Total debt and other obligations (current and non-current)(f)
$
24,337
Unamortized adjustments, net
129
Total face value of debt
24,466
Less: Ending cash and cash equivalents and restricted cash and cash equivalents(g)
274
Net Debt(d)
$
24,192
(a)As issued on February 4, 2026.
(b)Includes contribution from discontinued operations through June 30, 2026.
(c)Represents expected results from the Fiber Business, including the estimated loss on disposal, through June 30, 2026.
(d)See discussion and our definitions of FFO and AFFO, including per share amounts, and Net Debt in this "Non-GAAP Measures and Other Information."
(e)The above reconciliation excludes line items included in our definition which are not applicable for the period shown.
(f)As of December 31, 2025, excludes $29 million presented in discontinued operations relating to the Fiber Business.
(g)As of December 31, 2025, excludes $34 million presented in discontinued operations relating to the Fiber Business.
27
Crown Castle Inc.
Fourth Quarter 2025
COMPANY OVERVIEW
OUTLOOK
FINANCIAL
HIGHLIGHTS
CAPITALIZATION OVERVIEW
APPENDIX
Reconciliation of Adjusted Site Rental Gross Margin and Adjusted Services and Other Gross Margin:
Three Months Ended December 31,
Twelve Months Ended December 31,
(In millions of dollars; totals may not sum due to rounding)
2025
2024
2025
2024
Net income (loss)(a)
$
294
$
(4,768)
$
444
$
(3,903)
Adjustments to increase (decrease) income (loss):
Services and other revenues
(53)
(49)
(215)
(192)
Services and other costs of operations
29
26
113
107
Selling, general and administrative expenses
94
92
383
435
Asset write-down charges
4
1
11
11
Depreciation, amortization and accretion
170
184
690
736
Restructuring charges
—
3
—
70
Amortization of prepaid lease purchase price adjustments
4
4
15
16
Interest expense and amortization of deferred financing costs, net
246
240
972
932
Interest income
(3)
(5)
(13)
(20)
Other (income) expense
—
23
(3)
26
(Benefit) provision for income taxes
3
4
16
18
Stock-based compensation expense, net recorded in site rental costs of operations
1
1
4
4
(Income) loss from discontinued operations, net of tax
(17)
5,077
659
5,065
Adjusted Site Rental Gross Margin(b)(c)
$
772
$
834
$
3,076
$
3,307
Three Months Ended December 31,
Twelve Months Ended December 31,
(In millions of dollars; totals may not sum due to rounding)
2025
2024
2025
2024
Net income (loss)(a)
$
294
$
(4,768)
$
444
$
(3,903)
Adjustments to increase (decrease) net income (loss):
Site rental revenues
(1,019)
(1,070)
(4,049)
(4,268)
Site rental costs of operations(d)
252
242
992
983
Selling, general and administrative expenses
94
92
383
435
Asset write-down charges
4
1
11
11
Depreciation, amortization and accretion
170
184
690
736
Restructuring charges
—
3
—
70
Interest expense and amortization of deferred financing costs, net
246
240
972
932
Interest income
(3)
(5)
(13)
(20)
Other (income) expense
—
23
(3)
26
(Benefit) provision for income taxes
3
4
16
18
Stock-based compensation expense, net recorded in services and other costs of operations
1
1
5
6
(Income) loss from discontinued operations, net of tax
(17)
5,077
659
5,065
Adjusted Services and Other Gross Margin(b)(c)
$
25
$
24
$
107
$
91
(a)Includes contribution from discontinued operations.
(b)See discussion and our definition of Adjusted Site Rental Gross Margin and Adjusted Services and Other Gross Margin in this "Non-GAAP Measures and Other Information."
(c)The above reconciliation excludes line items included in our definition which are not applicable for the periods shown.
(d)Exclusive of depreciation, amortization and accretion shown separately.
28
Crown Castle Inc.
Fourth Quarter 2025
COMPANY OVERVIEW
OUTLOOK
FINANCIAL
HIGHLIGHTS
CAPITALIZATION OVERVIEW
APPENDIX
Reconciliation of Historical Free Cash Flow from Discontinued Operations:
Twelve Months Ended December 31,
(in millions of dollars; totals may not sum due to rounding)
2025
2024
Net cash provided by (used for) operating activities from discontinued operations
$
1,185
$
1,123
Net cash provided by (used for) investing activities from discontinued operations
(980)
(1,045)
Free Cash Flow from Discontinued Operations(a)
$
205
$
78
Reconciliation of Outlook for Free Cash Flow from Discontinued Operations:
(in millions of dollars; totals may not sum due to rounding)
Full Year 2026 Outlook(b)
Net cash provided by (used for) operating activities from discontinued operations
$500
to
$600
Net cash provided by (used for) investing activities from discontinued operations
(600)
to
(500)
Free Cash Flow from Discontinued Operations(a)
$(100)
to
$100
(a)See discussion and our definition of Free Cash Flow from Discontinued Operations in "Non-GAAP Measures and Other Information."