
Investor Presentation Third Quarter 2025 .2
Forward Looking Statement Disclaimer and Basis of Presentation • This presentation contains forward-looking statements within the meaning of the Private Securities Litigation Reform Act of 1995 about Heritage Bank (the "Bank") and its holding company, Heritage Commerce Corp (the "Company"). Forward-looking statements are based on management’s knowledge, assumptions and beliefs as of today and include information concerning the possible or assumed future financial condition, results of operations, business and earnings outlook for the Company and the Bank. These forward-looking statements are subject to risks and uncertainties. For a discussion of risk factors which could cause results to differ, please see the Company’s reports on Forms 10-K and 10-Q as filed with the Securities and Exchange Commission and the Company’s press releases. Readers should not place undue reliance on the forward-looking statements, which reflect management's view only as of the date hereof. The Company undertakes no obligation to publicly revise these forward-looking statements to reflect subsequent events or circumstances. • Financial results are presented in accordance with accounting principles generally accepted in the United States of America (“GAAP”) and prevailing practices in the banking industry. However, certain non-GAAP performance measures and ratios are used by management to evaluate and measure the Company’s performance. These measures include “adjusted” operating metrics that have been adjusted to exclude notable expenses incurred in the second quarter of 2025 as well as other performance measures and ratios adjusted for notable items. Management believes these non-GAAP financial measures enhance comparability between periods and in some instances are common in the banking industry. These non-GAAP financial measures should be supplemental to primary GAAP financial measures and should not be read in isolation or relied upon as a substitute for primary GAAP financial measures. A reconciliation of GAAP to non-GAAP financial measures are also presented in the Company’s third quarter earnings release, which is available on the Company’s website at https://heritagecommercecorp.com. 2
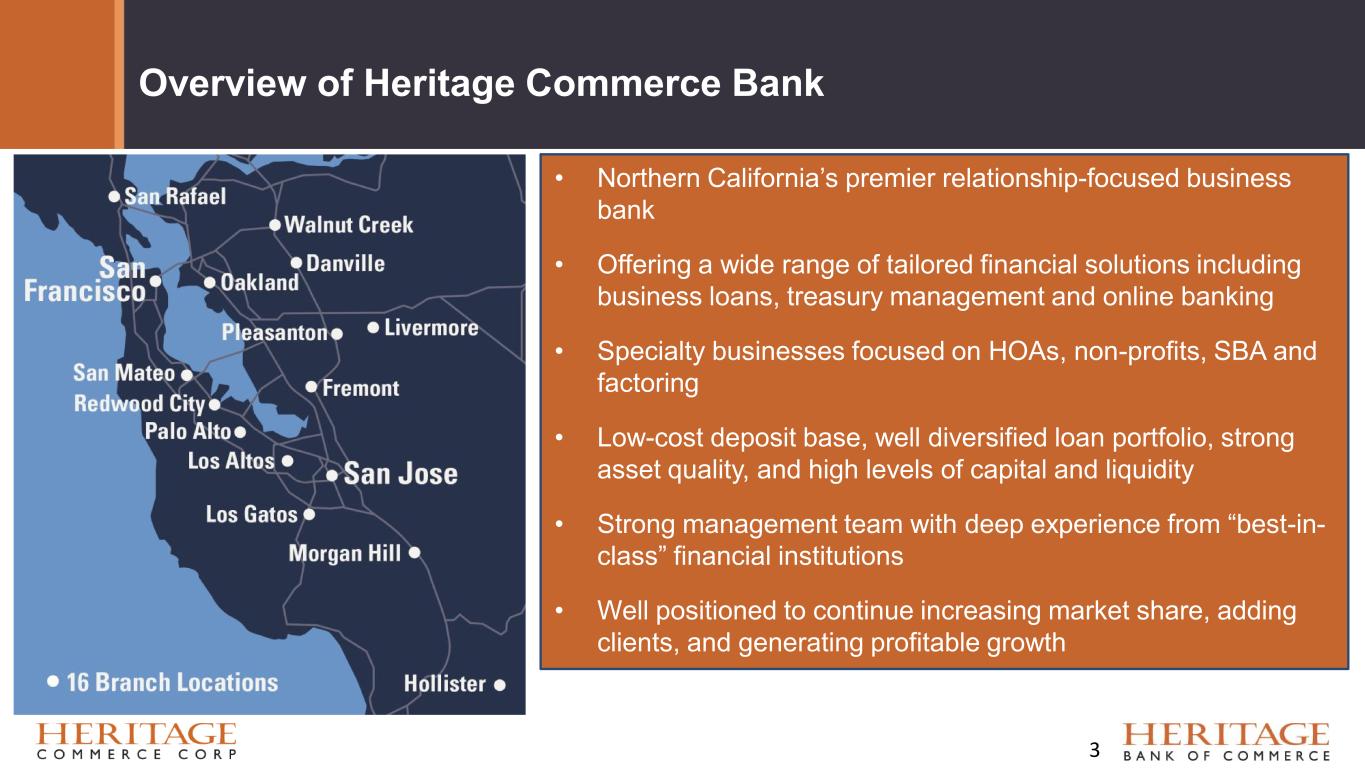
Overview of Heritage Commerce Bank 3 • Northern California’s premier relationship-focused business bank • Offering a wide range of tailored financial solutions including business loans, treasury management and online banking • Specialty businesses focused on HOAs, non-profits, SBA and factoring • Low-cost deposit base, well diversified loan portfolio, strong asset quality, and high levels of capital and liquidity • Strong management team with deep experience from “best-in- class” financial institutions • Well positioned to continue increasing market share, adding clients, and generating profitable growth
Heritage Commerce Corp Profile • History: • Heritage Bank of Commerce, recently celebrated its 30th anniversary as a community business bank headquartered in San Jose, California. The bank was founded in 1994. • Relationship Banking: • We offer a full range of banking using a “consultative” relationship banking approach. • Customer Clientele: • Small to medium-sized closely held businesses (and their principals and key employees) • Professional organizations • High net worth individuals • Non-profits • Specialty Expertise: • Cash Management • Construction Lending • Corporate Finance/Asset-Based Lending • Factoring • Homeowner Association Services (“HOA”) • Non-profit organizations, schools, and churches • Small Business Administration (“SBA”) Lending Honors / Awards: • Recognized on Forbes’ List of World’s Best Banks 2024 • Ranked 25th on S&P Global Market Intelligence’s Top 50 list of best- performing community banks 2024 • In May 2024, Kroll Bond Rating Agency, LLC (“KBRA”) affirmed the Company’s senior unsecured debt rating of BBB+, the subordinated debt rating of BBB, and the short-term debt rating of K2 • Earned the Raymond James Community Bankers Cup for 2022-2024, which recognizes the top 10% of community banks in the nation based on profitability, operational efficiency and balance sheet metrics 4

Management Team Robertson Clay Jones President and Chief Executive Officer Chris Edmonds-Waters Executive Vice President Chief People & Culture Deborah K. Reuter Executive Vice President Chief Risk Officer Janisha Sabnani Executive Vice President General Counsel Sachin Vaidya Executive Vice President Chief Information Officer Karol Watson Executive Vice President Branch Operations Tom Sa Executive Vice President Chief Operating Officer Glen E. Shu Executive Vice President President, Specialty Finance Group Dustin Warford Executive Vice President Chief Banking Officer Mr. Jones, Mr. Fonti, Ms. Reuter, Mr. Sa, and Ms. Sabnani are officers of the Company and the Bank 5 Seth Fonti Executive Vice President Chief Financial Officer Susan Just Executive Vice President Chief Credit Officer
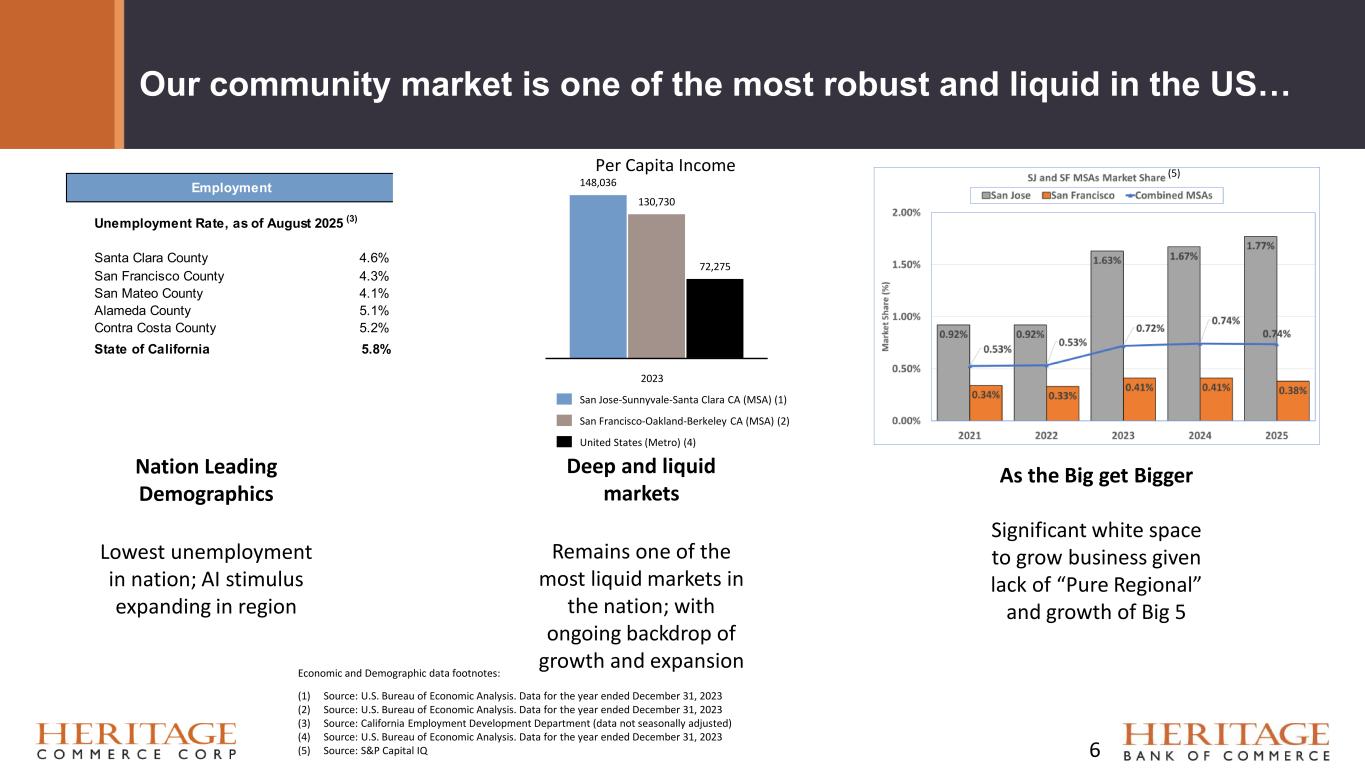
Our community market is one of the most robust and liquid in the US… 6 Nation Leading Demographics Lowest unemployment in nation; AI stimulus expanding in region Deep and liquid markets Remains one of the most liquid markets in the nation; with ongoing backdrop of growth and expansion As the Big get Bigger Significant white space to grow business given lack of “Pure Regional” and growth of Big 5 148,036 130,730 72,275 2023 San Jose-Sunnyvale-Santa Clara CA (MSA) (1) San Francisco-Oakland-Berkeley CA (MSA) (2) United States (Metro) (4) Per Capita Income Employment Unemployment Rate, as of August 2025 (3) Santa Clara County 4.6% San Francisco County 4.3% San Mateo County 4.1% Alameda County 5.1% Contra Costa County 5.2% State of California 5.8% Economic and Demographic data footnotes: (1) Source: U.S. Bureau of Economic Analysis. Data for the year ended December 31, 2023 (2) Source: U.S. Bureau of Economic Analysis. Data for the year ended December 31, 2023 (3) Source: California Employment Development Department (data not seasonally adjusted) (4) Source: U.S. Bureau of Economic Analysis. Data for the year ended December 31, 2023 (5) Source: S&P Capital IQ (5)
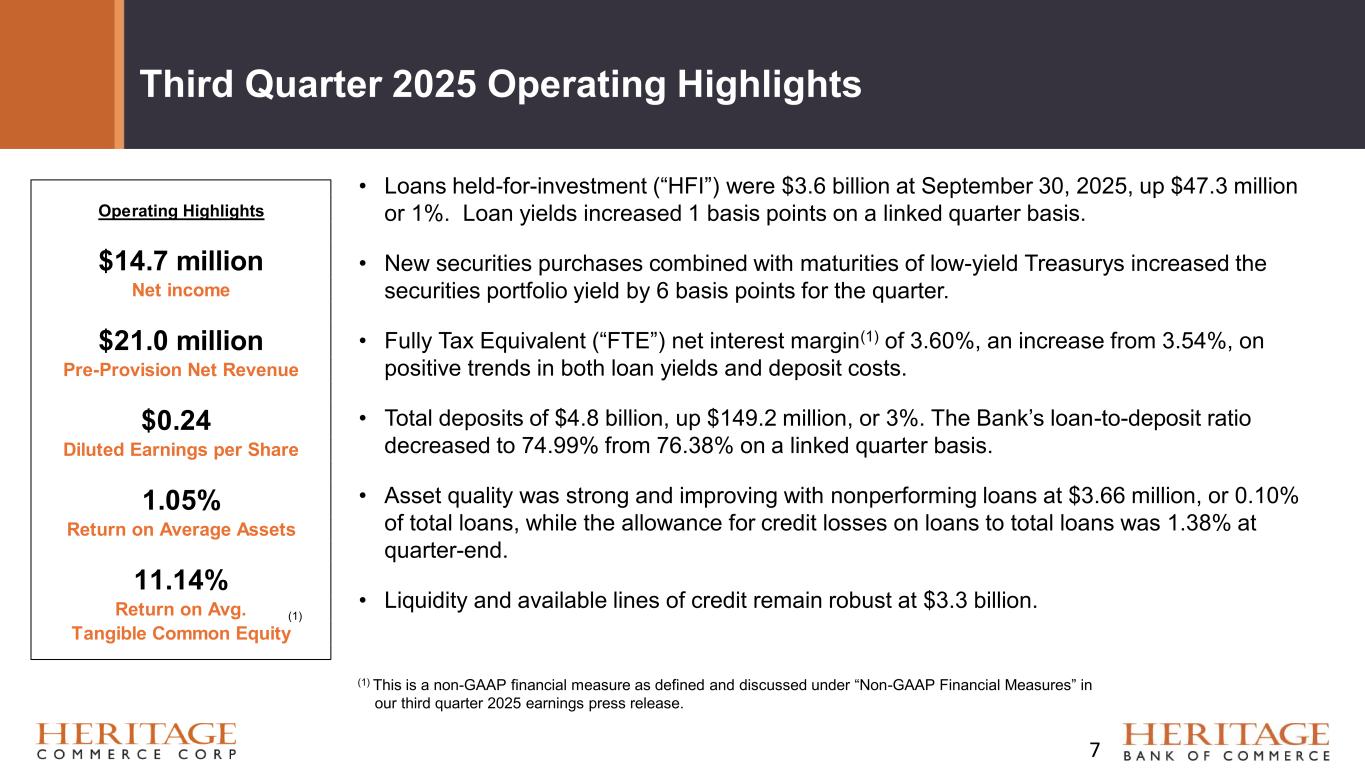
• Loans held-for-investment (“HFI”) were $3.6 billion at September 30, 2025, up $47.3 million or 1%. Loan yields increased 1 basis points on a linked quarter basis. • New securities purchases combined with maturities of low-yield Treasurys increased the securities portfolio yield by 6 basis points for the quarter. • Fully Tax Equivalent (“FTE”) net interest margin(1) of 3.60%, an increase from 3.54%, on positive trends in both loan yields and deposit costs. • Total deposits of $4.8 billion, up $149.2 million, or 3%. The Bank’s loan-to-deposit ratio decreased to 74.99% from 76.38% on a linked quarter basis. • Asset quality was strong and improving with nonperforming loans at $3.66 million, or 0.10% of total loans, while the allowance for credit losses on loans to total loans was 1.38% at quarter-end. • Liquidity and available lines of credit remain robust at $3.3 billion. Third Quarter 2025 Operating Highlights (1) This is a non-GAAP financial measure as defined and discussed under “Non-GAAP Financial Measures” in our third quarter 2025 earnings press release. 7 Operating Highlights $14.7 million Net income $21.0 million Pre-Provision Net Revenue $0.24 Diluted Earnings per Share 1.05% Return on Average Assets 11.14% Return on Avg. Tangible Common Equity (1)
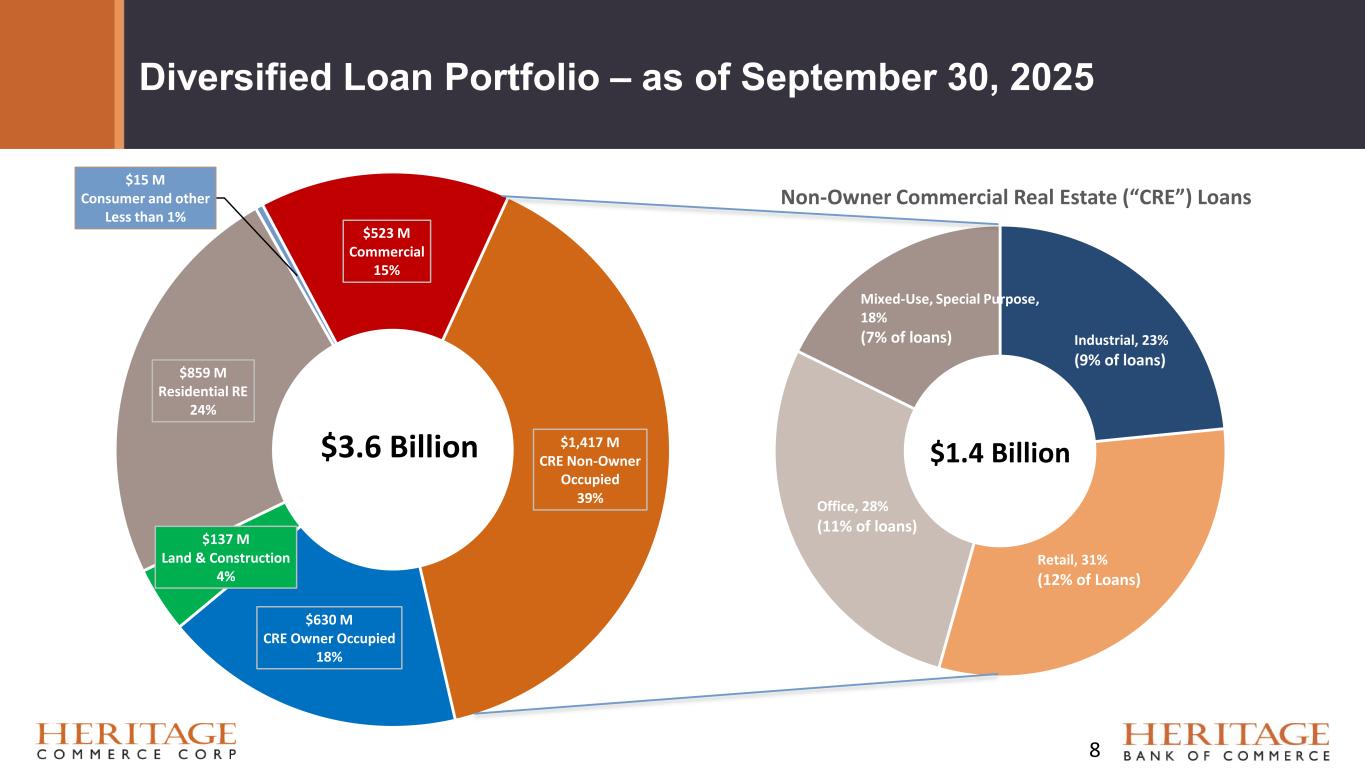
Diversified Loan Portfolio – as of September 30, 2025 Industrial, 23% (9% of loans) Retail, 31% (12% of Loans) Office, 28% (11% of loans) Mixed-Use, Special Purpose, 18% (7% of loans) Non-Owner Commercial Real Estate (“CRE”) Loans $1.4 Billion $523 M Commercial 15% $1,417 M CRE Non-Owner Occupied 39% $630 M CRE Owner Occupied 18% $137 M Land & Construction 4% $859 M Residential RE 24% $15 M Consumer and other Less than 1% $3.6 Billion 8
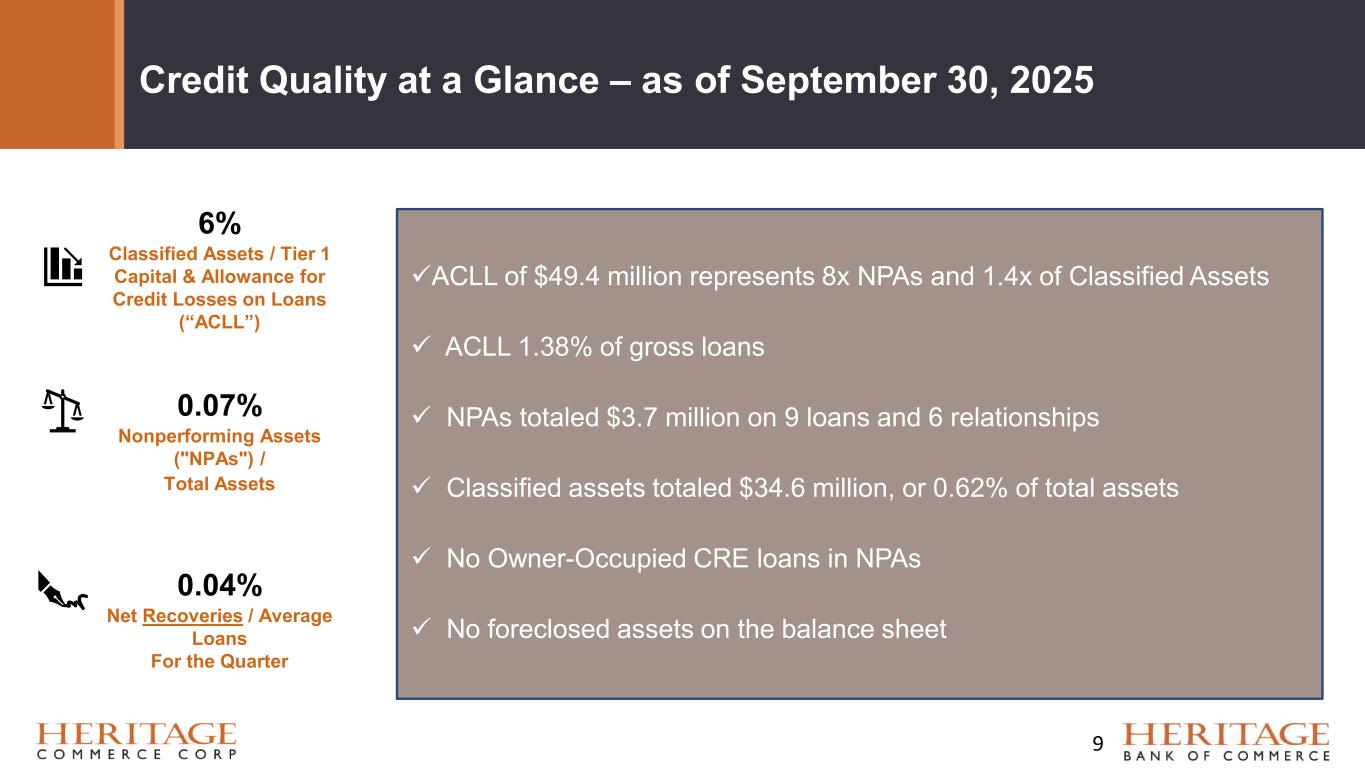
Credit Quality at a Glance – as of September 30, 2025 ✓ACLL of $49.4 million represents 8x NPAs and 1.4x of Classified Assets ✓ ACLL 1.38% of gross loans ✓ NPAs totaled $3.7 million on 9 loans and 6 relationships ✓ Classified assets totaled $34.6 million, or 0.62% of total assets ✓ No Owner-Occupied CRE loans in NPAs ✓ No foreclosed assets on the balance sheet 6% Classified Assets / Tier 1 Capital & Allowance for Credit Losses on Loans (“ACLL”) 0.07% Nonperforming Assets ("NPAs") / Total Assets 0.04% Net Recoveries / Average Loans For the Quarter 9
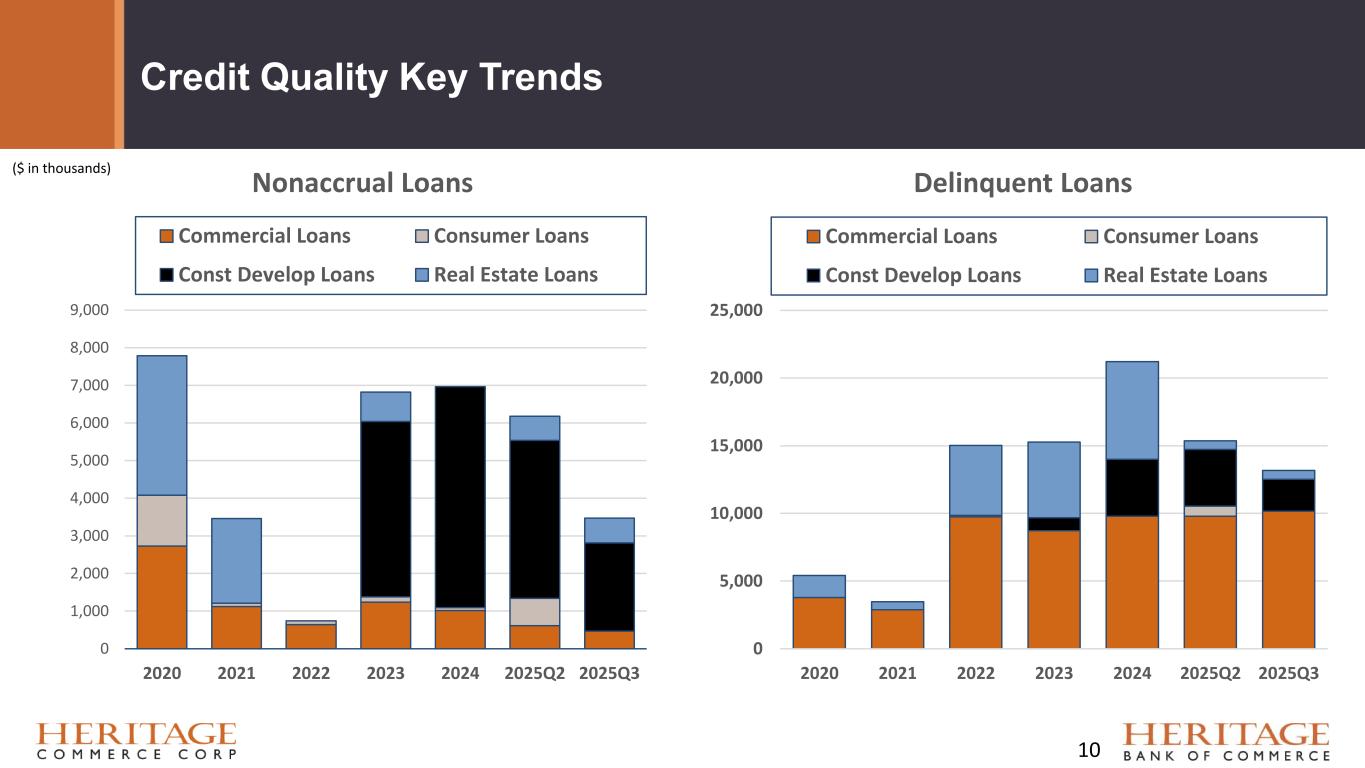
Credit Quality Key Trends ($ in thousands) 10 0 5,000 10,000 15,000 20,000 25,000 2020 2021 2022 2023 2024 2025Q2 2025Q3 Delinquent Loans Commercial Loans Consumer Loans Const Develop Loans Real Estate Loans 0 1,000 2,000 3,000 4,000 5,000 6,000 7,000 8,000 9,000 2020 2021 2022 2023 2024 2025Q2 2025Q3 Nonaccrual Loans Commercial Loans Consumer Loans Const Develop Loans Real Estate Loans
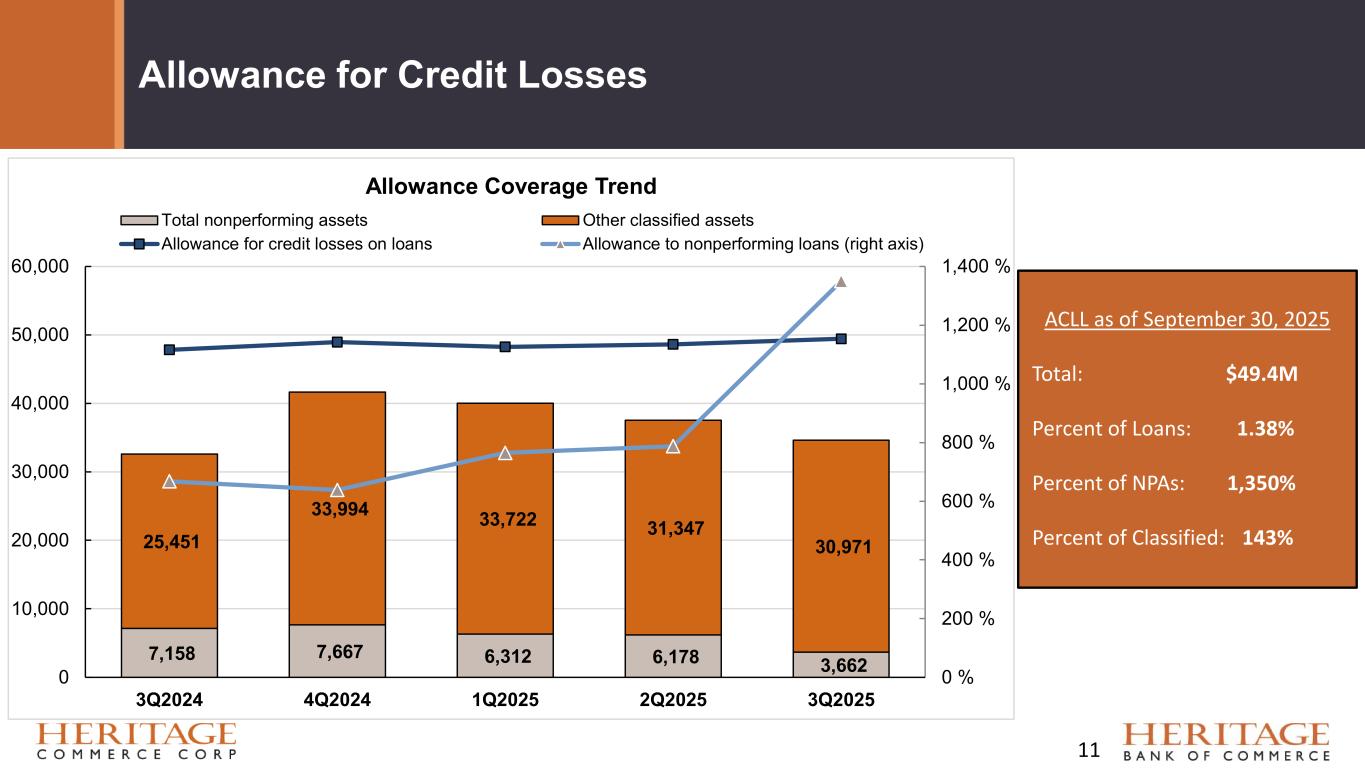
Allowance for Credit Losses ACLL as of September 30, 2025 Total: $49.4M Percent of Loans: 1.38% Percent of NPAs: 1,350% Percent of Classified: 143% 11 7,158 7,667 6,312 6,178 3,662 25,451 33,994 33,722 31,347 30,971 0 % 200 % 400 % 600 % 800 % 1,000 % 1,200 % 1,400 % 0 10,000 20,000 30,000 40,000 50,000 60,000 3Q2024 4Q2024 1Q2025 2Q2025 3Q2025 Allowance Coverage Trend Total nonperforming assets Other classified assets Allowance for credit losses on loans Allowance to nonperforming loans (right axis)
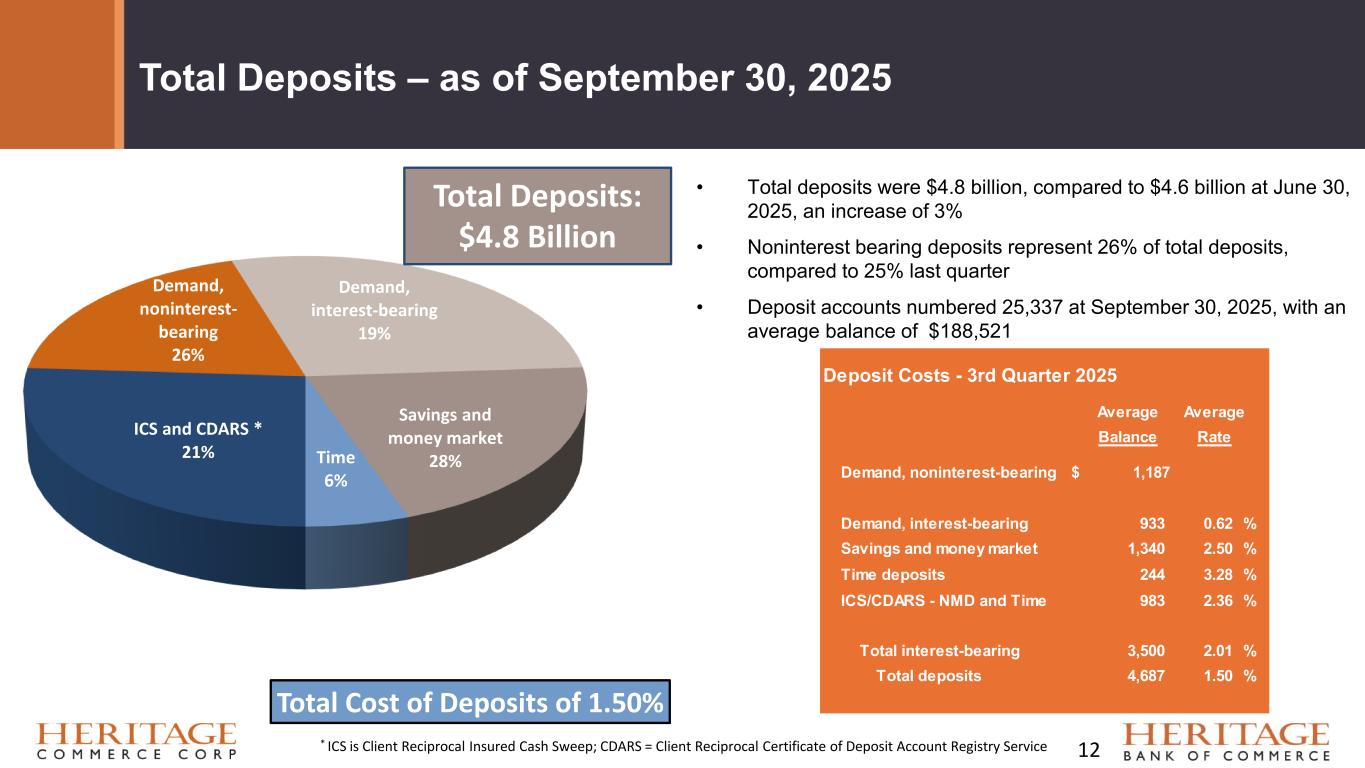
Demand, noninterest- bearing 26% Demand, interest-bearing 19% Savings and money market 28% ICS and CDARS * 21% Time 6% Total Cost of Deposits of 1.50% Total Deposits – as of September 30, 2025 • Total deposits were $4.8 billion, compared to $4.6 billion at June 30, 2025, an increase of 3% • Noninterest bearing deposits represent 26% of total deposits, compared to 25% last quarter • Deposit accounts numbered 25,337 at September 30, 2025, with an average balance of $188,521 Total Deposits: $4.8 Billion * ICS is Client Reciprocal Insured Cash Sweep; CDARS = Client Reciprocal Certificate of Deposit Account Registry Service 12 Deposit Costs - 3rd Quarter 2025 Average Average Balance Rate Demand, noninterest-bearing $ 1,187 Demand, interest-bearing 933 0.62 % Savings and money market 1,340 2.50 % Time deposits 244 3.28 % ICS/CDARS - NMD and Time 983 2.36 % Total interest-bearing 3,500 2.01 % Total deposits 4,687 1.50 %
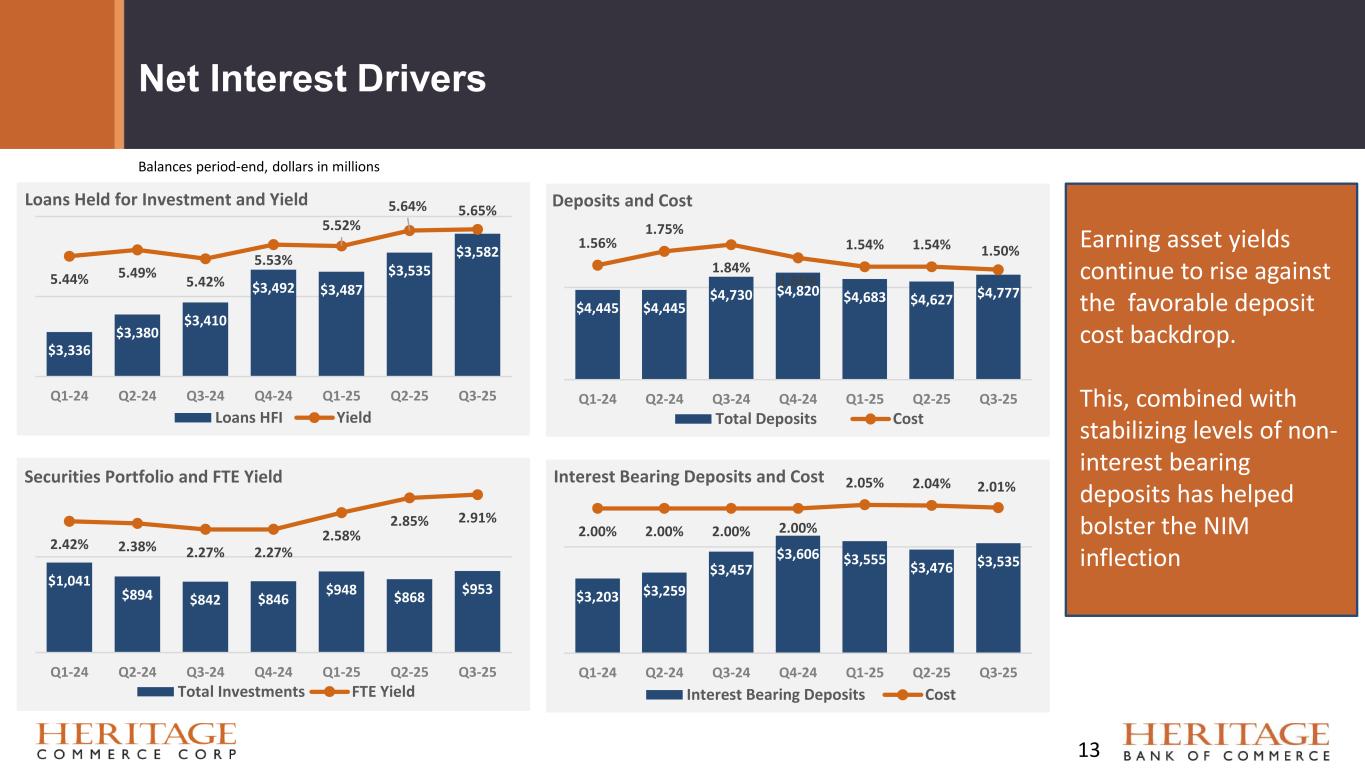
Net Interest Drivers $3,336 $3,380 $3,410 $3,492 $3,487 $3,535 $3,582 5.44% 5.49% 5.42% 5.53% 5.52% 5.64% 5.65% Q1-24 Q2-24 Q3-24 Q4-24 Q1-25 Q2-25 Q3-25 Loans Held for Investment and Yield Loans HFI Yield $1,041 $894 $842 $846 $948 $868 $953 2.42% 2.38% 2.27% 2.27% 2.58% 2.85% 2.91% Q1-24 Q2-24 Q3-24 Q4-24 Q1-25 Q2-25 Q3-25 Securities Portfolio and FTE Yield Total Investments FTE Yield $4,445 $4,445 $4,730 $4,820 $4,683 $4,627 $4,777 1.56% 1.75% 1.84% 1.66% 1.54% 1.54% 1.50% Q1-24 Q2-24 Q3-24 Q4-24 Q1-25 Q2-25 Q3-25 Deposits and Cost Total Deposits Cost $3,203 $3,259 $3,457 $3,606 $3,555 $3,476 $3,535 2.00% 2.00% 2.00% 2.00% 2.05% 2.04% 2.01% Q1-24 Q2-24 Q3-24 Q4-24 Q1-25 Q2-25 Q3-25 Interest Bearing Deposits and Cost Interest Bearing Deposits Cost Balances period-end, dollars in millions 13 Earning asset yields continue to rise against the favorable deposit cost backdrop. This, combined with stabilizing levels of non- interest bearing deposits has helped bolster the NIM inflection
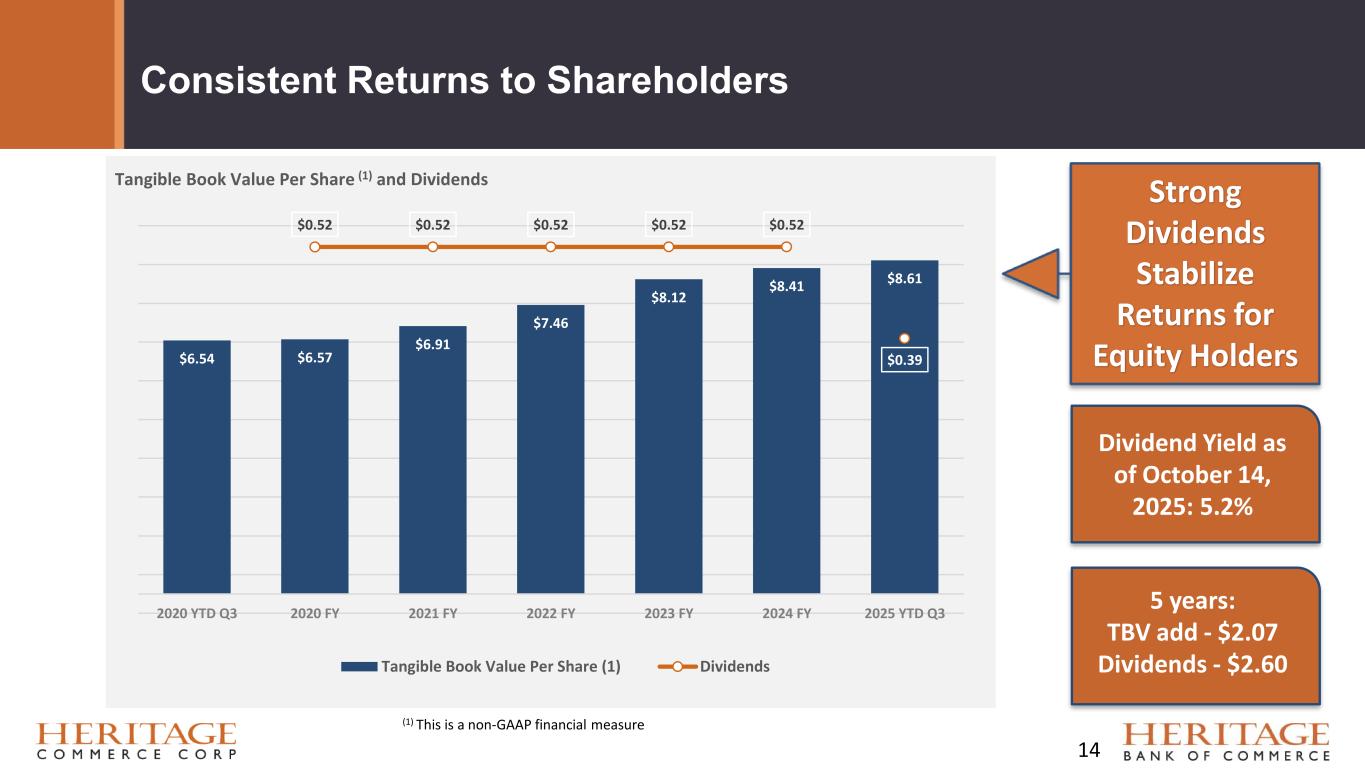
Consistent Returns to Shareholders Strong Dividends Stabilize Returns for Equity Holders Dividend Yield as of October 14, 2025: 5.2% $6.54 $6.57 $6.91 $7.46 $8.12 $8.41 $8.61 $0.52 $0.52 $0.52 $0.52 $0.52 $0.39 2020 YTD Q3 2020 FY 2021 FY 2022 FY 2023 FY 2024 FY 2025 YTD Q3 Tangible Book Value Per Share (1) and Dividends Tangible Book Value Per Share (1) Dividends 14 (1) This is a non-GAAP financial measure 5 years: TBV add - $2.07 Dividends - $2.60
Positioned for Continued Growth • Small to medium-sized business customer relationship focus in vibrant economic geography • Competitive loan and deposit/cash management products catering to businesses • Diversified specialty business units • Highly experienced management team throughout the company • Solid capital and liquidity management • 15.1% total capital ratio calculated using Basel III regulatory requirements at September 30, 2025 • 75% loan-to-deposit ratio at September 30, 2025 • Quarterly common dividend of $0.13 per share in the third quarter of 2025 • Excellent locations and markets with solid market share among community banks • 16 branch locations • San Jose-Sunnyvale-Santa Clara and San Francisco-Oakland-Berkeley MSA’s are first and second in the state of California with highest median household income and per capita income • The Bay Area counties the Bank operates in are ranked the highest in California for personal income 15
Long-Term Strategic Goals Drive Operating Leverage to enhance profitability Focus on high-quality loan and deposit growth Scale via organic growth and acquisitions to gain efficiency Grow non-interest income through best-in-class service levels Invest in talent and emerging technology A disciplined and strategic approach to delivering value long-term 16

For more information email: InvestorRelations@herbank.com 17