
.2
1First BanCorp Financial Results Fourth Quarter and Full Year 2025 January 27, 2026 1
Forward Looking Statements This presentation contains “forward -looking statements” concerning the Corporation’s future economic, operational and financial performance. The words or phrases “expect,” “anticipate,” “intend,” “should,” “would,” “will,” “plans,” “forecast,” “believe” and similar expressions are meant to identify “forward-looking statements” within the meaning of Section 27A of the Securities Act of 1933, as amended, and Section 21E of the Securities Exchange Act of 1934, as amended, and are subject to the safe harbor created by such sections. The Corporation cautions readers not to place undue reliance on any such forward -looking statements, which speak only as of the date hereof, and advises readers that any such forward-looking statements are not guarantees of future performance and involve certain risks, uncertainties, estimates and assumptions by us that are difficult to predict. Various factors, some of which are beyond our control, including, but not limited to, the uncertainties more fully discussed in Part I, Item 1A, “Risk Factors” of the Corporation’s Annual Report on Form 10-K for the year ended December 31, 2024, and the following, could cause actual results to differ materially from those expressed in, or implied by, such forward-looking statements: the effect of the current global interest rate environment (including the potential for ongoing reductions in interest rates) and inflation levels on the level, composition and performance of the Corporation’s assets and liabilities, and corresponding effects on the Corporation’s net interest income, net interest margin, loan originations, deposit attrition, overall results of operations, and liquidity position; the effects of changes in the interest rate environment, including any adverse change in the Corporation’s ability to attract and retain clients and gain acceptance from current and prospective customers for new products and services,
including those related to the offering of digital banking and financial services; volatility in the financial services industry, which could result in, among other things, bank deposit runoffs, liquidity constraints, and increased regulatory requirements and costs; uncertainty as to the ability of FirstBank to retain its core deposits and generate sufficient cash flow through its wholesale funding sources, which may require us to sell investment securities at a loss; adverse changes in general political and economic conditions in Puerto Rico, the U.S., and the U.S. and British Virgin Islands, including in the interest rate environment, unemployment rates, market liquidity, housing absorption rates, real estate markets and U.S. capital markets; general competitive factors and other market risks as well as the implementation of existent or planned strategic growth opportunities, including risks, uncertainties, and other factors or events related to any business acquisitions, dispositions, strategic partnerships, strategic operational investments including system conversions, and any anticipated efficiencies or other expected results related thereto; the impact of litigation or the threat of litigation, including any settlements or judgements against the Corporation, and the potential resulting adverse publicity or other reputational harm; uncertainty as to the implementation of the debt restructuring plan of Puerto Rico and the Fiscal Plan for Puerto Rico as certified on June 6, 2025 by the Financial Oversight and Management Board for Puerto Rico, or any revisions to it, on our clients and loan portfolios, and any potential impact from future economic or political developments and tax regulations in Puerto Rico; the impact of government financial assistance for hurricane recovery and other disaster relief on economic activity in Puerto Rico; the timing of sales of properties from our other real estate owned (“OREO”) portfolio; the impacts
of applicable legislative, tax or regulatory changes on the Corporation’s financial condition or performance; and the effect of continued changes in the fiscal, monetary, and trade policies and regulations of the U.S. federal government, the Puerto Rico government and other governments. The Corporation does not undertake and specifically disclaims any obligation to update any “forward -looking statements” to reflect occurrences or unanticipated events or circumstances after the date of such statements, except as required by the federal securities laws. Non-GAAP Financial Measures In addition to the Corporation’s financial information presented in accordance with GAAP, management uses certain “non-GAAP” financial measures” within the meaning of Regulation G promulgated by the SEC, to clarify and enhance understanding of past perform ance and prospects for the future. Please refer to pages 15-18 for a reconciliation of GAAP to non-GAAP measures and calculations. 2

Agenda 1 4Q 2025 – Quarter Highlights Aurelio Alemán, President and Chief Executive Officer 2 4Q 2025 – Results of Operations Orlando Berges, Executive Vice President and Chief Financial Officer 3 4Q 2025 – Questions and Answers 3
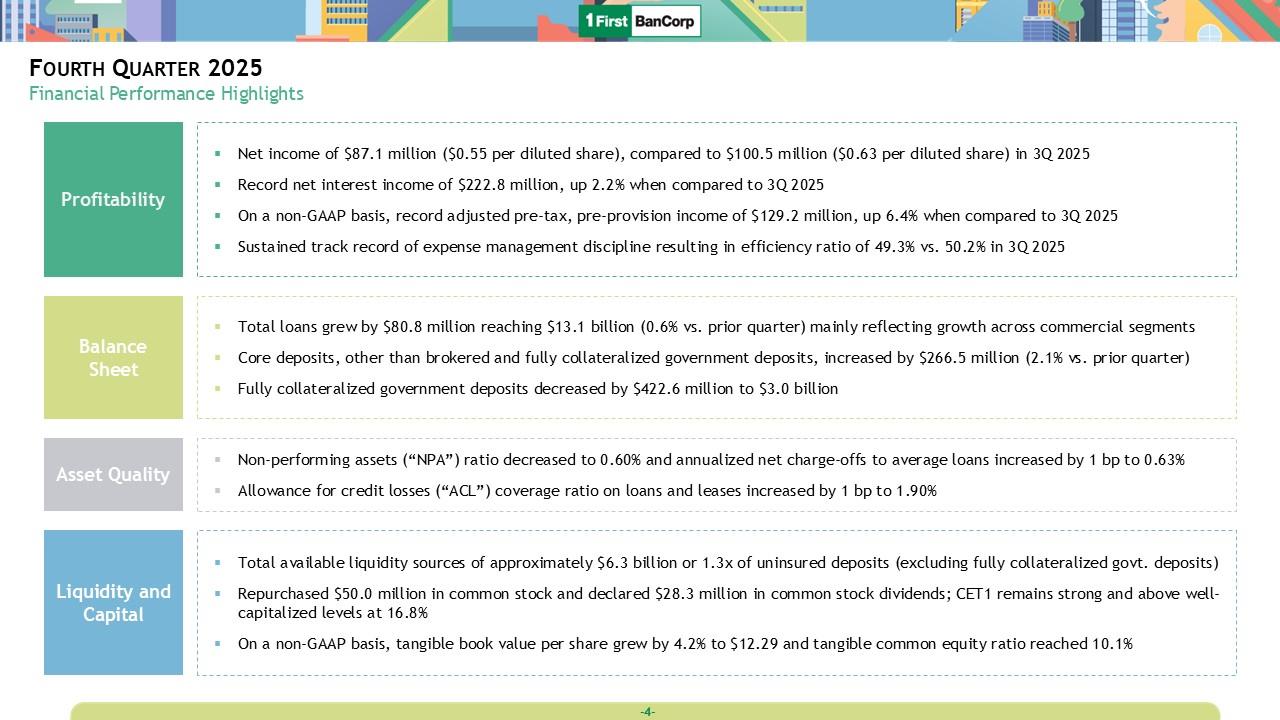
Fourth Quarter 2025 Financial Performance Highlights Profitability Net income of $87.1 million ($0.55 per diluted share), compared to $100.5 million ($0.63 per diluted share) in 3Q 2025 Record net interest income of $222.8 million, up 2.2% when compared to 3Q 2025 On a non-GAAP basis, record adjusted pre-tax, pre-provision income of $129.2 million, up 6.4% when compared to 3Q 2025 Sustained track record of expense management discipline resulting in efficiency ratio of 49.3% vs. 50.2% in 3Q 2025 Balance Sheet Total loans grew by $80.8 million reaching $13.1 billion (0.6% vs. prior quarter) mainly reflecting growth across commercial segments Core deposits, other than brokered and fully collateralized government deposits, increased by $266.5 million (2.1% vs. prior quarter) Fully collateralized government deposits decreased by $422.6 million to $3.0 billion Asset Quality Non-performing assets (“NPA”) ratio decreased to 0.60% and annualized net charge-offs to average loans increased by 1 bp to 0.63% Allowance for credit losses (“ACL”) coverage ratio on loans and leases increased by 1 bp to 1.90% Liquidity and Capital Total available liquidity sources of approximately $6.3 billion or 1.3x of uninsured deposits (excluding fully collateralized govt. deposits) Repurchased $50.0 million in common stock and declared $28.3 million in common stock dividends; CET1 remains strong and above well-capitalized levels at 16.8% On a non-GAAP basis, tangible book value per share grew by 4.2% to $12.29 and tangible common equity ratio reached 10.1% 4
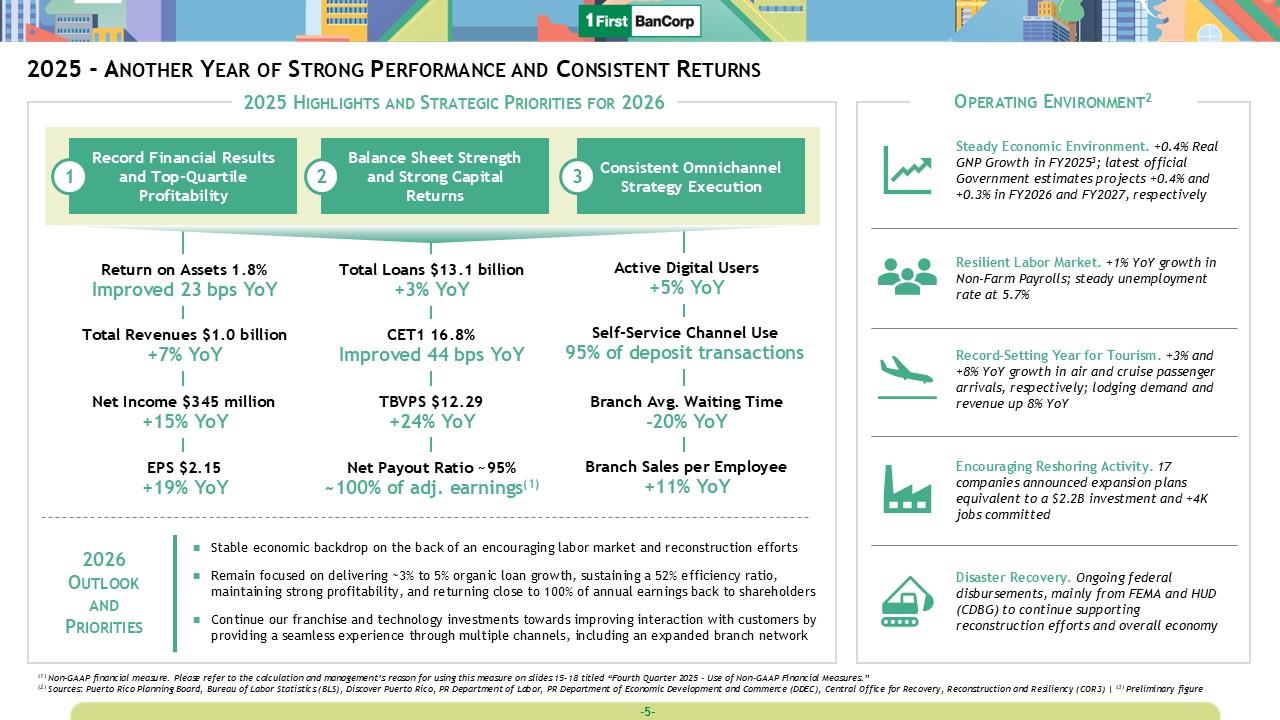
2025 - Another Year of Strong Performance and Consistent Returns 2025 Highlights and Strategic Priorities for 2026 2026 Outlook and Priorities Stable economic backdrop on the back of an encouraging labor market and reconstruction efforts Remain focused on delivering ~3% to 5% organic loan growth, sustaining a 52% efficiency ratio, maintaining strong profitability, and returning close to 100% of annual earnings back to shareholders Continue our franchise investments towards improving interaction with customers by providing a seamless experience through multiple channels Operating Environment2 Record Financial Results and Top-Quartile Profitability 1 Balance Sheet Strength and Strong Capital Returns 2 Consistent Omnichannel Strategy Execution 3 Net Income $345 million +15% YoY EPS $2.15 +19% YoY Total Revenues $1.0 billion +7% YoY Return on Assets 1.8% Improved 23 bps YoY TBVPS $12.29 +24% YoY Net Payout Ratio ~95% ~100% of adj. earnings(1) CET1 16.8% Improved 44 bps YoY Total Loans $13.1 billion +3% YoY Branch Sales per Employee +11% YoY Self-Service Channel Use 95% of deposit transactions Active Digital Users +5% YoY Branch Avg. Waiting Time -20% YoY (1) Non-GAAP financial measure. Please refer to the calculation and management’s reason for using this measure on page Slides 15-18 titled “Fourth Quarter 2025 - Use of Non-GAAP Financial Measures.” (2) Sources: Puerto Rico Planning Board, Bureau of Labor Statistics (BLS), Discover Puerto Rico, PR Department of Labor, PR Department of Economic Development and Commerce (DDEC), Central Office for Recovery, Reconstruction and Resiliency (COR3) | (3) Preliminary figure 5

Results of Operations 6
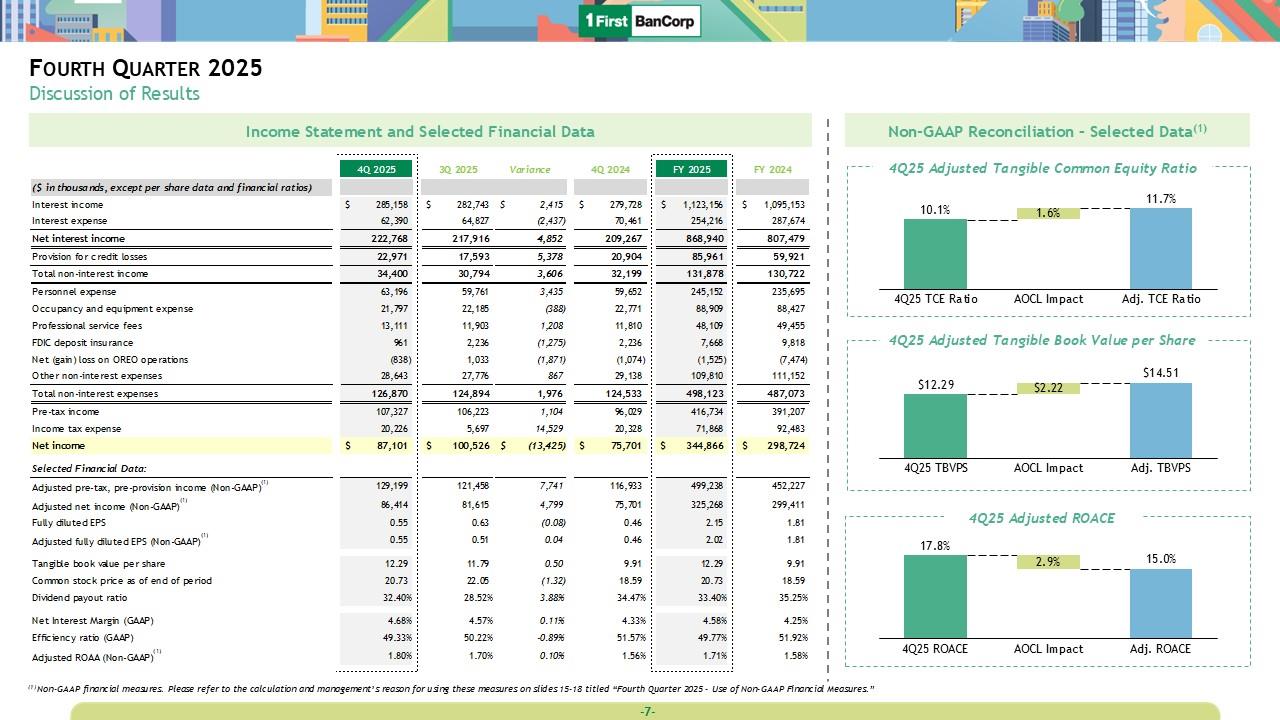
Fourth Quarter 2025 Discussion of Results Income Statement and Selected Financial Data • 40 2025 I Variance Í FY 2025 I ($ in thousands, except per share data and financial ratios) Interest income $ 285,158 $ 282,743 s 2,415 $ 279,728 $ 1,123,15 S 1,095,153 Interest expense 62,390 64,827 _2,437) 70,461 254,216 287,674 Net interest income 222,768 217,916 4,852 209,267 868,940 807,479 Provision for credit losses 22,971 17,593 5,378 20,904 85,961 59,921 Total non-interest income 34,400 30,794 3,606 32,199 131,878 130,722 Personnel expense 63,196 59,761 3,435 59,652 245,152 235,695 Occupancy and equipment expense 21,797 22,185 G88) 22,771 88,909 88,427 Professional service fees 13,111 11,903 1,208 11,810 48,109 49,455 FDIC deposit insurance %1 2,236 01,275) 2,236 7,668 9,818 Net (gain ) loss on OREO operations (838) 1,033 01,871) (1,074) (1,525) (,474) Other non-interest expenses 28,643 27,776 867 29,138 109,810 111,152 Total non-interest expenses 126,870 124,894 1,976 124,533 498,123 487,073 Pre-tax income 107,327 106,223 1,104 %,029 416,734 391,207 Income tax expense 20,226 5,697 14,529 20,328 71,868 92,483 Net income $ 87,101 $ 100,526 s (13,425) $ 75,701 S 344,866 s 298,724 Selected Financial Data: Adjusted pre-tax, pre-provision income Non-GAAP) 129,199 121,458 7,741 116,933 499,238 452,227 Adjusted net income (Non-GAAP) 86,414 81,615 4,799 75,701 325,268 299,41 1 Fully diluted EPS 0.55 0.63 (0.08) 0.46 2.15 1.81 Adjusted fully diluted EPS (Non-GAAP) 0.55 0.51 0.04 0.46 2.02 1.81 Tangible book value per share 12.29 11.79 0.50 9.91 12.29 9.91 Common stock price as of end of period 20.73 22.05 (1.32) 18.59 20.73 18.59 Dividend payout ratio 32.40% 28.52% 3.88% 34.47% 33.40% 35.25% Net Interest Margin (GAAP) 4.68% 4.57% 0.11% 4.33% 4.58% 4.25% Efficiency ratio (GAAP) 49.33% 50.22% -0.89% 51.57% 49.77%
51.92% Adjusted ROAA (Non-GAAP) 1.80% 1.70% 0.10% 1.56% 1.71% 1.58% Non-GAAP Reconciliation – Selected Data(1) 4Q25 Adjusted Tangible Common Equity Ratio 10.1% 1.6% 11.7% 4Q25 TCE Ratio AOCL Impact Adj. TCE Rato 4Q25 Adjusted Tangible Book Value per Share 12.30% 2.22% 14.51% 4Q25 TCE TBVPS AOCL Impact Adj. TBVPS 4Q25 Adjusted ROACE 17.8% 2.9% 15.0% 4Q25 TOACE AOCL Impact Adj. ROACE (1) Non-GAAP financial measures. Please refer to the calculation and management’s reason for using these measures on page Slides 15-18 titled “Fourth Quarter 2025 - Use of Non-GAAP Financial Measures.” 7
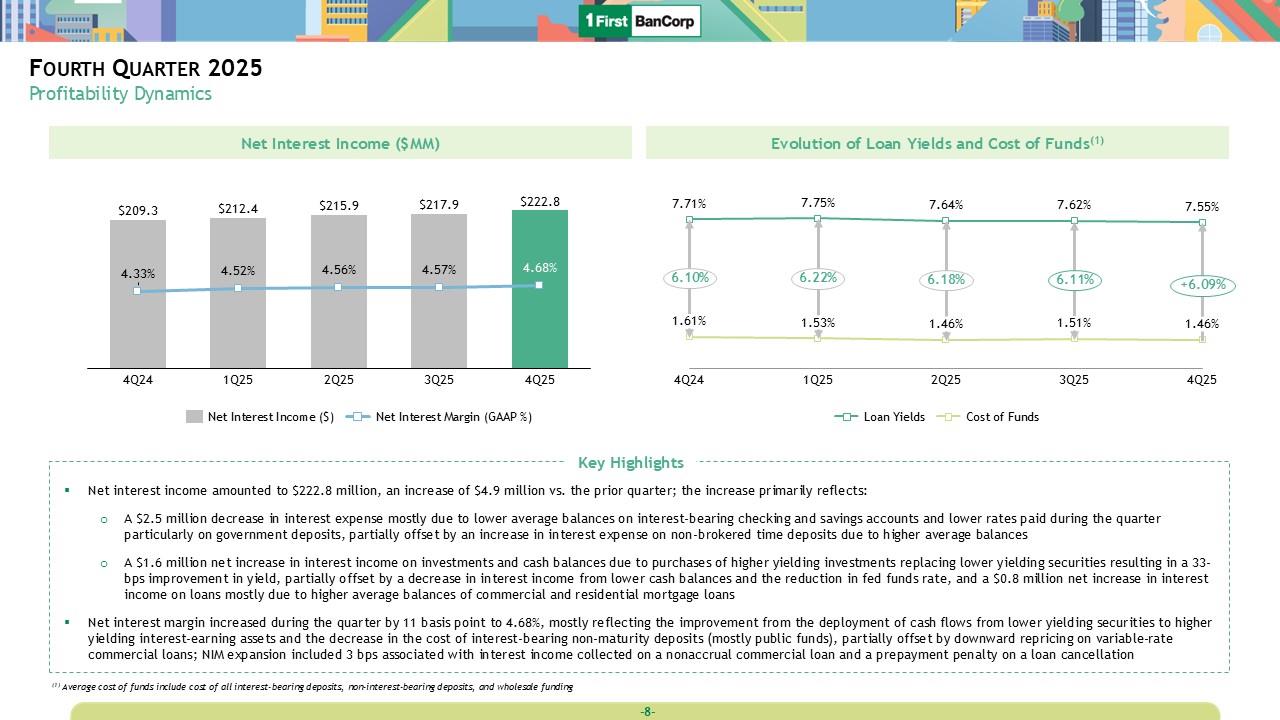
Fourth Quarter 2025 Profitability Dynamics Net Interest Income ($MM) $209.3 $212.4 $215.9 $217.9 $222.8 4.33% 4.52% 4.56% 4.57% 4.68% Q424 1Q25 2Q25 3Q25 4Q25 Net Interest Income ($) Net Interest Margin (GAAP %) Evolution of Loan Yields and Cost of Funds(1) 7.71% 7.75% 7.64% 7.62% 7.55% 6.10% 6.22% 6.18% 6.11% 6.09% 1.61% 1.53% 1.46% 1.51% 1.46% Q424 1Q25 2Q25 3Q25 4Q25 Loan Yields Cost of Funds Key Highlights Net interest income amounted to $222.8 million, an increase of $4.9 million vs. the prior quarter; the increase primarily reflects: A $2.5 million decrease in interest expense mostly due to lower average balances on interest-bearing checking and savings accounts and lower rates paid during the quarter particularly on government deposits, partially offset by an increase in interest expense on non-brokered time deposits due to higher average balances A $1.6 million net increase in interest income on investments and cash balances due to purchases of higher yielding investments replacing lower yielding securities resulting in a 33-bps improvement in yield, partially offset by a decrease in interest income from lower cash balances and the reduction in fed funds rate, and a $0.8 million net increase in interest income on loans mostly due to higher average balances of commercial and residential mortgage loans Net interest margin increased during the quarter by 11 basis point to 4.68%, mostly reflecting the improvement from the deployment of cash flows from lower yielding securities to higher yielding interest-earning assets and the decrease in the cost of interest-bearing non-maturity deposits (mostly public funds), partially offset by downward repricing on variable-rate commercial loans; NIM expansion included 3 bps associated with interest income collected on a nonaccrual commercial loan and a prepayment penalty on a loan cancellation (1) Average cost of
funds include cost of all interest-bearing deposits, non-interest-bearing deposits, and wholesale funding 8
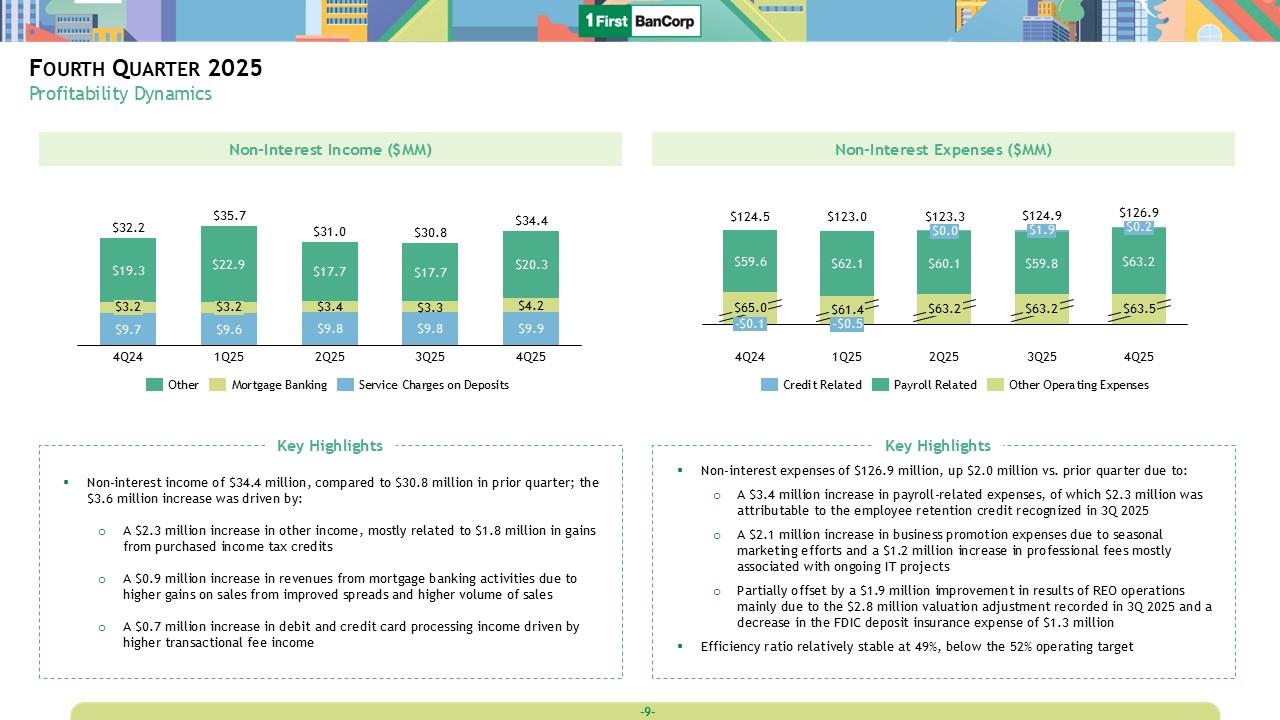
Fourth Quarter 2025 Profitability Dynamics Non-Interest Income ($MM) $32.2 $35.7 $31.0 $30.8 $34.4 $19.3 $22.9 $17.7 $17.7 $20.3 $3.2 $3.2 $3.4 $3.4 $4.2 $9.7 $9.6 $9.8 $9.8 $9.9 Q424 1Q25 2Q25 3Q25 4Q25 Other Mortgage Banking Service Charges on Deposits Non-Interest Expenses ($MM) $124.5 $1,233.0 $123.3 $124.9 $126.9 $59.6 $62.1 $60.1 $59.8 $63.2 $65.0 $61.4 $63.2 $63.2 $63.5 -$0.1 -$0.5 $0.0 $1.9 $0.2 Q424 1Q25 2Q25 3Q25 4Q25 Credit Related Payroll Related Other Operating Expenses Key Highlights Non-interest income of $34.4 million, compared to $30.8 million in prior quarter; the $3.6 million increase was driven by: A $2.3 million increase in other income, mostly related to $1.8 million in gains from purchased income tax credits A $0.9 million increase in revenues from mortgage banking activities due to higher gains on sales from improved spreads and higher volume of sales A $0.7 million increase in debit and credit card processing income driven by higher transactional fee income Key Highlights Non-interest expenses of $126.9 million, up $2.0 million vs. prior quarter due to: A $3.4 million increase in payroll-related expenses, of which $2.3 million was attributable to the employee retention credit recognized in 3Q 2025 A $2.1 million increase in business promotion expenses due to seasonal marketing efforts and a $1.2 million increase in professional fees mostly associated with ongoing IT projects Partially offset by a $1.9 million improvement in results of REO operations mainly due to the $2.8 million valuation adjustment recorded in 3Q 2025 and a decrease in the FDIC deposit insurance expense of $1.3 million Efficiency ratio relatively stable at 49%, below the 52% operating target 9
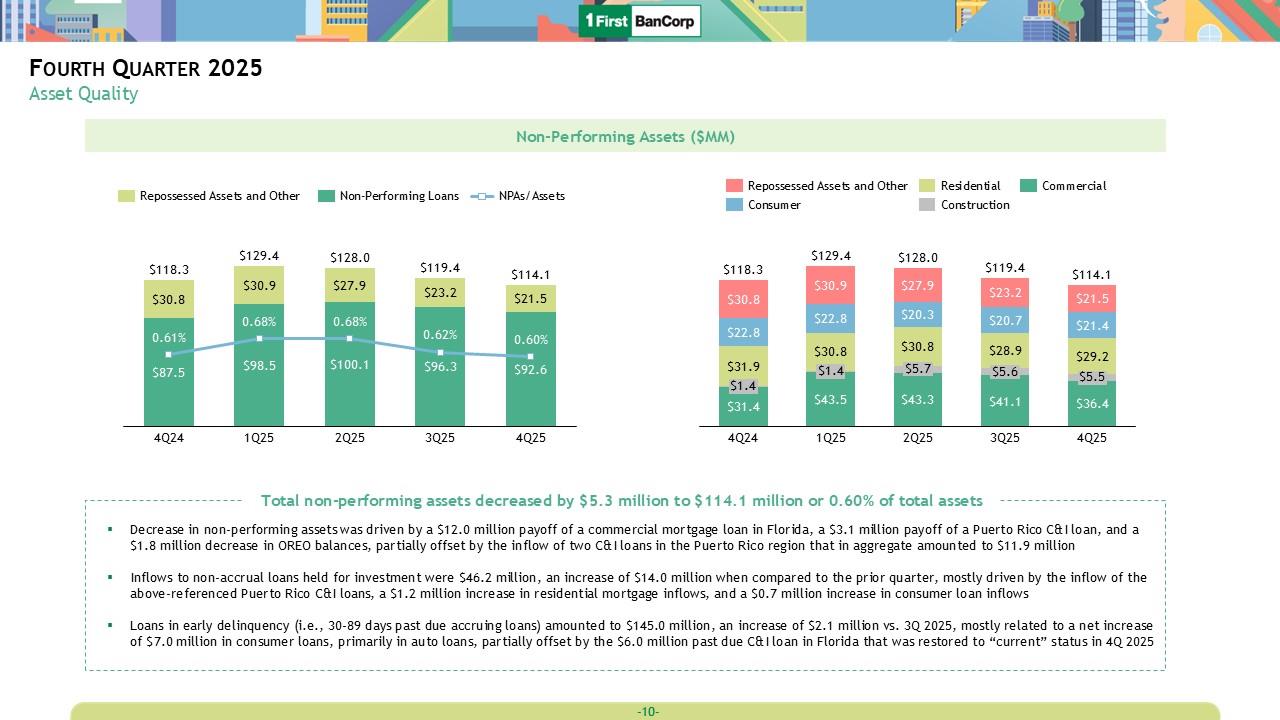
Fourth Quarter 2025 Asset Quality Non-Performing Assets ($MM) Repossessed Assets and Other Non-Performing Loans NPAs/Assets $118.3 $129.4 $128.0 $119.4 $114.1 $30.8 $30.9 $27.9 $23.2 $21.5 0.61% 0.68% 0.68% 0.62% 0.60% $87.5 $98.5 $100.1 $96.3 $92.6 Q424 1Q25 2Q25 3Q25 4Q25 Repossessed Assets and Other Consumer Residential Construction Commercial $118.3 $129.4 $128.0 $119.4 $114.1 $30.8 $30.9 $27.9 $23.2 $21.5 $22.8 $22.8 $20.3 $20.7 $21.4 $31.9 $30.8 $30.8 $28.9 $29.2 $1.4 $1.4 $5.7 $5.6 $5.5 $31.4 $43.5 $43.3 $41.1 $36.4 Q424 1Q25 2Q25 3Q25 4Q25 Total non-performing assets decreased by $5.3 million to $114.1 million or 0.60% of total assets Decrease in non-performing assets was driven by a $12.0 million payoff of a commercial mortgage loan in Florida, a $3.1 million payoff of a Puerto Rico C&I loan, and a $1.8 million decrease in OREO balances, partially offset by the inflow of two C&I loans in the Puerto Rico region that in aggregate amounted to $11.9 million Inflows to non-accrual loans held for investment were $46.2 million, an increase of $14.0 million when compared to the prior quarter, mostly driven by the inflow of the above-referenced Puerto Rico C&I loans, a $1.2 million increase in residential mortgage inflows, and a $0.7 million increase in consumer loan inflows Loans in early delinquency (i.e., 30-89 days past due accruing loans) amounted to $145.0 million, an increase of $2.1 million vs. 3Q 2025, mostly related to a net increase of $7.0 million in consumer loans, primarily in auto loans, partially offset by the $6.0 million past due C&I loan in Florida that was restored to “current” status in 4Q 2025 10
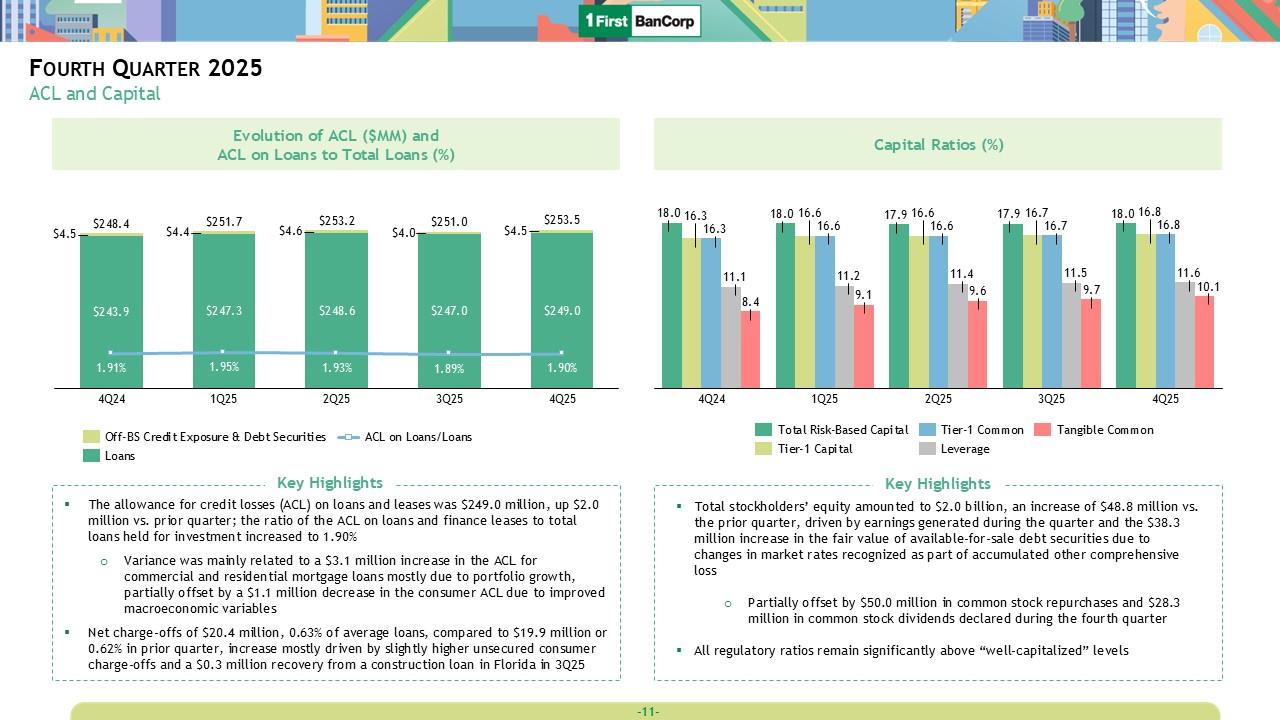
Fourth Quarter 2025 ACL and Capital Evolution of ACL ($MM) and ACL on Loans to Total Loans (%) $4.5 $4.4 $4.6 $4.0 $4.5 $248.4 $251.7 $253.2 $251.0 $253.5 $243.9 $247.3 $248.6 $247.0 $249.0 1.91% 1.95% 1.93% 1.89% 1.90% Q424 1Q25 2Q25 3Q25 4Q25 Off-BS Credit Exposure & Debt Securities Loans ACL on Loans/Loans Capital Ratios (%) 18.0 16.3 16.3 11.1 8.4 18.0 16.6 16.6 11.2 9.1 17.9 16.6 16.6 11.4 9.6 17.9 16.7 16.7 11.5 9.7 18.0 16.8 16.8 11.6 10.1 Q424 1Q25 2Q25 3Q25 4Q25 Total Risk-Based Capital Tier-1 Capital Tier-1 Common Leverage Tangible Common Key Highlights The allowance for credit losses (ACL) on loans and leases was $249.0 million, up $2.0 million vs. prior quarter; the ratio of the ACL on loans and finance leases to total loans held for investment increased to 1.90% Variance was mainly related to a $3.1 million increase in the ACL for commercial and residential mortgage loans mostly due to portfolio growth, partially offset by a $1.1 million decrease in the consumer ACL due to improved macroeconomic variables Net charge -offs of $20.4 million, 0.63% of average loans, compared to $19.9 million or 0.62% in prior quarter, increase mostly driven by slightly higher unsecured consumer charge-offs and a $0.3 million recovery from a construction loan in Florida in 3Q25 Key Highlights Total stockholders’ equity amounted to $2.0 billion, an increase of $48.8 million vs. the prior quarter, driven by earnings generated during the quarter and the $38.3 million increase in the fair value of available-for-sale debt securities due to changes in market rates recognized as part of accumulated other comprehensive loss Partially offset by $50.0 million in common stock repurchases and $28.3 million in common stock dividends declared during the fourth quarter All regulatory ratios remain significantly above “well-capitalized” levels 11
4Q 2025 Financial Results Appendix and Non-GAAP Financial Measures 12
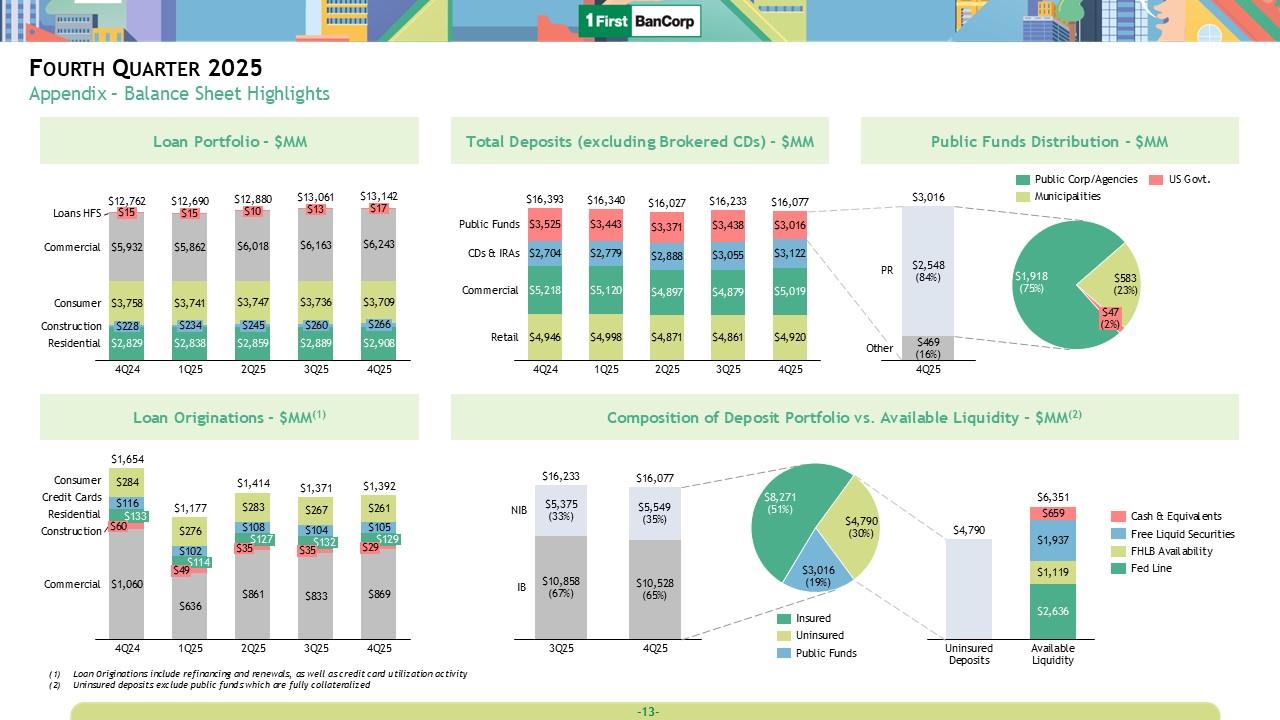
Fourth Quarter 2025 Appendix – Balance Sheet Highlights Loan Portfolio - $MM $12,762 $12,690 $12,880 $13,061 $13,142 Loans HFS $15 $15 $10 $13 $17 Commercial $5,932 $5,862 $6,018 $6,163 $6,243 Consumer $3,758 $3,741 $3,747 $3,736 $3,709 Construction $228 $234 $245 $260 $266 Residential $2,829 $2,838 $2,859 $2,889 $2,908 4Q24 1Q25 2Q25 3Q25 4Q25 Total Deposits (excluding Brokered CDs) - $MM $16,393 $16,340 $16,027 $16,233 $16,077 Public Funds $3,525 $3,443 $3,371 $3,438 $3,016 CD& IRAS $2,704 $2,779 $2,888 $3,055 $3,122 Commercial $5,218 $5,120 $4,897 $4,879 $5,019 Retail $4,946 $4,998 $4,871 $4,861 $4,920 4Q24 1Q25 2Q25 3Q25 4Q25 Public Funds Distribution - $MM Public Corp/Agencies US Govt. Municipalities $3,016 PR $2,548 84% $469 Other -16% 4Q24 $1,918 (75%) $583 (23%) $47 (2%) Loan Originations - $MM(1) $1,654 $1,177 $1,414 $1,371 $1,392 Consumer $284 $276 $283 $267 $261 Credit Cards $116 $102 $108 $104 $105 Residential $133 $114 $127 $132 $129 Construction $60 $49 $35 $35 $29 Commercial $1,060 $636 $861 $833 $869 4Q24 1Q25 2Q25 3Q25 4Q25 Composition of Deposit Portfolio vs. Available Liquidity - $MM(2) $16,233 $16,077 $5,375 $5,549 NIB 33% 35% $10,858 $10,528 IB 67% 65% 3Q25 4Q25 Insured $8,271 (51%) Uninsured $4,790 (30%) Public Funds $3,016 (19%) $4,790 $6,351 $659 Cash & Equivalents $1,937 Free Liquid Securities $1,119 FHB Availability $2,636 Fed Line 3Q25 4Q25 (1) Loan Originations include refinancing and renewals, as well as credit card utilization activity (2) Uninsured deposits exclude public funds which are fully collateralized 13
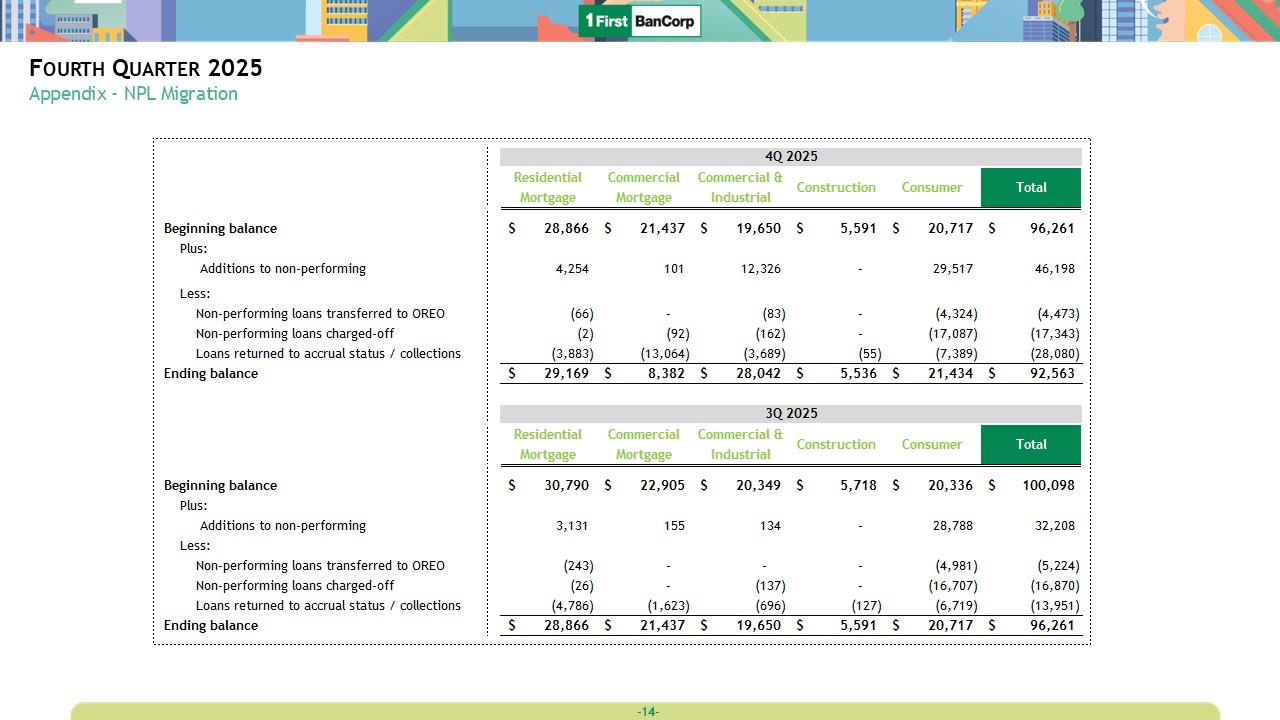
Fourth Quarter 2025 Appendix - NPL Migration 40 2025 Residential Mortgage Commercial Commercial & _ Construction Industrial Consumer Total Beginning balance $ 28,866 S 21,437 S 19,650 $ 5,591 S 20,717 S 96,261 Plus: Additions to non-performing 4,254 101 12,326 - 29,517 46,198 Less: Non-performing loans transferred to OREO (66) - (83) - (4,324) (4,473) Non-performing loans charged -off (2) (92) 062) - (17,087) (17,343) Loans returned to accrual status / collections (3,883) (13,064) (3,689) (55) (7,389) (28,080) Ending balance S 29,169 S 8,382 S 28,042 S 5,536 S 21,434 S 92,563 30 2025 Residential Mortgage Commercial Commercial & _ Construction Industrial Consumer Total Beginning balance S 30,790 S 22,905 S 20,349 S 5,718 S 20,336 S 100,098 Plus: Additions to non-performing 3,131 155 134 - 28,788 32,208 Less: Non-performing loans transferred to OREO (243) - - - (4,981) (5,224) Non-performing loans charged-off (26) - (137) - (16,707) (16,870) Loans returned to accrual status / collections (4,786) (1,623) (696) (127) (6,719) (13,951) Ending balance S28,866 S 21,437 S 19,650 S 5,591 S 20,717 S 96,261 14
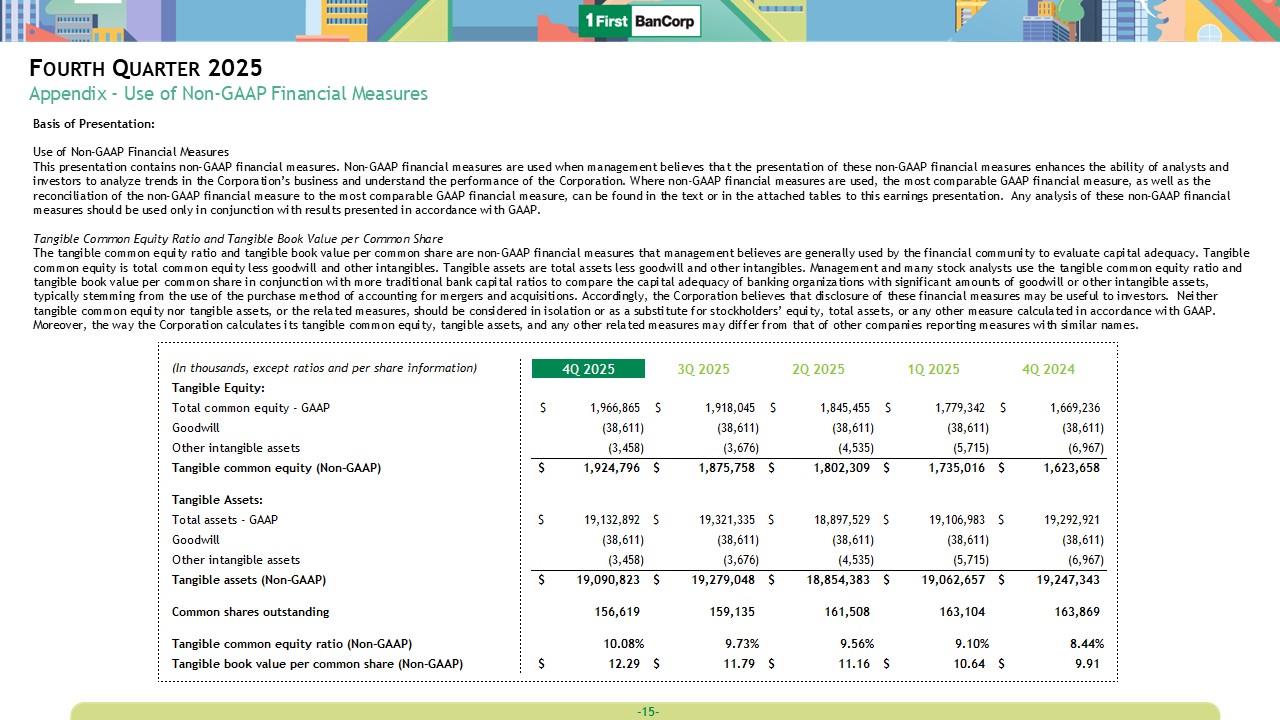
Fourth Quarter 2025 Appendix - Use of Non-GAAP Financial Measures Basis of Presentation: Use of Non-GAAP Financial Measures This presentation contains non-GAAP financial measures. Non-GAAP financial measures are used when management believes that the presentation of these non-GAAP financial measures enhances the ability of analysts and investors to analyze trends in the Corporation’s business and understand the performance of the Corporation. Where non-GAAP financial measures are used, the most comparable GAAP financial measure, as well as the reconciliation of the non-GAAP financial measure to the most comparable GAAP financial measure, can be found in the text or in the attached tables to this earnings presentation. Any analysis of these non-GAAP financial measures should be used only in conjunction with results presented in accordance with GAAP. Tangible Common Equity Ratio and Tangible Book Value per Common Share The tangible common equity ratio and tangible book value per common share are non-GAAP financial measures that management believes are generally used by the financial community to evaluate capital adequacy. Tangible common equity is total common equity less goodwill and other intangibles. Tangible assets are total assets less goodwill and other intangibles. Management and many stock analysts use the tangible common equity ratio and tangible book value per common share in conjunction with more traditional bank capital ratios to compare the capital adequacy of banking organizations with significant amounts of goodwill or other intangible assets, typically stemming from the use of the purchase method of accounting for mergers and acquisitions. Accordingly, the Corporation believes that disclosure of these financial measures may be useful to investors. Neither tangible common equity nor tangible assets, or the related measures,
should be considered in isolation or as a substitute for stockholders’ equity, total assets, or any other measure calculated in accordance with GAAP. Moreover, the way the Corporation calculates its tangible common equity, tangible assets, and any other related measures may differ from that of other companies reporting measures with similar names. (In thousands, except ratios and per share information) 40 2025 3Q2025 20 2025 1Q2025 4Q2024 Tangible Equity: Total common equity - GAAP Goodwill Other intangible assets $ 1,966,865 (38,611) (3,458) $ 1,918,045 (38,611) (3,676) $ 1,845,455 (38,611) (4,535) $ 1,779,342 (38,611) (5,715) $ 1,669,236 (38,611) (6,967) Tangible common equity (Non -GAAP) $ 1,924,796 $ 1,875,758 $ 1,802,309 $ 1,735,016 $ 1,623,658 Tangible Assets: Total assets - GAAP Goodwill Other intangible assets $ 19,132,892 (38,611) (3,458) $ 19,321,335 (38,611) (3,676) $ 18,897,529 (38,611) (4,535) $ 19,106,983 (38,611) (5,715) $ 19,292,921 (38,611) (6,967) Tangible assets (Non-GAAP) $ 19,090,823 $ 19,279,048 $ 18,854,383 $ 19,062,657 $ 19,247,343 Common shares outstanding 156,619 159,135 161,508 163,104 163,869 Tangible common equity ratio (Non-GAAP) Tangible book value per common share (Non-GAAP) $ 10.08% 12.29 $ 9.73% 11.79 $ 9.56% 11.16 $ 9.10% 10.64 $ 8.44% 9.91 15
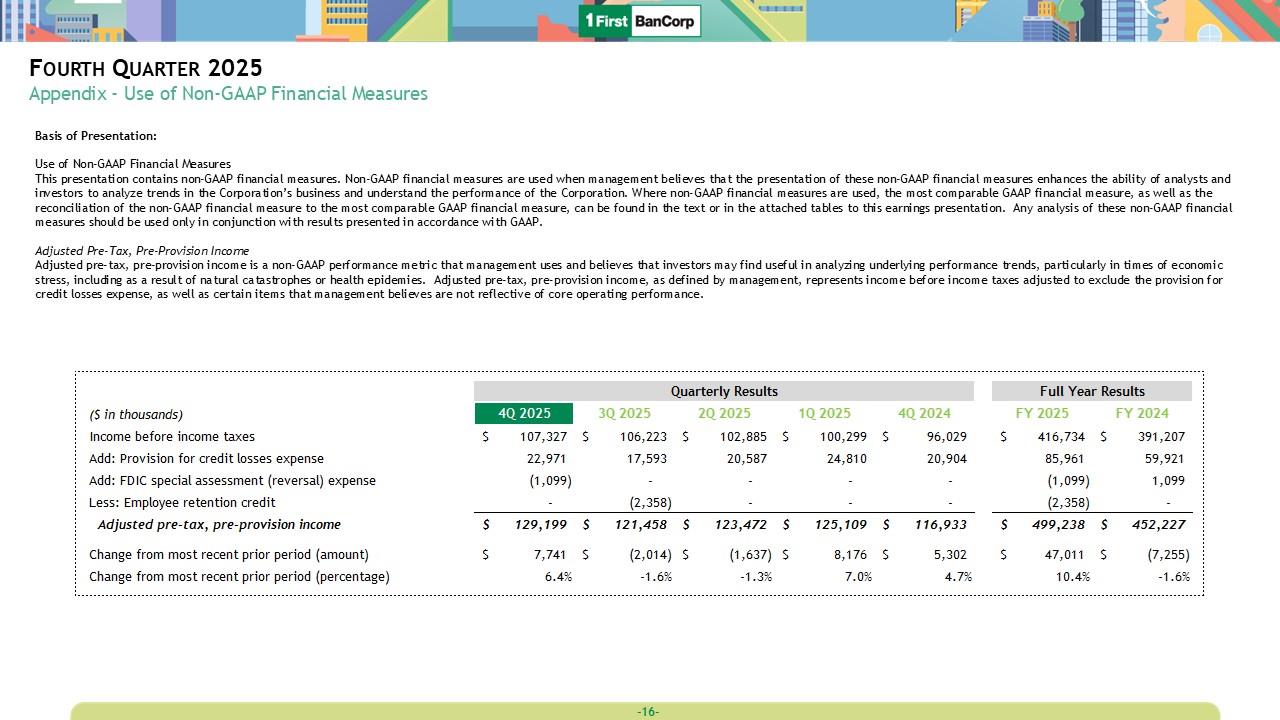
Fourth Quarter 2025 Appendix - Use of Non-GAAP Financial Measures Basis of Presentation: Use of Non-GAAP Financial Measures This presentation contains non-GAAP financial measures. Non-GAAP financial measures are used when management believes that the presentation of these non-GAAP financial measures enhances the ability of analysts and investors to analyze trends in the Corporation’s business and understand the performance of the Corporation. Where non-GAAP financial measures are used, the most comparable GAAP financial measure, as well as the reconciliation of the non-GAAP financial measure to the most comparable GAAP financial measure, can be found in the text or in the attached tables to this earnings presentation. Any analysis of these non-GAAP financial measures should be used only in conjunction with results presented in accordance with GAAP. Adjusted Pre-Tax, Pre-Provision Income Adjusted pre-tax, pre-provision income is a non-GAAP performance metric that management uses and believes that investors may find useful in analyzing underlying performance trends, particularly in times of economic stress, including as a result of natural catastrophes or health epidemies. Adjusted pre-tax, pre-provision income, as defined by management, represents income before income taxes adjusted to exclude the provision for credit losses expense, as well as certain items that management believes are not reflective of core operating performance. (S in thousands) Quarterly Results Full Year Results 1 40 2025 É 3Q2025 20 2025 1Q2025 4Q2024 FY 2025 FY 2024 Income before income taxes S 107,327 S 106,223 S 102,885 S 100,299 S 96,029 S 416,734 S 391,207 Add: Provision for credit losses expense 22,971 17,593 20,587 24,810 20,904 85,961 59,921 Add: FDIC special assessment (reversal) expense (1,099) - - - - (1,099) 1,099 Less: Employee retention credit - (2,358) -
- - _(2,358) - Adjusted pre-tax, pre-provision income S 129,199 S 121,458 S 123,472 S 125,109 S 116,933 S 499,238 S 452,227 Change from most recent prior period (amount) S 7,741 s (2,014) S (1,637) S 8,176 S 5,302 S 47,011 S (7,255) Change from most recent prior period (percentage) 6.4% -1.6% -1.3% 7.0% 4.7% 10.4% -1.6% 16
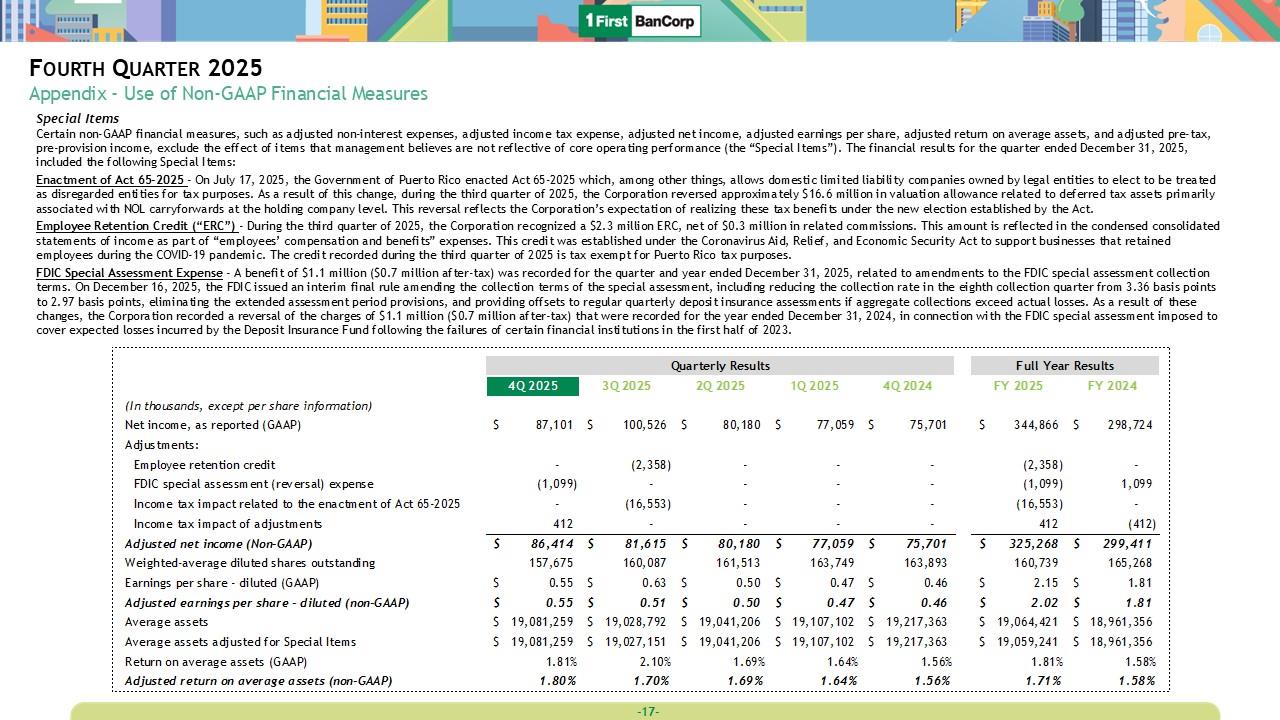
Fourth Quarter 2025 Appendix - Use of Non-GAAP Financial Measures Special Items Certain non-GAAP financial measures, such as adjusted non-interest expenses, adjusted income tax expense, adjusted net income, adjusted earnings per share, adjusted return on average assets, and adjusted pre-tax, pre-provision income, exclude the effect of items that management believes are not reflective of core operating performance (the “Special Items”). The financial results for the quarter ended December 31, 2025, included the following Special Items: Enactment of Act 65-2025 - On July 17, 2025, the Government of Puerto Rico enacted Act 65-2025 which, among other things, allows domestic limited liability companies owned by legal entities to elect to be treated as disregarded entities for tax purposes. As a result of this change, during the third quarter of 2025, the Corporation reversed approximately $16.6 million in valuation allowance related to deferred tax assets primarily associated with NOL carryforwards at the holding company level. This reversal reflects the Corporation’s expectation of realizing these tax benefits under the new election established by the Act. Employee Retention Credit (“ERC”) - During the third quarter of 2025, the Corporation recognized a $2.3 million ERC, net of $0.3 million in related commissions. This amount is reflected in the condensed consolidated statements of income as part of “employees’ compensation and benefits” expenses. This credit was established under the Coronavirus Aid, Relief, and Economic Security Act to support businesses that retained employees during the COVID -19 pandemic. The credit recorded during the third quarter of 2025 is tax exempt for Puerto Rico tax purposes. FDIC Special Assessment Expense - A benefit of $1.1 million ($0.7 million after-tax) was recorded for the quarter and year ended December 31, 2025, related to amendments to the
FDIC special assessment collection terms. On December 16, 2025, the FDIC issued an interim final rule amending the collection terms of the special assessment, including reducing the collection rate in the eighth collection quarter from 3.36 basis points to 2.97 basis points, eliminating the extended assessment period provisions, and providing offsets to regular quarterly deposit insurance assessments if aggregate collections exceed actual losses. As a result of these changes, the Corporation recorded a reversal of the charges of $1.1 million ($0.7 million after-tax) that were recorded for the year ended December 31, 2024, in connection with the FDIC special assessment imposed to cover expected losses incurred by the Deposit Insurance Fund following the failures of certain financial institutions in the first half of 2023. Quarterly Results Full Year FY 2025 Results FY 2024 • 4Q2025 I 3Q2025 2Q 2025 1Q2025 4Q2024 (In thousands, except pershare information) Net income, as reported (GAAP) S 87,101 S 100,526 S 80,180 S 77,059 S 75,701 S 344,866 S 298,724 Adjustments: Employee retention credit - (2,358) - - - (2,358) - FDIC special as 5 es sm ent (reversal) expense (1,099) - - - - (1,099) 1,099 Income tax impact related to the enactment of Act 65-2025 - (16,553) - - - (16,553) - Income tax impact of adjustments 412 - - - - 412 (412) Adjusted net income (Non-GAAP) S 86,414 S 81,615 S 80,180 S 77,059 S 75,701 S 325,268 S 299,411 Weighted-average diluted shares outstanding 157,675 160,087 161,513 163,749 163,893 160,739 165,268 Earnings per share - diluted (GAAP) S 0.55 S 0.63 S 0.50 S 0.47 S 0.46 S 2.15 S 1.81 Adjusted earnings per share - diluted (non-GAAP) S 0.55 S 0.51 S 0.50 S 0.47 S 0.46 S 2.02 S 1.81 Average assets S 19,081,259 S 19,028,792 S 19,041,206 S 19,107,102 S 19,217,363 S 19,064,421 S 18,961,356 Average assets adjusted for Special Items S 19,081,259 S
19,027,151 S 19,041,206 S 19,107,102 S 19,217,363 S 19,059,241 S 18,961,356 Return on average assets (GAAP) 1.81% 2.10% 1.69% 1.64% 1.56% 1.81% 1.58% Adjusted return on average assets (non-GAAP) 1.80% 1.70% 1.69% 1.64% 1.56% 1.71% 1.58% 17
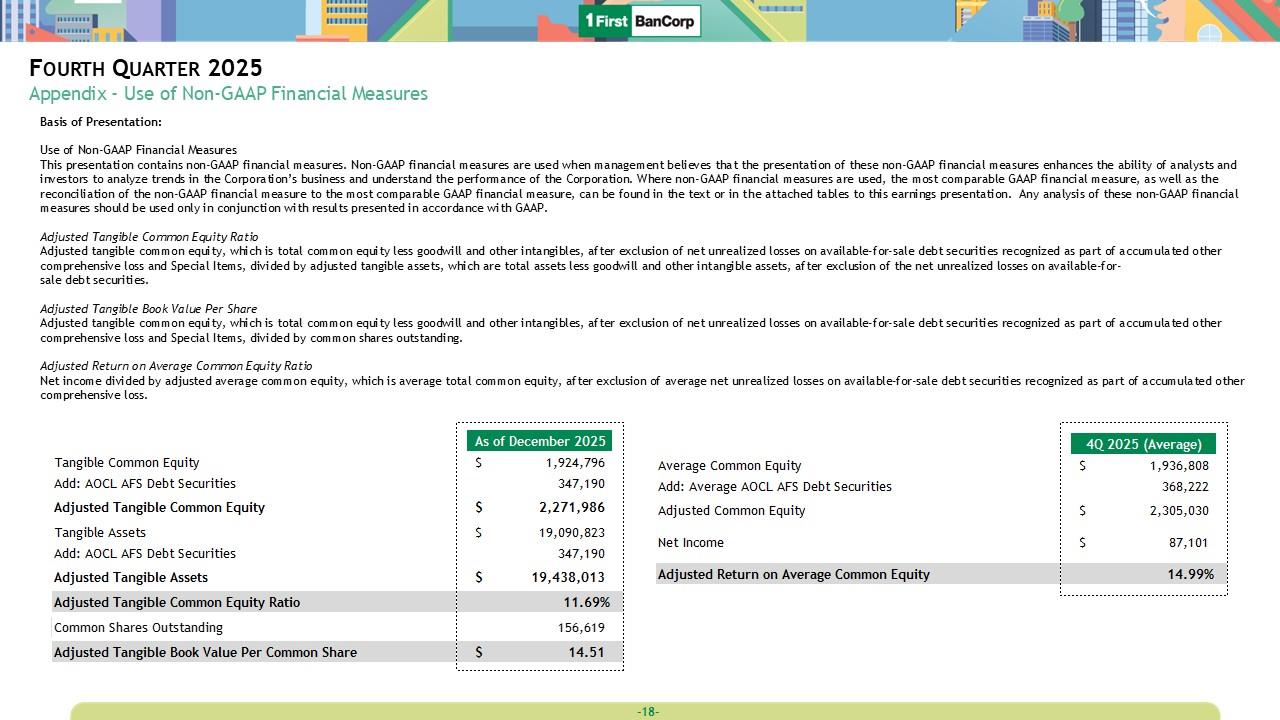
Fourth Quarter 2025 Appendix - Use of Non-GAAP Financial Measures Basis of Presentation: Use of Non-GAAP Financial Measures This presentation contains non-GAAP financial measures. Non-GAAP financial measures are used when management believes that the presentation of these non-GAAP financial measures enhances the ability of analysts and investors to analyze trends in the Corporation’s business and understand the performance of the Corporation. Where non-GAAP financial measures are used, the most comparable GAAP financial measure, as well as the reconciliation of the non-GAAP financial measure to the most comparable GAAP financial measure, can be found in the text or in the attached tables to this earnings presentation. Any analysis of these non-GAAP financial measures should be used only in conjunction with results presented in accordance with GAAP. Adjusted Tangible Common Equity Ratio Adjusted tangible common equity, which is total common equity less goodwill and other intangibles, after exclusion of net unrealized losses on available-for-sale debt securities recognized as part of accumulated other comprehensive loss and Special Items, divided by adjusted tangible assets, which are total assets less goodwill and other intangible assets, after exclusion of the net unrealized losses on available-for-sale debt securities. Adjusted Tangible Book Value Per Share Adjusted tangible common equity, which is total common equity less goodwill and other intangibles, after exclusion of net unrealized losses on available-for-sale debt securities recognized as part of accumulated other comprehensive loss and Special Items, divided by common shares outstanding. Adjusted Return on Average Common Equity Ratio Net income divided by adjusted average common equity, which is average total common equity, after exclusion of average net unrealized losses on available-for-sale
debt securities recognized as part of accumulated other comprehensive loss. As of December 2025 Tangible Common Equity s 1,924,796 Add: AOCL AFS Debt Securities 347,190 Adjusted Tangible Common Equity s 2,271,986 Tangible Assets s 19,090,823 Add: AOCL AFS Debt Securities 347,190 Adjusted Tangible Assets s 19,438,013 Adjusted Tangible Common Equity Ratio 11.69% Common Shares Outstanding 156,619 Adjusted Tangible Book Value Per Common Share s 14.51 • 40 2025 (Average) • Average Common Equity s 1,936,808 Add: Average AOCL AFS Debt Securities 368,222 Adjusted Common Equity s 2,305,030 Net Income s 87,101 Adjusted Return on Average Common Equity 14.99% ; 18

1First BanCorp 19