
.2
1First BanCorp Financial Results Second Quarter 2026 July 22, 2026
Forward Looking Statements This presentation contains “forward -looking statements” concerning the Corporation’s future economic, operational and financial performance. The words or phrases “expect,” “anticipate,” “intend,” “should,” “would,” “will,” “plans,” “forecast,” “believe” and similar expressions are meant to identify “forward-looking statements” within the meaning of Section 27A of the Securities Act of 1933, as amended, and Section 21E of the Securities Exchange Act of 1934, as amended, and are subject to the safe harbor created by such sections. The Corporation cautions readers not to place undue reliance on any such forward -looking statements, which speak only as of the date hereof, and advises readers that any such forward-looking statements are not guarantees of future performance and involve certain risks, uncertainties, estimates and assumptions by us that are difficult to predict. Various factors, some of which are beyond our control, including, but not limited to, the uncertainties more fully discussed in Part I, Item 1A, “Risk Factors” of the Corporation’s Annual Report on Form 10-K for the year ended December 31, 2025, and the following, could cause actual results to differ materially from those expressed in, or implied by, such forward-looking statements: the effect of the current global interest rate environment (including the potential for ongoing reductions in interest rates) and inflation levels on the level, composition and performance of the Corporation’s assets and liabilities, and corresponding effects on the Corporation’s net interest income, net interest margin, loan originations, deposit attrition, overall results of operations, and liquidity position; the effects of changes in the interest rate environment, including any adverse change in the Corporation’s ability to attract and retain clients and gain acceptance from current and prospective customers for new products and services,
including those related to the offering of digital banking and financial services; volatility in the financial services industry, which could result in, among other things, bank deposit runoffs, liquidity constraints, and increased regulatory requirements and costs; uncertainty as to the ability of FirstBank to retain its core deposits and generate sufficient cash flow through its wholesale funding sources, which may require us to sell investment securities at a loss; the impacts of natural or man-made disasters, widespread health emergencies, geopolitical conflicts (including sanctions, war or armed conflict, such as the ongoing conflict in Ukraine, ongoing conflicts in the Middle East, such as the war in Iran); adverse changes in general political and economic conditions in Puerto Rico, the U.S., and the U.S. and British Virgin Islands, includi ng in the interest rate environment, unemployment rates, market liquidity, housing absorption rates, real estate markets and U.S. capital markets; general competitive factors and other market risks as well as the implementation of existent or planned strategic growth opportunities, including risks, uncertainties, and other factors or events related to any business acquisitions, dispositions, strategic partnerships, strategic operational investments including system conversions, and any anticipated efficiencies or other expected results related thereto; the impact of litigation or the threat of litigation, including any settlements or judgments against the Corporation, and the potential resulting liabilities, costs, negative publicity or other reputational harm; the effects of asserted and unasserted claims and the extent of available insurance coverage; uncertainty as to the implementation of the debt restructuring plan of Puerto Rico and the Fiscal Plan for Puerto Rico as certified on June 19, 2026 by the Financial Oversight and Management Board for Puerto Rico, or any revisions to it, on our clients
and loan portfolios, and any potential impact from future economic or political developments and tax regulations in Puerto Rico; the impact of government financial assistance for hurricane recovery and other disaster relief on economic activity in Puerto Rico; the timing of sales of properties from our other real estate owned (“OREO”) portfolio; the impacts of applicable legislative, tax or regulatory changes on the Corporation’s financial condition or performance; and the effect of continued changes in the fiscal, monetary, and trade policies and regulations of the U.S. federal government, the Puerto Rico government and other governments. The Corporation does not undertake and specifically disclaims any obligation to update any “forward-looking statements” to reflect occurrences or unanticipated events or circumstances after the date of such statements, except as required by the federal securities laws. Non-GAAP Financial Measures In addition to the Corporation’s financial information presented in accordance with GAAP, management uses certain “non-GAAP” financial measures” within the meaning of Regulation G promulgated by the SEC, to clarify and enhance understanding of past performance and prospects for the future. Please refer to pages 14-16 for a reconciliation of GAAP to non-GAAP measures and calculations. 2
Agenda 1 2Q 2026 – Quarter Highlights Aurelio Alemán, President and Chief Executive Officer 2 2Q 2026 – Results of Operations Said Ortiz, Executive Vice President and Chief Financial Officer 3 v2Q 2026 – Questions and Answers 3
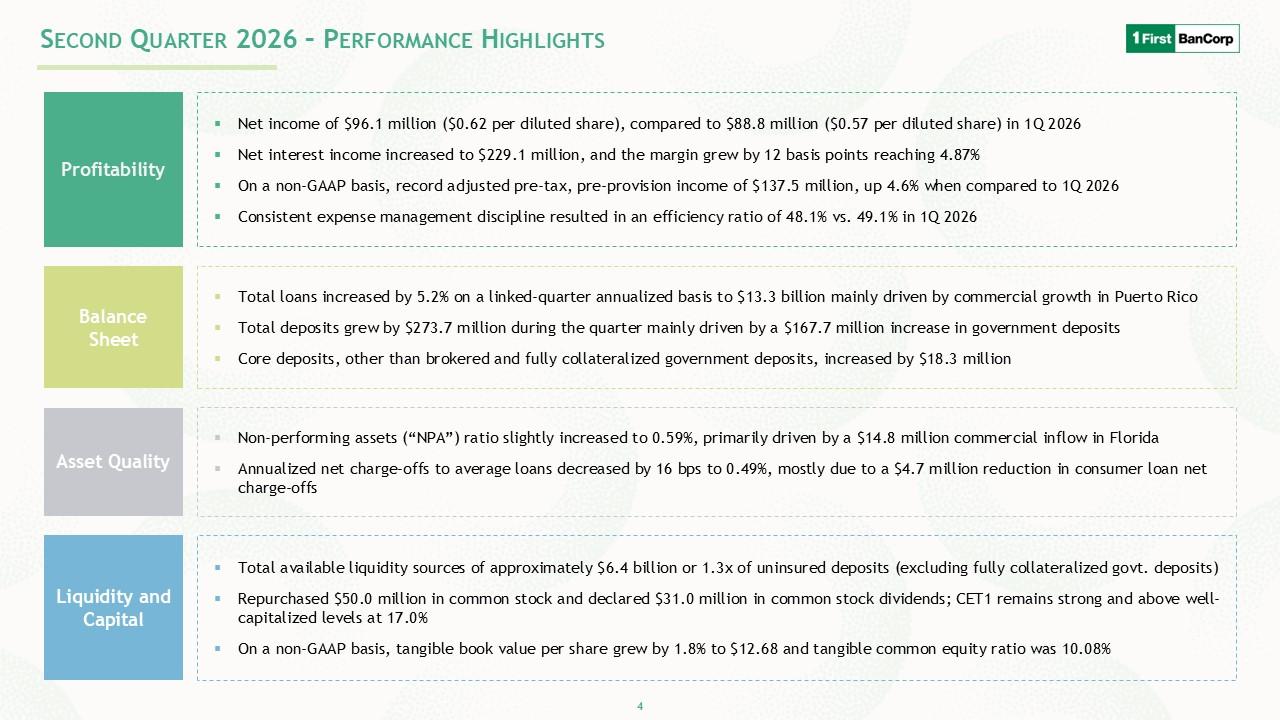
Second Quarter 2026 – Performance Highlights Profitability Net income of $96.1 million ($0.62 per diluted share), compared to $88.8 million ($0.57 per diluted share) in 1Q 2026 Net interest income increased to $229.1 million, and the margin grew by 12 basis points reaching 4.87% On a non-GAAP basis, record adjusted pre-tax, pre-provision income of $137.5 million, up 4.6% when compared to 1Q 2026 Consistent expense management discipline resulted in an efficiency ratio of 48.1% vs. 49.1% in 1Q 2026 Balance Sheet Total loans increased by 5.2% on a linked-quarter annualized basis to $13.3 billion mainly driven by commercial growth in Puerto Rico Total deposits grew by $273.7 million during the quarter mainly driven by a $167.7 million increase in government deposits Core deposits, other than brokered and fully collateralized government deposits, increased by $18.3 million Asset Quality Non-performing assets (“NPA”) ratio slightly increased to 0.59%, primarily driven by a $14.8 million commercial inflow in Florida Annualized net charge-offs to average loans decreased by 16 bps to 0.49%, mostly due to a $4.7 million reduction in consumer loan net charge -offs Liquidity and Capital Total available liquidity sources of approximately $6.4 billion or 1.3x of uninsured deposits (excluding fully collateralized govt. deposits) Repurchased $50.0 million in common stock and declared $31.0 million in common stock dividends; CET1 remains strong and above well-capitalized levels at 16.9% On a non-GAAP basis, tangible book value per share grew by 1.8% to $12.68 and tangible common equity ratio was 10.08% 4
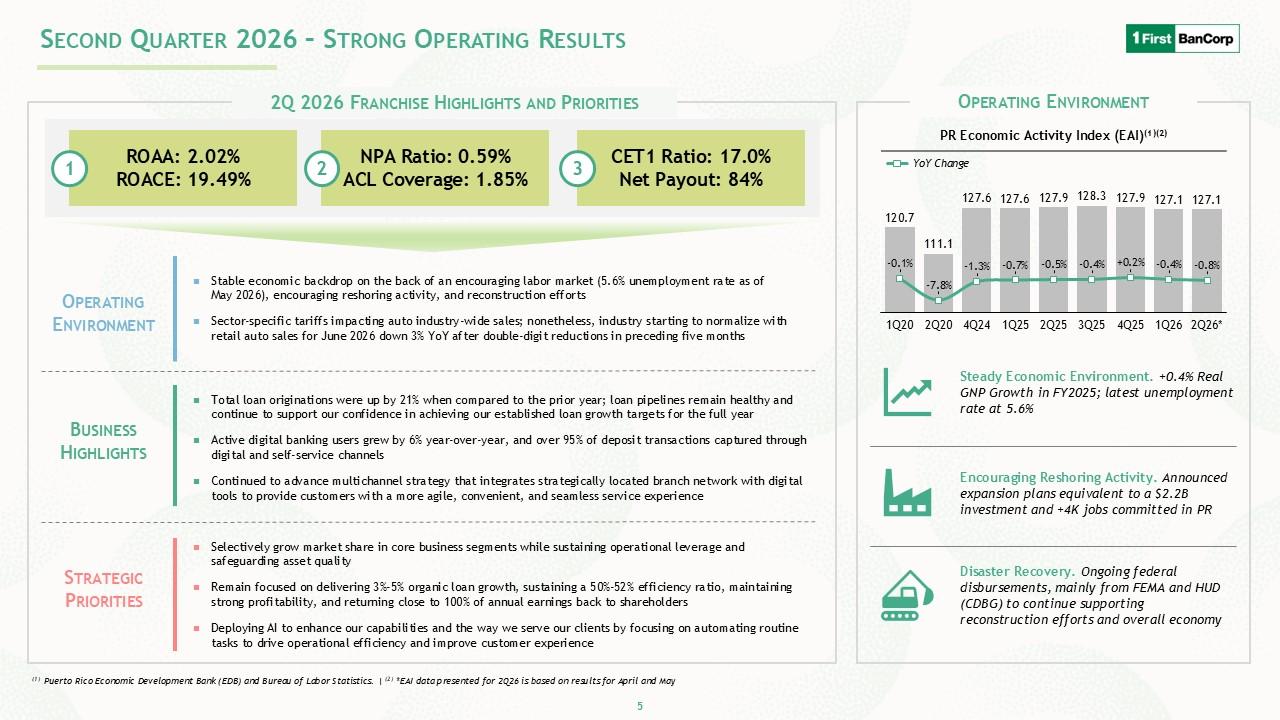
Second Quarter 2026 – Strong Operating Results 2Q 2026 Franchise Highlights and Priorities 1 ROAA: 2.02% ROACE: 19.49% 2 NPA Ratio: 0.59% ACL Coverage: 1.85% 3 CET1 Ratio:16.9% Net Payout: 84% Operating Environment Stable economic backdrop on the back of an encouraging labor market (5.6% unemployment rate as of May 2026), encouraging reshoring activity, and reconstruction efforts Sector-specific tariffs impacting auto industry-wide sales; nonetheless, industry starting to normalize with retail auto sales for June 2026 down 3% YoY after double-digit reductions in preceding five months Business Highlights Total loan originations were up by 21% when compared to the prior year; loan pipelines remain healthy and continue to support our confidence in achieving our established loan growth targets for the full year Active digital banking users grew by 6% year-over-year, and over 95% of deposit transactions captured through digital and self-service channels Continued to advance multichannel strategy that integrates strategically located branch network with digital tools to provide customers with a more agile, convenient, and seamless service experience Strategic Priorities Selectively grow market share in core business segments while sustaining operational leverage and safeguarding asset quality Remain focused on delivering 3%-5% organic loan growth, sustaining a 52% efficiency ratio, maintaining strong profitability, and returning close to 100% of annual earnings back to shareholders Deploying AI to enhance our capabilities and the way we serve our clients by focusing on automating routine tasks to drive operational efficiency and improve customer experience Operating Environment PR Economic Activity Index (EAI)(1)(2) YoY Change 120.7 111.1 127.6 127.6 127.9 128.3 127.9 127.1 127.1 -0.1% -785.0% -1.3% -0.7% -0.5% -0.4% 0.2% -0.4% -0.8% 1Q20 2Q20 4Q24
1Q25 2Q25 3Q25 4Q25 1Q26 2Q26 Steady Economic Environment. +0.4% Real GNP Growth in FY2025; latest unemployment rate at 5.6% Encouraging Reshoring Activity. Announced expansion plans equivalent to a $2.2B investment and +4K jobs committed in PR Disaster Recovery. Ongoing federal disbursements, mainly from FEMA and HUD (CDBG) to continue supporting reconstruction efforts and overall economy (1) Puerto Rico Economic Development Bank (EDB) and Bureau of Labor Statistics. | (2) *EAI data presented for 2Q26 is based on results for April and May 5

Results of Operations
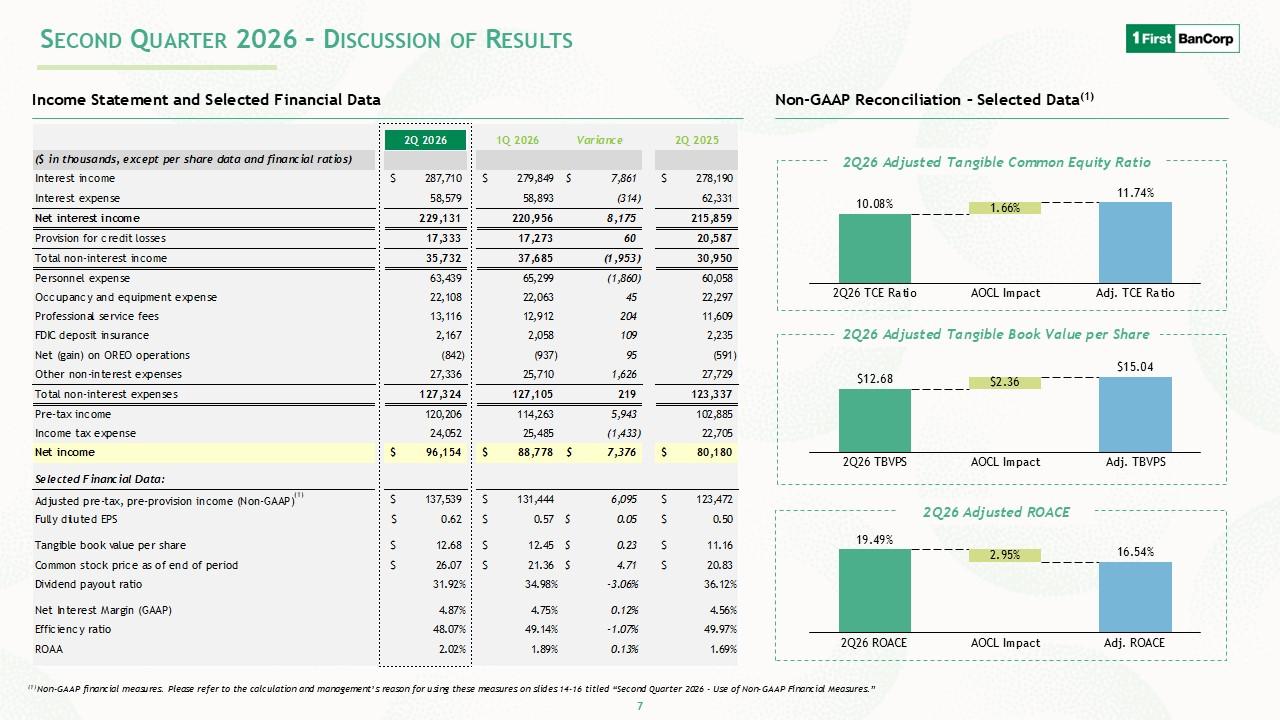
Second Quarter 2026 – Discussion of Results Income Statement and Selected Financial Data 2Q 2026 1Q 2026 Variance 2Q 2025 ($ in thousands, except per sh are data and financial ratios) Interest income $287,710 $2,798,849 $7,861 $278,190 Interest expense 58,757 58,893 (314) 62,331 Net interest income 229,131 220,956 8,175 215,859 Provison for credit losses 17,333 17,273 60 20,587 Total non-interst income 35,732 37,685 (1,953) 30,950 Personnel expense 63,439 65,299 (1,860) 60,058 Occupancy and equipment expense 22,108 22,063 45 22,297 Professional service fees 13,116 12,912 204 11,609 FIC deposit insurance 2,167 2,058 109 2,235 Net (gain) on OREO operaations (842) (937) 95 (591) Other non-interest expenses 27,336 25,710 1,626 27,729 Total non-interst expenses 127,324 127,105 219 123,337 Pre-tax income 120,206 114,263 5,943 102,885 Income tax expense 24,052 25,485 (1,433) 22,705 Net income $96,154 $88,778 $7,376 $80,180 Selected Financial Data: Adjusted pre-tax, pre-provision income (Non-GAAP) $137,539 $13,444 $6,095 $123,471 Fully diluted EPS $0.62 $0.57 $0.05 $0.50 Tangible book value per share $12.68 $12.45 $0.23 $11.16 Common stock price as of tend of period $26.07 $21.36 $4.71 $20.83 Dividend payout ratio 31.92% 34.98% -3.06% 36.12% Net Interest Margin (GAAP) 4.87% 4.78% 0.12% 4.56% Efficiency raio 40.07% 49.14% -1.07% 49.97% ROAA 2.02% 1.89% 0.13% 1.69% Non-GAAP Reconciliation – Selected Data(1) 2Q26 Adjusted Tangible Common Equity Ratio 10.08% 1.66% 1.74% 2Q26 TCE Ratio AOCL Impact Adj. TCE Ratio 2Q26 Adjusted Tangible Book Value per Share $12.68 $2.23 $15.04 2Q26 TBVPS AOCL Impact Adj. TBVPS 2Q26 Adjusted ROACE 19.49% 2.95% 16.54% 2Q26 ROACE AOCL Impact Adj. ROACE (1) Non-GAAP financial measures. Please refer to the calculation and management’s reason for using
these measures on Slides 14-16 titled “Second Quarter 2026 - Use of Non-GAAP Financial Measures.” 7
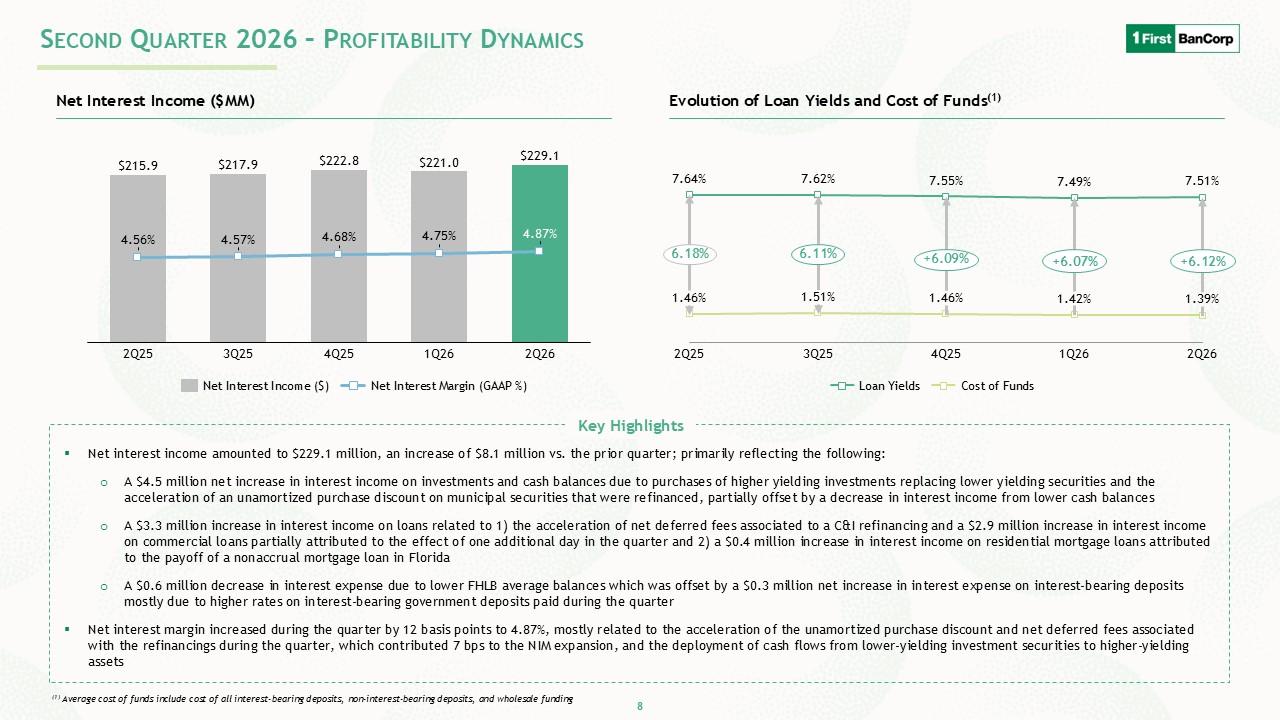
Second Quarter 2026 – Profitability Dynamics Net Interest Income ($MM) $215.9 $217.9 $222.8 $221.0 $229.1 4.56% 4.57% 4.68% 4.75% 4.87% 2Q25 3Q25 4Q25 1Q26 2Q26 Net Interest Income ($) Net Interest Margin (GAAP %) Key Highlights Net interest income amounted to $229.1 million, an increase of $8.1 million vs. the prior quarter; primarily reflecting the following: A $4.5 million net increase in interest income on investments and cash balances due to purchases of higher yielding investments replacing lower yielding securities and the acceleration of an unamortized purchase discount on municipal securities that were refinanced, partially offset by a decrease in interest income from lower cash balances A $3.3 million increase in interest income on loans related to 1) the acceleration of net deferred fees associated to a C&I refinancing and a $2.9 million increase in interest income on commercial loans partially attributed to the effect of one additional day in the quarter and 2) a $0.4 million increase in interest income on residential mortgage loans attributed to the payoff of a nonaccrual mortgage loan in Florida A $0.6 million decrease in interest expense due to lower FHLB average balances which was offset by a $0.3 million net increase in interest expense on interest-bearing deposits mostly due to higher rates on interest-bearing government deposits paid during the quarter Net interest margin increased during the quarter by 12 basis points to 4.87%, mostly related to the acceleration of the unamortized purchase discount and net deferred fees associated with the refinancings during the quarter, which contributed 7 bps to the NIM expansion, and the deployment of cash flows from lower-yielding investment securities to higher-yielding assets Evolution of Loan Yields and Cost of Funds(1) 7.64% 7.62% 7.55% 7.49% 7.51% 6.18% 6.11% 6.09% 6.07% 6.12% 1.46% 1.51% 1.46% 1.42% 1.39%
2Q25 3Q25 4Q25 1Q26 2Q26 Loan Yields Cost of Funds (1) Average cost of funds include cost of all interest-bearing deposits, non-interest -bearing deposits, and wholesale funding 8
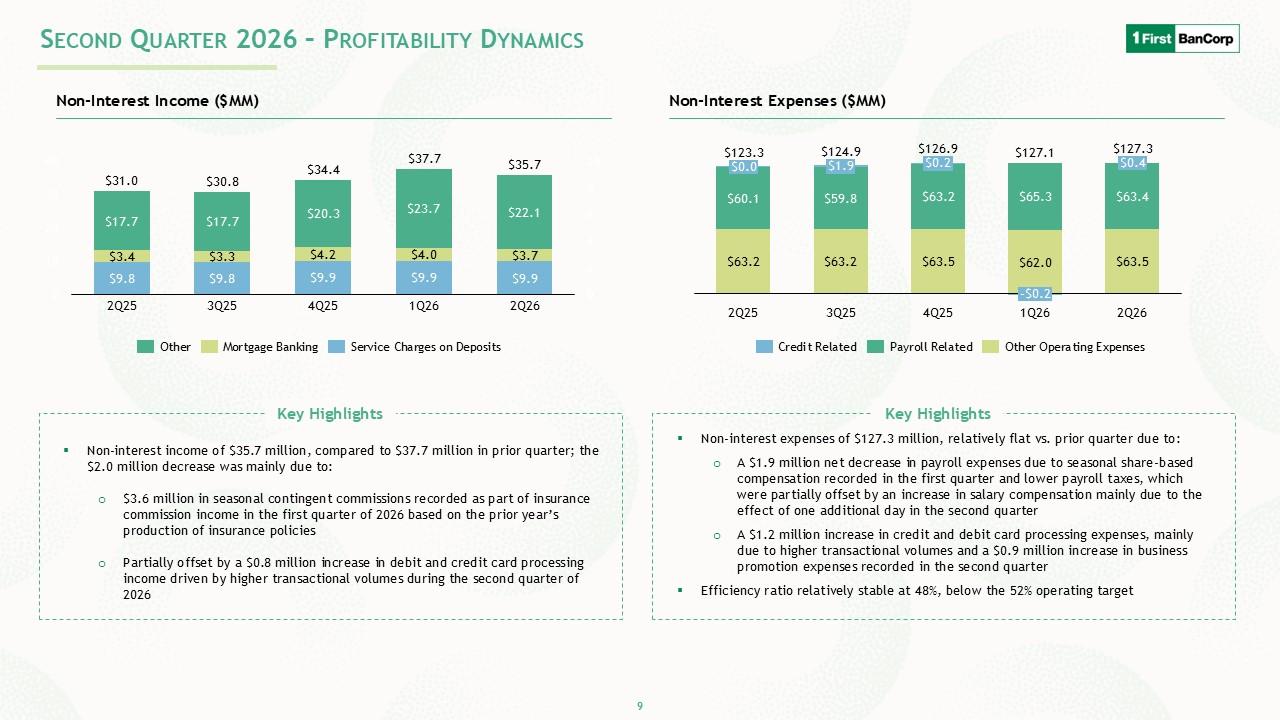
Non-Interest Income ($MM) $31.0 $30.8 $34.4 $37.7 $35.7 $17.7 $17.7 $20.3 $23.7 $22.1 $3.4 $3.3 $4.2 $4.0 $3.7 $9.8 $9.8 $9.9 $9.9 $9.9 2Q25 3Q25 4Q25 1Q26 2Q26 Other Mortgage Banking Service Charges on Deposits Key Highlights Non-interest income of $35.7 million, compared to $37.7 million in prior quarter; the $2.0 million decrease was mainly due to: $3.6 million in seasonal contingent commissions recorded as part of insurance commission income in the first quarter of 2026 based on the prior year’s production of insurance policies Partially offset by a $0.8 million increase in debit and credit card processing income driven by higher transactional volumes during the second quarter of 2026 Non-Interest Expenses ($MM) $1,233.3 $124.9 $126.9 $127.1 $127.3 $0.0 $1.9 $0.2 -$0.2 $0.4 $60.1 $59.8 $63.2 $65.3 $634.0 $63.2 $63.2 $63.5 $62.0 $63.5 $9.8 $9.8 $9.9 $9.9 $9.9 2Q25 3Q25 4Q25 1Q26 2Q26 Credit Related Payroll Related Other Operating Expenses Key Highlights Non -interest expenses of $127.3 million, relatively flat vs. prior quarter due to: A $1.9 million net decrease in payroll expenses due to seasonal share-based compensation recorded in the first quarter and lower payroll taxes, which were partially offset by an increase in salary compensation mainly due to the effect of one additional day in the second quarter A $1.2 million increase in credit and debit card processing expenses, mainly due to higher transactional volumes and a $0.9 million increase in business promotion expenses recorded in the second quarter Efficiency ratio relatively stable at 48%, below the 52% operating target 9
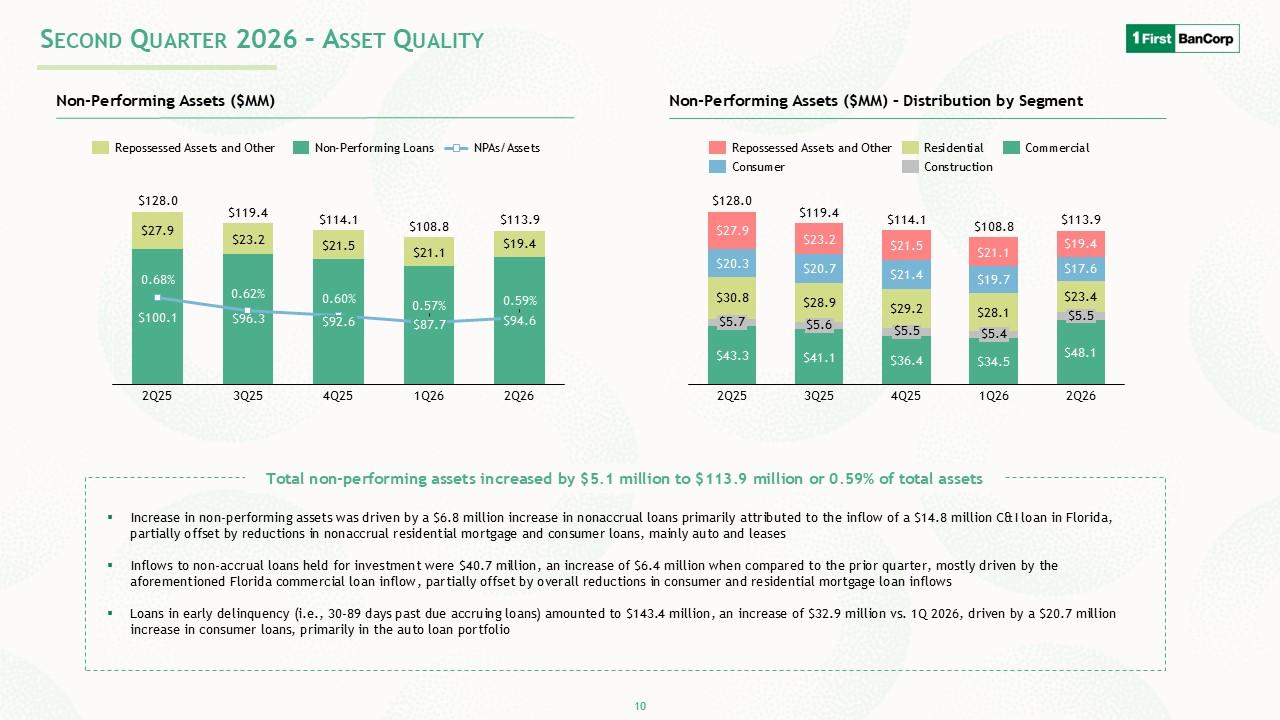
Second Quarter 2026 – Asset Quality Non-Performing Assets ($MM) Repossessed Assets and Other Non-Performing Loans NPAs/Assets $128.0 $119.4 $114.1 $108.8 $113.9 $27.9 $23.2 $21.5 $21.1 $19.4 0.68% 0.62% 0.60% 0.57% 0.59% $100.1 $96.3 $92.6 $57.7 $94.6 2Q25 3Q25 4Q25 1Q26 2Q26 Non-Performing Assets ($MM) – Distribution by Segment Repossessed Assets and Other Consumer Residential Construction Commercial $128.0 $119.4 $114.1 $108.8 $113.9 $27.9 $23.2 $21.5 $21.1 $19.4 $20.3 $20.7 $21.4 $19.7 $17.6 $308.0 $28.9 $29.2 $28.1 $23.4 $5.7 $5.6 $5.5 $5.4 $5.5 $43.3 $41.1 $36.4 $34.5 $48.1 2Q25 3Q25 4Q25 1Q26 2Q26 Total non-performing assets increased by $5.1 million to $113.9 million or 0.59% of total assets Increase in non-performing assets was driven by a $6.8 million increase in nonaccrual loans primarily attributed to the inflow of a $14.8 million C&I loan in Florida, partially offset by reductions in nonaccrual residential mortgage and consumer loans, mainly auto and leases Inflows to non-accrual loans held for investment were $40.7 million, an increase of $6.4 million when compared to the prior quarter, mostly driven by the aforementioned Florida commercial loan inflow, partially offset by overall reductions in consumer and residential mortgage loan inflows Loans in early delinquency (i.e., 30-89 days past due accruing loans) amounted to $143.4 million, an increase of $32.9 million vs. 1Q 2026, driven by a $20.7 million increase in consumer loans, primarily in the auto loan portfolio 10
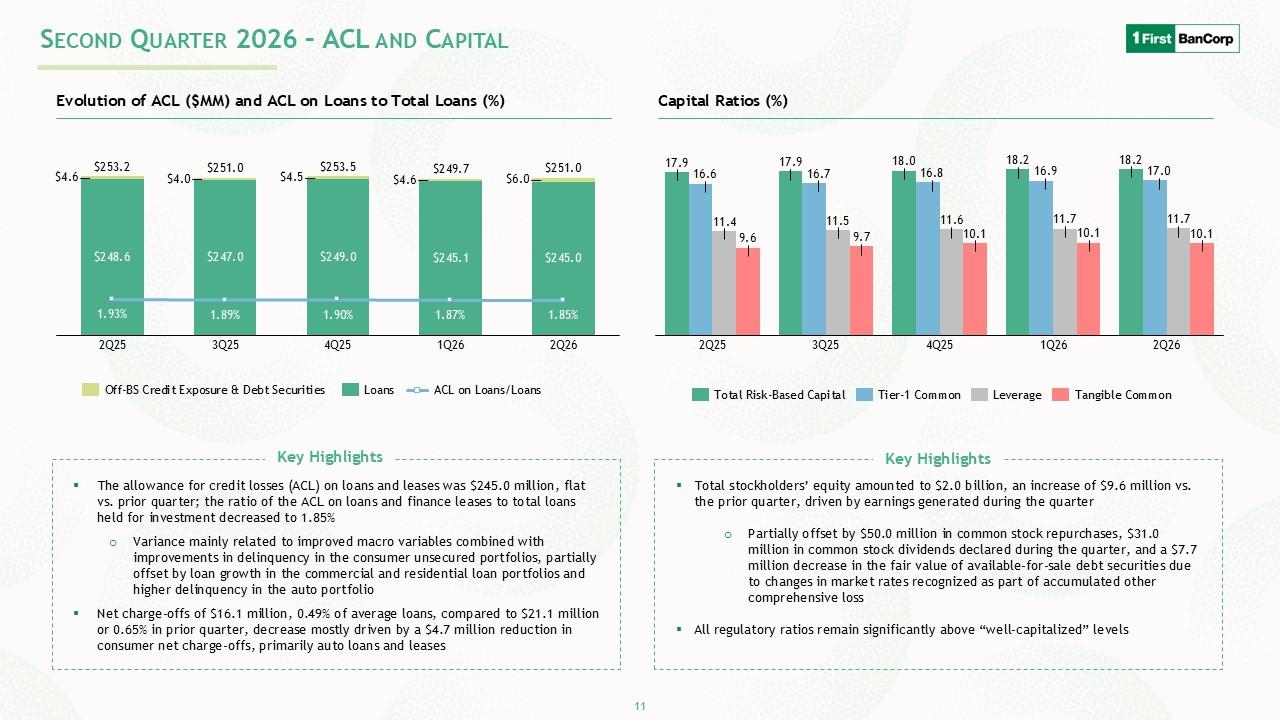
Second Quarter 2026 – ACL and Capital Evolution of ACL ($MM) and ACL on Loans to Total Loans (%) $253.2 $251.0 $253.5 $249.7 $251.0 $4.6 $4.0 $4.5 $4.6 $6.0 $248.6 $247.0 $249.0 $245.1 $245.0 1.93% 1.89% 1.90% 1.87% 1.85% 2Q25 3Q25 4Q25 1Q26 2Q26 Off-BS Credit Exposure & Debt Securities Loans ACL on Loans/Loans Key Highlights The allowance for credit losses (ACL) on loans and leases was $245.0 million, flat vs. prior quarter; the ratio of the ACL on loans and finance leases to total loans held for investment decreased to 1.85% Variance was mainly related to lower consumer and commercial ACL due to improved macroeconomic variables, partially offset an increase in the mortgage ACL mostly due to loan growth Net charge-offs of $16.1 million, 0.49% of average loans, compared to $21.1 million or 0.65% in prior quarter, decrease mostly driven by a $4.7 million reduction in consumer net charge-offs, primarily auto loans and leases Capital Ratios (%) 17.9 16.6 11.4 9.6 17.9 16.7 11.5 9.7 18 16.8 11.6 10.1 18.2 16.9 11.7 10.1 18.2 16.9 11.7 10.1 2Q25 3Q25 4Q25 1Q26 2Q26 Total Risk-Based Capital Tier-1 Common Leverage Tangible Common Key Highlights Total stockholders’ equity amounted to $2.0 billion, an increase of $9.6 million vs. the prior quarter, driven by earnings generated during the quarter Partially offset by $50.0 million in common stock repurchases, $31.0 million in common stock dividends declared during the quarter, and a $7.7 million decrease in the fair value of available-for-sale debt securities due to changes in market rates recognized as part of accumulated other comprehensive loss All regulatory ratios remain significantly above “well-capitalized” levels 11
2Q 2026 Financial Results Appendix and Non-GAAP Financial Measures
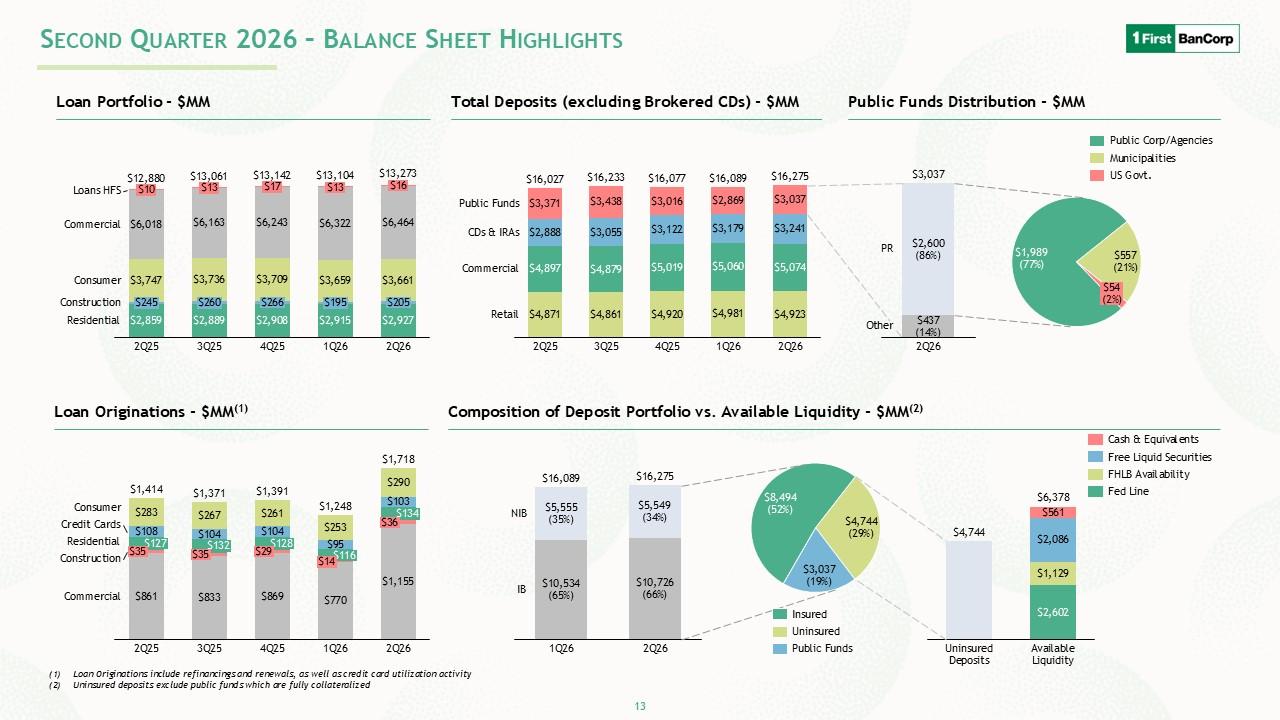
Second Quarter 2026 – Balance Sheet Highlights Loan Portfolio - $MM $12,880 $13,061 $13,142 $13,104 $13,273 Loans HFS $10 $13 $17 $13 $16 Commercial $20 $6,018 $6,163 $6,243 $6,322 Consumer $308 $3,747 $3,736 $3,709 $3,659 Construction $6 $245 $260 $266 $195 Retail $43 $2,859 $2,889 $2,908 $2,915 2Q25 3Q25 4Q25 1Q26 2Q26 Total Deposits (excluding Brokered CDs) - $MM $16,027 $16,233 $16,077 $16,089 $16,275 Public Funds $3,371 $3,438 $3,016 $2,869 $3,037 CDs & IRAs $2,888 $3,055 $3,122 $3,179 $3,241 Commercial $4,897 $4,879 $5,019 $5,060 $5,074 Retail $4,871 $4,861 $4,920 $4,981 $4,923 2Q25 3Q25 4Q25 1Q26 2Q26 Public Funds Distribution - $MM $3,037 $2,600 -86% $437 -14% 2Q26 Loan Originations - $MM(1) $1,414 $1,371 $1,391 $1,248 $1,718 Consumer $283 $267 $261 $253 $290 Credit Cards $108 $104 $104 $95 $103 Residential $127 $132 $128 $116 $134 Construction $35 $35 $29 $14 $36 Commercial $861 $833 $869 $770 $1,155 2Q25 3Q25 4Q25 1Q26 2Q26 Composition of Deposit Portfolio vs. Available Liquidity - $MM(2) $165,089 $16,275 $5,555 $5,549 -35% -34% $10,534 $10,726 -65% -66% 1Q26 2Q26 $165,089 $16,275 $5,555 $5,549 -35% -34% $10,534 $10,726 -65% -66% Ininsured Available Deposits Liquidity (1) Loan Originations include refinancings and renewals, as well as credit card utilization activity (2) Uninsured deposits exclude public funds which are fully collateralized 13
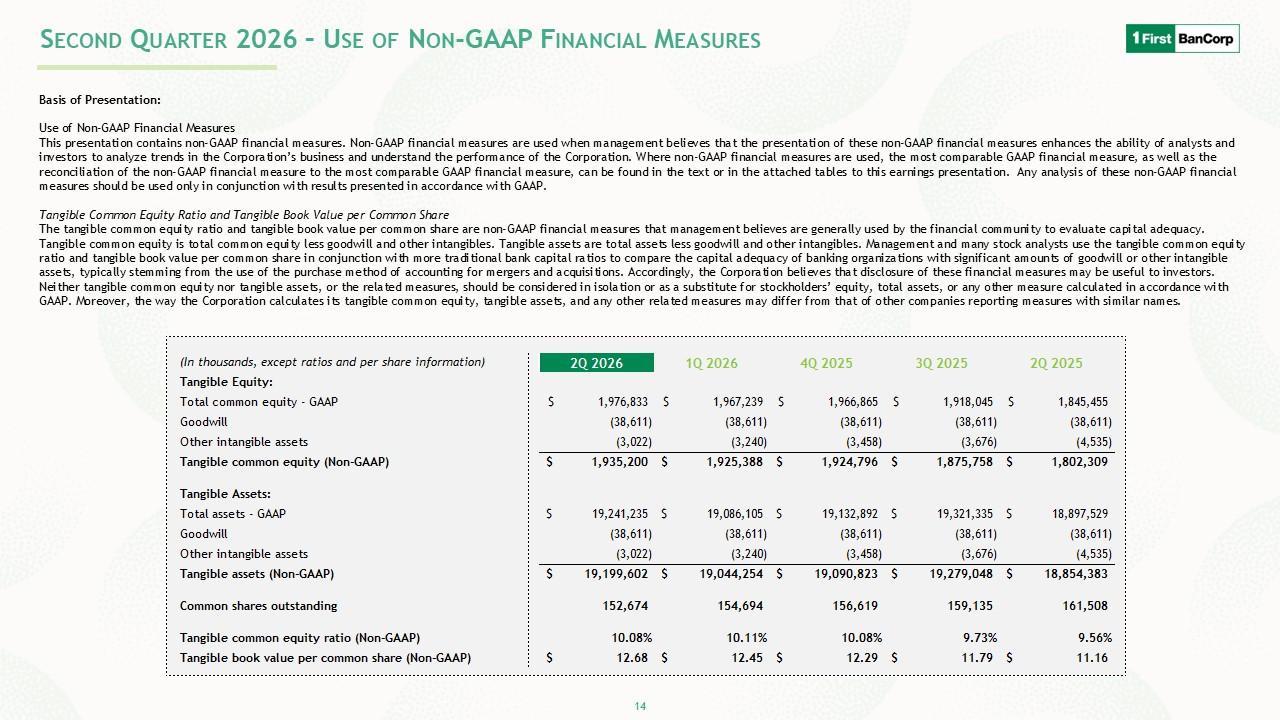
Second Quarter 2026 – Use of Non-GAAP Financial Measures Basis of Presentation: Use of Non-GAAP Financial Measures This presentation contains non-GAAP financial measures. Non-GAAP financial measures are used when management believes that the presentation of these non-GAAP financial measures enhances the ability of analysts and investors to analyze trends in the Corporation’s business and understand the performance of the Corporation. Where non-GAAP financial measures are used, the most comparable GAAP financial measure, as well as the reconciliation of the non-GAAP financial measure to the most comparable GAAP financial measure, can be found in the text or in the attached tables to this earnings presentation. Any analysis of these non-GAAP financial measures should be used only in conjunction with results presented in accordance with GAAP. Tangible Common Equity Ratio and Tangible Book Value per Common Share The tangible common equity ratio and tangible book value per common share are non-GAAP financial measures that management believes are generally used by the financial community to evaluate capital adequacy. Tangible common equity is total common equity less goodwill and other intangibles. Tangible assets are total assets less goodwill and other intangibles. Management and many stock analysts use the tangible common equity ratio and tangible book value per common share in conjunction with more traditional bank capital ratios to compare the capital adequacy of banking organizations with significant amounts of goodwill or other intangible assets, typically stemming from the use of the purchase method of accounting for mergers and acquisitions. Accordingly, the Corporation believes that disclosure of these financial measures may be useful to investors. Neither tangible common equity nor tangible assets, or the related measures, should be
considered in isolation or as a substitute for stockholders’ equity, total assets, or any other measure calculated in accordance with GAAP. Moreover, the way the Corporation calculates its tangible common equity, tangible assets, and any other related measures may differ from that of other companies reporting measures with similar names. (in thousands, except ratios and per share information 2Q 2026 1Q 2026 4Q 2025 3Q 2025 Q2 2025 Tangible Equity: Total common equity - GAAP $1,976,833 $19,672,239 $1,966,865 $1,918,045 $1,845,455 Goodwill (38,611) (38,611) (38,611) (38,611) (38,611) Other intangible assets (3,022) (3,240) (3,458) (3,676) (4,535) Tangible common equity (Non-GAAP) $1,935,200 $1,925,388 $1,924,946 $1,875,758 $1,802,309 Tangible Assets: Total assets - GAAP $19,241,235 $19,086,105 $19,132,892 $19,321,335 $18,897,529 Goodwill (38,611) (38,611) (38,611) (38,611) (38,611) Other intangible assets (3,022) (3,240) (3,458) (3,676) (4,535) Tangible common equity (Non-GAAP) $19,199,602 $19,044,254 $19,090,823 $19,279,048 $18,854,383 Common shares outstanding 15,674 154,694 15,619 159,135 161,508 Tangible common equity ration (Non- GAAP) 10.08% 10.11% 10.08% 9.73% 9.56% Tangible book value per common share (Non-GAAP) $12.68 $12.45 $12.29 $11.79 $11.16 14
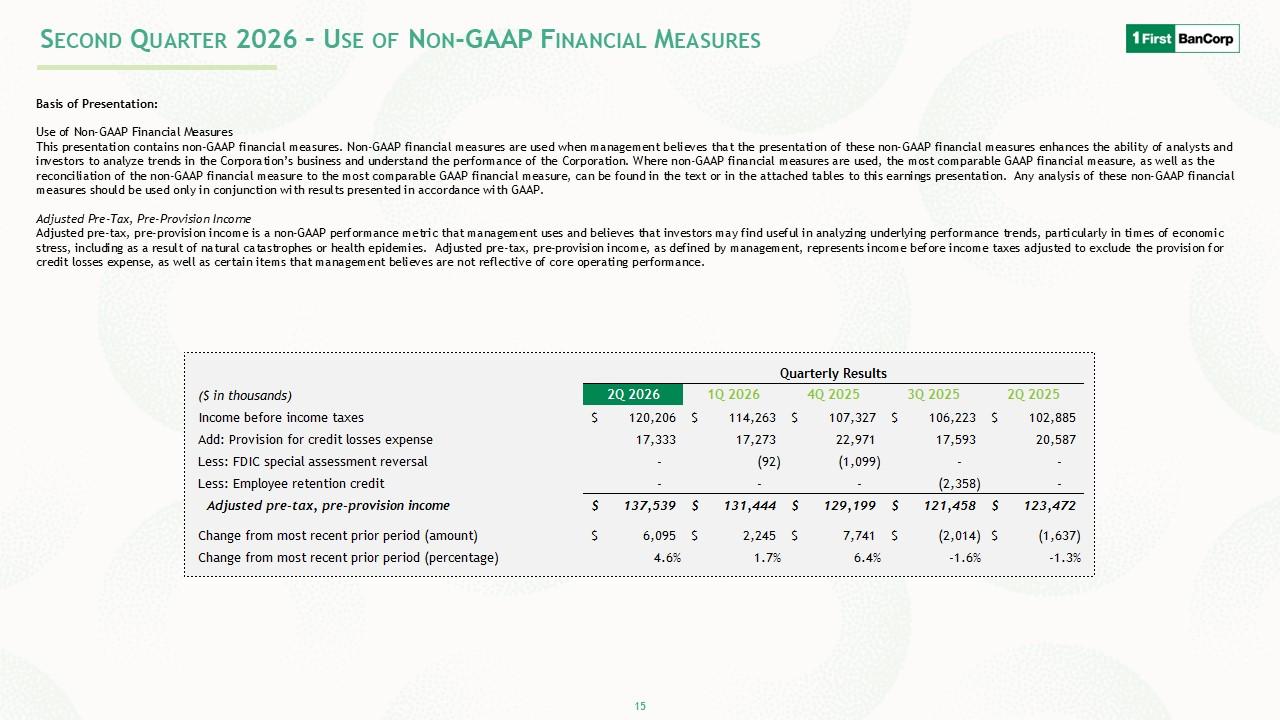
Second Quarter 2026 – Use of Non-GAAP Financial Measures Basis of Presentation: Use of Non-GAAP Financial Measures This presentation contains non-GAAP financial measures. Non-GAAP financial measures are used when management believes that the presentation of these non-GAAP financial measures enhances the ability of analysts and investors to analyze trends in the Corporation’s business and understand the performance of the Corporation. Where non-GAAP financial measures are used, the most comparable GAAP financial measure, as well as the reconciliation of the non-GAAP financial measure to the most comparable GAAP financial measure, can be found in the text or in the attached tables to this earnings presentation. Any analysis of these non-GAAP financial measures should be used only in conjunction with results presented in accordance with GAAP. Adjusted Pre-Tax, Pre-Provision Income Adjusted pre-tax, pre-provision income is a non-GAAP performance metric that management uses and believes that investors may find useful in analyzing underlying performance trends, particularly in times of economic stress, including as a result of natural catastrophes or health epidemies. Adjusted pre-tax, pre-provision income, as defined by management, represents income before income taxes adjusted to exclude the provision for credit losses expense, as well as certain items that management believe s are not reflective of core operating performance. (in thousands) 2Q 2026 1Q 2026 4Q 2025 3Q 2025 Q2 2025 Income before income taxes $120,206 $114,263 $107,327 $106,223 $102,885 Add: Provision for credit losses expense 17,333 17,273 22,971 17,593 20,587 Les: FDIC special assessment reversal — (92) (1,099) — — Less: Employee retention credit — — — (2,358) — Adjusted pre-tax, pre-provision income $137,539 $131,444 $129,199 $121,458 $123,472 Change from mos
tcertent prior period (amount) $6,095 $2,245 $7,741 -$2,014 -$1,637 Change from mos tcertent prior period (percentage) 4.6% 1.7% 6.4% -1.6% 1.3% 15
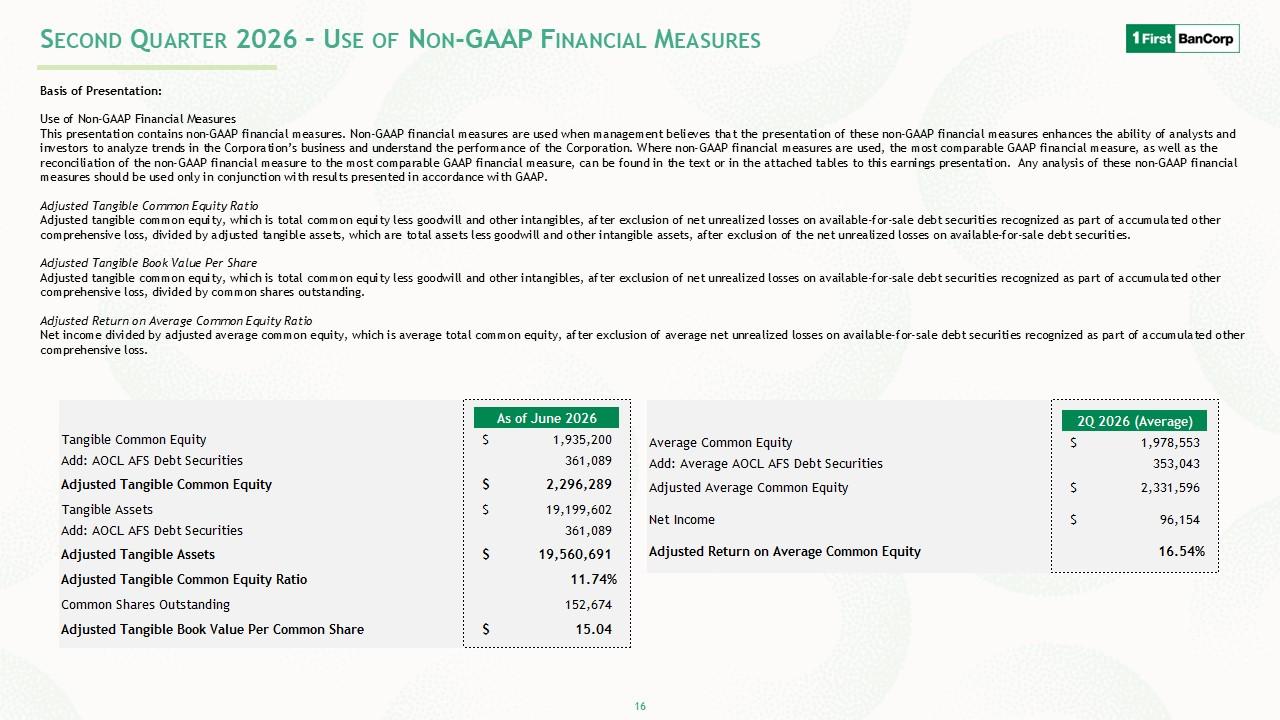
Second Quarter 2026 – Use of Non-GAAP Financial Measures Basis of Presentation: Use of Non-GAAP Financial Measures This presentation contains non-GAAP financial measures. Non-GAAP financial measures are used when management believes that the presentation of these non-GAAP financial measures enhances the ability of analysts and investors to analyze trends in the Corporation’s business and understand the performance of the Corporation. Where non-GAAP financial measures are used, the most comparable GAAP financial measure, as well as the reconciliation of the non-GAAP financial measure to the most comparable GAAP financial measure, can be found in the text or in the attached tables to this earnings presentation. Any analysis of these non-GAAP financial measures should be used only in conjunction with results presented in accordance with GAAP. Adjusted Tangible Common Equity Ratio Adjusted tangible common equity, which is total common equity less goodwill and other intangibles, after exclusion of net unrealized losses on available-for-sale debt securities recognized as part of accumulated other comprehensive loss, divided by adjusted tangible assets, which are total assets less goodwill and other intangible assets, after exclusion of the net unrealized losses on available-for-sale debt securities. Adjusted Tangible Book Value Per Share Adjusted tangible common equity, which is total common equity less goodwill and other intangibles, after exclusion of net unrealized losses on available-for-sale debt securities recognized as part of accumulated other comprehensive loss, divided by common shares outstanding. Adjusted Return on Average Common Equity Ratio Net income divided by adjusted average common equity, which is average total common equity, after exclusion of average net unrealized losses on available-for-sale debt securities recognized as part of
accumulated other comprehensive loss. As of June 2026 Tangible Common Equity $1,935,200 Add: AOCL AFS Debt Securities 361,089 Adjusted Tangible Common Equity $2,296,289 Tangibl eAssets $19,199,602 Add: AOCL AFS Debt Securities 361,089 Adjusted Tangible Assets $19,560,691 Adjusted Tangible Common Equity Ratio 11.74% Common Shares Outstanding $152,674 Adjusted Tangible Book Value Per Common Share $15.04 2Q 2026 (Average) Average Common Equity $1,978,553 Add: Average AOCL AFS Debt Securities 353,042 Adjusted Average Common Equity $2,331,596 Net Income $96,154 Adjusted Returnon Average Common Equity 16.54% 16
Financial Results Second Quarter 2026 July 22, 2026