
SECOND QUARTER SUMMARY FINANCIALS | ||||||||||||||
| Moody’s Corporation (MCO) Revenue | Moody’s Analytics (MA) Revenue | Moody’s Investors Service (MIS) Revenue | ||||||||||||
2Q 2025 | 2Q 2025 | 2Q 2025 | ||||||||||||
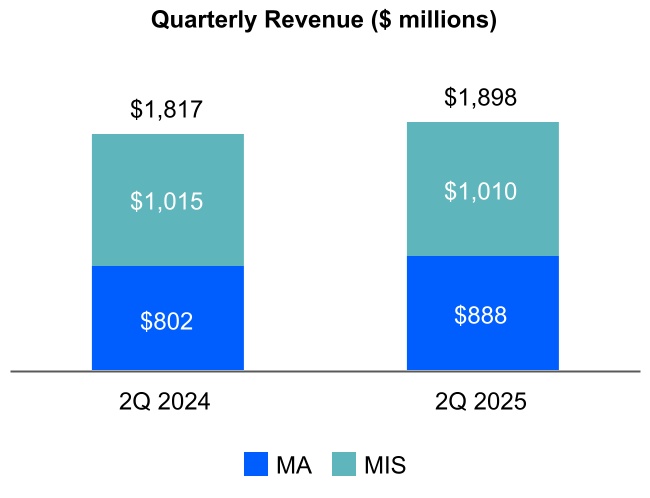
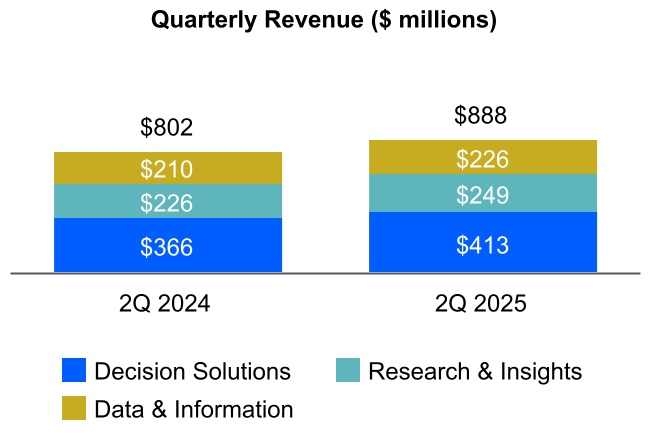
$1.9 billion ⇑ 4% | $888 million ⇑ 11% | $1.0 billion flat 0% | ||||||||||||
YTD 2025 | YTD 2025 | YTD 2025 | ||||||||||||
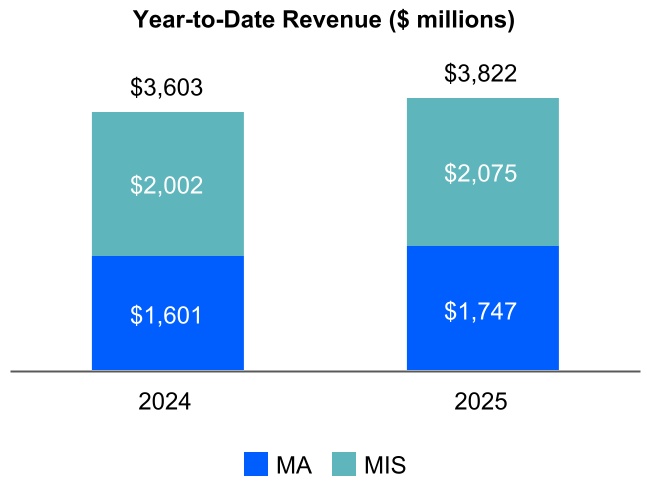
$3.8 billion ⇑ 6% | $1.7 billion ⇑ 9% | $2.1 billion ⇑ 4% | ||||||||||||
| MCO Diluted EPS | MCO Adjusted Diluted EPS2 | MCO FY 2025 Projected1 | ||||||||||||
2Q 2025 | 2Q 2025 | Diluted EPS | ||||||||||||
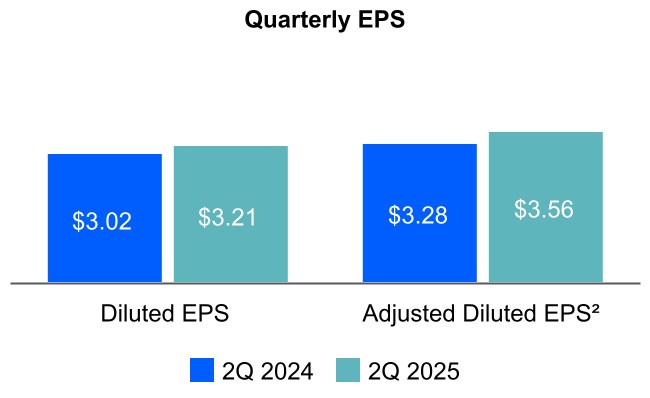
$3.21 ⇑ 6% | $3.56 ⇑ 9% | $12.25 to $12.75 | ||||||||||||
YTD 2025 | YTD 2025 | Adjusted Diluted EPS2 | ||||||||||||
$6.66 ⇑ 8% | $7.38 ⇑ 11% | $13.50 to $14.00 | ||||||||||||
“This past quarter, Moody’s provided the insights and expertise that helped markets make sense of a complex and rapidly changing global landscape. We continue to innovate and invest in our business as we capitalize on the deep currents that are driving demand for our solutions, and we are strengthening the earnings engine of the company by delivering strong recurring revenue growth combined with real cost discipline.” | |||||
| Rob Fauber President and Chief Executive Officer | |||||
“We are pleased to report a 4% increase in MCO’s second quarter revenues, driven by strong performance across both our business segments. This, combined with the significant expansion in our segments’ adjusted operating margins, highlights the success of our strategy and efficiency initiatives. Based on these results and current market trends, we are updating our expectations for MIS issuance and revenue growth and narrowing the range of our full-year adjusted diluted EPS2 guidance by $0.25 to $13.50 to $14.001, which at the midpoint implies 10% growth versus last year.” | |||||
| Noémie Heuland Chief Financial Officer | |||||
1 Guidance as of July 23, 2025. Refer to Table 12 - “2025 Outlook” for table of all items for which the Company provides guidance and page 10 for disclosure regarding the assumptions used by the Company with respect to its guidance. 2 Refer to the tables at the end of this press release for reconciliations of adjusted and constant currency measures to U.S. GAAP. | |||||
| REVENUE | ||
| Moody’s Corporation (MCO) | ||
Second Quarter 2025 | Year-to-Date 2025 | |||||||
•MCO revenue was $1.9 billion, a 4% increase from the prior-year period. •Foreign currency translation favorably impacted MCO revenue by 2%. | •MCO revenue increased 6% compared to the prior-year period. •Foreign currency translation had an immaterial impact on MCO’s revenue. | |||||||
| Moody’s Analytics (MA) | ||

Second Quarter 2025 | Year-to-Date 2025 | |||||||
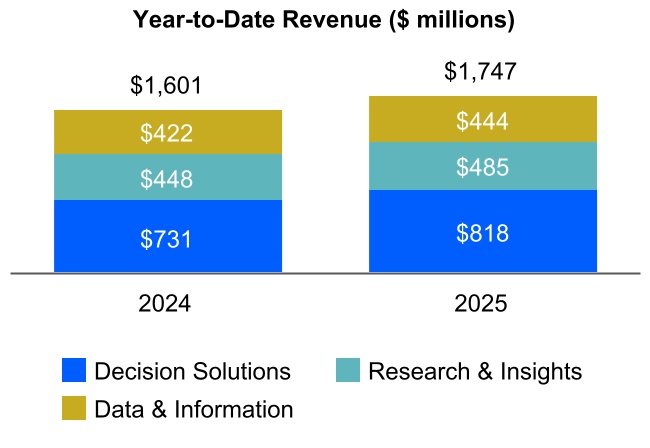
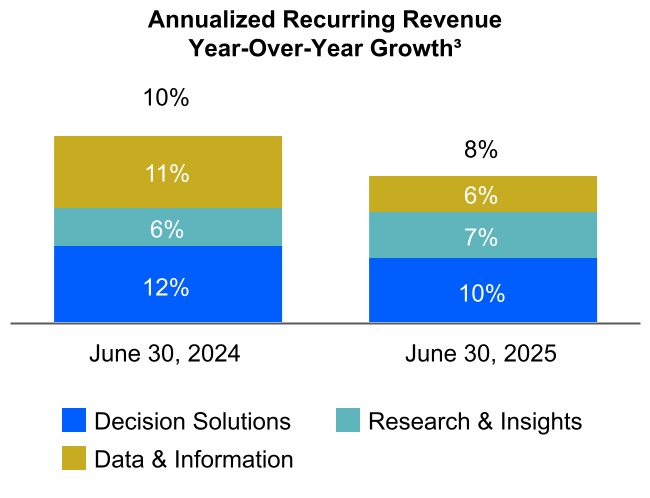
•Revenue grew 11%, or 7% on an organic constant currency basis2, versus the prior-year period, including 13% growth in Decision Solutions, followed by Research and Insights growth of 10% and Data & Information with 8% growth. •Within Decision Solutions, Banking, Insurance and Know Your Customer (KYC) revenue increased 5%, 14% and 22%, respectively. •Recurring revenue, comprising 96% of total MA revenue, grew 12% on a reported and 8% on an organic constant currency basis2. •Foreign currency translation favorably impacted MA’s revenue by 2%. | •Revenue grew 9% versus the prior-year period. •Recurring revenue grew 10% on a reported and 8% on an organic constant currency2 basis. •ARR3 of $3.3 billion increased by $246 million during the second quarter, representing 8% growth versus June 30, 2024. •Decision Solutions ARR3 grew 10%, including 7% in Banking, 9% in Insurance and 15% in KYC. Research & Insights and Data & Information ARR3 grew 7% and 6%, respectively. •Foreign currency translation favorably impacted MA’s revenue by 1%. | |||||||
3 Refer to Table 10 at the end of this press release for the definition of and further information on the Annualized Recurring Revenue (ARR) metric. | |||||
| Moody’s Investors Service (MIS) | ||
Second Quarter 2025 | Year-to-Date 2025 | |||||||
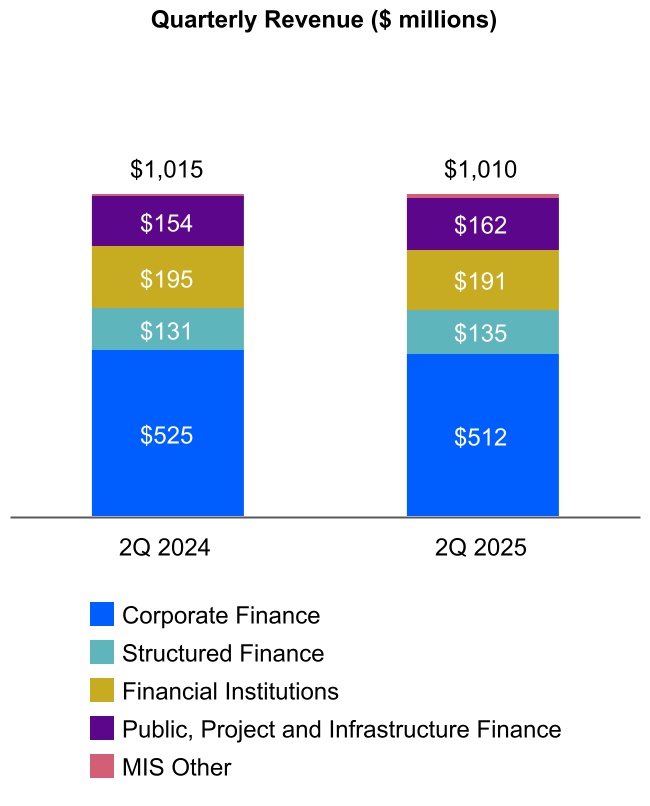
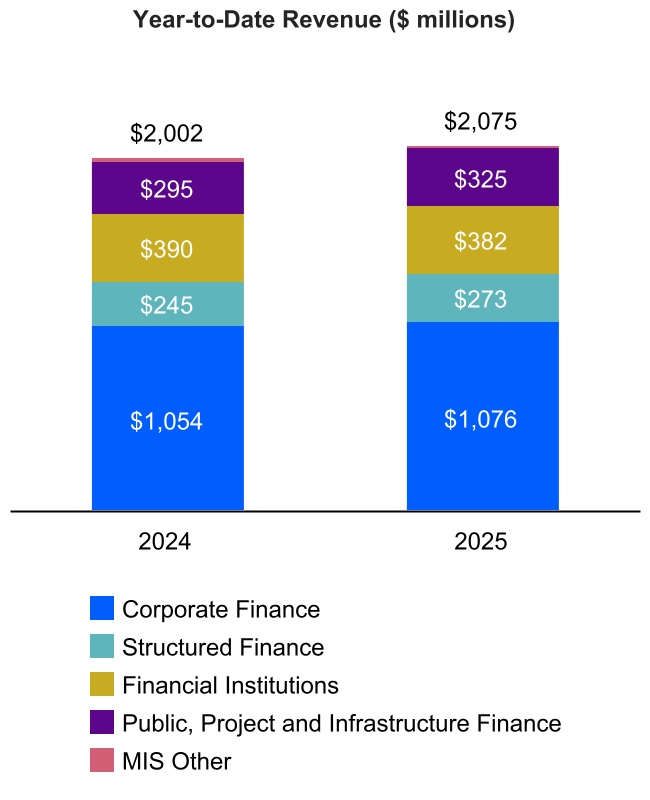
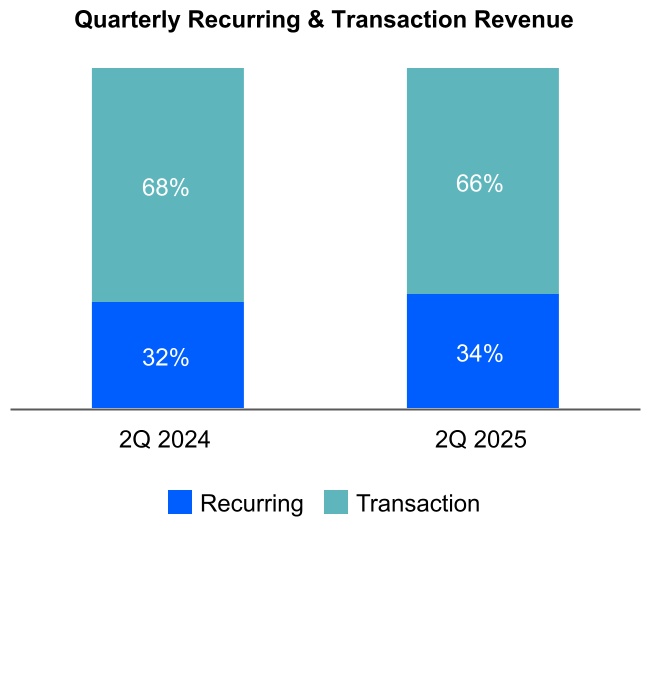
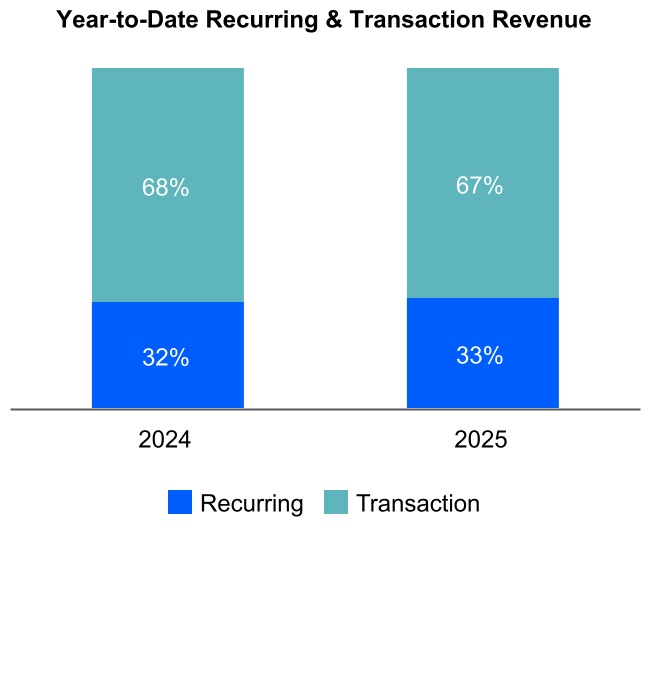
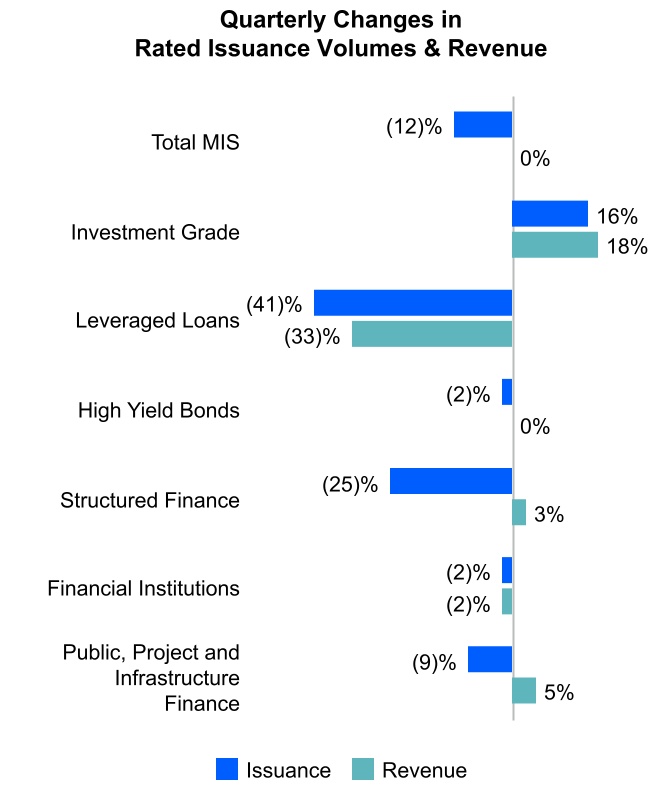
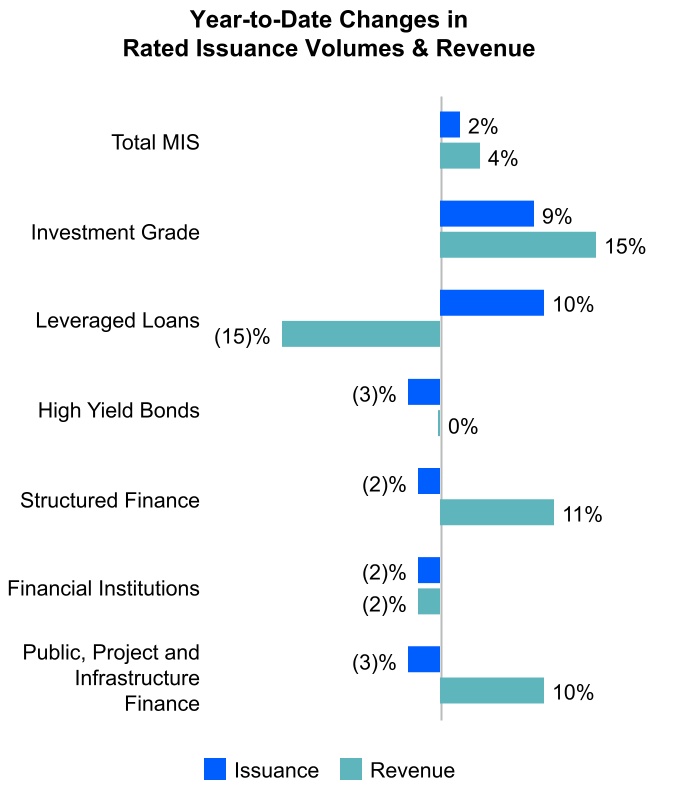
•MIS achieved over $1.0 billion in revenue for the second consecutive quarter, flat compared to the prior-year period despite a 12% decline in issuance, reflecting favorable revenue mix. •Corporate Finance revenue decline was primarily driven by lower bank loan activity, as M&A remained subdued. This was partially offset by growth in Investment Grade bonds. •Financial Institutions revenue declined due to a lower volume of infrequent Insurance issuance, given an elevated prior-year comparative. •Structured Finance revenue grew across most asset classes, as the spread environment remained favorable amidst market volatility. •Public, Project and Infrastructure Finance revenue growth was driven by U.S. Public Finance. •Foreign currency translation favorably impacted MIS revenue by 1%. | •Revenue grew 4% compared to the prior-year period. •Market conditions remained supportive despite periods of volatility, given tight spreads and strong investor demand. •Corporate Finance revenue growth was primarily driven by Investment Grade issuers due to strong demand for high-quality credits. •Financial Institutions revenue declined due to lower activity in the Insurance sector, following record prior-year activity. •Structured Finance revenue growth was primarily driven by CMBS. •Public, Project and Infrastructure Finance revenue growth came mainly from U.S. Public Finance as issuers tapped the market to get ahead of potential further volatility. •Foreign currency translation had an immaterial impact on MIS revenue. | |||||||
| OPERATING EXPENSES AND MARGIN | ||
MCO Operating Expenses | ||
Second Quarter 2025 | Year-to-Date 2025 | |||||||
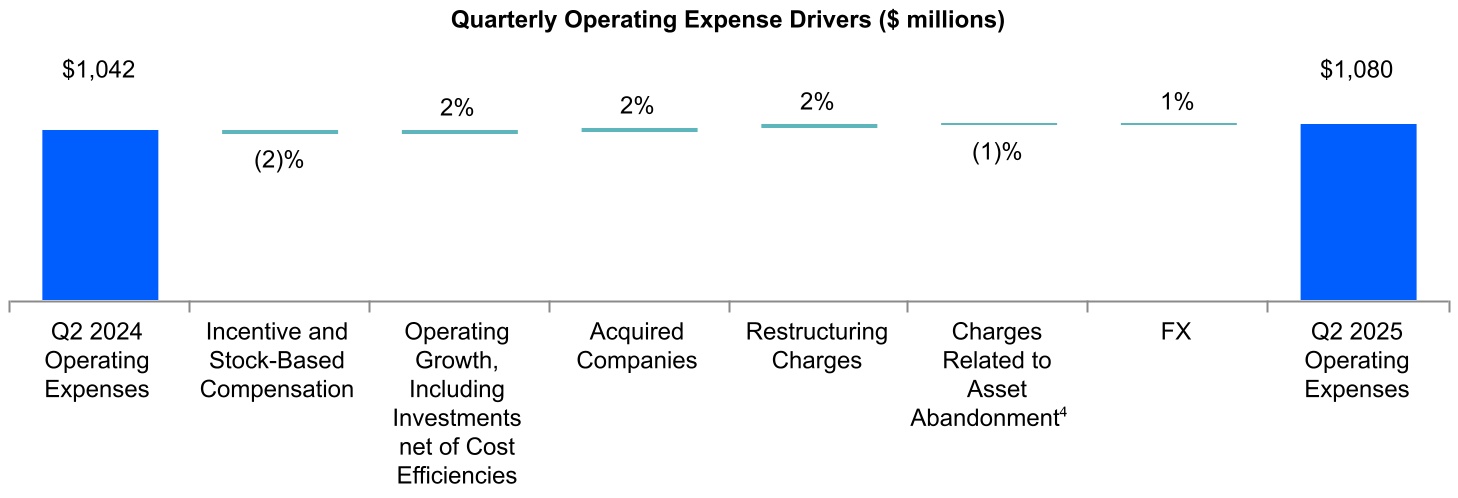
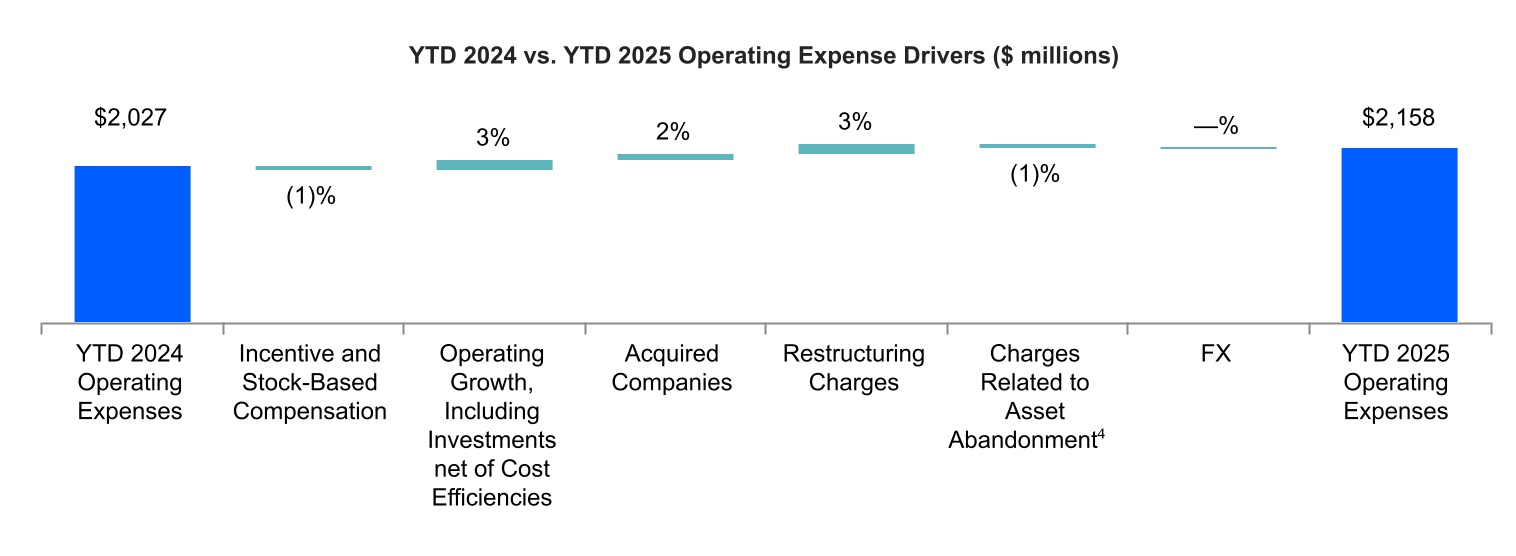
•Operating expenses grew 4% compared to the prior-year period, including 2% from restructuring charges as well as 2% from recent acquisitions. Operating growth was 2% as efficiency gains partially offset growth from ongoing investments in the business. •Foreign currency favorably impacted operating expenses by 1%. | •Operating expenses grew 6% compared to the prior-year period, including 3% from restructuring charges aimed at enabling efficiencies and improving operating leverage, as well as 2% from recent acquisitions. Operating growth, including ongoing investments, was 3%, supported by disciplined expense management. •Foreign currency had an immaterial impact on operating expenses. | |||||||
4 Refer to Table 5 - “Financial Information by Segment (Unaudited)” for more information regarding the “Charges Related to Asset Abandonment” category. | |||||
Operating Margin and Adjusted Operating Margin2 | ||
Second Quarter 2025 | Year-to-Date 2025 | |||||||
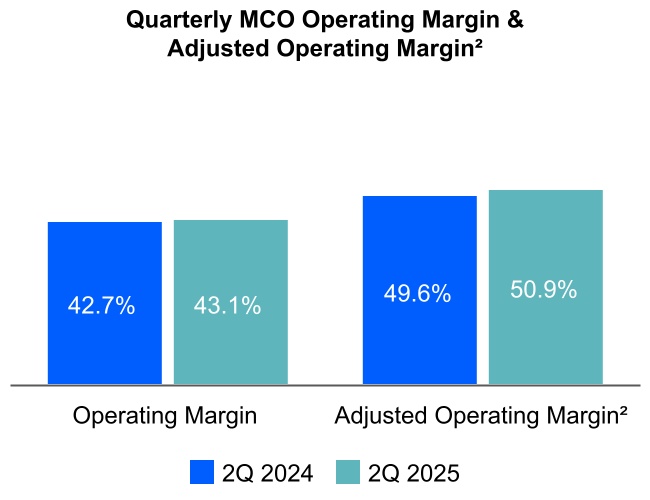
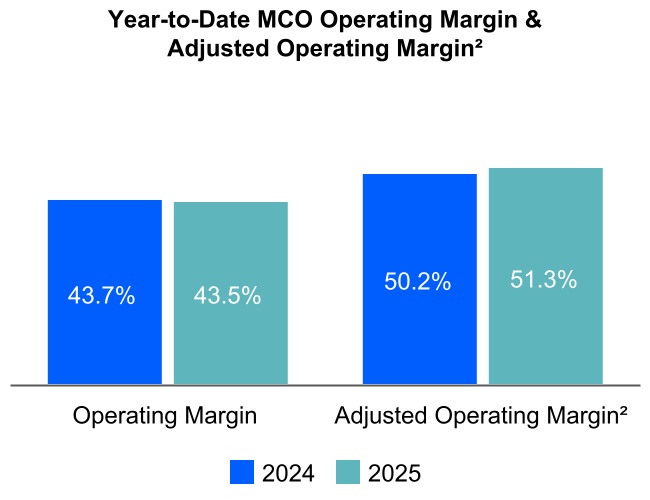
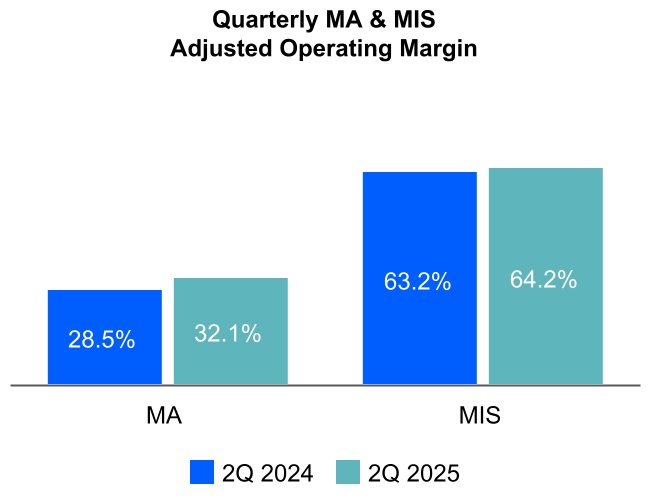
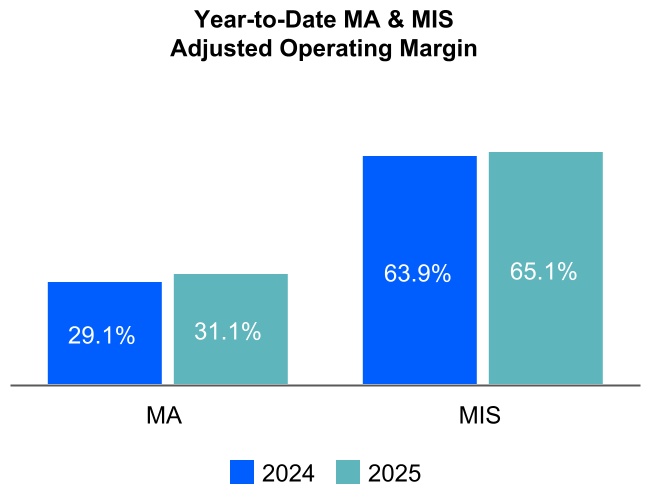
•MCO’s operating margin was 43.1%. MCO’s adjusted operating margin2 was 50.9%, up 130 basis points from the prior-year period. •MA’s adjusted operating margin was 32.1%, up 360 basis points from the prior-year period, reflecting strong revenue growth combined with disciplined cost management. •MIS’s adjusted operating margin was 64.2%, up 100 basis points from the prior-year period. •Foreign currency translation had an immaterial impact on MCO’s operating and adjusted operating margins2. | •MCO’s operating margin was 43.5% and MCO’s adjusted operating margin2 was 51.3%. •MA’s adjusted operating margin was 31.1%, up 200 basis points from the prior-year period, driven by revenue growth coupled with the benefits from the Strategic and Operational Efficiency Restructuring Program which enabled greater operational efficiency and cost savings. •MIS’s adjusted operating margin was 65.1%, up 120 basis points from the prior-year period. •Foreign currency translation had an immaterial impact on MCO’s operating and adjusted operating margins2. | |||||||
| EARNINGS PER SHARE (EPS) | ||
Diluted EPS and Adjusted Diluted EPS2 | ||

Second Quarter 2025 | Year-to-Date 2025 | |||||||
•Diluted EPS and Adjusted Diluted EPS2 grew 6% and 9%, respectively, from the prior-year period, due to healthy revenue growth and margin expansion. •The Effective Tax Rate (ETR) was 25.0%, higher than the 23.1% reported in the prior-year period, primarily attributable to higher non-U.S. and state income taxes, coupled with a decrease in excess tax benefits related to stock-based compensation. | •The increase in both Diluted EPS and Adjusted Diluted EPS2 from the prior-year period was primarily attributable to higher net income derived from strong revenue growth across both MA and MIS. •The ETR was 23.6%, in line with the prior-year period, primarily due to an increase in current year state income taxes and earnings from non-U.S. operations subject to higher income tax rates in foreign jurisdictions. | |||||||
| CAPITAL ALLOCATION AND LIQUIDITY | ||
Capital Returned to Shareholders & Free Cash Flow2 | ||
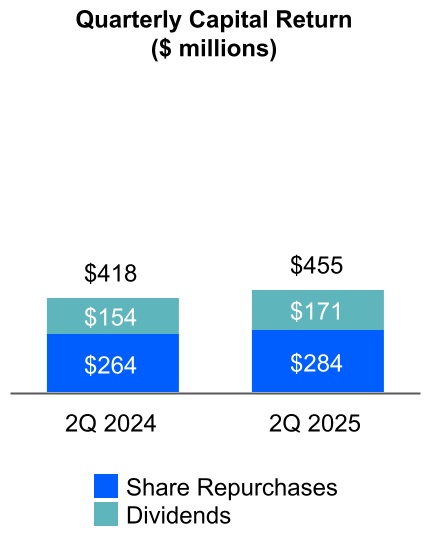
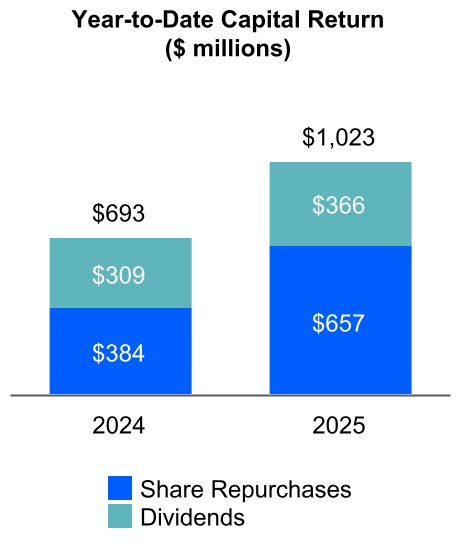
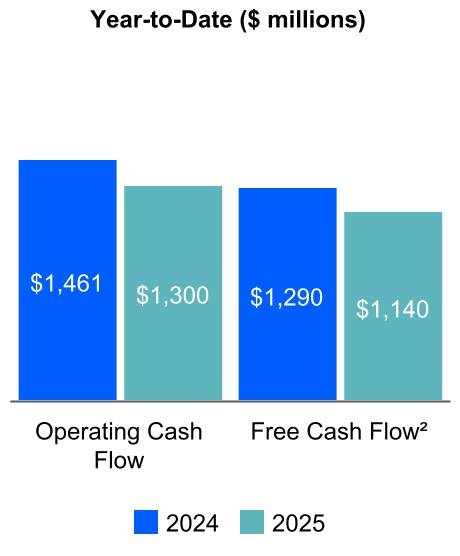
•Cash flow from operations was $1,300 million and free cash flow2 was $1,140 million. •The decrease in both operating cash flow and free cash flow2 was primarily driven by higher tax and incentive compensation payments compared to the prior-year period. •On July 22, 2025, the Board of Directors declared a regular quarterly dividend of $0.94 per share of MCO Common Stock, an 11% increase from the prior year’s quarterly dividend of $0.85 per share. The dividend will be payable on September 5, 2025, to stockholders of record at the close of business on August 15, 2025. •During the second quarter of 2025, Moody’s repurchased 0.6 million shares at an average cost of $460.76 per share and issued net 39 thousand shares as part of its employee stock-based compensation programs. The net amount included shares withheld for employee payroll taxes. •As of June 30, 2025, Moody’s had 179.4 million shares outstanding, with approximately $0.9 billion of share repurchase authority remaining. There is no established expiration date for the remaining authorization. •As of June 30, 2025, Moody's had $7.0 billion of outstanding debt and an undrawn $1.25 billion revolving credit facility. | ||
| ASSUMPTIONS AND OUTLOOK | ||
| Forecasted Item | Last Publicly Disclosed Assumption | Current Assumption | ||||||
U.S. GDP (1) growth | 0.0% - 1.0% | 0.5% - 1.5% | ||||||
Euro area GDP (1) growth | 0.0% - 1.0% | 0.5% - 1.5% | ||||||
Global GDP (1) growth | 1.0% - 2.0% | 1.5% - 2.5% | ||||||
| Global policy rates | Expecting two cuts from the U.S. Fed in 2H25. Other Central Banks to maintain easing bias | NC | ||||||
| U.S. high yield spreads | To widen to around 460 bps over the next 12 months, close to historical average of around 500 bps | To widen to around 430 bps over the next 12 months, below long-term average of around 500 bps | ||||||
| U.S. inflation rate | 3.5% - 4.5% | 2.5% - 3.5% | ||||||
| Euro area inflation rate | 2.0% - 2.5% | NC | ||||||
| U.S. unemployment rate | 4.0% - 5.0% during 2025 | NC | ||||||
| Global high yield default rate | To decline to 3.1% by year-end | To decline to around 3.6% by year-end | ||||||
| Global MIS rated issuance | Decrease in the low-single-digit to high-single-digit percent range | Decrease in the low-single-digit to mid-single-digit percent range | ||||||
| GBP/USD exchange rate | $1.29 for the remainder of the year | $1.37 for the remainder of the year | ||||||
| EUR/USD exchange rate | $1.08 for the remainder of the year | $1.17 for the remainder of the year | ||||||
NC - There is no difference between the Company’s current assumption and the last publicly disclosed assumption for this item. Note: All current assumptions are as of July 23, 2025. (1) GDP growth represents real GDP. | ||||||||
| TELECONFERENCE DETAILS | ||
| Date and Time | July 23, 2025, at 9:00 a.m. Eastern Time (ET). | |||||||
| Webcast | The webcast and its replay can be accessed through Moody’s Investor Relations website, ir.moodys.com, within “Events & Presentations.” | |||||||
| Dial In | U.S. and Canada | ‘+1-888-596-4144 | ||||||
Other callers | ‘+1-646-968-2525 | |||||||
| Passcode | 515 6491 | |||||||
| Dial In Replay | A replay will be available immediately after the call on July 23, 2025 and until July 30, 2025. | |||||||
U.S. and Canada | ‘+1-800-770-2030 | |||||||
Other callers | ‘+1-609-800-9909 | |||||||
| Passcode | 515 6491 | |||||||
| ABOUT MOODY’S CORPORATION | ||
| “SAFE HARBOR” STATEMENT UNDER THE PRIVATE SECURITIES LITIGATION REFORM ACT OF 1995 | ||
Three Months Ended June 30, | Six Months Ended June 30, | ||||||||||||||||||||||
| Amounts in millions, except per share amounts | 2025 | 2024 | 2025 | 2024 | |||||||||||||||||||
| Revenue | $ | 1,898 | $ | 1,817 | $ | 3,822 | $ | 3,603 | |||||||||||||||
| Expenses: | |||||||||||||||||||||||
| Operating | 489 | 469 | 980 | 936 | |||||||||||||||||||
Selling, general and administrative | 443 | 446 | 882 | 859 | |||||||||||||||||||
| Depreciation and amortization | 120 | 110 | 233 | 210 | |||||||||||||||||||
| Restructuring | 27 | 2 | 60 | 7 | |||||||||||||||||||
| Charges related to asset abandonment | 1 | 15 | 3 | 15 | |||||||||||||||||||
| Total expenses | 1,080 | 1,042 | 2,158 | 2,027 | |||||||||||||||||||
| Operating income | 818 | 775 | 1,664 | 1,576 | |||||||||||||||||||
| Non-operating (expense) income, net | |||||||||||||||||||||||
| Interest expense, net | (61) | (63) | (122) | (125) | |||||||||||||||||||
Other non-operating income, net | 15 | 7 | 34 | 20 | |||||||||||||||||||
| Total non-operating (expense) income, net | (46) | (56) | (88) | (105) | |||||||||||||||||||
| Income before provision for income taxes | 772 | 719 | 1,576 | 1,471 | |||||||||||||||||||
| Provision for income taxes | 193 | 166 | 372 | 341 | |||||||||||||||||||
| Net income | 579 | 553 | 1,204 | 1,130 | |||||||||||||||||||
Less: Net income attributable to noncontrolling interests | 1 | 1 | 1 | 1 | |||||||||||||||||||
Net income attributable to Moody's | $ | 578 | $ | 552 | $ | 1,203 | $ | 1,129 | |||||||||||||||
| Earnings per share attributable to Moody's common shareholders | |||||||||||||||||||||||
| Basic | $ | 3.22 | $ | 3.03 | $ | 6.69 | $ | 6.19 | |||||||||||||||
| Diluted | $ | 3.21 | $ | 3.02 | $ | 6.66 | $ | 6.16 | |||||||||||||||
| Weighted average number of shares outstanding | |||||||||||||||||||||||
| Basic | 179.7 | 182.3 | 179.9 | 182.5 | |||||||||||||||||||
| Diluted | 180.2 | 183.0 | 180.5 | 183.2 | |||||||||||||||||||
| Amounts in millions | June 30, 2025 | December 31, 2024 | |||||||||
| ASSETS | |||||||||||
| Current assets: | |||||||||||
| Cash and cash equivalents | $ | 2,174 | $ | 2,408 | |||||||
| Short-term investments | 116 | 566 | |||||||||
Accounts receivable, net of allowance for credit losses of $33 in 2025 and $32 in 2024 | 1,776 | 1,801 | |||||||||
| Other current assets | 573 | 515 | |||||||||
| Total current assets | 4,639 | 5,290 | |||||||||
Property and equipment, net of accumulated depreciation of $1,587 in 2025 and $1,453 in 2024 | 689 | 656 | |||||||||
| Operating lease right-of-use assets | 226 | 216 | |||||||||
| Goodwill | 6,481 | 5,994 | |||||||||
| Intangible assets, net | 1,989 | 1,890 | |||||||||
| Deferred tax assets, net | 318 | 293 | |||||||||
| Other assets | 1,145 | 1,166 | |||||||||
| Total assets | $ | 15,487 | $ | 15,505 | |||||||
| LIABILITIES AND SHAREHOLDERS' EQUITY | |||||||||||
| Current liabilities: | |||||||||||
| Accounts payable and accrued liabilities | $ | 968 | $ | 1,344 | |||||||
| Current portion of operating lease liabilities | 101 | 102 | |||||||||
| Current portion of long-term debt | — | 697 | |||||||||
| Deferred revenue | 1,578 | 1,454 | |||||||||
| Total current liabilities | 2,647 | 3,597 | |||||||||
| Non-current portion of deferred revenue | 57 | 57 | |||||||||
| Long-term debt | 6,967 | 6,731 | |||||||||
| Deferred tax liabilities, net | 355 | 449 | |||||||||
| Uncertain tax positions | 226 | 211 | |||||||||
| Operating lease liabilities | 214 | 216 | |||||||||
| Other liabilities | 913 | 517 | |||||||||
| Total liabilities | 11,379 | 11,778 | |||||||||
| Total Moody's shareholders' equity | 3,949 | 3,565 | |||||||||
| Noncontrolling interests | 159 | 162 | |||||||||
| Total shareholders' equity | 4,108 | 3,727 | |||||||||
Total liabilities, noncontrolling interests and shareholders' equity | $ | 15,487 | $ | 15,505 | |||||||
| Six Months Ended June 30, | |||||||||||
| Amounts in millions | 2025 | 2024 | |||||||||
Cash flows from operating activities | |||||||||||
| Net income | $ | 1,204 | $ | 1,130 | |||||||
Reconciliation of net income to net cash provided by operating activities: | |||||||||||
| Depreciation and amortization | 233 | 210 | |||||||||
| Stock-based compensation | 117 | 109 | |||||||||
Non-cash restructuring charges | 7 | — | |||||||||
| Deferred income taxes | 17 | 25 | |||||||||
Provision for credit losses on accounts receivable | 6 | 10 | |||||||||
Net changes in other operating assets and liabilities | (284) | (23) | |||||||||
| Net cash provided by operating activities | 1,300 | 1,461 | |||||||||
Cash flows from investing activities | |||||||||||
| Capital additions | (160) | (171) | |||||||||
| Purchases of investments | (118) | (87) | |||||||||
| Sales and maturities of investments | 579 | 81 | |||||||||
Purchases of investments in non-consolidated affiliates | (12) | (2) | |||||||||
| Receipts from settlement of net investment hedges | 32 | — | |||||||||
| Cash paid for acquisitions, net of cash acquired | (223) | (12) | |||||||||
| Net cash provided by (used in) investing activities | 98 | (191) | |||||||||
Cash flows from financing activities | |||||||||||
| Repayment of notes | (700) | — | |||||||||
Proceeds from stock-based compensation plans | 32 | 45 | |||||||||
Repurchase of shares related to stock-based compensation | (88) | (82) | |||||||||
Treasury shares | (657) | (384) | |||||||||
Dividends | (366) | (309) | |||||||||
| Dividends to noncontrolling interests | (1) | (1) | |||||||||
| Net cash used in financing activities | (1,780) | (731) | |||||||||
Effect of exchange rate changes on cash and cash equivalents | 148 | (34) | |||||||||
| (Decrease) increase in cash and cash equivalents | (234) | 505 | |||||||||
Cash and cash equivalents, beginning of period | 2,408 | 2,130 | |||||||||
Cash and cash equivalents, end of period | $ | 2,174 | $ | 2,635 | |||||||
Three Months Ended June 30, | Six Months Ended June 30, | ||||||||||||||||||||||
| Amounts in millions | 2025 | 2024 | 2025 | 2024 | |||||||||||||||||||
| Interest: | |||||||||||||||||||||||
| Income | $ | 13 | $ | 23 | $ | 37 | $ | 45 | |||||||||||||||
Expense on borrowings(1) | (62) | (74) | (134) | (148) | |||||||||||||||||||
Expense on UTPs and other tax related liabilities | (5) | (5) | (11) | (9) | |||||||||||||||||||
| Net periodic pension costs - interest component | (7) | (7) | (14) | (13) | |||||||||||||||||||
Interest expense, net | $ | (61) | $ | (63) | $ | (122) | $ | (125) | |||||||||||||||
Other non-operating income, net: | |||||||||||||||||||||||
FX gains (losses) | $ | 2 | $ | (4) | $ | (3) | $ | (7) | |||||||||||||||
| Net periodic pension income - non-service and non-interest cost components | 9 | 8 | 18 | 16 | |||||||||||||||||||
Income from investments in non-consolidated affiliates | 3 | 2 | 14 | 2 | |||||||||||||||||||
| Gain on investments | 2 | 5 | 5 | 8 | |||||||||||||||||||
Other | (1) | (4) | — | 1 | |||||||||||||||||||
Other non-operating income, net | $ | 15 | $ | 7 | $ | 34 | $ | 20 | |||||||||||||||
| Total non-operating (expense) income, net | $ | (46) | $ | (56) | $ | (88) | $ | (105) | |||||||||||||||
(1) Expense on borrowings includes interest on long-term debt and realized gains/losses related to interest rate swaps and cross currency swaps. | ||
Three Months Ended June 30, | |||||||||||||||||||||||||||||||||||||||||||||||
| 2025 | 2024 | ||||||||||||||||||||||||||||||||||||||||||||||
| Amounts in millions | MA | MIS | Eliminations | Consolidated | MA | MIS | Eliminations | Consolidated | |||||||||||||||||||||||||||||||||||||||
| Total external revenue | $ | 888 | $ | 1,010 | $ | — | $ | 1,898 | $ | 802 | $ | 1,015 | $ | — | $ | 1,817 | |||||||||||||||||||||||||||||||
| Intersegment revenue | 3 | 50 | (53) | — | 4 | 49 | (53) | — | |||||||||||||||||||||||||||||||||||||||
| Total revenue | 891 | 1,060 | (53) | 1,898 | 806 | 1,064 | (53) | 1,817 | |||||||||||||||||||||||||||||||||||||||
Compensation expense | 355 | 280 | — | 635 | 336 | 277 | — | 613 | |||||||||||||||||||||||||||||||||||||||
Non-compensation expense | 200 | 97 | — | 297 | 191 | 111 | — | 302 | |||||||||||||||||||||||||||||||||||||||
Intersegment expense | 50 | 3 | (53) | — | 49 | 4 | (53) | — | |||||||||||||||||||||||||||||||||||||||
| Operating, SG&A | 605 | 380 | (53) | 932 | 576 | 392 | (53) | 915 | |||||||||||||||||||||||||||||||||||||||
| Adjusted Operating Income | $ | 286 | $ | 680 | $ | — | $ | 966 | $ | 230 | $ | 672 | $ | — | $ | 902 | |||||||||||||||||||||||||||||||
| Adjusted Operating Margin | 32.1 | % | 64.2 | % | 50.9 | % | 28.5 | % | 63.2 | % | 49.6 | % | |||||||||||||||||||||||||||||||||||
| Depreciation and amortization | 97 | 23 | — | 120 | 90 | 20 | — | 110 | |||||||||||||||||||||||||||||||||||||||
| Restructuring | 18 | 9 | — | 27 | 1 | 1 | — | 2 | |||||||||||||||||||||||||||||||||||||||
Charges related to asset abandonment (1) | 1 | — | — | 1 | 15 | — | — | 15 | |||||||||||||||||||||||||||||||||||||||
| Operating income | $ | 818 | $ | 775 | |||||||||||||||||||||||||||||||||||||||||||
| Operating margin | 43.1 | % | 42.7 | % | |||||||||||||||||||||||||||||||||||||||||||
Non-operating (expense) income, net | (46) | (56) | |||||||||||||||||||||||||||||||||||||||||||||
Income before provision for income taxes | $ | 772 | $ | 719 | |||||||||||||||||||||||||||||||||||||||||||
Six Months Ended June 30, | |||||||||||||||||||||||||||||||||||||||||||||||
| 2025 | 2024 | ||||||||||||||||||||||||||||||||||||||||||||||
| Amounts in millions | MA | MIS | Eliminations | Consolidated | MA | MIS | Eliminations | Consolidated | |||||||||||||||||||||||||||||||||||||||
| Total external revenue | $ | 1,747 | $ | 2,075 | $ | — | $ | 3,822 | $ | 1,601 | $ | 2,002 | $ | — | $ | 3,603 | |||||||||||||||||||||||||||||||
| Intersegment revenue | 6 | 99 | (105) | — | 7 | 96 | (103) | — | |||||||||||||||||||||||||||||||||||||||
| Total revenue | 1,753 | 2,174 | (105) | 3,822 | 1,608 | 2,098 | (103) | 3,603 | |||||||||||||||||||||||||||||||||||||||
Compensation expense | 717 | 560 | — | 1,277 | 673 | 549 | — | 1,222 | |||||||||||||||||||||||||||||||||||||||
Non-compensation expense | 392 | 193 | — | 585 | 371 | 202 | — | 573 | |||||||||||||||||||||||||||||||||||||||
Intersegment expense | 99 | 6 | (105) | — | 96 | 7 | (103) | — | |||||||||||||||||||||||||||||||||||||||
| Operating, SG&A | 1,208 | 759 | (105) | 1,862 | 1,140 | 758 | (103) | 1,795 | |||||||||||||||||||||||||||||||||||||||
| Adjusted Operating Income | $ | 545 | $ | 1,415 | $ | — | $ | 1,960 | $ | 468 | $ | 1,340 | $ | — | $ | 1,808 | |||||||||||||||||||||||||||||||
| Adjusted Operating Margin | 31.1 | % | 65.1 | % | 51.3 | % | 29.1 | % | 63.9 | % | 50.2 | % | |||||||||||||||||||||||||||||||||||
| Depreciation and amortization | 191 | 42 | — | 233 | 172 | 38 | — | 210 | |||||||||||||||||||||||||||||||||||||||
| Restructuring | 44 | 16 | — | 60 | 3 | 4 | — | 7 | |||||||||||||||||||||||||||||||||||||||
Charges related to asset abandonment (1) | 3 | — | — | 3 | 15 | — | — | 15 | |||||||||||||||||||||||||||||||||||||||
| Operating income | $ | 1,664 | $ | 1,576 | |||||||||||||||||||||||||||||||||||||||||||
| Operating margin | 43.5 | % | 43.7 | % | |||||||||||||||||||||||||||||||||||||||||||
Non-operating (expense) income, net | (88) | (105) | |||||||||||||||||||||||||||||||||||||||||||||
Income before provision for income taxes | $ | 1,576 | $ | 1,471 | |||||||||||||||||||||||||||||||||||||||||||
Three Months Ended June 30, | |||||||||||||||||||||||||||||||||||
| 2025 | 2024 | ||||||||||||||||||||||||||||||||||
| Amounts in millions | Transaction | Recurring | Total | Transaction | Recurring | Total | |||||||||||||||||||||||||||||
Decision Solutions | |||||||||||||||||||||||||||||||||||
Banking | $ | 25 | $ | 113 | $ | 138 | $ | 28 | $ | 103 | $ | 131 | |||||||||||||||||||||||
| 18 | % | 82 | % | 100 | % | 21 | % | 79 | % | 100 | % | ||||||||||||||||||||||||
Insurance | $ | 6 | $ | 162 | $ | 168 | $ | 4 | $ | 143 | $ | 147 | |||||||||||||||||||||||
| 4 | % | 96 | % | 100 | % | 3 | % | 97 | % | 100 | % | ||||||||||||||||||||||||
KYC | $ | — | $ | 107 | $ | 107 | $ | 1 | $ | 87 | $ | 88 | |||||||||||||||||||||||
| — | % | 100 | % | 100 | % | 1 | % | 99 | % | 100 | % | ||||||||||||||||||||||||
Total Decision Solutions | $ | 31 | $ | 382 | $ | 413 | $ | 33 | $ | 333 | $ | 366 | |||||||||||||||||||||||
| 8 | % | 92 | % | 100 | % | 9 | % | 91 | % | 100 | % | ||||||||||||||||||||||||
| Research & Insights | $ | 3 | $ | 246 | $ | 249 | $ | 3 | $ | 223 | $ | 226 | |||||||||||||||||||||||
| 1 | % | 99 | % | 100 | % | 1 | % | 99 | % | 100 | % | ||||||||||||||||||||||||
| Data & Information | $ | 2 | $ | 224 | $ | 226 | $ | 2 | $ | 208 | $ | 210 | |||||||||||||||||||||||
| 1 | % | 99 | % | 100 | % | 1 | % | 99 | % | 100 | % | ||||||||||||||||||||||||
| Total MA | $ | 36 | $ | 852 | $ | 888 | $ | 38 | $ | 764 | $ | 802 | |||||||||||||||||||||||
| 4 | % | 96 | % | 100 | % | 5 | % | 95 | % | 100 | % | ||||||||||||||||||||||||
| Corporate Finance | $ | 365 | $ | 147 | $ | 512 | $ | 388 | $ | 137 | $ | 525 | |||||||||||||||||||||||
| 71 | % | 29 | % | 100 | % | 74 | % | 26 | % | 100 | % | ||||||||||||||||||||||||
| Structured Finance | $ | 74 | $ | 61 | $ | 135 | $ | 76 | $ | 55 | $ | 131 | |||||||||||||||||||||||
| 55 | % | 45 | % | 100 | % | 58 | % | 42 | % | 100 | % | ||||||||||||||||||||||||
| Financial Institutions | $ | 108 | $ | 83 | $ | 191 | $ | 115 | $ | 80 | $ | 195 | |||||||||||||||||||||||
| 57 | % | 43 | % | 100 | % | 59 | % | 41 | % | 100 | % | ||||||||||||||||||||||||
| Public, Project and Infrastructure Finance | $ | 113 | $ | 49 | $ | 162 | $ | 110 | $ | 44 | $ | 154 | |||||||||||||||||||||||
| 70 | % | 30 | % | 100 | % | 71 | % | 29 | % | 100 | % | ||||||||||||||||||||||||
| MIS Other | $ | 3 | $ | 7 | $ | 10 | $ | 3 | $ | 7 | $ | 10 | |||||||||||||||||||||||
| 30 | % | 70 | % | 100 | % | 30 | % | 70 | % | 100 | % | ||||||||||||||||||||||||
| Total MIS | $ | 663 | $ | 347 | $ | 1,010 | $ | 692 | $ | 323 | $ | 1,015 | |||||||||||||||||||||||
| 66 | % | 34 | % | 100 | % | 68 | % | 32 | % | 100 | % | ||||||||||||||||||||||||
| Total Moody's Corporation | $ | 699 | $ | 1,199 | $ | 1,898 | $ | 730 | $ | 1,087 | $ | 1,817 | |||||||||||||||||||||||
| 37 | % | 63 | % | 100 | % | 40 | % | 60 | % | 100 | % | ||||||||||||||||||||||||
| Six Months Ended June 30, | |||||||||||||||||||||||||||||||||||
| 2025 | 2024 | ||||||||||||||||||||||||||||||||||
| Amounts in millions | Transaction | Recurring | Total | Transaction | Recurring | Total | |||||||||||||||||||||||||||||
Decision Solutions | |||||||||||||||||||||||||||||||||||
Banking | $ | 51 | $ | 228 | $ | 279 | $ | 57 | $ | 208 | $ | 265 | |||||||||||||||||||||||
| 18 | % | 82 | % | 100 | % | 22 | % | 78 | % | 100 | % | ||||||||||||||||||||||||
Insurance | $ | 12 | $ | 319 | $ | 331 | $ | 14 | $ | 277 | $ | 291 | |||||||||||||||||||||||
| 4 | % | 96 | % | 100 | % | 5 | % | 95 | % | 100 | % | ||||||||||||||||||||||||
KYC | $ | — | $ | 208 | $ | 208 | $ | 3 | $ | 172 | $ | 175 | |||||||||||||||||||||||
| — | % | 100 | % | 100 | % | 2 | % | 98 | % | 100 | % | ||||||||||||||||||||||||
Total Decision Solutions | $ | 63 | $ | 755 | $ | 818 | $ | 74 | $ | 657 | $ | 731 | |||||||||||||||||||||||
| 8 | % | 92 | % | 100 | % | 10 | % | 90 | % | 100 | % | ||||||||||||||||||||||||
| Research & Insights | $ | 6 | $ | 479 | $ | 485 | $ | 6 | $ | 442 | $ | 448 | |||||||||||||||||||||||
| 1 | % | 99 | % | 100 | % | 1 | % | 99 | % | 100 | % | ||||||||||||||||||||||||
| Data & Information | $ | 4 | $ | 440 | $ | 444 | $ | 5 | $ | 417 | $ | 422 | |||||||||||||||||||||||
| 1 | % | 99 | % | 100 | % | 1 | % | 99 | % | 100 | % | ||||||||||||||||||||||||
| Total MA | $ | 73 | $ | 1,674 | $ | 1,747 | $ | 85 | $ | 1,516 | $ | 1,601 | |||||||||||||||||||||||
| 4 | % | 96 | % | 100 | % | 5 | % | 95 | % | 100 | % | ||||||||||||||||||||||||
| Corporate Finance | $ | 792 | $ | 284 | $ | 1,076 | $ | 787 | $ | 267 | $ | 1,054 | |||||||||||||||||||||||
| 74 | % | 26 | % | 100 | % | 75 | % | 25 | % | 100 | % | ||||||||||||||||||||||||
| Structured Finance | $ | 152 | $ | 121 | $ | 273 | $ | 135 | $ | 110 | $ | 245 | |||||||||||||||||||||||
| 56 | % | 44 | % | 100 | % | 55 | % | 45 | % | 100 | % | ||||||||||||||||||||||||
| Financial Institutions | $ | 217 | $ | 165 | $ | 382 | $ | 237 | $ | 153 | $ | 390 | |||||||||||||||||||||||
| 57 | % | 43 | % | 100 | % | 61 | % | 39 | % | 100 | % | ||||||||||||||||||||||||
| Public, Project and Infrastructure Finance | $ | 229 | $ | 96 | $ | 325 | $ | 206 | $ | 89 | $ | 295 | |||||||||||||||||||||||
| 70 | % | 30 | % | 100 | % | 70 | % | 30 | % | 100 | % | ||||||||||||||||||||||||
| MIS Other | $ | 5 | $ | 14 | $ | 19 | $ | 4 | $ | 14 | $ | 18 | |||||||||||||||||||||||
| 26 | % | 74 | % | 100 | % | 22 | % | 78 | % | 100 | % | ||||||||||||||||||||||||
| Total MIS | $ | 1,395 | $ | 680 | $ | 2,075 | $ | 1,369 | $ | 633 | $ | 2,002 | |||||||||||||||||||||||
| 67 | % | 33 | % | 100 | % | 68 | % | 32 | % | 100 | % | ||||||||||||||||||||||||
| Total Moody's Corporation | $ | 1,468 | $ | 2,354 | $ | 3,822 | $ | 1,454 | $ | 2,149 | $ | 3,603 | |||||||||||||||||||||||
| 38 | % | 62 | % | 100 | % | 40 | % | 60 | % | 100 | % | ||||||||||||||||||||||||
Three Months Ended June 30, | Six Months Ended June 30, | ||||||||||||||||||||||
| Amounts in millions | 2025 | 2024 | 2025 | 2024 | |||||||||||||||||||
| Operating income | $ | 818 | $ | 775 | $ | 1,664 | $ | 1,576 | |||||||||||||||
| Depreciation and amortization | 120 | 110 | 233 | 210 | |||||||||||||||||||
| Restructuring | 27 | 2 | 60 | 7 | |||||||||||||||||||
| Charges related to asset abandonment | 1 | 15 | 3 | 15 | |||||||||||||||||||
| Adjusted Operating Income | $ | 966 | $ | 902 | $ | 1,960 | $ | 1,808 | |||||||||||||||
| Operating margin | 43.1 | % | 42.7 | % | 43.5 | % | 43.7 | % | |||||||||||||||
| Adjusted Operating Margin | 50.9 | % | 49.6 | % | 51.3 | % | 50.2 | % | |||||||||||||||
| Six Months Ended June 30, | |||||||||||
| Amounts in millions | 2025 | 2024 | |||||||||
| Net cash provided by operating activities | $ | 1,300 | $ | 1,461 | |||||||
| Capital additions | (160) | (171) | |||||||||
| Free Cash Flow | $ | 1,140 | $ | 1,290 | |||||||
| Net cash provided by (used in) investing activities | $ | 98 | $ | (191) | |||||||
| Net cash used in financing activities | $ | (1,780) | $ | (731) | |||||||
Three Months Ended June 30, | Six Months Ended June 30, | |||||||||||||||||||||||||||||||||||||||||||||||||
| Amounts in millions | 2025 | 2024 | Change | Growth | 2025 | 2024 | Change | Growth | ||||||||||||||||||||||||||||||||||||||||||
| MCO revenue | $ | 1,898 | $ | 1,817 | $ | 81 | 4% | $ | 3,822 | $ | 3,603 | $ | 219 | 6% | ||||||||||||||||||||||||||||||||||||
| FX impact | (27) | — | (27) | (13) | — | (13) | ||||||||||||||||||||||||||||||||||||||||||||
| Inorganic revenue from acquisitions | (17) | — | (17) | (32) | — | (32) | ||||||||||||||||||||||||||||||||||||||||||||
Organic constant currency MCO revenue | $ | 1,854 | $ | 1,817 | $ | 37 | 2% | $ | 3,777 | $ | 3,603 | $ | 174 | 5% | ||||||||||||||||||||||||||||||||||||
| MA revenue | $ | 888 | $ | 802 | $ | 86 | 11% | $ | 1,747 | $ | 1,601 | $ | 146 | 9% | ||||||||||||||||||||||||||||||||||||
| FX impact | (15) | — | (15) | (7) | — | (7) | ||||||||||||||||||||||||||||||||||||||||||||
| Inorganic revenue from acquisitions | (14) | — | (14) | (25) | — | (25) | ||||||||||||||||||||||||||||||||||||||||||||
Organic constant currency MA revenue | $ | 859 | $ | 802 | $ | 57 | 7% | $ | 1,715 | $ | 1,601 | $ | 114 | 7% | ||||||||||||||||||||||||||||||||||||
| Decision Solutions revenue | $ | 413 | $ | 366 | $ | 47 | 13% | $ | 818 | $ | 731 | $ | 87 | 12% | ||||||||||||||||||||||||||||||||||||
| FX impact | (5) | — | (5) | (2) | — | (2) | ||||||||||||||||||||||||||||||||||||||||||||
| Inorganic revenue from acquisitions | (14) | — | (14) | (25) | — | (25) | ||||||||||||||||||||||||||||||||||||||||||||
Organic constant currency Decision Solutions revenue | $ | 394 | $ | 366 | $ | 28 | 8% | $ | 791 | $ | 731 | $ | 60 | 8% | ||||||||||||||||||||||||||||||||||||
| Research and Insights revenue | $ | 249 | $ | 226 | $ | 23 | 10% | $ | 485 | $ | 448 | $ | 37 | 8% | ||||||||||||||||||||||||||||||||||||
| FX impact | (4) | — | (4) | (3) | — | (3) | ||||||||||||||||||||||||||||||||||||||||||||
Constant currency Research and Insights revenue | $ | 245 | $ | 226 | $ | 19 | 8% | $ | 482 | $ | 448 | $ | 34 | 8% | ||||||||||||||||||||||||||||||||||||
| Data and Information revenue | $ | 226 | $ | 210 | $ | 16 | 8% | $ | 444 | $ | 422 | $ | 22 | 5% | ||||||||||||||||||||||||||||||||||||
| FX impact | (6) | — | (6) | (2) | — | (2) | ||||||||||||||||||||||||||||||||||||||||||||
Constant currency Data and Information revenue | $ | 220 | $ | 210 | $ | 10 | 5% | $ | 442 | $ | 422 | $ | 20 | 5% | ||||||||||||||||||||||||||||||||||||
| MA recurring revenue | $ | 852 | $ | 764 | $ | 88 | 12% | $ | 1,674 | $ | 1,516 | $ | 158 | 10% | ||||||||||||||||||||||||||||||||||||
| FX impact | (15) | — | (15) | (8) | — | (8) | ||||||||||||||||||||||||||||||||||||||||||||
| Inorganic recurring revenue from acquisitions | (13) | — | (13) | (24) | — | (24) | ||||||||||||||||||||||||||||||||||||||||||||
Organic constant currency MA recurring revenue | $ | 824 | $ | 764 | $ | 60 | 8% | $ | 1,642 | $ | 1,516 | $ | 126 | 8% | ||||||||||||||||||||||||||||||||||||
| MIS revenue | $ | 1,010 | $ | 1,015 | $ | (5) | —% | $ | 2,075 | $ | 2,002 | $ | 73 | 4% | ||||||||||||||||||||||||||||||||||||
| FX impact | (12) | — | (12) | (6) | — | (6) | ||||||||||||||||||||||||||||||||||||||||||||
| Inorganic revenue from acquisitions | (3) | — | (3) | (7) | — | (7) | ||||||||||||||||||||||||||||||||||||||||||||
Organic constant currency MIS revenue | $ | 995 | $ | 1,015 | $ | (20) | (2)% | $ | 2,062 | $ | 2,002 | $ | 60 | 3% | ||||||||||||||||||||||||||||||||||||
CFG revenue | $ | 512 | $ | 525 | $ | (13) | (2)% | $ | 1,076 | $ | 1,054 | $ | 22 | 2% | ||||||||||||||||||||||||||||||||||||
| FX impact | (7) | — | (7) | (4) | — | (4) | ||||||||||||||||||||||||||||||||||||||||||||
| Inorganic revenue from acquisitions | (1) | — | (1) | (2) | — | (2) | ||||||||||||||||||||||||||||||||||||||||||||
Organic constant currency CFG revenue | $ | 504 | $ | 525 | $ | (21) | (4)% | $ | 1,070 | $ | 1,054 | $ | 16 | 2% | ||||||||||||||||||||||||||||||||||||
| FIG revenue | $ | 191 | $ | 195 | $ | (4) | (2)% | $ | 382 | $ | 390 | $ | (8) | (2)% | ||||||||||||||||||||||||||||||||||||
| FX impact | (2) | — | (2) | — | — | — | ||||||||||||||||||||||||||||||||||||||||||||
| Inorganic revenue from acquisitions | (2) | — | (2) | (5) | — | (5) | ||||||||||||||||||||||||||||||||||||||||||||
Organic constant currency FIG revenue | $ | 187 | $ | 195 | $ | (8) | (4)% | $ | 377 | $ | 390 | $ | (13) | (3)% | ||||||||||||||||||||||||||||||||||||
| Amounts in millions | June 30, 2025 | June 30, 2024 | Change | Growth | |||||||||||||||||||
| MA ARR | |||||||||||||||||||||||
| Decision Solutions | |||||||||||||||||||||||
| Banking | $ | 456 | $ | 427 | $ | 29 | 7% | ||||||||||||||||
| Insurance | 616 | 563 | 53 | 9% | |||||||||||||||||||
| KYC | 395 | 342 | 53 | 15% | |||||||||||||||||||
Total Decision Solutions | $ | 1,467 | $ | 1,332 | $ | 135 | 10% | ||||||||||||||||
| Research and Insights | 956 | 892 | 64 | 7% | |||||||||||||||||||
| Data and Information | 874 | 827 | 47 | 6% | |||||||||||||||||||
| Total MA ARR | $ | 3,297 | $ | 3,051 | $ | 246 | 8% | ||||||||||||||||
Three Months Ended June 30, | Six Months Ended June 30, | ||||||||||||||||||||||||||||||||||
| Amounts in millions | 2025 | 2024 | 2025 | 2024 | |||||||||||||||||||||||||||||||
| Net Income attributable to Moody's common shareholders | $ | 578 | $ | 552 | $ | 1,203 | $ | 1,129 | |||||||||||||||||||||||||||
| Pre-tax Acquisition-Related Intangible Amortization Expenses | $ | 55 | $ | 48 | $ | 108 | $ | 97 | |||||||||||||||||||||||||||
| Tax on Acquisition-Related Intangible Amortization Expenses | (13) | (12) | (26) | (24) | |||||||||||||||||||||||||||||||
| Net Acquisition-Related Intangible Amortization Expenses | 42 | 36 | 82 | 73 | |||||||||||||||||||||||||||||||
| Pre-tax restructuring | $ | 27 | $ | 2 | $ | 60 | $ | 7 | |||||||||||||||||||||||||||
| Tax on restructuring | (7) | (1) | (15) | (2) | |||||||||||||||||||||||||||||||
| Net restructuring | 20 | 1 | 45 | 5 | |||||||||||||||||||||||||||||||
| Pre-tax charges related to asset abandonment | $ | 1 | $ | 15 | $ | 3 | $ | 15 | |||||||||||||||||||||||||||
| Tax on charges related to asset abandonment | (1) | (4) | (1) | (4) | |||||||||||||||||||||||||||||||
| Net charges related to asset abandonment | — | 11 | 2 | 11 | |||||||||||||||||||||||||||||||
| Adjusted Net Income | $ | 640 | $ | 600 | $ | 1,332 | $ | 1,218 | |||||||||||||||||||||||||||
Three Months Ended June 30, | Six Months Ended June 30, | ||||||||||||||||||||||||||||||||||
| 2025 | 2024 | 2025 | 2024 | ||||||||||||||||||||||||||||||||
| Diluted earnings per share attributable to Moody's common shareholders | $ | 3.21 | $ | 3.02 | $ | 6.66 | $ | 6.16 | |||||||||||||||||||||||||||
| Pre-tax Acquisition-Related Intangible Amortization Expenses | $ | 0.31 | $ | 0.26 | $ | 0.60 | $ | 0.53 | |||||||||||||||||||||||||||
| Tax on Acquisition-Related Intangible Amortization Expenses | (0.07) | (0.07) | (0.14) | (0.13) | |||||||||||||||||||||||||||||||
| Net Acquisition-Related Intangible Amortization Expenses | 0.24 | 0.19 | 0.46 | 0.40 | |||||||||||||||||||||||||||||||
| Pre-tax restructuring | $ | 0.15 | $ | 0.01 | $ | 0.33 | $ | 0.04 | |||||||||||||||||||||||||||
| Tax on restructuring | (0.04) | — | (0.08) | (0.01) | |||||||||||||||||||||||||||||||
| Net restructuring | 0.11 | 0.01 | 0.25 | 0.03 | |||||||||||||||||||||||||||||||
| Pre-tax charges related to asset abandonment | $ | 0.01 | $ | 0.08 | $ | 0.02 | $ | 0.08 | |||||||||||||||||||||||||||
| Tax on charges related to asset abandonment | (0.01) | (0.02) | (0.01) | (0.02) | |||||||||||||||||||||||||||||||
| Net charges related to asset abandonment | — | 0.06 | 0.01 | 0.06 | |||||||||||||||||||||||||||||||
| Adjusted Diluted EPS | $ | 3.56 | $ | 3.28 | $ | 7.38 | $ | 6.65 | |||||||||||||||||||||||||||
| Note: The tax impacts in the tables above were calculated using tax rates in effect in the jurisdiction for which the item relates. | ||
Full Year 2025 Moody's Corporation Guidance as of July 23, 2025 | ||||||||
Moody's Corporation (MCO) | Last Publicly Disclosed Guidance | Current Guidance | ||||||
| Revenue | Increase in the mid-single-digit percent range | NC | ||||||
Operating Expenses | Increase in the low-to-mid-single-digit percent range | NC | ||||||
Operating Margin | 42% to 43% | NC | ||||||
Adjusted Operating Margin (1) | 49% to 50% | NC | ||||||
Interest Expense, Net | $220 million to $240 million | NC | ||||||
Effective Tax Rate | 23% to 25% | NC | ||||||
Diluted EPS | $12.00 to $12.75 | $12.25 to $12.75 | ||||||
Adjusted Diluted EPS (1) | $13.25 to $14.00 | $13.50 to $14.00 | ||||||
Operating Cash Flow | $2.65 to $2.85 billion | NC | ||||||
Free Cash Flow (1) | $2.30 to $2.50 billion | NC | ||||||
Share Repurchases | At least $1.3 billion (subject to available cash, market conditions, M&A opportunities and other ongoing capital allocation decisions) | NC | ||||||
| Moody's Analytics (MA) | Last Publicly Disclosed Guidance | Current Guidance | ||||||
MA Revenue | Increase in the high-single-digit percent range | NC | ||||||
ARR (2) | Increase in the high-single-digit percent range | NC | ||||||
| MA Adjusted Operating Margin | 32% to 33% | NC | ||||||
| Moody's Investors Service (MIS) | Last Publicly Disclosed Guidance | Current Guidance | ||||||
MIS Revenue | Flat to increase in the mid-single-digit percent range | Increase in the low-single-digit to mid-single-digit percent range | ||||||
| MIS Adjusted Operating Margin | 61% to 62% | NC | ||||||
NC - There is no difference between the Company’s current guidance and the last publicly disclosed guidance for this item. Note: All current guidance as of July 23, 2025. (1) These metrics are adjusted measures. See below for reconciliation of these measures to their comparable U.S. GAAP measure. (2) Refer to Table 10 within this earnings release for the definition of and further information on the ARR metric. | ||||||||
Projected for the Year Ended December 31, 2025 | |||||
| Operating margin guidance | 42% to 43% | ||||
| Depreciation and amortization | Approximately 6% | ||||
| Restructuring | Approximately 1% | ||||
Charges Related to Asset Abandonment | Negligible | ||||
| Adjusted Operating Margin guidance | 49% to 50% | ||||
| Projected for the Year Ended December 31, 2025 | |||||
| Operating cash flow guidance | $2.65 to $2.85 billion | ||||
| Less: Capital expenditures | Approximately $350 million | ||||
| Free Cash Flow guidance | $2.30 to $2.50 billion | ||||
| Projected for the Year Ended December 31, 2025 | |||||
| Diluted EPS guidance | $12.25 to $12.75 | ||||
| Acquisition-Related Intangible Amortization | Approximately $0.90 | ||||
| Restructuring | Approximately $0.35 | ||||
Charges Related to Asset Abandonment | Negligible | ||||
| Adjusted Diluted EPS guidance | $13.50 to $14.00 | ||||