QUARTERLY REPORT PURSUANT TO SECTION 13 OR 15(d) OF THE SECURITIES EXCHANGE ACT OF 1934
For the quarterly period ended September 30, 2025
Or
☐
TRANSITION REPORT PURSUANT TO SECTION 13 OR 15(d) OF THE SECURITIES EXCHANGE ACT OF 1934
For the transition period from to
Commission file number 1-14037
____________________
Moody’s Corporation
(Exact name of registrant as specified in its charter)
Delaware
13-3998945
(State of Incorporation)
(I.R.S. Employer Identification No.)
7 World Trade Center at 250 Greenwich Street, New York, New York10007
(Address of Principal Executive Offices)
(Zip Code)
Registrant’s telephone number, including area code:
(212)553-0300
Securities registered pursuant to Section 12(b) of the Act:
Title of each class
Trading Symbol(s)
Name of each exchange on which registered
Common Stock, par value $0.01 per share
MCO
New York Stock Exchange
1.75% Senior Notes Due 2027
MCO 27
New York Stock Exchange
0.950% Senior Notes Due 2030
MCO 30
New York Stock Exchange
Indicate by check mark whether the registrant (1) has filed all reports required to be filed by Sections 13 or 15(d) of the Securities Exchange Act of 1934 during the preceding 12 months (or for such shorter period that the registrant was required to file such reports), and (2) has been subject to such filing requirements for the past 90 days. Yes ☑ No ☐
Indicate by check mark whether the registrant has submitted electronically, every Interactive Data File required to be submitted pursuant to Rule 405 of Regulation S-T during the preceding 12 months (or for such shorter period that the registrant was required to submit such files). Yes ☑ No ☐
Indicate by check mark whether the registrant is a large accelerated filer, an accelerated filer, a non-accelerated filer, smaller reporting company, or an emerging growth company. See the definitions of “large accelerated filer,” “accelerated filer,” “smaller reporting company,” and “emerging growth company” in Rule 12b-2 of the Exchange Act. (Check one):
Large Accelerated Filer
☑
Accelerated filer
☐
Non-accelerated filer
☐
Smaller reporting company
☐
Emerging growth company
☐
If an emerging growth company, indicate by check mark if the registrant has elected not to use the extended transition period for complying with any new or revised financial accounting standards provided pursuant to Section 13(a) of the Exchange Act. ☐
Indicate by check mark whether the registrant is a shell company (as defined in Rule 12b-2 of the Exchange Act). Yes ☐ No ☑
Indicate the number of shares outstanding of each of the issuer’s classes of common stock, as of the latest practicable date:
Amortization expense relating to definite-lived intangible assets acquired by the Company from all business combination transactions
Adjusted Diluted EPS
Diluted EPS excluding the impact of certain items as detailed in the section entitled “Non-GAAP Financial Measures”
Adjusted Net Income
Net Income excluding the impact of certain items as detailed in the section entitled “Non-GAAP Financial Measures”
Adjusted Operating Income
Operating income excluding the impact of certain items as detailed in the section entitled “Non-GAAP Financial Measures”
Adjusted Operating Margin
Adjusted Operating Income divided by revenue
Americas
Represents countries within North and South America, excluding the U.S.
AOCI(L)
Accumulated other comprehensive income/loss; a separate component of shareholders’ equity
ARR
Annualized Recurring Revenue; a supplemental performance metric to provide additional insight on the estimated value of MA's recurring revenue contracts at a given point in time, excluding the impact of FX and contracts related to acquisitions
ASC
The FASB Accounting Standards Codification; the sole source of authoritative GAAP as of July 1, 2009, except for rules and interpretive releases of the SEC, which are also sources of authoritative GAAP for SEC registrants
Asia-Pacific
Represents Australia and countries in Asia including but not limited to: China, India, Indonesia, Japan, Republic of South Korea, Malaysia, Singapore, Sri Lanka and Thailand
ASU
The FASB Accounting Standards Update to the ASC. Provides background information for accounting guidance and the bases for conclusions on the changes in the ASC. ASUs are not considered authoritative until codified into the ASC
BitSight
A provider that helps global market participants understand cyber risk through ratings, analytics, and performance management tools; the Company acquired a minority investment in BitSight in 2021
Board
The board of directors of the Company
BPS
Basis points
CAD
Canadian dollar
CAPE Analytics
A provider of AI-powered property risk intelligence; the Company acquired CAPE Analytics in January 2025
CCXI
China Cheng Xin International Credit Rating Co. Ltd.; the first and largest domestic credit rating agency approved by the People’s Bank of China; the Company acquired a 49% interest in 2006 and currently owns 30% of CCXI
CEO
Chief Executive Officer
CFG
Corporate finance group; an LOB of MIS
CLO
Collateralized loan obligation
CMBS
Commercial mortgage-backed securities; an asset class within SFG
CODM
Chief Operating Decision Maker; identified as the Company's CEO
COLI
Corporate-Owned Life Insurance
Common Stock
The Company’s common stock
Company
Moody’s Corporation and its subsidiaries; MCO; Moody’s
Compensation expense
Compensation expenses include salaries, benefits, incentive and stock-based compensation and other related expenses for employees. These expenses are charged to income as incurred
CP
Commercial Paper
CP Program
A program entered into on August 3, 2016 allowing the Company to privately place CP up to a maximum of $1 billion for which the maturity may not exceed 397 days from the date of issue, and which is backstopped by the 2024 Facility
CRAs
Credit rating agencies
Data and Information (D&I)
LOB within MA which provides vast data sets on companies and securities via data feeds and data applications products
LOB within MA that provides subscription-based solutions supporting banking, insurance, and KYC workflows. This LOB utilizes components from the Data & Information and Research & Insights LOBs to provide risk assessment solutions
EMEA
Represents countries within Europe, the Middle East and Africa
EPS
Earnings per share
ESTR
Euro Short-Term Rate
ETR
Effective tax rate
EU
European Union
EUR
Euros
Excess Tax Benefits
The difference between the tax benefit realized at exercise of an option or delivery of a restricted share and the tax benefit recorded at the time the option or restricted share is expensed under GAAP
Exchange Act
The Securities Exchange Act of 1934, as amended
External Revenue
Revenue excluding any intersegment amounts
FASB
Financial Accounting Standards Board
FIG
Financial institutions group; an LOB of MIS
Free Cash Flow
Net cash provided by operating activities less cash paid for capital additions
FX
Foreign exchange
GAAP
U.S. Generally Accepted Accounting Principles
GBP
British pounds
GCR (Global Credit Rating Company Limited and subsidiaries)
A domestic credit rating agency with operations spanning Africa; the Company acquired a controlling financial interest in GCR in July 2024; the Company previously accounted for GCR as an equity method investment
GDP
Gross domestic product
GLoBE
Global Anti-Base Erosion, also known as "Pillar II;" tax model issued by the OECD in 2023
HKD
Hong Kong Dollars
ICRA
ICRA Limited; a provider of credit ratings and research in India
INR
Indian rupee
JPY
Japanese yen
KYC
Know-your-customer
LOB
Line of business
MA
Moody’s Analytics - a reportable segment of MCO; consists of three LOBs - Decision Solutions; Research and Insights; and Data and Information
MAKS
Moody’s Analytics Knowledge Services; formerly known as Copal Amba; provided offshore research and analytic services to the global financial and corporate sectors; business was divested in the fourth quarter of 2019 and was formerly a reporting unit within the MA reportable segment
MCO
Moody’s Corporation and its subsidiaries; the Company; Moody’s
MD&A
Management’s Discussion and Analysis of Financial Condition and Results of Operations
M&A
Mergers and acquisitions
MIS
Moody’s Investors Service - a reportable segment of MCO; consists of five LOBs - CFG; SFG; FIG; PPIF; and MIS Other
MIS Other
Consists of financial instruments pricing services in the Asia-Pacific region, ICRA non-ratings revenue, and revenue from professional services. These businesses are components of MIS; MIS Other is an LOB of MIS
Moody’s
Moody’s Corporation and its subsidiaries; MCO; the Company
MSS
Moody's Shared Services; primarily consists of information technology and support staff such as finance, human resources and legal that support both MA and MIS
Net Income
Net income attributable to Moody’s Corporation, which excludes net income from consolidated noncontrolling interests belonging to the minority interest holder
Non-compensation expenses include costs incurred that are not related to employee compensation. This includes, but is not limited to, consulting and professional service fees, hosting expenses, rent, and marketing expenses. These expenses are charged to income as incurred
Non-GAAP
A financial measure not in accordance with GAAP; these measures, when read in conjunction with the Company’s reported results, can provide useful supplemental information for investors analyzing period-to-period comparisons of the Company’s performance, facilitate comparisons to competitors’ operating results and to provide greater transparency to investors of supplemental information used by management in its financial and operational decision making
NRSRO
Nationally Recognized Statistical Rating Organization, which is a credit rating agency registered with the SEC
Numerated
A provider of commercial lending platforms; the Company acquired Numerated in November 2024
OBBBA
The “One Big Beautiful Bill Act” enacted into U.S. law on July 4, 2025
OCI(L)
Other comprehensive income (loss); includes gains and losses on cash flow and net investment hedges, certain gains and losses relating to pension and other retirement benefit obligations and foreign currency translation adjustments
OECD
Organization for Economic Co-operation and Development
Operating segment
Term defined in the ASC relating to segment reporting; the ASC defines an operating segment as a component of a business entity that has each of the three following characteristics: i) the component engages in business activities from which it may recognize revenue and incur expenses; ii) the operating results of the component are regularly reviewed by the entity’s CODM; and iii) discrete financial information about the component is available
Pillar II
Tax model issued by the OECD in 2023; also referred to as the "Global Anti-Base Erosion" or "GLoBE" rules
PPIF
Public, project and infrastructure finance; an LOB of MIS
Praedicat
A provider of casualty insurance analytics; the Company acquired a controlling financial interest in Praedicat in September 2024; the Company previously accounted for Praedicat as an equity method investment
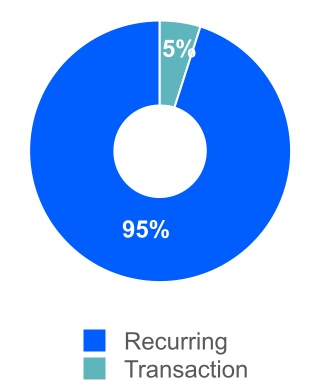
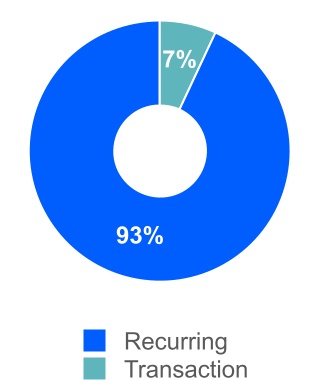
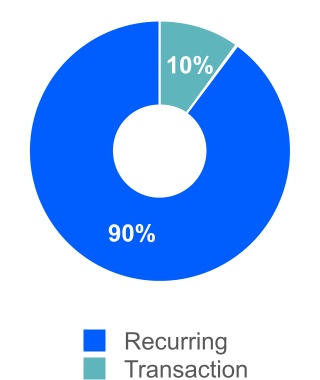
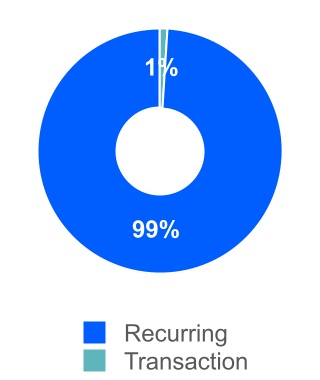
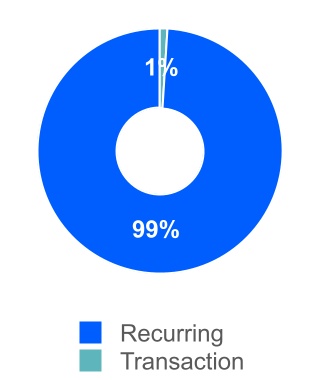
Recurring Revenue
For MA, represents subscription-based revenue and software maintenance revenue. For MIS, represents recurring monitoring fees of a rated debt obligation and/or entities that issue such obligations, as well as revenue from programs such as commercial paper, medium-term notes and shelf registrations. For MIS Other, represents financial instrument pricing services.
Reporting unit
The level at which Moody’s evaluates its goodwill for impairment under GAAP; defined as an operating segment or one level below an operating segment
Research and Insights (R&I)
LOB within MA thatprovides models, scores, expert insights and commentary. This LOB includes credit research; credit models and analytics; economics data and models; and structured finance solutions
RMBS
Residential mortgage-backed securities; an asset class within SFG
ROU Asset
Assets which represent the Company’s right to use an underlying asset for the term of a lease
SaaS
Software-as-a-Service
SEC
U.S. Securities and Exchange Commission
SFG
Structured finance group; an LOB of MIS
SG&A
Selling, general and administrative expenses
SGD
Singapore dollar
SOFR
Secured Overnight Financing Rate
Strategic and Operational Efficiency Restructuring Program
Multi-year restructuring program approved by the CEO of Moody’s on December 19, 2024 relating to the Company's strategy to realign the business toward high priority growth areas and to consolidate certain functions to simplify the organizational structure to enable efficiency and improved operating leverage; includes a reduction in staff, the rationalization and exit of certain real estate leases and incremental amortization of certain software
Tax Act
The “Tax Cuts and Jobs Act” enacted into U.S. law on December 22, 2017, which significantly amends the tax code in the U.S.
For MA, represents revenue from one-time sales, including those from perpetual software license fees, software implementation services, risk management advisory projects, and training and certification services. For MIS (excluding MIS Other), represents the initial rating of a new debt issuance as well as other one-time fees. For MIS Other, represents revenue from professional services.
(Amounts in millions, except share and per share data)
September 30, 2025
December 31, 2024
ASSETS
Current assets:
Cash and cash equivalents
$
2,181
$
2,408
Short-term investments
78
566
Accounts receivable, net of allowance for credit losses of $33 in 2025 and $32 in 2024
1,774
1,801
Other current assets
566
515
Total current assets
4,599
5,290
Property and equipment, net of accumulated depreciation of $1,506 in 2025 and $1,453 in 2024
712
656
Operating lease right-of-use assets
300
216
Goodwill
6,465
5,994
Intangible assets, net
1,916
1,890
Deferred tax assets, net
288
293
Other assets
1,135
1,166
Total assets
$
15,415
$
15,505
LIABILITIES AND SHAREHOLDERS' EQUITY
Current liabilities:
Accounts payable and accrued liabilities
$
1,032
$
1,344
Current portion of operating lease liabilities
98
102
Current portion of long-term debt
—
697
Deferred revenue
1,369
1,454
Total current liabilities
2,499
3,597
Non-current portion of deferred revenue
58
57
Long-term debt
6,983
6,731
Deferred tax liabilities, net
348
449
Uncertain tax positions
232
211
Operating lease liabilities
282
216
Other liabilities
901
517
Total liabilities
11,303
11,778
Contingencies (Note 16)
Shareholders' equity:
Preferred stock, par value $0.01 per share; 10,000,000 shares authorized; no shares issued and outstanding
—
—
Series common stock, par value $0.01 per share; 10,000,000 shares authorized; no shares issued and outstanding
—
Common stock, par value $0.01 per share; 1,000,000,000 shares authorized; 342,902,272 shares issued at September 30, 2025 and December 31, 2024, respectively
3
3
Capital surplus
1,617
1,451
Retained earnings
17,410
16,071
Treasury stock, at cost; 164,507,047 and 162,593,213 shares of common stock at September 30, 2025 and December 31, 2024, respectively
(14,535)
(13,322)
Accumulated other comprehensive loss
(538)
(638)
Total Moody's shareholders' equity
3,957
3,565
Noncontrolling interests
155
162
Total shareholders' equity
4,112
3,727
Total liabilities, noncontrolling interests and shareholders' equity
$
15,415
$
15,505
The accompanying notes are an integral part of the consolidated financial statements.
NOTES TO CONSOLIDATED FINANCIAL STATEMENTS (UNAUDITED)
(tabular dollar and share amounts in millions, except per share data)
NOTE 1. DESCRIPTION OF BUSINESS AND BASIS OF PRESENTATION
Moody’s is a global provider of integrated perspectives on risk that empowers organizations and investors to make better decisions. Moody’s reports in two reportable segments: MA and MIS.
MA is a global provider of: i) decision solutions; ii) research and insights; and iii) data and information, which help companies make better and faster decisions. MA leverages its industry expertise across multiple risks such as credit, market, financial crime, supply chain, catastrophe and climate to deliver integrated risk assessment solutions that enable business leaders to identify, measure and manage the implications of interrelated risks and opportunities.
MIS publishes credit ratings and provides assessment services on a wide range of debt obligations, programs and facilities, and the entities that issue such obligations in markets worldwide, including various corporate, financial institution and governmental obligations, and structured finance securities.
These interim financial statements have been prepared in accordance with the instructions to Form 10-Q and should be read in conjunction with the Company’s consolidated financial statements and related notes in the Company’s 2024 annual report on Form 10-K filed with the SEC on February 14, 2025. The results of interim periods are not necessarily indicative of results for the full year or any subsequent period. In the opinion of management, all adjustments (including normal recurring accruals) considered necessary for a fair presentation of financial position, results of operations and cash flows at the dates and for the periods presented have been included. The year-end consolidated balance sheet data was derived from audited financial statements, but does not include all disclosures required by GAAP.
Certain reclassifications have been made to prior period amounts to conform to the current presentation.
Recently Issued Accounting Standards
In December 2023, the FASB issued ASU 2023-09, "Income Taxes (Topic 740): Improvements to Income Tax Disclosures" ("ASU No. 2023-09"), which is intended to enhance the transparency and decision usefulness of income tax disclosures. The amendments in ASU No. 2023-09 require entities to disclose additional income tax information, primarily related to greater disaggregation of the entity's ETR reconciliation and income taxes paid by jurisdiction disclosures. This ASU is effective for annual periods beginning after December 15, 2024, and should be applied on a prospective basis; however, retrospective application is permitted. The Company is prepared to adopt and comply with the disclosure requirements set forth in this ASU upon its effective date.
In November 2024, the FASB issued ASU 2024-03, "Income Statement—Reporting Comprehensive Income—Expense Disaggregation Disclosures (Subtopic 220-40): Disaggregation of Income Statement Expenses" ("ASU No. 2024-03"). The amendments in this ASU require more detailed disclosures about specific expense categories in the notes to financial statements (including employee compensation, depreciation and intangible asset amortization) and apply to both interim and annual reporting periods. ASU No. 2024-03 also requires disclosure of total selling expenses for both interim and annual reporting periods, with an additional requirement to provide an entity’s definition of selling expenses in annual reporting. This ASU is effective in fiscal years beginning after December 15, 2026, and interim periods within fiscal years beginning after December 15, 2027. Early adoption is permitted. The amendments in this ASU should be applied either (1) prospectively for annual and interim reporting periods beginning after the aforementioned effective dates or (2) retrospectively to any or all prior periods presented in the financial statements. The Company is currently evaluating the impact of adopting this ASU on its consolidated financial statements and disclosures.
In July 2025, the FASB issued ASU 2025-05, "Financial Instruments—Credit Losses (Topic 326): Measurement of Credit Losses for Accounts Receivable and Contract Assets", which amends Topic 326 to provide a practical expedient and an accounting policy election related to the estimation of expected credit losses for current accounts receivable and current contract assets that arise from transactions accounted for under ASC 606. Specifically, in developing reasonable and supportable forecasts as part of estimating expected credit losses on accounts receivable, entities may elect a practical expedient that assumes that current conditions as of the balance sheet date do not change for the remaining life of the asset. This ASU is effective for annual reporting periods beginning after December 15, 2025, and interim reporting periods within those annual reporting periods, with early adoption permitted. Entities should apply the new guidance prospectively. The Company does not expect the adoption of this ASU to have a material impact on its financial statements.
In September 2025, the FASB issued ASU 2025-06 "Intangibles—Goodwill and Other—Internal-Use Software (Subtopic 350-40): Targeted Improvements to the Accounting for Internal-Use Software" ("ASU No. 2025-06"). This ASU eliminates prescriptive software development stages and requires capitalization of software costs when (1) management commits to funding the project, and (2) completion and intended use are probable, with consideration to when significant uncertainty associated with the development activities of the software no longer exists. This ASU also clarifies the disclosure requirements for internal-use software costs and supersedes prior guidance on website development costs. This ASU is effective for annual reporting periods beginning after December 15, 2027, with early adoption permitted. Entities may transition using prospective, modified prospective, or retrospective approaches. The Company is currently evaluating the impact of adopting this ASU on its consolidated financial statements and disclosures.
Reclassification of Previously Reported Transaction and Recurring Revenue
In the first quarter of 2025, the Company reclassified certain prior-year transaction and recurring revenue amounts to align with a refined classification methodology. The impact of the reclassifications was not material, and the reclassified amounts for 2024 are reflected in Note 3.
NOTE 2. SUMMARY OF SIGNIFICANT ACCOUNTING POLICIES
This update should be read in conjunction with the summary of significant accounting policies disclosures made in the Company's Form 10-K for the year ended December 31, 2024. All significant accounting policies described in the Form 10-K for the year ended December 31, 2024 remain unchanged with the exception of the following update:
Goodwill
Moody’s evaluates its goodwill for impairment at the reporting unit level, defined as an operating segment (i.e., MA and MIS), or one level below an operating segment (i.e., a component of an operating segment). Prior to 2025, MA's reporting unit structure consisted of two reporting units comprised of businesses that offer: i) data and data-driven analytical solutions; and ii) risk-management software, workflow and CRE solutions. During the first quarter of 2025, MA reorganized its management and reporting structure, which affected the composition of the reporting units within the MA reportable segment. As a result, MA's reporting unit structure now consists of one reporting unit, which is consistent with the segment's current management structure and operating model. This reorganization did not result in a change to the Company's reportable segments. The Company performed assessments of the reporting units impacted by the reorganization immediately before and after the reorganization became effective and determined that it was not more likely than not that the fair value of any reporting unit was less than its carrying amount.
Subsequent to the aforementioned reorganization of the MA reporting unit structure, the Company now has three reporting units: two within the Company’s ratings business (one for the ICRA business and one that encompasses all of Moody’s other ratings operations) and one reporting unit within MA.
The following table presents the Company’s revenues disaggregated by LOB:
Three Months Ended
September 30,
Nine Months Ended September 30,
2025
2024
2025
2024
MA:
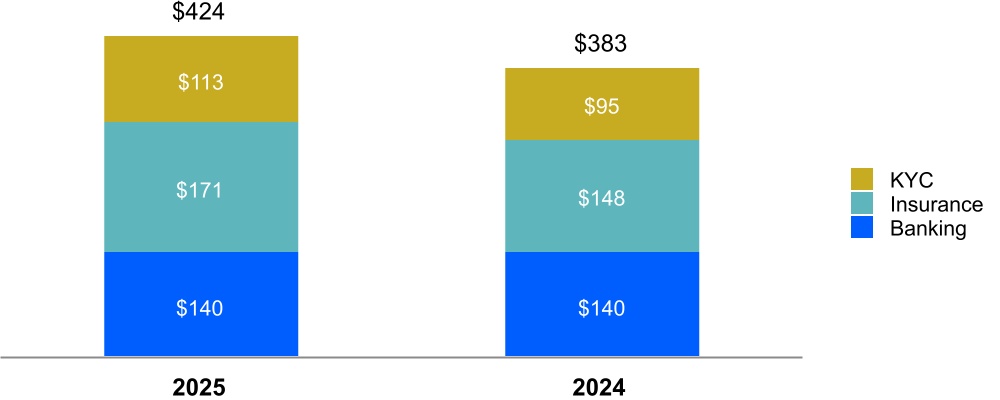
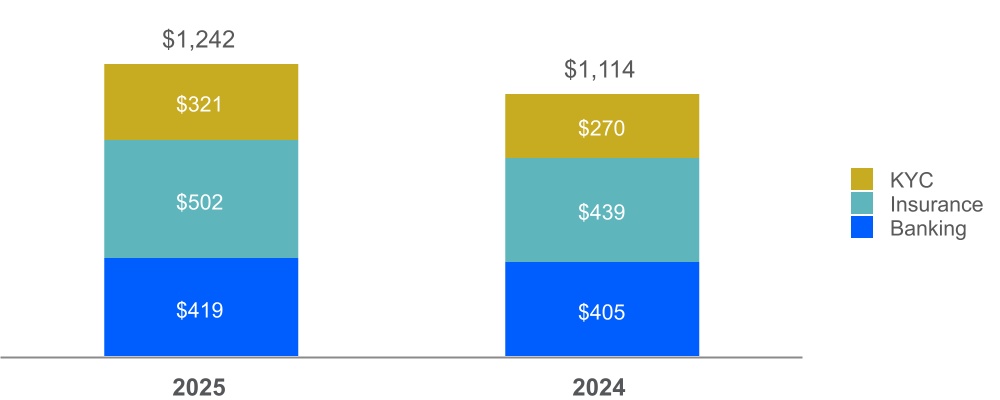
Decision Solutions (DS)
Banking
$
140
$
140
$
419
$
405
Insurance
171
148
502
439
KYC
113
95
321
270
Total DS
424
383
1,242
1,114
Research and Insights (R&I)
252
235
737
683
Data and Information (D&I)
233
213
677
635
Total external revenue
909
831
2,656
2,432
Intersegment revenue
3
3
9
10
Total MA
912
834
2,665
2,442
MIS:
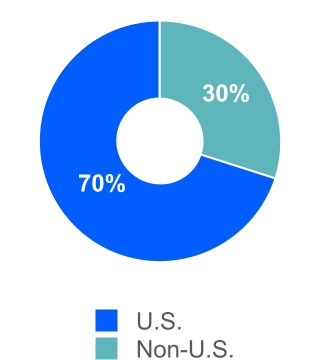
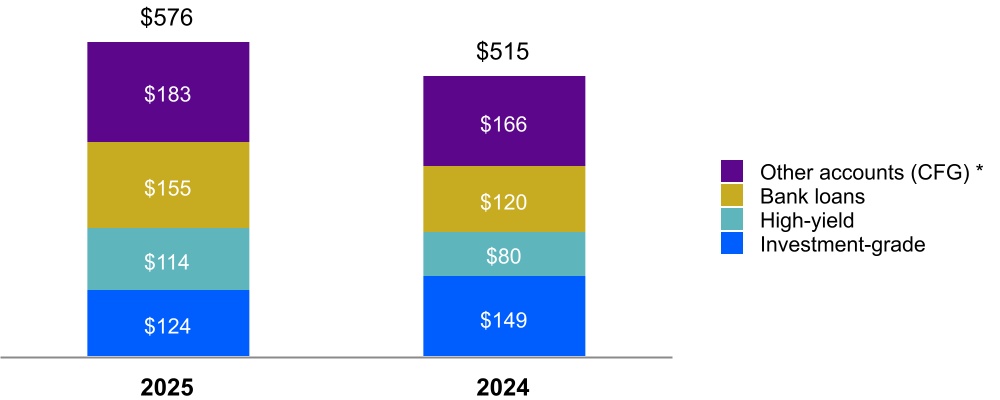
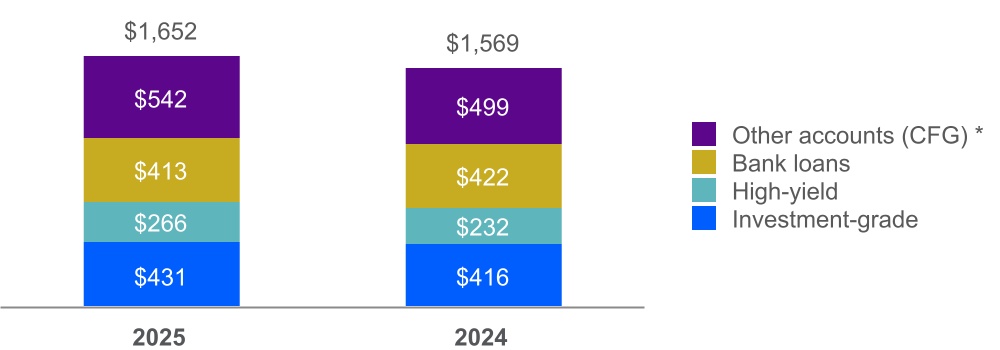
Corporate Finance (CFG)
Investment-grade
124
149
431
416
High-yield
114
80
266
232
Bank loans
155
120
413
422
Other accounts (1)
183
166
542
499
Total CFG
576
515
1,652
1,569
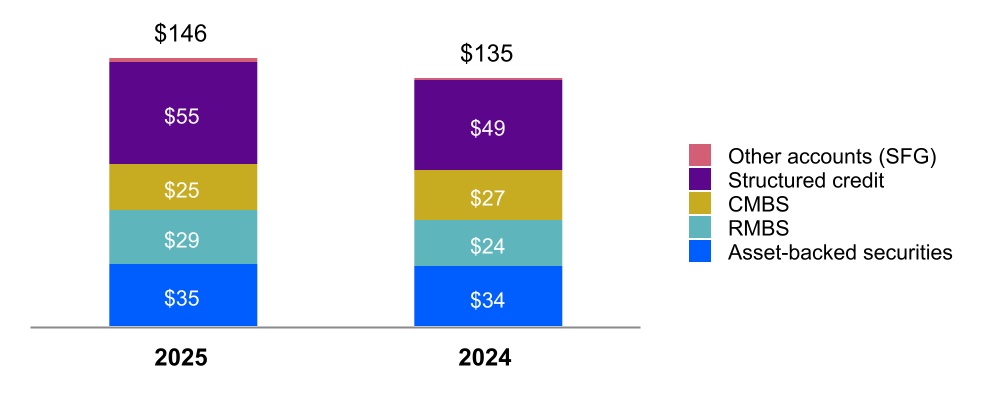
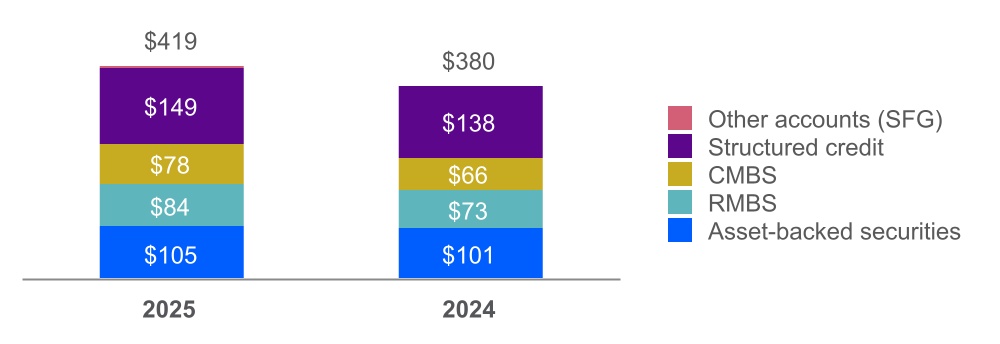
Structured Finance (SFG)
Asset-backed securities
35
34
105
101
RMBS
29
24
84
73
CMBS
25
27
78
66
Structured credit
55
49
149
138
Other accounts
2
1
3
2
Total SFG
146
135
419
380
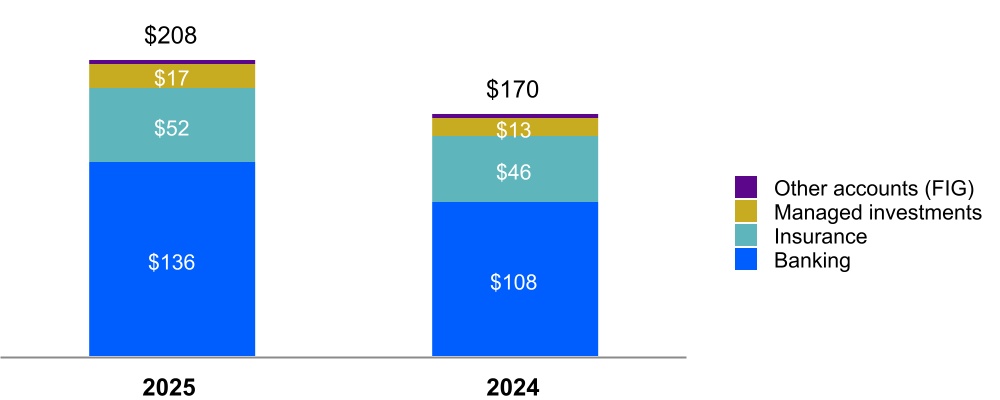
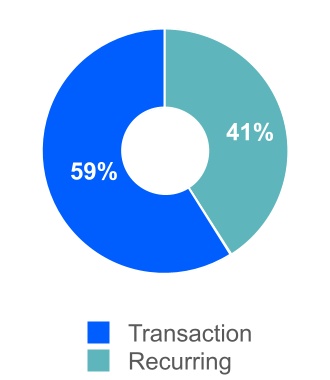
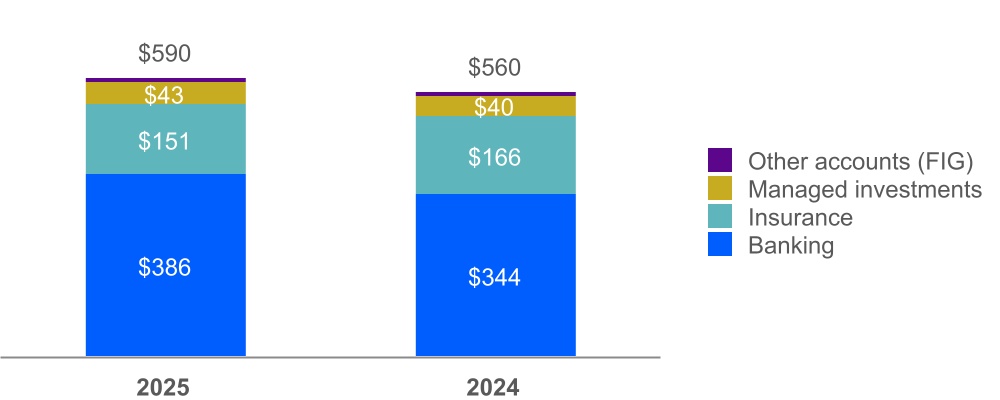
Financial Institutions (FIG)
Banking
136
108
386
344
Insurance
52
46
151
166
Managed investments
17
13
43
40
Other accounts
3
3
10
10
Total FIG
208
170
590
560
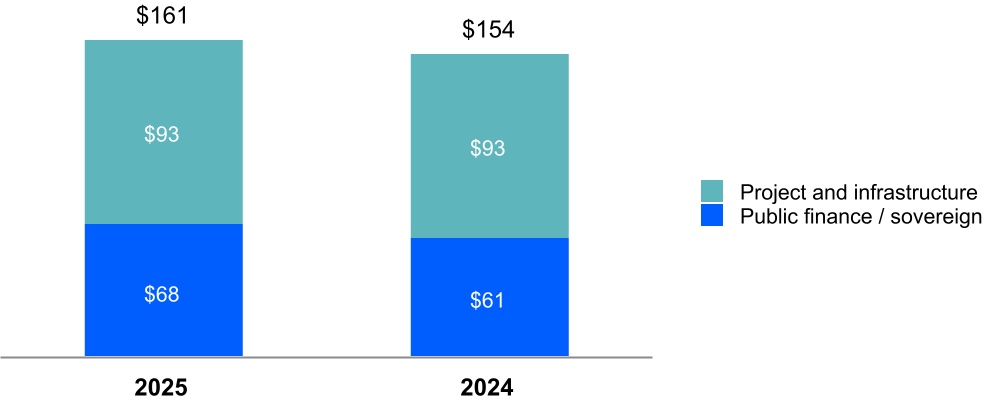
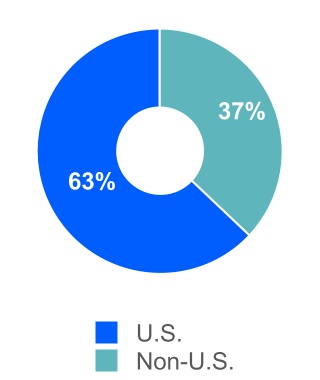
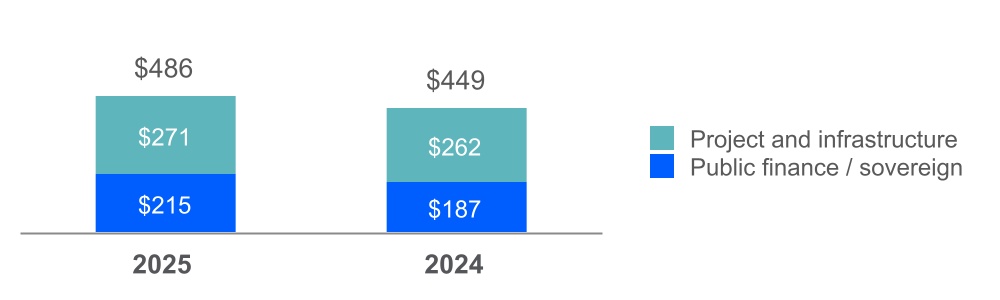
Public, Project and Infrastructure Finance (PPIF)
Public finance / sovereign
68
61
215
187
Project and infrastructure
93
93
271
262
Total PPIF
161
154
486
449
Total ratings revenue
1,091
974
3,147
2,958
MIS Other
7
8
26
26
Total external revenue
1,098
982
3,173
2,984
Intersegment revenue
50
48
149
144
Total MIS
1,148
1,030
3,322
3,128
Eliminations
(53)
(51)
(158)
(154)
Total MCO
$
2,007
$
1,813
$
5,829
$
5,416
(1) Other includes: recurring monitoring fees of a rated debt obligation and/or entities that issue such obligations as well as fees from programs such as commercial paper, medium term notes, and ICRA corporate finance revenue.
(1) Revenue from software implementation services and risk management advisory projects, while classified by management as transactional revenue, is recognized over time under GAAP.
The following tables present the timing of revenue recognition:
Unbilled receivables, deferred revenue and remaining performance obligations
Unbilled receivables
For certain MA arrangements, the timing of when the Company has the unconditional right to consideration and recognizes revenue occurs prior to invoicing the customer. In addition, certain MIS arrangements contain contractual terms whereby the customers are billed in arrears for annual monitoring services, requiring revenue to be accrued as an unbilled receivable as such services are provided.
The following table presents the Company's unbilled receivables, which are included within accounts receivable, net, at September 30, 2025 and December 31, 2024:
As of September 30, 2025
As of December 31, 2024
MA
MIS
MA
MIS
Unbilled Receivables
$
114
$
530
$
122
$
426
Deferred revenue
The Company recognizes deferred revenue when a contract requires a customer to pay consideration to the Company in advance of when revenue related to that contract is recognized. This deferred revenue is relieved when the Company satisfies the related performance obligation and revenue is recognized.
Significant changes in the deferred revenue balances during the three and nine months ended September 30, 2025 and 2024 are as follows:
Three Months Ended September 30, 2025
Three Months Ended September 30, 2024
MA
MIS
Total
MA
MIS
Total
Balance at June 30,
$
1,285
$
350
$
1,635
$
1,146
$
336
$
1,482
Changes in deferred revenue:
Revenue recognized that was included in the deferred revenue balance at the beginning of the period
(612)
(123)
(735)
(551)
(120)
(671)
Increases due to amounts billable excluding amounts recognized as revenue during the period
491
87
578
410
92
502
Reclassification to liabilities held-for-sale (1)
$
(23)
—
(23)
—
—
—
Increases due to acquisitions during the period
—
—
—
5
5
Effect of exchange rate changes
(27)
(1)
(28)
37
4
41
Total changes in deferred revenue
(171)
(37)
(208)
(99)
(24)
(123)
Balance at September 30,
$
1,114
$
313
$
1,427
$
1,047
$
312
$
1,359
(1) The 2025 reclassification to liabilities held-for-sale for the MA segment in the table above relate to the planned divestiture of the MA Learning Solutions business, more fully discussed in Note 12.
Revenue recognized that was included in the deferred revenue balance at the beginning of the period
(1,074)
(205)
(1,279)
(950)
(197)
(1,147)
Increases due to amounts billable excluding amounts recognized as revenue during the period
910
239
1,149
860
238
1,098
Reclassification to liabilities held-for-sale (1)
$
(23)
—
(23)
—
—
—
Increases due to acquisitions during the period
15
15
5
—
5
Effect of exchange rate changes
43
11
54
21
1
22
Total changes in deferred revenue
(129)
45
(84)
(64)
42
(22)
Balance at September 30,
$
1,114
$
313
$
1,427
$
1,047
$
312
$
1,359
Deferred revenue - current
$
1,113
$
256
$
1,369
$
1,047
$
253
$
1,300
Deferred revenue - non-current
$
1
$
57
$
58
$
—
$
59
$
59
(1) The 2025 reclassification to liabilities held-for-sale for the MA segment in the table above relate to the planned divestiture of the MA Learning Solutions business, more fully discussed in Note 12
For the MA segment, the decrease in deferred revenue for the three months ended September 30, 2025 and 2024 was primarily due to the recognition of annual subscription and maintenance revenue for the period, for which billing occurs in December and January. For the nine months ended September 30, 2025 and 2024, the decrease in the deferred revenue balance is attributable to recognition of revenues related to the aforementioned December billings being mostly offset by the impact of the high concentration of billings in the first quarter..
For the MIS segment, the change in the deferred revenue balance for all periods presented was primarily related to the significant portion of contract renewals that occur during the first quarter and are generally recognized over a one year period.
Remaining performance obligation
Remaining performance obligations in the MA segment include both amounts recorded as deferred revenue on the balance sheet as of September 30, 2025 as well as amounts not yet invoiced to customers as of September 30, 2025, largely reflecting future revenue related to signed multi-year arrangements for hosted and installed subscription-based products. As of September 30, 2025, the aggregate amount of the transaction price allocated to remaining performance obligations was approximately $4.1 billion. The Company expects to recognize into revenue approximately 55% of this balance within one year, approximately 25% of this balance between one to two years and the remaining amount thereafter.
Remaining performance obligations in the MIS segment largely reflect deferred revenue related to monitoring fees for certain structured finance products, primarily CMBS, where the issuers can elect to pay the monitoring fees for the life of the security in advance. As of September 30, 2025, the aggregate amount of the transaction price allocated to remaining performance obligations was approximately $87 million. The Company expects to recognize into revenue approximately 25% of this balance within one year, approximately 50% of this balance between one to five years and the remaining amount thereafter. With respect to the remaining performance obligations for the MIS segment, the Company has applied a practical expedient set forth in ASC Topic 606 permitting the omission of unsatisfied performance obligations relating to contracts with an original expected length of one year or less.
Presented below is a summary of the stock-based compensation cost and associated tax benefit included in the accompanying consolidated statements of operations:
Three Months Ended September 30,
Nine Months Ended September 30,
2025
2024
2025
2024
Stock-based compensation cost
$
58
$
57
$
176
$
166
Tax benefit
$
13
$
12
$
38
$
36
During the first nine months of 2025, the Company granted 0.1 million employee stock options, which had a weighted average grant date fair value of $163.59 per share. The Company also granted 0.4 million shares of restricted stock in the first nine months of 2025, which had a weighted average grant date fair value of $512.07 per share. Both the employee stock options and restricted stock generally vest ratably over four years. Additionally, the Company granted 0.1 million shares of performance-based awards whereby the number of shares that ultimately vest is based on the achievement of certain non-market-based performance metrics of the Company over three years. The weighted average grant date fair value of these awards was $501.88 per share.
The following weighted average assumptions were used in determining the fair value using the Black-Scholes option-pricing model for options granted in 2025:
Expected dividend yield
0.73
%
Expected stock volatility
27
%
Risk-free interest rate
4.51
%
Expected holding period
5.6 years
Unrecognized stock-based compensation expense at September 30, 2025 was $11 million and $287 million for unvested stock options and restricted stock, respectively, which is expected to be recognized over a weighted average period of 2.0 years and 2.5 years, respectively. Additionally, there was $59 million of unrecognized stock-based compensation expense relating to the aforementioned non-market-based performance-based awards, which is expected to be recognized over a weighted average period of 1.8 years.
The following table summarizes information relating to stock option exercises and restricted stock vesting:
Nine Months Ended September 30,
2025
2024
Exercise of stock options:
Proceeds from stock option exercises
$
26
$
44
Aggregate intrinsic value
$
42
$
60
Tax benefit realized upon exercise
$
9
$
10
Number of shares exercised
0.1
0.3
Vesting of restricted stock:
Fair value of shares vested
$
245
$
183
Tax benefit realized upon vesting
$
60
$
45
Number of shares vested
0.5
0.5
Vesting of performance-based restricted stock:
Fair value of shares vested
$
8
$
40
Tax benefit realized upon vesting
$
1
$
9
Number of shares vested (1)
—
0.1
(1) The number of shares vested in 2025 was approximately 15 thousand.
Moody’s ETR was 25.4% and 24.0% for the three months ended September 30, 2025 and 2024, respectively. The increase of 1.4% primarily reflects tax benefits recognized in the third quarter of 2024, which resulted from the resolutions of uncertain tax positions, coupled with an increase in current year state income taxes.
Moody’s ETR was 24.2% and 23.5% for the nine months ended September 30, 2025 and 2024, respectively. The year-to-date ETR as of September 30, 2025 was generally in line with the same period in the prior year. The Company’s provision for income taxes for the nine months ended September 30, 2025 differs from the tax computed by applying its estimated annual ETR to the pre-tax earnings primarily due to the excess tax benefits from stock-based compensation of $30 million.
The Company classifies interest related to UTPs in interest expense, net in its consolidated statements of operations. Penalties, if incurred, would be recognized in other non-operating income, net. The Company had an increase in its UTP reserves of $5 million, during the third quarter of 2025 (both on a gross basis and net of federal tax benefits) and an increase of $21 million ($19 million, net of federal tax benefits) during the first nine months of 2025.
Moody’s is subject to U.S. federal income tax as well as income tax in various state, local and foreign jurisdictions. The Company's U.S. federal income tax returns for 2021 through 2024 remain open to examination. The Company’s New York City tax returns for 2018 through 2022 are currently under examination, and 2023 is open to examination. The Company's U.K. corporate income tax returns are currently under audit for years 2017 through 2021, while years 2022 through 2023 remain open to examination.
In the fourth quarter of 2025, pursuant to a lapse of a statute of limitations, the Company expects to reverse $64 million in reserves (and $15 million in related interest) for uncertain tax positions that it had assumed as part of a prior year M&A transaction, for which the sellers had indemnified Moody's. This tax benefit and related reduction to Interest expense, net will be offset by the release of the related indemnification asset within Other non-operating income, net, with no impact to net income. For ongoing audits, it is possible the balance of UTPs could decrease in the next twelve months as a result of the settlement of such audits, which might involve the payment of additional taxes, the adjustment of certain deferred taxes and/or the recognition of tax benefits. It is also possible that new issues will be raised by tax authorities which could necessitate increases to the balance of UTPs. As the Company is unable to predict the timing or outcome of these audits, it is unable to estimate the amount of future changes to the balance of UTPs at this time. However, the Company believes that it has adequately provided for its financial exposure relating to all open tax years, by tax jurisdiction, in accordance with the applicable provisions of ASC Topic 740 regarding UTPs.
The following table shows the amount the Company paid for income taxes:
Nine Months Ended September 30,
2025
2024
Income taxes paid
$
644
$
391
On July 4, 2025, the One Big Beautiful Bill Act was enacted in the U.S. Key provisions of the OBBBA include making permanent certain aspects of the Tax Act, modifying certain international tax rules, and restoring provisions that accelerate deductions for certain business investments and expenditures. The legislation has multiple effective dates, with certain provisions effective in 2025 and others implemented in subsequent years. The OBBBA did not have material impact on the Company’s consolidated financial statements for the period ended September 30, 2025, and the Company does not expect the changes to have a material impact on the provision for income taxes or net income in future periods.
Effective in 2024, multiple foreign jurisdictions in which the Company operates enacted legislation to adopt a minimum tax rate described in the Global Anti-Base Erosion tax model rules (referred to as GloBE or Pillar II) issued by the OECD. A minimum ETR of 15% applies to multinational companies with consolidated revenue above €750 million. Under the GloBE rules, a company is required to determine a combined ETR for all entities located in a jurisdiction. If the jurisdictional effective tax rate is less than 15%, an additional tax generally will be due to bring the jurisdictional ETR up to 15%. We have evaluated the impact of the Pillar II global minimum tax rules on our consolidated financial statements and related disclosures. As of September 30, 2025, the Pillar II minimum tax requirement is not expected to have a material impact on our full-year results of operations or financial position.
NOTE 6. RECONCILIATION OF WEIGHTED AVERAGE SHARES OUTSTANDING
Below is a reconciliation of basic to diluted shares outstanding:
Three Months Ended September 30,
Nine Months Ended September 30,
2025
2024
2025
2024
Basic
178.9
181.7
179.5
182.2
Dilutive effect of shares issuable under stock-based compensation plans
0.7
0.8
0.7
0.8
Diluted
179.6
182.5
180.2
183.0
Anti-dilutive options to purchase common shares and restricted stock as well as contingently issuable restricted stock which are excluded from the table above
0.2
0.3
0.2
0.4
The calculation of basic shares outstanding is based on the weighted average number of shares of common stock outstanding during the reporting period. The calculation of diluted EPS requires certain assumptions regarding the use of both cash proceeds and assumed proceeds that would be received upon the exercise of stock options and vesting of restricted stock outstanding as of September 30, 2025 and 2024.
NOTE 7. CASH EQUIVALENTS AND INVESTMENTS
The table below provides additional information on the Company’s cash equivalents and investments:
As of September 30, 2025
Balance sheet location
Cost
Gains/(Losses)
Fair Value
Cash and cash equivalents
Short-term investments
Other assets
Certificates of deposit and money market deposit accounts/funds (1)
$
1,228
$
—
$
1,228
$
1,149
$
78
$
1
Mutual funds
$
91
$
14
$
105
$
—
$
—
$
105
As of December 31, 2024
Balance sheet location
Cost
Gains/(Losses)
Fair Value
Cash and cash equivalents
Short-term investments
Other assets
Certificates of deposit and money market deposit accounts/funds (1)
$
1,911
$
—
$
1,911
$
1,345
$
566
$
—
Mutual funds
$
88
$
10
$
98
$
—
$
—
$
98
(1) Consists of time deposits, money market deposit accounts and money market funds. The remaining contractual maturities for the certificates of deposits classified as short-term investments are one month to 12 months at both September 30, 2025 and December 31, 2024. The remaining contractual maturities for the certificates of deposits classified in other assets are 16 months to 23 monthsat September 30, 2025. Time deposits with a maturity of less than 90 days at time of purchase are classified as cash and cash equivalents.
In addition, the Company invested in COLI. As of September 30, 2025 and December 31, 2024, the contract value of the COLI was $50 million and $48 million, respectively.
NOTE 8. DERIVATIVE INSTRUMENTS AND HEDGING ACTIVITIES
The Company is exposed to global market risks, including risks from changes in FX rates and changes in interest rates. Accordingly, the Company uses derivatives in certain instances to manage financial exposures that occur in the normal course of business. The Company does not hold or issue derivatives for speculative purposes.
Derivatives and non-derivative instruments designated as accounting hedges:
Fair Value Hedges
Interest Rate Swaps
The Company has entered into interest rate swaps to convert the fixed interest rate on certain of its long-term debt to a floating interest rate based on the SOFR. The purpose of these hedges is to mitigate the risk associated with changes in the fair value of the long-term debt, thus the Company has designated these swaps as fair value hedges. The fair value of the swaps is adjusted quarterly with a corresponding adjustment to the carrying value of the debt. The changes in the fair value of the swaps and the underlying hedged item generally offset and the net cash settlements on the swaps are recorded each period within interest expense, net in the Company’s consolidated statements of operations.
The following table summarizes the Company’s interest rate swaps designated as fair value hedges:
Notional Amount
Hedged Item
Nature of Swap
As of
September 30, 2025
As of December 31, 2024
Floating Interest Rate
2014 Senior Notes due 2044
Pay Floating/Receive Fixed
$
300
$
300
SOFR
2017 Senior Notes due 2028
Pay Floating/Receive Fixed
500
500
SOFR
2018 Senior Notes due 2029
Pay Floating/Receive Fixed
400
400
SOFR
2018 Senior Notes due 2048
Pay Floating/Receive Fixed
300
300
SOFR
2020 Senior Notes due 2025
Pay Floating/Receive Fixed
—
300
SOFR
2022 Senior Notes due 2052
Pay Floating/Receive Fixed
500
500
SOFR
2022 Senior Notes due 2032
Pay Floating/Receive Fixed
250
250
SOFR
Total
$
2,250
$
2,550
Refer to Note 14 for information on the cumulative amount of fair value hedging adjustments included in the carrying amount of the above hedged items.
The following table summarizes the impact to the statements of operations of the Company’s interest rate swaps designated as fair value hedges:
Total amounts of financial statement line item presented in the statements of operations in which the effects of fair value hedges are recorded
Amount of income/(loss) recognized in the consolidated statements of operations
Three Months Ended September 30,
Nine Months Ended September 30,
2025
2024
2025
2024
Interest expense, net
$
(58)
$
(60)
$
(180)
$
(185)
Description
Location on Consolidated Statements of Operations
Net interest settlements and accruals on interest rate swaps
The Company has designated €500 million of the 2015 Senior Notes Due 2027 and €750 million of the 2019 Senior Notes due 2030 as net investment hedges to mitigate FX exposure related to a portion of the Company’s euro net investment in certain foreign subsidiaries against changes in euro/USD exchange rates. These hedges are designated as accounting hedges under the applicable sections of ASC Topic 815 and will end upon the repayment of the notes in 2027 and 2030, respectively, unless terminated early at the discretion of the Company.
Cross currency swaps designated as net investment hedges
The Company enters into cross-currency swaps to mitigate FX exposure related to a portion of the Company’s net investment in certain foreign subsidiaries against changes in exchange rates. The following tables provide information on the cross-currency swaps designated as net investment hedges under ASC Topic 815:
September 30, 2025
Pay
Receive
Nature of Swap
Notional Amount (1)
Weighted Average Interest Rate
Notional Amount
Weighted Average Interest Rate
Pay Fixed/Receive Fixed
€
1,997
2.48%
$
2,114
3.98%
Pay Floating/Receive Floating
€
1,688
Based on ESTR
$
1,750
Based on SOFR
Pay Fixed/Receive Fixed
HK$
3,907
—%
$
500
0.64%
Pay Fixed/Receive Fixed
S$
389
—%
HK$
2,350
0.62%
(1) € = euro, HK$ = Hong Kong dollar, S$ = Singapore dollar
As of September 30, 2025 these hedges will expire and the notional amounts will be settled as follows unless terminated early at the discretion of the Company:
EUR/USD
HKD/USD
SGD/HKD
Years Ending December 31,
Notional Amount (Pay) (1)
Notional Amount (Receive)
Notional Amount (Pay) (1)
Notional Amount (Receive)
Notional Amount (Pay) (1)
Notional Amount (Receive) (1)
2027
€
530
$
550
HK$
—
$
—
S$
—
HK$
—
2028
588
600
—
—
—
—
2029
573
614
—
—
—
—
2030
662
700
—
—
—
—
2031
481
500
—
—
—
—
2032
481
500
3,907
500
389
2,350
2033
370
400
—
—
—
—
Total
€
3,685
$
3,864
HK$
3,907
$
500
S$
389
HK$
2,350
(1) € = euro, HK$ = Hong Kong dollar, S$ = Singapore dollar
The following table provides information on the gains/(losses) on the Company’s net investment and cash flow hedges:
Derivative and Non-Derivative Instruments in Net Investment Hedging Relationships
Amount of Gain/(Loss) Recognized in AOCL on Derivative, net of Tax
Amount of Loss Reclassified from AOCL into Income, net of Tax
Gain Recognized in Income on Derivative (Amount Excluded from Effectiveness Testing)
Three Months Ended
September 30,
Three Months Ended
September 30,
Three Months Ended
September 30,
2025
2024
2025
2024
2025
2024
Cross currency swaps
$
6
$
(95)
$
—
$
—
$
17
$
12
Long-term debt
(1)
(41)
—
—
—
—
Total net investment hedges
$
5
$
(136)
$
—
$
—
$
17
$
12
Derivatives in Cash Flow Hedging Relationships
Cross currency swap
$
—
$
—
$
1
$
—
$
—
$
—
Interest rate contracts
$
—
$
—
$
(1)
$
(1)
$
—
$
—
Total cash flow hedges
$
—
$
—
$
—
$
(1)
$
—
$
—
Total
$
5
$
(136)
$
—
$
(1)
$
17
$
12
Derivative and Non-Derivative Instruments in Net Investment Hedging Relationships
Amount of Gain/(Loss) Recognized in AOCL on Derivative, net of Tax
Amount of Loss Reclassified from AOCL into Income, net of Tax
Gain Recognized in Income on Derivative (Amount Excluded from Effectiveness Testing)
The cumulative amount of net investment hedge and cash flow hedge gains (losses) remaining in AOCL is as follows:
Cumulative Gains (Losses), net of tax
September 30, 2025
December 31, 2024
Net investment hedges
Cross currency swaps
$
(181)
$
178
FX forwards
29
29
Long-term debt
(62)
68
Total net investment hedges
$
(214)
$
275
Cash flow hedges
Interest rate contracts
$
(41)
$
(43)
Cross currency swaps
—
1
Total cash flow hedges
(41)
(42)
Total net gain in AOCL
$
(255)
$
233
Derivatives not designated as accounting hedges:
Foreign exchange forwards
The Company also enters into foreign exchange forward contracts to mitigate the change in fair value on certain assets and liabilities denominated in currencies other than a subsidiary’s functional currency. These forward contracts are not designated as accounting hedges under the applicable sections of ASC Topic 815. Accordingly, changes in the fair value of these contracts are recognized immediately in other non-operating income, net, in the Company’s consolidated statements of operations along with the FX gain or loss recognized on the assets and liabilities denominated in a currency other than the subsidiary’s functional currency. These contracts have expiration dates at various times through December 2025.
The following table summarizes the notional amounts of the Company’s outstanding foreign exchange forwards:
September 30, 2025
December 31, 2024
Notional amount of currency pair (1):
Sell
Buy
Sell
Buy
Contracts to sell USD for GBP
$
597
£
442
$
604
£
470
Contracts to sell USD for JPY
$
24
¥
3,500
$
29
¥
4,000
Contracts to sell USD for CAD
$
38
C$
53
$
35
C$
50
Contracts to sell USD for SGD
$
74
S$
95
$
45
S$
59
Contracts to sell USD for EUR
$
105
€
89
$
—
€
—
Contracts to sell USD for INR
$
20
₹
1,729
$
23
₹
1,900
Contracts to sell EUR for USD
€
—
$
—
€
12
$
12
(1) € = euro, £ = British pound, S$ = Singapore dollar, $ = U.S. dollar, ¥ = Japanese yen, C$ = Canadian dollar, ₹= Indian Rupee
Total Return Swaps
The Company has entered into total return swaps to mitigate market-driven changes in the value of certain liabilities associated with the Company's deferred compensation plans. The fair value of these swaps at September 30, 2025 and related gains in the three and nine months ended September 30, 2025 were not material. The notional amount of the total return swaps as of September 30, 2025 and December 31, 2024 was $72 million and $66 million, respectively.
The following table summarizes the impact to the consolidated statements of operations relating to the gains (losses) on the Company’s derivatives which are not designated as hedging instruments:
The table below shows the classification between assets and liabilities on the Company’s consolidated balance sheets for the fair value of the derivative instrument as well as the carrying value of its non-derivative debt instruments designated and qualifying as net investment hedges:
Derivative and Non-Derivative Instruments
Balance Sheet Location
September 30, 2025
December 31, 2024
Assets:
Derivatives designated as accounting hedges:
Cross-currency swaps designated as net investment hedges
Other assets
$
—
$
58
Derivatives not designated as accounting hedges:
FX forwards on certain assets and liabilities
Other current assets
2
—
Total assets
$
2
$
58
Liabilities:
Derivatives designated as accounting hedges:
Interest rate swaps designated as fair value hedges
Accounts payable and accrued liabilities
$
4
$
3
Cross-currency swaps designated as net investment hedges
Other liabilities
480
26
Interest rate swaps designated as fair value hedges
NOTE 9. GOODWILL AND OTHER ACQUIRED INTANGIBLE ASSETS
The following table summarizes the activity in goodwill for the periods indicated:
Nine Months Ended September 30, 2025
MA
MIS
Consolidated
Gross goodwill
Accumulated impairment charge
Net goodwill
Gross goodwill
Accumulated impairment charge
Net goodwill
Gross goodwill
Accumulated impairment charge
Net goodwill
Balance at beginning of year
$
5,626
$
(12)
$
5,614
$
380
$
—
$
380
$
6,006
$
(12)
$
5,994
Additions/
adjustments (1)
136
—
136
8
—
8
144
—
144
Foreign currency translation adjustments
336
—
336
—
—
—
336
—
336
Reclassification to assets held-for-sale (2)
(9)
—
(9)
—
—
—
(9)
—
(9)
Ending balance
$
6,089
$
(12)
$
6,077
$
388
$
—
$
388
$
6,477
$
(12)
$
6,465
Year Ended December 31, 2024
MA
MIS
Consolidated
Gross goodwill
Accumulated
impairment
charge
Net
goodwill
Gross goodwill
Accumulated impairment
charge
Net
goodwill
Gross goodwill
Accumulated
impairment
charge
Net
goodwill
Balance at beginning of year
$
5,681
$
(12)
$
5,669
$
287
$
—
$
287
$
5,968
$
(12)
$
5,956
Additions/
adjustments (3)
112
—
112
97
—
97
209
—
209
Foreign currency translation adjustments
(167)
—
(167)
(4)
—
(4)
(171)
—
(171)
Ending balance
$
5,626
$
(12)
$
5,614
$
380
$
—
$
380
$
6,006
$
(12)
$
5,994
(1) The 2025 additions relate to the acquisition of CAPE Analytics and ICR Chile in 2025.
(2) The 2025 reclassification to assets held-for-sale for the MA segment in the table above relate to the planned divestiture of the MA Learning Solutions business, more fully discussed in Note 12.
(3) The 2024 additions/adjustments primarily relate to certain immaterial acquisitions in 2024 (most notably GCR, Numerated and Praedicat).
Acquired intangible assets and related amortization consisted of:
September 30, 2025
December 31, 2024
Customer relationships
$
2,149
$
2,035
Accumulated amortization
(686)
(631)
Net customer relationships
1,463
1,404
Software/product technology
774
695
Accumulated amortization
(507)
(419)
Net software/product technology
267
276
Database
163
166
Accumulated amortization
(99)
(89)
Net database
64
77
Trade names
200
199
Accumulated amortization
(91)
(83)
Net trade names
109
116
Other (1)
63
67
Accumulated amortization
(50)
(50)
Net other
13
17
Total acquired intangible assets, net (2)
$
1,916
$
1,890
(1) Other intangible assets primarily consist of trade secrets, covenants not to compete, and acquired ratings methodologies and models.
(2) Excludes approximately $15M of net acquired intangible assets, which were reclassified to assets held-for-sale related to the planned divestiture of the MA Learning Solutions business, more fully discussed in Note 12.
Amortization expense relating to acquired intangible assets is as follows:
Three Months Ended
September 30,
Nine Months Ended September 30,
2025
2024
2025
2024
Amortization expense
$
55
$
51
$
163
$
148
NOTE 10. RESTRUCTURING
On December 19, 2024, the CEO of Moody’s approved the Strategic and Operational Efficiency Restructuring Program. The Company estimates that upon completion, the program will result in annualized savings of $250 million to $300 million. This program relates to the Company's strategy to realign its operations toward high priority growth areas and to consolidate certain functions to simplify the organization to enable improved operating efficiency and leverage. This program will primarily include a reduction in staff, the rationalization and exit of certain leased office spaces and the retirement of certain legacy software applications. The program includes $170 million to $200 million of expected pre-tax personnel-related restructuring charges, an amount that includes severance costs, expense related to the modification of equity awards and other related costs primarily determined under the Company’s existing severance plans. In addition, the program is expected to result in $10 million to $20 million of non-cash charges from the exit from certain leased office spaces and $20 million to $30 million of non-cash charges related to incremental amortization of internally developed software due to a reduction in the useful life of the software assets. The savings generated from the Strategic and Operational Efficiency Restructuring Program are expected to strengthen the Company's operating margin, with a portion being deployed to support strategic investments. The Strategic and Operational Efficiency Restructuring Program is expected to be substantially complete by the end of 2026. Cash outlays associated with this program are expected to be $170 million to $200 million, which are expected to be paid through 2027.
Total expense included in the accompanying consolidated statements of operations relating to the aforementioned restructuring program is below:
Three months ended September 30,
Nine months ended September 30,
Cumulative expense incurred
2025
2024
2025
2024
Strategic and Operational Efficiency Restructuring Program
Employee termination and other related costs (1)
$
21
$
—
$
75
$
—
$
120
Real estate related costs (2)
—
—
4
—
4
Internally developed software-related charges (3)
—
—
2
—
2
Total Restructuring
$
21
$
—
$
81
$
—
$
126
(1) Primarily includes severance costs, expense related to the modification of equity awards and professional service fees related to execution of the restructuring program.
(2) Includes the non-cash acceleration of amortization of ROU Assets that have been abandoned or for which abandonment is planned in future periods.
(3) Includes the non-cash acceleration of amortization of internally developed software that has been abandoned.
Changes to the restructuring liability for the aforementioned restructuring program were as follows:
Balance as of December 31, 2024
$
39
Strategic and Operational Efficiency Restructuring Program:
Cost incurred and adjustments
72
Cash payments
(79)
Balance as of September 30, 2025 (1)
$
32
(1) Restructuring liability is primarily comprised of employee termination costs and other severance-related charges.
As of September 30, 2025, substantially all of the remaining $32 million restructuring liability is expected to be paid out in the next twelve months.
The tables below present information about items that are carried at fair value at September 30, 2025 and December 31, 2024:
Fair Value Measurement as of September 30, 2025
Description
Balance
Level 1
Level 2
Assets:
Derivatives (1)
$
2
$
—
$
2
Money market funds/mutual funds
115
115
—
Total
$
117
$
115
$
2
Liabilities:
Derivatives (1)
$
578
$
—
$
578
Total
$
578
$
—
$
578
Fair Value Measurement as of December 31, 2024
Description
Balance
Level 1
Level 2
Assets:
Derivatives (1)
$
58
$
—
$
58
Money market funds/mutual funds
108
108
—
Total
$
166
$
108
$
58
Liabilities:
Derivatives (1)
$
216
$
—
$
216
Total
$
216
$
—
$
216
(1) Represents fair value of certain derivative contracts as more fully described in Note 8 to the consolidated financial statements.
The following are descriptions of the methodologies utilized by the Company to estimate the fair value of its derivative contracts, money market mutual funds and mutual funds:
Derivatives:
In determining the fair value of the derivative contracts in the table above, the Company utilizes industry standard valuation models. Where applicable, these models project future cash flows and discount the future amounts to a present value using spot rates, forward points, currency volatilities, interest rates as well as the risk of non-performance of the Company and the counterparties with whom it has derivative contracts. The Company established strict counterparty credit guidelines and only enters into transactions with financial institutions that adhere to these guidelines. Accordingly, the risk of counterparty default is deemed to be minimal.
Money market funds and mutual funds:
The mutual funds in the table above are deemed to be equity securities with readily determinable fair values with changes in the fair value recognized through net income under ASC Topic 321. The fair value of these instruments is determined using Level 1 inputs as defined in the ASC Topic 820.
Derivative instruments designated as accounting hedges
570
192
Other
41
52
Total other liabilities
$
901
$
517
Assets and Liabilities Held-for-Sale
In August 2025, the Company entered into a definitive agreement to sell the MA Learning Solutions business. As of September 30, 2025, the assets and liabilities related to this business, which are not material, are classified as held-for-sale. The Company expects the transaction to close during the fourth quarter of 2025.
Investments in non-consolidated affiliates:
The following table provides additional detail regarding Moody's investments in non-consolidated affiliates, as included in other assets in the consolidated balance sheets:
September 30, 2025
December 31, 2024
Equity method investments (1)
$
119
$
127
Investments measured using the measurement alternative (2)
350
328
Other
14
10
Total investments in non-consolidated affiliates
$
483
$
465
(1) Equity securities in which the Company has significant influence over the investee but does not have a controlling financial interest in accordance with ASC Topic 323.
(2) Equity securities without readily determinable fair value for which the Company has elected to apply the measurement alternative in accordance with ASC Topic 321.
Moody's holds various investments accounted for under the equity method, the most significant of which is the Company's minority investment in CCXI. Moody's also holds various investments measured using the measurement alternative, the most significant of which is the Company's minority interest in BitSight.
Earnings from non-consolidated affiliates, which are included within other non-operating income, net, are disclosed within the table below.
Other non-operating income, net:
The following table summarizes the components of other non-operating income, net:
Three months ended September 30,
Nine Months Ended September 30,
2025
2024
2025
2024
FX gains (losses)
$
(7)
$
—
$
(10)
$
(7)
Net periodic pension income - non-service and non-interest cost components
9
9
27
25
Income from investments in non-consolidated affiliates
4
8
18
10
Gain on previously held equity method investments (1)
—
7
—
7
Gain on investments
3
4
8
12
Other
(1)
(3)
(1)
(2)
Total
$
8
$
25
$
42
$
45
(1) The amounts for the three and nine months ended September 30, 2024 reflect non-cash gains relating to the step-acquisitions of Praedicat and GCR.
Charges related to asset abandonment:
During the three and nine months ended September 30, 2025, the Company recorded severance charges pursuant to a reduction in staff due to the Company's decision in 2024 to outsource the production of certain sustainability content utilized in our product offerings. During the three and nine months ended September 30, 2024, the Company incurred severance charges and
incremental amortization expense related to the change in estimated useful lives of certain internally developed software and amortizable intangible assets that are associated with the sustainability content offerings for which production is being outsourced. Cumulative charges relating to this action as of September 30, 2025 were $47 million.
NOTE 13. COMPREHENSIVE INCOME AND ACCUMULATED OTHER COMPREHENSIVE LOSS
The amounts reclassified out of AOCL, as shown in the consolidated statements of comprehensive income, were not material for all periods presented.
The following tables show changes in AOCL by component (net of tax):
Three Months Ended September 30,
2025
2024
Gains/(Losses)
Pension and Other Retirement Benefits
Cash Flow Hedges
Foreign Currency Translation Adjustments
Net Investment Hedges
Total
Pension and Other Retirement Benefits
Cash Flow Hedges
Foreign Currency Translation Adjustments
Net Investment Hedges
Total
Balance at June 30,
$
(41)
$
(41)
$
(218)
$
(219)
$
(519)
$
(59)
$
(43)
$
(674)
$
159
$
(617)
Other comprehensive income (loss) before reclassifications
—
—
(24)
5
(19)
—
—
249
(136)
113
Amounts reclassified from AOCL
—
—
—
—
—
—
1
—
—
1
Other comprehensive income (loss)
—
—
(24)
5
(19)
—
1
249
(136)
114
Balance at September 30,
$
(41)
$
(41)
$
(242)
$
(214)
$
(538)
$
(59)
$
(42)
$
(425)
$
23
$
(503)
Nine Months Ended September 30,
2025
2024
Pension and Other Retirement Benefits
Cash Flow Hedges
Foreign Currency Translation Adjustments
Net Investment Hedges
Total
Pension and Other Retirement Benefits
Cash Flow Hedges
Foreign Currency Translation Adjustments
Net Investment Hedges
Total
Balance at December 31,
$
(39)
$
(42)
$
(832)
$
275
$
(638)
$
(56)
$
(44)
$
(520)
$
53
$
(567)
Other comprehensive income (loss) before reclassifications
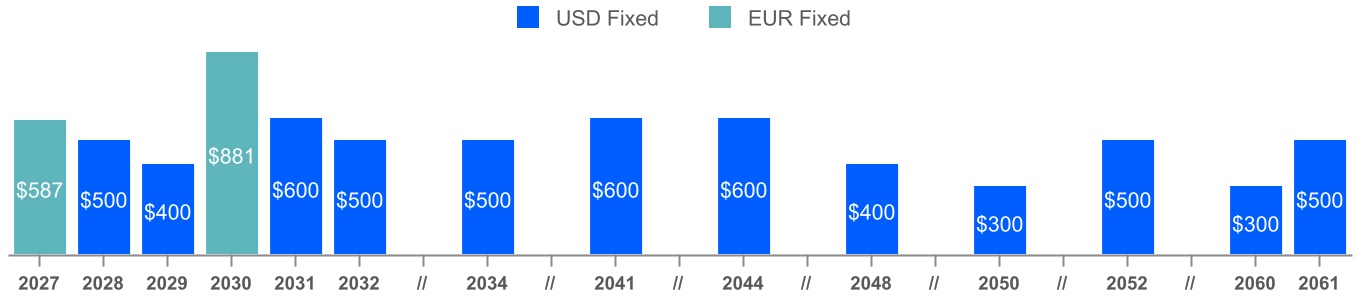
The Company’s debt is recorded at its carrying value, which represents the issuance amount plus or minus any issuance premium or discount, except for certain debt as depicted in the table below, which is recorded at the carrying value adjusted for the fair value of an interest rate swap used to hedge the fair value of the note.
The following table summarizes total indebtedness:
September 30, 2025
Notes Payable:
Principal Amount
Fair Value of Interest Rate Swaps (1)
Unamortized (Discount) Premium
Unamortized Debt Issuance Costs
Carrying Value
5.25% 2014 Senior Notes, due 2044
$
600
$
(20)
$
3
$
(4)
$
579
1.75% 2015 Senior Notes, due 2027
587
—
—
(1)
586
3.25% 2017 Senior Notes, due 2028
500
(4)
(1)
(1)
494
4.25% 2018 Senior Notes, due 2029
400
(21)
(1)
(1)
377
4.875% 2018 Senior Notes, due 2048
400
(23)
(6)
(3)
368
0.950% 2019 Senior Notes, due 2030
881
—
(1)
(3)
877
3.25% 2020 Senior Notes, due 2050
300
—
(4)
(3)
293
2.55% 2020 Senior Notes, due 2060
300
—
(2)
(3)
295
2.00% 2021 Senior Notes, due 2031
600
—
(5)
(3)
592
2.75% 2021 Senior Notes, due 2041
600
—
(12)
(4)
584
3.10% 2021 Senior Notes, due 2061
500
—
(6)
(5)
489
3.75% 2022 Senior Notes, due 2052
500
(23)
(8)
(4)
465
4.25% 2022 Senior Notes, due 2032
500
(3)
(2)
(3)
492
5.00% 2024 Senior Notes, due 2034
500
—
(4)
(4)
492
Total long-term debt
$
7,168
$
(94)
$
(49)
$
(42)
$
6,983
December 31, 2024
Notes Payable:
Principal Amount
Fair Value of Interest Rate Swaps (1)
Unamortized (Discount) Premium
Unamortized Debt Issuance Costs
Carrying Value
5.25% 2014 Senior Notes, due 2044
$
600
$
(32)
$
3
$
(4)
$
567
1.75% 2015 Senior Notes, due 2027
518
—
—
(1)
517
3.25% 2017 Senior Notes, due 2028
500
(13)
(2)
(1)
484
4.25% 2018 Senior Notes, due 2029
400
(35)
(1)
(1)
363
4.875% 2018 Senior Notes, due 2048
400
(35)
(6)
(3)
356
0.950% 2019 Senior Notes, due 2030
776
—
(1)
(3)
772
3.75% 2020 Senior Notes, due 2025
700
(3)
—
—
697
3.25% 2020 Senior Notes, due 2050
300
—
(4)
(3)
293
2.55% 2020 Senior Notes, due 2060
300
—
(2)
(3)
295
2.00% 2021 Senior Notes, due 2031
600
—
(6)
(4)
590
2.75% 2021 Senior Notes, due 2041
600
—
(12)
(5)
583
3.10% 2021 Senior Notes, due 2061
500
—
(7)
(5)
488
3.75% 2022 Senior Notes, due 2052
500
(43)
(8)
(5)
444
4.25% 2022 Senior Notes, due 2032
500
(8)
(2)
(3)
487
5.00% 2024 Senior Notes, due 2034
500
—
(4)
(4)
492
Total debt
$
7,694
$
(169)
$
(52)
$
(45)
$
7,428
Current portion
(697)
Total long-term debt
$
6,731
(1) The fair value of interest rate swaps in the tables above represents the cumulative amount of fair value hedging adjustments included in the carrying value of the hedged debt.
During the first quarter of 2025, the Company fully repaid the $700 million of 3.75% 2020 Senior Notes which had reached maturity.
At September 30, 2025, the Company was in compliance with all covenants contained within all of the debt agreements. All of the debt agreements contain cross default provisions which state that default under one of the aforementioned debt instruments could in turn permit lenders under other debt instruments to declare borrowings outstanding under those instruments to be immediately due and payable. As of September 30, 2025, there were no such cross defaults.
The repayment schedule for the Company’s borrowings is as follows:
Year Ending December 31,
Year Ending Total
2025 (After September 30,)
$
—
2026
—
2027
587
2028
500
2029
400
Thereafter
5,681
Total
$
7,168
Interest expense, net
The following table summarizes the components of interest as presented in the consolidated statements of operations and the cash paid for interest:
Three Months Ended September 30,
Nine Months Ended September 30,
2025
2024
2025
2024
Income
$
14
$
28
$
51
$
73
Expense on borrowings(1)
(59)
(79)
(193)
(227)
Expense on UTPs and other tax related liabilities
(6)
(3)
(17)
(12)
Net periodic pension costs - interest component
(7)
(6)
(21)
(19)
Interest expense, net
$
(58)
$
(60)
$
(180)
$
(185)
Interest paid(2)
$
56
$
83
$
192
$
234
(1) Expense on borrowings includes interest on long-term debt, as well as realized gains/losses related to interest rate and cross currency swaps, which are more fully discussed in Note 8.
(2) Interest paid includes net settlements on interest rate and cross currency swaps, which are more fully discussed in Note 8.
The fair value and carrying value of the Company’s debt as of September 30, 2025 and December 31, 2024 are as follows:
September 30, 2025
December 31, 2024
Carrying Value
Estimated Fair Value
Carrying Value
Estimated Fair Value
Total debt
$
6,983
$
6,283
$
7,428
$
6,601
The fair value of the Company’s debt is estimated based on quoted prices in active markets as of the reporting date, which are considered Level 1 inputs within the fair value hierarchy.
NOTE 15. LEASES
The Company has operating leases, substantially all of which relate to the lease of office space. The Company’s leases which are classified as finance leases are not material to the consolidated financial statements. Certain of the Company’s leases include options to renew, with renewal terms that can extend the lease term from one year to 20 years at the Company’s discretion.
The following table presents the components of the Company’s lease cost:
Three Months Ended September 30,
Nine Months Ended September 30,
2025
2024
2025
2024
Operating lease cost
$
22
$
23
$
66
$
66
Sublease income
(2)
(1)
(6)
(5)
Variable lease cost
5
5
15
16
Total lease cost
$
25
$
27
$
75
$
77
The following tables present other information related to the Company’s operating leases:
Three Months Ended September 30,
Nine Months Ended September 30,
2025
2024
2025
2024
Cash paid for amounts included in the measurement of operating lease liabilities
$
30
$
31
$
91
$
90
Right-of-use assets obtained in exchange for new operating lease liabilities
$
95
$
15
$
142
$
20
September 30, 2025
September 30, 2024
Weighted-average remaining lease term
6.5 years
4.0 years
Weighted-average discount rate applied to operating leases
4.6
%
3.2
%
The following table presents a maturity analysis of the future minimum lease payments included within the Company’s operating lease liabilities at September 30, 2025:
Year Ending December 31,
Operating Leases
2025 (After September 30,)
$
28
2026
100
2027
86
2028
31
2029
35
After 2029
177
Total lease payments (undiscounted)
457
Less: Interest
77
Present value of lease liabilities:
$
380
Lease liabilities - current
$
98
Lease liabilities - noncurrent
$
282
NOTE 16. CONTINGENCIES
Given the nature of the Company's activities, Moody’s and its subsidiaries are subject to legal and tax proceedings, governmental, regulatory and legislative investigations, subpoenas and other inquiries, and claims and litigation by governmental and private parties that are based on ratings assigned by MIS or that are otherwise incidental to the Company’s business. Moody’s and MIS also are subject to periodic reviews, inspections, examinations and investigations by regulators in the U.S. and other jurisdictions, any of which may result in claims, legal proceedings, assessments, fines, penalties or restrictions on business activities. Moody’s also is subject to ongoing tax audits as addressed in Note 5 to the consolidated financial statements.
Management periodically assesses the Company’s liabilities and contingencies in connection with these matters based upon the latest information available. For claims, litigation and proceedings and governmental investigations and inquiries not related to income taxes, the Company records liabilities in the consolidated financial statements when it is both probable that a liability has been incurred and the amount of loss can be reasonably estimated and periodically adjusts these as appropriate. When the reasonable estimate of the loss is within a range of amounts, the minimum amount of the range is accrued unless some higher amount within the range is a better estimate than another amount within the range. In instances when a loss is reasonably possible but uncertainties exist related to the probable outcome and/or the amount or range of loss, management does not record a liability but discloses the contingency if material. As additional information becomes available, the Company adjusts its assessments and estimates of such matters accordingly. Moody’s also discloses material pending legal proceedings pursuant to SEC rules and other pending matters as it may determine to be appropriate.
In view of the inherent difficulty of assessing the potential outcome of legal proceedings, governmental, regulatory and legislative investigations and inquiries, claims and litigation and similar matters and contingencies, particularly when the claimants seek large or indeterminate damages or assert novel legal theories or the matters involve a large number of parties, the Company often cannot predict what the eventual outcome of the pending matters will be or the timing of any resolution of such matters. The Company also may be unable to predict the impact (if any) that any such matters may have on how its business is conducted, on its competitive position or on its financial position, results of operations or cash flows. As the process to resolve any pending matters progresses, management will continue to review the latest information available and assess its ability to predict the outcome of such matters and the effects, if any, on its operations and financial condition and to accrue for and disclose such matters as and when required. However, because such matters are inherently unpredictable and unfavorable developments or resolutions can occur, the ultimate outcome of such matters, including the amount of any loss, may differ from those estimates.
NOTE 17. SEGMENT INFORMATION
The Company is organized into two operating segments: MA and MIS and accordingly, the Company reports in two reportable segments: MA and MIS.
Revenue for MA and expenses for MIS include an intersegment fee charged to MIS from MA for certain MA products and services utilized in MIS’s ratings process. Additionally, revenue for MIS and expenses for MA include intersegment fees charged to MA for the rights to use and distribute content, data and products developed by MIS. These intersegment fees are generally based on the market value of the products and services being transferred between the segments.
Overhead expenses include costs such as rent and occupancy, information technology and support staff such as finance, human resources and legal. Such costs and corporate expenses that exclusively benefit one segment are fully charged to that segment.
For overhead costs and corporate expenses that benefit both segments, costs are generally allocated to each segment based on historical/budgeted revenue amounts.
“Eliminations” in the following table represent intersegment revenue/expense. Moody’s does not report the Company’s assets by reportable segment, as this metric is not used by the CODM to allocate resources to the segments. Consequently, it is not practical to show assets by reportable segment.
Financial Information by Segment
The table below shows revenue, significant expenses regularly provided to the CODM and Adjusted Operating Income by reportable segment. The CODM, identified as the Company's CEO, utilizes the Adjusted Operating Income measure to assess the profitability of the Company and each of its reportable segments each quarter. Adjusted Operating Income is used in our budgeting and forecasting process, enabling the allocation of capital resources across the Company's strategic initiatives.
The costs expected to be incurred related to the Strategic and Operational Efficiency Restructuring Program are $125 million to $155 million for the MA segment and $75 million to $95 million for the MIS segment, which include allocations of charges associated with corporate functions. This restructuring program is more fully discussed in Note 10.
Consolidated Revenue Information by Geographic Area
Item 2. Management's Discussion and Analysis of Financial Condition and Results of Operations
This discussion and analysis of financial condition and results of operations should be read in conjunction with the Moody’s Corporation consolidated financial statements and notes thereto included elsewhere in this quarterly report on Form 10–Q.
This Management’s Discussion and Analysis of Financial Condition and Results of Operations contains Forward-Looking Statements. See “Forward-Looking Statements” commencing on page 86 for a discussion of uncertainties, risks and other factors associated with these statements.
THE COMPANY
In a world shaped by increasingly interconnected risks, Moody's data, insights, and innovative technologies help customers develop a holistic view of their world and unlock opportunities. With a rich history of experience in global markets and a diverse workforce of approximately 16,000 across more than 40 countries, Moody's gives customers the comprehensive perspective needed to act with confidence and thrive. Moody’s has two reportable segments: MA and MIS.
Moody's Analytics
Moody's Investors Service
MA provides data, intelligence and analytical tools to help business and financial leaders make confident decisions.
For more than 115 years, MIS has been a leading provider of credit ratings, research, and risk analysis helping businesses, governments, and other entities around the globe.
MA is comprised of: i) a premier fixed income and economic research business (Research & Insights); ii) a data business powered by the world’s largest database on companies and credit (Data & Information); and iii) three cloud-based subscription businesses serving banking, insurance and KYC workflows (Decision Solutions).
MIS publishes credit ratings and provides assessment services on a wide range of debt obligations, programs and facilities, and the entities that issue such obligations in markets worldwide, including various corporate, financial institution and governmental obligations, and structured finance securities.
Critical Accounting Estimates
Moody’s discussion and analysis of its financial condition and results of operations are based on the Company’s consolidated financial statements, which have been prepared in accordance with GAAP. The preparation of these financial statements requires Moody’s to make estimates and judgments that affect reported amounts of assets and liabilities and related disclosures of contingent assets and liabilities at the dates of the financial statements and revenue and expenses during the reporting periods. These estimates are based on historical experience and on other assumptions that are believed to be reasonable under the circumstances. On an ongoing basis, Moody’s evaluates its estimates, including those related to revenue recognition, contingencies, goodwill and acquired intangible assets, pension and other retirement benefits, investments in non-consolidated affiliates, and income taxes. Actual results may differ from these estimates under different assumptions or conditions. Item 7, MD&A, in the Company’s annual report on Form 10-K for the year ended December 31, 2024, includes descriptions of some of the judgments that Moody’s makes in applying its accounting estimates in these areas. Since the date of the annual report on Form 10-K, there have been no material changes to the Company’s critical accounting estimates disclosures other than the update below relating to the Company's assessment of goodwill for impairment.
Goodwill
At July 31st of each year, Moody’s evaluates its goodwill for impairment at the reporting unit level, defined as an operating segment (i.e., MA and MIS), or one level below an operating segment (i.e., a component of an operating segment).
Prior to 2025, MA's reporting unit structure consisted of two reporting units comprised of businesses that offer: i) data and data-driven analytical solutions; and ii) risk-management software, workflow and CRE solutions. During the first quarter of 2025, MA reorganized its management and reporting structure, which affected the composition of the reporting units within the MA reportable segment. As a result, MA's reporting unit structure now consists of one reporting unit, which is consistent with the segment's current management structure and operating model. This reorganization did not result in a change to the Company's reportable segments. The Company performed assessments of the reporting units impacted by the reorganization immediately before and after the reorganization became effective and determined that it was not more likely than not that the fair value of any reporting unit was less than its carrying amount.
Subsequent to the aforementioned reorganization of the MA reporting unit structure, the Company now has three reporting units: two within the Company’s ratings business (one for the ICRA business and one that encompasses all of Moody’s other ratings operations) and one reporting unit within MA.
At July 31, 2025, the Company performed qualitative assessments for each of the three reporting units. These qualitative assessments resulted in the Company determining that it was not more likely than not that the fair value of any reporting unit was less than its carrying amount.
Reportable Segments
The Company is organized into two reportable segments as of September 30, 2025: MA and MIS, which are more fully described in the section entitled “The Company” above and in Note 17 to the consolidated financial statements.
RESULTS OF OPERATIONS
The following footnotes are applicable throughout the discussion of the Company's results of operations:
(1) Refer to the section entitled "Non-GAAP Financial Measures" of this MD&A for the definition and methodology that the Company utilizes to calculate this metric.
(2) Refer to the section entitled "Key Performance Metrics" of this MD&A for the definition and methodology that the Company utilizes to calculate this metric.
Three months ended September 30, 2025 compared with three months ended September 30, 2024
Executive Summary
The following table provides an executive summary of key operating results for the quarter ended September 30, 2025. Following this executive summary is a more detailed discussion of the Company’s operating results as well as a discussion of the operating results of the Company’s reportable segments.
Insight and Key Drivers of Change Compared to Prior Year
Moody's total revenue
$
2,007
$
1,813
11
%
— reflects revenue growth in both segments
MA external revenue
$
909
$
831
9
%
— sustained demand for insurance and KYC offerings;
— ongoing strong demand for ratings data feeds and company data applications; and
— continued demand for credit research product offerings
— Organic constant currency revenue(1) growth was 6% and ARR(2) increased 8%
MIS external revenue
$
1,098
$
982
12
%
— strong investor demand and tight credit spreads supported revenue growth in all ratings LOBs, led by:
— an increase in leveraged finance issuance (which includes bank loans and speculative-grade bonds); and
— strong issuance activity from infrequent issuers in the FIG banking sector
Total operating and SG&A expenses
$
945
$
946
—
%
— a decrease in incentive compensation, which aligns with actual/projected financial and operational performance; offset by
— higher salaries reflecting an increase in headcount as well as annual salary increases in both segments;
— costs to support operating growth; and
— an increase in charitable contributions
Depreciation and amortization
$
123
$
108
(14
%)
— higher amortization of internally developed software, primarily related to the development of MA SaaS solutions; and
— amortization of recently acquired intangible assets
Restructuring
$
21
$
6
(250
%)
— relates to the Company's restructuring programs. The Strategic and Operational Efficiency Restructuring Program is more fully discussed in Note 10 to the consolidated financial statements
Charges related to asset abandonment
$
1
$
15
93
%
— costs related to the Company's decision to outsource the production of certain sustainability content utilized in our product offerings, more fully discussed in Note 12 to the consolidated financial statements
Total non-operating (expense) income, net
$
(50)
$
(35)
(43
%)
— an increase in FX losses; and
— gains recorded on previously held equity investments in the prior year, more fully discussed in Note 12 to the consolidated financial statements
Operating margin
45.7
%
40.7
%
500
BPS
— Operating margin and Adjusted Operating Margin(1) expansion reflects revenue growth coupled with disciplined cost management
Adjusted Operating Margin(1)
52.9
%
47.8
%
510
BPS
ETR
25.4
%
24.0
%
140
BPS
— reflects tax benefits recognized in the third quarter of 2024, which resulted from the resolutions of uncertain tax positions, coupled with an increase in current year state income taxes
Diluted EPS
$
3.60
$
2.93
23
%
— increase reflects the aforementioned revenue growth and margin expansion
The 11% increase in global revenue reflects growth in MA of 9% and MIS of 12%. On an organic constant currency basis, revenue(1) grew 9%. Refer to the section entitled “Segment Results” of this MD&A for a more comprehensive discussion of the Company’s segment revenue.
Third Quarter Operating Expense ⇓ $20 million
Compensation expenses of $364 million decreased $30 million, reflecting:
Non-compensation expenses of $128 million increased $10 million, reflecting:
— a decrease in incentive compensation, which aligns with actual/projected financial and operational performance; partially offset by
— increase in costs to support operating growth, including investments to support technology and innovation
— growth in salaries and benefits attributable to recent acquisitions as well as hiring and salary increases
Compensation expenses of $271 million decreased $3 million, reflecting:
Non-compensation expenses of $182 million increased $22 million, reflecting:
— a decrease in incentive compensation, which aligns with actual/projected financial and operational performance; partially offset by
— an increase in charitable contributions; and
— an increase in costs to support operating growth, including investments to support technology and innovation
— growth in salaries and benefits attributable to hiring and salary increases as well as recent acquisitions
Depreciation and amortization
The increase is primarily driven by amortization of internally developed software, which relates to the development of MA SaaS solutions, as well as amortization of recently acquired intangible assets.
Restructuring
The amounts reflect charges and adjustments related to the Company's restructuring programs. The Strategic and Operational Efficiency Restructuring Program is more fully discussed in Note 10 to the consolidated financial statements.
Operating margin 45.7%, ⇑ 500 BPS
Adjusted Operating Margin(1) 52.9%, ⇑ 510 BPS
Operating margin and Adjusted Operating Margin(1) expansion reflects revenue growth coupled with disciplined cost management.
Interest Expense, net ⇓ $2 million
Other non-operating income ⇓ $17 million
Interest expense was generally in line with prior year with the following offsetting factors:
Decrease in income is primarily due to:
— lower interest expense on borrowings of $20 million attributable to favorable impacts from fixed-to-floating interest rate swaps reflecting a lower interest rate environment compared to the prior year, coupled with a decrease in debt outstanding; partially offset by
— an increase in FX losses of $7 million; and
— gains of $7 million recorded on previously held equity investments in the prior year, more fully discussed in Note 12 to the consolidated financial statements
— a decrease in interest income of $14 million reflecting lower cash and short-term investment balances coupled with lower interest rates
ETR ⇑ 140 BPS
The ETR was higher than the prior year reflecting tax benefits recognized in the third quarter of 2024, which resulted from the resolutions of uncertain tax positions, coupled with an increase in current year state income taxes.
Global DS revenue for the three months ended September 30, 2025 and 2024 was comprised as follows:
Global DS revenue grew 11% compared to the third quarter of 2024 and reflects increases in the U.S. (16%) and internationally (8%). Organic constant currency revenue(1) and organic constant currency recurring revenue(1) growth for DS was 6% and 9%, respectively.
The most notable drivers of the growth are as follows:
–Insurance revenue grew 16%
–recurring revenue growth of 18% in Insurance was attributable to:
–continued demand for subscription-based catastrophe models; and
–revenue from Praedicat and CAPE Analytics, which the Company acquired in the third quarter of 2024 and first quarter of 2025, respectively
–Organic constant currency revenue(1) growth and organic constant currency recurring revenue(1) growth for Insurance was 8% and 11%, respectively
–ARR(2) grew 8% reflecting the continued demand for subscription-based catastrophe and actuarial models
–KYC revenue grew 19%
–recurring revenue growth of 22% reflects strong demand and customer retention for the suite of KYC solutions
–Organic constant currency revenue(1) growth and organic constant currency recurring revenue(1) growth in KYC was 16% and 18%, respectively
–ARR(2) grew 16%, reflecting the aforementioned strong demand for KYC solutions
–recurring revenue growth of 3% within Banking reflected:
–expansion of existing customer relationships to cloud hosted subscription-based banking offerings, which enable customers' lending, risk management and finance workflows; and
–revenue from Numerated, which the Company acquired in the fourth quarter of 2024;
partially offset by:
–a decline in revenue from installed software subscriptions
–Transaction revenue declined 11%
–The aforementioned declines in installed software subscriptions and transaction revenue reflect MA's continued strategic shift to cloud hosted subscription-based solutions
–Organic constant currency revenue(1) declined by 3% and organic constant currency recurring revenue(1) was in line with the prior year
–ARR(2) grew 7% reflecting the aforementioned expansion of existing customer relationships to subscription-based banking offerings
The aforementioned factors contributed to overall ARR(2) growth for DS of 10%.
Global R&I revenue increased 7% compared to the third quarter of 2024 and reflects growth in both the U.S. (7%) and internationally (7%).
The revenue increase was mainly driven by sales growth and improved retention rates from the credit research product offering, which contributed to R&I ARR(2) growth of 8%.
Global D&I revenue increased 9% compared to the third quarter of 2024 and reflects growth in both the U.S. (11%) and internationally (9%). Organic constant currency revenue(1) growth for D&I was 7%.
The revenue increase was mainly driven by continued demand for ratings data feeds and company data applications which contributed to ARR(2) growth of 7%.
MA: Third Quarter Operating and SG&A Expense ⇑ $16 million
Compensation expenses of $352 million were in line with the prior year reflecting:
Non-compensation expenses of $197 million increased $14 million:
— growth in salaries and benefits driven largely by recent acquisitions; offset by
— the increase is mainly attributable to costs to support operating growth, including investments to support technology and innovation
— benefits from operational efficiency and cost savings from the Strategic and Operational Efficiency Restructuring Program
MA: Adjusted Operating Margin 34.3% ⇑ 400 BPS
Adjusted Operating Margin expansion primarily reflects the aforementioned 9% increase in global MA revenue, partially offset by modest growth of 3% in operating and SG&A expenses, supported by operational efficiency and cost savings from the Strategic and Operational Efficiency Restructuring Program and ongoing disciplined cost management.
The increase in depreciation and amortization expense reflects higher amortization of internally developed software relating to the development of SaaS-based solutions as well as the amortization of recently acquired intangible assets.
Restructuring
The amounts reflect charges and adjustments related to the Company's restructuring programs. The Strategic and Operational Efficiency Restructuring Program is more fully discussed in Note 10 to the consolidated financial statements.
Moody’s Investors Service
The table below provides a summary of revenue and operating results, followed by further insight and commentary:
Three Months Ended
September 30,
% Change Favorable
(Unfavorable)
2025
2024
Revenue:
Corporate finance (CFG)
$
576
$
515
12
%
Structured finance (SFG)
146
135
8
%
Financial institutions (FIG)
208
170
22
%
Public, project and infrastructure finance (PPIF)
161
154
5
%
Total ratings revenue
1,091
974
12
%
MIS Other
7
8
(13
%)
Total external revenue
1,098
982
12
%
Intersegment revenue
50
48
4
%
Total MIS revenue
1,148
1,030
11
%
Expenses:
Operating and SG&A (external)
396
413
4
%
Operating and SG&A (intersegment)
3
3
—
%
Total operating and SG&A
399
416
4
%
Adjusted Operating Income
$
749
$
614
22
%
Adjusted Operating Margin
65.2
%
59.6
%
Depreciation and amortization
22
20
(10
%)
Restructuring
6
2
(200
%)
The following chart presents changes in rated issuance volumes compared to the third quarter of 2024. To the extent that changes in rated issuance volumes had a material impact to MIS's revenue compared to the prior year, those impacts are discussed below.
Global CFG revenue for the three months ended September 30, 2025 and 2024 was comprised as follows:
* Other includes: recurring monitoring fees of a rated debt obligation and/or entities that issue such obligations as well as fees from programs such as commercial paper, medium term notes, and ICRA corporate finance revenue.
The increase in CFG revenue of 12% reflects growth in the U.S. (11%) and internationally (13%).
Transaction revenue increased $51 million compared to the same period in the prior year, which primarily reflected:
–higher leveraged finance (which includes bank loans and speculative-grade bonds) issuance activity reflecting:
–strong investor demand as yields remained high;
–continued tight credit spreads; and
–speculative-grade issuers opportunistically refinancing upcoming debt maturities in response to favorable market conditions
partially offset by:
–lower investment grade revenue compared to a strong prior year comparative.
Recurring revenue increased $10 million, primarily reflecting the impact of annual price increases and higher monitored credits.
Global SFG revenue for the three months ended September 30, 2025 and 2024 was comprised as follows:
The increase in SFG revenue of 8% reflects growth in the U.S. (10%) and internationally (3%).
Transaction revenue increased $8 million compared to the third quarter of 2024, mainly attributable to tight spreads and strong investor demand, which supported:
–strong CLO deal formation supported by higher bank loan issuance; and
The increase in FIG revenue of 22% reflects growth in the U.S. (23%) and internationally (21%).
Transaction revenue increased $31 million compared to the third quarter of 2024, mainly due to growth in the banking sector, which was attributable to a favorable issuance mix from infrequent issuer activity.
Global PPIF revenue for the three months ended September 30, 2025 and 2024 was comprised as follows:
The increase in PPIF revenue of 5% reflects growth in the U.S. (8%), partially offset by declines internationally (2%).
Transaction revenue increased $2 million compared to the third quarter of 2024, driven by a favorable issuance mix in U.S. Public Finance, particularly in the regional and municipal sectors.
Recurring revenue increased $5 million, driven by the impact of annual price increases and higher monitored credits.
MIS: Third Quarter Operating and SG&A Expense ⇓ $17 million
Compensation expenses of $283 million decreased $35 million reflecting:
Non-compensation expenses of $113 million increased $18 million reflecting:
— a decrease in incentive compensation aligned with actual/projected financial and operating performance; partially offset by:
— an increase in charitable contributions; and
— an increase in costs to support operating growth
— growth in salaries and benefits reflecting higher headcount and annual salary increases.
MIS: Adjusted Operating Margin 65.2% ⇑ 560 BPS
MIS Adjusted Operating Margin expansion primarily reflects the aforementioned 12% increase in revenue, partially offset by growth of 4% in operating and SG&A expenses.
Restructuring
The amounts reflect charges and adjustments related to the Company's restructuring programs. The Strategic and Operational Efficiency Restructuring Program is more fully discussed in Note 10 to the consolidated financial statements.
Nine months ended September 30, 2025 compared with nine months ended September 30, 2024
Executive Summary
The following table provides an executive summary of key operating results for the nine months ended September 30, 2025. Following this executive summary is a more detailed discussion of the Company’s operating results as well as a discussion of the operating results of the Company’s reportable segments.
Nine Months Ended September 30,
Financial measure:
2025
2024
% Change Favorable (Unfavorable)
Insight and Key Drivers of Change Compared to Prior Year
Moody's total revenue
$
5,829
$
5,416
8
%
— reflects revenue growth in both segments
MA external revenue
$
2,656
$
2,432
9
%
— sustained demand for insurance and KYC offerings;
— continued demand for credit research product offerings; and
— ongoing demand for ratings data feeds
— Organic constant currency revenue(1) growth was 7%, and ARR(2) grew 8%
MIS external revenue
$
3,173
$
2,984
6
%
— strong investor demand and tight credit spreads supported revenue growth in all ratings LOBs
Total operating and SG&A expenses
$
2,807
$
2,741
(2
%)
— higher salaries and benefits reflecting an increase in headcount and annual salary increases; partially offset by
— a decrease in incentive compensation which aligns with actual/projected financial and operational performance
Depreciation and amortization
$
356
$
318
(12
%)
— higher amortization of internally developed software, primarily related to the development of MA SaaS solutions; and
— amortization of recently acquired intangible assets
Restructuring
$
81
$
13
NM
— relates to the Company's restructuring programs. The Strategic and Operational Efficiency Restructuring Program is more fully discussed in Note 10 to the consolidated financial statements
Charges related to asset abandonment
$
4
$
30
87
%
— costs related to the Company's decision to outsource the production of certain sustainability content utilized in our product offerings, which is more fully discussed in Note 12 to the consolidated financial statements
Total non-operating (expense) income, net
$
(138)
$
(140)
1
%
— in line with prior year
Operating margin
44.3
%
42.7
%
160 BPS
— Operating margin and Adjusted Operating Margin(1) expansion reflects revenue growth coupled with disciplined cost management
Adjusted Operating Margin(1)
51.8
%
49.4
%
240 BPS
ETR
24.2
%
23.5
%
(70 BPS)
— generally in line with the prior year
Diluted EPS
$
10.26
$
9.09
13
%
— increase reflects the aforementioned revenue growth and margin expansion
Growth in global revenue reflected increases in both MA and MIS, both in the U.S. and internationally. Refer to the section entitled “Segment Results” of this MD&A for a more comprehensive discussion of the Company’s segment revenue.
YTD Operating Expense ⇑ $24 million
Compensation expenses of $1,094 million increased $8 million, reflecting:
Non-compensation expenses of $378 million increased $16 million, reflecting:
— growth in salaries and benefits attributable to hiring and salary increases to support continued growth in the business as well as recent acquisitions; partially offset by
— costs associated with recent acquisitions; and
— increase in costs to support operating growth, including investments to support technology and innovation
— a decrease in incentive compensation, which aligns with actual/projected financial and operational performance
YTD SG&A Expense ⇑ $42 million
Compensation expenses of $818 million increased $14 million, reflecting:
Non-compensation expenses of $517 million increased $28 million, reflecting:
— growth in salaries and benefits attributable to recent acquisitions as well as hiring and annual salary increases; partially offset by
— costs associated with recent acquisitions; and
— an increase in charitable contributions
— a decrease in incentive compensation, which aligns with actual/projected financial and operational performance
The increase in depreciation and amortization expense is driven by the amortization of internally developed software, which is primarily related to the development of MA SaaS solutions as well as the amortization of recently acquired intangible assets.
Restructuring
The amounts reflect charges and adjustments related to the Company's restructuring programs. The Strategic and Operational Efficiency Restructuring Program is more fully discussed in Note 10 to the consolidated financial statements.
Charges related to asset abandonment
Reflects costs related to the Company's decision to outsource the production of certain sustainability content utilized in our product offerings, which is more fully discussed in Note 12 to the consolidated financial statements.
Operating margin 44.3%, ⇑ 160 BPS
Adjusted Operating Margin(1) 51.8%, ⇑ 240 BPS
Operating margin and Adjusted Operating Margin(1) expansion reflects the 8% increase in revenue, partially offset by growth of 5% in operating and SG&A expenses.
Interest Expense, net ⇓ $5 million
Other non-operating income ⇓ $3 million
The decrease in interest expense is primarily due to:
Other non-operating income was generally in line compared to the prior year
— lower interest expense on borrowings of $34 million is attributable to favorable impacts from fixed-to-floating interest rate swaps reflecting a lower interest rate environment compared to the prior year, coupled with a decrease in debt outstanding; partially offset by
— lower interest income of $22 million reflecting lower cash and short-term investment balances and lower interest rates
ETR ⇑ 70 BPS
The ETR was generally in line with the prior year.
Diluted EPS ⇑ $1.17
Adjusted Diluted EPS(1) ⇑ $1.45
Both diluted EPS and Adjusted Diluted EPS(1) growth is mostly attributable to the aforementioned growth in revenue and operating income/adjusted operating income(2).
Global DS revenue for the nine months ended September 30, 2025 and 2024 was comprised as follows:
Global DS revenue grew 11% compared to the first nine months of 2024 and reflects increases in both the U.S. (18%) and internationally (7%). Organic constant currency revenue(1) and organic constant currency recurring revenue(1) growth for DS was 7% and 10%, respectively. ARR(2) growth was 10%.
The most notable drivers of the growth are as follows:
–Insurance revenue grew 14%
–recurring revenue growth of 16% in Insurance was attributable to:
–continued demand resulting in new sales for subscription-based revenue for catastrophe modeling tools; and
–revenue from Praedicat and CAPE Analytics, which the Company acquired in the third quarter of 2024 and first quarter of 2025, respectively
–Organic constant currency revenue(1) and organic constant currency recurring revenue(1) growth for Insurance was 7% and 9%, respectively
–ARR(2) grew 8%, reflecting the aforementioned continued demand for subscription-based catastrophe modeling tools
–KYC revenue grew 19%
–recurring revenue growth of 21% in KYC reflects strong demand and customer retention for KYC and compliance solutions reflecting increased customer and supplier risk data usage
–Organic constant currency revenue(1) and organic constant currency recurring revenue(1) growth for KYC was 17% and 19%, respectively
–ARR(2) grew 16%, reflecting the aforementioned strong demand for KYC solutions, however trailed organic constant currency recurring revenue(1) growth mainly due to certain isolated customer attrition events in 2025
–recurring revenue growth of 7% within Banking reflected:
–expansion of existing customer relationships to cloud hosted subscription-based banking offerings, which enable customers' lending, risk management and finance workflows; and
–revenue from Numerated, which the Company acquired in the fourth quarter of 2024;
partially offset by:
–a decline in transaction revenue of 11%, reflecting MA's continued strategic shift to cloud hosted subscription-based solutions
–Organic constant currency revenue(1) and organic constant currency recurring revenue(1) growth for Banking was 1% and 5%, respectively
Global D&I revenue increased 7% compared to the first nine months of 2024 and reflects growth in both the U.S. (7%) and internationally (7%). Organic constant currency revenue(1) growth for D&I was 5%.
This growth was mainly driven by continued strong demand for ratings data feeds and company data applications, which contributed to ARR(2) growth of 7% for D&I.
MA: YTD Operating and SG&A Expense ⇑ $81 million
Compensation expenses of $1,069 million increased $46 million reflecting:
Non-compensation expenses of $589 million increased $35 million reflecting:
— growth in salaries and benefits driven largely by recent acquisitions
— costs associated with recent acquisitions; and
— an increase in costs to support operating growth, including investments to support technology and innovation
Adjusted Operating Margin expansion primarily reflects the aforementioned 9% increase in global MA revenue, partially offset by growth of 5% in operating and SG&A expenses, supported by operational efficiency/disciplined cost management and cost savings from the Strategic and Operational Efficiency Restructuring Program.
Depreciation and amortization
The increase in depreciation and amortization expense primarily reflects higher amortization of internally developed software relating to the development of SaaS-based solutions as well as the amortization of recently acquired intangible assets.
Restructuring
The amounts reflect charges and adjustments related to the Company's restructuring programs. The Strategic and Operational Efficiency Restructuring Program is more fully discussed in Note 10 to the consolidated financial statements.
Charges related to asset abandonment
Reflects costs related to the Company's decision to outsource the production of certain sustainability content utilized in our product offerings, which is more fully discussed in Note 12 to the consolidated financial statements.
The table below provides a summary of revenue and operating results, followed by further insight and commentary:
Nine Months Ended September 30,
% Change Favorable (Unfavorable)
2025
2024
Revenue:
Corporate finance (CFG)
$
1,652
$
1,569
5
%
Structured finance (SFG)
419
380
10
%
Financial institutions (FIG)
590
560
5
%
Public, project and infrastructure finance (PPIF)
486
449
8
%
Total ratings revenue
3,147
2,958
6
%
MIS Other
26
26
—
%
Total external revenue
3,173
2,984
6
%
Intersegment royalty
149
144
3
%
Total
3,322
3,128
6
%
Expenses:
Operating and SG&A (external)
1,149
1,164
1
%
Operating and SG&A (intersegment)
9
10
10
%
Total operating and SG&A expense
1,158
1,174
1
%
Adjusted Operating Income
$
2,164
$
1,954
11
%
Adjusted Operating Margin
65.1
%
62.5
%
Depreciation and amortization
64
58
(10
%)
Restructuring
22
6
(267
%)
The following chart presents changes in rated issuance volumes compared to the first nine months of2024. To the extent that changes in rated issuance volumes had a material impact on MIS's revenue compared to the prior year, those impacts are discussed below.
Global CFG revenue for the nine months ended September 30, 2025 and 2024 was comprised as follows:
* Other includes: recurring monitoring fees of a rated debt obligation and/or entities that issue such obligations as well as fees from programs such as commercial paper, medium term notes, and ICRA corporate finance revenue.
The increase in CFG revenue of 5% reflects growth in both the U.S. (3%) and internationally (10%).
Transaction revenue increased $56 million compared to the prior year, which primarily reflected:
–higher issuance activity for speculative-grade bonds driven by elevated third-quarter activity as issuers took advantage of favorable conditions, including tight spreads and lower interest rates, to refinance debt; and
–higher issuance activity for investment-grade bonds, which reflected continued tight credit spreads and investor demand for higher quality credits.
Recurring revenue increased $27 million, primarily reflecting the impact of annual price increases and higher monitored credits.
Global PPIF revenue for the nine months ended September 30, 2025 and 2024 was comprised as follows:
The 8% increase in PPIF revenue reflects increases in both the U.S. (12%) and internationally (1%), with the most notable driver of the growth reflecting higher issuance in U.S. Public Finance, particularly within the regional, municipal and higher education sectors.
Compensation expenses of $843 million decreased $24 million, reflecting:
Non-compensation expenses of $306 million increased $9 million, reflecting:
— a decrease in incentive compensation aligned with actual/projected financial and operating performance; partially offset by:
— an increase in charitable contributions; partially offset by
— a regulatory settlement in the prior year relating to MIS' failure to comply with record preservation requirements
— growth in salaries and benefits reflecting higher headcount and annual salary increases
Adjusted Operating Margin of 65.1% ⇑ 260 BPS
MIS Adjusted Operating Margin expansion primarily reflects the aforementioned 6% increase in revenue.
Restructuring Charges
The amounts reflect charges and adjustments related to the Company's restructuring programs. The Strategic and Operational Efficiency Restructuring Program is more fully discussed in Note 10 to the consolidated financial statements.
LIQUIDITY AND CAPITAL RESOURCES
Moody's remains committed to using its cash flow to create value for shareholders by both investing in the Company's employees and growing the business through targeted organic initiatives and inorganic acquisitions aligned with strategic priorities. Additional excess capital is returned to the Company’s shareholders via a combination of dividends and share repurchases.
Cash Flow
The Company is currently financing its operations, capital expenditures and share repurchases from operating and financing cash flows.
The following is a summary of the changes in the Company’s cash flows followed by a brief discussion of these changes:
Nine Months Ended September 30,
$ Change Favorable (Unfavorable)
2025
2024
Net cash provided by operating activities
$
2,043
$
2,164
$
(121)
Net cash provided by (used in) investing activities
$
44
$
(875)
$
919
Net cash used in financing activities
$
(2,454)
$
(812)
$
(1,642)
Free Cash Flow (1)
$
1,798
$
1,921
$
(123)
(1) Free Cash Flow is a non-GAAP measure and is defined by the Company as net cash provided by operating activities minus cash paid for capital expenditures. Refer to “Non-GAAP Financial Measures” of this MD&A for further information on this financial measure.
Net cash flows from operating activities for the nine months ended September 30, 2025 decreased by $121 million compared to the same period in 2024, with the most notable drivers reflecting:
–$253 million in higher income tax payments in the current year;
–approximately $100 million in higher incentive compensation payments in 2025 (based on full-year 2024 financial and operating results) compared to payments made in the prior year (based on full-year 2023 financial and operating results);
partially offset by:
–growth in operating income of $267 million coupled with various changes in working capital.
Net cash provided by (used in) investing activities
The $919 million increase in cash provided by investing activities in the nine months ended September 30, 2025 compared to the same period in 2024 was primarily due to:
–a $465 million decrease in purchases of investments, primarily due to the purchase of certificates of deposit in the prior year; and
–a $551 million increase in sales and maturities of investments primarily due to the maturity of certificates of deposit in the first quarter of 2025;
partially offset by:
–higher cash paid for acquisitions, net of cash acquired, of $117 million reflecting the acquisitions of CAPE Analytics and ICR Chile in 2025, compared to the acquisitions of GCR and Praedicat in 2024.
Net cash used in financing activities
The $1,642 million increase in cash used in financing activities in the nine months ended September 30, 2025 compared to the same period in the prior year was primarily attributed to:
–a $700 million repayment of notes payable in 2025;
–a $496 million issuance of notes in the third quarter of 2024; and
– higher cash paid for treasury share repurchases in 2025 of $358 million compared to the same period in the prior year.
Cash and cash equivalents and short-term investments
The Company’s aggregate cash and cash equivalents and short-term investments of $2.3 billion at September 30, 2025 included approximately $1.7 billion located outside of the U.S. Approximately 38% of the Company’s aggregate cash and cash equivalents and short-term investments is denominated in euros and GBP. The Company manages both its U.S. and non-U.S. cash flow to maintain sufficient liquidity in all regions to effectively meet its operating needs.
As a result of the Tax Act, all previously net undistributed foreign earnings have now been subject to U.S. tax. The Company continues to evaluate which entities it will indefinitely reinvest earnings outside the U.S. The Company has provided deferred taxes for those entities whose earnings are not considered indefinitely reinvested. Accordingly, the Company continues to repatriate a portion of its non-U.S. cash in these subsidiaries and will continue to repatriate certain of its offshore cash in a manner that addresses compliance with local statutory requirements, sufficient offshore working capital and any other factors that may be relevant in certain jurisdictions. Notwithstanding the Tax Act, which generally eliminated federal income tax on future cash repatriation to the U.S., cash repatriation may be subject to state and local taxes or withholding or similar taxes.
The Company's material cash requirements consist of the following contractual and other obligations:
Financing Arrangements
Indebtedness
At September 30, 2025, Moody’s had $7.2 billion of outstanding principal on debt and $1 billion of additional capacity available under the Company’s CP Program, which is backstopped by the $1.25 billion 2024 Facility.
The repayment schedule for the Company’s borrowings outstanding at September 30, 2025 is as follows:
For additional information on the Company's outstanding debt, refer to Note 14 to the consolidated financial statements.
Future interest payments and fees associated with the Company's debt and credit facility are expected to be $4.2 billion, of which approximately $300 million is expected to be paid in each of the next five years, and the remaining amount expected to be paid thereafter.
Management may consider pursuing additional long-term financing when it is appropriate in light of cash requirements for operations, share repurchases and other strategic opportunities, which could result in higher financing costs.
Purchase Obligations
Purchase obligations generally include multi-year agreements with vendors to purchase goods or services and mainly include data center/cloud hosting fees and fees for information technology licensing and maintenance. As of September 30, 2025, these purchase obligations totaled approximately $700 million, of which approximately 55% is expected to be paid in the next twelve months and another approximate 45% expected to be paid over the next two subsequent years, with the remainder to be paid thereafter.
Leases
The Company has remaining payments relating to its operating leases of $457 million at September 30, 2025, primarily related to real estate leases, of which $103 million in payments are expected over the next twelve months. For more information on the expected cash flows relating to the Company's operating leases, refer to Note 15 to the consolidated financial statements.
Pension and Other Retirement Plan Obligations
The Company does not anticipate making significant contributions to its funded pension plan in the next twelve months. This plan is overfunded at September 30, 2025, and accordingly holds sufficient investments to fund future benefit obligations. Payments for the Company's unfunded plans are not expected to be material in either the short or long-term.
Dividends and share repurchases
On October 21, 2025, the Board approved the declaration of a quarterly dividend of $0.94 per share for Moody’s common stock, payable December 12, 2025 to shareholders of record at the close of business on November 21, 2025. The continued payment of dividends at this rate, or at all, is subject to the discretion of the Board.
On October 15, 2024, the Board approved $1.5 billion in share repurchase authority. At September 30, 2025, the Company had approximately $0.4 billion of remaining authority under this authorization. On October 21, 2025, the Board authorized an additional $4 billion in share repurchase authority. There is no established expiration date for the remaining authorization.
As more fully discussed in Note 10 to the consolidated financial statements, the Company is currently in the process of executing the Strategic and Operational Efficiency Restructuring Program. Future cash outlays associated with this program are expected to be approximately $85 million to $115 million, which are expected to be paid out through 2027.
Sources of Funding to Satisfy Material Cash Requirements
The Company believes that it has the financial resources needed to meet its cash requirements and expects to have positive operating cash flow over the next twelve months. Cash requirements for periods beyond the next twelve months will depend, among other things, on the Company’s profitability and its ability to manage working capital requirements. The Company may also borrow from various sources as described above.
NON-GAAP FINANCIAL MEASURES
In addition to its reported results, Moody’s has included in this MD&A certain adjusted results that the SEC defines as “Non-GAAP financial measures.” Management believes that such adjusted financial measures, when read in conjunction with the Company’s reported results, can provide useful supplemental information for investors analyzing period-to-period comparisons of the Company’s performance, facilitate comparisons to competitors’ operating results and can provide greater transparency to investors of supplemental information used by management in its financial and operational decision-making. These adjusted measures, as defined by the Company, are not necessarily comparable to similarly defined measures of other companies. Furthermore, these adjusted measures should not be viewed in isolation or used as a substitute for other GAAP measures in assessing the operating performance or cash flows of the Company. Below are brief descriptions of the Company’s adjusted financial measures accompanied by a reconciliation of the adjusted measure to its most directly comparable GAAP measure:
Adjusted Operating Income and Adjusted Operating Margin:
The Company presents Adjusted Operating Income and Adjusted Operating Margin because management deems these metrics to be useful measures to provide additional perspective on Moody's operating performance. Adjusted Operating Income excludes the impact of: i) depreciation and amortization; ii) restructuring charges/adjustments, and iii) charges related to asset abandonment. Depreciation and amortization are excluded because companies utilize productive assets of different estimated useful lives and use different methods of acquiring and depreciating productive assets. Restructuring charges/adjustments and charges related to asset abandonment, which the Company believes are not reflective of its ongoing operating cost structure, are excluded as the frequency and magnitude of these charges may vary widely across periods and companies. Refer to Notes 10 and 12 to the consolidated financial statements for further information regarding the nature of the Company’s restructuring programs and asset abandonment, respectively.
Management believes that the exclusion of the aforementioned items, as detailed in the reconciliation below, allows for an additional perspective on the Company’s operating results from period to period and across companies. The Company defines Adjusted Operating Margin as Adjusted Operating Income divided by revenue.
Three Months Ended September 30,
Nine Months Ended September 30,
2025
2024
2025
2024
Operating income
$
917
$
738
$
2,581
$
2,314
Adjustments:
Depreciation and amortization
123
108
356
318
Restructuring
21
6
81
13
Charges related to asset abandonment
1
15
4
30
Adjusted Operating Income
$
1,062
$
867
$
3,022
$
2,675
Operating margin
45.7
%
40.7
%
44.3
%
42.7
%
Adjusted Operating Margin
52.9
%
47.8
%
51.8
%
49.4
%
Adjusted Net Income and Adjusted Diluted EPS attributable to Moody's common shareholders:
The Company presents Adjusted Net Income and Adjusted Diluted EPS because management deems these metrics to be useful measures to provide additional perspective on Moody’s operating performance. Adjusted Net Income and Adjusted Diluted EPS exclude the impact of: i) amortization of acquired intangible assets; ii) restructuring charges/adjustments; iii) charges related to asset abandonment; and iv) gains on previously held equity method investments.
The Company excludes the impact of amortization of acquired intangible assets as companies utilize intangible assets with different estimated useful lives and have different methods of acquiring and amortizing intangible assets. These intangible assets were recorded as part of acquisition accounting and contribute to revenue generation. The amortization of intangible assets related to acquisitions will recur in future periods until such intangible assets have been fully amortized. Furthermore, the timing and magnitude of business combination transactions are not predictable and the purchase price allocated to amortizable intangible assets and the related amortization period are unique to each acquisition and can vary significantly from period to period and across companies. Restructuring charges/adjustments and charges related to asset abandonment, which the Company believes are not reflective of its ongoing operating cost structure, are excluded as the frequency and magnitude of these items may vary widely across periods and companies.
The Company excludes the aforementioned items to provide additional perspective when comparing net income and diluted EPS from period to period and across companies as the frequency and magnitude of similar transactions may vary widely across periods.
The Company defines Free Cash Flow as net cash provided by operating activities minus cash paid for capital additions. Management believes that Free Cash Flow is a useful metric in assessing the Company’s cash flows to service debt, pay dividends and to fund acquisitions and share repurchases. Management deems capital expenditures essential to the Company’s product and service innovations and maintenance of Moody’s operational capabilities. Accordingly, capital expenditures are deemed to be a recurring use of Moody’s cash flow. Below is a reconciliation of the Company’s net cash flows from operating activities to Free Cash Flow:
Nine Months Ended September 30,
2025
2024
Net cash provided by operating activities
$
2,043
$
2,164
Capital additions
(245)
(243)
Free Cash Flow
$
1,798
$
1,921
Net cash provided by (used in) investing activities
The Company presents organic constant currency revenue growth (decline) as its non-GAAP measure of revenue growth (decline). Management deems this measure to be useful in providing additional perspective in assessing the Company's revenue growth (decline) excluding both the inorganic revenue impacts from certain acquisition activity and the impacts of changes in foreign exchange rates. The Company calculates the dollar impact of foreign exchange as the difference between the translation of its current period non-USD functional currency results using comparative prior period weighted average foreign exchange translation rates and current year reported results.
Below is a reconciliation of the Company's reported revenue and growth (decline) rates to its organic constant currency revenue growth (decline) measures:
The Company presents ARR on an organic constant currency basis for its MA business as a supplemental performance metric to provide additional insight on the estimated value of MA's recurring revenue contracts at a given point in time. The Company uses ARR to manage and monitor performance of its MA operating segment and believes that this metric is a key indicator of the trajectory of MA's recurring revenue base.
The Company calculates ARR by taking the total recurring contract value for each active renewable contract as of the reporting date, divided by the number of days in the contract and multiplied by 365 days to create an annualized value. The Company defines renewable contracts as subscriptions, term licenses, maintenance and renewable services. ARR excludes transaction sales including one-time training, services and perpetual licenses. In order to compare period-over-period ARR excluding the effects of foreign currency translation, the Company bases the calculation on currency rates utilized in its current year operating budget and holds these FX rates constant for the duration of all current and prior periods being reported. Additionally, ARR excludes contracts related to acquisitions to provide additional perspective in assessing growth excluding the impacts from certain acquisition activity.
The Company’s definition of ARR may differ from definitions utilized by other companies reporting similarly named measures, and this metric should be viewed in addition to, and not as a substitute for, financial measures presented in accordance with GAAP.
Amounts in millions
September 30, 2025
September 30, 2024
Change
Growth
MA ARR
Decision Solutions
Banking
$
466
$
436
$
30
7%
Insurance
628
583
45
8%
KYC
407
351
56
16%
Total Decision Solutions
$
1,501
$
1,370
$
131
10%
Research and Insights
970
899
71
8%
Data and Information
890
832
58
7%
Total MA ARR
$
3,361
$
3,101
$
260
8%
RECENTLY ISSUED ACCOUNTING STANDARDS
Refer to Note 1 to the consolidated financial statements located in Part I of this Form 10-Q for a discussion on the impact to the Company relating to recently issued accounting pronouncements.
CONTINGENCIES
Legal proceedings in which the Company is involved also may impact Moody’s liquidity or operating results. No assurance can be provided as to the outcome of such proceedings. In addition, litigation inherently involves significant costs. For information regarding legal proceedings, see Item 1 - "Financial Statements," Note 16 "Contingencies” in this Form 10-Q.
Certain statements contained in this quarterly report on Form 10-Q are forward-looking statements and are based on future expectations, plans and prospects for the Company's business and operations that involve a number of risks and uncertainties. Such statements involve estimates, projections, goals, forecasts, assumptions and uncertainties that could cause actual results or outcomes to differ materially from those contemplated, expressed, projected, anticipated or implied in the forward-looking statements. Those statements appear at various places throughout this quarterly report on Form 10-Q, including in the sections entitled “Contingencies” under Item 2, “MD&A,” commencing on page 45 of this quarterly report on Form 10-Q, under “Legal Proceedings” in Part II, Item 1, of this Form 10-Q, and elsewhere in the context of statements containing the words “believe,” “expect,” “anticipate,” “intend,” “plan,” “will,” “predict,” “potential,” “continue,” “strategy,” “aspire,” “target,” “forecast,” “project,” “estimate,” “should,” “could,” “may,” and similar expressions or words and variations thereof relating to the Company’s views on future events, trends and contingencies or otherwise convey the prospective nature of events or outcomes generally indicative of forward-looking statements. Stockholders and investors are cautioned not to place undue reliance on these forward-looking statements. The forward-looking statements and other information in this document are made as of the date of this quarterly report on Form 10-Q, and the Company undertakes no obligation (nor does it intend) to publicly supplement, update or revise such statements on a going-forward basis, whether as a result of subsequent developments, changed expectations or otherwise, except as required by applicable law or regulation. In connection with the “safe harbor” provisions of the Private Securities Litigation Reform Act of 1995, the Company is identifying certain factors that could cause actual results to differ, perhaps materially, from those indicated by these forward-looking statements.
Those factors, risks and uncertainties include, but are not limited to:
•the uncertain effects of U.S. and foreign government actions affecting international trade and economic policy, including changes and volatility in tariffs and trade policies and retaliatory actions, on credit markets, customers, and customer retention, and demand for our products and services;
•the impact of general economic conditions (including significant government debt and deficit levels and inflation or recessions and related monetary policy actions by governments in response thereto) on worldwide credit markets and on economic activity, including on the level of merger and acquisition activity, and their effects on the volume of debt and other securities issued in domestic and/or global capital markets;
•the uncertain effects of U.S. and foreign government initiatives and monetary policy to respond to the current economic climate, including instability of financial institutions, credit quality concerns, and other potential impacts of volatility in financial and credit markets;
•the impacts of geopolitical events and actions, such as the Russia-Ukraine military conflict, military conflicts in the Middle East, and tensions between India and Pakistan, and of tensions and disputes in political and global relations, on volatility in world financial markets, on general economic conditions and GDP in the U.S. and worldwide and on the Company's own operations and personnel;
•other matters that could affect the volume of debt and other securities issued in domestic and/or global capital markets, including regulation, increased utilization of technologies that have the potential to intensify competition and accelerate disruption and disintermediation in the financial services industry, as well as the number of issuances of securities without ratings or securities which are rated or evaluated by non-traditional parties;
•the level of merger and acquisition activity in the U.S. and abroad;
•the impact of MIS’s withdrawal of its credit ratings on countries or entities within countries and of Moody’s no longer conducting commercial operations in countries where political instability warrants such actions;
•concerns in the marketplace affecting our credibility or otherwise affecting market perceptions of the integrity or utility of independent credit agency ratings;
•the introduction or development of competing and/or emerging technologies and products;
•pricing pressure from competitors and/or customers;
•the level of success of new product development and global expansion;
•the impact of regulation as an NRSRO, the potential for new U.S., state and local legislation and regulations;
•the potential for increased competition and regulation in the jurisdictions in which we operate, including the EU;
•exposure to litigation related to our rating opinions, as well as any other litigation, government and regulatory proceedings, investigations and inquiries to which Moody’s may be subject from time to time;
•provisions in U.S. legislation modifying the pleading standards and EU regulations modifying the liability standards, applicable to CRAs in a manner adverse to CRAs;
•provisions of EU regulations imposing additional procedural and substantive requirements on the pricing of services and the expansion of supervisory remit to include non-EU ratings used for regulatory purposes;
•uncertainty regarding the future relationship between the U.S. and China;
•the possible loss of key employees and the impact of the global labor environment;
•failures or malfunctions of our operations and infrastructure;
•any vulnerabilities to cyber threats or other cybersecurity concerns;
•the timing and effectiveness of our restructuring programs;
•currency and foreign exchange volatility;
•the outcome of any review by tax authorities of Moody’s global tax planning initiatives;
•exposure to potential criminal sanctions or civil remedies if Moody’s fails to comply with foreign and U.S. laws and regulations that are applicable in the jurisdictions in which Moody’s operates, including data protection and privacy laws, sanctions laws, anti-corruption laws, and local laws prohibiting corrupt payments to government officials;
•the impact of mergers, acquisitions, or other business combinations and the ability of Moody’s to successfully integrate acquired businesses;
•the level of future cash flows;
•the levels of capital investments; and
•a decline in the demand for credit risk management tools by financial institutions, corporate or government entities.
These factors, risks and uncertainties as well as other risks and uncertainties that could cause Moody’s actual results to differ materially from those contemplated, expressed, projected, anticipated or implied in the forward-looking statements are described in greater detail under “Risk Factors” in Part I, Item 1A of Moody’s annual report on Form 10-K for the year ended December 31, 2024, and in other filings made by the Company from time to time with the SEC or in materials incorporated herein or therein. Stockholders and investors are cautioned that the occurrence of any of these factors, risks and uncertainties may cause the Company’s actual results to differ materially from those contemplated, expressed, projected, anticipated or implied in the forward-looking statements, which could have a material and adverse effect on the Company’s business, results of operations and financial condition. New factors may emerge from time to time, and it is not possible for the Company to predict new factors, nor can the Company assess the potential effect of any new factors on it. Forward-looking and other statements in this document may also address our corporate responsibility progress, plans, and goals (including sustainability and environmental matters), and the inclusion of such statements is not an indication that these contents are necessarily material to investors or required to be disclosed in the Company’s filings with the Securities and Exchange Commission. In addition, historical, current, and forward-looking sustainability-related statements may be based on standards for measuring progress that are still developing, internal controls and processes that continue to evolve, and assumptions that are subject to change in the future.
Item 3. Quantitative and Qualitative Disclosures About Market Risk
In the nine months ended September 30, 2025, the Company entered into new cross-currency swap hedging transactions designated as net investment hedges, which are disclosed in Note 8 to the consolidated financial statements. The related sensitivity analysis disclosed in our Form 10-K for the year ended December 31, 2024 for our derivatives and non-derivatives designated as net investment hedges has been updated below to reflect the Company's exposure to market risk as of September 30, 2025. There have been no material changes to the Company's market risk other than the aforementioned cross-currency swaps during the nine months ended September 30, 2025. For a discussion of the Company’s exposure to market risk, refer to the Company’s market risk disclosures set forth in Part II, Item 7A, “Quantitative and Qualitative Disclosures About Market Risk” of our Form 10-K for the year ended December 31, 2024.
Derivatives and non-derivatives designated as net investment hedges:
The Company designates derivative instruments and foreign currency-denominated debt as hedges of foreign currency risk of net investments in certain foreign subsidiaries (net investment hedges) under ASC Topic 815, Derivatives and Hedging.
Cross-currency swaps
As of September 30, 2025, the Company had cross-currency swaps designated as net investment hedges to mitigate FX exposure related to a portion of the Company’s net investment in certain foreign subsidiaries against changes in exchange rates. The notional values and corresponding interest rates are disclosed in Note 8 to the consolidated financial statements located in Item 1 of this Form 10-Q.
•If the euro were to strengthen 10% relative to the U.S. dollar, there would be an approximate $433 million unfavorable impact to the fair value of the cross-currency swaps recognized in OCI.
•If the Hong Kong dollar were to strengthen 10% relative to the U.S. dollar, there would be an approximate $50 million unfavorable impact to the fair value of the cross-currency swaps recognized in OCI.
•If the Singapore dollar were to strengthen 10% relative to the Hong Kong dollar, there would be an approximate $31 million unfavorable impact to the fair value of the cross-currency swaps recognized in OCI.
The aforementioned unfavorable impacts recognized within OCI would be offset by favorable currency translation gains on the Company’s hedged net investments in those foreign subsidiaries.
As of September 30, 2025 the Company has designated €500 million of the 2015 Senior Notes and €750 million of the 2019 Senior Notes as a net investment hedge to mitigate FX exposure relating to euro denominated net investments in subsidiaries. If the euro were to strengthen 10% relative to the U.S. dollar, there would be an approximate $147 million unfavorable adjustment to OCI related to these net investment hedges. This adjustment would be offset by favorable translation adjustments on the Company’s euro net investment in subsidiaries.
Item 4. Controls and Procedures
Evaluation of Disclosure Controls and Procedures: The Company carried out an evaluation, as required by Rule 13a-15(b) under the Exchange Act, under the supervision and with the participation of the Company’s management, including the Company’s Chief Executive Officer and Chief Financial Officer, of the effectiveness of the design and operation of the Company’s disclosure controls and procedures, as defined in Rule 13a-15(e) of the Exchange Act, as of the end of the period covered by this report (the “Evaluation Date”). Based on such evaluation, such officers have concluded that, as of the Evaluation Date, the Company’s disclosure controls and procedures were effective to provide reasonable assurance that information required to be disclosed by the Company in reports that it files or submits under the Exchange Act is recorded, processed, summarized and reported within the time periods specified in the communication to the Company’s management, including the Company’s Chief Executive Officer and Chief Financial Officer, as appropriate to allow timely decisions regarding required disclosure.
The Company’s management, including the Company’s Chief Executive Officer and Chief Financial Officer, has determined that there were no changes in the Company’s internal control over financial reporting that have materially affected, or are reasonably likely to materially affect, these internal controls over financial reporting during the three-month period ended September 30, 2025.
The Company's disclosure controls and procedures are designed to provide reasonable assurance of achieving their objectives as specified above. The Company's management does not expect, however, that our disclosure controls and procedures will prevent or detect all instances of error and fraud. Any control system, regardless of how well designed and operated, is based upon certain assumptions, and can provide only reasonable, not absolute, assurance that its objectives will be met. Further, no evaluation of controls can provide absolute assurance that misstatements due to error or fraud will not occur or that all control issues and instances of fraud, if any, within the Company have been detected.
For information regarding legal proceedings, see Item 1 – “Financial Statements – Notes to Consolidated Financial Statements (Unaudited),” Note 16 “Contingencies” in this Form 10-Q.
Item 1A. Risk Factors
There have been no material changes from the significant risk factors and uncertainties previously disclosed under the heading "Risk Factors" in the Company's annual report on Form 10-K for the year ended December 31, 2024, that if they were to occur, could materially adversely affect the Company’s business, financial condition, operating results and/or cash flow. For a discussion of the Company’s risk factors, refer to Item 1A. “Risk Factors” contained in the Company’s annual report on Form 10-K for the year ended December 31, 2024.
Item 2. Unregistered Sales of Equity Securities and Use of Proceeds
MOODY'S PURCHASES OF EQUITY SECURITIES
For the three months ended September 30, 2025
Period
Total Number of Shares Purchased (1)
Average Price Paid per Share
Total Number of Shares Purchased as Part of Publicly Announced Program
Approximate Dollar Value of Shares That May Yet be Purchased Under the Program(2)
July 1- 31
311,587
$
503.31
305,949
$
756
million
August 1- 31
326,809
$
514.10
326,561
$
588
million
September 1- 30
384,824
$
495.05
383,936
$
398
million
Total
1,023,220
$
503.66
1,016,446
(1) Includes surrender to the Company of 5,638; 248; and 888 shares of common stock in July, August, and September, respectively, to satisfy tax withholding obligations in connection with the vesting of restricted stock issued to employees.
(2) As of the last day of each of the months. On October 15, 2024, the Board authorized $1.5 billion in share repurchase authority. At September 30, 2025 there was approximately $0.4 billion of share repurchase authority remaining under this authorization. On October 21, 2025, the Board authorized an additional $4 billion in share repurchase authority. There is no established expiration date for the remaining authorization.
During the third quarter of 2025, Moody’s issued a net 53 thousand shares under employee stock-based compensation plans.
Item 5. Other Information
Rule 10b5-1 Plans
On July 30, 2025, Robert Fauber, the Company's Chief Executive Officer, adopted a trading plan intended to satisfy Rule 10b5-1(c). The plan relates to the sale of up to 43,204 shares of Moody’s Corporation common stock between October 28, 2025, and October 30, 2026. The shares include: i) shares which will be acquired upon the exercise of employee stock options; ii) vested restricted stock units; and iii) vested performance share units.
On July 29, 2025, Richard Steele, the Company's General Counsel, adopted a trading plan intended to satisfy Rule 10b5-1(c). The plan relates to the sale of up to 1,399 shares of Moody’s Corporation common stock between October 28, 2025 and July 31, 2026. The shares include: i) vested restricted stock units; and ii) vested performance share units.
Inline XBRL Instance Document (the instance document does not appear in the Interactive Data File because its XBRL tags are embedded within the Inline XBRL document)
Pursuant to the requirements of the Securities Exchange Act of 1934, the registrant has duly caused this report to be signed on its behalf by the undersigned thereunto duly authorized.