.3

MANAGEMENT’S
DISCUSSION AND ANALYSIS
FISCAL YEAR 2019
.3
MANAGEMENT’S
DISCUSSION AND ANALYSIS
FISCAL YEAR 2019
November 6, 2019
Basis of Presentation
This Management’s Discussion and Analysis of the Financial Position and Results of Operations (MD&A) is the responsibility of management and has been reviewed and approved by the Board of Directors. This MD&A has been prepared in accordance with the requirements of the Canadian Securities Administrators. The Board of Directors is ultimately responsible for reviewing and approving the MD&A. The Board of Directors carries out this responsibility mainly through its Audit and Risk Management Committee, which is appointed by the Board of Directors and is comprised entirely of independent and financially literate directors.
Throughout this document, CGI Inc. is referred to as “CGI”, “we”, “our” or “Company”. This MD&A provides information management believes is relevant to an assessment and understanding of the consolidated results of operations and financial condition of the Company. This document should be read in conjunction with the audited consolidated financial statements and the notes thereto for the years ended September 30, 2019 and 2018. CGI’s accounting policies are in accordance with International Financial Reporting Standards (IFRS) as issued by the International Accounting Standards Board (IASB). All dollar amounts are in Canadian dollars unless otherwise noted.
Materiality of Disclosures
This MD&A includes information we believe is material to investors. We consider something to be material if it results in, or would reasonably be expected to result in, a significant change in the market price or value of our shares, or if it is likely that a reasonable investor would consider the information to be important in making an investment decision.
Forward-Looking Statements
This MD&A contains “forward-looking information” within the meaning of Canadian securities laws and “forward-looking statements” within the meaning of the United States Private Securities Litigation Reform Act of 1995 and other applicable United States safe harbours. All such forward-looking information and statements are made and disclosed in reliance upon the safe harbour provisions of applicable Canadian and United States securities laws. Forward-looking information and statements include all information and statements regarding CGI’s intentions, plans, expectations, beliefs, objectives, future performance, and strategy, as well as any other information or statements that relate to future events or circumstances and which do not directly and exclusively relate to historical facts. Forward-looking information and statements often but not always use words such as “believe”, “estimate”, “expect”, “intend”, “anticipate”, “foresee”, “plan”, “predict”, “project”, “aim”, “seek”, “strive”, “potential”, “continue”, “target”, “may”, “might”, “could”, “should”, and similar expressions and variations thereof. These information and statements are based on our perception of historic trends, current conditions and expected future developments, as well as other assumptions, both general and specific, that we believe are appropriate in the circumstances. Such information and statements are, however, by their very nature, subject to inherent risks and uncertainties, of which many are beyond the control of the Company, and which give rise to the possibility that actual results could differ materially from our expectations expressed in, or implied by, such forward-looking information or forward-looking statements. These risks and uncertainties include but are not restricted to: risks related to the market such as the level of business activity of our clients, which is affected by economic and political conditions, and our ability to negotiate new contracts; risks related to our industry such as competition and our ability to attract and retain qualified employees, to develop and expand our services, to penetrate new markets, and to protect our intellectual property rights; risks related to our business such as risks associated with our growth strategy, including the integration of new operations, financial and operational risks inherent in worldwide operations, foreign exchange risks, income tax laws, our ability to negotiate favourable contractual terms, to deliver our services and to collect receivables, and the reputational and financial risks attendant to cybersecurity breaches and other incidents; as well as other risks identified or incorporated by reference in this MD&A and in other documents that we make public, including our filings with the Canadian Securities Administrators (on SEDAR at www.sedar.com) and the U.S. Securities and Exchange
| CGI Inc. - Management’s Discussion and Analysis for the year ended September 30, 2019 | Page 1 |
Commission (on EDGAR at www.sec.gov). Unless otherwise stated, the forward-looking information and statements contained in this MD&A are made as of the date hereof and CGI disclaims any intention or obligation to publicly update or revise any forward-looking information or forward-looking statements, whether as a result of new information, future events or otherwise, except as required by applicable law. While we believe that our assumptions on which these forward-looking information and forward-looking statements are based were reasonable as at the date of this MD&A, readers are cautioned not to place undue reliance on these forward-looking information or statements. Furthermore, readers are reminded that forward-looking information and statements are presented for the sole purpose of assisting investors and others in understanding our objectives, strategic priorities and business outlook as well as our anticipated operating environment. Readers are cautioned that such information may not be appropriate for other purposes. Further information on the risks that could cause our actual results to differ significantly from our current expectations may be found in section 8 - Risk Environment, which is incorporated by reference in this cautionary statement. We also caution readers that the risks described in the previously mentioned section and in other sections of this MD&A are not the only ones that could affect us. Additional risks and uncertainties not currently known to us or that we currently deem to be immaterial could also have a material adverse effect on our financial position, financial performance, cash flows, business or reputation.
| CGI Inc. - Management’s Discussion and Analysis for the year ended September 30, 2019 | Page 2 |
Non-GAAP and Key Performance Measures
The reader should note that the Company reports its financial results in accordance with IFRS. However, we use a combination of financial measures, ratios, and non-GAAP measures to assess the Company’s performance. The non-GAAP measures used in this MD&A do not have any standardized meaning prescribed by IFRS and are therefore unlikely to be comparable to similar measures presented by other issuers. These measures should be considered as supplemental in nature and not as a substitute for the related financial information prepared in accordance with IFRS.
The table below summarizes our non-GAAP measures and most relevant key performance measures:
| Profitability | • Adjusted EBIT (non-GAAP) – is a measure of earnings excluding acquisition-related and integration costs, restructuring costs, net finance costs and income tax expense. Management believes this measure is useful to investors as it best reflects the performance of its activities and allows for better comparability from period to period as well as to trend analysis. A reconciliation of the adjusted EBIT to its closest IFRS measure can be found in section 3.7 of the present document. | |
| • Adjusted EBIT margin (non-GAAP) is obtained by dividing our adjusted EBIT by our revenues. Management believes this measure is useful to investors as it best reflects the performance of its activities and allows for better comparability from period to period as well as to trend analysis. A reconciliation of the adjusted EBIT to its closest IFRS measure can be found in section 3.7 of the present document. | ||
| • Net earnings – is a measure of earnings generated for shareholders. | ||
| • Diluted earnings per share (diluted EPS) – is a measure of earnings generated for shareholders on a per share basis, assuming all dilutive elements are exercised. | ||
| • Net earnings excluding specific items (non-GAAP) – is a measure of net earnings excluding acquisition-related and integration costs, restructuring costs and tax adjustments. Management believes this measure is useful to investors as it best reflects the Company’s performance and allows for better comparability from period to period. A reconciliation of the net earnings excluding specific items to its closest IFRS measure can be found in section 3.8.3. of the present document. | ||
| • Net earnings margin excluding specific items (non-GAAP) is obtained by dividing our net earnings excluding specific items by our revenues. Management believes this measure is useful to investors as it best reflects the Company’s performance and allows for better comparability from period to period. A reconciliation of the net earnings excluding specific items to its closest IFRS measure can be found in section 3.8.3. of the present document. | ||
| • Diluted earnings per share excluding specific items (non-GAAP) – is defined as the net earnings excluding specific items on a per share basis. Management believes that this measure is useful to investors as it best reflects the Company’s performance on a per share basis and allows for better comparability from period to period. The diluted earnings per share reported in accordance with IFRS can be found in section 3.8 of the present document while the basic and diluted earnings per share excluding specific items can be found in section 3.8.3 of the present document. | ||
| Liquidity |
• Cash provided by operating activities – is a measure of cash generated from managing our day-to-day business operations. Management believes strong operating cash flow is indicative of financial flexibility, allowing us to execute the Company’s strategy. | |
|
• Days sales outstanding (DSO) (non-GAAP) – is the average number of days needed to convert our trade receivables and work in progress into cash. DSO is obtained by subtracting deferred revenue from trade accounts receivable and work in progress; the result is divided by our most recent quarter’s revenue over 90 days. Management tracks this metric closely to ensure timely collection and healthy liquidity. Management believes this measure is useful to investors as it demonstrates the Company’s ability to timely convert its trade receivables and work in progress into cash.
| ||
| CGI Inc. - Management’s Discussion and Analysis for the year ended September 30, 2019 | Page 3 |
|
Growth |
• Constant currency growth (non-GAAP) – is a measure of revenue growth before foreign currency translation impacts. This growth is calculated by translating current period results in local currency using the conversion rates in the equivalent period from the prior year. Management believes that it is helpful to adjust revenue to exclude the impact of currency fluctuations to facilitate period-to-period comparisons of business performance and that this measure is useful to investors for the same reason. | |
| • Backlog (non-GAAP) – includes new contract wins, extensions and renewals (bookings (non-GAAP)), adjusted for the backlog consumed during the period as a result of client work performed and adjustments related to the volume, cancellation and the impact of foreign currencies to our existing contracts. Backlog incorporates estimates from management that are subject to change. Management tracks this measure as it is a key indicator of management’s best estimate of contracted revenue to be realized in the future and believes that this measure is useful to investors for the same reason. | ||
|
• Book-to-bill ratio (non-GAAP) – is a measure of the proportion of the value of our bookings to our revenue in the period. This metric allows management to monitor the Company’s business development efforts to ensure we grow our backlog and our business over time and management believes that this measure is useful to investors for the same reason. Management remains committed to maintaining a target ratio greater than 100% over a trailing twelve-month period. Management believes that monitoring the Company’s bookings over a longer period is a more representative measure as the services and contract type, size and timing of bookings could cause this measurement to fluctuate significantly if taken for only a three-month period. | ||
|
Capital Structure |
• Net debt (non-GAAP) – is obtained by subtracting from our debt our cash and cash equivalents, short-term investments, long-term investments and fair value of foreign currency derivative financial instruments related to debt. Management uses the net debt metric to monitor the Company’s financial leverage and believes that this metric is useful to investors as it provides insight into its financial strength. A reconciliation of net debt to its closest IFRS measure can be found in section 4.5 of the present document. | |
| • Net debt to capitalization ratio (non-GAAP) – is a measure of our level of financial leverage and is obtained by dividing the net debt by the sum of shareholder’s equity and debt. Management uses the net debt to capitalization ratio to monitor the proportion of debt versus capital used to finance the Company’s operations and to assess its financial strength. Management believes that this metric is useful to investors for the same reasons. | ||
| • Return on equity (ROE) (non-GAAP) – is a measure of the rate of return on the ownership interest of our shareholders and is calculated as the proportion of net earnings for the last 12 months over the last four quarters’ average equity. Management looks at ROE to measure its efficiency at generating net earnings for the Company’s shareholders and how well the Company uses the invested funds to generate net earnings growth and believes that this measure is useful to investors for the same reasons. | ||
|
• Return on invested capital (ROIC) (non-GAAP) – is a measure of the Company’s efficiency at allocating the capital under its control to profitable investments and is calculated as the proportion of the net earnings excluding net finance costs after-tax for the last 12 months, over the last four quarters’ average invested capital, which is defined as the sum of equity and net debt. Management examines this ratio to assess how well it is using its funds to generate returns and believes that this measure is useful to investors for the same reason. | ||
Reporting Segments
During the first quarter of Fiscal 2019, the Company realigned its management structure, resulting primarily in the transfer of our Belgium and Southern Europe operations from the Central and Eastern Europe to the Western and Southern Europe
| CGI Inc. - Management’s Discussion and Analysis for the year ended September 30, 2019 | Page 4 |
operating segment as well as other internal organizational changes. During the three months ended June 30, 2019, the Company further realigned its management structure with the transfer of our Australia operations from the Asia Pacific segment to the U.K. operating segment. The Company has retrospectively revised the segmented information for the comparative periods. Please refer to sections 3.4, 3.6, 5.4 and 5.5 of the present document and to note 27 of our audited consolidated financial statements for additional information on our segments.
For Fiscal 2019, the Company’s results were presented through eight operating segments, namely: Western and Southern Europe (primarily France, Portugal and Belgium); Northern Europe (including Nordics, Baltics and Poland); Canada; United States of America (U.S.) Commercial and State Government; U.S. Federal; United Kingdom (U.K.) and Australia; Central and Eastern Europe (primarily Netherlands and Germany); and Asia Pacific Global Delivery Centers of Excellence (India and Philippines) (Asia Pacific).
| CGI Inc. - Management’s Discussion and Analysis for the year ended September 30, 2019 | Page 5 |
MD&A Objectives and Contents
In this document, we:
| • | Provide a narrative explanation of the audited consolidated financial statements through the eyes of management; |
| • | Provide the context within which the audited consolidated financial statements should be analyzed, by giving enhanced disclosure about the dynamics and trends of the Company’s business; and |
| • | Provide information to assist the reader in ascertaining the likelihood that past performance may be indicative of future performance. |
In order to achieve these objectives, this MD&A is presented in the following main sections:
|
Section
|
Contents
|
Pages
| ||
|
1. Corporate |
1.1. About CGI | 8 | ||
| Overview |
1.2. Vision and Strategy | 9 | ||
| 1.3. Competitive Environment | 10 | |||
|
2. Highlights and Key |
2.1. Fiscal 2019 Year-Over-Year Highlights | 11 | ||
| Performance |
2.2. Selected Yearly Information & Key Performance Measures | 12 | ||
| 2.3. Stock Performance | 13 | |||
| 2.4. Investments in Subsidiaries | 14 | |||
|
3. Financial Review |
3.1. Bookings and Book-to-Bill Ratio | 15 | ||
| 3.2. Foreign Exchange | 16 | |||
| 3.3. Revenue Distribution | 17 | |||
| 3.4. Revenue by Segment | 18 | |||
| 3.5. Operating Expenses | 20 | |||
| 3.6. Adjusted EBIT by Segment | 21 | |||
| 3.7. Earnings Before Income Taxes | 23 | |||
| 3.8. Net Earnings and Earnings Per Share | 24 | |||
|
4. Liquidity |
4.1. Consolidated Statements of Cash Flows | 26 | ||
| 4.2. Capital Resources | 29 | |||
| 4.3. Contractual Obligations | 30 | |||
| 4.4. Financial Instruments and Hedging Transactions | 30 | |||
| 4.5. Selected Measures of Capital Resources and Liquidity | 31 | |||
| 4.6. Off-Balance Sheet Financing and Guarantees | 31 | |||
| 4.7. Capability to Deliver Results | 32 | |||
|
5. Fourth Quarter |
5.1. Bookings and Book-to-Bill Ratio | 33 | ||
| Results |
5.2. Foreign Exchange | 34 | ||
| 5.3. Revenue Distribution | 35 | |||
| 5.4. Revenue by Segment | 36 | |||
| 5.5. Adjusted EBIT by Segment | 39 | |||
| 5.6. Net Earnings and Earnings Per Share | 41 | |||
| 5.7. Consolidated Statements of Cash Flows | 43 | |||
| CGI Inc. - Management’s Discussion and Analysis for the year ended September 30, 2019 | Page 6 |
|
6. Eight Quarter Summary |
A summary of the past eight quarters’ key performance measures and a discussion of the factors that could impact our quarterly results. | 45 | ||
|
7. Changes in Accounting Policies |
A summary of the accounting standard changes. | 47 | ||
|
8. Critical Accounting Estimates |
A discussion of the critical accounting estimates made in the preparation of the audited consolidated financial statements. | 50 | ||
|
9. Integrity of Disclosure |
A discussion of the existence of appropriate information systems, procedures and controls to ensure that information used internally and disclosed externally is complete and reliable. | 53 | ||
|
10. Risk Environment |
10.1. Risks and Uncertainties | 55 | ||
| 10.2. Legal Proceedings
|
64 | |||
| CGI Inc. - Management’s Discussion and Analysis for the year ended September 30, 2019 | Page 7 |
1. Corporate Overview
Founded in 1976 and headquartered in Montréal, Canada, CGI is among the largest information technology (IT) and business consulting services firms in the world. CGI delivers an end-to-end portfolio of capabilities, including strategic IT and business consulting, systems integration, intellectual property and managed IT and business process services. The Company employs approximately 77,500 consultants and professionals worldwide, whom are called members as they are also owners.
End-to-end services and solutions
CGI delivers end-to-end services that cover the full spectrum of technology delivery; from digital strategy and architecture to solution design, development, integration, implementation, and operations. Our portfolio encompasses:
| • | High-end IT services and business consulting and systems integration: CGI helps clients define their digital strategy and roadmap, adopting an agile, iterative approach that facilitates innovation, connection and optimization of mission-critical systems to deliver enterprise-wide change. |
| • | Managed IT and business process services: Our clients entrust us with full or partial responsibility for their IT and business functions to improve how they operate and transform their business. In return, we deliver innovation, significant efficiency gains, and cost savings. Typical services in an end-to-end engagement include: application development, integration and maintenance; technology infrastructure management; and business process services, such as in collections and payroll management. Managed IT and business process services contracts are long-term in nature, with a typical duration greater than five years, allowing our clients to reinvest savings, alongside CGI, in their digital transformations. |
| • | Intellectual property (IP): Our IP portfolio includes more than 175 business solutions, some of which are cross-industry solutions. Most IP has been co-innovated with clients and act as business accelerators for the industries we serve. These include business solutions encompassing commercial software embedded with our end-to-end-services, and digital enablers such as methodologies and frameworks to drive change across business and IT processes. |
Deep industry expertise
CGI has long standing and focused practices in all of its core industries, providing clients with a partner that is not only an expert in IT, but also expert in their industries. This combination of business knowledge and digital technology expertise allows us to help our clients adapt with shifts in market dynamics and changing consumer and citizen expectations. In the process, we evolve the services and solutions we deliver within our targeted industries.
Our targeted industries include: communications, financial services, government, health & life sciences, manufacturing, oil & gas, retail & consumer services, transportation, post & logistics and utilities. While these represent our go-to-market industry targets, we group these industries into the following for reporting purposes: government; manufacturing, retail & distribution (MRD); financial services; communications & utilities; and health.
As the move toward digitalization continues across industries, CGI partners with clients to help guide them in becoming customer and citizen-centric digital organizations.
Applied innovation
At CGI, innovation happens across many interconnected fronts. It starts in our everyday work on client projects, where thousands of innovations are applied daily. Through benchmark in-person interviews we conduct each year, business and technology executives share their priorities with us, informing our own innovation investments and driving our client proximity teams’ focus on local client priorities. We also turn ideas into new business solutions through our Innovate, Collaborate and Evolve (ICE) program which incubates proximity team innovations into scalable, replicable solutions for global application.
| CGI Inc. - Management’s Discussion and Analysis for the year ended September 30, 2019 | Page 8 |
Since 1976, CGI is a trusted partner in delivering innovative, client-inspired business services and solutions. We help develop, innovate and protect the technology that enables clients to achieve their digital transformation goals faster, with reduced risk and enduring results. Through our day-to-day project engagements as well as global programs and investments, CGI partners with clients to generate practical innovations that are replicable and scalable, followed by the delivery of measurable results.
Quality processes
CGI’s clients expect consistency of service wherever and whenever they engage us. We have an outstanding track record of on-time, within-budget delivery as a result of our commitment to excellence and our robust governance model - the CGI Management Foundation. The CGI Management Foundation provides a common business language, frameworks and practices for managing all operations consistently across the globe, driving a focus on continuous improvement. We also invest in rigorous quality and service delivery standards (including ISO and Capability Maturity Model Integration (CMMI) certification programs), as well as a comprehensive Client Satisfaction Assessment Program, with signed client assessments, to ensure high satisfaction on an ongoing basis.
CGI is unique compared to most companies. As our vision is based on a dream: “To create an environment in which we enjoy working together and, as owners, contribute to building a company we can be proud of.” This dream has motivated us since our founding in 1976 and drives our vision: “To be a global, world-class end-to-end IT and business consulting services leader helping our clients succeed.”
In pursuing our dream and vision, CGI has been highly disciplined throughout its history in executing a Build and Buy profitable growth strategy comprised of four pillars that combine profitable organic growth (Build) and accretive acquisitions (Buy):
Pillar 1: Win, renew and extend contracts
Pillar 2: New large managed IT and business process services contracts
These first two pillars relate to driving profitable organic growth through the pursuit of contracts with new and existing clients in our targeted industries. Successes in these pillars reflect the strength of our end-to-end portfolio of capabilities, the depth of expertise of our consultants in business and IT and the appreciation of the proximity model by our clients, both existing and potential.
Pillar 3: Metro market acquisitions
The third pillar focuses on growth through metro market acquisitions, complementing the proximity model, helping provide a fuller range of end-to-end services. We identify metro market acquisitions through a strategic qualification process that systematically searches for targets to strengthen our proximity model, leveraging strong local relationships with customers, and enhancing our industry expertise, services and solutions.
Pillar 4: Large, transformational acquisitions
We also pursue large acquisitions to further expand our geographic presence and critical mass, which enables us to compete for large managed IT and business process services contracts and broaden our client relationships. CGI will continue to be a consolidator in the IT services industry by being active on both of these last pillars.
Executing our strategy
CGI’s strategy is executed through a unique business model that combines client proximity with an extensive global delivery network to deliver the following benefits:
• Local relationships and accountability: We live and work near our clients to provide a high level of responsiveness, partnership, and innovation. Our local CGI members speak our clients’ language, understand their business environment, and collaborate to meet their goals and advance their business.
| CGI Inc. - Management’s Discussion and Analysis for the year ended September 30, 2019 | Page 9 |
• Global reach: Our local presence is complemented by an expansive global delivery network that ensures our clients have 24/7 access to best-fit digital capabilities and resources to meet their end-to-end needs. In addition, clients benefit from our unique combination of industry domain and technology expertise within our global delivery model.
• Committed experts: One of our key strategic goals is to be our clients’ partner and expert of choice. To achieve this, we invest in developing and recruiting professionals with extensive industry, business and in-demand technology expertise. In addition, CGI consultants and professionals are also owners through our Share Purchase Plan, which, combined with the Profit Participation Plan, provide an added level of commitment to the success of our clients.
• Comprehensive quality processes: CGI’s investment in quality frameworks and rigorous client satisfaction assessments has resulted in a consistent track record of on-time and within-budget project delivery. With regular reviews of engagements and transparency at all levels, the company ensures that client objectives and its own targets are consistently followed at all times. This thorough process enables CGI to generate continuous improvements for all stakeholders by applying corrective measures as soon as they are required.
• Corporate responsibility: Social Responsibility is one of CGI’s core values. Our business model is designed to ensure that we are close to our clients and communities. At CGI, our members embrace our responsibilities to contribute to the continuous improvement of the economic, social and environmental well-being of the communities in which we live and work.
In today’s digital era, there is a competitive urgency for organizations across industries to become digital in a sustainable way. The pressure is on to modernize legacy assets and connect them to digital business and operating models. Central to this massive transformation is the evolving role of technology. Traditionally viewed as an enabler, technology is now recognized as a driver of business transformation. The promise of digital creates an enormous opportunity to transform organizations end-to-end, and CGI is well-positioned to serve as a digital partner and expert of choice. We’re working with clients across the globe to implement digital strategies, roadmaps and solutions that revolutionize the customer/citizen experience, drive the launch of new products and services, and deliver efficiencies and cost savings.
As the demand for digitalization increases, competition within the global IT industry is intensifying. CGI’s competition comprises a variety of players; from metro market companies providing specialized services and software, to global, end-to-end IT service providers, to large consulting firms and government pure-play. All of these players are competing to deliver some or all of the services we provide.
Many factors distinguish the industry leaders, including the following:
• Depth and breadth of industry and technology expertise;
• Local presence and strength of client relationships;
• Consistent, on-time, within-budget delivery everywhere the client operates;
• Breadth of digital IP solutions;
• Ability to deliver practical innovation for measurable results;
• Total cost of services and value delivered;
• Unique global delivery network, including onshore, nearshore and offshore options.
CGI is one of the leaders in the industry with respect to all of these factors. We’re not only delivering all of the capabilities clients need to compete in a digital world, but the immediate results and long-term value they expect. As the market dynamics and industry trends continue to increase demand for enterprise solutions from global, end-to-end IT and business consulting services firms, CGI is one of few firms with the scale, reach, and capabilities to meet clients’ enterprise needs.
| CGI Inc. - Management’s Discussion and Analysis for the year ended September 30, 2019 | Page 10 |
2. Highlights and Key Performance Measures
• Revenue of $12.1 billion, up 5.3% or 5.9% in constant currency;
• Adjusted EBIT of $1,825.0 million, up 7.2%;
• Adjusted EBIT margin of 15.1%, up 30 bps;
• Net earnings of $1,263.2 million, up 10.7%;
• Diluted EPS of $4.55, up 15.2%;
• Net earnings, excluding specific items1, of $1,305.9 million, up 7.9%;
• Diluted EPS, excluding specific items1, of $4.70, up 12.2%;
• Cash provided by operating activities of $1,633.9 million, up 9.4%;
• Bookings of $12.6 billion, or 104.4% of revenue; and,
• Backlog of $22.6 billion, representing 1.9 times Fiscal 2019 revenue.
| 1 | Specific items are comprised of acquisition-related, integration costs and restructuring costs net of tax as well as tax adjustments, all of which are discussed in sections 3.7.1, 3.7.2. and 3.8.1 of the present document. |
| CGI Inc. - Management’s Discussion and Analysis for the year ended September 30, 2019 | Page 11 |
2.2. SELECTED YEARLY INFORMATION & KEY PERFORMANCE MEASURES
|
As at and for the years ended September 30, |
2019 |
2018 |
2017 |
Change |
Change 2018 / 2017 |
|||||||||||||||
| In millions of CAD unless otherwise noted
|
||||||||||||||||||||
|
Growth
|
||||||||||||||||||||
| Revenue |
12,111.2 | 11,506.8 | 10,845.1 | 604.4 | 661.7 | |||||||||||||||
| Year-over-year revenue growth |
5.3% | 6.1% | 1.5% | (0.8%) | 4.6% | |||||||||||||||
| Constant currency year-over-year revenue growth |
5.9% | 4.6% | 4.3% | 1.3% | 0.3% | |||||||||||||||
| Backlog |
22,611 | 22,577 | 20,813 | 34 | 1,764 | |||||||||||||||
| Bookings |
12,646 | 13,493 | 11,284 | (847) | 2,209 | |||||||||||||||
| Book-to-bill ratio
|
104.4% | 117.3% | 104.1% | (12.9%) | 13.2% | |||||||||||||||
|
Profitability
|
||||||||||||||||||||
| Adjusted EBIT |
1,825.0 | 1,701.7 | 1,586.6 | 123.3 | 115.1 | |||||||||||||||
| Adjusted EBIT margin |
15.1% | 14.8% | 14.6% | 0.3% | 0.2% | |||||||||||||||
| Net earnings |
1,263.2 | 1,141.4 | 1,035.2 | 121.8 | 106.2 | |||||||||||||||
| Net earnings margin |
10.4% | 9.9% | 9.5% | 0.5% | 0.4% | |||||||||||||||
| Diluted EPS (in dollars) |
4.55 | 3.95 | 3.41 | 0.60 | 0.54 | |||||||||||||||
| Net earnings excluding specific items |
1,305.9 | 1,210.7 | 1,107.0 | 95.2 | 103.7 | |||||||||||||||
| Net earnings margin excluding specific items |
10.8% | 10.5% | 10.2% | 0.3% | 0.3% | |||||||||||||||
| Diluted EPS excluding specific items (in dollars)
|
4.70 | 4.19 | 3.65 | 0.51 | 0.54 | |||||||||||||||
|
Liquidity
|
||||||||||||||||||||
| Cash provided by operating activities |
1,633.9 | 1,493.4 | 1,358.6 | 140.5 | 134.8 | |||||||||||||||
| As a % of revenue |
13.5% | 13.0% | 12.5% | 0.5% | 0.5% | |||||||||||||||
| Days sales outstanding
|
50 | 52 | 47 | (2) | 5 | |||||||||||||||
|
Capital structure
|
||||||||||||||||||||
| Net debt |
2,117.2 | 1,640.8 | 1,749.4 | 476.4 | (108.6) | |||||||||||||||
| Net debt to capitalization ratio |
22.9% | 19.2% | 21.5% | 3.7% | (2.3)% | |||||||||||||||
| Return on equity |
18.5% | 17.3% | 16.1% | 1.2% | 1.2% | |||||||||||||||
| Return on invested capital
|
15.1% | 14.5% | 13.7% | 0.6% | 0.8% | |||||||||||||||
|
Balance sheet
|
||||||||||||||||||||
| Cash and cash equivalents, and short-term investments |
223.7 | 184.1 | 165.9 | 39.6 | 18.2 | |||||||||||||||
| Total assets |
12,621.7 | 11,919.1 | 11,396.2 | 702.6 | 522.9 | |||||||||||||||
| Long-term financial liabilities1
|
2,236.0 | 1,530.1 | 1,821.9 | 705.9 | (291.8) | |||||||||||||||
| 1 | Long-term financial liabilities include the long-term portion of the debt and the long-term derivative financial instruments. |
| CGI Inc. - Management’s Discussion and Analysis for the year ended September 30, 2019 | Page 12 |
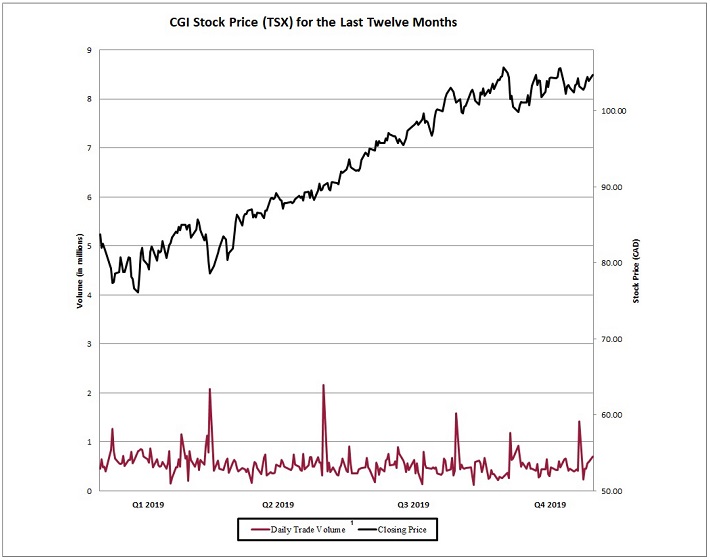
2.3.1. Fiscal 2019 Trading Summary
CGI’s shares are listed on the Toronto Stock Exchange (TSX) (stock quote – GIB.A) and the New York Stock Exchange (NYSE) (stock quote – GIB) and are included in key indices such as the S&P/TSX 60 Index.
| 1 | Includes the average daily volumes of both the TSX and alternative trading systems. |
| CGI Inc. - Management’s Discussion and Analysis for the year ended September 30, 2019 | Page 13 |
2.3.2. Normal Course Issuer Bid (NCIB)
On January 30, 2019, the Company’s Board of Directors authorized and subsequently received the regulatory approval from the TSX for the renewal of CGI’s NCIB which allows for the purchase for cancellation of up to 20,100,499 Class A subordinate voting shares (Class A Shares), representing 10% of the Company’s public float as of the close of business on January 23, 2019. Class A Shares may be purchased for cancellation under the current NCIB commencing on February 6, 2019 until no later than February 5, 2020, or on such earlier date when the Company has either acquired the maximum number of Class A Shares allowable under the NCIB or elects to terminate the bid.
During Fiscal 2019, the Company purchased for cancellation 12,460,232 Class A Shares for $1,126.1 million at a weighted average price of $90.37 under the previous and current NCIB. The purchased shares included 5,158,362 Class A Shares purchased for cancellation from Caisse de dépôt et placement du Québec (CDPQ) for cash consideration of $500.0 million. The purchase is considered within the annual aggregate limit that the Company is entitled to purchase under its current NCIB.
As at September 30, 2019, the Company could purchase up to 13,315,767 Class A Shares for cancellation under the current NCIB.
2.3.3. Capital Stock and Options Outstanding
The following table provides a summary of the Capital Stock and Options Outstanding as at November 1, 2019:
|
Capital Stock and Options Outstanding
|
As at November 1, 2019
|
|||
| Class A subordinate voting shares |
239,812,343 | |||
| Class B multiple voting shares |
28,945,706 | |||
| Options to purchase Class A subordinate voting shares |
9,749,355 | |||
2.4. INVESTMENTS IN SUBSIDIARIES
On October 11, 2018, the Company acquired all of the outstanding shares of ckc AG (ckc), for a purchase price of $21.0 million (€13.9 million). ckc was a specialized provider of agile software development and management services, with a focus on the automotive sector, headquartered in Brunswick, Germany. This acquisition added approximately 300 professionals and annualized revenues of approximately €30 million to the Company.
During the three months ended March 31, 2019, the Company acquired 22.6% of the outstanding shares of Acando AB (Acando), a consulting services firm with strategic consulting, system integration and customer-centric digital innovation capabilities, headquartered in Stockholm, Sweden, with additional offices in Finland, Norway, Germany and Latvia.
On April 16, 2019, the Company acquired control of Acando through the acquisition of an additional 71.1% of the outstanding shares under a tender offer. By May 14, 2019, an additional 2.4% was acquired, for a total purchase price of $623.8 million (SEK 4,319.7 million).This acquisition added approximately 2,100 professionals and annualized revenues of approximately $400 million to the Company, before considering divestitures in the range of 5%-10%.
On October 11 2019, the Company acquired the remaining 3.9% of the outstanding shares of Acando for a total purchase price of $23.1 million (SEK 171.5 million).
With significant strategic consulting, system integration and customer-centric digital innovation capabilities, these acquisitions were made to complement CGI’s proximity model and expertise across key sectors, including manufacturing, retail and government. Please refer to note 25 of our audited consolidated financial statements for additional information.
On June 14, 2019, the Company announced a cash offer of approximately $131 million (£ 78.9 million) to acquire all outstanding shares of SCISYS Group Plc (SCISYS). The transaction is expected to be completed by the first quarter of Fiscal 2020. SCISYS operates in several sectors, with deep expertise and industry leading solutions in the space and defense sectors, as well as in the media and broadcast news industries and is headquartered in Dublin, Ireland. This acquisition would add approximately 670 professionals predominantly based in the UK and Germany and annualized revenues of approximately £58.4 million to the Company.
| CGI Inc. - Management’s Discussion and Analysis for the year ended September 30, 2019 | Page 14 |
3. Financial Review
3.1. BOOKINGS AND BOOK-TO-BILL RATIO
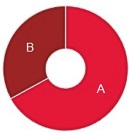
Bookings for the year were $12.6 billion representing a book-to-bill ratio of 104.4%. The breakdown of the new bookings signed during the year is as follows:
|
|
|
|
| |||||||||||||||||
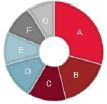
| Contract Type | Service Type | Segment | Vertical Market | |||||||||||||||||
|
A. Extensions, renewals and add-ons |
67% |
A. System integration and consulting |
59% |
A. U.S. Commercial and State Government |
19% |
A. Government |
31% | |||||||||||||
| B. New business |
33% | B. Managed IT and Business Process Services |
41% | B. Northern Europe |
18% | B. Financial Services |
27% | |||||||||||||
| C. Western and Southern Europe |
16% | C. MRD |
20% | |||||||||||||||||
| D. Canada |
12% | D. Communications & utilities |
11% | |||||||||||||||||
| E. U.S. Federal |
12% | E. Health |
11% | |||||||||||||||||
| F. U.K. and Australia |
12% | |||||||||||||||||||
| G. Central and Eastern Europe |
11% | |||||||||||||||||||
Information regarding our bookings is a key indicator of the volume of our business over time. However, due to the timing and transition period associated with managed IT and business process services contracts, the realization of revenue related to these bookings may fluctuate from period to period. The values initially booked may change over time due to their variable attributes, including demand-driven usage, modifications in the scope of work to be performed caused by changes in client requirements as well as termination clauses at the option of the client. As such, information regarding our bookings is not comparable to, nor should it be substituted for, an analysis of our revenue. Management however believes that it is a key indicator of potential future revenue.
The following table provides a summary of the bookings and book-to-bill ratio by segment:
| In thousands of CAD except for percentages |
Bookings for the year ended September 30, 2019 |
Book-to-bill ratio for the year ended September 30, 2019 |
||||
| Total CGI |
12,646,027 | 104.4 | % | |||
| Western and Southern Europe |
2,057,093 | 101.5 | % | |||
| Northern Europe |
2,254,359 | 113.8 | % | |||
| Canada |
1,556,634 | 82.9 | % | |||
| U.S. Commercial and State Government |
2,436,044 | 133.1 | % | |||
| U.S. Federal |
1,545,255 | 93.9 | % | |||
| U.K. and Australia |
1,466,935 | 94.0 | % | |||
| Central and Eastern Europe |
1,329,707 | 111.7 | % | |||
| CGI Inc. - Management’s Discussion and Analysis for the year ended September 30, 2019 | Page 15 |
The Company operates globally and is exposed to changes in foreign currency rates. Accordingly, as prescribed by IFRS, we value assets, liabilities and transactions that are measured in foreign currencies using various exchange rates. We report all dollar amounts in Canadian dollars.
Closing foreign exchange rates
| As at September 30, | 2019 | 2018 | Change | |||||||||
| U.S. dollar |
1.3246 | 1.2925 | 2.5% | |||||||||
| Euro |
1.4446 | 1.5024 | (3.8% | ) | ||||||||
| Indian rupee |
0.0188 | 0.0178 | 5.6% | |||||||||
| British pound |
1.6302 | 1.6874 | (3.4% | ) | ||||||||
| Swedish krona |
0.1347 | 0.1456 | (7.5% | ) | ||||||||
| Average foreign exchange rates |
||||||||||||
| For the year ended September 30, | 2019 | 2018 | Change | |||||||||
| U.S. dollar |
1.3270 | 1.2838 | 3.4% | |||||||||
| Euro |
1.4970 | 1.5278 | (2.0% | ) | ||||||||
| Indian rupee |
0.0188 | 0.0193 | (2.6% | ) | ||||||||
| British pound |
1.6943 | 1.7271 | (1.9% | ) | ||||||||
| Swedish krona |
0.1426 | 0.1510 | (5.6% | ) | ||||||||
| CGI Inc. - Management’s Discussion and Analysis for the year ended September 30, 2019 | Page 16 |
The following charts provide additional information regarding our revenue mix for the year:
|
|
|
| ||||||||||||
| Service Type | Client Geography | Vertical Market | ||||||||||||
|
A. System integration and consulting |
50% | A. U.S. | 29% | A. Government | 33% | |||||||||
|
B. Managed IT and Business Process |
50% | B. Canada | 16% | B. MRD | 24% | |||||||||
| C. France | 15% | C. Financial services | 22% | |||||||||||
| D. U.K. | 12% | D. Communications & utilities | 14% | |||||||||||
| E. Sweden | 7% | E. Health | 7% | |||||||||||
| F. Finland | 6% | |||||||||||||
| G. Rest of the world | 15% | |||||||||||||
3.3.1. Client Concentration
IFRS guidance on segment disclosures defines a single customer as a group of entities that are known to the reporting entity to be under common control. As a consequence, our work for the U.S. federal government including its various agencies represented 12.8% of our revenue for Fiscal 2019 as compared to 12.0% for Fiscal 2018.
| CGI Inc. - Management’s Discussion and Analysis for the year ended September 30, 2019 | Page 17 |
Our segments are reported based on where the client’s work is delivered from - our geographic delivery model.
The following table provides a summary of the year-over-year changes in our revenue, in total and by segment, separately showing the impacts of foreign currency exchange rate variations between Fiscal 2019 and Fiscal 2018. The Fiscal 2018 revenue by segment was recorded reflecting the actual foreign exchange rates for that period. The foreign exchange impact is the difference between the current period’s actual results and the same period’s results converted with the prior year’s foreign exchange rates.
| Change | ||||||||||||||||
| For the years ended September 30, | ||||||||||||||||
| 2019 | 2018 | $ | % | |||||||||||||
| In thousands of CAD except for percentages |
||||||||||||||||
| Total CGI revenue |
12,111,236 | 11,506,825 | 604,411 | 5.3% | ||||||||||||
| Variation prior to foreign currency impact |
5.9% | |||||||||||||||
| Foreign currency impact |
(0.6% | ) | ||||||||||||||
| Variation over previous period |
5.3% | |||||||||||||||
| Western and Southern Europe |
||||||||||||||||
| Revenue prior to foreign currency impact |
2,061,550 | 1,995,811 | 65,739 | 3.3% | ||||||||||||
| Foreign currency impact |
(41,887 | ) | ||||||||||||||
| Western and Southern Europe revenue |
2,019,663 | 1,995,811 | 23,852 | 1.2% | ||||||||||||
| Northern Europe |
||||||||||||||||
| Revenue prior to foreign currency impact |
1,950,212 | 1,800,460 | 149,752 | 8.3% | ||||||||||||
| Foreign currency impact |
(72,960 | ) | ||||||||||||||
| Northern Europe revenue |
1,877,252 | 1,800,460 | 76,792 | 4.3% | ||||||||||||
| Canada |
||||||||||||||||
| Revenue prior to foreign currency impact |
1,711,550 | 1,671,060 | 40,490 | 2.4% | ||||||||||||
| Foreign currency impact |
377 | |||||||||||||||
| Canada revenue |
1,711,927 | 1,671,060 | 40,867 | 2.4% | ||||||||||||
| U.S. Commercial and State Government |
||||||||||||||||
| Revenue prior to foreign currency impact |
1,744,239 | 1,689,686 | 54,553 | 3.2% | ||||||||||||
| Foreign currency impact |
58,223 | |||||||||||||||
| U.S. Commercial and State Government revenue |
1,802,462 | 1,689,686 | 112,776 | 6.7% | ||||||||||||
| U.S. Federal |
||||||||||||||||
| Revenue prior to foreign currency impact |
1,569,083 | 1,458,741 | 110,342 | 7.6% | ||||||||||||
| Foreign currency impact |
52,904 | |||||||||||||||
| U.S. Federal revenue |
1,621,987 | 1,458,741 | 163,246 | 11.2% | ||||||||||||
| U.K. and Australia |
||||||||||||||||
| Revenue prior to foreign currency impact |
1,380,231 | 1,342,662 | 37,569 | 2.8% | ||||||||||||
| Foreign currency impact |
(28,238 | ) | ||||||||||||||
| U.K. and Australia revenue |
1,351,993 | 1,342,662 | 9,331 | 0.7% | ||||||||||||
| Central and Eastern Europe |
||||||||||||||||
| Revenue prior to foreign currency impact |
1,187,715 | 1,027,055 | 160,660 | 15.6% | ||||||||||||
| Foreign currency impact |
(25,122 | ) | ||||||||||||||
| Central and Eastern Europe revenue |
1,162,593 | 1,027,055 | 135,538 | 13.2% | ||||||||||||
| Asia Pacific |
||||||||||||||||
| Revenue prior to foreign currency impact |
565,337 | 521,350 | 43,987 | 8.4% | ||||||||||||
| Foreign currency impact |
(1,978 | ) | ||||||||||||||
| Asia Pacific revenue |
563,359 | 521,350 | 42,009 | 8.1% | ||||||||||||
| CGI Inc. - Management’s Discussion and Analysis for the year ended September 30, 2019 | Page 18 |
For the year ended September 30, 2019, revenue was $12,111.2 million, an increase of $604.4 million, or 5.3% over the same period last year. On a constant currency basis, revenue increased by $674.1 million or 5.9%. Foreign currency rate fluctuations unfavourably impacted our revenue by $69.7 million. The increase in revenue was mostly due to organic growth, primarily within the MRD and government vertical markets, and recent business acquisitions.
3.4.1. Western and Southern Europe
For the year ended September 30, 2019, revenue in our Western and Southern Europe segment was $2,019.7 million, an increase of $23.9 million or 1.2% over the same period last year. On a constant currency basis, revenue increased by $65.7 million or 3.3%. The increase in revenue was the result of organic growth in France across most vertical markets, predominantly in MRD, partly offset by the performance of our Southern Europe and Brazil operations.
On a client geographic basis, the top two Western and Southern Europe vertical markets were MRD and financial services, generating combined revenues of approximately $1,290 million for the year ended September 30, 2019.
3.4.2. Northern Europe
For the year ended September 30, 2019, revenue in our Northern Europe segment was $1,877.3 million, an increase of $76.8 million or 4.3% over the same period last year. On a constant currency basis, revenue increased by $149.8 million or 8.3%. The increase was mainly driven by the Acando acquisition.
On a client geographic basis, the top two Northern Europe vertical markets were MRD and government, generating combined revenues of approximately $1,250 million for the year ended September 30, 2019.
3.4.3. Canada
For the year ended September 30, 2019, revenue in our Canada segment was $1,711.9 million, an increase of $40.9 million or 2.4% compared to the same period last year. On a constant currency basis, revenue increased by $40.5 million or 2.4%. The increase was mostly due to organic growth and higher IP license sales and related services, notably within the financial services and government vertical markets. This was in part offset by the decrease in work volume within the communications & utilities vertical market.
On a client geographic basis, the top two Canada vertical markets were financial services and communications & utilities, generating combined revenues of approximately $1,169 million for the year ended September 30, 2019.
3.4.4. U.S. Commercial and State Government
For the year ended September 30, 2019, revenue in our U.S. Commercial and State Government segment was $1,802.5 million, an increase of $112.8 million or 6.7% over the same period last year. On a constant currency basis, revenue increased by $54.6 million or 3.2%. The increase was mainly driven by higher IP license sales and related services, primarily within the financial services vertical market, combined with organic growth within the government vertical market.
On a client geographic basis, the top two U.S. Commercial and State Government vertical markets were financial services and government, generating combined revenues of approximately $1,088 million for the year ended September 30, 2019.
3.4.5. U.S. Federal
For the year ended September 30, 2019, revenue in our U.S. Federal segment was $1,622.0 million, an increase of $163.2 million or 11.2% over the same period last year. On a constant currency basis, revenue increased by $110.3 million or 7.6%. The increase was driven by new business mainly related to our IP solutions, application support and cybersecurity services. This was partly offset by lower business process services.
For the year ended September 30, 2019, 80% of revenues within the U.S. Federal segment were federal civilian based.
| CGI Inc. - Management’s Discussion and Analysis for the year ended September 30, 2019 | Page 19 |
3.4.6. U.K. and Australia
For the year ended September 30, 2019, revenue in our U.K. and Australia segment was $1,352.0 million, an increase of $9.3 million or 0.7% over the same period last year. On a constant currency basis, revenue increased by $37.6 million or 2.8%. The increase in revenue was due to organic growth within the government vertical market and higher IP license sales and related services within the financial services vertical market. This was partly offset by an unfavourable adjustment on a client contract.
On a client geographic basis, the top two U.K. and Australia vertical markets were government and communications & utilities, generating combined revenues of approximately $1,060 million for the year ended September 30, 2019.
3.4.7. Central and Eastern Europe
For the year ended September 30, 2019, revenue in our Central and Eastern Europe segment was $1,162.6 million, an increase of $135.5 million or 13.2% over the same period last year. On a constant currency basis, revenue increased by $160.7 million or 15.6%. The increase in revenue was mainly driven by organic growth in Germany and the Netherlands, primarily within the MRD, government and communications & utilities vertical markets and by recent acquisitions.
On a client geographic basis, the top two Central and Eastern Europe vertical markets were MRD and communications & utilities, generating combined revenues of approximately $779 million for year ended September 30, 2019.
3.4.8. Asia Pacific
For the year ended September 30, 2019, revenue in our Asia Pacific segment was $563.4 million, an increase of $42.0 million or 8.1% over the same period last year. On a constant currency basis, revenue increased by $44.0 million or 8.4%. The increase is mainly driven by the continued demand for our offshore delivery centers, predominantly within financial services and MRD vertical markets.
| For the years ended September 30, | 2019 | % of Revenue |
2018 | % of Revenue |
$ | % | ||||||||||||||||||
| In thousands of CAD except for percentages |
||||||||||||||||||||||||
| Costs of services, selling and administrative |
10,284,007 | 84.9% | 9,801,791 | 85.2% | 482,216 | 4.9% | ||||||||||||||||||
| Foreign exchange loss |
2,234 | 0.0% | 3,300 | 0.0% | (1,066 | ) | (32.3% | ) | ||||||||||||||||
3.5.1. Costs of Services, Selling and Administrative
For the year ended September 30, 2019, costs of services, selling and administrative expenses amounted to $10,284.0 million, an increase of $482.2 million over the same period last year. As a percentage of revenue, costs of services, selling and administrative expenses decreased to 84.9% from 85.2%. As a percentage of revenue, costs of services remained stable compared to the same period last year as the impact of a higher proportion of IP services and solutions revenue and savings generated by the Restructuring Program compensated for the unfavourable non-recurring adjustments and the temporary slowdown in certain segments, as outlined in section 3.6. of the present document. As a percentage of revenue, selling and administrative expenses improved mainly due to savings generated by the Restructuring Program and benefits of synergies achieved through the integration of business acquisitions.
During the year ended September 30, 2019, the translation of the results of our foreign operations from their local currencies to the Canadian dollar favourably impacted costs by $69.3 million, essentially offsetting the unfavourable translation impact of $69.7 million on our revenue.
| CGI Inc. - Management’s Discussion and Analysis for the year ended September 30, 2019 | Page 20 |
3.5.2. Foreign Exchange Loss
During the year ended September 30, 2019, CGI incurred $2.2 million of foreign exchange losses, mainly driven by the timing of payments combined with the volatility of foreign exchange rates. The Company, in addition to its natural hedges, uses derivatives as a strategy to manage its exposure, to the extent possible.
| Change | ||||||||||||||||
| For the years ended September 30, | ||||||||||||||||
| 2019 | 2018 | $ | % | |||||||||||||
| In thousands of CAD except for percentages |
||||||||||||||||
| Western and Southern Europe |
271,543 | 258,802 | 12,741 | 4.9% | ||||||||||||
| As a percentage of segment revenue |
13.4% | 13.0% | ||||||||||||||
| Northern Europe |
200,116 | 196,823 | 3,293 | 1.7% | ||||||||||||
| As a percentage of segment revenue |
10.7% | 10.9% | ||||||||||||||
| Canada |
349,497 | 363,066 | (13,569 | ) | (3.7% | ) | ||||||||||
| As a percentage of segment revenue |
20.4% | 21.7% | ||||||||||||||
| U.S. Commercial and State Government |
331,135 | 283,571 | 47,564 | 16.8% | ||||||||||||
| As a percentage of segment revenue |
18.4% | 16.8% | ||||||||||||||
| U.S. Federal |
235,262 | 198,140 | 37,122 | 18.7% | ||||||||||||
| As a percentage of segment revenue |
14.5% | 13.6% | ||||||||||||||
| U.K. and Australia |
180,646 | 195,098 | (14,452 | ) | (7.4% | ) | ||||||||||
| As a percentage of segment revenue |
13.4% | 14.5% | ||||||||||||||
| Central and Eastern Europe |
101,749 | 86,428 | 15,321 | 17.7% | ||||||||||||
| As a percentage of segment revenue |
8.8% | 8.4% | ||||||||||||||
| Asia Pacific |
155,047 | 119,806 | 35,241 | 29.4% | ||||||||||||
| As a percentage of segment revenue |
27.5% | 23.0% | ||||||||||||||
| Adjusted EBIT |
1,824,995 | 1,701,734 | 123,261 | 7.2% | ||||||||||||
| Adjusted EBIT margin |
15.1% | 14.8% | ||||||||||||||
For the year ended September 30, 2019, adjusted EBIT margin increased to 15.1% from 14.8% for the same period last year. The increase was mostly due to an improved revenue mix, compensating for the impact of unfavourable non-recurring adjustments, as disclosed below.
3.6.1. Western and Southern Europe
For the year ended September 30, 2019, adjusted EBIT in the Western and Southern Europe segment was $271.5 million, an increase of $12.7 million when compared to the same period last year. Adjusted EBIT margin increased to 13.4% from 13.0%. The increase was due to organic growth in France, partly offset by the performance of our Southern Europe and Brazil operations.
3.6.2. Northern Europe
For the year ended September 30, 2019, adjusted EBIT in the Northern Europe segment was $200.1 million, an increase of $3.3 million when compared to the same period last year. Adjusted EBIT margin was essentially stable as the temporary effects of excess capacity in our Swedish infrastructure business and the dilutive impact of the Acando acquisition were offset by improved utilization in Finland.
3.6.3. Canada
For the year ended September 30, 2019, adjusted EBIT in the Canada segment was $349.5 million, a decrease of $13.6 million when compared to the same period last year. Adjusted EBIT margin decreased to 20.4% from 21.7%, primarily due to cost associated with the optimization and modernization of our infrastructure business and the slowdown of projects and lower
| CGI Inc. - Management’s Discussion and Analysis for the year ended September 30, 2019 | Page 21 |
work volumes within the communications & utilities vertical market. This was partly offset by higher IP license sales and related services within financial services vertical market.
3.6.4. U.S. Commercial and State Government
For the year ended September 30, 2019, adjusted EBIT in the U.S. Commercial and State Government segment was $331.1 million, an increase of $47.6 million when compared to the same period last year. Adjusted EBIT margin increased to 18.4% from 16.8%. The increase was mainly due to an improved revenue mix, primarily as a result of higher IP license sales and related services.
3.6.5. U.S. Federal
For the year ended September 30, 2019, adjusted EBIT in the U.S. Federal segment was $235.3 million, an increase of $37.1 million when compared to the same period last year. Adjusted EBIT margin increased to 14.5% from 13.6% compared to the same period last year, primarily due to the improved revenue mix described in the revenue section.
3.6.6. U.K. and Australia
For the year ended September 30, 2019, adjusted EBIT in the U.K. and Australia segment was $180.6 million, a decrease of $14.5 million when compared to the same period last year. Adjusted EBIT margin decreased to 13.4% from 14.5%. An improved business mix combined with lower costs helped compensate for both the unfavourable impact of the equalization of pensionable services and client contracts adjustments. The change in adjusted EBIT margin was also impacted by a favourable client provision release in Q1 2018.
3.6.7. Central and Eastern Europe
For the year ended September 30, 2019, adjusted EBIT in the Central and Eastern Europe segment was $101.7 million, an increase of $15.3 million when compared to the same period last year. Adjusted EBIT margin increased to 8.8% from 8.4% last year. The increase in Adjusted EBIT was mainly driven by improved profitability in the Netherlands, in part offset by lower demand from a financial services client.
3.6.8. Asia Pacific
For the year ended September 30, 2019, adjusted EBIT in the Asia Pacific segment was $155.0 million, an increase of $35.2 million when compared to the same period last year. Adjusted EBIT margin increased to 27.5% from 23.0% last year. The increase in adjusted EBIT margin was mostly due to productivity improvements and automation efforts, as well as the favourable impact of our currency forward contracts.
| CGI Inc. - Management’s Discussion and Analysis for the year ended September 30, 2019 | Page 22 |
3.7. EARNINGS BEFORE INCOME TAXES
The following table provides a reconciliation between our adjusted EBIT and earnings before income taxes, which is reported in accordance with IFRS.
| Change | ||||||||||||||||||||||||
| For the years ended September 30, | % of | % of | ||||||||||||||||||||||
| 2019 | Revenue | 2018 | Revenue | $ | % | |||||||||||||||||||
| In thousands of CAD except for percentage |
||||||||||||||||||||||||
| Adjusted EBIT |
1,824,995 | 15.1 | % | 1,701,734 | 14.8 | % | 123,261 | 7.2 | % | |||||||||||||||
| Minus the following items: |
||||||||||||||||||||||||
| Acquisition-related and integration costs |
77,417 | 0.6 | % | 37,482 | 0.3 | % | 39,935 | 106.5 | % | |||||||||||||||
| Restructuring costs |
— | — | 100,387 | 0.9 | % | (100,387 | ) | (100.0 | %) | |||||||||||||||
| Net finance costs |
70,630 | 0.6 | % | 73,885 | 0.6 | % | (3,255 | ) | (4.4 | %) | ||||||||||||||
| Earnings before income taxes |
1,676,948 | 13.8 | % | 1,489,980 | 12.9 | % | 186,968 | 12.5 | % | |||||||||||||||
3.7.1. Acquisition-Related and Integration Costs
For the year ended September 30, 2019, the Company incurred $77.4 million of acquisition-related and integration costs, mainly in connection with the integration of the Acando and ckc operations to the CGI operating model. These costs are mainly related to severances, leases of vacated premises and professional fees.
3.7.2. Restructuring Costs
In Q4 2018, the Company completed the previously announced restructuring program (the Restructuring Program) for a total cost of $189.0 million, of which the remaining $100.4 million was expensed during the year ended September 30, 2018. These amounts include restructuring costs for termination of employment, leases of vacated premises, as well as other restructuring costs.
3.7.3. Net Finance Costs
Net finance costs mainly include interest on our long-term debt. For the year ended September 30, 2019 the decrease in net finance costs of $3.3 million was mainly due to less interest charges related to our unsecured notes and additional interest income from our financial assets. This was partially offset by interest expense related to the settlement of a client contract in our Northern Europe segment and the increase in utilization of our unsecured committed revolving credit facility.
| CGI Inc. - Management’s Discussion and Analysis for the year ended September 30, 2019 | Page 23 |
3.8. NET EARNINGS AND EARNINGS PER SHARE
The following table sets out the information supporting the earnings per share calculations:
| Change | ||||||||||||||||
| For the years ended September 30, | 2019 | 2018 | $ | % | ||||||||||||
| In thousands of CAD except for percentage and shares data |
||||||||||||||||
| Earnings before income taxes |
1,676,948 | 1,489,980 | 186,968 | 12.5% | ||||||||||||
| Income tax expense |
413,741 | 348,578 | 65,163 | 18.7% | ||||||||||||
| Effective tax rate |
24.7% | 23.4% | ||||||||||||||
|
Net earnings |
1,263,207 | 1,141,402 | 121,805 | 10.7% | ||||||||||||
| Net earnings margin |
10.4% | 9.9% | ||||||||||||||
| Weighted average number of shares outstanding |
||||||||||||||||
| Class A subordinate voting shares and Class B multiple voting shares (basic) |
272,719,309 | 283,878,426 | (3.9% | ) | ||||||||||||
| Class A subordinate voting shares and Class B multiple voting shares (diluted)
|
277,785,725 | 288,858,580 | (3.8% | ) | ||||||||||||
|
Earnings per share (in dollars) |
||||||||||||||||
| Basic |
4.63 | 4.02 | 0.61 | 15.2% | ||||||||||||
| Diluted |
4.55 | 3.95 | 0.60 | 15.2% | ||||||||||||
3.8.1. Income Tax Expense
For the year ended September 30, 2019, the income tax expense was $413.7 million compared to $348.6 million over the same period last year, while our effective tax rate increased to 24.7% from 23.4%. During the quarter ended September 30, 2019, the Company settled with the German tax authorities and booked $115.5 million of additional corporate tax losses, and recorded a $18.5 million income tax recovery. The prior year effective tax rate was impacted by a net favourable tax recovery of $34.1 million, resulting from the U.S. tax reform, a temporary corporate surtax in France and a tax rate reduction in Belgium. When excluding these tax adjustments and the tax effects from acquisition-related and integration costs and restructuring costs, the effective tax rate would have been 25.6% for both financial years.
The table in section 3.8.3. shows the year-over-year comparison of the tax rate with the impact of specific items removed.
Based on the enacted rates at the end of Fiscal 2019 and our current business mix, we expect our effective tax rate before any significant adjustments to be in the range of 24.5% to 26.5% in subsequent periods.
3.8.2. Weighted Average Number of Shares
For Fiscal 2019, CGI’s basic and diluted weighted average number of shares decreased compared to Fiscal 2018 due to the impact of the purchase for cancellation of Class A Shares, partly offset by the grant and the exercise of stock options.
| CGI Inc. - Management’s Discussion and Analysis for the year ended September 30, 2019 | Page 24 |
3.8.3. Net Earnings and Earnings per Share Excluding Specific Items
Below is a table showing the year-over-year comparison excluding specific items namely, acquisition-related and integration costs, restructuring costs, and tax adjustments:
| Change | ||||||||||||||||
| 2019 | 2018 | $ | % | |||||||||||||
| In thousands of CAD except for percentages and shares data |
||||||||||||||||
| Earnings before income taxes |
1,676,948 | 1,489,980 | 186,968 | 12.5% | ||||||||||||
| Add back: |
||||||||||||||||
| Acquisition-related and integration costs |
77,417 | 37,482 | 39,935 | 106.5% | ||||||||||||
| Restructuring costs |
— | 100,387 | (100,387 | ) | (100.0% | ) | ||||||||||
| Earnings before income taxes excluding specific items |
1,754,365 | 1,627,849 | 126,516 | 7.8% | ||||||||||||
| Margin |
14.5% | 14.1% | ||||||||||||||
| Income tax expense |
413,741 | 348,578 | 65,163 | 18.7% | ||||||||||||
| Add back: |
||||||||||||||||
| Tax deduction on acquisition-related and integration costs |
16,307 | 7,922 | 8,385 | 105.8% | ||||||||||||
| Tax deduction on restructuring costs |
— | 26,526 | (26,526 | ) | (100.0% | ) | ||||||||||
| Tax adjustment |
18,451 | 34,100 | (15,649 | ) | (45.9% | ) | ||||||||||
| Income tax expense excluding specific items |
448,499 | 417,126 | 31,373 | 7.5% | ||||||||||||
| Effective tax rate excluding specific items |
25.6% | 25.6% | ||||||||||||||
| Net earnings excluding specific items |
1,305,866 | 1,210,723 | 95,143 | 7.9% | ||||||||||||
| Net earnings margin excluding specific items |
10.8% | 10.5% | ||||||||||||||
| Weighted average number of shares outstanding |
||||||||||||||||
| Class A subordinate voting shares and Class B multiple voting shares (basic) |
272,719,309 | 283,878,426 | (3.9% | ) | ||||||||||||
| Class A subordinate voting shares and Class B multiple voting shares (diluted) |
277,785,725 | 288,858,580 | (3.8% | ) | ||||||||||||
| Earnings per share excluding specific items (in dollars) |
||||||||||||||||
| Basic |
4.79 | 4.26 | 0.53 | 12.4% | ||||||||||||
| Diluted |
4.70 | 4.19 | 0.51 | 12.2% | ||||||||||||
| CGI Inc. - Management’s Discussion and Analysis for the year ended September 30, 2019 | Page 25 |
4. Liquidity
4.1. CONSOLIDATED STATEMENTS OF CASH FLOWS
CGI’s growth is financed through a combination of cash flow from operations, borrowing under our existing credit facility, the issuance of long-term debt, and the issuance of equity. One of our financial priorities is to maintain an optimal level of liquidity through the active management of our assets and liabilities as well as our cash flows.
As at September 30, 2019, cash and cash equivalents were $213.8 million. The following table provides a summary of the generation and use of cash for the years ended September 30, 2019 and 2018.
| For the years ended September 30, | 2019 | 2018 | Change | |||||||||
| In thousands of CAD |
||||||||||||
| Cash provided by operating activities |
1,633,919 | 1,493,408 | 140,511 | |||||||||
| Cash used in investing activities |
(950,809 | ) | (577,418 | ) | (373,391 | ) | ||||||
| Cash used in financing activities |
(629,109 | ) | (879,044 | ) | 249,935 | |||||||
| Effect of foreign exchange rate changes on cash and cash equivalents |
(24,261 | ) | (18,727 | ) | (5,534 | ) | ||||||
|
Net increase in cash and cash equivalents
|
|
29,740
|
|
|
18,219
|
|
|
11,521
|
| |||
4.1.1. Cash Provided by Operating Activities
For the year ended September 30, 2019, cash provided by operating activities was $1,633.9 million or 13.5% of revenue compared to $1,493.4 million or 13.0% for the same period last year.
The following table provides a summary of the generation and use of cash from operating activities:
| For the years ended September 30, | 2019 | 2018 | Change | |||||||||
| In thousands of CAD |
||||||||||||
| Net earnings |
1,263,207 | 1,141,402 | 121,805 | |||||||||
| Amortization and depreciation |
392,301 | 392,675 | (374 | ) | ||||||||
| Other adjustments1 |
34,662 | (2,432 | ) | 37,094 | ||||||||
| Cash flow from operating activities before net change in non-cash working capital items |
1,690,170 | 1,531,645 | 158,525 | |||||||||
| Net change in non-cash working capital items: |
||||||||||||
| Accounts receivable, work in progress and deferred revenue |
21,859 | (159,609 | ) | 181,468 | ||||||||
| Accounts payable and accrued liabilities, accrued compensation, provisions and long-term liabilities |
(21,620 | ) | 79,322 | (100,942 | ) | |||||||
| Other2 |
(56,490 | ) | 42,050 | (98,540 | ) | |||||||
| Net change in non-cash working capital items |
(56,251 | ) | (38,237 | ) | (18,014 | ) | ||||||
|
Cash provided by operating activities
|
|
1,633,919
|
|
|
1,493,408
|
|
|
140,511
|
| |||
| 1 | Comprised of deferred income taxes, foreign exchange loss and share-based payment costs. |
| 2 | Comprised of prepaid expenses and other assets, long-term financial assets, retirement benefits obligations, derivative financial instruments and income taxes. |
For the year ended September 30, 2019, the net change in non-cash working capital items of $56.3 million was mostly due to the timing of accounts payable, income tax payments and collection of tax credits, partially offset by the decrease in our DSO from 52 days in Q4 2018 to 50 days in Q4 2019.
The timing of our working capital inflows and outflows will always have an impact on the cash flow from operations.
| CGI Inc. - Management’s Discussion and Analysis for the year ended September 30, 2019 | Page 26 |
4.1.2. Cash Used in Investing Activities
For the year ended September 30, 2019, $950.8 million was used in investing activities while $577.4 million was used over the prior year.
The following table provides a summary of the use of cash from investing activities:
| For the years ended September 30, | 2019 | 2018 | Change | |||||||||
| In thousands of CAD |
||||||||||||
| Business acquisitions and Investment in a step acquisition |
(620,014 | ) | (244,637 | ) | (375,377 | ) | ||||||
| Purchase of property, plant and equipment |
(162,061 | ) | (143,250 | ) | (18,811 | ) | ||||||
| Additions to contract costs |
(60,191 | ) | (87,420 | ) | 27,229 | |||||||
| Additions to intangible assets |
(105,976 | ) | (95,451 | ) | (10,525 | ) | ||||||
| Net change in short-term investments and purchase of long-term investments |
(2,567 | ) | (6,660 | ) | 4,093 | |||||||
| Cash used in investing activities |
(950,809 | ) | (577,418 | ) | (373,391 | ) | ||||||
The increase of $373.4 million in cash used in investing activities during the year ended September 30, 2019 was mainly due to the increase in cash used for acquisitions throughout the year. It was also due to an increase of investments in leasehold improvements and business solutions, partially offset by a decrease in cash used for contract costs.
4.1.3. Cash Used in Financing Activities
For the year ended September 30, 2019, $629.1 million was used in financing activities while $879.0 million was used over the same period last year.
The following table provides a summary of the generation and use of cash from financing activities:
| For the years ended September 30, | 2019 | 2018 | Change | |||||||||
| In thousands of CAD |
||||||||||||
| Net change in unsecured committed revolving credit facility |
139,575 | (5,205 | ) | 144,780 | ||||||||
| Net change in long-term debt |
331,404 | (101,660 | ) | 433,064 | ||||||||
| 470,979 | (106,865 | ) | 577,844 | |||||||||
| Repayment of debt assumed from business acquisitions |
(2,141 | ) | (28,609 | ) | 26,468 | |||||||
| Purchase of Class A subordinate voting shares held in trusts |
(30,740 | ) | (24,789 | ) | (5,951 | ) | ||||||
| Settlement of derivative financial instruments |
(554 | ) | (2,430 | ) | 1,876 | |||||||
| Resale of class A subordinate voting shares held in trust |
— | 528 | (528 | ) | ||||||||
| Purchase and cancellation of Class A subordinate voting shares |
(1,130,255 | ) | (794,076 | ) | (336,179 | ) | ||||||
| Issuance of Class A subordinate voting shares |
63,602 | 77,197 | (13,595 | ) | ||||||||
| Cash used in financing activities |
(629,109 | ) | (879,044 | ) | 249,935 | |||||||
For the year ended September 30, 2019, we drew $139.6 million under the unsecured committed revolving credit facility and we entered into a five-year unsecured committed term loan credit facility of $670.0 million (swapped into euro currency). The proceeds of the credit facility and term loan were used to repay the scheduled repayments of the Senior unsecured notes in the amount of $306.8 million, used to invest in business acquisitions and in the purchase for cancellation of class A shares. For the year ended September 30, 2018, $101.7 million was used to reduce our outstanding debt, mainly driven by the scheduled repayment of the Senior U.S. unsecured notes, while $28.6 million was used to repay debt assumed from the previous year’s business acquisitions.
For the year ended September 30, 2019, $30.7 million was used to purchase Class A Shares in connection with the Company’s Performance Share Unit Plans (PSU Plans) compared to $24.8 million during the year ended September 30, 2018. More information concerning the PSU Plans can be found in note 19 of the audited consolidated financial statements.
For the year ended September 30, 2019, $1,130.3 million was used to pay for the purchase for cancellation of 12,510,232 Class A Shares, compared to $794.1 million for the purchase for cancellation of 10,325,879 Class A Shares last year.
| CGI Inc. - Management’s Discussion and Analysis for the year ended September 30, 2019 | Page 27 |
Finally, for the year ended September 30, 2019, we received $63.6 million in proceeds from the exercise of stock options, compared to $77.2 million during the year ended September 30, 2018.
4.1.4. Effect of Foreign Exchange Rate Changes on Cash and Cash Equivalents
For the year ended September 30, 2019, the effect of foreign exchange rate changes on cash and cash equivalents had an unfavourable impact of $24.3 million. This amount had no effect on net earnings as it was recorded in other comprehensive income.
| CGI Inc. - Management’s Discussion and Analysis for the year ended September 30, 2019 | Page 28 |
| As at September 30, 2019 | Available | |||
| In thousands of CAD |
||||
| Cash and cash equivalents |
213,831 | |||
| Short-term investments |
9,889 | |||
| Long-term investments |
24,596 | |||
| $1.5 billion unsecured committed revolving credit facility1 |
1,155,369 | |||
| Total |
1,403,685 | |||
| 1 | As at September 30, 2019, letters of credit in the amount of $9.6 million were outstanding against the $1.5 billion unsecured committed revolving credit facility. |
Our cash position and bank lines are sufficient to support our growth strategy. As at September 30, 2019, cash and cash equivalents and investments represented $248.3 million.
Cash equivalents include term deposits, all with maturities of 90 days or less. Long-term investments include corporate and government bonds with maturities ranging from one to five years, with a credit rating of A or higher.
As at September 30, 2019, the aggregate amount of the capital resources available to the Company was $1,403.7 million. The long-term debt agreements contain covenants, which require us to maintain certain financial ratios. As at September 30, 2019, CGI was in compliance with these covenants.
Total debt increased by $530.3 million to $2,331.2 million as at September 30, 2019, compared to $1,800.9 million as at September 30, 2018. The variance was mainly due to the $670.0 million (US $500.0 million) received through the five-year unsecured committed term loan credit facility, net change in the unsecured committed revolving credit facility of $139.6 million and a foreign exchange translation impact of $22.0 million, partly offset by scheduled repayments of the unsecured notes in the amount of $306.8 million.
As at September 30, 2019, CGI was showing a positive working capital2 of $373.3 million. The Company also had $1,155.4 million available under its unsecured committed revolving credit facility and is generating a significant level of cash, which will allow it to fund its operations while maintaining adequate levels of liquidity. On November 5, 2019, the unsecured committed revolving facility was extended by one year to December 2024 and can be further extended. There were no material changes in the terms and conditions.
As at September 30, 2019, the cash and cash equivalents held by foreign subsidiaries were $149.1 million ($142.4 million as at September 30, 2018). The tax implications and impact related to its repatriation will not materially affect the Company’s liquidity.
| 2 | Working capital is defined as total current assets minus total current liabilities. |
| CGI Inc. - Management’s Discussion and Analysis for the year ended September 30, 2019 | Page 29 |
We are committed under the terms of contractual obligations which have various expiration dates, primarily for the rental of premises, computer equipment used in managed IT and business process services contracts and long-term service agreements. For the year ended September 30, 2019, the Company increased its commitments by $650.7 million mainly due to the increase of long-term debt.
| Commitment type
|
Total
|
Less than 1 year |
Between 1 and 2 years |
Between 2 and 5 years |
Beyond 5 years |
|||||||||||||||
| In thousands of CAD |
||||||||||||||||||||
| Long-term debt |
2,299,997 | 99,410 | 270,393 | 1,929,603 | 591 | |||||||||||||||
| Estimated interest on long-term debt |
300,150 | 81,030 | 78,980 | 140,140 | — | |||||||||||||||
| Finance lease obligations |
30,339 | 14,086 | 11,303 | 4,950 | — | |||||||||||||||
| Estimated interest on finance lease obligations |
906 | 448 | 282 | 176 | — | |||||||||||||||
| Operating leases |
||||||||||||||||||||
| Rental of office space (excluding cost of services and taxes) |
727,551 | 148,375 | 126,842 | 281,103 | 171,231 | |||||||||||||||
| Computer equipment |
1,545 | 949 | 419 | 177 | — | |||||||||||||||
| Vehicles |
118,406 | 38,797 | 28,270 | 51,339 | — | |||||||||||||||
| Long-term service agreements and other |
211,845 | 113,840 | 79,252 | 18,753 | — | |||||||||||||||
| Total |
3,690,739 | 496,935 | 595,741 | 2,426,241 | 171,822 | |||||||||||||||
The periods in the above table were aligned to the Company’s audited consolidated financial statements.
Our required benefit plan contributions have not been included in this table as such contributions depend on periodic actuarial valuations for funding purposes. Our contributions to defined benefit plans are estimated at $25.2 million for Fiscal 2019 as described in note 16 of the audited consolidated financial statements.
4.4. FINANCIAL INSTRUMENTS AND HEDGING TRANSACTIONS
We use various financial instruments to help us manage our exposure to fluctuations of foreign currency exchange rates and interest rates. Please refer to notes 3 and 30 of our audited consolidated financial statements for additional information on our financial instruments and hedging transactions.
| CGI Inc. - Management’s Discussion and Analysis for the year ended September 30, 2019 | Page 30 |
4.5. SELECTED MEASURES OF CAPITAL RESOURCES AND LIQUIDITY
| As at September 30, |
2019 |
2018 |
||||||
| In thousands of CAD except for percentages |
||||||||
| Reconciliation between net debt and long-term debt including the current portion: |
||||||||
| Net debt |
2,117,229 | 1,640,814 | ||||||
| Add back: |
||||||||
| Cash and cash equivalents |
213,831 | 184,091 | ||||||
| Short-term investments |
9,889 | — | ||||||
| Long-term investments |
24,596 | 30,054 | ||||||
| Fair value of foreign currency derivative financial instruments related to debt |
(34,338 | ) | (54,066 | ) | ||||
| Long-term debt including the current portion |
2,331,207 | 1,800,893 | ||||||
| Net debt to capitalization ratio |
22.9 | % | 19.2% | |||||
| Return on equity |
18.5 | % | 17.3% | |||||
| Return on invested capital |
15.1 | % | 14.5% | |||||
| Days sales outstanding |
50 | 52 | ||||||
We use the net debt to capitalization ratio as an indication of our financial leverage in order to realize our Build and Buy strategy (please refer to section 1.2 of the present document for additional information on our Build and Buy strategy). The net debt to capitalization ratio increased to 22.9% in Fiscal 2019 from 19.2% in Fiscal 2018. The change in the net debt to capitalization ratio was mostly due to an increase in long-term debt following the investment in our business acquisitions and in the purchase for cancellation of class A shares.
ROE is a measure of the return we are generating for our shareholders. ROE increased to 18.5% in Q4 2019 from 17.3% in Fiscal 2018. The increase was mainly due to higher net earnings over the last four quarters and the purchase for cancellation of class A shares.
ROIC is a measure of the Company’s efficiency in allocating the capital under our control to profitable investments. The return on invested capital ratio increased to 15.1% in Fiscal 2019 from 14.5% in Fiscal 2018. The improvement in the ROIC was mainly the result of our higher net earnings excluding net finance costs after-tax over the last four quarters.
DSO decreased to 50 days at the end of Fiscal 2019 when compared to 52 days in Fiscal 2018. In calculating the DSO, we subtract the deferred revenue balance from trade accounts receivable and work in progress; for that reason, the timing of payments received from managed IT and business process services clients in advance of the work to be performed and the timing of payments related to project milestones can affect the DSO. The Company maintains a target DSO of 45 days.
4.6. OFF-BALANCE SHEET FINANCING AND GUARANTEES
In the normal course of operations, CGI uses off-balance sheet financing for a variety of transactions such as operating leases for office space, computer equipment and vehicles. From time to time, we also enter into agreements to provide financial or performance assurances to third parties on the sale of assets, business divestitures and guarantees on government and commercial contracts.
In connection with sales of assets and business divestitures, we may be required to pay counterparties for costs and losses incurred as a result of breaches in our contractual obligations, representations and warranties, intellectual property right infringement and litigation against counterparties, among others. While some of the agreements specify a maximum potential exposure of approximately $8.9 million, others do not specify a maximum amount or limited period. It is not possible to reasonably estimate the maximum amount that may have to be paid under such guarantees. The amounts are dependent upon the outcome of future contingent events, the nature and likelihood of which cannot be determined at this time. The Company does not expect to incur any potential payment in connection with these guarantees that could have a materially adverse effect on its audited consolidated financial statements.
In the normal course of business, we may provide certain clients, principally governmental entities, with bid and performance bonds. In general, we would only be liable for the amount of the bid bonds if we refuse to perform the project once we are
| CGI Inc. - Management’s Discussion and Analysis for the year ended September 30, 2019 | Page 31 |
awarded the bid. We would also be liable for the performance bonds in the event of a default in the performance of our obligations. As at September 30, 2019, we had committed a total of $33.7 million for these bonds. To the best of our knowledge, we complied with our performance obligations under all service contracts for which there was a performance or bid bond, and the ultimate liability, if any, incurred in connection with these guarantees would not have a material adverse effect on our consolidated results of operations or financial condition.
4.7. CAPABILITY TO DELIVER RESULTS
The Company has sufficient capital resources coming from its cash provided by operating activities, credit facilities, long-term debt agreements and invested capital from shareholders to support ongoing business operations and execute the Build and Buy growth strategy. Our principal and most accretive uses of cash are: to invest in our business (procuring new large managed IT and business process services and managed services contracts and developing business and IP solutions); to pursue accretive acquisitions; to purchase for cancellation Class A Shares and pay down debt. In terms of financing, we are well positioned to continue executing our four-pillar growth strategy in Fiscal 2020.
To successfully implement the Company’s strategy, CGI relies on a strong leadership team, supported by highly knowledgeable members with relevant relationships and significant experience in both IT and our targeted industries. CGI fosters leadership development through the CGI Leadership Institute ensuring continuity and knowledge transfer across the organization. For key positions, a detailed succession plan is established and revised frequently.
As a Company built on human capital, our professionals and their knowledge are critical to delivering quality service to our clients. Our human resources program allows us to attract and retain the best talent as it provides competitive compensation and benefits, a favourable working environment, training programs and career development opportunities. Employee satisfaction is monitored annually through a Company-wide survey. Also, a majority of our consultants and professionals are owners of CGI through our Share Purchase Plan which, along with the Profit Participation Plan, allow them to share Company successes, further aligning stakeholders interests.
In addition to capital resources and talent, CGI has established the Management Foundation encompassing governance policies, organizational model and sophisticated management frameworks for its business units and corporate processes. This robust governance model, provides a common business language for managing all operations consistently across the globe, driving a focus on continuous improvement. CGI’s operations maintain appropriate certifications in accordance with service requirements such as the ISO and the Capability Maturity Model Integration (CMMI) certification programs.
| CGI Inc. - Management’s Discussion and Analysis for the year ended September 30, 2019 | Page 32 |
| 5. | Fourth Quarter Results (Unaudited) |
5.1. BOOKINGS AND BOOK-TO-BILL RATIO
Bookings for the quarter ended September 30, 2019 were $3.4 billion representing a book-to-bill ratio of 115.2%. The breakdown of the new bookings signed during the quarter is as follows:
|
|
|
|
| |||||||||||||||||||||||||
|
Contract Type |
Service Type |
Segment |
Vertical Market | |||||||||||||||||||||||||
| A. |
Extensions, renewals and add-ons | 80% | A. | Managed IT and Business Process Services | 53% | A. | U.S. Commercial and State Government | 29% | A. | Government | 31% | |||||||||||||||||
| B. |
New business | 20% | B. | U.S. Federal | 17% | B. | Financial Services | 24% | ||||||||||||||||||||
| B. | System integration and consulting | 47% | C. | Northern Europe | 12% | C. | MRD | 20% | ||||||||||||||||||||
| D. | Western and Southern Europe | 12% | D | Health | 16% | |||||||||||||||||||||||
| E. | U.K. and Australia | 11% | E | Communication & Utilities | 9% | |||||||||||||||||||||||
| F. | Canada | 10% | ||||||||||||||||||||||||||
| G. | Central and Eastern | 9% | ||||||||||||||||||||||||||
Information regarding our bookings is a key indicator of the volume of our business over time. However, due to the timing and transition period associated with managed IT and business process services contracts, the realization of revenue related to these bookings may fluctuate from period to period. The values initially booked may change over time due to their variable attributes, including demand-driven usage, modifications in the scope of work to be performed caused by changes in client requirements as well as termination clauses at the option of the client. As such, information regarding our bookings is not comparable to, nor should it be substituted for, an analysis of our revenue. Management however believes that it is a key indicator of potential future revenue.
The following table provides a summary of the bookings and book-to-bill ratio by segment:
| In thousands of CAD except for percentages |
Bookings for the three months ended September 30, 2019 |
Bookings for the year ended September 30, 2019 |
Book-to-bill ratio for the year ended September 30, 2019 | |||||||
| Total CGI |
3,409,260 | 12,646,027 | 104.4% | |||||||
| Western and Southern Europe |
409,670 | 2,057,093 | 101.5% | |||||||
| Northern Europe |
426,818 | 2,254,359 | 113.8% | |||||||
| Canada |
331,530 | 1,556,634 | 82.9% | |||||||
| U.S. Commercial and State Government |
997,657 | 2,436,044 | 133.1% | |||||||
| U.S. Federal |
574,875 | 1,545,255 | 93.9% | |||||||
| U.K. and Australia |
370,463 | 1,466,935 | 94.0% | |||||||
| Central and Eastern Europe |
298,247 | 1,329,707 | 111.7% | |||||||
| CGI Inc. - Management’s Discussion and Analysis for the year ended September 30, 2019 | Page 33 |
The Company operates globally and is exposed to changes in foreign currency rates. Accordingly, as prescribed by IFRS, we value assets, liabilities and transactions that are measured in foreign currencies using various exchange rates. We report all dollar amounts in Canadian dollars.
Average foreign exchange rates
| For the three months ended September 30, | 2019 | 2018 | Change | |||||||||
| U.S. dollar |
1.3205 | 1.3072 | 1.0 | % | ||||||||
| Euro |
1.4689 | 1.5204 | (3.4 | %) | ||||||||
| Indian rupee |
0.0188 | 0.0187 | 0.5 | % | ||||||||
| British pound |
1.6285 | 1.7035 | (4.4 | %) | ||||||||
| Swedish krona |
0.1378 | 0.1462 | (5.7 | %) | ||||||||
| CGI Inc. - Management’s Discussion and Analysis for the year ended September 30, 2019 | Page 34 |
The following charts provide additional information regarding our revenue mix for the quarter ended September 30, 2019:
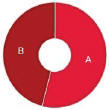
|
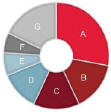
|
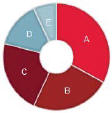
| ||||||||||||
|
Service Type |
Client Geography |
Vertical Market | ||||||||||||
| A. Managed IT and Business Process Services | 54% | A. U.S. | 30% | A. Government | 33% | |||||||||
| B. System integration and consulting | 46% | B. Canada | 15% | B. MRD | 24% | |||||||||
| C. France | 14% | C. Financial services | 22% | |||||||||||
| D. U.K. | 12% | D. Communications & utilities | 14% | |||||||||||
| E. Sweden | 7% | E. Health | 7% | |||||||||||
| F. Finland | 6% | |||||||||||||
| G. Rest of the world | 16% | |||||||||||||
5.3.1. Client Concentration
IFRS guidance on segment disclosures defines a single customer as a group of entities that are known to the reporting entity to be under common control. As a consequence, our work for the U.S. federal government including its various agencies represented 13.7% of our revenue for Q4 2019 as compared to 12.0% for Q4 2018.
| CGI Inc. - Management’s Discussion and Analysis for the year ended September 30, 2019 | Page 35 |
The following table provides a summary of the year-over-year changes in our revenue, in total and by segment, separately showing the impacts of foreign currency exchange rate variations between the Q4 2019 and Q4 2018 periods. The Q4 2018 revenue by segment was recorded reflecting the actual average foreign exchange rates for that period. The foreign exchange impact is the difference between the current period’s actual results and the current period’s results converted with the prior year’s average foreign exchange rates.
| Change
|
||||||||||||||||
| For the three months ended September 30, | 2019 | 2018 | $ | % | ||||||||||||
| In thousands of CAD except for percentages |
||||||||||||||||
| Total CGI revenue |
2,959,230 | 2,798,960 | 160,270 | 5.7 | % | |||||||||||
| Variation prior to foreign currency impact |
7.7% | |||||||||||||||
| Foreign currency impact |
(2.0% | ) | ||||||||||||||
| Variation over previous period |
5.7% | |||||||||||||||
| Western and Southern Europe |
||||||||||||||||
| Revenue prior to foreign currency impact |
491,570 | 475,026 | 16,544 | 3.5 | % | |||||||||||
| Foreign currency impact |
(17,331 | ) | ||||||||||||||
| Western and Southern Europe |
474,239 | 475,026 | (787 | ) | (0.2 | %) | ||||||||||
| Northern Europe |
||||||||||||||||
| Revenue prior to foreign currency impact |
456,931 | 396,369 | 60,562 | 15.3 | % | |||||||||||
| Foreign currency impact |
(22,134 | ) | ||||||||||||||
| Northern Europe |
434,797 | 396,369 | 38,428 | 9.7 | % | |||||||||||
| Canada |
||||||||||||||||
| Revenue prior to foreign currency impact |
415,885 | 418,254 | (2,369 | ) | (0.6 | %) | ||||||||||
| Foreign currency impact |
(132 | ) | ||||||||||||||
| Canada |
415,753 | 418,254 | (2,501 | ) | (0.6 | %) | ||||||||||
| U.S. Commercial and State Government |
||||||||||||||||
| Revenue prior to foreign currency impact |
435,093 | 427,007 | 8,086 | 1.9 | % | |||||||||||
| Foreign currency impact |
4,145 | |||||||||||||||
| U.S. Commercial and State Government revenue |
439,238 | 427,007 | 12,231 | 2.9 | % | |||||||||||
| U.S. Federal |
||||||||||||||||
| Revenue prior to foreign currency impact |
418,124 | 353,686 | 64,438 | 18.2 | % | |||||||||||
| Foreign currency impact |
4,307 | |||||||||||||||
| U.S. Federal revenue |
422,431 | 353,686 | 68,745 | 19.4 | % | |||||||||||
| U.K. and Australia |
||||||||||||||||
| Revenue prior to foreign currency impact |
352,373 | 337,028 | 15,345 | 4.6 | % | |||||||||||
| Foreign currency impact |
(15,818 | ) | ||||||||||||||
| U.K. and Australia revenue |
336,555 | 337,028 | (473 | ) | (0.1 | %) | ||||||||||
| Central and Eastern Europe |
||||||||||||||||
| Revenue prior to foreign currency impact |
302,885 | 259,141 | 43,744 | 16.9 | % | |||||||||||
| Foreign currency impact |
(10,711 | ) | ||||||||||||||
| Central and Eastern Europe revenue |
292,174 | 259,141 | 33,033 | 12.7 | % | |||||||||||
| Asia Pacific |
||||||||||||||||
| Revenue prior to foreign currency impact |
145,784 | 132,449 | 13,335 | 10.1 | % | |||||||||||
| Foreign currency impact |
(1,741 | ) | ||||||||||||||
| Asia Pacific revenue |
144,043 | 132,449 | 11,594 | 8.8 | % | |||||||||||
We ended the fourth quarter of Fiscal 2019 with revenue of $2,959.2 million, an increase of $160.3 million, or 5.7% when compared to the same period of Fiscal 2018. On a constant currency basis, revenue increased by $216.6 million or 7.7%. Foreign currency rate fluctuations unfavourably impacted our revenue by $56.3 million or 2.1%. The increase in revenue was mainly due to organic growth across most of our segments and recent business acquisitions.
| CGI Inc. - Management’s Discussion and Analysis for the year ended September 30, 2019 | Page 36 |
5.4.1. Western and Southern Europe
Revenue in our Western and Southern Europe segment was $474.2 million in Q4 2019, a decrease of $0.8 million or 0.2% over the same period last year. On a constant currency basis, revenue increased by 16.5 million or 3.5%. The increase in revenue was the result of organic growth in France across most vertical markets, predominantly in MRD.
On a client geographic basis, the top two Western and Southern Europe vertical markets were MRD and financial services, generating combined revenues of approximately $304 million for the three months ended September 30, 2019.
5.4.2. Northern Europe
Revenue in our Northern Europe segment was $434.8 million in Q4 2019, an increase of $38.4 million or 9.7% over the same period last year. On a constant currency basis, revenue increased by $60.6 million or 15.3%. The increase was mainly driven by the Acando acquisition and higher system integration and consulting services in Finland.
On a client geographic basis, the top two Northern Europe vertical markets were MRD and government, generating combined revenues of approximately $296 million for the three months ended September 30, 2019.
5.4.3. Canada
Revenue in our Canada segment was $415.8 million in Q4 2019, a decrease of $2.5 million or 0.6% over the same period last year, and essentially the same on a constant currency basis. The change in revenue was primarily due to completed projects and lower work volumes within the communication & utilities and MRD vertical markets. This was in part offset by higher IP license sales and related services, as well as organic growth within the financial services vertical market.
On a client geographic basis, the top two Canada vertical markets were financial services and MRD, generating combined revenues of approximately $287 million for the three months ended September 30, 2019.
5.4.4. U.S. Commercial and State Government
Revenue from our U.S. Commercial and State Government segment was $439.2 million in Q4 2019, an increase of $12.2 million or 2.9% compared to the same period last year. On a constant currency basis, revenue increased by $8.1 million or 1.9%. The increase was mainly driven by organic growth within the government and financial services vertical markets.
On a client geographic basis, the top two U.S. Commercial and State Government vertical markets were financial services and government, generating combined revenues of approximately $276 million for the three months ended September 30, 2019.
5.4.5. U.S. Federal
Revenue in our U.S. Federal segment was $422.4 million in Q4 2019, an increase of $68.7 million or 19.4% over the same period last year. On a constant currency basis, revenue increased by $64.4 million or 18.2%. The increase was driven by new business mainly related to our IP solutions, application support and cybersecurity services and to a lesser extent an unfavourable work in progress adjustment taken on a contract in Q4 2018.
For the three months ended September 30, 2019, 80% of revenues within the U.S. Federal segment were federal civilian based.
5.4.6. U.K. and Australia
Revenue in our U.K. and Australia segment was $336.6 million in Q4 2019, a decrease of $0.5 million or 0.1% over the same period last year. On a constant currency basis, revenue increased by $15.3 million or 4.6%. The increase was mainly driven by organic growth within the government vertical market and higher IP license sales and solution revenue within the financial services vertical market. This was partly offset by the completion of projects primarily in the MRD vertical market.
On a client geographic basis, the top two U.K. and Australia vertical markets were government and communications & utilities, generating combined revenues of approximately $258 million for the three months ended September 30, 2019, respectively.
| CGI Inc. - Management’s Discussion and Analysis for the year ended September 30, 2019 | Page 37 |
5.4.7. Central and Eastern Europe
Revenue in our Central and Eastern Europe segment was $292.2 million in Q4 2019, an increase of $33.0 million or 12.7% over the same period last year. On a constant currency basis, revenue increased by $43.7 million or 16.9%. The increase was mainly driven by recent acquisitions and organic growth in Germany and the Netherlands, primarily within the MRD and government vertical markets.
On a client geographic basis, the top two Central and Eastern Europe vertical markets were MRD and communications & utilities, generating combined revenues of approximately $196 million for the three months ended September 30, 2019.
5.4.8. Asia Pacific
Revenue in our Asia Pacific segment was $144.0 million in Q4 2019, an increase of $11.6 million or 8.8% over the same period last year. On a constant currency basis, revenue increased by $13.3 million or 10.1%. The increase is mainly driven by the continued demand for our offshore delivery centers, predominantly within financial services and MRD vertical markets.
| CGI Inc. - Management’s Discussion and Analysis for the year ended September 30, 2019 | Page 38 |
| Change
|
||||||||||||||||
| For the three months ended September 30, | 2019 | 2018 | $ | % | ||||||||||||
| In thousands of CAD except for percentages |
||||||||||||||||
| Western and Southern Europe |
73,100 | 58,638 | 14,462 | 24.7% | ||||||||||||
| As a percentage of segment revenue |
15.4% | 12.3% | ||||||||||||||
| Northern Europe |
44,721 | 49,868 | (5,147 | ) | (10.3% | ) | ||||||||||
| As a percentage of segment revenue |
10.3% | 12.6% | ||||||||||||||
| Canada |
99,228 | 92,358 | 6,870 | 7.4% | ||||||||||||
| As a percentage of segment revenue |
23.9% | 22.1% | ||||||||||||||
| U.S. Commercial and State Government |
66,839 | 85,388 | (18,549 | ) | (21.7% | ) | ||||||||||
| As a percentage of segment revenue |
15.2% | 20.0% | ||||||||||||||
| U.S. Federal |
60,249 | 45,394 | 14,855 | 32.7% | ||||||||||||
| As a percentage of segment revenue |
14.3% | 12.8% | ||||||||||||||
| U.K. and Australia |
42,601 | 42,938 | (337 | ) | (0.8% | ) | ||||||||||
| As a percentage of segment revenue |
12.7% | 12.7% | ||||||||||||||
| Central and Eastern Europe |
30,478 | 27,236 | 3,242 | 11.9% | ||||||||||||
| As a percentage of segment revenue |
10.4% | 10.5% | ||||||||||||||
| Asia Pacific |
40,241 | 33,912 | 6,329 | 18.7% | ||||||||||||
| As a percentage of segment revenue |
27.9% | 25.6% | ||||||||||||||
| Adjusted EBIT |
457,457 | 435,732 | 21,725 | 5.0% | ||||||||||||
| Adjusted EBIT margin |
15.5% | 15.6% | ||||||||||||||
Adjusted EBIT for the quarter was $457.5 million an increase of $21.7 million or 5.0% from Q4 2018. The adjusted EBIT margin remained essentially stable at 15.5% as the impact of organic growth described in the revenue section compensated for the favourable impact from additional R&D tax credits in Q4 2018.
5.5.1. Western and Southern Europe
Adjusted EBIT in the Western and Southern Europe segment was $73.1 million in Q4 2019, an increase of $14.5 million when compared to Q4 2018. Adjusted EBIT margin increased to 15.4% from 12.3% in Q4 2018, primarily due to the impact of organic growth in France and additional R&D tax credits.
5.5.2. Northern Europe
Adjusted EBIT in the Northern Europe segment was $44.7 million in Q4 2019, a decrease of $5.1 million when compared to Q4 2018. Adjusted EBIT margin decreased to 10.3% from 12.6% in Q4 2018. The change in adjusted EBIT margin was mainly driven by the temporary effects of both the dilutive impact of the Acando acquisition, as well as excess capacity in our Swedish infrastructure business. This was partly offset by improved utilization in Finland.
5.5.3. Canada
Adjusted EBIT in the Canada segment was $99.2 million in Q4 2019, an increase of $6.9 million when compared to Q4 2018. Adjusted EBIT margin increased to 23.9% from 22.1% in Q4 2018. The increase in adjusted EBIT margin was mainly due to higher IP license sales and related services within the financial services vertical market and the adjustments in performance based compensation accruals. This was partly offset by the slowdown of projects and lower work volumes within the communications & utilities vertical market.
5.5.4. U.S. Commercial and State Government
Adjusted EBIT in the U.S. Commercial and State Government segment was $66.8 million in Q4 2019, a decrease of $18.5 million when compared to Q4 2018. Adjusted EBIT margin decreased to 15.2% from 20.0% in Q4 2018. The change in adjusted EBIT margin was mainly due to the favourable impact from additional R&D tax credits in Q4 2018.
| CGI Inc. - Management’s Discussion and Analysis for the year ended September 30, 2019 | Page 39 |
5.5.5. U.S. Federal
Adjusted EBIT in the U.S. Federal segment was $60.2 million in Q4 2019, an increase of $14.9 million when compared to Q4 2018. Adjusted EBIT margin increased to 14.3% from 12.8% in Q4 2018. This increase was primarily due to the unfavourable work in progress adjustment taken on a contract in Q4 2018, in part offset by the adjustment in performance based compensation accruals.
5.5.6. U.K. and Australia
Adjusted EBIT in the U.K. and Australia segment was $42.6 million in Q4 2019, a decrease of $0.3 million when compared to Q4 2018. Adjusted EBIT margin was essentially stable as an improved business mix combined with lower costs compensated for an unfavourable adjustment on a client contract.
5.5.7. Central and Eastern Europe
Adjusted EBIT in the Central and Eastern Europe segment was $30.5 million in Q4 2019, an increase of $3.2 million when compared to Q4 2018. Adjusted EBIT margin was essentially stable as improved profitability in the Netherlands compensated for lower demand from a financial services client.
5.5.8. Asia Pacific
Adjusted EBIT in the Asia Pacific segment was 40.2 million in Q4 2019, an increase of $6.3 million when compared to Q4 2018, while the adjusted EBIT margin increased to 27.9% from 25.6% Q4 2018. The increase in adjusted EBIT margin was mostly due to productivity improvements and automation efforts, as well as the favourable impact of our currency forward contracts.
| CGI Inc. - Management’s Discussion and Analysis for the year ended September 30, 2019 | Page 40 |
5.6. NET EARNINGS AND EARNINGS PER SHARE
The following table sets out the information supporting the earnings per share calculations:
|
Change
|
||||||||||||||||
| For the three months ended September 30, | 2019 | 2018 | $ | % | ||||||||||||
| In thousands of CAD except for percentage and shares data |
||||||||||||||||
| Adjusted EBIT |
457,457 | 435,732 | 21,725 | 5.0% | ||||||||||||
| Minus the following items: |
||||||||||||||||
| Acquisition-related and integration costs |
27,291 | 2,089 | 25,202 | 1,206.4% | ||||||||||||
| Restructuring costs |
— | 20,082 | (20,082 | ) | (100.0% | ) | ||||||||||
| Net finance costs |
17,824 | 20,782 | (2,958 | ) | (14.2% | ) | ||||||||||
| Earnings before income taxes |
412,342 | 392,779 | 19,563 | 5.0% | ||||||||||||
| Income tax expense |
88,253 | 99,294 | (11,041 | ) | (11.1% | ) | ||||||||||
| Effective tax rate |
21.4% | 25.3% | ||||||||||||||
| Net earnings |
324,089 | 293,485 | 30,604 | 10.4% | ||||||||||||
| Margin |
11.0% | 10.5% | ||||||||||||||
| Weighted average number of shares |
||||||||||||||||
| Class A subordinate voting shares and Class B multiple voting shares (basic) |
268,135,727 | 279,415,304 | (4.0% | ) | ||||||||||||
| Class A subordinate voting shares and Class B multiple voting shares (diluted) |
273,090,564 | 284,531,000 | (4.0% | ) | ||||||||||||
| Earnings per share (in dollars) |
||||||||||||||||
| Basic EPS |
1.21 | 1.05 | 0.16 | 15.2% | ||||||||||||
| Diluted EPS |
1.19 | 1.03 | 0.16 | 15.5% | ||||||||||||
For the current quarter, the increase in earnings before income taxes was mainly due to revenue growth.
For Q4 2019, the income tax expense was $88.3 million compared to $99.3 million for the same period last year, while our effective tax rate decreased to 21.4% from 25.3%. During the quarter ended September 30, 2019, the Company settled with the German tax authorities and booked $115.5 million of additional corporate tax losses and recorded a $18.5 million income tax recovery. When excluding that tax adjustment and tax effects from acquisition-related and integration costs and restructuring costs, the effective tax rate would have been 25.1% in Q4 2019 compared to 25.3% in Q4 2018. The decrease in the effective tax rate was mainly attributable to a corporate tax rate reduction in India.
During the quarter, 1,053,300 Class A subordinate voting shares were purchased for cancellation while 522,894 stock options were exercised.
| CGI Inc. - Management’s Discussion and Analysis for the year ended September 30, 2019 | Page 41 |
5.6.1. Net Earnings and Earnings per Share Excluding Specific Items
Below is a table showing the year-over-year comparison excluding specific items, namely acquisition-related and integration costs as well as restructuring costs :
|
Change
|
||||||||||||||||
| For the three months ended September 30, | 2019 | 2018 | $ | % | ||||||||||||
| In thousands of CAD except for percentage and shares data |
||||||||||||||||
| Earnings before income taxes |
412,342 | 392,779 | 19,563 | 5.0% | ||||||||||||
| Add back: |
||||||||||||||||
| Acquisition-related and integration costs |
27,291 | 2,089 | 25,202 | 1,206.4% | ||||||||||||
| Restructuring costs |
— | 20,082 | (20,082 | ) | (100.0% | ) | ||||||||||
| Earnings before income taxes excluding specific items |
439,633 | 414,950 | 24,683 | 5.9% | ||||||||||||
| Income tax expense |
88,253 | 99,294 | (11,041 | ) | (11.1% | ) | ||||||||||
| Add back: |
||||||||||||||||
| Tax deduction on acquisition-related and integration costs |
3,467 | 448 | 3,019 | 673.9% | ||||||||||||
| Tax deduction on restructuring costs |
— | 5,364 | (5,364 | ) | (100.0% | ) | ||||||||||
| Tax adjustment |
18,451 | — | — | — | ||||||||||||
| Income tax expense excluding specific items |
110,171 | 105,106 | 5,065 | 4.8% | ||||||||||||
| Effective tax rate excluding specific items |
25.1% | 25.3% | ||||||||||||||
|
|
||||||||||||||||
| Net earnings excluding specific items |
329,462 | 309,844 | 19,618 | 6.3% | ||||||||||||
| Net earnings excluding specific items margin |
11.1% | 11.1% | ||||||||||||||
| Weighted average number of shares outstanding |
||||||||||||||||
| Class A subordinate voting shares and Class B multiple voting shares (basic) |
268,135,727 | 279,415,304 | (4.0% | ) | ||||||||||||
| Class A subordinate voting shares and Class B multiple voting shares (diluted) |
273,090,564 | 284,531,000 | (4.0% | ) | ||||||||||||
| Earnings per share excluding specific items (in dollars) |
||||||||||||||||
| Basic EPS |
1.23 | 1.11 | 0.12 | 10.8% | ||||||||||||
| Diluted EPS |
1.21 | 1.09 | 0.12 | 11.0% | ||||||||||||
| CGI Inc. - Management’s Discussion and Analysis for the year ended September 30, 2019 | Page 42 |
5.7. CONSOLIDATED STATEMENTS OF CASH FLOWS
As at September 30, 2019, cash and cash equivalents were $213.8 million. The following table provides a summary of the generation and use of cash and cash equivalents for the quarters ended September 30, 2019 and 2018.
| For the three months ended September 30, | 2019 | 2018 | Change | |||||||||
| In thousands of CAD |
||||||||||||
| Cash provided by operating activities |
405,214 | 340,363 | 64,851 | |||||||||
| Cash used in investing activities |
(94,730 | ) | (76,826 | ) | (17,904 | ) | ||||||
| Cash used in financing activities |
(307,835 | ) | (226,120 | ) | (81,715 | ) | ||||||
| Effect of foreign exchange rate changes on cash and cash equivalents |
(13,969 | ) | (24,422 | ) | 10,453 | |||||||
| Net (decrease) increase in cash and cash equivalents |
(11,320 | ) | 12,995 | (24,315 | ) | |||||||
5.7.1. Cash Provided by Operating Activities
For Q4 2019, cash provided by operating activities was $405.2 million compared to $340.4 million in Q4 2018, or 13.7% of revenue compared to 12.2% last year.
The following table provides a summary of the generation and use of cash from operating activities.
| For the three months ended September 30, | 2019 | 2018 | Change | |||||||||
| In thousands of CAD |
||||||||||||
| Net earnings |
324,089 | 293,485 | 30,604 | |||||||||
| Amortization and depreciation |
97,155 | 101,471 | (4,316) | |||||||||
| Other adjustments 1 |
6,971 | 25,283 | (18,312) | |||||||||
| Cash flow from operating activities before net change in non-cash working capital items |
428,215 | 420,239 | 7,976 | |||||||||
| Net change in non-cash working capital items: |
||||||||||||
| Accounts receivable, work in progress and deferred revenue |
74,308 | (13,106 | ) | 87,414 | ||||||||
| Accounts payable and accrued liabilities, accrued compensation, provisions and long-term liabilities |
(63,567 | ) | (79,057 | ) | 15,490 | |||||||
| Other 2 |
(33,742 | ) | 12,287 | (46,029) | ||||||||
| Net change in non-cash working capital items |
(23,001 | ) | (79,876 | ) | 56,875 | |||||||
| Cash provided by operating activities |
405,214 | 340,363 | 64,851 | |||||||||
| 1 | Other adjustments are comprised of deferred income taxes, foreign exchange loss (gain) and share-based payment costs. |
| 2 | Comprised of prepaid expenses and other assets, long-term financial assets, retirement benefits obligations, derivative financial instruments and income taxes. |
For the three months ended September 30, 2019, the $23.0 million of net change in non-cash working capital items was mostly due to the timing of accrued compensation mainly related to vacation, the timing of income tax payments, accounts payable and the timing of the collection of tax credits which was partially offset by the decrease in our DSO from 52 days in Q3 2019 to 50 days in Q4 2019 and the net decrease in prepaid expenses and other assets.
The timing of our working capital inflows and outflows will always have an impact on the cash flow from operations.
| CGI Inc. - Management’s Discussion and Analysis for the year ended September 30, 2019 | Page 43 |
5.7.2. Cash Used in Investing Activities
For Q4 2019, $94.7 million was used in investing activities while $76.8 million was used in the prior year.
The following table provides a summary of the generation and use of cash from investing activities:
| For the three months ended September 30, | 2019 | 2018 | Change | |||||||||
| In thousands of CAD |
||||||||||||
| Business acquisitions |
(14,876 | ) | 2,886 | (17,762 | ) | |||||||
| Purchase of property, plant and equipment |
(41,592 | ) | (42,367 | ) | 775 | |||||||
| Additions to contract costs |
(12,679 | ) | (16,746 | ) | 4,067 | |||||||
| Additions to intangible assets |
(26,421 | ) | (20,320 | ) | (6,101 | ) | ||||||
| Net change in short-term investments and purchase of long-term investments |
838 | (279 | ) | 1,117 | ||||||||
| Cash used in investing activities |
(94,730 | ) | (76,826 | ) | (17,904 | ) | ||||||
The increase of $17.9 million in cash used in investing activities during the three months ended September 30, 2019 was mainly due to the increase in cash used for an acquisition made in the quarter.
5.7.3. Cash Used in Financing Activities
| For the three months ended September 30, | 2019 | 2018 | Change | |||||||||
| In thousands of CAD |
||||||||||||
| Net change in unsecured committed revolving credit facility |
(95,119) | 53,136 | (148,255) | |||||||||
| Net change in long-term debt |
(123,446) | (71,882) | (51,564) | |||||||||
|
|
(218,565) | (18,746) | (199,819) | |||||||||
| Repayment of debt assumed in a business acquisition |
(767) | — | (767) | |||||||||
| Settlement of derivative financial instruments |
1,380 | (2,430) | 3,810 | |||||||||
| Purchase and cancellation of Class A subordinate voting shares held in trusts |
(106,143) | (215,616) | 109,473 | |||||||||
| Issuance of Class A subordinate voting shares |
16,260 | 10,672 | 5,588 | |||||||||
| Cash used in financing activities |
(307,835) | (226,120) | (81,715) | |||||||||
During Q4 2019, we used $123.4 million to reduce our outstanding long-term debt while, for the same period last year, $71.9 million was used. This was mainly driven by scheduled repayments on a Senior unsecured notes in the amount of $119.2 million. In addition, we repaid $95.1 million on the Company’s unsecured committed revolving credit facility during Q4 2019 while, for the same period last year, we drew $53.1 million.
During Q4 2019, we used $106.1 million to purchase Class A Shares for cancellation under the NCIB. For the same period last year, we used $215.6 million to purchase Class A Shares for cancellation under the NCIB.
In Q4 2019, we received $16.3 million in proceeds from the exercise of stock options, compared to $10.7 million during the same period last year.
| CGI Inc. - Management’s Discussion and Analysis for the year ended September 30, 2019 | Page 44 |
| 6. | Eight Quarter Summary (Unaudited) |
| As at and for the three months ended, | Sep. 30, 2019 |
Jun. 30, 2019 |
Mar. 31, 2019 |
Dec. 31, 2018 |
Sep. 30, 2018 |
Jun. 30, 2018 |
Mar. 31, 2018 |
Dec. 31, 2017 |
||||||||||||||||||||||||
| In millions of CAD unless otherwise noted |
| |||||||||||||||||||||||||||||||
| Growth |
||||||||||||||||||||||||||||||||
| Revenue |
2,959.2 | 3,119.8 | 3,068.3 | 2,963.9 | 2,799.0 | 2,940.7 | 2,950.3 | 2,816.9 | ||||||||||||||||||||||||
| Year-over-year revenue growth |
5.7% | 6.1% | 4.0% | 5.2% | 7.3% | 3.7% | 8.3% | 5.3% | ||||||||||||||||||||||||
| Constant currency year-over-year revenue growth |
7.7% | 6.6% | 4.7% | 4.5% | 5.0% | 3.8% | 4.9% | 4.9% | ||||||||||||||||||||||||
| Backlog |
22,611 | 22,418 | 22,947 | 23,338 | 22,577 | 22,407 | 22,049 | 21,110 | ||||||||||||||||||||||||
| Bookings |
3,409 | 2,951 | 3,255 | 3,031 | 3,534 | 3,470 | 3,513 | 2,976 | ||||||||||||||||||||||||
| Book-to-bill ratio |
115.2% | 94.6% | 106.1% | 102.3% | 126.2% | 118.0% | 119.1% | 105.7% | ||||||||||||||||||||||||
| Book-to-bill ratio trailing twelve months |
104.4% | 106.9% | 112.9% | 116.3% | 117.3% | 113.8% | 107.7% | 102.8% | ||||||||||||||||||||||||
| Profitability |
||||||||||||||||||||||||||||||||
| Adjusted EBIT |
457.5 | 474.2 | 454.1 | 439.2 | 435.7 | 435.3 | 424.4 | 406.3 | ||||||||||||||||||||||||
| Adjusted EBIT margin |
15.5% | 15.2% | 14.8% | 14.8% | 15.6% | 14.8% | 14.4% | 14.4% | ||||||||||||||||||||||||
| Net earnings |
324.1 | 309.4 | 318.3 | 311.5 | 293.5 | 288.3 | 274.4 | 285.3 | ||||||||||||||||||||||||
| Net earnings margin |
11.0% | 9.9% | 10.4% | 10.5% | 10.5% | 9.8% | 9.3% | 10.1% | ||||||||||||||||||||||||
| Diluted EPS (in dollars) |
1.19 | 1.12 | 1.14 | 1.11 | 1.03 | 1.00 | 0.94 | 0.98 | ||||||||||||||||||||||||
| Net earnings excluding specific items |
329.5 | 337.2 | 324.5 | 314.7 | 309.8 | 309.7 | 303.2 | 288.0 | ||||||||||||||||||||||||
| Net earnings margin excluding specific items |
11.1% | 10.8% | 10.6% | 10.6% | 11.1% | 10.5% | 10.3% | 10.2% | ||||||||||||||||||||||||
| Diluted EPS excluding specific items (in dollars) |
1.21 | 1.22 | 1.17 | 1.12 | 1.09 | 1.08 | 1.04 | 0.99 | ||||||||||||||||||||||||
| Liquidity |
||||||||||||||||||||||||||||||||
| Cash provided by operating activities |
405.2 | 375.2 | 462.0 | 391.5 | 340.4 | 317.3 | 425.7 | 410.1 | ||||||||||||||||||||||||
| As a % of revenue |
13.7% | 12.0% | 15.1% | 13.2% | 12.2% | 10.8% | 14.4% | 14.6% | ||||||||||||||||||||||||
| Days sales outstanding |
50 | 52 | 49 | 54 | 52 | 50 | 46 | 47 | ||||||||||||||||||||||||
| Capital structure |
||||||||||||||||||||||||||||||||
| Net debt |
2,117.2 | 2,336.1 | 1,597.3 | 1,738.7 | 1,640.8 | 1,685.2 | 1,525.9 | 1,635.0 | ||||||||||||||||||||||||
| Net debt to capitalization ratio |
22.9% | 25.2% | 17.4% | 19.1% | 19.2% | 19.6% | 17.5% | 19.3% | ||||||||||||||||||||||||
| Return on equity |
18.5% | 18.1% | 17.7% | 17.3% | 17.3% | 16.0% | 16.0% | 16.2% | ||||||||||||||||||||||||
| Return on invested capital |
15.1% | 15.0% | 14.9% | 14.5% | 14.5% | 13.5% | 13.5% | 13.7% | ||||||||||||||||||||||||
| Balance sheet |
||||||||||||||||||||||||||||||||
| Cash and cash equivalents, and short-term investments |
223.7 | 225.2 | 544.0 | 406.1 | 184.1 | 171.1 | 287.5 | 238.9 | ||||||||||||||||||||||||
| Total assets |
12,621.7 | 12,813.9 | 12,709.4 | 12,872.5 | 11,919.1 | 12,155.0 | 12,363.7 | 11,957.5 | ||||||||||||||||||||||||
| Long-term financial liabilities 1 |
2,236.0 | 2,421.3 | 2,007.3 | 2,070.9 | 1,530.1 | 1,615.7 | 1,578.9 | 1,588.3 | ||||||||||||||||||||||||
| 1 | Long-term financial liabilities include the long-term portion of the debt and the long-term derivative financial instruments. |
There are factors causing quarterly variances which may not be reflective of the Company’s future performance. First, there is seasonality in system integration and consulting work, and the quarterly performance of these operations is impacted by occurrences such as vacations and the number of statutory holidays in any given quarter. Managed IT and business process services contracts are affected to a lesser extent by seasonality. Second, the workflow from some clients may fluctuate from quarter to quarter based on their business cycle and the seasonality of their own operations. Third, the savings that we generate for a client on a given managed IT and business process services contract may temporarily reduce our revenue stream from this client, as these savings may not be immediately offset by additional work performed for this client.
Cash flow from operating activities could vary significantly from quarter to quarter depending on the timing of monthly payments received from large clients, cash requirements associated with large acquisitions, managed IT and business process services contracts and projects, the timing of the reimbursements for various tax credits as well as profit sharing payments to members and the timing of restructuring cost payments.
| CGI Inc. - Management’s Discussion and Analysis for the year ended September 30, 2019 | Page 45 |
Foreign exchange fluctuations can also contribute to quarterly variances as our percentage of operations in foreign countries evolves. The effect from these variances is primarily on our revenue and to a much lesser extent, on our margin as we benefit, as much as possible, from natural hedges.
| CGI Inc. - Management’s Discussion and Analysis for the year ended September 30, 2019 | Page 46 |
7. Changes in Accounting Policies
The audited consolidated financial statements for the year ended September 30, 2019 include all adjustments that CGI’s management considers necessary for the fair presentation of its financial position, results of operations, and cash flows.
ADOPTION OF ACCOUNTING STANDARDS
The following standards have been adopted by the Company on October 1, 2018:
IFRS 15 - Revenue from Contracts with Customers
In May 2014, the IASB issued IFRS 15, Revenue from Contracts with Customers, to specify how and when to recognize revenue as well as requiring the provision of more informative and relevant disclosures. The standard supersedes IAS 18, Revenue, IAS 11, Construction Contracts, and other revenue related interpretations.
IFRS 15 was adopted by the Company using the modified retrospective method, with no restatement of comparative figures.
The main changes to the accounting policies disclosed in the audited consolidated financial statements of the Company for the year ended September 30, 2019 are as follows:
– Initial implementation activities of managed IT and business process services arrangements, previously not considered as a separately identifiable component, could be in some cases identified as a separate performance obligation if they meet the criteria of being distinct under IFRS 15 resulting in acceleration of revenue recognition and related contract costs.
– Previously, when a software license had value to the client on a stand-alone basis and was identified as a separately identifiable component, revenue from the software license was recognized upon delivery. Under IFRS 15, when the arrangement involves significant customization services, revenue from a software license is now combined with the services resulting in deferral of revenue recognition.
– The Company changed its presentation of work in progress and deferred revenue which are now presented net on a contract-by-contract basis separately from accounts receivable and no longer for each project as it was previously the case for systems integration and consulting services arrangements.
– IFRS 15 indicates that IAS 37, Provisions, Contingent Liabilities and Contingent Assets, should now be applied to estimated losses on revenue-generating contracts. Therefore, related amounts previously classified as accounts payable and accrued liabilities and other long-term liabilities are now classified as current and non-current provisions.
– IFRS 15 requires additional disclosures such as information on disaggregation of revenue from contracts with customers by geography, service type and major clients and on remaining performance obligations, which are respectively provided in Note 27, Segmented Information, and Note 21, Remaining performance obligations, of the audited consolidated financial statements for the year ended September 30, 2019.
The adoption of IFRS 15 did not have a material impact on the Company’s audited consolidated financial statements.
IFRS 9 - Financial instruments
In July 2014, the IASB amended IFRS 9, Financial Instruments, to replace IAS 39, Financial Instruments: Recognition and Measurement.
IFRS 9 was adopted retrospectively by the Company, with no restatement of comparative figures.
The main changes to the accounting policies disclosed in the audited consolidated financial statements of the Company for the year ended September 30, 2019 are as follows:
– The standard simplifies the classification of financial assets, while carrying forward most of the requirements of IAS 39. The Company’s financial assets previously classified as loans and receivables are now classified at amortized cost and continue to be measured as such. Financial assets previously classified as available-for-sale are now classified at fair value
| CGI Inc. - Management’s Discussion and Analysis for the year ended September 30, 2019 | Page 47 |
through other comprehensive income and continue to be measured as such. Other financial assets and derivatives that do not qualify for hedge accounting are still classified and measured at fair value through earnings. Financial liabilities previously classified as other liabilities are now classified at amortized cost and continue to be measured as such.
– The standard introduces a new impairment model which applies to the Company’s trade accounts receivable, work in progress, long-term receivables and long-term bonds. The Company is not subject to any significant credit risk, given its large and diversified client base and its risk mitigation strategy to invest in high credit quality corporate and government bonds with a credit rating of A or higher. The Company has applied the simplified approach on its accounts receivable, work in progress and long-term receivables and used the low credit risk exemption on its long-term bonds.
– Finally, IFRS 9 introduces a new hedge accounting model that is more closely aligned with risk-management activities. The Company had applied the new hedge accounting model and the existing hedge relationships continue to qualify for hedge accounting under this new model. The Company had elected to account for the forward element of the cross-currency swaps as costs of hedging. Accordingly, as of October 1, 2018, an amount of $26.0 million of deferred costs of hedging, net of accumulated tax recovery of $3.9 million, was recognized in a separate component of the accumulated other comprehensive income.
– The additional annual disclosures are provided in Note 30, Financial instruments, of the audited consolidated financial statements for the year ended September 30, 2019.
The adoption of IFRS 9 did not have a material impact on the Company’s audited consolidated financial statements.
FUTURE ACCOUNTING STANDARD CHANGE
The following standard has been issued but is not yet effective. The Company’s preliminary assessment is subject to change, as the Company is progressing in the assessment of the impact of this standard on its audited consolidated financial statements.
IFRS 16 - Leases
In January 2016, the IASB issued IFRS 16, Leases, to set out the principles for the recognition, measurement, presentation and disclosure of leases for both parties to a lease agreement. The standard supersedes IAS 17, Leases, and other leases related interpretations, eliminates the lessee’s classification of leases as either operating leases or finance leases and introduces a single lessee accounting model. The standard is effective since October 1, 2019 for the Company. The standard permits two possible transition methods for its application: i) retrospectively to each prior reporting period presented or ii) retrospectively with the cumulative effect of initially applying the standard recognized on the date of the initial application (modified retrospective method). The Company adopted IFRS 16 using the modified retrospective method and applied with no restatement of comparative figures, The Company made use of practical expedients available on transition including the definition of a lease, the use of hindsight in determining the lease term, applying a single incremental borrowing rate to a portfolio of leases with similar characteristics and adjusting the right-of- use assets for any onerous lease provisions as an alternative to an impairment review.
In preparation for the conversion to IFRS 16, the Company has developed a detailed conversion plan consisting of three phases: 1) awareness and assessment, 2) design and 3) implementation. As part of the first phase, the Company has established a steering committee responsible for monitoring the progress and approving recommendations from the project team. The steering committee meets regularly and quarterly updates are provided to the Audit and Risk Management Committee. The Company is progressing toward completion of the third phase of the conversion plan.
The adoption of IFRS 16 will result in a material increase to the company’s assets and liabilities thought the recognition of right of use assets and of lease liabilities. Please refer to note 3 of our audited consolidated financial statements for additional information.
Amendments to IFRS 9, IAS 39 and IFRS 7 - Interest rate benchmark reform
In September 2019, the IASB has amended some of its requirements to address the uncertainty arising from the phasing out of interest-rate benchmarks such as interbank offered rates (IBORS). The amendments issued focused on the accounting effects of uncertainty in the period leading up to the reform. The IASB is also working on the potential consequences to financial
| CGI Inc. - Management’s Discussion and Analysis for the year ended September 30, 2019 | Page 48 |
reporting of replacing an existing benchmark with an alternative. The amendments impact IFRS 9 Financial instruments, IAS 39 Financial instruments: Recognition and measurement and IFRS 7 Financial instruments: Disclosures. The amendments come into effect for annual periods beginning on or after January 1, 2020 subject to EU endorsement. The Company is currently evaluating the impact of this standard on its consolidated financial statements.
| CGI Inc. - Management’s Discussion and Analysis for the year ended September 30, 2019 | Page 49 |
| 8. | Critical Accounting Estimates |
The Company’s significant accounting policies are described in note 3 of the audited consolidated financial statements for the year ended September 30, 2019. Certain of these accounting policies, listed below, require management to make accounting estimates and judgements that affect the reported amounts of assets, liabilities and equity and the accompanying disclosures at the date of the audited consolidated financial statements as well as the reported amounts of revenue and expenses during the reporting period. These accounting estimates are considered critical because they require management to make subjective and/or complex judgements that are inherently uncertain and because they could have a material impact on the presentation of our financial condition, changes in financial condition or results of operations.
| Areas impacted by estimates |
Consolidated balance sheets
|
Consolidated statements of earnings | ||||||
| Revenue | Cost of services, selling and administrative |
Income taxes | ||||||
| Revenue recognition 1 |
✓ | ✓ | ✓ | |||||
| Goodwill impairment |
✓ | ✓ | ||||||
| Business combinations |
✓ | ✓ | ✓ | ✓ | ||||
| Income taxes |
✓ | ✓ | ||||||
| Litigation and claims |
✓ | ✓ | ✓ | |||||
| 1 | Affects the balance sheet through accounts receivable, work in progress and deferred revenue. |
Revenue recognition
Relative selling price
If an arrangement involves the provision of multiple performance obligations, the total arrangement value is allocated to each performance obligation based on its relative stand-alone selling price. At least on a yearly basis, the Company reviews its best estimate of the stand-alone selling price which is established by using a reasonable range of prices for the various services and products offered by the Company based on local market information available. Information used in determining the range is mainly based on recent contracts signed and the economic environment. A change in the range could have a material impact on the allocation of total arrangement value, and therefore on the amount and timing of revenue recognition.
System integration and consulting services under fixed-fee arrangements
Revenue from systems integration and consulting services under fixed-fee arrangements is recognized using the percentage-of-completion method over time, as the Company has no alternative use for the asset created and has an enforceable right to payment for performance completed to date. The Company primarily uses labour costs or labour hours to measure the progress towards completion. Project managers monitor and re-evaluate project forecasts on a monthly basis. Forecasts are reviewed to consider factors such as: changes to the scope of the contracts, delays in reaching milestones and new complexities in the project delivery. Forecasts can also be affected by market risks such as the availability and retention of qualified IT professionals and/or the ability of the subcontractors to perform their obligation within agreed upon budget and timeframes. To the extent that actual labour hours or labour costs could vary from estimates, adjustments to revenue following the review of the costs to complete on projects are reflected in the period in which the facts that give rise to the revision occur. Whenever the total costs are forecasted to be higher than the total revenue, a provision for onerous revenue-generating contract is recorded.
| CGI Inc. - Management’s Discussion and Analysis for the year ended September 30, 2019 | Page 50 |
Goodwill impairment
The carrying value of goodwill is tested for impairment annually or if events or changes in circumstances indicate that the carrying value may be impaired. In order to determine if a goodwill impairment test is required, management reviews different factors on a quarterly basis such as changes in technological or market environment, changes in assumptions used to derive the weighted average cost of capital and actual financial performance compared to planned performance.
The recoverable amount of each segment has been determined based on its value in use calculation which includes estimates about their future financial performance based on cash flows approved by management. However, factors such as our ability to continue developing and expanding service offered to address emerging business demands and technology trends, a lengthened sales cycle and our ability to hire and retain qualified IT professionals affect future cash flows, and actual results might differ from future cash flows used in the goodwill impairment test. Key assumptions used in goodwill impairment testing are presented in note 11 of the audited consolidated financial statements for the fiscal year ended September 30, 2019. Historically, the Company has not recorded an impairment charge on goodwill. As at September 30, 2019, the recoverable amount of each segment represented between 229% and 433% of its carrying value.
Business combinations
Management makes assumptions when determining the acquisition-date fair values of the identifiable tangible and intangible assets acquired and liabilities assumed which involve estimates, such as the forecasting of future cash flows, discount rates, and the useful lives of the assets acquired.
Additionally, judgement is required in determining whether an intangible asset is identifiable, and should be recorded separately from goodwill.
Changes in the above assumptions, estimates and judgements could affect our acquisition-date fair values and therefore could have material impacts on our audited consolidated financial statements. These changes are recorded as part of the purchase price allocation and therefore result in corresponding goodwill adjustments if they occurred during the measurement period, not exceeding one year. All other subsequent changes are recorded in our consolidated statement of earnings.
Income taxes
Deferred tax assets are recognized for unused tax losses and deductible temporary differences to the extent that it is probable that taxable profit will be available for their utilization. The Company considers the analysis of forecast and future tax planning strategies. Estimates of taxable profit are made based on the forecast by jurisdiction which are aligned with goodwill impairment testing assumptions, on an undiscounted basis. In addition, management considers factors such as substantively enacted tax rates, the history of the taxable profits and availability of tax strategies. Due to the uncertainty and the variability of the factors mentioned above, deferred tax assets are subject to change. Management reviews its assumptions on a quarterly basis and adjusts the deferred tax assets when appropriate.
The Company is subject to taxation in numerous jurisdictions and there are transactions and calculations for which the ultimate tax determination is uncertain which occurs when there is uncertainty as to the meaning of the law, or to the applicability of the law to a particular transaction or both. In those circumstances, the Company might review administrative practice, consult tax authorities or advisors on the interpretation of tax legislation. When a tax position is uncertain, the Company recognizes an income tax benefit or reduces an income tax liability only when it is probable that the tax benefit will be realized in the future or that the income tax liability is no longer probable. The provision for uncertain tax position is made using the best estimate of the amount expected to be paid based on qualitative assessments of all relevant factors and is subject to change. The review of assumptions is done on a quarterly basis.
Litigation and claims
Provisions are recognized when the Company has a present legal or constructive obligation as a result of a past event, it is probable that an outflow of resources embodying economic benefits will be required to settle the obligation and a reliable estimate can be made of the amount of the obligation. The accrued litigation and legal claim provisions are based on historical experience, current trends and other assumptions that are believed to be reasonable under the circumstances. Estimates
| CGI Inc. - Management’s Discussion and Analysis for the year ended September 30, 2019 | Page 51 |
include the period in which the underlying cause of the claim occurred and the degree of probability of an unfavourable outcome. Management reviews assumptions and facts surrounding outstanding litigation and claims on a quarterly basis, involves external counsel when necessary and adjusts the provision accordingly. The Company has to be compliant with applicable law in many jurisdictions which increases the complexity of determining the adequate provision following a litigation review. Since the outcome of such litigation and claims is not predictable with assurance, those provisions are subject to change. Adjustments to litigation and claims provisions are reflected in the period when the facts that give rise to an adjustment occur.
| CGI Inc. - Management’s Discussion and Analysis for the year ended September 30, 2019 | Page 52 |
| 9. | Integrity of Disclosure |
The Board of Directors has the responsibility under its charter and under the securities laws that govern CGI’s continuous disclosure obligations to oversee CGI’s compliance with its continuous and timely disclosure obligations, as well as the integrity of the Company’s internal controls and management information systems. The Board of Directors carries out this responsibility mainly through its Audit and Risk Management Committee.
The Audit and Risk Management Committee of CGI is composed entirely of independent directors who meet the independence and experience requirements of National Instrument 52-110 adopted by the Canadian Securities Administrators as well as those of the New York Stock Exchange (NYSE) and the U.S. Securities and Exchange Commission. The role and responsibilities of the Audit and Risk Management Committee include: (a) reviewing public disclosure documents containing audited or unaudited financial information concerning CGI; (b) identifying and examining material financial and operating risks to which the Company is exposed, reviewing the various policies and practices of the Company that are intended to manage those risks, and reporting on a regular basis to the Board of Directors concerning risk management; (c) reviewing and assessing the effectiveness of CGI’s accounting policies and practices concerning financial reporting; (d) reviewing and monitoring CGI’s internal control procedures, programs and policies and assessing their adequacy and effectiveness; (e) reviewing the adequacy of CGI’s internal audit resources including the mandate and objectives of the internal auditor; (f) recommending to the Board of Directors the appointment of the external auditor, assessing the external auditor’s independence, reviewing the terms of their engagement, conducting an annual auditor’s performance assessment, and pursuing ongoing discussions with them; (g) reviewing related party transactions in accordance with the rules of the NYSE and other applicable laws and regulations; (h) reviewing the audit procedures including the proposed scope of the external auditor’s examinations; and (i) performing such other functions as are usually attributed to audit committees or as directed by the Board of Directors. In making its recommendation to the Board of Directors in relation to the annual appointment of the external auditor, the Audit and Risk Management Committee conducts an annual assessment of the external auditor’s performance following the recommendations of the Chartered Professional Accountants of Canada. The formal assessment is concluded in advance of the Annual General Meeting of Shareholders and is conducted with the assistance of key CGI personnel.
The Company has established and maintains disclosure controls and procedures designed to provide reasonable assurance that material information relating to the Company is made known to the Chief Executive Officer and Chief Financial Officer by others, particularly during the period in which annual and interim filings are prepared, and that information required to be disclosed by the Company in its annual, interim filings or other reports filed or submitted by the Company under Canadian and U.S. securities laws is recorded, processed, summarized and reported within the time periods specified under those laws and the related rules. As at September 30, 2019, management evaluated, under the supervision of and with the participation of the Chief Executive Officer and Chief Financial Officer, the effectiveness of the Company’s disclosure controls and procedures as defined under National Instrument 52-109 adopted by the Canadian Securities Administrators and in Rule 13(a)-15(e) under the U.S. Securities Exchange Act of 1934, as amended. Based on that evaluation, the Chief Executive Officer and Chief Financial Officer concluded that the Company’s disclosure controls and procedures were effective as at September 30, 2019.
The Company has also established and maintains internal control over financial reporting, as defined under National Instrument 52-109 and in Rule 13(a)-15(f) under the U.S. Securities Exchange Act of 1934, as amended. The Company’s internal control over financial reporting is a process designed under the supervision of the Chief Executive Officer and Chief Financial Officer, and effected by management and other key CGI personnel, to provide reasonable assurance regarding the reliability of financial reporting and the preparation of financial statements for external purposes in accordance with IFRS. However, because of its inherent limitations, internal control over financial reporting may not prevent or detect misstatements on a timely basis. Management evaluated, under the supervision of and with the participation of the Chief Executive Officer and the Chief Financial Officer, the effectiveness of the Company’s internal control over financial reporting as at September 30, 2019, based on the criteria established in Internal Control - Integrated Framework (2013) issued by the Committee of Sponsoring Organizations of the Treadway Commission (COSO). Based on that evaluation, management, under the supervision of and
| CGI Inc. - Management’s Discussion and Analysis for the year ended September 30, 2019 | Page 53 |
with the participation of the President and Chief Executive Officer as well as the Executive Vice President and Chief Financial Officer concluded that the Company’s internal control over financial reporting was effective as at September 30, 2019.
| CGI Inc. - Management’s Discussion and Analysis for the year ended September 30, 2019 | Page 54 |
| 10. | Risk Environment |
While we are confident about our long-term prospects, a number of risks and uncertainties could affect our ability to achieve our strategic vision and objectives for growth. The following risks and uncertainties should be considered when evaluating our potential as an investment.
10.1.1. External Risks
Economic and political risk
Economic and political conditions in the markets in which we operate have a bearing upon the results of our operations, directly and through their effect on the level of business activity of our clients. We can neither predict the impact that current economic and political conditions will have on our future revenue, nor predict changes in economic conditions or future political uncertainty. The level of activity of our clients and potential clients may be affected by an economic downturn or political uncertainty. Clients may cancel, reduce or defer existing contracts and delay entering into new engagements and may decide to undertake fewer IT systems projects resulting in limited implementation of new technology and smaller engagements. Since there may be fewer engagements, competition may increase and pricing for services may decline as competitors may decrease rates to maintain or increase their market share in our industry and this may trigger pricing adjustments related to the benchmarking obligations within our contracts. Economic downturns and political uncertainty makes it more difficult to meet business objectives and may divert management’s attention and time from operating and growing our business. Our business, results of operations and financial condition could be negatively affected as a result of these factors.
Other external risks
Additional external risks that could adversely impact the markets in which we operate, our industry and our business include terrorism, armed conflict, labor or social unrest, criminal activity, regional and international hostilities and international responses to these hostilities, and disease, illness or health emergencies that affect local, national or international economies, Additionally, the potential impacts of continued climate change are unpredictable and natural disasters, sea-level rise, floods, droughts or other weather-related events present additional external risks. Each of these risks could negatively impact our operations, revenue and profitability.
10.1.2. Risks Related to our Industry
The competition for contracts
CGI operates in a global marketplace in which competition among providers of IT services is vigorous. Some of our competitors possess greater financial, marketing and sales resources, and larger geographic scope in certain parts of the world than we do, which, in turn, provides them with additional leverage in the competition for contracts. In certain niche, regional or metropolitan markets, we face smaller competitors with specialized capabilities who may be able to provide competing services with greater economic efficiency. Some of our competitors have more significant operations than we do in lower cost countries that can serve as a platform from which to provide services worldwide on terms that may be more favourable. Increased competition among IT services firms often results in corresponding pressure on prices. There can be no assurance that we will succeed in providing competitively priced services at levels of service and quality that will enable us to maintain and grow our market share.
We derive significant revenue from contracts awarded through competitive bidding processes, which limit the Company’s ability to negotiate certain contractual terms and conditions. Risks related to competitive bidding processes also involve substantial cost and managerial time and effort spent by the Company to prepare bids and proposals for contracts that may
| CGI Inc. - Management’s Discussion and Analysis for the year ended September 30, 2019 | Page 55 |
or may not be awarded to the Company, as well as expenses and delays that may arise if the Company’s competitors protest or challenge awards made to the Company pursuant to competitive bidding processes.
The availability and retention of qualified IT professionals
There is strong demand for qualified individuals in the IT industry. Hiring and retaining a sufficient amount of individuals with the desired knowledge and skill set may be difficult. Therefore, it is important that we remain able to successfully attract and retain highly qualified professionals and establish an effective succession plan. If our comprehensive programs aimed at attracting and retaining qualified and dedicated professionals do not ensure that we have staff in sufficient numbers and with the appropriate training, expertise and suitable government security clearances required to serve the needs of our clients, we may have to rely on subcontractors or transfers of staff to fill resulting gaps. If our succession plan fails to identify those with potential or to develop these key individuals, we may be unable to replace key members who retire or leave the company and may be required to recruit and/or train new employees. This might result in lost revenue or increased costs, thereby putting pressure on our net earnings.
The ability to continue developing and expanding service offerings to address emerging business demands and technology trends
The rapid pace of change in all aspects of IT and the continually declining costs of acquiring and maintaining IT infrastructure mean that we must anticipate changes in our clients’ needs. To do so, we must adapt our services and our solutions so that we maintain and improve our competitive advantage and remain able to provide cost effective services and solutions. The markets in which we operate are extremely competitive and there can be no assurance that we will succeed in developing and adapting our business in a timely manner nor that we will be able to penetrate new markets successfully. If we do not keep pace, our ability to retain existing clients and gain new business may be adversely affected. This may result in pressure on our revenue, net earnings and resulting cash flow from operations.
Infringing on the intellectual property rights of others
Despite our efforts, the steps we take to ensure that our services and offerings do not infringe on the intellectual property rights of third parties may not be adequate to prevent infringement and, as a result, claims may be asserted against us or our clients. We enter into licensing agreements for the right to use intellectual property and may otherwise offer indemnities against liability and damages arising from third-party claims of patent, copyright, trademark or trade secret infringement in respect of our own intellectual property or software or other solutions developed for our clients. In some instances, the amount of these indemnity claims could be greater than the revenue we receive from the client (see guarantees risk). Intellectual property claims or litigation could be time-consuming and costly, harm our reputation, require us to enter into additional royalty or licensing arrangements, or prevent us from providing some solutions or services. Any limitation on our ability to sell or use solutions or services that incorporate software or technologies that are the subject of a claim could cause us to lose revenue-generating opportunities or require us to incur additional expenses to modify solutions for future projects.
Protecting our intellectual property rights
Our success depends, in part, on our ability to protect our proprietary methodologies, processes, know-how, tools, techniques and other intellectual property that we use to provide our services. Although CGI takes reasonable steps (e.g. available copyright protection and, in some cases, patent protection) to protect and enforce its intellectual property rights, there is no assurance that such measures will be enforceable or adequate. The cost of enforcing our rights can be substantial and, in certain cases, may prove to be uneconomic. In addition, the laws of some countries in which we conduct business may offer only limited intellectual property rights protection. Despite our efforts, the steps taken to protect our intellectual property may not be adequate to prevent or deter infringement or other misappropriation of intellectual property, and we may not be able to detect unauthorized use of our intellectual property, or take appropriate steps to enforce our intellectual property rights.
Benchmarking provisions within certain contracts
Some of our managed IT and business process services contracts contain clauses allowing our clients to externally benchmark the pricing of agreed upon services against those offered by other providers in a peer comparison group. The uniqueness of
| CGI Inc. - Management’s Discussion and Analysis for the year ended September 30, 2019 | Page 56 |
the client environment should be factored in and, if results indicate a difference outside the agreed upon tolerance, we may be required to work with clients to reset the pricing for their services. There can be no assurance that benchmarks will produce accurate or reliable data, including pricing data. This may result in pressure on our revenue, net earnings and resulting cash flow from operations.
| CGI Inc. - Management’s Discussion and Analysis for the year ended September 30, 2019 | Page 57 |
10.1.3. Risks Related to our Business
Risks associated with our growth strategy
CGI’s Build and Buy strategy is founded on four pillars of growth: first, organic growth through smaller contract wins, renewals and extensions in the areas of managed IT and business process services and system integration; second, the pursuit of new large long-term managed IT and business process services contracts; third, acquisitions of smaller firms or niche players; and fourth, large transformational acquisitions.
Our ability to achieve organic growth is affected by a number of factors outside of our control, including a lengthening of our sales cycle for major managed IT and business process services contracts.
Our ability to grow through niche and transformational acquisitions requires that we identify suitable acquisition targets that we correctly evaluate their potential as transactions that will meet our financial and operational objectives, and that we successfully integrate them into our business. There can, however, be no assurance that we will be able to identify suitable acquisition targets and consummate additional acquisitions that meet our economic thresholds, or that future acquisitions will be successfully integrated into our operations and yield the tangible accretive value that had been expected.
If we are unable to implement our Build and Buy strategy, we will likely be unable to maintain our historic or expected growth rates.
The variability of financial results
Our ability to maintain and increase our revenue is affected not only by our success in implementing our Build and Buy strategy, but also by a number of other factors, which could cause the Company’s financial results to fluctuate. These factors include: (i) our ability to introduce and deliver new services and business solutions; (ii) our potential exposure to a lengthened sales cycle; (iii) the cyclicality of the purchases of our technology services and products; (iv) the nature of our client’s business (for example, if a client encounters financial difficulty, it may be forced to cancel, reduce or defer existing contracts with us); and (v) the structure of our agreements with clients (for example, some of CGI’s agreements with clients contain clauses allowing the clients to benchmark the pricing of services provided by CGI against the prices offered by other providers). These, and other factors, make it difficult to predict financial results for any given period.
Business mix variations
The proportion of revenue that we generate from shorter-term system integration and consulting projects (SI&C), versus revenue from long-term managed IT and business process services contracts, will fluctuate at times, affected by acquisitions or other transactions. An increased exposure to revenue from SI&C projects may result in greater quarterly revenue variations, as the revenue from SI&C projects does not provide long-term consistency in revenue.
The financial and operational risks inherent in worldwide operations
We manage operations in numerous countries around the world including offshore delivery centers. The scope of our operations (including our offshore delivery centers) subjects us to issues that can negatively impact our operations, including: currency fluctuations (see foreign exchange risk); the burden of complying with a wide variety of national and local laws (see regulatory risk); the differences in and uncertainties arising from local business culture and practices; political, social and economic instability. Any or all of these risks could impact our global business operations and cause our profitability to decline.
Organizational challenges associated with our size
Our culture, standards, core values, internal controls and our policies need to be instilled across newly acquired businesses as well as maintained within our existing operations. To effectively communicate and manage these standards throughout a large global organization is both challenging and time consuming. Newly acquired businesses may be resistant to change and may remain attached to past methods, standards and practices which may compromise our business agility in pursuing opportunities. Cultural differences in various countries may also present barriers to introducing new ideas or aligning our vision and strategy with the rest of the organization. If we cannot overcome these obstacles in maintaining a strategic bond throughout the Company worldwide, we may not be able to achieve our growth and profitability objectives.
| CGI Inc. - Management’s Discussion and Analysis for the year ended September 30, 2019 | Page 58 |
Taxes and tax credit programs
In estimating our income tax payable, management uses accounting principles to determine income tax positions that are likely to be sustained by applicable tax authorities. However, there is no assurance that our tax benefits or tax liability will not materially differ from our estimates or expectations. The tax legislation, regulation and interpretation that apply to our operations are continually changing. In addition, future tax benefits and liabilities are dependent on factors that are inherently uncertain and subject to change, including future earnings, future tax rates, and anticipated business mix in the various jurisdictions in which we operate. Moreover, our tax returns are continually subject to review by applicable tax authorities and we are subject to ongoing audits, investigations and tax proceedings in various jurisdictions. These tax authorities determine the actual amounts of taxes payable or receivable, of any future tax benefits or liabilities and of income tax expense that we may ultimately recognize. Tax authorities have disagreed and may in the future disagree with our income tax positions and are taking increasingly aggressive positions in respect of income tax positions, including with respect to intercompany transactions.
Our effective tax rate in the future could be adversely affected by challenges to intercompany transactions, changes in the value of deferred tax assets and liabilities, changes in tax law or in their interpretation or enforcement, changes in the mix of earnings in countries with differing statutory tax rates, the expiration of tax benefits and changes in accounting principles. Tax rates in the jurisdictions in which we operate may change as a result of shifting economic conditions and tax policies.
A number of countries in which the Company does business have implemented, or are considering implementing, changes in relevant tax, accounting and other laws, regulations and interpretations and the overall tax environment has made it increasingly challenging for multinational corporations to operate with certainty about taxation in many jurisdictions.
Any of the above factors could have a material adverse effect on our net income or cash flow by affecting our operations and profitability, our effective tax rate, the availability of tax credits, the cost of the services we provide, and the availability of deductions for operating losses.
Benefits obtained from government sponsored programs
We benefit from government sponsored programs designed to support research and development, labour and economic growth in jurisdictions where we operate. Government programs reflect government policy and depend on various political and economic factors. There can be no assurance that such government programs will continue to be available to the Company in the future, or will not be reduced, amended or eliminated. Any future government program reductions or eliminations or other amendments to the tax credit programs could increase operating or capital expenditures incurred by the Company and have a material adverse effect on its net earnings or cash flow.
Credit risk with respect to accounts receivable and work in progress
In order to sustain our cash flow from operations, we must invoice and collect the amounts owed to us in an efficient and timely manner. Although we maintain provisions to account for anticipated shortfalls in amounts collected from clients, the provisions we take are based on management estimates and on our assessment of our clients’ creditworthiness which may prove to be inadequate in the light of actual results. To the extent that we fail to perform our services in accordance with our contracts and our clients’ reasonable expectations, and to the extent that we fail to invoice clients and to collect the amounts owed to the Company for our services correctly in a timely manner, our collections could suffer, which could materially adversely affect our revenue, net earnings and cash flow. In addition, a prolonged economic downturn may cause clients to curtail or defer projects, impair their ability to pay for services already provided, and ultimately cause them to default on existing contracts, in each case, causing a shortfall in revenue and impairing our future prospects.
Material developments regarding major commercial clients resulting from such causes as changes in financial condition, mergers or business acquisitions
Consolidation among our clients resulting from mergers and acquisitions may result in loss or reduction of business when the successor business’ IT needs are served by another service provider or are provided by the successor company’s own personnel. Growth in a client’s IT needs resulting from acquisitions or operations may mean that we no longer have a sufficient
| CGI Inc. - Management’s Discussion and Analysis for the year ended September 30, 2019 | Page 59 |
geographic scope or the critical mass to serve the client’s needs efficiently, resulting in the loss of the client’s business and impairing our future prospects. There can be no assurance that we will be able to achieve the objectives of our growth strategy in order to maintain and increase our geographic scope and critical mass in our targeted markets.
Early termination risk
If we should fail to deliver our services according to contractual agreements, some of our clients could elect to terminate contracts before their agreed expiry date, which would result in a reduction of our earnings and cash flow and may impact the value of our backlog of orders. In addition, a number of our managed IT and business process services contractual agreements have termination for convenience and change of control clauses according to which a change in the client’s intentions or a change in control of CGI could lead to a termination of these agreements. Early contract termination can also result from the exercise of a legal right or when circumstances that are beyond our control or beyond the control of our client prevent the contract from continuing. In cases of early termination, we may not be able to recover capitalized contract costs and we may not be able to eliminate ongoing costs incurred to support the contract.
Cost estimation risks
In order to generate acceptable margins, our pricing for services is dependent on our ability to accurately estimate the costs and timing for completing projects or long-term managed IT and business process services contracts, which can be based on a client’s bid specification, sometimes in advance of the final determination of the full scope and design of the contract. In addition, a significant portion of our project-oriented contracts are performed on a fixed-price basis. Billing for fixed-price engagements is carried out in accordance with the contract terms agreed upon with our client, and revenue is recognized based on the percentage of effort incurred to date in relation to the total estimated efforts to be incurred over the duration of the respective contract. These estimates reflect our best judgement regarding the efficiencies of our methodologies and professionals as we plan to apply them to the contracts in accordance with the CGI Client Partnership Management Framework (CPMF), a framework that contains high standards of contract management to be applied throughout the Company. If we fail to apply the CPMF correctly or if we are unsuccessful in accurately estimating the time or resources required to fulfill our obligations under a contract, or if unexpected factors, including those outside of our control, arise, there may be an impact on costs or the delivery schedule which could have a material adverse effect on our expected net earnings.
Risks related to teaming agreements and subcontracts
We derive revenue from contracts where we enter into teaming agreements with other providers. In some teaming agreements we are the prime contractor whereas in others we act as a subcontractor. In both cases, we rely on our relationships with other providers to generate business and we expect to continue to do so in the foreseeable future. Where we act as prime contractor, if we fail to maintain our relationships with other providers, we may have difficulty attracting suitable participants in our teaming agreements. Similarly, where we act as subcontractor, if our relationships are impaired, other providers might reduce the work they award to us, award that work to our competitors, or choose to offer the services directly to the client in order to compete with our business. In either case, if we fail to maintain our relationship with these providers or if our relationship with these providers is otherwise impaired, our business, prospects, financial condition and operating results could be materially adversely affected.
Our partners’ ability to deliver on their commitments
Increasingly large and complex contracts may require that we rely on third party subcontractors including software and hardware vendors to help us fulfill our commitments. Under such circumstances, our success depends on the ability of the third parties to perform their obligations within agreed upon budgets and timeframes. If our partners fail to deliver, our ability to complete the contract may be adversely affected, which could have an unfavourable impact on our profitability.
Guarantees risk
In the normal course of business, we enter into agreements that may provide for indemnification and guarantees to counterparties in transactions such as consulting and managed IT and business process services services, business divestitures, lease agreements and financial obligations. These indemnification undertakings and guarantees may require us
| CGI Inc. - Management’s Discussion and Analysis for the year ended September 30, 2019 | Page 60 |
to compensate counterparties for costs and losses incurred as a result of various events, including breaches of representations and warranties, intellectual property right infringement, claims that may arise while providing services or as a result of litigation that may be suffered by counterparties.
Risk related to human resources utilization rates
In order to maintain our net earnings, it is important that we maintain the appropriate availability of professional resources in each of our geographies by having a high utilization rate while still being able to assign additional resources to new work. Maintaining an efficient utilization rate requires us to forecast our need for professional resources accurately and to manage recruitment activities, professional training programs, attrition rates and restructuring programs appropriately. To the extent that we fail to do so, or to the extent that laws and regulations restrict our ability to do so, our utilization rates may be reduced; thereby having an impact on our revenue and profitability. Conversely, we may find that we do not have sufficient resources to deploy against new business opportunities in which case our ability to grow our revenue would suffer.
Client concentration risk
We derive a significant portion of our revenue from the services we provide to various U.S. federal government departments and agencies. We expect that this will continue for the foreseeable future. There can be, however, no assurance that each such U.S. federal government department and agency will continue to utilize our services to the same extent, or at all in the future. In the event that a major U.S. federal government department or agency were to limit, reduce, or eliminate the business it awards to us, we might be unable to recover the lost revenue with work from other U.S. federal government departments or agencies or other clients, and our business, prospects, financial condition and operating results could be materially and adversely affected. Although IFRS considers a national government and its departments and agencies as a single client, our client base in the U.S. government economic sector is in fact diversified with contracts from many different departments and agencies.
Government business risk
Changes in government spending policies or budget priorities could directly affect our financial performance. Among the factors that could harm our government contracting business are: the curtailment of governments’ use of consulting and IT services firms; a significant decline in spending by governments in general, or by specific departments or agencies in particular; the adoption of new legislation and/or actions affecting companies that provide services to governments; delays in the payment of our invoices by government; and general economic and political conditions. These or other factors could cause government agencies and departments to reduce their purchases under contracts, to exercise their right to terminate contracts, to issue temporary stop work orders, or not to exercise options to renew contracts, any of which would cause us to lose future revenue. Government spending reductions or budget cutbacks at these departments or agencies could materially harm our continued performance under these contracts, or limit the awarding of additional contracts from these agencies.
Regulatory risk
Our global operations require us to be compliant with laws and regulations in many jurisdictions on matters such as: anti-corruption, trade restrictions, immigration, taxation, securities, antitrust, data privacy, labour relations, and the environment, amongst others. Complying with these diverse requirements worldwide is a challenge and consumes significant resources. The laws and regulations frequently change and some may impose conflicting requirements which may expose us to penalties for non-compliance and harm our reputation. Furthermore, in some jurisdictions, we may face the absence of effective laws and regulations to protect our intellectual property rights and there may be restrictions on the movement of cash and other assets, on the import and export of certain technologies, and on the repatriation of earnings. Any or all of these risks could impact our global business operations and cause our profitability to decline.
Our business with the U.S. federal government departments and agencies also requires that we comply with complex laws and regulations relating to government contracts. These laws and regulations relate to the integrity of the procurement process, impose disclosure requirements, and address national security concerns, among other matters. For instance, we are routinely subject to audits by U.S. government departments and agencies with respect to compliance with these rules. If we fail to
| CGI Inc. - Management’s Discussion and Analysis for the year ended September 30, 2019 | Page 61 |
comply with these requirements we may incur penalties and sanctions, including contract termination, suspension of payments, suspension or debarment from doing business with the federal government, and fines.
Legal claims made against our work
We create, implement and maintain IT solutions that are often critical to the operations of our clients’ business. Our ability to complete large projects as expected could be adversely affected by unanticipated delays, renegotiations, and changing client requirements or project delays. Also, our solutions may suffer from defects that adversely affect their performance; they may not meet our clients’ requirements or may fail to perform in accordance with applicable service levels. Such problems could subject us to legal liability, which could materially adversely affect our business, operating results and financial condition, and may negatively affect our professional reputation. While we typically use reasonable efforts to include provisions in our contracts which are designed to limit our exposure to legal claims relating to our services and the applications we develop, we may not always be able to include such provisions and, where we are successful, such provisions may not protect us adequately or may not be enforceable under some circumstances or under the laws of some jurisdictions.
Data protection and infrastructure risks
Our business often requires that our clients’ applications and information, which may include their proprietary information and personal information they manage, be processed and stored on our networks and systems, and in data centers that we manage. We also process and store proprietary information relating to our business, and personal information relating to our members. The Company is subject to numerous laws and regulations designed to protect information, such as the European Union’s General Data Protection Regulation (GDPR), various laws and regulations in Canada, the U.S. and other countries in which the Company operates governing the protection of health or other personally identifiable information and data privacy. These laws and regulations are increasing in number and complexity and are being adopted and amended with greater frequency, which results in greater compliance risk and cost. The potential financial penalties for non-compliance with these laws and regulations have significantly increased with the adoption of the GDPR. The Company’s Chief Data Protection Officer oversees the Company’s compliance with the laws that protect the privacy of personal information. The Company faces risks inherent in protecting the security of such personal data which have grown in complexity, magnitude and frequency in recent years. Digital information and equipment are subject to loss, theft or destruction, and services that we provide may become temporarily unavailable as a result of those risks, or upon an equipment or system malfunction. The causes of such failures include human error in the course of normal operations (including from advertent or inadvertent actions or inactions by our members), maintenance and upgrading activities, as well as hacking, vandalism (including denial of service attacks and computer viruses), theft, and unauthorized access, as well as power outages or surges, floods, fires, natural disasters and many other causes. The measures that we take to protect against all information infrastructure risks, including both physical and logical controls on access to premises and information may prove in some circumstances to be inadequate to prevent the improper disclosure, loss, theft, misappropriation of, unauthorized access to, or destruction of client information, or service interruptions. Such events may expose the Company to financial loss arising from the costs of remediation and those arising from litigation from our clients and third parties (including under the laws that protect the privacy of personal information), claims and damages, as well as expose the Company to government sanctions and damage to our brand and reputation.
Security and cybersecurity risks
In the current environment, there are numerous and evolving security risks, especially from cyber threats, including criminal hackers, hacktivists, state sponsored organizations, industrial espionage, employee misconduct, and human or technological error. As a worldwide IT and business consulting firm providing services to both the private and public sectors, we process and store increasingly large amounts of data for our clients, including proprietary information and personal information. Consequently, our business could be negatively impacted by physical and cyber threats, which could affect our future sales and financial position or increase our costs and expenses. An unauthorized disclosure of sensitive or confidential client or member information, including by cyber-attacks or other security breaches, could cause a loss of data, give rise to remediation or other expenses, expose us to liability under federal and state laws, and subject us to litigation and investigations, which could have an adverse effect on our business, cash flows, financial condition and results of operations. These security risks to the Company include potential attacks not only of our own products, services and systems, but also those of our clients,
| CGI Inc. - Management’s Discussion and Analysis for the year ended September 30, 2019 | Page 62 |
contractors, business partners, vendors and other third parties. The Company’s Chief Security Officer is responsible for overseeing the security of the Company. We seek to detect and investigate all security incidents and to prevent their occurrence or recurrence, by: (i) developing and regularly reviewing policies and standards related to information security, data privacy, physical security and business continuity, (ii) monitoring the Company’s performance against these policies and standards, (iii) developing strategies intended to seek to mitigate the Company’s risks, including through security trainings for all employees to increase awareness of potential cyber threats, (iv) implementing security measures to ensure an appropriate level of control based on the nature of the information and the inherent risks attached thereto, including through access management, security monitoring and testing to mitigate and help detect and respond to attempts to gain unauthorized access to information systems and networks, and (v) working with the industry and governments against cyber threats. However, because of the evolving nature and sophistication of these security threats, there can be no assurance that our safeguards will detect or prevent the occurrence of material cyber breaches, intrusions or attacks. We are regularly the target of attempted cyber and other security threats and must continuously monitor and develop our information technology networks and infrastructure to prevent, detect, address and mitigate the risk of unauthorized access, misuse, computer viruses and other events that could have a security impact. Insider or employee cyber and security threats are increasingly a concern for all large companies, including ours. CGI is continuously working to install new, and upgrade its existing, information technology systems and provide member awareness training around phishing, malware, and other cyber risks to ensure that the Company is protected, to the greatest extent possible, against cyber risks and security breaches. While CGI selects third-party vendors carefully, it does not control their actions. Any problems caused by these third parties, including those resulting from breakdowns or other disruptions in communication services provided by a vendor, failure of a vendor to handle current or higher volumes, cyber-attacks and security breaches at a vendor could adversely affect the our ability to deliver products and services to our customers and otherwise conduct business. Furthermore, while our liability insurance policy covers cyber risks, there is no assurance that such insurance coverage will be sufficient in type or amount to cover the costs, damages, liabilities or losses that could result from security breaches, cyber-attacks and other related breaches. As the cyber threat landscape evolves, the Company may find it necessary to make further significant investments to protect data and infrastructure. Occurrence of any of the aforementioned security threats could expose the Company, our clients or other third parties to potential liability, litigation, and regulatory action, as well as the loss of client confidence, loss of existing or potential clients, loss of sensitive government contracts, damage to brand and reputation, and other financial loss.
Risk of harm to our reputation
CGI’s reputation as a capable and trustworthy service provider and long-term business partner is key to our ability to compete effectively in the market for IT services. The nature of our operations exposes us to the potential loss, unauthorized access to, or destruction of our clients’ information, as well as temporary service interruptions. Depending on the nature of the information or services, such events may have a negative impact on how the Company is perceived in the marketplace. Under such circumstances, our ability to obtain new clients and retain existing clients could suffer with a resulting impact on our revenue and net earnings.
Risks associated with the integration of new operations
The successful integration of new operations arising from our acquisition strategy or from large managed IT and business process services contracts requires that a substantial amount of management time and attention be focused on integration tasks. Management time that is devoted to integration activities may detract from management’s normal operations focus with resulting pressure on the revenues and earnings from our existing operations. In addition, we may face complex and potentially time-consuming challenges in implementing uniform standards, controls, procedures and policies across new operations when harmonizing their activities with those of our existing business units. Integration activities can result in unanticipated operational problems, expenses and liabilities. If we are not successful in executing our integration strategies in a timely and cost-effective manner, we will have difficulty achieving our growth and profitability objectives.
Internal controls risks
Due to the inherent limitations of internal controls including the circumvention or overriding of controls, or fraud, there can only be reasonable assurance that the Company’s internal controls will detect and prevent a misstatement. If the Company is
| CGI Inc. - Management’s Discussion and Analysis for the year ended September 30, 2019 | Page 63 |
unable to design, implement, monitor and maintain effective internal controls throughout its different business environments, the efficiency of our operations might suffer, resulting in a decline in revenue and profitability, and the accuracy of our financial reporting could be impaired.
Liquidity and funding risks
The Company’s future growth is contingent on the execution of its business strategy, which, in turn, is dependent on its ability to grow the business organically as well as through business acquisitions. In the event we would need to raise additional funds through equity or debt financing to fund any currently unidentified or unplanned future acquisitions and other growth opportunities, there can be no assurance that such financing will be available in amounts and on terms acceptable to us. Our ability to raise the required funding depends on the capacity of the capital markets to meet our equity and/or debt financing needs in a timely fashion and on the basis of interest rates and/or share prices that are reasonable in the context of our commercial objectives. Increasing interest rates, volatility in our share price, and the capacity of our current lenders to meet our additional liquidity requirements are all factors that may have a material adverse effect on any acquisitions or growth activities that we may, in the future, identify or plan. If we are unable to obtain the necessary funding, we may be unable to achieve our growth objectives.
Foreign exchange risk
The majority of our revenue and costs are denominated in currencies other than the Canadian dollar. Foreign exchange fluctuations impact the results of our operations as they are reported in Canadian dollars. This risk is partially mitigated by a natural hedge in matching our costs with revenue denominated in the same currency and through the use of derivatives in our global hedging strategy. However, as we continue our global expansion, natural hedges may begin to diminish and the use of hedging contracts exposes us to the risk that financial institutions could fail to perform their obligations under our hedging instruments. Furthermore, there can be no assurance that our hedging strategy and arrangements will offset the impact of fluctuations in currency exchange rates, which could materially adversely affect our business revenues, results of operations, financial condition or prospects. Other than the use of financial products to deliver on our hedging strategy, we do not trade derivative financial instruments.
Our functional and reporting currency is the Canadian dollar. As such, our U.S., European and Asian investments, operations and assets are exposed to net change in currency exchange rates. Volatility in exchange rates could have an adverse effect on our business, financial condition and results of operations.
The Company is involved in legal proceedings, audits, claims and litigation arising in the ordinary course of its business. Certain of these matters seek damages in significant amounts. Although the outcome of such matters is not predictable with assurance, the Company has no reason to believe that the disposition of any such current matter could reasonably be expected to have a material adverse effect on the Company’s financial position, results of operations or the ability to carry on any of its business activities.
| CGI Inc. - Management’s Discussion and Analysis for the year ended September 30, 2019 | Page 64 |
Transfer Agent
Computershare Investor Services Inc.
(800) 564-6253
Investor Relations
Lorne Gorber
Executive Vice-President, Investor and Public Relations
Telephone: (514) 841-3355
lorne.gorber@cgi.com
1350 René-Lévesque Boulevard West
25th Floor
Montréal, Quebec
H3G 1T4
Canada
| CGI Inc. - Management’s Discussion and Analysis for the year ended September 30, 2019 | Page 65 |