QUARTERLY REPORT PURSUANT TO SECTION 13 OR 15(d) OF THE SECURITIES EXCHANGE ACT OF 1934 |
TRANSITION REPORT PURSUANT TO SECTION 13 OR 15(d) OF THE SECURITIES EXCHANGE ACT OF 1934 |

(State or other jurisdiction of incorporation or organization) | (I.R.S. Employer Identification No.) |
Title of each class | Trading symbol(s) | Name of each exchange on which registered | |||
☒ | Accelerated filer | ☐ | ||
Non-accelerated filer | ☐ | Smaller reporting company | ||
Emerging growth company |
Page | ||
PART I. | FINANCIAL INFORMATION | |
ITEM 1. | ||
Consolidated Financial Statements (Unaudited): | ||
ITEM 2. | ||
ITEM 3. | ||
ITEM 4. | ||
PART II. | OTHER INFORMATION | |
ITEM 1. | ||
ITEM 1A. | ||
ITEM 2. | ||
ITEM 3. | ||
ITEM 4. | ||
ITEM 5. | ||
ITEM 6. | ||
June 30, 2025 | December 31, 2024 | ||
Assets | |||
Cash and cash equivalents | $ | $ | |
Loans receivable | |||
Current expected credit loss reserve | ( | ( | |
Loans receivable, net | |||
Real estate owned, net | |||
Investments in unconsolidated entities (includes $ June 30, 2025 and December 31, 2024, respectively) | |||
Other assets | |||
Total Assets | $ | $ | |
Liabilities and Equity | |||
Secured debt, net | $ | $ | |
Securitized debt obligations, net | |||
Asset-specific debt, net | |||
Loan participations sold, net | |||
Term loans, net | |||
Senior secured notes, net | |||
Convertible notes, net | |||
Other liabilities | |||
Total Liabilities | |||
Commitments and contingencies (Note 22) | |||
Equity | |||
Class A common stock, $ and December 31, 2024, respectively | |||
Additional paid-in capital | |||
Accumulated other comprehensive income | |||
Accumulated deficit | ( | ( | |
Total Blackstone Mortgage Trust, Inc. stockholders’ equity | |||
Non-controlling interests | |||
Total Equity | |||
Total Liabilities and Equity | $ | $ |
Three Months Ended June 30, | Six Months Ended June 30, | ||||||
2025 | 2024 | 2025 | 2024 | ||||
Income from loans and other investments | |||||||
Interest and related income | $ | $ | $ | $ | |||
Less: Interest and related expenses | |||||||
Income from loans and other investments, net | |||||||
Revenue from real estate owned | |||||||
Gain on extinguishment of debt | |||||||
Other income | |||||||
Total net revenues | |||||||
Expenses | |||||||
Management and incentive fees | |||||||
General and administrative expenses | |||||||
Expenses from real estate owned | |||||||
Total expenses | |||||||
Increase in current expected credit loss reserve | ( | ( | ( | ( | |||
Loss from unconsolidated entities | ( | ( | |||||
Income (loss) before income taxes | ( | ( | |||||
Income tax provision | |||||||
Net income (loss) | ( | ( | |||||
Net income attributable to non-controlling interests | ( | ( | ( | ( | |||
Net income (loss) attributable to Blackstone Mortgage Trust, Inc. | $ | $( | $ | $( | |||
Net income (loss) per share of common stock, basic and diluted | $ | $( | $ | $( | |||
Weighted-average shares of common stock outstanding, basic and diluted | |||||||
Three Months Ended June 30, | Six Months Ended June 30, | ||||||
2025 | 2024 | 2025 | 2024 | ||||
Net income (loss) | $ | $( | $ | $( | |||
Other comprehensive income | |||||||
Unrealized gain (loss) on foreign currency translation | ( | ||||||
Realized and unrealized (loss) gain on derivative financial instruments | ( | ( | ( | ||||
Unrealized loss on derivative financial instruments from unconsolidated entities | ( | ( | |||||
Other comprehensive income | |||||||
Comprehensive income (loss) | ( | ( | |||||
Comprehensive income attributable to non- controlling interests | ( | ( | ( | ( | |||
Comprehensive income (loss) attributable to Blackstone Mortgage Trust, Inc. | $ | $( | $ | $( | |||
Blackstone Mortgage Trust, Inc. | |||||||||||||
Class A Common Stock | Additional Paid- In Capital | Accumulated Other Comprehensive Income (Loss) | Accumulated Deficit | Stockholders’ Equity | Non- Controlling Interests | Total Equity | |||||||
Balance at December 31, 2024 | $ | $ | $ | $( | $ | $ | $ | ||||||
Shares of class A common stock issued, net | ( | — | — | — | — | ||||||||
Repurchases of class A common stock | ( | ( | — | — | ( | — | ( | ||||||
Restricted class A common stock earned | — | — | — | ||||||||||
Dividends reinvested | — | — | — | — | |||||||||
Deferred directors’ compensation | — | — | — | — | |||||||||
Net (loss) income | — | — | — | ( | ( | ( | |||||||
Other comprehensive income | — | — | — | — | |||||||||
Dividends declared on common stock and deferred stock units, $ | — | — | — | ( | ( | — | ( | ||||||
Distributions to non-controlling interests | — | — | — | — | — | ( | ( | ||||||
Balance at March 31, 2025 | $ | $ | $ | $( | $ | $ | $ | ||||||
Repurchases of class A common stock | ( | — | — | ( | — | ( | |||||||
Restricted class A common stock earned | — | — | — | ||||||||||
Dividends reinvested | — | — | — | — | |||||||||
Deferred directors’ compensation | — | — | — | — | |||||||||
Net income | — | — | — | ||||||||||
Other comprehensive income | — | — | — | — | |||||||||
Dividends declared on common stock and deferred stock units, $ | — | — | — | ( | ( | — | ( | ||||||
Balance at June 30, 2025 | $ | $ | $ | $( | $ | $ | $ | ||||||
See accompanying notes to consolidated financial statements. | |||||||||||||
Blackstone Mortgage Trust, Inc. | |||||||||||||
Class A Common Stock | Additional Paid- In Capital | Accumulated Other Comprehensive Income (Loss) | Accumulated Deficit | Stockholders’ Equity | Non- Controlling Interests | Total Equity | |||||||
Balance at December 31, 2023 | $ | $ | $ | $( | $ | $ | $ | ||||||
Restricted class A common stock earned | — | — | — | ||||||||||
Dividends reinvested | — | — | — | — | |||||||||
Deferred directors’ compensation | — | — | — | — | |||||||||
Net (loss) income | — | — | — | ( | ( | ( | |||||||
Other comprehensive income | — | — | — | — | |||||||||
Dividends declared on common stock and deferred stock units, $ | — | — | — | ( | ( | — | ( | ||||||
Distributions to non-controlling interests | — | — | — | — | — | ( | ( | ||||||
Balance at March 31, 2024 | $ | $ | $ | $( | $ | $ | $ | ||||||
Restricted class A common stock earned | — | — | — | — | |||||||||
Dividends reinvested | — | — | — | — | |||||||||
Deferred directors’ compensation | — | — | — | — | |||||||||
Net (loss) income | — | — | — | ( | ( | ( | |||||||
Other comprehensive income | — | — | — | — | |||||||||
Dividends declared on common stock and deferred stock units, $ | — | — | — | ( | ( | — | ( | ||||||
Contributions from non- controlling interests | — | — | — | — | — | ||||||||
Distributions to non-controlling interests | — | — | — | — | — | ( | ( | ||||||
Balance at June 30, 2024 | $ | $ | $ | $( | $ | $ | $ | ||||||
Six Months Ended June 30, | |||
2025 | 2024 | ||
Cash flows from operating activities | |||
Net income (loss) | $ | $( | |
Adjustments to reconcile net income (loss) to net cash provided by operating activities | |||
Non-cash compensation expense | |||
Amortization of deferred fees on loans | ( | ( | |
Amortization of deferred financing costs and premiums/discounts on debt obligations | |||
Payment-in-kind interest | ( | ( | |
Increase in current expected credit loss reserve | |||
Straight-line rental income | |||
Gain on extinguishment of debt | ( | ||
Depreciation and amortization of real estate owned | |||
Loss from unconsolidated entities | |||
Unrealized loss on derivative financial instruments, net | |||
Realized gain on derivative financial instruments, net | ( | ( | |
Changes in assets and liabilities, net | |||
Other assets | |||
Other liabilities | ( | ||
Net cash provided by operating activities | |||
Cash flows from investing activities | |||
Principal fundings of loans receivable | ( | ( | |
Principal collections, sales proceeds, and cost-recovery proceeds from loans receivable | |||
Origination and other fees received on loans receivable | |||
Payments under derivative financial instruments | ( | ( | |
Receipts under derivative financial instruments | |||
Collateral deposited under derivative agreements | ( | ( | |
Return of collateral deposited under derivative agreements | |||
Investment in unconsolidated entities | ( | ||
Capital expenditures on real estate owned | ( | ||
Net cash (used in) provided by investing activities | ( | ||
Six Months Ended June 30, | |||
2025 | 2024 | ||
Cash flows from financing activities | |||
Borrowings under secured debt | $ | $ | |
Repayments under secured debt | ( | ( | |
Proceeds from issuance of securitized debt obligations | |||
Repayments of securitized debt obligations | ( | ( | |
Borrowings under asset-specific debt | |||
Repayments under asset-specific debt | ( | ||
Repayments of loan participations | ( | ( | |
Repayments and repurchases of term loans | ( | ( | |
Repurchases of senior secured notes | ( | ||
Payment of deferred financing costs | ( | ( | |
Contributions from non-controlling interests | |||
Distributions to non-controlling interests | ( | ( | |
Dividends paid on class A common stock | ( | ( | |
Repurchases of class A common stock | ( | ||
Net cash provided by (used in) financing activities | ( | ||
Net increase in cash and cash equivalents | |||
Cash and cash equivalents at beginning of period | |||
Effects of currency translation on cash and cash equivalents | ( | ||
Cash and cash equivalents at end of period | $ | $ | |
Supplemental disclosure of cash flows information | |||
Payments of interest | $( | $( | |
Payments of income taxes | $( | $( | |
Supplemental disclosure of non-cash investing and financing activities | |||
Dividends declared, not paid | $( | $( | |
Loan principal payments held by servicer, net | $ | $ | |
Transfer of senior loan to real estate owned | $ | $ | |
Assumption of other assets and liabilities related to real estate owned | $ | $ | |
June 30, 2025 | December 31, 2024 | ||
Number of loans | |||
Principal balance | $ | $ | |
Net book value | $ | $ | |
Unfunded loan commitments(1) | $ | $ | |
Weighted-average cash coupon(2) | + | + | |
Weighted-average all-in yield(2) | + | + | |
Weighted-average maximum maturity (years)(3) |
Loans Receivable Principal Balance | ||||||
Index Rate Floors | USD | Non-USD(1) | Total | |||
Fixed Rate | $ | $ | $ | |||
0.00% or no floor(2) | ||||||
0.01% to 1.00% floor | ||||||
1.01% to 2.00% floor | ||||||
2.01% to 3.00% floor | ||||||
3.01% or more floor | ||||||
Total(3) | $ | $ | $ | |||
Principal Balance | Deferred Fees / Other Items(1) | Net Book Value | |||
Loans Receivable, as of December 31, 2024 | $ | $( | $ | ||
Loan fundings | — | ||||
Loan repayments, sales, and cost-recovery proceeds | ( | ( | ( | ||
Charge-offs | ( | ( | |||
Transfer to real estate owned | ( | — | ( | ||
Transfer to other assets, net(2) | ( | — | ( | ||
Payment-in-kind interest | — | ||||
Unrealized gain (loss) on foreign currency translation | ( | ||||
Deferred fees and other items | — | ( | ( | ||
Amortization of fees and other items | — | ||||
Loans Receivable, as of June 30, 2025 | $ | $( | $ | ||
CECL reserve | ( | ||||
Loans Receivable, net, as of June 30, 2025 | $ |
June 30, 2025 | ||||||||
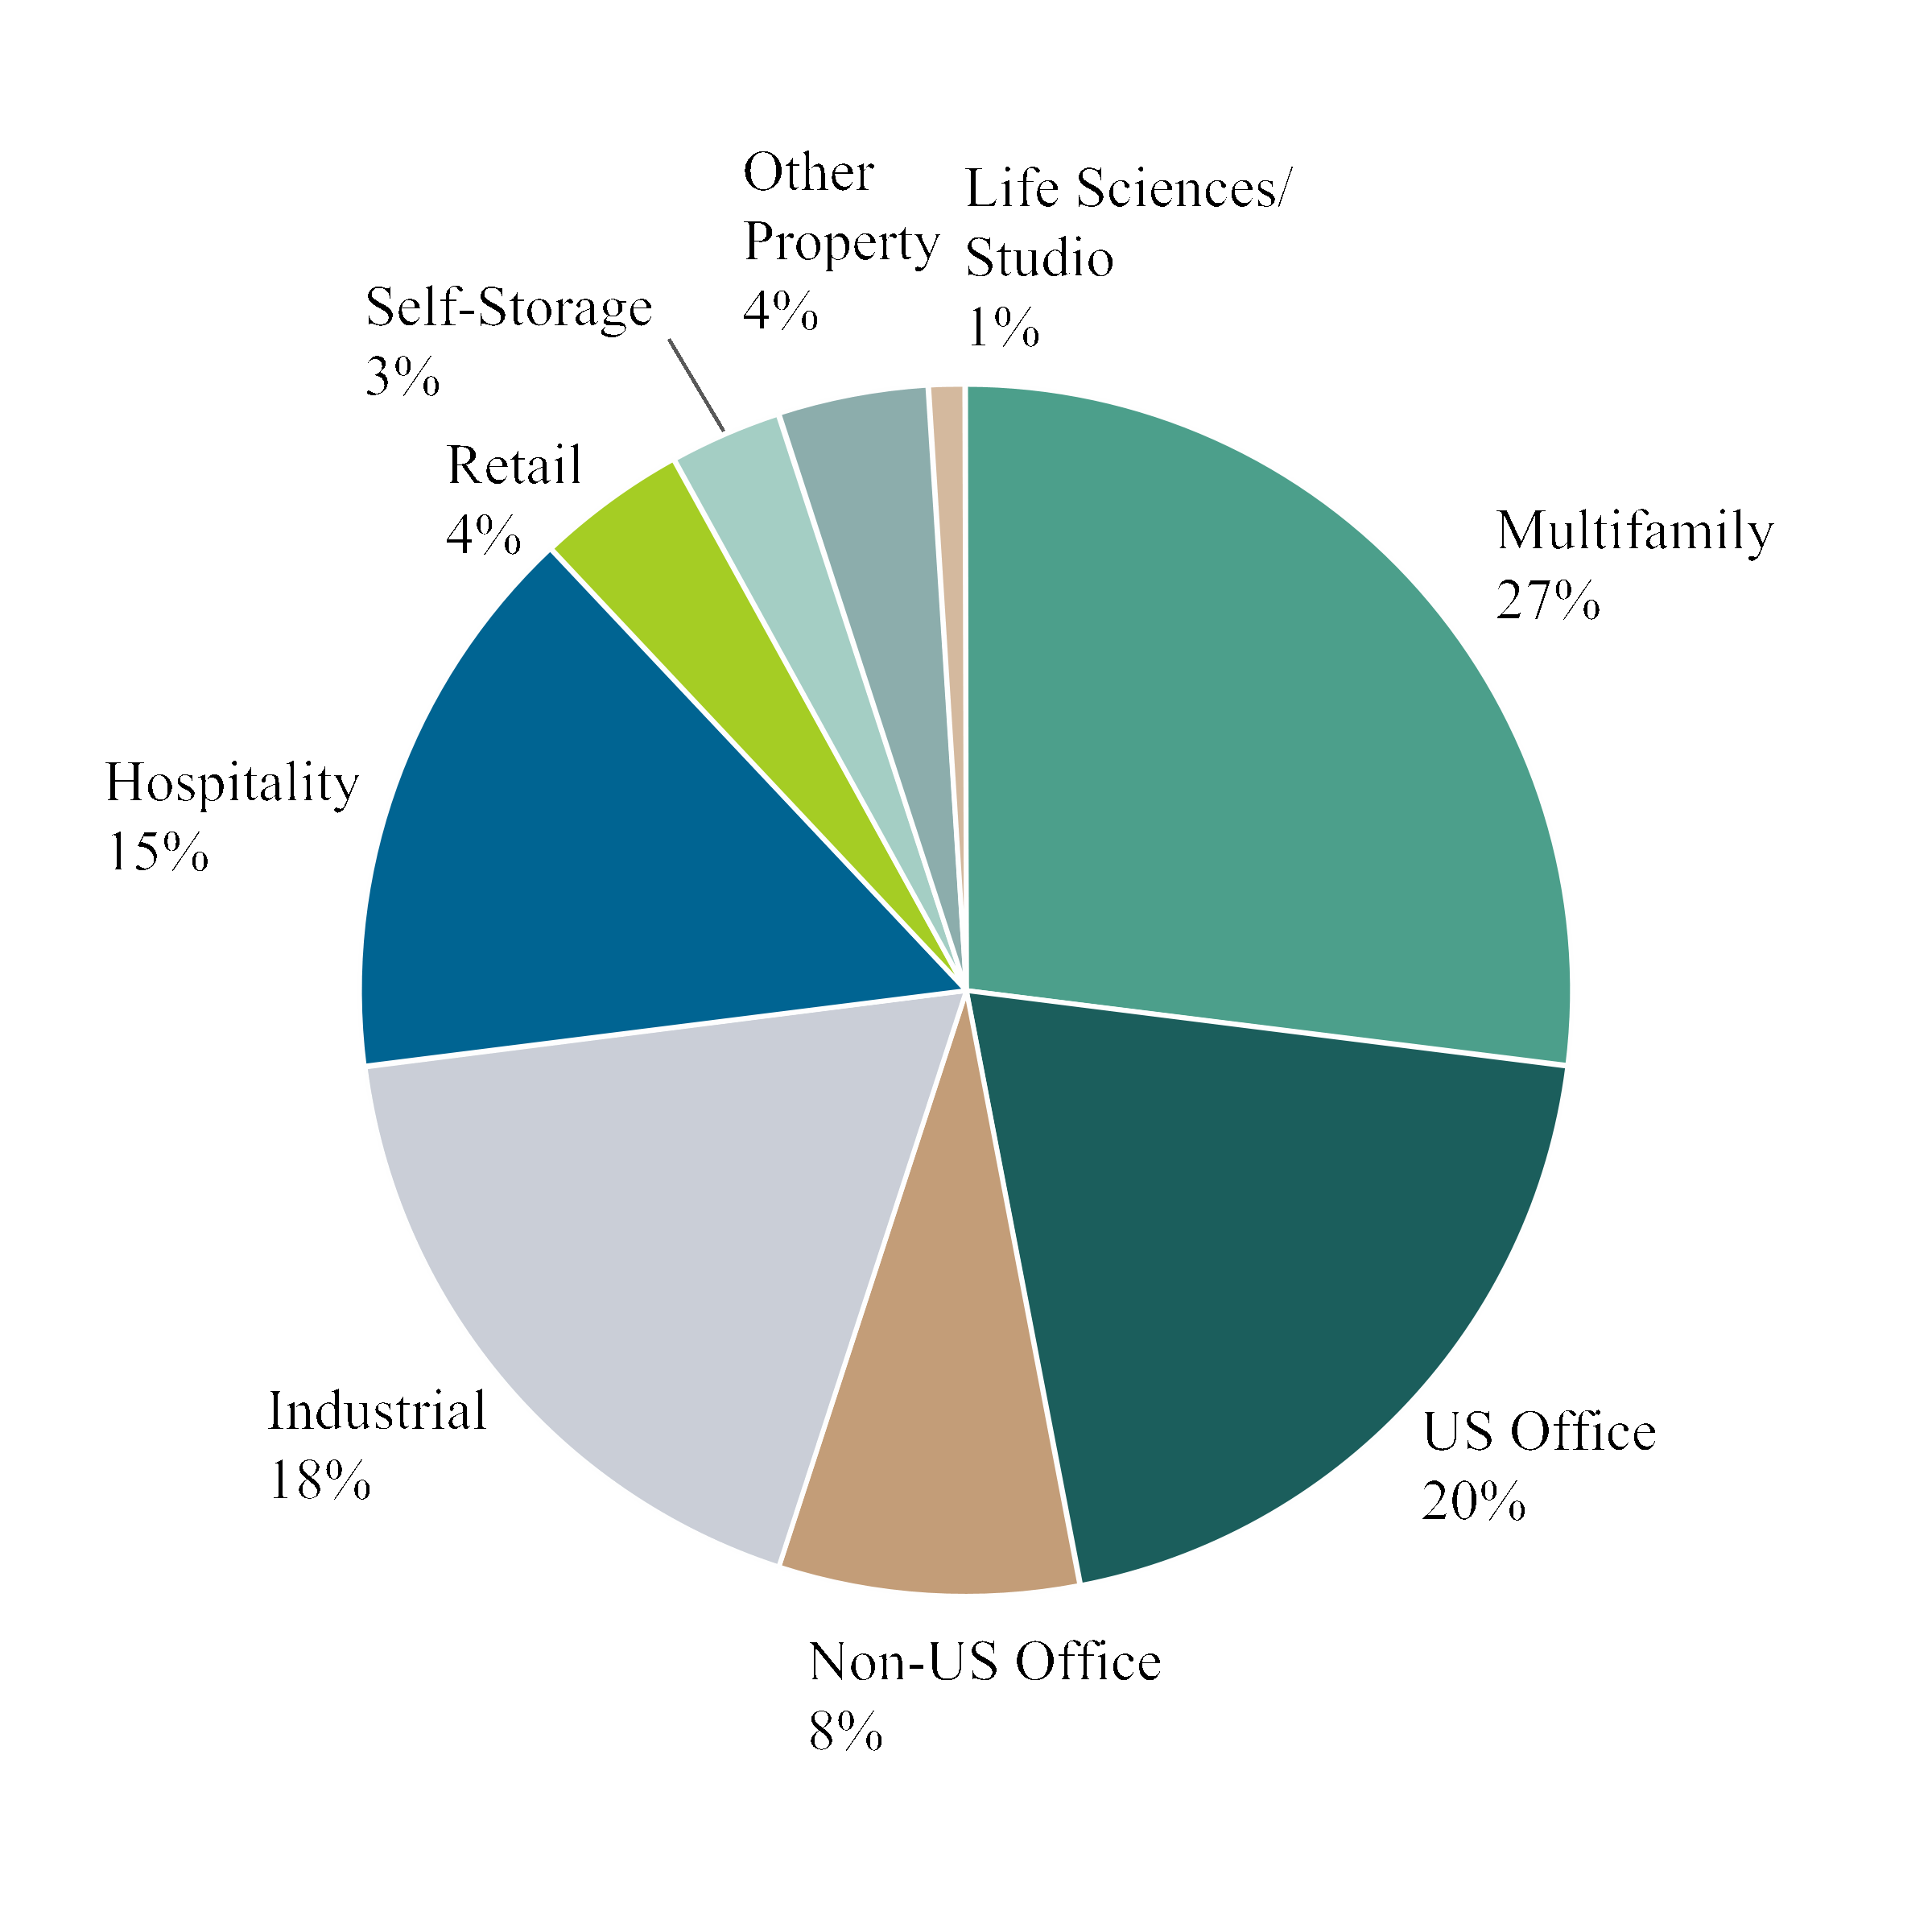
Property Type | Number of Loans | Net Book Value | Net Loan Exposure(1) | Net Loan Exposure Percentage of Portfolio | ||||
Office | $ | $ | ||||||
Multifamily | ||||||||
Industrial | ||||||||
Hospitality | ||||||||
Retail | ||||||||
Self-storage | ||||||||
Life Sciences / Studio | ||||||||
Other | ||||||||
Total loans receivable | $ | $ | ||||||
CECL reserve | ( | |||||||
Loans receivable, net | $ | |||||||
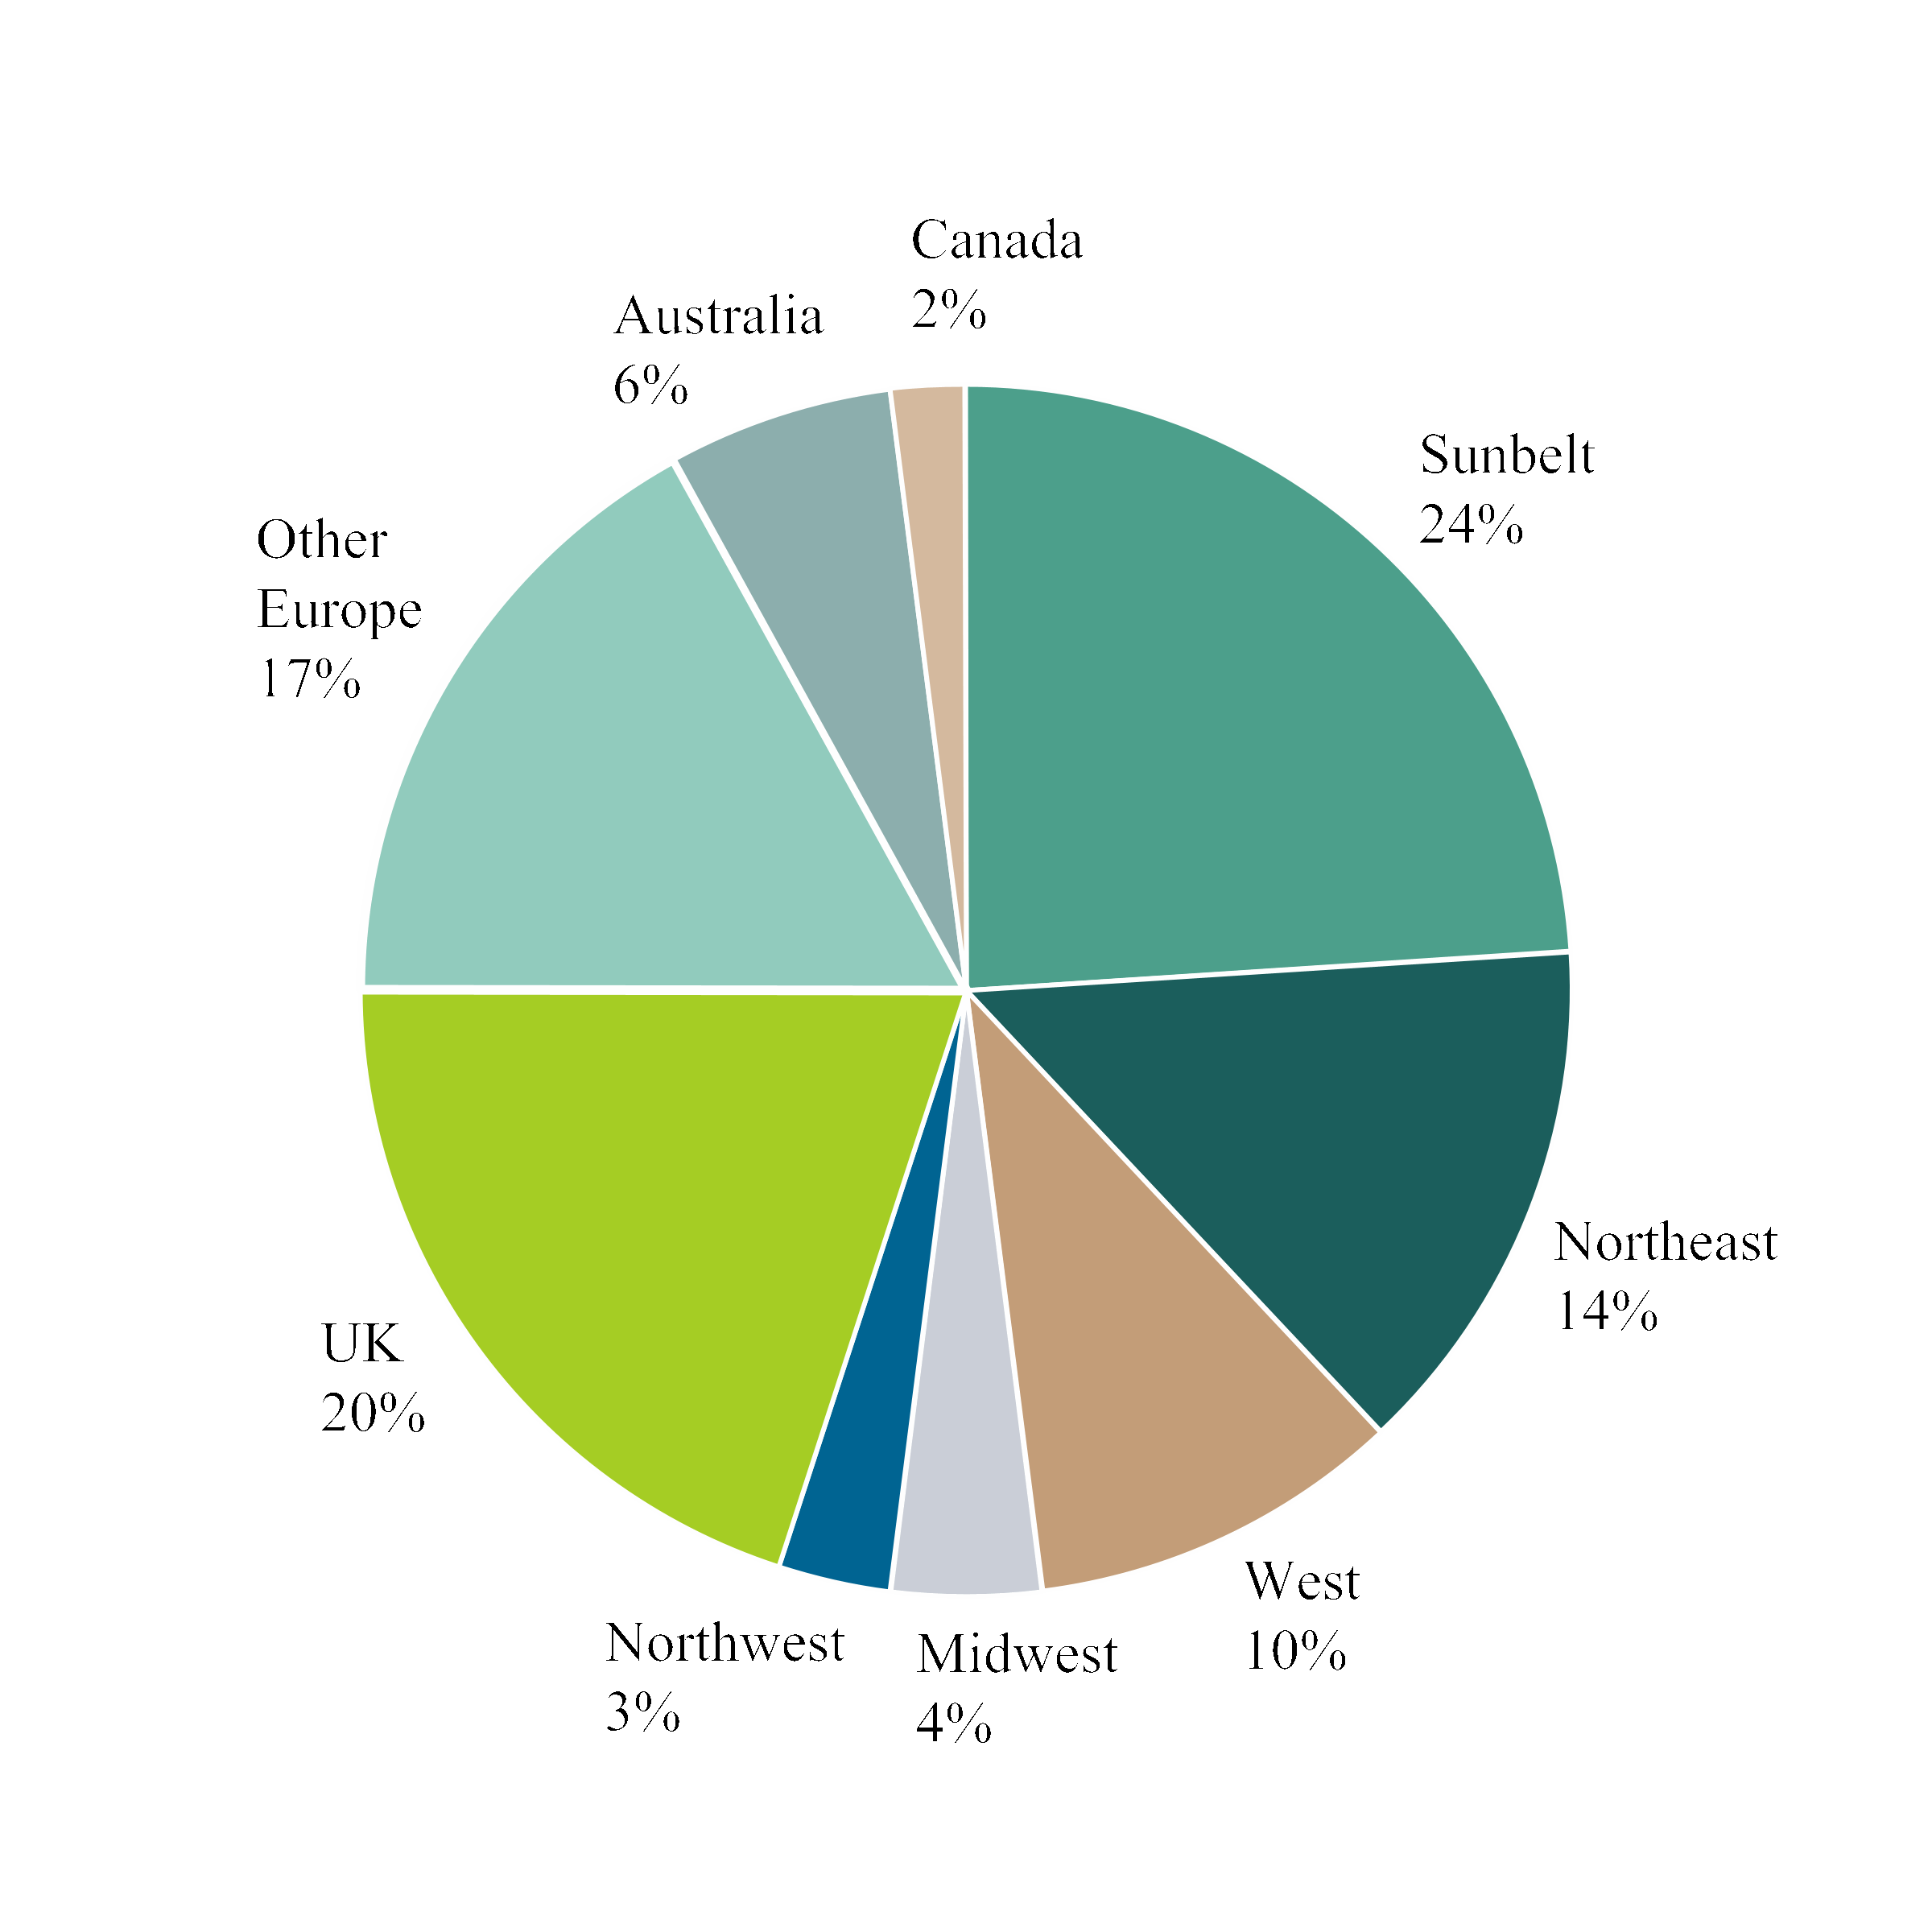
Geographic Location | Number of Loans | Net Book Value | Net Loan Exposure(1) | Net Loan Exposure Percentage of Portfolio | ||||
United States | ||||||||
Sunbelt | $ | $ | ||||||
Northeast | ||||||||
West | ||||||||
Midwest | ||||||||
Northwest | ||||||||
Subtotal | ||||||||
International | ||||||||
United Kingdom | ||||||||
Ireland | ||||||||
Australia | ||||||||
Spain | ||||||||
Sweden | ||||||||
Canada | ||||||||
Other Europe | ||||||||
Other International | ||||||||
Subtotal | ||||||||
Total loans receivable | $ | $ | ||||||
CECL reserve | ( | |||||||
Loans receivable, net | $ | |||||||
December 31, 2024 | ||||||||
Property Type | Number of Loans | Net Book Value | Net Loan Exposure(1) | Net Loan Exposure Percentage of Portfolio | ||||
Office | $ | $ | ||||||
Multifamily | ||||||||
Hospitality | ||||||||
Industrial | ||||||||
Retail | ||||||||
Life Sciences/Studio | ||||||||
Other | ||||||||
Total loans receivable | $ | $ | ||||||
CECL reserve | ( | |||||||
Loans receivable, net | $ | |||||||
Geographic Location | Number of Loans | Net Book Value | Net Loan Exposure(1) | Net Loan Exposure Percentage of Portfolio | ||||
United States | ||||||||
Sunbelt | $ | $ | ||||||
Northeast | ||||||||
West | ||||||||
Midwest | ||||||||
Northwest | ||||||||
Subtotal | ||||||||
International | ||||||||
United Kingdom | ||||||||
Ireland | ||||||||
Australia | ||||||||
Spain | ||||||||
Sweden | ||||||||
Other Europe | ||||||||
Other International | ||||||||
Subtotal | ||||||||
Total loans receivable | $ | $ | ||||||
CECL reserve | ( | |||||||
Loans receivable, net | $ | |||||||
June 30, 2025 | ||||||
Risk Rating | Number of Loans | Net Book Value | Net Loan Exposure(1) | |||
1 | $ | $ | ||||
2 | ||||||
3 | ||||||
4 | ||||||
5 | ||||||
Total loans receivable | $ | $ | ||||
CECL reserve | ( | |||||
Loans receivable, net | $ | |||||
December 31, 2024 | ||||||
Risk Rating | Number of Loans | Net Book Value | Net Loan Exposure(1) | |||
1 | $ | $ | ||||
2 | ||||||
3 | ||||||
4 | ||||||
5 | ||||||
Total loans receivable | $ | $ | ||||
CECL reserve | ( | |||||
Loans receivable, net | $ | |||||
U.S. Loans(1) | Non-U.S. Loans | Unique Loans | Impaired Loans | Total | |||||
Loans Receivable, Net | |||||||||
CECL reserves as of December 31, 2024 | $ | $ | $ | $ | $ | ||||
Increase in CECL reserves | |||||||||
Charge-offs of CECL reserves | ( | ( | |||||||
CECL reserves as of March 31, 2025 | $ | $ | $ | $ | $ | ||||
(Decrease) increase in CECL reserves | ( | ( | |||||||
Charge-offs of CECL reserves | ( | ( | |||||||
CECL reserves as of June 30, 2025 | $ | $ | $ | $ | $ | ||||
CECL reserves as of December 31, 2023 | $ | $ | $ | $ | $ | ||||
(Decrease) increase in CECL reserves | ( | ( | ( | ||||||
Charge-offs of CECL reserves | ( | ( | |||||||
CECL reserves as of March 31, 2024 | $ | $ | $ | $ | $ | ||||
(Decrease) increase in CECL reserves | ( | ( | |||||||
Charge-offs of CECL reserves | ( | ( | |||||||
CECL reserves as of June 30, 2024 | $ | $ | $ | $ | $ |
Net Book Value of Loans Receivable by Year of Origination(1) | ||||||||||||||
As of June 30, 2025 | ||||||||||||||
Risk Rating | 2025 | 2024 | 2023 | 2022 | 2021 | Prior | Total | |||||||
U.S. loans | ||||||||||||||
1 | $ | $ | $ | $ | $ | $ | $ | |||||||
2 | ||||||||||||||
3 | ||||||||||||||
4 | ||||||||||||||
5 | ||||||||||||||
Total U.S. loans | $ | $ | $ | $ | $ | $ | $ | |||||||
Non-U.S. loans | ||||||||||||||
1 | $ | $ | $ | $ | $ | $ | $ | |||||||
2 | ||||||||||||||
3 | ||||||||||||||
4 | ||||||||||||||
5 | ||||||||||||||
Total Non-U.S. loans | $ | $ | $ | $ | $ | $ | $ | |||||||
Unique loans | ||||||||||||||
1 | $ | $ | $ | $ | $ | $ | $ | |||||||
2 | ||||||||||||||
3 | ||||||||||||||
4 | ||||||||||||||
5 | ||||||||||||||
Total unique loans | $ | $ | $ | $ | $ | $ | $ | |||||||
Impaired loans | ||||||||||||||
1 | $ | $ | $ | $ | $ | $ | $ | |||||||
2 | ||||||||||||||
3 | ||||||||||||||
4 | ||||||||||||||
5 | ||||||||||||||
Total impaired loans | $ | $ | $ | $ | $ | $ | $ | |||||||
Total loans receivable | ||||||||||||||
1 | $ | $ | $ | $ | $ | $ | $ | |||||||
2 | ||||||||||||||
3 | ||||||||||||||
4 | ||||||||||||||
5 | ||||||||||||||
Total loans receivable | $ | $ | $ | $ | $ | $ | $ | |||||||
CECL reserve | ( | |||||||||||||
Loans receivable, net | $ | |||||||||||||
Gross charge-offs(2) | ( | ( | ( | $( | ||||||||||
Net Book Value of Loans Receivable by Year of Origination(1) | ||||||||||||||
As of December 31, 2024 | ||||||||||||||
Risk Rating | 2024 | 2023 | 2022 | 2021 | 2020 | Prior | Total | |||||||
U.S. loans | ||||||||||||||
1 | $ | $ | $ | $ | $ | $ | $ | |||||||
2 | ||||||||||||||
3 | ||||||||||||||
4 | ||||||||||||||
5 | ||||||||||||||
Total U.S. loans | $ | $ | $ | $ | $ | $ | $ | |||||||
Non-U.S. loans | ||||||||||||||
1 | $ | $ | $ | $ | $ | $ | $ | |||||||
2 | ||||||||||||||
3 | ||||||||||||||
4 | ||||||||||||||
5 | ||||||||||||||
Total Non-U.S. loans | $ | $ | $ | $ | $ | $ | $ | |||||||
Unique loans | ||||||||||||||
1 | $ | $ | $ | $ | $ | $ | $ | |||||||
2 | ||||||||||||||
3 | ||||||||||||||
4 | ||||||||||||||
5 | ||||||||||||||
Total unique loans | $ | $ | $ | $ | $ | $ | $ | |||||||
Impaired loans | ||||||||||||||
1 | $ | $ | $ | $ | $ | $ | $ | |||||||
2 | ||||||||||||||
3 | ||||||||||||||
4 | ||||||||||||||
5 | ||||||||||||||
Total impaired loans | $ | $ | $ | $ | $ | $ | $ | |||||||
Total loans receivable | ||||||||||||||
1 | $ | $ | $ | $ | $ | $ | $ | |||||||
2 | ||||||||||||||
3 | $ | |||||||||||||
4 | ||||||||||||||
5 | ||||||||||||||
Total loans receivable | $ | $ | $ | $ | $ | $ | $ | |||||||
CECL reserve | ( | |||||||||||||
Loans receivable, net | $ | |||||||||||||
Gross charge-offs(2) | ( | ( | ( | $( | ||||||||||
Acquisition Date | Location | Property Type | Acquisition Date Fair Value | |||
February 2025 | Chicago, IL | Office | $ |
June 30, 2025 | December 31, 2024 | ||
Assets | |||
Building and building improvements | $ | $ | |
Land and land improvements | |||
Total | $ | $ | |
Less: accumulated depreciation | ( | ( | |
Real estate owned, net | $ | $ | |
Intangible real estate assets | $ | $ | |
Less: accumulated amortization | ( | ( | |
Intangible real estate assets, net(1) | $ | $ | |
Liabilities | |||
Intangible real estate liabilities | $ | $ | |
Less: accumulated amortization | ( | ( | |
Intangible real estate liabilities, net(2) | $ | $ |
Three Months Ended June 30, | Six Months Ended June 30, | ||||||
2025 | 2024 | 2025 | 2024 | ||||
Rental income | $ | $ | $ | $ | |||
Other operating income | |||||||
Revenue from real estate owned | $ | $ | $ | $ | |||
Operating expense | $ | $ | $ | $ | |||
Depreciation and amortization expense | |||||||
Total expenses from real estate owned | $ | $ | $ | $ | |||
Net loss from real estate owned | $( | $( | $( | $( | |||
Future Minimum Rents | |
2025 (remaining) | $ |
2026 | |
2027 | |
2028 | |
2029 | |
Thereafter | |
Total | $ |
In-place lease intangibles | Above-market lease intangibles | Below-market lease intangibles | |||
2025 (remaining) | $ | $ | $( | ||
2026 | ( | ||||
2027 | ( | ||||
2028 | ( | ||||
2029 | ( | ||||
Thereafter | ( | ||||
Total | $ | $ | $( |
June 30, 2025 | ||||||
Investments in Unconsolidated Entities | Number of Assets | Ownership Interest | Book Value | |||
Unconsolidated entities carried at historical cost | ||||||
Net Lease Joint Venture(1) | $ | |||||
Total unconsolidated entities carried at historical cost | ||||||
Unconsolidated entities carried at fair value | ||||||
Bank Loan Portfolio Joint Venture(2) | ||||||
Total unconsolidated entities carried at fair value | ||||||
Total | $ | |||||
December 31, 2024 | ||||||
Investments in Unconsolidated Entities | Number of Assets | Ownership Interest | Book Value | |||
Unconsolidated entities carried at historical cost | ||||||
Net Lease Joint Venture | $ | |||||
Total unconsolidated entities carried at historical cost | ||||||
Total | $ | |||||
June 30, 2025 | December 31, 2024 | ||
Accrued interest receivable | $ | $ | |
Loan portfolio payments held by servicer(1) | |||
Collateral deposited under derivative agreements | |||
Real estate intangible assets, net | |||
Accounts receivable and other assets(2) | |||
Other real estate assets | |||
Derivative assets | |||
Prepaid expenses | |||
Total | $ | $ |
June 30, 2025 | December 31, 2024 | ||
Derivative liabilities | $ | $ | |
Other real estate liabilities | |||
Accrued dividends payable | |||
Accrued interest payable | |||
Debt repayments pending servicer remittance(1) | |||
Accrued management and incentive fees payable | |||
Accounts payable and other liabilities | |||
Current expected credit loss reserves for unfunded loan commitments(2) | |||
Total | $ | $ |
Secured Debt Borrowings Outstanding | |||
June 30, 2025 | December 31, 2024 | ||
Secured credit facilities | $ | $ | |
Deferred financing costs(1) | ( | ( | |
Net book value of secured debt | $ | $ | |
June 30, 2025 | ||||||||||||||||||
Recourse Limitation | ||||||||||||||||||
Currency | Lenders(1) | Borrowings | Wtd. Avg. Maturity(2) | Loan Count | Collateral(3) | Wtd. Avg. Maturity(4) | Wtd. Avg. | Range | ||||||||||
USD | $ | February 2027 | $ | March 2027 | ||||||||||||||
GBP | April 2028 | May 2028 | ||||||||||||||||
EUR | July 2027 | July 2027 | ||||||||||||||||
Others(5) | December 2028 | December 2028 | ||||||||||||||||
Total | $ | October 2027 | $ | October 2027 | ||||||||||||||
Six Months Ended June 30, 2025 | June 30, 2025 | |||||||||||||
Spread(1) | New Financings(2) | Total Borrowings | Wtd. Avg. All-in Cost(1)(3)(4) | Collateral(5) | Wtd. Avg. All-in Yield(1)(3) | Net Interest Margin(6) | ||||||||
+ 1.50% or less | $ | $ | + | $ | + | + | ||||||||
+ 1.51% to + 1.75% | + | + | + | |||||||||||
+ 1.76% to + 2.00% | + | + | + | |||||||||||
+ 2.01% or more | + | + | + | |||||||||||
Total | $ | $ | + | $ | + | + | ||||||||
Year Ended December 31, 2024 | December 31, 2024 | |||||||||||||
Spread(1) | New Financings(2) | Total Borrowings | Wtd. Avg. All-in Cost(1)(3)(4) | Collateral(5) | Wtd. Avg. All-in Yield(1)(3) | Net Interest Margin(6) | ||||||||
+ 1.50% or less | $ | $ | + | $ | + | + | ||||||||
+ 1.51% to + 1.75% | + | + | + | |||||||||||
+ 1.76% to + 2.00% | + | + | + | |||||||||||
+ 2.01% or more | + | + | + | |||||||||||
Total | $ | $ | + | $ | + | + | ||||||||
June 30, 2025 | ||||||||||
Securitized Debt Obligations | Count | Principal Balance | Book Value(1) | Wtd. Avg. Yield/Cost(2)(3) | Term(4) | |||||
2025 FL5 Collateralized Loan Obligation | ||||||||||
Senior CLO Securities Outstanding | $ | $ | + | October 2042 | ||||||
Underlying Collateral Assets | + | July 2028 | ||||||||
2021 FL4 Collateralized Loan Obligation | ||||||||||
Senior CLO Securities Outstanding | + | May 2038 | ||||||||
Underlying Collateral Assets | + | December 2026 | ||||||||
2020 FL3 Collateralized Loan Obligation | ||||||||||
Senior CLO Securities Outstanding | + | November 2037 | ||||||||
Underlying Collateral Assets | + | February 2027 | ||||||||
2020 FL2 Collateralized Loan Obligation | ||||||||||
Senior CLO Securities Outstanding | + | February 2038 | ||||||||
Underlying Collateral Assets | + | February 2027 | ||||||||
Total | ||||||||||
Senior CLO Securities Outstanding(5) | $ | $ | + | |||||||
Underlying Collateral Assets | $ | $ | + | |||||||
December 31, 2024 | ||||||||||
Securitized Debt Obligations | Count | Principal Balance | Book Value(1) | Wtd. Avg. Yield/Cost(2)(3) | Term(4) | |||||
2021 FL4 Collateralized Loan Obligation | ||||||||||
Senior CLO Securities Outstanding | $ | $ | + | May 2038 | ||||||
Underlying Collateral Assets | + | August 2026 | ||||||||
2020 FL3 Collateralized Loan Obligation | ||||||||||
Senior CLO Securities Outstanding | + | November 2037 | ||||||||
Underlying Collateral Assets | + | June 2026 | ||||||||
2020 FL2 Collateralized Loan Obligation | ||||||||||
Senior CLO Securities Outstanding | + | February 2038 | ||||||||
Underlying Collateral Assets | + | August 2026 | ||||||||
Total | ||||||||||
Senior CLO Securities Outstanding(5) | $ | $ | + | |||||||
Underlying Collateral Assets | $ | $ | + | |||||||
June 30, 2025 | ||||||||||
Asset-Specific Debt | Count | Principal Balance | Book Value(1) | Wtd. Avg. Yield/Cost(2) | Wtd. Avg. Term(3) | |||||
Financing provided | $ | $ | + | September 2029 | ||||||
Collateral assets | $ | $ | + | September 2029 | ||||||
December 31, 2024 | ||||||||||
Asset-Specific Debt | Count | Principal Balance | Book Value(1) | Wtd. Avg. Yield/Cost(2) | Wtd. Avg. Term(3) | |||||
Financing provided | $ | $ | + | June 2026 | ||||||
Collateral assets | $ | $ | + | June 2026 | ||||||
June 30, 2025 | ||||||||||
Loan Participations Sold | Count | Principal Balance | Book Value(1) | Wtd. Avg. Yield/Cost(2) | Term(3) | |||||
Junior Participations | ||||||||||
Loan Participation(4) | $ | $ | + | October 2026 | ||||||
Total Loan | + | October 2026 | ||||||||
December 31, 2024 | ||||||||||
Loan Participations Sold | Count | Principal Balance | Book Value(1) | Wtd. Avg. Yield/Cost(2) | Term(3) | |||||
Junior Participations | ||||||||||
Loan Participation(4) | $ | $ | + | February 2026 | ||||||
Total Loan | + | February 2026 | ||||||||
Face Value | ||||||||||
Term Loans | June 30, 2025 | December 31, 2024 | Interest Rate(1) | All-in Cost(1)(2) | Maturity | |||||
B-1 Term Loan | $ | $ | + | + | April 23, 2026 | |||||
B-4 Term Loan | + | + | May 9, 2029 | |||||||
B-5 Term Loan | + | + | December 10, 2028 | |||||||
B-6 Term Loan | + | + | December 10, 2030 | |||||||
Total face value | $ | $ | ||||||||
Deferred financing costs and unamortized discounts | ( | ( | ||||||||
Net book value | $ | $ | ||||||||
Three Months Ended June 30, | Six Months Ended June 30, | ||||||
2025 | 2024 | 2025 | 2024 | ||||
Cash coupon | $ | $ | $ | $ | |||
Discount and issuance cost amortization | |||||||
Total interest expense | $ | $ | $ | $ | |||
Face Value | ||||||||||
Senior Secured Notes Issuance | June 30, 2025 | December 31, 2024 | Interest Rate | All-in Cost(1) | Maturity | |||||
October 2021 | $ | $ | January 15, 2027 | |||||||
December 2024 | (2) | December 1, 2029 | ||||||||
Total face value | $ | $ | ||||||||
Deferred financing costs and unamortized discounts | ( | ( | ||||||||
Hedging adjustments(3) | ( | |||||||||
Net book value | $ | $ | ||||||||
Three Months Ended June 30, | Six Months Ended June 30, | ||||||
2025 | 2024 | 2025 | 2024 | ||||
Cash coupon | $ | $ | $ | $ | |||
Discount and issuance cost amortization | |||||||
Total interest expense | $ | $ | $ | $ | |||
Face Value | ||||||||||||
Convertible Notes | June 30, 2025 | December 31, 2024 | Interest Rate | All-in Cost(1) | Conversion Price(2) | Maturity | ||||||
Face value | $ | $ | $ | March 15, 2027 | ||||||||
Deferred financing costs and unamortized discount | ( | ( | ||||||||||
Net book value | $ | $ | ||||||||||
Three Months Ended June 30, | Six Months Ended June 30, | ||||||
2025 | 2024 | 2025 | 2024 | ||||
Cash coupon | $ | $ | $ | $ | |||
Discount and issuance cost amortization | |||||||
Total interest expense | $ | $ | $ | $ | |||
June 30, 2025 | December 31, 2024 | |||||||||
Foreign Currency Derivatives | Number of Instruments | Notional Amount | Foreign Currency Derivatives | Number of Instruments | Notional Amount | |||||
Buy USD / Sell SEK Forward | kr | Buy USD / Sell SEK Forward | kr | |||||||
Buy USD / Sell GBP Forward | £ | Buy USD / Sell GBP Forward | £ | |||||||
Buy USD / Sell EUR Forward | € | Buy USD / Sell EUR Forward | € | |||||||
Buy USD / Sell AUD Forward | A$ | Buy USD / Sell AUD Forward | A$ | |||||||
Buy USD / Sell CAD Forward | C$ | Buy USD / Sell CHF Forward | CHF | |||||||
Buy USD / Sell CHF Forward | CHF | |||||||||
June 30, 2025 | December 31, 2024 | |||||||||
Non-designated Hedges | Number of Instruments | Notional Amount | Non-designated Hedges | Number of Instruments | Notional Amount | |||||
Buy GBP / Sell USD Forward | £ | Buy GBP / Sell USD Forward | £ | |||||||
Buy USD / Sell GBP Forward | £ | Buy USD / Sell GBP Forward | £ | |||||||
Buy EUR / Sell USD Forward | € | |||||||||
Buy USD / Sell EUR Forward | € | |||||||||
Buy AUD / Sell USD Forward | A$ | |||||||||
Buy USD / Sell AUD Forward | A$ | |||||||||
June 30, 2025 | ||||||||||
Interest Rate Derivatives | Number of Instruments | Notional Amount | Fixed Rate | Index | Maturity (Years) | |||||
Interest Rate Swaps | $ | SOFR | ||||||||
December 31, 2024 | ||||||||||
Interest Rate Derivatives | Number of Instruments | Notional Amount | Fixed Rate | Index | Maturity (Years) | |||||
Interest Rate Swaps | $ | SOFR | ||||||||
June 30, 2025 | ||||
Line Item in the Consolidated Balance Sheets in which the Hedged Item is Included | Carrying Amount of the Hedged Assets/ Liabilities | Cumulative Amount of Fair Value Hedging Adjustment Included in Carrying Amount | ||
Senior secured notes, net | $ | $ | ||
December 31, 2024 | ||||
Line Item in the Consolidated Balance Sheets in which the Hedged Item is Included | Carrying Amount of the Hedged Assets/ Liabilities | Cumulative Amount of Fair Value Hedging Adjustment Included in Carrying Amount | ||
Senior secured notes, net | $ | $( | ||
Increase (Decrease) to Net Interest Income Recognized from Derivatives | ||||||||||
Three Months Ended June 30, | Six Months Ended June 30, | |||||||||
Derivatives in Hedging Relationships | Location of Income (Expense) Recognized | 2025 | 2024 | 2025 | 2024 | |||||
Designated Hedges | Interest Income(1) | $ | $ | $ | $ | |||||
Designated Hedges | Interest Expense(2) | ( | ( | |||||||
Non-Designated Hedges | Interest Income(1) | ( | ( | ( | ( | |||||
Non-Designated Hedges | Interest Expense(3) | ( | ( | |||||||
Total | $ | $ | $ | $ | ||||||
Three Months Ended June 30, 2025 | Six Months Ended June 30, 2025 | ||
Total interest and related expenses presented in the consolidated statements of operations | $ | $ | |
Gains (losses) on fair value hedging relationships | |||
Total gain on derivative instruments | $ | $ | |
Fair value basis adjustment on hedged items | ( | ( | |
Derivative settlements and accruals | |||
Net Gain on Fair Value Hedging Relationships(1) | $ | $ |
Fair Value of Derivatives in an Asset Position(1) as of | Fair Value of Derivatives in a Liability Position(2) as of | |||||||
June 30, 2025 | December 31, 2024 | June 30, 2025 | December 31, 2024 | |||||
Derivatives designated as hedging instruments | ||||||||
Foreign exchange contracts | $ | $ | $ | $ | ||||
Interest rate derivatives | ||||||||
Total derivatives designated as hedging instruments | $ | $ | $ | $ | ||||
Derivatives not designated as hedging instruments | ||||||||
Foreign exchange contracts | $ | $ | $ | $ | ||||
Interest rate derivatives | ||||||||
Total derivatives not designated as hedging instruments | $ | $ | $ | $ | ||||
Total Derivatives | $ | $ | $ | $ | ||||
Derivatives in Hedging Relationships | Amount of Gain (Loss) Recognized in OCI on Derivatives | Location of Gain (Loss) Reclassified from Accumulated OCI into Income | Amount of Gain (Loss) Reclassified from Accumulated OCI into Income | |||||||
Three Months Ended June 30, 2025 | Six Months Ended June 30, 2025 | Three Months Ended June 30, 2025 | Six Months Ended June 30, 2025 | |||||||
Net Investment Hedges | ||||||||||
Foreign exchange contracts(1) | $( | $( | Interest Expense | $ | $ | |||||
Total | $( | $( | $ | $ | ||||||
Six Months Ended June 30, | ||||
Common Stock Outstanding(1) | 2025 | 2024 | ||
Beginning balance | ||||
Issuance of class A common stock(2) | ||||
Repurchase of class A common stock | ( | |||
Issuance of restricted class A common stock, net(3)(4) | ||||
Issuance of deferred stock units | ||||
Ending balance | ||||
Three Months Ended June 30, | Six Months Ended June 30, | ||||||
2025 | 2024 | 2025 | 2024 | ||||
Dividends declared per share of common stock | $ | $ | $ | $ | |||
Class A common stock dividends declared | $ | $ | $ | $ | |||
Deferred stock unit dividends declared | |||||||
Total dividends declared | $ | $ | $ | $ | |||
Three Months Ended June 30, | Six Months Ended June 30, | ||||||
2025 | 2024 | 2025 | 2024 | ||||
Basic and Diluted Earnings | |||||||
Net income (loss)(1) | $ | $( | $ | $( | |||
Weighted-average shares outstanding, basic and diluted(2) | |||||||
Per share amount, basic and diluted | $ | $( | $ | $( | |||
Three Months Ended June 30, | Six Months Ended June 30, | ||||||
2025 | 2024 | 2025 | 2024 | ||||
Professional services | $ | $ | $ | $ | |||
Operating and other costs | |||||||
Subtotal(1) | |||||||
Non-cash compensation expenses | |||||||
Restricted class A common stock earned | |||||||
Director stock-based compensation | |||||||
Subtotal | |||||||
Total general and administrative expenses | $ | $ | $ | $ | |||
Restricted Class A Common Stock | Weighted-Average Grant Date Fair Value Per Share | ||
Balance as of December 31, 2024 | $ | ||
Granted | |||
Vested | ( | ||
Forfeited | ( | ||
Balance as of June 30, 2025 | $ |
June 30, 2025 | December 31, 2024 | ||||||||||||||
Level 1 | Level 2 | Level 3 | Total | Level 1 | Level 2 | Level 3 | Total | ||||||||
Assets | |||||||||||||||
Derivatives | $ | $ | $ | $ | $ | $ | $ | $ | |||||||
Liabilities | |||||||||||||||
Derivatives | $ | $ | $ | $ | $ | $ | $ | $ | |||||||
June 30, 2025 | December 31, 2024 | ||||||||||
Book Value | Face Amount | Fair Value | Book Value | Face Amount | Fair Value | ||||||
Financial assets | |||||||||||
Cash and cash equivalents | $ | $ | $ | $ | $ | $ | |||||
Loans receivable, net | |||||||||||
Financial liabilities | |||||||||||
Secured debt, net | |||||||||||
Securitized debt obligations, net | |||||||||||
Asset-specific debt, net | |||||||||||
Loan participations sold, net | |||||||||||
Secured term loans, net | |||||||||||
Senior secured notes, net | |||||||||||
Convertible notes, net | |||||||||||
June 30, 2025 | December 31, 2024 | ||
Assets | |||
Cash and cash equivalents | $ | $ | |
Loans receivable | |||
Current expected credit loss reserve | ( | ( | |
Loans receivable, net | |||
Real estate owned, net | |||
Other assets | |||
Total assets | $ | $ | |
Liabilities | |||
Securitized debt obligations, net | $ | $ | |
Other liabilities | |||
Total liabilities | $ | $ |
Three Months Ended June 30, | Six Months Ended June 30, | ||||||||
Asset Class | 2025 | 2024 | 2025 | 2024 | |||||
Brio Real Estate Services, LLC, Brio Real Estate (UK) Ltd., and Brio Real Estate (AUS) Pty Ltd.(1) | n/a | $ | $ | $ | $ | ||||
Revantage Corporate Services, LLC and Revantage Global Services Europe S.à r.l.(1) | n/a | ||||||||
Perform Properties, LLC(2)(3) | Office | ||||||||
LivCor, LLC(2) | Multifamily | ||||||||
BRE Hotels & Resorts, LLC(2) | Hospitality | ||||||||
LendingOne, LLC(4) | Multifamily | ||||||||
Total | $ | $ | $ | $ | |||||
Three Months Ended June 30, | Six Months Ended June 30, | ||||||
2025 | 2024 | 2025 | 2024 | ||||
BTIG, LLC(1) | $ | $ | $ | $ | |||
Gryphon Mutual Property Americas IC(2) | |||||||
Blackstone internal audit services | ( | ||||||
Lexington National Land Services(3) | |||||||
Blackstone Securities Partners L.P.(4) | |||||||
Total | $ | $ | $ | $ | |||
Year | Secured Debt(1) | Asset-Specific Debt(1) | Term Loans(2) | Senior Secured Notes | Convertible Notes(3) | Total(4) | ||||||
2025 (remaining) | $ | $ | $ | $ | $ | $ | ||||||
2026 | ||||||||||||
2027 | ||||||||||||
2028 | ||||||||||||
2029 | ||||||||||||
Thereafter | ||||||||||||
Total obligation | $ | $ | $ | $ | $ | $ |
Three Months Ended | |||
June 30, 2025 | March 31, 2025 | ||
Net income (loss)(1) | $6,969 | $(357) | |
Weighted-average shares outstanding, basic | 171,893,905 | 172,004,888 | |
Net income (loss) per share, basic | $0.04 | $(0.00) | |
Dividends declared per share | $0.47 | $0.47 | |
Three Months Ended | |||
June 30, 2025 | March 31, 2025 | ||
Net income (loss)(1) | $6,969 | $(357) | |
Charge-offs of CECL reserves(2) | (45,057) | (41,824) | |
Increase in CECL reserves | 45,593 | 49,505 | |
Depreciation and amortization of real estate owned(3) | 17,046 | 16,517 | |
Non-cash compensation expense | 7,303 | 6,965 | |
Realized hedging and foreign currency loss, net(4) | (703) | (1,237) | |
Allocable share of adjustments related to unconsolidated entities(5) | 1,665 | 94 | |
(Non-cash) cash income from Agency Multifamily Lending Partnership, net(6) | (127) | 24 | |
Adjustments attributable to non-controlling interests, net | (52) | (94) | |
Other items | (11) | (3) | |
Distributable Earnings | $32,626 | $29,590 | |
Charge-offs of CECL reserves(2) | 45,057 | 41,824 | |
Distributable Earnings prior to charge-offs of CECL reserves | $77,683 | $71,414 | |
Weighted-average shares outstanding, basic(7) | 171,893,905 | 172,004,888 | |
Distributable Earnings per share, basic | $0.19 | $0.17 | |
Distributable Earnings per share, basic, prior to charge-offs of CECL reserves | $0.45 | $0.42 | |
June 30, 2025 | March 31, 2025 | ||
Stockholders’ equity | $3,616,772 | $3,681,968 | |
Shares | |||
Class A common stock | 171,593,590 | 171,582,452 | |
Deferred stock units | 323,877 | 310,108 | |
Total outstanding | 171,917,467 | 171,892,560 | |
Book value per share(1) | $21.04 | $21.42 |
Three Months Ended June 30, 2025 | Six Months Ended June 30, 2025 | ||
Loan originations(1)(2) | $2,596,944 | $4,151,103 | |
Loan fundings | $1,767,182 | $3,448,480 | |
Loan repayments and sales | (1,595,496) | (3,405,320) | |
Total net fundings | $171,686 | $43,160 |
June 30, 2025 | |
Number of loans | 144 |
Principal balance | $19,874,340 |
Net book value | $18,965,254 |
Unfunded loan commitments(1) | $1,412,084 |
Weighted-average cash coupon(2) | + 3.30% |
Weighted-average all-in yield(2) | + 3.57% |
Weighted-average maximum maturity (years)(3) | 2.4 |
Origination loan-to-value (LTV)(4) | 64.1% |
Loans Receivable Principal Balance | ||||||
Index Rate Floors | USD | Non-USD(1) | Total | |||
Fixed Rate | $179,821 | $140,066 | $319,887 | |||
0.00% or no floor(2) | 2,286,822 | 5,412,057 | 7,698,879 | |||
0.01% to 1.00% floor | 3,787,560 | 990,685 | 4,778,245 | |||
1.01% to 2.00% floor | 640,370 | 1,384,033 | 2,024,403 | |||
2.01% to 3.00% floor | 3,209,355 | 367,621 | 3,576,976 | |||
3.01% or more floor | 1,299,612 | 176,338 | 1,475,950 | |||
Total(3) | $11,403,540 | $8,470,800 | $19,874,340 | |||
Loan Count | Currency | Loans Receivable Principal Balance | Floating Rate Index(1) | Cash Coupon(2) | All-in Yield(2) | |||||
109 | $ | $11,403,540 | SOFR | + 3.16% | + 3.45% | |||||
17 | £ | £2,675,442 | SONIA | + 3.45% | + 3.63% | |||||
10 | € | €2,304,801 | EURIBOR | + 3.03% | + 3.48% | |||||
8 | Various | $2,080,213 | Other(3) | + 4.01% | + 4.20% | |||||
144 | $19,874,340 | + 3.30% | + 3.57% |


June 30, 2025 | ||||||
Risk Rating | Number of Loans | Net Book Value | Net Loan Exposure(1) | |||
1 | 8 | $476,141 | $475,273 | |||
2 | 17 | 2,942,069 | 2,773,722 | |||
3 | 87 | 11,908,048 | 11,477,440 | |||
4 | 18 | 2,788,227 | 2,682,712 | |||
5 | 14 | 1,591,620 | 1,035,269 | |||
Loans receivable | 144 | $19,706,105 | $18,444,416 | |||
CECL reserve | (740,851) | |||||
Loans receivable, net | $18,965,254 | |||||
Portfolio Financing Outstanding Principal Balance | |||
June 30, 2025 | December 31, 2024 | ||
Secured debt | $10,693,596 | $9,705,529 | |
Securitizations | 2,502,834 | 1,936,967 | |
Asset-specific debt | 529,867 | 1,228,110 | |
Total portfolio financing | $13,726,297 | $12,870,606 | |
Six Months Ended June 30, 2025 | June 30, 2025 | |||||||||||||
Spread(1) | New Financings(2) | Total Borrowings | Wtd. Avg. All-in Cost(1)(3)(4) | Collateral(5) | Wtd. Avg. All-in Yield(1)(3) | Net Interest Margin(6) | ||||||||
+ 1.50% or less | $1,330,750 | $4,676,347 | +1.54% | $6,862,828 | +3.06% | +1.52% | ||||||||
+ 1.51% to + 1.75% | 462,809 | 2,541,857 | +1.75% | 3,303,560 | +3.51% | +1.76% | ||||||||
+ 1.76% to + 2.00% | 99,002 | 1,138,331 | +2.09% | 1,963,534 | +3.28% | +1.19% | ||||||||
+ 2.01% or more | 110,597 | 2,337,061 | +2.59% | 3,330,143 | +4.23% | +1.64% | ||||||||
Total | $2,003,158 | $10,693,596 | +1.88% | $15,460,065 | +3.44% | +1.56% | ||||||||
June 30, 2025 | ||||||||||
Securitized Debt Obligations | Count | Principal Balance | Book Value(1) | Wtd. Avg. Yield/Cost(2)(3) | Term(4) | |||||
2025 FL5 Collateralized Loan Obligation | ||||||||||
Senior CLO Securities Outstanding | 1 | $831,250 | $821,427 | + 2.15% | October 2042 | |||||
Underlying Collateral Assets | 19 | 997,805 | 997,805 | + 3.44% | July 2028 | |||||
2021 FL4 Collateralized Loan Obligation | ||||||||||
Senior CLO Securities Outstanding | 1 | 621,149 | 621,149 | + 1.44% | May 2038 | |||||
Underlying Collateral Assets | 19 | 768,996 | 768,996 | + 2.86% | December 2026 | |||||
2020 FL3 Collateralized Loan Obligation | ||||||||||
Senior CLO Securities Outstanding | 1 | 464,258 | 464,258 | + 2.50% | November 2037 | |||||
Underlying Collateral Assets | 12 | 624,917 | 624,917 | + 2.79% | February 2027 | |||||
2020 FL2 Collateralized Loan Obligation | ||||||||||
Senior CLO Securities Outstanding | 1 | 586,177 | 586,177 | + 1.76% | February 2038 | |||||
Underlying Collateral Assets | 12 | 813,168 | 813,168 | + 2.72% | February 2027 | |||||
Total | ||||||||||
Senior CLO Securities Outstanding(5) | 4 | $2,502,834 | $2,493,011 | + 1.95% | ||||||
Underlying Collateral Assets | 62 | $3,204,886 | $3,204,886 | + 3.15% | ||||||
June 30, 2025 | ||||||||||
Asset-Specific Debt | Count | Principal Balance | Book Value(1) | Wtd. Avg. Yield/Cost(2) | Wtd. Avg. Term(3) | |||||
Financing provided | 2 | $529,867 | $528,224 | + 3.36% | September 2029 | |||||
Collateral assets | 2 | $656,019 | $650,846 | + 4.58% | September 2029 | |||||
Corporate Financing Outstanding Principal Balance | |||
June 30, 2025 | December 31, 2024 | ||
Term loans | $1,760,748 | $1,764,437 | |
Senior secured notes | 785,316 | 785,316 | |
Convertible notes | 266,157 | 266,157 | |
Total corporate financing | $2,812,221 | $2,815,910 | |
Corporate Financing | Face Value | Interest Rate(1) | All-in Cost(1)(2) | Maturity | ||||
Term Loans | ||||||||
B-1 Term Loan | $309,268 | + 2.36% | + 2.53% | April 23, 2026 | ||||
B-4 Term Loan | 403,105 | + 3.50% | + 3.99% | May 9, 2029 | ||||
B-6 Term Loan | 1,048,375 | + 3.00% | + 3.55% | December 10, 2030 | ||||
Total term loans | $1,760,748 | |||||||
Senior Secured Notes | ||||||||
October 2021 | $335,316 | 3.75% | 4.06% | January 15, 2027 | ||||
December 2024 | 450,000 | 7.75% | (3) | 8.14% | December 1, 2029 | |||
Total senior secured notes | $785,316 | |||||||
Convertible Notes | ||||||||
Convertible Notes(4) | $266,157 | 5.50% | 5.79% | March 15, 2027 | ||||
Total corporate financings | $2,812,221 |
USD | GBP | EUR | All Other(1) | ||||
Floating rate loans(2)(3)(4)(5)(6) | $9,484,691 | £2,563,092 | €2,304,801 | $2,080,213 | |||
Floating rate portfolio financings(2)(4)(6)(7) | (7,317,673) | (2,041,146) | (1,642,912) | (1,669,223) | |||
Floating rate corporate financings(8) | (2,210,747) | — | — | — | |||
Net floating rate exposure | $(43,729) | £521,946 | €661,889 | $410,990 | |||
Net floating rate exposure in USD(9) | $(43,729) | $716,736 | $780,169 | $410,990 |
Three Months Ended | Change | ||||
June 30, 2025 | March 31, 2025 | $ | |||
Income from loans and other investments | |||||
Interest and related income | $359,537 | $332,057 | $27,480 | ||
Less: Interest and related expenses | 264,727 | 242,233 | 22,494 | ||
Income from loans and other investments, net | 94,810 | 89,824 | 4,986 | ||
Revenue from real estate owned | 38,812 | 37,033 | 1,779 | ||
Other income | 231 | 90 | 141 | ||
Total net revenues | 133,853 | 126,947 | 6,906 | ||
Expenses | |||||
Management and incentive fees | 17,036 | 17,235 | (199) | ||
General and administrative expenses | 13,526 | 12,664 | 862 | ||
Expenses from real estate owned | 47,796 | 46,302 | 1,494 | ||
Total expenses | 78,358 | 76,201 | 2,157 | ||
Increase in current expected credit loss reserve | (45,593) | (49,505) | 3,912 | ||
Loss from unconsolidated entities | (2,015) | (874) | (1,141) | ||
Income before income taxes | 7,887 | 367 | 7,520 | ||
Income tax provision | 903 | 718 | 185 | ||
Net income (loss) | 6,984 | (351) | 7,335 | ||
Net income attributable to non-controlling interests | (15) | (6) | (9) | ||
Net income (loss) attributable to Blackstone Mortgage Trust, Inc. | $6,969 | $(357) | $7,326 | ||
Net income (loss) per share of common stock, basic and diluted | $0.04 | $(0.00) | $0.04 | ||
Weighted-average shares of common stock outstanding, basic and diluted | 171,893,905 | 172,004,888 | (110,983) | ||
Dividends declared per share | $0.47 | $0.47 | $— | ||
Six Months Ended June 30, | Change | ||||
2025 | 2024 | $ | |||
Income from loans and other investments | |||||
Interest and related income | $691,594 | $952,275 | $(260,681) | ||
Less: Interest and related expenses | 506,960 | 683,110 | (176,150) | ||
Income from loans and other investments, net | 184,634 | 269,165 | (84,531) | ||
Revenue from real estate owned | 75,845 | — | 75,845 | ||
Other income | 321 | — | 321 | ||
Gain on extinguishment of debt | — | 2,963 | (2,963) | ||
Total net revenues | 260,800 | 272,128 | (11,328) | ||
Expenses | |||||
Management and incentive fees | 34,271 | 37,653 | (3,382) | ||
General and administrative expenses | 26,190 | 27,388 | (1,198) | ||
Expenses from real estate owned | 94,098 | 963 | 93,135 | ||
Total expenses | 154,559 | 66,004 | 88,555 | ||
Increase in current expected credit loss reserve | (95,098) | (387,277) | 292,179 | ||
Loss from unconsolidated entities | (2,889) | — | (2,889) | ||
Income (loss) before income taxes | 8,254 | (181,153) | 189,407 | ||
Income tax provision | 1,621 | 2,219 | (598) | ||
Net income (loss) | 6,633 | (183,372) | 190,005 | ||
Net income attributable to non-controlling interests | (21) | (1,523) | 1,502 | ||
Net income (loss) attributable to Blackstone Mortgage Trust, Inc. | $6,612 | $(184,895) | $191,507 | ||
Net income (loss) per share of common stock, basic and diluted | $0.04 | $(1.06) | $1.10 | ||
Weighted-average shares of common stock outstanding, basic and diluted | 171,949,090 | 174,004,464 | (2,055) | ||
Dividends declared per share | $0.94 | $1.24 | $(0.30) | ||
June 30, 2025 | December 31, 2024 | ||
Debt-to-equity ratios(1) | |||
Debt-to-equity ratio(2) | 3.8x | 3.5x | |
Adjusted debt-to-equity ratio(3) | 3.1x | 3.0x | |
Total leverage ratios(1) | |||
Total leverage ratio(4) | 4.5x | 4.0x | |
Adjusted total leverage ratio(5) | 3.7x | 3.4x |
June 30, 2025 | December 31, 2024 | ||
Total equity | $3,623,537 | $3,794,189 | |
Add back: aggregate CECL reserves | 754,711 | 746,495 | |
Adjusted Equity | $4,378,248 | $4,540,684 |
June 30, 2025 | December 31, 2024 | ||
Cash and cash equivalents | $388,049 | $323,483 | |
Available borrowings under secured debt | 697,941 | 1,111,206 | |
Loan principal payments held by servicer, net(1) | 52,459 | 74,313 | |
$1,138,449 | $1,509,002 |
Payment Timing | |||||||||
Total Obligation | Less Than 1 Year(1) | 1 to 3 Years | 3 to 5 Years | More Than 5 Years | |||||
Unfunded loan commitments(2) | $1,412,084 | $234,885 | $728,390 | $438,184 | $10,625 | ||||
Principal repayments under secured debt(3) | 10,693,596 | 2,003,977 | 5,749,576 | 2,940,043 | — | ||||
Principal repayments under asset-specific debt(3) | 529,867 | — | — | 529,867 | — | ||||
Principal repayments of term loans(4) | 1,760,748 | 319,751 | 20,968 | 424,072 | 995,957 | ||||
Principal repayments of senior secured notes | 785,316 | — | 335,316 | 450,000 | — | ||||
Principal repayments of convertible notes(5) | 266,157 | — | 266,157 | — | — | ||||
Interest payments(3)(6) | 2,286,919 | 812,951 | 968,995 | 470,296 | 34,677 | ||||
Total(7) | $17,734,687 | $3,371,564 | $8,069,402 | $5,252,462 | $1,041,259 | ||||
Six Months Ended June 30, | |||
2025 | 2024 | ||
Cash flows provided by operating activities | $157,749 | $194,793 | |
Cash flows (used in) provided by investing activities | (231,088) | 864,368 | |
Cash flows provided by (used in) financing activities | 129,200 | (1,032,778) | |
Net increase in cash and cash equivalents | $55,861 | $26,383 | |
Senior Loan Portfolio(1) | ||||||||||||||||||||||||||
Property Type | Location | Origination Date(2) | Total Commitment(3) | Principal Balance | Net Book Value(4) | Cash Coupon(5) | All-in Yield(5) | Maximum Maturity(6) | Loan Per SQFT / Unit / Key | Origination LTV(2) | Risk Rating | |||||||||||||||
1 | Mixed-Use | Dublin, IE | 8/14/2019 | $1,059 | $1,007 | $1,005 | +3.20 | % | +3.95 | % | 1/29/2027 | $281 / sqft | 74% | 3 | ||||||||||||
2 | Hospitality | Diversified, AU | 6/24/2022 | 871 | 871 | 865 | +4.75 | % | +4.93 | % | 6/21/2030 | $396 / sqft | 59% | 3 | ||||||||||||
3 | Mixed-Use | Diversified, Spain | 3/22/2018 | 563 | 563 | 563 | +3.25 | % | +3.31 | % | 3/15/2026 | n / a | 71% | 4 | ||||||||||||
4 | Industrial | Diversified, SE | 3/30/2021 | 504 | 504 | 503 | +3.20 | % | +3.41 | % | 5/15/2026 | $95 / sqft | 76% | 2 | ||||||||||||
5 | Self-Storage | Diversified, CAN | 2/20/2025 | 459 | 459 | 459 | +3.50 | % | +3.50 | % | 2/9/2030 | $160 / sqft | 58% | 2 | ||||||||||||
6 | Mixed-Use | Austin | 6/28/2022 | 675 | 454 | 449 | +4.60 | % | +5.07 | % | 7/9/2029 | $377 / sqft | 53% | 3 | ||||||||||||
7 | Mixed-Use | New York | 12/9/2021 | 385 | 381 | 381 | +2.76 | % | +3.00 | % | 12/9/2026 | $131 / sqft | 50% | 3 | ||||||||||||
8 | Industrial | Diversified, UK | 4/7/2025 | 357 | 357 | 356 | +2.55 | % | +2.88 | % | 4/7/2030 | $369 / sqft | 67% | 3 | ||||||||||||
9 | Multifamily | London, UK | 12/23/2021 | 354 | 354 | 350 | +4.25 | % | +4.95 | % | 6/24/2028 | $391,231 / unit | 59% | 3 | ||||||||||||
10 | Hospitality | Diversified, EUR | 7/15/2021 | 339 | 339 | 339 | +4.25 | % | +4.76 | % | 7/16/2026 | $259,296 / key | 53% | 3 | ||||||||||||
11 | Office | Chicago | 12/11/2018 | 356 | 324 | 326 | +1.75 | % | +1.75 | % | 12/9/2026 | $272 / sqft | 78% | 4 | ||||||||||||
12 | Industrial | Diversified, UK | 5/6/2022 | 310 | 310 | 310 | +3.50 | % | +3.79 | % | 5/6/2027 | $98 / sqft | 53% | 2 | ||||||||||||
13 | Industrial | Diversified, UK | 5/15/2025 | 310 | 310 | 310 | +2.70 | % | +2.89 | % | 5/15/2028 | $149 / sqft | 69% | 3 | ||||||||||||
14 | Other | Diversified, UK | 1/11/2019 | 296 | 296 | 295 | +5.15 | % | +5.06 | % | 6/14/2028 | $292 / sqft | 74% | 3 | ||||||||||||
15 | Hospitality | New York | 11/30/2018 | 291 | 291 | 247 | +2.54 | % | +2.54 | % | 8/9/2025 | $311,724 / key | n/m | 5 | ||||||||||||
16 | Office | Washington, DC | 9/29/2021 | 293 | 288 | 288 | +2.81 | % | +3.07 | % | 10/9/2026 | $375 / sqft | 66% | 2 | ||||||||||||
17 | Office | Seattle | 1/26/2022 | 338 | 275 | 274 | +4.10 | % | +4.74 | % | 2/9/2027 | $576 / sqft | 56% | 3 | ||||||||||||
18 | Multifamily | Dallas | 9/30/2021 | 275 | 275 | 274 | +2.61 | % | +3.10 | % | 9/30/2026 | $145,117 / unit | 74% | 3 | ||||||||||||
19 | Multifamily | New York | 2/27/2020 | 273 | 272 | 272 | +2.70 | % | +2.83 | % | 1/9/2027 | $597,976 / unit | 59% | 3 | ||||||||||||
20 | Multifamily | Dallas | 9/14/2021 | 253 | 253 | 252 | +2.61 | % | +3.07 | % | 9/14/2026 | $204,586 / unit | 72% | 3 | ||||||||||||
21 | Office | New York | 4/11/2018 | 243 | 243 | 242 | +2.25 | % | +2.62 | % | 3/7/2028 | $308 / sqft | 52% | 4 | ||||||||||||
22 | Multifamily | London, UK | 7/16/2021 | 251 | 242 | 242 | +3.25 | % | +3.51 | % | 2/15/2027 | $248,766 / unit | 69% | 3 | ||||||||||||
23 | Multifamily | Reno | 2/23/2022 | 245 | 235 | 235 | +2.60 | % | +2.84 | % | 3/9/2027 | $218,349 / unit | 74% | 3 | ||||||||||||
24 | Office | Berlin, DEU | 6/27/2019 | 261 | 226 | 226 | +1.00 | % | +1.13 | % | 6/6/2030 | $474 / sqft | 62% | 4 | ||||||||||||
25 | Office | London, UK | 6/28/2019 | 225 | 225 | 225 | +4.00 | % | +4.93 | % | 6/26/2026 | $544 / sqft | 71% | 3 | ||||||||||||
26 | Mixed-Use | New York | 12/22/2016 | 252 | 222 | 216 | +10.50 | % | +10.50 | % | 6/9/2028 | $313 / sqft | n/m | 5 | ||||||||||||
27 | Industrial | Diversified, UK | 3/28/2025 | 210 | 210 | 208 | +2.45 | % | +2.74 | % | 3/28/2030 | $131 / sqft | 69% | 3 | ||||||||||||
28 | Industrial | Diversified, UK | 4/11/2025 | 206 | 206 | 204 | +2.40 | % | +2.77 | % | 4/11/2030 | $118 / sqft | 69% | 3 | ||||||||||||
29 | Multifamily | Boca Raton | 9/30/2021 | 195 | 195 | 195 | (7) | +7.96 | % | +7.96 | % | 10/9/2026 | $396,175 / unit | 58% | 3 | |||||||||||
30 | Retail | Diversified, UK | 3/9/2022 | 185 | 185 | 185 | +2.95 | % | +3.17 | % | 8/15/2027 | $158 / sqft | 55% | 2 | ||||||||||||
Senior Loan Portfolio(1) | ||||||||||||||||||||||||||
Property Type | Location | Origination Date(2) | Total Commitment(3) | Principal Balance | Net Book Value(4) | Cash Coupon(5) | All-in Yield(5) | Maximum Maturity(6) | Loan Per SQFT / Unit / Key | Origination LTV(2) | Risk Rating | |||||||||||||||
31 | Hospitality | Diversified, Spain | 9/30/2021 | $202 | $185 | $185 | +4.00 | % | +4.67 | % | 9/30/2026 | $159,716 / key | 60% | 3 | ||||||||||||
32 | Office | New York | 7/23/2021 | 244 | 184 | 184 | -1.30 | % | (8) | -0.92 | % | 8/9/2028 | $596 / sqft | 53% | 4 | |||||||||||
33 | Office | Denver | 2/15/2022 | 191 | 182 | 167 | +2.90 | % | +2.90 | % | 3/9/2027 | $363 / sqft | n/m | 5 | ||||||||||||
34 | Life Sciences | Boston | 5/13/2021 | 199 | 179 | 179 | +3.66 | % | +3.66 | % | 6/9/2026 | $904 / sqft | n/m | 5 | ||||||||||||
35 | Multifamily | Dallas | 1/27/2022 | 178 | 178 | 179 | +3.10 | % | +5.92 | % | 2/9/2027 | $116,020 / unit | 71% | 4 | ||||||||||||
36 | Industrial | Diversified, US | 2/13/2025 | 185 | 165 | 164 | +3.10 | % | +3.48 | % | 3/9/2030 | $700,554 / acre | 62% | 3 | ||||||||||||
37 | Office | Atlanta | 5/27/2021 | 184 | 163 | 162 | +2.31 | % | +2.31 | % | 6/9/2026 | $137 / sqft | n/m | 5 | ||||||||||||
38 | Hospitality | Los Angeles | 3/7/2022 | 156 | 156 | 156 | +3.45 | % | +3.66 | % | 6/9/2026 | $624,000 / key | 64% | 3 | ||||||||||||
39 | Self-Storage | London, UK | 11/18/2021 | 155 | 155 | 155 | +3.25 | % | +3.51 | % | 11/18/2026 | $198 / sqft | 65% | 2 | ||||||||||||
40 | Hospitality | New York | 6/4/2018 | 153 | 153 | 153 | +4.00 | % | +4.46 | % | 9/9/2025 | $251,647 / key | 52% | 2 | ||||||||||||
41 | Office | Fort Lauderdale | 1/7/2022 | 155 | 152 | 152 | +3.70 | % | +3.94 | % | 1/9/2027 | $392 / sqft | 55% | 1 | ||||||||||||
42 | Multifamily | Dublin, IE | 12/15/2021 | 148 | 146 | 146 | +2.75 | % | +3.00 | % | 12/9/2026 | $365,521 / unit | 79% | 3 | ||||||||||||
43 | Multifamily | San Jose | 4/2/2025 | 182 | 143 | 142 | +2.35 | % | +2.76 | % | 4/9/2030 | $305,983 / unit | 67% | 3 | ||||||||||||
44 | Multifamily | Manchester, UK | 6/30/2025 | 143 | 143 | 142 | +2.30 | % | +2.65 | % | 6/30/2029 | $306,465 / unit | 63% | 3 | ||||||||||||
45 | Multifamily | Diversified, AU | 1/10/2025 | 142 | 142 | 140 | +3.85 | % | +4.52 | % | 1/10/2028 | $426,179 / unit | 76% | 3 | ||||||||||||
46 | Office | London, UK | 12/20/2019 | 140 | 140 | 140 | 4.00 | % | 4.00 | % | 3/31/2029 | $711 / sqft | 68% | 4 | ||||||||||||
47 | Mixed-Use | New York | 1/17/2020 | 183 | 138 | 137 | +3.12 | % | +3.44 | % | 2/9/2028 | $114 / sqft | 43% | 3 | ||||||||||||
48 | Office | Diversified, UK | 11/23/2018 | 137 | 137 | 136 | +3.50 | % | +3.74 | % | 11/15/2029 | $1,012 / sqft | 50% | 3 | ||||||||||||
49 | Industrial | Diversified, EUR | 6/5/2025 | 135 | 135 | 134 | +2.70 | % | +2.97 | % | 7/19/2030 | $68 / sqft | 70% | 3 | ||||||||||||
50 | Office | Miami | 12/10/2021 | 135 | 135 | 135 | +3.11 | % | +3.36 | % | 1/9/2027 | $452 / sqft | 49% | 2 | ||||||||||||
51 | Office | San Jose | 8/24/2021 | 156 | 133 | 133 | +2.71 | % | +2.71 | % | 9/9/2026 | $318 / sqft | n/m | 5 | ||||||||||||
52 | Office | Miami | 3/28/2022 | 130 | 127 | 127 | +2.55 | % | +2.79 | % | 4/9/2027 | $335 / sqft | 69% | 3 | ||||||||||||
53 | Multifamily | San Bernardino | 9/14/2021 | 128 | 127 | 127 | +2.81 | % | +3.05 | % | 10/9/2026 | $255,362 / unit | 75% | 3 | ||||||||||||
54 | Multifamily | Miami | 11/27/2024 | 125 | 125 | 124 | +2.80 | % | +3.17 | % | 12/9/2029 | $260,417 / unit | 71% | 3 | ||||||||||||
55 | Retail | San Diego | 8/27/2021 | 122 | 121 | 121 | +3.11 | % | +3.35 | % | 9/9/2026 | $459 / sqft | 58% | 3 | ||||||||||||
56 | Multifamily | Miami | 6/1/2021 | 120 | 120 | 120 | +2.96 | % | +3.32 | % | 6/9/2026 | $298,507 / unit | 61% | 2 | ||||||||||||
57 | Multifamily | Diversified, UK | 3/29/2021 | 119 | 119 | 119 | +4.02 | % | +4.28 | % | 3/29/2026 | $52,038 / unit | 61% | 3 | ||||||||||||
58 | Office | Houston | 7/15/2019 | 136 | 116 | 116 | +3.01 | % | +3.22 | % | 8/9/2028 | $210 / sqft | 58% | 4 | ||||||||||||
59 | Multifamily | Phoenix | 12/29/2021 | 110 | 110 | 110 | +2.85 | % | +3.02 | % | 1/9/2027 | $189,003 / unit | 64% | 3 | ||||||||||||
60 | Mixed-Use | New York | 3/10/2020 | 109 | 109 | 109 | +3.00 | % | +3.00 | % | 7/11/2029 | $667 / sqft | 48% | 2 | ||||||||||||
Senior Loan Portfolio(1) | ||||||||||||||||||||||||||
Property Type | Location | Origination Date(2) | Total Commitment(3) | Principal Balance | Net Book Value(4) | Cash Coupon(5) | All-in Yield(5) | Maximum Maturity(6) | Loan Per SQFT / Unit / Key | Origination LTV(2) | Risk Rating | |||||||||||||||
61 | Hospitality | Napa Valley | 4/29/2022 | $106 | $106 | $106 | +3.50 | % | +3.85 | % | 2/18/2027 | $1,116,719 / key | 66% | 3 | ||||||||||||
62 | Studio | Los Angeles | 6/28/2019 | 106 | 106 | 105 | +3.75 | % | +4.03 | % | 2/1/2026 | $531 / sqft | 48% | 3 | ||||||||||||
63 | Multifamily | Tampa | 2/15/2022 | 106 | 106 | 105 | +2.85 | % | +3.11 | % | 3/9/2027 | $241,972 / unit | 73% | 2 | ||||||||||||
64 | Office | Orange County | 8/31/2017 | 105 | 105 | 105 | +2.62 | % | +2.62 | % | 9/9/2026 | $162 / sqft | 58% | 4 | ||||||||||||
65 | Office | Minneapolis | 11/27/2019 | 104 | 102 | 96 | +7.86 | % | +7.86 | % | 9/6/2025 | $93 / sqft | n/m | 5 | ||||||||||||
66 | Office | Chicago | 9/30/2021 | 101 | 101 | 101 | 5.00 | % | 5.00 | % | 10/9/2029 | $112 / sqft | 43% | 4 | ||||||||||||
67 | Multifamily | Diversified, NL | 3/27/2025 | 101 | 101 | 100 | +2.70 | % | +2.97 | % | 3/31/2028 | $121,567 / unit | 62% | 2 | ||||||||||||
68 | Hospitality | Honolulu | 1/30/2020 | 99 | 99 | 99 | +3.50 | % | +3.66 | % | 2/9/2027 | $270,109 / key | 63% | 3 | ||||||||||||
69 | Industrial | New York | 6/18/2021 | 99 | 99 | 99 | +2.71 | % | +2.95 | % | 7/9/2026 | $51 / sqft | 55% | 1 | ||||||||||||
70 | Hospitality | Honolulu | 3/13/2018 | 98 | 98 | 98 | +3.11 | % | +3.36 | % | 4/9/2027 | $152,536 / key | 50% | 3 | ||||||||||||
71 | Industrial | Diversified, BE | 3/7/2025 | 111 | 98 | 97 | +2.75 | % | +3.32 | % | 3/7/2030 | $41 / sqft | 57% | 3 | ||||||||||||
72 | Multifamily | Miami | 3/29/2022 | 97 | 97 | 98 | +1.80 | % | +2.00 | % | 4/9/2027 | $271,118 / unit | 75% | 4 | ||||||||||||
73 | Multifamily | San Antonio | 3/20/2025 | 97 | 97 | 96 | +2.80 | % | +3.16 | % | 4/9/2030 | $449,074 / unit | 72% | 3 | ||||||||||||
74 | Multifamily | Phoenix | 10/1/2021 | 97 | 97 | 97 | +1.86 | % | +2.79 | % | 10/1/2026 | $223,811 / unit | 77% | 4 | ||||||||||||
75 | Multifamily | Philadelphia | 10/28/2021 | 96 | 96 | 95 | +3.00 | % | +3.24 | % | 11/9/2026 | $352,399 / unit | 79% | 3 | ||||||||||||
76 | Office | Washington, DC | 12/21/2021 | 103 | 94 | 94 | +2.70 | % | +2.94 | % | 1/9/2027 | $322 / sqft | 68% | 3 | ||||||||||||
77 | Multifamily | Orlando | 10/27/2021 | 93 | 93 | 93 | +2.61 | % | +2.81 | % | 11/9/2026 | $155,612 / unit | 75% | 3 | ||||||||||||
78 | Multifamily | Seattle | 9/13/2024 | 94 | 93 | 92 | +3.25 | % | +4.11 | % | 11/9/2027 | $500,796 / unit | 68% | 3 | ||||||||||||
79 | Hospitality | Boston | 3/3/2022 | 92 | 92 | 92 | +2.75 | % | +2.99 | % | 3/9/2027 | $418,182 / key | 64% | 2 | ||||||||||||
80 | Industrial | Diversified, US | 5/22/2025 | 115 | 90 | 89 | +3.00 | % | +3.41 | % | 6/9/2030 | $113 / acre | 56% | 3 | ||||||||||||
81 | Mixed-Use | San Francisco | 6/14/2022 | 106 | 88 | 88 | +2.95 | % | +3.84 | % | 7/9/2027 | $182 / sqft | 76% | 4 | ||||||||||||
82 | Hospitality | San Francisco | 10/16/2018 | 88 | 88 | 88 | +7.36 | % | +7.36 | % | 5/9/2025 | $191,807 / key | n/m | 5 | ||||||||||||
83 | Industrial | Dublin, IE | 8/17/2022 | 84 | 83 | 83 | +3.35 | % | +3.86 | % | 8/17/2027 | $132 / sqft | 72% | 2 | ||||||||||||
84 | Multifamily | Charlotte | 7/29/2021 | 82 | 82 | 82 | +2.76 | % | +3.01 | % | 8/9/2026 | $223,735 / unit | 78% | 3 | ||||||||||||
85 | Hospitality | Diversified, US | 8/27/2021 | 79 | 79 | 78 | +4.35 | % | +4.59 | % | 9/9/2026 | $116,587 / key | 67% | 3 | ||||||||||||
86 | Multifamily | Tampa | 12/21/2021 | 74 | 74 | 74 | +2.70 | % | +2.94 | % | 1/9/2027 | $217,353 / unit | 77% | 3 | ||||||||||||
87 | Retail | Utrecht, NL | 5/30/2025 | 74 | 74 | 73 | +2.80 | % | +3.16 | % | 5/30/2030 | $174 / sqft | 62% | 3 | ||||||||||||
88 | Hospitality | London, UK | 8/16/2022 | 73 | 73 | 72 | +4.75 | % | +5.19 | % | 8/16/2027 | $539,108 / key | 64% | 3 | ||||||||||||
89 | Multifamily | Tacoma | 10/28/2021 | 69 | 69 | 69 | +2.66 | % | +2.86 | % | 11/9/2026 | $209,864 / unit | 70% | 3 | ||||||||||||
90 | Multifamily | Las Vegas | 3/31/2022 | 68 | 68 | 68 | +2.80 | % | +3.04 | % | 4/9/2027 | $149,295 / unit | 71% | 3 | ||||||||||||
Senior Loan Portfolio(1) | ||||||||||||||||||||||||||
Property Type | Location | Origination Date(2) | Total Commitment(3) | Principal Balance | Net Book Value(4) | Cash Coupon(5) | All-in Yield(5) | Maximum Maturity(6) | Loan Per SQFT / Unit / Key | Origination LTV(2) | Risk Rating | |||||||||||||||
91 | Multifamily | Salt Lake City | 7/30/2021 | $62 | $62 | $62 | +2.86 | % | +3.06 | % | 8/9/2026 | $224,185 / unit | 73% | 3 | ||||||||||||
92 | Office | Los Angeles | 4/6/2021 | 62 | 62 | 62 | 6.00 | % | 6.00 | % | 1/9/2030 | $254 / sqft | 65% | 3 | ||||||||||||
93 | Office | Nashville | 6/30/2021 | 65 | 61 | 61 | +2.95 | % | +3.20 | % | 7/9/2026 | $252 / sqft | 71% | 4 | ||||||||||||
94 | Hospitality | Bermuda | 4/26/2024 | 69 | 61 | 61 | +4.95 | % | +5.62 | % | 5/9/2029 | $693,780 / key | 39% | 2 | ||||||||||||
95 | Office | Fort Lauderdale | 12/10/2020 | 61 | 60 | 60 | +3.30 | % | +3.54 | % | 1/9/2026 | $209 / sqft | 68% | 3 | ||||||||||||
96 | Multifamily | Phoenix | 12/17/2021 | 58 | 58 | 58 | +2.65 | % | +2.85 | % | 1/9/2027 | $209,601 / unit | 69% | 3 | ||||||||||||
97 | Office | Miami | 6/14/2021 | 58 | 58 | 58 | +2.30 | % | +2.30 | % | 3/9/2027 | $122 / sqft | 65% | 3 | ||||||||||||
98 | Office | New York | 5/28/2025 | 68 | 56 | 55 | +3.25 | % | +3.66 | % | 6/9/2030 | $364 / sqft | 60% | 3 | ||||||||||||
99 | Industrial | Minneapolis | 12/12/2024 | 61 | 56 | 55 | +2.85 | % | +3.23 | % | 1/9/2030 | $79 / sqft | 59% | 3 | ||||||||||||
100 | Multifamily | Atlanta | 3/6/2025 | 55 | 55 | 55 | +2.75 | % | +3.11 | % | 3/9/2030 | $187,075 / unit | 66% | 3 | ||||||||||||
101 | Office | Denver | 8/5/2021 | 56 | 54 | 54 | +2.96 | % | +3.21 | % | 8/9/2026 | $205 / sqft | 70% | 3 | ||||||||||||
102 | Office | Denver | 4/7/2022 | 57 | 54 | 54 | +3.25 | % | +3.50 | % | 4/9/2027 | $158 / sqft | 59% | 3 | ||||||||||||
103 | Industrial | Diversified, US | 12/14/2018 | 54 | 54 | 54 | +3.01 | % | +3.35 | % | 1/9/2026 | $40 / sqft | 57% | 1 | ||||||||||||
104 | Multifamily | Los Angeles | 7/28/2021 | 53 | 53 | 53 | +2.75 | % | +2.99 | % | 8/9/2026 | $303,097 / unit | 71% | 3 | ||||||||||||
105 | Office | Los Angeles | 8/22/2019 | 53 | 53 | 53 | +2.66 | % | +2.91 | % | 3/9/2027 | $304 / sqft | 63% | 4 | ||||||||||||
106 | Self-Storage | Diversified, US | 2/18/2025 | 53 | 53 | 52 | +3.10 | % | +3.47 | % | 3/9/2030 | $92 / sqft | 67% | 3 | ||||||||||||
107 | Multifamily | Denver | 3/19/2025 | 51 | 51 | 51 | +2.60 | % | +2.92 | % | 5/9/2030 | $221,739 / unit | 64% | 3 | ||||||||||||
108 | Hospitality | Waimea | 2/27/2025 | 50 | 50 | 50 | +2.80 | % | +2.92 | % | 2/9/2030 | $823,353 / key | 52% | 3 | ||||||||||||
109 | Multifamily | Los Angeles | 7/20/2021 | 48 | 48 | 48 | +2.86 | % | +3.11 | % | 8/9/2026 | $366,412 / unit | 60% | 3 | ||||||||||||
110 | Retail | Chicago | 11/30/2016 | 55 | 46 | 46 | +3.33 | % | +3.82 | % | 12/9/2025 | $804 / sqft | 54% | 4 | ||||||||||||
111 | Multifamily | Columbus | 12/8/2021 | 48 | 44 | 44 | +2.75 | % | +2.96 | % | 12/9/2026 | $143,150 / unit | 69% | 2 | ||||||||||||
112 | Multifamily | Dallas | 12/29/2021 | 43 | 43 | 43 | +3.05 | % | +3.24 | % | 1/1/2027 | $144,167 / unit | 73% | 3 | ||||||||||||
113 | Multifamily | Las Vegas | 7/29/2021 | 42 | 42 | 42 | +2.86 | % | +3.06 | % | 8/9/2026 | $167,113 / unit | 72% | 2 | ||||||||||||
114 | Multifamily | Las Vegas | 3/31/2022 | 39 | 39 | 39 | +2.80 | % | +3.04 | % | 4/9/2027 | $155,163 / unit | 72% | 3 | ||||||||||||
115 | Multifamily | Austin | 2/26/2021 | 36 | 36 | 36 | +3.50 | % | +3.74 | % | 3/9/2026 | $196,228 / unit | 64% | 1 | ||||||||||||
116 | Multifamily | New York | 12/23/2021 | 35 | 35 | 35 | +1.71 | % | +2.61 | % | 11/15/2025 | $171,269 / unit | 68% | 1 | ||||||||||||
117 | Multifamily | Los Angeles | 3/1/2022 | 35 | 35 | 35 | +3.00 | % | +3.24 | % | 3/9/2027 | $372,340 / unit | 72% | 3 | ||||||||||||
118 | Office | Diversified, AU | 5/8/2025 | 35 | 35 | 35 | +3.80 | % | +3.98 | % | 5/8/2028 | $396 / sqft | 75% | 3 | ||||||||||||
119 | Office | New York | 12/23/2021 | 35 | 35 | 35 | +3.11 | % | +3.33 | % | 2/1/2026 | $247 / sqft | 30% | 1 | ||||||||||||
120 | Multifamily | Corvallis | 12/23/2021 | 35 | 35 | 35 | +2.76 | % | +2.93 | % | 10/23/2025 | $96,273 / unit | 71% | 1 | ||||||||||||
Senior Loan Portfolio(1) | ||||||||||||||||||||||||||
Property Type | Location | Origination Date(2) | Total Commitment(3) | Principal Balance | Net Book Value(4) | Cash Coupon(5) | All-in Yield(5) | Maximum Maturity(6) | Loan Per SQFT / Unit / Key | Origination LTV(2) | Risk Rating | |||||||||||||||
121 | Office | Atlanta | 5/27/2025 | $41 | $34 | $33 | +3.65 | % | +4.00 | % | 6/9/2030 | $115 / sqft | 39% | 3 | ||||||||||||
122 | Mixed-Use | New York | 6/25/2025 | 221 | 33 | 31 | +3.75 | % | +4.43 | % | 12/25/2028 | $58,581 / unit | 44% | 3 | ||||||||||||
123 | Multifamily | Chicago | 11/19/2020 | 38 | 32 | 32 | +3.50 | % | +3.76 | % | 12/9/2025 | $184,388 / unit | 53% | 1 | ||||||||||||
124 | Multifamily | Atlanta | 11/3/2021 | 32 | 32 | 32 | +2.71 | % | +2.96 | % | 11/9/2026 | $182,093 / unit | 53% | 3 | ||||||||||||
125 | Office | Austin | 4/15/2021 | 36 | 32 | 32 | +3.06 | % | +3.06 | % | 12/9/2029 | $153 / sqft | 40% | 3 | ||||||||||||
126 | Multifamily | Melbourne, AU | 8/26/2022 | 28 | 28 | 27 | +4.50 | % | +4.94 | % | 6/23/2029 | $294,045 / unit | 68% | 3 | ||||||||||||
127 | Mixed-Use | New York | 2/21/2025 | 24 | 24 | 24 | +3.25 | % | +3.52 | % | 3/9/2030 | $775 / sqft | 59% | 3 | ||||||||||||
128 | Hospitality | Atlanta | 10/1/2019 | 23 | 23 | 23 | +3.80 | % | +4.03 | % | 10/9/2025 | $129,442 / key | 74% | 3 | ||||||||||||
129 | Multifamily | Las Vegas | 8/4/2021 | 22 | 22 | 22 | +2.86 | % | +3.13 | % | 8/9/2026 | $180,000 / unit | 73% | 3 | ||||||||||||
130 | Multifamily | Atlanta | 5/9/2025 | 21 | 21 | 21 | +2.85 | % | +2.94 | % | 5/9/2030 | $205,882 / unit | 65% | 3 | ||||||||||||
131 | Multifamily | Melbourne, AU | 6/13/2025 | 240 | 0 | (2) | +4.75 | % | +7.76 | % | 6/13/2029 | $0 / unit | 76% | 3 | ||||||||||||
Subtotal: Senior loan portfolio | $20,506 | $19,196 | $19,067 | +3.24 | +3.59 | 2.3 yrs | 64% | 3.1 | ||||||||||||||||||
Subordinate Loan Portfolio(9) | ||||||||||||||||||||||||||
Property Type | Location | Origination Date(2) | Total Commitment(3) | Principal Balance | Net Book Value(4) | Cash Coupon(5) | All-in Yield(5) | Maximum Maturity(6) | Loan Per SQFT / Unit / Key | Origination LTV(2) | Risk Rating | |||||||||||||||
132 | Office | Chicago | 9/30/2021 | 143 | 110 | 110 | n/m | % | n/m | % | 10/9/2029 | $262 / sqft | n/m | 5 | ||||||||||||
133 | Office | Los Angeles | 11/22/2019 | 123 | 107 | 107 | +2.50 | % | +2.50 | % | 12/9/2027 | $785 / sqft | 69% | 4 | ||||||||||||
134 | Office | New York | 5/1/2018 | 102 | 102 | 86 | n/m | % | n/m | % | 3/7/2028 | $466 / sqft | n/m | 5 | ||||||||||||
135 | Industrial | Diversified, US | 3/10/2025 | 60 | 60 | 60 | +5.00 | % | +5.12 | % | 3/9/2030 | $178 / sqft | 70% | 3 | ||||||||||||
136 | Office | Orange County | 8/31/2017 | 64 | 57 | 40 | n/m | % | n/m | % | 9/9/2026 | $327 / sqft | n/m | 5 | ||||||||||||
137 | Life Sciences | San Francisco | 11/10/2021 | 72 | 57 | 57 | +8.71 | % | +8.93 | % | 12/9/2026 | $528 / sqft | 66% | 4 | ||||||||||||
138 | Multifamily | Miami | 3/29/2022 | 47 | 45 | 45 | +8.70 | % | +9.52 | % | 4/9/2027 | $380,633 / unit | 72% | 3 | ||||||||||||
139 | Mixed-Use | New York | 3/10/2020 | 35 | 35 | 34 | n/m | % | n/m | % | 7/11/2029 | $1,007 / sqft | n/m | 5 | ||||||||||||
140 | Multifamily | Los Angeles | 12/30/2021 | 46 | 34 | 33 | +8.80 | % | +9.90 | % | 1/9/2028 | $482,935 / unit | 50% | 3 | ||||||||||||
141 | Office | Austin | 4/15/2021 | 24 | 24 | 20 | n/m | % | n/m | % | 12/9/2029 | $270 / sqft | n/m | 5 | ||||||||||||
142 | Mixed-Use | New York | 5/20/2025 | 28 | 17 | 17 | 10.00 | % | 10.06 | % | 10/1/2034 | $1,038 / sqft | 59% | 3 | ||||||||||||
143 | Hospitality | Miami | 5/2/2025 | 23 | 17 | 16 | +9.50 | % | +10.33 | % | 5/9/2030 | $1,403,393 / key | 53% | 3 | ||||||||||||
144 | Office | London, UK | 12/20/2019 | 14 | 14 | 14 | n/m | % | n/m | % | 3/31/2029 | $711 / sqft | n/m | 5 | ||||||||||||
Subtotal: subordinate loan portfolio | $781 | $679 | $639 | +5.78 | +6.09 | 2.9 yrs | 67% | 4.3 | ||||||||||||||||||
Subtotal: loans receivable portfolio | $21,286 | $19,875 | $19,706 | |||||||||||||||||||||||
Total CECL reserve | (741) | |||||||||||||||||||||||||
Total loans receivable portfolio | $21,286 | $19,875 | $18,965 | +3.30 | % | +3.57 | % | 2.3 yrs | 64% | 3.1 | ||||||||||||||||
Acquisition Date | Location | Property Type | Acquisition Date Fair Value | SQFT / Units / Keys | ||||||
1 | March 2024 | Mountain View, CA | Office | $60,203 | 150,507 sqft | |||||
2 | July 2024 | San Antonio, TX | Multifamily | 33,607 | 388 units | |||||
3 | September 2024 | Burlington, MA | Office | 64,628 | 379,018 sqft | |||||
4 | October 2024 | Washington, DC | Office | 107,016 | 892,480 sqft | |||||
5 | December 2024 | San Francisco, CA | Hospitality | 201,530 | 686 keys | |||||
6 | December 2024 | El Segundo, CA | Office | 145,363 | 494,532 sqft | |||||
7 | December 2024 | Denver, CO | Office | 33,337 | 170,304 sqft | |||||
8 | February 2025 | Chicago, IL | Office | 45,045 | 517,115 sqft | |||||
$690,729 |
Assets (Liabilities) Sensitive to Changes in Interest Rates(1) | Interest Rate Sensitivity as of June 30, 2025(2)(3) | |||||||||
Increase in Rates | Decrease in Rates | |||||||||
50 Basis Points | 100 Basis Points | 50 Basis Points | 100 Basis Points | |||||||
Floating rate assets(4)(5)(6) | $17,801,211 | $71,068 | $142,272 | $(70,708) | $(135,774) | |||||
Floating rate liabilities(5)(7) | (15,937,045) | (63,948) | (127,896) | 63,859 | 127,671 | |||||
Net exposure | $1,864,166 | $7,120 | $14,376 | $(6,849) | $(8,103) | |||||
June 30, 2025 | |||||
GBP | EUR | All Other(1) | |||
Foreign currency assets | £2,723,413 | €2,337,692 | $2,118,545 | ||
Foreign currency liabilities | (2,061,097) | (1,653,560) | (1,677,634) | ||
Foreign currency contracts – notional | (655,443) | (677,316) | (432,723) | ||
Net exposure to exchange rate fluctuations | £6,873 | €6,816 | $8,188 | ||
Net exposure to exchange rate fluctuations in USD(2) | $9,438 | $8,034 | $8,188 | ||
Period | Total Number of Shares Purchased | Average Price Paid per Share | Total Number of Shares Purchased as Part of Publicly Announced Plans or Programs(1) | Approximate Dollar Value of Shares that May Yet Be Purchased Under the Program ($ in thousands)(1) | |||
April 1 - April 30, 2025 | — | $— | — | $89,189 | |||
May 1 - May 31, 2025 | 2,100 | 18.38 | 2,100 | 89,150 | |||
June 1 - June 30, 2025 | — | — | — | 89,150 | |||
Total | 2,100 | $18.38 | 2,100 | $89,150 |
ITEM 6. | EXHIBITS |
10.1 | ||
10.2 | ||
10.3 | ||
10.4 | ||
10.5 | ||
10.6 | ||
31.1 | ||
31.2 | ||
32.1 + | ||
32.2 + | ||
101.INS | XBRL Instance Document – the instance document does not appear in the interactive data file because its XBRL tags are embedded within the inline XBRL document | |
101.SCH | Inline XBRL Taxonomy Extension Schema Document With Embedded Linkbase Documents | |
101.CAL | Inline XBRL Taxonomy Extension Calculation Linkbase Document | |
101.DEF | Inline XBRL Taxonomy Extension Definition Linkbase Document | |
101.LAB | Inline XBRL Taxonomy Extension Label Linkbase Document | |
101.PRE | Inline XBRL Taxonomy Extension Presentation Linkbase Document | |
104 | Cover Page Interactive Data File (formatted as Inline XBRL and contained in Exhibit 101) | |
BLACKSTONE MORTGAGE TRUST, INC. | ||
July 30, 2025 | /s/ Katharine A. Keenan | |
Date | Katharine A. Keenan | |
Chief Executive Officer | ||
(Principal Executive Officer) | ||
July 30, 2025 | /s/ Anthony F. Marone, Jr. | |
Date | Anthony F. Marone, Jr. | |
Chief Financial Officer | ||
(Principal Financial Officer) | ||
July 30, 2025 | /s/ Marcin Urbaszek | |
Date | Marcin Urbaszek | |
Deputy Chief Financial Officer | ||
(Principal Accounting Officer) |