
June 2026 Investor Presentation
2 Forward-Looking Statements / Non-GAAP Disclosures Forward-Looking
Statements This presentation contains statements about future events that constitute forward-looking statements, as defined in the Private Securities Litigation Reform Act of 1995. Forward-looking statements may be identified by references
to a future period or periods or by the use of the words “believe,” “expect,” “anticipate,” “intend,” “estimate,” “assume,” “will,” “should,” “could,” “plan,” and other similar terms of expressions. Forward-looking statements should not be
relied on because they involve known and unknown risks, uncertainties and other factors, many of which are beyond the Company’s control. These risks, uncertainties and other factors may cause the actual results, performance or achievements
expressed in, or implied by, the forward-looking statements to differ materially from those contemplated by the forward-looking statements. Factors that may cause such a difference include, but are not limited to, local, regional, national
and international general economic conditions, including actual or potential stress in the banking industry, financial and regulatory changes, changes in interest rates, regulatory considerations, competition, technological developments,
retention and recruitment of qualified personnel, changes in customer deposit behavior, and market acceptance of the Company’s pricing, products and services. The Company cautions readers not to place undue reliance on any forward-looking
statements, which speak only as of the date made, and advises readers that various factors, including, but not limited to, those described above and other factors discussed in the Company’s annual and quarterly reports previously filed with
the Securities and Exchange Commission, could affect the Company’s financial performance and could cause the Company’s actual results or circumstances for future periods to differ materially from those anticipated or projected. Unless
required by law, the Company does not undertake, and specifically disclaims any obligations to, publicly release any revisions that may be made to any forward-looking statements to reflect the occurrence of anticipated or unanticipated events
or circumstances after the date of such statements. For more information, please see our reports filed with the United States Securities and Exchange Commission (“SEC”), including our most recent annual report on Form 10-K and quarterly
reports on Form 10-Q. Non-GAAP Financial Measures In addition to presenting information in conformity with accounting principles generally accepted in the United States of America (GAAP), this presentation contains financial information
determined by methods other than GAAP (non-GAAP). The following measures used in this presentation, which are commonly utilized by financial institutions, have not been specifically exempted by the Securities and Exchange Commission ("SEC")
and may constitute "non-GAAP financial measures" within the meaning of the SEC's rules. The Company has provided in this Presentation supplemental disclosures for the calculation of tangible common equity to tangible assets and net interest
margin fully taxable-equivalent. Management believes that the non-GAAP financial measures disclosed by the Company from time to time are useful in evaluating the Company's performance and that such information should be considered as
supplemental in nature and not as a substitute for or superior to the related financial information prepared in accordance with GAAP. Our non-GAAP financial measures may differ from similar measures presented by other companies. Refer to the
appendix for Non-GAAP to GAAP reconciliations.
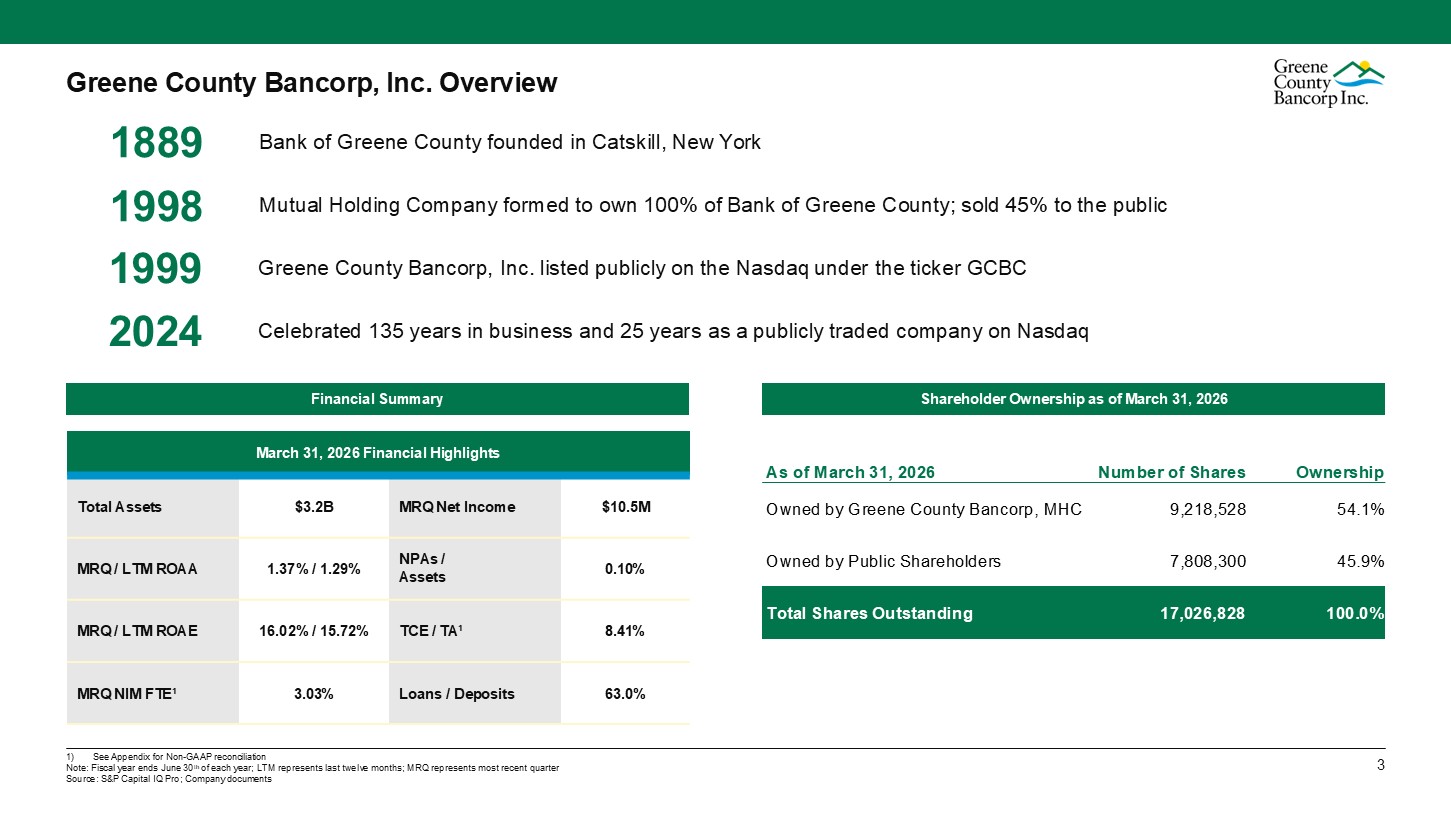
3 Greene County Bancorp, Inc. Overview Financial Summary March 31, 2026
Financial Highlights Total Assets $3.2B MRQ Net Income $10.5M MRQ / LTM ROAA 1.37% / 1.29% NPAs / Assets 0.10% MRQ / LTM ROAE 16.02% / 15.72% TCE / TA¹ 8.41% MRQ NIM FTE¹ 3.03% Loans /
Deposits 63.0% 1889 1998 1999 2024 Greene County Bancorp, Inc. listed publicly on the Nasdaq under the ticker GCBC Celebrated 135 years in business and 25 years as a publicly traded company on Nasdaq Bank of Greene County founded in
Catskill, New York Mutual Holding Company formed to own 100% of Bank of Greene County; sold 45% to the public 1) See Appendix for Non-GAAP reconciliation Note: Fiscal year ends June 30th of each year; LTM represents last twelve months; MRQ
represents most recent quarter Source: S&P Capital IQ Pro; Company documents Shareholder Ownership as of March 31, 2026 As of March 31, 2026 Number of Shares Ownership Owned by Greene County Bancorp, MHC 9,218,528 54.1% Owned by
Public Shareholders 7,808,300 45.9% Total Shares Outstanding 17,026,828 100.0%
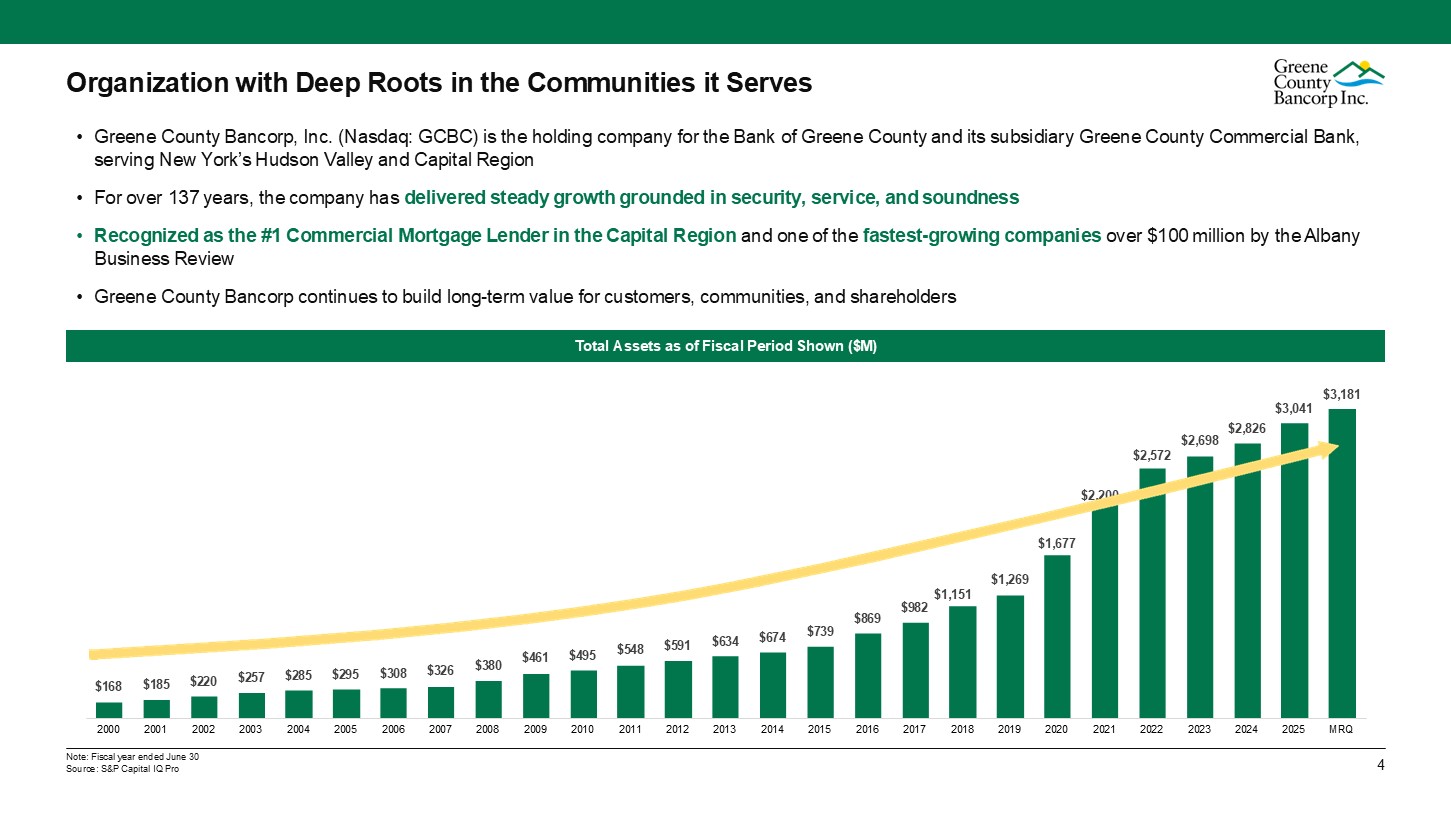
4 2000 2001 2002 Note: Fiscal year ended June 30 Source: S&P Capital IQ
Pro Organization with Deep Roots in the Communities it Serves Greene County Bancorp, Inc. (Nasdaq: GCBC) is the holding company for the Bank of Greene County and its subsidiary Greene County Commercial Bank, serving New York’s Hudson Valley
and Capital Region For over 137 years, the company has delivered steady growth grounded in security, service, and soundness Recognized as the #1 Commercial Mortgage Lender in the Capital Region and one of the fastest-growing companies over
$100 million by the Albany Business Review Greene County Bancorp continues to build long-term value for customers, communities, and
shareholders $168 $185 $220 $257 $285 $295 $308 $326 $380 $461 $495 $548 $591 $634 $674 $739 $869 $982 $3,181 $3,041 $2,826 $2,698 $2,572 $2,200 $1,677 $1,269 $1,151 2003 2004 2005 2006 2007 2008 2009 2010 2011 2012 2013 2014 2015 2016 2017 2018 2019 2020 2021 2022 2023 2024 2025 MRQ Total
Assets as of Fiscal Period Shown ($M)
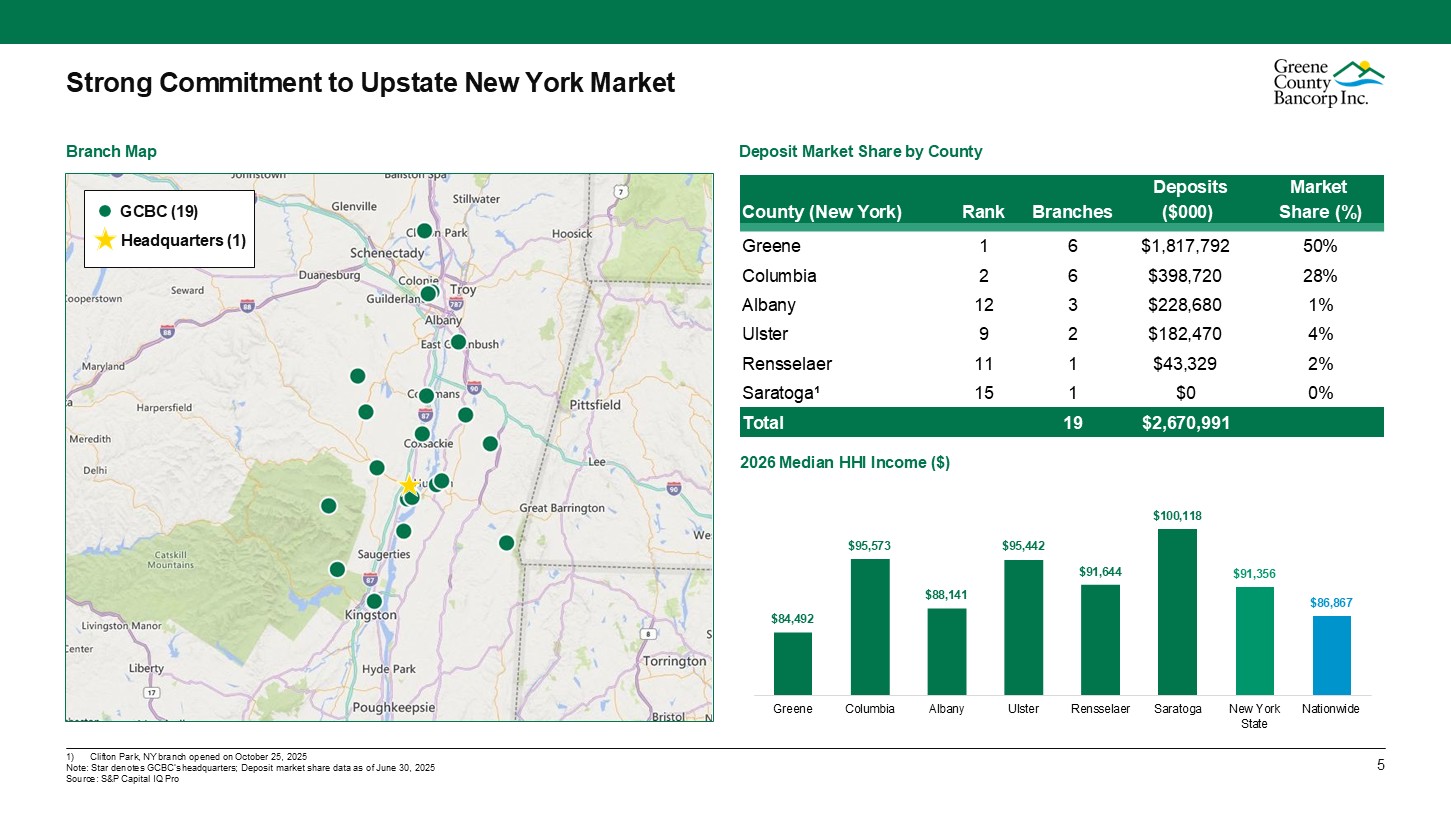
5 1) Clifton Park, NY branch opened on October 25, 2025 Note: Star denotes
GCBC’s headquarters; Deposit market share data as of June 30, 2025 Source: S&P Capital IQ Pro Strong Commitment to Upstate New York Market Deposit Market Share by County Branch Map GCBC (19) Headquarters (1) Deposits Market County
(New York) Rank Branches ($000) Share
(%) Greene 1 6 $1,817,792 50% Columbia 2 6 $398,720 28% Albany 12 3 $228,680 1% Ulster 9 2 $182,470 4% Rensselaer 11 1 $43,329 2% Saratoga¹ 15 1 $0 0% Total 19 $2,670,991 2026 Median HHI Income
($) $84,492 $95,573 $88,141 $95,442 $91,644 $100,118 $91,356 $86,867 Greene Columbia Albany Ulster Rensselaer Saratoga New York State Nationwide
6 Source: S&P Capital IQ Pro; Company documents Most Recent Quarter
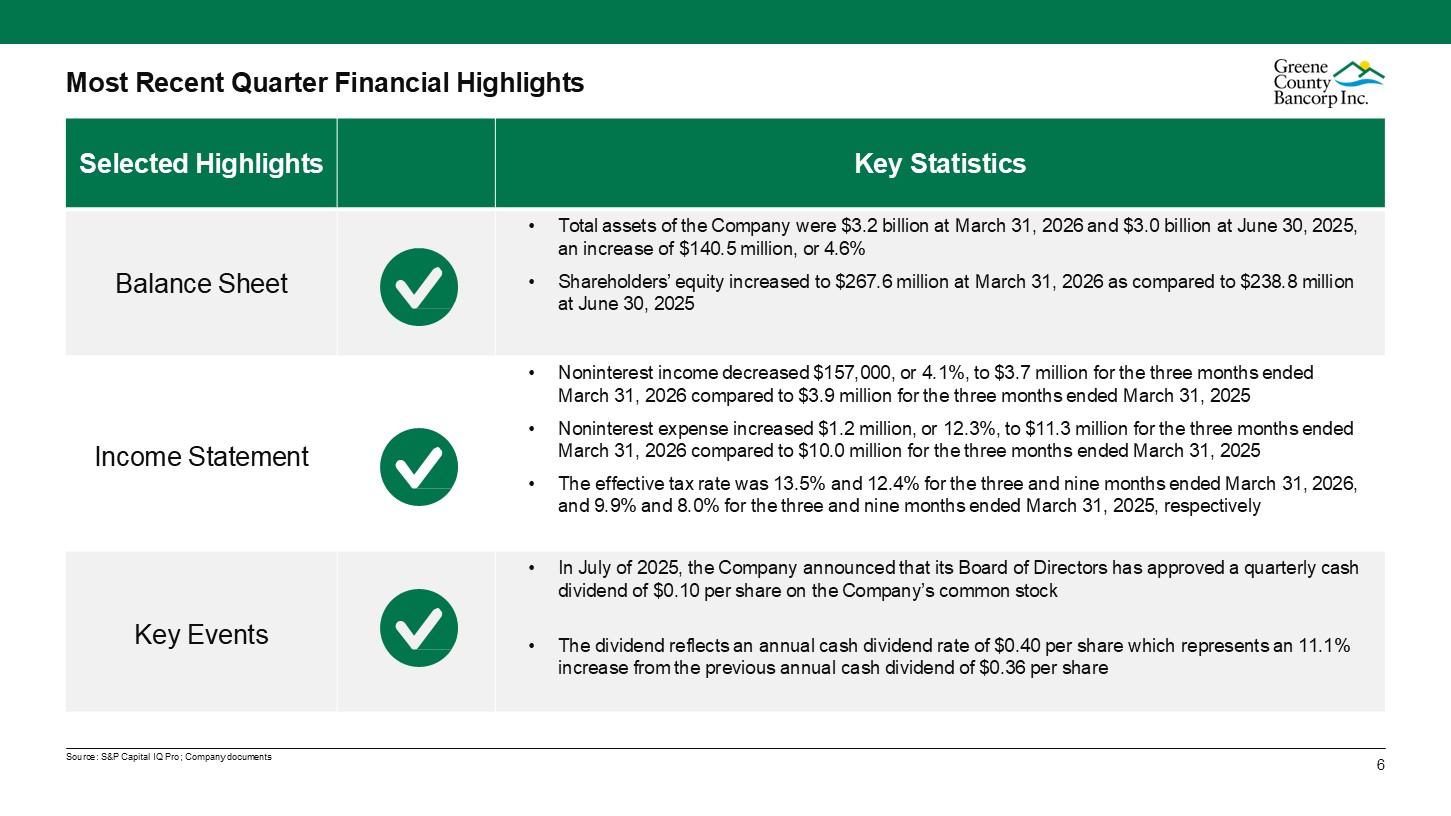
Financial Highlights Selected Highlights Key Statistics Balance Sheet Total assets of the Company were $3.2 billion at March 31, 2026 and $3.0 billion at June 30, 2025, an increase of $140.5 million, or 4.6% Shareholders’ equity
increased to $267.6 million at March 31, 2026 as compared to $238.8 million at June 30, 2025 Income Statement Noninterest income decreased $157,000, or 4.1%, to $3.7 million for the three months ended March 31, 2026 compared to $3.9 million
for the three months ended March 31, 2025 Noninterest expense increased $1.2 million, or 12.3%, to $11.3 million for the three months ended March 31, 2026 compared to $10.0 million for the three months ended March 31, 2025 The effective tax
rate was 13.5% and 12.4% for the three and nine months ended March 31, 2026, and 9.9% and 8.0% for the three and nine months ended March 31, 2025, respectively Key Events In July of 2025, the Company announced that its Board of Directors
has approved a quarterly cash dividend of $0.10 per share on the Company’s common stock The dividend reflects an annual cash dividend rate of $0.40 per share which represents an 11.1% increase from the previous annual cash dividend of $0.36
per share
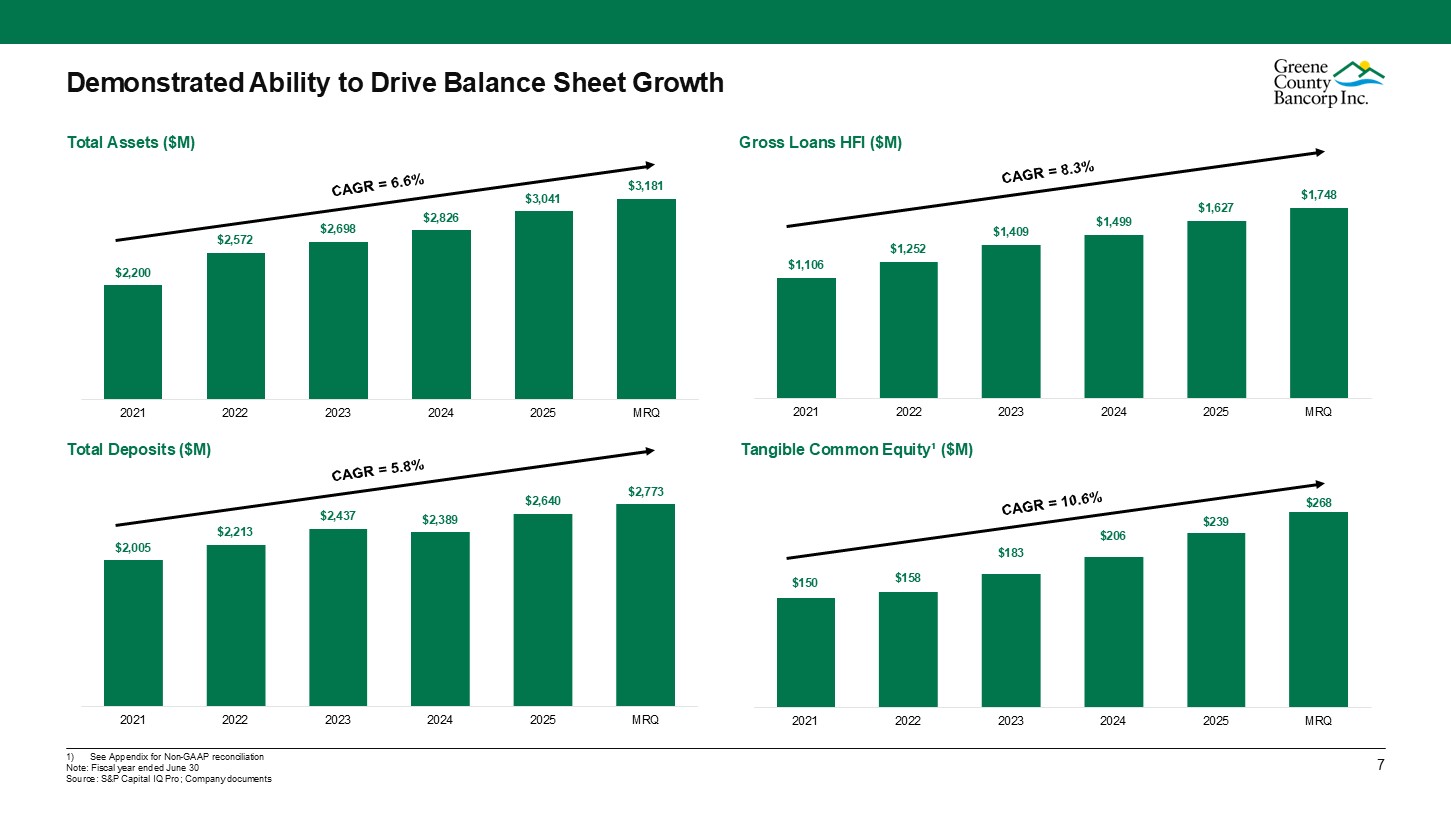
$2,200 $2,572 $2,698 $2,826 $3,041 $3,181 2021 2022 2023 2024 2025 MRQ $1,106 $1,252 $1,409 $1,499 $1,627 $1,748 2021
2022 Tangible Common Equity¹ ($M) 2023 2024 2025 MRQ $150 $158 $183 $206 $239 $268 2021 2022 2023 2024 2025 MRQ $2,005 $2,213 $2,437 $2,389 $2,640 $2,773 2021 2022 2023 2024 2025 MRQ Demonstrated Ability to Drive
Balance Sheet Growth Total Deposits ($M) Gross Loans HFI ($M) Total Assets ($M) 1) See Appendix for Non-GAAP reconciliation Note: Fiscal year ended June 30 Source: S&P Capital IQ Pro; Company documents 7
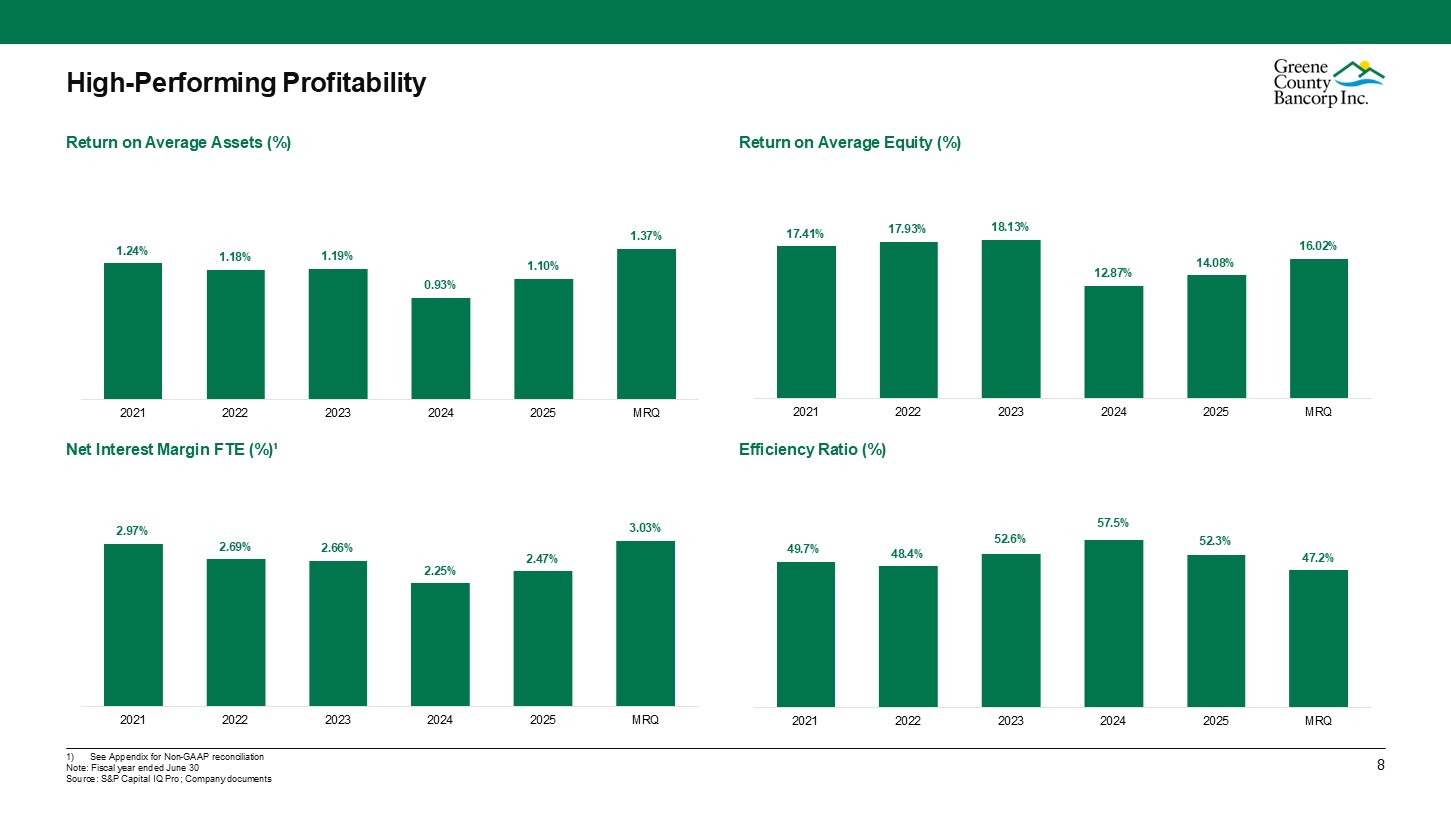
High-Performing Profitability Efficiency Ratio (%) 2021 2022 Net Interest
Margin FTE (%)¹ Return on Average Equity (%) Return on Average Assets
(%) 1.24% 1.18% 1.19% 0.93% 1.10% 1.37% 2023 2024 2025 MRQ 17.41% 17.93% 18.13% 12.87% 14.08% 16.02% 2021 2022 2023 2024 2025 MRQ 49.7% 48.4% 52.6% 57.5% 52.3% 47.2% 2021 2022 2023 2024 2025 MRQ 2.97% 1)
See Appendix for Non-GAAP reconciliation Note: Fiscal year ended June 30 Source: S&P Capital IQ Pro; Company documents 7 2.69% 2.66% 2.25% 2.47% 3.03% 2021 2022 2023 2024 2025 MRQ
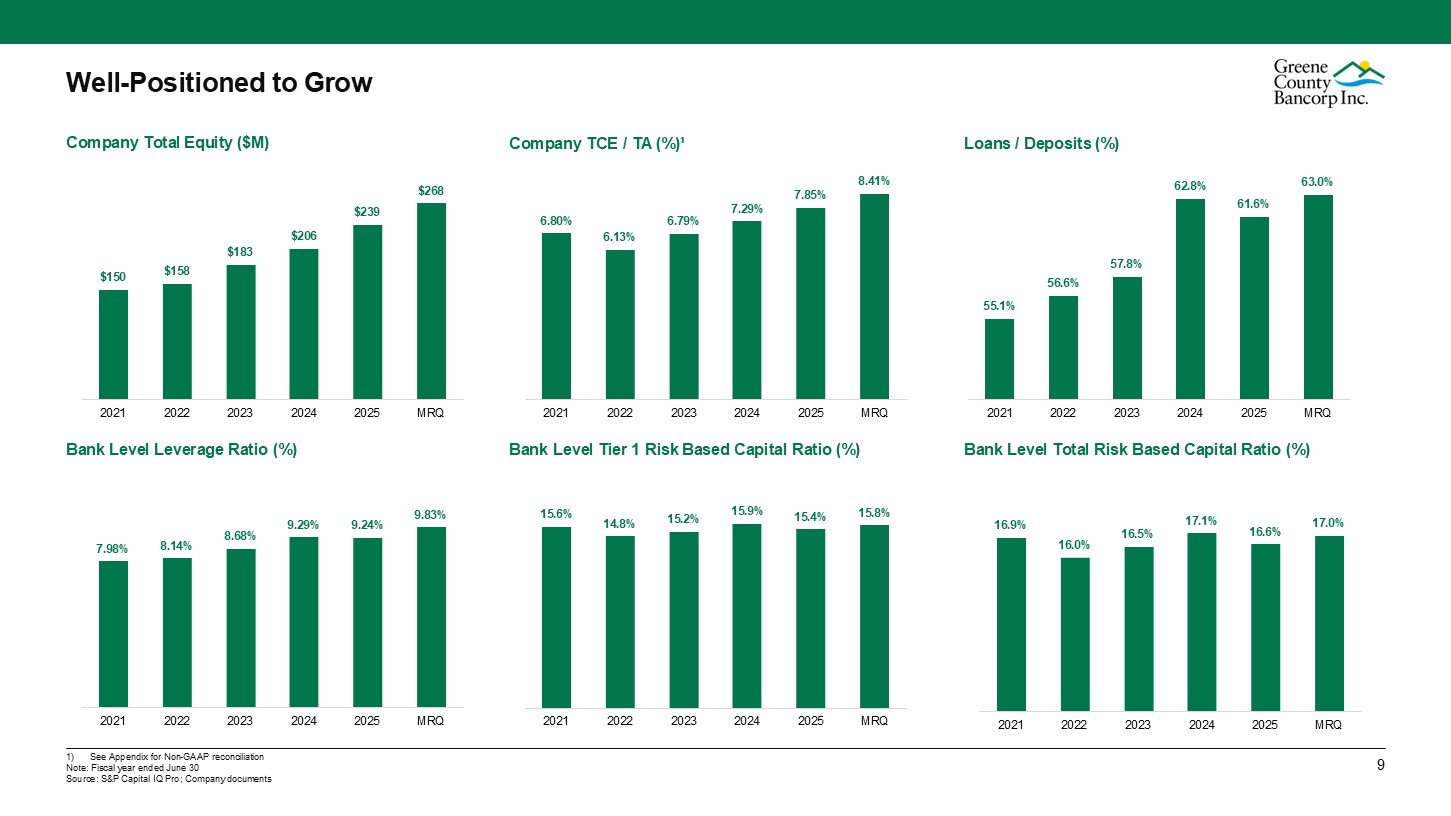
Well-Positioned to Grow 2021 2022 2023 2024 2025 MRQ Bank Level Tier 1 Risk
Based Capital Ratio (%) 2021 2022 2023 2024 Bank Level Leverage Ratio (%) Company TCE / TA (%)¹ Company Total Equity ($M) 2021 2022 2023 2024 2025 MRQ Bank Level Total Risk Based Capital Ratio (%) Loans / Deposits
(%) 55.1% 56.6% 57.8% 62.8% 61.6% 63.0% 16.9% 16.0% 16.5% 17.1% 16.6% 17.0% 2021 2022 2023 2024 2025 MRQ $150 $158 $183 $206 $239 $268 2025 MRQ 6.80% 6.13% 6.79% 7.29% 7.85% 8.41% 15.6% 14.8% 15.2% 15.9% 15.4% 15.8% 2021 2022 2023 2024 2025 MRQ 7.98% 1)
See Appendix for Non-GAAP reconciliation Note: Fiscal year ended June 30 Source: S&P Capital IQ Pro; Company documents 7 8.14% 8.68% 9.29% 9.24% 9.83% 2021 2022 2023 2024 2025 MRQ
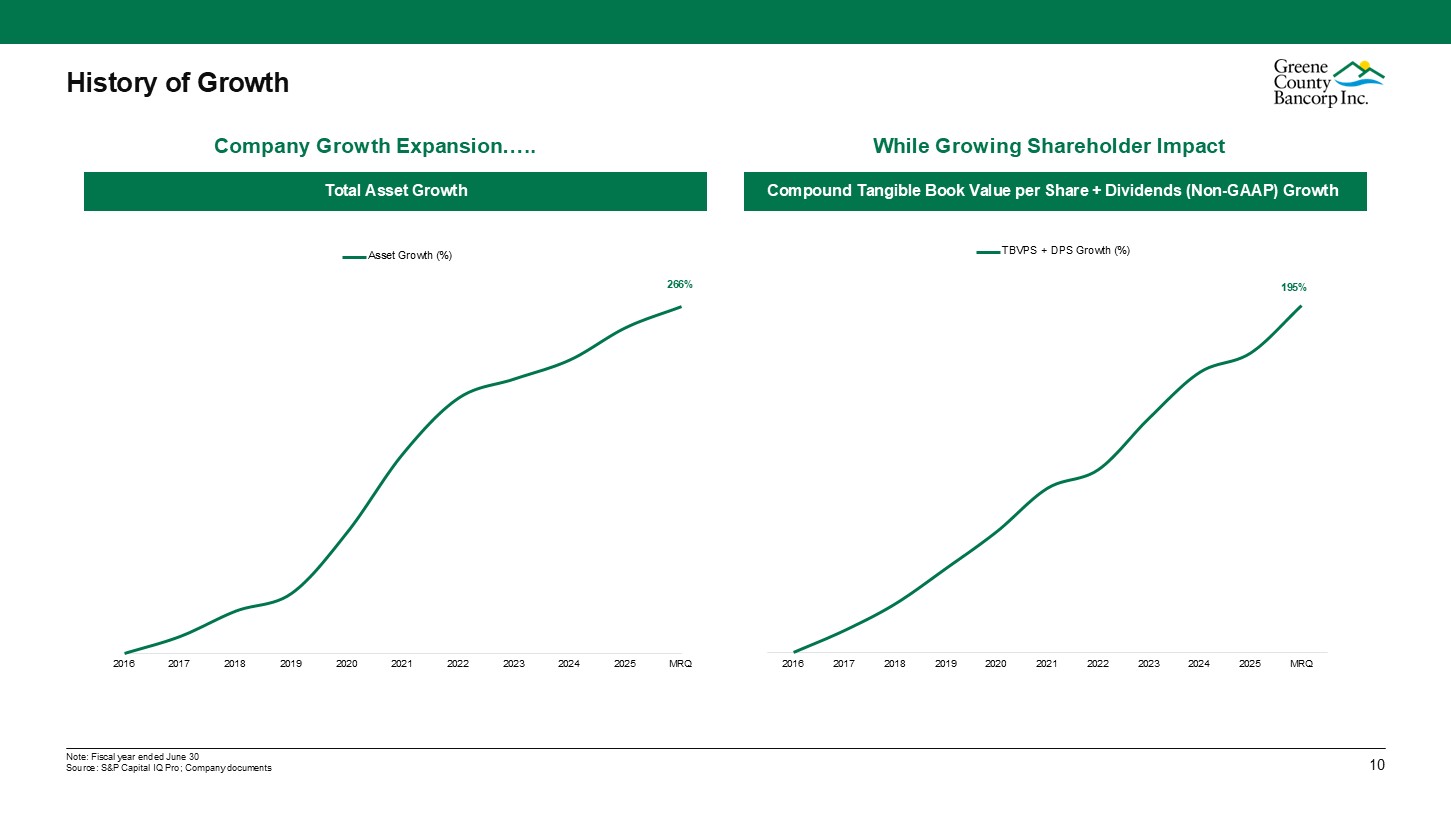
History of
Growth 195% 2016 2017 2018 2019 2020 2021 2022 2023 2024 2025 MRQ TBVPS + DPS Growth (%) Compound Tangible Book Value per Share + Dividends (Non-GAAP) Growth Total Asset
Growth 266% 2016 2017 2018 2019 2020 2021 2022 2023 2024 2025 MRQ Asset Growth (%) Note: Fiscal year ended June 30 Source: S&P Capital IQ Pro; Company documents 10 Company Growth Expansion….. While Growing Shareholder
Impact
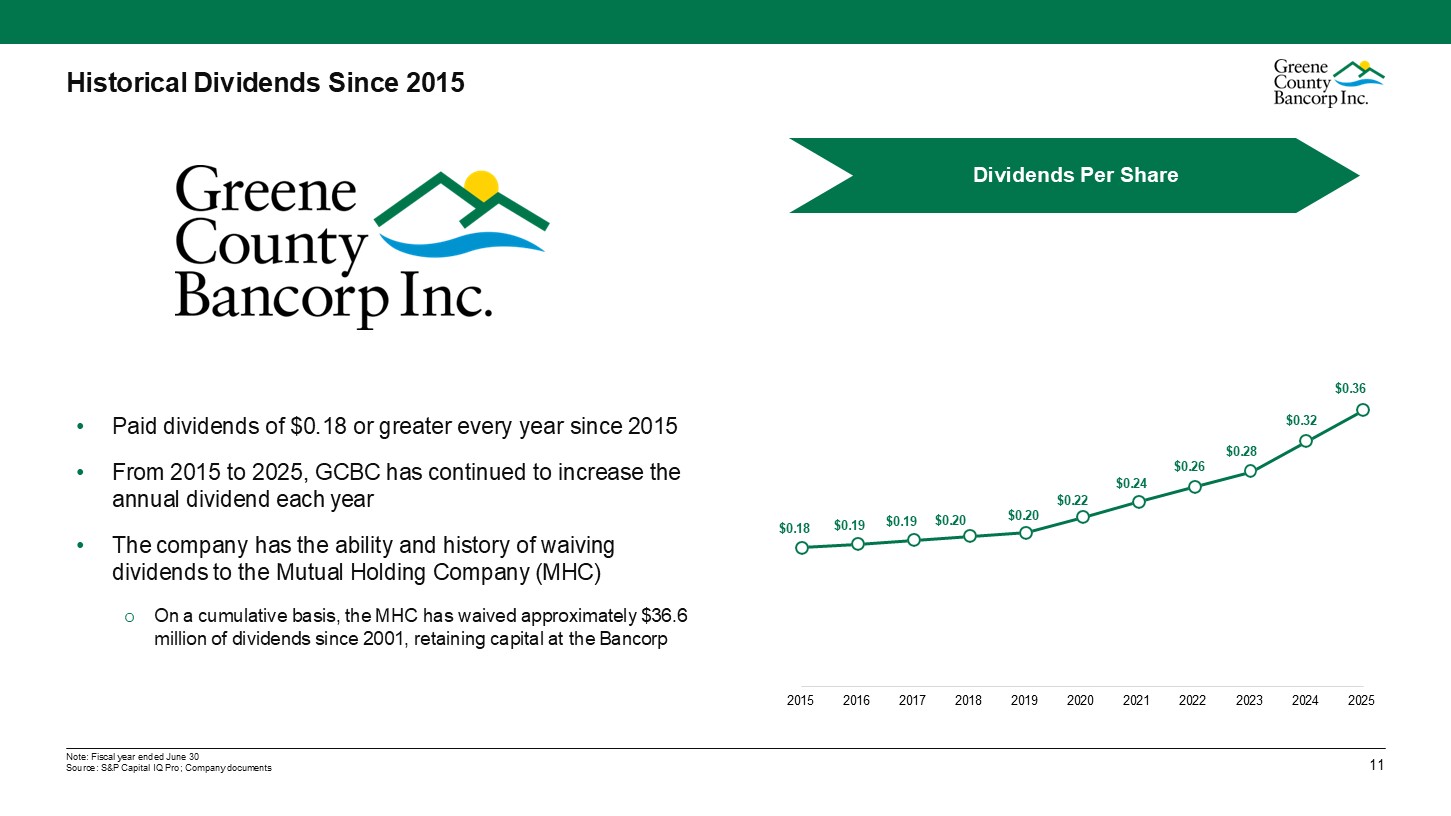
Historical Dividends Since 2015 Dividends Per Share Paid dividends of $0.18 or
greater every year since 2015 From 2015 to 2025, GCBC has continued to increase the annual dividend each year The company has the ability and history of waiving dividends to the Mutual Holding Company (MHC) On a cumulative basis, the MHC
has waived approximately $36.6 million of dividends since 2001, retaining capital at the
Bancorp $0.18 $0.19 $0.19 $0.20 $0.20 $0.22 $0.24 $0.26 $0.28 $0.32 $0.36 2015 2016 2017 2018 2019 2020 2021 2022 2023 2024 2025 Note: Fiscal year ended June 30 Source: S&P Capital IQ Pro; Company documents 10
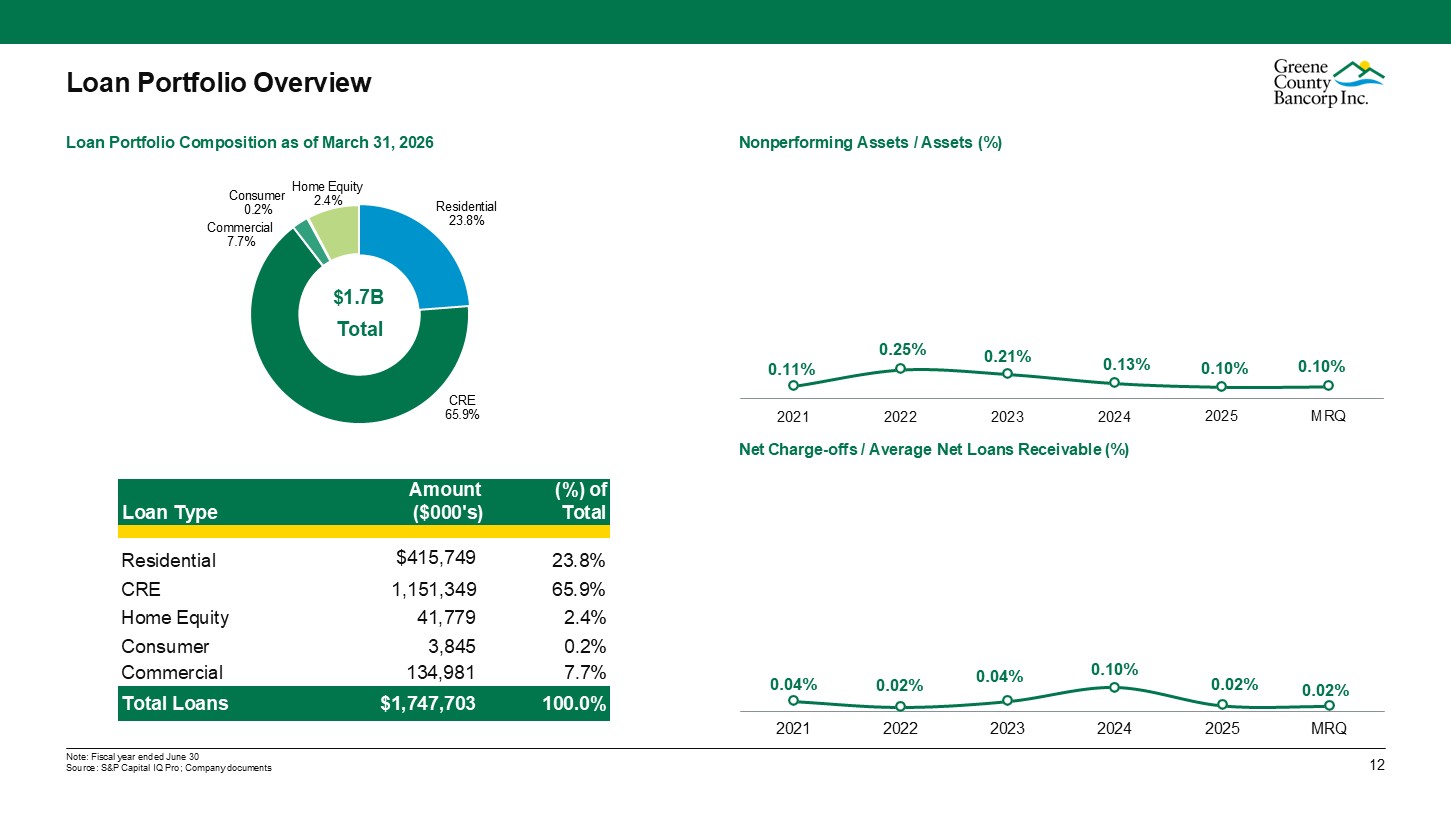
Loan Portfolio Overview Net Charge-offs / Average Net Loans Receivable
(%) Nonperforming Assets / Assets (%) Loan Portfolio Composition as of March 31, 2026 Amount (%) of Loan Type ($000's) Total Residential $415,749 23.8% CRE 1,151,349 65.9% Home
Equity 41,779 2.4% Consumer 3,845 0.2% Commercial 134,981 7.7% Total Loans $1,747,703 100.0% $1.7B Total Residential 23.8% CRE 65.9% Home Equity 2.4% Consumer 0.2% Commercial
7.7% 0.25% 0.21% 0.13% 0.10% 0.10% 0.11% 2021 2022 2023 2024 2025 MRQ 0.04% Note: Fiscal year ended June 30 Source: S&P Capital IQ Pro; Company
documents 10 0.02% 0.04% 0.10% 0.02% 0.02% 2021 2022 2023 2024 2025 MRQ
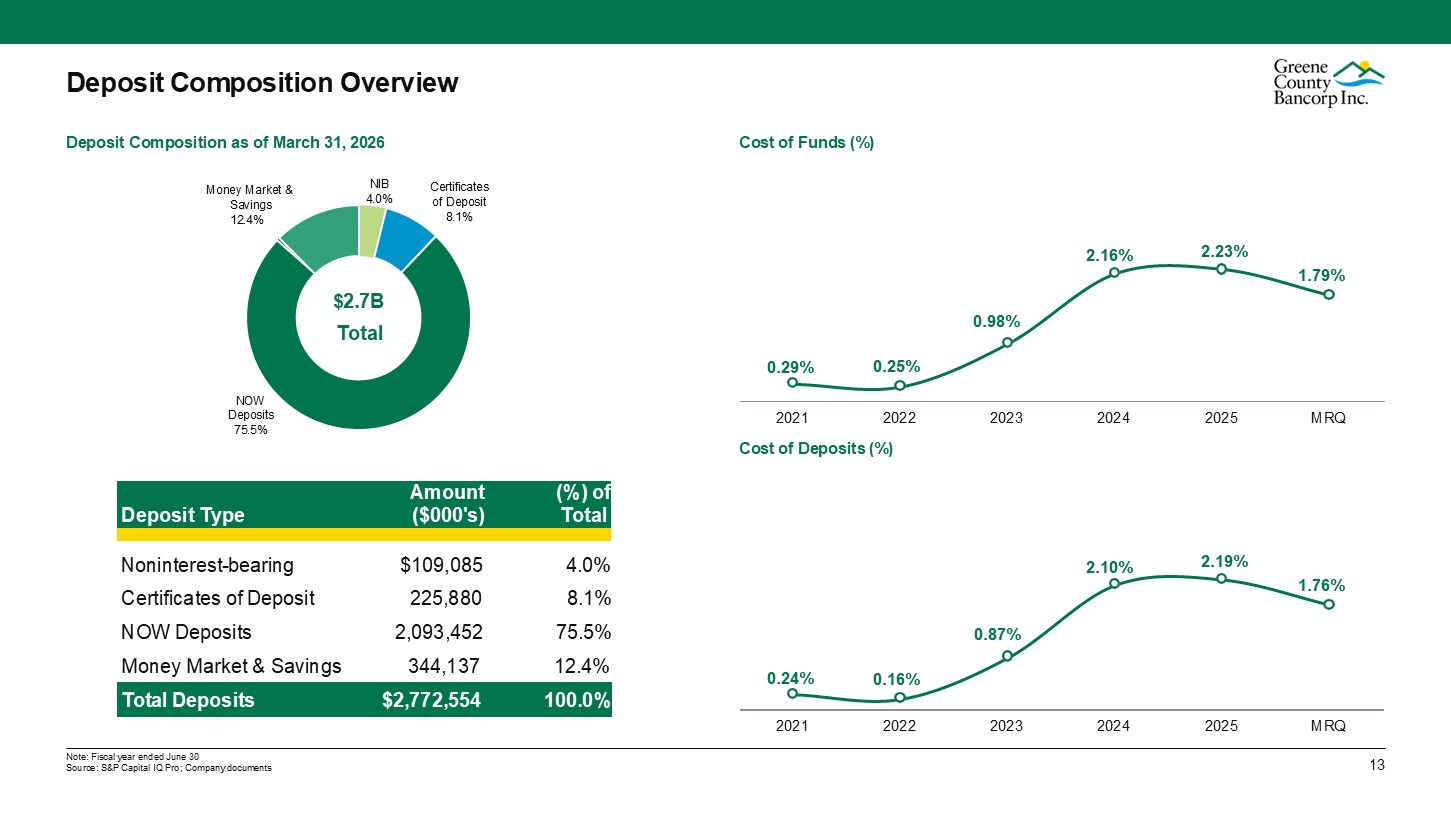
Deposit Composition Overview 2021 2022 Cost of Deposits (%) Cost of Funds
(%) Deposit Composition as of March 31, 2026 NIB 4.0% Certificates of Deposit 8.1% NOW Deposits 75.5% Money Market & Savings
12.4% $2.7B Total 0.29% 0.25% 0.98% 2.16% 2.23% 1.79% 2023 2024 2025 MRQ 0.24% 0.16% 2.19% 1.76% Noninterest-bearing $109,085 4.0% 2.10% Certificates of Deposit 225,880 8.1% NOW
Deposits 2,093,452 75.5% 0.87% Amount (%) of Deposit Type ($000's) Total Money Market & Savings Total Deposits $2,772,554 100.0% 2021 2022 2023 2024 2025 MRQ Note: Fiscal year ended June 30 Source: S&P Capital IQ
Pro; Company documents 13 344,137 12.4%
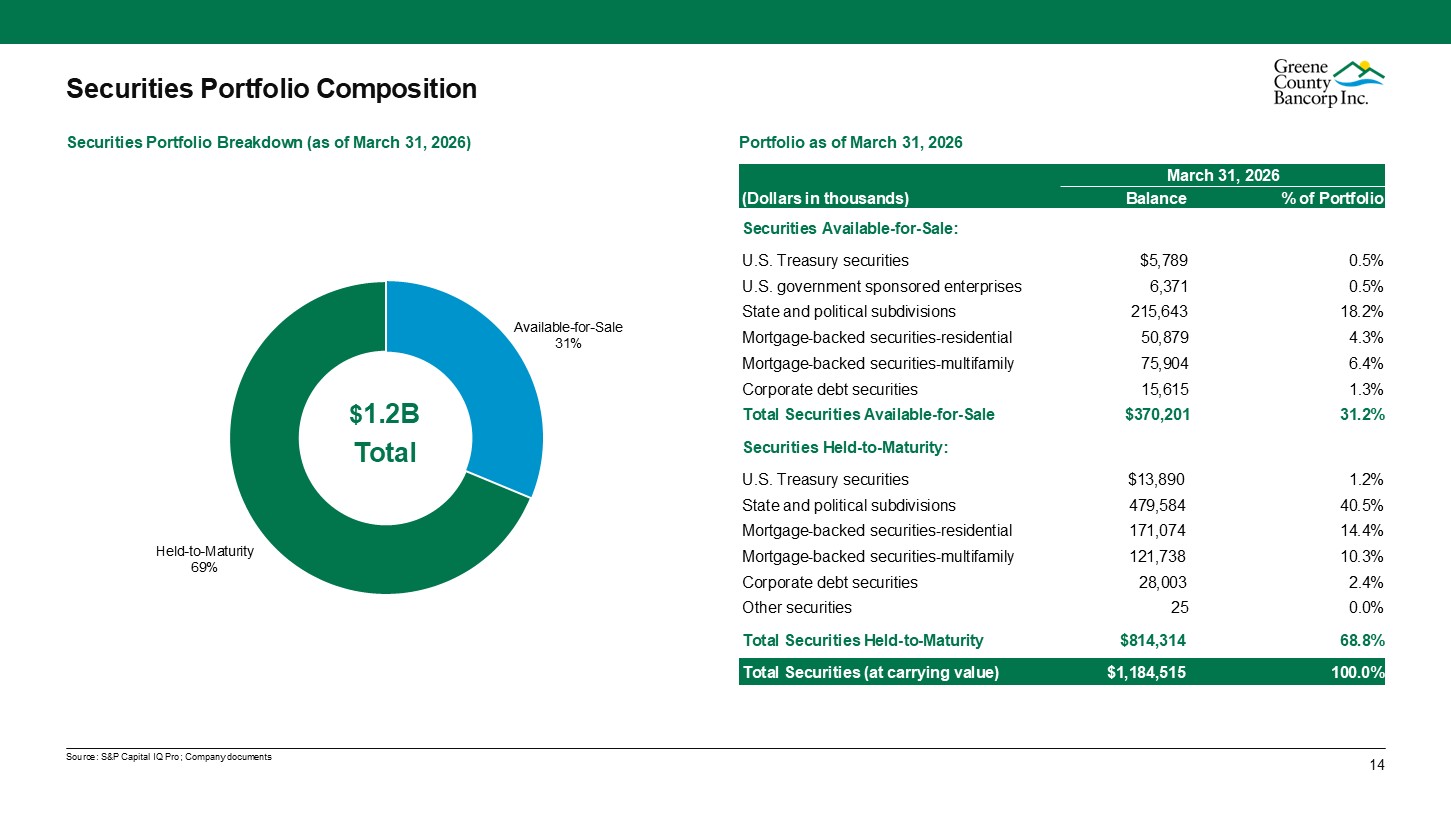
Available-for-Sale 31% 14 Held-to-Maturity 69% Source: S&P Capital IQ
Pro; Company documents Securities Portfolio Composition Portfolio as of March 31, 2026 Securities Portfolio Breakdown (as of March 31, 2026) $1.2B Total March 31, 2026 (Dollars in thousands) Balance % of Portfolio Securities
Available-for-Sale: U.S. Treasury securities $5,789 0.5% U.S. government sponsored enterprises 6,371 0.5% State and political subdivisions 215,643 18.2% Mortgage-backed securities-residential 50,879 4.3% Mortgage-backed
securities-multifamily 75,904 6.4% Corporate debt securities 15,615 1.3% Total Securities Available-for-Sale $370,201 31.2% Securities Held-to-Maturity: U.S. Treasury securities $13,890 1.2% State and political
subdivisions 479,584 40.5% Mortgage-backed securities-residential 171,074 14.4% Mortgage-backed securities-multifamily 121,738 10.3% Corporate debt securities 28,003 2.4% Other securities 25 0.0% Total Securities
Held-to-Maturity $814,314 68.8% Total Securities (at carrying value) $1,184,515 100.0%
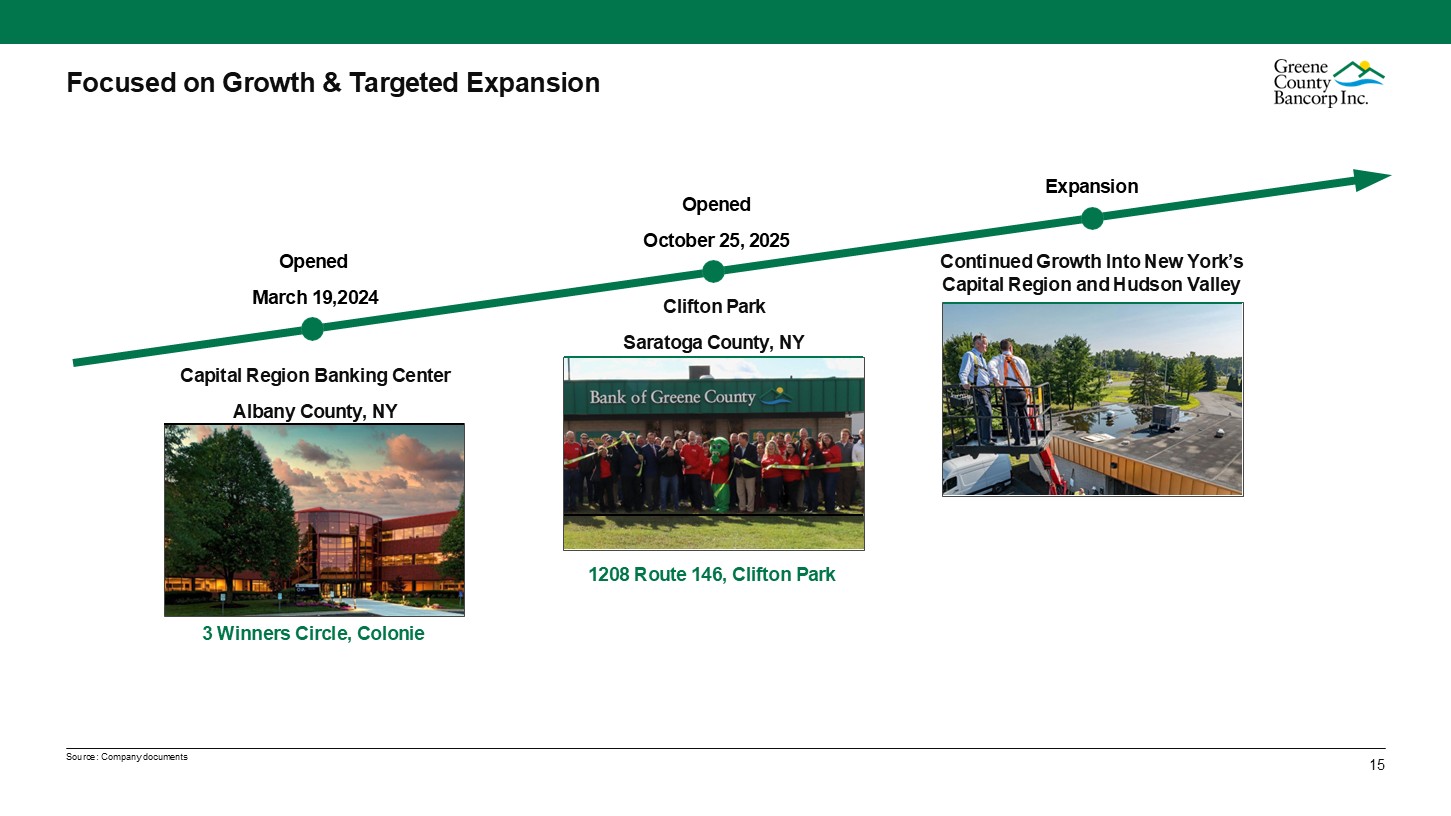
Opened October 25, 2025 Source: Company documents Focused on Growth &
Targeted Expansion Capital Region Banking Center Albany County, NY Clifton Park Saratoga County, NY Continued Growth Into New York’s Capital Region and Hudson Valley 14 Opened March 19,2024 Expansion 3 Winners Circle, Colonie 1208
Route 146, Clifton Park
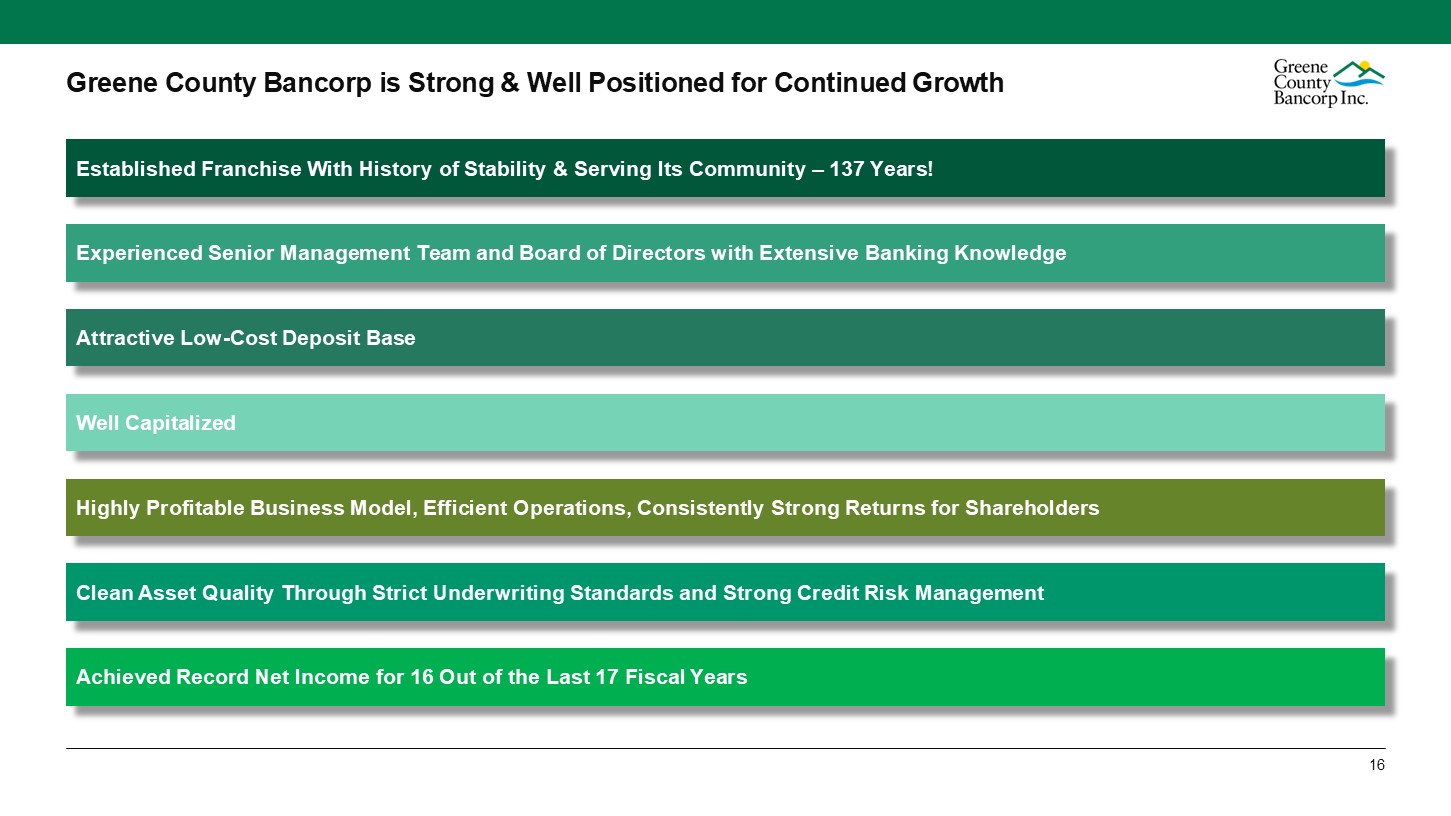
Greene County Bancorp is Strong & Well Positioned for Continued
Growth Experienced Senior Management Team and Board of Directors with Extensive Banking Knowledge Attractive Low-Cost Deposit Base Clean Asset Quality Through Strict Underwriting Standards and Strong Credit Risk Management Well
Capitalized Achieved Record Net Income for 16 Out of the Last 17 Fiscal Years Highly Profitable Business Model, Efficient Operations, Consistently Strong Returns for Shareholders Established Franchise With History of Stability &
Serving Its Community – 137 Years! 14
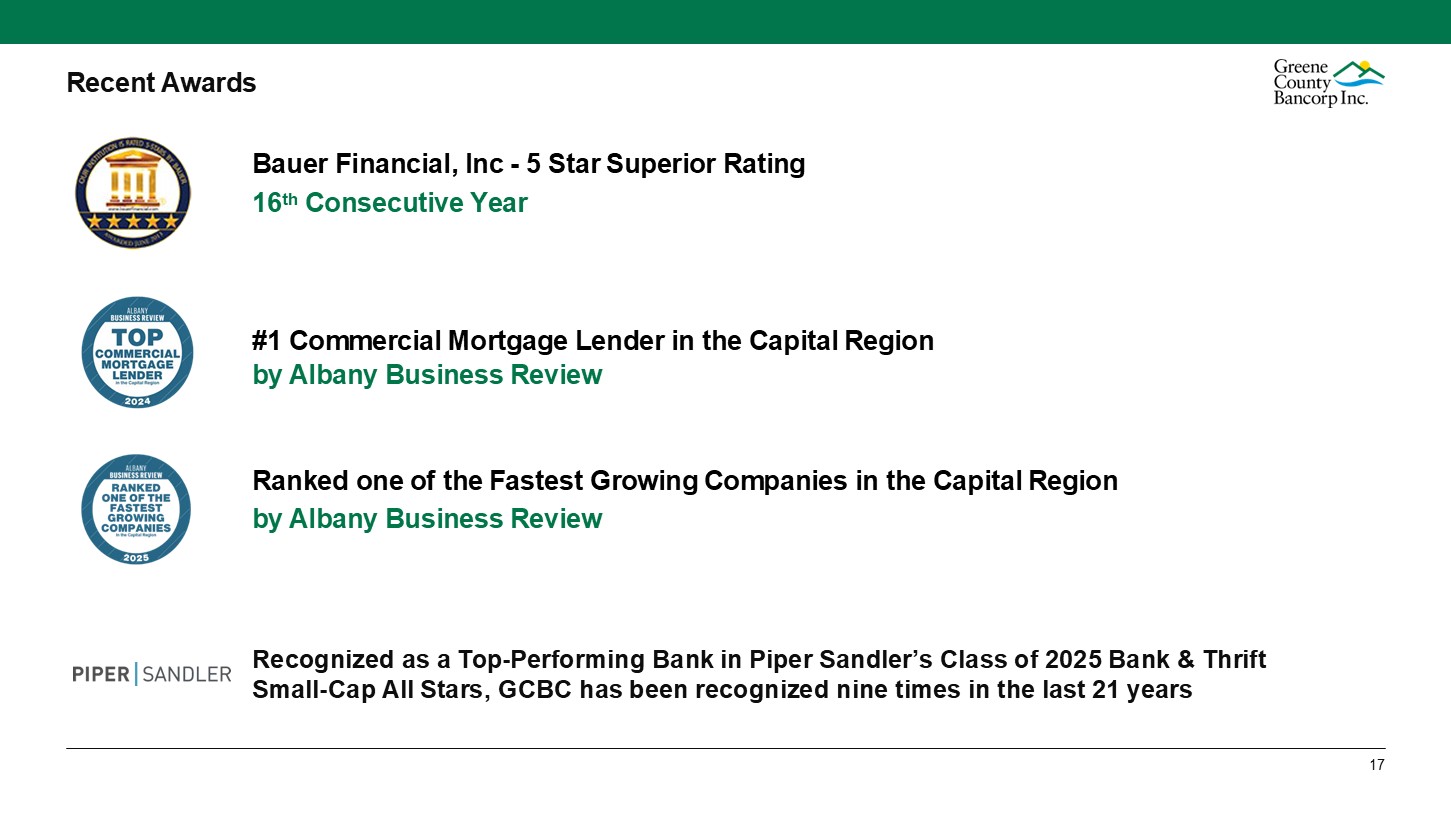
#1 Commercial Mortgage Lender in the Capital Region by Albany Business
Review Ranked one of the Fastest Growing Companies in the Capital Region by Albany Business Review Recent Awards Bauer Financial, Inc - 5 Star Superior Rating 16th Consecutive Year Recognized as a Top-Performing Bank in Piper Sandler’s
Class of 2025 Bank & Thrift Small-Cap All Stars, GCBC has been recognized nine times in the last 21 years 14
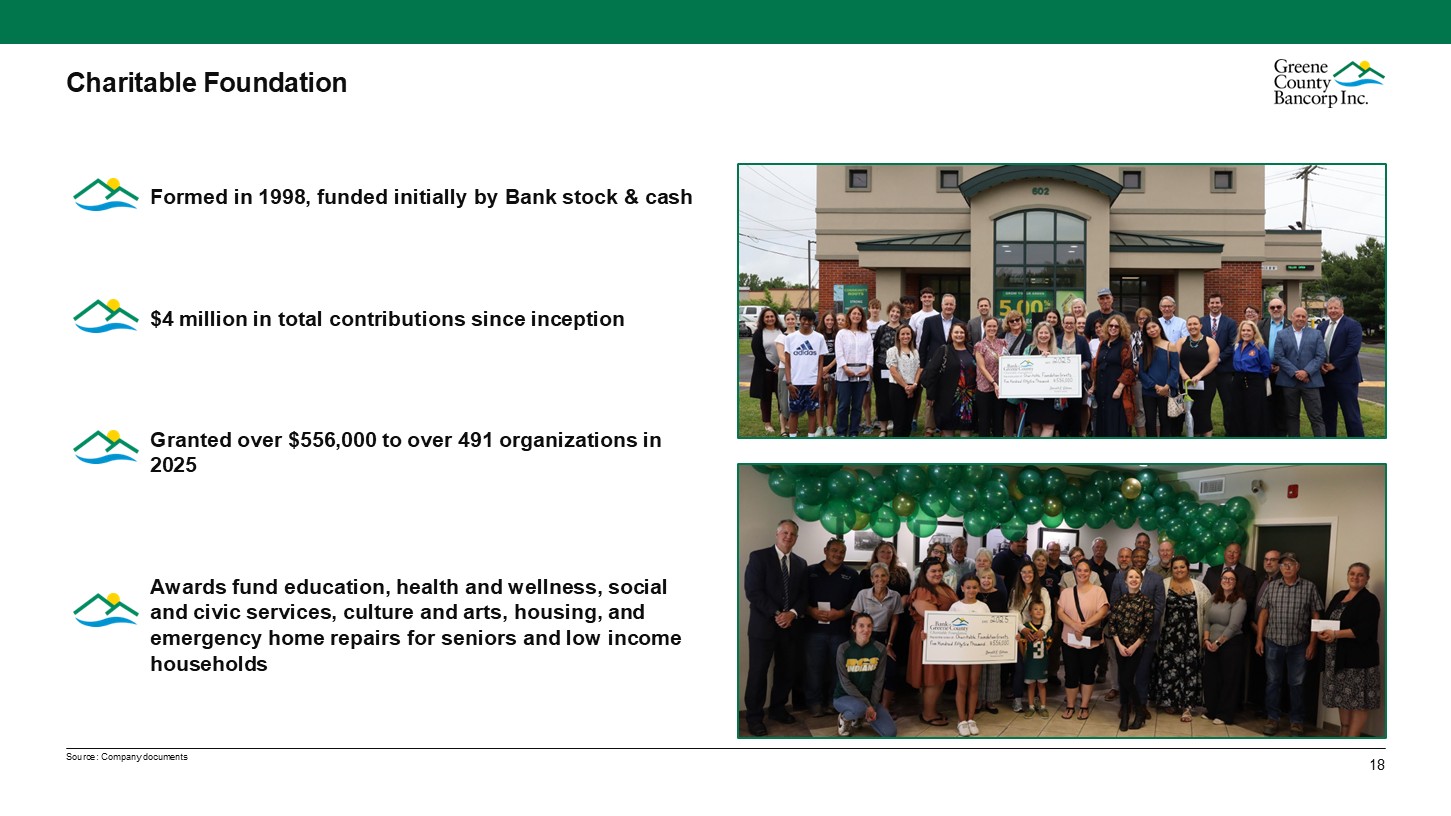
Source: Company documents Charitable Foundation Formed in 1998, funded
initially by Bank stock & cash $4 million in total contributions since inception Granted over $556,000 to over 491 organizations in 2025 Awards fund education, health and wellness, social and civic services, culture and arts, housing,
and emergency home repairs for seniors and low income households 14

Appendix
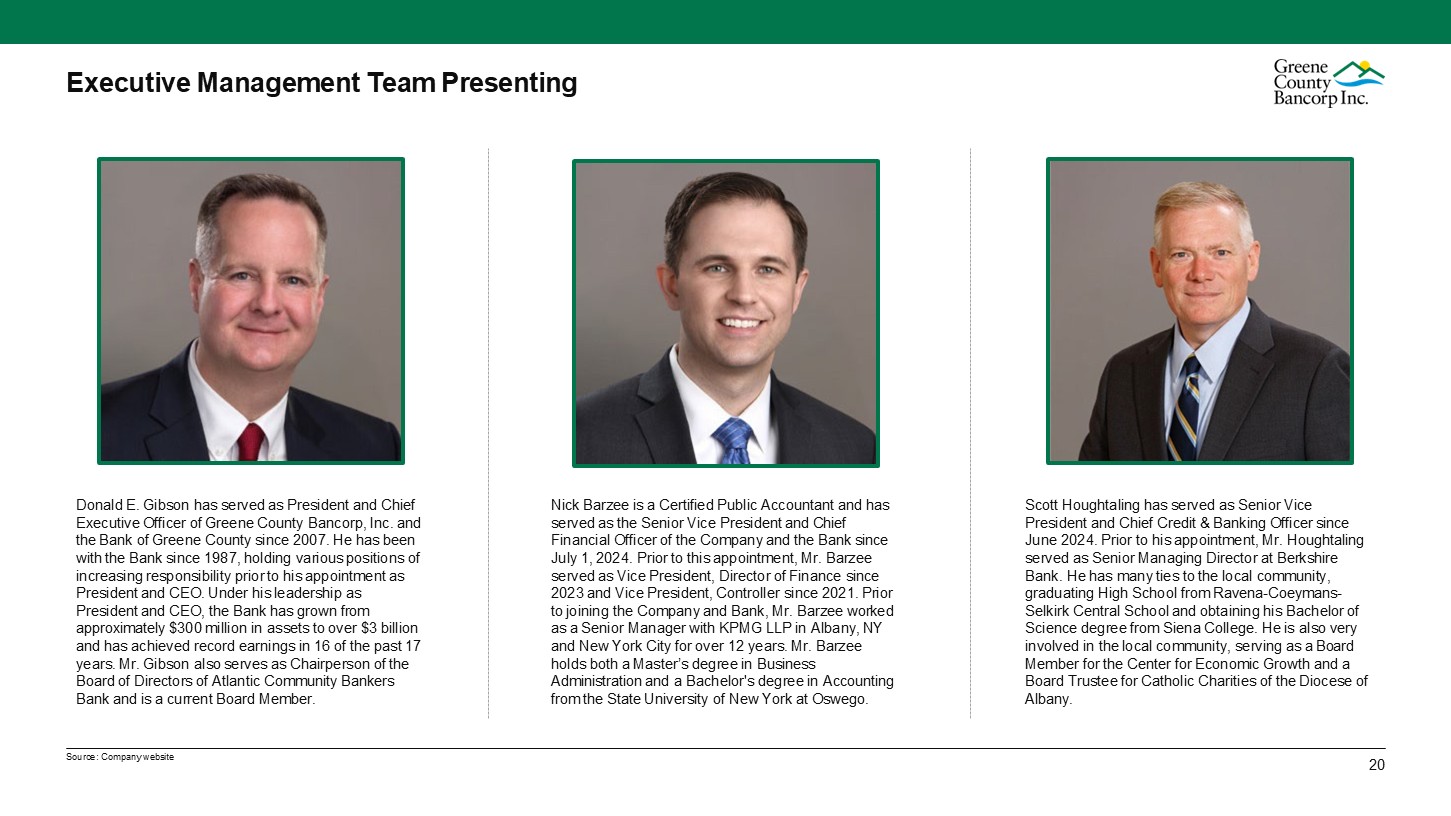
Executive Management Team Presenting Donald E. Gibson has served as President
and Chief Executive Officer of Greene County Bancorp, Inc. and the Bank of Greene County since 2007. He has been with the Bank since 1987, holding various positions of increasing responsibility prior to his appointment as President and CEO.
Under his leadership as President and CEO, the Bank has grown from approximately $300 million in assets to over $3 billion and has achieved record earnings in 16 of the past 17 years. Mr. Gibson also serves as Chairperson of the Board of
Directors of Atlantic Community Bankers Bank and is a current Board Member. Nick Barzee is a Certified Public Accountant and has served as the Senior Vice President and Chief Financial Officer of the Company and the Bank since July 1, 2024.
Prior to this appointment, Mr. Barzee served as Vice President, Director of Finance since 2023 and Vice President, Controller since 2021. Prior to joining the Company and Bank, Mr. Barzee worked as a Senior Manager with KPMG LLP in Albany, NY
and New York City for over 12 years. Mr. Barzee holds both a Master’s degree in Business Administration and a Bachelor's degree in Accounting from the State University of New York at Oswego. Scott Houghtaling has served as Senior Vice
President and Chief Credit & Banking Officer since June 2024. Prior to his appointment, Mr. Houghtaling served as Senior Managing Director at Berkshire Bank. He has many ties to the local community, graduating High School from
Ravena-Coeymans-Selkirk Central School and obtaining his Bachelor of Science degree from Siena College. He is also very involved in the local community, serving as a Board Member for the Center for Economic Growth and a Board Trustee for
Catholic Charities of the Diocese of Albany. Source: Company website 20
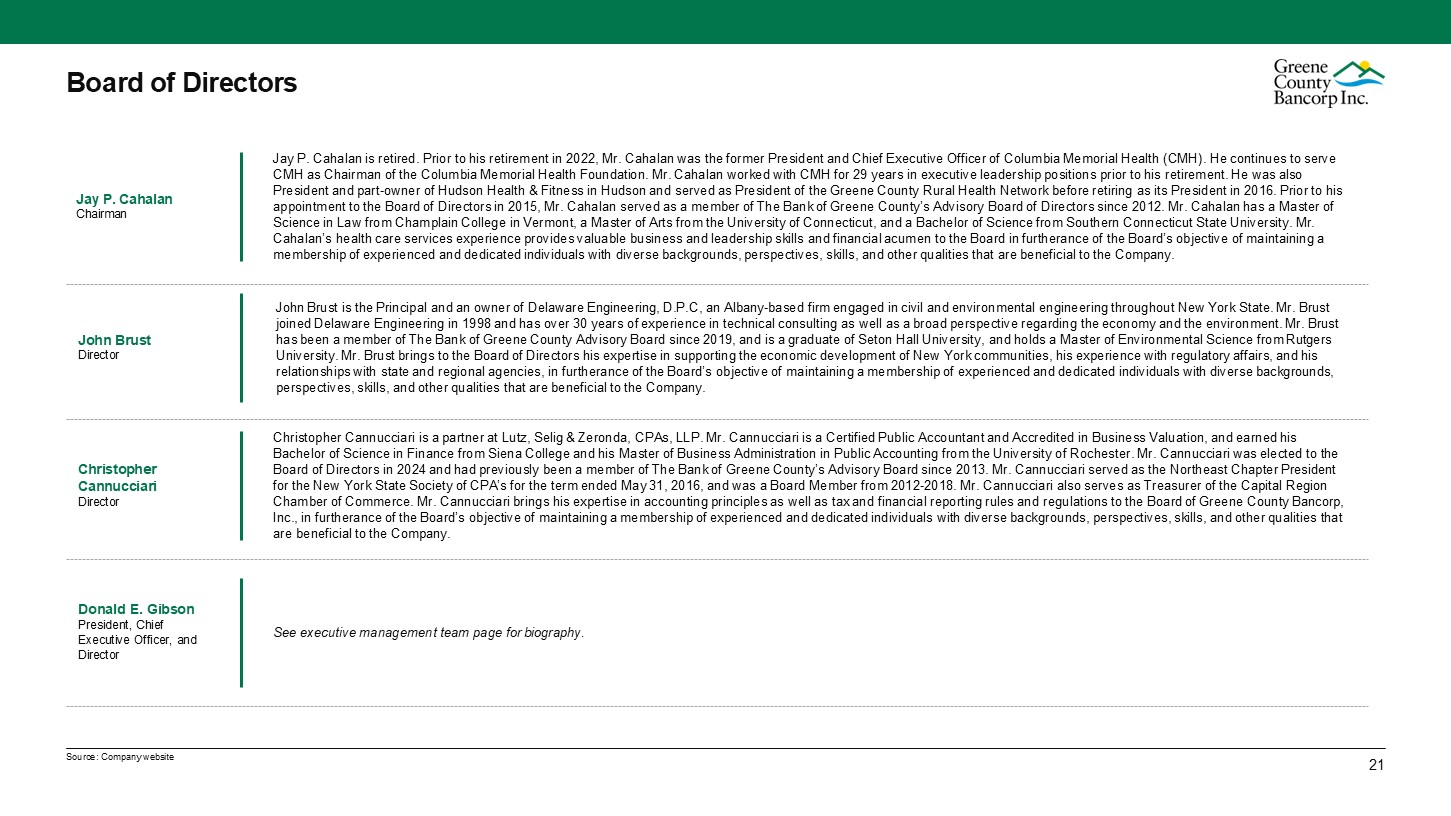
Board of Directors Christopher Cannucciari is a partner at Lutz, Selig &
Zeronda, CPAs, LLP. Mr. Cannucciari is a Certified Public Accountant and Accredited in Business Valuation, and earned his Bachelor of Science in Finance from Siena College and his Master of Business Administration in Public Accounting from
the University of Rochester. Mr. Cannucciari was elected to the Board of Directors in 2024 and had previously been a member of The Bank of Greene County’s Advisory Board since 2013. Mr. Cannucciari served as the Northeast Chapter President
for the New York State Society of CPA’s for the term ended May 31, 2016, and was a Board Member from 2012-2018. Mr. Cannucciari also serves as Treasurer of the Capital Region Chamber of Commerce. Mr. Cannucciari brings his expertise in
accounting principles as well as tax and financial reporting rules and regulations to the Board of Greene County Bancorp, Inc., in furtherance of the Board’s objective of maintaining a membership of experienced and dedicated individuals with
diverse backgrounds, perspectives, skills, and other qualities that are beneficial to the Company. Christopher Cannucciari Director Jay P. Cahalan is retired. Prior to his retirement in 2022, Mr. Cahalan was the former President and Chief
Executive Officer of Columbia Memorial Health (CMH). He continues to serve CMH as Chairman of the Columbia Memorial Health Foundation. Mr. Cahalan worked with CMH for 29 years in executive leadership positions prior to his retirement. He was
also President and part-owner of Hudson Health & Fitness in Hudson and served as President of the Greene County Rural Health Network before retiring as its President in 2016. Prior to his appointment to the Board of Directors in 2015, Mr.
Cahalan served as a member of The Bank of Greene County’s Advisory Board of Directors since 2012. Mr. Cahalan has a Master of Science in Law from Champlain College in Vermont, a Master of Arts from the University of Connecticut, and a
Bachelor of Science from Southern Connecticut State University. Mr. Cahalan’s health care services experience provides valuable business and leadership skills and financial acumen to the Board in furtherance of the Board’s objective of
maintaining a membership of experienced and dedicated individuals with diverse backgrounds, perspectives, skills, and other qualities that are beneficial to the Company. Jay P. Cahalan Chairman John Brust is the Principal and an owner of
Delaware Engineering, D.P.C, an Albany-based firm engaged in civil and environmental engineering throughout New York State. Mr. Brust joined Delaware Engineering in 1998 and has over 30 years of experience in technical consulting as well as a
broad perspective regarding the economy and the environment. Mr. Brust has been a member of The Bank of Greene County Advisory Board since 2019, and is a graduate of Seton Hall University, and holds a Master of Environmental Science from
Rutgers University. Mr. Brust brings to the Board of Directors his expertise in supporting the economic development of New York communities, his experience with regulatory affairs, and his relationships with state and regional agencies, in
furtherance of the Board’s objective of maintaining a membership of experienced and dedicated individuals with diverse backgrounds, perspectives, skills, and other qualities that are beneficial to the Company. John Brust Director See
executive management team page for biography. Donald E. Gibson President, Chief Executive Officer, and Director Source: Company website 20
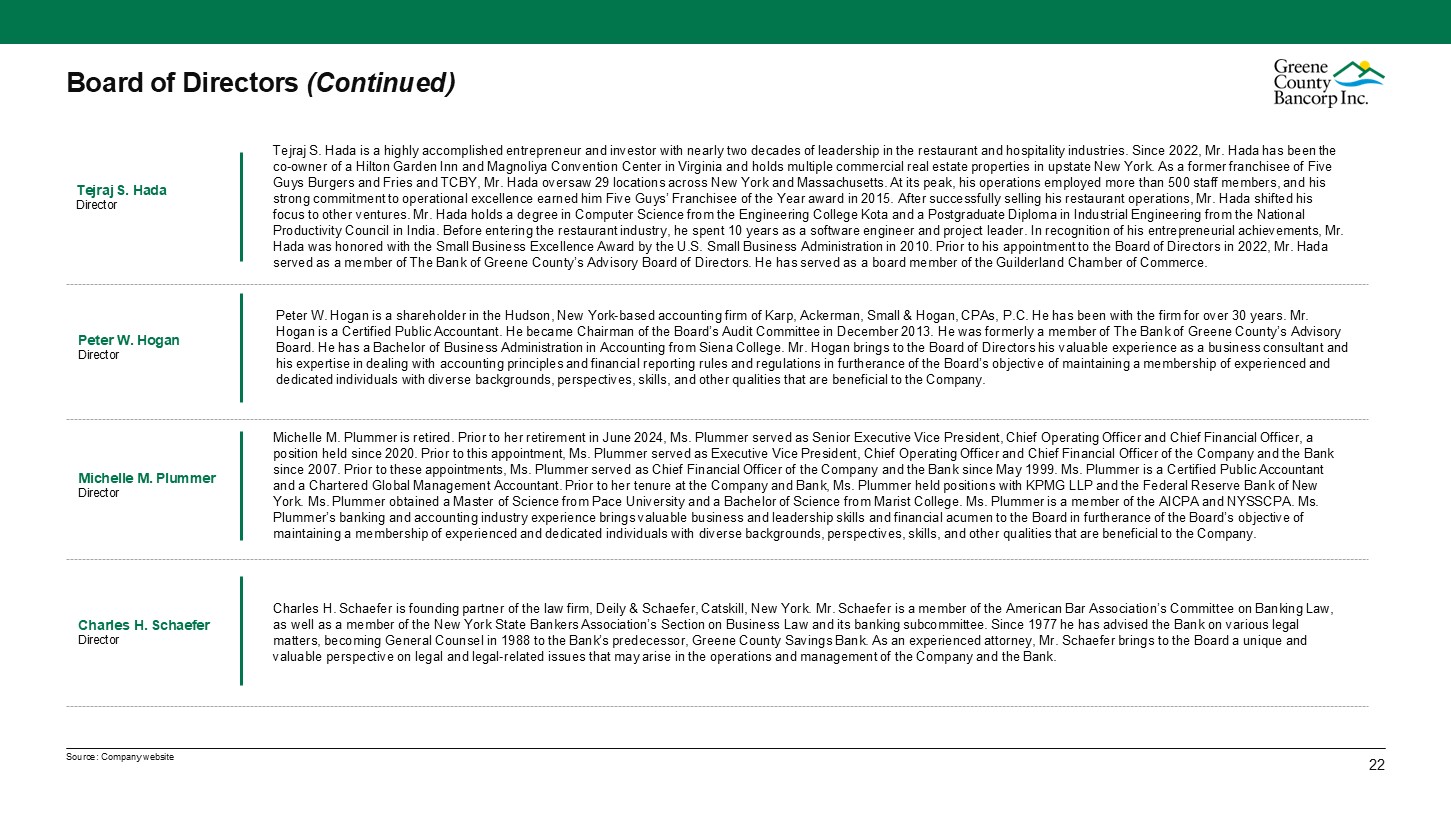
Board of Directors (Continued) Michelle M. Plummer is retired. Prior to her
retirement in June 2024, Ms. Plummer served as Senior Executive Vice President, Chief Operating Officer and Chief Financial Officer, a position held since 2020. Prior to this appointment, Ms. Plummer served as Executive Vice President, Chief
Operating Officer and Chief Financial Officer of the Company and the Bank since 2007. Prior to these appointments, Ms. Plummer served as Chief Financial Officer of the Company and the Bank since May 1999. Ms. Plummer is a Certified Public
Accountant and a Chartered Global Management Accountant. Prior to her tenure at the Company and Bank, Ms. Plummer held positions with KPMG LLP and the Federal Reserve Bank of New York. Ms. Plummer obtained a Master of Science from Pace
University and a Bachelor of Science from Marist College. Ms. Plummer is a member of the AICPA and NYSSCPA. Ms. Plummer’s banking and accounting industry experience brings valuable business and leadership skills and financial acumen to the
Board in furtherance of the Board’s objective of maintaining a membership of experienced and dedicated individuals with diverse backgrounds, perspectives, skills, and other qualities that are beneficial to the Company. Michelle M.
Plummer Director Tejraj S. Hada is a highly accomplished entrepreneur and investor with nearly two decades of leadership in the restaurant and hospitality industries. Since 2022, Mr. Hada has been the co-owner of a Hilton Garden Inn and
Magnoliya Convention Center in Virginia and holds multiple commercial real estate properties in upstate New York. As a former franchisee of Five Guys Burgers and Fries and TCBY, Mr. Hada oversaw 29 locations across New York and Massachusetts.
At its peak, his operations employed more than 500 staff members, and his strong commitment to operational excellence earned him Five Guys’ Franchisee of the Year award in 2015. After successfully selling his restaurant operations, Mr. Hada
shifted his focus to other ventures. Mr. Hada holds a degree in Computer Science from the Engineering College Kota and a Postgraduate Diploma in Industrial Engineering from the National Productivity Council in India. Before entering the
restaurant industry, he spent 10 years as a software engineer and project leader. In recognition of his entrepreneurial achievements, Mr. Hada was honored with the Small Business Excellence Award by the U.S. Small Business Administration in
2010. Prior to his appointment to the Board of Directors in 2022, Mr. Hada served as a member of The Bank of Greene County’s Advisory Board of Directors. He has served as a board member of the Guilderland Chamber of Commerce. Tejraj S.
Hada Director Peter W. Hogan is a shareholder in the Hudson, New York-based accounting firm of Karp, Ackerman, Small & Hogan, CPAs, P.C. He has been with the firm for over 30 years. Mr. Hogan is a Certified Public Accountant. He became
Chairman of the Board’s Audit Committee in December 2013. He was formerly a member of The Bank of Greene County’s Advisory Board. He has a Bachelor of Business Administration in Accounting from Siena College. Mr. Hogan brings to the Board of
Directors his valuable experience as a business consultant and his expertise in dealing with accounting principles and financial reporting rules and regulations in furtherance of the Board’s objective of maintaining a membership of
experienced and dedicated individuals with diverse backgrounds, perspectives, skills, and other qualities that are beneficial to the Company. Peter W. Hogan Director Charles H. Schaefer is founding partner of the law firm, Deily &
Schaefer, Catskill, New York. Mr. Schaefer is a member of the American Bar Association’s Committee on Banking Law, as well as a member of the New York State Bankers Association’s Section on Business Law and its banking subcommittee. Since
1977 he has advised the Bank on various legal matters, becoming General Counsel in 1988 to the Bank’s predecessor, Greene County Savings Bank. As an experienced attorney, Mr. Schaefer brings to the Board a unique and valuable perspective on
legal and legal-related issues that may arise in the operations and management of the Company and the Bank. Charles H. Schaefer Director Source: Company website 20
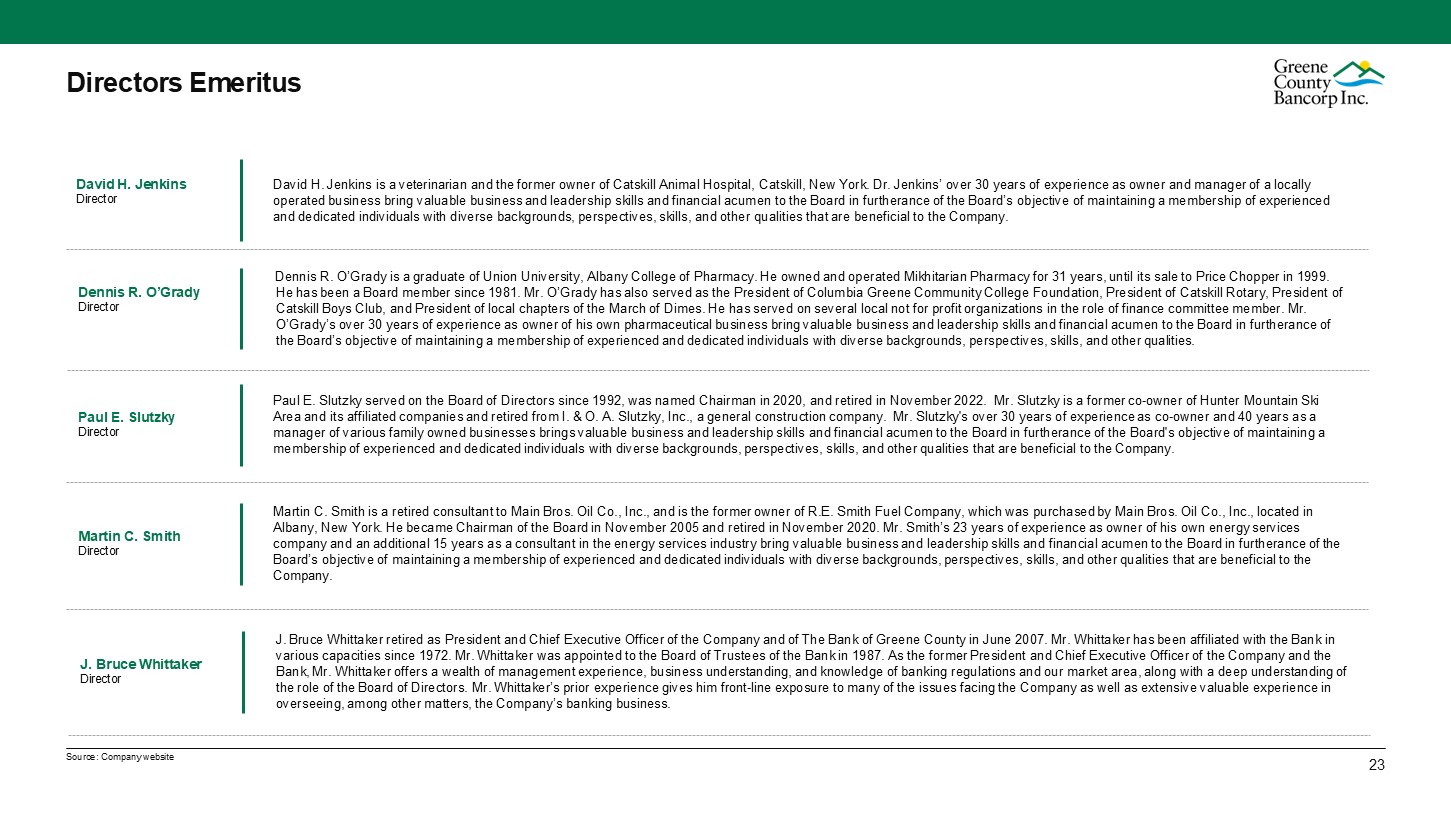
Directors Emeritus Paul E. Slutzky served on the Board of Directors since 1992,
was named Chairman in 2020, and retired in November 2022. Mr. Slutzky is a former co-owner of Hunter Mountain Ski Area and its affiliated companies and retired from I. & O. A. Slutzky, Inc., a general construction company. Mr. Slutzky's
over 30 years of experience as co-owner and 40 years as a manager of various family owned businesses brings valuable business and leadership skills and financial acumen to the Board in furtherance of the Board's objective of maintaining a
membership of experienced and dedicated individuals with diverse backgrounds, perspectives, skills, and other qualities that are beneficial to the Company. Paul E. Slutzky Director David H. Jenkins is a veterinarian and the former owner of
Catskill Animal Hospital, Catskill, New York. Dr. Jenkins’ over 30 years of experience as owner and manager of a locally operated business bring valuable business and leadership skills and financial acumen to the Board in furtherance of the
Board’s objective of maintaining a membership of experienced and dedicated individuals with diverse backgrounds, perspectives, skills, and other qualities that are beneficial to the Company. David H. Jenkins Director Dennis R. O’Grady is a
graduate of Union University, Albany College of Pharmacy. He owned and operated Mikhitarian Pharmacy for 31 years, until its sale to Price Chopper in 1999. He has been a Board member since 1981. Mr. O’Grady has also served as the President of
Columbia Greene Community College Foundation, President of Catskill Rotary, President of Catskill Boys Club, and President of local chapters of the March of Dimes. He has served on several local not for profit organizations in the role of
finance committee member. Mr. O’Grady’s over 30 years of experience as owner of his own pharmaceutical business bring valuable business and leadership skills and financial acumen to the Board in furtherance of the Board’s objective of
maintaining a membership of experienced and dedicated individuals with diverse backgrounds, perspectives, skills, and other qualities. Dennis R. O’Grady Director Martin C. Smith is a retired consultant to Main Bros. Oil Co., Inc., and is
the former owner of R.E. Smith Fuel Company, which was purchased by Main Bros. Oil Co., Inc., located in Albany, New York. He became Chairman of the Board in November 2005 and retired in November 2020. Mr. Smith’s 23 years of experience as
owner of his own energy services company and an additional 15 years as a consultant in the energy services industry bring valuable business and leadership skills and financial acumen to the Board in furtherance of the Board’s objective of
maintaining a membership of experienced and dedicated individuals with diverse backgrounds, perspectives, skills, and other qualities that are beneficial to the Company. Martin C. Smith Director J. Bruce Whittaker retired as President and
Chief Executive Officer of the Company and of The Bank of Greene County in June 2007. Mr. Whittaker has been affiliated with the Bank in various capacities since 1972. Mr. Whittaker was appointed to the Board of Trustees of the Bank in 1987.
As the former President and Chief Executive Officer of the Company and the Bank, Mr. Whittaker offers a wealth of management experience, business understanding, and knowledge of banking regulations and our market area, along with a deep
understanding of the role of the Board of Directors. Mr. Whittaker’s prior experience gives him front-line exposure to many of the issues facing the Company as well as extensive valuable experience in overseeing, among other matters, the
Company’s banking business. J. Bruce Whittaker Director Source: Company website 20
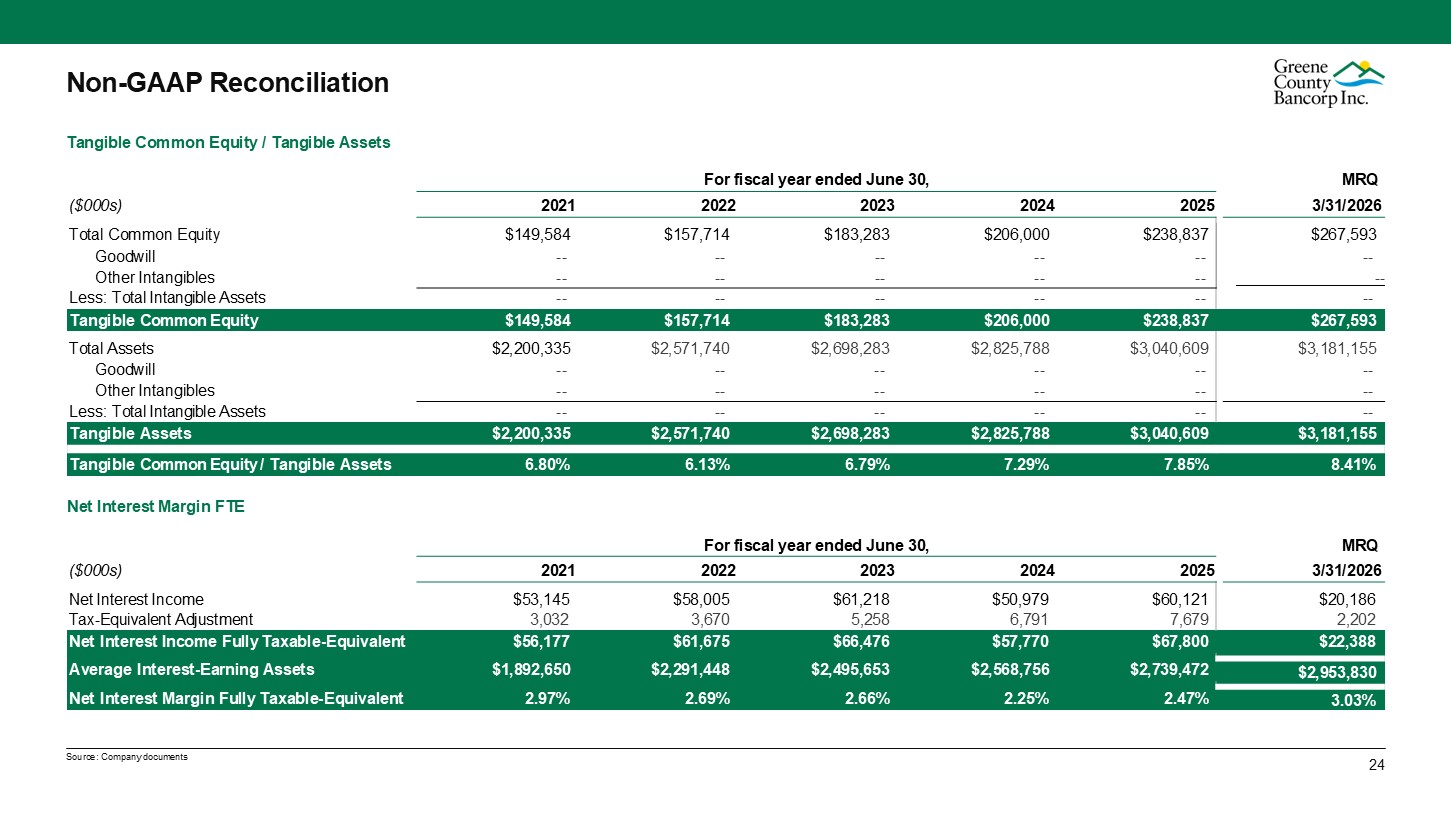
For fiscal year ended June 30,
MRQ ($000s) 2021 2022 2023 2024 2025 3/31/2026 Total Common Equity $149,584 $157,714 $183,283 $206,000 $238,837 $267,593 Goodwill -- -- -- -- -- -- Other Intangibles -- -- -- -- -- -- Less: Total Intangible
Assets -- -- -- -- -- -- Tangible Common Equity $149,584 $157,714 $183,283 $206,000 $238,837 $267,593 Total Assets $2,200,335 $2,571,740 $2,698,283 $2,825,788 $3,040,609 $3,181,155 Goodwill -- -- -- -- -- -- Other
Intangibles -- -- -- -- -- -- Less: Total Intangible Assets -- -- -- -- -- -- Tangible Assets $2,200,335 $2,571,740 $2,698,283 $2,825,788 $3,040,609 $3,181,155 Tangible Common Equity / Tangible
Assets 6.80% 6.13% 6.79% 7.29% 7.85% 8.41% Net Interest Margin FTE For fiscal year ended June 30, MRQ ($000s) 2021 2022 2023 2024 2025 3/31/2026 Net Interest
Income $53,145 $58,005 $61,218 $50,979 $60,121 $20,186 Tax-Equivalent Adjustment 3,032 3,670 5,258 6,791 7,679 2,202 Net Interest Income Fully Taxable-Equivalent $56,177 $61,675 $66,476 $57,770 $67,800 $22,388 Average
Interest-Earning Assets $1,892,650 $2,291,448 $2,495,653 $2,568,756 $2,739,472 $2,953,830 Net Interest Margin Fully Taxable-Equivalent 2.97% 2.69% 2.66% 2.25% 2.47% 3.03% Source: Company documents 24 Non-GAAP
Reconciliation Tangible Common Equity / Tangible Assets