.2
Supplemental Financial Information

DECEMBER 31, 2025

ANDAZ MAUI AT WAILEA RESORT
TABLE OF CONTENTS

PROPERTY LEVEL DATA AND CORPORATE MEASURES | ||
Comparable Hotel Results 2026 Forecast and Full Year 2025 | ||
Ground Lease Summary as of December 31, 2025 | ||
CAPITALIZATION | ||
FINANCIAL COVENANTS | ||
NOTES TO SUPPLEMENTAL FINANCIAL INFORMATION | ||

OVERVIEW |
PROPERTY LEVEL DATA AND CORPORATE MEASURES |
CAPITALIZATION |
FINANCIAL COVENANTS |
NOTES TO SUPPLEMENTAL FINANCIAL INFORMATION |
HOST HOTELS & RESORTS CORPORATE HEADQUARTERS
© Host Hotels & Resorts, Inc.4

BAKER'S CAY RESORT KEY LARGO, CURIO COLLECTION BY HILTON
About Host Hotels & Resorts
PREMIER U.S. LODGING REIT
S&P
500
COMPANY
$12.4
BILLION
MARKET CAP(1)
$17.0
BILLION
ENTERPRISE VALUE(1)
LUXURY & UPPER UPSCALE CONSOLIDATED HOTELS PORTFOLIO(2)
76
HOTELS
41,700
ROOMS
21
TOP U.S. MARKETS
(1) Based on market cap as of December 31, 2025. See Comparative Capitalization for calculation.
(2) At February 18, 2026.
© Host Hotels & Resorts, Inc.5
Analyst Coverage
BAIRD Mike Bellisario 414-298-6130 mbellisario@rwbaird.com | DEUTSCHE BANK SECURITIES Chris Woronka 212-250-9376 chris.woronka@db.com | RAYMOND JAMES & ASSOCIATES RJ Milligan 727-567-2585 rjmilligan@raymondjames.com |
BARCLAYS Rich Hightower 212-526-8768 richard.hightower@barclays.com | EVERCORE ISI Duane Pfennigwerth 212-497-0817 duane.pfennigwerth@evercoreisi.com | STIFEL, NICOLAUS & CO. Simon Yarmak 443-224-1345 yarmaks@stifel.com |
BOFA SECURITIES, INC. Shaun Kelley 646-855-1005 shaun.kelley@baml.com | GREEN STREET ADVISORS Chris Darling 949-640-8780 cdarling@greenst.com | TRUIST C. Patrick Scholes 212-319-3915 patrick.scholes@suntrust.com |
BMO CAPITAL MARKETS Ari Klein 212-885-4103 ari.klein@bmo.com | JEFFERIES David Katz 212-323-3355 dkatz@jefferies.com | UBS SECURITIES LLC Robin Farley 212-713-2060 robin.farley@ubs.com |
CANTOR FITZGERALD Richard Anderson 929-441-6927 richard.anderson@cantor.com | JPMORGAN Daniel Politzer 212-622-0110 daniel.politzer@jpmorgan.com | WELLS FARGO SECURITIES LLC Cooper Clark 212-214-1146 cooper.clark@wellsfargo.com |
CITI INVESTMENT RESEARCH Smedes Rose 212-816-6243 smedes.rose@citi.com | KOLYITCS David Abraham +44 7527 493597 david.abraham@kolytics.com | WOLFE RESEARCH Logan Epstein 646-582-9267 lepstein@wolferesearch.com |
COMPASS POINT RESEARCH & TRADING, LLC Ken Billingsley 202-534-1393 kbillingsley@compasspointllc.com | MORGAN STANLEY & CO. Stephen Grambling 212-761-1010 stephen.grambling@morganstanley.com | |
The Company is followed by the analysts listed above. Please note that any opinions, estimates or forecasts regarding the Company’s performance made by these analysts are theirs alone and do not represent opinions, forecasts or predictions of the Company or its
management. The Company does not by its reference above imply its endorsement of or concurrence with any of such analysts’ information, conclusions or recommendations.
© Host Hotels & Resorts, Inc.6
Overview
ABOUT HOST HOTELS & RESORTS
Host Hotels & Resorts, Inc., herein referred to as “we,” “Host Inc.,” or the “Company,” is a self-managed and self-administered real estate investment trust that
owns hotel properties. We conduct our operations as an umbrella partnership REIT through an operating partnership, Host Hotels & Resorts, L.P. (“Host LP”), of
which we are the sole general partner. When distinguishing between Host Inc. and Host LP, the primary difference is approximately 1% of the partnership
interests in Host LP held by outside partners as of December 31, 2025, which are non-controlling interests in Host LP in our consolidated balance sheets and are
included in net (income) loss attributable to non-controlling interests in our condensed consolidated statements of operations. Readers are encouraged to find
further detail regarding our organizational structure in our annual report on Form 10-K.
FORWARD-LOOKING STATEMENTS
This supplemental information contains forward-looking statements within the meaning of federal securities regulations. These forward-looking statements
include, but may not be limited to, our expectations regarding the strength of lodging demand, the continued recovery in Maui from the 2023 wildfires, and 2026
estimates with respect to our business, including our anticipated capital expenditures and financial and operating results. Forward-looking statements are not
guarantees of future performance and involve known and unknown risks, uncertainties and other factors which may cause the actual results to differ materially
from those anticipated at the time the forward-looking statements are made. These risks include, but are not limited to, those described in the Company’s
annual report on Form 10-K and other filings with the SEC. Although the Company believes the expectations reflected in such forward-looking statements are
based upon reasonable assumptions, it can give no assurance that the expectations will be attained or that any deviation will not be material. All information in
this supplemental presentation is as of February 18, 2026, and the Company undertakes no obligation to update any forward-looking statement to conform the
statement to actual results or changes in the Company’s expectations.
NON-GAAP FINANCIAL MEASURES
Included in this supplemental information are certain “non-GAAP financial measures,” which are measures of our historical or future financial performance that
are not calculated and presented in accordance with GAAP (U.S. generally accepted accounting principles), within the meaning of applicable SEC rules. They are
as follows: : (i) Funds From Operations (“FFO”) and FFO per diluted share (both NAREIT and Adjusted), (ii) EBITDA, both at hotel level and company-wide, (iii)
EBITDAre and Adjusted EBITDAre, (iv) Net Operating Income (NOI), (v) Comparable Hotel Operating Statistics and Results and (vi) measures derived from EBITDA
and NOI such as EBITDA multiples and capitalization rates. Also included are reconciliations to the most directly comparable GAAP measures. See the Notes to
Supplemental Financial Information for definitions of these measures, why we believe these measures are useful and limitations on their use.
Also included in this supplemental information is our leverage ratio, unsecured interest coverage ratio and fixed charge coverage ratio, calculated in accordance
with our credit facility, along with our EBITDA to interest coverage ratio, indenture indebtedness test, indenture secured indebtedness test, and indenture
unencumbered assets to unsecured indebtedness test, calculated in accordance with our senior notes indenture covenants. Included with these ratios are
reconciliations calculated in accordance with GAAP. See the Notes to Supplemental Financial Information for information on how these supplemental measures
are calculated, why we believe they are useful and limitations on their use.
© Host Hotels & Resorts, Inc. 7

OVERVIEW |
PROPERTY LEVEL DATA AND CORPORATE MEASURES |
CAPITALIZATION |
FINANCIAL COVENANTS |
NOTES TO SUPPLEMENTAL FINANCIAL INFORMATION |
1 HOTEL NASHVILLE
© Host Hotels & Resorts, Inc.8
Comparable Hotel Results by Location (1)
(unaudited, in millions, except hotel statistics and per room basis)
Quarter ended December 31, 2025 | |||||||||
Location | No. of Properties | No. of Rooms | Average Room Rate | Average Occupancy Percentage | RevPAR | Total revenues | Total Revenues per Available Room | Hotel Net Income (Loss) | Hotel EBITDA |
Maui | 3 | 1,580 | $695.25 | 69.9% | $486.21 | $106.0 | $729.05 | $11.0 | $28.0 |
Oahu | 2 | 876 | 508.27 | 79.5% | 403.87 | 49.3 | 602.60 | 5.3 | 12.0 |
Miami | 2 | 1,038 | 572.20 | 73.1% | 418.49 | 72.0 | 733.00 | 14.6 | 23.4 |
Jacksonville | 1 | 446 | 523.35 | 63.0% | 329.71 | 32.9 | 802.29 | 7.9 | 11.1 |
New York | 3 | 2,720 | 521.39 | 90.2% | 470.15 | 166.5 | 665.17 | 48.5 | 58.4 |
Florida Gulf Coast | 4 | 1,529 | 513.52 | 62.1% | 318.94 | 94.6 | 672.71 | 3.5 | 25.1 |
Phoenix | 3 | 1,545 | 406.39 | 68.7% | 279.35 | 96.5 | 678.84 | 26.1 | 37.1 |
Nashville | 2 | 721 | 363.74 | 77.3% | 281.27 | 31.4 | 473.35 | 5.3 | 11.4 |
Orlando | 2 | 2,448 | 473.90 | 60.0% | 284.43 | 131.9 | 585.83 | 28.5 | 42.1 |
Los Angeles/Orange County | 3 | 1,067 | 301.26 | 72.6% | 218.66 | 34.2 | 348.68 | 4.7 | 7.1 |
San Diego | 3 | 3,294 | 273.17 | 66.9% | 182.62 | 106.5 | 351.35 | 8.5 | 25.8 |
Boston | 2 | 1,496 | 284.38 | 72.3% | 205.70 | 37.3 | 271.09 | 7.4 | 11.9 |
Philadelphia | 2 | 810 | 244.85 | 78.4% | 191.92 | 22.4 | 300.82 | 4.8 | 7.3 |
Washington, D.C. (CBD) | 4 | 2,788 | 299.93 | 57.1% | 171.13 | 64.7 | 252.14 | 6.5 | 18.3 |
Northern Virginia | 2 | 916 | 267.28 | 71.3% | 190.56 | 28.2 | 334.49 | 5.4 | 8.6 |
Chicago | 3 | 1,562 | 251.05 | 69.6% | 174.82 | 36.6 | 254.63 | 2.2 | 6.3 |
San Francisco/San Jose | 6 | 4,162 | 252.61 | 65.1% | 164.53 | 95.3 | 248.87 | (3.8) | 10.3 |
Seattle | 2 | 1,315 | 225.26 | 54.1% | 121.83 | 21.2 | 175.33 | (4.0) | (1.0) |
Atlanta | 2 | 810 | 206.01 | 62.8% | 129.35 | 16.7 | 224.30 | 0.5 | 4.4 |
Houston | 4 | 1,710 | 204.61 | 65.4% | 133.86 | 30.0 | 190.72 | 6.7 | 9.3 |
Austin | 2 | 769 | 274.74 | 62.0% | 170.38 | 21.1 | 298.62 | 1.0 | 6.6 |
San Antonio | 2 | 1,512 | 235.14 | 55.7% | 131.02 | 29.4 | 211.52 | 5.3 | 8.9 |
New Orleans | 1 | 1,333 | 193.13 | 63.8% | 123.23 | 24.3 | 198.22 | 5.3 | 7.7 |
Denver | 3 | 1,342 | 193.82 | 53.7% | 104.10 | 20.9 | 169.37 | 1.7 | 5.2 |
Other | 8 | 2,551 | 266.19 | 67.7% | 180.13 | 68.5 | 288.45 | 6.3 | 15.0 |
Other property level (2) | 0.2 | 1.2 | 1.2 | ||||||
Domestic | 71 | 40,340 | 344.12 | 67.0% | 230.56 | 1,438.6 | 386.89 | 210.4 | 401.5 |
International | 5 | 1,499 | 208.59 | 64.7% | 134.98 | 29.4 | 212.84 | 7.7 | 9.4 |
All Locations - comparable hotels | 76 | 41,839 | 339.44 | 66.9% | 227.14 | 1,468.0 | 380.71 | 218.1 | 410.9 |
Non-comparable hotels | 2 | 407 | 29.4 | 2.7 | 9.0 | ||||
Property transaction adjustments (3) | 1 | 232 | 6.5 | — | 1.6 | ||||
Gain on sale of property and corporate level income/expense (4) | 98.9 | (83.9) | (17.6) | ||||||
Total | 79 | 42,478 | $— | — | $— | $1,602.8 | $— | $136.9 | $403.9 |
(1)See the Notes to Supplemental Financial Information for a discussion of comparable hotel operating statistics. CBD of a location refers to the central business district. RevPAR is the product of the average daily room rate charged and the average daily occupancy
achieved. Total Revenues per Available Room ("Total RevPAR") is a summary measure of hotel results calculated by dividing the sum of room, food and beverage and other ancillary service revenue by room nights available to guests for the period. It includes ancillary
revenues not included with RevPAR.
(2)Other property level includes certain ancillary revenues and related expenses, as well as non-income taxes on TRS leases.
(3)Property transaction adjustments represent the following items: (i) the elimination of results of operations of our hotels sold or held-for-sale as of the reporting date, which operations are included in our unaudited condensed consolidated statements of operations as
continuing operations, and (ii) the addition of results for periods prior to our ownership for hotels acquired as of the reporting date. As of December 31, 2025, this includes two hotels sold in 2025 and one hotel classified as held-for-sale.
(4)Certain Items from our statement of operations are not allocated to individual properties, including interest on our senior notes, corporate and other expenses, and the provision for income taxes. These items are reflected in “gain on sale of property and corporate
level income/expense.” Refer to the table below for reconciliation of net income to EBITDA by location.
© Host Hotels & Resorts, Inc.9
Comparable Hotel Results by Location
(unaudited, in millions, except hotel statistics and per room basis)
Quarter ended December 31, 2025 | ||||||||
Location | No. of Properties | No. of Rooms | Hotel Net Income (Loss) | Plus: Depreciation | Plus: Interest Expense | Plus: Income Tax | Plus: Property Transaction Adjustments | Equals: Hotel EBITDA |
Maui | 3 | 1,580 | $11.0 | $17.0 | $— | $— | $— | $28.0 |
Oahu | 2 | 876 | 5.3 | 6.7 | — | — | — | 12.0 |
Miami | 2 | 1,038 | 14.6 | 8.8 | — | — | — | 23.4 |
Jacksonville | 1 | 446 | 7.9 | 3.2 | — | — | — | 11.1 |
New York | 3 | 2,720 | 48.5 | 9.9 | — | — | — | 58.4 |
Florida Gulf Coast | 4 | 1,529 | 3.5 | 21.6 | — | — | — | 25.1 |
Phoenix | 3 | 1,545 | 26.1 | 11.0 | — | — | — | 37.1 |
Nashville | 2 | 721 | 5.3 | 6.1 | — | — | — | 11.4 |
Orlando | 2 | 2,448 | 28.5 | 13.6 | — | — | — | 42.1 |
Los Angeles/Orange County | 3 | 1,067 | 4.7 | 2.4 | — | — | — | 7.1 |
San Diego | 3 | 3,294 | 8.5 | 17.3 | — | — | — | 25.8 |
Boston | 2 | 1,496 | 7.4 | 4.5 | — | — | — | 11.9 |
Philadelphia | 2 | 810 | 4.8 | 2.5 | — | — | — | 7.3 |
Washington, D.C. (CBD) | 4 | 2,788 | 6.5 | 11.8 | — | — | — | 18.3 |
Northern Virginia | 2 | 916 | 5.4 | 3.2 | — | — | — | 8.6 |
Chicago | 3 | 1,562 | 2.2 | 4.1 | — | — | — | 6.3 |
San Francisco/San Jose | 6 | 4,162 | (3.8) | 14.1 | — | — | — | 10.3 |
Seattle | 2 | 1,315 | (4.0) | 3.0 | — | — | — | (1.0) |
Atlanta | 2 | 810 | 0.5 | 3.9 | — | — | — | 4.4 |
Houston | 4 | 1,710 | 6.7 | 4.2 | — | — | (1.6) | 9.3 |
Austin | 2 | 769 | 1.0 | 4.6 | 1.0 | — | — | 6.6 |
San Antonio | 2 | 1,512 | 5.3 | 3.6 | — | — | — | 8.9 |
New Orleans | 1 | 1,333 | 5.3 | 2.4 | — | — | — | 7.7 |
Denver | 3 | 1,342 | 1.7 | 3.5 | — | — | — | 5.2 |
Other | 8 | 2,551 | 6.3 | 8.7 | — | — | — | 15.0 |
Other property level (1) | 1.2 | — | — | — | — | 1.2 | ||
Domestic | 71 | 40,340 | 210.4 | 191.7 | 1.0 | — | (1.6) | 401.5 |
International | 5 | 1,499 | 7.7 | 1.7 | — | — | — | 9.4 |
All Locations - comparable hotels | 76 | 41,839 | $218.1 | $193.4 | $1.0 | $— | $(1.6) | $410.9 |
Non-comparable hotels | 2 | 407 | 2.7 | 6.3 | — | — | — | 9.0 |
Property transaction adjustments (2) | 1 | 232 | — | — | — | — | 1.6 | 1.6 |
Gain on sale of property and corporate level income/expense (3) | (83.9) | 0.4 | 58.5 | 7.4 | — | (17.6) | ||
Total | 79 | 42,478 | $136.9 | $200.1 | $59.5 | $7.4 | $— | $403.9 |
(1)Other property level includes certain ancillary revenues and related expenses, as well as non-income taxes on TRS leases.
(2)Property transaction adjustments represent the following items: (i) the elimination of results of operations of our hotels sold or held-for-sale as of the reporting date, which operations are included in our unaudited condensed consolidated statements of operations
as continuing operations, and (ii) the addition of results for periods prior to our ownership for hotels acquired as of the reporting date.
(3)Certain items from our statement of operations are not allocated to individual properties, including interest on our senior notes, corporate and other expenses, and the provision for income taxes. These items are reflected in “gain on sale of property and corporate
level income/expense.”
© Host Hotels & Resorts, Inc.10
Comparable Hotel Results by Location
(unaudited, in millions, except hotel statistics and per room basis)
Quarter ended December 31, 2024 | |||||||||
Location | No. of Properties | No. of Rooms | Average Room Rate | Average Occupancy Percentage | RevPAR | Total revenues | Total Revenues per Available Room | Hotel Net Income (Loss) | Hotel EBITDA |
Maui | 3 | 1,580 | $675.53 | 62.6% | $422.84 | $94.0 | $646.58 | $4.6 | $22.4 |
Oahu | 2 | 876 | 468.41 | 77.4% | 362.69 | 43.9 | 536.20 | 2.0 | 8.1 |
Miami | 2 | 1,038 | 543.45 | 70.3% | 381.89 | 64.4 | 656.15 | 11.8 | 20.2 |
Jacksonville | 1 | 446 | 479.66 | 62.4% | 299.52 | 30.1 | 733.55 | 5.6 | 8.9 |
New York | 3 | 2,720 | 482.16 | 89.9% | 433.68 | 146.9 | 586.91 | 37.9 | 50.0 |
Florida Gulf Coast | 4 | 1,529 | 451.08 | 62.7% | 282.72 | 83.3 | 591.92 | 4.0 | 23.6 |
Phoenix | 3 | 1,545 | 401.26 | 70.4% | 282.47 | 97.9 | 688.85 | 28.3 | 39.1 |
Nashville | 2 | 721 | 354.34 | 76.4% | 270.87 | 30.3 | 456.11 | 4.6 | 10.6 |
Orlando | 2 | 2,448 | 457.96 | 55.4% | 253.73 | 119.1 | 528.74 | 20.1 | 34.2 |
Los Angeles/Orange County | 3 | 1,067 | 296.49 | 75.3% | 223.12 | 34.4 | 350.33 | 3.8 | 6.8 |
San Diego | 3 | 3,294 | 275.76 | 70.9% | 195.51 | 114.3 | 377.07 | 17.8 | 32.9 |
Boston | 2 | 1,496 | 279.69 | 73.0% | 204.26 | 37.6 | 272.85 | 7.3 | 11.9 |
Philadelphia | 2 | 810 | 246.18 | 80.1% | 197.07 | 22.4 | 300.45 | 5.1 | 7.5 |
Washington, D.C. (CBD) | 4 | 2,788 | 287.48 | 62.3% | 179.13 | 68.0 | 265.48 | 11.3 | 19.6 |
Northern Virginia | 2 | 916 | 265.46 | 71.0% | 188.58 | 27.4 | 324.74 | 5.9 | 8.3 |
Chicago | 3 | 1,562 | 257.17 | 70.3% | 180.84 | 35.9 | 249.48 | 4.8 | 9.1 |
San Francisco/San Jose | 6 | 4,162 | 226.27 | 56.4% | 127.70 | 73.4 | 191.78 | (13.4) | 1.0 |
Seattle | 2 | 1,315 | 230.58 | 61.8% | 142.52 | 24.8 | 205.28 | (0.8) | 2.3 |
Atlanta | 2 | 810 | 198.53 | 62.9% | 124.90 | 15.0 | 200.77 | 0.9 | 4.0 |
Houston | 4 | 1,710 | 200.05 | 68.0% | 136.03 | 29.8 | 189.48 | 4.5 | 8.9 |
Austin | 2 | 769 | 281.60 | 66.8% | 188.13 | 22.8 | 323.46 | 3.7 | 8.1 |
San Antonio | 2 | 1,512 | 217.39 | 63.7% | 138.50 | 32.2 | 231.76 | 6.2 | 10.2 |
New Orleans | 1 | 1,333 | 202.74 | 68.9% | 139.61 | 26.5 | 215.85 | 7.6 | 9.8 |
Denver | 3 | 1,342 | 191.18 | 55.9% | 106.88 | 21.8 | 176.34 | 2.0 | 5.7 |
Other | 8 | 2,551 | 270.70 | 65.5% | 177.33 | 68.5 | 288.06 | 6.9 | 14.4 |
Other property level (1) | 0.2 | 7.9 | 7.9 | ||||||
Domestic | 71 | 40,340 | 327.63 | 67.2% | 220.04 | 1,364.9 | 367.00 | 200.4 | 385.5 |
International | 5 | 1,499 | 215.21 | 64.1% | 138.01 | 27.5 | 199.77 | 7.1 | 9.1 |
All Locations - comparable hotels | 76 | 41,839 | 323.78 | 67.1% | 217.11 | 1,392.4 | 361.07 | 207.5 | 394.6 |
Non-comparable hotels | 2 | 407 | 13.0 | (2.5) | 1.4 | ||||
Property transaction adjustments (2) | 1 | 232 | 23.0 | — | 6.4 | ||||
Gain on sale of property and corporate level income/expense (3) | — | (95.7) | (43.4) | ||||||
Total | 79 | 42,478 | $— | — | $— | $1,428.4 | $— | $109.3 | $359.0 |
(1)Other property level includes certain ancillary revenues and related expenses, as well as non-income taxes on TRS leases.
(2)Property transaction adjustments represent the following items: (i) the elimination of results of operations of our hotels sold or held-for-sale as of the reporting date, which operations are included in our unaudited condensed consolidated statements of operations
as continuing operations, and (ii) the addition of results for periods prior to our ownership for hotels acquired as of the reporting date. As of December 31, 2025, this includes two hotels sold in 2025 and one hotel classified as held-for-sale and four hotels acquired in
2024.
(3)Certain items from our statement of operations are not allocated to individual properties, including interest on our senior notes, corporate and other expenses, and the provision for income taxes. These items are reflected in “gain on sale of property and corporate
level income/expense.” Refer to the table below for reconciliation of net income to EBITDA by location.
© Host Hotels & Resorts, Inc.11
Comparable Hotel Results by Location
(unaudited, in millions, except hotel statistics and per room basis)
Quarter ended December 31, 2024 | ||||||||
Location | No. of Properties | No. of Rooms | Hotel Net Income (Loss) | Plus: Depreciation | Plus: Interest Expense | Plus: Income Tax | Plus: Property Transaction Adjustments | Equals: Hotel EBITDA |
Maui | 3 | 1,580 | $4.6 | $17.8 | $— | $— | $— | $22.4 |
Oahu | 2 | 876 | 2.0 | 6.1 | — | — | — | 8.1 |
Miami | 2 | 1,038 | 11.8 | 8.4 | — | — | — | 20.2 |
Jacksonville | 1 | 446 | 5.6 | 3.3 | — | — | — | 8.9 |
New York | 3 | 2,720 | 37.9 | 12.1 | — | — | — | 50.0 |
Florida Gulf Coast | 4 | 1,529 | 4.0 | 19.6 | — | — | — | 23.6 |
Phoenix | 3 | 1,545 | 28.3 | 10.8 | — | — | — | 39.1 |
Nashville | 2 | 721 | 4.6 | 6.0 | — | — | — | 10.6 |
Orlando | 2 | 2,448 | 20.1 | 14.1 | — | — | — | 34.2 |
Los Angeles/Orange County | 3 | 1,067 | 3.8 | 3.0 | — | — | — | 6.8 |
San Diego | 3 | 3,294 | 17.8 | 15.1 | — | — | — | 32.9 |
Boston | 2 | 1,496 | 7.3 | 4.6 | — | — | — | 11.9 |
Philadelphia | 2 | 810 | 5.1 | 2.4 | — | — | — | 7.5 |
Washington, D.C. (CBD) | 4 | 2,788 | 11.3 | 11.1 | — | — | (2.8) | 19.6 |
Northern Virginia | 2 | 916 | 5.9 | 2.4 | — | — | — | 8.3 |
Chicago | 3 | 1,562 | 4.8 | 4.3 | — | — | — | 9.1 |
San Francisco/San Jose | 6 | 4,162 | (13.4) | 14.4 | — | — | — | 1.0 |
Seattle | 2 | 1,315 | (0.8) | 3.1 | — | — | — | 2.3 |
Atlanta | 2 | 810 | 0.9 | 3.1 | — | — | — | 4.0 |
Houston | 4 | 1,710 | 4.5 | 5.8 | — | — | (1.4) | 8.9 |
Austin | 2 | 769 | 3.7 | 3.4 | 1.0 | — | — | 8.1 |
San Antonio | 2 | 1,512 | 6.2 | 4.0 | — | — | — | 10.2 |
New Orleans | 1 | 1,333 | 7.6 | 2.2 | — | — | — | 9.8 |
Denver | 3 | 1,342 | 2.0 | 3.7 | — | — | — | 5.7 |
Other | 8 | 2,551 | 6.9 | 9.7 | — | — | (2.2) | 14.4 |
Other property level (1) | 7.9 | — | — | — | — | 7.9 | ||
Domestic | 71 | 40,340 | 200.4 | 190.5 | 1.0 | — | (6.4) | 385.5 |
International | 5 | 1,499 | 7.1 | 2.0 | — | — | — | 9.1 |
All Locations - comparable hotels | 76 | 41,839 | $207.5 | $192.5 | $1.0 | $— | $(6.4) | $394.6 |
Non-comparable hotels | 2 | 407 | (2.5) | 3.9 | — | — | — | 1.4 |
Property transaction adjustments (2) | 1 | 232 | — | — | — | — | 6.4 | 6.4 |
Gain on sale of property and corporate level income/expense (3) | (95.7) | 0.5 | 58.2 | (6.4) | — | (43.4) | ||
Total | 79 | 42,478 | $109.3 | $196.9 | $59.2 | $(6.4) | $— | $359.0 |
(1)Other property level includes certain ancillary revenues and related expenses, as well as non-income taxes on TRS leases.
(2)Property transaction adjustments represent the following items: (i) the elimination of results of operations of our hotels sold or held-for-sale as of the reporting date, which operations are included in our unaudited condensed consolidated statements of operations
as continuing operations, and (ii) the addition of results for periods prior to our ownership for hotels acquired as of the reporting date.
(3)Certain items from our statement of operations are not allocated to individual properties, including interest on our senior notes, corporate and other expenses, and the provision for income taxes. These items are reflected in “gain on sale of property and corporate
level income/expense.”
© Host Hotels & Resorts, Inc.12
Comparable Hotel Results by Location (1)
(unaudited, in millions, except hotel statistics and per room basis)
Year ended December 31, 2025 | |||||||||
Location | No. of Properties | No. of Rooms | Average Room Rate | Average Occupancy Percentage | RevPAR | Total revenues | Total Revenues per Available Room | Hotel Net Income (Loss) | Hotel EBITDA |
Maui | 3 | 1,580 | $654.62 | 71.3% | $467.04 | $420.3 | $728.79 | $45.0 | $110.7 |
Oahu | 2 | 876 | 489.06 | 82.5 | 403.54 | 199.4 | 614.38 | 21.6 | 46.9 |
Miami | 2 | 1,038 | 549.06 | 72.9 | 400.38 | 274.1 | 703.89 | 52.4 | 87.0 |
Jacksonville | 1 | 446 | 541.61 | 71.7 | 388.19 | 144.8 | 889.30 | 39.8 | 52.5 |
New York | 3 | 2,720 | 418.18 | 87.0 | 363.64 | 516.4 | 520.10 | 102.0 | 148.3 |
Florida Gulf Coast | 4 | 1,529 | 517.51 | 64.3 | 332.59 | 401.0 | 718.61 | 40.8 | 121.5 |
Phoenix | 3 | 1,545 | 393.28 | 70.8 | 278.57 | 371.3 | 658.45 | 94.7 | 138.0 |
Nashville | 2 | 721 | 344.87 | 79.9 | 275.44 | 123.8 | 470.44 | 18.9 | 43.2 |
Orlando | 2 | 2,448 | 416.42 | 64.4 | 268.25 | 504.2 | 564.26 | 99.0 | 154.0 |
Los Angeles/Orange County | 3 | 1,067 | 305.18 | 76.8 | 234.23 | 139.5 | 358.11 | 17.5 | 28.3 |
San Diego | 3 | 3,294 | 295.65 | 73.8 | 218.24 | 493.8 | 410.72 | 93.8 | 158.4 |
Boston | 2 | 1,496 | 289.70 | 74.8 | 216.74 | 154.9 | 283.72 | 33.9 | 51.8 |
Philadelphia | 2 | 810 | 238.13 | 81.2 | 193.26 | 87.8 | 297.12 | 17.9 | 27.8 |
Washington, D.C. (CBD) | 4 | 2,788 | 309.82 | 61.9 | 191.85 | 286.0 | 281.17 | 53.6 | 90.5 |
Northern Virginia | 2 | 916 | 268.19 | 69.3 | 185.77 | 99.5 | 297.46 | 17.7 | 29.1 |
Chicago | 3 | 1,562 | 252.09 | 71.4 | 179.92 | 147.0 | 257.81 | 18.1 | 34.5 |
San Francisco/San Jose | 6 | 4,162 | 254.71 | 69.0 | 175.69 | 396.5 | 261.00 | 9.0 | 65.6 |
Seattle | 2 | 1,315 | 246.07 | 67.3 | 165.67 | 107.6 | 224.24 | 1.6 | 13.7 |
Atlanta | 2 | 810 | 212.87 | 66.9 | 142.34 | 70.8 | 239.51 | 6.1 | 20.7 |
Houston | 4 | 1,710 | 208.40 | 67.5 | 140.64 | 122.6 | 196.48 | 23.5 | 39.1 |
Austin | 2 | 769 | 249.07 | 54.8 | 136.53 | 69.7 | 248.67 | 4.7 | 24.2 |
San Antonio | 2 | 1,512 | 226.17 | 60.3 | 136.38 | 120.2 | 217.83 | 21.5 | 36.0 |
New Orleans | 1 | 1,333 | 202.57 | 65.0 | 131.61 | 102.6 | 210.83 | 24.1 | 33.5 |
Denver | 3 | 1,342 | 201.83 | 63.8 | 128.84 | 96.9 | 197.80 | 15.3 | 29.7 |
Other | 8 | 2,551 | 298.83 | 68.3 | 204.00 | 300.4 | 318.75 | 39.6 | 73.2 |
Other property level (2) | 0.7 | 2.1 | 2.1 | ||||||
Domestic | 71 | 40,340 | 332.09 | 70.1 | 232.78 | 5,751.8 | 389.91 | 914.2 | 1,660.3 |
International | 5 | 1,499 | 199.31 | 67.1 | 133.80 | 104.4 | 190.79 | 26.5 | 33.3 |
All Locations - comparable hotels | 76 | 41,839 | $327.54 | 70.0 | $229.24 | $5,856.2 | $382.83 | $940.7 | $1,693.6 |
Non-comparable hotels | 2 | 407 | 96.1 | 26.0 | 47.5 | ||||
Property transaction adjustments (3) | 1 | 232 | 62.6 | — | 15.2 | ||||
Gain on sale of property and corporate level income/expense (4) | 98.9 | (191.2) | 83.4 | ||||||
Total | 79 | 42,478 | — | — | — | $6,113.8 | — | $775.5 | $1,839.7 |
(1)See the Notes to Supplemental Financial Information for a discussion of comparable hotel operating statistics. CBD of a location refers to the central business district. RevPAR is the product of the average daily room rate charged and the average daily occupancy
achieved. Total Revenues per Available Room ("Total RevPAR") is a summary measure of hotel results calculated by dividing the sum of room, food and beverage and other ancillary service revenue by room nights available to guests for the period. It includes
ancillary revenues not included with RevPAR.
(2)Other property level includes certain ancillary revenues and related expenses, as well as non-income taxes on TRS leases.
(3)Property transaction adjustments represent the following items: (i) the elimination of results of operations of our hotels sold or held-for-sale as of the reporting date, which operations are included in our unaudited condensed consolidated statements of operations
as continuing operations, and (ii) the addition of results for periods prior to our ownership for hotels acquired as of the reporting date. As of December 31, 2025, this includes two hotels sold in 2025 and one hotel classified as held-for-sale.
(4)Certain items from our statement of operations are not allocated to individual properties, including interest on our senior notes, corporate and other expenses, and the provision for income taxes. These items are reflected in “gain on sale of property and corporate
level income/expense.” Refer to the table below for reconciliation of net income to EBITDA by location.
© Host Hotels & Resorts, Inc.13
Comparable Hotel Results by Location
(unaudited, in millions, except hotel statistics and per room basis)
Year ended December 31, 2025 | ||||||||
Location | No. of Properties | No. of Rooms | Hotel Net Income (Loss) | Plus: Depreciation | Plus: Interest Expense | Plus: Income Tax | Plus: Property Transaction Adjustments | Equals: Hotel EBITDA |
Maui | 3 | 1,580 | $45.0 | $65.7 | $— | $— | $— | $110.7 |
Oahu | 2 | 876 | 21.6 | 25.3 | — | — | — | 46.9 |
Miami | 2 | 1,038 | 52.4 | 34.6 | — | — | — | 87.0 |
Jacksonville | 1 | 446 | 39.8 | 12.7 | — | — | — | 52.5 |
New York | 3 | 2,720 | 102.0 | 46.3 | — | — | — | 148.3 |
Florida Gulf Coast | 4 | 1,529 | 40.8 | 80.7 | — | — | — | 121.5 |
Phoenix | 3 | 1,545 | 94.7 | 43.3 | — | — | — | 138.0 |
Nashville | 2 | 721 | 18.9 | 24.3 | — | — | — | 43.2 |
Orlando | 2 | 2,448 | 99.0 | 55.0 | — | — | — | 154.0 |
Los Angeles/Orange County | 3 | 1,067 | 17.5 | 10.8 | — | — | — | 28.3 |
San Diego | 3 | 3,294 | 93.8 | 64.6 | — | — | — | 158.4 |
Boston | 2 | 1,496 | 33.9 | 17.9 | — | — | — | 51.8 |
Philadelphia | 2 | 810 | 17.9 | 9.9 | — | — | — | 27.8 |
Washington, D.C. (CBD) | 4 | 2,788 | 53.6 | 46.0 | — | — | (9.1) | 90.5 |
Northern Virginia | 2 | 916 | 17.7 | 11.4 | — | — | — | 29.1 |
Chicago | 3 | 1,562 | 18.1 | 16.4 | — | — | — | 34.5 |
San Francisco/San Jose | 6 | 4,162 | 9.0 | 56.6 | — | — | — | 65.6 |
Seattle | 2 | 1,315 | 1.6 | 12.1 | — | — | — | 13.7 |
Atlanta | 2 | 810 | 6.1 | 14.6 | — | — | — | 20.7 |
Houston | 4 | 1,710 | 23.5 | 19.6 | — | — | (4.0) | 39.1 |
Austin | 2 | 769 | 4.7 | 15.6 | 3.9 | — | — | 24.2 |
San Antonio | 2 | 1,512 | 21.5 | 14.5 | — | — | — | 36.0 |
New Orleans | 1 | 1,333 | 24.1 | 9.4 | — | — | — | 33.5 |
Denver | 3 | 1,342 | 15.3 | 14.4 | — | — | — | 29.7 |
Other | 8 | 2,551 | 39.6 | 35.7 | — | — | (2.1) | 73.2 |
Other property level (1) | 2.1 | — | — | — | — | 2.1 | ||
Domestic | 71 | 40,340 | 914.2 | 757.4 | 3.9 | — | (15.2) | 1,660.3 |
International | 5 | 1,499 | 26.5 | 6.8 | — | — | — | 33.3 |
All Locations - comparable hotels | 76 | 41,839 | $940.7 | $764.2 | $3.9 | $— | $(15.2) | $1,693.6 |
Non-comparable hotels | 2 | 407 | 26.0 | 21.5 | — | — | — | 47.5 |
Property transaction adjustments (2) | 1 | 232 | — | — | — | — | 15.2 | 15.2 |
Gain on sale of property and corporate level income/expense (3) | (191.2) | 1.6 | 230.7 | 42.3 | — | 83.4 | ||
Total | 79 | 42,478 | $775.5 | $787.3 | $234.6 | $42.3 | $— | $1,839.7 |
(1)Other property level includes certain ancillary revenues and related expenses, as well as non-income taxes on TRS leases.
(2)Property transaction adjustments represent the following items: (i) the elimination of results of operations of our hotels sold or held-for-sale as of the reporting date, which operations are included in our unaudited condensed consolidated statements of operations
as continuing operations, and (ii) the addition of results for periods prior to our ownership for hotels acquired as of the reporting date.
(3)Certain items from our statement of operations are not allocated to individual properties, including interest on our senior notes, corporate and other expenses, and the provision for income taxes. These items are reflected in “gain on sale of property and corporate
level income/expense.”
© Host Hotels & Resorts, Inc.14
Comparable Hotel Results by Location
(unaudited, in millions, except hotel statistics and per room basis)
Year ended December 31, 2024 | |||||||||
Location | No. of Properties | No. of Rooms | Average Room Rate | Average Occupancy Percentage | RevPAR | Total revenues | Total Revenues per Available Room | Hotel Net Income (Loss) | Hotel EBITDA |
Maui | 3 | 1,580 | $663.09 | 60.1% | $398.83 | $370.7 | $641.01 | $48.2 | $115.8 |
Oahu | 2 | 876 | 457.70 | 81.2% | 371.85 | 187.4 | 576.36 | 3.9 | 40.6 |
Miami | 2 | 1,038 | 526.83 | 70.2% | 369.84 | 250.5 | 641.42 | 46.0 | 78.8 |
Jacksonville | 1 | 446 | 517.28 | 71.2% | 368.44 | 137.2 | 840.68 | 37.0 | 49.5 |
New York | 3 | 2,720 | 392.96 | 84.6% | 332.63 | 461.3 | 463.36 | 71.4 | 128.5 |
Florida Gulf Coast | 4 | 1,529 | 473.90 | 67.2% | 318.69 | 376.4 | 672.55 | 33.2 | 110.5 |
Phoenix | 3 | 1,545 | 395.73 | 70.0% | 276.93 | 365.8 | 646.95 | 96.9 | 138.1 |
Nashville | 2 | 721 | 344.36 | 79.7% | 274.37 | 118.2 | 447.79 | 14.7 | 42.7 |
Orlando | 2 | 2,448 | 383.93 | 65.1% | 249.76 | 473.1 | 528.04 | 82.1 | 137.5 |
Los Angeles/Orange County | 3 | 1,067 | 297.23 | 78.1% | 232.13 | 136.9 | 350.62 | 15.0 | 26.9 |
San Diego | 3 | 3,294 | 293.18 | 78.9% | 231.22 | 522.6 | 433.50 | 112.8 | 173.3 |
Boston | 2 | 1,496 | 280.30 | 78.1% | 218.97 | 157.4 | 287.46 | 39.8 | 58.2 |
Philadelphia | 2 | 810 | 237.00 | 80.4% | 190.56 | 86.0 | 289.97 | 17.4 | 27.0 |
Washington, D.C. (CBD) | 4 | 2,788 | 289.11 | 67.7% | 195.84 | 297.1 | 291.55 | 69.6 | 96.3 |
Northern Virginia | 2 | 916 | 258.13 | 72.5% | 187.25 | 99.5 | 296.74 | 18.7 | 28.6 |
Chicago | 3 | 1,562 | 255.54 | 70.4% | 180.01 | 142.8 | 249.73 | 22.8 | 40.0 |
San Francisco/San Jose | 6 | 4,162 | 241.04 | 65.3% | 157.34 | 352.7 | 231.55 | (17.0) | 45.3 |
Seattle | 2 | 1,315 | 248.84 | 68.3% | 169.99 | 111.0 | 230.55 | 5.4 | 17.7 |
Atlanta | 2 | 810 | 202.78 | 61.8% | 125.29 | 61.1 | 206.10 | 8.1 | 18.9 |
Houston | 4 | 1,710 | 202.39 | 72.4% | 146.51 | 125.9 | 201.19 | 21.3 | 40.7 |
Austin | 2 | 769 | 256.02 | 66.3% | 169.83 | 84.3 | 300.41 | 10.0 | 27.2 |
San Antonio | 2 | 1,512 | 216.95 | 62.0% | 134.48 | 121.1 | 218.75 | 19.4 | 36.3 |
New Orleans | 1 | 1,333 | 193.96 | 71.4% | 138.52 | 106.5 | 218.31 | 25.5 | 34.2 |
Denver | 3 | 1,342 | 199.13 | 66.8% | 133.12 | 101.0 | 205.67 | 16.9 | 31.6 |
Other | 8 | 2,551 | 295.74 | 65.3% | 193.04 | 288.7 | 305.70 | 40.8 | 68.4 |
Other property level (1) | 0.7 | 7.9 | 7.9 | ||||||
Domestic | 71 | 40,340 | 317.42 | 70.7% | 224.31 | 5,535.9 | 374.29 | 867.8 | 1,620.5 |
International | 5 | 1,499 | 200.88 | 63.4% | 127.43 | 101.0 | 184.07 | 24.3 | 32.6 |
All Locations - comparable hotels | 76 | 41,839 | $313.67 | 70.4% | $220.84 | $5,636.9 | $367.53 | $892.1 | $1,653.1 |
Non-comparable hotels | 2 | 407 | 105.2 | 34.3 | 51.9 | ||||
Property transaction adjustments (2) | 1 | 232 | (58.4) | — | (14.7) | ||||
Gain on sale of property and corporate level income/expense (3) | — | (219.0) | 7.7 | ||||||
Total | 79 | 42,478 | $— | — | $— | $5,683.7 | $— | $707.4 | $1,698.0 |
(1)Other property level includes certain ancillary revenues and related expenses, as well as non-income taxes on TRS leases.
(2)Property transaction adjustments represent the following items: (i) the elimination of results of operations of our hotels sold or held-for-sale as of the reporting date, which operations are included in our unaudited condensed consolidated statements of operations
as continuing operations, and (ii) the addition of results for periods prior to our ownership for hotels acquired as of the reporting date. As of December 31, 2025, this includes two hotels sold in 2025 and one hotel classified as held-for-sale and four hotels acquired in
2024.
(3)Certain items from our statement of operations are not allocated to individual properties, including interest on our senior notes, corporate and other expenses, and the provision for income taxes. These items are reflected in “gain on sale of property and corporate
level income/expense.” Refer to the table below for reconciliation of net income to EBITDA by location.
© Host Hotels & Resorts, Inc.15
Comparable Hotel Results by Location
(unaudited, in millions, except hotel statistics and per room basis)
Year ended December 31, 2024 | ||||||||
Location | No. of Properties | No. of Rooms | Hotel Net Income (Loss) | Plus: Depreciation | Plus: Interest Expense | Plus: Income Tax | Plus: Property Transaction Adjustments | Equals: Hotel EBITDA |
Maui | 3 | 1,580 | $48.2 | $67.6 | $— | $— | $— | $115.8 |
Oahu | 2 | 876 | 3.9 | 13.8 | — | — | 22.9 | 40.6 |
Miami | 2 | 1,038 | 46.0 | 32.8 | — | — | — | 78.8 |
Jacksonville | 1 | 446 | 37.0 | 12.5 | — | — | — | 49.5 |
New York | 3 | 2,720 | 71.4 | 48.5 | — | — | 8.6 | 128.5 |
Florida Gulf Coast | 4 | 1,529 | 33.2 | 77.3 | — | — | — | 110.5 |
Phoenix | 3 | 1,545 | 96.9 | 41.2 | — | — | — | 138.1 |
Nashville | 2 | 721 | 14.7 | 18.0 | — | — | 10.0 | 42.7 |
Orlando | 2 | 2,448 | 82.1 | 55.4 | — | — | — | 137.5 |
Los Angeles/Orange County | 3 | 1,067 | 15.0 | 11.9 | — | — | — | 26.9 |
San Diego | 3 | 3,294 | 112.8 | 60.5 | — | — | — | 173.3 |
Boston | 2 | 1,496 | 39.8 | 18.4 | — | — | — | 58.2 |
Philadelphia | 2 | 810 | 17.4 | 9.6 | — | — | — | 27.0 |
Washington, D.C. (CBD) | 4 | 2,788 | 69.6 | 39.8 | — | — | (13.1) | 96.3 |
Northern Virginia | 2 | 916 | 18.7 | 9.9 | — | — | — | 28.6 |
Chicago | 3 | 1,562 | 22.8 | 17.2 | — | — | — | 40.0 |
San Francisco/San Jose | 6 | 4,162 | (17.0) | 62.3 | — | — | — | 45.3 |
Seattle | 2 | 1,315 | 5.4 | 12.3 | — | — | — | 17.7 |
Atlanta | 2 | 810 | 8.1 | 10.8 | — | — | — | 18.9 |
Houston | 4 | 1,710 | 21.3 | 24.0 | — | — | (4.6) | 40.7 |
Austin | 2 | 769 | 10.0 | 13.2 | 4.0 | — | — | 27.2 |
San Antonio | 2 | 1,512 | 19.4 | 16.9 | — | — | — | 36.3 |
New Orleans | 1 | 1,333 | 25.5 | 8.7 | — | — | — | 34.2 |
Denver | 3 | 1,342 | 16.9 | 14.7 | — | — | — | 31.6 |
Other | 8 | 2,551 | 40.8 | 36.7 | — | — | (9.1) | 68.4 |
Other property level (1) | 7.9 | — | — | — | — | 7.9 | ||
Domestic | 71 | 40,340 | 867.8 | 734.0 | 4.0 | — | 14.7 | 1,620.5 |
International | 5 | 1,499 | 24.3 | 8.3 | — | — | — | 32.6 |
All Locations - comparable hotels | 76 | 41,839 | $892.1 | $742.3 | $4.0 | $— | $14.7 | $1,653.1 |
Non-comparable hotels | 2 | 407 | 34.3 | 17.6 | — | — | — | 51.9 |
Property transaction adjustments (2) | 1 | 232 | — | — | — | — | (14.7) | (14.7) |
Gain on sale of property and corporate level income/expense (3) | (219.0) | 1.8 | 211.4 | 13.5 | — | 7.7 | ||
Total | 79 | 42,478 | $707.4 | $761.7 | $215.4 | $13.5 | $— | $1,698.0 |
(1)Other property level includes certain ancillary revenues and related expenses, as well as non-income taxes on TRS leases.
(2)Property transaction adjustments represent the following items: (i) the elimination of results of operations of our hotels sold or held-for-sale as of the reporting date, which operations are included in our unaudited condensed consolidated statements of operations
as continuing operations, and (ii) the addition of results for periods prior to our ownership for hotels acquired as of the reporting date.
(3)Certain items from our statement of operations are not allocated to individual properties, including interest on our senior notes, corporate and other expenses, and the provision for income taxes. These items are reflected in “gain on sale of property and corporate
level income/expense.”
© Host Hotels & Resorts, Inc.16
Top 40 Hotels by Total RevPAR for Year Ended December 31, 2025
(unaudited, in millions, except hotel statistics and per room basis)
Year ended December 31, 2025 | ||||||||||
Hotel | Location | No. of Rooms | Average Room Rate | Average Occupancy Percentage | RevPAR | Total revenues | Total Revenues per Available Room | Hotel Net Income (Loss) | Hotel EBITDA (1) | |
1 | Alila Ventana Big Sur | Other Domestic | 59 | $1,844.41 | 85.5% | $1,577.34 | $46.5 | $2,355.76 | $7.9 | $14.8 |
2 | Four Seasons Resort and Residences Jackson Hole | Other Domestic | 125 | 1,565.76 | 62.8% | 983.56 | 95.2 | 1,671.05 | 10.5 | 23.5 |
3 | Four Seasons Resort Orlando at Walt Disney World® Resort | Orlando | 444 | 1,241.71 | 63.0% | 782.73 | 210.9 | 1,300.64 | 33.5 | 58.0 |
4 | 1 Hotel South Beach | Miami | 433 | 945.56 | 74.5% | 704.49 | 215.5 | 1,277.42 | 39.5 | 65.0 |
5 | The Ritz-Carlton, Naples | Florida Gulf Coast | 474 | 908.63 | 63.6% | 577.89 | 209.3 | 1,209.24 | 12.6 | 68.3 |
6 | Andaz Maui at Wailea Resort | Maui | 320 | 811.01 | 78.8% | 639.26 | 112.5 | 963.59 | 15.6 | 30.4 |
7 | The Ritz-Carlton O'ahu, Turtle Bay | Oahu | 450 | 829.31 | 71.2% | 590.86 | 162.5 | 961.67 | 18.4 | 37.5 |
8 | Fairmont Kea Lani, Maui | Maui | 450 | 947.54 | 72.3% | 685.30 | 157.3 | 957.53 | 22.3 | 49.2 |
9 | The Ritz-Carlton, Amelia Island | Jacksonville | 446 | 541.61 | 71.7% | 388.19 | 144.8 | 889.30 | 39.8 | 52.5 |
10 | The Phoenician, A Luxury Collection Resort, Scottsdale | Phoenix | 645 | 493.07 | 71.7% | 353.36 | 202.6 | 860.72 | 43.6 | 71.7 |
11 | 1 Hotel Central Park | New York | 234 | 719.30 | 81.0% | 582.62 | 67.5 | 790.71 | 17.7 | 26.3 |
12 | 1 Hotel Nashville | Nashville | 215 | 435.90 | 78.1% | 340.25 | 53.1 | 676.82 | 7.9 | 15.9 |
13 | The Ritz-Carlton Naples, Tiburón | Florida Gulf Coast | 295 | 558.07 | 55.9% | 312.15 | 67.8 | 629.54 | 11.7 | 19.0 |
14 | The Westin Kierland Resort & Spa | Phoenix | 735 | 339.86 | 68.7% | 233.50 | 156.5 | 583.46 | 45.7 | 59.5 |
15 | New York Marriott Marquis | New York | 1,971 | 405.15 | 88.6% | 359.07 | 387.3 | 538.36 | 72.3 | 105.3 |
16 | Baker's Cay Resort Key Largo, Curio Collection by Hilton | Other Domestic | 200 | 440.15 | 75.6% | 332.93 | 39.3 | 538.12 | 6.3 | 11.8 |
17 | The Ritz-Carlton, Marina del Rey | Los Angeles/Orange County | 304 | 430.62 | 74.5% | 320.76 | 59.6 | 537.28 | 8.3 | 11.6 |
18 | Marriott Marquis San Diego Marina | San Diego | 1,366 | 311.42 | 78.9% | 245.59 | 241.1 | 483.60 | 49.8 | 82.8 |
19 | Hyatt Regency Maui Resort and Spa | Maui | 810 | 409.38 | 67.8% | 277.75 | 137.1 | 463.85 | 5.6 | 28.4 |
20 | The Ritz-Carlton, Tysons Corner | Northern Virginia | 398 | 337.44 | 74.8% | 252.30 | 62.8 | 432.26 | 9.1 | 14.7 |
21 | Hyatt Regency Coconut Point Resort and Spa | Florida Gulf Coast | 462 | 291.07 | 66.8% | 194.44 | 70.9 | 420.64 | 3.8 | 18.3 |
22 | Coronado Island Marriott Resort & Spa | San Diego | 300 | 310.91 | 76.2% | 236.97 | 45.3 | 413.41 | 6.4 | 11.8 |
23 | Orlando World Center Marriott | Orlando | 2,004 | 238.34 | 64.7% | 154.27 | 293.4 | 401.11 | 65.7 | 96.1 |
24 | The Don CeSar ⁽³⁾ | Florida Gulf Coast | 348 | 393.77 | 51.2% | 201.57 | 49.7 | 391.27 | 17.9 | 32.5 |
25 | Embassy Suites by Hilton Nashville Downtown | Nashville | 506 | 307.43 | 80.6% | 247.91 | 70.7 | 382.76 | 11.0 | 27.3 |
26 | JW Marriott Washington, DC | Washington, D.C. (CBD) | 777 | 335.43 | 78.0% | 261.68 | 108.0 | 380.91 | 30.1 | 35.0 |
27 | Manchester Grand Hyatt San Diego | San Diego | 1,628 | 277.45 | 69.1% | 191.84 | 207.4 | 349.07 | 37.6 | 63.8 |
28 | The Alida, Savannah, a Tribute Portfolio Hotel | Other Domestic | 173 | 253.83 | 76.8% | 195.04 | 21.9 | 347.26 | 1.6 | 5.5 |
29 | The Logan Philadelphia, Curio Collection by Hilton | Philadelphia | 391 | 245.46 | 76.5% | 187.70 | 49.3 | 345.48 | 8.6 | 16.0 |
30 | San Francisco Marriott Marquis | San Francisco/San Jose | 1,500 | 291.77 | 70.5% | 205.74 | 179.7 | 328.25 | 11.9 | 35.3 |
31 | New York Marriott Downtown | New York | 515 | 338.16 | 83.3% | 281.65 | 61.5 | 327.25 | 12.0 | 16.7 |
32 | The Westin Chicago River North | Chicago | 445 | 301.74 | 72.7% | 219.33 | 51.7 | 318.57 | 6.3 | 11.9 |
33 | Marina del Rey Marriott | Los Angeles/Orange County | 370 | 286.12 | 81.3% | 232.76 | 42.7 | 316.37 | 6.7 | 11.4 |
34 | The Singer Oceanfront Resort, Curio Collection by Hilton | Other Domestic | 223 | 270.41 | 73.6% | 199.03 | 25.5 | 312.85 | 3.1 | 7.6 |
35 | Boston Marriott Copley Place | Boston | 1,145 | 304.26 | 78.8% | 239.63 | 128.7 | 308.04 | 27.8 | 43.2 |
36 | Grand Hyatt Washington | Washington, D.C. (CBD) | 902 | 293.91 | 64.6% | 189.91 | 95.8 | 291.07 | 9.5 | 31.4 |
37 | Hotel Van Zandt | Austin | 319 | 265.64 | 56.9% | 151.22 | 33.0 | 283.29 | (3.8) | 8.2 |
38 | The Westin Georgetown, Washington D.C. | Washington, D.C. (CBD) | 269 | 302.70 | 72.0% | 217.96 | 27.2 | 276.95 | 2.3 | 7.3 |
39 | Miami Marriott Biscayne Bay | Miami | 605 | 234.49 | 71.7% | 168.16 | 58.7 | 265.93 | 12.8 | 22.0 |
40 | The Westin South Coast Plaza, Costa Mesa | Los Angeles/Orange County | 393 | 227.42 | 74.2% | 168.68 | 37.1 | 258.82 | 2.5 | 5.3 |
Total Top 40 | 23,649 | 409.12 | 72.9% | 298.09 | 4,487.4 | 518.37 | 751.9 | 1,352.8 | ||
Remaining 39 Hotels | 18,829 | 220.47 | 65.8% | 145.03 | 1,485.7 | 216.22 | 201.4 | 390.1 | ||
Other Property Level (2) | 0.7 | 2.1 | 2.1 | |||||||
Gain on sale of property, sold property operations and corporate level income/expense | 140.0 | (179.9) | (14.5) | |||||||
Total | 42,478 | — | — | — | $6,113.8 | — | $775.5 | $1,730.5 | ||
(1)Certain items from our statement of operations are not allocated to individual properties, including interest on our senior notes, corporate and other expenses, and the provision for income taxes. These items are reflected below in “gain on sale of property, sold
property operations and corporate level income/expense”. Refer to the table below for a reconciliation of net income (loss) to Hotel EBITDA. The total represents the Company's EBITDAre, as defined in the Notes to Supplemental Financial Information.
(2)Other property level includes certain ancillary revenues and related expenses, as well as non-income taxes on TRS leases.
(3)2025 Hotel EBITDA for The Don CeSar includes $24 million of business interruption proceeds collected in relation to Hurricanes Helene and Milton.
© Host Hotels & Resorts, Inc.17
Top 40 Hotels by Total RevPAR Reconciliation from Hotel Net Income (Loss) to
Hotel EBITDA and EBITDAre
(unaudited, in millions, except hotel statistics and per room basis)
Year ended December 31, 2025 | ||||||||||
Location | Location | No. of Rooms | Hotel Net Income (Loss) | Plus: Depreciation | Plus: Interest Expense | Plus: Income Tax | Less: Gain on dispositions | Plus: Equity Investment | Equals: Hotel EBITDA (1) | |
1 | Alila Ventana Big Sur | Other Domestic | 59 | $7.9 | $6.9 | $— | $— | $— | $— | $14.8 |
2 | Four Seasons Resort and Residences Jackson Hole | Other Domestic | 125 | 10.5 | 13.0 | — | — | — | — | 23.5 |
3 | Four Seasons Resort Orlando at Walt Disney World® Resort | Orlando | 444 | 33.5 | 24.5 | — | — | — | — | 58.0 |
4 | 1 Hotel South Beach | Miami | 433 | 39.5 | 25.5 | — | — | — | — | 65.0 |
5 | The Ritz-Carlton, Naples | Florida Gulf Coast | 474 | 12.6 | 55.7 | — | — | — | — | 68.3 |
6 | Andaz Maui at Wailea Resort | Maui | 320 | 15.6 | 14.8 | — | — | — | — | 30.4 |
7 | The Ritz-Carlton O'ahu, Turtle Bay | Oahu | 450 | 18.4 | 19.1 | — | — | — | — | 37.5 |
8 | Fairmont Kea Lani, Maui | Maui | 450 | 22.3 | 26.9 | — | — | — | — | 49.2 |
9 | The Ritz-Carlton, Amelia Island | Jacksonville | 446 | 39.8 | 12.7 | — | — | — | — | 52.5 |
10 | The Phoenician, A Luxury Collection Resort, Scottsdale | Phoenix | 645 | 43.6 | 28.1 | — | — | — | — | 71.7 |
11 | 1 Hotel Central Park | New York | 234 | 17.7 | 8.6 | — | — | — | — | 26.3 |
12 | 1 Hotel Nashville | Nashville | 215 | 7.9 | 8.0 | — | — | — | — | 15.9 |
13 | The Ritz-Carlton Naples, Tiburón | Florida Gulf Coast | 295 | 11.7 | 7.3 | — | — | — | — | 19.0 |
14 | The Westin Kierland Resort & Spa | Phoenix | 735 | 45.7 | 13.8 | — | — | — | — | 59.5 |
15 | New York Marriott Marquis | New York | 1,971 | 72.3 | 33.0 | — | — | — | — | 105.3 |
16 | Baker's Cay Resort Key Largo, Curio Collection by Hilton | Other Domestic | 200 | 6.3 | 5.5 | — | — | — | — | 11.8 |
17 | The Ritz-Carlton, Marina del Rey | Los Angeles/Orange County | 304 | 8.3 | 3.3 | — | — | — | — | 11.6 |
18 | Marriott Marquis San Diego Marina | San Diego | 1,366 | 49.8 | 33.0 | — | — | — | — | 82.8 |
19 | Hyatt Regency Maui Resort and Spa | Maui | 810 | 5.6 | 22.8 | — | — | — | — | 28.4 |
20 | The Ritz-Carlton, Tysons Corner | Northern Virginia | 398 | 9.1 | 5.6 | — | — | — | — | 14.7 |
21 | Hyatt Regency Coconut Point Resort and Spa | Florida Gulf Coast | 462 | 3.8 | 14.5 | — | — | — | — | 18.3 |
22 | Coronado Island Marriott Resort & Spa | San Diego | 300 | 6.4 | 5.4 | — | — | — | — | 11.8 |
23 | Orlando World Center Marriott | Orlando | 2,004 | 65.7 | 30.4 | — | — | — | — | 96.1 |
24 | The Don CeSar ⁽³⁾ | Florida Gulf Coast | 348 | 17.9 | 14.6 | — | — | — | — | 32.5 |
25 | Embassy Suites by Hilton Nashville Downtown | Nashville | 506 | 11.0 | 16.3 | — | — | — | — | 27.3 |
26 | JW Marriott Washington, DC | Washington, D.C. (CBD) | 777 | 30.1 | 4.9 | — | — | — | — | 35.0 |
27 | Manchester Grand Hyatt San Diego | San Diego | 1,628 | 37.6 | 26.2 | — | — | — | — | 63.8 |
28 | The Alida, Savannah, a Tribute Portfolio Hotel | Other Domestic | 173 | 1.6 | 3.9 | — | — | — | — | 5.5 |
29 | The Logan Philadelphia, Curio Collection by Hilton | Philadelphia | 391 | 8.6 | 7.4 | — | — | — | — | 16.0 |
30 | San Francisco Marriott Marquis | San Francisco/San Jose | 1,500 | 11.9 | 23.4 | — | — | — | — | 35.3 |
31 | New York Marriott Downtown | New York | 515 | 12.0 | 4.7 | — | — | — | — | 16.7 |
32 | The Westin Chicago River North | Chicago | 445 | 6.3 | 5.6 | — | — | — | — | 11.9 |
33 | Marina del Rey Marriott | Los Angeles/Orange County | 370 | 6.7 | 4.7 | — | — | — | — | 11.4 |
34 | The Singer Oceanfront Resort, Curio Collection by Hilton | Other Domestic | 223 | 3.1 | 4.5 | — | — | — | — | 7.6 |
35 | Boston Marriott Copley Place | Boston | 1,145 | 27.8 | 15.4 | — | — | — | — | 43.2 |
36 | Grand Hyatt Washington | Washington, D.C. (CBD) | 902 | 9.5 | 21.9 | — | — | — | — | 31.4 |
37 | Hotel Van Zandt | Austin | 319 | (3.8) | 8.1 | 3.9 | — | — | — | 8.2 |
38 | The Westin Georgetown, Washington D.C. | Washington, D.C. (CBD) | 269 | 2.3 | 5.0 | — | — | — | — | 7.3 |
39 | Miami Marriott Biscayne Bay | Miami | 605 | 12.8 | 9.2 | — | — | — | — | 22.0 |
40 | The Westin South Coast Plaza, Costa Mesa | Los Angeles/Orange County | 393 | 2.5 | 2.8 | — | — | — | — | 5.3 |
Total Top 40 | 23,649 | 751.9 | 597.0 | 3.9 | — | — | — | 1,352.8 | ||
Remaining 39 Hotels | 18,829 | 201.4 | 188.7 | — | — | — | — | 390.1 | ||
Other Property Level (2) | 2.1 | — | — | — | — | — | 2.1 | |||
Gain on sale of property, sold property operations and corporate level income/expense | (179.9) | 9.4 | 230.7 | 42.3 | (143.0) | 26.0 | (14.5) | |||
Total | 42,478 | $775.5 | $795.1 | $234.6 | $42.3 | $(143.0) | $26.0 | $1,730.5 | ||
(1)Certain items from our statement of operations are not allocated to individual properties, including interest on our senior notes, corporate and other expenses, and the provision for income taxes. These items are reflected below in “gain on sale of property, sold
property operations and corporate level income/expense”. Refer to the table below for a reconciliation of net income (loss) to Hotel EBITDA. The total represents the Company's EBITDAre, as defined in the Notes to Supplemental Financial Information.
(2)Other property level includes certain ancillary revenues and related expenses, as well as non-income taxes on TRS leases.
(3)2025 Hotel EBITDA for The Don CeSar includes $24 million of business interruption proceeds collected in relation to Hurricanes Helene and Milton.
© Host Hotels & Resorts, Inc.18
Historical Comparable Hotel Results with 2026 Comparable Hotel Set
(unaudited, in millions, except hotel statistics)
Historical Comparable Hotel Metrics (1)
2026 Comparable Hotel Set (3) | |||||||||
Three Months Ended | Year Ended | ||||||||
March 31, 2025 | June 30, 2025 | September 30, 2025 | December 31, 2025 | December 31, 2025 | |||||
Number of hotels | 74 | 74 | 74 | 74 | 74 | ||||
Number of rooms | 40,954 | 40,954 | 40,954 | 40,954 | 40,954 | ||||
Comparable hotel RevPAR | $233.77 | $235.05 | $204.18 | $220.73 | $223.34 | ||||
Comparable hotel occupancy | 69.9% | 74.1% | 69.9% | 67.0% | 70.2% | ||||
Comparable hotel ADR | $334.24 | $317.39 | $292.11 | $329.67 | $318.14 | ||||
Historical Comparable Hotel Revenues (1)(2)
2026 Comparable Hotel Set (3) | |||||||||
Three Months Ended | Year Ended | ||||||||
March 31, 2025 | June 30, 2025 | September 30, 2025 | December 31, 2025 | December 31, 2025 | |||||
Total revenues | $1,594 | $1,586 | $1,331 | $1,603 | $6,114 | ||||
Less: Revenues from asset disposition | (117) | (99) | (79) | (93) | (388) | ||||
Less: Revenues from non- comparable hotels | (3) | (16) | (14) | (17) | (50) | ||||
Less: Revenues from condominium sales | — | — | — | (99) | (99) | ||||
Comparable hotel revenues | $1,474 | $1,471 | $1,238 | $1,394 | $5,577 | ||||
© Host Hotels & Resorts, Inc.19
Historical Comparable Hotel Results with 2026 Comparable Hotel Set (cont.)
(unaudited, in millions, except hotel statistics)
Historical Comparable Hotel EBITDA (1)(2)
2026 Comparable Hotel Set (3) | |||||||||
Three Months Ended | Year Ended | ||||||||
March 31, 2025 | June 30, 2025 | September 30, 2025 | December 31, 2025 | December 31, 2025 | |||||
Net income | $251 | $225 | $163 | $137 | $776 | ||||
Depreciation and amortization | 196 | 195 | 196 | 208 | 795 | ||||
Interest expense | 57 | 58 | 60 | 60 | 235 | ||||
Provision (benefit) for income taxes | (1) | 27 | 9 | 7 | 42 | ||||
Gain on sale of property and corporate level income/expense | 9 | (8) | (104) | 29 | (74) | ||||
Property transaction adjustments | (34) | (24) | (13) | (27) | (98) | ||||
Non-comparable hotel results, net | (6) | (13) | (9) | (5) | (33) | ||||
Condominium sales | — | 1 | 1 | (19) | (17) | ||||
Comparable hotel EBITDA | $472 | $461 | $303 | $390 | $1,626 | ||||
(1)Comparable hotel results represent adjustments for the following items: (i) to remove the results of operations of our hotels assumed to be sold or held-for-sale as of December 31, 2026, which
operations are included in our condensed consolidated statements of operations as continuing operations, (ii) to include the results for periods prior to our ownership for hotels acquired as of
December 31, 2025 and (iii) to remove the results of our non-comparable hotels.
(2)Comparable hotel revenues and comparable hotel EBITDA are non-GAAP financial measures within the meaning of the rules of the Securities and Exchange commission. See the Notes to
Supplemental Financial Information for discussion of these non-GAAP measures.
(3)Comparable hotel results include 74 hotels (of our 79 hotels owned at December 31, 2025) based on our forecast comparable hotel set as of December 31, 2026. No assurances can be made as to
the hotels that will be in the comparable hotel set for 2026. The following property that we own and that is not classified as held-for-sale, is expected to be non-comparable for full year 2026:
•The Don CeSar (business disruption due to Hurricane Helene resulting in closure of the hotel beginning at the end of September 2024, reopened in March 2025).
Additionally, revenues and costs, including marketing and administrative expenses of approximately $2 million in 2025, related to the development and sale of condominium units adjacent to the
Four Seasons Resort Orlando at Walt Disney World® Resort are excluded from our comparable hotel results.
© Host Hotels & Resorts, Inc.20
Comparable Hotel Results 2026 Forecast and Full Year 2025
(unaudited, in millions, except hotel statistics)
2026 Comparable Hotel Set | ||||
2026 Forecast(1) | 2025 | |||
Number of hotels | 74 | 74 | ||
Number of rooms | 40,954 | 40,954 | ||
Comparable hotel Total RevPAR | $384.59 | $372.75 | ||
Comparable hotel RevPAR | $229.49 | $223.34 | ||
Operating profit margin(5) | 14.3% | 14.0% | ||
Comparable hotel EBITDA margin(5) | 29.2% | 29.2% | ||
Food and beverage profit margin(5) | 33.4% | 32.1% | ||
Comparable hotel food and beverage profit margin(5) | 33.4% | 32.7% | ||
Net income | $865 | $776 | ||
Depreciation and amortization | 756 | 795 | ||
Interest expense | 242 | 235 | ||
Provision for income taxes | 42 | 42 | ||
Gain on sale of property and corporate level income/expense | (154) | (74) | ||
Property transaction adjustments⁽²⁾ | (12) | (98) | ||
Non-comparable hotel results, net⁽³⁾ | (34) | (33) | ||
Condominium sales ⁽⁴⁾ | (23) | (17) | ||
Comparable hotel EBITDA | $1,682 | $1,626 | ||
(1)See "Reconciliation of Net Income to EBITDA, EBITDAre and Adjusted EBITDAre and Diluted Earnings per Common Share to NAREIT and Adjusted Funds From Operations per Diluted Share for Full Year 2026
Forecasts" for other forecast assumptions. Forecast presented assumes the midpoint of our comparable hotel RevPAR guidance of 2.75% growth over 2025. Forecast comparable hotel results include 74
hotels (of our 79 hotels owned at December 31, 2025) that we have assumed will be classified as comparable as of December 31, 2026. See “Comparable Hotel Operating Statistics and Results” in the Notes
to Supplemental Financial Information. No assurances can be made as to the hotels that will be in the comparable hotel set for 2026.
(2)Property transaction adjustments represent the following items: (i) the elimination of results of operations of our hotels sold or held-for-sale as of the reporting date, which operations are included in our
unaudited condensed consolidated statements of operations as continuing operations, and (ii) the addition of results for periods prior to our ownership for hotels acquired as of the reporting date. Forecast
data also eliminates results of hotels assumed to be sold during the year.
(3)Non-comparable hotel results, net, includes the following items: (i) the results of operations of our non-comparable hotels, which operations are included in our consolidated statements of operations as
continuing operations, and (ii) gains on business interruption proceeds covering lost revenues while the property was considered non-comparable. The following property that we own and that is not
classified as held-for-sale, is expected to be non-comparable for full year 2026:
•The Don CeSar (business disruption due to Hurricane Helene resulting in closure of the hotel beginning at the end of September 2024, reopened in March 2025).
(4)Includes revenues and costs, including marketing and administrative expenses of approximately $6 million million and $2 million for the 2026 forecast and 2025, respectively, related to the development and
sale of condominium units adjacent to the Four Seasons Resort Orlando at Walt Disney World® Resort.
(5)Profit margins are calculated by dividing the applicable operating profit by the related revenue amount. GAAP profit margins are calculated using amounts presented in the unaudited condensed
consolidated statements of operations. Comparable hotel margins are calculated using amounts presented in the following tables, which include reconciliations to the applicable GAAP results:
© Host Hotels & Resorts, Inc.21
Comparable Hotel Results 2026 Forecast and Full Year 2025 (cont.)
(unaudited, in millions)
Forecast Year ended December 31, 2026 | Year ended December 31, 2025 | ||||||||||||||||||||||||
Adjustments | Adjustments | ||||||||||||||||||||||||
GAAP Results | Property Transaction Adjustment | Non-comparable hotel results, net | Condominium sales | Depreciation and corporate level items | Comparable hotel Results | GAAP Results | Property transaction adjustments | Non-comparable hotel results, net | Condominium sales | Depreciation and corporate level items | Comparable hotel Results | ||||||||||||||
Revenues | |||||||||||||||||||||||||
Room | $3,502 | $(28) | $(38) | $— | $— | $3,436 | $3,608 | $(241) | $(25) | $— | $— | $3,342 | |||||||||||||
Food and beverage | 1,801 | (14) | (27) | — | — | 1,760 | 1,803 | (101) | (16) | — | — | 1,686 | |||||||||||||
Other | 774 | (7) | (14) | (191) | — | 562 | 703 | (46) | (9) | (99) | — | 549 | |||||||||||||
Total revenues | 6,077 | (49) | (79) | (191) | — | 5,758 | 6,114 | (388) | (50) | (99) | — | 5,577 | |||||||||||||
Expenses | |||||||||||||||||||||||||
Room | 888 | (6) | (7) | — | — | 875 | 906 | (52) | (6) | — | — | 848 | |||||||||||||
Food and beverage | 1,200 | (10) | (18) | — | — | 1,172 | 1,224 | (78) | (11) | — | — | 1,135 | |||||||||||||
Other | 2,083 | (21) | (27) | (6) | — | 2,029 | 2,154 | (160) | (24) | (2) | — | 1,968 | |||||||||||||
Depreciation and amortization | 756 | — | — | — | (756) | — | 795 | — | — | — | (795) | — | |||||||||||||
Cost of goods sold | 162 | — | — | (162) | — | — | 80 | — | — | (80) | — | — | |||||||||||||
Corporate and other expenses | 126 | — | — | — | (126) | — | 124 | — | — | — | (124) | — | |||||||||||||
Net gain on insurance settlements | (7) | — | 7 | — | — | — | (24) | — | 24 | — | — | — | |||||||||||||
Total expenses | 5,208 | (37) | (45) | (168) | (882) | 4,076 | 5,259 | (290) | (17) | (82) | (919) | 3,951 | |||||||||||||
Operating Profit - Comparable hotel EBITDA | $869 | $(12) | $(34) | $(23) | $882 | $1,682 | $855 | $(98) | $(33) | $(17) | $919 | $1,626 | |||||||||||||
Comparable hotel results includes the results of our properties in Maui. The following table reconciles net income to Hotel EBITDA based on the expected 2026 results of these properties
(in millions); any changes to net income would be equal to the change in Hotel EBITDA:
Location | No. of Properties | Net Income (loss) | Plus: Depreciation | Equals: Hotel EBITDA | ||||
Maui | 3 | $56 | $64 | $120 |
Forecast non-comparable hotel results, net includes the results of The Don CeSar. The following table reconciles net income to Hotel EBITDA based on the expected 2026 results of the
property, excluding business interruption proceeds (in millions); any changes to net income would be equal to the change in Hotel EBITDA:
Hotel | Net Income (loss) | Plus: Depreciation | Equals: Hotel EBITDA | |||
The Don CeSar | $12 | $15 | $27 |
© Host Hotels & Resorts, Inc.22
Reconciliation of Net Income to EBITDA, EBITDAre and Adjusted EBITDAre and
Diluted Earnings per Common Share to NAREIT and Adjusted Funds From
Operations per Diluted Share for Full Year 2026 Forecasts(1)
(unaudited in millions, except per share amounts)
Full Year 2026 | ||
Mid-point | ||
Net income | $865 | |
Interest expense | 242 | |
Depreciation and amortization | 756 | |
Income taxes | 42 | |
EBITDA | 1,905 | |
Gain on dispositions | (200) | |
Equity investment adjustments: | ||
Equity in earnings of affiliates | (22) | |
Pro rata EBITDAre of equity investments | 62 | |
EBITDAre | 1,745 | |
Adjustments to EBITDAre: | ||
Non-cash stock-based compensation expense | 25 | |
Adjusted EBITDAre | $1,770 |
Full Year 2026 | ||
Mid-point | ||
Net income | $865 | |
Less: Net income attributable to non-controlling interests | (13) | |
Net income attributable to Host Inc. | 852 | |
Adjustments: | ||
Gain on dispositions | (200) | |
Depreciation and amortization | 754 | |
Equity investment adjustments: | ||
Equity in earnings of affiliates | (22) | |
Pro rata FFO of equity investments | 31 | |
Consolidated partnership adjustments: | ||
FFO adjustment for non-controlling partnerships | (1) | |
FFO adjustment for non-controlling interests of Host LP | (7) | |
NAREIT FFO | 1,407 | |
Adjustments to NAREIT FFO: | ||
Non-cash stock-based compensation expense | 25 | |
Adjusted FFO | $1,432 | |
Diluted weighted average shares outstanding - EPS, NAREIT FFO and Adjusted FFO | 691.7 | |
Diluted earnings per common share | $1.23 | |
NAREIT FFO per diluted share | $2.03 | |
Adjusted FFO per diluted share | $2.07 |
See assumptions that follow.
© Host Hotels & Resorts, Inc.23
Reconciliation of Net Income to EBITDA, EBITDAre and Adjusted EBITDAre and
Diluted Earnings per Common Share to NAREIT and Adjusted Funds From
Operations per Diluted Share for Full Year 2026 Forecasts (cont.)
(unaudited, in millions, except per share amounts)
(1)The Forecasts are based on the below assumptions:
•Comparable hotel RevPAR will increase at the midpoint of our guidance of 2.75% compared to 2025. This forecast assumes a continued recovery at our Maui
properties, however the timing of Maui's full recovery remains uncertain.
•Comparable hotel EBITDA margins will be approximately flat compared to 2025.
•We expect to spend approximately $525 million to $625 million on capital expenditures.
•Includes the dispositions of The. St. Regis Houston and the two Four Seasons properties in the first quarter of 2026, and assumes the disposition of Sheraton Parsippany
during the year. There can be no assurances that the sale will be completed. Assumes no acquisitions during the year.
•The Four Seasons sale is expected to generate an approximate $500 million capital gain on sale. If we are unable to find a suitable acquisition asset to consummate
a like-kind exchange, we would intend to distribute the capital gain to stockholders. This forecast makes no assumptions on the remaining proceeds, though we
will weigh potential cash uses which may include, subject to market conditions, acquisitions, other investments in our portfolio, common stock repurchases or
increased dividends, which dividends could be in excess of taxable income. Any special dividend will be subject to approval by Host Inc.’s Board of Directors.
•Assumes an approximate $20 million to $25 million contribution to net income and Adjusted EBITDAre from the sale of condominium units.
•Includes $7 million of gain from business interruption proceeds related to hurricane claims already received in 2026, but assumes no further business interruption
proceeds during the year.
For a discussion of items that may affect forecast results, see the Notes to Supplemental Financial Information.
© Host Hotels & Resorts, Inc.24
Ground Lease Summary as of December 31, 2025
As of December 31, 2025 | ||||||
No. of rooms | Lessor Institution Type | Minimum rent | Current expiration | Expiration after all potential options (1) | ||
1 | Boston Marriott Copley Place | 1,145 | Public | N/A (2) | 12/31/2123 | 12/31/2123 |
2 | Coronado Island Marriott Resort & Spa | 300 | Public | 1,565,770 | 10/31/2062 | 10/31/2078 |
3 | Denver Marriott West | 305 | Private | 160,000 | 12/28/2028 | 12/28/2058 |
4 | Houston Airport Marriott at George Bush Intercontinental | 573 | Public | 1,560,000 | 10/31/2053 | 10/31/2053 |
5 | Houston Marriott Medical Center/Museum District | 398 | Non-Profit | 160,000 | 12/28/2029 | 12/28/2059 |
6 | Manchester Grand Hyatt San Diego | 1,628 | Public | 6,600,000 | 5/31/2067 | 5/31/2083 |
7 | Marina del Rey Marriott | 370 | Public | 2,082,082 | 3/31/2043 | 3/31/2043 |
8 | Marriott Downtown at CF Toronto Eaton Centre | 461 | Non-Profit | 364,300 | 9/20/2082 | 9/20/2082 |
9 | Marriott Marquis San Diego Marina | 1,366 | Public | 7,650,541 | 11/30/2061 | 11/30/2083 |
10 | Newark Liberty International Airport Marriott | 591 | Public | 2,676,119 | 12/31/2055 | 12/31/2055 |
11 | Philadelphia Airport Marriott | 419 | Public | 1,509,994 | 6/29/2045 | 6/29/2045 |
12 | San Antonio Marriott Rivercenter | 1,000 | Private | 700,000 | 12/31/2033 | 12/31/2063 |
13 | San Francisco Marriott Marquis | 1,500 | Public | 1,500,000 | 8/25/2046 | 8/25/2076 |
14 | Santa Clara Marriott | 766 | Private | 100,025 | 11/30/2028 | 11/30/2058 |
15 | Tampa Airport Marriott | 298 | Public | 1,545,291 | 12/31/2043 | 12/31/2043 |
16 | The Ritz-Carlton, Marina del Rey | 304 | Public | 2,078,916 | 7/29/2067 | 7/29/2067 |
17 | The Ritz-Carlton, Tysons Corner | 398 | Private | 1,043,459 | 6/30/2112 | 6/30/2112 |
18 | The Westin South Coast Plaza, Costa Mesa | 393 | Private | 625,000 | 9/30/2059 | 9/30/2059 |
Weighted average remaining lease term (assuming all extension options) | 47 years | |||||
Percentage of leases (based on room count) with Public/Private/Non-Profit lessors | 70% / 23% / 7% | |||||
(1)Exercise of Host’s option to extend is subject to certain conditions, including the existence of no defaults and subject to any applicable rent escalation or rent re-negotiation provisions.
(2)The lease was amended in 2024 resulting in extension of the term and an upfront payment for the extension. No further rental payments are required for the remainder of the lease term.

OVERVIEW |
PROPERTY LEVEL DATA AND CORPORATE MEASURES |
CAPITALIZATION |
FINANCIAL COVENANTS |
NOTES TO SUPPLEMENTAL FINANCIAL INFORMATION |
SAN FRANCISCO MARRIOTT MARQUIS
© Host Hotels & Resorts, Inc.26
Comparative Capitalization
(in millions, except security pricing and per share amounts)
As of | As of | As of | As of | As of | |||||
December 31, | September 30, | June 30, | March 31, | December 31, | |||||
Shares/Units | 2025 | 2025 | 2025 | 2025 | 2024 | ||||
Common shares outstanding | 687.8 | 687.7 | 687.5 | 693.7 | 699.1 | ||||
Common shares outstanding assuming conversion of OP Units (1) | 697.4 | 696.4 | 696.4 | 703.0 | 708.5 | ||||
Preferred OP Units outstanding | 0.01 | 0.01 | 0.01 | 0.01 | 0.01 | ||||
Security pricing | |||||||||
Common stock at end of quarter (2) | $17.73 | $17.02 | $15.36 | $14.21 | $17.52 | ||||
High during quarter | 18.64 | 17.68 | 16.07 | 17.45 | 19.07 | ||||
Low during quarter | 15.82 | 15.27 | 12.70 | 14.21 | 17.24 | ||||
Capitalization | |||||||||
Market value of common equity (3) | $12,365 | $11,853 | $10,697 | $9,990 | $12,413 | ||||
Consolidated debt | 5,077 | 5,079 | 5,077 | 5,085 | 5,083 | ||||
Less: Cash | (768) | (539) | (490) | (428) | (554) | ||||
Consolidated total capitalization | 16,674 | 16,393 | 15,284 | 14,647 | 16,942 | ||||
Plus: Share of debt in unconsolidated investments | 329 | 312 | 284 | 282 | 240 | ||||
Pro rata total capitalization | $17,003 | $16,705 | 15,568 | 14,929 | 17,182 | ||||
Quarter ended | Quarter ended | Quarter ended | Quarter ended | Quarter ended | |||||
December 31, | September 30, | June 30, | March 31, | December 31, | |||||
2025 | 2025 | 2025 | 2025 | 2024 | |||||
Dividends declared per common share | $0.35 | $0.20 | $0.20 | $0.20 | $0.30 |
(1)Each OP Unit is redeemable for cash or, at our option, for 1.021494 common shares of Host Inc. At December 31, 2025, September 30, 2025, June 30, 2025, March 31, 2025, and December 31, 2024,
there were 9.4 million, 8.6 million, 8.7 million, 9.2 million, and 9.2 million in common OP Units, respectively, held by non-controlling interests.
(2)Share prices are the closing price as reported by the NASDAQ.
(3)Market value of common equity is calculated as the number of common shares outstanding including assumption of conversion of OP units multiplied the closing share price on that day.
© Host Hotels & Resorts, Inc.27
Consolidated Debt Summary
(in millions)
Debt | |||||||
Senior debt | Rate | Maturity date | December 31, 2025 | December 31, 2024 | |||
Series E | 4% | 6/2025 | $— | $500 | |||
Series F | 4 ½% | 2/2026 | — | 399 | |||
Series H | 3 ⅜% | 12/2029 | 645 | 644 | |||
Series I | 3 ½% | 9/2030 | 741 | 740 | |||
Series J | 2.9% | 12/2031 | 443 | 442 | |||
Series K | 5.7% | 7/2034 | 586 | 585 | |||
Series L | 5.5% | 4/2035 | 685 | 683 | |||
Series M | 5.7% | 6/2032 | 491 | — | |||
Series N | 4.25% | 12/2028 | 395 | — | |||
2027 Credit facility term loan | 4.6% | 1/2027 | 500 | 499 | |||
2028 Credit facility term loan | 4.6% | 1/2028 | 499 | 499 | |||
Credit facility revolver(1) | —% | 1/2027 | (3) | (6) | |||
4,982 | 4,985 | ||||||
Mortgage and other debt | |||||||
Mortgage and other debt | 4.67% | 11/2027 | 95 | 98 | |||
Total debt(2)(3) | $5,077 | $5,083 | |||||
Percentage of fixed rate debt | 80% | 80% | |||||
Weighted average interest rate | 4.8% | 4.7% | |||||
Weighted average debt maturity | 5.1years | 5.2years | |||||
Credit Facility | |||||||
Total capacity | $1,500 | ||||||
Available capacity | 1,500 | ||||||
Consolidated assets encumbered by mortgage debt | 1 |
(1)There are no outstanding credit facility revolver borrowings at December 31, 2025 and 2024. Amount shown represents deferred financing costs related to the credit facility revolver.
(2)In accordance with GAAP, total debt includes the debt of entities that we consolidate, but of which we do not own 100%, and excludes the debt of entities that we do not consolidate, but of
which we have a non-controlling ownership interest and record our investment therein under the equity method of accounting. As of December 31, 2025, our share of debt in unconsolidated
investments is $329 million and none of our debt is attributable to non-controlling interests.
(3)Total debt as of December 31, 2025 and December 31, 2024, includes net discounts and deferred financing costs of $67 million and $63 million, respectively.
© Host Hotels & Resorts, Inc.28
Consolidated Debt Maturity as of December 31, 2025
(in millions)
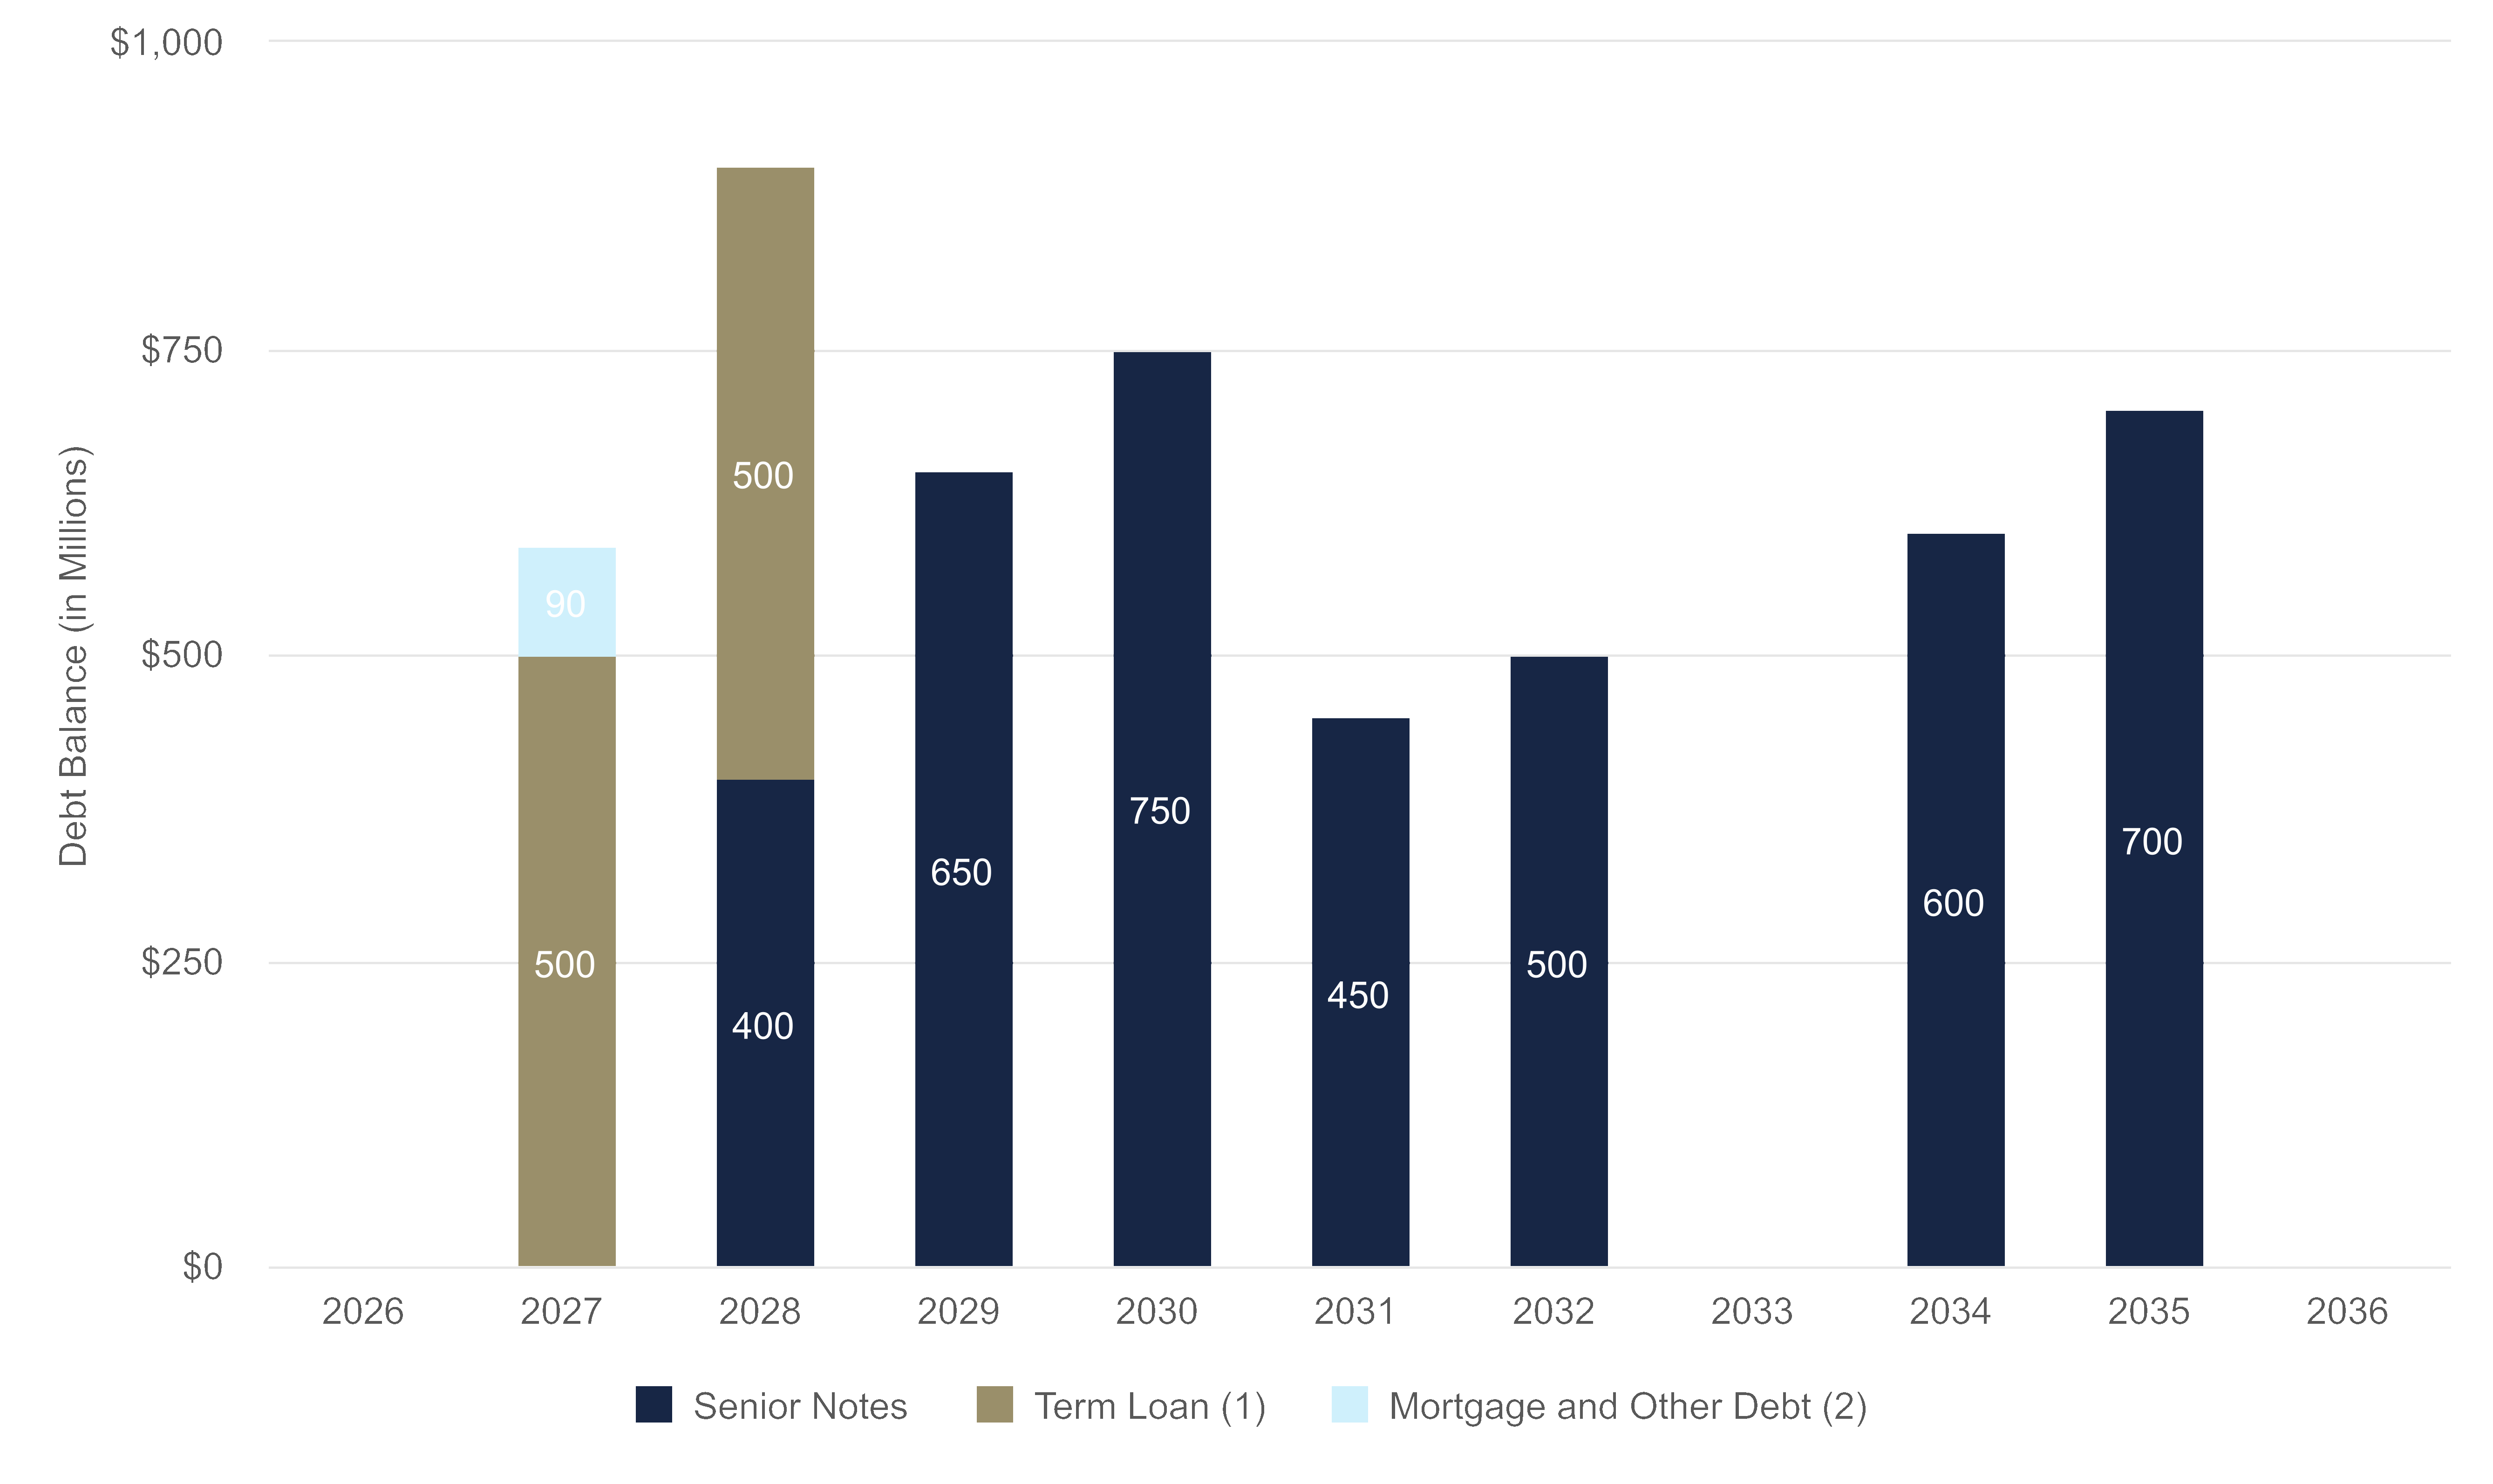
(1)The first term loan that is due in 2027 has an extension option that would extend maturity of the instrument to 2028, subject to meeting certain conditions, including payment of a fee. The
second term loan tranche that is due in 2028 does not have an extension option.
(2)Mortgage and other debt excludes principal amortization of $2 million each year from 2026-2027 for the mortgage loan that matures in 2027.
© Host Hotels & Resorts, Inc.29
Property Transactions
The following table reconciles net income to Hotel EBITDA and Hotel Net Operating Income for the dispositions through February 18, 2026 (in millions,
except for room count and multiples):
No. of Rooms | Price | Hotel Net Income(4) | Plus: Depreciation | Equals: Hotel EBITDA | Renewal & Replacement funding | Hotel Net Operating Income | Net income Cap Rate(7) | Cap Rate(5) | Net income multiple(7) | EBITDA multiple(6) | |
Four Seasons Resort Orlando at Walt Disney World® Resort and Four Seasons Resort and Residences Jackson Hole | 569 | $1,100 | $42.4 | $37.5 | $79.9 | $(13.6) | $66.3 | 3.9% | 5.9% | 26x | 14.9x |
St. Regis Houston | 232 | $51 | $1.7 | $2.3 | $4.0 | $(1.1) | $2.9 | 3.3% | 3.1% | 30x | 25.0x |
The following table presents net income and Hotel EBITDA multiples and Cap rates for the 2018-2026 acquisitions and dispositions (in millions, except for
room count and multiples):
No. of Rooms | Price | Net income Cap Rate(7) | Cap Rate(5) | Net income multiple(7) | EBITDA multiple(6) | |
2018-2026 Dispositions(1) | 20,761 | $6,391 | 3.5% | 5.1% | 29x | 16.7x |
2018-2026 Acquisitions(2)(3) | 5,273 | $4,909 | 4.3% | 6.4% | 23x | 13.6x |
The following table reconciles net income to Hotel EBITDA and Hotel Net Operating Income for the 2018-2026 acquisitions and dispositions (in
millions):
Hotel Net Income(4) | Plus: Depreciation | Plus: Interest expense | Plus: Income Tax | Equals: Hotel EBITDA | Renewal & Replacement funding | Hotel Net Operating Income | |
2018-2026 Dispositions(1) | $222.5 | $216.1 | $10.4 | $2.3 | $451.3 | $(85.3) | $366.0 |
2018-2026 Acquisitions(2)(3) | $211.4 | $145.3 | $4.7 | $— | $361.4 | $(44.2) | $317.2 |
(1)2018-2026 dispositions include the sale of 35 properties since January 1, 2018, through February 18, 2026, as well as the sale of the European Joint Venture and the New York Marriott Marquis retail, theater and signage commercial
condominium units. European Joint Venture balances included in this total represent our approximate 33% previous ownership interest, except for the number of rooms of 4,335, which represents the total room count of the
European Joint Venture properties. Disposition multiples are calculated as the ratio between the sales price (plus estimated avoided capital expenditures over the five years following the disposition dates) and EBITDA on a TTM basis
from the disposition date, except for 2020 – 2022 dispositions which use 2019 full year results as the TTM are not representative of normalized operations.
(2)2018-2026 acquisitions include 16 properties and two Ka'anapali golf courses since January 1, 2018 through February 18, 2026. Acquisition multiples are based on forecast operations in the year of acquisition or, for hotels acquired in
2021, 2019 operations, with the following exceptions: Baker's Cay Resort Key Largo (2021 acquisition), based on 2021 forecast operations at acquisition, as the property was under renovation and closed for part of 2019; The Laura
Hotel (2021 acquisition), based on estimated normalized results at acquisition that assume results are in-line with the 2019 results of comparable Houston properties, as the property was re-opened with a new manager and brand
when acquired in 2021; Alila Ventana Big Sur (2021 acquisition), based on 2021 forecast operations at acquisition as the property was under renovation for part of 2019; The Alida, Savannah (2021 acquisition), which adjusts 2019
results for construction disruption to the surrounding Plant Riverside District and for initial ramp-up of hotel operations. The other seven properties and Ka’anapali golf courses use full year 2019 results. Due to the impact of
COVID-19, actual results in 2020 and 2021 are not reflective of normal operations of the hotels. Any forecast incremental increases to net income compared to net income at underwriting would be equal to the incremental increases
in Hotel EBITDA. Some operating results are based on actual results from the manager for periods prior to our ownership. Since the operations include periods prior to our ownership, the results may not necessarily correspond to our
actual results.
(3)The purchase price used to calculate the acquisition multiples is net of $50 million for the 49-acre land parcel entitled for development and net of key money, both related to The Ritz-Carlton O'ahu, Turtle Bay acquisition.
(4)Certain items from our statement of operations are not allocated to individual properties, including interest on our senior notes, corporate and other expenses, and the benefit (provision) for income taxes.
(5)The cap rate is calculated as the ratio between net operating income (NOI) and the sales price (plus avoided capital expenditures in excess of escrow funding for dispositions). Avoided capital expenditures for 2018-2026 sales, the
Four Seasons Resort Orlando at Walt Disney World® Resort and Four Seasons Resort and Residences Jackson Hole and the St. Regis Houston sale represent $767 million, $16 million and $44 million, respectively of estimated capital
expenditure spend requirements for the properties in excess of escrow funding over the next 5 years.
(6)The EBITDA multiple is calculated as the ratio between the sales price (plus avoided capital expenditures including escrow funding for dispositions) and Hotel EBITDA. Avoided capital expenditures for 2018-2026 sales, the Four
Seasons Resort Orlando at Walt Disney World® Resort and Four Seasons Resort and Residences Jackson Hole and the St. Regis Houston sale represent $1,167 million, $88 million and $49 million, respectively, of estimated capital
expenditure spend requirements for the properties including escrow funding over the next five years.
(7)Net income cap rate is calculated as the ratio between net income and the sales price. Net income multiple is calculated as the ratio between the sales price and Hotel net income. The reconciliations from net income to Hotel EBITDA
and NOI appear above.

OVERVIEW |
PROPERTY LEVEL DATA AND CORPORATE MEASURES |
CAPITALIZATION |
FINANCIAL COVENANTS |
NOTES TO SUPPLEMENTAL FINANCIAL INFORMATION |
1 HOTEL SOUTH BEACH
© Host Hotels & Resorts, Inc.31
Financial Covenants: Credit Facility and Senior Notes Financial Performance Tests
(unaudited, in millions, except ratios)
On January 4, 2023, we amended our Credit Facility agreement. The covenant requirements are consistent with previous amendment covenant levels:
Leverage Ratio | Maximum 7.25x |
Fixed Charge Coverage Ratio | Minimum 1.25x |
Unsecured Interest Coverage Ratio | Minimum 1.75x (1) |
Covenant ratios are calculated using Host’s credit facility and senior notes definitions. See the subsequent pages for a reconciliation of the equivalent GAAP
measure. The GAAP ratio is not relevant for the purpose of the financial covenants.
The following tables present the financial performance tests for our credit facility and senior notes as of:
December 31, 2025 | |||
Credit Facility Financial Performance Tests | Permitted | GAAP Ratio | Covenant Ratio |
Leverage Ratio | Maximum 7.25x | 6.5x | 2.6x |
Unsecured Interest Coverage Ratio | Minimum 1.75x(1) | 3.3x | 7.2x |
Consolidated Fixed Charge Coverage Ratio | Minimum 1.25x | 3.3x | 5.6x |
December 31, 2025 | |||
Bond Compliance Financial Performance Tests | Permitted | GAAP Ratio | Covenant Ratio |
Indebtedness Test | Maximum 65% | 39% | 22% |
Secured Indebtedness Test | Maximum 40% | <1% | <1% |
EBITDA-to-interest Coverage ratio (2) | Minimum 1.5x | 3.3x | 7.1x |
Ratio of Unencumbered Assets to Unsecured Indebtedness | Minimum 150% | 257% | 450% |
(1)If the leverage ratio is greater than 7.0x, then the unsecured interest coverage ratio minimum will decrease to 1.50x.
(2)The GAAP ratio is based on net income, while the covenant ratio is based on EBITDA. See subsequent pages for a reconciliation of net income to EBITDA.
© Host Hotels & Resorts, Inc.32
Financial Covenants: Reconciliation of GAAP Leverage Ratio to Credit Facility Leverage Ratio
(unaudited, in millions, except ratios)
The following tables present the calculation of our leverage ratio using GAAP measures and as used in the financial covenants of the credit facility.
GAAP Leverage Ratio | ||
Year ended | ||
December 31, 2025 | ||
Debt | $5,077 | |
Net income | 776 | |
GAAP Leverage Ratio | 6.5x |
Leverage Ratio per Credit Facility | ||
Year ended | ||
December 31, 2025 | ||
Net debt (1) | $4,410 | |
Adjusted Credit Facility EBITDA (2) | 1,729 | |
Leverage Ratio | 2.6x |
(1)The following presents the reconciliation of debt to net debt per our credit facility definition:
December 31, 2025 | ||
Debt | $5,077 | |
Less: Unrestricted cash over $100 million | (667) | |
Net debt per credit facility definition | $4,410 |
(2)The following presents the reconciliation of net income to EBITDA, EBITDAre, Adjusted EBITDAre, and Adjusted EBITDA per our credit facility definition in
determining leverage ratio:
Year ended | ||
December 31, 2025 | ||
Net income | $776 | |
Interest expense | 235 | |
Depreciation and amortization | 787 | |
Income taxes | 42 | |
EBITDA | 1,840 | |
Gain on dispositions | (143) | |
Non-cash impairment expense | 8 | |
Equity in earnings of affiliates | (18) | |
Pro rata EBITDAre of equity investments | 44 | |
EBITDAre | 1,731 | |
Non-cash stock-based compensation expense | 26 | |
Adjusted EBITDAre | 1,757 | |
Pro forma EBITDA - Dispositions | (8) | |
Non-cash partnership adjustments | (20) | |
Adjusted Credit Facility EBITDA | $1,729 |
© Host Hotels & Resorts, Inc.33
Financial Covenants: Reconciliation of GAAP Interest Coverage Ratio to Credit
Facility Unsecured Interest Coverage Ratio
(unaudited, in millions, except ratios)
The following tables present the calculation of our unsecured interest coverage ratio using GAAP measures and as used in the financial covenants of the credit facility:
Unsecured Interest Coverage per Credit Facility Ratio | |
Year ended | |
December 31, 2025 | |
Unencumbered consolidated EBITDA per credit facility definition (1) | $1,720 |
Adjusted Credit Facility unsecured interest expense (2) | 239 |
Unsecured Interest Coverage Ratio | 7.2x |
GAAP Interest Coverage Ratio | |
Year ended | |
December 31, 2025 | |
Net income | $776 |
Interest expense | 235 |
GAAP Interest Coverage Ratio | 3.3x |
`
(1)The following reconciles Adjusted Credit Facility EBITDA to Unencumbered Consolidated EBITDA per our credit facility definition. See Reconciliation of GAAP
Leverage Ratio to Credit Facility Leverage Ratio for calculation and reconciliation of net income to Adjusted Credit Facility EBITDA:
Year ended | ||
December 31, 2025 | ||
Adjusted Credit Facility EBITDA | $1,729 | |
Less: Encumbered EBITDA | (8) | |
Corporate overhead allocated to encumbered assets | (1) | |
Unencumbered Consolidated EBITDA per credit facility definition | $1,720 |
(2)The following reconciles GAAP interest expense to unsecured interest expense per our credit facility definition:
Year ended | ||
December 31, 2025 | ||
GAAP Interest expense | $235 | |
Interest on secured debt | (4) | |
Deferred financing cost amortization | (7) | |
Capitalized interest | 16 | |
Pro forma interest adjustments | (1) | |
Adjusted Credit Facility Unsecured Interest Expense | $239 |
© Host Hotels & Resorts, Inc.34
Financial Covenants: Reconciliation of GAAP Interest Coverage Ratio to Credit
Facility Fixed Charge Coverage Ratio
(unaudited, in millions, except ratios)
The following tables present the calculation of our GAAP Interest coverage ratio and our fixed charge coverage ratio as used in the financial covenants of the
credit facility:
GAAP Fixed Charge Coverage Ratio | |
Year ended | |
December 31, 2025 | |
Net income | $776 |
Interest expense | 235 |
GAAP Fixed Charge Coverage Ratio | 3.3x |
Credit Facility Fixed Charge Coverage Ratio | |
Year ended | |
December 31, 2025 | |
Credit Facility Fixed Charge Coverage Ratio EBITDA (1) | $1,430 |
Fixed charges (2) | 257 |
Credit Facility Fixed Charge Coverage Ratio | 5.6x |
(1)The following reconciles Adjusted Credit Facility EBITDA to Credit Facility Fixed Charge Coverage Ratio EBITDA. See Reconciliation of GAAP Leverage Ratio to
Credit Facility Leverage Ratio for calculation and reconciliation of Adjusted Credit Facility EBITDA:
Year ended | ||
December 31, 2025 | ||
Adjusted Credit Facility EBITDA | $1,729 | |
Less: 5% of hotel property gross revenue | (298) | |
Less: 3% of revenues from other real estate | (1) | |
Credit Facility Fixed Charge Coverage Ratio EBITDA | $1,430 |
(2)The following table calculates the fixed charges per our credit facility definition. See Reconciliation of GAAP Interest Coverage Ratio to Credit Facility
Unsecured Interest Coverage Ratio for reconciliation of GAAP interest expense to adjusted unsecured interest expense per our credit facility definition:
Year ended | ||
December 31, 2025 | ||
Adjusted Credit Facility Unsecured Interest Expense | $239 | |
Interest on secured debt | 4 | |
Adjusted Credit Facility Interest Expense | 243 | |
Scheduled principal payments | 2 | |
Cash taxes on ordinary income | 12 | |
Fixed Charges | $257 |
© Host Hotels & Resorts, Inc.35
Financial Covenants: Reconciliation of GAAP Indebtedness Test to Senior Notes
Indenture Indebtedness Test
(unaudited, in millions, except ratios)
The following tables present the calculation of our total indebtedness to total assets using GAAP measures and as used in the financial covenants of our senior
notes indenture:
GAAP Total Indebtedness to Total Assets | ||
December 31, 2025 | ||
Debt | $5,077 | |
Total assets | 13,049 | |
GAAP Total Indebtedness to Total Assets | 39% |
Total Indebtedness to Total Assets per Senior Notes Indenture | ||
December 31, 2025 | ||
Adjusted indebtedness (1) | $5,107 | |
Adjusted total assets (2) | 23,094 | |
Total Indebtedness to Total Assets | 22% |
(1)The following reconciles our GAAP total indebtedness to our total indebtedness per our senior notes indenture:
December 31, 2025 | ||
Debt | $5,077 | |
Add: Deferred financing costs | 31 | |
Less: Mark-to-market on assumed mortgage | (1) | |
Adjusted Indebtedness per Senior Notes Indenture | $5,107 |
(2)The following presents the reconciliation of total assets to adjusted total assets per the financial covenants of our senior notes indenture definition:
December 31, 2025 | ||
Total assets | $13,049 | |
Add: Accumulated depreciation | 10,578 | |
Add: Prior impairment of assets held | 19 | |
Add: Inventory impairment at unconsolidated investment | 13 | |
Less: Intangibles | (5) | |
Less: Right-of-use assets | (560) | |
Adjusted Total Assets per Senior Notes Indenture | $23,094 |
© Host Hotels & Resorts, Inc.36
Financial Covenants: Reconciliation of GAAP Secured Indebtedness Test to
Senior Notes Indenture Secured Indebtedness Test
(unaudited, in millions, except ratios)
The following table presents the calculation of our secured indebtedness using GAAP measures and as used in the financial covenants of our senior notes
indenture:
GAAP Secured Indebtedness | ||
December 31, 2025 | ||
Mortgage and other secured debt | $95 | |
Total assets | 13,049 | |
GAAP Secured Indebtedness to Total Assets | <1% |
Secured Indebtedness per Senior Notes Indenture | ||
December 31, 2025 | ||
Secured indebtedness (1) | $94 | |
Adjusted total assets (2) | 23,094 | |
Secured Indebtedness to Total Assets | <1% |
(1)The following presents the reconciliation of mortgage debt to secured indebtedness per the financial covenants of our senior notes indenture definition:
December 31, 2025 | ||
Mortgage and other secured debt | $95 | |
Less: Mark-to-market on assumed mortgage | (1) | |
Secured Indebtedness | $94 |
(2)See Reconciliation of GAAP Indebtedness Test to Senior Notes Indenture Indebtedness Test for reconciliation of GAAP Total Assets to Adjusted Total Assets per
our senior notes indenture.
© Host Hotels & Resorts, Inc.37
Financial Covenants: Reconciliation of GAAP Interest Coverage Ratio to Senior
Notes Indenture EBITDA-to-Interest Coverage Ratio
(unaudited, in millions, except ratios)
The following tables present the calculation of our interest coverage ratio using our GAAP measures and as used in the financial covenants of the senior notes
indenture:
GAAP Interest Coverage Ratio | ||
Year ended | ||
December 31, 2025 | ||
Net income | $776 | |
Interest expense | 235 | |
GAAP Interest Coverage Ratio | 3.3x |
EBITDA to Interest Coverage Ratio | ||
Year ended | ||
December 31, 2025 | ||
Adjusted Credit Facility EBITDA (1) | $1,729 | |
Non-controlling interest adjustment | 2 | |
Adjusted Senior Notes EBITDA | 1,731 | |
Adjusted Credit Facility Interest Expense (2) | 243 | |
Plus: Premium amortization on assumed mortgage | 1 | |
Adjusted Senior Notes Interest Expense | $244 | |
EBITDA to Interest Coverage Ratio | 7.1x |
(1)See Reconciliation of GAAP Leverage Ratio to Credit Facility Leverage Ratio for the calculation of Adjusted Credit Facility EBITDA and reconciliation to net
income.
(2)See Reconciliation of GAAP Interest Coverage Ratio to Credit Facility Fixed Charge Coverage Ratio for the calculation of Adjusted Credit Facility interest
expense and reconciliation to GAAP interest expense.
© Host Hotels & Resorts, Inc.38
Financial Covenants: Reconciliation of GAAP Assets to Indebtedness Test to
Senior Notes Unencumbered Assets to Unsecured Indebtedness Test
(unaudited, in millions, except ratios)
The following tables present the calculation of our total assets to total debt using GAAP measures and unencumbered assets to unsecured debt as used in the
financial covenants of our senior notes indenture:
GAAP Assets / Debt | ||
December 31, 2025 | ||
Total assets | $13,049 | |
Total debt | 5,077 | |
GAAP Total Assets / Total Debt | 257% |
Unencumbered Assets / Unsecured Debt per Senior Notes Indenture | ||
December 31, 2025 | ||
Unencumbered Assets (1) | $22,565 | |
Unsecured Debt (2) | 5,013 | |
Unencumbered Assets / Unsecured Debt | 450% |
(1)The following presents the reconciliation of adjusted total assets to unencumbered assets per the financial covenants of our senior notes indenture definition:
December 31, 2025 | ||
Adjusted total assets (a) | $23,094 | |
Less: Partnership adjustments | (259) | |
Less: Inventory impairment at unconsolidated investment | (13) | |
Less: Encumbered Assets | (257) | |
Unencumbered Assets | $22,565 |
(a)See reconciliation of GAAP Indebtedness Test to Senior Notes Indenture Indebtedness Test for reconciliation of GAAP Total Assets to Adjusted Total Assets per
our senior notes indenture.
(2)The following presents the reconciliation of total debt to unsecured debt per the financial covenants of our senior notes indenture definition:
December 31, 2025 | ||
Adjusted indebtedness (b) | $5,107 | |
Less: Secured indebtedness (c) | (94) | |
Unsecured Debt | $5,013 |
(b)See reconciliation of GAAP Indebtedness Test to Senior Notes Indenture Indebtedness Test for reconciliation of GAAP Total Debt to Adjusted Indebtedness per
our senior notes indenture.
(c)See reconciliation of GAAP Secured Indebtedness Test to Senior Notes Indenture Secured Indebtedness Test for the reconciliation of mortgage and other
secured debt to senior notes secured indebtedness.

OVERVIEW |
PROPERTY LEVEL DATA AND CORPORATE MEASURES |
CAPITALIZATION |
FINANCIAL COVENANTS |
NOTES TO SUPPLEMENTAL FINANCIAL INFORMATION |
GRAND HYATT WASHINGTON
© Host Hotels & Resorts, Inc.40
NOTES TO SUPPLEMENTAL FINANCIAL INFORMATION
FORECASTS
Our forecast of net income, earnings per diluted share, NAREIT and Adjusted FFO per diluted share, EBITDA, EBITDAre, Adjusted EBITDAre and comparable hotel
results are forward-looking statements and are not guarantees of future performance and involve known and unknown risks, uncertainties and other factors
which may cause actual results and performance to differ materially from those expressed or implied by these forecasts. Although we believe the expectations
reflected in the forecasts are based upon reasonable assumptions, we can give no assurance that the expectations will be attained or that the results will not be
materially different. Risks that may affect these assumptions and forecasts include the following: potential changes in overall economic outlook make it
inherently difficult to forecast the level of RevPAR, earnings and profitability; the amount and timing of debt payments may change significantly based on market
conditions, which will directly affect the level of interest expense and net income; the amount and timing of transactions involving shares of our common stock
may change based on market conditions; and other risks and uncertainties associated with our business described herein and in our annual report on Form 10-K,
quarterly reports on Form 10-Q and current reports on Form 8-K filed with the SEC.
COMPARABLE HOTEL OPERATING STATISTICS AND RESULTS
To facilitate a year-to-year comparison of our operations, we present certain operating statistics (i.e., Total RevPAR, RevPAR, average daily rate and average
occupancy) and operating results (revenues, expenses, hotel EBITDA and associated margins) for the periods included in our reports on a comparable hotel basis
in order to enable our investors to better evaluate our operating performance. We define our comparable hotels as those that: (i) are owned or leased by us as of
the reporting date and are not classified as held-for-sale; and (ii) have not sustained substantial property damage or business interruption, or undergone large-
scale capital projects, in each case requiring closures lasting one month or longer (as further defined below), during the reporting periods being compared.
We make adjustments to include recent acquisitions to include results for periods prior to our ownership. For these hotels, since the year-over-year comparison
includes periods prior to our ownership, the changes will not necessarily correspond to changes in our actual results. Additionally, operating results of hotels that
we sell are excluded from the comparable hotel set once the transaction has closed or the hotel is classified as held-for-sale.
The hotel business is capital-intensive and renovations are a regular part of the business. Generally, hotels under renovation remain comparable hotels. A large-
scale capital project would cause a hotel to be excluded from our comparable hotel set if it requires the entire property to be closed to hotel guests for one
month or longer.
© Host Hotels & Resorts, Inc.41
NOTES TO SUPPLEMENTAL FINANCIAL INFORMATION
COMPARABLE HOTEL OPERATING STATISTICS AND RESULTS (continued)
Similarly, hotels are excluded from our comparable hotel set from the date that they sustain substantial property damage or business interruption if it requires
the property to be closed to hotel guests for one month or longer. In each case, these hotels are returned to the comparable hotel set when the operations of the
hotel have been included in our consolidated results for one full calendar year after the hotel has reopened. Often, related to events that cause property damage
and the closure of a hotel, we will collect business interruption insurance proceeds for the near-term loss of business. These proceeds are included in net gain on
insurance settlements on our condensed consolidated statements of operations. Business interruption insurance gains covering lost revenues while the property
was considered non-comparable also will be excluded from the comparable hotel results.
Of the 79 hotels that we owned as of December 31, 2025, 76 have been classified as comparable hotels. The operating results of the following properties that we
owned, and that were not classified as held-for-sale, as of December 31, 2025 are excluded from comparable hotel results for these periods:
•The Don CeSar (business disruption due to Hurricane Helene resulting in closure of the hotel beginning at the end of September 2024, reopened in
March 2025);
•Alila Ventana Big Sur (business disruption due to the collapse of a portion of Highway 1, causing closure of the hotel beginning in March 2024, reopened
in May 2024); and
•Operations related to the development and sale of condominium units on a development parcel adjacent to the Four Seasons Resort Orlando at Walt
Disney World® Resort.
At December 31, 2025, The St. Regis Houston was classified as held-for-sale. Therefore, the results of this hotel are also excluded from comparable hotel
operating statistics and results.
NON-GAAP FINANCIAL MEASURES
Included in this supplemental information are certain “non-GAAP financial measures,” which are measures of our historical or future financial performance that
are not calculated and presented in accordance with GAAP, within the meaning of applicable SEC rules. They are as follows: (i) FFO and FFO per diluted share
(both NAREIT and Adjusted), (ii) EBITDA, both at the hotel level and company-wide, (iii) EBITDAre and Adjusted EBITDAre, (iv) net operating income (NOI), (v)
Comparable Hotel Operating Statistics and Results, (vi) measures derived from EBITDA and NOI such as EBITDA multiples and capitalization rates, (vii) Credit
Facility Financial Performance Tests, and (viii) Senior Notes Financial Performance Tests. The following discussion defines these measures and presents why we
believe they are useful supplemental measures of our performance.
© Host Hotels & Resorts, Inc.42
NOTES TO SUPPLEMENTAL FINANCIAL INFORMATION
NON-GAAP FINANCIAL MEASURES (continued)
NAREIT FFO AND NAREIT FFO PER DILUTED SHARE
We present NAREIT FFO and NAREIT FFO per diluted share as non-GAAP measures of our performance in addition to our earnings per share (calculated in
accordance with GAAP). We calculate NAREIT FFO per diluted share as our NAREIT FFO (defined as set forth below) for a given operating period, as adjusted for
the effect of dilutive securities, divided by the number of fully diluted shares outstanding during such period, in accordance with NAREIT guidelines. As noted in
NAREIT’s Funds From Operations White Paper – 2018 Restatement, NAREIT defines FFO as net income (calculated in accordance with GAAP) excluding
depreciation and amortization related to certain real estate assets, gains and losses from the sale of certain real estate assets, gains and losses from change in
control, impairment expense of certain real estate assets and investments and adjustments for consolidated partially owned entities and unconsolidated
affiliates. Adjustments for consolidated partially owned entities and unconsolidated affiliates are calculated to reflect our pro rata share of the FFO of those
entities on the same basis.
We believe that NAREIT FFO per diluted share is a useful supplemental measure of our operating performance and that the presentation of NAREIT FFO per
diluted share, when combined with the primary GAAP presentation of diluted earnings per share, provides beneficial information to investors. By excluding the
effect of real estate depreciation, amortization, impairment expense and gains and losses from sales of depreciable real estate, all of which are based on
historical cost accounting and which may be of lesser significance in evaluating current performance, we believe that such measures can facilitate comparisons
of operating performance between periods and with other REITs, even though NAREIT FFO per diluted share does not represent an amount that accrues directly
to holders of our common stock. Historical cost accounting for real estate assets implicitly assumes that the value of real estate assets diminishes predictably
over time. As noted by NAREIT in its Funds From Operations White Paper – 2018 Restatement, the primary purpose for including FFO as a supplemental measure
of operating performance of a REIT is to address the artificial nature of historical cost depreciation and amortization of real estate and real estate-related assets
mandated by GAAP. For these reasons, NAREIT adopted the FFO metric in order to promote a uniform industry-wide measure of REIT operating performance.
ADJUSTED FFO PER DILUTED SHARE
We also present Adjusted FFO per diluted share when evaluating our performance because management believes that the exclusion of certain additional items
described below provides useful supplemental information to investors regarding our ongoing operating performance. Management historically has made the
adjustments detailed below in evaluating our performance, in our annual budget process and for our compensation programs. We believe that the presentation
of Adjusted FFO per diluted share, when combined with both the primary GAAP presentation of diluted earnings per share and FFO per diluted share as defined
by NAREIT, provides useful supplemental information that is beneficial to an investor’s understanding of our operating performance. We adjust NAREIT FFO per
diluted share for the following items, which may occur in any period, and refer to this measure as Adjusted FFO per diluted share:
•Gains and Losses on the Extinguishment of Debt – We exclude the effect of finance charges and premiums associated with the extinguishment of debt,
including the acceleration of the write-off of deferred financing costs from the original issuance of the debt being redeemed or retired and incremental
interest expense incurred during the refinancing period. We also exclude the gains on debt repurchases and the original issuance costs associated with
the retirement of preferred stock. We believe that these items are not reflective of our ongoing finance costs.
© Host Hotels & Resorts, Inc.43
NOTES TO SUPPLEMENTAL FINANCIAL INFORMATION
NON-GAAP FINANCIAL MEASURES (continued)
•Acquisition Costs – Under GAAP, costs associated with completed property acquisitions that are considered business combinations are expensed in the
year incurred. We exclude the effect of these costs because we believe they are not reflective of the ongoing performance of the Company.
•Litigation Gains and Losses – We exclude the effect of gains or losses associated with litigation recorded under GAAP that we consider to be outside the
ordinary course of business. We believe that including these items is not consistent with our ongoing operating performance.
•Severance Expense – In certain circumstances, we will add back hotel-level severance expenses when we do not believe that such expenses are
reflective of the ongoing operation of our properties. Situations that would result in a severance add-back include, but are not limited to, (i) costs
incurred as part of a broad- based reconfiguration of the operating model with the specific hotel operator for a portfolio of hotels and (ii) costs incurred
at a specific hotel due to a broad- based and significant reconfiguration of a hotel and/or its workforce. We do not add back corporate-level severance
costs or severance costs at an individual hotel that we consider to be incurred in the normal course of business.
•Non-Cash Stock-Based Compensation - We exclude the expense recorded for non-cash stock-based compensation, as it represents a non-cash
transaction and the add back is consistent with the calculation of Adjusted EBITDA for our financial covenant ratios under our credit facility and senior
notes indentures and consistent with the presentation of Adjusted FFO per diluted share for the majority of other lodging REIT filers.
In unusual circumstances, we also may adjust NAREIT FFO for gains or losses that management believes are not representative of the Company’s current
operating performance. For example, in 2017, as a result of the reduction of the U.S. federal corporate income tax rate from 35% to 21% by the Tax Cuts and Jobs
Act, we remeasured our domestic deferred tax assets as of December 31, 2017 and recorded a one-time adjustment to reduce our deferred tax assets and to
increase the provision for income taxes by approximately $11 million. We do not consider this adjustment to be reflective of our ongoing operating performance
and, therefore, we excluded this item from Adjusted FFO.
EBITDA AND NOI AND ASSOCIATED METRICS
Earnings before Interest Expense, Income Taxes, Depreciation and Amortization (“EBITDA”) is a commonly used measure of performance in many industries.
Management believes EBITDA provides useful information to investors regarding our results of operations because it helps us and our investors evaluate the
ongoing operating performance of our properties after removing the impact of the Company’s capital structure (primarily interest expense) and its asset base
(primarily depreciation and amortization). Management also believes the use of EBITDA facilitates comparisons between us and other lodging REITs, hotel
owners that are not REITs and other capital-intensive companies. Management uses EBITDA to evaluate property-level results and as one measure in
determining the value of acquisitions and dispositions and, like FFO and Adjusted FFO per diluted share, it is widely used by management in the annual budget
process and for our compensation programs. Management also uses EBITDA when calculating EBITDA multiples to evaluate acquisitions and dispositions.
EBITDA multiples are calculated as the sales price divided by hotel EBITDA. Management believes using EBITDA multiples allow for a consistent valuation
method in comparing the purchase or sale value of properties.
© Host Hotels & Resorts, Inc.44
NOTES TO SUPPLEMENTAL FINANCIAL INFORMATION
NON-GAAP FINANCIAL MEASURES (continued)
For a specific hotel, NOI is calculated as the hotel or entity level EBITDA less an estimate for the annual contractual reserve requirements for renewal and
replacement expenditures. Management uses NOI when calculating capitalization rates (“Cap Rates”) to evaluate acquisitions and dispositions. Cap rates are
calculated as hotel NOI divided by sales price. As with EBITDA multiples, management believes using Cap Rates allows for a consistent valuation method in
comparing the purchase or sale value of properties.
EBITDAre AND ADJUSTED EBITDAre
We present EBITDAre in accordance with NAREIT guidelines, as defined in its September 2017 white paper “Earnings Before Interest, Taxes, Depreciation and
Amortization for Real Estate,” to provide an additional performance measure to facilitate the evaluation and comparison of the Company’s results with other
REITs. NAREIT defines EBITDAre as net income (calculated in accordance with GAAP) excluding interest expense, income tax, depreciation and amortization,
gains or losses on disposition of depreciated property (including gains or losses on change of control), impairment expense for depreciated property and of
investments in unconsolidated affiliates caused by a decrease in value of depreciated property in the affiliate, and adjustments to reflect the entity’s pro rata
share of EBITDAre of unconsolidated affiliates.
We make additional adjustments to EBITDAre when evaluating our performance because we believe that the exclusion of certain additional items described
below provides useful supplemental information to investors regarding our ongoing operating performance. We believe that the presentation of Adjusted
EBITDAre, when combined with the primary GAAP presentation of net income, is beneficial to an investor’s understanding of our operating performance.
Adjusted EBITDAre also is similar to the measure used to calculate certain credit ratios for our credit facility and senior notes. We adjust EBITDAre for the
following items, which may occur in any period, and refer to this measure as Adjusted EBITDAre:
•Property Insurance Gains and Property Damage Losses – We exclude the effect of property insurance gains reflected in our condensed consolidated
statements of operations because we believe that including them in Adjusted EBITDAre is not consistent with reflecting the ongoing performance of our
assets. In addition, property insurance gains could be less important to investors given that the depreciated asset book value written off in connection
with the calculation of the property insurance gain often does not reflect the market value of real estate assets. Similarly, losses from property damage
or remediation costs that are not covered through insurance are excluded.
•Acquisition Costs – Under GAAP, costs associated with completed property acquisitions that are considered business combinations are expensed in the
year incurred. We exclude the effect of these costs because we believe they are not reflective of the ongoing performance of the Company.
•Litigation Gains and Losses – We exclude the effect of gains or losses associated with litigation recorded under GAAP that we consider to be outside the
ordinary course of business. We believe that including these items is not consistent with our ongoing operating performance.
•Severance Expense – In certain circumstances, we will add back hotel-level severance expenses when we do not believe that such expenses are
reflective of the ongoing operation of our properties. Situations that would result in a severance add-back include, but are not limited to, (i) costs
incurred as part of a broad-based reconfiguration of the operating model with the specific hotel operator for a portfolio of hotels and (ii) costs incurred
at a specific hotel due to a broad-based and significant reconfiguration of a hotel and/or its workforce. We do not add back corporate-level severance
costs or severance costs at an individual hotel that we consider to be incurred in the normal course of business.
© Host Hotels & Resorts, Inc.45
NOTES TO SUPPLEMENTAL FINANCIAL INFORMATION
NON-GAAP FINANCIAL MEASURES (continued)
•Non-Cash Stock-Based Compensation - We exclude the expense recorded for non-cash stock-based compensation, as it represents a non-cash
transaction and the add back is consistent with the calculation of Adjusted EBITDA for our financial covenant ratios under our credit facility and senior
notes indentures and consistent with the presentation of Adjusted EBITDAre for the majority of other lodging REIT filers.
In unusual circumstances, we also may adjust EBITDAre for gains or losses that management believes are not representative of the Company’s current operating
performance. The last adjustment of this nature was a 2013 exclusion of a gain from an eminent domain claim.
LIMITATIONS ON THE USE OF NAREIT FFO PER DILUTED SHARE, ADJUSTED FFO PER DILUTED SHARE, EBITDA, EBITDAre AND ADJUSTED
EBITDAre
We calculate EBITDAre and NAREIT FFO per diluted share in accordance with standards established by NAREIT, which may not be comparable to measures
calculated by other companies that do not use the NAREIT definition of EBITDAre and FFO or do not calculate FFO per diluted share in accordance with NAREIT
guidance. In addition, although EBITDAre and FFO per diluted share are useful measures when comparing our results to other REITs, they may not be helpful to
investors when comparing us to non-REITs. We also calculate Adjusted FFO per diluted share and Adjusted EBITDAre, which measures are not in accordance with
NAREIT guidance and may not be comparable to measures calculated by other REITs or by other companies. This information should not be considered as an
alternative to net income, operating profit, cash from operations or any other operating performance measure calculated in accordance with GAAP. Cash
expenditures for various long-term assets (such as renewal and replacement capital expenditures, with the exception of NOI), interest expense (for EBITDA,
EBITDAre, Adjusted EBITDAre, and NOI purposes only), severance expense related to significant property-level reconfiguration and other items have been, and
will be, made and are not reflected in the presentations for EBITDA (and measures derived from EBITDA such as NOI, Cap Rates and EBITDA multiples), EBITDAre,
Adjusted EBITDAre, NAREIT FFO per diluted share and Adjusted FFO per diluted share. Management compensates for these limitations by separately considering
the impact of these excluded items to the extent they are material to operating decisions or assessments of our operating performance.
Our consolidated statements of operations and consolidated statements of cash flows in the Company’s annual report on Form 10-K and quarterly reports on
Form 10-Q include interest expense, capital expenditures, and other excluded items, all of which should be considered when evaluating our performance, as well
as the usefulness of our non-GAAP financial measures. Additionally, NAREIT FFO per diluted share, Adjusted FFO per diluted share, EBITDA, EBITDAre and
Adjusted EBITDAre should not be considered as measures of our liquidity or indicative of funds available to fund our cash needs, including our ability to make
cash distributions. In addition, NAREIT FFO per diluted share and Adjusted FFO per diluted share do not measure, and should not be used as measures of,
amounts that accrue directly to stockholders’ benefit.
© Host Hotels & Resorts, Inc.46
NOTES TO SUPPLEMENTAL FINANCIAL INFORMATION
NON-GAAP FINANCIAL MEASURES (continued)
Similarly, EBITDAre, Adjusted EBITDAre, NAREIT FFO and Adjusted FFO per diluted share include adjustments for the pro rata share of our equity investments,
and NAREIT FFO and Adjusted FFO per diluted share include adjustments for the pro rata share of non-controlling partners in consolidated partnerships. Our
equity investments consist of interests ranging from 11% to 67% in seven domestic partnerships that own a total of 90 properties and a vacation ownership
development. Due to the voting rights of the outside owners, we do not control and, therefore, do not consolidate these entities. The non-controlling partners in
consolidated partnerships primarily consist of the approximate 1% interest in Host LP held by unaffiliated limited partners and a 15% interest held by an
unaffiliated limited partner in a partnership owning one hotel for which we do control the entity and, therefore, consolidate its operations. These pro rata results
for NAREIT FFO and Adjusted FFO per diluted share, EBITDAre and Adjusted EBITDAre were calculated as set forth in the definitions above. Readers should be
cautioned that the pro rata results presented in these measures for consolidated partnerships (for NAREIT FFO and Adjusted FFO per diluted share) and equity
investments may not accurately depict the legal and economic implications of our investments in these entities.
COMPARABLE HOTEL PROPERTY LEVEL OPERATING RESULTS
We present certain operating results for our hotels, such as hotel revenues, expenses, food and beverage profit, and EBITDA (and the related margins), on a
comparable hotel, or "same store," basis as supplemental information for our investors. Our comparable hotel results present operating results for our hotels
without giving effect to dispositions or properties that experienced closures due to renovations or property damage, as discussed in “Comparable Hotel
Operating Statistics and Results” above. We present comparable hotel EBITDA to help us and our investors evaluate the ongoing operating performance of our
comparable hotels after removing the impact of the Company’s capital structure (primarily interest expense) and its asset base (primarily depreciation and
amortization expense). Corporate-level costs and expenses also are removed to arrive at property-level results. We believe these property-level results provide
investors with supplemental information about the ongoing operating performance of our comparable hotels. Comparable hotel results are presented both by
location and for the Company’s properties in the aggregate. We eliminate from our comparable hotel level operating results severance costs related to broad-
based and significant property-level reconfiguration that is not considered to be within the normal course of business, as we believe this elimination provides
useful supplemental information that is beneficial to an investor’s understanding of our ongoing operating performance. We also eliminate depreciation and
amortization expense because, even though depreciation and amortization expense are property-level expenses, these non-cash expenses, which are based on
historical cost accounting for real estate assets, implicitly assume that the value of real estate assets diminishes predictably over time. As noted earlier, because
real estate values historically have risen or fallen with market conditions, many real estate industry investors have considered presentation of historical cost
accounting for operating results to be insufficient.
Because of the elimination of corporate-level costs and expenses, gains or losses on disposition, certain severance expenses and depreciation and amortization
expense, the comparable hotel operating results we present do not represent our total revenues, expenses, operating profit or net income and should not be
used to evaluate our performance as a whole. Management compensates for these limitations by separately considering the impact of these excluded items to
the extent they are material to operating decisions or assessments of our operating performance. Our condensed consolidated statements of operations include
such amounts, all of which should be considered by investors when evaluating our performance.
© Host Hotels & Resorts, Inc.47
NOTES TO SUPPLEMENTAL FINANCIAL INFORMATION
NON-GAAP FINANCIAL MEASURES (continued)
We present these hotel operating results on a comparable hotel basis because we believe that doing so provides investors and management with useful
information for evaluating the period-to-period performance of our hotels and facilitates comparisons with other hotel REITs and hotel owners. In particular,
these measures assist management and investors in distinguishing whether increases or decreases in revenues and/or expenses are due to growth or decline of
operations at comparable hotels (which represent the vast majority of our portfolio) or from other factors. While management believes that presentation of
comparable hotel results is a supplemental measure that provides useful information in evaluating our ongoing performance, this measure is not used to
allocate resources or to assess the operating performance of each of our hotels, as these decisions are based on data for individual hotels and are not based on
comparable hotel results in the aggregate. For these reasons, we believe comparable hotel operating results, when combined with the presentation of GAAP
operating profit, revenues and expenses, provide useful information to investors and management.
CREDIT FACILITY – LEVERAGE, UNSECURED INTEREST COVERAGE AND CONSOLIDATED FIXED CHARGE COVERAGE RATIOS
Host’s credit facility contains certain financial covenants, including allowable leverage, unsecured interest coverage and fixed charge ratios, which are
determined using EBITDA as calculated under the terms of our credit facility (“Adjusted Credit Facility EBITDA”). The leverage ratio is defined as net debt plus
preferred equity to Adjusted Credit Facility EBITDA. The unsecured interest coverage ratio is defined as unencumbered Adjusted Credit Facility EBITDA to
unsecured consolidated interest expense. The fixed charge coverage ratio is defined as Adjusted Credit Facility EBITDA divided by fixed charges, which include
interest expense, required debt amortization payments, cash taxes and preferred stock payments. These calculations are based on pro forma results for the prior
four fiscal quarters giving effect to transactions such as acquisitions, dispositions and financings as if they occurred at the beginning of the period. The credit
facility also incorporates by reference the ratio of unencumbered assets to unsecured indebtedness test from our senior notes indentures, calculated in the same
manner, and the covenant is discussed below with the senior notes covenants.
Additionally, total debt used in the calculation of our leverage ratio is based on a “net debt” concept, under which cash and cash equivalents in excess of $100
million are deducted from our total debt balance. Management believes these financial ratios provide useful information to investors regarding our compliance
with the covenants in our credit facility and our ability to access the capital markets, in particular debt financing.
SENIOR NOTES INDENTURE – INDEBTEDNESS TEST, SECURED INDEBTEDNESS TO TOTAL ASSETS TEST, EBITDA-TO-INTEREST COVERAGE
RATIO AND RATIO OF UNENCUMBERED ASSETS TO UNSECURED INDEBTEDNESS
Host’s senior notes indentures contains certain financial covenants, including allowable indebtedness, secured indebtedness to total assets, EBITDA-to-interest
coverage and unencumbered assets to unsecured indebtedness. The indebtedness test is defined as adjusted indebtedness, which includes total debt adjusted
for deferred financing costs, divided by adjusted total assets, which includes undepreciated real estate book values (“Adjusted Total Assets”). The secured
indebtedness to total assets is defined as secured indebtedness, which includes mortgage debt and finance leases, divided by Adjusted Total Assets. The
EBITDA-to-interest coverage ratio is defined as EBITDA as calculated under our senior notes indenture (“Adjusted Senior Notes EBITDA”) to interest expense as
defined by our senior notes indenture. The ratio of unencumbered assets to unsecured indebtedness is defined as unencumbered adjusted assets, which
includes Adjusted Total Assets less encumbered assets, divided by unsecured debt, which includes the aggregate principal amount of outstanding unsecured
indebtedness plus contingent obligations.
© Host Hotels & Resorts, Inc.48
NOTES TO SUPPLEMENTAL FINANCIAL INFORMATION
NON-GAAP FINANCIAL MEASURES (continued)
Under the terms of the senior notes indentures, interest expense excludes items such as the gains and losses on the extinguishment of debt, deferred financing
charges related to the senior notes or the credit facility, amortization of debt premiums or discounts that were recorded at issuance of a loan to establish its fair
value and non-cash interest expense, all of which are included in interest expense on our consolidated statement of operations. As with the credit facility
covenants, management believes these financial ratios provide useful information to investors regarding our compliance with the covenants in our senior notes
indentures and our ability to access the capital markets, in particular debt financing.
LIMITATIONS ON CREDIT FACILITY AND SENIOR NOTES CREDIT RATIOS
These metrics are useful in evaluating the Company’s compliance with the covenants contained in its credit facility and senior notes indentures. However,
because of the various adjustments taken to the ratio components as a result of negotiations with the Company’s lenders and noteholders they should not be
considered as an alternative to the same ratios determined in accordance with GAAP. For instance, interest expense as calculated under the credit facility and
senior notes indenture excludes the items noted above such as deferred financing charges and amortization of debt premiums or discounts, all of which are
included in interest expense on our consolidated statement of operations. Management compensates for these limitations by separately considering the impact
of these excluded items to the extent they are material to operating decisions or assessments of performance. In addition, because the credit facility and
indenture ratio components are also based on pro forma results for the prior four fiscal quarters, giving effect to transactions such as acquisitions, dispositions
and financings as if they occurred at the beginning of the period, they are not reflective of actual performance over the same period calculated in accordance
with GAAP.