| Gerdau S.A. Videoconference February 24 (Tuesday) 12:00 p.m. BRT 11:00 a.m. NY Click here to access the videoconference RI.GERDAU.COM RI.GERDAU.COM 4Q25 Results |
| Gerdau S.A. Videoconference February 24 (Tuesday) 12:00 p.m. BRT 11:00 a.m. NY Click here to access the videoconference RI.GERDAU.COM RI.GERDAU.COM 4Q25 Results |
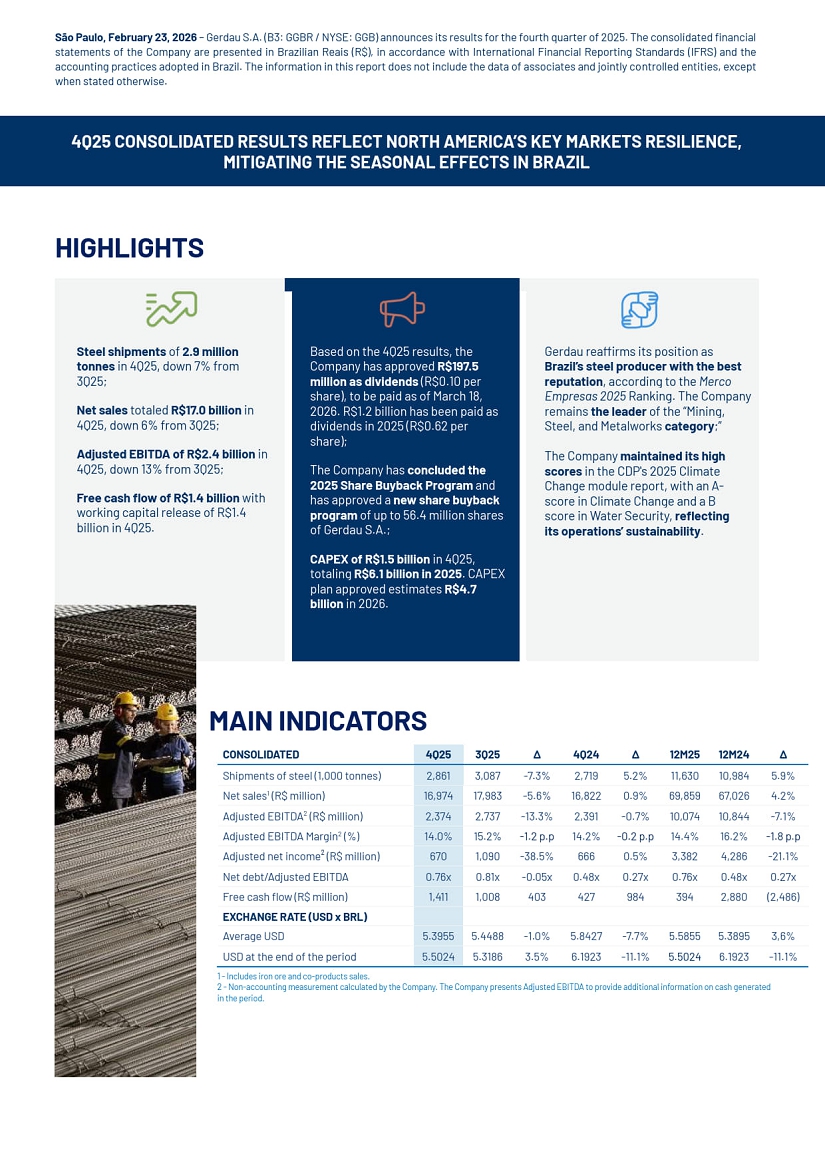
| São Paulo, February 23, 2026 – Gerdau S.A. (B3: GGBR / NYSE: GGB) announces its results for the fourth quarter of 2025. The consolidated financial statements of the Company are presented in Brazilian Reais (R$), in accordance with International Financial Reporting Standards (IFRS) and the accounting practices adopted in Brazil. The information in this report does not include the data of associates and jointly controlled entities, except when stated otherwise. 4Q25 CONSOLIDATED RESULTS REFLECT NORTH AMERICA’S KEY MARKETS RESILIENCE, MITIGATING THE SEASONAL EFFECTS IN BRAZIL HIGHLIGHTS MAIN INDICATORS 1 - Includes iron ore and co-products sales. 2 - Non-accounting measurement calculated by the Company. The Company presents Adjusted EBITDA to provide additional information on cash generated in the period. Steel shipments of 2.9 million tonnes in 4Q25, down 7% from 3Q25; Net sales totaled R$17.0 billion in 4Q25, down 6% from 3Q25; Adjusted EBITDA of R$2.4 billion in 4Q25, down 13% from 3Q25; Free cash flow of R$1.4 billion with working capital release of R$1.4 billion in 4Q25. Based on the 4Q25 results, the Company has approved R$197.5 million as dividends (R$0.10 per share), to be paid as of March 18, 2026. R$1.2 billion has been paid as dividends in 2025 (R$0.62 per share); The Company has concluded the 2025 Share Buyback Program and has approved a new share buyback program of up to 56.4 million shares of Gerdau S.A.; CAPEX of R$1.5 billion in 4Q25, totaling R$6.1 billion in 2025. CAPEX plan approved estimates R$4.7 billion in 2026. Gerdau reaffirms its position as Brazil’s steel producer with the best reputation, according to the Merco Empresas 2025 Ranking. The Company remains the leader of the “Mining, Steel, and Metalworks category;” The Company maintained its high scores in the CDP's 2025 Climate Change module report, with an A-score in Climate Change and a B score in Water Security, reflecting its operations’ sustainability. CONSOLIDATED 4Q25 3Q25 ∆ 4Q24 ∆ 12M25 12M24 ∆ Shipments of steel (1,000 tonnes) 2,861 3,087 -7.3% 2,719 5.2% 11,630 10,984 5.9% Net sales1 (R$ million) 16,974 17,983 -5.6% 16,822 0.9% 69,859 67,026 4.2% Adjusted EBITDA2 (R$ million) 2,374 2,737 -13.3% 2,391 -0.7% 10,074 10,844 -7.1% Adjusted EBITDA Margin2 (%) 14.0% 15.2% -1.2 p.p 14.2% -0.2 p.p 14.4% 16.2% -1.8 p.p Adjusted net income² (R$ million) 670 1,090 -38.5% 666 0.5% 3,382 4,286 -21.1% Net debt/Adjusted EBITDA 0.76x 0.81x -0.05x 0.48x 0.27x 0.76x 0.48x 0.27x Free cash flow (R$ million) 1,411 1,008 403 427 984 394 2,880 (2,486) EXCHANGE RATE (USD x BRL) Average USD 5.3955 5.4488 -1.0% 5.8427 -7.7% 5,5855 5.3895 3,6% USD at the end of the period 5.5024 5.3186 3.5% 6.1923 -11.1% 5.5024 6.1923 -11.1% |
| Quarterly Results 4Q25 | Gerdau S.A. 3 MESSAGE FROM MANAGEMENT We ended 2025 with results that reaffirm the resilience of our operations and the relevance of our global presence. People's safety remains our non-negotiable value and top priority, guiding decisions and reinforcing a culture built on our employees’ care and well-being. In 4Q25, we recorded an Adjusted EBITDA of R$2.4 billion, 13% lower than in 3Q25. The period was once again marked by opposing dynamics between the segments in which we operate. While our North America operations sustained a strong performance, even with the typical year-end seasonality. In Brazil, meanwhile, we faced more pronounced seasonal effects, scheduled maintenance shutdowns, and a still challenging competitive environment, which resulted in lower volumes and margins. North America Our North America operations delivered another solid quarter, supported by resilient demand in our key operating segments, more favorable pricing, and controlled costs. Despite a seasonally weaker period, shipment volume was 14% higher than in 4Q24, primarily driven by a rebalancing of supply and demand in the domestic market after the implementation of Section 232 tariff adjustments. These results reinforce the growing relevance of the region for the Company's consolidated performance, representing 73% of Consolidated EBITDA in 4Q25. Regarding trade defense and imports, the United States continues its antidumping proceedings on rebar imports from Algeria, Egypt, and Vietnam. U.S. authorities issued a positive preliminary ruling, and the final determination is scheduled for 2Q26. Brazil In Brazil, the quarter was impacted by lower volumes compared to 3Q25 (-8%) and slight shipment volume growth versus 4Q24 (+2%). The typical seasonality of the period affected domestic shipment volumes, which were partially offset by increased exports, although with a negative impact on the product mix. In addition to the weaker seasonal consumption, the imported steel penetration rate remained at high levels, ending 4Q25 at 21%, heightening unfair competition in the domestic market. It is worth noting important advances in trade defense measures announced in recent months for the steel sector. The MDIC (Ministry of Development, Industry, Trade and Services) published positive preliminary determinations in the antidumping investigations on hot-rolled coil and wire rod imports from China, recognizing evidence of dumping, though without definitive application. Both investigations are within the regulatory deadline to be concluded by the end of 2026. In addition, a direct tariff increase of 25% has been approved for 12 months, covering 9 additional NCMs. Among them, 2 NCMs are sold by Gerdau in Brazil: drawn wire and special wire rod. South America In South America, the quarter's performance reflected a more challenging operating environment. Despite higher shipment volume compared to 3Q25 (+3%), mainly fueled by exports in Argentina, which offset weaker demand in the domestic market, the cost of goods sold increased due to lower production levels reflecting seasonal effects and scheduled maintenance shutdowns during the quarter. Financial results Throughout 2025, we maintained a solid capital structure, with healthy leverage levels and adequate financial flexibility to sustain the continuity of our strategic projects and generate returns for our shareholders. We invested R$6.1 billion in CAPEX, advancing relevant initiatives such as the completion of the new hot-rolled coil line in Ouro Branco (MG), investments in renewable energy self-generation, and the expansion of the Midlothian (TX) industrial unit, bolstering the competitiveness of our North America’s main asset. We also moved forward with the physical progress of the Miguel Burnier Sustainable Mining platform – which reached 91% in 4Q25 – and which will add 5.5 million tonnes/year of iron ore capacity. For 2026, we estimate R$4.7 billion in CAPEX, with a focus on our assets’ maintenance and competitiveness, ensuring the disciplined execution of key projects. Based on the 4Q25 results, the Company has approved the distribution of dividends in the amount of R$0.10 per share, totaling R$198 million. In 2025, we distributed roughly R$1.2 billion in dividends. We also completed the 2025 Share Buyback Program, acquiring 64.5 million shares, equivalent to 3.0% of outstanding shares. In addition to a robust investment cycle, capital allocation discipline in 2025 considered a total of R$2.4 billion in shareholder remuneration, including dividends and share buybacks, or a payout of 182%. Keeping this commitment to return value to our shareholders, on February 23, 2026, the Company's Board of Directors approved a new share buyback program of up to 55 million preferred shares, and up to 1.4 million common shares, equivalent to 2,9% of outstanding shares (GGBR and/or GGB), with a 18-month term. With 125 years of history completed in January 2026, we remain firmly committed to enhancing the Company's competitiveness, swiftly adapting to market changes, and generating a positive impact in the regions where we operate. Once again, we would like to thank our employees, customers, suppliers, partners, shareholders, and other stakeholders for their trust and support in building our history and continuously creating value. THE MANAGEMENT |
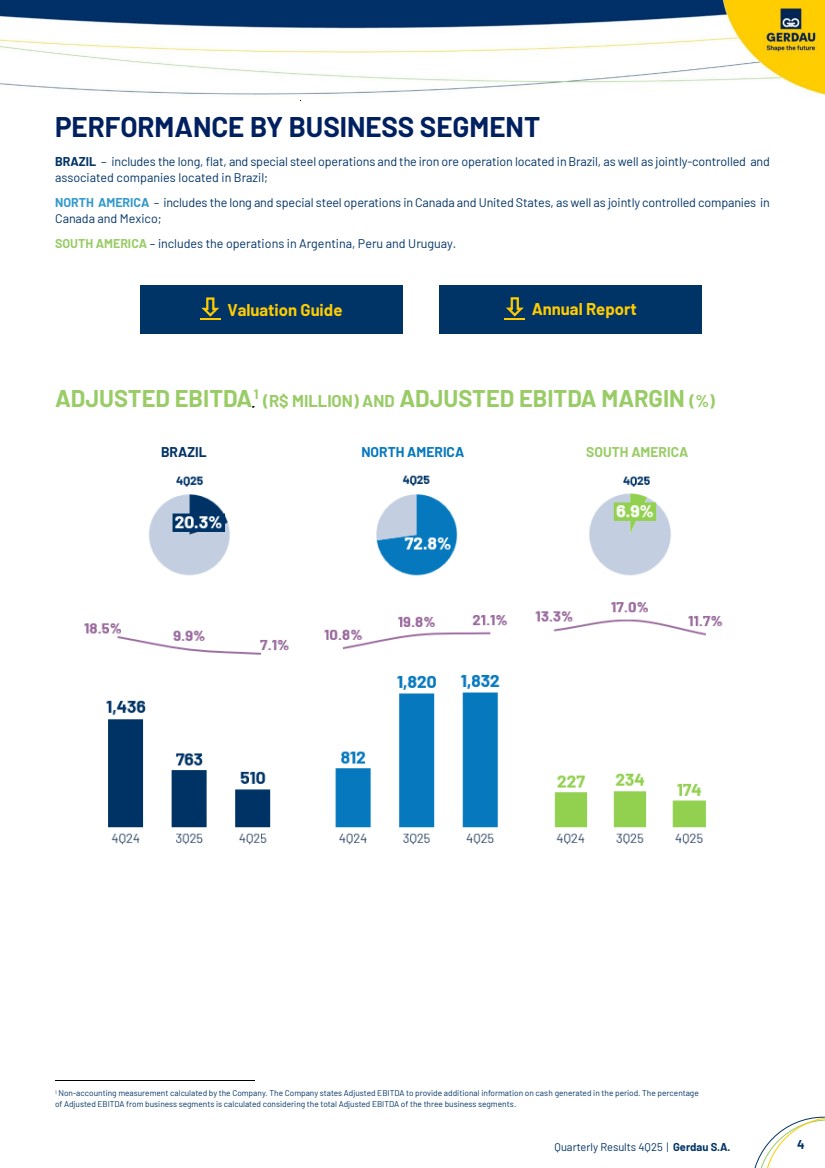
| Quarterly Results 4Q25 | Gerdau S.A. 4 PERFORMANCE BY BUSINESS SEGMENT BRAZIL – includes the long,flat, and special steel operations and the iron ore operation located inBrazil, as well as jointly-controlled and associated companies located in Brazil; NORTH AMERICA – includes the long and special steel operations in Canada and United States, as well as jointly controlled companies in Canada and Mexico; SOUTH AMERICA – includes the operations in Argentina, Peru and Uruguay. Valuation Guide ADJUSTED EBITDA3F0F 1 (R$ MILLION) AND ADJUSTED EBITDA MARGIN (%) BRAZIL NORTH AMERICA SOUTH AMERICA 1 Non-accounting measurement calculated by the Company. The Company states Adjusted EBITDA to provide additional information on cash generated in the period. The percentage of Adjusted EBITDA from business segments is calculated considering the total Adjusted EBITDA of the three business segments. Annual Report |
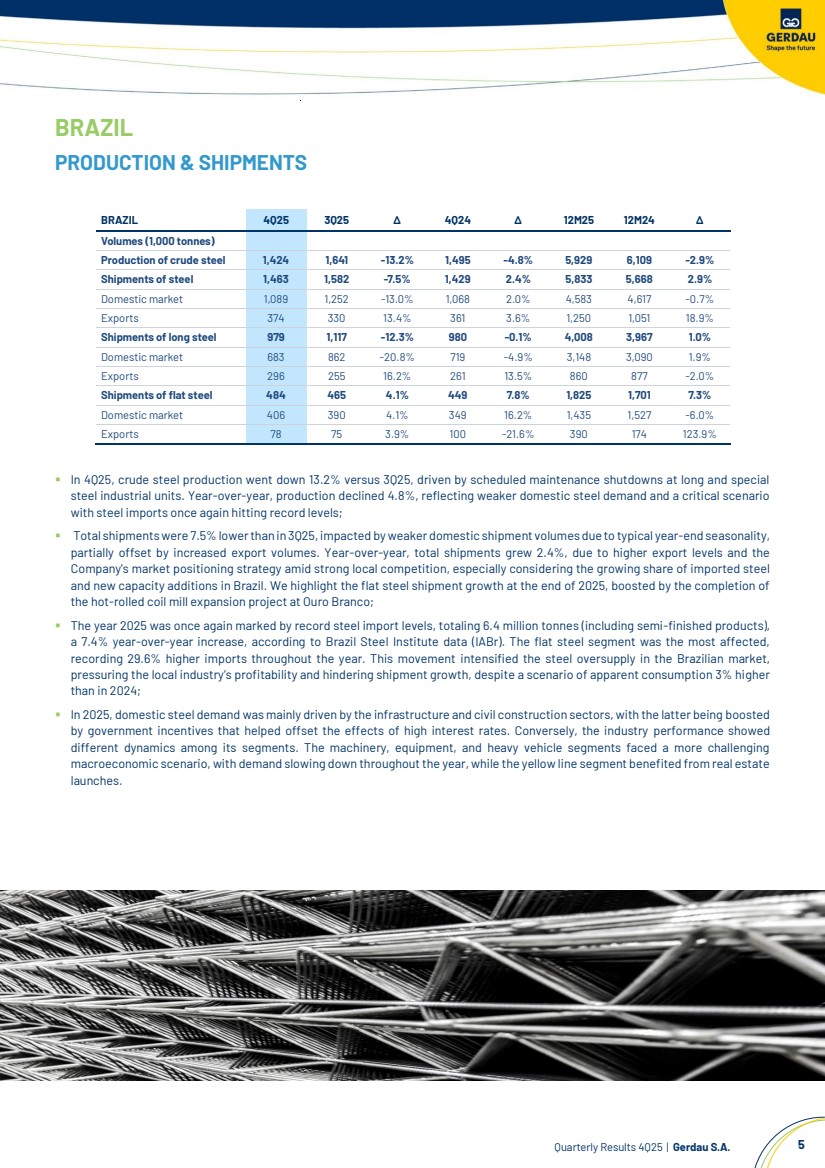
| Quarterly Results 4Q25 | Gerdau S.A. 5 BRAZIL PRODUCTION & SHIPMENTS ▪ In 4Q25, crude steel production went down 13.2% versus 3Q25, driven by scheduled maintenance shutdowns at long and special steel industrial units. Year-over-year, production declined 4.8%, reflecting weaker domestic steel demand and a critical scenario with steel imports once again hitting record levels; ▪ Total shipments were 7.5% lower than in 3Q25, impacted by weaker domestic shipment volumes due to typical year-end seasonality, partially offset by increased export volumes. Year-over-year, total shipments grew 2.4%, due to higher export levels and the Company's market positioning strategy amid strong local competition, especially considering the growing share of imported steel and new capacity additions in Brazil. We highlight the flat steel shipment growth at the end of 2025, boosted by the completion of the hot-rolled coil mill expansion project at Ouro Branco; ▪ The year 2025 was once again marked by record steel import levels, totaling 6.4 million tonnes (including semi-finished products), a 7.4% year-over-year increase, according to Brazil Steel Institute data (IABr). The flat steel segment was the most affected, recording 29.6% higher imports throughout the year. This movement intensified the steel oversupply in the Brazilian market, pressuring the local industry’s profitability and hindering shipment growth, despite a scenario of apparent consumption 3% higher than in 2024; ▪ In 2025, domestic steel demand was mainly driven by the infrastructure and civil construction sectors, with the latter being boosted by government incentives that helped offset the effects of high interest rates. Conversely, the industry performance showed different dynamics among its segments. The machinery, equipment, and heavy vehicle segments faced a more challenging macroeconomic scenario, with demand slowing down throughout the year, while the yellow line segment benefited from real estate launches. BRAZIL 4Q25 3Q25 ∆ 4Q24 ∆ 12M25 12M24 ∆ Volumes (1,000 tonnes) Production of crude steel 1,424 1,641 -13.2% 1,495 -4.8% 5,929 6,109 -2.9% Shipments of steel 1,463 1,582 -7.5% 1,429 2.4% 5,833 5,668 2.9% Domestic market 1,089 1,252 -13.0% 1,068 2.0% 4,583 4,617 -0.7% Exports 374 330 13.4% 361 3.6% 1,250 1,051 18.9% Shipments of long steel 979 1,117 -12.3% 980 -0.1% 4,008 3,967 1.0% Domestic market 683 862 -20.8% 719 -4.9% 3,148 3,090 1.9% Exports 296 255 16.2% 261 13.5% 860 877 -2.0% Shipments of flat steel 484 465 4.1% 449 7.8% 1,825 1,701 7.3% Domestic market 406 390 4.1% 349 16.2% 1,435 1,527 -6.0% Exports 78 75 3.9% 100 -21.6% 390 174 123.9% |
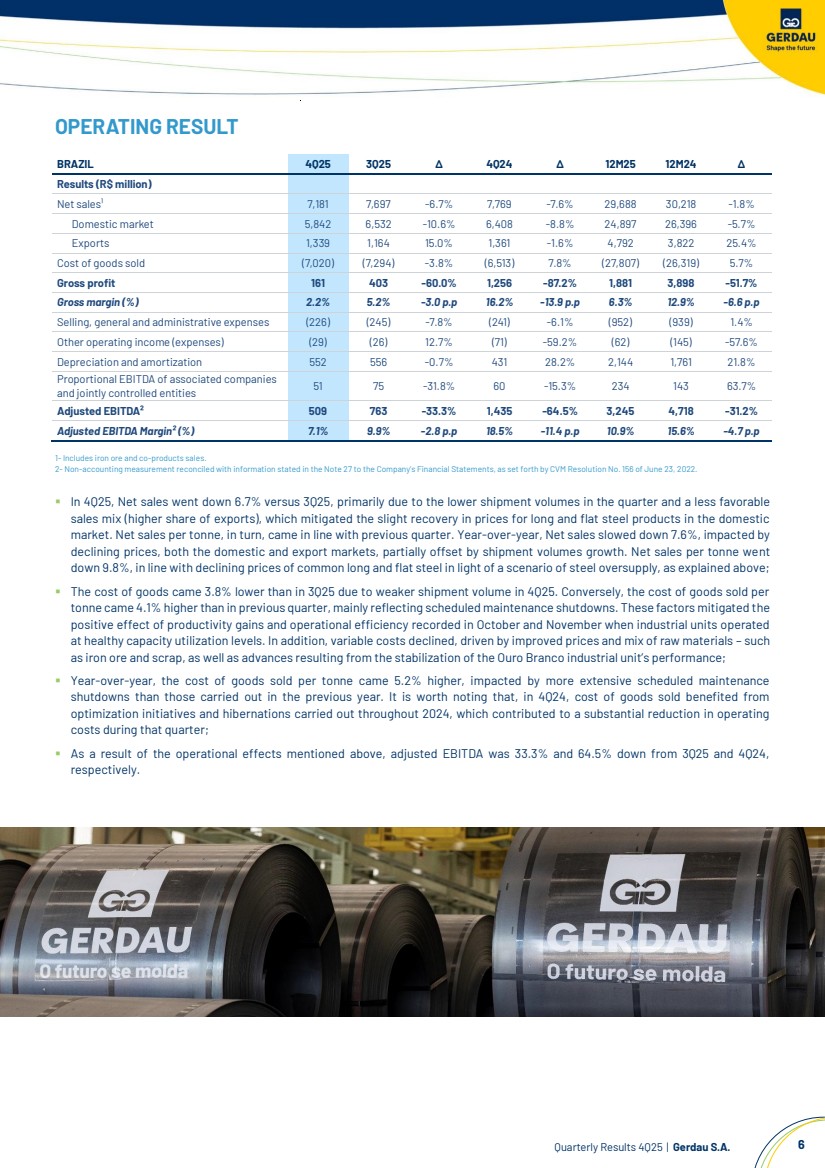
| Quarterly Results 4Q25 | Gerdau S.A. 6 OPERATING RESULT 1- Includes iron ore and co-products sales. 2- Non-accounting measurement reconciled with information stated in the Note 27 to the Company’s Financial Statements, as set forth by CVM Resolution No. 156 of June 23, 2022. ▪ In 4Q25, Net sales went down 6.7% versus 3Q25, primarily due to the lower shipment volumes in the quarter and a less favorable sales mix (higher share of exports), which mitigated the slight recovery in prices for long and flat steel products in the domestic market. Net sales per tonne, in turn, came in line with previous quarter. Year-over-year, Net sales slowed down 7.6%, impacted by declining prices, both the domestic and export markets, partially offset by shipment volumes growth. Net sales per tonne went down 9.8%, in line with declining prices of common long and flat steel in light of a scenario of steel oversupply, as explained above; ▪ The cost of goods came 3.8% lower than in 3Q25 due to weaker shipment volume in 4Q25. Conversely, the cost of goods sold per tonne came 4.1% higher than in previous quarter, mainly reflecting scheduled maintenance shutdowns. These factors mitigated the positive effect of productivity gains and operational efficiency recorded in October and November when industrial units operated at healthy capacity utilization levels. In addition, variable costs declined, driven by improved prices and mix of raw materials – such as iron ore and scrap, as well as advances resulting from the stabilization of the Ouro Branco industrial unit’s performance; ▪ Year-over-year, the cost of goods sold per tonne came 5.2% higher, impacted by more extensive scheduled maintenance shutdowns than those carried out in the previous year. It is worth noting that, in 4Q24, cost of goods sold benefited from optimization initiatives and hibernations carried out throughout 2024, which contributed to a substantial reduction in operating costs during that quarter; ▪ As a result of the operational effects mentioned above, adjusted EBITDA was 33.3% and 64.5% down from 3Q25 and 4Q24, respectively. BRAZIL 4Q25 3Q25 ∆ 4Q24 ∆ 12M25 12M24 ∆ Results (R$ million) Net sales¹ 7,181 7,697 -6.7% 7,769 -7.6% 29,688 30,218 -1.8% Domestic market 5,842 6,532 -10.6% 6,408 -8.8% 24,897 26,396 -5.7% Exports 1,339 1,164 15.0% 1,361 -1.6% 4,792 3,822 25.4% Cost of goods sold (7,020) (7,294) -3.8% (6,513) 7.8% (27,807) (26,319) 5.7% Gross profit 161 403 -60.0% 1,256 -87.2% 1,881 3,898 -51.7% Gross margin (%) 2.2% 5.2% -3.0 p.p 16.2% -13.9 p.p 6.3% 12.9% -6.6 p.p Selling, general and administrative expenses (226) (245) -7.8% (241) -6.1% (952) (939) 1.4% Other operating income (expenses) (29) (26) 12.7% (71) -59.2% (62) (145) -57.6% Depreciation and amortization 552 556 -0.7% 431 28.2% 2,144 1,761 21.8% Proportional EBITDA of associated companies and jointly controlled entities 51 75 -31.8% 60 -15.3% 234 143 63.7% Adjusted EBITDA² 509 763 -33.3% 1,435 -64.5% 3,245 4,718 -31.2% Adjusted EBITDA Margin² (%) 7.1% 9.9% -2.8 p.p 18.5% -11.4 p.p 10.9% 15.6% -4.7 p.p |
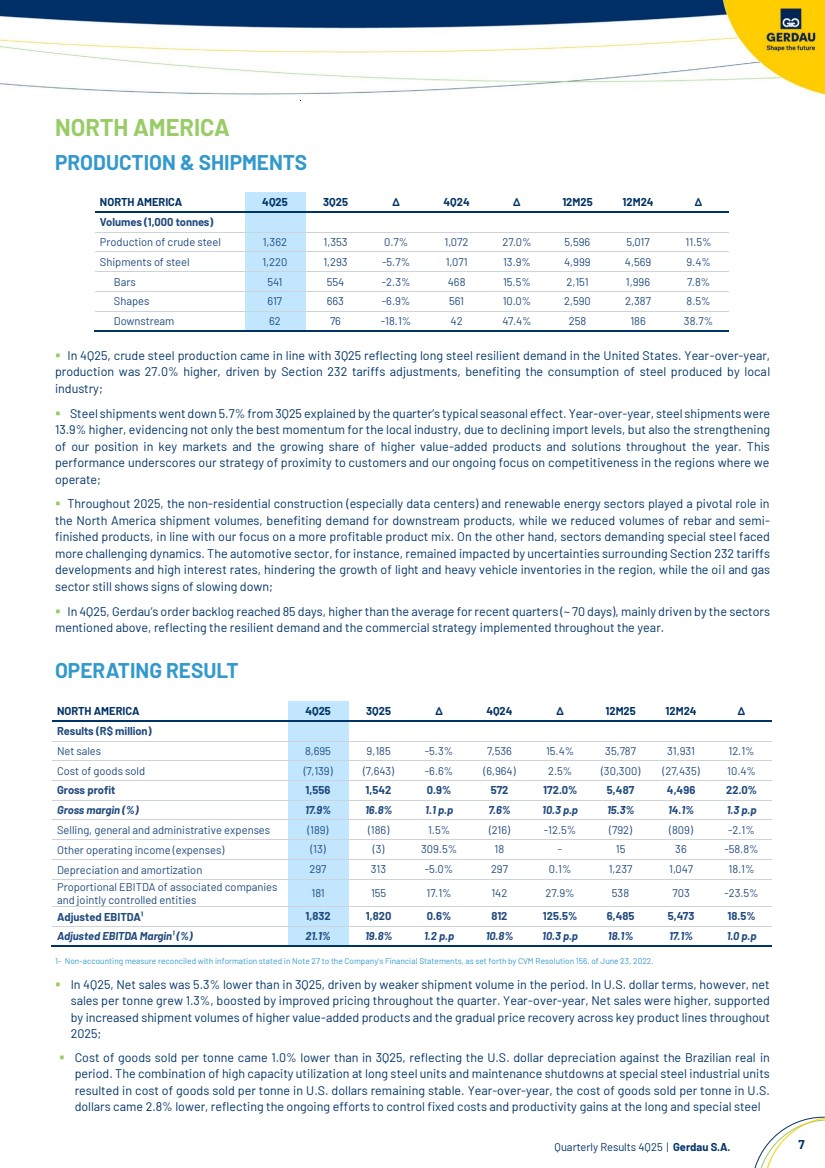
| Quarterly Results 4Q25 | Gerdau S.A. 7 NORTH AMERICA PRODUCTION & SHIPMENTS ▪ In 4Q25, crude steel production came in line with 3Q25 reflecting long steel resilient demand in the United States. Year-over-year, production was 27.0% higher, driven by Section 232 tariffs adjustments, benefiting the consumption of steel produced by local industry; ▪ Steel shipments went down 5.7% from 3Q25 explained by the quarter’s typical seasonal effect. Year-over-year, steel shipments were 13.9% higher, evidencing not only the best momentum for the local industry, due to declining import levels, but also the strengthening of our position in key markets and the growing share of higher value-added products and solutions throughout the year. This performance underscores our strategy of proximity to customers and our ongoing focus on competitiveness in the regions where we operate; ▪ Throughout 2025, the non-residential construction (especially data centers) and renewable energy sectors played a pivotal role in the North America shipment volumes, benefiting demand for downstream products, while we reduced volumes of rebar and semi-finished products, in line with our focus on a more profitable product mix. On the other hand, sectors demanding special steel faced more challenging dynamics. The automotive sector, for instance, remained impacted by uncertainties surrounding Section 232 tariffs developments and high interest rates, hindering the growth of light and heavy vehicle inventories in the region, while the oil and gas sector still shows signs of slowing down; ▪ In 4Q25, Gerdau’s order backlog reached 85 days, higher than the average for recent quarters (~ 70 days), mainly driven by the sectors mentioned above, reflecting the resilient demand and the commercial strategy implemented throughout the year. OPERATING RESULT 1- Non-accounting measure reconciled with information stated in Note 27 to the Company’s Financial Statements, as set forth by CVM Resolution 156, of June 23, 2022. ▪ In 4Q25, Net sales was 5.3% lower than in 3Q25, driven by weaker shipment volume in the period. In U.S. dollar terms, however, net sales per tonne grew 1.3%, boosted by improved pricing throughout the quarter. Year-over-year, Net sales were higher, supported by increased shipment volumes of higher value-added products and the gradual price recovery across key product lines throughout 2025; ▪ Cost of goods sold per tonne came 1.0% lower than in 3Q25, reflecting the U.S. dollar depreciation against the Brazilian real in period. The combination of high capacity utilization at long steel units and maintenance shutdowns at special steel industrial units resulted in cost of goods sold per tonne in U.S. dollars remaining stable. Year-over-year, the cost of goods sold per tonne in U.S. dollars came 2.8% lower, reflecting the ongoing efforts to control fixed costs and productivity gains at the long and special steel NORTH AMERICA 4Q25 3Q25 ∆ 4Q24 ∆ 12M25 12M24 ∆ Volumes (1,000 tonnes) Production of crude steel 1,362 1,353 0.7% 1,072 27.0% 5,596 5,017 11.5% Shipments of steel 1,220 1,293 -5.7% 1,071 13.9% 4,999 4,569 9.4% Bars 541 554 -2.3% 468 15.5% 2,151 1,996 7.8% Shapes 617 663 -6.9% 561 10.0% 2,590 2,387 8.5% Downstream 62 76 -18.1% 42 47.4% 258 186 38.7% NORTH AMERICA 4Q25 3Q25 ∆ 4Q24 ∆ 12M25 12M24 ∆ Results (R$ million) Net sales 8,695 9,185 -5.3% 7,536 15.4% 35,787 31,931 12.1% Cost of goods sold (7,139) (7,643) -6.6% (6,964) 2.5% (30,300) (27,435) 10.4% Gross profit 1,556 1,542 0.9% 572 172.0% 5,487 4,496 22.0% Gross margin (%) 17.9% 16.8% 1.1 p.p 7.6% 10.3 p.p 15.3% 14.1% 1.3 p.p Selling, general and administrative expenses (189) (186) 1.5% (216) -12.5% (792) (809) -2.1% Other operating income (expenses) (13) (3) 309.5% 18 - 15 36 -58.8% Depreciation and amortization 297 313 -5.0% 297 0.1% 1,237 1,047 18.1% Proportional EBITDA of associated companies and jointly controlled entities 181 155 17.1% 142 27.9% 538 703 -23.5% Adjusted EBITDA¹ 1,832 1,820 0.6% 812 125.5% 6,485 5,473 18.5% Adjusted EBITDA Margin¹ (%) 21.1% 19.8% 1.2 p.p 10.8% 10.3 p.p 18.1% 17.1% 1.0 p.p |
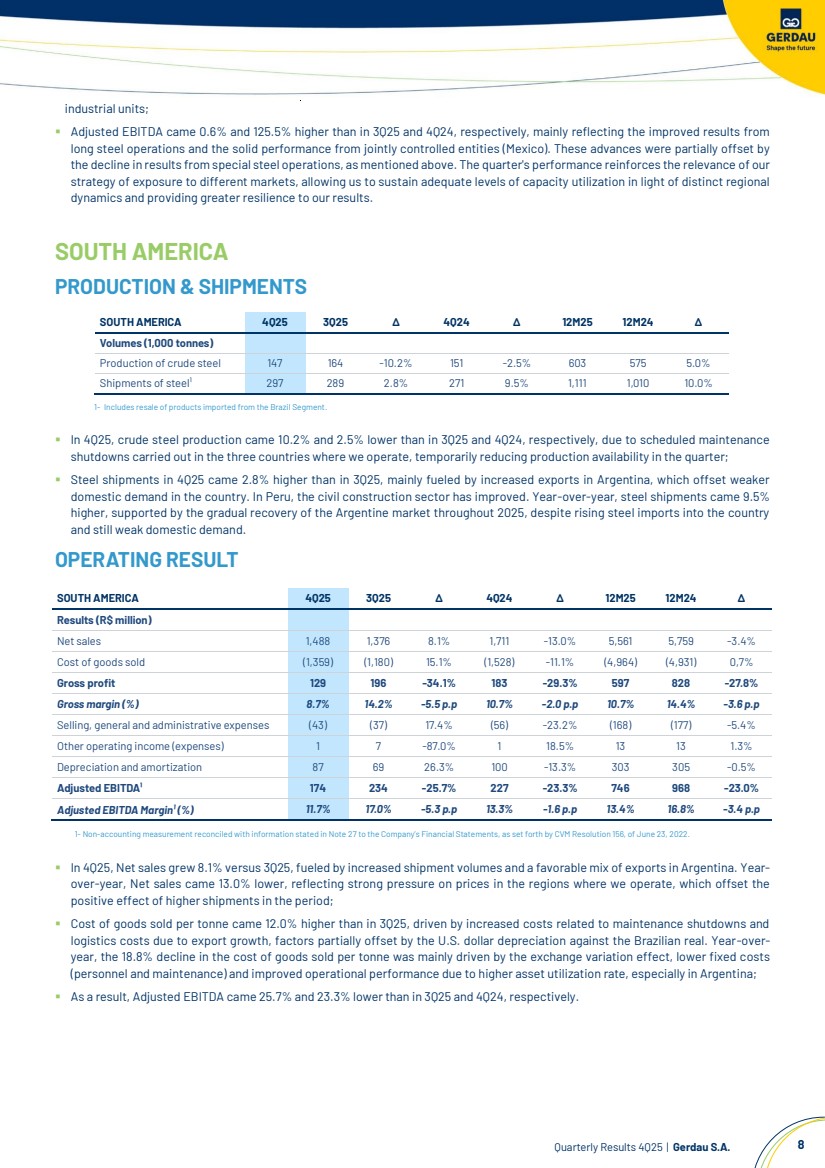
| Quarterly Results 4Q25 | Gerdau S.A. 8 industrial units; ▪ Adjusted EBITDA came 0.6% and 125.5% higher than in 3Q25 and 4Q24, respectively, mainly reflecting the improved results from long steel operations and the solid performance from jointly controlled entities (Mexico). These advances were partially offset by the decline in results from special steel operations, as mentioned above. The quarter's performance reinforces the relevance of our strategy of exposure to different markets, allowing us to sustain adequate levels of capacity utilization in light of distinct regional dynamics and providing greater resilience to our results. SOUTH AMERICA PRODUCTION & SHIPMENTS 1- Includes resale of products imported from the Brazil Segment. ▪ In 4Q25, crude steel production came 10.2% and 2.5% lower than in 3Q25 and 4Q24, respectively, due to scheduled maintenance shutdowns carried out in the three countries where we operate, temporarily reducing production availability in the quarter; ▪ Steel shipments in 4Q25 came 2.8% higher than in 3Q25, mainly fueled by increased exports in Argentina, which offset weaker domestic demand in the country. In Peru, the civil construction sector has improved. Year-over-year, steel shipments came 9.5% higher, supported by the gradual recovery of the Argentine market throughout 2025, despite rising steel imports into the country and still weak domestic demand. OPERATING RESULT 1- Non-accounting measurement reconciled with information stated in Note 27 to the Company’s Financial Statements, as set forth by CVM Resolution 156, of June 23, 2022. ▪ In 4Q25, Net sales grew 8.1% versus 3Q25, fueled by increased shipment volumes and a favorable mix of exports in Argentina. Year-over-year, Net sales came 13.0% lower, reflecting strong pressure on prices in the regions where we operate, which offset the positive effect of higher shipments in the period; ▪ Cost of goods sold per tonne came 12.0% higher than in 3Q25, driven by increased costs related to maintenance shutdowns and logistics costs due to export growth, factors partially offset by the U.S. dollar depreciation against the Brazilian real. Year-over-year, the 18.8% decline in the cost of goods sold per tonne was mainly driven by the exchange variation effect, lower fixed costs (personnel and maintenance) and improved operational performance due to higher asset utilization rate, especially in Argentina; ▪ As a result, Adjusted EBITDA came 25.7% and 23.3% lower than in 3Q25 and 4Q24, respectively. SOUTH AMERICA 4Q25 3Q25 ∆ 4Q24 ∆ 12M25 12M24 ∆ Volumes (1,000 tonnes) Production of crude steel 147 164 -10.2% 151 -2.5% 603 575 5.0% Shipments of steel¹ 297 289 2.8% 271 9.5% 1,111 1,010 10.0% SOUTH AMERICA 4Q25 3Q25 ∆ 4Q24 ∆ 12M25 12M24 ∆ Results (R$ million) Net sales 1,488 1,376 8.1% 1,711 -13.0% 5,561 5,759 -3.4% Cost of goods sold (1,359) (1,180) 15.1% (1,528) -11.1% (4,964) (4,931) 0,7% Gross profit 129 196 -34.1% 183 -29.3% 597 828 -27.8% Gross margin (%) 8.7% 14.2% -5.5 p.p 10.7% -2.0 p.p 10.7% 14.4% -3.6 p.p Selling, general and administrative expenses (43) (37) 17.4% (56) -23.2% (168) (177) -5.4% Other operating income (expenses) 1 7 -87.0% 1 18.5% 13 13 1.3% Depreciation and amortization 87 69 26.3% 100 -13.3% 303 305 -0.5% Adjusted EBITDA¹ 174 234 -25.7% 227 -23.3% 746 968 -23.0% Adjusted EBITDA Margin¹ (%) 11.7% 17.0% -5.3 p.p 13.3% -1.6 p.p 13.4% 16.8% -3.4 p.p |
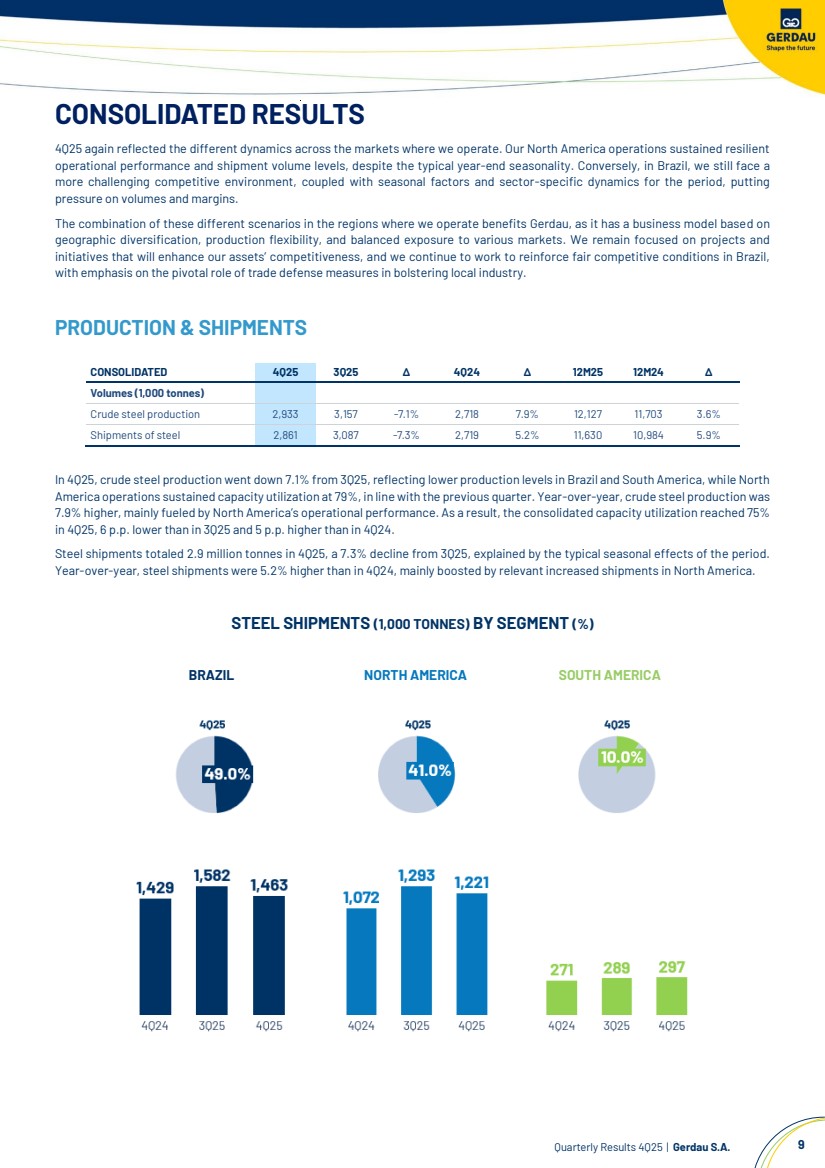
| Quarterly Results 4Q25 | Gerdau S.A. 9 CONSOLIDATED RESULTS 4Q25 again reflected the different dynamics across the markets where we operate. Our North America operations sustained resilient operational performance and shipment volume levels, despite the typical year-end seasonality. Conversely, in Brazil, we still face a more challenging competitive environment, coupled with seasonal factors and sector-specific dynamics for the period, putting pressure on volumes and margins. The combination of these different scenarios in the regions where we operate benefits Gerdau, as it has a business model based on geographic diversification, production flexibility, and balanced exposure to various markets. We remain focused on projects and initiatives that will enhance our assets’ competitiveness, and we continue to work to reinforce fair competitive conditions in Brazil, with emphasis on the pivotal role of trade defense measures in bolstering local industry. PRODUCTION & SHIPMENTS CONSOLIDATED 4Q25 3Q25 ∆ 4Q24 ∆ 12M25 12M24 ∆ Volumes (1,000 tonnes) Crude steel production 2,933 3,157 -7.1% 2,718 7.9% 12,127 11,703 3.6% Shipments of steel 2,861 3,087 -7.3% 2,719 5.2% 11,630 10,984 5.9% In 4Q25, crude steel production went down 7.1% from 3Q25, reflecting lower production levels in Brazil and South America, while North America operations sustained capacity utilization at 79%, in line with the previous quarter. Year-over-year, crude steel production was 7.9% higher, mainly fueled by North America’s operational performance. As a result, the consolidated capacity utilization reached 75% in 4Q25, 6 p.p. lower than in 3Q25 and 5 p.p. higher than in 4Q24. Steel shipments totaled 2.9 million tonnes in 4Q25, a 7.3% decline from 3Q25, explained by the typical seasonal effects of the period. Year-over-year, steel shipments were 5.2% higher than in 4Q24, mainly boosted by relevant increased shipments in North America. STEEL SHIPMENTS (1,000 TONNES) BY SEGMENT (%) BRAZIL NORTH AMERICA SOUTH AMERICA |
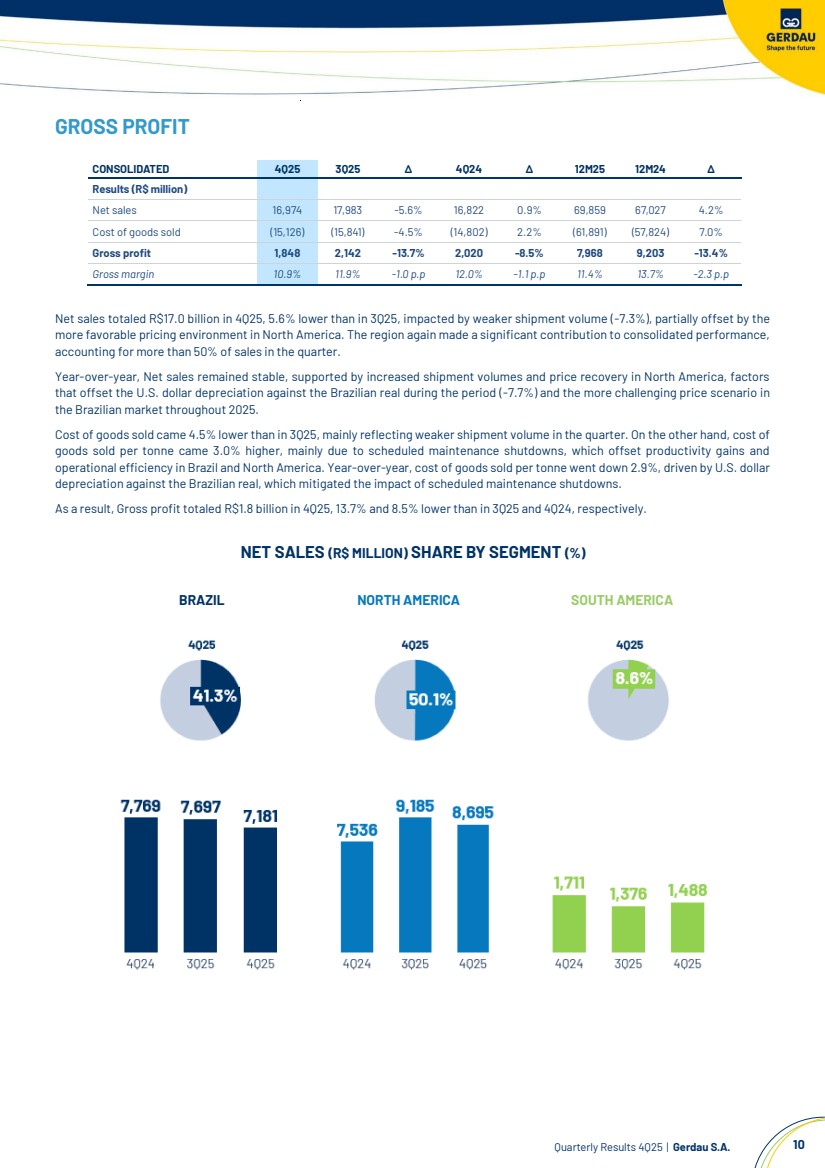
| Quarterly Results 4Q25 | Gerdau S.A. 10 GROSS PROFIT Net sales totaled R$17.0 billion in 4Q25, 5.6% lower than in 3Q25, impacted by weaker shipment volume (-7.3%), partially offset by the more favorable pricing environment in North America. The region again made a significant contribution to consolidated performance, accounting for more than 50% of sales in the quarter. Year-over-year, Net sales remained stable, supported by increased shipment volumes and price recovery in North America, factors that offset the U.S. dollar depreciation against the Brazilian real during the period (-7.7%) and the more challenging price scenario in the Brazilian market throughout 2025. Cost of goods sold came 4.5% lower than in 3Q25, mainly reflecting weaker shipment volume in the quarter. On the other hand, cost of goods sold per tonne came 3.0% higher, mainly due to scheduled maintenance shutdowns, which offset productivity gains and operational efficiency in Brazil and North America. Year-over-year, cost of goods sold per tonne went down 2.9%, driven by U.S. dollar depreciation against the Brazilian real, which mitigated the impact of scheduled maintenance shutdowns. As a result, Gross profit totaled R$1.8 billion in 4Q25, 13.7% and 8.5% lower than in 3Q25 and 4Q24, respectively. NET SALES (R$ MILLION) SHARE BY SEGMENT (%) CONSOLIDATED 4Q25 3Q25 ∆ 4Q24 ∆ 12M25 12M24 ∆ Results (R$ million) Net sales 16,974 17,983 -5.6% 16,822 0.9% 69,859 67,027 4.2% Cost of goods sold (15,126) (15,841) -4.5% (14,802) 2.2% (61,891) (57,824) 7.0% Gross profit 1,848 2,142 -13.7% 2,020 -8.5% 7,968 9,203 -13.4% Gross margin 10.9% 11.9% -1.0 p.p 12.0% -1.1 p.p 11.4% 13.7% -2.3 p.p BRAZIL NORTH AMERICA SOUTH AMERICA |
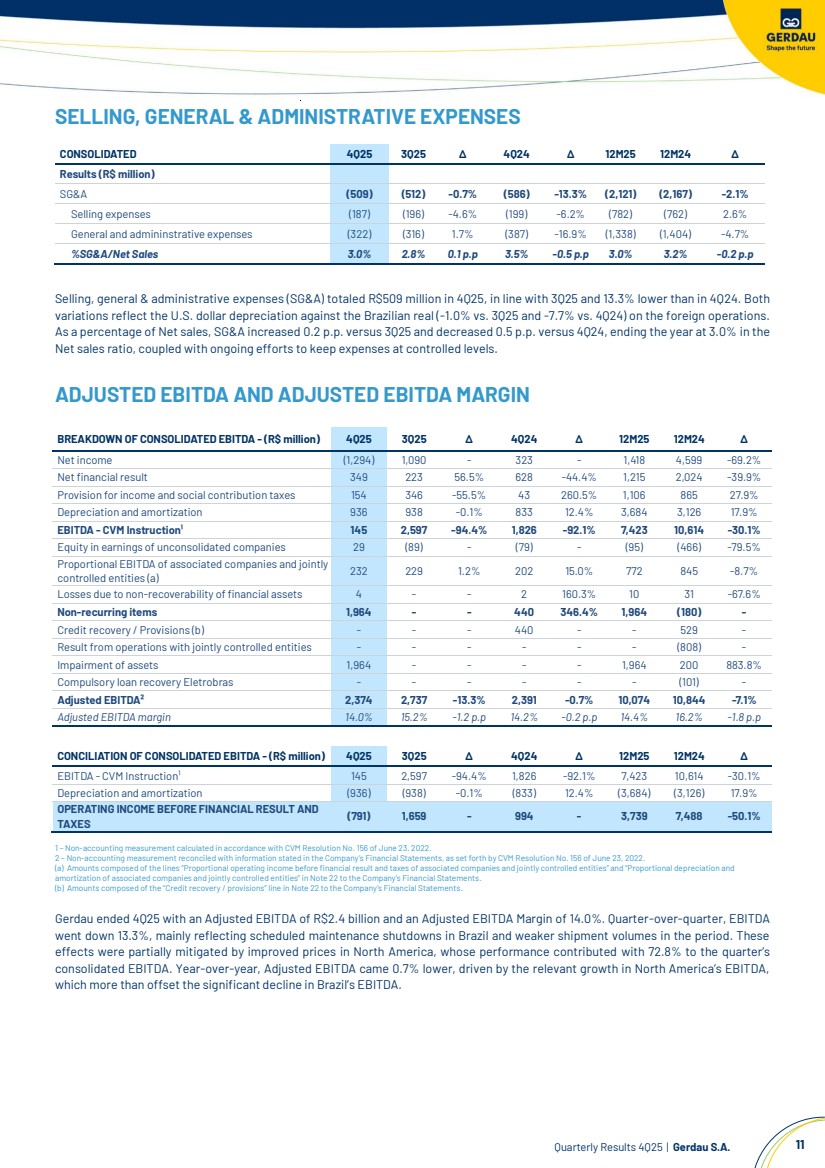
| Quarterly Results 4Q25 | Gerdau S.A. 11 SELLING, GENERAL & ADMINISTRATIVE EXPENSES Selling, general & administrative expenses (SG&A) totaled R$509 million in 4Q25, in line with 3Q25 and 13.3% lower than in 4Q24. Both variations reflect the U.S. dollar depreciation against the Brazilian real (-1.0% vs. 3Q25 and -7.7% vs. 4Q24) on the foreign operations. As a percentage of Net sales, SG&A increased 0.2 p.p. versus 3Q25 and decreased 0.5 p.p. versus 4Q24, ending the year at 3.0% in the Net sales ratio, coupled with ongoing efforts to keep expenses at controlled levels. ADJUSTED EBITDA AND ADJUSTED EBITDA MARGIN 1 – Non-accounting measurement calculated in accordance with CVM Resolution No. 156 of June 23, 2022. 2 – Non-accounting measurement reconciled with information stated in the Company’s Financial Statements, as set forth by CVM Resolution No. 156 of June 23, 2022. (a) Amounts composed of the lines “Proportional operating income before financial result and taxes of associated companies and jointly controlled entities” and “Proportional depreciation and amortization of associated companies and jointly controlled entities" in Note 22 to the Company’s Financial Statements. (b) Amounts composed of the “Credit recovery / provisions” line in Note 22 to the Company’s Financial Statements. Gerdau ended 4Q25 with an Adjusted EBITDA of R$2.4 billion and an Adjusted EBITDA Margin of 14.0%. Quarter-over-quarter, EBITDA went down 13.3%, mainly reflecting scheduled maintenance shutdowns in Brazil and weaker shipment volumes in the period. These effects were partially mitigated by improved prices in North America, whose performance contributed with 72.8% to the quarter’s consolidated EBITDA. Year-over-year, Adjusted EBITDA came 0.7% lower, driven by the relevant growth in North America’s EBITDA, which more than offset the significant decline in Brazil’s EBITDA. CONSOLIDATED 4Q25 3Q25 ∆ 4Q24 ∆ 12M25 12M24 ∆ Results (R$ million) SG&A (509) (512) -0.7% (586) -13.3% (2,121) (2,167) -2.1% Selling expenses (187) (196) -4.6% (199) -6.2% (782) (762) 2.6% General and admininstrative expenses (322) (316) 1.7% (387) -16.9% (1,338) (1,404) -4.7% %SG&A/Net Sales 3.0% 2.8% 0.1 p.p 3.5% -0.5 p.p 3.0% 3.2% -0.2 p.p BREAKDOWN OF CONSOLIDATED EBITDA - (R$ million) 4Q25 3Q25 ∆ 4Q24 ∆ 12M25 12M24 ∆ Net income (1,294) 1,090 - 323 - 1,418 4,599 -69.2% Net financial result 349 223 56.5% 628 -44.4% 1,215 2,024 -39.9% Provision for income and social contribution taxes 154 346 -55.5% 43 260.5% 1,106 865 27.9% Depreciation and amortization 936 938 -0.1% 833 12.4% 3,684 3,126 17.9% EBITDA - CVM Instruction¹ 145 2,597 -94.4% 1,826 -92.1% 7,423 10,614 -30.1% Equity in earnings of unconsolidated companies 29 (89) - (79) - (95) (466) -79.5% Proportional EBITDA of associated companies and jointly controlled entities (a) 232 229 1.2% 202 15.0% 772 845 -8.7% Losses due to non-recoverability of financial assets 4 - - 2 160.3% 10 31 -67.6% Non-recurring items 1,964 - - 440 346.4% 1,964 (180) - Credit recovery / Provisions (b) - - - 440 - - 529 - Result from operations with jointly controlled entities - - - - - - (808) - Impairment of assets 1,964 - - - - 1,964 200 883.8% Compulsory loan recovery Eletrobras - - - - - - (101) - Adjusted EBITDA² 2,374 2,737 -13.3% 2,391 -0.7% 10,074 10,844 -7.1% Adjusted EBITDA margin 14.0% 15.2% -1.2 p.p 14.2% -0.2 p.p 14.4% 16.2% -1.8 p.p CONCILIATION OF CONSOLIDATED EBITDA - (R$ million) 4Q25 3Q25 ∆ 4Q24 ∆ 12M25 12M24 ∆ EBITDA - CVM Instruction¹ 145 2,597 -94.4% 1,826 -92.1% 7,423 10,614 -30.1% Depreciation and amortization (936) (938) -0.1% (833) 12.4% (3,684) (3,126) 17.9% OPERATING INCOME BEFORE FINANCIAL RESULT AND TAXES (791) 1,659 - 994 - 3,739 7,488 -50.1% |
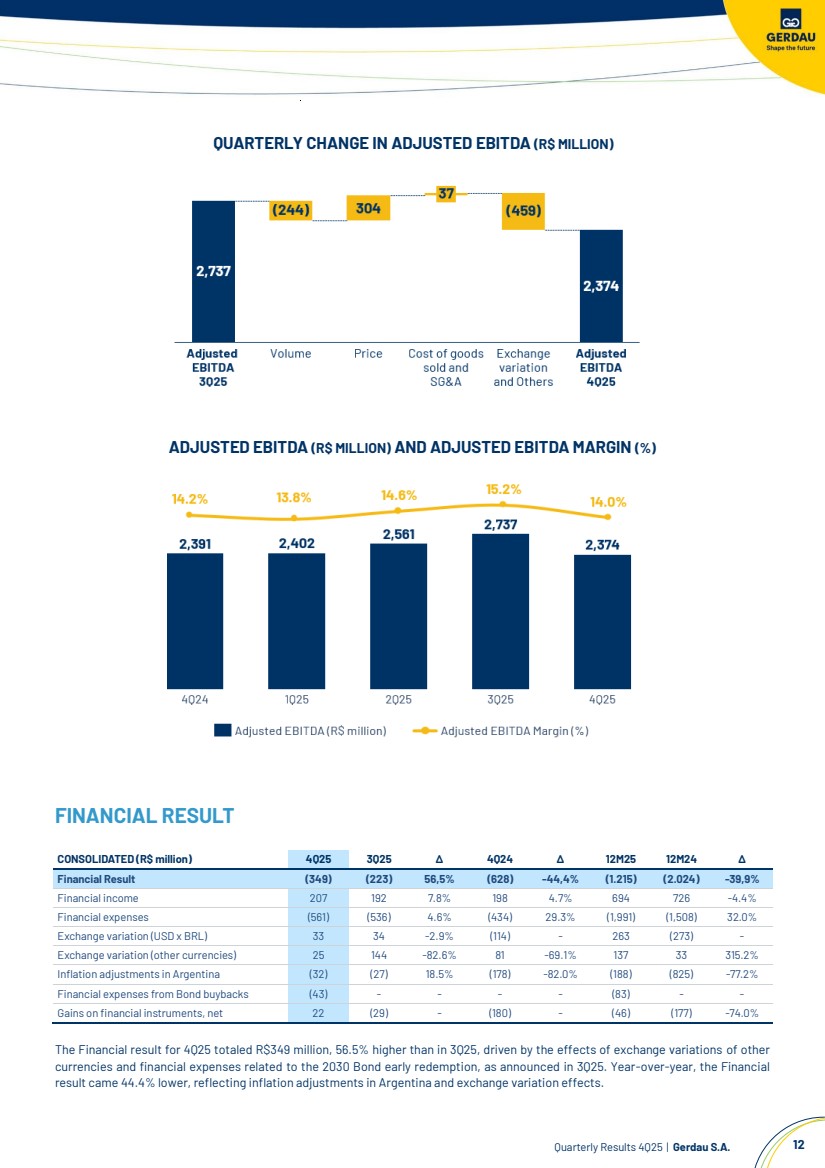
| Quarterly Results 4Q25 | Gerdau S.A. 12 QUARTERLY CHANGE IN ADJUSTED EBITDA (R$ MILLION) ADJUSTED EBITDA (R$ MILLION) AND ADJUSTED EBITDA MARGIN (%) FINANCIAL RESULT CONSOLIDATED (R$ million) 4Q25 3Q25 ∆ 4Q24 ∆ 12M25 12M24 ∆ Financial Result (349) (223) 56,5% (628) -44,4% (1.215) (2.024) -39,9% Financial income 207 192 7.8% 198 4.7% 694 726 -4.4% Financial expenses (561) (536) 4.6% (434) 29.3% (1,991) (1,508) 32.0% Exchange variation (USD x BRL) 33 34 -2.9% (114) - 263 (273) - Exchange variation (other currencies) 25 144 -82.6% 81 -69.1% 137 33 315.2% Inflation adjustments in Argentina (32) (27) 18.5% (178) -82.0% (188) (825) -77.2% Financial expenses from Bond buybacks (43) - - - - (83) - - Gains on financial instruments, net 22 (29) - (180) - (46) (177) -74.0% The Financial result for 4Q25 totaled R$349 million, 56.5% higher than in 3Q25, driven by the effects of exchange variations of other currencies and financial expenses related to the 2030 Bond early redemption, as announced in 3Q25. Year-over-year, the Financial result came 44.4% lower, reflecting inflation adjustments in Argentina and exchange variation effects. |
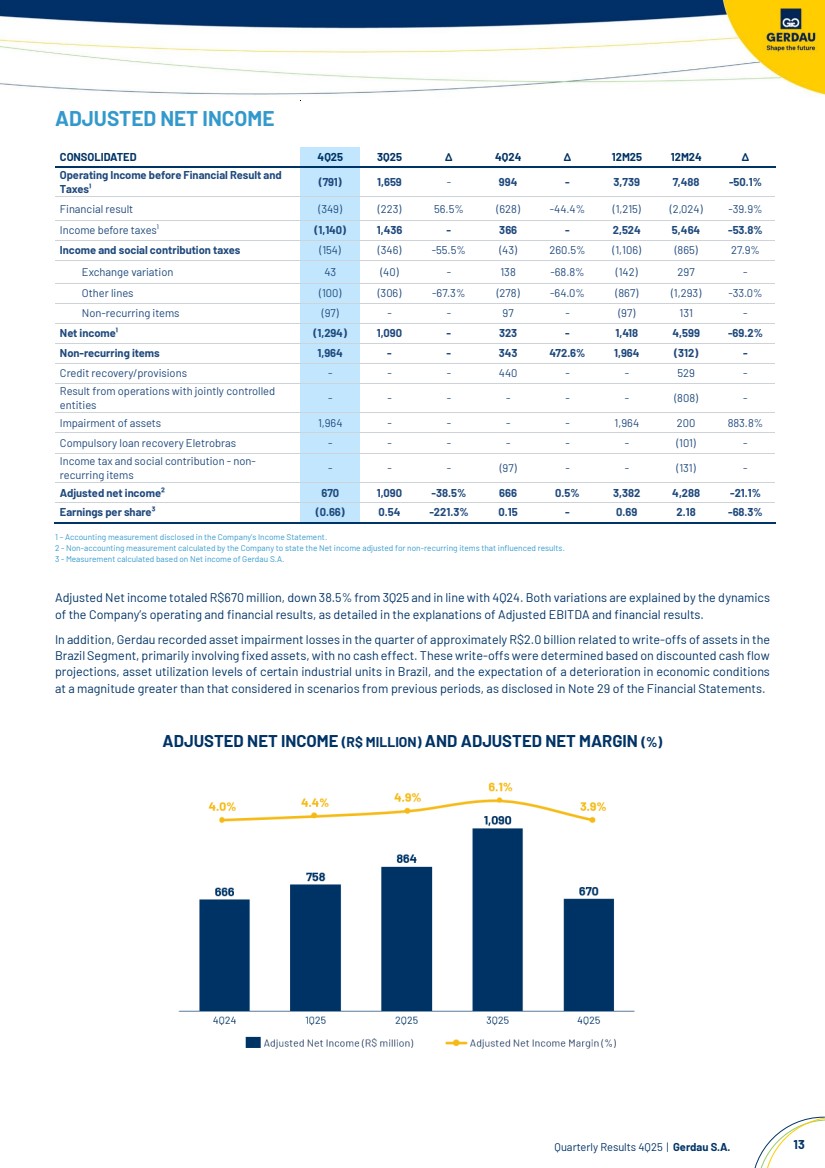
| Quarterly Results 4Q25 | Gerdau S.A. 13 ADJUSTED NET INCOME 1 – Accounting measurement disclosed in the Company’s Income Statement. 2 - Non-accounting measurement calculated by the Company to state the Net income adjusted for non-recurring items that influenced results. 3 - Measurement calculated based on Net income of Gerdau S.A. Adjusted Net income totaled R$670 million, down 38.5% from 3Q25 and in line with 4Q24. Both variations are explained by the dynamics of the Company’s operating and financial results, as detailed in the explanations of Adjusted EBITDA and financial results. In addition, Gerdau recorded assetimpairment losses in the quarter of approximately R$2.0 billion related to write-offs of assets in the Brazil Segment, primarily involving fixed assets, with no cash effect. These write-offs were determined based on discounted cash flow projections, asset utilization levels of certain industrial units in Brazil, and the expectation of a deterioration in economic conditions at a magnitude greater than that considered in scenarios from previous periods, as disclosed in Note 29 of the Financial Statements. ADJUSTED NET INCOME (R$ MILLION) AND ADJUSTED NET MARGIN (%) CONSOLIDATED 4Q25 3Q25 ∆ 4Q24 ∆ 12M25 12M24 ∆ Operating Income before Financial Result and Taxes¹ (791) 1,659 - 994 - 3,739 7,488 -50.1% Financial result (349) (223) 56.5% (628) -44.4% (1,215) (2,024) -39.9% Income before taxes¹ (1,140) 1,436 - 366 - 2,524 5,464 -53.8% Income and social contribution taxes (154) (346) -55.5% (43) 260.5% (1,106) (865) 27.9% Exchange variation 43 (40) - 138 -68.8% (142) 297 - Other lines (100) (306) -67.3% (278) -64.0% (867) (1,293) -33.0% Non-recurring items (97) - - 97 - (97) 131 - Net income¹ (1,294) 1,090 - 323 - 1,418 4,599 -69.2% Non-recurring items 1,964 - - 343 472.6% 1,964 (312) - Credit recovery/provisions - - - 440 - - 529 - Result from operations with jointly controlled entities - - - - - - (808) - Impairment of assets 1,964 - - - - 1,964 200 883.8% Compulsory loan recovery Eletrobras - - - - - - (101) - Income tax and social contribution - non-recurring items - - - (97) - - (131) - Adjusted net income² 670 1,090 -38.5% 666 0.5% 3,382 4,288 -21.1% Earnings per share³ (0.66) 0.54 -221.3% 0.15 - 0.69 2.18 -68.3% |
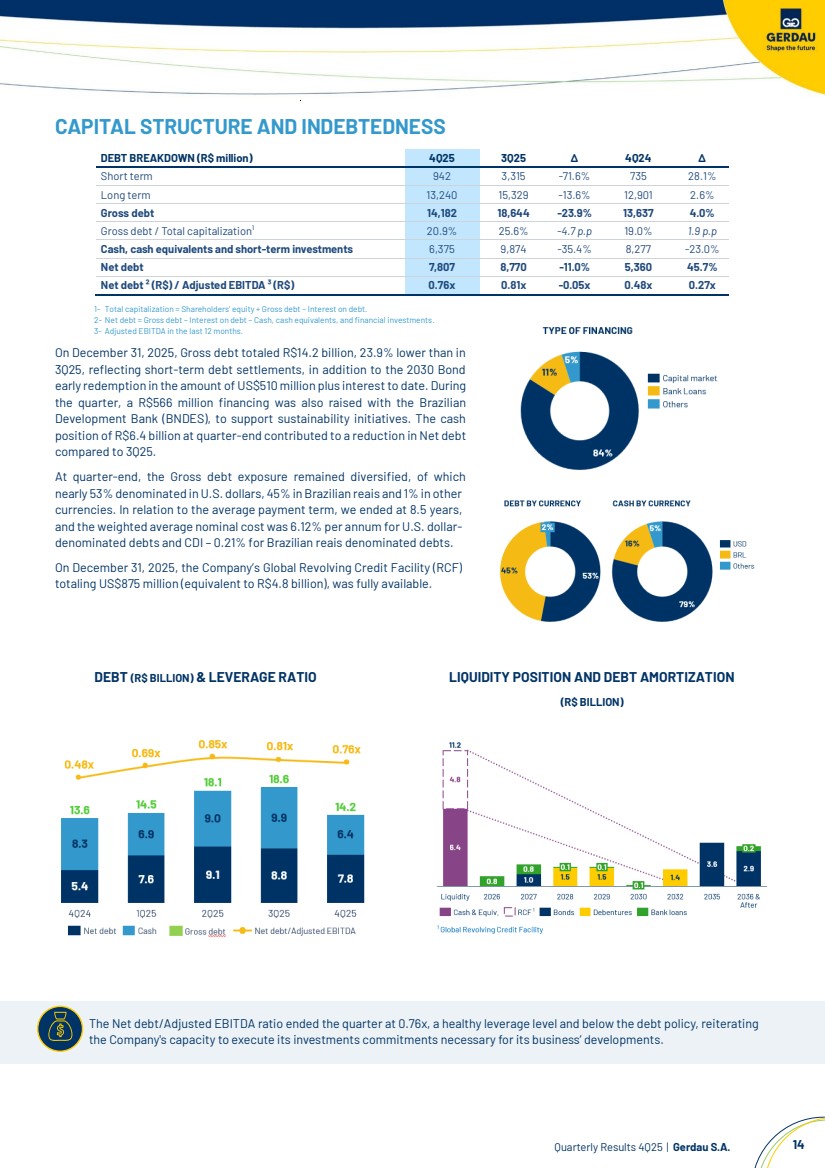
| Quarterly Results 4Q25 | Gerdau S.A. 14 The Net debt/Adjusted EBITDA ratio ended the quarter at 0.76x, a healthy leverage level and below the debt policy, reiterating the Company's capacity to execute its investments commitments necessary for its business’ developments. CAPITAL STRUCTURE AND INDEBTEDNESS DEBT BREAKDOWN (R$ million) 4Q25 3Q25 ∆ 4Q24 ∆ Short term 942 3,315 -71.6% 735 28.1% Long term 13,240 15,329 -13.6% 12,901 2.6% Gross debt 14,182 18,644 -23.9% 13,637 4.0% Gross debt / Total capitalization¹ 20.9% 25.6% -4.7 p.p 19.0% 1.9 p.p Cash, cash equivalents and short-term investments 6,375 9,874 -35.4% 8,277 -23.0% Net debt 7,807 8,770 -11.0% 5,360 45.7% Net debt ² (R$) / Adjusted EBITDA ³ (R$) 0.76x 0.81x -0.05x 0.48x 0.27x 1- Total capitalization = Shareholders’ equity + Gross debt – Interest on debt. 2- Net debt = Gross debt – Interest on debt – Cash, cash equivalents, and financial investments. 3- Adjusted EBITDA in the last 12 months. On December 31, 2025, Gross debt totaled R$14.2 billion, 23.9% lower than in 3Q25, reflecting short-term debt settlements, in addition to the 2030 Bond early redemption in the amount of US$510 million plus interest to date. During the quarter, a R$566 million financing was also raised with the Brazilian Development Bank (BNDES), to support sustainability initiatives. The cash position of R$6.4 billion at quarter-end contributed to a reduction in Net debt compared to 3Q25. At quarter-end, the Gross debt exposure remained diversified, of which nearly 53% denominated in U.S. dollars, 45% in Brazilian reais and 1% in other currencies. In relation to the average payment term, we ended at 8.5 years, and the weighted average nominal cost was 6.12% per annum for U.S. dollar-denominated debts and CDI – 0.21% for Brazilian reais denominated debts. On December 31, 2025, the Company’s Global Revolving Credit Facility (RCF) totaling US$875 million (equivalent to R$4.8 billion), was fully available. DEBT (R$ BILLION) & LEVERAGE RATIO LIQUIDITY POSITION AND DEBT AMORTIZATION (R$ BILLION) |
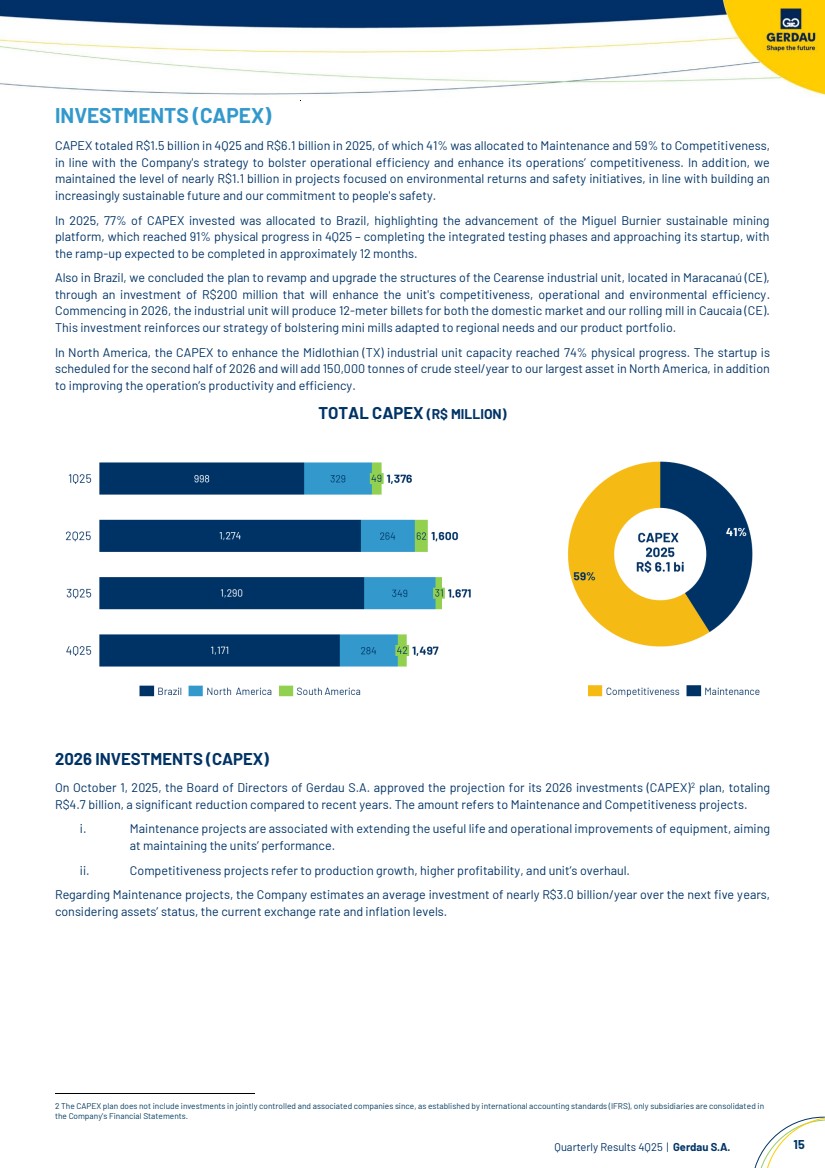
| Quarterly Results 4Q25 | Gerdau S.A. 15 INVESTMENTS (CAPEX) CAPEX totaled R$1.5 billion in 4Q25 and R$6.1 billion in 2025, of which 41% was allocated to Maintenance and 59% to Competitiveness, in line with the Company's strategy to bolster operational efficiency and enhance its operations’ competitiveness. In addition, we maintained the level of nearly R$1.1 billion in projects focused on environmental returns and safety initiatives, in line with building an increasingly sustainable future and our commitment to people's safety. In 2025, 77% of CAPEX invested was allocated to Brazil, highlighting the advancement of the Miguel Burnier sustainable mining platform, which reached 91% physical progress in 4Q25 – completing the integrated testing phases and approaching its startup, with the ramp-up expected to be completed in approximately 12 months. Also in Brazil, we concluded the plan to revamp and upgrade the structures of the Cearense industrial unit, located in Maracanaú (CE), through an investment of R$200 million that will enhance the unit's competitiveness, operational and environmental efficiency. Commencing in 2026, the industrial unit will produce 12-meter billets for both the domestic market and our rolling mill in Caucaia (CE). This investment reinforces our strategy of bolstering mini mills adapted to regional needs and our product portfolio. In North America, the CAPEX to enhance the Midlothian (TX) industrial unit capacity reached 74% physical progress. The startup is scheduled for the second half of 2026 and will add 150,000 tonnes of crude steel/year to our largest asset in North America, in addition to improving the operation’s productivity and efficiency. TOTAL CAPEX (R$ MILLION) 2026 INVESTMENTS (CAPEX) On October 1, 2025, the Board of Directors of Gerdau S.A. approved the projection for its 2026 investments (CAPEX)2 plan, totaling R$4.7 billion, a significant reduction compared to recent years. The amount refers to Maintenance and Competitiveness projects. i. Maintenance projects are associated with extending the useful life and operational improvements of equipment, aiming at maintaining the units’ performance. ii. Competitiveness projects refer to production growth, higher profitability, and unit’s overhaul. Regarding Maintenance projects, the Company estimates an average investment of nearly R$3.0 billion/year over the next five years, considering assets’ status, the current exchange rate and inflation levels. 2 The CAPEX plan does not include investments in jointly controlled and associated companies since, as established by international accounting standards (IFRS), only subsidiaries are consolidated in the Company's Financial Statements. |
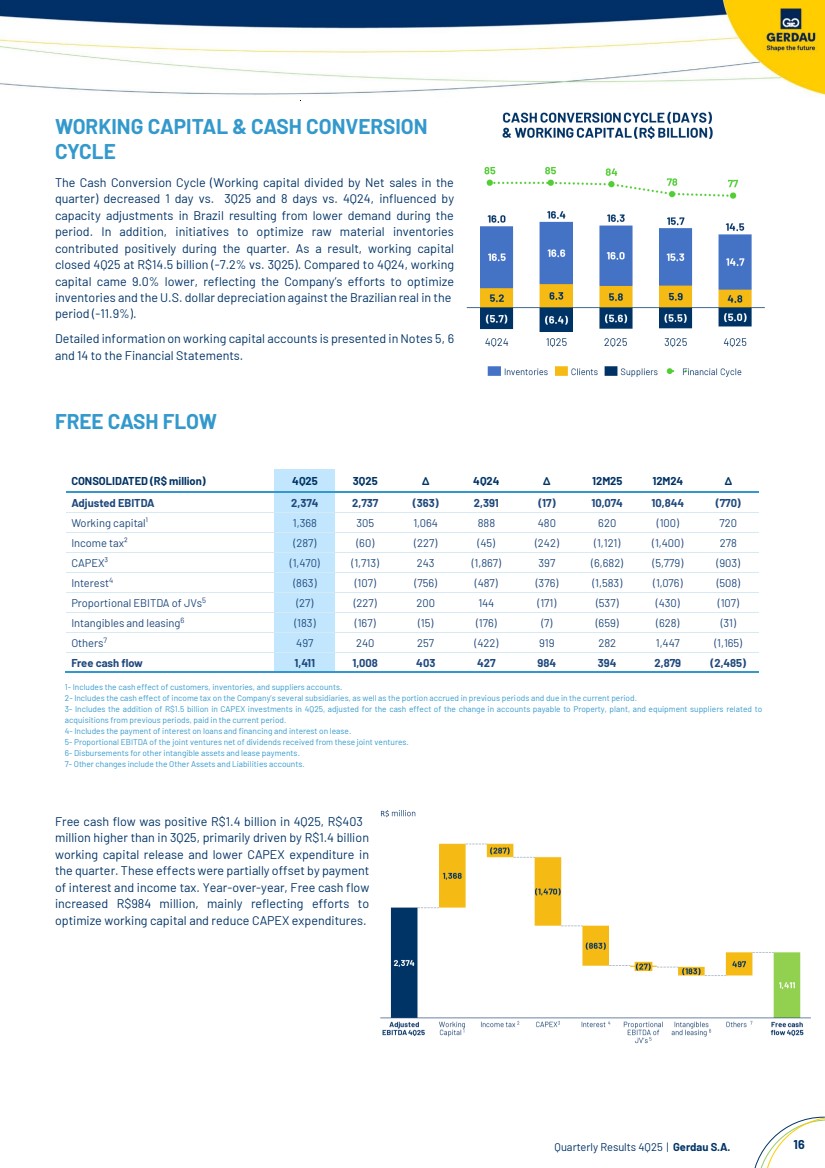
| Quarterly Results 4Q25 | Gerdau S.A. 16 WORKING CAPITAL & CASH CONVERSION CYCLE The Cash Conversion Cycle (Working capital divided by Net sales in the quarter) decreased 1 day vs. 3Q25 and 8 days vs. 4Q24, influenced by capacity adjustments in Brazil resulting from lower demand during the period. In addition, initiatives to optimize raw material inventories contributed positively during the quarter. As a result, working capital closed 4Q25 at R$14.5 billion (-7.2% vs. 3Q25). Compared to 4Q24, working capital came 9.0% lower, reflecting the Company’s efforts to optimize inventories and the U.S. dollar depreciation against the Brazilian real in the period (-11.9%). Detailed information on working capital accounts is presented inNotes 5, 6 and 14 to the Financial Statements. FREE CASH FLOW CONSOLIDATED (R$ million) 4Q25 3Q25 ∆ 4Q24 ∆ 12M25 12M24 ∆ Adjusted EBITDA 2,374 2,737 (363) 2,391 (17) 10,074 10,844 (770) Working capital¹ 1,368 305 1,064 888 480 620 (100) 720 Income tax² (287) (60) (227) (45) (242) (1,121) (1,400) 278 CAPEX³ (1,470) (1,713) 243 (1,867) 397 (6,682) (5,779) (903) Interest4 (863) (107) (756) (487) (376) (1,583) (1,076) (508) Proportional EBITDA of JVs5 (27) (227) 200 144 (171) (537) (430) (107) Intangibles and leasing6 (183) (167) (15) (176) (7) (659) (628) (31) Others7 497 240 257 (422) 919 282 1,447 (1,165) Free cash flow 1,411 1,008 403 427 984 394 2,879 (2,485) 1- Includes the cash effect of customers, inventories, and suppliers accounts. 2- Includes the cash effect of income tax on the Company’s several subsidiaries, as well as the portion accrued in previous periods and due in the current period. 3- Includes the addition of R$1.5 billion in CAPEX investments in 4Q25, adjusted for the cash effect of the change in accounts payable to Property, plant, and equipment suppliers related to acquisitions from previous periods, paid in the current period. 4- Includes the payment of interest on loans and financing and interest on lease. 5- Proportional EBITDA of the joint ventures net of dividends received from these joint ventures. 6- Disbursements for other intangible assets and lease payments. 7- Other changes include the Other Assets and Liabilities accounts. Free cash flow was positive R$1.4 billion in 4Q25, R$403 million higher than in 3Q25, primarily driven by R$1.4 billion working capital release and lower CAPEX expenditure in the quarter. These effects were partially offset by payment of interest and income tax. Year-over-year, Free cash flow increased R$984 million, mainly reflecting efforts to optimize working capital and reduce CAPEX expenditures. |
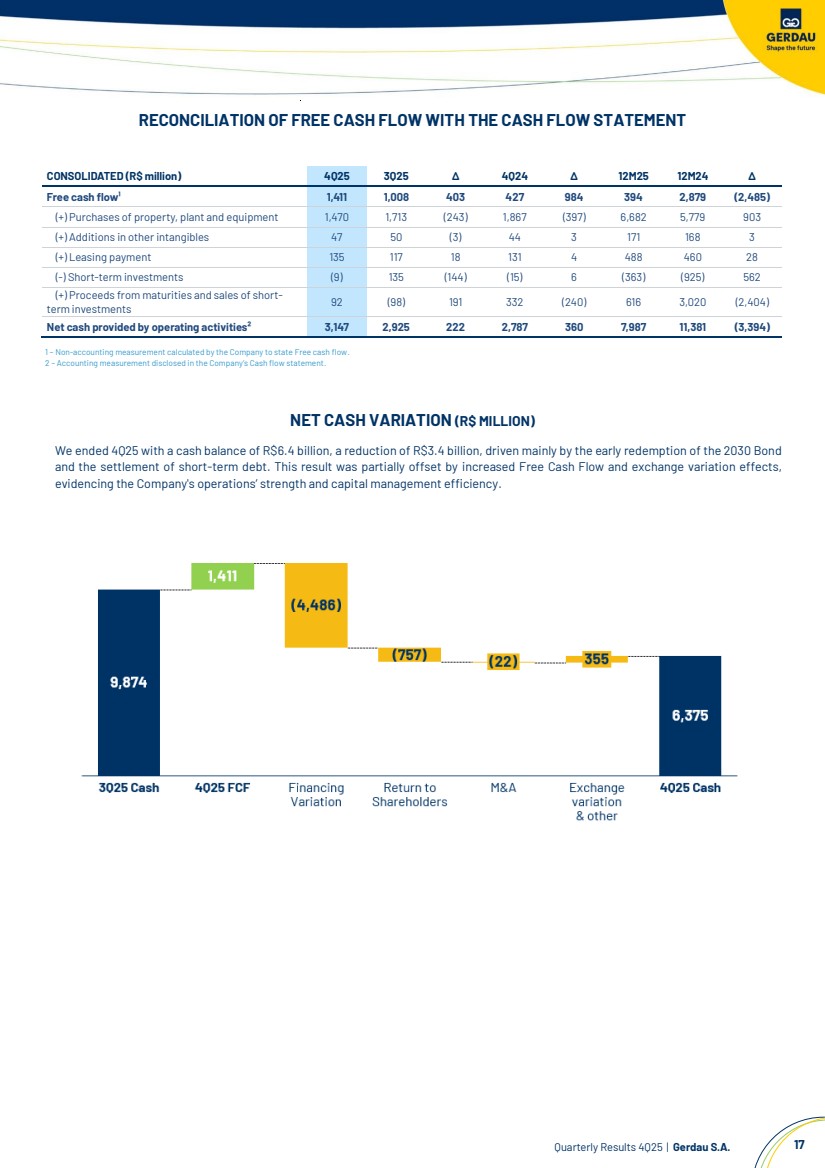
| Quarterly Results 4Q25 | Gerdau S.A. 17 RECONCILIATION OF FREE CASH FLOW WITH THE CASH FLOW STATEMENT 1 – Non-accounting measurement calculated by the Company to state Free cash flow. 2 – Accounting measurement disclosed in the Company’s Cash flow statement. NET CASH VARIATION (R$ MILLION) We ended 4Q25 with a cash balance of R$6.4 billion, a reduction of R$3.4 billion, driven mainly by the early redemption of the 2030 Bond and the settlement of short-term debt. This result was partially offset by increased Free Cash Flow and exchange variation effects, evidencing the Company's operations’ strength and capital management efficiency. CONSOLIDATED (R$ million) 4Q25 3Q25 ∆ 4Q24 ∆ 12M25 12M24 ∆ Free cash flow¹ 1,411 1,008 403 427 984 394 2,879 (2,485) (+) Purchases of property, plant and equipment 1,470 1,713 (243) 1,867 (397) 6,682 5,779 903 (+) Additions in other intangibles 47 50 (3) 44 3 171 168 3 (+) Leasing payment 135 117 18 131 4 488 460 28 (-) Short-term investments (9) 135 (144) (15) 6 (363) (925) 562 (+) Proceeds from maturities and sales of short-term investments 92 (98) 191 332 (240) 616 3,020 (2,404) Net cash provided by operating activities² 3,147 2,925 222 2,787 360 7,987 11,381 (3,394) |
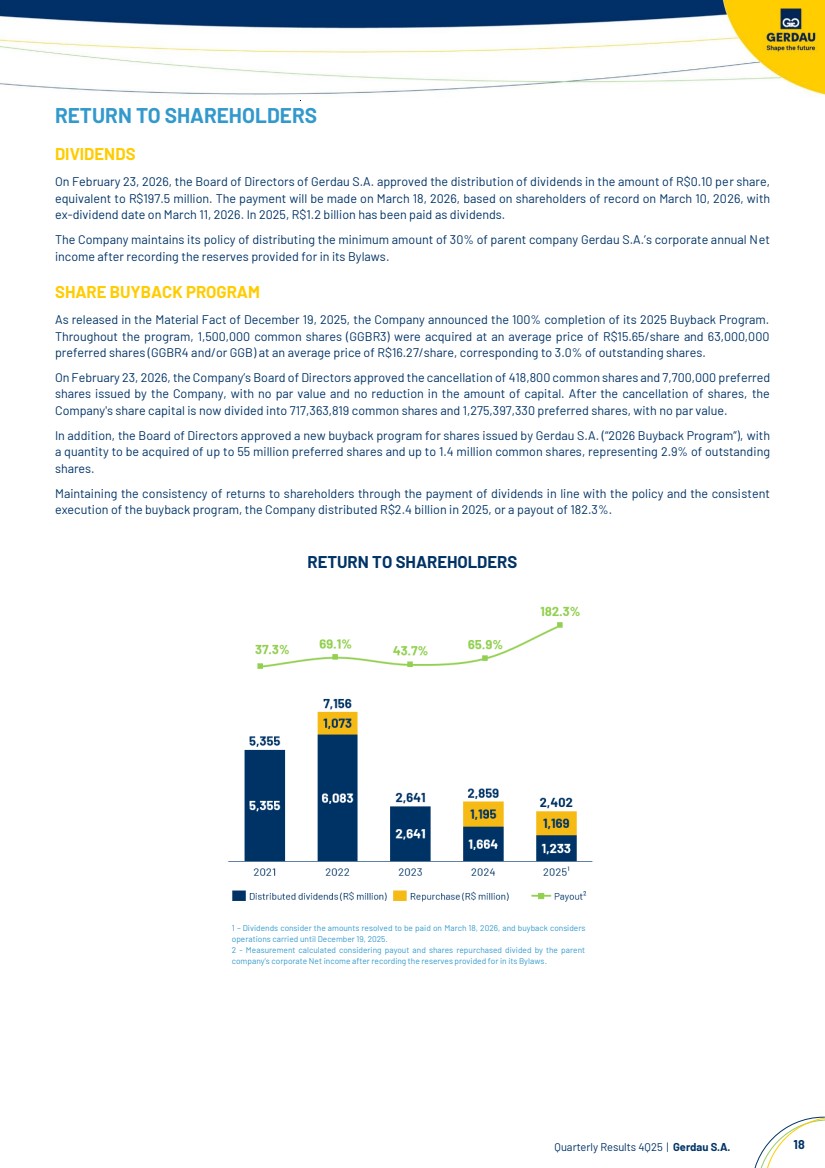
| Quarterly Results 4Q25 | Gerdau S.A. 18 RETURN TO SHAREHOLDERS DIVIDENDS On February 23, 2026, the Board of Directors of Gerdau S.A. approved the distribution of dividends in the amount of R$0.10 per share, equivalent to R$197.5 million. The payment will be made on March 18, 2026, based on shareholders of record on March 10, 2026, with ex-dividend date on March 11, 2026. In 2025, R$1.2 billion has been paid as dividends. The Company maintains its policy of distributing the minimum amount of 30% of parent company Gerdau S.A.’s corporate annual Net income after recording the reserves provided for in its Bylaws. SHARE BUYBACK PROGRAM As released in the Material Fact of December 19, 2025, the Company announced the 100% completion of its 2025 Buyback Program. Throughout the program, 1,500,000 common shares (GGBR3) were acquired at an average price of R$15.65/share and 63,000,000 preferred shares (GGBR4 and/or GGB) at an average price of R$16.27/share, corresponding to 3.0% of outstanding shares. On February 23, 2026, the Company’s Board of Directors approved the cancellation of 418,800 common shares and 7,700,000 preferred shares issued by the Company, with no par value and no reduction in the amount of capital. After the cancellation of shares, the Company's share capital is now divided into 717,363,819 common shares and 1,275,397,330 preferred shares, with no par value. In addition, the Board of Directors approved a new buyback program for shares issued by Gerdau S.A. (“2026 Buyback Program”), with a quantity to be acquired of up to 55 million preferred shares and up to 1.4 million common shares, representing 2.9% of outstanding shares. Maintaining the consistency of returns to shareholders through the payment of dividends in line with the policy and the consistent execution of the buyback program, the Company distributed R$2.4 billion in 2025, or a payout of 182.3%. RETURN TO SHAREHOLDERS 1 – Dividends consider the amounts resolved to be paid on March 18, 2026, and buyback considers operations carried until December 19, 2025. 2 - Measurement calculated considering payout and shares repurchased divided by the parent company’s corporate Net income after recording the reserves provided for in its Bylaws. |
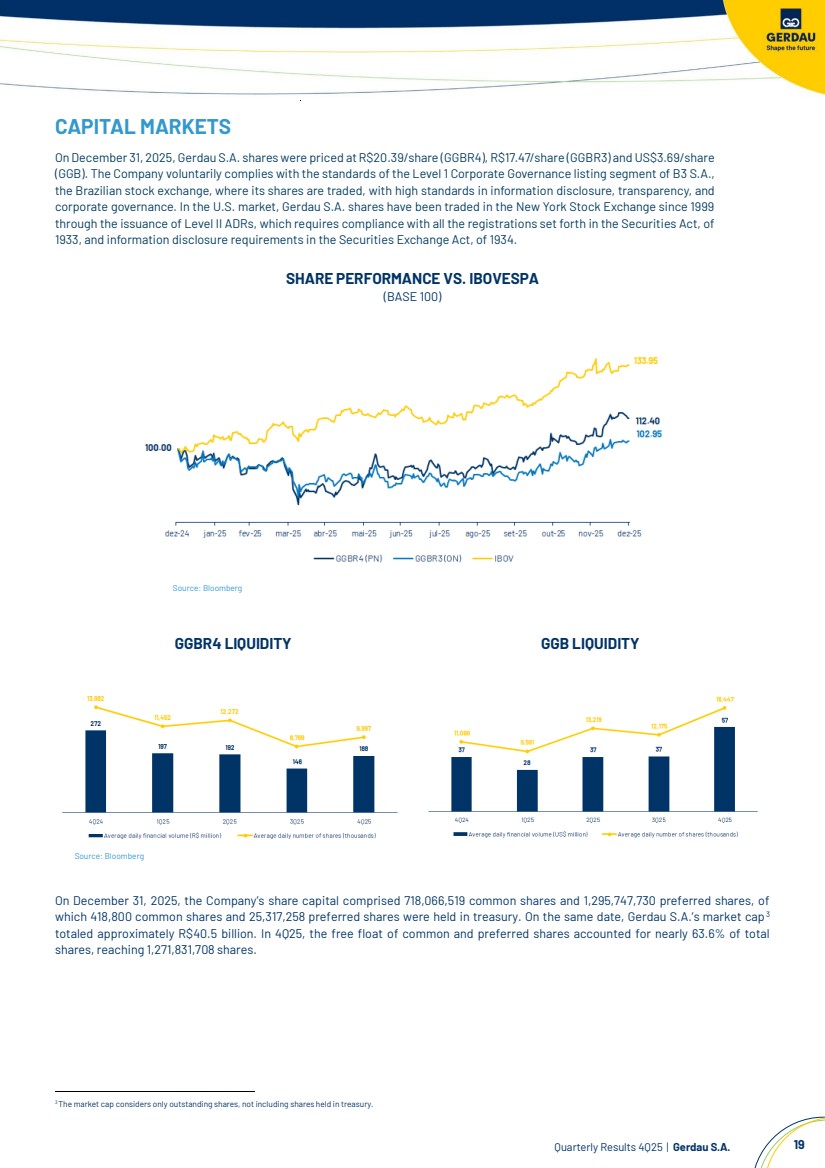
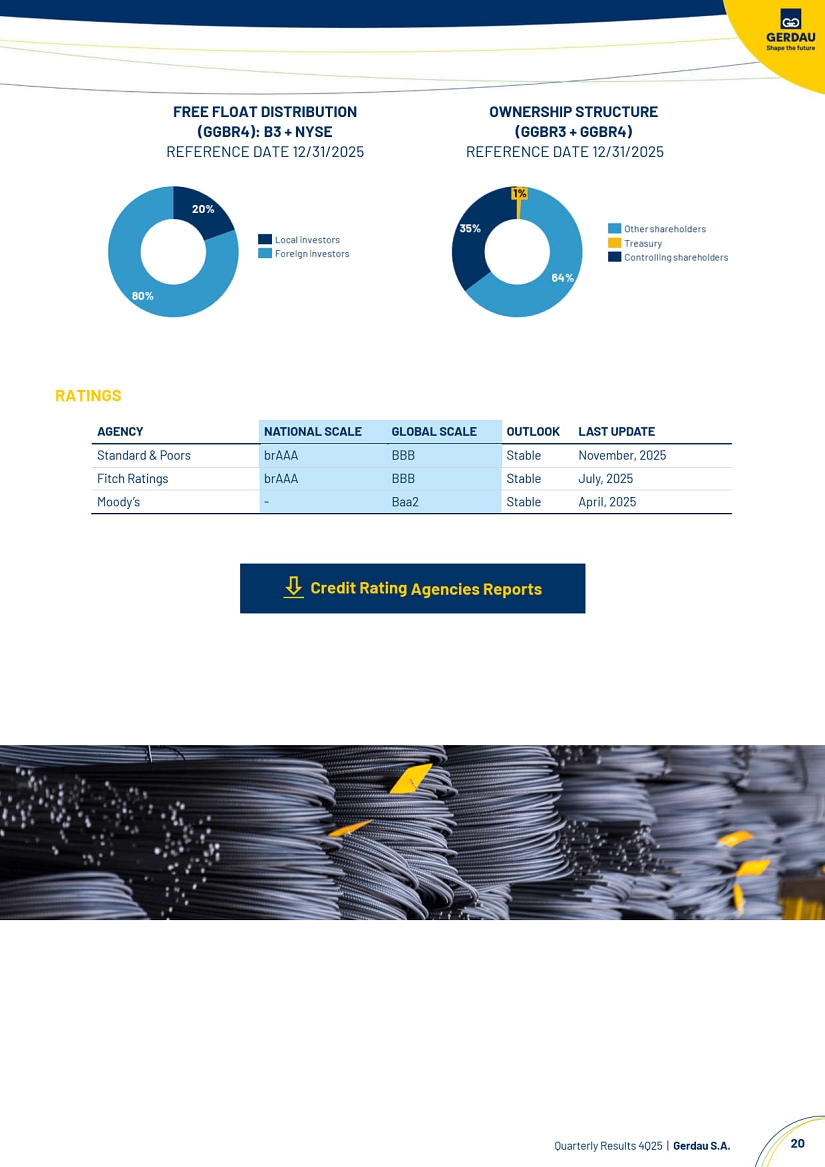
| Quarterly Results 4Q25 | Gerdau S.A. 19 CAPITAL MARKETS On December 31, 2025, Gerdau S.A. shares were priced at R$20.39/share (GGBR4), R$17.47/share (GGBR3) and US$3.69/share (GGB). The Company voluntarily complies with the standards of the Level 1 Corporate Governance listing segment of B3 S.A., the Brazilian stock exchange, where its shares are traded, with high standards in information disclosure, transparency, and corporate governance. In the U.S. market, Gerdau S.A. shares have been traded in the New York Stock Exchange since 1999 through the issuance of Level II ADRs, which requires compliance with all the registrations set forth in the Securities Act, of 1933, and information disclosure requirements in the Securities Exchange Act, of 1934. SHARE PERFORMANCE VS. IBOVESPA (BASE 100) Source: Bloomberg GGBR4 LIQUIDITY GGB LIQUIDITY Source: Bloomberg On December 31, 2025, the Company’s share capital comprised 718,066,519 common shares and 1,295,747,730 preferred shares, of which 418,800 common shares and 25,317,258 preferred shares were held in treasury. On the same date, Gerdau S.A.’s market cap4F 3 totaled approximately R$40.5 billion. In 4Q25, the free float of common and preferred shares accounted for nearly 63.6% of total shares, reaching 1,271,831,708 shares. 3The market cap considers only outstanding shares, not including shares held in treasury. |
| Quarterly Results 4Q25 | Gerdau S.A. 20 FREE FLOAT DISTRIBUTION (GGBR4): B3 + NYSE REFERENCE DATE 12/31/2025 OWNERSHIP STRUCTURE (GGBR3 + GGBR4) REFERENCE DATE 12/31/2025 RATINGS Credit Rating Agencies Reports AGENCY NATIONAL SCALE GLOBAL SCALE OUTLOOK LAST UPDATE Standard & Poors brAAA BBB Stable October, 2024 Fitch Ratings brAAA BBB Stable July, 2025 Moody’s - Baa2 Stable April, 2025 |
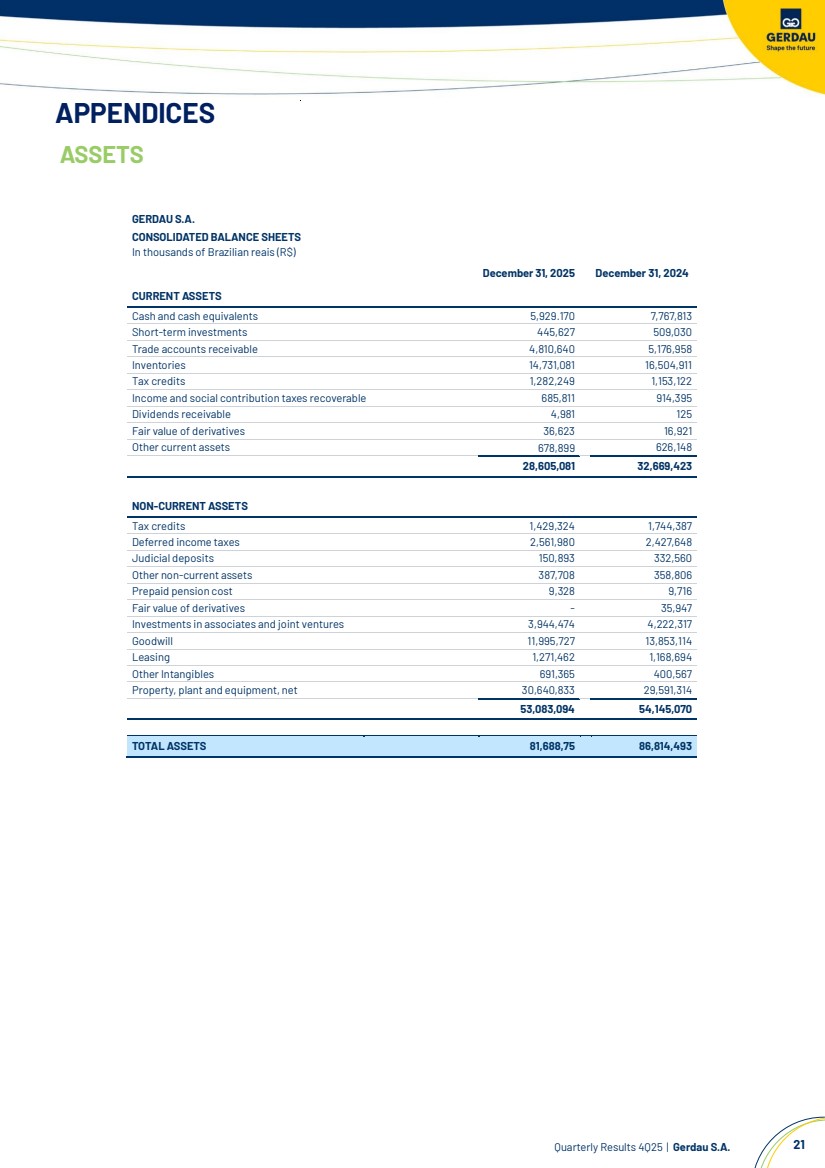
| Quarterly Results 4Q25 | Gerdau S.A. 21 APPENDICES ASSETS GERDAU S.A. CONSOLIDATED BALANCE SHEETS In thousands of Brazilian reais (R$) December 31, 2025 December 31, 2024 CURRENT ASSETS Cash and cash equivalents 5,929.170 7,767,813 Short-term investments 445,627 509,030 Trade accounts receivable 4,810,640 5,176,958 Inventories 14,731,081 16,504,911 Tax credits 1,282,249 1,153,122 Income and social contribution taxes recoverable 685,811 914,395 Dividends receivable 4,981 125 Fair value of derivatives 36,623 16,921 Other current assets 678,899 626,148 28,605,081 32,669,423 NON-CURRENT ASSETS Tax credits 1,429,324 1,744,387 Deferred income taxes 2,561,980 2,427,648 Judicial deposits 150,893 332,560 Other non-current assets 387,708 358,806 Prepaid pension cost 9,328 9,716 Fair value of derivatives - 35,947 Investments in associates and joint ventures 3,944,474 4,222,317 Goodwill 11,995,727 13,853,114 Leasing 1,271,462 1,168,694 Other Intangibles 691,365 400,567 Property, plant and equipment, net 30,640,833 29,591,314 53,083,094 54,145,070 TOTAL ASSETS 81,688,75 86,814,493 |
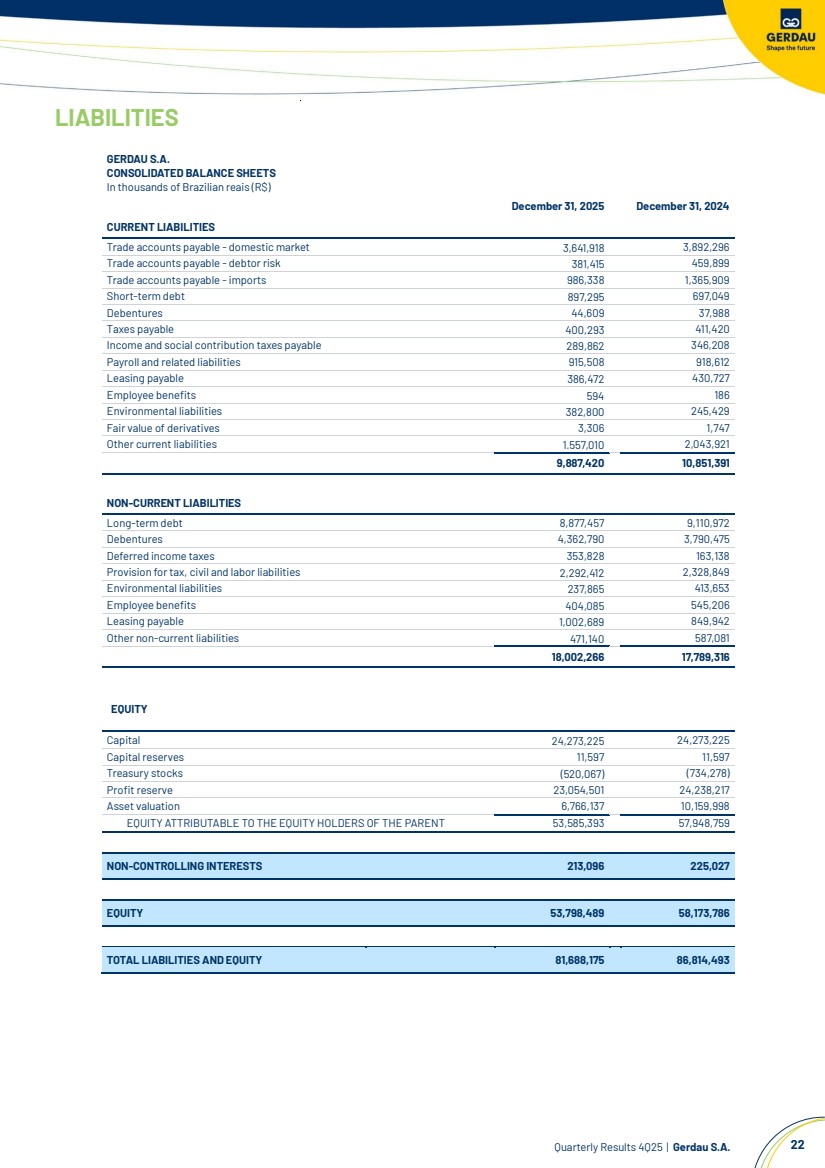
| Quarterly Results 4Q25 | Gerdau S.A. 22 LIABILITIES GERDAU S.A. CONSOLIDATED BALANCE SHEETS In thousands of Brazilian reais (R$) December 31, 2025 December 31, 2024 CURRENT LIABILITIES Trade accounts payable - domestic market 3,641,918 3,892,296 Trade accounts payable - debtor risk 381,415 459,899 Trade accounts payable -imports 986,338 1,365,909 Short-term debt 897,295 697,049 Debentures 44,609 37,988 Taxes payable 400,293 411,420 Income and social contribution taxes payable 289,862 346,208 Payroll and related liabilities 915,508 918,612 Leasing payable 386,472 430,727 Employee benefits 594 186 Environmental liabilities 382,800 245,429 Fair value of derivatives 3,306 1,747 Other current liabilities 1.557,010 2,043,921 9,887,420 10,851,391 NON-CURRENT LIABILITIES Long-term debt 8,877,457 9,110,972 Debentures 4,362,790 3,790,475 Deferred income taxes 353,828 163,138 Provision for tax, civil and labor liabilities 2,292,412 2,328,849 Environmental liabilities 237,865 413,653 Employee benefits 404,085 545,206 Leasing payable 1,002,689 849,942 Other non-current liabilities 471,140 587,081 18,002,266 17,789,316 EQUITY Capital 24,273,225 24,273,225 Capital reserves 11,597 11,597 Treasury stocks (520,067) (734,278) Profit reserve 23,054,501 24,238,217 Asset valuation 6,766,137 10,159,998 EQUITY ATTRIBUTABLE TO THE EQUITY HOLDERS OF THE PARENT 53,585,393 57,948,759 NON-CONTROLLING INTERESTS 213,096 225,027 EQUITY 53,798,489 58,173,786 TOTAL LIABILITIES AND EQUITY 81,688,175 86,814,493 |
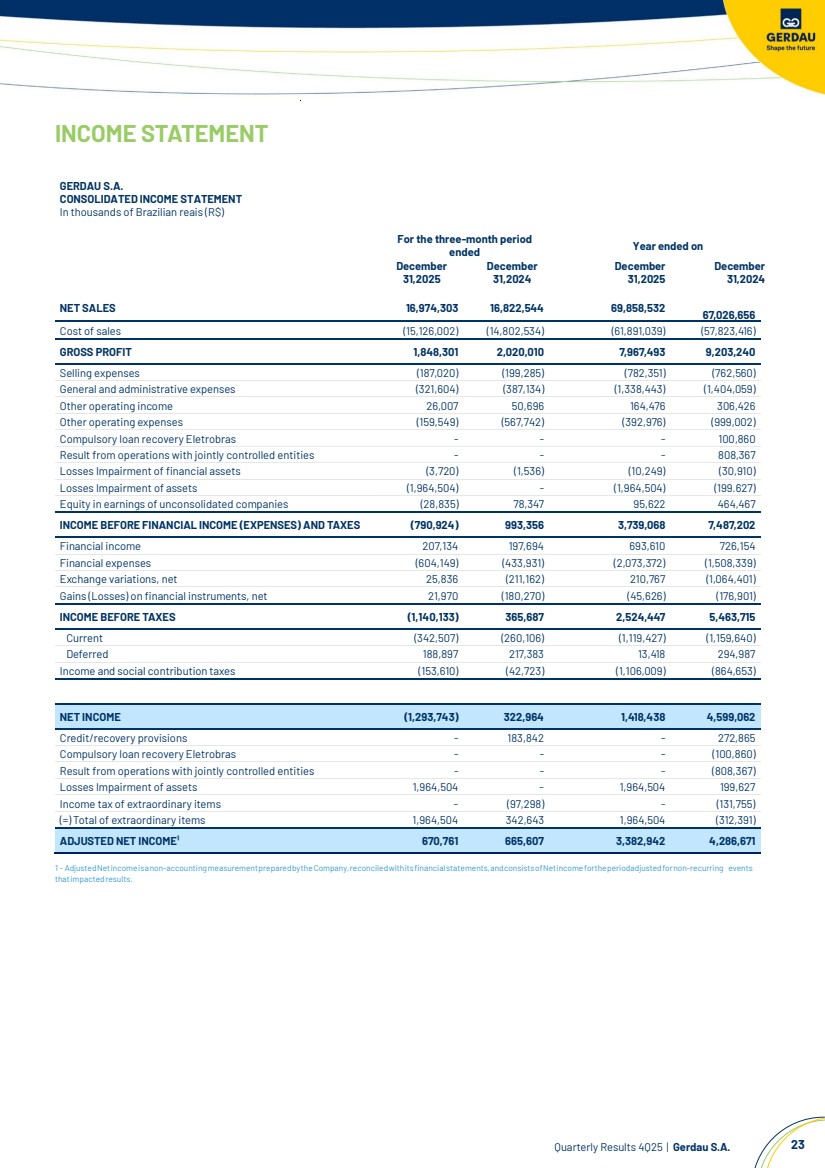
| Quarterly Results 4Q25 | Gerdau S.A. 23 INCOME STATEMENT GERDAU S.A. CONSOLIDATED INCOME STATEMENT In thousands of Brazilian reais (R$) For the three-month period ended Year ended on December 31,2025 December 31,2024 December 31,2025 December 31,2024 NET SALES 16,974,303 16,822,544 69,858,532 67,026,656 Cost of sales (15,126,002) (14,802,534) (61,891,039) (57,823,416) GROSS PROFIT 1,848,301 2,020,010 7,967,493 9,203,240 Selling expenses (187,020) (199,285) (782,351) (762,560) General and administrative expenses (321,604) (387,134) (1,338,443) (1,404,059) Other operating income 26,007 50,696 164,476 306,426 Other operating expenses (159,549) (567,742) (392,976) (999,002) Compulsory loan recovery Eletrobras - - - 100,860 Result from operations with jointly controlled entities - - - 808,367 Losses Impairment of financial assets (3,720) (1,536) (10,249) (30,910) Losses Impairment of assets (1,964,504) - (1,964,504) (199.627) Equity in earnings of unconsolidated companies (28,835) 78,347 95,622 464,467 INCOME BEFORE FINANCIAL INCOME (EXPENSES) AND TAXES (790,924) 993,356 3,739,068 7,487,202 Financial income 207,134 197,694 693,610 726,154 Financial expenses (604,149) (433,931) (2,073,372) (1,508,339) Exchange variations, net 25,836 (211,162) 210,767 (1,064,401) Gains (Losses) on financial instruments, net 21,970 (180,270) (45,626) (176,901) INCOME BEFORE TAXES (1,140,133) 365,687 2,524,447 5,463,715 Current (342,507) (260,106) (1,119,427) (1,159,640) Deferred 188,897 217,383 13,418 294,987 Income and social contribution taxes (153,610) (42,723) (1,106,009) (864,653) NET INCOME (1,293,743) 322,964 1,418,438 4,599,062 Credit/recovery provisions - 183,842 - 272,865 Compulsory loan recovery Eletrobras - - - (100,860) Result from operations with jointly controlled entities - - - (808,367) Losses Impairment of assets 1,964,504 - 1,964,504 199,627 Income tax of extraordinary items - (97,298) - (131,755) (=) Total of extraordinary items 1,964,504 342,643 1,964,504 (312,391) ADJUSTED NET INCOME¹ 670,761 665,607 3,382,942 4,286,671 1 - AdjustedNetincomeisanon-accountingmeasurementpreparedbytheCompany,reconciledwithitsfinancialstatements,andconsistsofNetincomefortheperiodadjustedfornon-recurring events thatimpactedresults. |
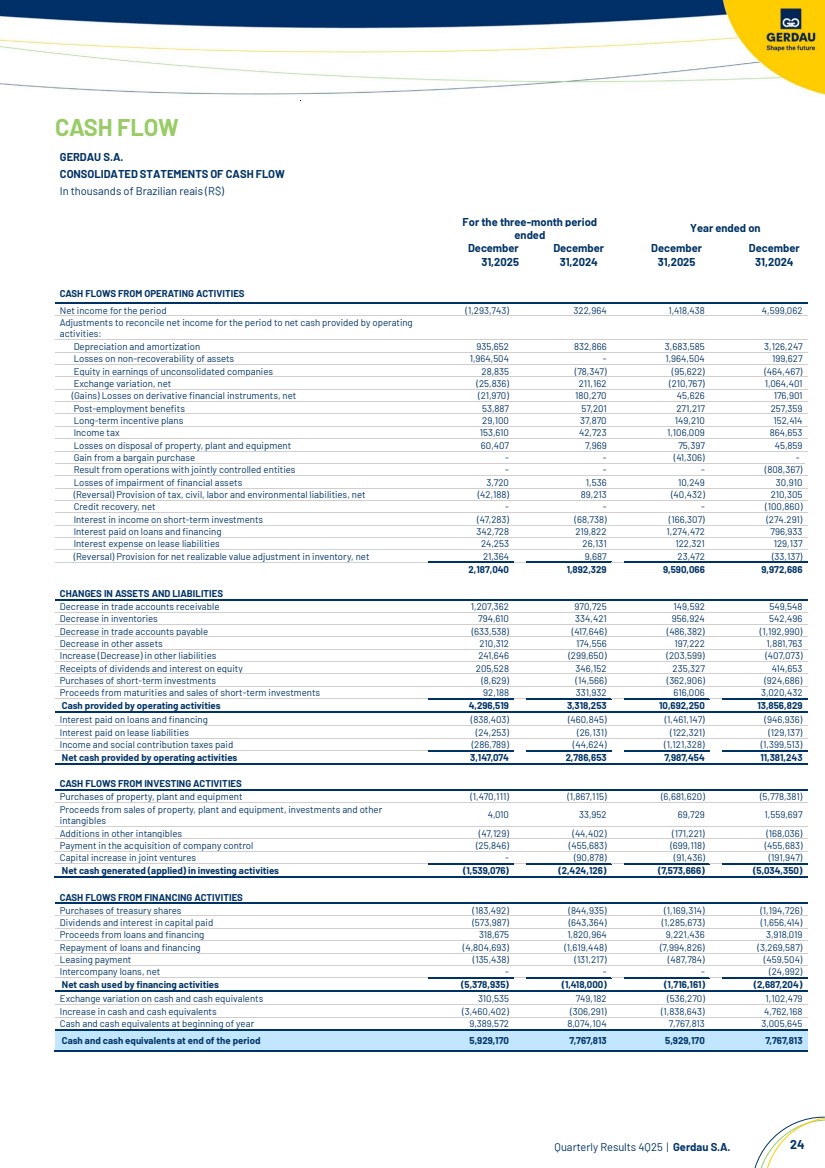
| Quarterly Results 4Q25 | Gerdau S.A. 24 CASH FLOW GERDAU S.A. CONSOLIDATED STATEMENTS OF CASH FLOW In thousands of Brazilian reais (R$) For the three-month period ended Year ended on December 31,2025 December 31,2024 December 31,2025 December 31,2024 CASH FLOWS FROM OPERATING ACTIVITIES Net income for the period (1,293,743) 322,964 1,418,438 4,599,062 Adjustments to reconcile net income for the period to net cash provided by operating activities: Depreciation and amortization 935,652 832,866 3,683,585 3,126,247 Losses on non-recoverability of assets 1,964,504 - 1,964,504 199,627 Equity in earnings of unconsolidated companies 28,835 (78,347) (95,622) (464,467) Exchange variation, net (25,836) 211,162 (210,767) 1,064,401 (Gains) Losses on derivative financial instruments, net (21,970) 180,270 45,626 176,901 Post-employment benefits 53,887 57,201 271,217 257,359 Long-term incentive plans 29,100 37,870 149,210 152,414 Income tax 153,610 42,723 1,106,009 864,653 Losses on disposal of property, plant and equipment 60,407 7,969 75,397 45,859 Gain from a bargain purchase - - (41,306) - Result from operations with jointly controlled entities - - - (808,367) Losses of impairment of financial assets 3,720 1,536 10,249 30,910 (Reversal) Provision of tax, civil, labor and environmental liabilities, net (42,188) 89,213 (40,432) 210,305 Credit recovery, net - - - (100,860) Interest in income on short-term investments (47,283) (68,738) (166,307) (274.291) Interest paid on loans and financing 342,728 219,822 1,274,472 796,933 Interest expense on lease liabilities 24,253 26,131 122,321 129,137 (Reversal) Provision for net realizable value adjustment in inventory, net 21,364 9,687 23,472 (33,137) 2,187,040 1,892,329 9,590,066 9,972,686 CHANGES IN ASSETS AND LIABILITIES Decrease in trade accounts receivable 1,207,362 970,725 149,592 549,548 Decrease in inventories 794,610 334,421 956,924 542,496 Decrease in trade accounts payable (633,538) (417,646) (486,382) (1,192,990) Decrease in other assets 210,312 174,556 197,222 1,881,763 Increase (Decrease) in other liabilities 241,646 (299,650) (203,599) (407,073) Receipts of dividends and interest on equity 205,528 346,152 235,327 414,653 Purchases of short-term investments (8,629) (14,566) (362,906) (924,686) Proceeds from maturities and sales of short-term investments 92,188 331,932 616,006 3,020,432 Cash provided by operating activities 4,296,519 3,318,253 10,692,250 13,856,829 Interest paid on loans and financing (838,403) (460,845) (1,461,147) (946,936) Interest paid on lease liabilities (24,253) (26,131) (122,321) (129,137) Income and social contribution taxes paid (286,789) (44,624) (1,121,328) (1,399,513) Net cash provided by operating activities 3,147,074 2,786,653 7,987,454 11,381,243 CASH FLOWS FROM INVESTING ACTIVITIES Purchases of property, plant and equipment (1,470,111) (1,867,115) (6,681,620) (5,778,381) Proceeds from sales of property, plant and equipment, investments and other intangibles 4,010 33,952 69,729 1,559,697 Additions in other intangibles (47,129) (44,402) (171,221) (168,036) Payment in the acquisition of company control (25,846) (455,683) (699,118) (455,683) Capital increase in joint ventures - (90,878) (91,436) (191,947) Net cash generated (applied) in investing activities (1,539,076) (2,424,126) (7,573,666) (5,034,350) CASH FLOWS FROM FINANCING ACTIVITIES Purchases of treasury shares (183,492) (844,935) (1,169,314) (1,194,726) Dividends and interest in capital paid (573,987) (643,364) (1,285,673) (1,656,414) Proceeds from loans and financing 318,675 1,820,964 9,221,436 3,918,019 Repayment of loans and financing (4,804,693) (1,619,448) (7,994,826) (3,269,587) Leasing payment (135,438) (131,217) (487,784) (459,504) Intercompany loans, net - - - (24,992) Net cash used by financing activities (5,378,935) (1,418,000) (1,716,161) (2,687,204) Exchange variation on cash and cash equivalents 310,535 749,182 (536,270) 1,102,479 Increase in cash and cash equivalents (3,460,402) (306,291) (1,838,643) 4,762,168 Cash and cash equivalents at beginning of year 9,389,572 8,074,104 7,767,813 3,005,645 Cash and cash equivalents at end of the period 5,929,170 7,767,813 5,929,170 7,767,813 |
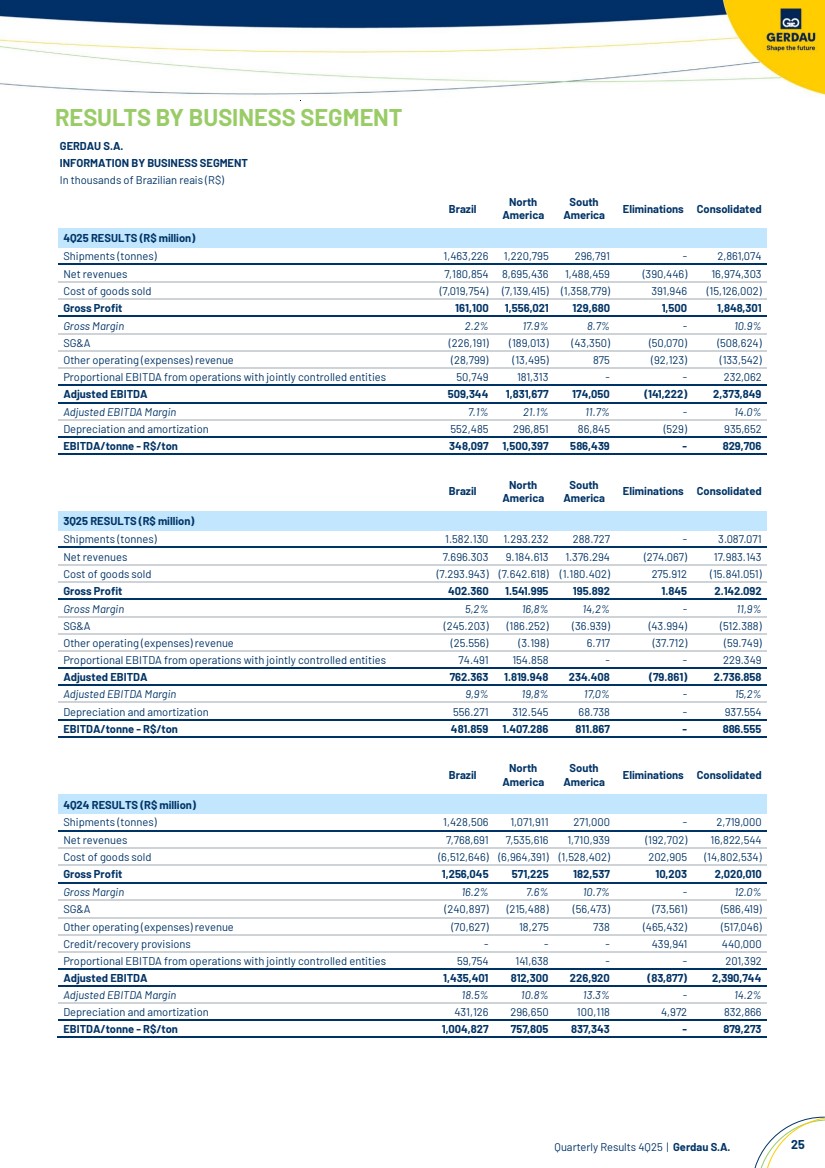
| Quarterly Results 4Q25 | Gerdau S.A. 25 RESULTS BY BUSINESS SEGMENT GERDAU S.A. INFORMATION BY BUSINESS SEGMENT In thousands of Brazilian reais (R$) Brazil North America South America Eliminations Consolidated 4Q25 RESULTS (R$ million) Shipments (tonnes) 1,463,226 1,220,795 296,791 - 2,861,074 Net revenues 7,180,854 8,695,436 1,488,459 (390,446) 16,974,303 Cost of goods sold (7,019,754) (7,139,415) (1,358,779) 391,946 (15,126,002) Gross Profit 161,100 1,556,021 129,680 1,500 1,848,301 Gross Margin 2.2% 17.9% 8.7% - 10.9% SG&A (226,191) (189,013) (43,350) (50,070) (508,624) Other operating (expenses) revenue (28,799) (13,495) 875 (92,123) (133,542) Proportional EBITDA from operations with jointly controlled entities 50,749 181,313 - - 232,062 Adjusted EBITDA 509,344 1,831,677 174,050 (141,222) 2,373,849 Adjusted EBITDA Margin 7.1% 21.1% 11.7% - 14.0% Depreciation and amortization 552,485 296,851 86,845 (529) 935,652 EBITDA/tonne - R$/ton 348,097 1,500,397 586,439 - 829,706 Brazil North America South America Eliminations Consolidated 3Q25 RESULTS (R$ million) Shipments (tonnes) 1.582.130 1.293.232 288.727 - 3.087.071 Net revenues 7.696.303 9.184.613 1.376.294 (274.067) 17.983.143 Cost of goods sold (7.293.943) (7.642.618) (1.180.402) 275.912 (15.841.051) Gross Profit 402.360 1.541.995 195.892 1.845 2.142.092 Gross Margin 5,2% 16,8% 14,2% - 11,9% SG&A (245.203) (186.252) (36.939) (43.994) (512.388) Other operating (expenses) revenue (25.556) (3.198) 6.717 (37.712) (59.749) Proportional EBITDA from operations with jointly controlled entities 74.491 154.858 - - 229.349 Adjusted EBITDA 762.363 1.819.948 234.408 (79.861) 2.736.858 Adjusted EBITDA Margin 9,9% 19,8% 17,0% - 15,2% Depreciation and amortization 556.271 312.545 68.738 - 937.554 EBITDA/tonne - R$/ton 481.859 1.407.286 811.867 - 886.555 Brazil North America South America Eliminations Consolidated 4Q24 RESULTS (R$ million) Shipments (tonnes) 1,428,506 1,071,911 271,000 - 2,719,000 Net revenues 7,768,691 7,535,616 1,710,939 (192,702) 16,822,544 Cost of goods sold (6,512,646) (6,964,391) (1,528,402) 202,905 (14,802,534) Gross Profit 1,256,045 571,225 182,537 10,203 2,020,010 Gross Margin 16.2% 7.6% 10.7% - 12.0% SG&A (240,897) (215,488) (56,473) (73,561) (586,419) Other operating (expenses) revenue (70,627) 18,275 738 (465,432) (517,046) Credit/recovery provisions - - - 439,941 440,000 Proportional EBITDA from operations with jointly controlled entities 59,754 141,638 - - 201,392 Adjusted EBITDA 1,435,401 812,300 226,920 (83,877) 2,390,744 Adjusted EBITDA Margin 18.5% 10.8% 13.3% - 14.2% Depreciation and amortization 431,126 296,650 100,118 4,972 832,866 EBITDA/tonne - R$/ton 1,004,827 757,805 837,343 - 879,273 |
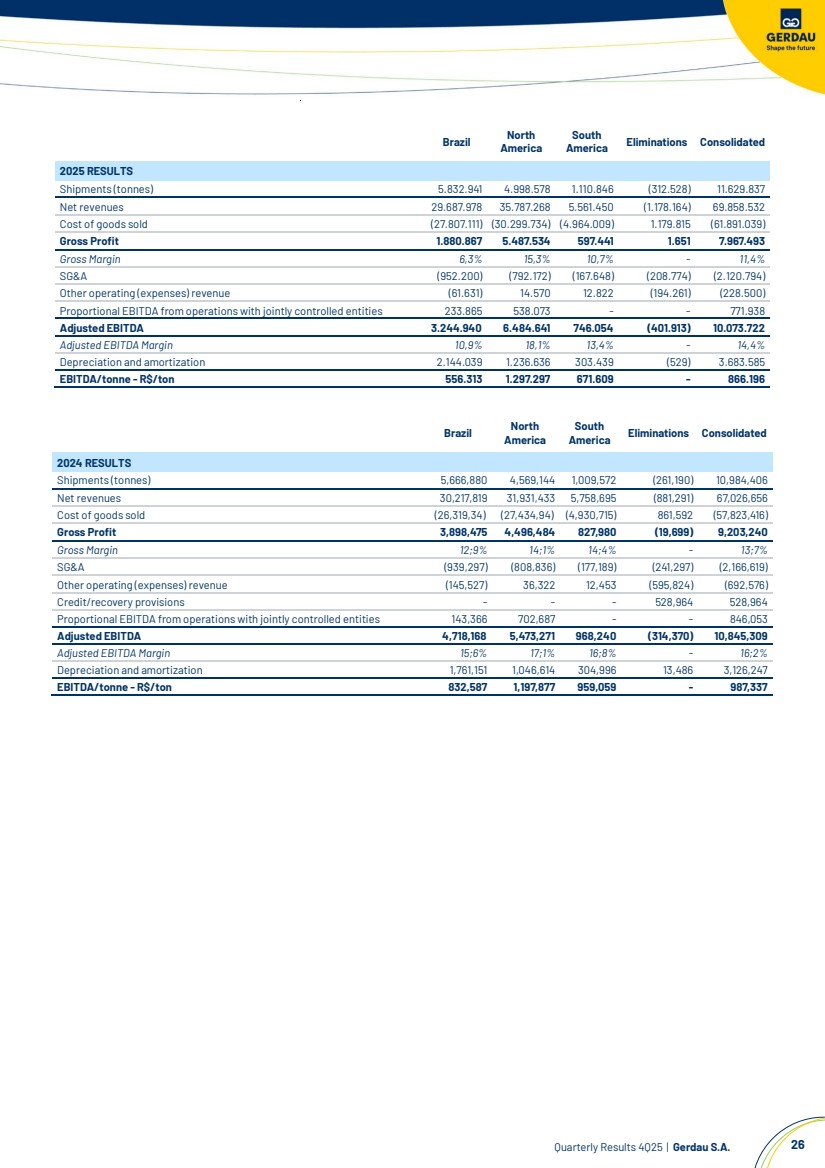
| Quarterly Results 4Q25 | Gerdau S.A. 26 Brazil North America South America Eliminations Consolidated 2025 RESULTS Shipments (tonnes) 5.832.941 4.998.578 1.110.846 (312.528) 11.629.837 Net revenues 29.687.978 35.787.268 5.561.450 (1.178.164) 69.858.532 Cost of goods sold (27.807.111) (30.299.734) (4.964.009) 1.179.815 (61.891.039) Gross Profit 1.880.867 5.487.534 597.441 1.651 7.967.493 Gross Margin 6,3% 15,3% 10,7% - 11,4% SG&A (952.200) (792.172) (167.648) (208.774) (2.120.794) Other operating (expenses) revenue (61.631) 14.570 12.822 (194.261) (228.500) Proportional EBITDA from operations with jointly controlled entities 233.865 538.073 - - 771.938 Adjusted EBITDA 3.244.940 6.484.641 746.054 (401.913) 10.073.722 Adjusted EBITDA Margin 10,9% 18,1% 13,4% - 14,4% Depreciation and amortization 2.144.039 1.236.636 303.439 (529) 3.683.585 EBITDA/tonne - R$/ton 556.313 1.297.297 671.609 - 866.196 Brazil North America South America Eliminations Consolidated 2024 RESULTS Shipments (tonnes) 5,666,880 4,569,144 1,009,572 (261,190) 10,984,406 Net revenues 30,217,819 31,931,433 5,758,695 (881,291) 67,026,656 Cost of goods sold (26,319,34) (27,434,94) (4,930,715) 861,592 (57,823,416) Gross Profit 3,898,475 4,496,484 827,980 (19,699) 9,203,240 Gross Margin 12;9% 14;1% 14;4% - 13;7% SG&A (939,297) (808,836) (177,189) (241,297) (2,166,619) Other operating (expenses) revenue (145,527) 36,322 12,453 (595,824) (692,576) Credit/recovery provisions - - - 528,964 528,964 Proportional EBITDA from operations with jointly controlled entities 143,366 702,687 - - 846,053 Adjusted EBITDA 4,718,168 5,473,271 968,240 (314,370) 10,845,309 Adjusted EBITDA Margin 15;6% 17;1% 16;8% - 16;2% Depreciation and amortization 1,761,151 1,046,614 304,996 13,486 3,126,247 EBITDA/tonne - R$/ton 832,587 1,197,877 959,059 - 987,337 |
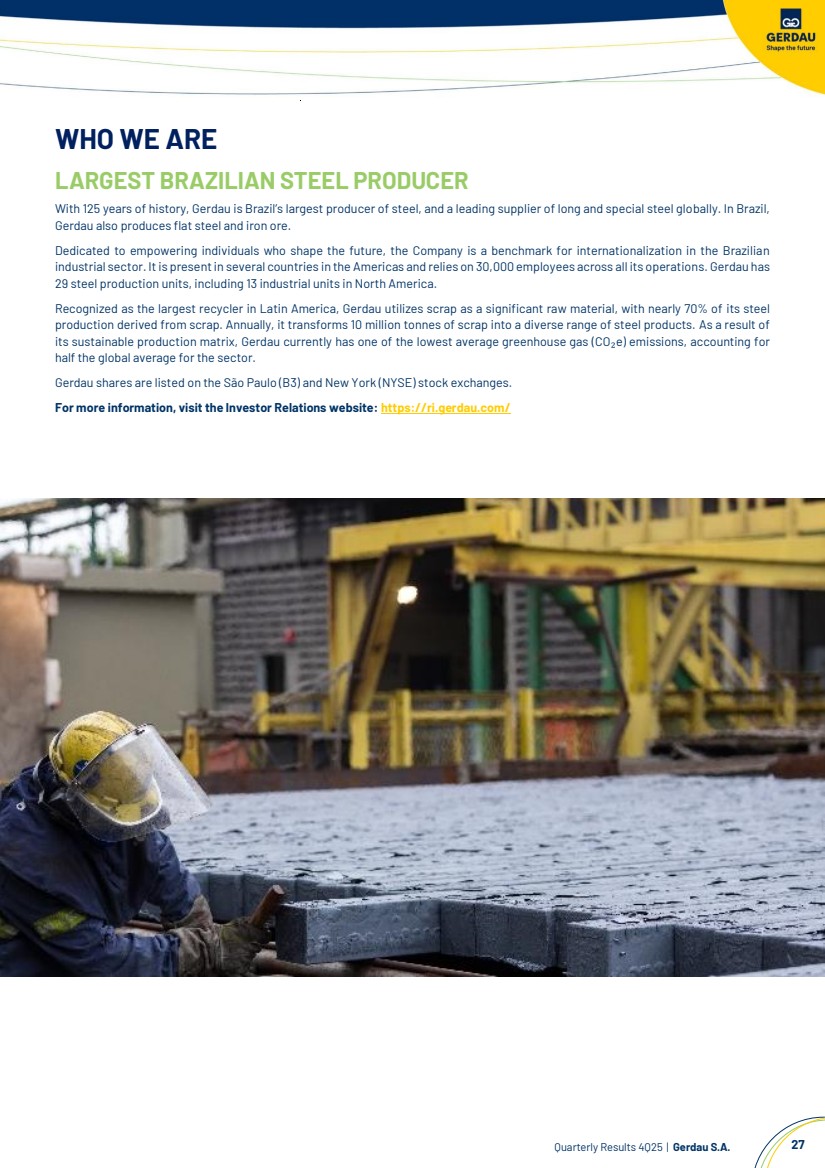
| Quarterly Results 4Q25 | Gerdau S.A. 27 WHO WE ARE LARGEST BRAZILIAN STEEL PRODUCER With 125 years of history, Gerdau is Brazil’s largest producer of steel, and a leading supplier of long and special steel globally. In Brazil, Gerdau also produces flat steel and iron ore. Dedicated to empowering individuals who shape the future, the Company is a benchmark for internationalization in the Brazilian industrial sector. It is present in several countries in the Americas and relies on 30,000 employees across all its operations. Gerdau has 29 steel production units, including 13 industrial units in North America. Recognized as the largest recycler in Latin America, Gerdau utilizes scrap as a significant raw material, with nearly 70% of its steel production derived from scrap. Annually, it transforms 10 million tonnes of scrap into a diverse range of steel products. As a result of its sustainable production matrix, Gerdau currently has one of the lowest average greenhouse gas (CO₂e) emissions, accounting for half the global average for the sector. Gerdau shares are listed on the São Paulo (B3) and New York (NYSE) stock exchanges. For more information, visit the Investor Relations website: https://ri.gerdau.com/ |
| Rafael Japur Vice President and Investor Relations Officer Mariana Velho Dutra IR Manager Ariana De Cesare Renata Albuquerque Arthur Alves Trovo Adriana Costa Adriana Costa Adriana Siga a Gerdau nas Redes Sociais IR CONTACTS Investor Relations website: http://ri.gerdau.com/ IR e-mail: inform@gerdau.com Press e-mail: atendimentogerdau.br@bcw-global.com |