| 4Q25 Earnings Release February 24th, 2026 |
| DISCLAIMER This document may contain forward-looking statements. These statements are based on estimates, information or methods that may be incorrect or inaccurate and that may not occur. These estimates are also subject to risks, uncertainties, and assumptions that include, among other factors, general economic, political, and commercial conditions in Brazil and in the markets where we operate, as well as existing and future government regulations. Potential investors are cautioned that these forward-looking statements do not constitute guarantees of future performance, given that they involve risks and uncertainties. Gerdau does not undertake, and expressly waives, any obligation to update any of these forward-looking statements, which speak only as of the date they were made . |
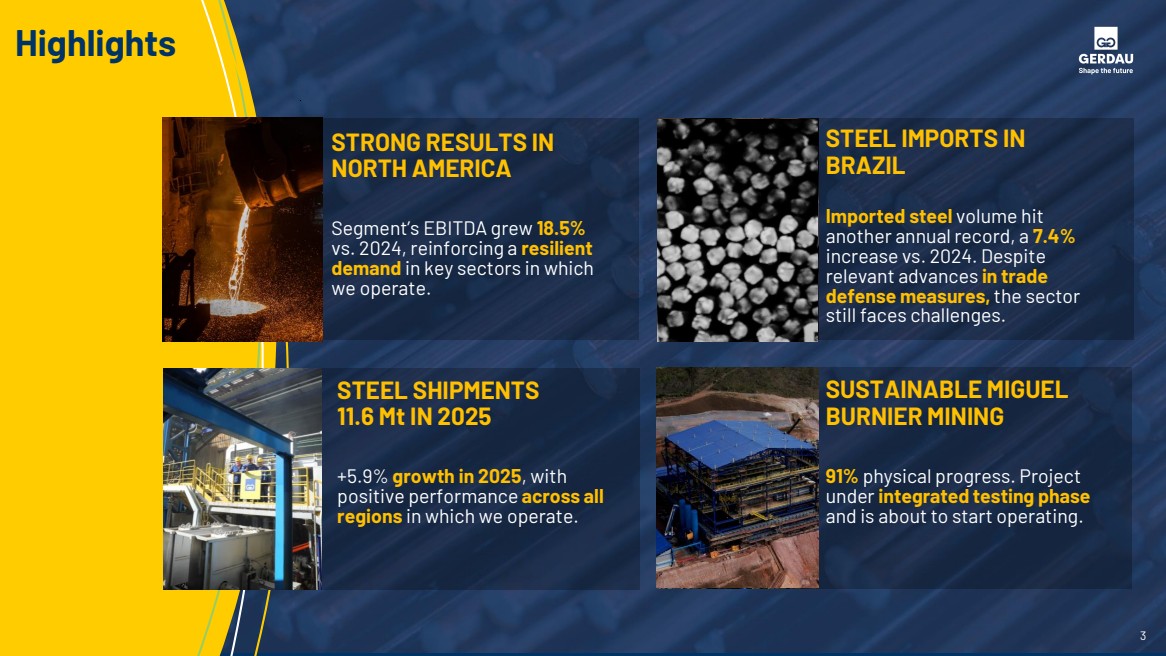
| 3 Highlights STEEL IMPORTS IN BRAZIL SUSTAINABLE MIGUEL BURNIER MINING 91% physical progress. Project under integrated testing phase and is about to start operating. Segment’s EBITDA grew 18.5% vs. 2024, reinforcing a resilient demand in key sectors in which we operate. STRONG RESULTS IN NORTH AMERICA Imported steel volume hit another annual record, a 7.4% increase vs. 2024. Despite relevant advances in trade defense measures, the sector still faces challenges. STEEL SHIPMENTS 11.6 Mt IN 2025 +5.9% growth in 2025, with positive performance across all regions in which we operate. |
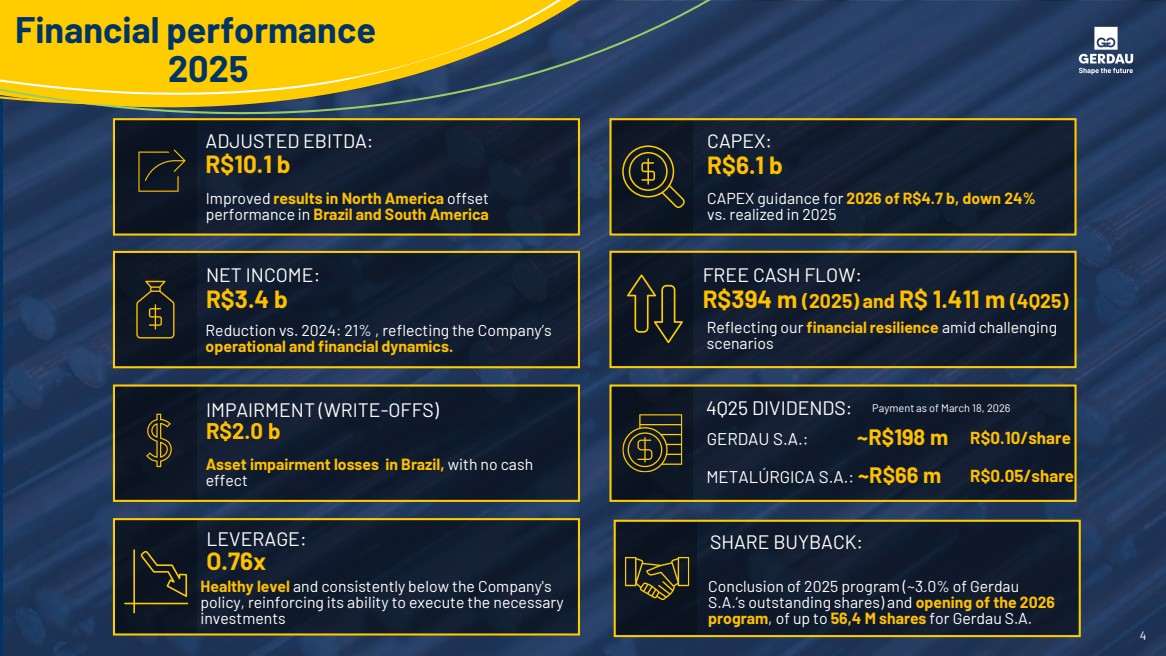
| 4 Financial performance 2025 CAPEX: R$6.1 b CAPEX guidance for 2026 of R$4.7 b, down 24% vs. realized in 2025 GERDAU S.A.: ~R$198 m 4Q25 DIVIDENDS: METALÚRGICA S.A.: ~R$66 m Payment as of March 18, 2026 R$0.10/share R$0.05/share SHARE BUYBACK: Conclusion of 2025 program (~3.0% of Gerdau S.A.’s outstanding shares) and opening of the 2026 program, of up to 56,4 M shares for Gerdau S.A. ADJUSTED EBITDA: R$10.1 b Improved results in North America offset performance in Brazil and South America NET INCOME: R$3.4 b Reduction vs. 2024: 21% , reflecting the Company’s operational and financial dynamics. LEVERAGE: O.76x Healthy level and consistently below the Company's policy, reinforcing its ability to execute the necessary investments IMPAIRMENT (WRITE-OFFS) R$2.0 b Asset impairment losses in Brazil, with no cash effect FREE CASH FLOW: R$394 m (2025) and R$ 1.411 m (4Q25) Reflecting our financial resilience amid challenging scenarios |
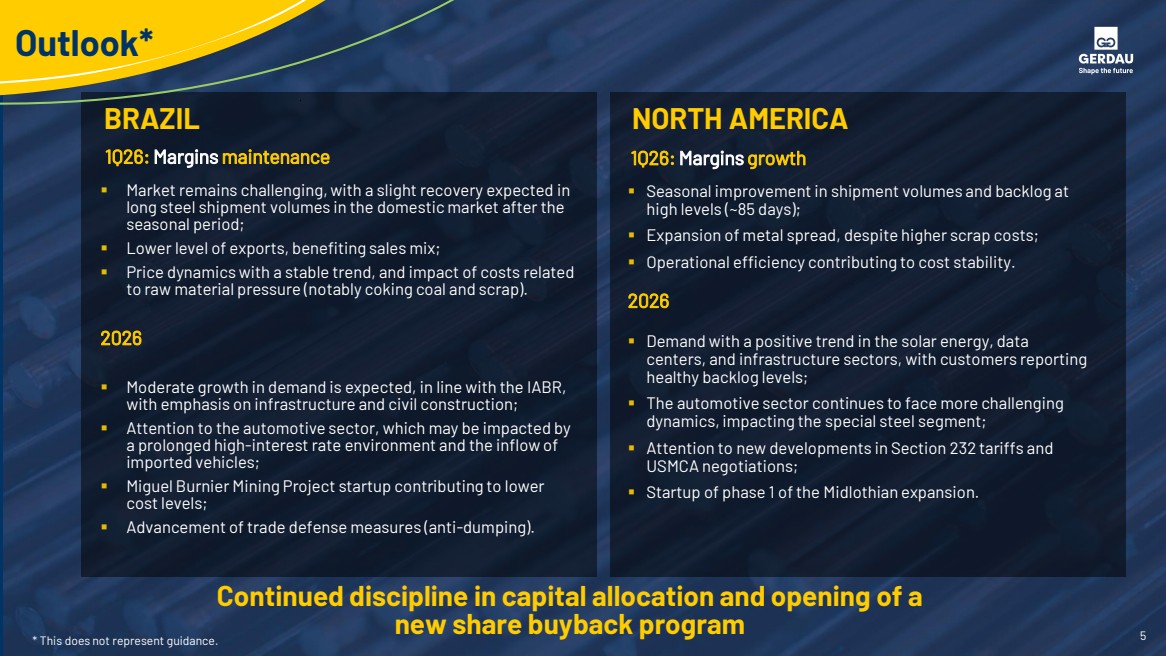
| 5 Outlook* BRAZIL NORTH AMERICA 1Q26: Margins maintenance 1Q26: Margins growth Continued discipline in capital allocation and opening of a new share buyback program ▪ Market remains challenging, with a slight recovery expected in long steel shipment volumes in the domestic market after the seasonal period; ▪ Lower level of exports, benefiting sales mix; ▪ Price dynamics with a stable trend, and impact of costs related to raw material pressure (notably coking coal and scrap). 2026 ▪ Moderate growth in demand is expected, in line with the IABR, with emphasis on infrastructure and civil construction; ▪ Attention to the automotive sector, which may be impacted by a prolonged high-interest rate environment and the inflow of imported vehicles; ▪ Miguel Burnier Mining Project startup contributing to lower cost levels; ▪ Advancement of trade defense measures (anti-dumping). ▪ Seasonal improvement in shipment volumes and backlog at high levels (~85 days); ▪ Expansion of metal spread, despite higher scrap costs; ▪ Operational efficiency contributing to cost stability. 2026 ▪ Demand with a positive trend in the solar energy, data centers, and infrastructure sectors, with customers reporting healthy backlog levels; ▪ The automotive sector continues to face more challenging dynamics, impacting the special steel segment; ▪ Attention to new developments in Section 232 tariffs and USMCA negotiations; ▪ Startup of phase 1 of the Midlothian expansion. * This does not represent guidance. |
| Q&A To ask questions, please indicate your name and institution via Raise Hand icon, wait to be announced. Once announced, accept the prompt to activate your microphone and camera. |

| ANEXOS 7 Appendices |
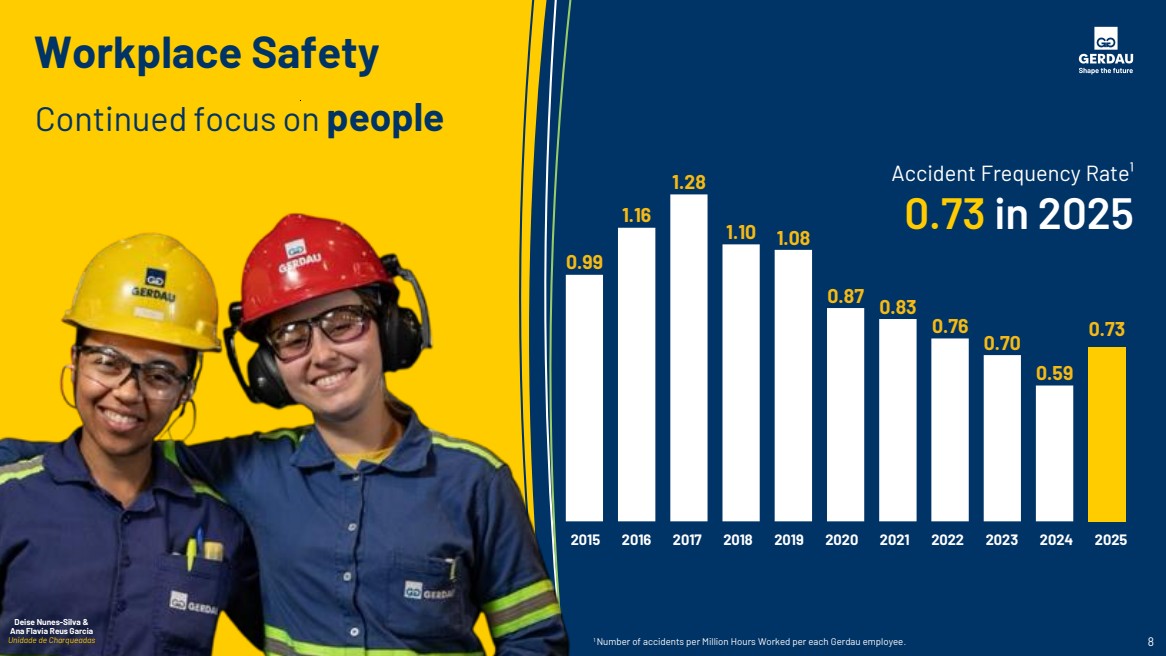
| Workplace Safety Continued focus on people Accident Frequency Rate¹ 0.73 in 2025 0.99 1.16 1.28 1.10 1.08 0.87 0.83 0.76 0.70 0.59 0.73 2015 2016 2017 2018 2019 2020 2021 2022 2023 2024 1Number of accidents per Million Hours Worked per each Gerdau employee. 8 2025 Deise Nunes-Silva & Ana Flavia Reus Garcia Unidade de Charqueadas |
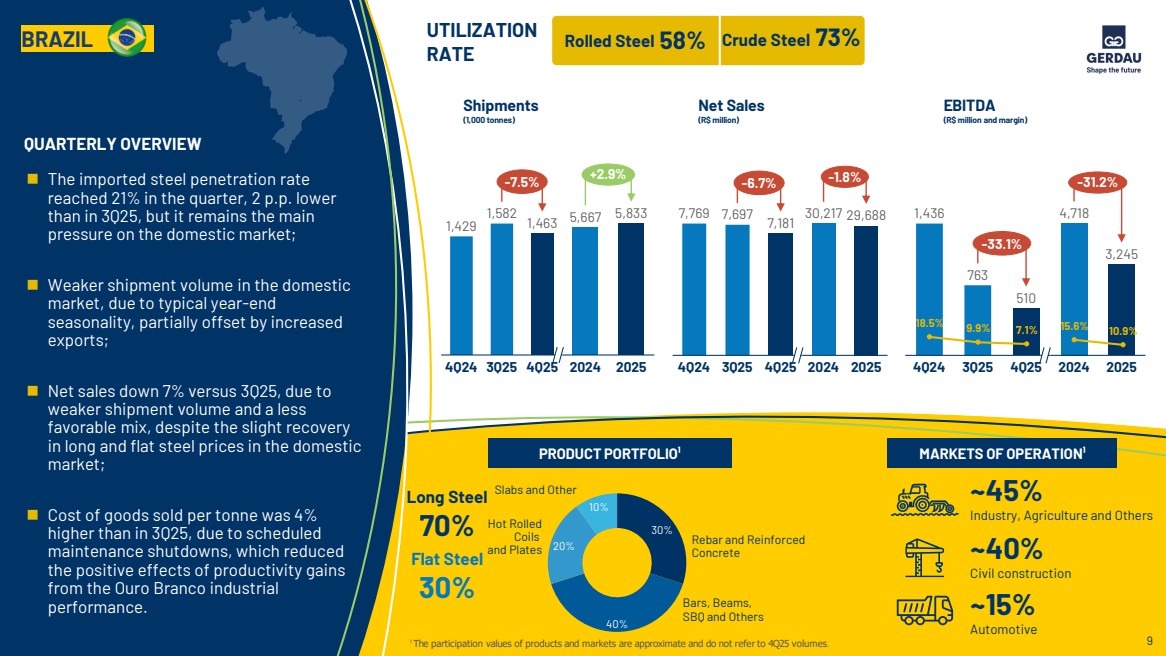
| 9 QUARTERLY OVERVIEW ◼ The imported steel penetration rate reached 21% in the quarter, 2 p.p. lower than in 3Q25, but it remains the main pressure on the domestic market; ◼ Weaker shipment volume in the domestic market, due to typical year-end seasonality, partially offset by increased exports; ◼ Net sales down 7% versus 3Q25, due to weaker shipment volume and a less favorable mix, despite the slight recovery in long and flat steel prices in the domestic market; ◼ Cost of goods sold per tonne was 4% higher than in 3Q25, due to scheduled maintenance shutdowns, which reduced the positive effects of productivity gains from the Ouro Branco industrial performance. 58% UTILIZATION RATE Rolled Steel Crude Steel 73% ~45% Industry, Agriculture and Others ~40% Civil construction ~15% Automotive PRODUCT PORTFOLIO¹ MARKETS OF OPERATION¹ 30% 40% 20% 10% Rebar and Reinforced Concrete Bars, Beams, SBQ and Others Hot Rolled Coils and Plates Slabs and Other ¹ The participation values of products and markets are approximate and do not refer to 4Q25 volumes. Long Steel 70% Flat Steel 30% BRAZIL Shipments (1,000 tonnes) Net Sales (R$ million) EBITDA (R$ million and margin) 4Q24 3Q25 4Q25 1,429 1,582 1,463 -7.5% 4Q24 3Q25 4Q25 7,769 7,697 7,181 -6.7% 763 510 4Q24 3Q25 4Q25 1,436 -33.1% 2024 2025 30,217 29,688 -1.8% 2024 2025 5,667 5,833 +2.9% 2024 2025 4,718 3,245 -31.2% 18.5% 9.9% 7.1% 15.6% 10.9% |
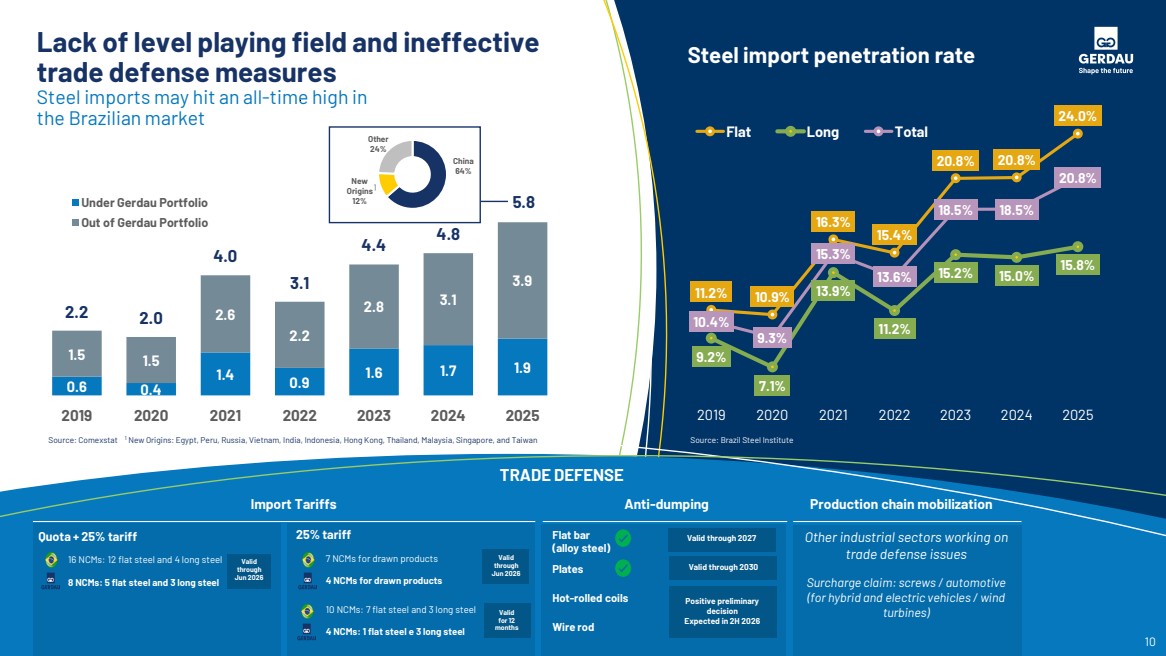
| Lack of level playing field and ineffective trade defense measures Steel imports may hit an all-time high in the Brazilian market 0.6 0.4 1.4 0.9 1.6 1.7 1.9 1.5 1.5 2.6 2.2 2.8 3.1 3.9 2.2 2.0 4.0 3.1 4.4 4.8 5.8 2019 2020 2021 2022 2023 2024 2025 Título do Gráfico Under Gerdau Portfolio Out of Gerdau Portfolio Source: Comexstat 11.2% 10.9% 16.3% 15.4% 20.8% 20.8% 24.0% 9.2% 7.1% 13.9% 11.2% 15.2% 15.0% 15.8% 10.4% 9.3% 15.3% 13.6% 18.5% 18.5% 20.8% 2019 2020 2021 2022 2023 2024 2025 Flat Long Total Steel import penetration rate Source: Brazil Steel Institute China 64% New Origins 12% Other 24% TRADE DEFENSE 1 New Origins: Egypt, Peru, Russia, Vietnam, India, Indonesia, Hong Kong, Thailand, Malaysia, Singapore, and Taiwan. 10 ¹ Import Tariffs Anti-dumping 25% tariff 7 NCMs for drawn products 4 NCMs for drawn products 10 NCMs: 7 flat steel and 3 long steel 4 NCMs: 1 flat steel e 3 long steel Quota + 25% tariff 16 NCMs: 12 flat steel and 4 long steel 8 NCMs: 5 flat steel and 3 long steel Flat bar (alloy steel) Plates Hot-rolled coils Wire rod Production chain mobilization Other industrial sectors working on trade defense issues Surcharge claim: screws / automotive (for hybrid and electric vehicles / wind turbines) Valid through Jun 2026 Valid through Jun 2026 Valid for 12 months Valid through 2027 Positive preliminary decision Expected in 2H 2026 Valid through 2030 |
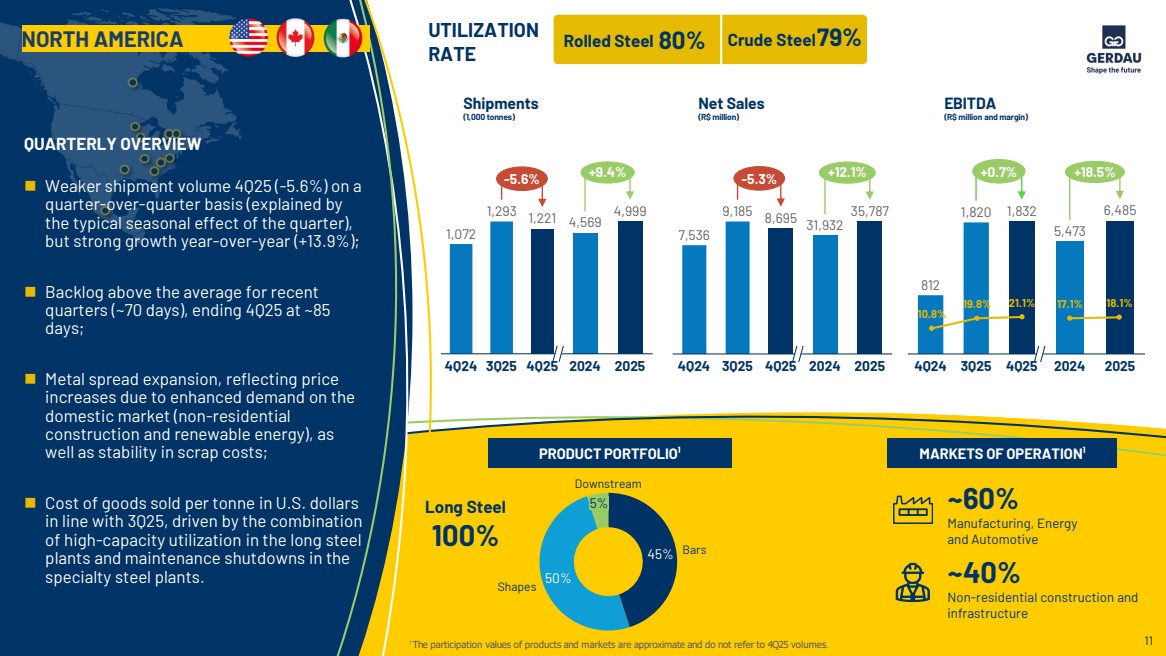
| Shipments (1,000 tonnes) Net Sales (R$ million) EBITDA (R$ million and margin) QUARTERLY OVERVIEW ◼ Weaker shipment volume 4Q25 (-5.6%) on a quarter-over-quarter basis (explained by the typical seasonal effect of the quarter), but strong growth year-over-year (+13.9%); ◼ Backlog above the average for recent quarters (~70 days), ending 4Q25 at ~85 days; ◼ Metal spread expansion, reflecting price increases due to enhanced demand on the domestic market (non-residential construction and renewable energy), as well as stability in scrap costs; ◼ Cost of goods sold per tonne in U.S. dollars in line with 3Q25, driven by the combination of high-capacity utilization in the long steel plants and maintenance shutdowns in the specialty steel plants. 45% 50% Bars Shapes 5% Downstream ~40% Non-residential construction and infrastructure ~60% Manufacturing, Energy and Automotive Long Steel 100% ¹ The participation values of products and markets are approximate and do not refer to 4Q25 volumes. NORTH AMERICA UTILIZATION RATE Rolled Steel 80% PRODUCT PORTFOLIO¹ MARKETS OF OPERATION¹ Crude Steel79% 4Q24 3Q25 4Q25 1,072 1,293 1,221 -5.6% 4Q24 3Q25 4Q25 7,536 9,185 8,695 -5.3% 812 4Q24 3Q25 4Q25 1,820 1,832 +0.7% 2024 2025 4,569 4,999 +9.4% 2024 2025 31,932 35,787 +12.1% 2024 2025 5,473 6,485 +18.5% 10.8% 19.8% 21.1% 17.1% 18.1% 11 |
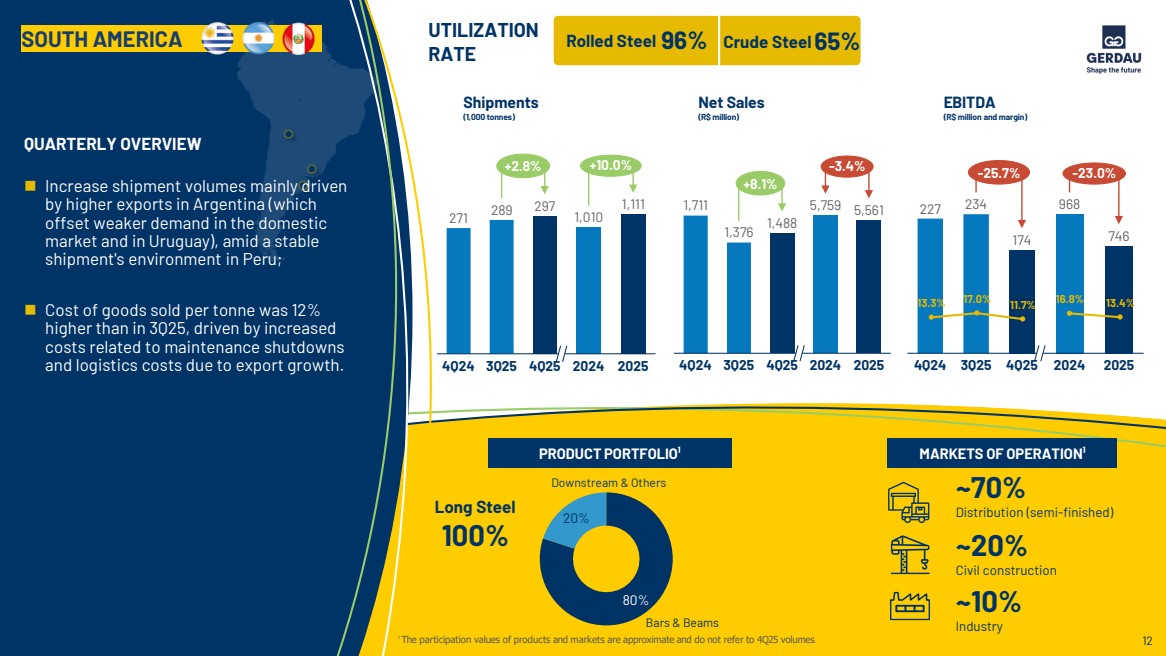
| Shipments (1,000 tonnes) Net Sales (R$ million) EBITDA (R$ million and margin) 96% UTILIZATION RATE Rolled Steel Crude Steel65% QUARTERLY OVERVIEW 80% 20% Bars & Beams Downstream & Others ¹ The participation values of products and markets are approximate and do not refer to 4Q25 volumes. ~70% Distribution (semi-finished) ~20% Civil construction ~10% Industry SOUTH AMERICA PRODUCT PORTFOLIO¹ MARKETS OF OPERATION¹ Long Steel 100% ◼ Increase shipment volumes mainly driven by higher exports in Argentina (which offset weaker demand in the domestic market and in Uruguay), amid a stable shipment's environment in Peru; ◼ Cost of goods sold per tonne was 12% higher than in 3Q25, driven by increased costs related to maintenance shutdowns and logistics costs due to export growth. 271 289 297 4Q24 3Q25 4Q25 +2.8% 4Q24 3Q25 4Q25 1,711 1,376 1,488 +8.1% 227 234 174 4Q24 3Q25 4Q25 -25.7% 13.3% 17.0% 11.7% 2024 2025 1,010 1,111 +10.0% 2024 2025 5,759 5,561 -3.4% 968 746 2024 2025 -23.0% 16.8% 13.4% 12 |
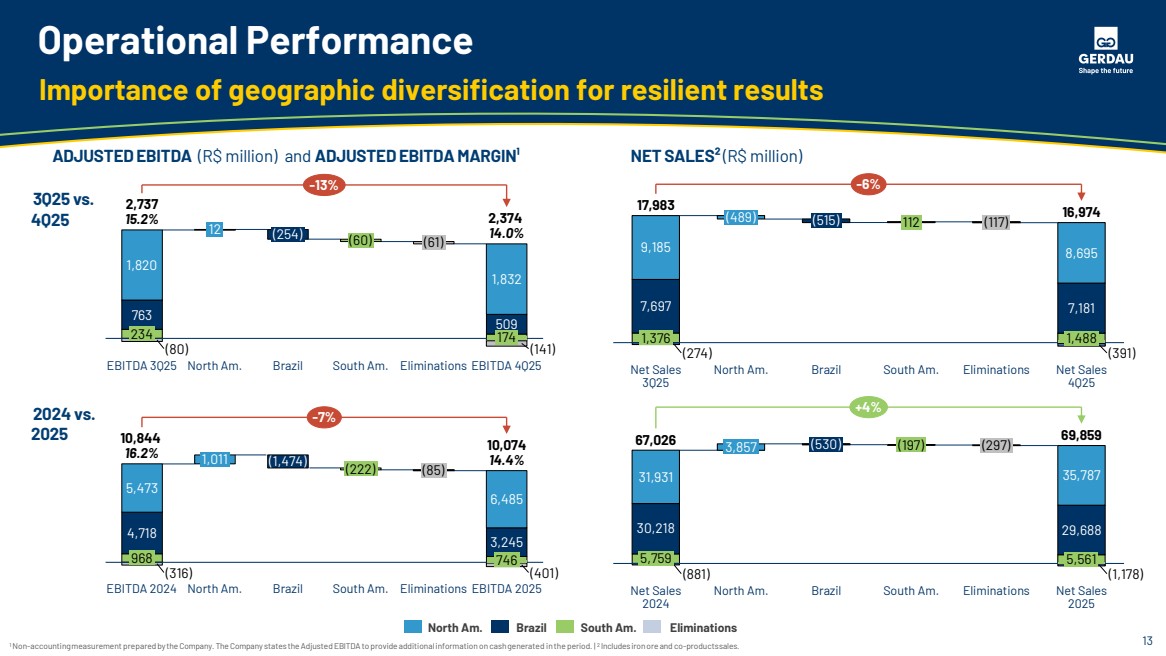
| Operational Performance 1 Non-accountingmeasurement prepared by theCompany. The Company statestheAdjusted EBITDA toprovideadditionalinformation on cashgenerated inthe period. | 2 Includes ironore and co-productssales. Importance of geographic diversification for resilient results ADJUSTED EBITDA (R$ million) and ADJUSTED EBITDA MARGIN¹ NET SALES² (R$ million) North Am. Brazil South Am. Eliminations (274) (391) Eliminations 8,695 9,185 7,697 1,376 1,488 Net Sales 4Q25 Net Sales 3Q25 (489) North Am. (515) Brazil 112 South Am. (117) 17,983 16,974 7,181 -6% -171 763 509 (80) (141) 1,820 234 EBITDA 3Q25 12 North Am. (254) Brazil (60) South Am. (61) Eliminations 1,832 174 EBITDA 4Q25 2,737 15.2% 2,374 14.0% -13% 3Q25 vs. 4Q25 (316) (401) 5,473 4,718 968 EBITDA 2024 1,011 North Am. (1,474) Brazil (222) South Am. (85) Eliminations 6,485 3,245 746 EBITDA 2025 10,844 16.2% 10,074 14.4% -7% (881) Eliminations 31,931 35,787 30,218 5,561 (1,178) 5,759 Net Sales 2025 Net Sales 2024 3,857 North Am. (530) Brazil (197) South Am. (297) 67,026 69,859 29,688 +4% 2024 vs. 2025 13 |
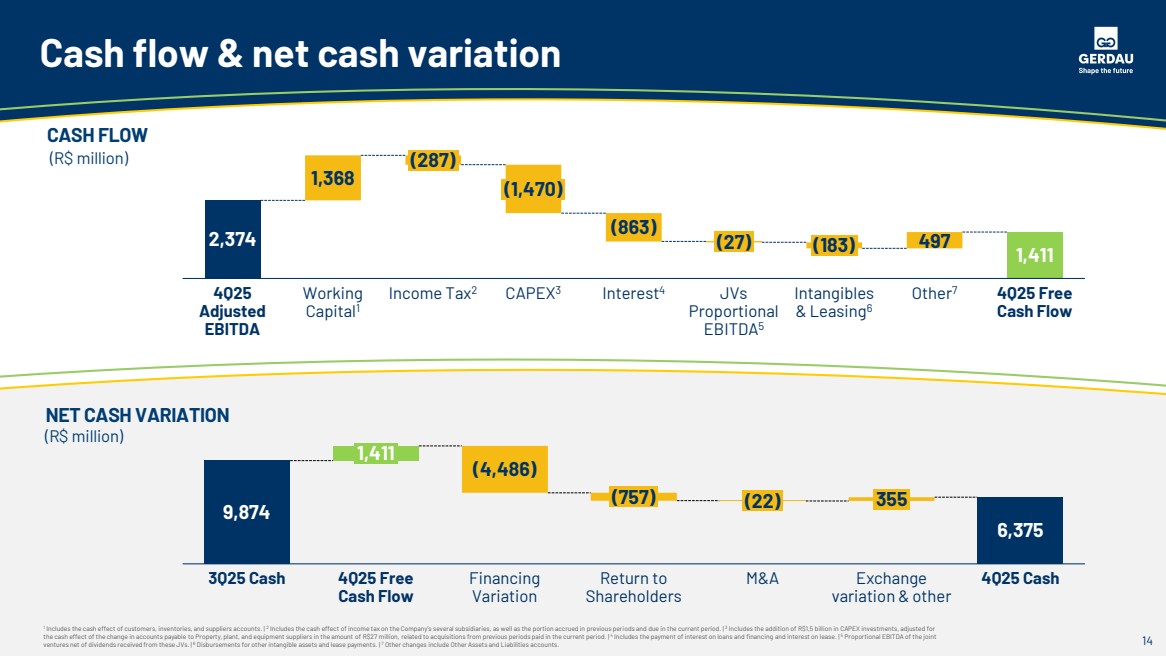
| Cash flow & net cash variation 1 Includes the cash effect of customers, inventories, and suppliers accounts. | 2 Includes the cash effect of income tax on the Company’s several subsidiaries, as well as the portion accrued in previous periods and due in the current period. | 3 Includes the addition of R$1,5 billion in CAPEX investments, adjusted for the cash effect of the change in accounts payable to Property, plant, and equipment suppliers in the amount of R$27 million, related to acquisitions from previous periods paid in the current period. | 4 Includes the payment of interest on loans and financing and interest on lease. | 5 Proportional EBITDA of the joint ventures net of dividends received from these JVs. | 6 Disbursements for other intangible assets and lease payments. | 7 Other changes include Other Assets and Liabilities accounts. CASH FLOW (R$ million) NET CASH VARIATION (R$ million) 3Q25 Cash 1,411 4Q25 Free Cash Flow (4,486) Financing Variation (757) Return to Shareholders (22) M&A 355 Exchange variation & other 4Q25 Cash 9,874 6,375 2,374 497 4Q25 Adjusted EBITDA 1,368 Working Capital1 (287) Income Tax2 (1,470) CAPEX3 (863) Interest4 (27) JVs Proportional EBITDA5 (183) Intangibles & Leasing6 Other7 1,411 4Q25 Free Cash Flow 14 |
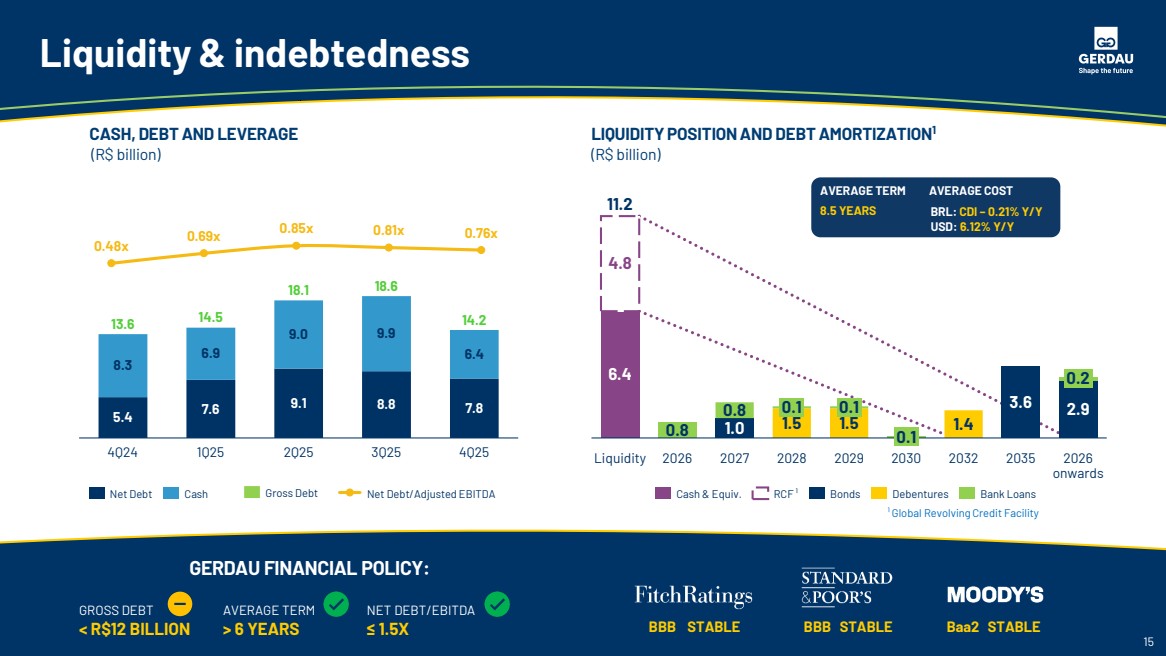
| CASH, DEBT AND LEVERAGE (R$ billion) LIQUIDITY POSITION AND DEBT AMORTIZATION1 (R$ billion) RATINGS: ¹ Global Revolving Credit Facility AVERAGE COST 8.5 YEARS BRL: CDI – 0.21% Y/Y USD: 6.12% Y/Y AVERAGE TERM POLÍTICA FINANCEIRA GERDAU: 15 GROSS DEBT < R$12 BILLION AVERAGE TERM > 6 YEARS NET DEBT/EBITDA ≤ 1.5X BBB STABLE BBB STABLE Baa2 STABLE GERDAU FINANCIAL POLICY: 5.4 8.3 4Q24 7.6 6.9 1Q25 9.1 9.0 2Q25 8.8 9.9 3Q25 7.8 6.4 4Q25 13.6 14.5 18.1 18.6 14.2 Net Debt Cash 0.48x 0.69x 0.85x 0.81x 0.76x Gross Debt Net Debt/Adjusted EBITDA Liquidity & indebtedness Cash & Equiv. RCF ¹ Bonds Debentures Bank Loans Liquidity 2026 2027 0.1 2028 0.1 2029 0.1 2030 2032 2035 0.2 2026 onwards 11.2 6.4 4.8 0.8 1.0 0.8 1.5 1.5 1.4 3.6 2.9 15 |
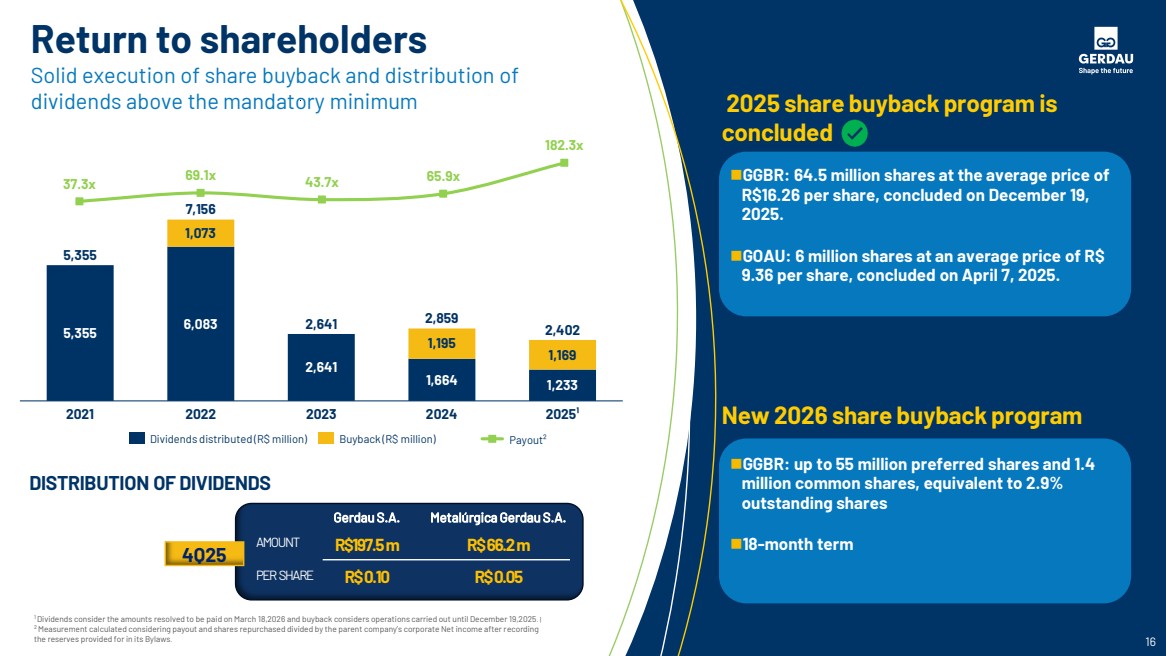
| Return to shareholders Solid execution of share buyback and distribution of dividends above the mandatory minimum 16 2025 share buyback program is concluded DISTRIBUTION OF DIVIDENDS AMOUNT PER SHARE R$197.5 m R$ 0.10 4Q25 Gerdau S.A. R$ 66.2 m R$ 0.05 Metalúrgica Gerdau S.A. 1 Dividends consider the amounts resolved to be paid on March 18,2026 and buyback considers operations carried out until December 19,2025. | 2 Measurement calculated considering payout and shares repurchased divided by the parent company’s corporate Net income after recording the reserves provided for in its Bylaws. 2021 2022 2023 2024 2025¹ 5,355 7,156 2,641 2,859 5,355 2,402 6,083 1,073 2,641 1,664 1,195 1,233 1,169 Dividends distributed (R$ million) Buyback (R$ million) 37.3x 69.1x 43.7x 65.9x 182.3x Payout² ◼GGBR: up to 55 million preferred shares and 1.4 million common shares, equivalent to 2.9% outstanding shares ◼18-month term ◼GGBR: 64.5 million shares at the average price of R$16.26 per share, concluded on December 19, 2025. ◼GOAU: 6 million shares at an average price of R$ 9.36 per share, concluded on April 7, 2025. New 2026 share buyback program |
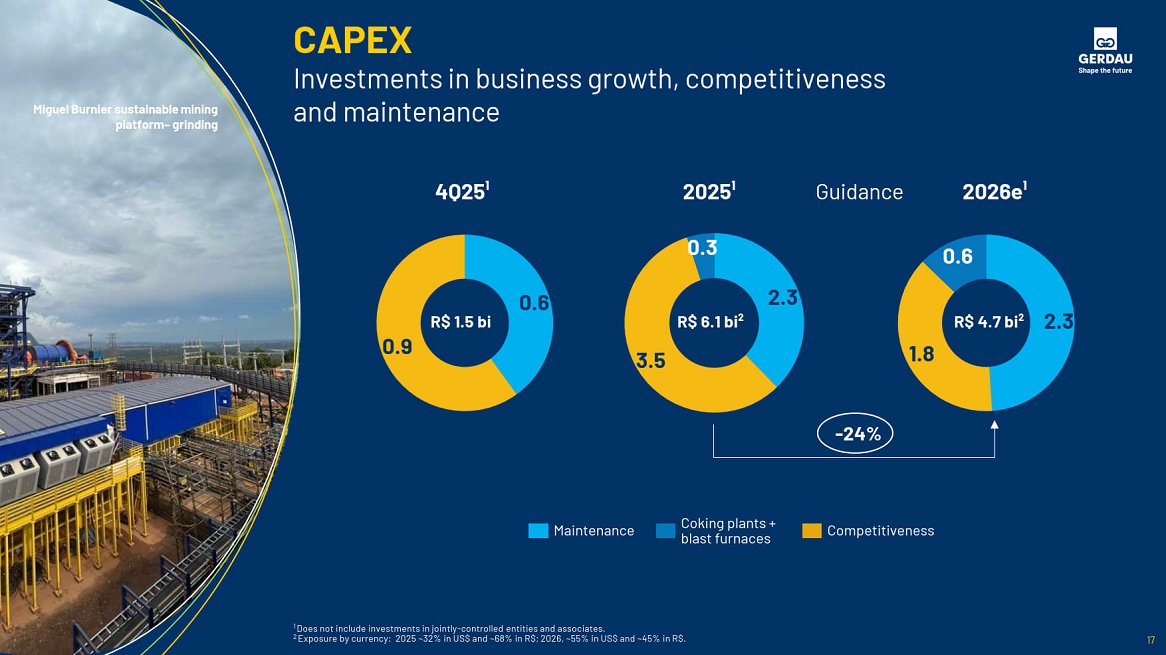
| CAPEX Investments in business growth, competitiveness and maintenance 17 2025¹ 2026e¹ 2.3 3.5 0.3 Maintenance Coking plants + blast furnaces Competitiveness R$6.1 bi² 2.3 1.8 0.6 R$4.7 bi² 1 Does not include investments in jointly-controlled entities and associates. 2 Exposure by currency: 2025 ~46% in US$ and ~54% in R$; 2026, ~55% in US$ and ~45% in R$. 4Q25¹ Guidance 0.6 0.9 R$1.5 bi -24% Miguel Burnier sustainable mining platform– grinding 17 |
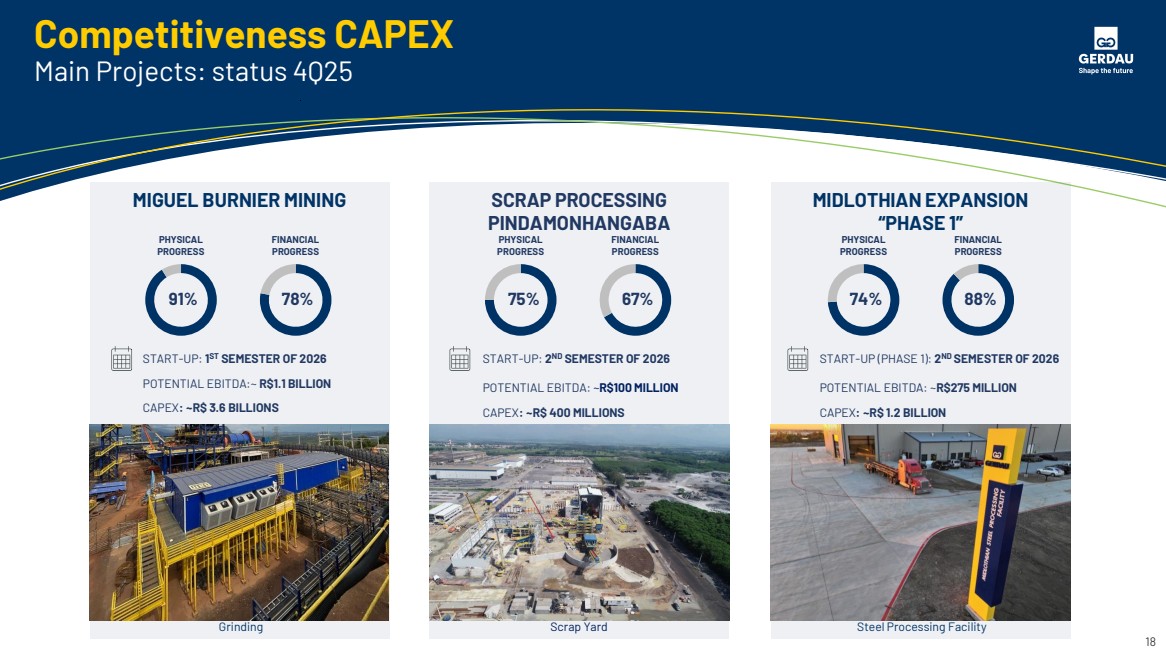
| 18 MIGUEL BURNIER MINING PHYSICAL PROGRESS FINANCIAL PROGRESS 91% 78% Grinding START-UP: 1 ST SEMESTER OF 2026 POTENTIAL EBITDA:~ R$1.1 BILLION CAPEX: ~R$ 3.6 BILLIONS SCRAP PROCESSING PINDAMONHANGABA Scrap Yard PHYSICAL PROGRESS FINANCIAL PROGRESS 75% 67% START-UP: 2 ND SEMESTER OF 2026 POTENTIAL EBITDA: ~R$100 MILLION CAPEX: ~R$ 400 MILLIONS MIDLOTHIAN EXPANSION “PHASE 1” Steel Processing Facility PHYSICAL PROGRESS FINANCIAL PROGRESS 74% 88% START-UP (PHASE 1): 2 ND SEMESTER OF 2026 POTENTIAL EBITDA: ~R$275 MILLION CAPEX: ~R$ 1.2 BILLION Competitiveness CAPEX Main Projects: status 4Q25 |
| Follow Gerdau on social media. Earnings Release 1Q26 April 27, 2026 Videoconference April 28, 2026 inform@gerdau.com | ri.gerdau.com |