| 1Q26 Results Gerdau S.A. Videoconference April 28 (Tuesday) 12:00 p.m. BRT 11:00 a.m. NY 11:00 a.m. NY Click here to access the videoconference RI.GERDAU.COM RI.GERDAU.COM |
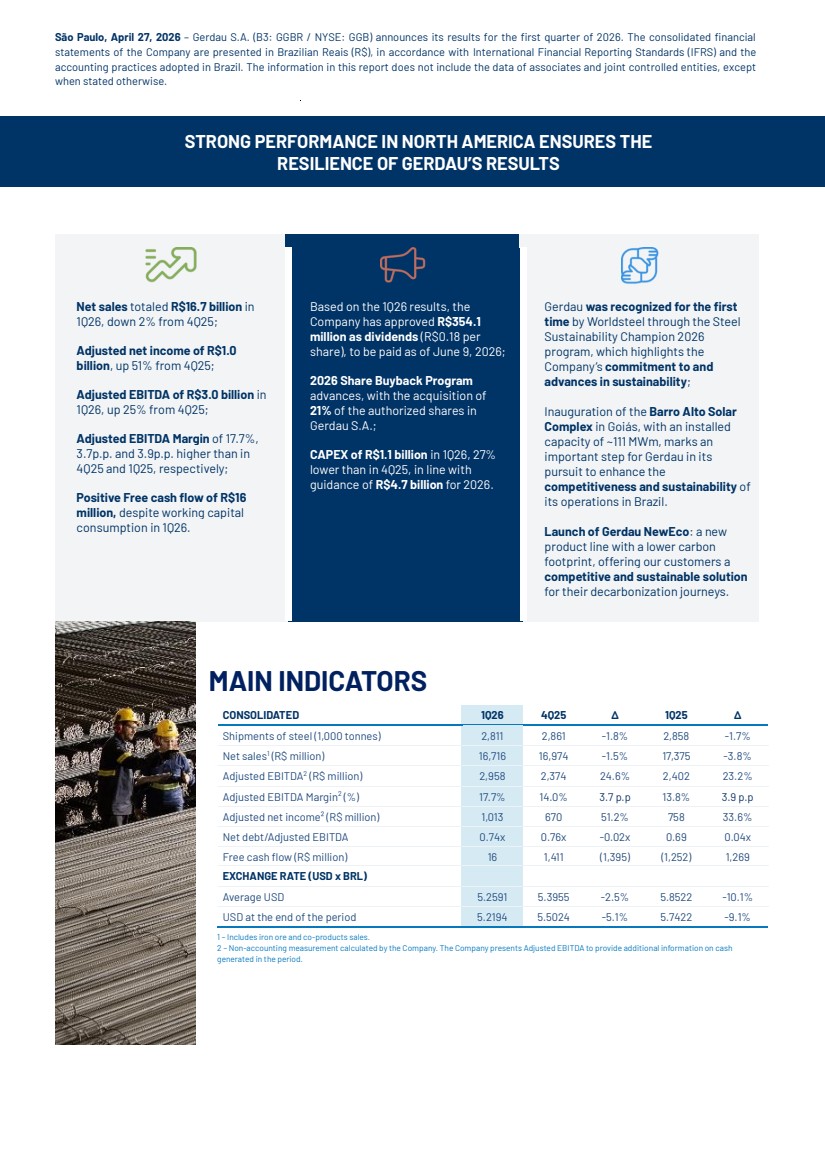
| São Paulo, April 27, 2026 – Gerdau S.A. (B3: GGBR / NYSE: GGB) announces its results for the first quarter of 2026. The consolidated financial statements of the Company are presented in Brazilian Reais (R$), in accordance with International Financial Reporting Standards (IFRS) and the accounting practices adopted in Brazil. The information in this report does not include the data of associates and joint controlled entities, except when stated otherwise. STRONG PERFORMANCE IN NORTH AMERICA ENSURES THE RESILIENCE OF GERDAU’S RESULTS MAIN INDICATORS 1 – Includes iron ore and co-products sales. 2 – Non-accounting measurement calculated by the Company. The Company presents Adjusted EBITDA to provide additional information on cash generated in the period. Net sales totaled R$16.7 billion in 1Q26, down 2% from 4Q25; Adjusted net income of R$1.0 billion, up 51% from 4Q25; Adjusted EBITDA of R$3.0 billion in 1Q26, up 25% from 4Q25; Adjusted EBITDA Margin of 17.7%, 3.7p.p. and 3.9p.p. higher than in 4Q25 and 1Q25, respectively; Positive Free cash flow of R$16 million, despite working capital consumption in 1Q26. Based on the 1Q26 results, the Company has approved R$354.1 million as dividends (R$0.18 per share), to be paid as of June 9, 2026; 2026 Share Buyback Program advances, with the acquisition of 21% of the authorized shares in Gerdau S.A.; CAPEX of R$1.1 billion in 1Q26, 27% lower than in 4Q25, in line with guidance of R$4.7 billion for 2026. Gerdau was recognized for the first time by Worldsteel through the Steel Sustainability Champion 2026 program, which highlights the Company’s commitment to and advances in sustainability; Inauguration of the Barro Alto Solar Complex in Goiás, with an installed capacity of ~111 MWm, marks an important step for Gerdau in its pursuit to enhance the competitiveness and sustainability of its operations in Brazil. Launch of Gerdau NewEco: a new product line with a lower carbon footprint, offering our customers a competitive and sustainable solution for their decarbonization journeys. CONSOLIDATED 1Q26 4Q25 ∆ 1Q25 ∆ Shipments of steel (1,000 tonnes) 2,811 2,861 -1.8% 2,858 -1.7% Net sales1 (R$ million) 16,716 16,974 -1.5% 17,375 -3.8% Adjusted EBITDA2 (R$ million) 2,958 2,374 24.6% 2,402 23.2% Adjusted EBITDA Margin2 (%) 17.7% 14.0% 3.7 p.p 13.8% 3.9 p.p Adjusted net income² (R$ million) 1,013 670 51.2% 758 33.6% Net debt/Adjusted EBITDA 0.74x 0.76x -0.02x 0.69 0.04x Free cash flow (R$ million) 16 1,411 (1,395) (1,252) 1,269 EXCHANGE RATE (USD x BRL) Average USD 5.2591 5.3955 -2.5% 5.8522 -10.1% USD at the end of the period 5.2194 5.5024 -5.1% 5.7422 -9.1% |
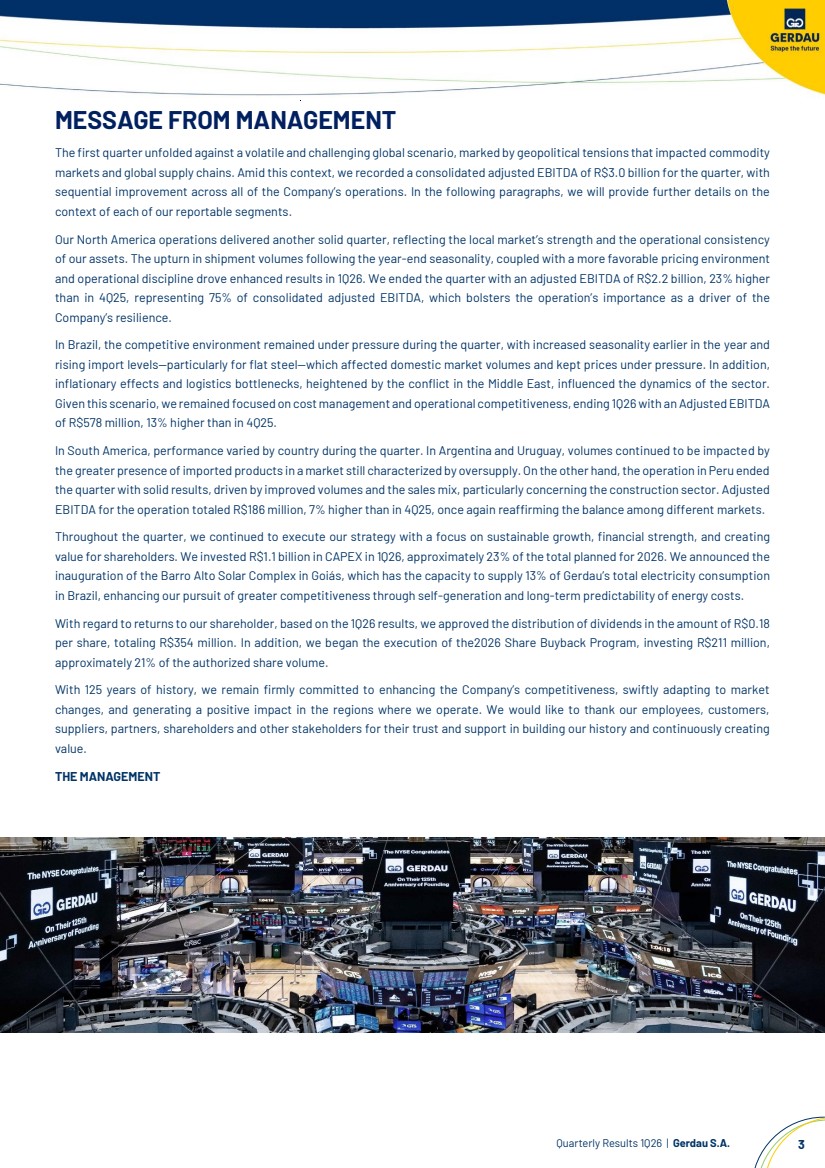
| Quarterly Results 1Q26 | Gerdau S.A. 3 MESSAGE FROM MANAGEMENT The first quarter unfolded against a volatile and challenging global scenario, marked by geopolitical tensions that impacted commodity markets and global supply chains. Amid this context, we recorded a consolidated adjusted EBITDA of R$3.0 billion for the quarter, with sequential improvement across all of the Company’s operations. In the following paragraphs, we will provide further details on the context of each of our reportable segments. Our North America operations delivered another solid quarter, reflecting the local market’s strength and the operational consistency of our assets. The upturn in shipment volumes following the year-end seasonality, coupled with a more favorable pricing environment and operational discipline drove enhanced results in 1Q26. We ended the quarter with an adjusted EBITDA of R$2.2 billion, 23% higher than in 4Q25, representing 75% of consolidated adjusted EBITDA, which bolsters the operation’s importance as a driver of the Company’s resilience. In Brazil, the competitive environment remained under pressure during the quarter, with increased seasonality earlier in the year and rising import levels—particularly for flat steel—which affected domestic market volumes and kept prices under pressure. In addition, inflationary effects and logistics bottlenecks, heightened by the conflict in the Middle East, influenced the dynamics of the sector. Given this scenario, we remained focused on cost management and operational competitiveness, ending 1Q26 with an Adjusted EBITDA of R$578 million, 13% higher than in 4Q25. In South America, performance varied by country during the quarter. In Argentina and Uruguay, volumes continued to be impacted by the greater presence of imported products in a market still characterized by oversupply. On the other hand, the operation in Peru ended the quarter with solid results, driven by improved volumes and the sales mix, particularly concerning the construction sector. Adjusted EBITDA for the operation totaled R$186 million, 7% higher than in 4Q25, once again reaffirming the balance among different markets. Throughout the quarter, we continued to execute our strategy with a focus on sustainable growth, financial strength, and creating value for shareholders. We invested R$1.1 billion in CAPEX in 1Q26, approximately 23% of the total planned for 2026. We announced the inauguration of the Barro Alto Solar Complex in Goiás, which has the capacity to supply 13% of Gerdau’s total electricity consumption in Brazil, enhancing our pursuit of greater competitiveness through self-generation and long-term predictability of energy costs. With regard to returns to our shareholder, based on the 1Q26 results, we approved the distribution of dividends in the amount of R$0.18 per share, totaling R$354 million. In addition, we began the execution of the2026 Share Buyback Program, investing R$211 million, approximately 21% of the authorized share volume. With 125 years of history, we remain firmly committed to enhancing the Company’s competitiveness, swiftly adapting to market changes, and generating a positive impact in the regions where we operate. We would like to thank our employees, customers, suppliers, partners, shareholders and other stakeholders for their trust and support in building our history and continuously creating value. THE MANAGEMENT |
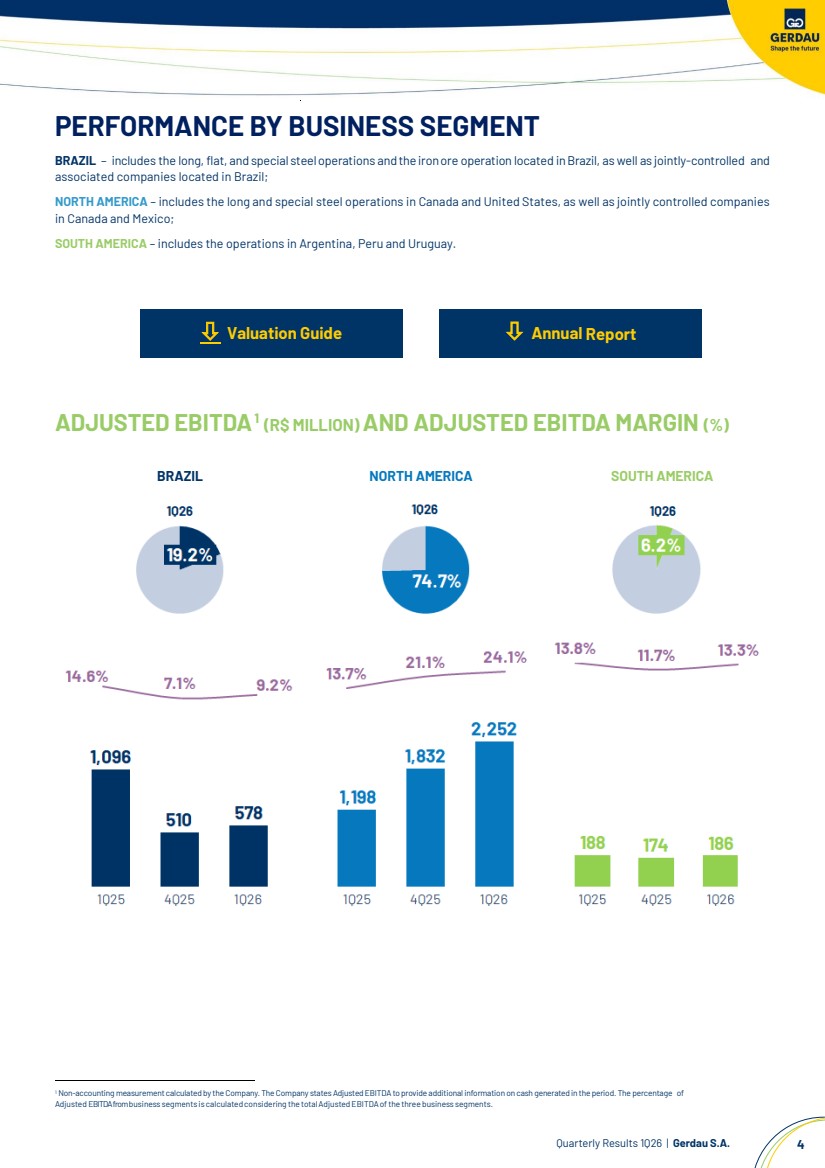
| Quarterly Results 1Q26 | Gerdau S.A. 4 PERFORMANCE BY BUSINESS SEGMENT BRAZIL – includes the long,flat, and special steeloperations andthe ironore operation located inBrazil, as well as jointly-controlled and associated companies located in Brazil; NORTH AMERICA – includes the long and special steel operations in Canada and United States, as well as jointly controlled companies in Canada and Mexico; SOUTH AMERICA – includes the operations in Argentina, Peru and Uruguay. Valuation Guide ADJUSTED EBITDA3F0F0F 1 (R$ MILLION) AND ADJUSTED EBITDA MARGIN (%) BRAZIL NORTH AMERICA SOUTH AMERICA 1 Non-accounting measurement calculated by the Company. The Company states AdjustedEBITDA to provide additional information on cash generated in the period. The percentage of Adjusted EBITDA frombusiness segments is calculatedconsidering the totalAdjustedEBITDAofthe three business segments. Annual Report |
| Quarterly Results 1Q26 | Gerdau S.A. 5 BRAZIL PRODUCTION & SHIPMENTS ▪ In 1Q26, crude steel production went up 3.2% versus 4Q25, reflecting the upturn in production levels following the previous period’s seasonality, with a focus on inventories restocking. Year-over-year, production grew 1.6% from 1Q25, when it had been affected by shutdowns carried out for the expansion of the hot-rolled coil line in Ouro Branco; ▪ During the quarter, domestic steel demand remained mainly sustained by the civil construction sector, which continues to be the key driver of long steel consumption, supported by ongoing housing programs and construction site inventory levels below the historical average. Conversely, industrial segments continued to underperform, particularly in the capital goods and automotive sectors; ▪ According to Brazil Steel Institute data (IABr), 1Q26 was once again marked by record import levels, particularly for flat steel, whose market penetration reached 34% in February, its all-time highest level, ending the quarter with an average penetration rate of 28.5%; ▪ Steel imports totaled 1.7 million tonnes in 1Q26, approximately 32% higher than in 4Q25 and up 4% from 1Q25. This trend led to worsening oversupply in the Brazilian market and hindered shipment growth, against a scenario of apparent consumption 2.5% lower than that seen in the same period of 2025; ▪ Total shipments were 9.5% and 7.5% lower than in 4Q25 and 1Q25, respectively, reflecting a more pronounced seasonality in earlier months of 2026, with both domestic and export markets experiencing a decline in volumes, against a scenario of continued pressure on global demand. Flat steel shipments were hit hardest, affected by weaker domestic demand and the impact of high import levels; ▪ The Ouro Branco industrial unit, which had its hot-rolled coil capacity expanded in 2025, hit record production in March, underscoring the Company’s operational flexibility and its ability to stabilize volumes as demand for flat steel recovers in the domestic market; ▪ In the special steel market, 1Q26 domestic market performance was weaker than expected, mainly impacted by an 18.9% decline in heavy vehicle production compared to 1Q25, according to ANFAVEA data. BRAZIL 1Q26 4Q25 ∆ 1Q25 ∆ Volumes (1,000 tonnes) Production of crude steel 1,469 1,424 3.2% 1,445 1.6% Shipments of steel 1,324 1,463 -9.5% 1,431 -7.5% Domestic market 1,036 1,089 -4.9% 1,079 -4.0% Exports 288 374 -22.9% 352 -18.1% Shipments of long steel 947 979 -3.3% 972 -2.6% Domestic market 704 683 3.0% 781 -9.8% Exports 243 296 -17.9% 192 26.7% Shipments of flat steel 378 484 -22.0% 459 -17.7% Domestic market 332 406 -18.2% 298 11.3% Exports 45 78 -42.0% 160 -71.6% |
| Quarterly Results 1Q26 | Gerdau S.A. 6 OPERATING RESULT 1- Includes iron ore and co-products sales. 2- Non-accounting measurement reconciled with information stated in the Note 22 to the Company’s Financial Statements, as set forth by CVM Resolution No. 156 of June 23, 2022. ▪ In 1Q26, Net sales went down 12.7% and 16.3% versus 4Q25 and 1Q25, respectively, reflecting a combination of weaker shipment volumes for the quarter and a pricing environment that remained under pressure, with declines in both the domestic and export markets. Supply dynamics remained challenging, with high penetration of imported steel and local new capacity additions, which continued to hinder price recovery and, in certain product lines and markets, pushed prices down to lower levels; ▪ The Cost of goods sold came 13.8% lower than in 4Q25, primarily due to weaker shipment volume, in addition to lower costs following the scheduled maintenance shutdowns carried out in 4Q25. These factors helped mitigate the impact of rising input prices, such as coal, and higher freight costs throughout the quarter. Year-over-year, the Cost of goods sold came 9.6% lower, reflecting weaker shipment volumes and ongoing efforts to control fixed costs and enhance productivity. In addition, we saw the effect of a higher basis of comparison during that period, when the Ouro Branco unit was shut down for the expansion of the hot-rolled coil line. ▪ Adjusted EBITDA was 13.3% higher than in 4Q25 and 47.3% lower than in 1Q25, reflecting the operational effects explained above. BRAZIL 1Q26 4Q25 ∆ 1Q25 ∆ Results (R$ million) Net sales¹ 6,271 7,181 -12.7% 7,494 -16.3% Domestic market 5,269 5,842 -9.8% 6,177 -14.7% Exports 1,002 1,339 -25.2% 1,317 -23.9% Cost of goods sold (6,053) (7,020) -13.8% (6,699) -9.6% Gross profit 218 162 35.0% 795 -72.6% Gross margin (%) 3.5% 2.2% 1.2 p.p 10.6% -7.1 p.p Selling, general and administrative expenses (222) (226) -1.6% (226) -1.5% Other operating income (expenses) (16) (29) -43.6% (5) 229.6% Depreciation and amortization 550 552 -0.4% 489 12.4% Proportional EBITDA of associated companies and jointly controlled entities2 48 51 -5.3% 42 13.9% Adjusted EBITDA² 578 510 13.3% 1,096 -47.3% Adjusted EBITDA Margin² (%) 9.2% 7.1% 2.1 p.p 14.6% -5.4 p.p |
| Quarterly Results 1Q26 | Gerdau S.A. 7 NORTH AMERICA PRODUCTION & SHIPMENTS ▪ In 1Q26, crude steel production came 11.0% higher than in 4Q25, driven by the recovery in production levels and the resilience of demand for long steel products in the United States. Year-over-year, production was 8.4% higher, fueled by increased capacity utilization rate of common long steel units, which grew by approximately 8 p.p. between the periods. In addition, production in 1Q26 was driven by the restocking of billet inventories, due to the schedule of planned shutdowns for the second half of 2026, associated with the start of the capacity expansion in Midlothian; ▪ Steel shipments went up 4.5% from 4Q25, reflecting the typical upturn in volumes following the year-end seasonality. Growth in the quarter was driven by an increase in the order backlog in the non-residential construction and renewable energy segments, as well as higher demand from the distribution channel, supported by inventory restocking. Year-over-year, steel shipments were 3.8% higher, highlighting the Section 232 tariff adjustments that benefited local producers and the resilience of the main markets served; ▪ Throughout the quarter, certain segments with high demand for special steel, such as the automotive sector, continued to face greater pressure, reflecting vehicle inventory levels below the historical average (currently 50 days vs. 65 days), against a scenario of high interest rates and vehicle prices; ▪ In 1Q26, the order backlog remained above 90 days, a level higher than the average of recent quarters (around 70 days), highlighting the resilience of the North American market and our focused market position in higher value-added products and solutions. OPERATING RESULT 1- Non-accounting measurement reconciled with information stated in the Note 22 to the Company’s Financial Statements, as set forth by CVM Resolution No. 156 of June 23, 2022. ▪ In 1Q26, Net sales was 7.5% and 6.6% higher than in 4Q25 and 1Q25, respectively, driven by increased shipment volume and higher prices for the main product lines, due to adjustments implemented throughout the period. In addition, the growth strategy based on an improved product mix with a greater share of higher value-added products, coupled with strengthened partnerships with customers, contributed to enhanced results; ▪ Cost of sales per ton recorded a slight decrease compared to 4Q25, benefiting both from the U.S. dollar depreciation against the Brazilian real (-2.5%) and from efficiency gains associated with higher production levels, factors that mitigated the impact of rising scrap and electricity prices throughout the quarter. The total Cost of goods sold was 4.1% higher than in 4Q25, basically reflecting the increase in volume. Compared to 1Q25, Cost of goods sold was 4.4% lower, mainly driven by the foreign exchange effect (10.1%). Additionally, the operation maintained ongoing efforts to control fixed costs and achieve productivity gains at the long and special steel units; NORTH AMERICA 1Q26 4Q25 ∆ 1Q25 ∆ Volumes (1,000 tonnes) Production of crude steel 1,513 1,362 11.0% 1,395 8.4% Shipments of steel 1,276 1,221 4.5% 1,229 3.8% Bars 546 541 0.8% 512 6.6% Shapes 668 617 8.2% 663 0.8% Downstream 62 62 0.0% 54 14.7% NORTH AMERICA 1Q26 4Q25 ∆ 1Q25 ∆ Results (R$ million) Net sales 9,349 8,695 7.5% 8,768 6.6% Cost of goods sold (7,430) (7,139) 4.1% (7,773) -4.4% Gross profit 1,920 1,556 23.4% 995 93.0% Gross margin (%) 20.5% 17.9% 2.6 p.p 11.3% 9.2 p.p Selling, general and administrative expenses (188) (189) -0.6% (213) -11.8% Other operating income (expenses) 11 (13) - (0) - Depreciation and amortization 282 297 -5.1% 310 -9.3% Proportional EBITDA of associated companies and jointly controlled entities 227 181 25.4% 105 116.3% Adjusted EBITDA1 2,252 1,832 22.9% 1,198 88.1% Adjusted EBITDA Margin1 (%) 24.1% 21.1% 3.0 p.p 13.7% 10.4 p.p |
| Quarterly Results 1Q26 | Gerdau S.A. 8 ▪ As a result, Adjusted EBITDA came 22.9% and 88.1% higher than in 4Q25 and 1Q25, respectively, primarily driven by the improved results from long steel operations and the solid performance from jointly controlled entities in Mexico. On the other hand, as mentioned earlier, the results of the special steel operations remained under greater pressure, reflecting the more challenging market environment for this segment. SOUTH AMERICA PRODUCTION & SHIPMENTS 1- Includes resale of products imported from the Brazil Segment. ▪ In 1Q26, crude steel production came 13.5% and 15.7% higher than in 4Q25 and 1Q25, respectively, primarily driven by a significant demand upturn in Peru throughout the quarter. This trend boosted the region’s capacity utilization rate, which advanced approximately 10 p.p. in the year-over-year comparison; ▪ Steel shipments in 1Q26 came 3.0% and 29.1% higher than in 4Q25 and 1Q25, respectively, with stronger demand in the construction market and an improved sales mix in Peru. In Argentina and Uruguay, shipments remained at lower levels due to weakening demand in segments such as distribution and infrastructure. OPERATING RESULT 1- Non-accounting measurement reconciled with information stated in the Note 22 to the Company’s Financial Statements, as set forth by CVM Resolution No. 156 of June 23, 2022. ▪ In 1Q26, Net sales went down 6.2% from 4Q25. Despite increased volumes, the less favorable sales mix in Argentina, with a greater share of exports, and prices under pressure from the continued high inflow of imported products and local oversupply negatively impacted Net sales per tonne for the quarter. Year-over-year, Net sales came 2.2% higher, driven by increased shipment volumes, which offset lower steel prices and the impact of the U.S. dollar depreciation against the Brazilian real (-10.1%); ▪ Cost of goods sold came 8.6% lower than in 4Q25, mainly reflecting lower maintenance costs, particularly in Argentina, following the scheduled shutdowns carried out in 4Q25. In Peru, we achieved the highest rolling mill efficiency level in the past 20 months, which resulted in cost-savings, coupled with increased scrap consumption at more competitive prices. Year-over-year, the Cost of goods sold came 2.9% higher, keeping pace with the significant growth in volumes; on the other hand, the Cost of goods sold per tonne was approximately 20% lower in the period, driven by both exchange variation effects and significant operational efficiency gains resulting from industrial units’ higher capacity utilization. ▪ As a result, Adjusted EBITDA came 6.6% higher than in 4Q25 and 1.5% lower than in 1Q25. SOUTH AMERICA 1Q26 4Q25 ∆ 1Q25 ∆ Volumes (1,000 tonnes) Production of crude steel 167 147 13.5% 144 15.7% Shipments of steel¹ 306 297 3.0% 237 29.1% SOUTH AMERICA 1Q26 4Q25 ∆ 1Q25 ∆ Results (R$ million) Net sales 1,396 1,488 -6.2% 1,366 2.2% Cost of goods sold (1,241) (1,359) -8.6% (1,206) 2.9% Gross profit 155 130 19.3% 160 -3.1% Gross margin (%) 11.1% 8.7% 2.4 p.p 11.7% -0.6 p.p Selling, general and administrative expenses (42) (43) -2.1% (45) -6.4% Other operating income (expenses) 3 1 221.2% 4,4 -36.8% Depreciation and amortization 70 87 -18.8% 70 1.2% Adjusted EBITDA1 186 174 6.6% 188 -1.5% Adjusted EBITDA Margin1 (%) 13.3% 11.7% 1.6 p.p 13.8% -0.5 p.p |
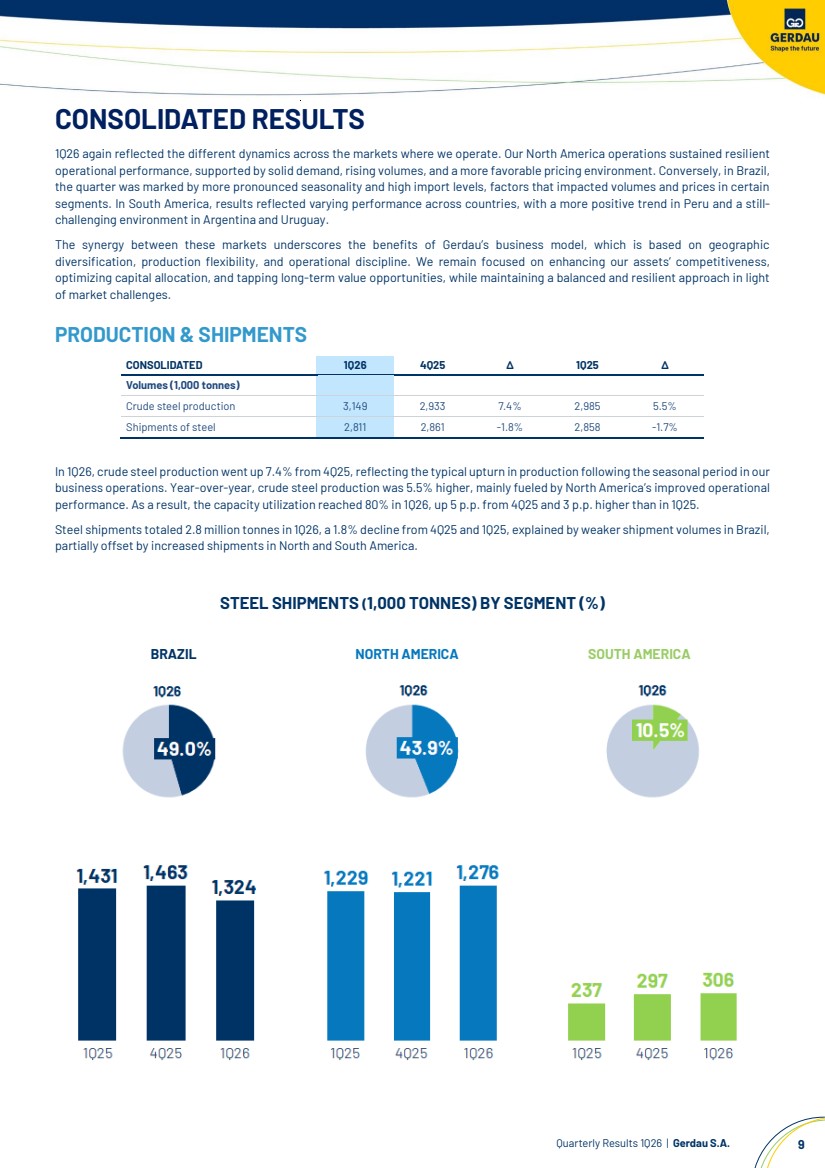
| Quarterly Results 1Q26 | Gerdau S.A. 9 CONSOLIDATED RESULTS 1Q26 again reflected the different dynamics across the markets where we operate. Our North America operations sustained resilient operational performance, supported by solid demand, rising volumes, and a more favorable pricing environment. Conversely, in Brazil, the quarter was marked by more pronounced seasonality and high import levels, factors that impacted volumes and prices in certain segments. In South America, results reflected varying performance across countries, with a more positive trend in Peru and a still-challenging environment in Argentina and Uruguay. The synergy between these markets underscores the benefits of Gerdau’s business model, which is based on geographic diversification, production flexibility, and operational discipline. We remain focused on enhancing our assets’ competitiveness, optimizing capital allocation, and tapping long-term value opportunities, while maintaining a balanced and resilient approach in light of market challenges. PRODUCTION & SHIPMENTS CONSOLIDATED 1Q26 4Q25 ∆ 1Q25 ∆ Volumes (1,000 tonnes) Crude steel production 3,149 2,933 7.4% 2,985 5.5% Shipments of steel 2,811 2,861 -1.8% 2,858 -1.7% In 1Q26, crude steel production went up 7.4% from 4Q25, reflecting the typical upturn in production following the seasonal period in our business operations. Year-over-year, crude steel production was 5.5% higher, mainly fueled by North America’s improved operational performance. As a result, the capacity utilization reached 80% in 1Q26, up 5 p.p. from 4Q25 and 3 p.p. higher than in 1Q25. Steel shipments totaled 2.8 million tonnes in 1Q26, a 1.8% decline from 4Q25 and 1Q25, explained by weaker shipment volumes in Brazil, partially offset by increased shipments in North and South America. STEEL SHIPMENTS (1,000 TONNES) BY SEGMENT (%) BRAZIL NORTH AMERICA SOUTH AMERICA |
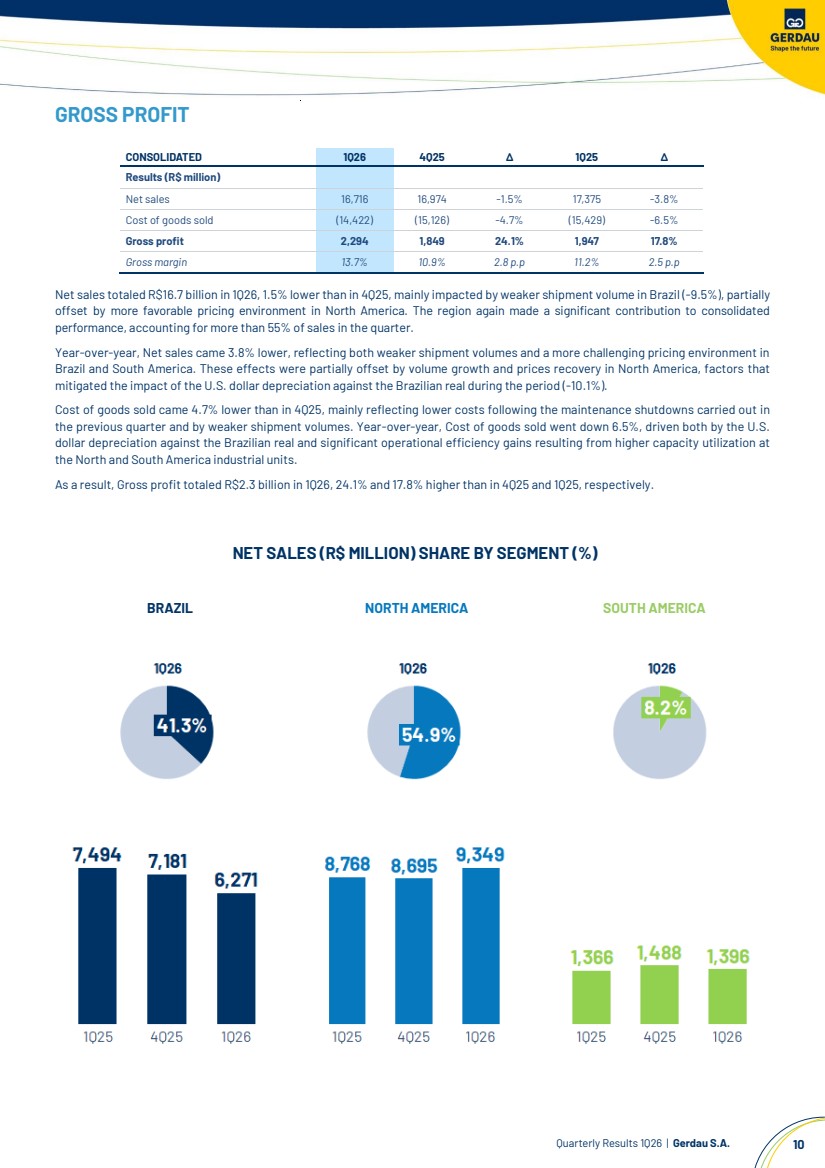
| Quarterly Results 1Q26 | Gerdau S.A. 10 GROSS PROFIT Net sales totaled R$16.7 billion in 1Q26, 1.5% lower than in 4Q25, mainly impacted by weaker shipment volume in Brazil (-9.5%), partially offset by more favorable pricing environment in North America. The region again made a significant contribution to consolidated performance, accounting for more than 55% of sales in the quarter. Year-over-year, Net sales came 3.8% lower, reflecting both weaker shipment volumes and a more challenging pricing environment in Brazil and South America. These effects were partially offset by volume growth and prices recovery in North America, factors that mitigated the impact of the U.S. dollar depreciation against the Brazilian real during the period (-10.1%). Cost of goods sold came 4.7% lower than in 4Q25, mainly reflecting lower costs following the maintenance shutdowns carried out in the previous quarter and by weaker shipment volumes. Year-over-year, Cost of goods sold went down 6.5%, driven both by the U.S. dollar depreciation against the Brazilian real and significant operational efficiency gains resulting from higher capacity utilization at the North and South America industrial units. As a result, Gross profit totaled R$2.3 billion in 1Q26, 24.1% and 17.8% higher than in 4Q25 and 1Q25, respectively. NET SALES (R$ MILLION) SHARE BY SEGMENT (%) CONSOLIDATED 1Q26 4Q25 ∆ 1Q25 ∆ Results (R$ million) Net sales 16,716 16,974 -1.5% 17,375 -3.8% Cost of goods sold (14,422) (15,126) -4.7% (15,429) -6.5% Gross profit 2,294 1,849 24.1% 1,947 17.8% Gross margin 13.7% 10.9% 2.8 p.p 11.2% 2.5 p.p BRAZIL NORTH AMERICA SOUTH AMERICA |
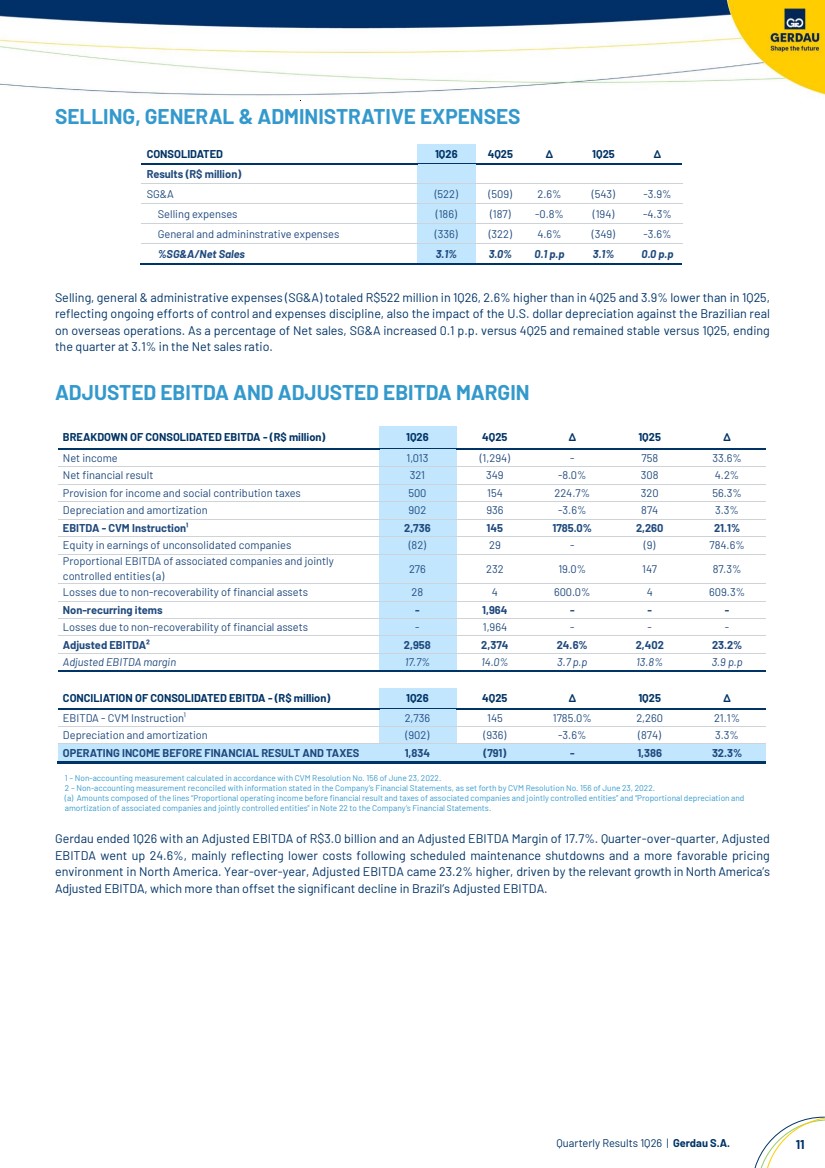
| Quarterly Results 1Q26 | Gerdau S.A. 11 SELLING, GENERAL & ADMINISTRATIVE EXPENSES Selling, general & administrative expenses (SG&A) totaled R$522 million in 1Q26, 2.6% higher than in 4Q25 and 3.9% lower than in 1Q25, reflecting ongoing efforts of control and expenses discipline, also the impact of the U.S. dollar depreciation against the Brazilian real on overseas operations. As a percentage of Net sales, SG&A increased 0.1 p.p. versus 4Q25 and remained stable versus 1Q25, ending the quarter at 3.1% in the Net sales ratio. ADJUSTED EBITDA AND ADJUSTED EBITDA MARGIN 1 – Non-accounting measurement calculated in accordance with CVM Resolution No. 156 of June 23, 2022. 2 – Non-accounting measurement reconciled with information stated in the Company’s Financial Statements, as set forth by CVM Resolution No. 156 of June 23, 2022. (a) Amounts composed of the lines “Proportional operating income before financial result and taxes of associated companies and jointly controlled entities” and “Proportional depreciation and amortization of associated companies and jointly controlled entities" in Note 22 to the Company’s Financial Statements. Gerdau ended 1Q26 with an Adjusted EBITDA of R$3.0 billion and an Adjusted EBITDA Margin of 17.7%. Quarter-over-quarter, Adjusted EBITDA went up 24.6%, mainly reflecting lower costs following scheduled maintenance shutdowns and a more favorable pricing environment in North America. Year-over-year, Adjusted EBITDA came 23.2% higher, driven by the relevant growth in North America’s Adjusted EBITDA, which more than offset the significant decline in Brazil’s Adjusted EBITDA. CONSOLIDATED 1Q26 4Q25 ∆ 1Q25 ∆ Results (R$ million) SG&A (522) (509) 2.6% (543) -3.9% Selling expenses (186) (187) -0.8% (194) -4.3% General and admininstrative expenses (336) (322) 4.6% (349) -3.6% %SG&A/Net Sales 3.1% 3.0% 0.1 p.p 3.1% 0.0 p.p BREAKDOWN OF CONSOLIDATED EBITDA - (R$ million) 1Q26 4Q25 ∆ 1Q25 ∆ Net income 1,013 (1,294) - 758 33.6% Net financial result 321 349 -8.0% 308 4.2% Provision for income and social contribution taxes 500 154 224.7% 320 56.3% Depreciation and amortization 902 936 -3.6% 874 3.3% EBITDA - CVM Instruction¹ 2,736 145 1785.0% 2,260 21.1% Equity in earnings of unconsolidated companies (82) 29 - (9) 784.6% Proportional EBITDA of associated companies and jointly controlled entities (a) 276 232 19.0% 147 87.3% Losses due to non-recoverability of financial assets 28 4 600.0% 4 609.3% Non-recurring items - 1,964 - - - Losses due to non-recoverability of financial assets - 1,964 - - - Adjusted EBITDA² 2,958 2,374 24.6% 2,402 23.2% Adjusted EBITDA margin 17.7% 14.0% 3.7 p.p 13.8% 3.9 p.p CONCILIATION OF CONSOLIDATED EBITDA - (R$ million) 1Q26 4Q25 ∆ 1Q25 ∆ EBITDA - CVM Instruction¹ 2,736 145 1785.0% 2,260 21.1% Depreciation and amortization (902) (936) -3.6% (874) 3.3% OPERATING INCOME BEFORE FINANCIAL RESULT AND TAXES 1,834 (791) - 1,386 32.3% |
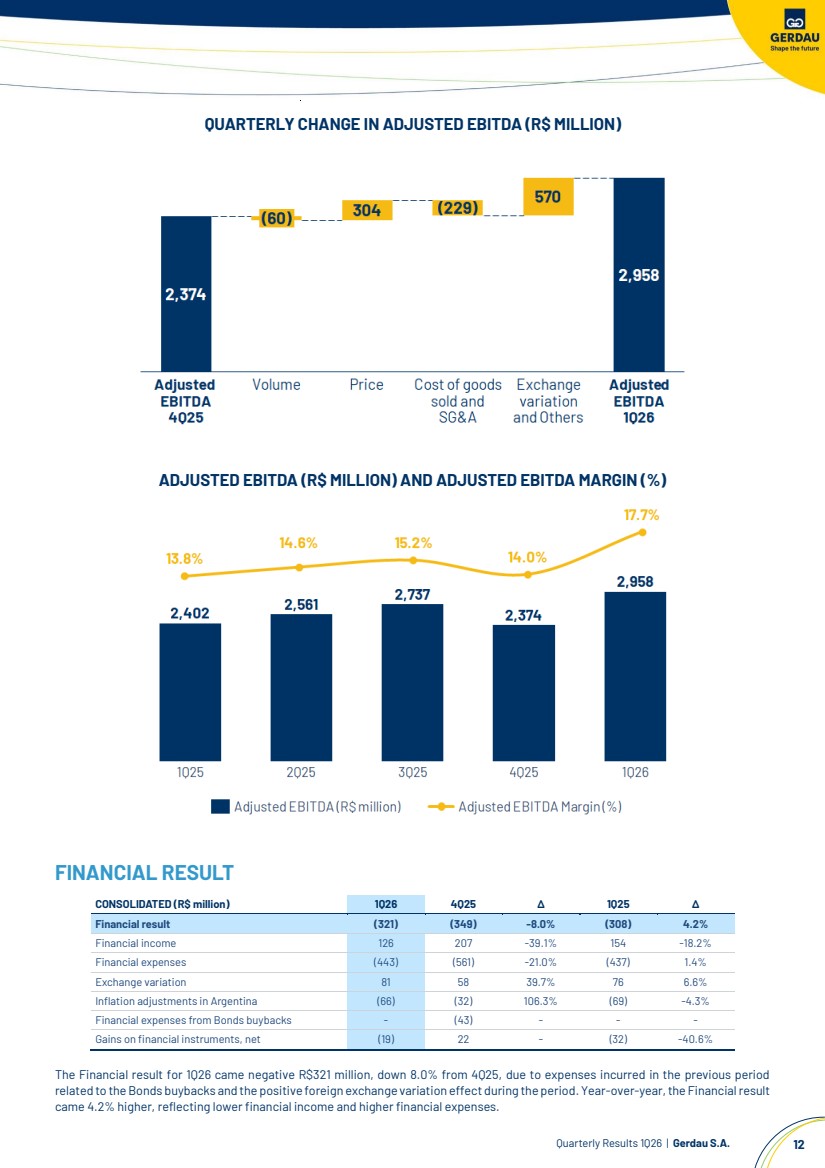
| Quarterly Results 1Q26 | Gerdau S.A. 12 QUARTERLY CHANGE IN ADJUSTED EBITDA (R$ MILLION) ADJUSTED EBITDA (R$ MILLION) AND ADJUSTED EBITDA MARGIN (%) FINANCIAL RESULT CONSOLIDATED (R$ million) 1Q26 4Q25 ∆ 1Q25 ∆ Financial result (321) (349) -8.0% (308) 4.2% Financial income 126 207 -39.1% 154 -18.2% Financial expenses (443) (561) -21.0% (437) 1.4% Exchange variation 81 58 39.7% 76 6.6% Inflation adjustments in Argentina (66) (32) 106.3% (69) -4.3% Financial expenses from Bonds buybacks - (43) - - - Gains on financial instruments, net (19) 22 - (32) -40.6% The Financial result for 1Q26 came negative R$321 million, down 8.0% from 4Q25, due to expenses incurred in the previous period related to the Bonds buybacks and the positive foreign exchange variation effect during the period. Year-over-year, the Financial result came 4.2% higher, reflecting lower financial income and higher financial expenses. |
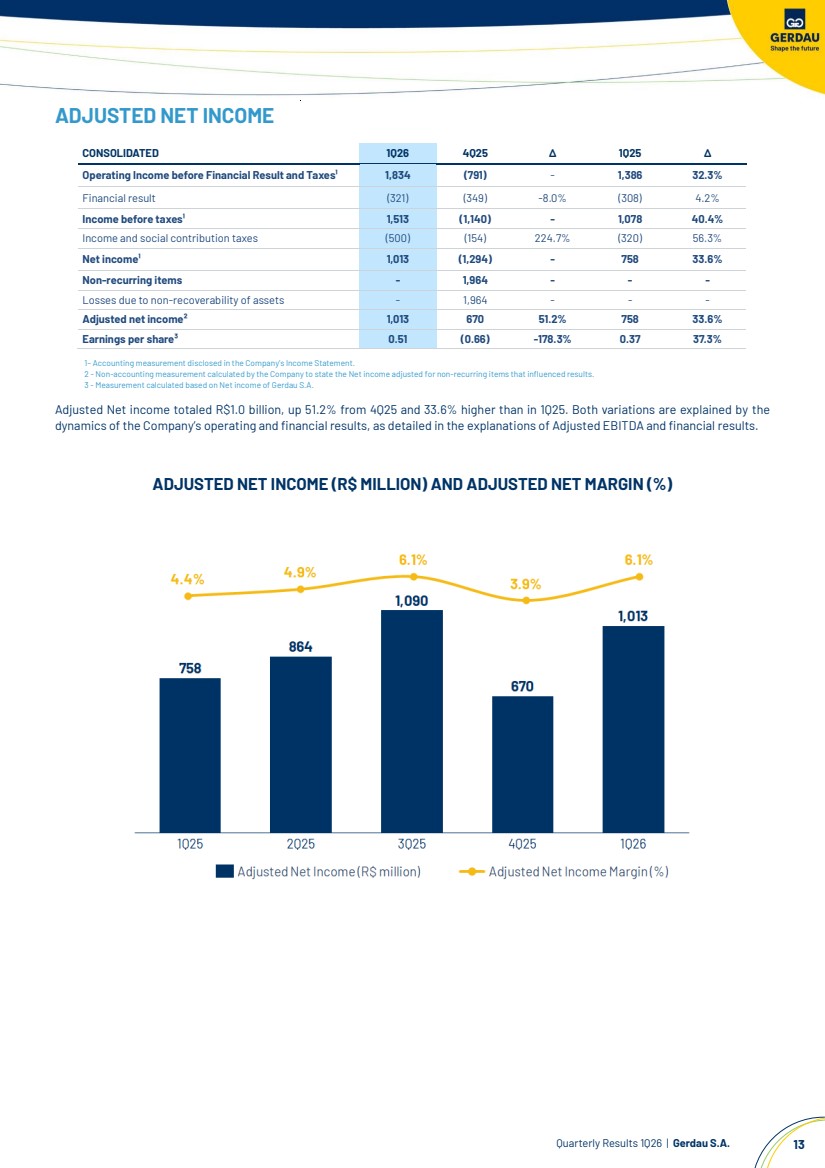
| Quarterly Results 1Q26 | Gerdau S.A. 13 ADJUSTED NET INCOME 1– Accounting measurement disclosed in the Company’s Income Statement. 2 - Non-accounting measurement calculated by the Company to state the Net income adjusted for non-recurring items that influenced results. 3 - Measurement calculated based on Net income of Gerdau S.A. Adjusted Net income totaled R$1.0 billion, up 51.2% from 4Q25 and 33.6% higher than in 1Q25. Both variations are explained by the dynamics of the Company’s operating and financial results, as detailed in the explanations of Adjusted EBITDA and financial results. ADJUSTED NET INCOME (R$ MILLION) AND ADJUSTED NET MARGIN (%) CONSOLIDATED 1Q26 4Q25 ∆ 1Q25 ∆ Operating Income before Financial Result and Taxes¹ 1,834 (791) - 1,386 32.3% Financial result (321) (349) -8.0% (308) 4.2% Income before taxes¹ 1,513 (1,140) - 1,078 40.4% Income and social contribution taxes (500) (154) 224.7% (320) 56.3% Net income¹ 1,013 (1,294) - 758 33.6% Non-recurring items - 1,964 - - - Losses due to non-recoverability of assets - 1,964 - - - Adjusted net income² 1,013 670 51.2% 758 33.6% Earnings per share³ 0.51 (0.66) -178.3% 0.37 37.3% |
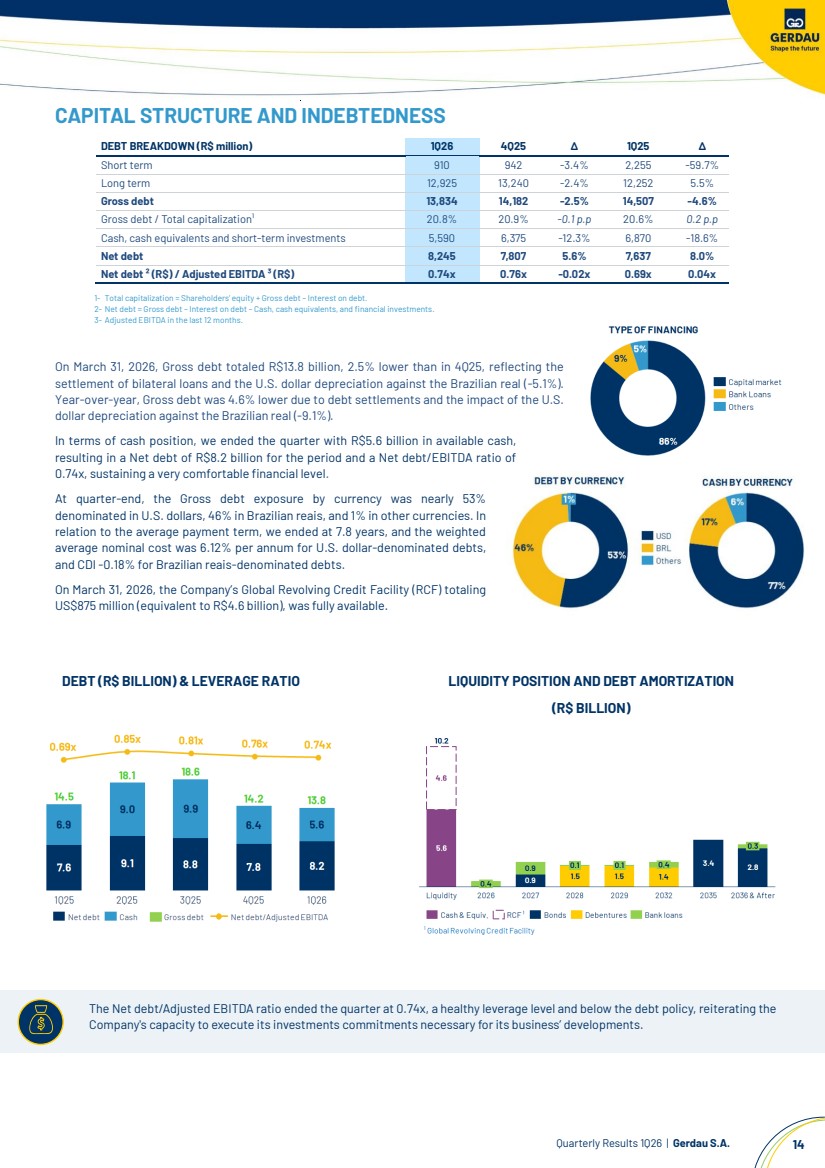
| Quarterly Results 1Q26 | Gerdau S.A. 14 The Net debt/Adjusted EBITDA ratio ended the quarter at 0.74x, a healthy leverage level and below the debt policy, reiterating the Company's capacity to execute its investments commitments necessary for its business’ developments. CAPITAL STRUCTURE AND INDEBTEDNESS DEBT BREAKDOWN (R$ million) 1Q26 4Q25 ∆ 1Q25 ∆ Short term 910 942 -3.4% 2,255 -59.7% Long term 12,925 13,240 -2.4% 12,252 5.5% Gross debt 13,834 14,182 -2.5% 14,507 -4.6% Gross debt / Total capitalization¹ 20.8% 20.9% -0.1 p.p 20.6% 0.2 p.p Cash, cash equivalents and short-term investments 5,590 6,375 -12.3% 6,870 -18.6% Net debt 8,245 7,807 5.6% 7,637 8.0% Net debt ² (R$) / Adjusted EBITDA ³ (R$) 0.74x 0.76x -0.02x 0.69x 0.04x 1- Total capitalization = Shareholders’ equity + Gross debt – Interest on debt. 2- Net debt = Gross debt – Interest on debt – Cash, cash equivalents, and financial investments. 3- Adjusted EBITDA in the last 12 months. On March 31, 2026, Gross debt totaled R$13.8 billion, 2.5% lower than in 4Q25, reflecting the settlement of bilateral loans and the U.S. dollar depreciation against the Brazilian real (-5.1%). Year-over-year, Gross debt was 4.6% lower due to debt settlements and the impact of the U.S. dollar depreciation against the Brazilian real (-9.1%). In terms of cash position, we ended the quarter with R$5.6 billion in available cash, resulting in a Net debt of R$8.2 billion for the period and a Net debt/EBITDA ratio of 0.74x, sustaining a very comfortable financial level. At quarter-end, the Gross debt exposure by currency was nearly 53% denominated in U.S. dollars, 46% in Brazilian reais, and 1% in other currencies. In relation to the average payment term, we ended at 7.8 years, and the weighted average nominal cost was 6.12% per annum for U.S. dollar-denominated debts, and CDI -0.18% for Brazilian reais-denominated debts. On March 31, 2026, the Company’s Global Revolving Credit Facility (RCF) totaling US$875 million (equivalent to R$4.6 billion), was fully available. DEBT (R$ BILLION) & LEVERAGE RATIO LIQUIDITY POSITION AND DEBT AMORTIZATION (R$ BILLION) |
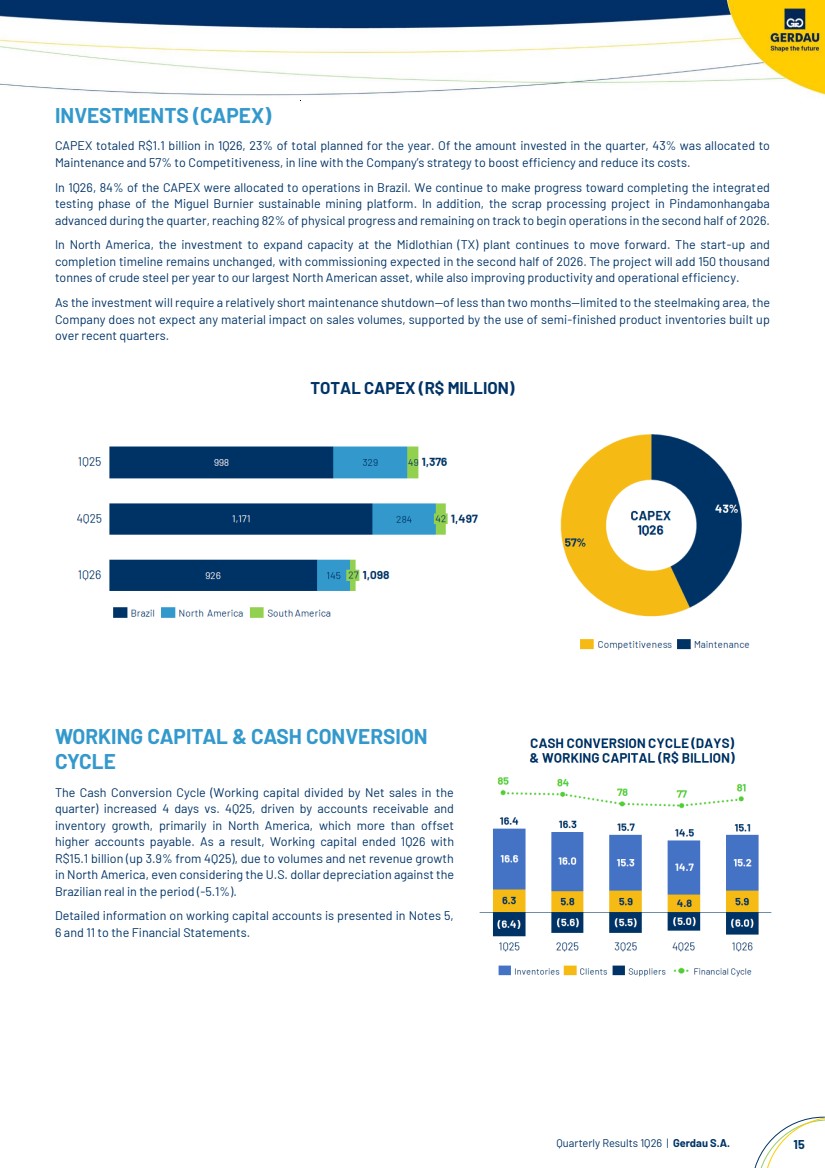
| Quarterly Results 1Q26 | Gerdau S.A. 15 INVESTMENTS (CAPEX) CAPEX totaled R$1.1 billion in 1Q26, 23% of total planned for the year. Of the amount invested in the quarter, 43% was allocated to Maintenance and 57% to Competitiveness, in line with the Company’s strategy to boost efficiency and reduce its costs. In 1Q26, 84% of the CAPEX were allocated to operations in Brazil. We continue to make progress toward completing the integrated testing phase of the Miguel Burnier sustainable mining platform. In addition, the scrap processing project in Pindamonhangaba advanced during the quarter, reaching 82% of physical progress and remaining on track to begin operations in the second half of 2026. In North America, the investment to expand capacity at the Midlothian (TX) plant continues to move forward. The start-up and completion timeline remains unchanged, with commissioning expected in the second half of 2026. The project will add 150 thousand tonnes of crude steel per year to our largest North American asset, while also improving productivity and operational efficiency. As the investment will require a relatively short maintenance shutdown—of less than two months—limited to the steelmaking area, the Company does not expect any material impact on sales volumes, supported by the use of semi-finished product inventories built up over recent quarters. TOTAL CAPEX (R$ MILLION) WORKING CAPITAL & CASH CONVERSION CYCLE The Cash Conversion Cycle (Working capital divided by Net sales in the quarter) increased 4 days vs. 4Q25, driven by accounts receivable and inventory growth, primarily in North America, which more than offset higher accounts payable. As a result, Working capital ended 1Q26 with R$15.1 billion (up 3.9% from 4Q25), due to volumes and net revenue growth in North America, even considering the U.S. dollar depreciation against the Brazilian real in the period (-5.1%). Detailed information on working capital accounts is presented in Notes 5, 6 and 11 to the Financial Statements. |
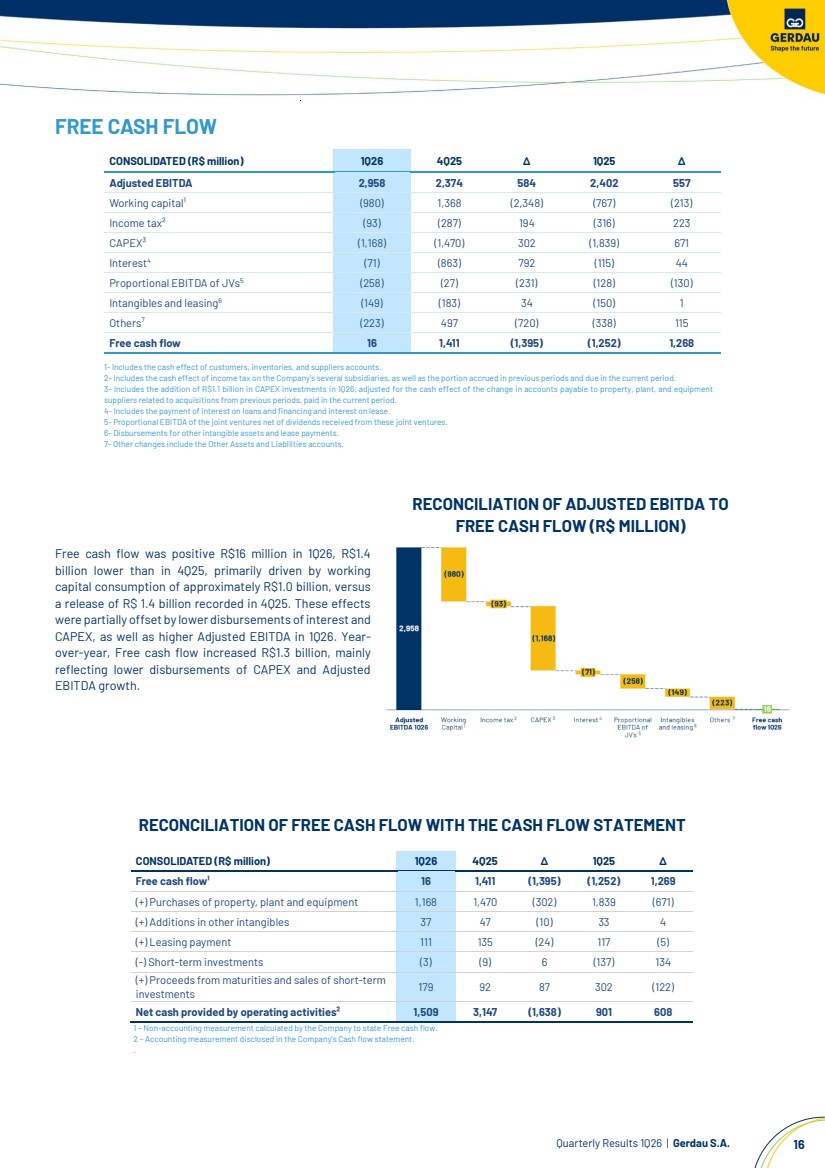
| Quarterly Results 1Q26 | Gerdau S.A. 16 FREE CASH FLOW CONSOLIDATED (R$ million) 1Q26 4Q25 ∆ 1Q25 ∆ Adjusted EBITDA 2,958 2,374 584 2,402 557 Working capital¹ (980) 1,368 (2,348) (767) (213) Income tax² (93) (287) 194 (316) 223 CAPEX³ (1,168) (1,470) 302 (1,839) 671 Interest4 (71) (863) 792 (115) 44 Proportional EBITDA of JVs5 (258) (27) (231) (128) (130) Intangibles and leasing6 (149) (183) 34 (150) 1 Others7 (223) 497 (720) (338) 115 Free cash flow 16 1,411 (1,395) (1,252) 1,268 1-Includes the cash effect of customers, inventories, and suppliers accounts. 2-Includes the cash effect of income tax on the Company’s several subsidiaries, as well as the portion accrued in previous periods and due in the current period. 3- Includes the addition of R$1.1 billion in CAPEX investments in 1Q26, adjusted for the cash effect of the change in accounts payable to property, plant, and equipment suppliers related to acquisitions from previous periods, paid in the current period. 4-Includes the payment of interest on loans and financing and interest on lease. 5- Proportional EBITDA of the joint ventures net of dividends received from these joint ventures. 6- Disbursements for other intangible assets and lease payments. 7- Other changes include the Other Assets and Liabilities accounts. RECONCILIATION OF ADJUSTED EBITDA TO FREE CASH FLOW (R$ MILLION) Free cash flow was positive R$16 million in 1Q26, R$1.4 billion lower than in 4Q25, primarily driven by working capital consumption of approximately R$1.0 billion, versus a release of R$ 1.4 billion recorded in 4Q25. These effects were partially offset by lower disbursements of interest and CAPEX, as well as higher Adjusted EBITDA in 1Q26. Year-over-year, Free cash flow increased R$1.3 billion, mainly reflecting lower disbursements of CAPEX and Adjusted EBITDA growth. RECONCILIATION OF FREE CASH FLOW WITH THE CASH FLOW STATEMENT 1 – Non-accounting measurement calculated by the Company to state Free cash flow. 2 – Accounting measurement disclosed in the Company’s Cash flow statement. . CONSOLIDATED (R$ million) 1Q26 4Q25 ∆ 1Q25 ∆ Free cash flow¹ 16 1,411 (1,395) (1,252) 1,269 (+) Purchases of property, plant and equipment 1,168 1,470 (302) 1,839 (671) (+) Additions in other intangibles 37 47 (10) 33 4 (+) Leasing payment 111 135 (24) 117 (5) (-) Short-term investments (3) (9) 6 (137) 134 (+) Proceeds from maturities and sales of short-term investments 179 92 87 302 (122) Net cash provided by operating activities² 1,509 3,147 (1,638) 901 608 |
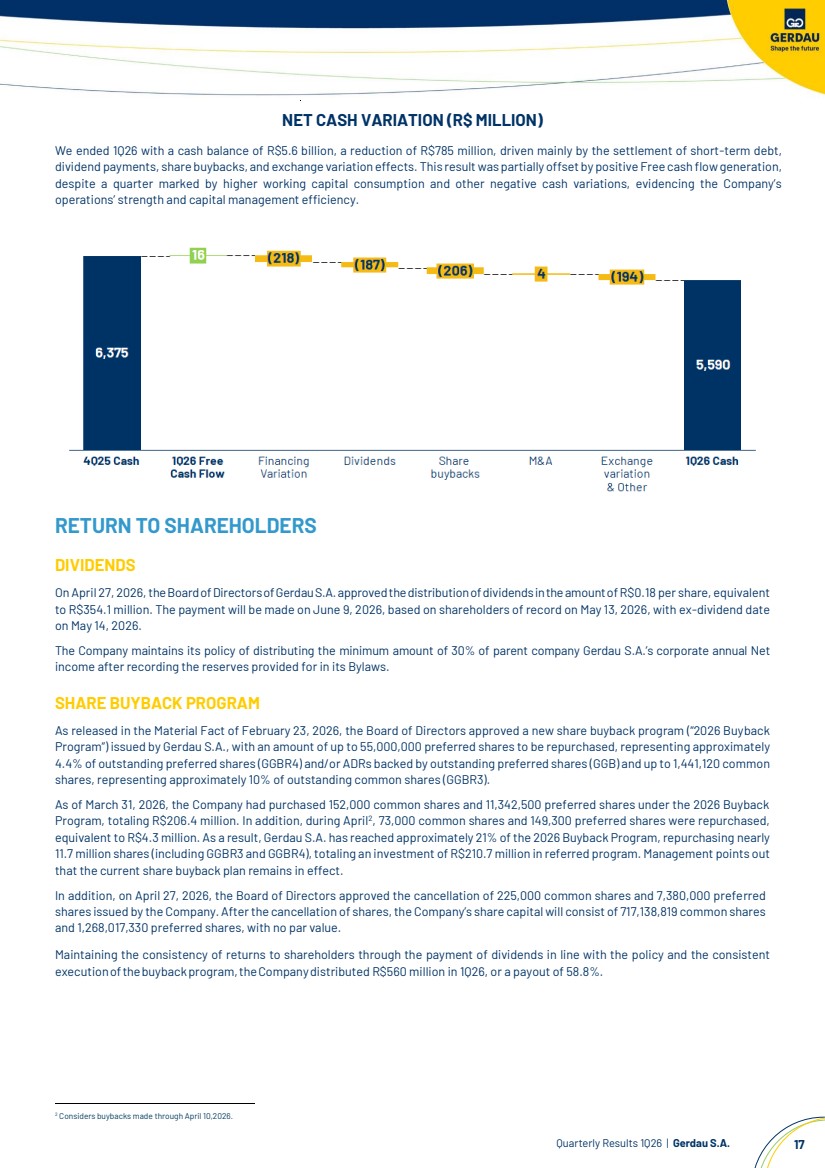
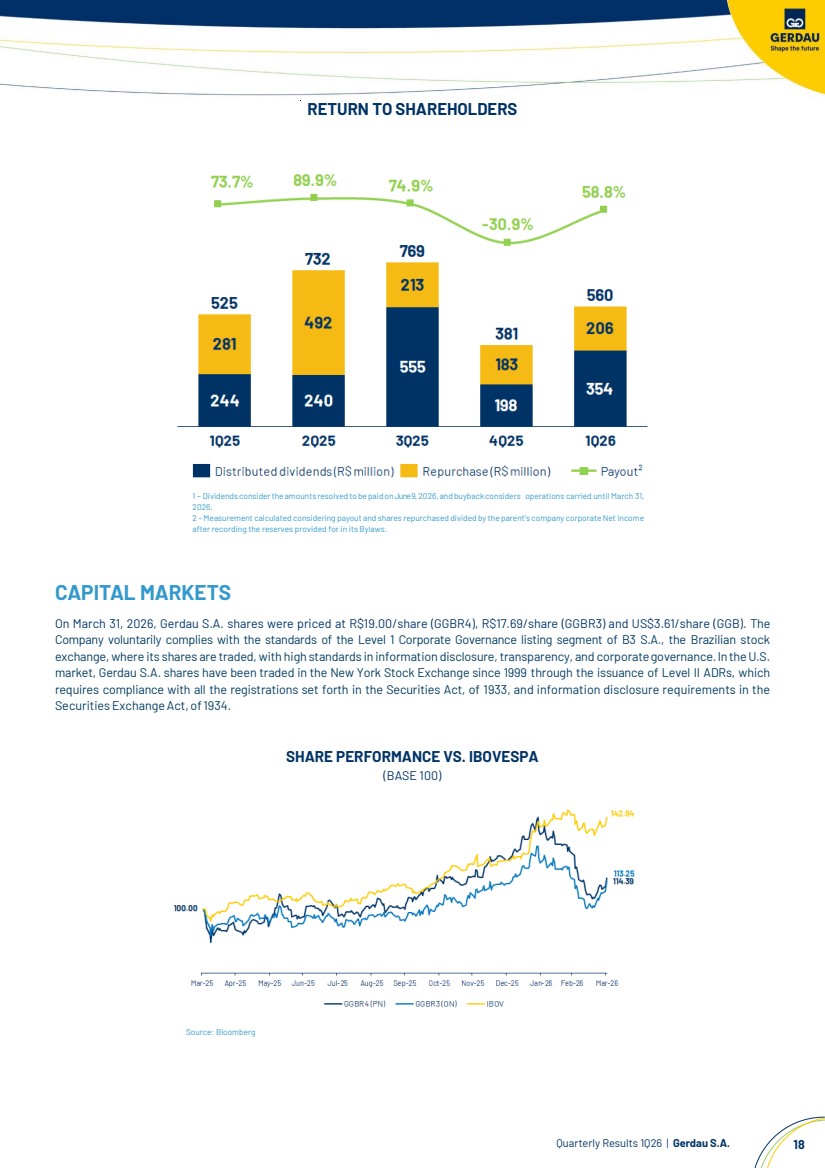
| Quarterly Results 1Q26 | Gerdau S.A. 17 NET CASH VARIATION (R$ MILLION) We ended 1Q26 with a cash balance of R$5.6 billion, a reduction of R$785 million, driven mainly by the settlement of short-term debt, dividend payments, share buybacks, and exchange variation effects. This result was partially offset by positive Free cash flow generation, despite a quarter marked by higher working capital consumption and other negative cash variations, evidencing the Company’s operations’ strength and capital management efficiency. RETURN TO SHAREHOLDERS DIVIDENDS On April 27, 2026, theBoardofDirectorsofGerdauS.A.approvedthedistributionofdividendsintheamountofR$0.18 per share, equivalent to R$354.1 million. The payment will be made on June 9, 2026, based on shareholders of record on May 13, 2026, with ex-dividend date on May 14, 2026. The Company maintains its policy of distributing the minimum amount of 30% of parent company Gerdau S.A.’s corporate annual Net income after recording the reserves provided for in its Bylaws. SHARE BUYBACK PROGRAM As released in the Material Fact of February 23, 2026, the Board of Directors approved a new share buyback program (“2026 Buyback Program”) issued by Gerdau S.A., with an amount of up to 55,000,000 preferred shares to be repurchased, representing approximately 4.4% of outstanding preferred shares (GGBR4) and/or ADRs backed by outstanding preferred shares (GGB) and up to 1,441,120 common shares, representing approximately 10% of outstanding common shares (GGBR3). As of March 31, 2026, the Company had purchased 152,000 common shares and 11,342,500 preferred shares under the 2026 Buyback Program, totaling R$206.4 million. In addition, during April2 , 73,000 common shares and 149,300 preferred shares were repurchased, equivalent to R$4.3 million. As a result, Gerdau S.A. has reached approximately 21% of the 2026 Buyback Program, repurchasing nearly 11.7 million shares (including GGBR3 and GGBR4), totaling an investment of R$210.7 million in referred program. Management points out that the current share buyback plan remains in effect. In addition, on April 27, 2026, the Board of Directors approved the cancellation of 225,000 common shares and 7,380,000 preferred shares issued by the Company. After the cancellation of shares, the Company’s share capital will consist of 717,138,819 common shares and 1,268,017,330 preferred shares, with no par value. Maintaining the consistency of returns to shareholders through the payment of dividends in line with the policy and the consistent executionofthebuybackprogram,theCompanydistributed R$560 million in 1Q26, or a payout of 58.8%. 2 Considers buybacks made through April 10,2026. |
| Quarterly Results 1Q26 | Gerdau S.A. 18 RETURN TO SHAREHOLDERS 1 – Dividends considertheamounts resolved tobepaidonJune 9, 2026, andbuybackconsiders operations carried until March 31, 2026. 2 – Measurement calculated considering payout and shares repurchased divided by the parent’s company corporate Net income after recording the reserves provided for in its Bylaws. CAPITAL MARKETS On March 31, 2026, Gerdau S.A. shares were priced at R$19.00/share (GGBR4), R$17.69/share (GGBR3) and US$3.61/share (GGB). The Company voluntarily complies with the standards of the Level 1 Corporate Governance listing segment of B3 S.A., the Brazilian stock exchange, where its shares are traded, with high standards in information disclosure,transparency, and corporategovernance.IntheU.S. market, Gerdau S.A. shares have been traded in the New York Stock Exchange since 1999 through the issuance of Level II ADRs, which requires compliance with all the registrations set forth in the Securities Act, of 1933, and information disclosure requirements in the SecuritiesExchangeAct, of1934. SHARE PERFORMANCE VS. IBOVESPA (BASE 100) Source: Bloomberg |
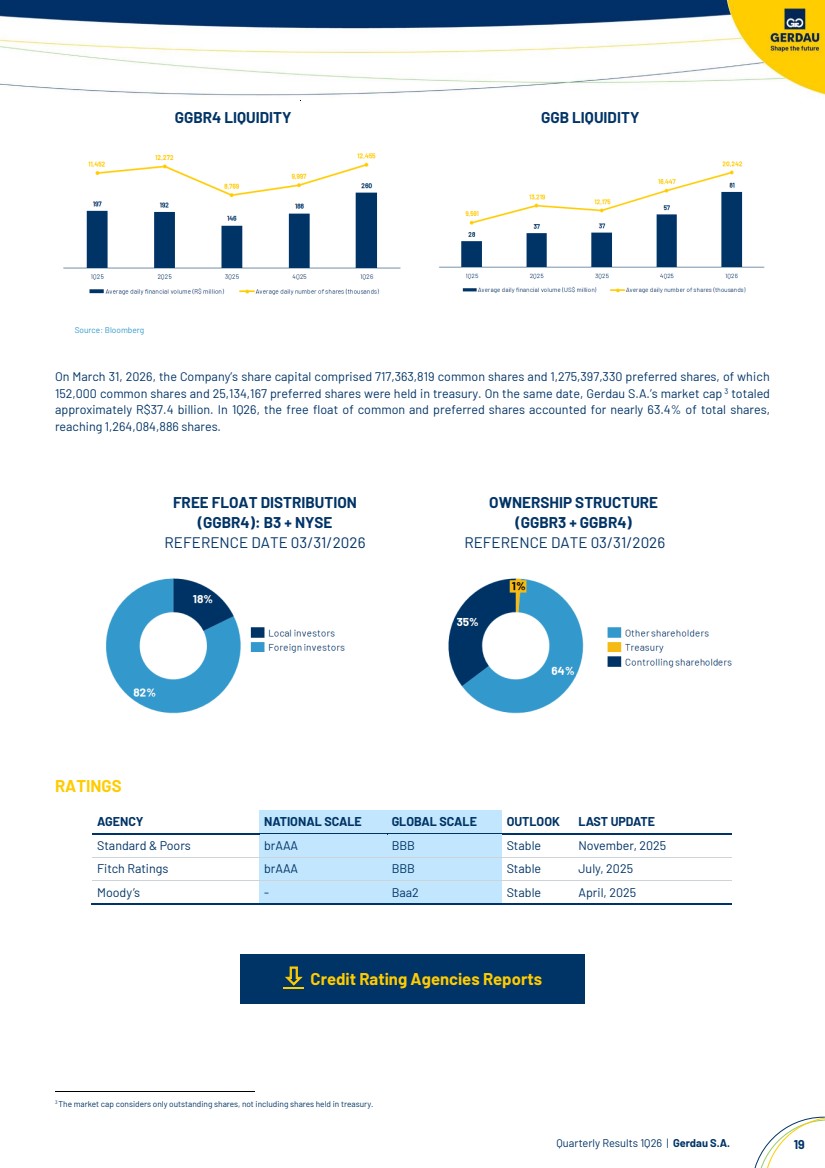
| Quarterly Results 1Q26 | Gerdau S.A. 19 GGBR4 LIQUIDITY GGB LIQUIDITY Source: Bloomberg On March 31, 2026, the Company’s share capital comprised 717,363,819 common shares and 1,275,397,330 preferred shares, of which 152,000 common shares and 25,134,167 preferred shares were held in treasury. On the same date, Gerdau S.A.’s market cap4F2F 3 totaled approximately R$37.4 billion. In 1Q26, the free float of common and preferred shares accounted for nearly 63.4% of total shares, reaching 1,264,084,886 shares. FREE FLOAT DISTRIBUTION (GGBR4): B3 + NYSE REFERENCE DATE 03/31/2026 OWNERSHIP STRUCTURE (GGBR3 + GGBR4) REFERENCE DATE 03/31/2026 RATINGS Credit Rating Agencies Reports 3The market cap considers only outstanding shares, not including shares held in treasury. AGENCY NATIONAL SCALE GLOBAL SCALE OUTLOOK LAST UPDATE Standard & Poors brAAA BBB Stable November, 2025 Fitch Ratings brAAA BBB Stable July, 2025 Moody’s - Baa2 Stable April, 2025 |
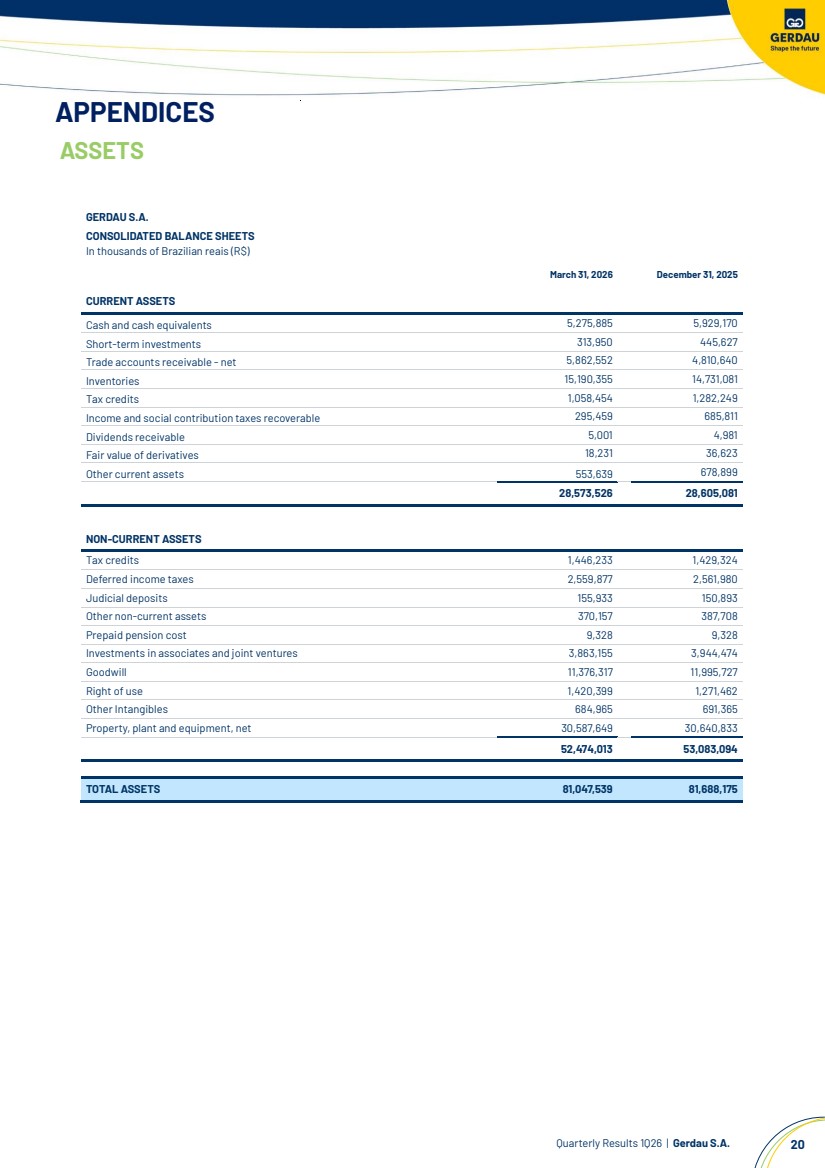
| Quarterly Results 1Q26 | Gerdau S.A. 20 APPENDICES ASSETS GERDAU S.A. CONSOLIDATED BALANCE SHEETS In thousands of Brazilian reais (R$) March 31, 2026 December 31, 2025 CURRENT ASSETS Cash and cash equivalents 5,275,885 5,929,170 Short-term investments 313,950 445,627 Trade accounts receivable - net 5,862,552 4,810,640 Inventories 15,190,355 14,731,081 Tax credits 1,058,454 1,282,249 Income and social contribution taxes recoverable 295,459 685,811 Dividends receivable 5,001 4,981 Fair value of derivatives 18,231 36,623 Other current assets 553,639 678,899 28,573,526 28,605,081 NON-CURRENT ASSETS Tax credits 1,446,233 1,429,324 Deferred income taxes 2,559,877 2,561,980 Judicial deposits 155,933 150,893 Other non-current assets 370,157 387,708 Prepaid pension cost 9,328 9,328 Investments in associates and joint ventures 3,863,155 3,944,474 Goodwill 11,376,317 11,995,727 Right of use 1,420,399 1,271,462 Other Intangibles 684,965 691,365 Property, plant and equipment, net 30,587,649 30,640,833 52,474,013 53,083,094 TOTAL ASSETS 81,047,539 81,688,175 |
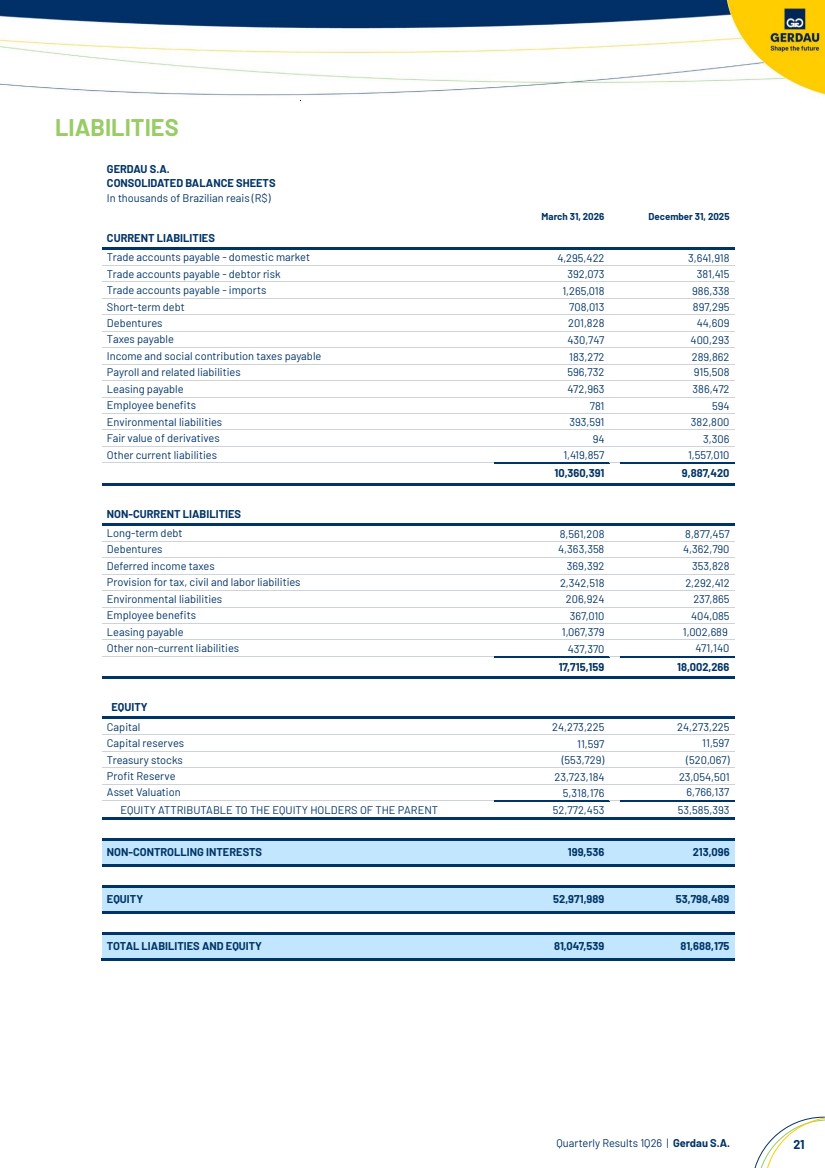
| Quarterly Results 1Q26 | Gerdau S.A. 21 LIABILITIES GERDAU S.A. CONSOLIDATED BALANCE SHEETS In thousands of Brazilian reais (R$) March 31, 2026 December 31, 2025 CURRENT LIABILITIES Trade accounts payable - domestic market 4,295,422 3,641,918 Trade accounts payable - debtor risk 392,073 381,415 Trade accounts payable - imports 1,265,018 986,338 Short-term debt 708,013 897,295 Debentures 201,828 44,609 Taxes payable 430,747 400,293 Income and social contribution taxes payable 183,272 289,862 Payroll and related liabilities 596,732 915,508 Leasing payable 472,963 386,472 Employee benefits 781 594 Environmental liabilities 393,591 382,800 Fair value of derivatives 94 3,306 Other current liabilities 1,419,857 1,557,010 10,360,391 9,887,420 NON-CURRENT LIABILITIES Long-term debt 8,561,208 8,877,457 Debentures 4,363,358 4,362,790 Deferred income taxes 369,392 353,828 Provision for tax, civil and labor liabilities 2,342,518 2,292,412 Environmental liabilities 206,924 237,865 Employee benefits 367,010 404,085 Leasing payable 1,067,379 1,002,689 Other non-current liabilities 437,370 471,140 17,715,159 18,002,266 EQUITY Capital 24,273,225 24,273,225 Capital reserves 11,597 11,597 Treasury stocks (553,729) (520,067) Profit Reserve 23,723,184 23,054,501 Asset Valuation 5,318,176 6,766,137 EQUITY ATTRIBUTABLE TO THE EQUITY HOLDERS OF THE PARENT 52,772,453 53,585,393 NON-CONTROLLING INTERESTS 199,536 213,096 EQUITY 52,971,989 53,798,489 TOTAL LIABILITIES AND EQUITY 81,047,539 81,688,175 |
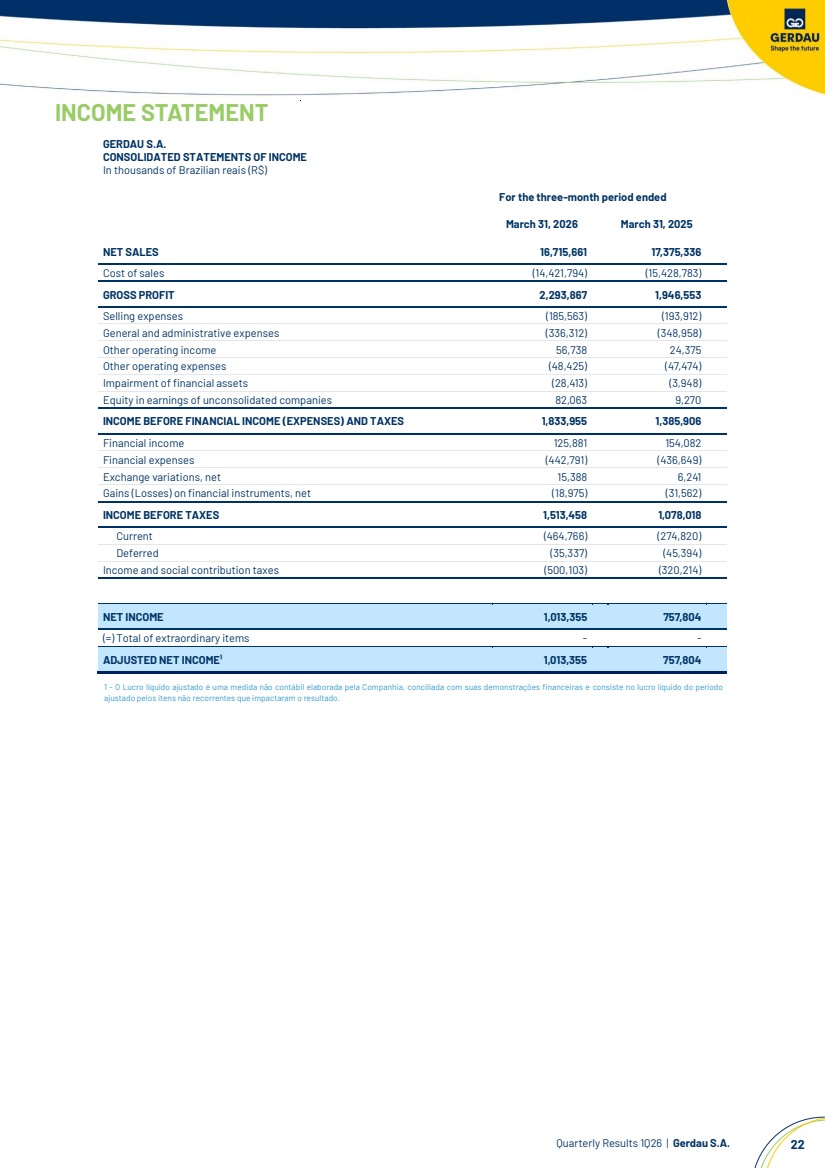
| Quarterly Results 1Q26 | Gerdau S.A. 22 INCOME STATEMENT GERDAU S.A. CONSOLIDATED STATEMENTS OF INCOME In thousands of Brazilian reais (R$) For the three-month period ended March 31, 2026 March 31, 2025 NET SALES 16,715,661 17,375,336 Cost of sales (14,421,794) (15,428,783) GROSS PROFIT 2,293,867 1,946,553 Selling expenses (185,563) (193,912) General and administrative expenses (336,312) (348,958) Other operating income 56,738 24,375 Other operating expenses (48,425) (47,474) Impairment of financial assets (28,413) (3,948) Equity in earnings of unconsolidated companies 82,063 9,270 INCOME BEFORE FINANCIAL INCOME (EXPENSES) AND TAXES 1,833,955 1,385,906 Financial income 125,881 154,082 Financial expenses (442,791) (436,649) Exchange variations, net 15,388 6,241 Gains (Losses) on financial instruments, net (18,975) (31,562) INCOME BEFORE TAXES 1,513,458 1,078,018 Current (464,766) (274,820) Deferred (35,337) (45,394) Income and social contribution taxes (500,103) (320,214) NET INCOME 1,013,355 757,804 (=) Total of extraordinary items - - ADJUSTED NET INCOME¹ 1,013,355 757,804 1 - O Lucro líquido ajustado é uma medida não contábil elaborada pela Companhia, conciliada com suas demonstrações financeiras e consiste no lucro líquido do período ajustado pelos itens não recorrentes que impactaram o resultado. |
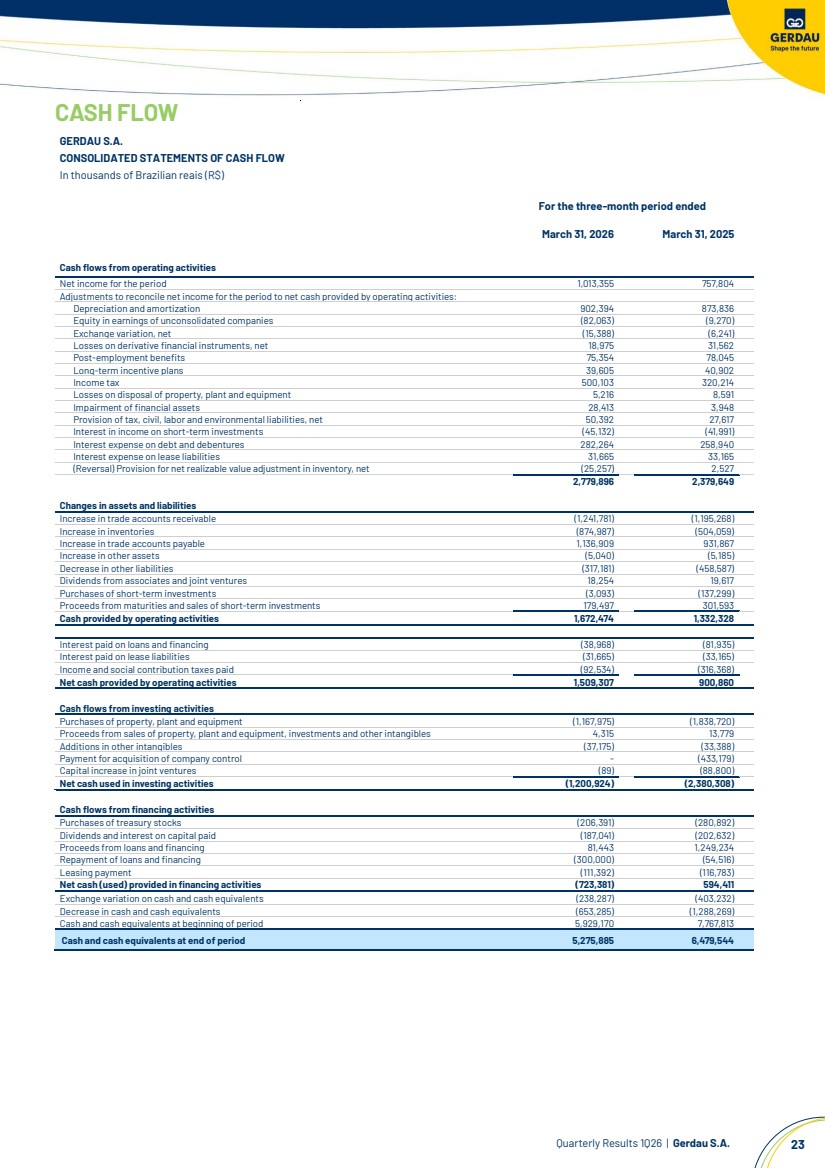
| Quarterly Results 1Q26 | Gerdau S.A. 23 CASH FLOW GERDAU S.A. CONSOLIDATED STATEMENTS OF CASH FLOW In thousands of Brazilian reais (R$) For the three-month period ended March 31, 2026 March 31, 2025 Cash flows from operating activities Net income for the period 1,013,355 757,804 Adjustments to reconcile net income for the period to net cash provided by operating activities: Depreciation and amortization 902,394 873,836 Equity in earnings of unconsolidated companies (82,063) (9,270) Exchange variation, net (15,388) (6,241) Losses on derivative financial instruments, net 18,975 31,562 Post-employment benefits 75,354 78,045 Long-term incentive plans 39,605 40,902 Income tax 500,103 320,214 Losses on disposal of property, plant and equipment 5,216 8,591 Impairment of financial assets 28,413 3,948 Provision of tax, civil, labor and environmental liabilities, net 50,392 27,617 Interest in income on short-term investments (45,132) (41,991) Interest expense on debt and debentures 282,264 258,940 Interest expense on lease liabilities 31,665 33,165 (Reversal) Provision for net realizable value adjustment in inventory, net (25,257) 2,527 2,779,896 2,379,649 Changes in assets and liabilities Increase in trade accounts receivable (1,241,781) (1,195,268) Increase in inventories (874,987) (504,059) Increase in trade accounts payable 1,136,909 931,867 Increase in other assets (5,040) (5,185) Decrease in other liabilities (317,181) (458,587) Dividends from associates and joint ventures 18,254 19,617 Purchases of short-term investments (3,093) (137,299) Proceeds from maturities and sales of short-term investments 179,497 301,593 Cash provided by operating activities 1,672,474 1,332,328 Interest paid on loans and financing (38,968) (81,935) Interest paid on lease liabilities (31,665) (33,165) Income and social contribution taxes paid (92,534) (316,368) Net cash provided by operating activities 1,509,307 900,860 Cash flows from investing activities Purchases of property, plant and equipment (1,167,975) (1,838,720) Proceeds from sales of property, plant and equipment, investments and other intangibles 4,315 13,779 Additions in other intangibles (37,175) (33,388) Payment for acquisition of company control - (433,179) Capital increase in joint ventures (89) (88,800) Net cash used in investing activities (1,200,924) (2,380,308) Cash flows from financing activities Purchases of treasury stocks (206,391) (280,892) Dividends and interest on capital paid (187,041) (202,632) Proceeds from loans and financing 81,443 1,249,234 Repayment of loans and financing (300,000) (54,516) Leasing payment (111,392) (116,783) Net cash (used) provided in financing activities (723,381) 594,411 Exchange variation on cash and cash equivalents (238,287) (403,232) Decrease in cash and cash equivalents (653,285) (1,288,269) Cash and cash equivalents at beginning of period 5,929,170 7,767,813 Cash and cash equivalents at end of period 5,275,885 6,479,544 |
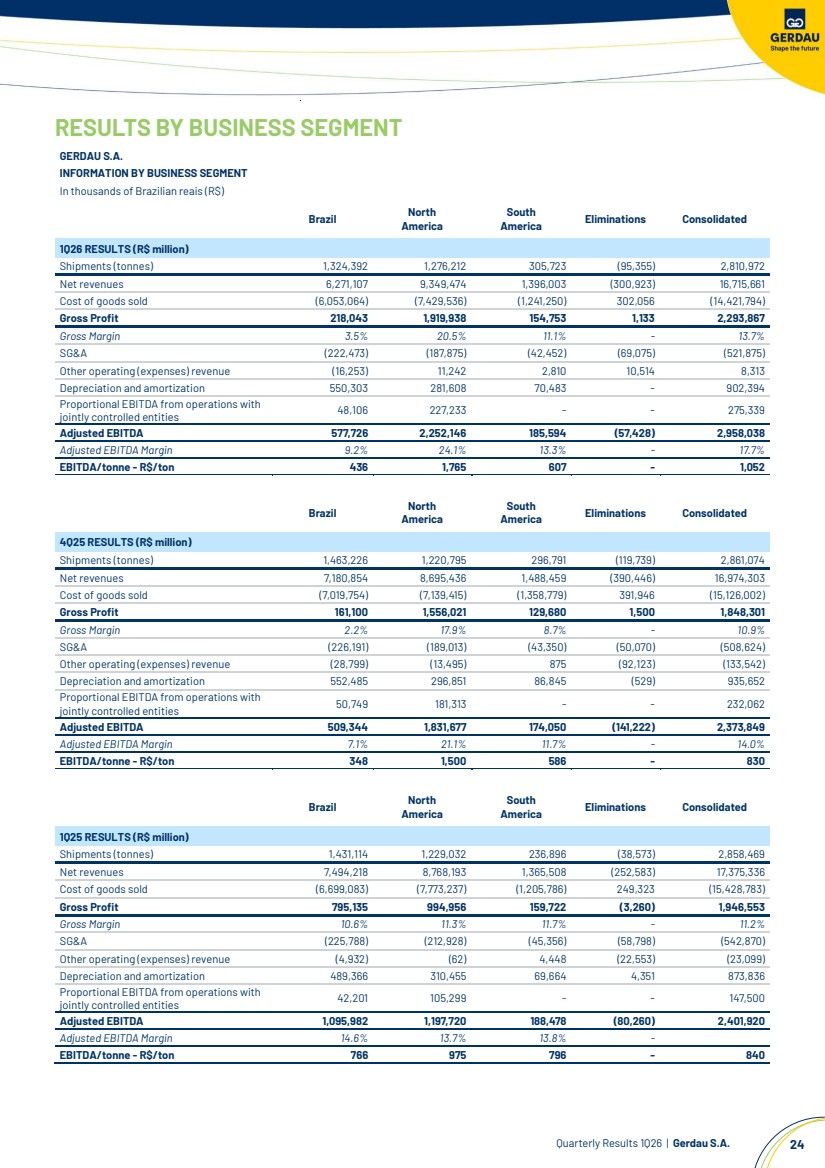
| Quarterly Results 1Q26 | Gerdau S.A. 24 RESULTS BY BUSINESS SEGMENT GERDAU S.A. INFORMATION BY BUSINESS SEGMENT In thousands of Brazilian reais (R$) Brazil North America South America Eliminations Consolidated 1Q26 RESULTS (R$ million) Shipments (tonnes) 1,324,392 1,276,212 305,723 (95,355) 2,810,972 Net revenues 6,271,107 9,349,474 1,396,003 (300,923) 16,715,661 Cost of goods sold (6,053,064) (7,429,536) (1,241,250) 302,056 (14,421,794) Gross Profit 218,043 1,919,938 154,753 1,133 2,293,867 Gross Margin 3.5% 20.5% 11.1% - 13.7% SG&A (222,473) (187,875) (42,452) (69,075) (521,875) Other operating (expenses) revenue (16,253) 11,242 2,810 10,514 8,313 Depreciation and amortization 550,303 281,608 70,483 - 902,394 Proportional EBITDA from operations with jointly controlled entities 48,106 227,233 - - 275,339 Adjusted EBITDA 577,726 2,252,146 185,594 (57,428) 2,958,038 Adjusted EBITDA Margin 9.2% 24.1% 13.3% - 17.7% EBITDA/tonne - R$/ton 436 1,765 607 - 1,052 Brazil North America South America Eliminations Consolidated 4Q25 RESULTS (R$ million) Shipments (tonnes) 1,463,226 1,220,795 296,791 (119,739) 2,861,074 Net revenues 7,180,854 8,695,436 1,488,459 (390,446) 16,974,303 Cost of goods sold (7,019,754) (7,139,415) (1,358,779) 391,946 (15,126,002) Gross Profit 161,100 1,556,021 129,680 1,500 1,848,301 Gross Margin 2.2% 17.9% 8.7% - 10.9% SG&A (226,191) (189,013) (43,350) (50,070) (508,624) Other operating (expenses) revenue (28,799) (13,495) 875 (92,123) (133,542) Depreciation and amortization 552,485 296,851 86,845 (529) 935,652 Proportional EBITDA from operations with jointly controlled entities 50,749 181,313 - - 232,062 Adjusted EBITDA 509,344 1,831,677 174,050 (141,222) 2,373,849 Adjusted EBITDA Margin 7.1% 21.1% 11.7% - 14.0% EBITDA/tonne - R$/ton 348 1,500 586 - 830 Brazil North America South America Eliminations Consolidated 1Q25 RESULTS (R$ million) Shipments (tonnes) 1,431,114 1,229,032 236,896 (38,573) 2,858,469 Net revenues 7,494,218 8,768,193 1,365,508 (252,583) 17,375,336 Cost of goods sold (6,699,083) (7,773,237) (1,205,786) 249,323 (15,428,783) Gross Profit 795,135 994,956 159,722 (3,260) 1,946,553 Gross Margin 10.6% 11.3% 11.7% - 11.2% SG&A (225,788) (212,928) (45,356) (58,798) (542,870) Other operating (expenses) revenue (4,932) (62) 4,448 (22,553) (23,099) Depreciation and amortization 489,366 310,455 69,664 4,351 873,836 Proportional EBITDA from operations with jointly controlled entities 42,201 105,299 - - 147,500 Adjusted EBITDA 1,095,982 1,197,720 188,478 (80,260) 2,401,920 Adjusted EBITDA Margin 14.6% 13.7% 13.8% - EBITDA/tonne - R$/ton 766 975 796 - 840 |
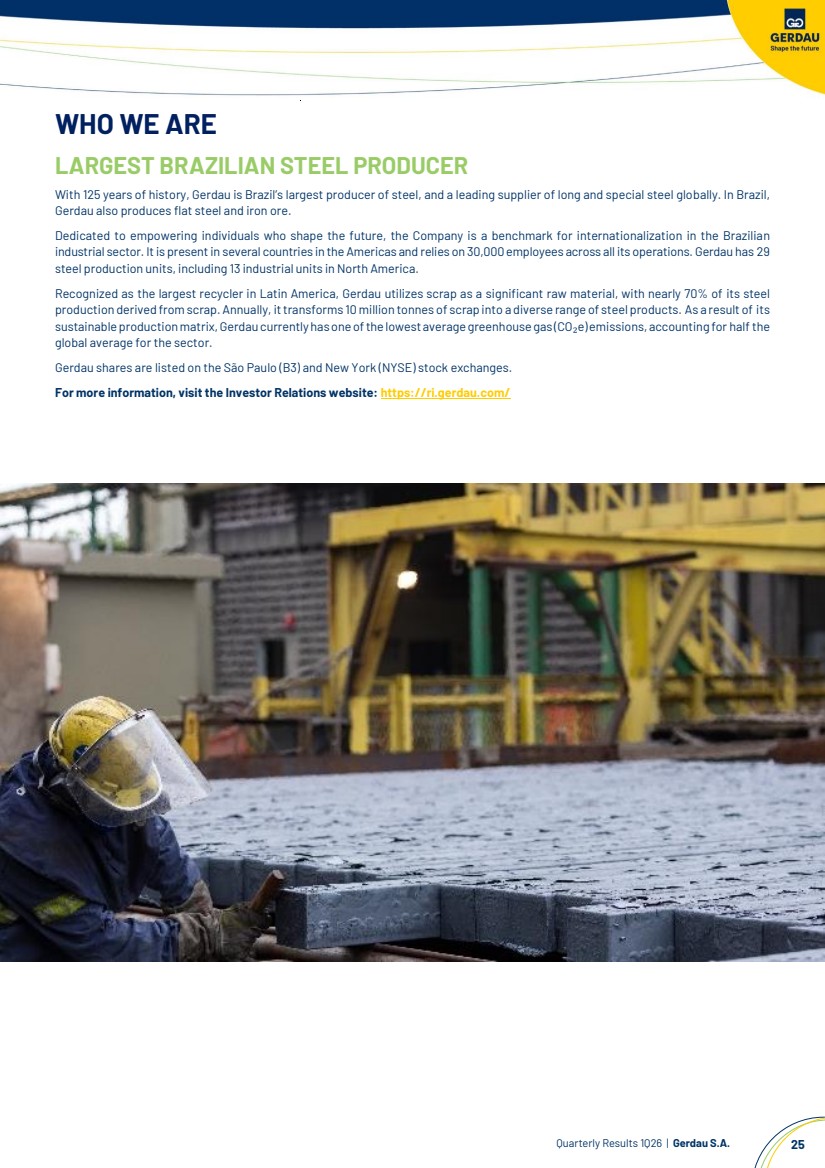
| Quarterly Results 1Q26 | Gerdau S.A. 25 WHO WE ARE LARGEST BRAZILIAN STEEL PRODUCER With 125 years of history, Gerdau is Brazil’s largest producer of steel, and a leading supplier of long and special steel globally. In Brazil, Gerdau also produces flat steel and iron ore. Dedicated to empowering individuals who shape the future, the Company is a benchmark for internationalization in the Brazilian industrial sector. It is presentin several countries in the Americas and relies on 30,000 employees across all its operations. Gerdau has 29 steel production units, including 13 industrial units in North America. Recognized as the largest recycler in Latin America, Gerdau utilizes scrap as a significant raw material, with nearly 70% of its steel production derived from scrap. Annually, ittransforms 10 million tonnes of scrap into a diverse range of steel products. As a result of its sustainableproductionmatrix,Gerdaucurrently hasoneofthelowestaveragegreenhousegas (CO₂e)emissions, accountingfor half the global average for the sector. Gerdau shares are listed on the São Paulo (B3) and New York (NYSE) stock exchanges. For more information, visit the Investor Relations website: https://ri.gerdau.com/ |
| Follow Gerdau on Social Media Rafael Japur Vice President and Investor Relations Officer Mariana Velho Dutra IR Manager Ariana Pereira Renata Albuquerque Arthur Alves Trovo Adriana Costa Adriana Costa IR CONTACTS Investor Relations website: http://ri.gerdau.com/ IR e-mail: inform@gerdau.com Press e-mail: atendimentogerdau.br@bcw-global.com |