UNITED STATES
SECURITIES AND EXCHANGE COMMISSION
Washington, D.C. 20549
FORM N-CSR
CERTIFIED SHAREHOLDER REPORT OF REGISTERED
MANAGEMENT INVESTMENT COMPANIES
| Investment Company Act file number |
811‑09135 |
(Exact name of registrant as specified in charter)
Nuveen Investments
333 West Wacker Drive
Chicago, Illinois 60606
(Address of principal executive offices) (Zip code)
Mark L. Winget
Vice President and Secretary
333 West Wacker Drive
Chicago, Illinois 60606
(Name and address of agent for service)
Registrant’s telephone number, including area code: (800) 257‑8787
Date of fiscal year end: August 31
Date of reporting period: August 31, 2025
| Item 1. | Reports to Stockholders. |
 |
 |
Nuveen Municipal
Closed‑End Funds
| Nuveen Arizona Quality Municipal Income Fund |
NAZ | |||
| Nuveen California AMT‑Free Quality Municipal Income Fund |
NKX | |||
| Nuveen California Municipal Value Fund |
NCA | |||
| Nuveen California Quality Municipal Income Fund |
NAC | |||
| Nuveen New Jersey Quality Municipal Income Fund |
NXJ | |||
| Nuveen New York AMT‑Free Quality Municipal Income Fund |
NRK | |||
| Nuveen New York Municipal Value Fund |
NNY | |||
| Nuveen New York Quality Municipal Income Fund |
NAN | |||
| Nuveen Pennsylvania Quality Municipal Income Fund |
NQP | |||
Annual
Report
Table
of Contents
| 3 | ||||
| 4 | ||||
| 13 | ||||
| 15 | ||||
| 16 | ||||
| 35 | ||||
| 37 | ||||
| 128 | ||||
| 130 | ||||
| 132 | ||||
| 141 | ||||
| 144 | ||||
| 157 | ||||
| 176 | ||||
| 222 | ||||
| 223 | ||||
| 225 | ||||
| 226 | ||||
| 230 | ||||
| 238 | ||||
2
Important Notices
NXJ - Portfolio manager update: Effective September 18, 2025, Kristen DeJong was added as a portfolio manager of NXJ.
NXJ and NQP - Fund merger: On September 17, 2025, the Funds’ Board of Trustees approved a merger of NXJ, NQP and Nuveen Missouri Quality Municipal Income Fund (NOM) into the Nuveen Municipal High Income Opportunity Fund (NMZ). The merger is pending shareholder approval and satisfying other closing conditions.
3
Discussion of Fund Performance
Nuveen Arizona Quality Municipal Income Fund (NAZ)
Nuveen California ATM‑Free Quality Municipal Income Fund (NKX)
Nuveen California Municipal Value Fund (NCA)
Nuveen California Quality Municipal Income Fund (NAC)
Nuveen New Jersey Quality Municipal Income Fund (NXJ)
Nuveen New York AMT‑Free Quality Municipal Income Fund (NRK)
Nuveen New York Municipal Value Fund (NNY)
Nuveen New York Quality Municipal Income Fund (NAN)
Nuveen Pennsylvania Quality Municipal Income Fund (NQP)
Nuveen Asset Management, LLC (NAM), an affiliate of Nuveen Fund Advisors, LLC, is the investment adviser for Nuveen Arizona Quality Municipal Income Fund (NAZ), Nuveen California AMT‑Free Quality Municipal Income Fund (NKX), Nuveen California Municipal Value Fund (NCA), Nuveen California Quality Municipal Income Fund (NAC), Nuveen New Jersey Quality Municipal Income Fund (NXJ), Nuveen New York AMT‑Free Quality Municipal Income Fund (NRK), Nuveen New York Municipal Value Fund (NNY), Nuveen New York Quality Municipal Income Fund (NAN) and Nuveen Pennsylvania Quality Municipal Income Fund (NQP).
The portfolio managers for NAZ are Michael Hamilton and Stephen Candido, CFA. The portfolio managers for NKX, NCA, NAC, NRK, NNY and NAN are Scott Romans, PhD., and Kristen DeJong, CFA. The portfolio managers for NXJ are Paul Brennan, CFA, Steven Hlavin, and Kristen DeJong, CFA. The portfolio managers for NQP are Paul Brennan, CFA, and Steven Hlavin
Below is a discussion of Fund performance and the factors that contributed and detracted during the reporting period ended August 31, 2025. For more information on Fund investment objectives and policies, please refer to the Shareholder Update section at the end of the report.
Nuveen Arizona Quality Municipal Income Fund (NAZ)
What factors affected markets during the reporting period?
| • | Municipal bond yields rose across longer maturities and fell across shorter maturities, steepening the municipal yield curve over the reporting period. Yields saw elevated volatility during the period, in response to uncertainties about the Federal Reserve’s plan for monetary easing, U.S. fiscal and trade policy under the Trump administration, and the impacts to the economy, inflation and federal debt sustainability. |
| • | While credit fundamentals remained strong, unprecedented supply pressure weighed on the municipal market during the reporting period. Demand for municipal debt increased during the reporting period but was less robust when compared to the elevated level of supply. |
What key strategies were used to manage the Fund during the reporting period?
| • | The Fund’s trading activity remained focused on pursuing its investment objectives. During the reporting period, the Fund continued to emphasize a long-term view of investing in longer-duration and lower-rated bonds, which offered incrementally higher yields to support the Fund’s income earnings capability. |
| • | The portfolio management team took advantage of periods of market weakness to buy bonds at attractive valuations and continued to seek enhanced income opportunities by selling bonds with lower book yields and replacing them with bonds with higher book yields. |
How did the Fund perform and what factors affected relative performance?
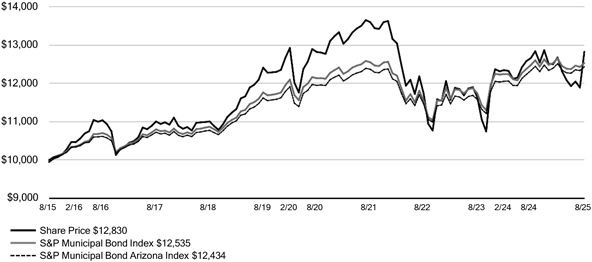
For the twelve-month reporting period ended August 31, 2025, NAZ returned -5.10%. The Fund significantly underperformed the returns of the S&P Municipal Bond Arizona Index, which returned 0.81%.
Top contributors to relative performance
| • | Overweights to the dedicated tax and single-family housing sectors. |
| • | Exposure to shorter-duration higher education bonds. |
4
Top detractors from relative performance
| • | The Fund’s use of leverage through the issuance of preferred shares. |
| • | Overweight to bonds with durations of eight years and longer. |
| • | Overweight to lower-rated credits, particularly non‑rated bonds. |
Nuveen California AMT‑Free Quality Municipal Income Fund (NKX)
What factors affected markets during the reporting period?
| • | Municipal bond yields rose across longer maturities and fell across shorter maturities, steepening the municipal yield curve over the reporting period. Yields saw elevated volatility during the period, in response to uncertainties about the Federal Reserve’s plan for monetary easing, U.S. fiscal and trade policy under the Trump administration, and the impacts to the economy, inflation and federal debt sustainability. |
| • | While credit fundamentals remained strong, unprecedented supply pressure weighed on the municipal market during the reporting period. Demand for municipal debt increased during the reporting period but was less robust when compared to the elevated level of supply. |
What key strategies were used to manage the Fund during reporting period?
| • | The Fund’s trading activity remained focused on pursuing its investment objectives. During the reporting period, the Fund continued to emphasize a long-term view of investing in longer-duration and lower-rated bonds, which offered incrementally higher yields to support the Fund’s income earnings capability. |
| • | The portfolio management team took advantage of periods of market stress to buy bonds at attractive valuations and continued to carefully manage the Fund’s income sustainability via tactical trading. |
How did the Fund perform and what factors affected relative performance?
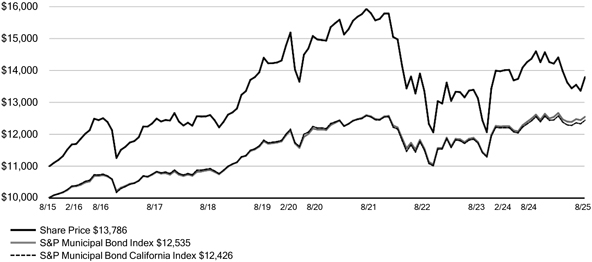
For the twelve-month reporting period ended August 31, 2025, NKX returned -6.12%. The Fund significantly underperformed the returns of the S&P Municipal Bond California Index, which returned 0.15%.
Top contributors to relative performance
| • | Underweight to tobacco bonds. |
| • | Underweight to dedicated tax bonds. |
Top detractors from relative performance
| • | The Fund’s use of leverage through inverse floating rate securities and the issuance of preferred shares. |
| • | Overall duration positioning, especially an overweight to bonds with durations greater than 12.0 years. |
| • | Overweights to below-investment-grade and non‑rated bonds. |
| • | Overweight to the health care sector. |
| 5 |
Discussion of Fund Performance (continued)
Nuveen California Municipal Value Fund (NCA)
What factors affected markets during the reporting period?
| • | Municipal bond yields rose across longer maturities and fell across shorter maturities, steepening the municipal yield curve over the reporting period. Yields saw elevated volatility during the period, in response to uncertainties about the Federal Reserve’s plan for monetary easing, U.S. fiscal and trade policy under the Trump administration, and the impacts to the economy, inflation and federal debt sustainability. |
| • | While credit fundamentals remained strong, unprecedented supply pressure weighed on the municipal market during the reporting period. Demand for municipal debt increased during the reporting period but was less robust when compared to the elevated level of supply. |
What key strategies were used to manage the Fund during the reporting period?
| • | The Fund’s trading activity remained focused on pursuing its investment objectives. During the reporting period, the Fund continued to emphasize a long-term view of investing in longer-duration and lower-rated bonds, which offered incrementally higher yields to support the Fund’s income earnings capability. |
| • | The portfolio management team took advantage of periods of market stress to buy bonds at attractive valuations and continued to carefully manage the Fund’s income sustainability via tactical trading. |
How did the Fund perform and what factors affected relative performance?
For the twelve-month reporting period ended August 31, 2025, NCA returned -2.31%. The Fund significantly underperformed the returns of the S&P Municipal Bond California Index, which returned 0.15%.
Top contributors to relative performance
| • | Overall credit ratings positioning. |
| • | Underweight to tobacco bonds. |
Top detractors from relative performance
| • | Overall duration positioning, especially an overweight to bonds with durations greater than 12.0 years. |
| • | Overweights to BB‑rated bonds. |
| • | Overweight to the health care sector. |
| 6 |
Nuveen California Quality Municipal Income Fund (NAC)
What factors affected markets during the reporting period?
| • | Municipal bond yields rose across longer maturities and fell across shorter maturities, steepening the municipal yield curve over the reporting period. Yields saw elevated volatility during the period, in response to uncertainties about the Federal Reserve’s plan for monetary easing, U.S. fiscal and trade policy under the Trump administration, and the impacts to the economy, inflation and federal debt sustainability. |
| • | While credit fundamentals remained strong, unprecedented supply pressure weighed on the municipal market during the reporting period. Demand for municipal debt increased during the reporting period but was less robust when compared to the elevated level of supply. |
What key strategies were used to manage the Fund during the reporting period?
| • | The Fund’s trading activity remained focused on pursuing its investment objectives. During the reporting period, the Fund continued to emphasize a long-term view of investing in longer-duration and lower-rated bonds, which offered incrementally higher yields to support the Fund’s income earnings capability. |
| • | The portfolio management team took advantage of periods of market stress to buy bonds at attractive valuations and continued to carefully manage the Fund’s income sustainability via tactical trading. |
How did the Fund perform and what factors affected relative performance?
For the twelve-month reporting period ended August 31, 2025, NAC returned -6.68%. The Fund significantly underperformed the returns of the S&P Municipal Bond California Index, which returned 0.15%.
Top contributors to relative performance
| • | Overall credit ratings positioning. |
| • | Overall sector positioning. |
Top detractors from relative performance
| • | The Fund’s use of leverage through inverse floating rate securities and the issuance of preferred shares. |
| • | Overall duration positioning, especially an overweight to bonds with durations greater than 12.0 years. |
| • | Overweight to below-investment-grade bonds. |
| • | Overweight to the health care sector. |
Nuveen New Jersey Quality Municipal Income Fund (NXJ)
What factors affected markets during the reporting period?
| • | Municipal bond yields rose across longer maturities and fell across shorter maturities, steepening the municipal yield curve over the reporting period. Yields saw elevated volatility during the period, in response to uncertainties about the Federal Reserve’s plan for monetary easing, U.S. fiscal and trade policy under the Trump administration, and the impacts to the economy, inflation and federal debt sustainability. |
| • | While credit fundamentals remained strong, unprecedented supply pressure weighed on the municipal market during the reporting period. Demand for municipal debt increased during the reporting period but was less robust when compared to the elevated level of supply. |
| 7 |
Discussion of Fund Performance (continued)
What key strategies were used to manage the Fund during the reporting period?
| • | The Fund’s trading activity remained focused on pursuing its investment objectives. During the reporting period, the Fund continued to emphasize a long-term view of investing in longer-duration and lower-rated bonds, which offered incrementally higher yields to support the Fund’s income earnings capability. |
| • | The portfolio management team took advantage of periods of market stress to buy bonds at attractive valuations and continued to carefully manage the Fund’s income sustainability via tactical trading. |
How did the Fund perform and what factors affected relative performance?
For the twelve-month reporting period ended August 31, 2025, NXJ returned -3.62%. The Fund significantly underperformed the returns of the S&P Municipal Bond New Jersey Index, which returned 1.04%.
Top contributors to relative performance
| • | Credit quality positioning, particularly an overweight to non‑rated bonds. |
| • | Sector allocations, driven by an overweight to local tax‑supported debt and underweights to the New Jersey tax‑ supported debt and higher education sectors. |
Top detractors from relative performance
| • | Duration and yield curve positioning, driven by an overweight to long-term maturities, especially to 12 years and longer duration structures and an underweight to zero- to four-year duration structures. |
| • | Security selection. |
| • | The Fund’s use of leverage through inverse floating rate securities and the issuance of preferred shares detracted from relative performance during the reporting period. |
Nuveen New York AMT‑Free Quality Municipal Income Fund (NRK)
What factors affected markets during the reporting period?
| • | Municipal bond yields rose across longer maturities and fell across shorter maturities, steepening the municipal yield curve over the reporting period. Yields saw elevated volatility during the period, in response to uncertainties about the Federal Reserve’s plan for monetary easing, U.S. fiscal and trade policy under the Trump administration, and the impacts to the economy, inflation and federal debt sustainability. |
| • | While credit fundamentals remained strong, unprecedented supply pressure weighed on the municipal market during the reporting period. Demand for municipal debt increased during the reporting period but was less robust when compared to the elevated level of supply. |
| 8 |
What key strategies were used to manage the Fund during the reporting period?
| • | The Fund’s trading activity remained focused on pursuing its investment objectives. During the reporting period, the Fund continued to emphasize a long-term view of investing in longer-duration and lower-rated bonds, which offered incrementally higher yields to support the Fund’s income earnings capability. |
| • | The portfolio management team took advantage of periods of market stress to buy bonds at attractive valuations and continued to carefully manage the Fund’s income sustainability via tactical trading. |
How did the Fund perform and what factors affected relative performance?
For the twelve-month reporting period ended August 31, 2025, NRK returned -7.66%. The Fund significantly underperformed the returns of the S&P Municipal Bond New York Index, which returned ‑0.33%.
Top contributors to relative performance
| • | Underweight to dedicated tax bonds. |
| • | Underweight to tobacco bonds. |
Top detractors from relative performance
| • | The Fund’s use of leverage through inverse floating rate securities and the issuance of preferred shares. |
| • | Overall duration positioning, especially an overweight to bonds with durations greater than 12.0 years. |
| • | Overall credit ratings positioning, especially an overweight to non‑rated bonds. |
| • | Overweights to the health care and multi-family housing sectors. |
Nuveen New York Municipal Value Fund (NNY)
What factors affected markets during the reporting period?
| • | Municipal bond yields rose across longer maturities and fell across shorter maturities, steepening the municipal yield curve over the reporting period. Yields saw elevated volatility during the period, in response to uncertainties about the Federal Reserve’s plan for monetary easing, U.S. fiscal and trade policy under the Trump administration, and the impacts to the economy, inflation and federal debt sustainability. |
| • | While credit fundamentals remained strong, unprecedented supply pressure weighed on the municipal market during the reporting period. Demand for municipal debt increased during the reporting period but was less robust when compared to the elevated level of supply. |
| 9 |
Discussion of Fund Performance (continued)
What key strategies were used to manage the Fund during the reporting period?
| • | The Fund’s trading activity remained focused on pursuing its investment objectives. During the reporting period, the Fund continued to emphasize a long-term view of investing in longer-duration and lower-rated bonds, which offered incrementally higher yields to support the Fund’s income earnings capability. |
| • | The portfolio management team took advantage of periods of market stress to buy bonds at attractive valuations and continued to carefully manage the Fund’s income sustainability via tactical trading. |
How did the Fund perform and what factors affected relative performance?
For the twelve-month reporting period ended August 31, 2025, NNY returned -1.89%. The Fund underperformed the returns of the S&P Municipal Bond New York Index, which returned ‑0.33%.
Top contributors to relative performance
| • | Underweight to dedicated tax bonds. |
| • | Underweight to tobacco bonds. |
Top detractors from relative performance
| • | Overall duration positioning, especially an overweight to bonds with durations greater than 12.0 years. |
| • | Overall credit ratings positioning, especially an overweight to non‑rated bonds. |
| • | Overall sector positioning. |
Nuveen New York Quality Municipal Income Fund (NAN)
What factors affected markets during the reporting period?
| • | Municipal bond yields rose across longer maturities and fell across shorter maturities, steepening the municipal yield curve over the reporting period. Yields saw elevated volatility during the period, in response to uncertainties about the Federal Reserve’s plan for monetary easing, U.S. fiscal and trade policy under the Trump administration, and the impacts to the economy, inflation and federal debt sustainability. |
| • | While credit fundamentals remained strong, unprecedented supply pressure weighed on the municipal market during the reporting period. Demand for municipal debt increased during the reporting period but was less robust when compared to the elevated level of supply. |
What key strategies were used to manage the Fund during the reporting period?
| • | The Fund’s trading activity remained focused on pursuing its investment objectives. During the reporting period, the Fund continued to emphasize a long-term view of investing in longer-duration and lower-rated bonds, which offered incrementally higher yields to support the Fund’s income earnings capability. |
| 10 |
| • | The portfolio management team took advantage of periods of market stress to buy bonds at attractive valuations and continued to carefully manage the Fund’s income sustainability via tactical trading. |
How did the Fund perform and what factors affected relative performance?
For the twelve-month reporting period ended August 31, 2025, NAN returned -6.24%. The Fund significantly underperformed the returns of the S&P Municipal Bond New York Index, which returned ‑0.33%.
Top contributors to relative performance
| • | Underweight to dedicated tax bonds. |
| • | Underweight to tobacco bonds. |
Top detractors from relative performance
| • | The Fund’s use of leverage through inverse floating rate securities and the issuance of preferred shares. |
| • | Overall duration positioning, especially an overweight to bonds with durations greater than 12.0 years. |
| • | Overall credit ratings positioning, especially an overweight to non‑rated bonds. |
| • | Overweights to the health care and higher ed sectors. |
Nuveen Pennsylvania Quality Municipal Income Fund (NQP)
What factors affected markets during the reporting period?
| • | Municipal bond yields rose across longer maturities and fell across shorter maturities, steepening the municipal yield curve over the reporting period. Yields saw elevated volatility during the period, in response to uncertainties about the Federal Reserve’s plan for monetary easing, U.S. fiscal and trade policy under the Trump administration, and the impacts to the economy, inflation and federal debt sustainability. |
| • | While credit fundamentals remained strong, unprecedented supply pressure weighed on the municipal market during the reporting period. Demand for municipal debt increased during the reporting period but was less robust when compared to the elevated level of supply |
What key strategies were used to manage the Fund during the reporting period?
| • | The Fund’s trading activity remained focused on pursuing its investment objectives. During the reporting period, the Fund continued to emphasize a long-term view of investing in longer-duration and lower-rated bonds, which offered incrementally higher yields to support the Fund’s income earnings capability. |
| • | The portfolio management team took advantage of periods of market stress to buy bonds at attractive valuations and continued to carefully manage the Fund’s income sustainability via tactical trading. |
How did the Fund perform and what factors affected relative performance?
For the twelve-month reporting period ended August 31, 2025, NQP returned -6.93%. The Fund significantly underperformed the returns of the S&P Municipal Bond Pennsylvania Index, which returned 0.65%.
| 11 |
Discussion of Fund Performance (continued)
Top contributors to relative performance
| • | Credit quality positioning, driven by an overweight to non‑rated bonds. |
| • | An overweight to the single-family housing bond sector. |
Top detractors from relative performance
| • | Duration and yield curve positioning, including an overweight to 10‑years and longer duration structures and an underweight in zero‑ to six‑year duration structures. |
| • | The Fund’s use of leverage through inverse floating rate securities and the issuance of preferred shares. |
| • | The Fund’s use of total return swaps for hedging purposes. |
This material is not intended to be a recommendation or investment advice, does not constitute a solicitation to buy, sell or hold a security or an investment strategy, and is not provided in a fiduciary capacity. The information provided does not take into account the specific objectives or circumstances of any particular investor, or suggest any specific course of action. Investment decisions should be made based on an investor’s objectives and circumstances and in consultation with his or her advisors.
Certain statements in this report are forward-looking statements. Discussions of specific investments are for illustration only and are not intended as recommendations of individual investments. The forward-looking statements and other views expressed herein are those of the portfolio manager as of the date of this report. Actual future results or occurrences may differ significantly from those anticipated in any forward-looking statements, and the views expressed herein are subject to change at any time, due to numerous market and other factors. The Fund disclaims any obligation to update publicly or revise any forward-looking statements or views expressed herein.
For financial reporting purposes, the ratings disclosed are the highest rating given by one of the following national rating agencies: Standard & Poor’s Group (S&P), Moody’s Investors Service, Inc. (Moody’s) or Fitch, Inc. (Fitch). This treatment of split-rated securities may differ from that used for other purposes, such as for Fund investment policies. Credit ratings are subject to change. AAA, AA, A and BBB are investment grade ratings, while BB, B, CCC, CC, C and D are below investment grade ratings. Holdings designated N/R are not rated by these national rating agencies.
Bond insurance guarantees only the payment of principal and interest on the bond when due, and not the value of the bonds themselves, which will fluctuate with the bond market and the financial success of the issuer and the insurer. Insurance relates specifically to the bonds in the portfolio and not to the share prices of a Fund. No representation is made as to the insurers’ ability to meet their commitments.
Refer to the Glossary of Terms Used in this Report for further definition of the terms used within this section.
| 12 |
Common Share Information
COMMON SHARE DISTRIBUTION INFORMATION
The following information regarding the Funds’ distributions is current as of August 31, 2025. Each Fund’s distribution levels may vary over time based on each Fund’s investment activity and portfolio investment value changes.
During the current reporting period, each Fund’s distributions to common shareholders were as shown in the accompanying table.
| Per Common Share Amounts | ||||||||||||||||||||||||
| Monthly Distributions (Ex‑Dividend Date) | NAZ | NKX | NCA | NAC | NXJ | |||||||||||||||||||
| September |
$0.0725 | $0.0760 | $0.0290 | $0.0735 | $0.0785 | |||||||||||||||||||
| October |
0.0725 | 0.0760 | 0.0290 | 0.0735 | 0.0785 | |||||||||||||||||||
| November |
0.0725 | 0.0760 | 0.0290 | 0.0735 | 0.0785 | |||||||||||||||||||
| December |
0.0725 | 0.0760 | 0.0290 | 0.0735 | 0.0785 | |||||||||||||||||||
| January |
0.0725 | 0.0760 | 0.0290 | 0.0735 | 0.0785 | |||||||||||||||||||
| February |
0.0725 | 0.0760 | 0.0290 | 0.0735 | 0.0785 | |||||||||||||||||||
| March |
0.0725 | 0.0760 | 0.0290 | 0.0735 | 0.0785 | |||||||||||||||||||
| April |
0.0725 | 0.0760 | 0.0290 | 0.0735 | 0.0785 | |||||||||||||||||||
| May |
0.0725 | 0.0760 | 0.0290 | 0.0735 | 0.0785 | |||||||||||||||||||
| June |
0.0725 | 0.0760 | 0.0290 | 0.0735 | 0.0785 | |||||||||||||||||||
| July |
0.0725 | 0.0760 | 0.0290 | 0.0735 | 0.0785 | |||||||||||||||||||
| August |
0.0725 | 0.0760 | 0.0290 | 0.0735 | 0.0785 | |||||||||||||||||||
| Total Distributions from Net Investment Income |
$0.8700 | $0.9120 | $0.3480 | $0.8820 | $0.9420 | |||||||||||||||||||
| Per Common Share Amounts | ||||||||||||||||||||||||
| Monthly Distributions (Ex‑Dividend Date) | NRK | NNY | NAN | NQP | ||||||||||||||||||||
| September |
$0.0690 | $0.0295 | $0.0720 | $0.0780 | ||||||||||||||||||||
| October |
0.0690 | 0.0295 | 0.0720 | 0.0780 | ||||||||||||||||||||
| November |
0.0690 | 0.0295 | 0.0720 | 0.0780 | ||||||||||||||||||||
| December |
0.0690 | 0.0295 | 0.0720 | 0.0780 | ||||||||||||||||||||
| January |
0.0690 | 0.0295 | 0.0720 | 0.0780 | ||||||||||||||||||||
| February |
0.0690 | 0.0295 | 0.0720 | 0.0780 | ||||||||||||||||||||
| March |
0.0690 | 0.0295 | 0.0720 | 0.0780 | ||||||||||||||||||||
| April |
0.0690 | 0.0295 | 0.0720 | 0.0780 | ||||||||||||||||||||
| May |
0.0690 | 0.0295 | 0.0720 | 0.0780 | ||||||||||||||||||||
| June |
0.0690 | 0.0295 | 0.0720 | 0.0780 | ||||||||||||||||||||
| July |
0.0690 | 0.0295 | 0.0720 | 0.0780 | ||||||||||||||||||||
| August |
0.0690 | 0.0295 | 0.0720 | 0.0780 | ||||||||||||||||||||
| Total Distributions from Net Investment Income |
$0.8280 | $0.3540 | $0.8640 | $0.9360 | ||||||||||||||||||||
| Yields | NAZ | NKX | NCA | NAC | NXJ | NRK | ||||||||||||||||||
| Market Yield1 |
7.34% | 7.72% | 4.08% | 7.85% | 8.25% | 8.71% | ||||||||||||||||||
| Taxable-Equivalent Yield1 |
12.94% | 16.81% | 8.90% | 17.11% | 17.04% | 18.03% | ||||||||||||||||||
| Yields | NNY | NAN | NQP | |||||||||||||||||||||
| Market Yield1 |
4.38% | 7.88% | 8.54% | |||||||||||||||||||||
| Taxable-Equivalent Yield1 |
9.06% | 16.31% | 15.22% | |||||||||||||||||||||
| 1 | Market Yield is based on the Fund’s current annualized monthly distribution divided by the Fund’s current market price as of the end of the reporting period. Taxable-Equivalent Yield represents the yield that must be earned on a fully taxable investment in order to equal the yield of the Fund on an after‑tax basis. It is based on a combined federal and state income tax rate of 43.3%, 54.1%, 54.1%, 54.1%, 51.6%, 51.7%,51.7%, 51.7% and 43.9% for NAZ, NKX, NCA, NAC, NXJ, NRK, NNY, NAN and NQP, respectively. Your actual combined federal and state income tax rate may differ from the assumed rate. The Taxable-Equivalent Yield also takes into account the percentage of the Fund’s income generated and paid by the Fund (based on payments made during the previous calendar year) that was either exempt from federal income tax but not from state income tax (e.g., income from an out‑of‑state municipal bond), or was exempt from neither federal nor state income tax. Separately, if the comparison were instead to investments that generate qualified dividend income, which is taxable at a rate lower than an individual’s ordinary graduated tax rate, the fund’s Taxable-Equivalent Yield would be lower. |
Each Fund’s distribution policy, which may be changed by the Board, is to make regular monthly cash distributions to holders of its common shares (stated in terms of a fixed cents per common share dividend distribution rate which may be set from time to time). The Fund intends to distribute all or substantially all of its net investment income each year through its regular monthly distribution and to distribute realized capital gains at least annually. In addition, in any monthly period, to maintain its declared per common share distribution amount, the Fund may distribute more or less than its net investment income during the period. In the event the
13
Common Share Information (continued)
Fund distributes more than its net investment income during any yearly period, such distributions may also include realized gains and/or a return of capital. To the extent that a distribution includes a return of capital the NAV per share may erode. If the Fund’s distribution includes anything other than net investment income, the Fund will provide a notice to shareholders of its best estimate of the distribution sources at that the time of the distribution. These estimates may not match the final tax characterization (for the full year’s distributions) contained in shareholders’ 1099‑DIV forms after the end of the year.
NUVEEN CLOSED‑END FUND DISTRIBUTION AMOUNTS
The Nuveen Closed‑End Funds’ monthly and quarterly periodic distributions to shareholders are posted on www.nuveen.com and can be found on Nuveen’s enhanced closed‑end fund resource page, which is at https://www.nuveen.com/resource-center- closed‑end‑funds, along with other Nuveen closed‑end fund product updates. To ensure timely access to the latest information, shareholders may use a subscribe function, which can be activated at this web page (https://www.nuveen.com/subscriptions).
COMMON SHARE EQUITY SHELF PROGRAMS
During the current reporting period, NAZ, NKX, NAC and NAN were authorized by the Securities and Exchange Commission to issue additional common shares through an equity shelf program (Shelf Offering). Under these programs, NAZ, NKX, NAC and NAN, subject to market conditions, may raise additional capital from time to time in varying amounts and offering methods at a net price at or above the Fund’s NAV per common share. The maximum aggregate offering under these Shelf Offerings, are as shown in the accompanying table.
| NAZ | NKX | NAC | NAN | |||||||||||||
| Maximum aggregate offering |
1,200,000 | 4,800,000 | 14,500,000 | 3,100,000 | ||||||||||||
During the current reporting period, NAZ, NKX, NAC and NAN sold common shares through its Shelf Offering at a weighted average premium to its NAV per common share in the accompanying table.
| NAZ | NKX | NAC | NAN | |||||||||||||
| Common shares sold through shelf offering |
490,326 | 2,040,416 | 1,006,029 | 166,880 | ||||||||||||
| Weighted average premium to NAV per common share sold |
4.97% | 1.51% | 1.41% | 0.87% | ||||||||||||
Refer to the Notes to Financial Statements for further details on shelf offerings and each Fund’s transactions.
COMMON SHARE REPURCHASES
The Funds’ Board of Trustees reauthorized an open-market share repurchase program, allowing each Fund to repurchase and retire an aggregate of up to approximately 10% of its outstanding common shares.
During the current reporting period, the Funds did not repurchase any of their outstanding common shares. As of August 31, 2025 (and since the inception of the Funds’ repurchase programs), each Fund has cumulatively repurchased and retired its outstanding common shares as shown in the accompanying table.
| NAZ | NKX | NCA | NAC | NXJ | ||||||||||||||||
| Common shares cumulatively repurchased and retired |
133,000 | 230,000 | - | 383,000 | 1,960,343 | |||||||||||||||
| Common shares authorized for repurchase |
1,155,000 | 4,775,000 | 3,310,000 | 14,470,000 | 4,120,000 | |||||||||||||||
| NRK | NNY | NAN | NQP | |||||||||||||||||
| Common shares cumulatively repurchased and retired |
390,000 | - | 292,714 | 900,440 | ||||||||||||||||
| Common shares authorized for repurchase |
8,720,000 | 1,885,000 | 3,080,000 | 3,720,000 | ||||||||||||||||
| 14 |
About the Funds’ Benchmarks
S&P Municipal Bond Index: An index designed to measure the performance of the tax‑exempt U.S. municipal bond market. Index returns assume reinvestment of distributions, but do not reflect any applicable sales charges or management fees.
S&P Municipal Bond Arizona Index: An index designed to measure the performance of the tax‑exempt Arizona municipal bond market. Index returns assume reinvestment of distributions, but do not reflect any applicable sales charges or management fees.
S&P Municipal Bond California Index: An index designed to measure the performance of the tax‑exempt California municipal bond market. Index returns assume reinvestment of distributions, but do not reflect any applicable sales charges or management fees.
S&P Municipal Bond New Jersey Index: An index designed to measure the performance of the tax‑exempt New Jersey municipal bond market. Index returns assume reinvestment of distributions, but do not reflect any applicable sales charges or management fees.
S&P Municipal Bond New York Index: An index designed to measure the performance of the tax‑exempt New York municipal bond market. Index returns assume reinvestment of distributions, but do not reflect any applicable sales charges or management fees.
S&P Municipal Bond Pennsylvania Index: An index designed to measure the performance of the tax‑exempt Pennsylvania municipal bond market. Index returns assume reinvestment of distributions, but do not reflect any applicable sales charges or management fees.
15
Fund Performance, Leverage and Holdings Summaries
The Fund Performance, Leverage and Holding Summaries for each Fund are shown below within this section of the report.
Fund Performance
Performance data shown represents past performance and does not predict or guarantee future results. Current performance may be higher or lower than the data shown. Returns do not reflect the deduction of taxes that shareholders may have to pay on Fund distributions or upon the sale of Fund shares. Returns at NAV are net of Fund expenses, and assume reinvestment of distributions. Comparative index return information is provided for the Fund’s shares at NAV only. Indexes are not available for direct investment.
Total returns for a period of less than one year are not annualized (i.e. cumulative returns). Since inception returns are shown for share classes that have less than 10‑years of performance. For performance, current to the most recent month‑end visit Nuveen.com or call (800) 257‑8787.
Impact of Leverage
One important factor impacting the returns of the Funds’ common shares relative to their comparative benchmarks was the Funds’ use of leverage through their issuance of preferred shares and/or investments in inverse floating rate securities, which represent leveraged investments in underlying bonds. The Funds use leverage because our research has shown that, over time, leveraging provides opportunities for additional income. The opportunity arises when short-term rates that a Fund pays on its leveraging instruments are lower than the interest the Fund earns on its portfolio of long-term bonds that it has bought with the proceeds of that leverage.
However, use of leverage can expose Fund common shares to additional price volatility. When the Fund uses leverage, the Fund’s common shares will experience a greater increase in their net asset value if the securities acquired through the use of leverage increase in value, but will also experience a correspondingly larger decline in their net asset value if the securities acquired through leverage decline in value. All this will make the shares’ total return performance more variable over time.
In addition, common share income in levered funds will typically decrease in comparison to unlevered funds when short-term interest rates increase and increase when short-term interest rates decrease. In recent quarters, fund leverage expenses have generally tracked the overall movement of short-term interest rates. While fund leverage expenses are higher than their prior year lows, leverage nevertheless continues to provide the opportunity for incremental common share income, particularly over longer-term periods.
Leverage Ratios
Each Fund’s Effective Leverage and Regulatory Leverage Ratios are set forth below. “Effective Leverage” is a Fund’s effective economic leverage, and includes both regulatory leverage and the leverage effects of certain derivative and other investments in a Fund’s portfolio that increase the Fund’s investment exposure. Currently, the leverage effects of Tender Option Bond (TOB) inverse floater holdings are included in effective leverage values, in addition to any regulatory leverage. “Regulatory Leverage” consists of preferred shares or borrowings of a Fund. Regulatory Leverage is a part of a Fund’s capital structure. Regulatory leverage is subject to asset coverage limits set forth in the Investment Company Act of 1940. A Fund, however, may from time to time borrow for temporary purposes, typically on a transient basis in connection with its day‑to‑day operations, primarily in connection with the need to settle portfolio trades. Such temporary borrowings are excluded from the calculation of a Fund’s Effective Leverage and Regulatory Leverage ratios.
Holding Summaries
The Holdings Summaries data relates to the securities held in each Fund’s portfolio of investments as of the end of this reporting period. It should not be construed as a measure of performance for the Fund itself. Holdings are subject to change. Refer to the Fund’s Portfolio of Investments for individual security information.
For financial reporting purposes, the ratings disclosed are the highest rating given by one of the following national rating agencies: Standard & Poor’s, Moody’s Investors Service, Inc. or Fitch, Inc. This treatment of split-rated securities may differ from that used for other purposes, such as for Fund investment policies. Credit ratings are subject to change. AAA, AA, A and BBB are investment grade ratings; BB, B, CCC, CC, C and D are below investment grade ratings. Holdings designated N/R are not rated by these national rating agencies.
16
| NAZ | Nuveen Arizona Quality Municipal Income Fund Fund Performance, Leverage and Holdings Summaries August 31, 2025 |
Performance*
| Total Returns as of August 31, 2025 |
||||||||||||||||
| Average Annual | ||||||||||||||||
| Inception Date |
1-Year | 5-Year | 10-Year | |||||||||||||
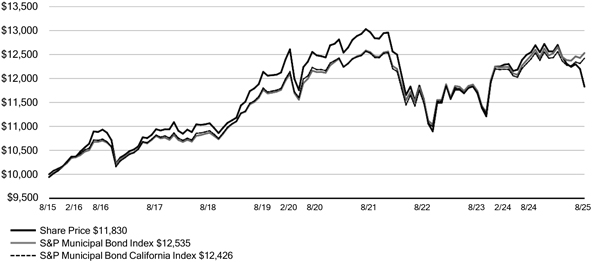
| NAZ at Common Share NAV |
11/19/92 | (5.10)% | (1.48)% | 1.71% | ||||||||||||
| NAZ at Common Share Price |
11/19/92 | 9.53% | 0.78% | 2.52% | ||||||||||||
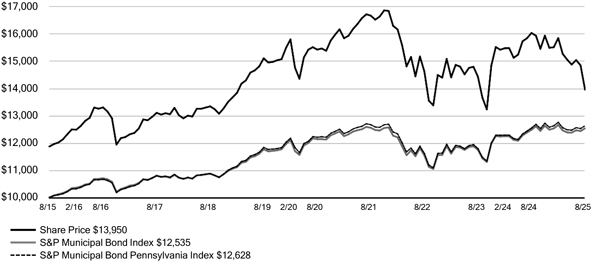
| S&P Municipal Bond Index |
– | 0.44% | 0.65% | 2.28% | ||||||||||||
| S&P Municipal Bond Arizona Index |
– | 0.81% | 0.80% | 2.20% | ||||||||||||
*For purposes of Fund performance, relative results are measured against the S&P Municipal Bond Arizona Index.
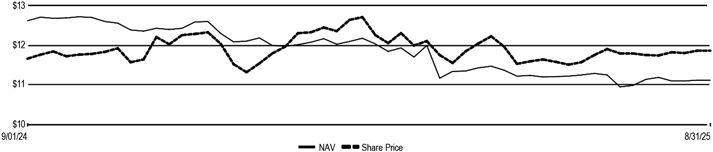
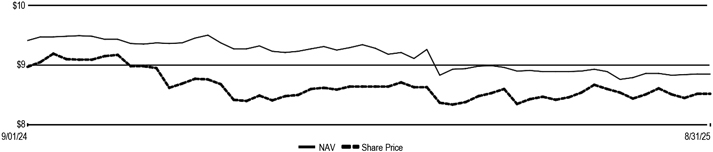
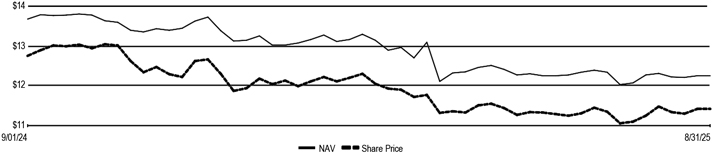
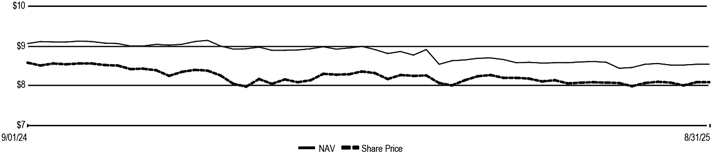
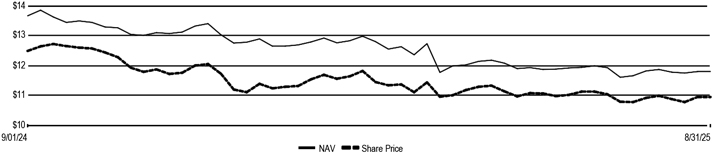
Daily Common Share NAV and Share Price
| Common Share NAV |
Common Share Price |
Premium/(Discount) to NAV |
Average Premium/(Discount) to NAV |
|||||||||
| $11.12 |
$11.86 | 6.65% | 0.70% | |||||||||
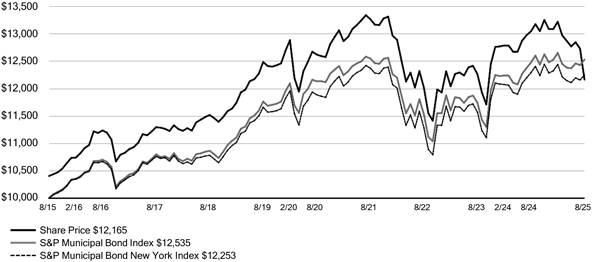
Growth of an Assumed $10,000 Investment as of August 31, 2025 - Common Share Price
17
Performance Overview and Holdings Summaries as of August 31, 2025
(continued)
Leverage and Holdings
| Leverage | ||||
| Effective Leverage |
39.62% | |||
| Regulatory Leverage |
39.62% | |||
| Fund Allocation | ||||
| (% of net assets) | ||||
| Municipal Bonds |
162.0% | |||
| Other Assets & Liabilities, Net |
3.6% | |||
| AMTP Shares, Net |
(65.6)% | |||
| Net Assets |
100% | |||
| Portfolio Credit Quality | ||||
| (% of total investments) | ||||
| AAA |
9.1% | |||
| AA |
55.7% | |||
| A |
14.8% | |||
| BBB |
3.6% | |||
| BB or Lower |
5.0% | |||
| N/R (not rated) |
11.8% | |||
| Total |
100% | |||
| Portfolio Composition1 | ||||
| (% of total investments) | ||||
| Tax Obligation/Limited |
23.7% | |||
| Utilities |
20.4% | |||
| Education and Civic Organizations |
19.0% | |||
| Tax Obligation/General |
13.4% | |||
| Health Care |
12.3% | |||
| Transportation |
4.2% | |||
| Housing/Single Family |
2.4% | |||
| Long-Term Care |
2.2% | |||
| Other |
2.4% | |||
| Total |
100% | |||
| States and Territories2 | ||||
| (% of total municipal bonds) | ||||
| Arizona |
94.4% | |||
| Puerto Rico |
3.9% | |||
| Guam |
1.4% | |||
| Virgin Islands |
0.3% | |||
| Total |
100% | |||
| 1 | See the Portfolio of Investments for the remaining industries/sectors comprising “Other” and not listed in the table above. |
| 2 | The Fund may invest up to 20% of its net assets in municipal bonds that are exempt from regular federal income tax, but not from Arizona personal income tax if, in the judgement of the Fund’s sub‑adviser, such purchases are expected to enhance the Fund’s after‑tax total return potential. |
| 18 |
| NKX | Nuveen California AMT‑Free Quality Municipal Income Fund Fund Performance, Leverage and Holdings Summaries August 31, 2025 |
Performance*
| Total Returns as of August 31, 2025 |
||||||||||||||||
| Average Annual | ||||||||||||||||
| Inception Date |
1-Year | 5-Year | 10-Year | |||||||||||||
| NKX at Common Share NAV |
11/21/02 | (6.12)% | (2.35)% | 1.76% | ||||||||||||
| NKX at Common Share Price |
11/21/02 | (4.64)% | (0.07)% | 3.26% | ||||||||||||
| S&P Municipal Bond Index |
– | 0.44% | 0.65% | 2.28% | ||||||||||||
| S&P Municipal Bond California Index |
– | 0.15% | 0.39% | 2.20% | ||||||||||||
*For purposes of Fund performance, relative results are measured against the S&P Municipal Bond California Index.
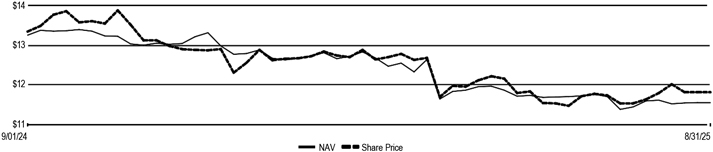
Daily Common Share NAV and Share Price
| Common Share NAV |
Common Share Price |
Premium/(Discount) to NAV |
Average Premium/(Discount) to NAV |
|||||||||
| $11.56 |
$11.82 | 2.25% | 0.71% | |||||||||
Growth of an Assumed $10,000 Investment as of August 31, 2025 - Common Share Price
19
Performance Overview and Holdings Summaries as of August 31, 2025
(continued)
Leverage and Holdings
| Leverage | ||||
| Effective Leverage |
42.84% | |||
| Regulatory Leverage |
40.87% | |||
| Fund Allocation | ||||
| (% of net assets) | ||||
| Municipal Bonds |
172.4% | |||
| Short-Term Municipal Bonds |
2.8% | |||
| Other Assets & Liabilities, Net |
(0.5)% | |||
| Floating Rate Obligations |
(5.8)% | |||
| MFP Shares, Net |
(24.4)% | |||
| VRDP Shares, Net |
(44.5)% | |||
| Net Assets |
100% | |||
| Portfolio Credit Quality | ||||
| (% of total investments) | ||||
| AAA |
6.7% | |||
| AA |
42.1% | |||
| A |
17.7% | |||
| BBB |
9.0% | |||
| BB or Lower |
4.4% | |||
| N/R (not rated) |
20.1% | |||
| Total |
100% | |||
| Portfolio Composition1 | ||||
| (% of total investments) | ||||
| Tax Obligation/General |
23.0% | |||
| Health Care |
18.6% | |||
| Utilities |
15.9% | |||
| Tax Obligation/Limited |
12.3% | |||
| Housing/Multifamily |
10.3% | |||
| Transportation |
9.5% | |||
| Education and Civic Organizations |
6.8% | |||
| U.S. Guaranteed |
2.5% | |||
| Other |
1.1% | |||
| Total |
100% | |||
| States and Territories2 | ||||
| (% of total municipal bonds) | ||||
| California |
92.7% | |||
| Puerto Rico |
5.6% | |||
| Guam |
1.2% | |||
| Virgin Islands |
0.4% | |||
| New York |
0.1% | |||
| Total |
100% | |||
| 1 | See the Portfolio of Investments for the remaining industries/sectors comprising “Other” and not listed in the table above. |
| 2 | The Fund may invest up to 20% of its net assets in municipal bonds that are exempt from regular federal income tax, but not from California personal income tax if, in the judgement of the Fund’s sub‑adviser, such purchases are expected to enhance the Fund’s after‑tax total return potential. |
| 20 |
| NCA | Nuveen California Municipal Value Fund Fund Performance, Leverage and Holdings Summaries August 31, 2025 |
Performance*
| Total Returns as of August 31, 2025 |
||||||||||||||||
| Average Annual | ||||||||||||||||
| Inception Date |
1-Year | 5-Year | 10-Year | |||||||||||||
| NCA at Common Share NAV |
10/07/87 | (2.31)% | (0.51)% | 2.00% | ||||||||||||
| NCA at Common Share Price |
10/07/87 | (1.12)% | (0.72)% | 1.69% | ||||||||||||
| S&P Municipal Bond Index |
– | 0.44% | 0.65% | 2.28% | ||||||||||||
| S&P Municipal Bond California Index |
– | 0.15% | 0.39% | 2.20% | ||||||||||||
*For purposes of Fund performance, relative results are measured against the S&P Municipal Bond California Index.
Daily Common Share NAV and Share Price
| Common Share NAV |
Common Share Price |
Premium/(Discount) to NAV |
Average Premium/(Discount) to NAV |
|||||||||
| $8.85 |
$8.52 | (3.73)% | (5.54)% | |||||||||
Growth of an Assumed $10,000 Investment as of August 31, 2025 - Common Share Price
21
Performance Overview and Holdings Summaries as of August 31, 2025
(continued)
Leverage and Holdings
| Leverage | ||||
| Effective Leverage |
0.00% | |||
| Regulatory Leverage |
0.00% | |||
| Fund Allocation | ||||
| (% of net assets) | ||||
| Municipal Bonds |
94.8% | |||
| Variable Rate Demand Preferred Shares |
0.8% | |||
| Short-Term Municipal Bonds |
3.4% | |||
| Other Assets & Liabilities, Net |
1.0% | |||
| Net Assets |
100% | |||
| Portfolio Credit Quality | ||||
| (% of total investments) | ||||
| AAA |
8.1% | |||
| AA |
57.8% | |||
| A |
13.3% | |||
| BBB |
4.8% | |||
| BB or Lower |
2.7% | |||
| N/R (not rated) |
13.3% | |||
| Total |
100% | |||
| Portfolio Composition1 | ||||
| (% of total investments) | ||||
| Tax Obligation/General |
27.4% | |||
| Transportation |
18.7% | |||
| Utilities |
17.7% | |||
| Health Care |
11.4% | |||
| Housing/Multifamily |
9.3% | |||
| Tax Obligation/Limited |
9.2% | |||
| Education and Civic Organizations |
3.3% | |||
| Other |
3.0% | |||
| Total |
100% | |||
| States and Territories2 | ||||
| (% of total municipal bonds) | ||||
| California |
97.0% | |||
| Puerto Rico |
3.0% | |||
| Total |
100% | |||
| 1 | See the Portfolio of Investments for the remaining industries/sectors comprising “Other” and not listed in the table above. |
| 2 | The Fund may invest up to 20% of its net assets in municipal bonds that are exempt from regular federal income tax, but not from California personal income tax if, in the judgement of the Fund’s sub‑adviser, such purchases are expected to enhance the Fund’s after‑tax total return potential. |
| 22 |
| NAC | Nuveen California Quality Municipal Income Fund Fund Performance, Leverage and Holdings Summaries August 31, 2025 |
Performance*
| Total Returns as of August 31, 2025 |
||||||||||||||||
| Average Annual | ||||||||||||||||
| Inception Date |
1-Year | 5-Year | 10-Year | |||||||||||||
| NAC at Common Share NAV |
5/26/99 | (6.68)% | (2.56)% | 1.42% | ||||||||||||
| NAC at Common Share Price |
5/26/99 | 2.96% | 0.03% | 2.73% | ||||||||||||
| S&P Municipal Bond Index |
– | 0.44% | 0.65% | 2.28% | ||||||||||||
| S&P Municipal Bond California Index |
– | 0.15% | 0.39% | 2.20% | ||||||||||||
* For purposes of Fund performance, relative results are measured against the S&P Municipal Bond California Index.
Daily Common Share NAV and Share Price
| Common Share NAV |
Common Share Price |
Premium/(Discount) to NAV |
Average Premium/(Discount) to NAV |
|||||||||
| $11.06 |
$11.23 | 1.54% | (5.26)% | |||||||||
Growth of an Assumed $10,000 Investment as of August 31, 2025 - Common Share Price
23
Performance Overview and Holdings Summaries as of August 31, 2025
(continued)
Leverage and Holdings
| Leverage | ||||
| Effective Leverage |
42.87% | |||
| Regulatory Leverage |
41.96% | |||
| Fund Allocation | ||||
| (% of net assets) | ||||
| Municipal Bonds |
172.7% | |||
| Short-Term Municipal Bonds |
1.5% | |||
| Other Assets & Liabilities, Net |
0.7% | |||
| Floating Rate Obligations |
(2.8)% | |||
| MFP Shares, Net |
(15.9)% | |||
| VRDP Shares, Net |
(56.2)% | |||
| Net Assets |
100% | |||
| Portfolio Credit Quality | ||||
| (% of total investments) | ||||
| AAA |
4.4% | |||
| AA |
47.7% | |||
| A |
18.8% | |||
| BBB |
7.1% | |||
| BB or Lower |
4.6% | |||
| N/R (not rated) |
17.4% | |||
| Total |
100% | |||
| Portfolio Composition1 | ||||
| (% of total investments) | ||||
| Tax Obligation/General |
18.0% | |||
| Utilities |
17.8% | |||
| Health Care |
17.4% | |||
| Transportation |
16.7% | |||
| Housing/Multifamily |
10.9% | |||
| Tax Obligation/Limited |
9.4% | |||
| Education and Civic Organizations |
6.7% | |||
| Other |
3.1% | |||
| Total |
100% | |||
| States and Territories2 | ||||
| (% of total municipal bonds) | ||||
| California |
95.1% | |||
| Puerto Rico |
4.1% | |||
| Guam |
0.7% | |||
| Virgin Islands |
0.1% | |||
| Total |
100% | |||
| 1 | See the Portfolio of Investments for the remaining industries/sectors comprising “Other” and not listed in the table above. |
| 2 | The Fund may invest up to 20% of its net assets in municipal bonds that are exempt from regular federal income tax, but not from California personal income tax if, in the judgement of the Fund’s sub‑adviser, such purchases are expected to enhance the Fund’s after‑tax total return potential. |
| 24 |
| NXJ | Nuveen New Jersey Quality Municipal Income Fund Fund Performance, Leverage and Holdings Summaries August 31, 2025 |
Performance*
| Total Returns as of August 31, 2025 |
||||||||||||||||
| Average Annual | ||||||||||||||||
| Inception Date |
1-Year | 5-Year | 10-Year | |||||||||||||
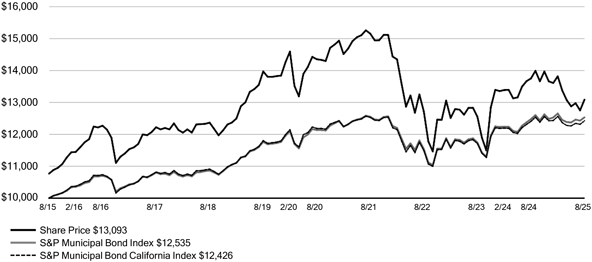
| NXJ at Common Share NAV |
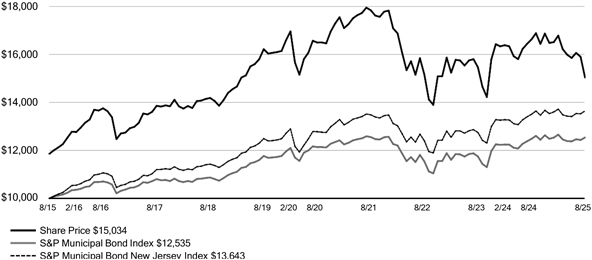
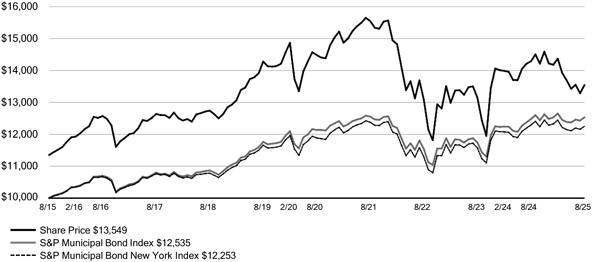
3/27/01 | (3.62)% | (0.99)% | 2.50% | ||||||||||||
| NXJ at Common Share Price |
3/27/01 | (3.08)% | 1.54% | 4.16% | ||||||||||||
| S&P Municipal Bond Index |
– | 0.44% | 0.65% | 2.28% | ||||||||||||
| S&P Municipal Bond New Jersey Index |
– | 1.04% | 1.32% | 3.16% | ||||||||||||
* For purposes of Fund performance, relative results are measured against the S&P Municipal Bond New Jersey Index.
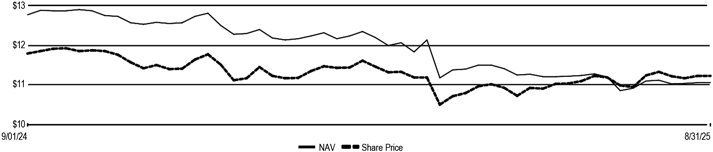
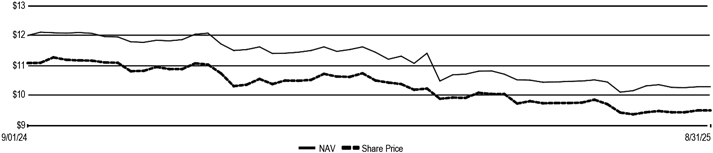
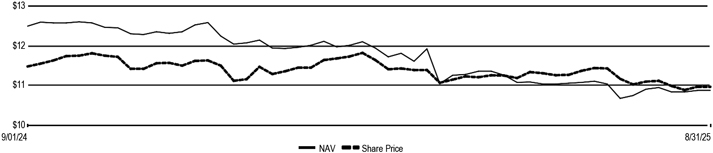
Daily Common Share NAV and Share Price
| Common Share NAV |
Common Share Price |
Premium/(Discount) to NAV |
Average Premium/(Discount) to NAV |
|||||||||
| $12.25 |
$11.42 | (6.78)% | (7.51)% | |||||||||
Growth of an Assumed $10,000 Investment as of August 31, 2025 - Common Share Price
25
Performance Overview and Holdings Summaries as of August 31, 2025
(continued)
Leverage and Holdings
| Leverage | ||||
| Effective Leverage |
42.78% | |||
| Regulatory Leverage |
38.32% | |||
| Fund Allocation | ||||
| (% of net assets) | ||||
| Municipal Bonds |
173.0% | |||
| Short-Term Municipal Bonds |
0.4% | |||
| Other Assets & Liabilities, Net |
1.1% | |||
| Floating Rate Obligations |
(12.6)% | |||
| VRDP Shares, Net |
(61.9)% | |||
| Net Assets |
100% | |||
| Portfolio Credit Quality | ||||
| (% of total investments) | ||||
| AAA |
8.2% | |||
| AA |
53.2% | |||
| A |
21.8% | |||
| BBB |
8.9% | |||
| BB or Lower |
3.2% | |||
| N/R (not rated) |
4.7% | |||
| Total |
100% | |||
| Portfolio Composition1 | ||||
| (% of total investments) | ||||
| Tax Obligation/Limited |
29.1% | |||
| Transportation |
18.7% | |||
| Tax Obligation/General |
11.8% | |||
| Education and Civic Organizations |
11.8% | |||
| Health Care |
8.3% | |||
| Housing/Single Family |
7.5% | |||
| Housing/Multifamily |
4.4% | |||
| Utilities |
3.5% | |||
| Consumer Staples |
3.1% | |||
| Other |
1.8% | |||
| Total |
100% | |||
| States and Territories2 | ||||
| (% of total municipal bonds) | ||||
| New Jersey |
91.1% | |||
| New York |
4.1% | |||
| Pennsylvania |
2.8% | |||
| Puerto Rico |
1.5% | |||
| Delaware |
0.4% | |||
| Guam |
0.1% | |||
| Total |
100% | |||
| 1 | See the Portfolio of Investments for the remaining industries/sectors comprising “Other” and not listed in the table above. |
| 2 | The Fund may invest up to 20% of its net assets in municipal bonds that are exempt from regular federal income tax, but not from New Jersey personal income tax if, in the judgement of the Fund’s sub‑adviser, such purchases are expected to enhance the Fund’s after‑tax total return potential. |
| 26 |
| NRK | Nuveen New York AMT‑Free Quality Municipal Income Fund Fund Performance, Leverage and Holdings Summaries August 31, 2025 |
Performance*
| Total Returns as of August 31, 2025 |
||||||||||||||||
| Average Annual | ||||||||||||||||
| Inception Date |
1-Year | 5-Year | 10-Year | |||||||||||||
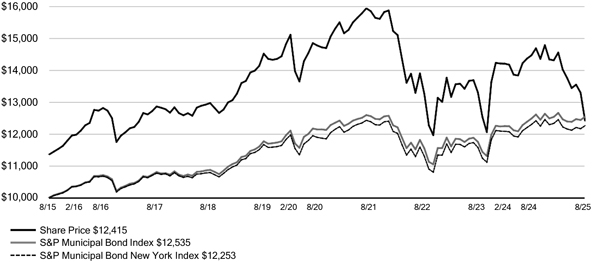
| NRK at Common Share NAV |
11/21/02 | (7.66)% | (2.37)% | 1.20% | ||||||||||||
| NRK at Common Share Price |
11/21/02 | (7.08)% | (1.06)% | 2.19% | ||||||||||||
| S&P Municipal Bond Index |
– | 0.44% | 0.65% | 2.28% | ||||||||||||
| S&P Municipal Bond New York Index |
– | (0.33)% | 0.61% | 2.05% | ||||||||||||
* For purposes of Fund performance, relative results are measured against the S&P Municipal Bond New York Index.
Daily Common Share NAV and Share Price
| Common Share NAV |
Common Share Price |
Premium/(Discount) to NAV |
Average Premium/(Discount) to NAV |
|||||||||
| $10.30 |
$9.51 | (7.67)% | (7.72)% | |||||||||
Growth of an Assumed $10,000 Investment as of August 31, 2025 - Common Share Price
27
Performance Overview and Holdings Summaries as of August 31, 2025
(continued)
Leverage and Holdings
| Leverage | ||||
| Effective Leverage |
42.97% | |||
| Regulatory Leverage |
42.48% | |||
| Fund Allocation | ||||
| (% of net assets) | ||||
| Municipal Bonds |
170.4% | |||
| Short-Term Municipal Bonds |
3.1% | |||
| Other Assets & Liabilities, Net |
1.7% | |||
| Floating Rate Obligations |
(1.5)% | |||
| MFP Shares, Net |
(8.9)% | |||
| VRDP Shares, Net |
(64.8)% | |||
| Net Assets |
100% | |||
| Portfolio Credit Quality | ||||
| (% of total investments) | ||||
| AAA |
8.6% | |||
| AA |
49.7% | |||
| A |
13.7% | |||
| BBB |
8.0% | |||
| BB or Lower |
8.1% | |||
| N/R (not rated) |
11.9% | |||
| Total |
100% | |||
| Portfolio Composition1 | ||||
| (% of total investments) | ||||
| Tax Obligation/Limited |
28.6% | |||
| Health Care |
17.1% | |||
| Education and Civic Organizations |
14.1% | |||
| Utilities |
13.9% | |||
| Transportation |
11.5% | |||
| Tax Obligation/General |
4.8% | |||
| Consumer Staples |
4.6% | |||
| Industrials |
2.1% | |||
| Other |
3.3% | |||
| Total |
100% | |||
| States and Territories2 | ||||
| (% of total municipal bonds) | ||||
| New York |
93.7% | |||
| Puerto Rico |
5.6% | |||
| Guam |
0.7% | |||
| Total |
100% | |||
| 1 | See the Portfolio of Investments for the remaining industries/sectors comprising “Other” and not listed in the table above. |
| 2 | The Fund may invest up to 20% of its net assets in municipal bonds that are exempt from regular federal income tax, but not from New York personal income tax if, in the judgement of the Fund’s sub‑adviser, such purchases are expected to enhance the Fund’s after‑tax total return potential. |
| 28 |
| NNY | Nuveen New York Municipal Value Fund Fund Performance, Leverage and Holdings Summaries August 31, 2025 |
Performance*
| Total Returns as of August 31, 2025 |
||||||||||||||||
| Average Annual | ||||||||||||||||
| Inception Date |
1-Year | 5-Year | 10-Year | |||||||||||||
| NNY at Common Share NAV |
10/07/87 | (1.89)% | 0.15% | 1.99% | ||||||||||||
| NNY at Common Share Price |
10/07/87 | (1.58)% | (1.28)% | 1.98% | ||||||||||||
| S&P Municipal Bond Index |
– | 0.44% | 0.65% | 2.28% | ||||||||||||
| S&P Municipal Bond New York Index |
– | (0.33)% | 0.61% | 2.05% | ||||||||||||
* For purposes of Fund performance, relative results are measured against the S&P Municipal Bond New York Index.
Daily Common Share NAV and Share Price
| Common Share NAV |
Common Share Price |
Premium/(Discount) to NAV |
Average Premium/(Discount) to NAV |
|||||||||
| $8.54 |
$8.09 | (5.27)% | (6.65)% | |||||||||
Growth of an Assumed $10,000 Investment as of August 31, 2025 - Common Share Price
29
Performance Overview and Holdings Summaries as of August 31, 2025
(continued)
Leverage and Holdings
| Leverage | ||||
| Effective Leverage |
0.00% | |||
| Regulatory Leverage |
0.00% | |||
| Fund Allocation | ||||
| (% of net assets) | ||||
| Municipal Bonds |
97.8% | |||
| Short-Term Municipal Bonds |
2.2% | |||
| Other Assets & Liabilities, Net |
0.0% | |||
| Net Assets |
100% | |||
| Portfolio Credit Quality | ||||
| (% of total investments) | ||||
| AAA |
8.5% | |||
| AA |
41.1% | |||
| A |
12.8% | |||
| BBB |
18.7% | |||
| BB or Lower |
10.1% | |||
| N/R (not rated) |
8.8% | |||
| Total |
100% | |||
| Portfolio Composition1 | ||||
| (% of total investments) | ||||
| Transportation |
22.2% | |||
| Tax Obligation/Limited |
16.8% | |||
| Utilities |
15.2% | |||
| Health Care |
14.7% | |||
| Education and Civic Organizations |
13.2% | |||
| Tax Obligation/General |
9.6% | |||
| Industrials |
4.1% | |||
| Consumer Staples |
2.9% | |||
| Other |
1.3% | |||
| Total |
100% | |||
| States and Territories2 | ||||
| (% of total municipal bonds) | ||||
| New York |
95.0% | |||
| Puerto Rico |
3.4% | |||
| Guam |
1.6% | |||
| Total |
100% | |||
| 1 | See the Portfolio of Investments for the remaining industries/sectors comprising “Other” and not listed in the table above. |
| 2 | The Fund may invest up to 20% of its net assets in municipal bonds that are exempt from regular federal income tax, but not from New York personal income tax if, in the judgement of the Fund’s sub‑adviser, such purchases are expected to enhance the Fund’s after‑tax total return potential. |
| 30 |
| NAN | Nuveen New York Quality Municipal Income Fund Fund Performance, Leverage and Holdings Summaries August 31, 2025 |
Performance*
| Total Returns as of August 31, 2025 |
||||||||||||||||
| Average Annual | ||||||||||||||||
| Inception Date |
1-Year | 5-Year | 10-Year | |||||||||||||
| NAN at Common Share NAV |
5/26/99 | (6.24)% | (1.92)% | 1.27% | ||||||||||||
| NAN at Common Share Price |
5/26/99 | 3.08% | 0.91% | 3.08% | ||||||||||||
| S&P Municipal Bond Index |
– | 0.44% | 0.65% | 2.28% | ||||||||||||
| S&P Municipal Bond New York Index |
– | (0.33)% | 0.61% | 2.05% | ||||||||||||
* For purposes of Fund performance, relative results are measured against the S&P Municipal Bond New York Index.
Daily Common Share NAV and Share Price
| Common Share NAV |
Common Share Price |
Premium/(Discount) to NAV |
Average Premium/(Discount) to NAV |
|||||||||
| $10.88 |
$10.97 | 0.83% | (2.69)% | |||||||||
Growth of an Assumed $10,000 Investment as of August 31, 2025 - Common Share Price
31
Performance Overview and Holdings Summaries as of August 31, 2025
(continued)
Leverage and Holdings
| Leverage | ||||
| Effective Leverage |
42.03% | |||
| Regulatory Leverage |
39.01% | |||
| Fund Allocation | ||||
| (% of net assets) | ||||
| Municipal Bonds |
170.8% | |||
| Other Assets & Liabilities, Net |
1.5% | |||
| Floating Rate Obligations |
(8.5)% | |||
| AMTP Shares, Net |
(37.6)% | |||
| VRDP Shares, Net |
(26.2)% | |||
| Net Assets |
100% | |||
| Portfolio Credit Quality | ||||
| (% of total investments) | ||||
| AAA |
12.2% | |||
| AA |
37.9% | |||
| A |
11.5% | |||
| BBB |
17.7% | |||
| BB or Lower |
10.1% | |||
| N/R (not rated) |
10.6% | |||
| Total |
100% | |||
| States and Territories2 | ||||
| (% of total municipal bonds) | ||||
| New York |
93.9% | |||
| Puerto Rico |
5.0% | |||
| Guam |
1.1% | |||
| Total |
100% | |||
| Portfolio Composition1 | ||||
| (% of total investments) | ||||
| Tax Obligation/Limited |
30.2% | |||
| Transportation |
28.0% | |||
| Health Care |
15.4% | |||
| Education and Civic Organizations |
6.8% | |||
| Utilities |
6.0% | |||
| Consumer Staples |
3.7% | |||
| Industrials |
3.4% | |||
| Tax Obligation/General |
3.2% | |||
| Financials |
2.3% | |||
| Other |
1.0% | |||
| Total |
100% | |||
| 1 | See the Portfolio of Investments for the remaining industries/sectors comprising “Other” and not listed in the table above. |
| 2 | The Fund may invest up to 20% of its net assets in municipal bonds that are exempt from regular federal income tax, but not from New York personal income tax if, in the judgement of the Fund’s sub‑adviser, such purchases are expected to enhance the Fund’s after‑tax total return potential. |
| 32 |
| NQP | Nuveen Pennsylvania Quality Municipal Income Fund Fund Performance, Leverage and Holdings Summaries August 31, 2025 |
Performance*
| Total Returns as of August 31, 2025 |
||||||||||||||||
| Average Annual | ||||||||||||||||
| Inception Date |
1-Year | 5-Year | 10-Year | |||||||||||||
| NQP at Common Share NAV |
2/21/91 | (6.93)% | (1.04)% | 1.82% | ||||||||||||
| NQP at Common Share Price |
2/21/91 | (4.89)% | 0.66% | 3.38% | ||||||||||||
| S&P Municipal Bond Index |
– | 0.44% | 0.65% | 2.28% | ||||||||||||
| S&P Municipal Bond Pennsylvania Index |
– | 0.65% | 0.68% | 2.36% | ||||||||||||
* For purposes of Fund performance, relative results are measured against the S&P Municipal Bond Pennsylvania Index.
Daily Common Share NAV and Share Price
| Common Share NAV |
Common Share Price |
Premium/(Discount) to NAV |
Average Premium/(Discount) to NAV |
|||||||||
| $11.81 |
$10.96 | (7.20)% | (8.60)% | |||||||||
Growth of an Assumed $10,000 Investment as of August 31, 2025 - Common Share Price
33
Performance Overview and Holdings Summaries as of August 31, 2025
(continued)
Leverage and Holdings
| Leverage | ||||
| Effective Leverage |
42.46% | |||
| Regulatory Leverage |
33.10% | |||
| Fund Allocation | ||||
| (% of net assets) | ||||
| Municipal Bonds |
168.4% | |||
| Variable Rate Senior Loan Interests |
0.0% | |||
| Other Assets & Liabilities, Net |
5.2% | |||
| Floating Rate Obligations |
(24.3)% | |||
| VRDP Shares, Net |
(49.3)% | |||
| Net Assets |
100% | |||
| Portfolio Credit Quality | ||||
| (% of total investments) | ||||
| AAA |
0.5% | |||
| AA |
60.8% | |||
| A |
18.2% | |||
| BBB |
9.0% | |||
| BB or Lower |
2.2% | |||
| N/R (not rated) |
9.3% | |||
| Total |
100% | |||
| States and Territories2 | ||||
| (% of total municipal bonds) | ||||
| Pennsylvania |
98.4% | |||
| Puerto Rico |
0.9% | |||
| New Jersey |
0.7% | |||
| Total |
100% | |||
| Portfolio Composition1 | ||||
| (% of total investments) | ||||
| Health Care |
15.9% | |||
| Tax Obligation/General |
15.3% | |||
| Housing/Single Family |
14.8% | |||
| Utilities |
12.9% | |||
| Education and Civic Organizations |
12.4% | |||
| Transportation |
11.1% | |||
| Tax Obligation/Limited |
7.3% | |||
| Long-Term Care |
5.6% | |||
| U.S. Guaranteed |
2.5% | |||
| Other |
2.2% | |||
| Variable Rate Senior Loan Interests |
0.0% | |||
| Total |
100% | |||
| 1 | See the Portfolio of Investments for the remaining industries/sectors comprising “Other” and not listed in the table above. |
| 2 | The Fund may invest up to 20% of its net assets in municipal bonds that are exempt from regular federal income tax, but not from Pennsylvania personal income tax if, in the judgement of the Fund’s sub‑adviser, such purchases are expected to enhance the Fund’s after‑tax total return potential. |
| 34 |
Report of Independent Registered Public Accounting Firm
To the Board of Trustees and Shareholders of Nuveen Arizona Quality Municipal Income Fund, Nuveen California AMT‑Free Quality Municipal Income Fund, Nuveen California Municipal Value Fund, Nuveen California Quality Municipal Income Fund, Nuveen New Jersey Quality Municipal Income Fund, Nuveen New York AMT‑Free Quality Municipal Income Fund, Nuveen New York Municipal Value Fund, Nuveen New York Quality Municipal Income Fund and Nuveen Pennsylvania Quality Municipal Income Fund
Opinions on the Financial Statements
We have audited the accompanying statements of assets and liabilities, including the portfolios of investments, of each of the funds listed in the table below (hereafter collectively referred to as the “Funds”) as of August 31, 2025, the related statements of operations, of changes in net assets and, for the funds indicated in the table below, of cash flows for the year ended August 31, 2025, including the related notes, and the financial highlights for the year ended August 31, 2025 (collectively referred to as the “financial statements”). In our opinion, the financial statements present fairly, in all material respects, the financial position of each of the Funds listed in the table below as of August 31, 2025, the results of each of their operations, the changes in each of their net assets and, for the funds indicated in the table below, each of their cash flows for the year ended August 31, 2025, and each of the financial highlights for the year ended August 31, 2025, in conformity with accounting principles generally accepted in the United States of America.
Nuveen Arizona Quality Municipal Income Fund (1)
Nuveen California AMT‑Free Quality Municipal Income Fund (1)
Nuveen California Municipal Value Fund (2)
Nuveen California Quality Municipal Income Fund (1)
Nuveen New Jersey Quality Municipal Income Fund (1)
Nuveen New York AMT‑Free Quality Municipal Income Fund (1)
Nuveen New York Municipal Value Fund (2)
Nuveen New York Quality Municipal Income Fund (1)
Nuveen Pennsylvania Quality Municipal Income Fund (1)
| (1) | Statement of operations, statement of changes in net assets, statement of cash flows and financial highlights for the year ended August 31, 2025 |
| (2) | Statement of operations, statement of changes in net assets and financial highlights for the year ended August 31, 2025 |
The financial statements of the Funds as of August 31, 2024, for the six months ended August 31, 2024 and the year ended February 29, 2024 and the financial highlights for each of the periods ended on or prior to August 31, 2024 (not presented herein, other than the statements of changes in net assets and the financial highlights) were audited by other auditors whose report dated October 29, 2024 expressed an unqualified opinion on those financial statements and financial highlights.
35
Report of Independent Registered Public Accounting Firm (continued)
Basis for Opinions
These financial statements are the responsibility of the Funds’ management. Our responsibility is to express an opinion on the Funds’ financial statements based on our audits. We are a public accounting firm registered with the Public Company Accounting Oversight Board (United States) (PCAOB) and are required to be independent with respect to the Funds in accordance with the U.S. federal securities laws and the applicable rules and regulations of the Securities and Exchange Commission and the PCAOB.
We conducted our audits of these financial statements in accordance with the standards of the PCAOB. Those standards require that we plan and perform the audit to obtain reasonable assurance about whether the financial statements are free of material misstatement, whether due to error or fraud.
Our audits included performing procedures to assess the risks of material misstatement of the financial statements, whether due to error or fraud, and performing procedures that respond to those risks. Such procedures included examining, on a test basis, evidence regarding the amounts and disclosures in the financial statements. Our audits also included evaluating the accounting principles used and significant estimates made by management, as well as evaluating the overall presentation of the financial statements. Our procedures included confirmation of securities owned as of August 31, 2025 by correspondence with the custodian and brokers; when replies were not received from brokers, we performed other auditing procedures. We believe that our audits provide a reasonable basis for our opinions.
/s/ PricewaterhouseCoopers LLP
Chicago, Illinois
October 29, 2025
We have served as the auditor of one or more investment companies in Nuveen Funds since 2002.
36
Portfolio of Investments August 31, 2025
NAZ
| PRINCIPAL | DESCRIPTION | RATE | MATURITY | VALUE | ||||||||||||||
| |
|
|||||||||||||||||
| LONG-TERM INVESTMENTS - 162.0% (100.0% of Total Investments) | ||||||||||||||||||
| MUNICIPAL BONDS - 162.0% (100.0% of Total Investments) | ||||||||||||||||||
| EDUCATION AND CIVIC ORGANIZATIONS - 30.8% (19.0% of Total Investments) | ||||||||||||||||||
| $ | 2,175,000 | Arizona Board of Regents, Arizona State University System Revenue Bonds, Green Series 2016B | 5.000% | 07/01/47 | $ | 2,157,858 | ||||||||||||
| 2,000,000 | Arizona Board of Regents, Arizona State University System Revenue Bonds, Green Series 2024A | 5.000 | 07/01/50 | 2,029,924 | ||||||||||||||
| 2,030,000 | Arizona Board of Regents, Arizona State University System Revenue Bonds, Series 2020B | 4.000 | 07/01/47 | 1,777,126 | ||||||||||||||
| 425,000 | (a) | Arizona Board of Regents, Arizona State University System Revenue Bonds, Series 2025A | 5.000 | 07/01/45 | 438,270 | |||||||||||||
| 1,000,000 | Arizona Board of Regents, University of Arizona, System Revenue Bonds, Refunding Series 2021A | 5.000 | 06/01/42 | 1,029,258 | ||||||||||||||
| 2,000,000 | Arizona Board of Regents, University of Arizona, System Revenue Bonds, Refunding Series 2025A | 5.000 | 06/01/50 | 2,024,018 | ||||||||||||||
| 515,000 | (b) | Arizona Industrial Development Authority, Arizona, Education Facility Revenue Bonds, Basis Schools, Inc. Projects, Series 2017A | 5.125 | 07/01/37 | 516,169 | |||||||||||||
| 525,000 | Arizona Industrial Development Authority, Arizona, Education Facility Revenue Bonds, Basis Schools, Inc. Projects, Series 2017C | 5.000 | 07/01/47 | 510,825 | ||||||||||||||
| 250,000 | (b) | Arizona Industrial Development Authority, Arizona, Education Facility Revenue Bonds, Basis Schools, Inc. Projects, Series 2017D | 5.000 | 07/01/47 | 229,709 | |||||||||||||
| 1,700,000 | Arizona Industrial Development Authority, Arizona, Education Facility Revenue Bonds, Basis Schools, Inc. Projects, Series 2017F | 5.000 | 07/01/37 | 1,719,261 | ||||||||||||||
| 1,000,000 | Arizona Industrial Development Authority, Arizona, Education Facility Revenue Bonds, Basis Schools, Inc. Projects, Series 2017F | 5.000 | 07/01/52 | 950,674 | ||||||||||||||
| 380,000 | (b) | Arizona Industrial Development Authority, Arizona, Education Facility Revenue Bonds, Basis Schools, Inc. Projects, Series 2017G | 5.000 | 07/01/47 | 349,157 | |||||||||||||
| 240,000 | (b) | Arizona Industrial Development Authority, Arizona, Education Facility Revenue Bonds, Montessori Academy Projects, Refunding Series 2017A | 6.250 | 11/01/50 | 203,226 | |||||||||||||
| 420,000 | (b) | Arizona Industrial Development Authority, Arizona, Education Facility Revenue Bonds, Somerset Academy of Las Vegas - Aliante and Skye Canyon Campus Projects, Series 2021A | 4.000 | 12/15/41 | 348,621 | |||||||||||||
| 375,000 | (b) | Arizona Industrial Development Authority, Arizona, Education Revenue Bonds, Arizona Agribusiness and Equine Center, Inc. Project, Series 2017B | 5.000 | 03/01/48 | 327,289 | |||||||||||||
| 100,000 | (b) | Arizona Industrial Development Authority, Arizona, Education Revenue Bonds, Academies of Math & Science Projects, Series 2017B | 4.250 | 07/01/27 | 100,330 | |||||||||||||
| 615,000 | Arizona Industrial Development Authority, Arizona, Education Revenue Bonds, Academies of Math & Science Projects, Series 2018A | 5.000 | 07/01/38 | 617,519 | ||||||||||||||
| 1,000,000 | Arizona Industrial Development Authority, Arizona, Education Revenue Bonds, Academies of Math & Science Projects, Series 2018A | 5.000 | 07/01/48 | 931,043 | ||||||||||||||
| 125,000 | Arizona Industrial Development Authority, Arizona, Education Revenue Bonds, GreatHearts Arizona Projects, Series 2021A | 5.000 | 07/01/28 | 131,423 | ||||||||||||||
| 125,000 | Arizona Industrial Development Authority, Arizona, Education Revenue Bonds, GreatHearts Arizona Projects, Series 2021A | 5.000 | 07/01/29 | 133,169 | ||||||||||||||
| 130,000 | Arizona Industrial Development Authority, Arizona, Education Revenue Bonds, GreatHearts Arizona Projects, Series 2021A | 5.000 | 07/01/30 | 139,672 | ||||||||||||||
| 125,000 | Arizona Industrial Development Authority, Arizona, Education Revenue Bonds, GreatHearts Arizona Projects, Series 2021A | 5.000 | 07/01/31 | 134,660 | ||||||||||||||
| 455,000 | (b) | Arizona Industrial Development Authority, Arizona, Education Revenue Bonds, Pinecrest Academy of Nevada’s Horizon, Inspirada and St. Rose Campus Projects, Series 2018A | 5.750 | 07/15/38 | 457,433 | |||||||||||||
| 100,000 | (b) | Arizona Industrial Development Authority, Arizona, Education Revenue Bonds, Social Bonds Pensar Academy Project, Series 2020 | 4.000 | 07/01/30 | 97,199 | |||||||||||||
| 1,645,000 | Arizona Industrial Development Authority, Arizona, Lease Revenue Bonds, University of Indianapolis - Health Pavilion Project, Series 2019A | 4.000 | 10/01/39 | 1,430,916 | ||||||||||||||
| 1,080,000 | Arizona Industrial Development Authority, Arizona, Lease Revenue Bonds, University of Indianapolis - Health Pavilion Project, Series 2019A | 4.000 | 10/01/49 | 806,659 | ||||||||||||||
| See Notes to Financial Statements |
37 |
Portfolio of Investments August 31, 2025 (continued)
NAZ
| PRINCIPAL | DESCRIPTION | RATE | MATURITY | VALUE | ||||||||||||||
| |
|
|||||||||||||||||
| EDUCATION AND CIVIC ORGANIZATIONS (continued) | ||||||||||||||||||
| $ | 1,500,000 | (b),(c) | Arizona Industrial Development Authority, Education Facility Revenue Bonds, Caurus Academy Project, Series 2018A | 6.375% | 06/01/39 | $ | 1,050,000 | |||||||||||
| 360,000 | Industrial Development Authority, Pima County, Arizona, Education Revenue Bonds, Center for Academic Success Project, Refunding Series 2019 | 4.000 | 07/01/31 | 359,773 | ||||||||||||||
| 340,000 | Industrial Development Authority, Pima County, Arizona, Education Revenue Bonds, Center for Academic Success Project, Refunding Series 2019 | 4.000 | 07/01/33 | 332,842 | ||||||||||||||
| 780,000 | (b) | Maricopa County Industrial Development Authority, Arizona, Education Revenue Bonds, Arizona Autism Charter Schools Project, Series 2020A | 5.000 | 07/01/50 | 686,338 | |||||||||||||
| 195,000 | (b) | Maricopa County Industrial Development Authority, Arizona, Education Revenue Bonds, Arizona Autism Charter Schools Project, Social Series 2021A | 4.000 | 07/01/51 | 143,640 | |||||||||||||
| 355,000 | Maricopa County Industrial Development Authority, Arizona, Education Revenue Bonds, Great Hearts Academies Projects, Series 2017A | 5.000 | 07/01/37 | 358,711 | ||||||||||||||
| 490,000 | Maricopa County Industrial Development Authority, Arizona, Education Revenue Bonds, Great Hearts Academies Projects, Series 2017C | 5.000 | 07/01/48 | 470,311 | ||||||||||||||
| 1,715,000 | Maricopa County Industrial Development Authority, Arizona, Education Revenue Bonds, Highland Prep Project, Series 2019 | 5.000 | 01/01/50 | 1,633,056 | ||||||||||||||
| 700,000 | (b) | Maricopa County Industrial Development Authority, Arizona, Education Revenue Bonds, Legacy Traditional Schools Projects, Series 2021A | 4.000 | 07/01/41 | 596,956 | |||||||||||||
| 335,000 | Maricopa County Industrial Development Authority, Arizona, Education Revenue Bonds, Legacy Traditional Schools Projects, Series 2024 | 4.250 | 07/01/44 | 283,407 | ||||||||||||||
| 870,000 | (b) | Maricopa County Industrial Development Authority, Arizona, Education Revenue Bonds, Paradise Schools Projects, Series 2016 | 5.000 | 07/01/47 | 760,883 | |||||||||||||
| 520,000 | Maricopa County Industrial Development Authority, Arizona, Education Revenue Bonds, Reid Traditional School Projects, Series 2016 | 5.000 | 07/01/36 | 515,297 | ||||||||||||||
| 300,000 | Maricopa County Industrial Development Authority, Arizona, Education Revenue Bonds, Reid Traditional School Projects, Series 2016 | 5.000 | 07/01/47 | 268,157 | ||||||||||||||
| 2,000,000 | Maricopa County Industrial Development Authority, Arizona, Educational Facilities Revenue Bonds, Creighton University Projects, Series 2020 | 4.000 | 07/01/50 | 1,628,856 | ||||||||||||||
| 775,000 | McAllister Academic Village LLC, Arizona, Revenue Bonds, Arizona State University Hassayampa Academic Village Project, Refunding Series 2016 | 5.000 | 07/01/37 | 781,252 | ||||||||||||||
| 1,000,000 | McAllister Academic Village LLC, Arizona, Revenue Bonds, Arizona State University Hassayampa Academic Village Project, Refunding Series 2016 | 5.000 | 07/01/38 | 1,005,925 | ||||||||||||||
| 1,000,000 | Northern Arizona University, System Revenue Bonds, Refunding Series 2020B - BAM Insured | 5.000 | 06/01/39 | 1,030,942 | ||||||||||||||
| 70,000 | (b) | Phoenix Industrial Development Authority, Arizona, Education Facility Revenue Bonds, Basis Schools, Inc. Projects, Series 2016A | 5.000 | 07/01/46 | 64,572 | |||||||||||||
| 800,000 | Phoenix Industrial Development Authority, Arizona, Education Facility Revenue Bonds, Great Hearts Academies Project, Series 2016A | 5.000 | 07/01/41 | 792,704 | ||||||||||||||
| 315,000 | (b) | Phoenix Industrial Development Authority, Arizona, Education Facility Revenue Bonds, Legacy Traditional Schools Projects, Series 2015 | 5.000 | 07/01/35 | 315,065 | |||||||||||||
| 300,000 | (b) | Phoenix Industrial Development Authority, Arizona, Education Facility Revenue Bonds, Legacy Traditional Schools Projects, Series 2015 | 5.000 | 07/01/45 | 277,250 | |||||||||||||
| 650,000 | (b) | Phoenix Industrial Development Authority, Arizona, Education Facility Revenue Bonds, Legacy Traditional Schools Projects, Series 2016A | 5.000 | 07/01/41 | 622,923 | |||||||||||||
| 1,110,000 | (b) | Phoenix Industrial Development Authority, Arizona, Education Facility Revenue Bonds, Northwest Christian School Project, Series 2020A | 5.000 | 09/01/45 | 925,148 | |||||||||||||
| 38 |
See Notes to Financial Statements |
| PRINCIPAL | DESCRIPTION | RATE | MATURITY | VALUE | ||||||||||||||
| |
|
|||||||||||||||||
| EDUCATION AND CIVIC ORGANIZATIONS (continued) | ||||||||||||||||||
| $ | 400,000 | Phoenix Industrial Development Authority, Arizona, Education Facility Revenue Bonds, Villa Montessori, Inc. Projects, Series 2015 | 5.000% | 07/01/35 | $ | 400,100 | ||||||||||||
| 900,000 | Phoenix Industrial Development Authority, Arizona, Education Facility Revenue Bonds, Vista College Preparatory Project, Series 2018A | 4.125 | 07/01/38 | 836,604 | ||||||||||||||
| 1,995,000 | Phoenix Industrial Development Authority, Arizona, Lease Revenue Bonds, Eastern Kentucky University Project, Series 2016 | 5.000 | 10/01/36 | 2,011,678 | ||||||||||||||
| 500,000 | Pima County Community College District, Arizona, Revenue Bonds, Series 2019 | 5.000 | 07/01/36 | 515,562 | ||||||||||||||
| 120,000 | (b) | Pima County Industrial Development Authority, Arizona, Education Facility Revenue Bonds, Champion Schools Project, Series 2017 | 6.000 | 06/15/37 | 120,445 | |||||||||||||
| 680,000 | (b) | Pima County Industrial Development Authority, Arizona, Education Facility Revenue Bonds, Champion Schools Project, Series 2017 | 6.125 | 06/15/47 | 668,343 | |||||||||||||
| 200,000 | (c) | Pima County Industrial Development Authority, Arizona, Education Facility Revenue Bonds, Edkey Charter Schools Project, Series 2016 | 5.250 | 07/01/36 | 140,000 | |||||||||||||
| 115,000 | (b) | Pima County Industrial Development Authority, Arizona, Education Facility Revenue Bonds, San Tan Montessori School Project, Series 2017 | 6.750 | 02/01/50 | 110,614 | |||||||||||||
| 500,000 | (b) | Pima County Industrial Development Authority, Arizona, Education Revenue Bonds, Noah Webster Schools - Mesa Project, Series 2015A | 5.000 | 12/15/34 | 485,080 | |||||||||||||
| 730,000 | Pinal County Community College District, Arizona, Revenue Bonds, Central Arizona College, Series 2017 - BAM Insured | 5.000 | 07/01/35 | 740,538 | ||||||||||||||
| 1,000,000 | (b) | Sierra Vista Industrial Development Authority, Arizona, Education Facility Revenue Bonds, Desert Heights Charter School Project, Refunding Series 2024 | 6.125 | 06/01/57 | 897,073 | |||||||||||||
| |
|
|||||||||||||||||
| TOTAL EDUCATION AND CIVIC ORGANIZATIONS | 41,421,453 | |||||||||||||||||
| |
||||||||||||||||||
| HEALTH CARE - 19.9% (12.3% of Total Investments) | ||||||||||||||||||
| 890,000 | Arizona Industrial Development Authority, Arizona, Lease Revenue Bonds, Children’s National Prince County Regional Medical Center, Series 2020A | 4.000 | 09/01/38 | 863,757 | ||||||||||||||
| 4,975,000 | Arizona Industrial Development Authority, Hospital Revenue Bonds, Phoenix Children’s Hospital, Series 2020A | 4.000 | 02/01/50 | 4,089,054 | ||||||||||||||
| 1,000,000 | Maricopa County Industrial Development Authority, Arizona, Hospital Revenue Bonds, Honor Health, Series 2024D | 5.000 | 12/01/44 | 1,000,708 | ||||||||||||||
| 1,250,000 | Maricopa County Industrial Development Authority, Arizona, Hospital Revenue Bonds, HonorHealth, Series 2019A | 5.000 | 09/01/42 | 1,253,426 | ||||||||||||||
| 3,275,000 | Maricopa County Industrial Development Authority, Arizona, Hospital Revenue Bonds, HonorHealth, Series 2021A | 4.000 | 09/01/51 | 2,620,355 | ||||||||||||||
| 1,250,000 | Maricopa County Industrial Development Authority, Arizona, Revenue Bonds, Banner Health, Series 2016A | 5.000 | 01/01/32 | 1,280,902 | ||||||||||||||
| 1,000,000 | Maricopa County Industrial Development Authority, Arizona, Revenue Bonds, Banner Health, Series 2016A | 5.000 | 01/01/35 | 1,019,377 | ||||||||||||||
| 2,000,000 | Maricopa County Industrial Development Authority, Arizona, Revenue Bonds, Banner Health, Series 2017A | 5.000 | 01/01/41 | 2,026,290 | ||||||||||||||
| 2,000,000 | Maricopa County Industrial Development Authority, Arizona, Revenue Bonds, Banner Health, Series 2019A | 4.000 | 01/01/44 | 1,770,592 | ||||||||||||||
| 3,000,000 | Phoenix Industrial Development Authority, Arizona, Lease Revenue Bonds, Mayo/Brooks Rehabilitation Facility Project, Series 2024A | 5.000 | 10/31/44 | 3,036,785 | ||||||||||||||
| 2,250,000 | Pima County Industrial Development Authority, Arizona, Revenue Bonds, Tucson Medical Center, Series 2021A | 3.000 | 04/01/51 | 1,453,572 | ||||||||||||||
| 1,025,000 | Yavapai County Industrial Development Authority, Arizona, Hospital Revenue Bonds, Yavapai Regional Medical Center, Refunding Series 2016 | 5.000 | 08/01/36 | 1,033,057 | ||||||||||||||
| 815,000 | Yavapai County Industrial Development Authority, Arizona, Hospital Revenue Bonds, Yavapai Regional Medical Center, Series 2019 | 5.000 | 08/01/39 | 832,250 | ||||||||||||||
| 650,000 | Yavapai County Industrial Development Authority, Arizona, Hospital Revenue Bonds, Yavapai Regional Medical Center, Series 2019 | 4.000 | 08/01/43 | 570,651 | ||||||||||||||
| See Notes to Financial Statements |
39 |
Portfolio of Investments August 31, 2025 (continued)
NAZ
| PRINCIPAL | DESCRIPTION | RATE | MATURITY | VALUE | ||||||||||||||
| |
|
|||||||||||||||||
| HEALTH CARE (continued) | ||||||||||||||||||
| $ | 2,125,000 | Yuma Industrial Development Authority, Arizona, Hospital Revenue Bonds, Yuma Regional Medical Center, Series 2024A | 5.250% | 08/01/49 | $ | 2,155,397 | ||||||||||||
| 500,000 | Yuma Industrial Development Authority, Arizona, Hospital Revenue Bonds, Yuma Regional Medical Center, Series 2024A | 4.000 | 08/01/54 | 418,699 | ||||||||||||||
| 1,325,000 | Yuma Industrial Development Authority, Arizona, Hospital Revenue Bonds, Yuma Regional Medical Center, Series 2024A | 5.250 | 08/01/54 | 1,333,504 | ||||||||||||||
| |
|
|||||||||||||||||
| TOTAL HEALTH CARE | 26,758,376 | |||||||||||||||||
| |
||||||||||||||||||
| HOUSING/MULTIFAMILY - 1.8% (1.1% of Total Investments) | ||||||||||||||||||
| 1,830,000 | Arizona Industrial Development Authority, Student Housing Revenue Bonds, Provident Group - NCCU Properties LLC - North Carolina Central University, Series 2019A - BAM Insured | 5.000 | 06/01/49 | 1,808,815 | ||||||||||||||
| 250,000 | (b),(d) | Sierra Vista Industrial Development Authority, Arizona, Economic Development Revenue Bonds, Convertible Capital Appreciation Revenue Bonds, Series 2021A | 0.000 | 10/01/56 | 193,093 | |||||||||||||
| 500,000 | Sierra Vista Industrial Development Authority, Arizona, Economic Development Revenue Bonds, Convertible Capital Appreciation Revenue Bonds, Series 2022A | 7.000 | 10/01/56 | 481,844 | ||||||||||||||
| |
|
|||||||||||||||||
| TOTAL HOUSING/MULTIFAMILY | 2,483,752 | |||||||||||||||||
| |
||||||||||||||||||
| HOUSING/SINGLE FAMILY - 3.9% (2.4% of Total Investments) | ||||||||||||||||||
| 940,000 | Maricopa County and Phoenix City Industrial Development Authority, Arizona, Single Family Mortgage Revenue Bonds, Series 2023A | 5.450 | 09/01/48 | 939,320 | ||||||||||||||
| 815,000 | Maricopa County and Phoenix City Industrial Development Authority, Arizona, Single Family Mortgage Revenue Bonds, Series 2024A | 4.650 | 09/01/54 | 768,068 | ||||||||||||||
| 1,855,000 | Maricopa County and Phoenix City Industrial Development Authority, Arizona, Single Family Mortgage Revenue Bonds, Series 2024C | 4.850 | 09/01/54 | 1,793,503 | ||||||||||||||
| 735,000 | Tucson and Pima County Industrial Development Authority, Arizona, Joint Single Family Mortgage Revenue Bonds, Series 2023A | 4.850 | 07/01/48 | 719,971 | ||||||||||||||
| 1,090,000 | Tucson and Pima County Industrial Development Authority, Arizona, Joint Single Family Mortgage Revenue Bonds, Series 2024A | 4.800 | 07/01/54 | 1,045,695 | ||||||||||||||
| |
|
|||||||||||||||||
| TOTAL HOUSING/SINGLE FAMILY | 5,266,557 | |||||||||||||||||
| |
||||||||||||||||||
| INFORMATION TECHNOLOGY - 0.3% (0.2% of Total Investments) | ||||||||||||||||||
| 410,000 | Chandler Industrial Development Authority, Arizona, Industrial Development Revenue Bonds, Intel Corporation Project, Series 2007, (AMT), (Mandatory Put 6/15/28) | 4.100 | 12/01/37 | 413,713 | ||||||||||||||
| |
|
|||||||||||||||||
| TOTAL INFORMATION TECHNOLOGY | 413,713 | |||||||||||||||||
| |
||||||||||||||||||
| LONG-TERM CARE - 3.5% (2.2% of Total Investments) | ||||||||||||||||||
| 585,000 | Arizona Industrial Development Authority, Multifamily Housing Revenue Bonds, Bridgewater Avondale Project, Series 2017 | 5.375 | 01/01/38 | 458,463 | ||||||||||||||
| 1,000,000 | Glendale Industrial Development Authority, Arizona, Senior Living Revenue Bonds, Royal Oaks Royal Oaks - Inspirata Pointe Project, Series 2020A | 5.000 | 05/15/41 | 921,170 | ||||||||||||||
| 1,760,000 | Phoenix Industrial Development Authority, Arizona, Multi-Family Housing Revenue Bonds, 3rd and Indian Road Assisted Living Project, Series 2016 | 5.400 | 10/01/36 | 1,373,476 | ||||||||||||||
| 1,435,000 | Tempe Industrial Development Authority, Arizona, Revenue Bonds, Friendship Village of Tempe Project, Refunding Series 2021A | 4.000 | 12/01/38 | 1,297,068 | ||||||||||||||
| 1,080,000 | (b) | Tempe Industrial Development Authority, Arizona, Revenue Bonds, Mirabella at ASU Project, Series 2017A | 6.125 | 10/01/47 | 702,422 | |||||||||||||
| |
|
|||||||||||||||||
| TOTAL LONG-TERM CARE | 4,752,599 | |||||||||||||||||
| |
||||||||||||||||||
| TAX OBLIGATION/GENERAL - 21.8% (13.4% of Total Investments) | ||||||||||||||||||
| 575,000 | Buckeye Union High School District 201, Maricopa County, Arizona, General Obligation Bonds, School Improvement Project, Refunding Series 2017 - BAM Insured | 5.000 | 07/01/35 | 593,195 | ||||||||||||||
| 1,215,000 | Buckeye, Arizona, General Obligation Bonds, Series 2025 | 5.250 | 07/01/50 | 1,259,969 | ||||||||||||||
| 665,000 | Glendale, Arizona, General Obligation Bonds, Series 2024 | 5.000 | 07/01/44 | 695,402 | ||||||||||||||
| 2,105,000 | Golder Ranch Fire District, Pima and Pinal Counties, Arizona, General Obligation Bonds, Series 2021 | 4.000 | 07/01/45 | 1,888,447 | ||||||||||||||
| 40 |
See Notes to Financial Statements |
| PRINCIPAL | DESCRIPTION | RATE | MATURITY | VALUE | ||||||||||||||
| |
|
|||||||||||||||||
| TAX OBLIGATION/GENERAL (continued) | ||||||||||||||||||
| $ | 1,045,000 | Maricopa County School District 14 Creighton Elementary, Arizona, General Obligation Bonds, School Improvement Series 2021C | 4.000% | 07/01/34 | $ | 1,079,591 | ||||||||||||
| 2,315,000 | Maricopa County School District 214 Tolleson Union High, Arizona, General Obligation Bonds, School Improvement Project 1990, Series 1990A | 5.000 | 07/01/38 | 2,383,907 | ||||||||||||||
| 630,000 | Maricopa County School District 214 Tolleson Union High, Arizona, General Obligation Bonds, School Improvement Project 2017, Series 2018A | 5.000 | 07/01/37 | 646,524 | ||||||||||||||
| 800,000 | Maricopa County School District 3 Tempe Elementary, Arizona, General Obligation Bonds, School Improvement, Project of 2022, Series 2025B | 5.000 | 07/01/43 | 835,459 | ||||||||||||||
| 300,000 | Maricopa County School District 3 Tempe Elementary, Arizona, General Obligation Bonds, School Improvement, Project of 2022, Series 2025B | 5.000 | 07/01/44 | 311,275 | ||||||||||||||
| 600,000 | Maricopa County School District 6, Arizona, General Obligation Bonds, Washington Elementary School Improvement Project of 2022, Series 2025B - BAM Insured | 5.000 | 07/01/44 | 618,995 | ||||||||||||||
| 1,250,000 | Maricopa County School District 66 Roosevelt Elementary, Arizona, General Obligation Bonds, School Improvement Project of 2020, Series 2024C - AGM Insured | 5.000 | 07/01/43 | 1,283,003 | ||||||||||||||
| 1,500,000 | Maricopa County Special Health Care District, Arizona, General Obligation Bonds, Series 2018C | 5.000 | 07/01/36 | 1,545,874 | ||||||||||||||
| 2,000,000 | Maricopa County Unified School District 69 Paradise Valley, Arizona, General Obligation Bonds, School Improvement Project of 2019, Series 2022D | 4.000 | 07/01/41 | 1,889,923 | ||||||||||||||
| 1,275,000 | Maricopa County Union High School District 210 Phoenix, Arizona, General Obligation Bonds, School Improvement & Project of 2011 Series 2017E | 5.000 | 07/01/33 | 1,321,568 | ||||||||||||||
| 1,295,000 | Maricopa County Union High School District 216 Agua Fria, Arizona, General Obligation Bonds, School Improvement, Project of 2023, Series 2024A | 5.000 | 07/01/43 | 1,340,388 | ||||||||||||||
| 200,000 | Maricopa County Union High School District 216 Agua Fria, Arizona, General Obligation Bonds, School Improvement, Projects of 2023 and 2024, Series 2025 | 5.000 | 07/01/44 | 207,510 | ||||||||||||||
| 1,000,000 | Mohave County Union High School District 2 Colorado River, Arizona, General Obligation Bonds, School Improvement Series 2017 | 5.000 | 07/01/34 | 1,034,894 | ||||||||||||||
| 1,000,000 | Mohave County Union High School District 2 Colorado River, Arizona, General Obligation Bonds, School Improvement Series 2017 | 5.000 | 07/01/36 | 1,029,485 | ||||||||||||||
| 690,000 | Northwest Fire District of Pima County, Arizona, General Obligation Bonds, Series 2017 | 5.000 | 07/01/36 | 707,994 | ||||||||||||||
| 1,000,000 | Phoenix, Arizona, General Obligation Bonds, Various Purpose Series 2024A | 5.000 | 07/01/45 | 1,039,110 | ||||||||||||||
| 200,000 | Pima County Unified School District 1, Tucson, Arizona, General Obligation Bonds, Project of 2023 School Improvement Series 2024A - AGM Insured | 5.000 | 07/01/43 | 207,948 | ||||||||||||||
| 750,000 | Pima County Unified School District 6 Marana, Arizona, General Obligation Bonds, School Improvement, Project of 2022, Series 2025C | 5.000 | 07/01/43 | 772,414 | ||||||||||||||
| 620,000 | Pinal County School District 4 Casa Grande Elementary, Arizona, General Obligation Bonds, School improvement Project 2016, Series 2017A - BAM Insured | 5.000 | 07/01/34 | 640,962 | ||||||||||||||
| 1,000,000 | Pinal County School District 4 Casa Grande Elementary, Arizona, General Obligation Bonds, School improvement Project 2016, Series 2017A - BAM Insured | 5.000 | 07/01/35 | 1,031,644 | ||||||||||||||
| 550,000 | Pinal County Unified School District 20 Maricopa, Arizona, General Obligation Bonds, School Improvement Project of 2024, Series 2025A - BAM Insured | 5.000 | 07/01/44 | 563,209 | ||||||||||||||
| 2,000,000 | Puerto Rico, General Obligation Bonds, Restructured Series 2022A‑1 | 4.000 | 07/01/46 | 1,652,983 | ||||||||||||||
| 500,000 | Tempe Union High School District 213, Maricopa County, Arizona, General Obligation Bonds, School Improvement Project of 2022, Series 2025B | 5.000 | 07/01/43 | 521,214 | ||||||||||||||
| See Notes to Financial Statements |
41 |
Portfolio of Investments August 31, 2025 (continued)
NAZ
| PRINCIPAL | DESCRIPTION | RATE | MATURITY | VALUE | ||||||||||||||
| |
|
|||||||||||||||||
| TAX OBLIGATION/GENERAL (continued) | ||||||||||||||||||
| $ | 1,025,000 | Tempe, Arizona, General Obligation Bonds, Refunding Series 2024 | 5.000% | 07/01/44 | $ | 1,066,525 | ||||||||||||
| 950,000 | Tempe, Arizona, General Obligation Bonds, Series 2021 | 5.000 | 07/01/39 | 1,002,739 | ||||||||||||||
| 105,000 | Western Maricopa Education Center District 402, Maricopa County, Arizona, General Obligation Bonds, School Improvement Project 2012, Series2014B | 4.500 | 07/01/33 | 105,095 | ||||||||||||||
| |
|
|||||||||||||||||
| TOTAL TAX OBLIGATION/GENERAL | 29,277,246 | |||||||||||||||||
| |
||||||||||||||||||
| TAX OBLIGATION/LIMITED - 38.4% (23.7% of Total Investments) | ||||||||||||||||||
| 100,000 | (b) | Arizona Industrial Development Authority, Arizona, Economic Development Revenue Bonds, Linder Village Project in Meridian, Ada County, Idaho, Series 2020 | 5.000 | 06/01/31 | 100,692 | |||||||||||||
| 1,250,000 | Arizona State Transportation Board, Highway Revenue Bonds, Refunding Series 2016 | 5.000 | 07/01/35 | 1,266,604 | ||||||||||||||
| 275,000 | Buckeye, Arizona, Excise Tax Revenue Obligations, Refunding Series 2016 | 4.000 | 07/01/36 | 274,612 | ||||||||||||||
| 1,000,000 | Buckeye, Arizona, Excise Tax Revenue Obligations, Refunding Series 2025 | 4.500 | 07/01/43 | 976,329 | ||||||||||||||
| 1,215,000 | Cadence Community Facilities District, Mesa, Arizona, Special Assessment Revenue Bonds, Assessment District 3, Series 2020 | 4.000 | 07/01/45 | 970,188 | ||||||||||||||
| 122,853 | (b),(c) | Cahava Springs Revitalization District, Cave Creek, Arizona, Special Assessment Bonds, Series 2017A | 7.000 | 07/01/41 | 85,997 | |||||||||||||
| 1,210,000 | (b) | Eastmark Community Facilities District 1, Mesa, Arizona, General Obligation Bonds, Series 2015 | 5.000 | 07/15/39 | 1,147,297 | |||||||||||||
| 1,810,000 | Eastmark Community Facilities District 1, Mesa, Arizona, General Obligation Bonds, Series 2017 - AGM Insured | 5.000 | 07/15/42 | 1,828,432 | ||||||||||||||
| 2,445,000 | Eastmark Community Facilities District 1, Mesa, Arizona, General Obligation Bonds, Series 2018 - BAM Insured | 4.375 | 07/15/43 | 2,314,394 | ||||||||||||||
| 650,000 | Eastmark Community Facilities District 1, Mesa, Arizona, General Obligation Bonds, Series 2021 - BAM Insured | 4.000 | 07/15/41 | 597,553 | ||||||||||||||
| 484,000 | Eastmark Community Facilities District 1, Mesa, Arizona, Special Assessment Revenue Bonds, Assessment District 1, Series 2013 | 5.250 | 07/01/38 | 464,860 | ||||||||||||||
| 696,000 | Eastmark Community Facilities District 1, Mesa, Arizona, Special Assessment Revenue Bonds, Assessment District 1, Series 2019 | 5.200 | 07/01/43 | 617,203 | ||||||||||||||
| 2,279,000 | Eastmark Community Facilities District 1, Mesa, Arizona, Special Assessment Revenue Bonds, Assessment District 12, Series 2021 | 3.750 | 07/01/45 | 1,650,745 | ||||||||||||||
| 1,035,000 | Eastmark Community Facilities District 2, Mesa, Arizona, General Obligation Bonds, Series 2020 | 3.500 | 07/15/44 | 706,175 | ||||||||||||||
| 105,000 | Estrella Mountain Ranch Community Facilities District, Goodyear, Arizona, General Obligation Bonds, Refunding Series 2017 —AGM Insured | 5.000 | 07/15/32 | 108,878 | ||||||||||||||
| 1,145,000 | Estrella Mountain Ranch Community Facilities District, Goodyear, Arizona, Special Assessment Revenue Bonds, Lucero Assessment District 2, Series 2023 | 5.750 | 07/01/46 | 1,094,520 | ||||||||||||||
| 370,000 | Festival Ranch Community Facilities District, Buckeye, Arizona, General Obligation Bonds, Series 2016 - BAM Insured | 4.000 | 07/15/36 | 364,450 | ||||||||||||||
| 1,000,000 | Festival Ranch Community Facilities District, Buckeye, Arizona, General Obligation Bonds, Series 2017 - BAM Insured | 5.000 | 07/15/37 | 1,011,530 | ||||||||||||||
| 590,000 | Festival Ranch Community Facilities District, Buckeye, Arizona, General Obligation Bonds, Series 2018 - BAM Insured | 5.000 | 07/15/38 | 595,595 | ||||||||||||||
| 1,000,000 | Festival Ranch Community Facilities District, Buckeye, Arizona, General Obligation Bonds, Series 2020 - BAM Insured | 4.000 | 07/15/40 | 926,012 | ||||||||||||||
| 1,000,000 | Festival Ranch Community Facilities District, Buckeye, Arizona, General Obligation Bonds, Series 2022 - AGM Insured | 5.000 | 07/15/42 | 997,156 | ||||||||||||||
| 308,000 | Festival Ranch Community Facilities District, Buckeye, Arizona, Special Assessment Revenue Bonds, Assessment District 11, Series 2017 | 5.200 | 07/01/37 | 287,947 | ||||||||||||||
| 1,469,000 | Floreo at Teravalis Community Facilities District, Arizona, Special Assessment Revenue Bonds, District 1 Series 2025 | 5.750 | 07/01/40 | 1,474,512 | ||||||||||||||
| 545,000 | Goodyear Community Facilities Utilities District 1, Arizona, General Obligation Bonds, Refunding Series 2016 | 4.000 | 07/15/32 | 548,829 | ||||||||||||||
| 1,500,000 | Government of Guam, Business Privilege Tax Bonds, Refunding Series 2015D | 5.000 | 11/15/39 | 1,507,411 | ||||||||||||||
| 1,250,000 | Guam Government, Limited Obligation Section 30 Revenue Bonds, Series 2016A | 5.000 | 12/01/46 | 1,227,987 | ||||||||||||||
| 42 |
See Notes to Financial Statements |
| PRINCIPAL | DESCRIPTION | RATE | MATURITY | VALUE | ||||||||||||||
| |
|
|||||||||||||||||
| TAX OBLIGATION/LIMITED (continued) | ||||||||||||||||||
| $ | 615,000 | Matching Fund Special Purpose Securitization Corporation, Virgin Islands, Revenue Bonds, Series 2022A | 5.000% | 10/01/39 | $ | 612,766 | ||||||||||||
| 200,000 | Merrill Ranch Community Facilities District 2, Florence, Arizona, General Obligation Bonds, Series 2016 | 5.000 | 07/15/31 | 202,805 | ||||||||||||||
| 385,000 | Merrill Ranch Community Facilities District 2, Florence, Arizona, General Obligation Bonds, Series 2017 - BAM Insured | 5.000 | 07/15/42 | 386,247 | ||||||||||||||
| 400,000 | Parkway Community Facilities District 1, Prescott Valley, Arizona, General Obligation Bonds, Series 2006 | 5.350 | 07/15/31 | 400,033 | ||||||||||||||
| 1,625,000 | Phoenix Civic Improvement Corporation, Arizona, Excise Tax Revenue Bonds, Subordinate Lien Series 2020A | 4.000 | 07/01/45 | 1,498,403 | ||||||||||||||
| 580,000 | Phoenix Mesa Gateway Airport Authority, Arizona, Special Facility Revenue Bonds, Mesa Project, Series 2012, (AMT) | 5.000 | 07/01/38 | 580,061 | ||||||||||||||
| 1,500,000 | Pinal County, Arizona, Pledged Revenue Obligations, Series 2019 | 4.000 | 08/01/38 | 1,478,529 | ||||||||||||||
| 6,908,000 | Puerto Rico Sales Tax Financing Corporation, Sales Tax Revenue Bonds, Restructured 2018A‑1 | 0.000 | 07/01/46 | 2,183,325 | ||||||||||||||
| 915,000 | Puerto Rico Sales Tax Financing Corporation, Sales Tax Revenue Bonds, Restructured 2018A‑1 | 5.000 | 07/01/58 | 839,291 | ||||||||||||||
| 2,440,000 | Puerto Rico Sales Tax Financing Corporation, Sales Tax Revenue Bonds, Taxable Restructured Cofina Project Series 2019A‑2 | 4.784 | 07/01/58 | 2,155,559 | ||||||||||||||
| 390,000 | Queen Creek, Arizona, Excise Tax & State Shared Revenue Obligation Bonds, Refunding Series 2016 | 4.000 | 08/01/34 | 391,926 | ||||||||||||||
| 395,000 | Queen Creek, Arizona, Excise Tax & State Shared Revenue Obligation Bonds, Refunding Series 2016 | 4.000 | 08/01/36 | 395,340 | ||||||||||||||
| 2,500,000 | Queen Creek, Arizona, Excise Tax & State Shared Revenue Obligation Bonds, Series 2020 | 4.000 | 08/01/45 | 2,240,710 | ||||||||||||||
| 2,000,000 | Queen Creek, Arizona, Excise Tax and State Shared Revenue Obligation Bonds, Series 2024 | 5.000 | 08/01/49 | 2,031,546 | ||||||||||||||
| 1,000,000 | Queen Creek, Arizona, Excise Tax and State Shared Revenue Obligation Bonds, Series 2024 | 5.000 | 08/01/54 | 1,007,869 | ||||||||||||||
| 280,000 | Sedona, Arizona, Excise Tax Revenue Bonds, Series 2024 - AGM Insured | 5.000 | 07/01/54 | 280,893 | ||||||||||||||
| 1,650,000 | Sundance Community Facilities District, Buckeye, Arizona, General Obligation Bonds, Refunding Series 2018 - BAM Insured | 5.000 | 07/15/39 | 1,687,117 | ||||||||||||||
| 347,000 | Superstition Vistas Community Facilities District 1, Apache Junction, Arizona, Special Assessment Bonds, Assessment Area 3, Series 2024 | 5.800 | 07/01/48 | 331,324 | ||||||||||||||
| 694,000 | Superstition Vistas Community Facilities District 1, Apache Junction, Arizona, Special Assessment Revenue Bonds, Series 2023 | 6.000 | 07/01/47 | 692,163 | ||||||||||||||
| 235,000 | Superstition Vistas Community Facilities District 2, Arizona, Special Assessment Bonds, Assessment Area 2, Series 2025 | 5.700 | 07/01/40 | 235,708 | ||||||||||||||
| 750,000 | Tartesso West Community Facility District, Buckeye, Arizona, General Obligation Bonds, Series 2024 | 4.000 | 07/15/47 | 659,683 | ||||||||||||||
| 2,500,000 | Town of Queen Creek, Arizona, Excise Tax and State Shared Revenue Obligation Bonds, Series 2022 | 5.000 | 08/01/47 | 2,540,213 | ||||||||||||||
| 500,000 | Verrado District 1 Community Facilities District, Buckeye, Arizona, General Obligation Bonds, Series 2023 - BAM Insured | 4.125 | 07/15/41 | 470,534 | ||||||||||||||
| 405,000 | Vistancia North Community Facilities District, Peoria, Arizona, General Obligation Bonds, Series 2024 - AGM Insured | 4.375 | 07/15/49 | 364,141 | ||||||||||||||
| 3,965,000 | Yavapai County Jail District, Arizona, Pledged Revenue Obligation Bonds, Series 2020 - BAM Insured | 4.000 | 07/01/40 | 3,693,403 | ||||||||||||||
| 1,160,000 | Yuma County, Arizona, Pledge Revenue Obligations, Series 2022 - BAM Insured |
4.250 | 07/15/42 | 1,107,957 | ||||||||||||||
| |
|
|||||||||||||||||
| TOTAL TAX OBLIGATION/LIMITED | 51,613,454 | |||||||||||||||||
| |
||||||||||||||||||
| TRANSPORTATION - 6.8% (4.2% of Total Investments) | ||||||||||||||||||
| 2,000,000 | Phoenix Civic Improvement Corporation, Arizona, Airport Revenue Bonds, Junior Lien Series 2019B, (AMT) | 5.000 | 07/01/49 | 1,967,028 | ||||||||||||||
| 1,550,000 | Phoenix Civic Improvement Corporation, Arizona, Airport Revenue Bonds, Refunding Junior Lien Series 2025 | 5.000 | 07/01/45 | 1,589,920 | ||||||||||||||
| 1,000,000 | Phoenix Civic Improvement Corporation, Arizona, Airport Revenue Bonds, Senior Lien Series 2017A, (AMT) | 5.000 | 07/01/37 | 1,009,751 | ||||||||||||||
| 1,000,000 | Phoenix Civic Improvement Corporation, Arizona, Airport Revenue Bonds, Senior Lien Series 2017A, (AMT) | 5.000 | 07/01/42 | 1,000,106 | ||||||||||||||
| See Notes to Financial Statements |
43 |
Portfolio of Investments August 31, 2025 (continued)
NAZ
| PRINCIPAL | DESCRIPTION | RATE | MATURITY | VALUE | ||||||||||||||
| |
|
|||||||||||||||||
| TRANSPORTATION (continued) | ||||||||||||||||||
| $ | 1,500,000 | Phoenix Civic Improvement Corporation, Arizona, Airport Revenue Bonds, Senior Lien Series 2018, (AMT) | 5.000% | 07/01/43 | $ | 1,486,284 | ||||||||||||
| 1,045,000 | Phoenix Civic Improvement Corporation, Arizona, Rental Car Facility Charge Revenue Bonds, Series 2019A | 5.000 | 07/01/35 | 1,093,349 | ||||||||||||||
| 1,000,000 | Phoenix Civic Improvement Corporation, Arizona, Rental Car Facility Charge Revenue Bonds, Series 2019A | 5.000 | 07/01/38 | 1,027,826 | ||||||||||||||
| |
|
|||||||||||||||||
| TOTAL TRANSPORTATION | 9,174,264 | |||||||||||||||||
| |
||||||||||||||||||
| U.S. GUARANTEED - 1.7% (e)(1.1% of Total Investments) | ||||||||||||||||||
| 550,000 | Estrella Mountain Ranch Community Facilities District, Goodyear, Arizona, General Obligation Bonds, Refunding Series 2017, (Pre-refunded 7/15/27) - AGM Insured | 5.000 | 07/15/32 | 576,916 | ||||||||||||||
| 55,000 | Goodyear Community Facilities Utilities District 1, Arizona, General Obligation Bonds, Refunding Series 2016, (Pre‑refunded 7/15/26) | 4.000 | 07/15/32 | 55,696 | ||||||||||||||
| 150,000 | Queen Creek, Arizona, Excise Tax & State Shared Revenue Obligation Bonds, Refunding Series 2016, (Pre‑refunded 8/01/26) | 4.000 | 08/01/34 | 151,735 | ||||||||||||||
| 150,000 | Queen Creek, Arizona, Excise Tax & State Shared Revenue Obligation Bonds, Refunding Series 2016, (Pre‑refunded 8/01/26) | 4.000 | 08/01/36 | 151,736 | ||||||||||||||
| 1,320,000 | Scottsdale Municipal Property Corporation, Arizona, Excise Tax Revenue Bonds, Refunding Series 2017, (Pre‑refunded 7/01/27) | 5.000 | 07/01/36 | 1,384,492 | ||||||||||||||
| |
|
|||||||||||||||||
| TOTAL U.S. GUARANTEED | 2,320,575 | |||||||||||||||||
| |
||||||||||||||||||
| UTILITIES - 33.1% (20.4% of Total Investments) | ||||||||||||||||||
| 30,000 | Carefree Utilities Community Facilities District, Arizona, Water System Revenue Bonds, Series 2021 | 4.000 | 07/01/41 | 28,140 | ||||||||||||||
| 650,000 | Carefree Utilities Community Facilities District, Arizona, Water System Revenue Bonds, Series 2021 | 4.000 | 07/01/46 | 564,178 | ||||||||||||||
| 655,000 | Central Arizona Water Conservation District, Arizona, Water Delivery O&M Revenue Bonds, Series 2016 | 5.000 | 01/01/36 | 658,301 | ||||||||||||||
| 2,615,000 | City of Mesa, Arizona, Utility System Revenue Bonds, Series 2022C | 5.000 | 07/01/36 | 2,931,118 | ||||||||||||||
| 1,250,000 | Gilbert Water Resource Municipal Property Corporation, Arizona, Utility System Revenue Bonds, Senior Lien Green Series 2022 | 4.000 | 07/15/47 | 1,133,715 | ||||||||||||||
| 1,000,000 | Glendale, Arizona, Water and Sewer Revenue Bonds, Refunding Senior Lien Series 2025 | 5.000 | 07/01/45 | 1,031,327 | ||||||||||||||
| 785,000 | Goodyear, Arizona, Water and Sewer Revenue Obligations, Refunding Subordinate Lien Series 2016 - AGM Insured | 5.000 | 07/01/45 | 786,534 | ||||||||||||||
| 875,000 | Goodyear, Arizona, Water and Sewer Revenue Obligations, Subordinate Lien Series 2020 - AGM Insured | 4.000 | 07/01/49 | 752,987 | ||||||||||||||
| 1,825,000 | Goodyear, Arizona, Water and Sewer Revenue Obligations, Subordinate Lien Series 2025 | 5.000 | 07/01/43 | 1,894,098 | ||||||||||||||
| 200,000 | Guam Power Authority, Revenue Bonds, Refunding Series 2024A | 5.000 | 10/01/42 | 201,902 | ||||||||||||||
| 1,700,000 | Mesa, Arizona, Utility System Revenue Bonds, Series 2018 | 5.000 | 07/01/42 | 1,717,766 | ||||||||||||||
| 1,205,000 | Mesa, Arizona, Utility System Revenue Bonds, Series 2022A - BAM Insured | 5.000 | 07/01/46 | 1,219,160 | ||||||||||||||
| 500,000 | Mesa, Arizona, Utility System Revenue Bonds, Series 2025 | 4.500 | 07/01/49 | 473,536 | ||||||||||||||
| 1,840,000 | Phoenix Civic Improvement Corporation, Arizona, Wastewater System Revenue Bonds, Junior Lien Series 2023 | 5.250 | 07/01/47 | 1,922,560 | ||||||||||||||
| 1,135,000 | Phoenix Civic Improvement Corporation, Arizona, Wastewater System Revenue Bonds, Refunding Junior Lien Series 2014 | 5.000 | 07/01/29 | 1,136,723 | ||||||||||||||
| 1,000,000 | Phoenix Civic Improvement Corporation, Arizona, Water System Revenue Bonds, Junior Lien Series 2021A | 4.000 | 07/01/42 | 963,165 | ||||||||||||||
| 750,000 | (b) | Puerto Rico Aqueduct and Sewerage Authority, Revenue Bonds, Refunding Senior Lien Series 2020A | 5.000 | 07/01/47 | 701,613 | |||||||||||||
| 1,000,000 | (b) | Puerto Rico Aqueduct and Sewerage Authority, Revenue Bonds, Refunding Senior Lien Series 2021B | 5.000 | 07/01/37 | 1,026,654 | |||||||||||||
| 2,500,000 | Salt River Project Agricultural Improvement and Power District, Arizona, Electric System Revenue Bonds, Series 2023A | 5.000 | 01/01/47 | 2,553,136 | ||||||||||||||
| 4,000,000 | Salt River Project Agricultural Improvement and Power District, Arizona, Electric System Revenue Bonds, Series 2023A | 5.000 | 01/01/50 | 4,069,009 | ||||||||||||||
| 1,155,000 | Salt River Project Agricultural Improvement and Power District, Arizona, Electric System Revenue Bonds, Series 2023B | 5.000 | 01/01/48 | 1,183,615 | ||||||||||||||
| 44 |
See Notes to Financial Statements |
| PRINCIPAL | DESCRIPTION | RATE | MATURITY | VALUE | ||||||||||||||
| |
|
|||||||||||||||||
| UTILITIES (continued) | ||||||||||||||||||
| $ | 3,000,000 | Salt River Project Agricultural Improvement and Power District, Arizona, Electric System Revenue Bonds, Series 2024A | 5.000% | 01/01/49 | $ | 3,076,273 | ||||||||||||
| 4,500,000 | Salt Verde Financial Corporation, Arizona, Senior Gas Revenue Bonds, Citigroup Energy Inc Prepay Contract Obligations, Series 2007 | 5.500 | 12/01/29 | 4,858,393 | ||||||||||||||
| 5,665,000 | Salt Verde Financial Corporation, Arizona, Senior Gas Revenue Bonds, Citigroup Energy Inc Prepay Contract Obligations, Series 2007 | 5.000 | 12/01/37 | 5,926,307 | ||||||||||||||
| 805,000 | Surprise, Arizona, Utility System Revenue Bonds, Refunding Senior Lien Series 2018 | 5.000 | 07/01/36 | 830,055 | ||||||||||||||
| 3,000,000 | Yuma, Arizona, Utilities System Revenue Bonds, Green Series 2021 - BAM Insured |
4.000 | 07/01/40 | 2,910,496 | ||||||||||||||
| |
|
|||||||||||||||||
| TOTAL UTILITIES | 44,550,761 | |||||||||||||||||
| |
||||||||||||||||||
| TOTAL MUNICIPAL BONDS (Cost $229,492,535) |
218,032,750 | |||||||||||||||||
| |
||||||||||||||||||
| TOTAL LONG-TERM INVESTMENTS (Cost $229,492,535) |
218,032,750 | |||||||||||||||||
| |
||||||||||||||||||
| AMTP SHARES, NET - (65.6)% (f) | (88,271,752) | |||||||||||||||||
| |
||||||||||||||||||
| OTHER ASSETS & LIABILITIES, NET - 3.6% | 4,819,898 | |||||||||||||||||
| |
||||||||||||||||||
| NET ASSETS APPLICABLE TO COMMON SHARES - 100% | $ | 134,580,896 | ||||||||||||||||
| |
||||||||||||||||||
All percentages shown in the Portfolio of Investments are based on net assets applicable to common shares unless otherwise noted.
| AMT | Alternative Minimum Tax | |
| (a) | When-issued or delayed delivery security. | |
| (b) | Security is exempt from registration under Rule 144A of the Securities Act of 1933, as amended. These securities are deemed liquid and may be resold in transactions exempt from registration, which are normally those transactions with qualified institutional buyers. As of the end of the reporting period, the aggregate value of these securities is $14,311,231 or 6.6% of Total Investments. | |
| (c) | Defaulted security. A security whose issuer has failed to fully pay principal and/or interest when due, or is under the protection of bankruptcy. | |
| (d) | Step‑up coupon bond, a bond with a coupon that increases (“steps up”), usually at regular intervals, while the bond is outstanding. The rate shown is the coupon as of the end of the reporting period. | |
| (e) | Backed by an escrow or trust containing sufficient U.S. Government or U.S. Government agency securities, which ensure the timely payment of principal and interest. | |
| (f) | AMTP Shares, Net as a percentage of Total Investments is 40.5%. | |
| See Notes to Financial Statements |
45 |
Portfolio of Investments August 31, 2025
NKX
| PRINCIPAL | DESCRIPTION | RATE | MATURITY | VALUE | ||||||||||||||
| |
|
|||||||||||||||||
| LONG-TERM INVESTMENTS - 172.4% (98.4% of Total Investments) | ||||||||||||||||||
| MUNICIPAL BONDS - 172.4% (98.4% of Total Investments) | ||||||||||||||||||
| CONSUMER STAPLES - 0.0% (0.0% of Total Investments) | ||||||||||||||||||
| $ | 235,000 | California County Tobacco Securitization Agency, Tobacco Settlement Asset-Backed Bonds, Los Angeles County Securitization Corporation, Series 2020A | 4.000% | 06/01/49 | $ | 193,435 | ||||||||||||
| |
|
|||||||||||||||||
| TOTAL CONSUMER STAPLES | 193,435 | |||||||||||||||||
| |
||||||||||||||||||
| EDUCATION AND CIVIC ORGANIZATIONS - 10.5% (6.0% of Total Investments) | ||||||||||||||||||
| 1,515,000 | California Educational Facilities Authority, Revenue Bonds, University of the Pacific, Series 2023 | 5.000 | 11/01/53 | 1,535,311 | ||||||||||||||
| 700,000 | (a) | California Enterprise Development Authority, Charter School Revenue Bonds, Academy for Academic Excellence Project, Series 2020A | 5.000 | 07/01/50 | 620,919 | |||||||||||||
| 500,000 | (a) | California Enterprise Development Authority, Charter School Revenue Bonds, Norton Science & Language Academy Project, Series 2021 | 4.000 | 07/01/61 | 347,285 | |||||||||||||
| 6,760,000 | California Infrastructure and Economic Development Bank, Revenue Bonds, Los Angeles County Museum of Natural History Foundation, Series 2020 | 4.000 | 07/01/50 | 5,886,380 | ||||||||||||||
| 455,000 | (a) | California Municipal Finance Authority Charter School Revenue Bonds, River Charter Schools Project, Series 2018A | 5.500 | 06/01/53 | 409,372 | |||||||||||||
| 3,300,000 | California Municipal Finance Authority, Academic Facilities Revenue Bonds, Scripps College Series 2025 | 5.000 | 07/01/55 | 3,224,766 | ||||||||||||||
| 1,000,000 | (a) | California Municipal Finance Authority, Charter School Revenue Bonds, John Adams Academies, Inc. - Lincoln Project, Taxable Series 2019B | 5.000 | 10/01/39 | 949,896 | |||||||||||||
| 995,000 | (a) | California Municipal Finance Authority, Charter School Revenue Bonds, Palmdale Aerospace Academy Project, Series 2016A | 5.000 | 07/01/46 | 873,549 | |||||||||||||
| 1,560,000 | (a) | California Municipal Finance Authority, Revenue Bonds, Goodwill Industries of Sacramento Valley & Northern Nevada Project, Series 2012A | 6.875 | 01/01/42 | 1,445,706 | |||||||||||||
| 1,000,000 | California Municipal Finance Authority, Revenue Bonds, The Master’s University & Seminary, Series 2019 | 5.000 | 08/01/48 | 923,625 | ||||||||||||||
| 1,100,000 | (a) | California School Finance Authority, Charter School Revenue Bonds, Arts in Action Charter Schools - Obligated Group, Series 2020A | 5.000 | 06/01/59 | 850,981 | |||||||||||||
| 250,000 | (a) | California School Finance Authority, Charter School Revenue Bonds, Aspire Public School - Obligated Group, Issue No.6, Series 2020A | 5.000 | 08/01/42 | 237,397 | |||||||||||||
| 1,000,000 | (a) | California School Finance Authority, Charter School Revenue Bonds, Camino Nuevo Charter Academy Sustainability Series 2023A | 5.000 | 06/01/43 | 950,457 | |||||||||||||
| 415,000 | (a) | California School Finance Authority, Charter School Revenue Bonds, Lifeline Education Charter School Project, Series 2020A | 5.000 | 07/01/55 | 369,291 | |||||||||||||
| 600,000 | (a) | California School Finance Authority, Charter School Revenue Bonds, Social Bonds - iLead Lancaster Project, Series 2021A | 5.000 | 06/01/51 | 501,155 | |||||||||||||
| 555,000 | (a) | California School Finance Authority, Charter School Revenue Bonds, Stem Preparatory Schools - Obligated Group, Series 2023A | 5.125 | 06/01/53 | 510,113 | |||||||||||||
| 635,000 | (a) | California School Finance Authority, School Facility Revenue Bonds, Alliance for College-Ready Public Schools Project, Series 2015A | 5.000 | 07/01/45 | 623,248 | |||||||||||||
| 750,000 | (a) | California School Finance Authority, School Facility Revenue Bonds, Alliance for College-Ready Public Schools Project, Series 2016A | 5.000 | 07/01/46 | 730,467 | |||||||||||||
| 4,925,000 | (a) | California School Finance Authority, School Facility Revenue Bonds, Alliance for College-Ready Public Schools Project, Series 2016C | 5.000 | 07/01/46 | 4,827,402 | |||||||||||||
| 1,000,000 | (a) | California School Finance Authority, School Facility Revenue Bonds, Granada Hills Charter High School Obligated Group, Series 2019 | 5.000 | 07/01/43 | 969,188 | |||||||||||||
| 280,000 | (a) | California School Finance Authority, School Facility Revenue Bonds, Value Schools, Series 2016A | 5.750 | 07/01/41 | 281,408 | |||||||||||||
| 46 |
See Notes to Financial Statements |
| PRINCIPAL | DESCRIPTION | RATE | MATURITY | VALUE | ||||||||||||||
| |
|
|||||||||||||||||
| EDUCATION AND CIVIC ORGANIZATIONS (continued) | ||||||||||||||||||
| $ | 7,710,000 | California State University, Systemwide Revenue Bonds, Series 2017A | 5.000% | 11/01/47 | $ | 7,735,351 | ||||||||||||
| 5,500,000 | California State University, Systemwide Revenue Bonds, Series 2024A | 4.000 | 11/01/49 | 4,851,702 | ||||||||||||||
| 1,115,000 | California State University, Systemwide Revenue Bonds, Series 2024A | 4.000 | 11/01/55 | 957,265 | ||||||||||||||
| 10,000,000 | University of California, General Revenue Bonds, Limited Project Series 2018O | 5.000 | 05/15/43 | 10,141,014 | ||||||||||||||
| 9,425,000 | University of California, General Revenue Bonds, Series 2025CC | 5.000 | 05/15/53 | 9,643,661 | ||||||||||||||
| |
|
|||||||||||||||||
| TOTAL EDUCATION AND CIVIC ORGANIZATIONS | 60,396,909 | |||||||||||||||||
| |
||||||||||||||||||
| HEALTH CARE - 32.7% (18.6% of Total Investments) | ||||||||||||||||||
| 15,875,000 | California Health Facilities Financing Authority, California, Revenue Bonds, Sutter Health, Refunding Series 2016B | 5.000 | 11/15/46 | 15,889,848 | ||||||||||||||
| 10,000,000 | California Health Facilities Financing Authority, California, Revenue Bonds, Sutter Health, Refunding Series 2017A | 4.000 | 11/15/48 | 8,440,151 | ||||||||||||||
| 5,375,000 | California Health Facilities Financing Authority, Revenue Bonds, Adventist Health System/West, Refunding Series 2016A | 4.000 | 03/01/39 | 4,777,984 | ||||||||||||||
| 7,760,000 | California Health Facilities Financing Authority, Revenue Bonds, Cedars-Sinai Health System, Series 2021A | 4.000 | 08/15/48 | 6,847,815 | ||||||||||||||
| 7,900,000 | California Health Facilities Financing Authority, Revenue Bonds, Children’s Hospital Los Angeles, Series 2017A | 5.000 | 08/15/42 | 7,645,506 | ||||||||||||||
| 4,265,000 | California Health Facilities Financing Authority, Revenue Bonds, Children’s Hospital Los Angeles, Series 2017A | 5.000 | 08/15/47 | 4,042,873 | ||||||||||||||
| 2,930,000 | California Health Facilities Financing Authority, Revenue Bonds, City of Hope National Medical Center, Series 2019 | 4.000 | 11/15/45 | 2,519,187 | ||||||||||||||
| 3,390,000 | California Health Facilities Financing Authority, Revenue Bonds, CommonSpirit Health, Series 2020A | 4.000 | 04/01/44 | 3,026,117 | ||||||||||||||
| 7,500,000 | California Health Facilities Financing Authority, Revenue Bonds, Lucile Salter Packard Children’s Hospital at Stanford, Refunding Forward Delivery Series 2022A | 4.000 | 05/15/46 | 6,560,847 | ||||||||||||||
| 5,235,000 | California Health Facilities Financing Authority, Revenue Bonds, Lucile Salter Packard Children’s Hospital at Stanford, Refunding Forward Delivery Series 2022A | 4.000 | 05/15/51 | 4,413,298 | ||||||||||||||
| 795,000 | California Health Facilities Financing Authority, Revenue Bonds, Providence Health & Services, Refunding Series 2014A | 5.000 | 10/01/38 | 795,392 | ||||||||||||||
| 6,760,000 | California Health Facilities Financing Authority, Revenue Bonds, Providence Health & Services, Series 2014B | 5.000 | 10/01/44 | 6,738,563 | ||||||||||||||
| 15,660,000 | California Health Facilities Financing Authority, Revenue Bonds, Providence Saint Joseph Health, Refunding Series 2016A | 4.000 | 10/01/47 | 13,284,663 | ||||||||||||||
| 9,450,000 | California Health Facilities Financing Authority, Revenue Bonds, Stanford Health Care, Series 2020A | 4.000 | 08/15/50 | 8,205,558 | ||||||||||||||
| 7,635,000 | California Infrastructure and Economic Development Bank, Revenue Bonds, Adventist Health Energy Projects, Series 2024A | 5.250 | 07/01/49 | 7,501,952 | ||||||||||||||
| 4,465,000 | California Infrastructure and Economic Development Bank, Revenue Bonds, Adventist Health Energy Projects, Series 2024A | 5.250 | 07/01/54 | 4,348,579 | ||||||||||||||
| 5,495,000 | California Municipal Finance Authority, Revenue Bonds, Community Health System, Series 2021A - AGM Insured | 4.000 | 02/01/51 | 4,695,914 | ||||||||||||||
| 7,700,000 | California Municipal Finance Authority, Revenue Bonds, Community Health System, Series 2021A | 4.000 | 02/01/51 | 6,275,012 | ||||||||||||||
| 3,000,000 | California Municipal Finance Authority, Revenue Bonds, Community Medical Centers, Series 2017A | 5.000 | 02/01/42 | 3,001,903 | ||||||||||||||
| 2,000,000 | California Municipal Finance Authority, Revenue Bonds, Eisenhower Medical Center, Refunding Series 2017A | 5.000 | 07/01/42 | 1,935,770 | ||||||||||||||
| 250,000 | California Municipal Finance Authority, Revenue Bonds, Eisenhower Medical Center, Refunding Series 2017A | 5.000 | 07/01/47 | 237,929 | ||||||||||||||
| 1,635,000 | California Municipal Finance Authority, Revenue Bonds, NorthBay Healthcare Group, Series 2015 | 5.000 | 11/01/35 | 1,635,080 | ||||||||||||||
| 1,000,000 | California Municipal Finance Authority, Revenue Bonds, NorthBay Healthcare Group, Series 2015 | 5.000 | 11/01/40 | 952,079 | ||||||||||||||
| 3,000,000 | California Municipal Finance Authority, Revenue Bonds, NorthBay Healthcare Group, Series 2015 | 5.000 | 11/01/44 | 2,796,079 | ||||||||||||||
| 2,690,000 | California Municipal Finance Authority, Revenue Bonds, NorthBay Healthcare Group, Series 2017A | 5.250 | 11/01/36 | 2,699,176 | ||||||||||||||
| See Notes to Financial Statements |
47 |
Portfolio of Investments August 31, 2025 (continued)
NKX
| PRINCIPAL | DESCRIPTION | RATE | MATURITY | VALUE | ||||||||||||||
| |
|
|||||||||||||||||
| HEALTH CARE (continued) | ||||||||||||||||||
| $ | 2,585,000 | California Municipal Finance Authority, Revenue Bonds, NorthBay Healthcare Group, Series 2017A | 5.250% | 11/01/41 | $ | 2,542,271 | ||||||||||||
| 1,000,000 | California Municipal Finance Authority, Revenue Bonds, NorthBay Healthcare Group, Series 2017A | 5.000 | 11/01/47 | 889,655 | ||||||||||||||
| 3,200,000 | California Municipal Finance Authority, Revenue Bonds, NorthBay Healthcare Group, Series 2017A | 5.250 | 11/01/47 | 3,047,658 | ||||||||||||||
| 1,855,000 | California Municipal Financing Authority, Certificates of Participation, Palomar Health, Series 2022A | 5.250 | 11/01/52 | 1,859,494 | ||||||||||||||
| 500,000 | California Public Finance Authority, Revenue Bonds, Henry Mayo Newhall Hospital, Series 2017 | 5.000 | 10/15/37 | 502,552 | ||||||||||||||
| 13,615,000 | California Public Finance Authority, Revenue Bonds, Henry Mayo Newhall Hospital, Series 2017 | 5.000 | 10/15/47 | 12,686,693 | ||||||||||||||
| 1,100,000 | California Statewide Communities Development Authority, California, Redlands Community Hospital, Revenue Bonds, Series 2016 | 5.000 | 10/01/46 | 1,081,855 | ||||||||||||||
| 1,200,000 | California Statewide Communities Development Authority, California, Revenue Bonds, Loma Linda University Medical Center, Series 2014A | 5.250 | 12/01/44 | 1,165,734 | ||||||||||||||
| 4,000,000 | California Statewide Communities Development Authority, California, Revenue Bonds, Loma Linda University Medical Center, Series 2014A | 5.500 | 12/01/54 | 3,870,127 | ||||||||||||||
| 1,535,000 | (a) | California Statewide Communities Development Authority, California, Revenue Bonds, Loma Linda University Medical Center, Series 2016A | 5.250 | 12/01/56 | 1,401,366 | |||||||||||||
| 15,205,000 | (a) | California Statewide Communities Development Authority, California, Revenue Bonds, Loma Linda University Medical Center, Series 2018A | 5.500 | 12/01/58 | 14,642,955 | |||||||||||||
| 2,655,000 | California Statewide Communities Development Authority, Revenue Bonds, Adventist Health System/West, Series 2018A | 5.000 | 03/01/42 | 2,648,270 | ||||||||||||||
| 1,940,000 | California Statewide Communities Development Authority, Revenue Bonds, Marin General Hospital, Green Series 2018A | 4.000 | 08/01/45 | 1,604,919 | ||||||||||||||
| 845,000 | California Statewide Community Development Authority, Health Revenue Bonds, Enloe Medical Center, Refunding Series 2022A - AGM Insured | 5.250 | 08/15/52 | 853,905 | ||||||||||||||
| 2,550,000 | Palomar Pomerado Health Care District, California, Certificates of Participation, Series 2017 | 5.000 | 11/01/32 | 2,374,950 | ||||||||||||||
| 8,895,000 | Palomar Pomerado Health System, California, Revenue Bonds, Refunding Series 2016 | 4.000 | 11/01/39 | 6,504,938 | ||||||||||||||
| 520,000 | Washington Township Health Care District, California, Revenue Bonds, Series 2023A | 5.750 | 07/01/48 | 539,005 | ||||||||||||||
| |
|
|||||||||||||||||
| TOTAL HEALTH CARE | 187,483,622 | |||||||||||||||||
| |
||||||||||||||||||
| HOUSING/MULTIFAMILY - 18.0% (10.3% of Total Investments) | ||||||||||||||||||
| 5,915,000 | (a) | California Community Housing Agency, California, Essential Housing Revenue Bonds, Creekwood, Series 2021A | 4.000 | 02/01/56 | 3,749,854 | |||||||||||||
| 7,570,000 | (a) | California Community Housing Agency, California, Essential Housing Revenue Bonds, Glendale Properties, Junior Series 2021A‑2 | 4.000 | 08/01/47 | 5,526,887 | |||||||||||||
| 5,355,000 | (a) | California Community Housing Agency, California, Essential Housing Revenue Bonds, Serenity at Larkspur Apartments, Series 2020A | 5.000 | 02/01/50 | 3,478,183 | |||||||||||||
| 230,000 | (a) | California Community Housing Agency, California, Essential Housing Revenue Bonds, Summit at Sausalito Apartments, Series 2021A‑2 | 4.000 | 02/01/50 | 165,625 | |||||||||||||
| 1,645,000 | (a) | California Community Housing Agency, California, Essential Housing Revenue Bonds, The Arbors, Series 2020A | 5.000 | 08/01/50 | 1,464,456 | |||||||||||||
| 500,000 | (a) | California Community Housing Agency, California, Essential Housing Revenue Bonds, Verdant at Green Valley Apartments, Series 2019A | 5.000 | 08/01/49 | 438,167 | |||||||||||||
| 5,345,000 | (a) | California Community Housing Agency, Workforce Housing Revenue Bonds, Annadel Apartments, Series 2019A | 5.000 | 04/01/49 | 4,329,192 | |||||||||||||
| 7,005,530 | California Housing Finance Agency, Municipal Certificate Revenue Bonds, Class A Series 2019‑2 | 4.000 | 03/20/33 | 7,104,958 | ||||||||||||||
| 6,124,278 | California Housing Finance Agency, Municipal Certificate Revenue Bonds, Class A Series 2021‑1 | 3.500 | 11/20/35 | 5,779,507 | ||||||||||||||
| 48 |
See Notes to Financial Statements |
| PRINCIPAL | DESCRIPTION | RATE | MATURITY | VALUE | ||||||||||||||
| |
|
|||||||||||||||||
| HOUSING/MULTIFAMILY (continued) | ||||||||||||||||||
| $ | 1,098,571 | California Housing Finance Agency, Municipal Certificate Revenue Bonds, Class A Series2019‑1 | 4.250% | 01/15/35 | $ | 1,122,068 | ||||||||||||
| 5,981,597 | California Housing Finance Agency, Municipal Certificate Revenue Bonds, Class A Social Certificates Series 2023-1 | 4.375 | 09/20/36 | 6,007,681 | ||||||||||||||
| 160,000 | (a) | California Public Finance Authority, University Housing Revenue Bonds, National Campus Community Development - Claremont Properties LLC Claremont Colleges Project, Refunding Series 2023A | 5.250 | 07/01/40 | 163,159 | |||||||||||||
| 8,205,000 | (a) | CMFA Special Finance Agency I, California, Essential Housing Revenue Bonds, The Mix at Center City, Series 2021A‑2 | 4.000 | 04/01/56 | 5,927,245 | |||||||||||||
| 2,740,000 | (a) | CMFA Special Finance Agency, California, Essential Housing Revenue Bonds, Enclave Apartments, Senior Series 2022A-1 | 4.000 | 08/01/58 | 1,960,091 | |||||||||||||
| 1,440,000 | (a) | CSCDA Community Improvement Authority, California, Essential Housing Revenue Bonds, 777 Place-Pomona, Senior Lien Series 2021A‑1 | 3.600 | 05/01/47 | 1,124,557 | |||||||||||||
| 3,980,000 | (a) | CSCDA Community Improvement Authority, California, Essential Housing Revenue Bonds, 777 Place-Pomona, Senior Lien Series 2021A‑2 | 3.250 | 05/01/57 | 2,566,144 | |||||||||||||
| 6,135,000 | (a) | CSCDA Community Improvement Authority, California, Essential Housing Revenue Bonds, Acacia on Santa Rosa Creek, Senior Lien Series 2021A | 4.000 | 10/01/56 | 4,763,962 | |||||||||||||
| 250,000 | (a) | CSCDA Community Improvement Authority, California, Essential Housing Revenue Bonds, Altana Glendale, Series 2021A‑1 | 3.500 | 10/01/46 | 196,242 | |||||||||||||
| 7,065,000 | (a) | CSCDA Community Improvement Authority, California, Essential Housing Revenue Bonds, Altana Glendale, Series 2021A‑2 | 4.000 | 10/01/56 | 5,139,314 | |||||||||||||
| 9,485,000 | (a) | CSCDA Community Improvement Authority, California, Essential Housing Revenue Bonds, Center City Anaheim, Series 2020A | 5.000 | 01/01/54 | 8,208,442 | |||||||||||||
| 7,485,000 | (a) | CSCDA Community Improvement Authority, California, Essential Housing Revenue Bonds, Moda at Monrovia Station, Social Series 2021A‑2 | 4.000 | 10/01/56 | 5,411,687 | |||||||||||||
| 770,000 | (a) | CSCDA Community Improvement Authority, California, Essential Housing Revenue Bonds, Monterrey Station Apartments, Senior Lien Series 2021A‑1 | 3.000 | 07/01/43 | 569,232 | |||||||||||||
| 3,340,000 | (a) | CSCDA Community Improvement Authority, California, Essential Housing Revenue Bonds, Monterrey Station Apartments, Senior Lien Series 2021A‑1 | 3.125 | 07/01/56 | 2,050,382 | |||||||||||||
| 2,485,000 | (a) | CSCDA Community Improvement Authority, California, Essential Housing Revenue Bonds, Oceanaire-Long Beach, Social Series 2021A‑2 | 4.000 | 09/01/56 | 1,751,779 | |||||||||||||
| 155,000 | (a) | CSCDA Community Improvement Authority, California, Essential Housing Revenue Bonds, Orange City Portfolio, Mezzanine Lien Series 2021B | 4.000 | 03/01/57 | 107,072 | |||||||||||||
| 3,775,000 | (a) | CSCDA Community Improvement Authority, California, Essential Housing Revenue Bonds, Parallel-Anaheim Series 2021A | 4.000 | 08/01/56 | 3,199,649 | |||||||||||||
| 1,360,000 | (a) | CSCDA Community Improvement Authority, California, Essential Housing Revenue Bonds, Pasadena Portfolio Social Bond, Mezzanine Senior Series 2021B | 4.000 | 12/01/56 | 984,039 | |||||||||||||
| 555,000 | CSCDA Community Improvement Authority, California, Essential Housing Revenue Bonds, Pasadena Portfolio Social Bond, Series 2021A‑2 | 3.000 | 12/01/56 | 369,939 | ||||||||||||||
| 2,720,000 | (a) | CSCDA Community Improvement Authority, California, Essential Housing Revenue Bonds, Union South Bay, Series 2021A‑2 | 4.000 | 07/01/56 | 2,090,825 | |||||||||||||
| 1,975,000 | (a) | CSCDA Community Improvement Authority, California, Essential Housing Revenue Bonds, Westgate Phase 1‑Pasadena Apartments, Senior Lien Series 2021A‑1 | 3.000 | 06/01/47 | 1,307,936 | |||||||||||||
| 7,200,000 | (a) | CSCDA Community Improvement Authority, California, Essential Housing Revenue Bonds, Westgate Phase 1‑Pasadena Apartments, Senior Lien Series 2021A‑2 | 3.125 | 06/01/57 | 4,096,835 | |||||||||||||
| 7,285,000 | CSCDA Community Improvement Authority, California, Essential Housing Revenue Bonds, Wood Creek Apartments, Senior Lien Series 2021A‑1 | 3.000 | 12/01/49 | 4,656,711 | ||||||||||||||
| 3,285,000 | Independent Cities Finance Authority, California, Mobile Home Park Revenue Bonds, Rancho Vallecitos Mobile Home Park, Series 2013 | 5.000 | 04/15/38 | 3,286,917 | ||||||||||||||
| See Notes to Financial Statements |
49 |
Portfolio of Investments August 31, 2025 (continued)
NKX
| PRINCIPAL | DESCRIPTION | RATE | MATURITY | VALUE | ||||||||||||||
| |
|
|||||||||||||||||
| HOUSING/MULTIFAMILY (continued) | ||||||||||||||||||
| $ | 670,000 | La Verne, California, Mobile Home Park Revenue Bonds, Copacabana Mobile Home Park, Refunding Series 2014 | 5.000% | 06/15/44 | $ | 670,013 | ||||||||||||
| 185,000 | La Verne, California, Mobile Home Park Revenue Bonds, Copacabana Mobile Home Park, Refunding Series 2014 | 5.000 | 06/15/49 | 184,220 | ||||||||||||||
| 1,420,000 | Los Angeles Housing Authority, California, Multifamily Housing Revenue Bonds, Clarendon Apartments, Senior Series 2024A | 4.400 | 12/01/54 | 1,219,059 | ||||||||||||||
| 510,000 | Los Angeles Housing Authority, California, Multifamily Housing Revenue Bonds, Clarendon Apartments, Senior Series 2024A | 4.500 | 12/01/59 | 448,721 | ||||||||||||||
| 1,965,000 | Los Angeles Housing Authority, California, Multifamily Housing Revenue Bonds, Clarendon Apartments, Senior Series 2024A | 4.550 | 12/01/61 | 1,773,340 | ||||||||||||||
| |
|
|||||||||||||||||
| TOTAL HOUSING/MULTIFAMILY | 103,394,090 | |||||||||||||||||
| |
||||||||||||||||||
| LONG-TERM CARE - 0.5% (0.3% of Total Investments) | ||||||||||||||||||
| 630,000 | California Health Facilities Financing Authority, Insured Revenue Bonds, Community Program for Persons with Developmental Disabilities, Series 2011A | 6.250 | 02/01/26 | 631,872 | ||||||||||||||
| 2,500,000 | California Municipal Finance Authority, Revenue Bonds, HumanGood California Obligated Group, Refunding Series 2019A |
5.000 | 10/01/44 | 2,421,788 | ||||||||||||||
| |
|
|||||||||||||||||
| TOTAL LONG-TERM CARE | 3,053,660 | |||||||||||||||||
| |
||||||||||||||||||
| TAX OBLIGATION/GENERAL - 40.4% (23.0% of Total Investments) | ||||||||||||||||||
| 2,210,000 | Butte-Glenn Community College District, Butte and Glenn Counties, California, General Obligation Bonds, Election 2016 Series 2017A | 5.250 | 08/01/46 | 2,239,748 | ||||||||||||||
| 1,600,000 | California State, General Obligation Bonds, Refunding Various Purpose Bid Group C Series 2016 | 5.000 | 09/01/32 | 1,635,667 | ||||||||||||||
| 13,000,000 | California State, General Obligation Bonds, Refunding Various Purpose Series 2018. Bid Group C | 5.000 | 08/01/37 | 13,517,734 | ||||||||||||||
| 5,390,000 | California State, General Obligation Bonds, Various Purpose Series 2015 | 5.000 | 08/01/45 | 5,392,870 | ||||||||||||||
| 3,000,000 | California State, General Obligation Bonds, Various Purpose Series 2017 | 5.000 | 11/01/47 | 3,033,012 | ||||||||||||||
| 5,000,000 | California State, General Obligation Bonds, Various Purpose Series 2018. Bid Group A/B | 5.000 | 10/01/48 | 5,060,211 | ||||||||||||||
| 20,750,000 | Coachella Valley Unified School District, Riverside County, California, General Obligation Bonds, Election 2005 Series 2010C - AGM Insured | 0.000 | 08/01/43 | 8,735,198 | ||||||||||||||
| 4,500,000 | Corona-Norco Unified School District, Riverside County, California, General Obligation Bonds, Election 2014, Series 2018B | 4.000 | 08/01/43 | 4,138,226 | ||||||||||||||
| 1,725,000 | Los Angeles Community College District, California, General Obligation Bonds, 2008 Election Series 2017J | 4.000 | 08/01/41 | 1,645,023 | ||||||||||||||
| 19,230,000 | Los Angeles County, California, Tax and Revenue Anticipation Notes, Series 2025‑26 | 5.000 | 06/30/26 | 19,707,212 | ||||||||||||||
| 5,000,000 | Los Angeles Unified School District, Los Angeles County, California, General Obligation Bonds, Dedicated Ad Valorem Property Tax, Sustainability Green Series 2022QRR | 5.250 | 07/01/47 | 5,213,264 | ||||||||||||||
| 22,290,000 | Los Angeles, California, General Obligation Bonds, Tax & Revenue Anticipation Notes, Series 2025 | 5.000 | 06/25/26 | 22,828,818 | ||||||||||||||
| 1,500,000 | Marin Healthcare District, Marin County, California, General Obligation Bonds, 2013 Election, Series 2015A | 4.000 | 08/01/45 | 1,311,968 | ||||||||||||||
| 1,150,000 | Monterey Peninsula Community College District, Monterey County, California, General Obligation Bonds, Election of 2020 Series 2024B | 4.000 | 08/01/51 | 1,000,748 | ||||||||||||||
| 16,744,000 | Puerto Rico, General Obligation Bonds, Restructured Series 2022A‑1 | 4.000 | 07/01/41 | 14,578,875 | ||||||||||||||
| 5,000,000 | San Diego Community College District, San Diego County, California, General Obligation Bonds, Election of 2024, Series 2025A‑1 | 4.000 | 08/01/50 | 4,446,975 | ||||||||||||||
| 11,980,000 | San Diego Unified School District, San Diego County, California, General Obligation Bonds, Refunding Series 2012R‑1 | 0.000 | 07/01/31 | 10,092,973 | ||||||||||||||
| 3,400,000 | San Francisco Community College District, California, General Obligation Bonds, Election 2020 Series 2020A | 4.000 | 06/15/45 | 3,103,600 | ||||||||||||||
| 50 |
See Notes to Financial Statements |
| PRINCIPAL | DESCRIPTION | RATE | MATURITY | VALUE | ||||||||||||||
| |
|
|||||||||||||||||
| TAX OBLIGATION/GENERAL (continued) | ||||||||||||||||||
| $ | 1,580,000 | Santa Ana College Improvement District 1, Orange County, California, General Obligation Bonds, Rancho Santiago Community College District, Election of 2012, Series 2019C | 3.000% | 08/01/39 | $ | 1,319,629 | ||||||||||||
| 10,000,000 | Southwestern Community College District, San Diego County, California, General Obligation Bonds, Election of 2008, Series 2011C | 0.000 | 08/01/41 | 4,889,547 | ||||||||||||||
| 23,280,000 | (b) | Stockton Unified School District, San Joaquin County, California, General Obligation Bonds, Election 2008 Series 2011D - AGC Insured | 0.000 | 08/01/47 | 25,519,906 | |||||||||||||
| 38,845,000 | (b) | Stockton Unified School District, San Joaquin County, California, General Obligation Bonds, Election 2008 Series 2011D - AGM Insured | 0.000 | 08/01/50 | 42,644,764 | |||||||||||||
| 15,780,000 | (b) | Sylvan Union School District, Stanislaus County, California, General Obligation Bonds, Election of 2006, Series 2010 - AGM Insured | 0.000 | 08/01/49 | 13,226,269 | |||||||||||||
| 8,625,000 | Walnut Creek School District, Contra Costa County, California, General Obligation Bonds, Election 2022 Series 2023A | 4.000 | 09/01/52 | 7,446,714 | ||||||||||||||
| 2,500,000 | Washington Township Health Care District, California, General Obligation Bonds, 2020 Election Series 2023B - AGM Insured | 4.500 | 08/01/53 | 2,349,469 | ||||||||||||||
| 8,345,000 | (b) | Yosemite Community College District, California, General Obligation Bonds, Capital Appreciation, Election 2004, Series 2010D | 0.000 | 08/01/42 | 6,666,755 | |||||||||||||
| |
|
|||||||||||||||||
| TOTAL TAX OBLIGATION/GENERAL | 231,745,175 | |||||||||||||||||
| |
||||||||||||||||||
| TAX OBLIGATION/LIMITED - 21.5% (12.3% of Total Investments) | ||||||||||||||||||
| 1,260,000 | Brea and Olinda Unified School District, Orange County, California, Certificates of Participation Refunding, Series 2002A - AGM Insured | 5.125 | 08/01/26 | 1,262,128 | ||||||||||||||
| 210,000 | Brentwood Infrastructure Financing Authority, California, Infrastructure Revenue Bonds, Refunding Subordinated Series 2014B | 5.000 | 09/02/36 | 210,054 | ||||||||||||||
| 1,000,000 | California Municipal Finance Authority, Special Tax Revenue Bonds, Community Facilities District 2023‑11 Hesperia- Silverwood Improvement Area 1, Series 2025 | 5.125 | 09/01/55 | 952,258 | ||||||||||||||
| 2,830,000 | California Municipal Finance Authority, Special Tax Revenue Bonds, Community Facilities District 2023‑11 Hesperia- Silverwood Improvement Area 1, Series 2025 | 5.250 | 09/01/60 | 2,724,892 | ||||||||||||||
| 2,065,000 | California State Public Works Board, Lease Revenue Bonds, Department of Education, Riverside Campus Project, Series 2012H | 5.000 | 04/01/31 | 2,068,184 | ||||||||||||||
| 545,000 | California Statewide Communities Development Authority, Statewide Community Infrastructure Program Revenue Bonds, Series 2016B | 5.000 | 09/02/46 | 544,596 | ||||||||||||||
| 1,000,000 | California Statewide Communities Development Authority, Statewide Community Infrastructure Program Revenue Bonds, Series 2017C | 5.000 | 09/02/47 | 980,657 | ||||||||||||||
| 745,000 | California Statewide Communities Development Authority, Statewide Community Infrastructure Program Revenue Bonds, Series 2018A | 5.000 | 09/02/47 | 743,233 | ||||||||||||||
| 750,000 | Corona, California, Special Tax Bonds, Community Facilities District 2018‑1 Bedford, Series 2018A | 5.000 | 09/01/48 | 750,068 | ||||||||||||||
| 3,795,000 | (a) | El Monte, California, Senior Lien Certificates of Participation, Department of Public Services Facility Phase II, Series 2001 - AMBAC Insured | 5.250 | 01/01/34 | 3,802,075 | |||||||||||||
| 185,000 | Golden State Tobacco Securitization Corporation, California, Tobacco Settlement Asset-Backed Revenue Bonds, Series 2022A‑1 | 5.000 | 06/01/51 | 176,736 | ||||||||||||||
| 7,930,000 | Government of Guam, Business Privilege Tax Bonds, Refunding Series 2015D | 5.000 | 11/15/31 | 7,969,177 | ||||||||||||||
| 4,000,000 | Government of Guam, Business Privilege Tax Bonds, Refunding Series 2015D | 5.000 | 11/15/39 | 4,019,761 | ||||||||||||||
| 1,000,000 | Lathrop, California, Limited Obligation Improvement Bonds, Crossroads Assessment District, Series 2015 | 5.000 | 09/02/40 | 993,925 | ||||||||||||||
| 2,760,000 | Los Angeles County Facilities Inc, California, Lease Revenue Bonds, Vermont Corridor County Administration Building, Series 2018A | 5.000 | 12/01/51 | 2,788,901 | ||||||||||||||
| See Notes to Financial Statements |
51 |
Portfolio of Investments August 31, 2025 (continued)
NKX
| PRINCIPAL | DESCRIPTION | RATE | MATURITY | VALUE | ||||||||||||||
| |
|
|||||||||||||||||
| TAX OBLIGATION/LIMITED (continued) | ||||||||||||||||||
| $ | 15,000,000 | Los Angeles County Metropolitan Transportation Authority, California, Measure R Sales Tax Revenue Bonds, Senior Series 2016A | 5.000% | 06/01/38 | $ | 15,166,845 | ||||||||||||
| 3,220,000 | Los Angeles County Metropolitan Transportation Authority, California, Proposition C Sales Tax Revenue Bonds, Green Senior Lien Series 2019A | 5.000 | 07/01/44 | 3,296,841 | ||||||||||||||
| 3,580,000 | (c) | Los Angeles County Public Works Financing Authority, California, Lease Revenue Bonds, Series 2025J | 5.250 | 12/01/50 | 3,731,344 | |||||||||||||
| 1,000,000 | Menifee Union School District, Riverside County, California, Special Tax Bonds, Community Facilities District 2014‑2, Series 2017 | 5.000 | 09/01/47 | 998,940 | ||||||||||||||
| 16,657,000 | Puerto Rico Sales Tax Financing Corporation, Sales Tax Revenue Bonds, Restructured 2018A‑1 | 0.000 | 07/01/46 | 5,264,568 | ||||||||||||||
| 32,445,000 | Puerto Rico Sales Tax Financing Corporation, Sales Tax Revenue Bonds, Restructured 2018A‑1 | 0.000 | 07/01/51 | 7,573,173 | ||||||||||||||
| 17,239,000 | Puerto Rico Sales Tax Financing Corporation, Sales Tax Revenue Bonds, Restructured 2018A‑1 | 5.000 | 07/01/58 | 15,812,614 | ||||||||||||||
| 1,000,000 | Puerto Rico Sales Tax Financing Corporation, Sales Tax Revenue Bonds, Taxable Restructured Cofina Project Series 2019A‑2 | 4.329 | 07/01/40 | 927,442 | ||||||||||||||
| 1,482,000 | Puerto Rico Sales Tax Financing Corporation, Sales Tax Revenue Bonds, Taxable Restructured Cofina Project Series 2019A‑2 | 4.536 | 07/01/53 | 1,278,232 | ||||||||||||||
| 3,175,000 | Puerto Rico Sales Tax Financing Corporation, Sales Tax Revenue Bonds, Taxable Restructured Cofina Project Series 2019A‑2 | 4.784 | 07/01/58 | 2,804,877 | ||||||||||||||
| 2,160,000 | River Islands Public Financing Authority, California, Special Tax Bonds, Community Facilities District 2003‑1 Improvement Area 1, Refunding Series 2022A‑1 - AGM Insured | 5.250 | 09/01/52 | 2,214,887 | ||||||||||||||
| 400,000 | Roseville, California, Special Tax Bonds, Community Facilities District 1 Westpark, Refunding Series 2015 | 5.000 | 09/01/33 | 400,193 | ||||||||||||||
| 15,385,000 | San Diego County Regional Transportation Commission, California, Sales Tax Revenue Bonds, Limited Tax Series 2016A | 5.000 | 04/01/48 | 15,451,708 | ||||||||||||||
| 325,000 | San Diego Redevelopment Agency, California, Subordinate Lien Tax Increment and Parking Revenue Bonds, Centre City Project, Series 2003B | 5.250 | 09/01/26 | 325,561 | ||||||||||||||
| 540,000 | San Francisco City and County Redevelopment Agency Successor Agency, California, Special Tax Bonds, Community Facilities District 7, Hunters Point Shipyard Phase One Improvements, Refunding Series 2014 | 5.000 | 08/01/39 | 540,843 | ||||||||||||||
| 10,000 | Signal Hill Redevelopment Agency, California, Project 1 Tax Allocation Bonds, Series 2011 | 7.000 | 10/01/26 | 10,031 | ||||||||||||||
| 3,600,000 | Stockton Public Financing Authority, California, Revenue Bonds, Arch Road East Community Facility District 99‑02, Series 2018A | 5.000 | 09/01/33 | 3,710,866 | ||||||||||||||
| 2,145,000 | (a) | Temecula Public Financing Authority, California, Special Tax Bonds, Community Facilities District 16‑01, Series 2017 | 6.125 | 09/01/37 | 2,219,549 | |||||||||||||
| 990,000 | (a) | Temecula Public Financing Authority, California, Special Tax Bonds, Community Facilities District 16‑01, Series 2017 | 6.250 | 09/01/47 | 1,010,457 | |||||||||||||
| 600,000 | Tracy, California, Special Tax Bonds, Community Facilities District 2016‑1 Tracy Hills, Improvement Area 2, Series 2023 | 5.250 | 09/01/38 | 626,080 | ||||||||||||||
| 635,000 | Transbay Joint Powers Authority, California, Tax Allocation Bonds, Senior Green Series 2020A | 5.000 | 10/01/45 | 611,641 | ||||||||||||||
| 2,540,000 | Transbay Joint Powers Authority, California, Tax Allocation Bonds, Senior Green Series 2020A | 5.000 | 10/01/49 | 2,387,604 | ||||||||||||||
| 3,965,000 | Virgin Islands Public Finance Authority, Gross Receipts Taxes Loan Note, Refunding Series 2012A - AGM Insured | 5.000 | 10/01/32 | 3,975,429 | ||||||||||||||
| 350,000 | West Patterson Financing Authority, California, Special Tax Bonds, Community Facilities District 2015‑1 Arambel‑KDN, Refunding Series 2015 | 5.250 | 09/01/35 | 350,340 | ||||||||||||||
| 790,000 | West Patterson Financing Authority, California, Special Tax Bonds, Community Facilities District 2015‑1 Arambel‑KDN, Refunding Series 2015 | 5.250 | 09/01/45 | 790,076 | ||||||||||||||
| 700,000 | West Sacramento, California, Special Tax Bonds, Community Facilities District 27 Bridge District, Refunding Series 2016 | 5.000 | 09/01/40 | 701,763 | ||||||||||||||
| 1,400,000 | West Sacramento, California, Special Tax Bonds, Community Facilities District 27 Bridge District, Series 2017 | 5.000 | 09/01/47 | 1,362,142 | ||||||||||||||
| |
|
|||||||||||||||||
| TOTAL TAX OBLIGATION/LIMITED | 123,530,691 | |||||||||||||||||
| |
||||||||||||||||||
| 52 |
See Notes to Financial Statements |
| PRINCIPAL | DESCRIPTION | RATE | MATURITY | VALUE | ||||||||||||||
| |
|
|||||||||||||||||
| TRANSPORTATION - 16.6% (9.5% of Total Investments) | ||||||||||||||||||
| $ | 6,500,000 | Bay Area Toll Authority, California, Revenue Bonds, San Francisco Bay Area Toll Bridge, Subordinate Fixed Rate Series 2017S‑7 | 4.000% | 04/01/47 | $ | 5,743,744 | ||||||||||||
| 2,000,000 | Foothill/Eastern Transportation Corridor Agency, California, Toll Road Revenue Bonds, Refunding Senior Lien Series 2021A | 4.000 | 01/15/46 | 1,818,708 | ||||||||||||||
| 4,000,000 | Los Angeles Department of Airports, California, Revenue Bonds, Los Angeles International Airport, Subordinate Lien Series 2019E | 5.000 | 05/15/49 | 4,022,022 | ||||||||||||||
| 3,000,000 | San Diego County Regional Airport Authority, California, Airport Revenue Bonds, Senior Series 2023A | 5.000 | 07/01/53 | 3,046,685 | ||||||||||||||
| 3,000,000 | San Diego County Regional Airport Authority, California, Airport Revenue Bonds, Subordinate Series 2021A | 4.000 | 07/01/51 | 2,631,982 | ||||||||||||||
| 4,230,000 | San Diego County Regional Airport Authority, California, Airport Revenue Bonds, Subordinate Series 2021A | 4.000 | 07/01/56 | 3,633,529 | ||||||||||||||
| 13,770,000 | San Diego County Regional Airport Authority, California, Airport Revenue Bonds, Subordinate Series 2021A | 5.000 | 07/01/56 | 13,865,981 | ||||||||||||||
| 4,535,000 | San Francisco Airport Commission, California, Revenue Bonds, San Francisco International Airport, Governmental Purpose Second Series 2017B | 5.000 | 05/01/47 | 4,534,840 | ||||||||||||||
| 44,650,000 | (d) | San Francisco Airport Commission, California, Revenue Bonds, San Francisco International Airport, Governmental Purpose Second Series 2017B, (UB) | 5.000 | 05/01/47 | 44,648,419 | |||||||||||||
| 9,500,000 | San Francisco Airport Commission, California, Revenue Bonds, San Francisco International Airport, Refunding Second Series 2023D | 5.250 | 05/01/48 | 9,866,379 | ||||||||||||||
| 2,025,000 | San Joaquin Hills Transportation Corridor Agency, Orange County, California, Refunding Senior Lien Toll Road Revenue Bonds, Series 2021A | 4.000 | 01/15/50 | 1,733,052 | ||||||||||||||
| |
|
|||||||||||||||||
| TOTAL TRANSPORTATION | 95,545,341 | |||||||||||||||||
| |
||||||||||||||||||
| U.S. GUARANTEED - 4.4% (e)(2.5% of Total Investments) | ||||||||||||||||||
| 2,040,000 | California Health Facilities Financing Authority, California, Revenue Bonds, Sutter Health, Refunding Series 2016B, (Pre‑refunded 11/15/26) | 5.000 | 11/15/46 | 2,109,818 | ||||||||||||||
| 18,430,000 | California Health Facilities Financing Authority, California, Revenue Bonds, Sutter Health, Series 2016A, (Pre‑refunded 11/15/25) | 5.000 | 11/15/41 | 18,530,156 | ||||||||||||||
| 2,250,000 | California Infrastructure and Economic Development Bank, First Lien Revenue Bonds, San Francisco Bay Area Toll Bridge, Series 2003A, (Pre‑refunded 1/01/28) - AMBAC Insured | 5.000 | 07/01/36 | 2,404,276 | ||||||||||||||
| 2,000,000 | Chaffey Community College District, San Bernardino County, California, General Obligation Bonds, Taxable Refunding Series 2019, (Pre‑refunded 6/01/28) | 4.000 | 06/01/43 | 2,099,350 | ||||||||||||||
| |
|
|||||||||||||||||
| TOTAL U.S. GUARANTEED | 25,143,600 | |||||||||||||||||
| |
||||||||||||||||||
| UTILITIES - 27.8% (15.9% of Total Investments) | |
|||||||||||||||||
| 30,055,000 | California Community Choice Financing Authority, Clean Energy Project Revenue Bonds, Green Series 2021B‑1, (Mandatory Put 8/01/31) | 4.000 | 02/01/52 | 30,199,249 | ||||||||||||||
| 7,000,000 | California Community Choice Financing Authority, Clean Energy Project Revenue Bonds, Green Series 2023E‑1, (Mandatory Put 3/01/31) | 5.000 | 02/01/54 | 7,446,140 | ||||||||||||||
| 6,625,000 | California Community Choice Financing Authority, Clean Energy Project Revenue Bonds, Green Series 2023F, (Mandatory Put 11/01/30) | 5.500 | 10/01/54 | 7,119,591 | ||||||||||||||
| 5,250,000 | California Community Choice Financing Authority, Clean Energy Project Revenue Bonds, Green Series 2023G, (Mandatory Put 4/01/30) | 5.250 | 11/01/54 | 5,622,302 | ||||||||||||||
| 4,000,000 | (a) | California Pollution Control Financing Authority, Water Furnishing Revenue Bonds, San Diego County Water Authority Desalination Project Pipeline, Refunding Series 2019 | 5.000 | 07/01/39 | 4,044,393 | |||||||||||||
| 5,635,000 | Central Valley Energy Authority, California, Commodity Supply Revenue Bonds, Prepaid Pacific Life Insurance, Series 2025, (Mandatory Put 8/01/35) | 5.000 | 12/01/55 | 6,057,052 | ||||||||||||||
| 6,190,000 | East Bay Municipal Utility District, Alameda and Contra Costa Counties, California, Water System Revenue Bonds, Green Series 2019A | 5.000 | 06/01/49 | 6,273,064 | ||||||||||||||
| See Notes to Financial Statements |
53 |
Portfolio of Investments August 31, 2025 (continued)
NKX
| PRINCIPAL | DESCRIPTION | RATE | MATURITY | VALUE | ||||||||||||||
| |
|
|||||||||||||||||
| UTILITIES (continued) | ||||||||||||||||||
| $ | 2,490,000 | Long Beach Bond Finance Authority, California, Natural Gas Purchase Revenue Bonds, Series 2007A | 5.000% | 11/15/35 | $ | 2,661,382 | ||||||||||||
| 1,835,000 | Long Beach Bond Finance Authority, California, Natural Gas Purchase Revenue Bonds, Series 2007A | 5.500 | 11/15/37 | 2,024,319 | ||||||||||||||
| 6,015,000 | Los Angeles Department of Water and Power, California, Power System Revenue Bonds, Series 2017C | 5.000 | 07/01/47 | 5,976,706 | ||||||||||||||
| 8,340,000 | Los Angeles Department of Water and Power, California, Power System Revenue Bonds, Series 2019A | 5.000 | 07/01/45 | 8,319,169 | ||||||||||||||
| 5,190,000 | Los Angeles Department of Water and Power, California, Power System Revenue Bonds, Series 2020B | 5.000 | 07/01/50 | 5,187,439 | ||||||||||||||
| 3,000,000 | Los Angeles Department of Water and Power, California, Power System Revenue Bonds, Series 2022B | 5.000 | 07/01/47 | 3,000,149 | ||||||||||||||
| 1,820,000 | Los Angeles Department of Water and Power, California, Power System Revenue Bonds, Series 2025A - BAM Insured | 5.000 | 07/01/53 | 1,825,449 | ||||||||||||||
| 1,145,000 | Los Angeles Department of Water and Power, California, Waterworks Revenue Bonds, Refunding Series 2016B | 5.000 | 07/01/42 | 1,141,065 | ||||||||||||||
| 8,250,000 | Los Angeles Department of Water and Power, California, Waterworks Revenue Bonds, Series 2020C | 5.000 | 07/01/38 | 8,550,310 | ||||||||||||||
| 5,000,000 | Los Angeles, California, Wastewater System Revenue Bonds, Green Subordinate Series 2018A | 5.000 | 06/01/43 | 5,085,827 | ||||||||||||||
| 1,000,000 | New York State Environmental Facilities Corporation, State Clean Water and Drinking Water Revolving Funds Revenue Bonds, New York City Municipal Water Finance Authority Projects-Second Resolution Bonds, Subordinated SRF Series 2017A | 5.000 | 06/15/46 | 1,005,959 | ||||||||||||||
| 2,000,000 | Orange County Sanitation District, California, Wastewater Revenue Bonds, Refunding Series 2016A | 5.000 | 02/01/35 | 2,015,363 | ||||||||||||||
| 8,660,000 | (a) | Puerto Rico Aqueduct and Sewerage Authority, Revenue Bonds, Refunding Senior Lien Series 2020A | 5.000 | 07/01/47 | 8,101,288 | |||||||||||||
| 2,000,000 | San Diego Public Facilities Financing Authority, California, Water Utility Revenue Bonds, Refunding Subordinate Lien Series 2016B | 5.000 | 08/01/37 | 2,024,754 | ||||||||||||||
| 600,000 | San Joaquin County, California, Revenue Bonds, CSA County Service Area 31, Refunding Series 2018A | 5.000 | 08/01/42 | 571,062 | ||||||||||||||
| 5,000,000 | South Coast Water District Financing Authority, California, Revenue Bonds, Series 2019A | 5.000 | 02/01/44 | 5,123,981 | ||||||||||||||
| 15,000,000 | Southern California Public Power Authority, California, Revenue Bonds, Clean Energy Project Revenue Bonds, Series 2024A, (Mandatory Put 9/01/30) | 5.000 | 04/01/55 | 15,898,641 | ||||||||||||||
| 14,530,000 | Southern California Public Power Authority, Southern Transmission System Renewal Project Revenue Bonds, Series 2023‑1A | 5.000 | 07/01/48 | 14,533,563 | ||||||||||||||
| |
|
|||||||||||||||||
| TOTAL UTILITIES | 159,808,217 | |||||||||||||||||
| |
||||||||||||||||||
| TOTAL MUNICIPAL BONDS (Cost $1,012,993,252) |
990,294,740 | |||||||||||||||||
| TOTAL LONG-TERM INVESTMENTS (Cost $1,012,993,252) |
990,294,740 | |||||||||||||||||
| |
||||||||||||||||||
| PRINCIPAL | DESCRIPTION | RATE | MATURITY | VALUE | ||||||||||||||
| |
|
|||||||||||||||||
| SHORT-TERM INVESTMENTS - 2.8% (1.6% of Total Investments) | ||||||||||||||||||
| MUNICIPAL BONDS - 2.8% (1.6% of Total Investments) | ||||||||||||||||||
| EDUCATION AND CIVIC ORGANIZATIONS - 1.4% (0.8% of Total Investments) | ||||||||||||||||||
| $ | 8,000,000 | (f) | University of California, General Revenue Bonds, Variable Rate Demand Obligation, Series 2024BY‑1 | 2.650 | 05/15/54 | $ | 8,000,000 | |||||||||||
| |
|
|||||||||||||||||
| TOTAL EDUCATION AND CIVIC ORGANIZATIONS | 8,000,000 | |||||||||||||||||
| |
||||||||||||||||||
| 54 |
See Notes to Financial Statements |
| PRINCIPAL | DESCRIPTION | RATE | MATURITY | VALUE | ||||||||||||||
| |
|
|||||||||||||||||
| WATER AND SEWER - 1.4% (0.8% of Total Investments) | ||||||||||||||||||
| $ | 8,000,000 | (f) | Orange County Water District, California, Revenue Certificates of Participation, Adjustable Rate Series 2003A | 2.650% | 08/01/42 | $ | 8,000,000 | |||||||||||
| TOTAL WATER AND SEWER | 8,000,000 | |||||||||||||||||
| |
||||||||||||||||||
| TOTAL MUNICIPAL BONDS (Cost $16,000,000) |
16,000,000 | |||||||||||||||||
| |
||||||||||||||||||
| TOTAL SHORT-TERM INVESTMENTS (Cost $16,000,000) |
16,000,000 | |||||||||||||||||
| |
||||||||||||||||||
| TOTAL INVESTMENTS - 175.2% (Cost $1,028,993,252) |
1,006,294,740 | |||||||||||||||||
| |
||||||||||||||||||
| FLOATING RATE OBLIGATIONS - (5.8)% | (33,485,000) | |||||||||||||||||
| |
||||||||||||||||||
| MFP SHARES, NET - (24.4)% (g) | (140,062,927) | |||||||||||||||||
| |
||||||||||||||||||
| VRDP SHARES, NET - (44.5)% (h) | (255,773,357) | |||||||||||||||||
| |
||||||||||||||||||
| OTHER ASSETS & LIABILITIES, NET - (0.5)% | (2,572,997) | |||||||||||||||||
| |
||||||||||||||||||
| NET ASSETS APPLICABLE TO COMMON SHARES - 100% | $ | 574,400,459 | ||||||||||||||||
| |
||||||||||||||||||
All percentages shown in the Portfolio of Investments are based on net assets applicable to common shares unless otherwise noted.
| UB | Underlying bond of an inverse floating rate trust reflected as a financing transaction. Inverse floating rate trust is a Recourse Trust unless otherwise noted. | |
| (a) | Security is exempt from registration under Rule 144A of the Securities Act of 1933, as amended. These securities are deemed liquid and may be resold in transactions exempt from registration, which are normally those transactions with qualified institutional buyers. As of the end of the reporting period, the aggregate value of these securities is $121,490,873 or 12.1% of Total Investments. | |
| (b) | Step‑up coupon bond, a bond with a coupon that increases (“steps up”), usually at regular intervals, while the bond is outstanding. The rate shown is the coupon as of the end of the reporting period. | |
| (c) | When-issued or delayed delivery security. | |
| (d) | Investment, or portion of investment, has been pledged to collateralize the net payment obligations for investments in inverse floating rate transactions. | |
| (e) | Backed by an escrow or trust containing sufficient U.S. Government or U.S. Government agency securities, which ensure the timely payment of principal and interest. | |
| (f) | Investment has a maturity of greater than one year, but has variable rate and/or demand features which qualify it as a short-term investment. The rate disclosed, as well as the reference rate and spread, where applicable, is that in effect as of the end of the reporting period. This rate changes periodically based on market conditions or a specified market index. | |
| (g) | MFP Shares, Net as a percentage of Total Investments is 13.9%. | |
| (h) | VRDP Shares, Net as a percentage of Total Investments is 25.4%. |
| See Notes to Financial Statements |
55 |
Portfolio of Investments August 31, 2025
NCA
| PRINCIPAL | DESCRIPTION | RATE | MATURITY | VALUE | ||||||||||||||
| |
|
|||||||||||||||||
| LONG-TERM INVESTMENTS - 95.6% (96.6% of Total Investments) | ||||||||||||||||||
| MUNICIPAL BONDS - 94.8% (95.7% of Total Investments) | ||||||||||||||||||
| CONSUMER STAPLES - 0.6% (0.6% of Total Investments) | ||||||||||||||||||
| $ | 70,000 | California County Tobacco Securitization Agency, Tobacco Settlement Asset-Backed Bonds, Los Angeles County Securitization Corporation, Series 2020A | 4.000% | 06/01/49 | $ | 57,619 | ||||||||||||
| 4,895,000 | Silicon Valley Tobacco Securitization Authority, California, Tobacco Settlement Asset-Backed Bonds, Santa Clara County Tobacco Securitization Corporation, Series 2007A |
0.000 | 06/01/41 | 1,700,013 | ||||||||||||||
| |
|
|||||||||||||||||
| TOTAL CONSUMER STAPLES | 1,757,632 | |||||||||||||||||
| |
||||||||||||||||||
| EDUCATION AND CIVIC ORGANIZATIONS - 3.3% (3.3% of Total Investments) | ||||||||||||||||||
| 2,000,000 | California Infrastructure and Economic Development Bank, Revenue Bonds, Los Angeles County Museum of Natural History Foundation, Series 2020 | 4.000 | 07/01/50 | 1,741,533 | ||||||||||||||
| 1,000,000 | California Municipal Finance Authority, Revenue Bonds, Linxs APM Project, Senior Lien Series 2018A, (AMT) | 5.000 | 12/31/43 | 974,407 | ||||||||||||||
| 335,000 | (a) | California School Finance Authority, Charter School Revenue Bonds, Arts in Action Charter Schools - Obligated Group, Series 2020A | 5.000 | 06/01/59 | 259,162 | |||||||||||||
| 125,000 | (a) | California School Finance Authority, Charter School Revenue Bonds, Lifeline Education Charter School Project, Series 2020A | 5.000 | 07/01/55 | 111,232 | |||||||||||||
| 220,000 | (a) | California School Finance Authority, School Facility Revenue Bonds, Alliance for College-Ready Public Schools Project, Series 2016A | 5.000 | 07/01/46 | 214,270 | |||||||||||||
| 1,425,000 | (a) | California School Finance Authority, School Facility Revenue Bonds, Alliance for College-Ready Public Schools Project, Series 2016C | 5.250 | 07/01/52 | 1,413,180 | |||||||||||||
| 3,780,000 | California State University, Systemwide Revenue Bonds, Series 2017A | 5.000 | 11/01/47 | 3,792,429 | ||||||||||||||
| 1,070,000 | University of California, General Revenue Bonds, Series 2018AZ | 5.000 | 05/15/38 | 1,102,999 | ||||||||||||||
| |
|
|||||||||||||||||
| TOTAL EDUCATION AND CIVIC ORGANIZATIONS | 9,609,212 | |||||||||||||||||
| |
||||||||||||||||||
| HEALTH CARE - 11.3% (11.4% of Total Investments) | ||||||||||||||||||
| 4,105,000 | California Health Facilities Financing Authority, California, Revenue Bonds, Sutter Health, Refunding Series 2016B | 5.000 | 11/15/46 | 4,108,839 | ||||||||||||||
| 1,000,000 | California Health Facilities Financing Authority, California, Revenue Bonds, Sutter Health, Series 2018A | 5.000 | 11/15/36 | 1,031,125 | ||||||||||||||
| 2,045,000 | California Health Facilities Financing Authority, Revenue Bonds, City of Hope National Medical Center, Series 2019 | 4.000 | 11/15/45 | 1,758,272 | ||||||||||||||
| 1,815,000 | California Health Facilities Financing Authority, Revenue Bonds, CommonSpirit Health, Series 2020A | 4.000 | 04/01/44 | 1,620,178 | ||||||||||||||
| 3,700,000 | California Health Facilities Financing Authority, Revenue Bonds, CommonSpirit Health, Series 2020A | 4.000 | 04/01/49 | 3,113,926 | ||||||||||||||
| 445,000 | California Health Facilities Financing Authority, Revenue Bonds, CommonSpirit Health, Series 2024A | 5.000 | 12/01/54 | 442,789 | ||||||||||||||
| 240,000 | California Health Facilities Financing Authority, Revenue Bonds, Providence Health & Services, Refunding Series 2014A | 5.000 | 10/01/38 | 240,118 | ||||||||||||||
| 840,000 | California Health Facilities Financing Authority, Revenue Bonds, Providence Health & Services, Series 2014B | 5.000 | 10/01/44 | 837,336 | ||||||||||||||
| 3,245,000 | California Infrastructure and Economic Development Bank, Revenue Bonds, Adventist Health Energy Projects, Series 2024A | 5.250 | 07/01/49 | 3,188,453 | ||||||||||||||
| 1,600,000 | California Municipal Finance Authority, Revenue Bonds, Community Health System, Series 2021A - AGM Insured | 4.000 | 02/01/51 | 1,367,327 | ||||||||||||||
| 2,000,000 | California Municipal Finance Authority, Revenue Bonds, Community Medical Centers, Series 2017A | 5.000 | 02/01/47 | 1,969,083 | ||||||||||||||
| 2,000,000 | California Municipal Finance Authority, Revenue Bonds, Eisenhower Medical Center, Refunding Series 2017A | 4.000 | 07/01/47 | 1,655,061 | ||||||||||||||
| 120,000 | California Municipal Finance Authority, Revenue Bonds, Eisenhower Medical Center, Refunding Series 2017A | 5.000 | 07/01/47 | 114,206 | ||||||||||||||
| 100,000 | California Municipal Finance Authority, Revenue Bonds, NorthBay Healthcare Group, Series 2017A | 5.250 | 11/01/41 | 98,347 | ||||||||||||||
| 1,090,000 | California Municipal Finance Authority, Revenue Bonds, NorthBay Healthcare Group, Series 2017A | 5.000 | 11/01/47 | 969,724 | ||||||||||||||
| 400,000 | California Municipal Finance Authority, Revenue Bonds, NorthBay Healthcare Group, Series 2017A | 5.250 | 11/01/47 | 380,957 | ||||||||||||||
| 56 |
See Notes to Financial Statements |
| PRINCIPAL | DESCRIPTION | RATE | MATURITY | VALUE | ||||||||||||||
| |
|
|||||||||||||||||
| HEALTH CARE (continued) | ||||||||||||||||||
| $ | 520,000 | California Municipal Financing Authority, Certificates of Participation, Palomar Health, Series 2022A | 5.250% | 11/01/52 | $ | 521,260 | ||||||||||||
| 1,000,000 | California Statewide Communities Development Authority, California, Redlands Community Hospital, Revenue Bonds, Series 2016 | 5.000 | 10/01/46 | 983,504 | ||||||||||||||
| 150,000 | California Statewide Communities Development Authority, California, Revenue Bonds, Loma Linda University Medical Center, Series 2014A | 5.250 | 12/01/34 | 150,072 | ||||||||||||||
| 5,800,000 | (a) | California Statewide Communities Development Authority, California, Revenue Bonds, Loma Linda University Medical Center, Series 2016A | 5.250 | 12/01/56 | 5,295,065 | |||||||||||||
| 1,000,000 | (a) | California Statewide Communities Development Authority, California, Revenue Bonds, Loma Linda University Medical Center, Series 2018A | 5.500 | 12/01/58 | 963,036 | |||||||||||||
| 245,000 | California Statewide Community Development Authority, Health Revenue Bonds, Enloe Medical Center, Refunding Series 2022A - AGM Insured |
5.250 | 08/15/52 | 247,582 | ||||||||||||||
| 2,000,000 | University of California Regents, Medical Center Pooled Revenue Bonds, Series 2022P | 5.000 | 05/15/47 | 2,014,240 | ||||||||||||||
| |
|
|||||||||||||||||
| TOTAL HEALTH CARE | 33,070,500 | |||||||||||||||||
| |
||||||||||||||||||
| HOUSING/MULTIFAMILY - 9.2% (9.3% of Total Investments) | ||||||||||||||||||
| 1,445,000 | (a) | California Community Housing Agency, California, Essential Housing Revenue Bonds, Creekwood, Series 2021A | 4.000 | 02/01/56 | 916,067 | |||||||||||||
| 2,190,000 | (a) | California Community Housing Agency, California, Essential Housing Revenue Bonds, Glendale Properties, Junior Series 2021A‑2 | 4.000 | 08/01/47 | 1,598,927 | |||||||||||||
| 1,650,000 | (a) | California Community Housing Agency, California, Essential Housing Revenue Bonds, Serenity at Larkspur Apartments, Series 2020A | 5.000 | 02/01/50 | 1,071,709 | |||||||||||||
| 1,285,000 | (a) | California Community Housing Agency, Workforce Housing Revenue Bonds, Annadel Apartments, Series 2019A | 5.000 | 04/01/49 | 1,040,788 | |||||||||||||
| 1,995,436 | California Housing Finance Agency, Municipal Certificate Revenue Bonds, Class A Series 2019‑2 | 4.000 | 03/20/33 | 2,023,757 | ||||||||||||||
| 1,779,068 | California Housing Finance Agency, Municipal Certificate Revenue Bonds, Class A Series 2021‑1 | 3.500 | 11/20/35 | 1,678,914 | ||||||||||||||
| 311,940 | California Housing Finance Agency, Municipal Certificate Revenue Bonds, Class A Series2019‑1 | 4.250 | 01/15/35 | 318,612 | ||||||||||||||
| 1,753,818 | California Housing Finance Agency, Municipal Certificate Revenue Bonds, Class A Social Certificates Series 2023-1 | 4.375 | 09/20/36 | 1,761,466 | ||||||||||||||
| 2,320,000 | (a) | CMFA Special Finance Agency I, California, Essential Housing Revenue Bonds, The Mix at Center City, Series 2021A‑2 | 4.000 | 04/01/56 | 1,675,955 | |||||||||||||
| 800,000 | (a) | CMFA Special Finance Agency, California, Essential Housing Revenue Bonds, Enclave Apartments, Senior Series 2022A-1 | 4.000 | 08/01/58 | 572,289 | |||||||||||||
| 125,000 | (a) | CSCDA Community Improvement Authority, California, Essential Housing Revenue Bonds, 777 Place-Pomona, Senior Lien Series 2021A‑1 | 3.600 | 05/01/47 | 97,618 | |||||||||||||
| 1,130,000 | (a) | CSCDA Community Improvement Authority, California, Essential Housing Revenue Bonds, 777 Place-Pomona, Senior Lien Series 2021A‑2 | 3.250 | 05/01/57 | 728,579 | |||||||||||||
| 1,465,000 | (a) | CSCDA Community Improvement Authority, California, Essential Housing Revenue Bonds, Acacia on Santa Rosa Creek, Senior Lien Series 2021A | 4.000 | 10/01/56 | 1,137,605 | |||||||||||||
| 2,005,000 | (a) | CSCDA Community Improvement Authority, California, Essential Housing Revenue Bonds, Altana Glendale, Series 2021A‑2 | 4.000 | 10/01/56 | 1,458,503 | |||||||||||||
| 2,820,000 | (a) | CSCDA Community Improvement Authority, California, Essential Housing Revenue Bonds, Center City Anaheim, Series 2020A | 5.000 | 01/01/54 | 2,440,465 | |||||||||||||
| 2,120,000 | (a) | CSCDA Community Improvement Authority, California, Essential Housing Revenue Bonds, Moda at Monrovia Station, Social Series 2021A‑2 | 4.000 | 10/01/56 | 1,532,769 | |||||||||||||
| 220,000 | (a) | CSCDA Community Improvement Authority, California, Essential Housing Revenue Bonds, Monterrey Station Apartments, Senior Lien Series 2021A‑1 | 3.000 | 07/01/43 | 162,638 | |||||||||||||
| 950,000 | (a) | CSCDA Community Improvement Authority, California, Essential Housing Revenue Bonds, Monterrey Station Apartments, Senior Lien Series 2021A‑1 | 3.125 | 07/01/56 | 583,192 | |||||||||||||
| See Notes to Financial Statements |
57 |
Portfolio of Investments August 31, 2025 (continued)
NCA
| PRINCIPAL | DESCRIPTION | RATE | MATURITY | VALUE | ||||||||||||||
| |
|
|||||||||||||||||
| HOUSING/MULTIFAMILY (continued) | ||||||||||||||||||
| $ | 405,000 | (a) | CSCDA Community Improvement Authority, California, Essential Housing Revenue Bonds, Oceanaire-Long Beach, Social Series 2021A‑2 | 4.000% | 09/01/56 | $ | 285,501 | |||||||||||
| 860,000 | (a) | CSCDA Community Improvement Authority, California, Essential Housing Revenue Bonds, Parallel-Anaheim Series 2021A | 4.000 | 08/01/56 | 728,927 | |||||||||||||
| 530,000 | (a) | CSCDA Community Improvement Authority, California, Essential Housing Revenue Bonds, Pasadena Portfolio Social Bond, Mezzanine Senior Series 2021B | 4.000 | 12/01/56 | 383,486 | |||||||||||||
| 555,000 | (a) | CSCDA Community Improvement Authority, California, Essential Housing Revenue Bonds, Pasadena Portfolio Social Bond, Series 2021A‑2 | 3.000 | 12/01/56 | 369,938 | |||||||||||||
| 795,000 | (a) | CSCDA Community Improvement Authority, California, Essential Housing Revenue Bonds, Union South Bay, Series 2021A‑2 | 4.000 | 07/01/56 | 611,105 | |||||||||||||
| 560,000 | (a) | CSCDA Community Improvement Authority, California, Essential Housing Revenue Bonds, Westgate Phase 1‑Pasadena Apartments, Senior Lien Series 2021A‑1 | 3.000 | 06/01/47 | 370,858 | |||||||||||||
| 2,035,000 | (a) | CSCDA Community Improvement Authority, California, Essential Housing Revenue Bonds, Westgate Phase 1‑Pasadena Apartments, Senior Lien Series 2021A‑2 | 3.125 | 06/01/57 | 1,157,925 | |||||||||||||
| 2,080,000 | CSCDA Community Improvement Authority, California, Essential Housing Revenue Bonds, Wood Creek Apartments, Senior Lien Series 2021A‑1 | 3.000 | 12/01/49 | 1,329,576 | ||||||||||||||
| 435,000 | Los Angeles Housing Authority, California, Multifamily Housing Revenue Bonds, Clarendon Apartments, Senior Series 2024A | 4.400 | 12/01/54 | 373,444 | ||||||||||||||
| 755,000 | Los Angeles Housing Authority, California, Multifamily Housing Revenue Bonds, Clarendon Apartments, Senior Series 2024A | 4.500 | 12/01/59 | 664,283 | ||||||||||||||
| |
|
|||||||||||||||||
| TOTAL HOUSING/MULTIFAMILY | 27,074,896 | |||||||||||||||||
| |
||||||||||||||||||
| LONG-TERM CARE - 0.1% (0.1% of Total Investments) | ||||||||||||||||||
| 280,000 | California Health Facilities Financing Authority, Insured Revenue Bonds, Community Program for Persons with Developmental Disabilities, Series 2011A |
6.250 | 02/01/26 | 280,832 | ||||||||||||||
| |
|
|||||||||||||||||
| TOTAL LONG-TERM CARE | 280,832 | |||||||||||||||||
| |
||||||||||||||||||
| TAX OBLIGATION/GENERAL - 23.7% (24.0% of Total Investments) | ||||||||||||||||||
| 4,000,000 | Anaheim Union High School District, Orange County, California, General Obligation Bonds, 2014 Election Series 2019 - BAM Insured | 3.000 | 08/01/40 | 3,331,280 | ||||||||||||||
| 10,000,000 | Berkeley Unified School District, Alameda County, California, General Obligation Bonds, Election of 2020 Series 2024D | 4.000 | 08/01/54 | 8,663,880 | ||||||||||||||
| 375,000 | Butte-Glenn Community College District, Butte and Glenn Counties, California, General Obligation Bonds, Election 2016 Series 2017A | 5.250 | 08/01/46 | 380,048 | ||||||||||||||
| 5,000 | California State, General Obligation Bonds, Series 2013 | 5.000 | 02/01/29 | 5,009 | ||||||||||||||
| 3,000,000 | California State, General Obligation Bonds, Various Purpose Refunding Series 2015 | 5.000 | 08/01/34 | 3,003,845 | ||||||||||||||
| 2,000,000 | California State, General Obligation Bonds, Various Purpose Series 2018. Bid Group A/B | 5.000 | 10/01/48 | 2,024,084 | ||||||||||||||
| 5,000,000 | California State, General Obligation Bonds, Various Purpose Series 2023 | 5.000 | 09/01/26 | 5,143,911 | ||||||||||||||
| 1,000,000 | Chaffey Joint Union High School District, San Bernardino County, California, General Obligation Bonds, Election 2012 Series 2017C | 5.250 | 08/01/47 | 1,011,654 | ||||||||||||||
| 5,000,000 | Chino Valley Unified School District, San Bernardino County, California, General Obligation Bonds, 2016 Election Series 2020B | 5.000 | 08/01/55 | 5,047,473 | ||||||||||||||
| 4,200,000 | Corona-Norco Unified School District, Riverside County, California, General Obligation Bonds, Election 2014, Series 2019C | 4.000 | 08/01/49 | 3,676,782 | ||||||||||||||
| 2,000,000 | Desert Community College District, Riverside County, California, General Obligation Bonds, Election of 2016 Series 2024 | 4.000 | 08/01/51 | 1,738,570 | ||||||||||||||
| 690,000 | Los Angeles Community College District, California, General Obligation Bonds, 2008 Election Series 2017J | 4.000 | 08/01/41 | 658,009 | ||||||||||||||
| 2,000,000 | Marin Healthcare District, Marin County, California, General Obligation Bonds, 2013 Election, Series 2015A | 4.000 | 08/01/40 | 1,909,207 | ||||||||||||||
| 58 |
See Notes to Financial Statements |
| PRINCIPAL | DESCRIPTION | RATE | MATURITY | VALUE | ||||||||||||||
| |
|
|||||||||||||||||
| TAX OBLIGATION/GENERAL (continued) | ||||||||||||||||||
| $ | 519,000 | Puerto Rico, General Obligation Bonds, Restructured Series 2022A‑1 | 4.000% | 07/01/41 | $ | 451,889 | ||||||||||||
| 5,000,000 | San Diego Community College District, San Diego County, California, General Obligation Bonds, Election of 2024, Series 2025A‑1 | 4.000 | 08/01/50 | 4,446,976 | ||||||||||||||
| 11,875,000 | (b) | San Mateo Union High School District, San Mateo County, California, General Obligation Bonds, Election 2010 Series 2011A | 0.000 | 09/01/41 | 12,120,830 | |||||||||||||
| 19,860,000 | (b) | Yosemite Community College District, California, General Obligation Bonds, Capital Appreciation, Election 2004, Series 2010D |
0.000 | 08/01/42 | 15,865,999 | |||||||||||||
| |
|
|||||||||||||||||
| TOTAL TAX OBLIGATION/GENERAL | 69,479,446 | |||||||||||||||||
| |
||||||||||||||||||
| TAX OBLIGATION/LIMITED - 9.1% (9.2% of Total Investments) | ||||||||||||||||||
| 70,000 | Brentwood Infrastructure Financing Authority, California, Infrastructure Revenue Bonds, Refunding Subordinated Series 2014B | 5.000 | 09/02/36 | 70,018 | ||||||||||||||
| 1,000,000 | California Infrastructure and Economic Development Bank, Lease Revenue Bonds, California State Teachers’ Retirement System Headquarters Expansion, Green Bond-Climate Bond Certified Series 2019 | 5.000 | 08/01/44 | 1,008,262 | ||||||||||||||
| 165,000 | California Statewide Communities Development Authority, Statewide Community Infrastructure Program Revenue Bonds, Series 2016B | 5.000 | 09/02/46 | 164,878 | ||||||||||||||
| 400,000 | Corona, California, Special Tax Bonds, Community Facilities District 2018‑1 Bedford, Series 2018A | 5.000 | 09/01/48 | 400,036 | ||||||||||||||
| 55,000 | Golden State Tobacco Securitization Corporation, California, Tobacco Settlement Asset-Backed Revenue Bonds, Series 2022A‑1 | 5.000 | 06/01/51 | 52,543 | ||||||||||||||
| 1,000,000 | Los Angeles County Facilities Inc, California, Lease Revenue Bonds, Vermont Corridor County Administration Building, Series 2018A | 5.000 | 12/01/51 | 1,010,471 | ||||||||||||||
| 4,000,000 | Los Angeles County Metropolitan Transportation Authority, California, Measure R Sales Tax Revenue Bonds, Senior Series 2016A | 5.000 | 06/01/39 | 4,040,292 | ||||||||||||||
| 2,300,000 | Los Angeles County Metropolitan Transportation Authority, California, Proposition C Sales Tax Revenue Bonds, Senior Lien Series 2017A | 5.000 | 07/01/42 | 2,327,933 | ||||||||||||||
| 4,923,000 | Puerto Rico Sales Tax Financing Corporation, Sales Tax Revenue Bonds, Restructured 2018A‑1 | 5.000 | 07/01/58 | 4,515,662 | ||||||||||||||
| 29,000 | Puerto Rico Sales Tax Financing Corporation, Sales Tax Revenue Bonds, Taxable Restructured Cofina Project Series 2019A‑2 | 4.329 | 07/01/40 | 26,896 | ||||||||||||||
| 2,095,000 | Puerto Rico Sales Tax Financing Corporation, Sales Tax Revenue Bonds, Taxable Restructured Cofina Project Series 2019A‑2 | 4.784 | 07/01/58 | 1,850,777 | ||||||||||||||
| 625,000 | River Islands Public Financing Authority, California, Special Tax Bonds, Community Facilities District 2003‑1 Improvement Area 1, Refunding Series 2022A‑1 - AGM Insured | 5.250 | 09/01/52 | 640,882 | ||||||||||||||
| 135,000 | San Francisco City and County Redevelopment Agency Successor Agency, California, Special Tax Bonds, Community Facilities District 7, Hunters Point Shipyard Phase One Improvements, Refunding Series 2014 | 5.000 | 08/01/39 | 135,211 | ||||||||||||||
| 5,000,000 | San Francisco City and County Redevelopment Agency Successor Agency, California, Tax Allocation Bonds, Mission Bay North Redevelopment Project, Refunding Series 2016A - NPFG Insured | 5.000 | 08/01/41 | 5,025,423 | ||||||||||||||
| 30,000 | Signal Hill Redevelopment Agency, California, Project 1 Tax Allocation Bonds, Series 2011 | 7.000 | 10/01/26 | 30,093 | ||||||||||||||
| 1,000,000 | Stockton Public Financing Authority, California, Revenue Bonds, Arch Road East Community Facility District 99‑02, Series 2018A | 5.000 | 09/01/33 | 1,030,796 | ||||||||||||||
| 765,000 | Stockton Public Financing Authority, California, Revenue Bonds, Arch Road East Community Facility District 99‑02, Series 2018A | 5.000 | 09/01/43 | 765,463 | ||||||||||||||
| 1,335,000 | Sulphur Springs Union School District, California, Special Tax Bonds, Community Facilities District 2006‑1, Series 2018 | 5.000 | 09/01/43 | 1,339,069 | ||||||||||||||
| 195,000 | (a) | Temecula Public Financing Authority, California, Special Tax Bonds, Community Facilities District 16‑01, Series 2017 | 5.750 | 09/01/32 | 203,642 | |||||||||||||
| See Notes to Financial Statements |
59 |
Portfolio of Investments August 31, 2025 (continued)
NCA
| PRINCIPAL | DESCRIPTION | RATE | MATURITY | VALUE | ||||||||||||||
| |
|
|||||||||||||||||
| TAX OBLIGATION/LIMITED (continued) | ||||||||||||||||||
| $ | 2,185,000 | Transbay Joint Powers Authority, California, Tax Allocation Bonds, Senior Green Series 2020A | 5.000% | 10/01/45 | $ | 2,104,623 | ||||||||||||
| |
|
|||||||||||||||||
| TOTAL TAX OBLIGATION/LIMITED | 26,742,970 | |||||||||||||||||
| |
||||||||||||||||||
| TRANSPORTATION - 18.5% (18.7% of Total Investments) | ||||||||||||||||||
| 1,000,000 | Burbank-Glendale-Pasadena Airport Authority, California, Airport Revenue Bonds, Senior Series 2024B - AGM Insured, (AMT) | 4.375 | 07/01/49 | 895,509 | ||||||||||||||
| 225,000 | California Municipal Finance Authority, Special Facility Revenue Bonds, United Airlines, Inc. Los Angeles International Airport Project, Series 2019, (AMT) | 4.000 | 07/15/29 | 223,903 | ||||||||||||||
| 10,415,000 | Los Angeles Department of Airports, California, Revenue Bonds, Los Angeles International Airport, Subordinate Lien Series 2018C, (AMT) | 5.000 | 05/15/44 | 10,337,457 | ||||||||||||||
| 2,670,000 | Los Angeles Department of Airports, California, Revenue Bonds, Los Angeles International Airport, Subordinate Lien Series 2019D, (AMT) | 5.000 | 05/15/33 | 2,772,132 | ||||||||||||||
| 1,480,000 | Los Angeles Department of Airports, California, Revenue Bonds, Los Angeles International Airport, Subordinate Lien Series 2022A, (AMT) | 5.000 | 05/15/45 | 1,472,644 | ||||||||||||||
| 2,345,000 | San Diego County Regional Airport Authority, California, Airport Revenue Bonds, International Senior Series 2023B, (AMT) | 5.250 | 07/01/58 | 2,370,329 | ||||||||||||||
| 3,075,000 | San Diego County Regional Airport Authority, California, Airport Revenue Bonds, Subordinate Series 2021A | 4.000 | 07/01/51 | 2,697,782 | ||||||||||||||
| 3,740,000 | San Francisco Airport Commission, California, Revenue Bonds, San Francisco International Airport, Governmental Purpose Second Series 2016C | 5.000 | 05/01/46 | 3,741,541 | ||||||||||||||
| 16,295,000 | San Francisco Airport Commission, California, Revenue Bonds, San Francisco International Airport, Governmental Purpose Second Series 2017B | 5.000 | 05/01/47 | 16,294,423 | ||||||||||||||
| 4,200,000 | San Francisco Airport Commission, California, Revenue Bonds, San Francisco International Airport, Refunding Second Series 2023C, (AMT) | 5.500 | 05/01/40 | 4,469,911 | ||||||||||||||
| 4,160,000 | San Francisco Airport Commission, California, Revenue Bonds, San Francisco International Airport, Second Series 2018D, (AMT) | 5.000 | 05/01/43 | 4,155,865 | ||||||||||||||
| 1,035,000 | San Francisco Airport Commission, California, Revenue Bonds, San Francisco International Airport, Second Series 2025A, (AMT) | 5.250 | 05/01/55 | 1,044,300 | ||||||||||||||
| 2,885,000 | San Francisco Airport Commission, California, Revenue Bonds, San Francisco International Airport, Second Series 2025A, (AMT) | 5.500 | 05/01/55 | 2,985,341 | ||||||||||||||
| 665,000 | San Joaquin Hills Transportation Corridor Agency, Orange County, California, Refunding Senior Lien Toll Road Revenue Bonds, Series 2021A | 4.000 | 01/15/50 | 569,126 | ||||||||||||||
| 100,000 | San Joaquin Hills Transportation Corridor Agency, Orange County, California, Toll Road Revenue Bonds, Refunding Junior Lien Series 2014B | 5.250 | 01/15/44 | 100,007 | ||||||||||||||
| |
|
|||||||||||||||||
| TOTAL TRANSPORTATION | 54,130,270 | |||||||||||||||||
| |
||||||||||||||||||
| U.S. GUARANTEED - 1.4% (c)(1.4% of Total Investments) | ||||||||||||||||||
| 795,000 | California Health Facilities Financing Authority, California, Revenue Bonds, Sutter Health, Refunding Series 2016B, (Pre‑ refunded 11/15/26) | 5.000 | 11/15/46 | 822,208 | ||||||||||||||
| 130,000 | California Health Facilities Financing Authority, Revenue Bonds, CommonSpirit Health, Series 2020A, (Pre‑refunded 4/01/30) | 4.000 | 04/01/49 | 139,275 | ||||||||||||||
| 3,000,000 | Chaffey Community College District, San Bernardino County, California, General Obligation Bonds, Taxable Refunding Series 2019, (Pre‑refunded 6/01/28) | 4.000 | 06/01/43 | 3,149,025 | ||||||||||||||
| |
|
|||||||||||||||||
| TOTAL U.S. GUARANTEED | 4,110,508 | |||||||||||||||||
| |
||||||||||||||||||
| UTILITIES - 17.6% (17.7% of Total Investments) | ||||||||||||||||||
| 1,375,000 | (a) | California Pollution Control Financing Authority, Water Furnishing Revenue Bonds, Poseidon Resources Channelside LP Desalination Project, Series 2012, (AMT) | 5.000 | 07/01/37 | 1,375,377 | |||||||||||||
| 3,750,000 | (a) | California Pollution Control Financing Authority, Water Furnishing Revenue Bonds, Poseidon Resources Channelside LP Desalination Project, Series 2012, (AMT) | 5.000 | 11/21/45 | 3,560,990 | |||||||||||||
| 1,500,000 | (a) | California Pollution Control Financing Authority, Water Furnishing Revenue Bonds, San Diego County Water Authority Desalination Project Pipeline, Refunding Series 2019 | 5.000 | 07/01/39 | 1,516,647 | |||||||||||||
| 60 |
See Notes to Financial Statements |
| PRINCIPAL | DESCRIPTION | RATE | MATURITY | VALUE | ||||||||||||||
| |
|
|||||||||||||||||
| UTILITIES (continued) | ||||||||||||||||||
| $ | 2,815,000 | Central Valley Energy Authority, California, Commodity Supply Revenue Bonds, Prepaid Pacific Life Insurance, Series 2025, (Mandatory Put 8/01/35) | 5.000% | 12/01/55 | $ | 3,025,839 | ||||||||||||
| 1,800,000 | Long Beach Bond Finance Authority, California, Natural Gas Purchase Revenue Bonds, Series 2007A | 5.500 | 11/15/37 | 1,985,708 | ||||||||||||||
| 835,000 | Los Angeles Department of Water and Power, California, Power System Revenue Bonds, Series 2016B | 5.000 | 07/01/37 | 836,569 | ||||||||||||||
| 2,425,000 | Los Angeles Department of Water and Power, California, Power System Revenue Bonds, Series 2018D | 5.000 | 07/01/48 | 2,393,917 | ||||||||||||||
| 3,395,000 | Los Angeles Department of Water and Power, California, Power System Revenue Bonds, Series 2020B | 5.000 | 07/01/45 | 3,404,950 | ||||||||||||||
| 3,795,000 | Los Angeles Department of Water and Power, California, Power System Revenue Bonds, Series 2022A | 5.000 | 07/01/51 | 3,791,210 | ||||||||||||||
| 560,000 | Los Angeles Department of Water and Power, California, Power System Revenue Bonds, Series 2025A - BAM Insured | 5.000 | 07/01/53 | 561,677 | ||||||||||||||
| 4,150,000 | Los Angeles Department of Water and Power, California, Water System Revenue Bonds, Series 2022B | 5.000 | 07/01/47 | 4,161,340 | ||||||||||||||
| 1,500,000 | Los Angeles Department of Water and Power, California, Waterworks Revenue Bonds, Series 2018B | 5.000 | 07/01/38 | 1,523,254 | ||||||||||||||
| 2,500,000 | Los Angeles Department of Water and Power, California, Waterworks Revenue Bonds, Series 2020C | 5.000 | 07/01/36 | 2,630,124 | ||||||||||||||
| 6,000,000 | Los Angeles Department of Water and Power, California, Waterworks Revenue Bonds, Series 2020C | 5.000 | 07/01/38 | 6,218,407 | ||||||||||||||
| 3,000,000 | M‑S‑R Energy Authority, California, Gas Revenue Bonds, Citigroup Prepay Contracts, Series 2009C | 6.500 | 11/01/39 | 3,565,898 | ||||||||||||||
| 2,000,000 | (a) | Puerto Rico Aqueduct and Sewerage Authority, Revenue Bonds, Refunding Senior Lien Series 2020A | 5.000 | 07/01/47 | 1,870,967 | |||||||||||||
| 5,775,000 | Riverside, California, Sewer Revenue Bonds, Refunding Series 2018A | 5.000 | 08/01/39 | 5,982,686 | ||||||||||||||
| 3,000,000 | San Diego Public Facilities Financing Authority, California, Water Utility Revenue Bonds, Refunding Subordinate Lien Series 2016B | 5.000 | 08/01/37 | 3,037,131 | ||||||||||||||
| |
|
|||||||||||||||||
| TOTAL UTILITIES | 51,442,691 | |||||||||||||||||
| |
||||||||||||||||||
| TOTAL MUNICIPAL BONDS (Cost $286,472,029) |
277,698,957 | |||||||||||||||||
| |
||||||||||||||||||
| PRINCIPAL | DESCRIPTION | RATE | MATURITY | VALUE | ||||||||||||||
| |
|
|||||||||||||||||
| VARIABLE RATE DEMAND PREFERRED SHARES - 0.8% (0.9% of Total Investments) | ||||||||||||||||||
| $ | 2,500,000 | (d) | BlackRock MuniHoldings California Quality Fund Inc, Series W‑7, LIQ: Barclays Bank PLC | 2.840 | 09/01/54 | $ | 2,500,000 | |||||||||||
| |
|
|||||||||||||||||
| TOTAL VARIABLE RATE DEMAND PREFERRED SHARES (Cost $2,500,000) |
2,500,000 | |||||||||||||||||
| |
||||||||||||||||||
| TOTAL LONG-TERM INVESTMENTS (Cost $288,972,029) |
280,198,957 | |||||||||||||||||
| |
||||||||||||||||||
| PRINCIPAL | DESCRIPTION | RATE | MATURITY | VALUE | ||||||||||||||
| |
|
|||||||||||||||||
| SHORT-TERM INVESTMENTS - 3.4% (3.4% of Total Investments) | ||||||||||||||||||
| MUNICIPAL BONDS - 3.4% (3.4% of Total Investments) | ||||||||||||||||||
| TAX OBLIGATION/GENERAL - 3.4% (3.4% of Total Investments) | ||||||||||||||||||
| $ | 10,000,000 | (e) | California State, General Obligation Bonds, Variable Rate Weekly Rate Period, Series 2024c‑2 | 2.000 | 05/01/47 | $ | 10,000,000 | |||||||||||
| |
|
|||||||||||||||||
| TOTAL TAX OBLIGATION/GENERAL | 10,000,000 | |||||||||||||||||
| |
||||||||||||||||||
| TOTAL SHORT-TERM INVESTMENTS (Cost $10,000,000) |
10,000,000 | |||||||||||||||||
| |
||||||||||||||||||
| TOTAL INVESTMENTS - 99.0% (Cost $298,972,029) |
290,198,957 | |||||||||||||||||
| |
||||||||||||||||||
| OTHER ASSETS & LIABILITIES, NET - 1.0% | 2,836,370 | |||||||||||||||||
| |
||||||||||||||||||
| NET ASSETS APPLICABLE TO COMMON SHARES - 100% | $ | 293,035,327 | ||||||||||||||||
| |
||||||||||||||||||
All percentages shown in the Portfolio of Investments are based on net assets applicable to common shares unless otherwise noted.
| AMT | Alternative Minimum Tax | |
| LIQ | Liquidity Agreement |
| See Notes to Financial Statements |
61 |
Portfolio of Investments August 31, 2025 (continued)
NCA
| (a) | Security is exempt from registration under Rule 144A of the Securities Act of 1933, as amended. These securities are deemed liquid and may be resold in transactions exempt from registration, which are normally those transactions with qualified institutional buyers. As of the end of the reporting period, the aggregate value of these securities is $35,708,412 or 12.3% of Total Investments. | |
| (b) | Step‑up coupon bond, a bond with a coupon that increases (“steps up”), usually at regular intervals, while the bond is outstanding. The rate shown is the coupon as of the end of the reporting period. | |
| (c) | Backed by an escrow or trust containing sufficient U.S. Government or U.S. Government agency securities, which ensure the timely payment of principal and interest. | |
| (d) | Variable Rate Demand Preferred Shares of a closed‑end investment company which has a weekly demand feature. The rate shown is the coupon as of the end of the reporting period. | |
| (e) | Investment has a maturity of greater than one year, but has variable rate and/or demand features which qualify it as a short-term investment. The rate disclosed, as well as the reference rate and spread, where applicable, is that in effect as of the end of the reporting period. This rate changes periodically based on market conditions or a specified market index. |
| 62 |
See Notes to Financial Statements |
Portfolio of Investments August 31, 2025
NAC
| PRINCIPAL | DESCRIPTION | RATE | MATURITY | VALUE | ||||||||||||||
| |
|
|||||||||||||||||
| LONG-TERM INVESTMENTS - 172.7% (99.2% of Total Investments) | ||||||||||||||||||
| MUNICIPAL BONDS - 172.7% (99.2% of Total Investments) | ||||||||||||||||||
| CONSUMER STAPLES - 0.7% (0.4% of Total Investments) | ||||||||||||||||||
| $ | 1,000,000 | California County Tobacco Securitization Agency, Tobacco Settlement Asset-Backed Bonds, Golden Gate Tobacco Funding Corporation, Turbo, Series 2007A | 5.000% | 06/01/47 | $ | 876,022 | ||||||||||||
| 2,575,000 | California County Tobacco Securitization Agency, Tobacco Settlement Asset-Backed Bonds, Los Angeles County Securitization Corporation, Series 2020A | 4.000 | 06/01/49 | 2,119,551 | ||||||||||||||
| 520,000 | California County Tobacco Securitization Agency, Tobacco Settlement Asset-Backed Bonds, Los Angeles County Securitization Corporation, Series 2020B‑1 | 5.000 | 06/01/49 | 502,367 | ||||||||||||||
| 34,035,000 | Golden State Tobacco Securitization Corporation, California, Tobacco Settlement Asset-Backed Bonds, Capital Appreciation Series 2021B‑2 | 0.000 | 06/01/66 | 3,170,942 | ||||||||||||||
| 19,000,000 | Silicon Valley Tobacco Securitization Authority, California, Tobacco Settlement Asset-Backed Bonds, Santa Clara County Tobacco Securitization Corporation, Series 2007B |
0.000 | 06/01/47 | 4,255,312 | ||||||||||||||
| |
|
|||||||||||||||||
| TOTAL CONSUMER STAPLES | 10,924,194 | |||||||||||||||||
| |
||||||||||||||||||
| EDUCATION AND CIVIC ORGANIZATIONS - 11.3% (6.5% of Total Investments) | ||||||||||||||||||
| 6,995,000 | California Educational Facilities Authority, Revenue Bonds, Chapman University, Series 2017B | 4.000 | 04/01/47 | 6,190,915 | ||||||||||||||
| 5,725,000 | California Educational Facilities Authority, Revenue Bonds, Stanford University Series 2016U‑7 | 5.000 | 06/01/46 | 6,095,449 | ||||||||||||||
| 4,385,000 | California Educational Facilities Authority, Revenue Bonds, University of the Pacific, Series 2023 | 5.000 | 11/01/53 | 4,443,788 | ||||||||||||||
| 650,000 | (a) | California Enterprise Development Authority, Charter School Revenue Bonds, Academy for Academic Excellence Project, Series 2020A | 5.000 | 07/01/55 | 566,800 | |||||||||||||
| 1,500,000 | (a) | California Enterprise Development Authority, Charter School Revenue Bonds, Norton Science & Language Academy Project, Series 2021 | 4.000 | 07/01/61 | 1,041,855 | |||||||||||||
| 27,000,000 | California Infrastructure and Economic Development Bank, Revenue Bonds, UCSF Clinical and Life Sciences Building, Series 2025 | 5.250 | 05/15/59 | 27,910,605 | ||||||||||||||
| 1,350,000 | (a) | California Municipal Finance Authority Charter School Revenue Bonds, River Charter Schools Project, Series 2018A | 5.500 | 06/01/53 | 1,214,620 | |||||||||||||
| 800,000 | (a) | California Municipal Finance Authority, Revenue Bonds, Creative Center of Los Altos Project Pinewood & Oakwood Schools, Series 2016B | 4.000 | 11/01/36 | 744,472 | |||||||||||||
| 1,000,000 | (a) | California Municipal Finance Authority, Revenue Bonds, Creative Center of Los Altos Project Pinewood & Oakwood Schools, Series 2016B | 4.500 | 11/01/46 | 853,155 | |||||||||||||
| 8,395,000 | California Municipal Finance Authority, Academic Facilities Revenue Bonds, Scripps College Series 2025 | 5.500 | 07/01/60 | 8,573,343 | ||||||||||||||
| 1,210,000 | (a) | California Municipal Finance Authority, Charter School Revenue Bonds, John Adams Academies, Inc. - Lincoln Project, Taxable Series 2019B | 5.000 | 10/01/39 | 1,149,375 | |||||||||||||
| 2,980,000 | (a) | California Municipal Finance Authority, Charter School Revenue Bonds, John Adams Academies, Inc. - Lincoln Project, Taxable Series 2019B | 5.000 | 10/01/57 | 2,498,831 | |||||||||||||
| 1,000,000 | (a) | California Municipal Finance Authority, Charter School Revenue Bonds, Palmdale Aerospace Academy Project, Series 2016A | 5.000 | 07/01/46 | 877,939 | |||||||||||||
| 3,500,000 | California Municipal Finance Authority, Revenue Bonds, Linxs APM Project, Senior Lien Series 2018A, (AMT) | 5.000 | 12/31/43 | 3,410,425 | ||||||||||||||
| 1,650,000 | California Municipal Finance Authority, Revenue Bonds, Linxs APM Project, Senior Lien Series 2018A, (AMT) | 4.000 | 12/31/47 | 1,352,685 | ||||||||||||||
| 4,000,000 | California Municipal Finance Authority, Revenue Bonds, Linxs APM Project, Senior Lien Series 2018A, (AMT) | 5.000 | 12/31/47 | 3,819,563 | ||||||||||||||
| 1,000,000 | California Municipal Finance Authority, Revenue Bonds, The Master’s University & Seminary, Series 2019 | 5.000 | 08/01/48 | 923,626 | ||||||||||||||
| 3,250,000 | (a) | California School Finance Authority, Charter School Revenue Bonds, Arts in Action Charter Schools - Obligated Group, Series 2020A | 5.000 | 06/01/59 | 2,514,262 | |||||||||||||
| See Notes to Financial Statements |
63 |
Portfolio of Investments August 31, 2025 (continued)
NAC
| PRINCIPAL | DESCRIPTION | RATE | MATURITY | VALUE | ||||||||||||||
| |
|
|||||||||||||||||
| EDUCATION AND CIVIC ORGANIZATIONS (continued) | ||||||||||||||||||
| $ | 750,000 | (a) | California School Finance Authority, Charter School Revenue Bonds, Aspire Public School - Obligated Group, Issue No.6, Series 2020A | 5.000% | 08/01/42 | $ | 712,192 | |||||||||||
| 1,550,000 | (a) | California School Finance Authority, Charter School Revenue Bonds, Camino Nuevo Charter Academy Sustainability Series 2023A | 5.250 | 06/01/53 | 1,455,553 | |||||||||||||
| 175,000 | (a) | California School Finance Authority, Charter School Revenue Bonds, Kepler Neighborhood School, Series 2017A | 5.000 | 05/01/27 | 176,019 | |||||||||||||
| 1,215,000 | (a) | California School Finance Authority, Charter School Revenue Bonds, Lifeline Education Charter School Project, Series 2020A | 5.000 | 07/01/55 | 1,081,177 | |||||||||||||
| 1,320,000 | (a) | California School Finance Authority, Charter School Revenue Bonds, Social Bonds - iLead Lancaster Project, Series 2021A | 5.000 | 06/01/61 | 1,063,052 | |||||||||||||
| 1,100,000 | (a) | California School Finance Authority, Charter School Revenue Bonds, Stem Preparatory Schools - Obligated Group, Series 2023A | 5.375 | 05/01/63 | 1,027,084 | |||||||||||||
| 1,615,000 | (a) | California School Finance Authority, School Facility Revenue Bonds, Alliance for College-Ready Public Schools Project, Series 2015A | 5.000 | 07/01/45 | 1,585,110 | |||||||||||||
| 2,150,000 | (a) | California School Finance Authority, School Facility Revenue Bonds, Alliance for College-Ready Public Schools Project, Series 2016A | 5.000 | 07/01/46 | 2,094,004 | |||||||||||||
| 7,995,000 | (a) | California School Finance Authority, School Facility Revenue Bonds, Alliance for College-Ready Public Schools Project, Series 2016C | 5.000 | 07/01/46 | 7,836,564 | |||||||||||||
| 8,340,000 | (a) | California School Finance Authority, School Facility Revenue Bonds, Alliance for College-Ready Public Schools Project, Series 2016C | 5.250 | 07/01/52 | 8,270,820 | |||||||||||||
| 1,500,000 | (a) | California School Finance Authority, School Facility Revenue Bonds, Granada Hills Charter High School Obligated Group, Series 2019 | 5.000 | 07/01/43 | 1,453,782 | |||||||||||||
| 800,000 | (a) | California School Finance Authority, School Facility Revenue Bonds, Value Schools, Series 2016A | 6.000 | 07/01/51 | 803,219 | |||||||||||||
| 3,315,000 | California State University, Systemwide Revenue Bonds, Series 2015A | 5.000 | 11/01/43 | 3,329,217 | ||||||||||||||
| 115,000 | California State University, Systemwide Revenue Bonds, Series 2015A | 5.000 | 11/01/43 | 115,019 | ||||||||||||||
| 10,440,000 | California State University, Systemwide Revenue Bonds, Series 2018A | 5.000 | 11/01/43 | 10,604,645 | ||||||||||||||
| 1,965,000 | California State University, Systemwide Revenue Bonds, Series 2018A | 5.000 | 11/01/48 | 1,978,281 | ||||||||||||||
| 2,935,000 | University of California, General Revenue Bonds, Limited Project Series 2017M | 5.000 | 05/15/52 | 2,943,433 | ||||||||||||||
| 8,500,000 | University of California, General Revenue Bonds, Limited Project Series 2018O | 5.000 | 05/15/43 | 8,619,862 | ||||||||||||||
| 10,390,000 | University of California, General Revenue Bonds, Limited Project Series 2018O | 4.000 | 05/15/48 | 9,013,098 | ||||||||||||||
| 3,930,000 | University of California, General Revenue Bonds, Series 2018AZ | 5.000 | 05/15/38 | 4,051,203 | ||||||||||||||
| 19,025,000 | University of California, General Revenue Bonds, Series 2018AZ | 5.000 | 05/15/48 | 19,054,487 | ||||||||||||||
| 12,810,000 | University of California, General Revenue Bonds, Series 2020BE | 4.000 | 05/15/47 | 11,244,384 | ||||||||||||||
| 10,000,000 | University of California, General Revenue Bonds, Series 2024BW | 5.000 | 05/15/54 | 10,204,808 | ||||||||||||||
| |
|
|||||||||||||||||
| TOTAL EDUCATION AND CIVIC ORGANIZATIONS | 182,898,721 | |||||||||||||||||
| |
||||||||||||||||||
| FINANCIALS - 0.0% (0.0% of Total Investments) | ||||||||||||||||||
| 1,304,842 | (b) | Cofina Class 2 Trust Tax‑Exempt Class 2054, Puerto Rico. | 0.000 | 08/01/54 | 245,039 | |||||||||||||
| |
|
|||||||||||||||||
| TOTAL FINANCIALS | 245,039 | |||||||||||||||||
| |
||||||||||||||||||
| HEALTH CARE - 30.3% (17.4% of Total Investments) | ||||||||||||||||||
| 6,365,000 | California Health Facilities Financing Authority, California, Revenue Bonds, Sutter Health, Refunding Series 2016B | 4.000 | 11/15/41 | 5,857,313 | ||||||||||||||
| 19,795,000 | California Health Facilities Financing Authority, California, Revenue Bonds, Sutter Health, Refunding Series 2016B | 5.000 | 11/15/46 | 19,813,514 | ||||||||||||||
| 20,215,000 | California Health Facilities Financing Authority, California, Revenue Bonds, Sutter Health, Refunding Series 2017A | 4.000 | 11/15/48 | 17,061,765 | ||||||||||||||
| 13,110,000 | California Health Facilities Financing Authority, California, Revenue Bonds, Sutter Health, Refunding Series 2017A | 5.000 | 11/15/48 | 12,991,437 | ||||||||||||||
| 64 |
See Notes to Financial Statements |
| PRINCIPAL | DESCRIPTION | RATE | MATURITY | VALUE | ||||||||||||||
| |
|
|||||||||||||||||
| HEALTH CARE (continued) | ||||||||||||||||||
| $ | 5,890,000 | California Health Facilities Financing Authority, California, Revenue Bonds, Sutter Health, Series 2018A | 5.000% | 11/15/38 | $ | 6,024,261 | ||||||||||||
| 7,960,000 | California Health Facilities Financing Authority, Revenue Bonds, Adventist Health System/West, Refunding Series 2016A | 4.000 | 03/01/39 | 7,075,861 | ||||||||||||||
| 7,810,000 | California Health Facilities Financing Authority, Revenue Bonds, Adventist Health System/West, Series 2013A | 4.000 | 03/01/43 | 6,353,470 | ||||||||||||||
| 15,000,000 | California Health Facilities Financing Authority, Revenue Bonds, Cedars-Sinai Medical Center, Refunding Series 2016B | 4.000 | 08/15/39 | 14,652,947 | ||||||||||||||
| 7,400,000 | California Health Facilities Financing Authority, Revenue Bonds, Children’s Hospital Los Angeles, Series 2017A | 5.000 | 08/15/47 | 7,014,597 | ||||||||||||||
| 1,030,000 | California Health Facilities Financing Authority, Revenue Bonds, Children’s Hospital of Orange County, Series 2024A | 5.000 | 11/01/54 | 1,046,620 | ||||||||||||||
| 16,625,000 | California Health Facilities Financing Authority, Revenue Bonds, City of Hope National Medical Center, Series 2019 | 4.000 | 11/15/45 | 14,294,020 | ||||||||||||||
| 30,630,000 | California Health Facilities Financing Authority, Revenue Bonds, City of Hope National Medical Center, Series 2019 | 5.000 | 11/15/49 | 30,192,864 | ||||||||||||||
| 31,810,000 | California Health Facilities Financing Authority, Revenue Bonds, CommonSpirit Health, Series 2020A | 4.000 | 04/01/44 | 28,395,512 | ||||||||||||||
| 8,475,000 | California Health Facilities Financing Authority, Revenue Bonds, CommonSpirit Health, Series 2020A | 4.000 | 04/01/45 | 7,430,148 | ||||||||||||||
| 2,720,000 | California Health Facilities Financing Authority, Revenue Bonds, CommonSpirit Health, Series 2020A | 4.000 | 04/01/49 | 2,289,156 | ||||||||||||||
| 4,430,000 | California Health Facilities Financing Authority, Revenue Bonds, CommonSpirit Health, Series 2024A | 5.000 | 12/01/54 | 4,407,987 | ||||||||||||||
| 24,625,000 | California Health Facilities Financing Authority, Revenue Bonds, Lucile Salter Packard Children’s Hospital at Stanford, Refunding Forward Delivery Series 2022A | 4.000 | 05/15/51 | 20,759,784 | ||||||||||||||
| 2,230,000 | California Health Facilities Financing Authority, Revenue Bonds, Providence Health & Services, Refunding Series 2014A | 5.000 | 10/01/38 | 2,231,100 | ||||||||||||||
| 16,375,000 | California Health Facilities Financing Authority, Revenue Bonds, Providence Health & Services, Series 2014B | 5.000 | 10/01/44 | 16,323,073 | ||||||||||||||
| 26,330,000 | California Health Facilities Financing Authority, Revenue Bonds, Providence Saint Joseph Health, Refunding Series 2016A | 4.000 | 10/01/47 | 22,336,218 | ||||||||||||||
| 17,635,000 | California Infrastructure and Economic Development Bank, Revenue Bonds, Adventist Health Energy Projects, Series 2024A | 5.250 | 07/01/49 | 17,327,693 | ||||||||||||||
| 21,020,000 | California Infrastructure and Economic Development Bank, Revenue Bonds, Adventist Health Energy Projects, Series 2024A | 5.250 | 07/01/54 | 20,471,920 | ||||||||||||||
| 16,185,000 | California Municipal Finance Authority, Revenue Bonds, Community Health System, Series 2021A - AGM Insured | 4.000 | 02/01/51 | 13,831,368 | ||||||||||||||
| 3,095,000 | California Municipal Finance Authority, Revenue Bonds, Eisenhower Medical Center, Refunding Series 2017A | 5.000 | 07/01/42 | 2,995,604 | ||||||||||||||
| 685,000 | California Municipal Finance Authority, Revenue Bonds, Eisenhower Medical Center, Refunding Series 2017A | 5.000 | 07/01/47 | 651,925 | ||||||||||||||
| 11,830,000 | California Municipal Finance Authority, Revenue Bonds, NorthBay Healthcare Group, Series 2017A | 5.250 | 11/01/36 | 11,870,355 | ||||||||||||||
| 1,420,000 | California Municipal Finance Authority, Revenue Bonds, NorthBay Healthcare Group, Series 2017A | 5.250 | 11/01/41 | 1,396,528 | ||||||||||||||
| 9,335,000 | California Municipal Finance Authority, Revenue Bonds, NorthBay Healthcare Group, Series 2017A | 5.000 | 11/01/47 | 8,304,928 | ||||||||||||||
| 6,770,000 | California Municipal Finance Authority, Revenue Bonds, NorthBay Healthcare Group, Series 2017A | 5.250 | 11/01/47 | 6,447,701 | ||||||||||||||
| 5,330,000 | California Municipal Financing Authority, Certificates of Participation, Palomar Health, Series 2022A | 5.250 | 11/01/52 | 5,342,913 | ||||||||||||||
| 12,485,000 | California Public Finance Authority, Revenue Bonds, Henry Mayo Newhall Hospital, Series 2017 | 5.000 | 10/15/47 | 11,633,739 | ||||||||||||||
| 14,550,000 | California Public Finance Authority, Revenue Bonds, Hoag Memorial Hospital Presbyterian, Fixed Period Series 2022A | 4.000 | 07/15/51 | 12,786,560 | ||||||||||||||
| 5,310,000 | California Statewide Communities Development Authority, California, Redlands Community Hospital, Revenue Bonds, Series 2016 | 5.000 | 10/01/46 | 5,222,407 | ||||||||||||||
| 1,000,000 | California Statewide Communities Development Authority, California, Revenue Bonds, Loma Linda University Medical Center, Series 2014A | 5.250 | 12/01/34 | 1,000,483 | ||||||||||||||
| See Notes to Financial Statements |
65 |
Portfolio of Investments August 31, 2025 (continued)
NAC
| PRINCIPAL | DESCRIPTION | RATE | MATURITY | VALUE | ||||||||||||||
| |
|
|||||||||||||||||
| HEALTH CARE (continued) | ||||||||||||||||||
| $ | 1,200,000 | California Statewide Communities Development Authority, California, Revenue Bonds, Loma Linda University Medical Center, Series 2014A | 5.250% | 12/01/44 | $ | 1,165,734 | ||||||||||||
| 2,375,000 | California Statewide Communities Development Authority, California, Revenue Bonds, Loma Linda University Medical Center, Series 2014A | 5.500 | 12/01/54 | 2,297,888 | ||||||||||||||
| 13,235,000 | (a) | California Statewide Communities Development Authority, California, Revenue Bonds, Loma Linda University Medical Center, Series 2016A | 5.250 | 12/01/56 | 12,082,791 | |||||||||||||
| 46,490,000 | (a) | California Statewide Communities Development Authority, California, Revenue Bonds, Loma Linda University Medical Center, Series 2018A | 5.500 | 12/01/58 | 44,771,520 | |||||||||||||
| 2,345,000 | California Statewide Communities Development Authority, Revenue Bonds, Adventist Health System/West, Series 2015A | 5.000 | 03/01/35 | 2,352,175 | ||||||||||||||
| 5,000,000 | California Statewide Communities Development Authority, Revenue Bonds, Adventist Health System/West, Series 2018A | 5.000 | 03/01/42 | 4,987,325 | ||||||||||||||
| 3,760,000 | California Statewide Communities Development Authority, Revenue Bonds, Adventist Health System/West, Series 2018A | 5.000 | 03/01/48 | 3,612,027 | ||||||||||||||
| 6,465,000 | California Statewide Communities Development Authority, Revenue Bonds, John Muir Health, Series 2016A | 4.000 | 08/15/51 | 5,601,868 | ||||||||||||||
| 4,000,000 | California Statewide Community Development Authority, Certificates of Participation, Methodist Hospital of Southern California, Series 2018 | 5.000 | 01/01/48 | 4,012,181 | ||||||||||||||
| 2,475,000 | California Statewide Community Development Authority, Health Revenue Bonds, Enloe Medical Center, Refunding Series 2022A - AGM Insured |
5.250 | 08/15/52 | 2,501,082 | ||||||||||||||
| 3,920,000 | Madera County, California, Certificates of Participation, Valley Children’s Hospital Project, Series 1995 - NPFG Insured | 5.750 | 03/15/28 | 4,044,633 | ||||||||||||||
| 21,355,000 | Palomar Pomerado Health System, California, Revenue Bonds, Refunding Series 2016 | 5.000 | 11/01/36 | 18,964,914 | ||||||||||||||
| 4,500,000 | Palomar Pomerado Health System, California, Revenue Bonds, Refunding Series 2016 | 4.000 | 11/01/39 | 3,290,863 | ||||||||||||||
| 9,000,000 | University of California Regents, Medical Center Pooled Revenue Bonds, Series 2022P | 5.000 | 05/15/47 | 9,064,080 | ||||||||||||||
| 4,410,000 | University of California Regents, Medical Center Pooled Revenue Bonds, Series 2022P | 4.000 | 05/15/53 | 3,743,208 | ||||||||||||||
| 755,000 | Washington Township Health Care District, California, Revenue Bonds, Series 2023A | 5.750 | 07/01/53 | 770,730 | ||||||||||||||
| |
|
|||||||||||||||||
| TOTAL HEALTH CARE | 489,098,790 | |||||||||||||||||
| |
||||||||||||||||||
| HOUSING/MULTIFAMILY - 19.0% (10.9% of Total Investments) | ||||||||||||||||||
| 11,535,000 | (a) | California Community Housing Agency, California, Essential Housing Revenue Bonds, Creekwood, Series 2021A | 4.000 | 02/01/56 | 7,312,690 | |||||||||||||
| 22,070,000 | (a) | California Community Housing Agency, California, Essential Housing Revenue Bonds, Glendale Properties, Junior Series 2021A‑2 | 4.000 | 08/01/47 | 16,113,393 | |||||||||||||
| 35,110,000 | (a) | California Community Housing Agency, California, Essential Housing Revenue Bonds, Serenity at Larkspur Apartments, Series 2020A | 5.000 | 02/01/50 | 22,804,672 | |||||||||||||
| 660,000 | (a) | California Community Housing Agency, California, Essential Housing Revenue Bonds, Summit at Sausalito Apartments, Series 2021A‑2 | 4.000 | 02/01/50 | 475,272 | |||||||||||||
| 2,020,000 | (a) | California Community Housing Agency, California, Essential Housing Revenue Bonds, The Arbors, Series 2020A | 5.000 | 08/01/50 | 1,798,298 | |||||||||||||
| 1,385,000 | (a) | California Community Housing Agency, California, Essential Housing Revenue Bonds, Verdant at Green Valley Apartments, Series 2019A | 5.000 | 08/01/49 | 1,213,723 | |||||||||||||
| 9,320,000 | (a) | California Community Housing Agency, Workforce Housing Revenue Bonds, Annadel Apartments, Series 2019A | 5.000 | 04/01/49 | 7,548,751 | |||||||||||||
| 20,569,337 | California Housing Finance Agency, Municipal Certificate Revenue Bonds, Class A Series 2019‑2 | 4.000 | 03/20/33 | 20,861,274 | ||||||||||||||
| 13,156,719 | California Housing Finance Agency, Municipal Certificate Revenue Bonds, Class A Series 2021‑1 | 3.500 | 11/20/35 | 12,416,052 | ||||||||||||||
| 4,922,182 | California Housing Finance Agency, Municipal Certificate Revenue Bonds, Class A Series 2021‑3 | 3.250 | 08/20/36 | 4,623,612 | ||||||||||||||
| 66 |
See Notes to Financial Statements |
| PRINCIPAL | DESCRIPTION | RATE | MATURITY | VALUE | ||||||||||||||
| |
|
|||||||||||||||||
| HOUSING/MULTIFAMILY (continued) | ||||||||||||||||||
| $ | 3,218,856 | California Housing Finance Agency, Municipal Certificate Revenue Bonds, Class A Series2019‑1 | 4.250% | 01/15/35 | $ | 3,287,706 | ||||||||||||
| 17,474,494 | California Housing Finance Agency, Municipal Certificate Revenue Bonds, Class A Social Certificates Series 2023-1 | 4.375 | 09/20/36 | 17,550,695 | ||||||||||||||
| 1,465,000 | (a) | California Public Finance Authority, University Housing Revenue Bonds, National Campus Community Development - Claremont Properties LLC Claremont Colleges Project, Refunding Series 2023A | 5.500 | 07/01/50 | 1,473,016 | |||||||||||||
| 1,000,000 | (a) | California Public Finance Authority, University Housing Revenue Bonds, National Campus Community Development - Claremont Properties LLC Claremont Colleges Project, Refunding Series 2023A | 6.000 | 07/01/53 | 1,049,557 | |||||||||||||
| 23,750,000 | (a) | CMFA Special Finance Agency I, California, Essential Housing Revenue Bonds, The Mix at Center City, Series 2021A‑2 | 4.000 | 04/01/56 | 17,156,865 | |||||||||||||
| 8,060,000 | (a) | CMFA Special Finance Agency, California, Essential Housing Revenue Bonds, Enclave Apartments, Senior Series 2022A-1 | 4.000 | 08/01/58 | 5,765,816 | |||||||||||||
| 3,265,000 | (a) | CSCDA Community Improvement Authority, California, Essential Housing Revenue Bonds, 777 Place-Pomona, Senior Lien Series 2021A‑1 | 3.600 | 05/01/47 | 2,549,777 | |||||||||||||
| 11,510,000 | (a) | CSCDA Community Improvement Authority, California, Essential Housing Revenue Bonds, 777 Place-Pomona, Senior Lien Series 2021A‑2 | 3.250 | 05/01/57 | 7,421,186 | |||||||||||||
| 12,910,000 | (a) | CSCDA Community Improvement Authority, California, Essential Housing Revenue Bonds, Acacia on Santa Rosa Creek, Senior Lien Series 2021A | 4.000 | 10/01/56 | 10,024,898 | |||||||||||||
| 7,450,000 | (a) | CSCDA Community Improvement Authority, California, Essential Housing Revenue Bonds, Altana Glendale, Series 2021A‑1 | 3.500 | 10/01/46 | 5,847,995 | |||||||||||||
| 20,500,000 | (a) | CSCDA Community Improvement Authority, California, Essential Housing Revenue Bonds, Altana Glendale, Series 2021A‑2 | 4.000 | 10/01/56 | 14,912,376 | |||||||||||||
| 26,165,000 | (a) | CSCDA Community Improvement Authority, California, Essential Housing Revenue Bonds, Center City Anaheim, Series 2020A | 5.000 | 01/01/54 | 22,643,531 | |||||||||||||
| 4,575,000 | (a) | CSCDA Community Improvement Authority, California, Essential Housing Revenue Bonds, Jefferson-Anaheim Series 2021A‑1 | 2.875 | 08/01/41 | 4,026,877 | |||||||||||||
| 7,030,000 | (a) | CSCDA Community Improvement Authority, California, Essential Housing Revenue Bonds, Jefferson-Anaheim Series 2021A‑2 | 3.125 | 08/01/56 | 4,983,597 | |||||||||||||
| 3,565,000 | (a) | CSCDA Community Improvement Authority, California, Essential Housing Revenue Bonds, Moda at Monrovia Station, Social Series 2021A‑1 | 3.400 | 10/01/46 | 2,670,435 | |||||||||||||
| 23,660,000 | (a) | CSCDA Community Improvement Authority, California, Essential Housing Revenue Bonds, Moda at Monrovia Station, Social Series 2021A‑2 | 4.000 | 10/01/56 | 17,106,279 | |||||||||||||
| 2,215,000 | (a) | CSCDA Community Improvement Authority, California, Essential Housing Revenue Bonds, Monterrey Station Apartments, Senior Lien Series 2021A‑1 | 3.000 | 07/01/43 | 1,637,466 | |||||||||||||
| 9,645,000 | (a) | CSCDA Community Improvement Authority, California, Essential Housing Revenue Bonds, Monterrey Station Apartments, Senior Lien Series 2021A‑1 | 3.125 | 07/01/56 | 5,920,938 | |||||||||||||
| 7,345,000 | (a) | CSCDA Community Improvement Authority, California, Essential Housing Revenue Bonds, Oceanaire-Long Beach, Social Series 2021A‑2 | 4.000 | 09/01/56 | 5,177,792 | |||||||||||||
| 450,000 | (a) | CSCDA Community Improvement Authority, California, Essential Housing Revenue Bonds, Orange City Portfolio, Mezzanine Lien Series 2021B | 4.000 | 03/01/57 | 310,853 | |||||||||||||
| 11,140,000 | (a) | CSCDA Community Improvement Authority, California, Essential Housing Revenue Bonds, Parallel-Anaheim Series 2021A | 4.000 | 08/01/56 | 9,442,144 | |||||||||||||
| 4,020,000 | (a) | CSCDA Community Improvement Authority, California, Essential Housing Revenue Bonds, Pasadena Portfolio Social Bond, Mezzanine Senior Series 2021B | 4.000 | 12/01/56 | 2,908,702 | |||||||||||||
| 8,025,000 | (a) | CSCDA Community Improvement Authority, California, Essential Housing Revenue Bonds, Union South Bay, Series 2021A‑2 | 4.000 | 07/01/56 | 6,168,702 | |||||||||||||
| 2,010,000 | (a) | CSCDA Community Improvement Authority, California, Essential Housing Revenue Bonds, Waterscape Apartments, Mezzanine Lien Series 2021B | 4.000 | 09/01/46 | 1,583,067 | |||||||||||||
| See Notes to Financial Statements |
67 |
Portfolio of Investments August 31, 2025 (continued)
NAC
| PRINCIPAL | DESCRIPTION | RATE | MATURITY | VALUE | ||||||||||||||
| |
|
|||||||||||||||||
| HOUSING/MULTIFAMILY (continued) | ||||||||||||||||||
| $ | 5,700,000 | (a) | CSCDA Community Improvement Authority, California, Essential Housing Revenue Bonds, Westgate Phase 1‑Pasadena Apartments, Senior Lien Series 2021A‑1 | 3.000% | 06/01/47 | $ | 3,774,803 | |||||||||||
| 20,760,000 | (a) | CSCDA Community Improvement Authority, California, Essential Housing Revenue Bonds, Westgate Phase 1‑Pasadena Apartments, Senior Lien Series 2021A‑2 | 3.125 | 06/01/57 | 11,812,542 | |||||||||||||
| 21,185,000 | CSCDA Community Improvement Authority, California, Essential Housing Revenue Bonds, Wood Creek Apartments, Senior Lien Series 2021A‑1 | 3.000 | 12/01/49 | 13,541,857 | ||||||||||||||
| 4,190,000 | Los Angeles Housing Authority, California, Multifamily Housing Revenue Bonds, Clarendon Apartments, Senior Series 2024A | 4.400 | 12/01/54 | 3,597,083 | ||||||||||||||
| 7,290,000 | Los Angeles Housing Authority, California, Multifamily Housing Revenue Bonds, Clarendon Apartments, Senior Series 2024A | 4.500 | 12/01/59 | 6,414,069 | ||||||||||||||
| |
|
|||||||||||||||||
| TOTAL HOUSING/MULTIFAMILY | 305,928,361 | |||||||||||||||||
| |
||||||||||||||||||
| LONG-TERM CARE - 0.5% (0.3% of Total Investments) | ||||||||||||||||||
| 6,120,000 | California Municipal Finance Authority, Revenue Bonds, HumanGood California Obligated Group, Refunding Series 2019 | 4.000 | 10/01/37 | 5,872,689 | ||||||||||||||
| 1,900,000 | California Statewide Communities Development Authority, Revenue Bonds, Odd Fellows Home of California Project, Insured Refunding Series 2023A | 4.000 | 04/01/43 | 1,773,388 | ||||||||||||||
| 1,000,000 | California Statewide Communities Development Authority, Revenue Bonds, Odd Fellows Home of California Project, Insured Refunding Series 2023A |
4.125 | 04/01/53 | 885,548 | ||||||||||||||
| |
|
|||||||||||||||||
| TOTAL LONG-TERM CARE | 8,531,625 | |||||||||||||||||
| |
||||||||||||||||||
| TAX OBLIGATION/GENERAL - 31.3% (18.0% of Total Investments) | ||||||||||||||||||
| 20,995,000 | Berkeley Unified School District, Alameda County, California, General Obligation Bonds, Election of 2020 Series 2024D | 4.000 | 08/01/54 | 18,189,816 | ||||||||||||||
| 4,420,000 | Butte-Glenn Community College District, Butte and Glenn Counties, California, General Obligation Bonds, Election 2016 Series 2017A | 5.250 | 08/01/46 | 4,479,496 | ||||||||||||||
| 2,500,000 | California State, General Obligation Bonds, Refunding Various Purpose Bid Group C Series 2016 | 5.000 | 09/01/32 | 2,555,729 | ||||||||||||||
| 4,000,000 | California State, General Obligation Bonds, Refunding Various Purpose Series 2016 | 5.000 | 09/01/35 | 4,068,970 | ||||||||||||||
| 3,570,000 | California State, General Obligation Bonds, Refunding Various Purpose Series 2021. Forward Delivery | 5.000 | 09/01/41 | 3,750,158 | ||||||||||||||
| 50,000 | California State, General Obligation Bonds, Series 2013 | 5.000 | 02/01/29 | 50,091 | ||||||||||||||
| 1,000,000 | California State, General Obligation Bonds, Various Purpose Refunding Series 2016 | 5.000 | 09/01/34 | 1,018,921 | ||||||||||||||
| 14,780,000 | California State, General Obligation Bonds, Various Purpose Series 2017 | 5.000 | 11/01/47 | 14,942,641 | ||||||||||||||
| 5,000,000 | California State, General Obligation Bonds, Various Purpose Series 2018. Bid Group A/B | 5.000 | 10/01/48 | 5,060,211 | ||||||||||||||
| 1,770,000 | California State, General Obligation Bonds, Various Purpose Series 2020 | 4.000 | 11/01/45 | 1,603,917 | ||||||||||||||
| 870,000 | Centinela Valley Union High School District, Los Angeles County, California, General Obligation Bonds, Series 2002A - NPFG Insured | 5.250 | 02/01/26 | 879,677 | ||||||||||||||
| 5,400,000 | Central Unified School District, Fresno County, California, General Obligation Bonds, 2016 Election Series 2018B. | 4.000 | 08/01/48 | 4,841,423 | ||||||||||||||
| 7,850,000 | Cerritos Community College District, California, General Obligation Bonds, Election of 2022 Series 2024A | 4.000 | 08/01/49 | 6,961,134 | ||||||||||||||
| 7,860,000 | Corona-Norco Unified School District, Riverside County, California, General Obligation Bonds, Election 2014, Series 2019C - BAM Insured | 3.000 | 08/01/44 | 5,969,400 | ||||||||||||||
| 15,285,000 | Desert Community College District, Riverside County, California, General Obligation Bonds, Election of 2016 Series 2024 | 4.000 | 08/01/51 | 13,287,024 | ||||||||||||||
| 5,000,000 | Elk Grove Unified School District, Sacramento County, California, General Obligation Bonds, Election of 2016, Series 2017 | 4.000 | 08/01/46 | 4,525,758 | ||||||||||||||
| 15,250,000 | Glendale Community College District, Los Angeles County, California, General Obligation Bonds, Election 2016 Taxable Refunding Series 2020B | 4.000 | 08/01/50 | 13,246,748 | ||||||||||||||
| 6,185,000 | Grossmont-Cuyamaca Community College District, California, General Obligation Bonds, Refunding Series 2018 | 4.000 | 08/01/47 | 5,575,216 | ||||||||||||||
| 68 |
See Notes to Financial Statements |
| PRINCIPAL | DESCRIPTION | RATE | MATURITY | VALUE | ||||||||||||||
| |
|
|||||||||||||||||
| TAX OBLIGATION/GENERAL (continued) | ||||||||||||||||||
| $ | 5,150,000 | Hacienda La Puente Unified School District Facilities Financing Authority, California, General Obligation Revenue Bonds, Program Series 2007 - AGM Insured | 5.000% | 08/01/26 | $ | 5,281,673 | ||||||||||||
| 3,000,000 | Hacienda La Puente Unified School District, Los Angeles County, California, General Obligation Bonds, 2016 Election, Series 2017A | 4.000 | 08/01/47 | 2,704,228 | ||||||||||||||
| 5,585,000 | Lake Elsinore Unified School District, Riverside County, California, General Obligation Bonds, 2016 Election Series B - BAM Insured | 4.000 | 08/01/49 | 4,890,802 | ||||||||||||||
| 5,630,000 | (c) | Lake Tahoe Unified School District, El Dorado County, California, General Obligation Bonds, Series 2010 - AGM Insured | 0.000 | 08/01/45 | 4,505,559 | |||||||||||||
| 4,140,000 | Los Angeles Community College District, California, General Obligation Bonds, 2008 Election Series 2017J | 4.000 | 08/01/41 | 3,948,055 | ||||||||||||||
| 14,425,000 | Los Angeles County, California, Tax and Revenue Anticipation Notes, Series 2025‑26 | 5.000 | 06/30/26 | 14,782,971 | ||||||||||||||
| 1,285,000 | Los Angeles Unified School District, Los Angeles County, California, General Obligation Bonds, Measure Q Series 2020C | 4.000 | 07/01/40 | 1,254,249 | ||||||||||||||
| 44,585,000 | Los Angeles, California, General Obligation Bonds, Tax & Revenue Anticipation Notes, Series 2025 | 5.000 | 06/25/26 | 45,662,758 | ||||||||||||||
| 3,100,000 | Manteca Unified School District, San Joaquin County, California, General Obligation Bonds, Election 2014 Series 2017B | 4.000 | 08/01/42 | 2,877,662 | ||||||||||||||
| 10,000,000 | Marin Healthcare District, Marin County, California, General Obligation Bonds, 2013 Election, Series 2015A | 4.000 | 08/01/40 | 9,546,033 | ||||||||||||||
| 7,500,000 | Marin Healthcare District, Marin County, California, General Obligation Bonds, 2013 Election, Series 2015A | 4.000 | 08/01/45 | 6,559,840 | ||||||||||||||
| 4,100,000 | Monrovia Unified School District, Los Angeles County, California, General Obligation Bonds, Election 1997 Series 2000B - FGIC Insured | 0.000 | 08/01/27 | 3,911,445 | ||||||||||||||
| 4,650,000 | Monterey Peninsula Community College District, Monterey County, California, General Obligation Bonds, Election of 2020 Series 2024B | 4.000 | 08/01/51 | 4,046,503 | ||||||||||||||
| 6,950,000 | Morgan Hill Unified School District, Santa Clara County, California, General Obligation Bonds, Election 2012 Series 2017B | 4.000 | 08/01/47 | 6,274,869 | ||||||||||||||
| 10,765,000 | North Orange County Community College District, California, General Obligation Bonds, Election of 2002 Series 2003B - FGIC Insured | 0.000 | 08/01/27 | 10,332,294 | ||||||||||||||
| 5,000,000 | Oakland Unified School District, Alameda County, California, General Obligation Bonds, Election 2020, Series 2023A - AGM Insured | 5.250 | 08/01/48 | 5,202,245 | ||||||||||||||
| 10,330,000 | Palomar Pomerado Health, California, General Obligation Bonds, Convertible Capital Appreciation, Election 2004 Series 2010A | 0.000 | 08/01/35 | 5,831,868 | ||||||||||||||
| 5,000,000 | Paramount Unified School District, Los Angeles County, California, General Obligation Bonds, Election 2006 Series 2011 | 6.375 | 08/01/45 | 5,652,636 | ||||||||||||||
| 7,350,000 | Pleasant Valley School District, Ventura County, California, General Obligation Bonds, Refunding Series B | 4.000 | 08/01/46 | 6,652,864 | ||||||||||||||
| 16,736,000 | Puerto Rico, General Obligation Bonds, Restructured Series 2022A‑1 | 4.000 | 07/01/41 | 14,571,910 | ||||||||||||||
| 28,000,000 | San Bernardino Community College District, California, General Obligation Bonds, Election of 2008 Series 2009B | 0.000 | 08/01/44 | 11,170,057 | ||||||||||||||
| 7,500,000 | San Francisco Bay Area Rapid Transit District, California, General Obligation Bonds, Election of 2016, Green Series 2022D‑1 | 4.250 | 08/01/52 | 6,840,075 | ||||||||||||||
| 9,760,000 | San Francisco Community College District, California, General Obligation Bonds, Election 2020 Series 2020A | 4.000 | 06/15/45 | 8,909,156 | ||||||||||||||
| 4,970,000 | San Rafael City High School District, Marin County, California, General Obligation Bonds, Series 2004B - FGIC Insured | 0.000 | 08/01/27 | 4,740,539 | ||||||||||||||
| 10,000,000 | Santa Cruz City High School District, Santa Cruz County, California, General Obligation Bonds, Election of 2022, Series 2024A | 4.000 | 08/01/54 | 8,657,787 | ||||||||||||||
| 5,530,000 | (c) | Stockton Unified School District, San Joaquin County, California, General Obligation Bonds, Election 2008 Series 2011D - AGM Insured | 0.000 | 08/01/50 | 6,070,937 | |||||||||||||
| 26,000,000 | (c) | Sylvan Union School District, Stanislaus County, California, General Obligation Bonds, Election of 2006, Series 2010 - AGM Insured | 0.000 | 08/01/49 | 21,792,332 | |||||||||||||
| See Notes to Financial Statements |
69 |
Portfolio of Investments August 31, 2025 (continued)
NAC
| PRINCIPAL | DESCRIPTION | RATE | MATURITY | VALUE | ||||||||||||||
| |
|
|||||||||||||||||
| TAX OBLIGATION/GENERAL (continued) | ||||||||||||||||||
| $ | 4,740,000 | Washington Township Health Care District, Alameda County, California, General Obligation Bonds, 2004 Election Series 2013B | 5.500% | 08/01/38 | $ | 4,750,305 | ||||||||||||
| 4,830,000 | Washington Township Health Care District, Alameda County, California, General Obligation Bonds, 2004 Election Series 2013B | 5.500 | 08/01/40 | 4,840,020 | ||||||||||||||
| 20,510,000 | Washington Township Health Care District, Alameda County, California, General Obligation Bonds, 2004 Election Series 2013B | 5.000 | 08/01/43 | 20,245,591 | ||||||||||||||
| 4,355,000 | Washington Township Health Care District, Alameda County, California, General Obligation Bonds, 2012 Election Series 2013A | 5.500 | 08/01/38 | 4,364,468 | ||||||||||||||
| 3,500,000 | Washington Township Health Care District, Alameda County, California, General Obligation Bonds, 2012 Election Series 2013A | 5.500 | 08/01/40 | 3,507,261 | ||||||||||||||
| 8,410,000 | Washington Township Health Care District, Alameda County, California, General Obligation Bonds, 2012 Election Series 2015B | 4.000 | 08/01/45 | 7,478,648 | ||||||||||||||
| 750,000 | Washington Township Health Care District, California, General Obligation Bonds, 2020 Election Series 2023B - AGM Insured | 4.250 | 08/01/45 | 723,977 | ||||||||||||||
| 2,575,000 | Washington Township Health Care District, California, General Obligation Bonds, 2020 Election Series 2023B | 5.250 | 08/01/48 | 2,714,036 | ||||||||||||||
| 140,160,000 | (c) | Yosemite Community College District, California, General Obligation Bonds, Capital Appreciation, Election 2004, Series 2010D | 0.000 | 08/01/42 | 111,972,730 | |||||||||||||
| |
|
|||||||||||||||||
| TOTAL TAX OBLIGATION/GENERAL | 504,274,713 | |||||||||||||||||
| |
||||||||||||||||||
| TAX OBLIGATION/LIMITED - 16.3% (9.4% of Total Investments) | ||||||||||||||||||
| 1,655,000 | Bell Community Housing Authority, California, Lease Revenue Bonds, Series 2005 - AMBAC Insured | 5.000 | 10/01/36 | 1,601,977 | ||||||||||||||
| 615,000 | Brentwood Infrastructure Financing Authority, California, Infrastructure Revenue Bonds, Refunding Subordinated Series 2014B | 5.000 | 09/02/36 | 615,158 | ||||||||||||||
| 1,200,000 | California Infrastructure and Economic Development Bank, Lease Revenue Bonds, California State Teachers’ Retirement System Headquarters Expansion, Green Bond-Climate Bond Certified Series 2019 | 5.000 | 08/01/44 | 1,209,914 | ||||||||||||||
| 13,520,000 | California State Public Works Board, Lease Revenue Bonds, Various Capital Projects, Series 2014E | 5.000 | 09/01/39 | 13,535,155 | ||||||||||||||
| 1,605,000 | California Statewide Communities Development Authority, Statewide Community Infrastructure Program Revenue Bonds, Series 2016B | 5.000 | 09/02/46 | 1,603,811 | ||||||||||||||
| 2,550,000 | California Statewide Communities Development Authority, Statewide Community Infrastructure Program Revenue Bonds, Series 2017C | 5.000 | 09/02/47 | 2,500,676 | ||||||||||||||
| 2,000,000 | California Statewide Communities Development Authority, Statewide Community Infrastructure Program Revenue Bonds, Series 2018A | 5.000 | 09/02/47 | 1,995,257 | ||||||||||||||
| 1,355,000 | Corona, California, Special Tax Bonds, Community Facilities District 2018‑1 Bedford, Series 2018A | 5.000 | 09/01/43 | 1,359,386 | ||||||||||||||
| 545,000 | Golden State Tobacco Securitization Corporation, California, Tobacco Settlement Asset-Backed Revenue Bonds, Series 2022A‑1 | 5.000 | 06/01/51 | 520,656 | ||||||||||||||
| 9,000,000 | Government of Guam, Business Privilege Tax Bonds, Refunding Series 2015D | 5.000 | 11/15/32 | 9,044,463 | ||||||||||||||
| 11,000,000 | Government of Guam, Business Privilege Tax Bonds, Refunding Series 2015D | 5.000 | 11/15/39 | 11,054,343 | ||||||||||||||
| 5,250,000 | Irvine Facilities Financing Authority, California, Special Tax Revenue Bonds, Great Park Infrastructure Project Series 2023A | 5.000 | 09/01/43 | 5,457,574 | ||||||||||||||
| 1,000,000 | Lathrop, California, Limited Obligation Improvement Bonds, Crossroads Assessment District, Series 2015 | 5.000 | 09/02/40 | 993,925 | ||||||||||||||
| 5,620,000 | Los Angeles County Metropolitan Transportation Authority, California, Measure R Sales Tax Revenue Bonds, Senior Series 2016A | 5.000 | 06/01/37 | 5,696,175 | ||||||||||||||
| 70 |
See Notes to Financial Statements |
| PRINCIPAL | DESCRIPTION | RATE | MATURITY | VALUE | ||||||||||||||
| |
|
|||||||||||||||||
| TAX OBLIGATION/LIMITED (continued) | ||||||||||||||||||
| $ | 10,455,000 | Los Angeles County Metropolitan Transportation Authority, California, Measure R Sales Tax Revenue Bonds, Senior Series 2016A | 5.000% | 06/01/38 | $ | 10,571,291 | ||||||||||||
| 5,000,000 | Los Angeles County Metropolitan Transportation Authority, California, Proposition C Sales Tax Revenue Bonds, Green Senior Lien Series 2019A | 5.000 | 07/01/39 | 5,172,301 | ||||||||||||||
| 20,735,000 | Los Angeles County Metropolitan Transportation Authority, California, Proposition C Sales Tax Revenue Bonds, Green Senior Lien Series 2019A | 5.000 | 07/01/44 | 21,229,816 | ||||||||||||||
| 3,995,000 | Los Angeles County Metropolitan Transportation Authority, California, Proposition C Sales Tax Revenue Bonds, Senior Lien Series 2017A | 5.000 | 07/01/42 | 4,043,518 | ||||||||||||||
| 2,000,000 | Los Angeles County Public Works Financing Authority, California, Lease Revenue Bonds, Series 2019E‑1 | 5.000 | 12/01/49 | 2,001,359 | ||||||||||||||
| 8,000,000 | (d) | Los Angeles County Public Works Financing Authority, California, Lease Revenue Bonds, Series 2025J | 5.250 | 12/01/54 | 8,320,789 | |||||||||||||
| 1,835,000 | Modesto, California, Special Tax Bonds, Community Facilities District 2004‑1 Village One 2, Refunding Series 2014 | 5.000 | 09/01/31 | 1,837,545 | ||||||||||||||
| 1,000,000 | Norco Redevelopment Agency, California, Tax Allocation Bonds, Project Area 1, Series 2009 | 7.000 | 03/01/34 | 1,003,322 | ||||||||||||||
| 6,055,000 | Orange County Local Transportation Authority, California, Measure M2 Sales Tax Revenue Bonds, Limited Tax Series 2019 | 5.000 | 02/15/41 | 6,279,213 | ||||||||||||||
| 8,831,000 | Puerto Rico Sales Tax Financing Corporation, Sales Tax Revenue Bonds, Restructured 2018A‑1 | 0.000 | 07/01/46 | 2,791,103 | ||||||||||||||
| 14,741,000 | Puerto Rico Sales Tax Financing Corporation, Sales Tax Revenue Bonds, Restructured 2018A‑1 | 0.000 | 07/01/51 | 3,440,781 | ||||||||||||||
| 82,962,000 | Puerto Rico Sales Tax Financing Corporation, Sales Tax Revenue Bonds, Restructured 2018A‑1 | 5.000 | 07/01/58 | 76,097,574 | ||||||||||||||
| 5,500,000 | Puerto Rico Sales Tax Financing Corporation, Sales Tax Revenue Bonds, Taxable Restructured Cofina Project Series 2019A‑2 | 4.329 | 07/01/40 | 5,100,932 | ||||||||||||||
| 43,000 | Puerto Rico Sales Tax Financing Corporation, Sales Tax Revenue Bonds, Taxable Restructured Cofina Project Series 2019A‑2 | 4.536 | 07/01/53 | 37,088 | ||||||||||||||
| 8,185,000 | Puerto Rico Sales Tax Financing Corporation, Sales Tax Revenue Bonds, Taxable Restructured Cofina Project Series 2019A‑2 | 4.784 | 07/01/58 | 7,230,841 | ||||||||||||||
| 815,000 | River Islands Public Financing Authority, California, Special Tax Bonds, Community Facilities District 2003‑1 Improvement Area 1, Refunding Series 2022A‑1 - AGM Insured | 4.250 | 09/01/47 | 746,610 | ||||||||||||||
| 5,000,000 | Riverside County Transportation Commission, California, Sales Tax Revenue Bonds, Refunding Limited Tax Series 2017B | 5.000 | 06/01/38 | 5,183,033 | ||||||||||||||
| 385,000 | Roseville, California, Special Tax Bonds, Community Facilities District 1 Westpark, Refunding Series 2015 | 5.000 | 09/01/31 | 385,245 | ||||||||||||||
| 575,000 | Roseville, California, Special Tax Bonds, Community Facilities District 1 Westpark, Refunding Series 2015 | 5.000 | 09/01/37 | 575,139 | ||||||||||||||
| 4,250,000 | Sacramento City Financing Authority, California, Tax Allocation Revenue Bonds, Merged Downtown Sacramento and Oak Park Projects, Series 2005A - FGIC Insured | 0.000 | 12/01/31 | 3,388,391 | ||||||||||||||
| 610,000 | San Buenaventura Redevelopment Agency, California, Tax Allocation Bonds, Merged Project Areas, Series 2008 | 7.750 | 08/01/28 | 612,426 | ||||||||||||||
| 1,325,000 | San Buenaventura Redevelopment Agency, California, Tax Allocation Bonds, Merged Project Areas, Series 2008 | 8.000 | 08/01/38 | 1,329,544 | ||||||||||||||
| 1,620,000 | San Francisco City and County Redevelopment Agency Successor Agency, California, Special Tax Bonds, Community Facilities District 7, Hunters Point Shipyard Phase One Improvements, Refunding Series 2014 | 5.000 | 08/01/39 | 1,622,529 | ||||||||||||||
| 5,000,000 | San Francisco City and County Redevelopment Agency Successor Agency, California, Tax Allocation Bonds, Mission Bay North Redevelopment Project, Refunding Series 2016A - NPFG Insured | 5.000 | 08/01/41 | 5,025,422 | ||||||||||||||
| 280,000 | Signal Hill Redevelopment Agency, California, Project 1 Tax Allocation Bonds, Series 2011 | 7.000 | 10/01/26 | 280,870 | ||||||||||||||
| 2,500,000 | Stockton Public Financing Authority, California, Revenue Bonds, Arch Road East Community Facility District 99‑02, Series 2018A | 5.000 | 09/01/37 | 2,553,618 | ||||||||||||||
| 495,000 | (a) | Temecula Public Financing Authority, California, Special Tax Bonds, Community Facilities District 16‑01, Series 2017 | 5.500 | 09/01/27 | 508,801 | |||||||||||||
| See Notes to Financial Statements |
71 |
Portfolio of Investments August 31, 2025 (continued)
NAC
| PRINCIPAL | DESCRIPTION | RATE | MATURITY | VALUE | ||||||||||||||
| |
|
|||||||||||||||||
| TAX OBLIGATION/LIMITED (continued) | ||||||||||||||||||
| $ | 1,435,000 | (a) | Temecula Public Financing Authority, California, Special Tax Bonds, Community Facilities District 16‑01, Series 2017 | 5.750% | 09/01/32 | $ | 1,498,595 | |||||||||||
| 5,520,000 | (a) | Temecula Public Financing Authority, California, Special Tax Bonds, Community Facilities District 16‑01, Series 2017 | 6.250 | 09/01/47 | 5,634,062 | |||||||||||||
| 1,700,000 | Tracy, California, Special Tax Bonds, Community Facilities District 2016‑1 Tracy Hills, Improvement Area 2, Series 2023 | 5.750 | 09/01/48 | 1,762,817 | ||||||||||||||
| 4,315,000 | Transbay Joint Powers Authority, California, Tax Allocation Bonds, Senior Green Series 2020A | 5.000 | 10/01/45 | 4,156,269 | ||||||||||||||
| 7,285,000 | Transbay Joint Powers Authority, California, Tax Allocation Bonds, Senior Green Series 2020A | 5.000 | 10/01/49 | 6,847,912 | ||||||||||||||
| 1,430,000 | Virgin Islands Public Finance Authority, Gross Receipts Taxes Loan Note, Refunding Series 2012A - AGM Insured | 5.000 | 10/01/32 | 1,433,761 | ||||||||||||||
| 2,105,000 | West Sacramento, California, Special Tax Bonds, Community Facilities District 27 Bridge District, Refunding Series 2016 | 5.000 | 09/01/40 | 2,110,302 | ||||||||||||||
| 4,205,000 | West Sacramento, California, Special Tax Bonds, Community Facilities District 27 Bridge District, Series 2017 | 5.000 | 09/01/47 | 4,091,290 | ||||||||||||||
| |
|
|||||||||||||||||
| TOTAL TAX OBLIGATION/LIMITED | 262,092,579 | |||||||||||||||||
| |
||||||||||||||||||
| TRANSPORTATION - 28.1% (16.1% of Total Investments) | ||||||||||||||||||
| 7,025,000 | Bay Area Toll Authority, California, Revenue Bonds, San Francisco Bay Area Toll Bridge, Series 2023F‑2 | 4.125 | 04/01/54 | 6,195,653 | ||||||||||||||
| 10,000,000 | Bay Area Toll Authority, California, Revenue Bonds, San Francisco Bay Area Toll Bridge, Subordinate Fixed Rate Series 2017S‑7 | 4.000 | 04/01/37 | 10,034,808 | ||||||||||||||
| 5,760,000 | Burbank-Glendale-Pasadena Airport Authority, California, Airport Revenue Bonds, Senior Series 2024B - AGM Insured, (AMT) | 4.500 | 07/01/54 | 5,192,936 | ||||||||||||||
| 7,775,000 | California Municipal Finance Authority, Special Facility Revenue Bonds, United Airlines, Inc. Los Angeles International Airport Project, Series 2019, (AMT) | 4.000 | 07/15/29 | 7,737,102 | ||||||||||||||
| 10,979,000 | Foothill/Eastern Transportation Corridor Agency, California, Toll Road Revenue Bonds, Refunding Senior Lien Series 2021A | 4.000 | 01/15/46 | 9,983,798 | ||||||||||||||
| 7,500,000 | Long Beach, California, Harbor Revenue Bonds, Series 2019A | 5.000 | 05/15/49 | 7,612,586 | ||||||||||||||
| 11,400,000 | Los Angeles Department of Airports, California, Revenue Bonds, Los Angeles International Airport, Refunding Subordinate Green Series 2025A, (AMT) | 5.250 | 05/15/50 | 11,552,215 | ||||||||||||||
| 13,600,000 | (e) | Los Angeles Department of Airports, California, Revenue Bonds, Los Angeles International Airport, Refunding Subordinate Green Series 2025A, (AMT), (UB) | 5.250 | 05/15/50 | 13,781,590 | |||||||||||||
| 4,160,000 | Los Angeles Department of Airports, California, Revenue Bonds, Los Angeles International Airport, Refunding Subordinate Lien Private Activity Series 2021A, (AMT) | 5.000 | 05/15/46 | 4,124,863 | ||||||||||||||
| 13,625,000 | Los Angeles Department of Airports, California, Revenue Bonds, Los Angeles International Airport, Refunding Subordinate Lien Private Activity Series 2021A, (AMT) | 5.000 | 05/15/51 | 13,417,644 | ||||||||||||||
| 4,850,000 | Los Angeles Department of Airports, California, Revenue Bonds, Los Angeles International Airport, Senior Series 2022H, (AMT) | 5.000 | 05/15/42 | 4,880,504 | ||||||||||||||
| 5,080,000 | Los Angeles Department of Airports, California, Revenue Bonds, Los Angeles International Airport, Senior Series 2022H, (AMT) | 5.000 | 05/15/52 | 5,007,574 | ||||||||||||||
| 24,405,000 | Los Angeles Department of Airports, California, Revenue Bonds, Los Angeles International Airport, Subordinate Lien Series 2016B, (AMT) | 5.000 | 05/15/46 | 24,198,868 | ||||||||||||||
| 3,310,000 | Los Angeles Department of Airports, California, Revenue Bonds, Los Angeles International Airport, Subordinate Lien Series 2018C, (AMT) | 5.000 | 05/15/44 | 3,285,356 | ||||||||||||||
| 5,000,000 | Los Angeles Department of Airports, California, Revenue Bonds, Los Angeles International Airport, Subordinate Lien Series 2018D, (AMT) | 5.000 | 05/15/48 | 4,929,457 | ||||||||||||||
| 5,485,000 | Los Angeles Department of Airports, California, Revenue Bonds, Los Angeles International Airport, Subordinate Lien Series 2019E | 5.000 | 05/15/44 | 5,558,824 | ||||||||||||||
| 945,000 | Los Angeles Department of Airports, California, Revenue Bonds, Los Angeles International Airport, Subordinate Lien Series 2021D, (AMT) | 5.000 | 05/15/37 | 982,839 | ||||||||||||||
| 22,230,000 | Los Angeles Department of Airports, California, Revenue Bonds, Los Angeles International Airport, Subordinate Lien Series 2021D, (AMT) | 5.000 | 05/15/46 | 22,042,239 | ||||||||||||||
| 72 |
See Notes to Financial Statements |
| PRINCIPAL | DESCRIPTION | RATE | MATURITY | VALUE | ||||||||||||||
| |
|
|||||||||||||||||
| TRANSPORTATION (continued) | ||||||||||||||||||
| $ | 3,750,000 | Los Angeles Department of Airports, California, Revenue Bonds, Los Angeles International Airport, Subordinate Lien Series 2022A, (AMT) | 5.000% | 05/15/45 | $ | 3,731,361 | ||||||||||||
| 4,780,000 | Riverside County Transportation Commission, California, Toll Revenue Second Lien Bonds, RCTC 91 Express Lanes, Refunding Series 2021C | 4.000 | 06/01/47 | 4,055,587 | ||||||||||||||
| 7,750,000 | Riverside County Transportation Commission, California, Toll Revenue Senior Lien Bonds, RCTC 91 Express Lanes, Refunding Series 2021B‑1 | 4.000 | 06/01/46 | 6,643,012 | ||||||||||||||
| 20,000,000 | San Diego County Regional Airport Authority, California, Airport Revenue Bonds, International Senior Series 2023B, (AMT) | 5.250 | 07/01/58 | 20,216,022 | ||||||||||||||
| 3,600,000 | San Diego County Regional Airport Authority, California, Airport Revenue Bonds, Refunding Subordinate Series 2019A | 5.000 | 07/01/34 | 3,844,349 | ||||||||||||||
| 1,250,000 | San Diego County Regional Airport Authority, California, Airport Revenue Bonds, Refunding Subordinate Series 2019A | 5.000 | 07/01/36 | 1,319,417 | ||||||||||||||
| 6,000,000 | San Diego County Regional Airport Authority, California, Airport Revenue Bonds, Subordinate Series 2021A | 4.000 | 07/01/51 | 5,263,965 | ||||||||||||||
| 34,270,000 | San Francisco Airport Commission, California, Revenue Bonds, San Francisco International Airport, Governmental Purpose Second Series 2017B | 5.000 | 05/01/47 | 34,268,787 | ||||||||||||||
| 3,040,000 | San Francisco Airport Commission, California, Revenue Bonds, San Francisco International Airport, Refunding Second Series 2019A, (AMT) | 5.000 | 05/01/38 | 3,085,566 | ||||||||||||||
| 43,180,000 | San Francisco Airport Commission, California, Revenue Bonds, San Francisco International Airport, Refunding Second Series 2019A, (AMT) | 5.000 | 05/01/44 | 43,189,335 | ||||||||||||||
| 22,345,000 | San Francisco Airport Commission, California, Revenue Bonds, San Francisco International Airport, Refunding Second Series 2019A, (AMT) | 5.000 | 05/01/49 | 21,917,878 | ||||||||||||||
| 16,410,000 | San Francisco Airport Commission, California, Revenue Bonds, San Francisco International Airport, Refunding Second Series 2023C, (AMT) | 5.500 | 05/01/42 | 17,181,154 | ||||||||||||||
| 11,000,000 | San Francisco Airport Commission, California, Revenue Bonds, San Francisco International Airport, Refunding Second Series 2023C, (AMT) | 5.500 | 05/01/43 | 11,439,517 | ||||||||||||||
| 1,845,000 | San Francisco Airport Commission, California, Revenue Bonds, San Francisco International Airport, Refunding Second Series 2023C, (AMT) | 5.750 | 05/01/48 | 1,925,484 | ||||||||||||||
| 22,835,000 | San Francisco Airport Commission, California, Revenue Bonds, San Francisco International Airport, Second Series 2016B, (AMT) | 5.000 | 05/01/46 | 22,441,514 | ||||||||||||||
| 10,910,000 | San Francisco Airport Commission, California, Revenue Bonds, San Francisco International Airport, Second Series 2017A, (AMT) | 5.000 | 05/01/42 | 10,910,999 | ||||||||||||||
| 3,775,000 | San Francisco Airport Commission, California, Revenue Bonds, San Francisco International Airport, Second Series 2018D, (AMT) | 5.000 | 05/01/48 | 3,711,857 | ||||||||||||||
| 24,820,000 | San Francisco Airport Commission, California, Revenue Bonds, San Francisco International Airport, Second Series 2018D, (AMT) | 5.250 | 05/01/48 | 24,863,872 | ||||||||||||||
| 4,900,000 | San Francisco Airport Commission, California, Revenue Bonds, San Francisco International Airport, Second Series 2019E, (AMT) | 5.000 | 05/01/40 | 4,925,993 | ||||||||||||||
| 3,540,000 | San Francisco Airport Commission, California, Revenue Bonds, San Francisco International Airport, Second Series 2019E, (AMT) | 5.000 | 05/01/50 | 3,459,778 | ||||||||||||||
| 7,510,000 | San Francisco Airport Commission, California, Revenue Bonds, San Francisco International Airport, Second Series 2019F | 5.000 | 05/01/50 | 7,541,153 | ||||||||||||||
| 4,135,000 | San Francisco Airport Commission, California, Revenue Bonds, San Francisco International Airport, Second Series 2025A, (AMT) | 5.250 | 05/01/55 | 4,172,154 | ||||||||||||||
| 10,815,000 | San Francisco Airport Commission, California, Revenue Bonds, San Francisco International Airport, Second Series 2025A, (AMT) | 5.500 | 05/01/55 | 11,191,150 | ||||||||||||||
| 16,936,000 | San Joaquin Hills Transportation Corridor Agency, Orange County, California, Refunding Senior Lien Toll Road Revenue Bonds, Series 2021A | 4.000 | 01/15/50 | 14,494,306 | ||||||||||||||
| 6,250,000 | San Jose, California, Airport Revenue Bonds, Refunding Series 2017A, (AMT) |
5.000 | 03/01/47 | 6,098,874 | ||||||||||||||
| |
|
|||||||||||||||||
| TOTAL TRANSPORTATION | 452,411,940 | |||||||||||||||||
| |
||||||||||||||||||
| See Notes to Financial Statements |
73 |
Portfolio of Investments August 31, 2025 (continued)
NAC
| PRINCIPAL | DESCRIPTION | RATE | MATURITY | VALUE | ||||||||||||||
| |
|
|||||||||||||||||
| U.S. GUARANTEED - 4.2% (f)(2.4% of Total Investments) | ||||||||||||||||||
| $ | 18,400,000 | Antelope Valley Community College District, Los Angeles County, California, General Obligation Bonds, Election 2016 Series 2017A, (Pre‑refunded 2/15/27) | 5.250% | 08/01/42 | $ | 19,157,837 | ||||||||||||
| 12,880,000 | California Health Facilities Financing Authority, California, Revenue Bonds, Sutter Health, Refunding Series 2016B, (Pre‑ refunded 11/15/26) | 5.000 | 11/15/46 | 13,320,812 | ||||||||||||||
| 16,250,000 | California Health Facilities Financing Authority, California, Revenue Bonds, Sutter Health, Series 2016A, (Pre‑refunded 11/15/25) | 5.000 | 11/15/46 | 16,338,309 | ||||||||||||||
| 95,000 | California Health Facilities Financing Authority, Revenue Bonds, CommonSpirit Health, Series 2020A, (Pre‑refunded 4/01/30) | 4.000 | 04/01/49 | 101,778 | ||||||||||||||
| 7,500,000 | Desert Community College District, Riverside County, California, General Obligation Bonds, Refunding Series 2016, (Pre‑refunded 2/01/26) | 5.000 | 08/01/37 | 7,586,995 | ||||||||||||||
| 55,000 | Los Angeles Department of Airports, California, Revenue Bonds, Los Angeles International Airport, Subordinate Lien Series 2021D, (Pre‑refunded 11/15/31), (AMT) | 5.000 | 05/15/37 | 59,704 | ||||||||||||||
| 70,000 | Los Angeles Department of Airports, California, Revenue Bonds, Los Angeles International Airport, Subordinate Lien Series 2021D, (Pre‑refunded 11/15/31), (AMT) | 5.000 | 05/15/46 | 75,987 | ||||||||||||||
| 5,840,000 | Orange County Water District, California, Revenue Certificates of Participation, Series 1999A, (ETM) | 5.375 | 08/15/29 | 6,315,436 | ||||||||||||||
| 905,000 | Orange County Water District, California, Revenue Certificates of Participation, Series 2003B, (Pre‑refunded 8/15/32) - NPFG Insured | 5.000 | 08/15/34 | 1,038,419 | ||||||||||||||
| 2,000,000 | Puerto Rico Public Finance Corporation, Commonwealth Appropriation Bonds, Series 2002E, (ETM) | 6.000 | 08/01/26 | 2,060,093 | ||||||||||||||
| 1,460,000 | Rohnert Park Community Development Commission, California, Tax Allocation Bonds, Redevelopment Project Series 2007R - FGIC Insured, (ETM) | 5.000 | 08/01/37 | 1,525,638 | ||||||||||||||
| 5,000 | San Francisco Airport Commission, California, Revenue Bonds, San Francisco International Airport, Second Series 2018D, (Pre‑ refunded 5/01/28), (AMT) | 5.000 | 05/01/48 | 5,220 | ||||||||||||||
| |
|
|||||||||||||||||
| TOTAL U.S. GUARANTEED | 67,586,228 | |||||||||||||||||
| |
||||||||||||||||||
| UTILITIES - 31.0% (17.8% of Total Investments) | ||||||||||||||||||
| 44,950,000 | (e) | California Community Choice Financing Authority, Clean Energy Project Revenue Bonds, Green Series 2023G, (Mandatory Put 4/01/30), (UB) | 5.250 | 11/01/54 | 48,137,611 | |||||||||||||
| 5,000,000 | California Community Choice Financing Authority, Clean Energy Project Revenue Bonds, Green Series 2024A, (Mandatory Put 4/01/32) | 5.000 | 05/01/54 | 5,342,851 | ||||||||||||||
| 38,915,000 | California Community Choice Financing Authority, Clean Energy Project Revenue Bonds, Green Series 2024B, (Mandatory Put 12/01/32) | 5.000 | 01/01/55 | 40,642,678 | ||||||||||||||
| 5,150,000 | California Community Choice Financing Authority, Clean Energy Project Revenue Bonds, Green Series 2024C, (Mandatory Put 10/01/32) | 5.000 | 08/01/55 | 5,474,483 | ||||||||||||||
| 3,925,000 | (a) | California Pollution Control Financing Authority, Water Furnishing Revenue Bonds, Poseidon Resources Channelside LP Desalination Project, Series 2012, (AMT) | 5.000 | 07/01/37 | 3,926,077 | |||||||||||||
| 69,535,000 | (a) | California Pollution Control Financing Authority, Water Furnishing Revenue Bonds, Poseidon Resources Channelside LP Desalination Project, Series 2012, (AMT) | 5.000 | 11/21/45 | 66,030,241 | |||||||||||||
| 2,200,000 | East Bay Municipal Utility District, Alameda and Contra Costa Counties, California, Water System Revenue Bonds, Green Series 2017A | 5.000 | 06/01/45 | 2,221,713 | ||||||||||||||
| 5,000,000 | East Bay Municipal Utility District, Alameda and Contra Costa Counties, California, Water System Revenue Bonds, Green Series 2019A | 5.000 | 06/01/49 | 5,067,095 | ||||||||||||||
| 2,500,000 | El Dorado Irrigation District, California, Certificates of Participation, Revenue Bonds, Series 2024A | 4.000 | 03/01/50 | 2,142,931 | ||||||||||||||
| 14,140,000 | Long Beach Bond Finance Authority, California, Natural Gas Purchase Revenue Bonds, Series 2007A | 5.000 | 11/15/35 | 15,113,231 | ||||||||||||||
| 7,610,000 | Long Beach Bond Finance Authority, California, Natural Gas Purchase Revenue Bonds, Series 2007A | 5.500 | 11/15/37 | 8,395,130 | ||||||||||||||
| 74 |
See Notes to Financial Statements |
| PRINCIPAL | DESCRIPTION | RATE | MATURITY | VALUE | ||||||||||||||
| |
|
|||||||||||||||||
| UTILITIES (continued) | ||||||||||||||||||
| $ | 62,085,000 | Los Angeles Department of Water and Power, California, Power System Revenue Bonds, Series 2017C | 5.000% | 07/01/47 | $ | 61,689,742 | ||||||||||||
| 8,960,000 | Los Angeles Department of Water and Power, California, Power System Revenue Bonds, Series 2018D | 5.000 | 07/01/38 | 9,094,139 | ||||||||||||||
| 3,910,000 | Los Angeles Department of Water and Power, California, Power System Revenue Bonds, Series 2018D | 5.000 | 07/01/39 | 3,955,364 | ||||||||||||||
| 8,980,000 | Los Angeles Department of Water and Power, California, Power System Revenue Bonds, Series 2019A | 5.000 | 07/01/45 | 8,957,571 | ||||||||||||||
| 8,960,000 | Los Angeles Department of Water and Power, California, Power System Revenue Bonds, Series 2020B | 5.000 | 07/01/40 | 9,117,650 | ||||||||||||||
| 5,105,000 | Los Angeles Department of Water and Power, California, Power System Revenue Bonds, Series 2020B | 5.000 | 07/01/45 | 5,119,962 | ||||||||||||||
| 24,625,000 | Los Angeles Department of Water and Power, California, Power System Revenue Bonds, Series 2020B | 5.000 | 07/01/50 | 24,612,848 | ||||||||||||||
| 2,000,000 | Los Angeles Department of Water and Power, California, Power System Revenue Bonds, Series 2021C | 5.000 | 07/01/51 | 1,998,003 | ||||||||||||||
| 4,000,000 | Los Angeles Department of Water and Power, California, Power System Revenue Bonds, Series 2022B | 5.000 | 07/01/47 | 4,000,199 | ||||||||||||||
| 6,500,000 | Los Angeles Department of Water and Power, California, Power System Revenue Bonds, Series 2022B | 5.000 | 07/01/52 | 6,492,119 | ||||||||||||||
| 3,000,000 | Los Angeles Department of Water and Power, California, Power System Revenue Bonds, Series 2022C | 5.000 | 07/01/39 | 3,117,478 | ||||||||||||||
| 2,325,000 | Los Angeles Department of Water and Power, California, Power System Revenue Bonds, Series 2022C | 5.000 | 07/01/41 | 2,391,645 | ||||||||||||||
| 4,370,000 | Los Angeles Department of Water and Power, California, Power System Revenue Bonds, Series 2025A - BAM Insured | 5.000 | 07/01/53 | 4,383,084 | ||||||||||||||
| 3,500,000 | Los Angeles Department of Water and Power, California, Water System Revenue Bonds, Series 2022B | 5.000 | 07/01/52 | 3,502,054 | ||||||||||||||
| 2,875,000 | Los Angeles Department of Water and Power, California, Water System Revenue Bonds, Series 2023A | 5.000 | 07/01/49 | 2,887,743 | ||||||||||||||
| 10,000,000 | Los Angeles Department of Water and Power, California, Waterworks Revenue Bonds, Series 2016A | 5.000 | 07/01/46 | 9,814,351 | ||||||||||||||
| 35,245,000 | Los Angeles Department of Water and Power, California, Waterworks Revenue Bonds, Series 2017A | 5.000 | 07/01/44 | 35,236,513 | ||||||||||||||
| 2,000,000 | Los Angeles Department of Water and Power, California, Waterworks Revenue Bonds, Series 2020C | 5.000 | 07/01/36 | 2,104,099 | ||||||||||||||
| 3,000,000 | Los Angeles Department of Water and Power, California, Waterworks Revenue Bonds, Series 2020C | 5.000 | 07/01/38 | 3,109,204 | ||||||||||||||
| 5,000,000 | Los Angeles, California, Wastewater System Revenue Bonds, Green Subordinate Series 2018A | 5.000 | 06/01/43 | 5,085,826 | ||||||||||||||
| 6,500,000 | Metropolitan Water District of Southern California, Water Revenue Bonds, Refunding Series 2023A | 5.000 | 04/01/53 | 6,711,358 | ||||||||||||||
| 7,525,000 | Moulton Niguel Water District, California, Certificates of Participation, Series 2019 | 3.000 | 09/01/44 | 5,802,044 | ||||||||||||||
| 2,820,000 | Orange County Sanitation District, California, Wastewater Revenue Bonds, Refunding Series 2016A | 5.000 | 02/01/35 | 2,841,662 | ||||||||||||||
| 4,415,000 | (a) | Puerto Rico Aqueduct and Sewerage Authority, Revenue Bonds, Refunding Senior Lien Series 2020A | 5.000 | 07/01/47 | 4,130,160 | |||||||||||||
| 2,950,000 | Sacramento County Sanitation Districts Financing Authority, California, Revenue Bonds, Sacramento Regional County Sanitation District, Series 2020A | 5.000 | 12/01/50 | 2,998,337 | ||||||||||||||
| 16,670,000 | Sacramento Municipal Utility District, California, Electric Revenue Bonds, Climate Certified Green Series 2023K | 5.000 | 08/15/53 | 17,055,344 | ||||||||||||||
| 7,000,000 | Sacramento Municipal Utility District, California, Electric Revenue Bonds, Green Series 2019G | 5.000 | 08/15/41 | 7,278,389 | ||||||||||||||
| 1,510,000 | Sacramento Municipal Utility District, California, Electric Revenue Bonds, Series 2020H | 5.000 | 08/15/50 | 1,534,907 | ||||||||||||||
| 4,000,000 | San Diego Public Facilities Financing Authority, California, Water Revenue Bonds, Senior Series 2023A | 4.000 | 08/01/52 | 3,499,483 | ||||||||||||||
| 1,180,000 | San Diego Public Facilities Financing Authority, California, Water Utility Revenue Bonds, Refunding Subordinate Lien Series 2016B | 5.000 | 08/01/37 | 1,194,605 | ||||||||||||||
| 1,250,000 | San Joaquin County, California, Revenue Bonds, CSA County Service Area 31, Refunding Series 2018A | 5.000 | 08/01/38 | 1,248,393 | ||||||||||||||
| 4,000,000 | Southern California Public Power Authority, Natural Gas Project 1 Revenue Bonds, Series 2007A | 5.000 | 11/01/33 | 4,254,238 | ||||||||||||||
| See Notes to Financial Statements |
75 |
Portfolio of Investments August 31, 2025 (continued)
NAC
| PRINCIPAL | DESCRIPTION | RATE | MATURITY | VALUE | ||||||||||||||
| |
|
|||||||||||||||||
| UTILITIES (continued) | ||||||||||||||||||
| $ | 31,970,000 | Southern California Public Power Authority, Southern Transmission System Renewal Project Revenue Bonds, Series 2023‑1A | 5.000% | 07/01/48 | $ | 31,977,839 | ||||||||||||
| |
|
|||||||||||||||||
| TOTAL UTILITIES | 499,690,394 | |||||||||||||||||
| |
||||||||||||||||||
| TOTAL MUNICIPAL BONDS (Cost $2,896,430,128) |
2,783,682,584 | |||||||||||||||||
| |
||||||||||||||||||
| TOTAL LONG-TERM INVESTMENTS (Cost $2,896,430,128) |
2,783,682,584 | |||||||||||||||||
| |
||||||||||||||||||
| PRINCIPAL | DESCRIPTION | RATE | MATURITY | VALUE | ||||||||||||||
| |
|
|||||||||||||||||
| SHORT-TERM INVESTMENTS - 1.5% (0.8% of Total Investments) | ||||||||||||||||||
| MUNICIPAL BONDS - 1.5% (0.8% of Total Investments) | ||||||||||||||||||
| EDUCATION AND CIVIC ORGANIZATIONS - 0.5% (0.2% of Total Investments) | ||||||||||||||||||
| $ | 7,000,000 | (g) | University of California, General Revenue Bonds, Variable Rate Demand Obligation, Series 2024BY-1 |
2.650 | 05/15/54 | $ | 7,000,000 | |||||||||||
| |
|
|||||||||||||||||
| TOTAL EDUCATION AND CIVIC ORGANIZATIONS | 7,000,000 | |||||||||||||||||
| |
||||||||||||||||||
| TRANSPORTATION - 1.0% (0.6% of Total Investments) | ||||||||||||||||||
| 16,600,000 | (g) | Bay Area Toll Authority, California, Revenue Bonds, San Francisco Bay Area Toll Bridge, Series 2007A‑1 | 2.000 | 04/01/47 | 16,600,000 | |||||||||||||
| |
|
|||||||||||||||||
| TOTAL TRANSPORTATION | 16,600,000 | |||||||||||||||||
| |
||||||||||||||||||
| TOTAL MUNICIPAL BONDS (Cost $23,600,000) |
23,600,000 | |||||||||||||||||
| |
||||||||||||||||||
| TOTAL SHORT-TERM INVESTMENTS (Cost $23,600,000) |
23,600,000 | |||||||||||||||||
| |
||||||||||||||||||
| TOTAL INVESTMENTS - 174.2% (Cost $2,920,030,128) |
2,807,282,584 | |||||||||||||||||
| |
||||||||||||||||||
| FLOATING RATE OBLIGATIONS - (2.8)% | (44,590,000) | |||||||||||||||||
| |
||||||||||||||||||
| MFP SHARES, NET - (15.9)% (h) | (256,945,290) | |||||||||||||||||
| |
||||||||||||||||||
| VRDP SHARES, NET - (56.2)% (i) | (905,609,432) | |||||||||||||||||
| |
||||||||||||||||||
| OTHER ASSETS & LIABILITIES, NET - 0.7% | 11,210,018 | |||||||||||||||||
| |
||||||||||||||||||
| NET ASSETS APPLICABLE TO COMMON SHARES - 100% | $ | 1,611,347,880 | ||||||||||||||||
| |
||||||||||||||||||
All percentages shown in the Portfolio of Investments are based on net assets applicable to common shares unless otherwise noted.
| AMT | Alternative Minimum Tax |
| ETM | Escrowed to maturity |
| UB | Underlying bond of an inverse floating rate trust reflected as a financing transaction. Inverse floating rate trust is a Recourse Trust unless otherwise noted. |
| (a) | Security is exempt from registration under Rule 144A of the Securities Act of 1933, as amended. These securities are deemed liquid and may be resold in transactions exempt from registration, which are normally those transactions with qualified institutional buyers. As of the end of the reporting period, the aggregate value of these securities is $401,238,145 or 14.3% of Total Investments. |
| (b) | Effective February 12, 2019, the par value of the original bonds was replaced with taxable and tax exempt Puerto Rico Sales Tax Financing Corporation (commonly known as COFINA) bond units that are collateralized by a bundle of zero and coupon paying bonds. The quantity shown represents units in a trust, which were assigned according to the original bond’s accreted value. These securities do not have a stated coupon interest rate and income will be recognized through accretion of the discount associated with the trust units. The factor at which these units accrete can also decrease, primarily for principal payments generated from coupon payments received or dispositions of the underlying bond collateral. The quantity of units will not change as a result of these principal payments. |
| (c) | Step‑up coupon bond, a bond with a coupon that increases (“steps up”), usually at regular intervals, while the bond is outstanding. The rate shown is the coupon as of the end of the reporting period. |
| (d) | When-issued or delayed delivery security. |
| (e) | Investment, or portion of investment, has been pledged to collateralize the net payment obligations for investments in inverse floating rate transactions. |
| (f) | Backed by an escrow or trust containing sufficient U.S. Government or U.S. Government agency securities, which ensure the timely payment of principal and interest. |
| (g) | Investment has a maturity of greater than one year, but has variable rate and/or demand features which qualify it as a short-term investment. The rate disclosed, as well as the reference rate and spread, where applicable, is that in effect as of the end of the reporting period. This rate changes periodically based on market conditions or a specified market index. |
| (h) | MFP Shares, Net as a percentage of Total Investments is 9.2%. |
| (i) | VRDP Shares, Net as a percentage of Total Investments is 32.3%. |
| 76 |
See Notes to Financial Statements |
Portfolio of Investments August 31, 2025
NXJ
| PRINCIPAL | DESCRIPTION | RATE | MATURITY | VALUE | ||||||||||||||
| |
|
|||||||||||||||||
| LONG-TERM INVESTMENTS - 173.0% (99.8% of Total Investments) | ||||||||||||||||||
| MUNICIPAL BONDS - 173.0% (99.8% of Total Investments) | ||||||||||||||||||
| CONSUMER STAPLES - 5.4% (3.1% of Total Investments) | ||||||||||||||||||
| $ | 8,525,000 | Tobacco Settlement Financing Corporation, New Jersey, Tobacco Settlement Asset-Backed Bonds, Series 2018A | 4.000% | 06/01/37 | $ | 8,101,485 | ||||||||||||
| 12,895,000 | Tobacco Settlement Financing Corporation, New Jersey, Tobacco Settlement Asset-Backed Bonds, Series 2018A | 5.000 | 06/01/46 | 12,442,060 | ||||||||||||||
| 7,250,000 | Tobacco Settlement Financing Corporation, New Jersey, Tobacco Settlement Asset-Backed Bonds, Series 2018B |
5.000 | 06/01/46 | 6,979,291 | ||||||||||||||
| |
|
|||||||||||||||||
| TOTAL CONSUMER STAPLES | 27,522,836 | |||||||||||||||||
| |
||||||||||||||||||
| EDUCATION AND CIVIC ORGANIZATIONS - 20.4% (11.8% of Total Investments) | ||||||||||||||||||
| 1,000,000 | Atlantic County Improvement Authority, New Jersey, General Obligation Lease Revenue Bonds, Stockton University Atlantic City Campus Phase II, Series 2021A - AGM Insured | 4.000 | 07/01/53 | 826,610 | ||||||||||||||
| 715,000 | Camden County Improvement Authority, New Jersey, School Revenue Bonds, KIPP: Cooper Norcross Academy 2022 Project, Social Series 2022 | 6.000 | 06/15/62 | 728,515 | ||||||||||||||
| 1,600,000 | Essex County Improvement Authority, New Jersey, General Obligation Lease Revenue Bonds, Institute of Technology CHF‑ Newark, LLC‑NJIT Student Housing Project, Series 2021A - BAM Insured | 4.000 | 08/01/51 | 1,388,523 | ||||||||||||||
| 1,000,000 | Essex County Improvement Authority, New Jersey, General Obligation Lease Revenue Bonds, Institute of Technology CHF‑ Newark, LLC‑NJIT Student Housing Project, Series 2021A - BAM Insured | 4.000 | 08/01/56 | 851,785 | ||||||||||||||
| 1,000,000 | Gloucester County Improvement Authority, New Jersey, Revenue Bonds, Rowan University Fossil Park & Student Center Projects, Series 2021 - BAM Insured | 4.000 | 07/01/46 | 903,517 | ||||||||||||||
| 3,210,000 | Gloucester County Improvement Authority, New Jersey, Revenue Bonds, Rowan University Project, County Guaranteed Loan, Series 2024 - BAM Insured | 5.000 | 07/01/49 | 3,248,672 | ||||||||||||||
| 4,000,000 | Gloucester County Improvement Authority, New Jersey, Revenue Bonds, Rowan University Project, County Guaranteed Loan, Series 2024 - BAM Insured | 5.000 | 07/01/54 | 4,032,255 | ||||||||||||||
| 1,290,000 | Montclair State University, New Jersey, General Obligation Bonds, Series 2025A | 5.000 | 07/01/32 | 1,448,136 | ||||||||||||||
| 885,000 | Montclair State University, New Jersey, General Obligation Bonds, Series 2025A | 5.000 | 07/01/33 | 996,555 | ||||||||||||||
| 715,000 | Montclair State University, New Jersey, General Obligation Bonds, Series 2025A | 5.000 | 07/01/34 | 804,177 | ||||||||||||||
| 1,000,000 | New Jersey Economic Development Authority, Charter School Revenue Bonds, Foundation Academy Charter School, Series 2018A | 5.000 | 07/01/50 | 851,180 | ||||||||||||||
| 175,000 | (a) | New Jersey Economic Development Authority, Charter School Revenue Bonds, Teaneck Community Charter School, Series 2017A | 5.125 | 09/01/52 | 160,367 | |||||||||||||
| 840,000 | New Jersey Economic Development Authority, Revenue Bonds, The Seeing Eye Inc., Refunding Series 2017 | 3.000 | 06/01/32 | 823,259 | ||||||||||||||
| 500,000 | New Jersey Economic Development Authority, Revenue Bonds, The Seeing Eye Inc., Refunding Series 2017 | 5.000 | 06/01/32 | 517,562 | ||||||||||||||
| 770,000 | New Jersey Educational Facilities Authority, Revenue Bonds, Kean University, Refunding Series 2015H - AGM Insured | 4.000 | 07/01/39 | 747,815 | ||||||||||||||
| 6,000,000 | New Jersey Educational Facilities Authority, Revenue Bonds, Princeton University, Series 2024A‑1 | 5.000 | 03/01/37 | 6,671,860 | ||||||||||||||
| 10,000,000 | (b) | New Jersey Educational Facilities Authority, Revenue Bonds, Princeton University, Series 2024B, (UB) | 4.000 | 03/01/53 | 8,887,376 | |||||||||||||
| 330,000 | New Jersey Educational Facilities Authority, Revenue Bonds, Rider University, Series 2017F | 3.750 | 07/01/37 | 243,996 | ||||||||||||||
| 3,830,000 | New Jersey Educational Facilities Authority, Revenue Bonds, Rider University, Series 2017F | 4.000 | 07/01/42 | 2,645,751 | ||||||||||||||
| 3,885,000 | New Jersey Educational Facilities Authority, Revenue Bonds, Rider University, Series 2017F | 5.000 | 07/01/47 | 2,885,873 | ||||||||||||||
| 1,200,000 | New Jersey Educational Facilities Authority, Revenue Bonds, Seton Hall University, Refunding Series 2015C | 5.000 | 07/01/35 | 1,200,457 | ||||||||||||||
| See Notes to Financial Statements |
77 |
Portfolio of Investments August 31, 2025 (continued)
NXJ
| PRINCIPAL | DESCRIPTION | RATE | MATURITY | VALUE | ||||||||||||||
| |
|
|||||||||||||||||
| EDUCATION AND CIVIC ORGANIZATIONS (continued) | ||||||||||||||||||
| $ | 775,000 | New Jersey Educational Facilities Authority, Revenue Bonds, Seton Hall University, Refunding Series 2017D | 3.500% | 07/01/44 | $ | 603,690 | ||||||||||||
| 515,000 | New Jersey Educational Facilities Authority, Revenue Bonds, Seton Hall University, Series 2013D | 5.000 | 07/01/38 | 515,077 | ||||||||||||||
| 1,935,000 | New Jersey Educational Facilities Authority, Revenue Bonds, Seton Hall University, Series 2013D | 5.000 | 07/01/43 | 1,873,206 | ||||||||||||||
| 1,980,000 | New Jersey Educational Facilities Authority, Revenue Bonds, Seton Hall University, Series 2016C | 3.000 | 07/01/46 | 1,375,244 | ||||||||||||||
| 1,060,000 | New Jersey Educational Facilities Authority, Revenue Bonds, Stevens Institute of Technology, Series 2017A | 5.000 | 07/01/37 | 1,076,301 | ||||||||||||||
| 2,280,000 | New Jersey Educational Facilities Authority, Revenue Bonds, Stevens Institute of Technology, Series 2017A | 5.000 | 07/01/42 | 2,285,774 | ||||||||||||||
| 1,050,000 | New Jersey Educational Facilities Authority, Revenue Bonds, Stevens Institute of Technology, Series 2017A | 4.000 | 07/01/47 | 890,547 | ||||||||||||||
| 3,160,000 | New Jersey Educational Facilities Authority, Revenue Bonds, Stevens Institute of Technology, Series 2017A | 5.000 | 07/01/47 | 3,090,803 | ||||||||||||||
| 4,560,000 | New Jersey Educational Facilities Authority, Revenue Bonds, William Paterson University, Series 2015C | 5.000 | 07/01/40 | 4,560,409 | ||||||||||||||
| 2,000,000 | New Jersey Educational Facilities Authority, Revenue Bonds, William Paterson University, Series 2017B - AGM Insured | 5.000 | 07/01/42 | 2,005,825 | ||||||||||||||
| 2,295,000 | New Jersey Educational Facilities Authority, Revenue Bonds, William Paterson University, Series 2017B - AGM Insured | 5.000 | 07/01/47 | 2,244,277 | ||||||||||||||
| 875,000 | New Jersey Higher Education Student Assistance Authority, Student Loan Revenue Bonds, Refunding Senior Series 2021B, (AMT) | 2.500 | 12/01/40 | 811,049 | ||||||||||||||
| 8,295,000 | New Jersey Higher Education Student Assistance Authority, Student Loan Revenue Bonds, Refunding Senior Series 2022B, (AMT) | 4.000 | 12/01/41 | 8,191,338 | ||||||||||||||
| 365,000 | New Jersey Higher Education Student Assistance Authority, Student Loan Revenue Bonds, Refunding Series 2018A, (AMT) | 3.750 | 12/01/30 | 365,875 | ||||||||||||||
| 370,000 | New Jersey Higher Education Student Assistance Authority, Student Loan Revenue Bonds, Refunding Series 2018A, (AMT) | 4.000 | 12/01/32 | 370,247 | ||||||||||||||
| 290,000 | New Jersey Higher Education Student Assistance Authority, Student Loan Revenue Bonds, Refunding Series 2018A, (AMT) | 4.000 | 12/01/33 | 290,129 | ||||||||||||||
| 315,000 | New Jersey Higher Education Student Assistance Authority, Student Loan Revenue Bonds, Refunding Series 2018A, (AMT) | 4.000 | 12/01/35 | 314,985 | ||||||||||||||
| 1,215,000 | New Jersey Higher Education Student Assistance Authority, Student Loan Revenue Bonds, Refunding Series 2023B, (AMT) | 4.000 | 12/01/44 | 1,129,648 | ||||||||||||||
| 1,000,000 | New Jersey Higher Education Student Assistance Authority, Student Loan Revenue Bonds, Refunding Series 2024B, (AMT) | 4.250 | 12/01/45 | 979,811 | ||||||||||||||
| 2,650,000 | New Jersey Higher Education Student Assistance Authority, Student Loan Revenue Bonds, Refunding Series 2025‑1B, (AMT) | 4.500 | 12/01/45 | 2,636,157 | ||||||||||||||
| 2,430,000 | New Jersey Higher Education Student Assistance Authority, Student Loan Revenue Bonds, Refunding Subordinate Series 2021C, (AMT) | 3.250 | 12/01/51 | 1,619,839 | ||||||||||||||
| 2,500,000 | New Jersey Higher Education Student Assistance Authority, Student Loan Revenue Bonds, Refunding Subordinate Series 2022C, (AMT) | 5.000 | 12/01/52 | 2,338,445 | ||||||||||||||
| 1,220,000 | New Jersey Higher Education Student Assistance Authority, Student Loan Revenue Bonds, Senior Lien Series 2016‑1A, (AMT) | 3.500 | 12/01/32 | 1,222,387 | ||||||||||||||
| 280,000 | New Jersey Higher Education Student Assistance Authority, Student Loan Revenue Bonds, Senior Lien Series 2016‑1A, (AMT) | 4.000 | 12/01/39 | 280,910 | ||||||||||||||
| 365,000 | New Jersey Higher Education Student Assistance Authority, Student Loan Revenue Bonds, Senior Series 2019B, (AMT) | 3.250 | 12/01/39 | 352,466 | ||||||||||||||
| 465,000 | New Jersey Higher Education Student Assistance Authority, Student Loan Revenue Bonds, Senior Series 2020B, (AMT) | 3.500 | 12/01/39 | 449,763 | ||||||||||||||
| 6,855,000 | New Jersey Higher Education Student Assistance Authority, Student Loan Revenue Bonds, Subordinate Series 2017‑C, (AMT) | 4.250 | 12/01/47 | 5,874,028 | ||||||||||||||
| 4,795,000 | New Jersey Higher Education Student Assistance Authority, Student Loan Revenue Bonds, Subordinate Series 2019C, (AMT) | 3.625 | 12/01/49 | 3,470,864 | ||||||||||||||
| 1,000,000 | New Jersey Higher Education Student Assistance Authority, Student Loan Revenue Bonds, Subordinate Series 2020C, (AMT) | 4.250 | 12/01/50 | 819,452 | ||||||||||||||
| 1,060,000 | New Jersey Institute of Technology, New Jersey, General Obligation Bonds, Series 2025A - BAM Insured | 5.000 | 07/01/45 | 1,100,665 | ||||||||||||||
| 78 |
See Notes to Financial Statements |
| PRINCIPAL | DESCRIPTION | RATE | MATURITY | VALUE | ||||||||||||||
| |
|
|||||||||||||||||
| EDUCATION AND CIVIC ORGANIZATIONS (continued) | ||||||||||||||||||
| $ | 3,430,000 | New Jersey Institute of Technology, New Jersey, General Obligation Bonds, Series 2025A - BAM Insured | 5.250% | 07/01/50 | $ | 3,579,860 | ||||||||||||
| 2,865,000 | New Jersey Institute of Technology, New Jersey, General Obligation Bonds, Series 2025A - BAM Insured | 5.250 | 07/01/55 | 2,967,570 | ||||||||||||||
| 1,560,000 | Passaic County Improvement Authority, New Jersey, Charter School Revenue Bonds, Community Charter School of Paterson, Series 2024A | 5.000 | 01/01/55 | 1,394,376 | ||||||||||||||
| 1,000,000 | Passaic County Improvement Authority, New Jersey, Charter School Revenue Bonds, Paterson Arts & Science Charter School, Series 2023 | 5.500 | 07/01/58 | 1,000,413 | ||||||||||||||
| |
|
|||||||||||||||||
| TOTAL EDUCATION AND CIVIC ORGANIZATIONS | 102,945,671 | |||||||||||||||||
| |
||||||||||||||||||
| FINANCIALS - 0.2% (0.1% of Total Investments) | ||||||||||||||||||
| 840,852 | New Jersey Economic Development Authority, Revenue Refunding Bonds, Kapkowski Road Landfill Project, Series 2002 | 6.500 | 04/01/28 | 869,453 | ||||||||||||||
| |
|
|||||||||||||||||
| TOTAL FINANCIALS | 869,453 | |||||||||||||||||
| |
||||||||||||||||||
| HEALTH CARE - 14.4% (8.3% of Total Investments) | ||||||||||||||||||
| 2,880,000 | New Jersey Health Care Facilities Authority, Revenue Bonds, Atlanticare Health System Obligated Group Issue, Series 2021 | 2.375 | 07/01/46 | 1,723,220 | ||||||||||||||
| 1,215,000 | New Jersey Health Care Facilities Authority, Revenue Bonds, Atlanticare Health System Obligated Group Issue, Series 2021 | 3.000 | 07/01/51 | 843,530 | ||||||||||||||
| 85,000 | New Jersey Health Care Facilities Finance Authority, Revenue Bonds, AHS Hospital Corporation, Series 2008A | 5.000 | 07/01/27 | 85,092 | ||||||||||||||
| 1,935,000 | New Jersey Health Care Facilities Financing Authority, Revenue Bonds, AHS Hospital Corporation, Refunding Series 2016 | 4.000 | 07/01/41 | 1,794,643 | ||||||||||||||
| 700,000 | New Jersey Health Care Facilities Financing Authority, Revenue Bonds, Hackensack Meridian Health Obligated Group, Refunding Series 2017A | 5.000 | 07/01/28 | 730,774 | ||||||||||||||
| 4,140,000 | New Jersey Health Care Facilities Financing Authority, Revenue Bonds, Hackensack Meridian Health Obligated Group, Refunding Series 2017A | 5.000 | 07/01/57 | 4,043,058 | ||||||||||||||
| 210,000 | New Jersey Health Care Facilities Financing Authority, Revenue Bonds, Hunterdon Medical Center, Refunding Series 2014A | 4.000 | 07/01/45 | 179,621 | ||||||||||||||
| 6,220,000 | New Jersey Health Care Facilities Financing Authority, Revenue Bonds, Inspira Health Obligated Group Issue, Refunding Series 2024A | 4.125 | 07/01/54 | 5,277,620 | ||||||||||||||
| 5,880,000 | New Jersey Health Care Facilities Financing Authority, Revenue Bonds, Inspira Health Obligated Group Issue, Refunding Series 2024A | 5.250 | 07/01/54 | 6,001,294 | ||||||||||||||
| 13,810,000 | New Jersey Health Care Facilities Financing Authority, Revenue Bonds, Inspira Health Obligated Group Issue, Series 2017A | 5.000 | 07/01/42 | 13,708,548 | ||||||||||||||
| 830,000 | New Jersey Health Care Facilities Financing Authority, Revenue Bonds, Princeton HealthCare System, Series 2016A | 5.000 | 07/01/32 | 842,607 | ||||||||||||||
| 1,055,000 | New Jersey Health Care Facilities Financing Authority, Revenue Bonds, Princeton HealthCare System, Series 2016A | 5.000 | 07/01/33 | 1,069,897 | ||||||||||||||
| 1,370,000 | New Jersey Health Care Facilities Financing Authority, Revenue Bonds, Princeton HealthCare System, Series 2016A | 5.000 | 07/01/34 | 1,388,030 | ||||||||||||||
| 150,000 | New Jersey Health Care Facilities Financing Authority, Revenue Bonds, RWJ Barnabas Health Obligated Group, Refunding Series 2016A | 5.000 | 07/01/43 | 150,011 | ||||||||||||||
| 375,000 | New Jersey Health Care Facilities Financing Authority, Revenue Bonds, RWJ Barnabas Health Obligated Group, Refunding Series 2024A | 4.250 | 07/01/54 | 334,492 | ||||||||||||||
| 2,055,000 | New Jersey Health Care Facilities Financing Authority, Revenue Bonds, RWJ Barnabas Health Obligated Group, Series 2021A | 4.000 | 07/01/45 | 1,848,504 | ||||||||||||||
| 2,155,000 | New Jersey Health Care Facilities Financing Authority, Revenue Bonds, RWJ Barnabas Health Obligated Group, Series 2021A | 3.000 | 07/01/51 | 1,537,513 | ||||||||||||||
| 1,755,000 | New Jersey Health Care Facilities Financing Authority, Revenue Bonds, RWJ Barnabas Health Obligated Group, Series 2021A | 4.000 | 07/01/51 | 1,492,272 | ||||||||||||||
| 1,600,000 | New Jersey Health Care Facilities Financing Authority, Revenue Bonds, Saint Joseph’s Healthcare System Obligated Group Issue, Refunding Series 2016 | 3.000 | 07/01/32 | 1,471,601 | ||||||||||||||
| 1,135,000 | New Jersey Health Care Facilities Financing Authority, Revenue Bonds, Saint Joseph’s Healthcare System Obligated Group Issue, Refunding Series 2016 | 4.000 | 07/01/34 | 1,108,053 | ||||||||||||||
| See Notes to Financial Statements |
79 |
Portfolio of Investments August 31, 2025 (continued)
NXJ
| PRINCIPAL | DESCRIPTION | RATE | MATURITY | VALUE | ||||||||||||||
| |
|
|||||||||||||||||
| HEALTH CARE (continued) | ||||||||||||||||||
| $ | 2,100,000 | New Jersey Health Care Facilities Financing Authority, Revenue Bonds, Saint Joseph’s Healthcare System Obligated Group Issue, Refunding Series 2016 | 5.000% | 07/01/35 | $ | 2,104,818 | ||||||||||||
| 4,265,000 | New Jersey Health Care Facilities Financing Authority, Revenue Bonds, Saint Joseph’s Healthcare System Obligated Group Issue, Refunding Series 2016 | 5.000 | 07/01/36 | 4,268,866 | ||||||||||||||
| 3,085,000 | New Jersey Health Care Facilities Financing Authority, Revenue Bonds, Saint Joseph’s Healthcare System Obligated Group Issue, Refunding Series 2016 | 5.000 | 07/01/41 | 3,024,011 | ||||||||||||||
| 6,595,000 | New Jersey Health Care Facilities Financing Authority, Revenue Bonds, Saint Joseph’s Healthcare System Obligated Group Issue, Refunding Series 2016 | 4.000 | 07/01/48 | 5,357,698 | ||||||||||||||
| 3,875,000 | New Jersey Health Care Facilities Financing Authority, Revenue Bonds, University Hospital Issue, Refunding Series 2015A - AGM Insured | 4.125 | 07/01/38 | 3,715,332 | ||||||||||||||
| 3,915,000 | New Jersey Health Care Facilities Financing Authority, Revenue Bonds, University Hospital Issue, Refunding Series 2015A - AGM Insured | 5.000 | 07/01/46 | 3,838,694 | ||||||||||||||
| 1,500,000 | New Jersey Health Care Facilities Financing Authority, Revenue Bonds, Valley Health System Obligated Group, Series 2019 | 4.000 | 07/01/44 | 1,306,464 | ||||||||||||||
| 5,350,000 | New Jersey Health Care Facilities Financing Authority, Revenue Bonds, Valley Health System Obligated Group, Series 2019 |
3.000 | 07/01/49 | 3,777,661 | ||||||||||||||
| |
|
|||||||||||||||||
| TOTAL HEALTH CARE | 73,023,924 | |||||||||||||||||
| |
||||||||||||||||||
| HOUSING/MULTIFAMILY - 7.3% (4.2% of Total Investments) | ||||||||||||||||||
| 450,000 | New Jersey Economic Development Authority, Revenue Bonds, Provident Group - Kean Properties LLC - Kean University Student Housing Project, Series 2017A | 5.000 | 07/01/47 | 403,091 | ||||||||||||||
| 1,400,000 | New Jersey Economic Development Authority, Revenue Bonds, Provident Group - Kean Properties LLC - Kean University Student Housing Project, Series 2017A | 5.000 | 01/01/50 | 1,232,021 | ||||||||||||||
| 1,900,000 | New Jersey Economic Development Authority, Revenue Bonds, Provident Group - Rowan Properties LLC - Rowan University Student Housing Project, Series 2015A | 5.000 | 01/01/48 | 1,683,290 | ||||||||||||||
| 6,575,000 | New Jersey Economic Development Authority, Revenue Bonds, West Campus Housing LLC - New Jersey City University Student Housing Project, Series 2015 | 5.000 | 07/01/47 | 5,553,441 | ||||||||||||||
| 3,306,583 | New Jersey Housing & Mortgage Finance Agency, Multifamily Conduit Revenue Bonds, Cherry Garden Apartments Project, Series 2021B | 2.375 | 01/01/39 | 2,514,848 | ||||||||||||||
| 1,730,000 | New Jersey Housing & Mortgage Finance Agency, Multifamily Conduit Revenue Bonds, Riverview Towers Apartments, Series 2024B | 5.250 | 12/20/65 | 1,763,613 | ||||||||||||||
| 3,500,000 | New Jersey Housing and Mortgage Finance Agency, Multifamily Conduit Revenue Bonds, Forest Hill House, GNMA Collateralized, Series 2024A‑1 | 5.000 | 01/20/66 | 3,481,902 | ||||||||||||||
| 1,795,000 | New Jersey Housing and Mortgage Finance Agency, Multifamily Conduit Revenue Bonds, Montgomery Gateway Apartments, Series 2025A | 4.550 | 05/01/41 | 1,780,834 | ||||||||||||||
| 4,320,000 | New Jersey Housing and Mortgage Finance Agency, Multifamily Revenue Bonds, Series 2015A | 4.000 | 11/01/45 | 3,728,944 | ||||||||||||||
| 2,000,000 | New Jersey Housing and Mortgage Finance Agency, Multifamily Revenue Bonds, Series 2017D, (AMT) | 3.900 | 11/01/32 | 1,996,824 | ||||||||||||||
| 1,750,000 | New Jersey Housing and Mortgage Finance Agency, Multifamily Revenue Bonds, Series 2017D, (AMT) | 4.250 | 11/01/37 | 1,702,834 | ||||||||||||||
| 1,150,000 | New Jersey Housing and Mortgage Finance Agency, Multifamily Revenue Bonds, Series 2020A | 2.300 | 11/01/40 | 830,093 | ||||||||||||||
| 500,000 | New Jersey Housing and Mortgage Finance Agency, Multifamily Revenue Bonds, Series 2020A | 2.450 | 11/01/45 | 331,870 | ||||||||||||||
| 1,000,000 | New Jersey Housing and Mortgage Finance Agency, Multifamily Revenue Bonds, Series 2020A | 2.550 | 11/01/50 | 621,762 | ||||||||||||||
| 1,000,000 | New Jersey Housing and Mortgage Finance Agency, Multifamily Revenue Bonds, Series 2020A | 2.625 | 11/01/56 | 595,477 | ||||||||||||||
| 1,500,000 | New Jersey Housing and Mortgage Finance Agency, Multifamily Revenue Bonds, Series 2021A | 2.250 | 11/01/36 | 1,184,491 | ||||||||||||||
| 80 |
See Notes to Financial Statements |
| PRINCIPAL | DESCRIPTION | RATE | MATURITY | VALUE | ||||||||||||||
| |
|
|||||||||||||||||
| HOUSING/MULTIFAMILY (continued) | ||||||||||||||||||
| $ | 1,270,000 | New Jersey Housing and Mortgage Finance Agency, Multifamily Revenue Bonds, Series 2021A | 2.650% | 11/01/46 | $ | 841,603 | ||||||||||||
| 1,445,000 | New Jersey Housing and Mortgage Finance Agency, Multifamily Revenue Bonds, Series 2021A | 2.700 | 11/01/51 | 912,112 | ||||||||||||||
| 1,310,000 | New Jersey Housing and Mortgage Finance Agency, Multifamily Revenue Bonds, Series 2021A | 2.750 | 11/01/56 | 801,833 | ||||||||||||||
| 1,000,000 | New Jersey Housing and Mortgage Finance Agency, Multifamily Revenue Bonds, Series 2023C, (AMT) | 5.000 | 11/01/38 | 992,672 | ||||||||||||||
| 1,000,000 | New Jersey Housing and Mortgage Finance Agency, Multifamily Revenue Bonds, Series 2023E‑1 | 4.350 | 05/01/45 | 939,987 | ||||||||||||||
| 1,500,000 | New Jersey Housing and Mortgage Finance Agency, Multifamily Revenue Bonds, Series 2023E‑1 | 4.550 | 05/01/55 | 1,394,682 | ||||||||||||||
| 1,175,000 | New Jersey Housing and Mortgage Finance Agency, Multifamily Revenue Bonds, Series 2023E‑1 | 4.600 | 05/01/60 | 1,090,626 | ||||||||||||||
| 690,000 | New Jersey Housing and Mortgage Finance Agency, Multifamily Revenue Bonds, Series 2024A | 4.500 | 05/01/50 | 641,328 | ||||||||||||||
| |
|
|||||||||||||||||
| TOTAL HOUSING/MULTIFAMILY | 37,020,178 | |||||||||||||||||
| |
||||||||||||||||||
| HOUSING/SINGLE FAMILY - 13.0% (7.5% of Total Investments) | ||||||||||||||||||
| 5,280,000 | New Jersey Housing and Mortgage Finance Agency, Single Family Housing Revenue Bonds, Series 2018A | 3.600 | 04/01/33 | 5,248,893 | ||||||||||||||
| 3,025,000 | New Jersey Housing and Mortgage Finance Agency, Single Family Housing Revenue Bonds, Series 2018A | 3.750 | 10/01/35 | 2,951,114 | ||||||||||||||
| 2,840,000 | New Jersey Housing and Mortgage Finance Agency, Single Family Housing Revenue Bonds, Series 2018B, (AMT) | 3.800 | 10/01/32 | 2,825,968 | ||||||||||||||
| 4,585,000 | New Jersey Housing and Mortgage Finance Agency, Single Family Housing Revenue Bonds, Series 2019C | 3.500 | 10/01/34 | 4,472,538 | ||||||||||||||
| 4,835,000 | (b) | New Jersey Housing and Mortgage Finance Agency, Single Family Housing Revenue Bonds, Series 2019C, (UB) | 3.850 | 10/01/39 | 4,532,092 | |||||||||||||
| 2,780,000 | New Jersey Housing and Mortgage Finance Agency, Single Family Housing Revenue Bonds, Series 2019C | 3.950 | 10/01/44 | 2,510,598 | ||||||||||||||
| 4,810,000 | New Jersey Housing and Mortgage Finance Agency, Single Family Housing Revenue Bonds, Series 2020E | 2.050 | 10/01/35 | 3,892,419 | ||||||||||||||
| 6,235,000 | New Jersey Housing and Mortgage Finance Agency, Single Family Housing Revenue Bonds, Series 2020E | 2.250 | 10/01/40 | 4,418,568 | ||||||||||||||
| 3,210,000 | New Jersey Housing and Mortgage Finance Agency, Single Family Housing Revenue Bonds, Series 2020E | 2.400 | 10/01/45 | 2,105,118 | ||||||||||||||
| 1,000,000 | New Jersey Housing and Mortgage Finance Agency, Single Family Housing Revenue Bonds, Series 2024K | 4.150 | 10/01/39 | 967,212 | ||||||||||||||
| 1,335,000 | New Jersey Housing and Mortgage Finance Agency, Single Family Housing Revenue Bonds, Series 2024K | 4.550 | 10/01/44 | 1,300,908 | ||||||||||||||
| 1,500,000 | New Jersey Housing and Mortgage Finance Agency, Single Family Housing Revenue Bonds, Series 2024K | 4.700 | 10/01/50 | 1,445,532 | ||||||||||||||
| 5,995,000 | New Jersey Housing and Mortgage Finance Agency, Single Family Housing Revenue Bonds, Social Series 2021H | 1.900 | 10/01/36 | 4,453,008 | ||||||||||||||
| 4,625,000 | New Jersey Housing and Mortgage Finance Agency, Single Family Housing Revenue Bonds, Social Series 2021H | 2.150 | 10/01/41 | 3,109,996 | ||||||||||||||
| 8,070,000 | New Jersey Housing and Mortgage Finance Agency, Single Family Housing Revenue Bonds, Social Series 2021H | 2.400 | 04/01/52 | 4,944,655 | ||||||||||||||
| 4,040,000 | New Jersey Housing and Mortgage Finance Agency, Single Family Housing Revenue Bonds, Social Series 2022I | 4.500 | 10/01/42 | 3,951,807 | ||||||||||||||
| 2,980,000 | New Jersey Housing and Mortgage Finance Agency, Single Family Housing Revenue Bonds, Social Series 2022I | 4.600 | 10/01/46 | 2,905,803 | ||||||||||||||
| 1,000,000 | (b) | New Jersey Housing and Mortgage Finance Agency, Single Family Housing Revenue Bonds, Social Series 2023J, (UB) | 4.150 | 10/01/38 | 971,599 | |||||||||||||
| 2,300,000 | (b) | New Jersey Housing and Mortgage Finance Agency, Single Family Housing Revenue Bonds, Social Series 2023J, (UB) | 4.500 | 10/01/43 | 2,238,095 | |||||||||||||
| 3,850,000 | (b) | New Jersey Housing and Mortgage Finance Agency, Single Family Housing Revenue Bonds, Social Series 2023J, (UB) | 4.700 | 10/01/48 | 3,740,786 | |||||||||||||
| 2,455,000 | New Jersey Housing and Mortgage Finance Agency, Single Family Housing Revenue Bonds, Social Series 2025M | 5.050 | 10/01/45 | 2,469,431 | ||||||||||||||
| |
|
|||||||||||||||||
| TOTAL HOUSING/SINGLE FAMILY | 65,456,140 | |||||||||||||||||
| |
||||||||||||||||||
| See Notes to Financial Statements |
81 |
Portfolio of Investments August 31, 2025 (continued)
NXJ
| PRINCIPAL | DESCRIPTION | RATE | MATURITY | VALUE | ||||||||||||||
| |
|
|||||||||||||||||
| INDUSTRIALS - 0.6% (0.4% of Total Investments) | ||||||||||||||||||
| $ | 1,000,000 | New Jersey Economic Development Authority, Energy Facilities Revenue Bonds, UMM Energy Partners, LLC Project, Series 2012A, (AMT) | 4.750% | 06/15/32 | $ | 1,000,246 | ||||||||||||
| 1,225,000 | New Jersey Economic Development Authority, Energy Facilities Revenue Bonds, UMM Energy Partners, LLC Project, Series 2012A, (AMT) | 5.125 | 06/15/43 | 1,153,572 | ||||||||||||||
| 1,000,000 | (a) | New Jersey Economic Development Authority, New Jersey, Dock and Wharf Facility Revenue Bonds, Repauno Port & Rail Terminal Project, Series 2025, (AMT) | 6.625 | 01/01/45 | 1,021,107 | |||||||||||||
| |
|
|||||||||||||||||
| TOTAL INDUSTRIALS | 3,174,925 | |||||||||||||||||
| |
||||||||||||||||||
| LONG-TERM CARE - 0.8% (0.5% of Total Investments) | ||||||||||||||||||
| 1,110,000 | New Jersey Economic Development Authority, Fixed Rate Revenue Bonds, Lions Gate Project, Series 2014 | 5.250 | 01/01/44 | 989,085 | ||||||||||||||
| 2,708,281 | (a) | New Jersey Economic Development Authority, Revenue Bonds, White Horse HMT Urban Renewal LLC Project, Series 2020 | 5.000 | 01/01/40 | 1,870,381 | |||||||||||||
| 1,420,000 | (a) | New Jersey Health Care Facilities Financing Authority, Revenue Bonds, Village Drive Healthcare Urban Renewal LLC, Series 2018 | 5.750 | 10/01/38 | 1,018,285 | |||||||||||||
| |
|
|||||||||||||||||
| TOTAL LONG-TERM CARE | 3,877,751 | |||||||||||||||||
| |
||||||||||||||||||
| TAX OBLIGATION/GENERAL - 20.5% (11.8% of Total Investments) | ||||||||||||||||||
| 1,000,000 | Asbury Park, New Jersey, General Obligation Bonds, Bond Anticipation Notes Series 2025AB | 4.000 | 01/14/26 | 1,005,125 | ||||||||||||||
| 1,780,000 | Bridgewater & Raritan School District, Somerset County, New Jersey, General Obligation Bonds, Series 2024 | 4.000 | 07/15/45 | 1,617,555 | ||||||||||||||
| 2,920,000 | Cumberland County Improvement Authority, New Jersey, Guaranteed Lease Revenue Bonds, County Correctional Facility Project, Series 2018 - BAM Insured | 4.000 | 10/01/43 | 2,693,286 | ||||||||||||||
| 1,470,000 | Cumberland County, New Jersey, General Obligation Bonds, Series 2021 | 2.000 | 05/15/30 | 1,368,095 | ||||||||||||||
| 1,475,000 | Cumberland County, New Jersey, General Obligation Bonds, Series 2021 | 2.000 | 05/15/31 | 1,332,771 | ||||||||||||||
| 600,000 | Essex County Improvement Authority, New Jersey, Lease Revenue Bonds, Essex County Family Court Building Projects, County Guaranteed Series 2025 | 5.000 | 03/17/26 | 607,899 | ||||||||||||||
| 2,000,000 | Essex County, New Jersey, General Obligation Bonds, Bond Anticipation Notes, Series 2025 | 4.000 | 07/08/26 | 2,024,421 | ||||||||||||||
| 1,000,000 | Freehold Township Board of Education, Monmouth County, New Jersey, General Obligation Bonds, School Series 2025 | 4.000 | 08/15/41 | 964,667 | ||||||||||||||
| 625,000 | Gloucester County Improvement Authority, New Jersey, General Obligation Loan Revenue Bonds, Health Sciences Educational Facilities Projects Series 2024 | 5.000 | 03/01/32 | 711,610 | ||||||||||||||
| 500,000 | Gloucester County Improvement Authority, New Jersey, General Obligation Loan Revenue Bonds, Health Sciences Educational Facilities Projects Series 2024 | 5.000 | 03/01/36 | 561,023 | ||||||||||||||
| 680,000 | Hamilton Township, Mercer County Board of Education, New Jersey, General Obligation Bonds, Series 2017 | 3.250 | 12/15/38 | 604,714 | ||||||||||||||
| 1,340,000 | Harrison, New Jersey, General Obligation Bonds, Parking Utility Series 2018 - BAM Insured | 3.125 | 03/01/31 | 1,342,195 | ||||||||||||||
| 1,110,000 | Harrison, New Jersey, General Obligation Bonds, Parking Utility Series 2018 - BAM Insured | 3.250 | 03/01/32 | 1,110,174 | ||||||||||||||
| 1,255,000 | Harrison, New Jersey, General Obligation Bonds, Parking Utility Series 2018 - BAM Insured | 3.500 | 03/01/36 | 1,235,641 | ||||||||||||||
| 1,040,000 | Hudson County Improvement Authority, New Jersey, County Guaranteed Governmental Loan Revenue Bonds, Guttenberg General Obligation Bond Project, Series 2018 | 5.000 | 08/01/42 | 1,040,112 | ||||||||||||||
| 2,000,000 | Hudson County Improvement Authority, New Jersey, County Secured Lease Revenue Bonds, Hudson County Courthouse Project, Series 2020 | 4.000 | 10/01/46 | 1,823,193 | ||||||||||||||
| 2,390,000 | Hudson County Improvement Authority, New Jersey, County Secured Lease Revenue Bonds, Hudson County Courthouse Project, Series 2020 | 4.000 | 10/01/51 | 2,093,821 | ||||||||||||||
| 4,235,000 | Hudson County Improvement Authority, New Jersey, County Secured Lease Revenue Bonds, Hudson County Vocational Technical Schools Project, Series 2016 | 5.000 | 05/01/46 | 4,236,883 | ||||||||||||||
| 82 |
See Notes to Financial Statements |
| PRINCIPAL | DESCRIPTION | RATE | MATURITY | VALUE | ||||||||||||||
| |
|
|||||||||||||||||
| TAX OBLIGATION/GENERAL (continued) | ||||||||||||||||||
| $ | 9,775,000 | Hudson County Improvement Authority, New Jersey, County Secured Lease Revenue Bonds, Hudson County Vocational Technical Schools Project, Series 2016 | 5.250% | 05/01/51 | $ | 9,788,452 | ||||||||||||
| 3,500,000 | Hudson County, New Jersey, Bond Anticipation Notes, Series 2025 | 4.000 | 02/26/26 | 3,523,673 | ||||||||||||||
| 650,000 | Jersey City Board of Education, Hudson County, New Jersey, General Obligation Bonds, School Energy Savings Refunding Series 2023 - AGM Insured | 4.000 | 08/15/40 | 638,179 | ||||||||||||||
| 500,000 | Jersey City Board of Education, Hudson County, New Jersey, General Obligation Bonds, School Energy Savings Refunding Series 2023 - AGM Insured | 4.000 | 08/15/41 | 482,287 | ||||||||||||||
| 880,000 | Jersey City Board of Education, Hudson County, New Jersey, General Obligation Bonds, School Energy Savings Refunding Series 2023 - AGM Insured | 4.125 | 08/15/42 | 844,668 | ||||||||||||||
| 5,000,000 | Jersey City, New Jersey, General Obligation Bonds, General Improvement Series 2022A | 3.000 | 02/15/37 | 4,442,685 | ||||||||||||||
| 1,000,000 | Jersey City, New Jersey, General Obligation Bonds, Refunding General Improvement Series 2017A | 5.000 | 11/01/29 | 1,054,465 | ||||||||||||||
| 515,000 | Jersey City, New Jersey, General Obligation Bonds, Refunding General Improvement Series 2017A | 5.000 | 11/01/31 | 538,494 | ||||||||||||||
| 440,000 | Jersey City, New Jersey, General Obligation Bonds, Refunding General Improvement Series 2017A | 5.000 | 11/01/33 | 456,681 | ||||||||||||||
| 1,850,000 | Madison Borough Board of Education, Morris County, New Jersey, General Obligation Bonds, School Series 2024 | 1.000 | 08/15/30 | 1,675,679 | ||||||||||||||
| 1,585,000 | Madison Borough Board of Education, Morris County, New Jersey, General Obligation Bonds, School Series 2024 | 4.000 | 08/15/42 | 1,474,260 | ||||||||||||||
| 2,305,000 | Manalapan-Englishtown Regional Board of Education, New Jersey, General Obligation Bonds, School Series 2025 | 4.000 | 07/15/43 | 2,164,818 | ||||||||||||||
| 5,195,000 | Manalapan-Englishtown Regional Board of Education, New Jersey, General Obligation Bonds, School Series 2025 | 4.000 | 07/15/44 | 4,826,173 | ||||||||||||||
| 1,000,000 | Monmouth County Improvement Authority, New Jersey, Governmental Pooled Loan Revenue Bonds, Series 2021A | 3.000 | 03/01/36 | 928,899 | ||||||||||||||
| 1,500,000 | Montclair Township Board of Education, Essex County, New Jersey, General Obligation Bonds, School Series 2025 | 4.250 | 08/01/44 | 1,429,276 | ||||||||||||||
| 165,000 | Montclair Township Board of Education, Essex County, New Jersey, General Obligation Bonds, School Series 2025 | 4.375 | 08/01/45 | 158,402 | ||||||||||||||
| 1,110,000 | New Brunswick, New Jersey, General Obligation Bonds, Cultural Center Project, Series 2017 - AGM Insured | 4.000 | 09/15/44 | 1,039,015 | ||||||||||||||
| 2,000,000 | New Jersey State, General Obligation Bonds, Covid‑19 Emergency Series 2020A | 5.000 | 06/01/27 | 2,091,095 | ||||||||||||||
| 3,310,000 | New Jersey State, General Obligation Bonds, Covid‑19 Emergency Series 2020A | 4.000 | 06/01/31 | 3,532,758 | ||||||||||||||
| 1,340,000 | New Jersey State, General Obligation Bonds, Covid‑19 Emergency Series 2020A | 3.000 | 06/01/32 | 1,327,904 | ||||||||||||||
| 3,280,000 | New Jersey State, General Obligation Bonds, Various Purpose Series 2020 | 2.250 | 06/01/35 | 2,762,372 | ||||||||||||||
| 1,000,000 | New Jersey State, General Obligation Bonds, Various Purpose Series 2021 - BAM Insured | 2.000 | 06/01/36 | 782,154 | ||||||||||||||
| 750,000 | Newark Board of Education, Essex County, New Jersey, General Obligation Bonds, School Energy Savings Series 2021 - BAM Insured | 3.000 | 07/15/38 | 622,968 | ||||||||||||||
| 755,000 | Newark Board of Education, Essex County, New Jersey, General Obligation Bonds, School Energy Savings Series 2021 - BAM Insured | 3.000 | 07/15/39 | 613,464 | ||||||||||||||
| 1,000,000 | Newark Board of Education, Essex County, New Jersey, General Obligation Bonds, School Energy Savings Series 2021 - BAM Insured | 3.000 | 07/15/40 | 797,830 | ||||||||||||||
| 2,400,000 | Newark, Essex County, New Jersey, Mass Transit Access Tax Revenue Bonds, Mulberry Pedestrian Bridge Redevelopment Project, Series 2022 - AGM Insured | 6.000 | 11/15/62 | 2,602,314 | ||||||||||||||
| 1,290,000 | Newark, New Jersey, General Obligation Bonds, Refunding Qualified General Improvement Series 2025A | 5.000 | 07/15/26 | 1,314,811 | ||||||||||||||
| 2,937,000 | Puerto Rico, General Obligation Bonds, Restructured Series 2022A‑1 | 4.000 | 07/01/33 | 2,873,570 | ||||||||||||||
| See Notes to Financial Statements |
83 |
Portfolio of Investments August 31, 2025 (continued)
NXJ
| PRINCIPAL | DESCRIPTION | RATE | MATURITY | VALUE | ||||||||||||||
| |
|
|||||||||||||||||
| TAX OBLIGATION/GENERAL (continued) | ||||||||||||||||||
| $ | 2,032,000 | Puerto Rico, General Obligation Bonds, Restructured Series 2022A‑1 | 4.000% | 07/01/35 | $ | 1,948,433 | ||||||||||||
| 2,000,000 | Rahway, New Jersey, General Obligation Bonds, Bond Anticipation Note Series 2025 | 4.000 | 07/22/26 | 2,025,218 | ||||||||||||||
| 1,000,000 | Sayreville School District, Middlesex County, New Jersey, General Obligation Bonds, School Series 2022 - BAM Insured | 4.000 | 01/15/41 | 978,200 | ||||||||||||||
| 500,000 | South Orange Village Township, New Jersey, General Obligation Bonds, Refunding Series 2020 | 4.000 | 01/15/26 | 502,666 | ||||||||||||||
| 4,035,000 | Tenafly Board of Education, Bergen County, New Jersey, General Obligation Bonds, Series 2024 | 3.000 | 08/01/36 | 3,729,107 | ||||||||||||||
| 1,000,000 | Toms River Board of Education, Ocean County, New Jersey, General Obligation Bonds, Regional Schools Series 2019 | 2.000 | 07/15/26 | 983,121 | ||||||||||||||
| 4,755,000 | Union County Utilities Authority, New Jersey, Resource Recovery Facility Lease Revenue Bonds, Covantan Union Inc. Lessee, Refunding Series 2011B, (AMT) | 5.250 | 12/01/31 | 4,763,828 | ||||||||||||||
| 2,515,000 | Union County Utilities Authority, New Jersey, Solid Waste System County Deficiency Revenue Bonds, Series 2011A | 5.000 | 06/15/41 | 2,516,473 | ||||||||||||||
| 590,000 | Vineland Board of Education, Cumberland County, New Jersey, General Obligation Bonds, Energy Savings Refunding School Series 2025 - BAM Insured | 5.000 | 07/01/40 | 634,713 | ||||||||||||||
| 500,000 | Vineland Board of Education, Cumberland County, New Jersey, General Obligation Bonds, Energy Savings Refunding School Series 2025 - BAM Insured | 5.000 | 07/01/41 | 527,630 | ||||||||||||||
| 750,000 | Vineland Board of Education, Cumberland County, New Jersey, General Obligation Bonds, Energy Savings Refunding School Series 2025 - BAM Insured | 5.000 | 07/01/42 | 783,733 | ||||||||||||||
| 700,000 | Vineland Board of Education, Cumberland County, New Jersey, General Obligation Bonds, Energy Savings Refunding School Series 2025 - BAM Insured | 4.500 | 07/01/43 | 689,246 | ||||||||||||||
| 700,000 | Vineland Board of Education, Cumberland County, New Jersey, General Obligation Bonds, Energy Savings Refunding School Series 2025 - BAM Insured | 4.500 | 07/01/44 | 688,503 | ||||||||||||||
| 1,515,000 | Washington Township Board of Education, Mercer County, New Jersey, General Obligation Bonds, Refunding Series 2005 - AGM Insured | 5.250 | 01/01/27 | 1,571,101 | ||||||||||||||
| |
|
|||||||||||||||||
| TOTAL TAX OBLIGATION/GENERAL | 103,502,503 | |||||||||||||||||
| |
||||||||||||||||||
| TAX OBLIGATION/LIMITED - 50.5% (29.1% of Total Investments) | ||||||||||||||||||
| 3,295,000 | Bergen County Improvement Authority, New Jersey, County Guaranteed Governmental Pooled Project Notes, Series 2024 | 4.000 | 10/16/25 | 3,300,453 | ||||||||||||||
| 4,500,000 | Bergen County Improvement Authority, New Jersey, County Guaranteed Governmental Pooled Project Notes, Series 2025A | 4.000 | 05/21/26 | 4,544,943 | ||||||||||||||
| 2,365,000 | Bergen County Improvement Authority, New Jersey, County Guaranteed Revenue Bonds, Bergen New Bridge Medical Center Project, Series 2022 | 5.000 | 08/01/47 | 2,425,368 | ||||||||||||||
| 3,775,000 | Bergen County Improvement Authority, New Jersey, Guaranteed Lease Revenue Bonds, County Administration Complex Project, Series 2005 | 5.000 | 11/15/26 | 3,897,436 | ||||||||||||||
| 3,065,000 | Bergen County Improvement Authority, New Jersey, Lease Revenue Bonds, County Courthouse Project, County Guaranteed Series 2024 | 5.000 | 06/01/49 | 3,200,762 | ||||||||||||||
| 2,000,000 | Bergen County Improvement Authority, New Jersey, Lease Revenue Bonds, County Courthouse Project, County Guaranteed Series 2024 | 5.000 | 06/01/54 | 2,083,738 | ||||||||||||||
| 2,605,000 | Burlington County Bridge Commission, New Jersey, Governmental Leasing Program Revenue Bonds, Notes Series 2025C‑2 | 4.000 | 07/31/26 | 2,633,986 | ||||||||||||||
| 440,000 | Camden County Improvement Authority, New Jersey, County Guaranteed Loan Revenue Bonds, Refunding Capital Program Series 2024B | 5.000 | 01/15/33 | 502,134 | ||||||||||||||
| 475,000 | Camden County Improvement Authority, New Jersey, County Guaranteed Loan Revenue Bonds, Refunding Capital Program Series 2024B | 5.000 | 01/15/36 | 529,089 | ||||||||||||||
| 500,000 | Camden County Improvement Authority, New Jersey, County Guaranteed Loan Revenue Bonds, Refunding Capital Program Series 2024B | 5.000 | 01/15/37 | 551,363 | ||||||||||||||
| 84 |
See Notes to Financial Statements |
| PRINCIPAL | DESCRIPTION | RATE | MATURITY | VALUE | ||||||||||||||
| |
|
|||||||||||||||||
| TAX OBLIGATION/LIMITED (continued) | ||||||||||||||||||
| $ | 1,000,000 | Casino Reinvestment Development Authority, New Jersey, Luxury Tax Revenue Bonds, Series 2024A | 5.000% | 11/01/40 | $ | 1,046,459 | ||||||||||||
| 1,005,000 | Casino Reinvestment Development Authority, New Jersey, Luxury Tax Revenue Bonds, Series 2024A | 4.000 | 11/01/44 | 880,431 | ||||||||||||||
| 3,000,000 | Garden State Preservation Trust, New Jersey, Open Space and Farmland Preservation Bonds, Series 2003B - AGM Insured | 0.000 | 11/01/25 | 2,985,450 | ||||||||||||||
| 335,000 | Gloucester County Improvement Authority, New Jersey, Revenue Bonds, County Guaranteed Loan Capital Program, Refunding Series 2025 | 5.000 | 10/01/25 | 335,709 | ||||||||||||||
| 560,000 | Gloucester County Improvement Authority, New Jersey, Revenue Bonds, County Guaranteed Loan Capital Program, Refunding Series 2025 | 5.000 | 04/01/26 | 568,467 | ||||||||||||||
| 590,000 | Gloucester County Improvement Authority, New Jersey, Revenue Bonds, County Guaranteed Loan Capital Program, Refunding Series 2025 | 5.000 | 04/01/27 | 614,757 | ||||||||||||||
| 1,965,000 | Middlesex County Improvement Authority, New Jersey, General Obligation Lease Revenue Bonds, New Jersey Health + Life Science Exchange - H‑1 Project Series 2023A | 5.000 | 08/15/49 | 2,028,824 | ||||||||||||||
| 8,000,000 | (b) | Middlesex County Improvement Authority, New Jersey, General Obligation Lease Revenue Bonds, New Jersey Health + Life Science Exchange - H‑1 Project Series 2023A, (UB) | 4.000 | 08/15/53 | 6,970,876 | |||||||||||||
| 5,615,000 | Middlesex County Improvement Authority, New Jersey, General Obligation Lease Revenue Bonds, New Jersey Health + Life Science Exchange - H‑1 Project Series 2023A | 5.000 | 08/15/53 | 5,722,368 | ||||||||||||||
| 7,785,000 | (b) | Middlesex County Improvement Authority, New Jersey, General Obligation Lease Revenue Bonds, New Jersey Health + Life Science Exchange - H‑1 Project Series 2023A, (UB) | 5.000 | 08/15/53 | 7,933,863 | |||||||||||||
| 5,445,000 | New Jersey Economic Development Authority, Lease Revenue Bonds, State House Project, Series 2017B | 4.500 | 06/15/40 | 5,302,124 | ||||||||||||||
| 2,400,000 | New Jersey Economic Development Authority, New Jersey, Transit Transportation Project Revenue Bonds, Portal North Bridge Project Series 2022A | 5.250 | 11/01/47 | 2,445,422 | ||||||||||||||
| 1,685,000 | New Jersey Economic Development Authority, New Jersey, Transit Transportation Project Revenue Bonds, Portal North Bridge Project Series 2022A | 5.000 | 11/01/52 | 1,687,413 | ||||||||||||||
| 5,675,000 | New Jersey Economic Development Authority, Revenue Bonds, Motor Vehicle Surcharge, Refunding Subordinate Series 2017A | 3.375 | 07/01/30 | 5,608,502 | ||||||||||||||
| 6,025,000 | New Jersey Economic Development Authority, Revenue Bonds, New Jersey Transit Corporation Projects Sublease, Refunding Series 2017B | 5.000 | 11/01/25 | 6,048,029 | ||||||||||||||
| 1,300,000 | New Jersey Economic Development Authority, School Facilities Construction Bonds, Social Series 2021QQQ | 5.000 | 06/15/31 | 1,440,501 | ||||||||||||||
| 1,000,000 | New Jersey Economic Development Authority, School Facilities Construction Bonds, Social Series 2021QQQ | 5.000 | 06/15/32 | 1,097,483 | ||||||||||||||
| 590,000 | New Jersey Educational Facilities Authority, New Jersey, Revenue Bonds, Higher Education Capital Improvement Fund, Series 2023A | 5.250 | 09/01/53 | 598,808 | ||||||||||||||
| 6,495,000 | (b) | New Jersey Educational Facilities Authority, Revenue Bonds, Higher Education Capital Improvement Fund Series 2023A, (UB) | 4.625 | 09/01/48 | 6,228,474 | |||||||||||||
| 1,140,000 | New Jersey Transportation Trust Fund Authority, Federal Highway Reimbursement Revenue Notes, Series 2016A‑1 | 5.000 | 06/15/29 | 1,160,385 | ||||||||||||||
| 655,000 | New Jersey Transportation Trust Fund Authority, Federal Highway Reimbursement Revenue Notes, Series 2016A‑1 | 5.000 | 06/15/30 | 666,072 | ||||||||||||||
| 2,000,000 | New Jersey Transportation Trust Fund Authority, Federal Highway Reimbursement Revenue Notes, Series 2018A | 5.000 | 06/15/31 | 2,030,974 | ||||||||||||||
| 3,495,000 | New Jersey Transportation Trust Fund Authority, Transportation Program Bonds, Series 2019AA | 5.000 | 06/15/46 | 3,498,738 | ||||||||||||||
| 1,250,000 | New Jersey Transportation Trust Fund Authority, Transportation Program Bonds, Series 2022BB | 3.000 | 06/15/50 | 864,755 | ||||||||||||||
| 260,000 | New Jersey Transportation Trust Fund Authority, Transportation Program Bonds, Series 2022BB | 4.000 | 06/15/50 | 221,521 | ||||||||||||||
| 3,750,000 | New Jersey Transportation Trust Fund Authority, Transportation Program Bonds, Series 2022CC | 5.000 | 06/15/42 | 3,826,806 | ||||||||||||||
| 1,000,000 | New Jersey Transportation Trust Fund Authority, Transportation Program Bonds, Series 2023AA | 4.250 | 06/15/44 | 909,725 | ||||||||||||||
| See Notes to Financial Statements |
85 |
Portfolio of Investments August 31, 2025 (continued)
NXJ
| PRINCIPAL | DESCRIPTION | RATE | MATURITY | VALUE | ||||||||||||||
| |
|
|||||||||||||||||
| TAX OBLIGATION/LIMITED (continued) | ||||||||||||||||||
| $ | 31,175,000 | New Jersey Transportation Trust Fund Authority, Transportation System Bonds, Capital Appreciation Series 2010A | 0.000% | 12/15/30 | $ | 26,450,628 | ||||||||||||
| 37,000,000 | New Jersey Transportation Trust Fund Authority, Transportation System Bonds, Refunding Series 2006C - AGM Insured | 0.000 | 12/15/32 | 28,945,104 | ||||||||||||||
| 37,945,000 | New Jersey Transportation Trust Fund Authority, Transportation System Bonds, Refunding Series 2006C - AGM Insured | 0.000 | 12/15/33 | 28,295,750 | ||||||||||||||
| 5,160,000 | New Jersey Transportation Trust Fund Authority, Transportation System Bonds, Refunding Series 2006C - AGM Insured | 0.000 | 12/15/34 | 3,656,709 | ||||||||||||||
| 1,150,000 | New Jersey Transportation Trust Fund Authority, Transportation System Bonds, Series 2018A | 5.000 | 12/15/35 | 1,194,140 | ||||||||||||||
| 440,000 | New Jersey Transportation Trust Fund Authority, Transportation System Bonds, Series 2018A | 5.000 | 12/15/36 | 454,598 | ||||||||||||||
| 4,950,000 | New Jersey Transportation Trust Fund Authority, Transportation System Bonds, Series 2019A | 4.000 | 12/15/39 | 4,651,235 | ||||||||||||||
| 750,000 | New Jersey Transportation Trust Fund Authority, Transportation System Bonds, Series 2019BB | 4.000 | 06/15/44 | 655,461 | ||||||||||||||
| 6,845,000 | New Jersey Transportation Trust Fund Authority, Transportation System Bonds, Series 2019BB | 3.500 | 06/15/46 | 5,353,271 | ||||||||||||||
| 2,720,000 | New Jersey Transportation Trust Fund Authority, Transportation System Bonds, Series 2019BB | 4.000 | 06/15/50 | 2,317,453 | ||||||||||||||
| 4,425,000 | New Jersey Transportation Trust Fund Authority, Transportation System Bonds, Series 2020AA | 5.000 | 06/15/45 | 4,443,492 | ||||||||||||||
| 2,045,000 | New Jersey Transportation Trust Fund Authority, Transportation System Bonds, Series 2020AA | 3.000 | 06/15/50 | 1,414,740 | ||||||||||||||
| 1,940,000 | New Jersey Transportation Trust Fund Authority, Transportation System Bonds, Series 2024AA | 4.000 | 06/15/42 | 1,742,886 | ||||||||||||||
| 3,170,000 | New Jersey Transportation Trust Fund Authority, Transportation System Bonds, Series 2024CC | 4.125 | 06/15/55 | 2,695,643 | ||||||||||||||
| 600,000 | Newark Parking Authority, Essex County, New Jersey, Lease Revenue Bonds, Parking Facility/Office Project Series 2023 - AGM Insured | 5.250 | 02/01/43 | 603,004 | ||||||||||||||
| 1,250,000 | Newark Parking Authority, Essex County, New Jersey, Lease Revenue Bonds, Parking Facility/Office Project Series 2023 - AGM Insured | 5.500 | 02/01/51 | 1,253,485 | ||||||||||||||
| 1,140,000 | Passaic County Improvement Authority, New Jersey, Guaranteed Revenue Bonds, Senior Housing Project Series 2024 | 4.000 | 11/01/46 | 1,072,874 | ||||||||||||||
| 750,000 | Passaic County Improvement Authority, New Jersey, Guaranteed Revenue Bonds, Senior Housing Project Series 2024 | 4.125 | 11/01/56 | 668,300 | ||||||||||||||
| 3,790,000 | Passaic County Improvement Authority, New Jersey, Lease Revenue Bonds, Preakness Healthcare Center Expansion Project, Refunding Series 2015 | 3.750 | 05/01/36 | 3,772,150 | ||||||||||||||
| 3,550,000 | Passaic County Improvement Authority, New Jersey, Lease Revenue Bonds, Preakness Healthcare Center Expansion Project, Series 2012 | 3.500 | 05/01/35 | 3,498,877 | ||||||||||||||
| 909,000 | Puerto Rico Sales Tax Financing Corporation, Sales Tax Revenue Bonds, Restructured 2018A‑1 | 4.750 | 07/01/53 | 816,308 | ||||||||||||||
| 1,783,000 | Puerto Rico Sales Tax Financing Corporation, Sales Tax Revenue Bonds, Restructured 2018A‑1 | 5.000 | 07/01/58 | 1,635,471 | ||||||||||||||
| 2,899,000 | Puerto Rico Sales Tax Financing Corporation, Sales Tax Revenue Bonds, Taxable Restructured Cofina Project Series 2019A‑2 | 4.329 | 07/01/40 | 2,688,655 | ||||||||||||||
| 1,059,000 | Puerto Rico Sales Tax Financing Corporation, Sales Tax Revenue Bonds, Taxable Restructured Cofina Project Series 2019A‑2 | 4.784 | 07/01/58 | 935,548 | ||||||||||||||
| 1,470,000 | Union County Improvement Authority, New Jersey, County Guaranteed Lease Revenue Bonds, Union County Administration Complex Project, Series 2024 | 4.125 | 04/15/54 | 1,285,004 | ||||||||||||||
| 1,420,000 | Union County Improvement Authority, New Jersey, General Obligation Lease Bonds, Juvenile Detention Center Facility Project, Refunding Series 2015A | 5.500 | 05/01/28 | 1,539,896 | ||||||||||||||
| 1,425,000 | Union County Improvement Authority, New Jersey, General Obligation Lease Bonds, Juvenile Detention Center Facility Project, Refunding Series 2015A | 5.500 | 05/01/29 | 1,586,279 | ||||||||||||||
| 1,000,000 | Union County Improvement Authority, New Jersey, General Obligation Lease Bonds, Juvenile Detention Center Facility Project, Refunding Series 2015A | 5.500 | 05/01/30 | 1,137,479 | ||||||||||||||
| 86 |
See Notes to Financial Statements |
| PRINCIPAL | DESCRIPTION | RATE | MATURITY | VALUE | ||||||||||||||
| |
|
|||||||||||||||||
| TAX OBLIGATION/LIMITED (continued) | ||||||||||||||||||
| $ | 1,830,000 | Union County Improvement Authority, New Jersey, General Obligation Lease Bonds, Juvenile Detention Center Facility Project, Refunding Series 2015A | 5.500% | 05/01/31 | $ | 2,114,927 | ||||||||||||
| 1,915,000 | Union County Improvement Authority, New Jersey, General Obligation Lease Bonds, Juvenile Detention Center Facility Project, Refunding Series 2015A | 5.500 | 05/01/32 | 2,241,584 | ||||||||||||||
| 1,990,000 | Union County Improvement Authority, New Jersey, General Obligation Lease Bonds, Juvenile Detention Center Facility Project, Refunding Series 2015A | 5.500 | 05/01/33 | 2,353,058 | ||||||||||||||
| 2,075,000 | Union County Improvement Authority, New Jersey, General Obligation Lease Bonds, Juvenile Detention Center Facility Project, Refunding Series 2015A | 5.500 | 05/01/34 | 2,472,773 | ||||||||||||||
| 13,760,000 | Union County Improvement Authority, New Jersey, Lease Revenue Bonds, Plainfield - Park Madison Redevelopment Project, Refunding Series 2013A |
5.000 | 03/01/34 | 15,018,158 | ||||||||||||||
| |
|
|||||||||||||||||
| TOTAL TAX OBLIGATION/LIMITED | 255,357,148 | |||||||||||||||||
| |
||||||||||||||||||
| TRANSPORTATION - 32.4% (18.7% of Total Investments) | ||||||||||||||||||
| 1,000,000 | Delaware River and Bay Authority, Delaware and New Jersey, Revenue Bonds, Refunding Series 2024B | 5.000 | 01/01/42 | 1,053,532 | ||||||||||||||
| 1,000,000 | Delaware River and Bay Authority, Delaware and New Jersey, Revenue Bonds, Refunding Series 2024B | 5.000 | 01/01/43 | 1,046,400 | ||||||||||||||
| 1,075,000 | Delaware River and Bay Authority, Delaware and New Jersey, Revenue Bonds, Series 2019 | 4.000 | 01/01/44 | 972,828 | ||||||||||||||
| 665,000 | Delaware River and Bay Authority, Delaware and New Jersey, Revenue Bonds, Series 2024A | 5.000 | 01/01/49 | 681,641 | ||||||||||||||
| 1,000,000 | Delaware River Joint Toll Bridge Commission, New Jersey and Pennsylvania, Bridge System Revenue Bonds, Refunding Series 2015 - BAM Insured | 4.000 | 07/01/34 | 1,000,307 | ||||||||||||||
| 2,820,000 | Delaware River Joint Toll Bridge Commission, New Jersey and Pennsylvania, Bridge System Revenue Bonds, Refunding Series 2015 - BAM Insured | 4.000 | 07/01/35 | 2,820,496 | ||||||||||||||
| 2,005,000 | Delaware River Joint Toll Bridge Commission, New Jersey and Pennsylvania, Bridge System Revenue Bonds, Refunding Series 2019B | 5.000 | 07/01/28 | 2,147,417 | ||||||||||||||
| 1,520,000 | Delaware River Joint Toll Bridge Commission, New Jersey and Pennsylvania, Bridge System Revenue Bonds, Refunding Series 2019B | 5.000 | 07/01/29 | 1,661,234 | ||||||||||||||
| 2,820,000 | Delaware River Joint Toll Bridge Commission, New Jersey and Pennsylvania, Bridge System Revenue Bonds, Series 2017 | 5.000 | 07/01/42 | 2,833,766 | ||||||||||||||
| 10,210,000 | Delaware River Joint Toll Bridge Commission, New Jersey and Pennsylvania, Bridge System Revenue Bonds, Series 2017 | 5.000 | 07/01/47 | 10,222,669 | ||||||||||||||
| 1,050,000 | Delaware River Joint Toll Bridge Commission, New Jersey and Pennsylvania, Bridge System Revenue Bonds, Series 2019A | 5.000 | 07/01/28 | 1,124,582 | ||||||||||||||
| 1,350,000 | Delaware River Joint Toll Bridge Commission, New Jersey and Pennsylvania, Bridge System Revenue Bonds, Series 2019A | 5.000 | 07/01/29 | 1,475,439 | ||||||||||||||
| 1,015,000 | Delaware River Joint Toll Bridge Commission, New Jersey and Pennsylvania, Bridge System Revenue Bonds, Series 2019A | 5.000 | 07/01/30 | 1,106,160 | ||||||||||||||
| 10,035,000 | Delaware River Port Authority, New Jersey and Pennsylvania, Revenue Bonds, Series 2013 | 5.000 | 01/01/40 | 10,053,538 | ||||||||||||||
| 4,140,000 | Delaware River Port Authority, New Jersey and Pennsylvania, Revenue Bonds, Refunding Series 2025 | 5.000 | 01/01/37 | 4,577,417 | ||||||||||||||
| 2,400,000 | Delaware River Port Authority, New Jersey and Pennsylvania, Revenue Bonds, Series 2018A | 5.000 | 01/01/37 | 2,489,709 | ||||||||||||||
| 6,355,000 | New Jersey Economic Development Authority, Private Activity Bonds, The Goethals Bridge Replacement Project, Series 2013, (AMT) | 5.375 | 01/01/43 | 6,358,095 | ||||||||||||||
| 7,815,000 | New Jersey Economic Development Authority, Private Activity Bonds, The Goethals Bridge Replacement Project, Series 2013, (AMT) | 5.625 | 01/01/52 | 7,818,204 | ||||||||||||||
| 1,975,000 | New Jersey Economic Development Authority, Special Facilities Revenue Bonds, Continental Airlines Inc., Series 1999, (AMT) | 5.250 | 09/15/29 | 1,977,062 | ||||||||||||||
| 2,250,000 | New Jersey Economic Development Authority, Special Facilities Revenue Bonds, Continental Airlines Inc., Series 2000A & 2000B, (AMT) | 5.625 | 11/15/30 | 2,252,349 | ||||||||||||||
| See Notes to Financial Statements |
87 |
Portfolio of Investments August 31, 2025 (continued)
NXJ
| PRINCIPAL | DESCRIPTION | RATE | MATURITY | VALUE | ||||||||||||||
| |
|
|||||||||||||||||
| TRANSPORTATION (continued) | ||||||||||||||||||
| $ | 5,215,000 | New Jersey Economic Development Authority, Special Facility Revenue Bonds, Port Newark Container Terminal LLC Project, Refunding Series 2017, (AMT) | 5.000% | 10/01/37 | $ | 5,255,095 | ||||||||||||
| 9,110,000 | New Jersey Economic Development Authority, Special Facility Revenue Bonds, Port Newark Container Terminal LLC Project, Refunding Series 2017, (AMT) | 5.000 | 10/01/47 | 8,631,224 | ||||||||||||||
| 2,565,000 | New Jersey Turnpike Authority, Revenue Bonds, Series 2005A - AGM Insured | 5.250 | 01/01/29 | 2,803,459 | ||||||||||||||
| 2,000,000 | New Jersey Turnpike Authority, Turnpike Revenue Bonds, Series 2021A | 4.000 | 01/01/42 | 1,842,703 | ||||||||||||||
| 2,490,000 | New Jersey Turnpike Authority, Turnpike Revenue Bonds, Series 2021A | 4.000 | 01/01/51 | 2,148,362 | ||||||||||||||
| 1,230,000 | New Jersey Turnpike Authority, Turnpike Revenue Bonds, Series 2022A | 4.000 | 01/01/42 | 1,138,033 | ||||||||||||||
| 2,500,000 | New Jersey Turnpike Authority, Turnpike Revenue Bonds, Series 2022A | 4.000 | 01/01/43 | 2,276,442 | ||||||||||||||
| 7,500,000 | (b) | New Jersey Turnpike Authority, Turnpike Revenue Bonds, Series 2022B, (UB) | 5.250 | 01/01/52 | 7,712,094 | |||||||||||||
| 8,500,000 | (b) | New Jersey Turnpike Authority, Turnpike Revenue Bonds, Series 2024B, (UB) | 4.125 | 01/01/54 | 7,381,035 | |||||||||||||
| 3,000,000 | New Jersey Turnpike Authority, Turnpike Revenue Bonds, Series 2024B | 5.250 | 01/01/54 | 3,101,530 | ||||||||||||||
| 5,000,000 | (b) | New Jersey Turnpike Authority, Turnpike Revenue Bonds, Series 2025A, (UB) | 4.750 | 01/01/50 | 4,926,605 | |||||||||||||
| 5,000,000 | (b) | New Jersey Turnpike Authority, Turnpike Revenue Bonds, Series 2025A, (UB) | 4.750 | 01/01/55 | 4,891,279 | |||||||||||||
| 2,800,000 | New Jersey Turnpike Authority, Turnpike Revenue Bonds, Series 2025A | 5.250 | 01/01/55 | 2,906,542 | ||||||||||||||
| 2,750,000 | Passaic County Improvement Authority, New Jersey, Revenue Bonds, Paterson Parking Deck Facility, Series 2005 | 5.000 | 04/15/35 | 2,753,085 | ||||||||||||||
| 2,890,000 | Port Authority of New York and New Jersey, Consolidated Revenue Bonds, One Hundred Seventy Seventh Series 2013, (AMT) | 4.000 | 01/15/43 | 2,463,187 | ||||||||||||||
| 7,895,000 | Port Authority of New York and New Jersey, Consolidated Revenue Bonds, Two Hundred Eighteen Series 2019, (AMT) | 4.000 | 11/01/41 | 7,088,161 | ||||||||||||||
| 4,000,000 | Port Authority of New York and New Jersey, Consolidated Revenue Bonds, Two Hundred Eighteen Series 2019, (AMT) | 4.000 | 11/01/47 | 3,343,979 | ||||||||||||||
| 1,000,000 | Port Authority of New York and New Jersey, Consolidated Revenue Bonds, Two Hundred Forty-Fifth Series 2024 | 5.000 | 09/01/49 | 1,017,396 | ||||||||||||||
| 1,285,000 | Port Authority of New York and New Jersey, Consolidated Revenue Bonds, Two Hundred Forty-Fifth Series 2024 | 5.000 | 09/01/54 | 1,302,712 | ||||||||||||||
| 4,500,000 | Port Authority of New York and New Jersey, Consolidated Revenue Bonds, Two Hundred Fourteen Series 2019, (AMT) | 4.000 | 09/01/38 | 4,253,790 | ||||||||||||||
| 2,500,000 | Port Authority of New York and New Jersey, Consolidated Revenue Bonds, Two Hundred Fourteen Series 2019, (AMT) | 4.000 | 09/01/39 | 2,324,767 | ||||||||||||||
| 1,265,000 | Port Authority of New York and New Jersey, Consolidated Revenue Bonds, Two Hundred Thirty-Eighth Series 2023, (AMT) | 5.000 | 07/15/38 | 1,313,571 | ||||||||||||||
| 2,000,000 | Port Authority of New York and New Jersey, Consolidated Revenue Bonds, Two Hundred Thirty-Four Series 2022, (AMT) | 5.500 | 08/01/52 | 2,052,151 | ||||||||||||||
| 10,720,000 | (b) | Port Authority of New York and New Jersey, Consolidated Revenue Bonds, Two Hundred Thirty‑Six Series 2022, (AMT), (UB) | 5.000 | 01/15/47 | 10,694,345 | |||||||||||||
| 1,000,000 | South Jersey Transportation Authority, New Jersey, Transportation System Revenue Bonds, Refunding Series 2025A - BAM Insured | 4.000 | 11/01/38 | 962,158 | ||||||||||||||
| 1,000,000 | South Jersey Transportation Authority, New Jersey, Transportation System Revenue Bonds, Refunding Series 2025A - BAM Insured | 4.000 | 11/01/39 | 946,707 | ||||||||||||||
| 1,385,000 | South Jersey Transportation Authority, New Jersey, Transportation System Revenue Bonds, Series 2020A | 5.000 | 11/01/45 | 1,386,634 | ||||||||||||||
| 2,240,000 | South Jersey Transportation Authority, New Jersey, Transportation System Revenue Bonds, Series 2022A | 4.625 | 11/01/47 | 2,093,351 | ||||||||||||||
| 1,000,000 | South Jersey Transportation Authority, New Jersey, Transportation System Revenue Bonds, Series 2022A - BAM Insured | 5.250 | 11/01/52 | 1,029,086 | ||||||||||||||
| |
|
|||||||||||||||||
| TOTAL TRANSPORTATION | 163,712,328 | |||||||||||||||||
| |
||||||||||||||||||
| 88 |
See Notes to Financial Statements |
| PRINCIPAL | DESCRIPTION | RATE | MATURITY | VALUE | ||||||||||||||
| |
|
|||||||||||||||||
| U.S. GUARANTEED - 1.4% (c)(0.8% of Total Investments) | ||||||||||||||||||
| $ | 1,760,000 | New Jersey Health Care Facilities Financing Authority, Revenue Bonds, Kennedy Health System Obligated Group Issue, Refunding Series 2012, (ETM) | 3.750% | 07/01/27 | $ | 1,782,696 | ||||||||||||
| 1,875,000 | New Jersey Transportation Trust Fund Authority, Transportation Program Bonds, Series 2019AA, (Pre‑refunded 12/15/28) | 5.000 | 06/15/46 | 2,035,751 | ||||||||||||||
| 1,250,000 | New Jersey Transportation Trust Fund Authority, Transportation Program Bonds, Series 2022CC, (Pre‑refunded 12/15/32) | 5.000 | 06/15/48 | 1,430,755 | ||||||||||||||
| 1,610,000 | New Jersey Transportation Trust Fund Authority, Transportation Program Bonds, Series 2022CC, (Pre‑refunded 12/15/32) | 5.500 | 06/15/50 | 1,895,547 | ||||||||||||||
| |
|
|||||||||||||||||
| TOTAL U.S. GUARANTEED | 7,144,749 | |||||||||||||||||
| |
||||||||||||||||||
| UTILITIES - 6.1% (3.5% of Total Investments) | ||||||||||||||||||
| 500,000 | Guam Power Authority, Revenue Bonds, Refunding Series 2024A | 5.000 | 10/01/28 | 532,526 | ||||||||||||||
| 505,000 | Guam Power Authority, Revenue Bonds, Refunding Series 2024A | 5.000 | 10/01/29 | 545,356 | ||||||||||||||
| 1,970,000 | New Jersey Economic Development Authority, Natural Gas Facilities Revenue Bonds, New Jersey Natural Gas Company Project, Refunding Series 2011A | 2.750 | 08/01/39 | 1,488,333 | ||||||||||||||
| 1,495,000 | New Jersey Economic Development Authority, Natural Gas Facilities Revenue Bonds, New Jersey Natural Gas Company Project, Refunding Series 2011C, (AMT) | 3.000 | 08/01/41 | 1,137,340 | ||||||||||||||
| 2,355,000 | New Jersey Economic Development Authority, Water Facilities Revenue Bonds, Middlesex Water Company, Series 2019, (AMT) | 4.000 | 08/01/59 | 1,867,621 | ||||||||||||||
| 835,000 | New Jersey Environmental Infrastructure Trust, Environmental Infrastructure Bonds, Green Series 2025A‑SW1 | 5.000 | 09/01/36 | 958,560 | ||||||||||||||
| 4,455,000 | New Jersey Infrastructure Bank, Environmental Infrastructure Bonds, Green Series 2021A‑1 | 3.000 | 09/01/34 | 4,248,603 | ||||||||||||||
| 925,000 | New Jersey Infrastructure Bank, Environmental Infrastructure Bonds, Green Series 2024A‑W1 | 5.000 | 09/01/49 | 957,523 | ||||||||||||||
| 2,700,000 | Passaic County Utilities Authority, New Jersey, Solid Waste Disposal Revenue Bonds, Refunding Series 2018 | 5.000 | 03/01/37 | 2,948,869 | ||||||||||||||
| 1,365,000 | Passaic Valley Water Commission, New Jersey, Water System Revenue Bonds, Series 2023 - AGM Insured | 4.000 | 12/01/53 | 1,208,385 | ||||||||||||||
| 1,500,000 | (a) | Puerto Rico Aqueduct and Sewerage Authority, Revenue Bonds, Refunding Senior Lien Series 2020A | 5.000 | 07/01/35 | 1,547,109 | |||||||||||||
| 1,000,000 | (a) | Puerto Rico Aqueduct and Sewerage Authority, Revenue Bonds, Refunding Senior Lien Series 2021B | 4.000 | 07/01/42 | 863,600 | |||||||||||||
| 13,000,000 | Salem County Pollution Control Financing Authority, New Jersey, Revenue Bonds, Atlantic City Electric Company Project, Refunding Series 2020 | 2.250 | 06/01/29 | 12,386,144 | ||||||||||||||
| |
|
|||||||||||||||||
| TOTAL UTILITIES | 30,689,969 | |||||||||||||||||
| |
||||||||||||||||||
| TOTAL MUNICIPAL BONDS (Cost $912,286,109) |
874,297,575 | |||||||||||||||||
| |
||||||||||||||||||
| TOTAL LONG-TERM INVESTMENTS (Cost $912,286,109) |
874,297,575 | |||||||||||||||||
| |
||||||||||||||||||
| PRINCIPAL | DESCRIPTION | RATE | MATURITY | VALUE | ||||||||||||||
| |
|
|||||||||||||||||
| SHORT-TERM INVESTMENTS - 0.4% (0.2% of Total Investments) | ||||||||||||||||||
| MUNICIPAL BONDS - 0.4% (0.2% of Total Investments) | ||||||||||||||||||
| HOUSING/MULTIFAMILY - 0.4% (0.2% of Total Investments) | ||||||||||||||||||
| $ | 1,960,000 | (d) | New Jersey Housing and Mortgage Finance Agency, Multifamily Housing Revenue Bonds, Meadow Brook Apartments Project, Series 2006A, (AMT) | 3.000 | 03/15/40 | $ | 1,960,000 | |||||||||||
| |
|
|||||||||||||||||
| TOTAL HOUSING/MULTIFAMILY | 1,960,000 | |||||||||||||||||
| |
||||||||||||||||||
| TOTAL SHORT-TERM INVESTMENTS (Cost $1,960,000) |
1,960,000 | |||||||||||||||||
| |
||||||||||||||||||
| TOTAL INVESTMENTS - 173.4% (Cost $914,246,109) |
876,257,575 | |||||||||||||||||
| |
||||||||||||||||||
| FLOATING RATE OBLIGATIONS - (12.6)% | (63,850,000) | |||||||||||||||||
| |
||||||||||||||||||
| VRDP SHARES, NET - (61.9)% (e) | (312,832,483) | |||||||||||||||||
| |
||||||||||||||||||
| OTHER ASSETS & LIABILITIES, NET - 1.1% | 5,643,694 | |||||||||||||||||
| |
||||||||||||||||||
| NET ASSETS APPLICABLE TO COMMON SHARES - 100% | $ | 505,218,786 | ||||||||||||||||
| |
||||||||||||||||||
All percentages shown in the Portfolio of Investments are based on net assets applicable to common shares unless otherwise noted.
| See Notes to Financial Statements |
89 |
Portfolio of Investments August 31, 2025 (continued)
NXJ
| AMT | Alternative Minimum Tax | |
| ETM | Escrowed to maturity | |
| UB | Underlying bond of an inverse floating rate trust reflected as a financing transaction. Inverse floating rate trust is a Recourse Trust unless otherwise noted. | |
| (a) | Security is exempt from registration under Rule 144A of the Securities Act of 1933, as amended. These securities are deemed liquid and may be resold in transactions exempt from registration, which are normally those transactions with qualified institutional buyers. As of the end of the reporting period, the aggregate value of these securities is $6,480,849 or 0.7% of Total Investments. | |
| (b) | Investment, or portion of investment, has been pledged to collateralize the net payment obligations for investments in inverse floating rate transactions. | |
| (c) | Backed by an escrow or trust containing sufficient U.S. Government or U.S. Government agency securities, which ensure the timely payment of principal and interest. | |
| (d) | Investment has a maturity of greater than one year, but has variable rate and/or demand features which qualify it as a short-term investment. The rate disclosed, as well as the reference rate and spread, where applicable, is that in effect as of the end of the reporting period. This rate changes periodically based on market conditions or a specified market index. | |
| (e) | VRDP Shares, Net as a percentage of Total Investments is 35.7%. | |
| 90 |
See Notes to Financial Statements |
Portfolio of Investments August 31, 2025
NRK
| PRINCIPAL | DESCRIPTION | RATE | MATURITY | VALUE | ||||||||||||||
| |
|
|||||||||||||||||
| LONG-TERM INVESTMENTS - 170.4% (98.2% of Total Investments) | ||||||||||||||||||
| MUNICIPAL BONDS - 170.4% (98.2% of Total Investments) | ||||||||||||||||||
| CONSUMER STAPLES - 8.0% (4.6% of Total Investments) | ||||||||||||||||||
| $ | 27,580,000 | Erie County Tobacco Asset Securitization Corporation, New York, Tobacco Settlement Asset-Backed Bonds, Series 2005A | 5.000% | 06/01/38 | $ | 24,870,726 | ||||||||||||
| 9,555,000 | Erie County Tobacco Asset Securitization Corporation, New York, Tobacco Settlement Asset-Backed Bonds, Series 2005A | 5.000 | 06/01/45 | 7,726,721 | ||||||||||||||
| 10,000,000 | (a) | Erie County Tobacco Asset Securitization Corporation, New York, Tobacco Settlement Asset-Backed Bonds, Series 2005C | 0.000 | 06/01/50 | 1,160,009 | |||||||||||||
| 4,680,000 | New York Counties Tobacco Trust VI, New York, Tobacco Settlement Pass-Through Bonds, Turbo Term Series 2016A. Including 2016A‑1, 2016A‑2A and 2016A‑2B | 5.000 | 06/01/45 | 3,983,604 | ||||||||||||||
| 39,715,000 | TSASC Inc., New York, Tobacco Asset-Backed Bonds, Series 2006 | 5.000 | 06/01/48 | 33,727,018 | ||||||||||||||
| |
|
|||||||||||||||||
| TOTAL CONSUMER STAPLES | 71,468,078 | |||||||||||||||||
| |
||||||||||||||||||
| EDUCATION AND CIVIC ORGANIZATIONS - 24.4% (14.1% of Total Investments) | ||||||||||||||||||
| 6,620,000 | Brooklyn Arena Local Development Corporation, New York, Payment in Lieu of Taxes Revenue Bonds, Barclays Center Project, Refunding Series 2016A | 5.000 | 07/15/42 | 6,476,827 | ||||||||||||||
| 9,995,000 | Brooklyn Arena Local Development Corporation, New York, Payment in Lieu of Taxes Revenue Bonds, Barclays Center Project, Series 2009 | 0.000 | 07/15/45 | 3,392,652 | ||||||||||||||
| 29,145,000 | Brooklyn Arena Local Development Corporation, New York, Payment in Lieu of Taxes Revenue Bonds, Barclays Center Project, Series 2009 | 0.000 | 07/15/47 | 8,667,411 | ||||||||||||||
| 970,000 | Build New York City Resource Corporation, New York, Revenue Bonds, Classical Charter Schools Series 2023A | 4.500 | 06/15/43 | 881,474 | ||||||||||||||
| 850,000 | Build New York City Resource Corporation, New York, Revenue Bonds, Classical Charter Schools Series 2023A | 4.750 | 06/15/53 | 754,330 | ||||||||||||||
| 500,000 | Build New York City Resource Corporation, New York, Revenue Bonds, Classical Charter Schools Series 2023A | 4.750 | 06/15/58 | 437,831 | ||||||||||||||
| 725,000 | Build New York City Resource Corporation, New York, Revenue Bonds, Global Community Charter School Project, Series 2022A | 5.000 | 06/15/52 | 586,570 | ||||||||||||||
| 5,000,000 | Build New York City Resource Corporation, New York, Revenue Bonds, KIPP New York City Public School Facilities, Canal West Project, Series 2022 | 5.250 | 07/01/57 | 4,741,006 | ||||||||||||||
| 5,325,000 | Build New York City Resource Corporation, New York, Revenue Bonds, KIPP New York City Public School Facilities, Canal West Project, Series 2022 | 5.250 | 07/01/62 | 4,996,050 | ||||||||||||||
| 1,100,000 | (b) | Build New York City Resource Corporation, New York, Revenue Bonds, Metropolitan College of New York, Series 2014 | 5.250 | 11/01/29 | 770,000 | |||||||||||||
| 5,705,000 | (b) | Build New York City Resource Corporation, New York, Revenue Bonds, Metropolitan College of New York, Series 2014 | 5.250 | 11/01/34 | 3,993,500 | |||||||||||||
| 1,500,000 | (b) | Build New York City Resource Corporation, New York, Revenue Bonds, Metropolitan College of New York, Series 2014 | 5.000 | 11/01/39 | 1,050,000 | |||||||||||||
| 880,000 | Build New York City Resource Corporation, New York, Revenue Bonds, Success Academy Charter Schools Project, Series 2024 | 4.000 | 09/01/43 | 785,226 | ||||||||||||||
| 1,050,000 | Build New York City Resource Corporation, New York, Revenue Bonds, Success Academy Charter Schools Project, Series 2024 | 4.000 | 09/01/44 | 929,096 | ||||||||||||||
| 2,440,000 | (a) | Build NYC Resource Corporation Revenue Bonds, New York, East Harlem Scholars Academy Charter School Project, Series 2022 (Social Bonds) | 5.750 | 06/01/62 | 2,264,887 | |||||||||||||
| 7,510,000 | (a) | Build NYC Resource Corporation, New York, Revenue Bonds, Family Life Academy Charter School, Series 2020A‑1 | 5.500 | 06/01/55 | 6,296,916 | |||||||||||||
| 500,000 | (a) | Build NYC Resource Corporation, New York, Revenue Bonds, Richmond Preparatory Charter School Project, Social Impact Project Series 2021A | 5.000 | 06/01/41 | 426,007 | |||||||||||||
| 2,085,000 | (a) | Build NYC Resource Corporation, New York, Revenue Bonds, Richmond Preparatory Charter School Project, Social Impact Project Series 2021A | 5.000 | 06/01/51 | 1,614,731 | |||||||||||||
| 750,000 | (a) | Build NYC Resource Corporation, New York, Revenue Bonds, Richmond Preparatory Charter School Project, Social Impact Project Series 2021A | 5.000 | 06/01/56 | 566,004 | |||||||||||||
| 3,655,000 | Dobbs Ferry Local Development Corporation, New York, Revenue Bonds, Mercy College Project, Series 2014 | 5.000 | 07/01/44 | 3,581,393 | ||||||||||||||
| See Notes to Financial Statements |
91 |
Portfolio of Investments August 31, 2025 (continued)
NRK
| PRINCIPAL | DESCRIPTION | RATE | MATURITY | VALUE | ||||||||||||||
| |
|
|||||||||||||||||
| EDUCATION AND CIVIC ORGANIZATIONS (continued) | ||||||||||||||||||
| $ | 4,750,000 | (a) | Dormitory Authority of the State of New York, General Revenue Bonds, American Musical and Dramatic Academy Inc., Series 2023A | 7.250% | 07/01/53 | $ | 4,750,194 | |||||||||||
| 5,055,000 | Dormitory Authority of the State of New York, General Revenue Bonds, Yeshiva University, Series 2022A | 5.000 | 07/15/42 | 5,026,287 | ||||||||||||||
| 8,655,000 | Dormitory Authority of the State of New York, General Revenue Bonds, Yeshiva University, Series 2022A | 5.000 | 07/15/50 | 8,248,546 | ||||||||||||||
| 4,265,000 | Dormitory Authority of the State of New York, Housing Revenue Bonds, Fashion Institute of Technology, Series 2007 - FGIC Insured | 5.250 | 07/01/34 | 4,362,425 | ||||||||||||||
| 9,000,000 | Dormitory Authority of the State of New York, Revenue Bonds, Fordham University, Series 2020 | 4.000 | 07/01/46 | 7,693,052 | ||||||||||||||
| 4,825,000 | Dormitory Authority of the State of New York, Revenue Bonds, Icahn School of Medicine at Mount Sinai, Refunding Series 2015A | 5.000 | 07/01/40 | 4,824,623 | ||||||||||||||
| 8,145,000 | Dormitory Authority of the State of New York, Revenue Bonds, Icahn School of Medicine at Mount Sinai, Refunding Series 2015A | 5.000 | 07/01/45 | 7,685,048 | ||||||||||||||
| 5,820,000 | Dormitory Authority of the State of New York, Revenue Bonds, New School University, Series 2016A | 5.000 | 07/01/41 | 5,841,231 | ||||||||||||||
| 4,000,000 | Dormitory Authority of the State of New York, Revenue Bonds, New School University, Series 2022A | 4.000 | 07/01/47 | 3,284,440 | ||||||||||||||
| 4,000,000 | Dormitory Authority of the State of New York, Revenue Bonds, New York University, Series 2001‑1 - AMBAC Insured | 5.500 | 07/01/40 | 4,494,990 | ||||||||||||||
| 2,605,000 | Dormitory Authority of the State of New York, Revenue Bonds, New York University, Series 2016A | 4.000 | 07/01/43 | 2,335,437 | ||||||||||||||
| 2,000,000 | Dormitory Authority of the State of New York, Revenue Bonds, New York University, Series 2019A | 5.000 | 07/01/37 | 2,086,797 | ||||||||||||||
| 4,125,000 | Dormitory Authority of the State of New York, Revenue Bonds, Rockefeller University, Green Series 2019B | 5.000 | 07/01/50 | 4,126,237 | ||||||||||||||
| 1,375,000 | Dormitory Authority of the State of New York, Revenue Bonds, Rockefeller University, Series 2020A | 5.000 | 07/01/53 | 1,363,294 | ||||||||||||||
| 13,165,000 | Dormitory Authority of the State of New York, Revenue Bonds, Rockefeller University, Series 2022A | 4.000 | 07/01/42 | 12,168,449 | ||||||||||||||
| 8,925,000 | (a) | Dormitory Authority of the State of New York, Revenue Bonds, Vaughn College of Aeronautics & Technology, Series 2016A | 5.500 | 12/01/36 | 7,942,559 | |||||||||||||
| 11,470,000 | Dutchess County Local Development Corporation, New York, Revenue Bonds, Marist College Project, Series 2022 | 4.000 | 07/01/49 | 9,547,877 | ||||||||||||||
| 7,695,000 | Glen Cove Local Economic Assistance Corporation, New York, Revenue Bonds, Garvies Point Public Improvement Project, Capital Appreciation Series 2016C | 5.625 | 01/01/55 | 6,557,594 | ||||||||||||||
| 1,500,000 | Glen Cove Local Economic Assistance Corporation, New York, Revenue Bonds, Garvies Point Public Improvement Project, Current Interest Series 2016A | 5.000 | 01/01/56 | 1,148,831 | ||||||||||||||
| 1,785,000 | Hempstead Town Local Development Corporation, New York, Revenue Bonds, Adelphi University Project, Series 2013 | 5.000 | 09/01/38 | 1,785,419 | ||||||||||||||
| 1,785,000 | Hempstead Town Local Development Corporation, New York, Revenue Bonds, Adelphi University Project, Series 2013 | 5.000 | 09/01/43 | 1,756,207 | ||||||||||||||
| 5,750,000 | Monroe County Industrial Development Corporation, New York, Revenue Bonds, University of Rochester Project, Series 2023A | 5.000 | 07/01/53 | 5,761,247 | ||||||||||||||
| 635,000 | Monroe County Industrial Development Corporation, New York, Revenue Bonds, St. John Fisher University Project, Series 2024 | 5.250 | 06/01/49 | 649,411 | ||||||||||||||
| 8,315,000 | MTA Hudson Rail Yards Trust Obligations, New York, MTA Financing Agreement Payable by the Metropolitan Transportation Authority, Series 2016A | 5.000 | 11/15/51 | 8,114,027 | ||||||||||||||
| 15,950,000 | New York City Industrial Development Agency, New York, PILOT Payment in Lieu of Taxes Revenue Bonds, Yankee Stadium Project, Refunding Series 2020A | 4.000 | 03/01/45 | 13,753,381 | ||||||||||||||
| 7,645,000 | New York City Industrial Development Agency, New York, PILOT Payment in Lieu of Taxes Revenue Bonds, Yankee Stadium Project, Refunding Series 2020A - AGM Insured | 4.000 | 03/01/45 | 6,843,686 | ||||||||||||||
| 10,000,000 | Onondaga County Trust For Cultural Resources, New York, Revenue Bonds, Syracuse University Project, Series 2019 | 5.000 | 12/01/43 | 10,138,865 | ||||||||||||||
| 15,805,000 | Onondaga County Trust For Cultural Resources, New York, Revenue Bonds, Syracuse University Project, Series 2019 | 4.000 | 12/01/47 | 13,799,406 | ||||||||||||||
| 92 |
See Notes to Financial Statements |
| PRINCIPAL | DESCRIPTION | RATE | MATURITY | VALUE | ||||||||||||||
| |
|
|||||||||||||||||
| EDUCATION AND CIVIC ORGANIZATIONS (continued) | ||||||||||||||||||
| $ | 350,000 | Yonkers Economic Development Corporation, New York, Educational Revenue Bonds, Lamartine/Warburton LLC‑Charter School of Educational Excellence Project, Series 2019A |
5.000% | 10/15/39 | $ | 341,642 | ||||||||||||
| |
|
|||||||||||||||||
| TOTAL EDUCATION AND CIVIC ORGANIZATIONS | 219,643,113 | |||||||||||||||||
| |
||||||||||||||||||
| FINANCIALS - 2.0% (1.1% of Total Investments) | ||||||||||||||||||
| 1,615,000 | Liberty Development Corporation, New York, Goldman Sachs Headquarter Revenue Bonds, Series 2005 | 5.250 | 10/01/35 | 1,818,855 | ||||||||||||||
| 13,835,000 | Liberty Development Corporation, New York, Goldman Sachs Headquarters Revenue Bonds Series 2007 |
5.500 | 10/01/37 | 15,756,905 | ||||||||||||||
| |
|
|||||||||||||||||
| TOTAL FINANCIALS | 17,575,760 | |||||||||||||||||
| |
||||||||||||||||||
| HEALTH CARE - 28.2% (16.2% of Total Investments) | ||||||||||||||||||
| 23,690,000 | Dormitory Authority of the State of New York, General Revenue Bonds, Northwell Health Obligated Group, Series 2022A | 4.000 | 05/01/45 | 20,458,575 | ||||||||||||||
| 29,975,000 | Dormitory Authority of the State of New York, General Revenue Bonds, Northwell Health Obligated Group, Series 2022A | 4.250 | 05/01/52 | 25,631,059 | ||||||||||||||
| 3,000,000 | Dormitory Authority of the State of New York, General Revenue Bonds, Northwell Health Obligated Group, Series 2022A | 5.000 | 05/01/52 | 2,931,804 | ||||||||||||||
| 5,000,000 | Dormitory Authority of the State of New York, General Revenue Bonds, Northwell Health Obligated Group, Series 2024A | 4.000 | 05/01/54 | 4,094,159 | ||||||||||||||
| 22,645,000 | Dormitory Authority of the State of New York, General Revenue Bonds, Northwell Health Obligated Group, Series 2024A | 5.250 | 05/01/54 | 22,759,314 | ||||||||||||||
| 25,000,000 | Dormitory Authority of the State of New York, Revenue Bonds, Memorial Sloan Kettering Cancer Center, Series 2022‑1A | 4.000 | 07/01/51 | 21,381,010 | ||||||||||||||
| 1,000,000 | Dormitory Authority of the State of New York, Revenue Bonds, Montefiore Medical Center, Series 2024 | 5.500 | 11/01/47 | 1,020,993 | ||||||||||||||
| 6,750,000 | Dormitory Authority of the State of New York, Revenue Bonds, Montefiore Obligated Group, Series 2018A | 5.000 | 08/01/34 | 6,859,951 | ||||||||||||||
| 3,250,000 | Dormitory Authority of the State of New York, Revenue Bonds, Montefiore Obligated Group, Series 2020A | 5.000 | 09/01/33 | 3,406,584 | ||||||||||||||
| 2,450,000 | Dormitory Authority of the State of New York, Revenue Bonds, Montefiore Obligated Group, Series 2020A | 4.000 | 09/01/45 | 2,049,656 | ||||||||||||||
| 9,055,000 | Dormitory Authority of the State of New York, Revenue Bonds, Mount Sinai Health Obligated Group, Series 2025 | 5.250 | 07/01/50 | 8,769,925 | ||||||||||||||
| 14,365,000 | Dormitory Authority of the State of New York, Revenue Bonds, NYU Langone Hospitals Obligated Group, Series 2020A | 4.000 | 07/01/50 | 12,154,367 | ||||||||||||||
| 21,830,000 | Dormitory Authority of the State of New York, Revenue Bonds, NYU Langone Hospitals Obligated Group, Series 2020A | 4.000 | 07/01/53 | 17,868,440 | ||||||||||||||
| 1,000,000 | (a) | Dormitory Authority of the State of New York, Revenue Bonds, Orange Regional Medical Center Obligated Group, Series 2015 | 5.000 | 12/01/30 | 1,000,117 | |||||||||||||
| 1,200,000 | (a) | Dormitory Authority of the State of New York, Revenue Bonds, Orange Regional Medical Center Obligated Group, Series 2015 | 5.000 | 12/01/34 | 1,180,143 | |||||||||||||
| 3,500,000 | (a) | Dormitory Authority of the State of New York, Revenue Bonds, Orange Regional Medical Center Obligated Group, Series 2015 | 5.000 | 12/01/40 | 3,137,597 | |||||||||||||
| 7,900,000 | (a) | Dormitory Authority of the State of New York, Revenue Bonds, Orange Regional Medical Center Obligated Group, Series 2015 | 5.000 | 12/01/45 | 6,733,799 | |||||||||||||
| 1,300,000 | (a) | Dormitory Authority of the State of New York, Revenue Bonds, Orange Regional Medical Center Obligated Group, Series 2017 | 5.000 | 12/01/25 | 1,301,893 | |||||||||||||
| 1,000,000 | (a) | Dormitory Authority of the State of New York, Revenue Bonds, Orange Regional Medical Center Obligated Group, Series 2017 | 5.000 | 12/01/27 | 1,011,709 | |||||||||||||
| 1,900,000 | (a) | Dormitory Authority of the State of New York, Revenue Bonds, Orange Regional Medical Center Obligated Group, Series 2017 | 5.000 | 12/01/29 | 1,918,978 | |||||||||||||
| 2,600,000 | (a) | Dormitory Authority of the State of New York, Revenue Bonds, Orange Regional Medical Center Obligated Group, Series 2017 | 5.000 | 12/01/30 | 2,619,873 | |||||||||||||
| 3,500,000 | (a) | Dormitory Authority of the State of New York, Revenue Bonds, Orange Regional Medical Center Obligated Group, Series 2017 | 5.000 | 12/01/34 | 3,437,057 | |||||||||||||
| 590,000 | (a) | Dormitory Authority of the State of New York, Revenue Bonds, Orange Regional Medical Center Obligated Group, Series 2017 | 5.000 | 12/01/36 | 569,253 | |||||||||||||
| 1,000,000 | Dormitory Authority of the State of New York, Revenue Bonds, Roswell Park Cancer Institute Obligated Group, Series 2025A | 5.500 | 07/01/50 | 1,040,804 | ||||||||||||||
| 620,000 | Dormitory Authority of the State of New York, Revenue Bonds, White Plains Hospital, Series 2024 | 5.250 | 10/01/49 | 601,831 | ||||||||||||||
| 5,475,000 | Dormitory Authority of the State of New York, Revenue Bonds, White Plains Hospital, Series 2024 | 5.500 | 10/01/54 | 5,592,650 | ||||||||||||||
| See Notes to Financial Statements |
93 |
Portfolio of Investments August 31, 2025 (continued)
NRK
| PRINCIPAL | DESCRIPTION | RATE | MATURITY | VALUE | ||||||||||||||
| |
|
|||||||||||||||||
| HEALTH CARE (continued) | ||||||||||||||||||
| $ | 15,405,000 | Dutchess County Local Development Corporation, New York, Revenue Bonds, Health Quest Systems, Inc. Project, Series 2016B | 4.000% | 07/01/41 | $ | 13,946,620 | ||||||||||||
| 16,705,000 | Dutchess County Local Development Corporation, New York, Revenue Bonds, Health Quest Systems, Inc. Project, Series 2016B | 5.000 | 07/01/46 | 15,822,720 | ||||||||||||||
| 200,000 | Livingston County Industrial Development Agency, New York, Civic Facility Revenue Bonds, Nicholas H. Noyes Hospital, Series 2005 | 6.000 | 07/01/30 | 200,358 | ||||||||||||||
| 3,975,000 | Monroe County Industrial Development Corporation, New York, Revenue Bonds, Rochester General Hospital Project, Series 2013A | 5.000 | 12/01/42 | 3,867,272 | ||||||||||||||
| 8,925,000 | Monroe County Industrial Development Corporation, New York, Revenue Bonds, Rochester General Hospital Project, Series 2017 | 5.000 | 12/01/46 | 8,634,223 | ||||||||||||||
| 4,000,000 | Monroe County Industrial Development Corporation, New York, Revenue Bonds, Rochester Regional Health Project, Series 2020A | 4.000 | 12/01/46 | 3,290,047 | ||||||||||||||
| 1,765,000 | New York State Dormitory Authority, Revenue Bonds, Memorial Sloan-Kettering Cancer Center Series 2025‑I | 5.250 | 07/01/54 | 1,818,249 | ||||||||||||||
| 28,805,000 | Westchester County Local Development Corporation, New York, Revenue Bonds, Westchester Medical Center Obligated Group Project, Series 2016 | 5.000 | 11/01/46 | 25,515,120 | ||||||||||||||
| 665,000 | Westchester County Local Development Corporation, New York, Revenue Bonds, Westchester Medical Center Obligated Group Project, Series 2023 | 6.250 | 11/01/52 | 693,491 | ||||||||||||||
| |
|
|||||||||||||||||
| TOTAL HEALTH CARE | 253,319,641 | |||||||||||||||||
| |
||||||||||||||||||
| HOUSING/MULTIFAMILY - 1.2% (0.7% of Total Investments) | ||||||||||||||||||
| 3,450,000 | New York City Housing Development Corporation, New York, Multifamily Housing Revenue Bonds, Sustainable Development Green Series 2024B‑1‑A | 4.750 | 11/01/54 | 3,380,652 | ||||||||||||||
| 3,430,000 | New York City Housing Development Corporation, New York, Multifamily Housing Revenue Bonds, Sustainable Development Green Series 2024B‑1‑A | 4.850 | 11/01/59 | 3,318,681 | ||||||||||||||
| 3,900,000 | New York City Housing Development Corporation, New York, Multi-Family Mortgage Revenue Bonds, 8 Spruce Street, Class F Series 2024 | 5.250 | 12/15/31 | 4,003,566 | ||||||||||||||
| |
|
|||||||||||||||||
| TOTAL HOUSING/MULTIFAMILY | 10,702,899 | |||||||||||||||||
| |
||||||||||||||||||
| INDUSTRIALS - 3.6% (2.1% of Total Investments) | ||||||||||||||||||
| 31,530,000 | (a) | New York Liberty Development Corporation, New York, Liberty Revenue Bonds, 3 World Trade Center Project, Class 1 Series 2014 | 5.000 | 11/15/44 | 30,641,185 | |||||||||||||
| 2,000,000 | New York Liberty Development Corporation, New York, Liberty Revenue Bonds, 7 World Trade Center Project, Refunding Green Series 2022A‑CL2 | 3.250 | 09/15/52 | 1,405,331 | ||||||||||||||
| 120,000 | New York Liberty Development Corporation, New York, Liberty Revenue Bonds, 7 World Trade Center Project, Refunding Green Series 2022A‑CL2 | 3.500 | 09/15/52 | 87,774 | ||||||||||||||
| |
|
|||||||||||||||||
| TOTAL INDUSTRIALS | 32,134,290 | |||||||||||||||||
| |
||||||||||||||||||
| LONG-TERM CARE - 0.1% (0.1% of Total Investments) | ||||||||||||||||||
| 1,000,000 | Monroe County Industrial Development Corporation, New York, Revenue Bonds, Saint Ann’s Community Project, Series 2019 | 5.000 | 01/01/40 | 925,831 | ||||||||||||||
| |
|
|||||||||||||||||
| TOTAL LONG-TERM CARE | 925,831 | |||||||||||||||||
| |
||||||||||||||||||
| TAX OBLIGATION/GENERAL - 7.6% (4.4% of Total Investments) | ||||||||||||||||||
| 5,030,000 | Nassau County, New York, General Obligation Bonds, General Improvement Series 2016C | 5.000 | 04/01/33 | 5,073,444 | ||||||||||||||
| 10,000,000 | Nassau County, New York, General Obligation Bonds, General Improvement Series 2018B - AGM Insured | 5.000 | 07/01/45 | 10,157,844 | ||||||||||||||
| 3,905,000 | Nassau County, New York, General Obligation Bonds, General Improvement Series 2021A - AGM Insured | 4.000 | 04/01/51 | 3,396,163 | ||||||||||||||
| 5,000 | New York City, New York, General Obligation Bonds, Fiscal 2013 Series F‑1 | 5.000 | 03/01/29 | 5,009 | ||||||||||||||
| 7,560,000 | New York City, New York, General Obligation Bonds, Fiscal 2018 Series B‑1 | 5.250 | 10/01/32 | 7,914,852 | ||||||||||||||
| 4,525,000 | New York City, New York, General Obligation Bonds, Fiscal 2018 Series E‑1 | 5.000 | 03/01/40 | 4,599,425 | ||||||||||||||
| 6,830,000 | New York City, New York, General Obligation Bonds, Fiscal 2018 Series F‑1 | 5.000 | 04/01/40 | 6,945,648 | ||||||||||||||
| 94 |
See Notes to Financial Statements |
| PRINCIPAL | DESCRIPTION | RATE | MATURITY | VALUE | ||||||||||||||
| |
|
|||||||||||||||||
| TAX OBLIGATION/GENERAL (continued) | ||||||||||||||||||
| $ | 1,500,000 | New York City, New York, General Obligation Bonds, Fiscal 2020 Series A‑1 | 5.000% | 08/01/43 | $ | 1,518,639 | ||||||||||||
| 5,890,000 | New York City, New York, General Obligation Bonds, Fiscal 2020 Series A‑1 | 4.000 | 08/01/44 | 5,272,779 | ||||||||||||||
| 6,500,000 | New York City, New York, General Obligation Bonds, Fiscal 2021 Series C | 5.000 | 08/01/38 | 6,753,650 | ||||||||||||||
| 5,000,000 | New York City, New York, General Obligation Bonds, Fiscal 2021 Series F‑1 | 5.000 | 03/01/44 | 5,049,874 | ||||||||||||||
| 6,425,000 | New York City, New York, General Obligation Bonds, Fiscal 2024 Series C | 5.250 | 03/01/53 | 6,571,420 | ||||||||||||||
| 4,344,000 | Puerto Rico, General Obligation Bonds, Restructured Series 2022A‑1 | 4.000 | 07/01/41 | 3,782,288 | ||||||||||||||
| 730,000 | Rochester, New York, General Obligation Bonds, Series 1999 - NPFG Insured | 5.250 | 10/01/25 | 731,715 | ||||||||||||||
| 725,000 | Rochester, New York, General Obligation Bonds, Series 1999 - NPFG Insured | 5.250 | 10/01/26 | 748,274 | ||||||||||||||
| |
|
|||||||||||||||||
| TOTAL TAX OBLIGATION/GENERAL | 68,521,024 | |||||||||||||||||
| |
||||||||||||||||||
| TAX OBLIGATION/LIMITED - 49.7% (28.6% of Total Investments) | ||||||||||||||||||
| 25,000,000 | Battery Park City Authority, New York, Revenue Bonds, Senior Sustainability Series 2023A | 5.000 | 11/01/48 | 25,605,305 | ||||||||||||||
| 105,000 | Dormitory Authority of the State of New York, Revenue Bonds, School Districts Financing Program, Series 2009A - AGC Insured | 5.625 | 10/01/29 | 105,259 | ||||||||||||||
| 20,910,000 | Dormitory Authority of the State of New York, State Personal Income Tax Revenue Bonds, General Purpose Series 2024A | 4.000 | 03/15/54 | 17,723,680 | ||||||||||||||
| 13,805,000 | Dormitory Authority of the State of New York, State Personal Income Tax Revenue Bonds, General Purpose, Bidding Group 5 Series 2021E | 4.000 | 03/15/48 | 11,949,799 | ||||||||||||||
| 1,960,000 | Dormitory Authority of the State of New York, State Personal Income Tax Revenue Bonds, General Purpose, Series 2021A | 5.000 | 03/15/49 | 1,968,543 | ||||||||||||||
| 12,560,000 | Dormitory Authority of the State of New York, State Sales Tax Revenue Bonds, Series 2015B. Group A,B&C | 5.000 | 03/15/45 | 12,568,409 | ||||||||||||||
| 1,400,000 | Dormitory Authority of the State of New York, State Sales Tax Revenue Bonds, Series 2017A Group C | 5.000 | 03/15/41 | 1,414,647 | ||||||||||||||
| 17,510,000 | Dormitory Authority of the State of New York, State Sales Tax Revenue Bonds, Series 2018A | 5.000 | 03/15/40 | 17,903,940 | ||||||||||||||
| 10,000,000 | Dormitory Authority of the State of New York, State Sales Tax Revenue Bonds, Series 2018C | 4.000 | 03/15/45 | 8,927,868 | ||||||||||||||
| 5,045,000 | Government of Guam, Business Privilege Tax Bonds, Refunding Series 2015D | 5.000 | 11/15/27 | 5,069,924 | ||||||||||||||
| 6,490,000 | Government of Guam, Business Privilege Tax Bonds, Refunding Series 2015D | 5.000 | 11/15/39 | 6,522,062 | ||||||||||||||
| 1,080,000 | Hudson Yards Infrastructure Corporation, New York, Revenue Bonds, Green Fiscal 2022 Series A | 4.000 | 02/15/36 | 1,096,422 | ||||||||||||||
| 1,115,000 | Hudson Yards Infrastructure Corporation, New York, Revenue Bonds, Second Indenture Fiscal 2017 Series A | 5.000 | 02/15/34 | 1,143,639 | ||||||||||||||
| 3,500,000 | Hudson Yards Infrastructure Corporation, New York, Revenue Bonds, Second Indenture Fiscal 2017 Series A | 5.000 | 02/15/36 | 3,574,053 | ||||||||||||||
| 5,285,000 | Hudson Yards Infrastructure Corporation, New York, Revenue Bonds, Second Indenture Fiscal 2017 Series A | 5.000 | 02/15/39 | 5,363,804 | ||||||||||||||
| 13,275,000 | Hudson Yards Infrastructure Corporation, New York, Revenue Bonds, Second Indenture Fiscal 2017 Series A | 5.000 | 02/15/45 | 13,346,726 | ||||||||||||||
| 8,000,000 | Metropolitan Transportation Authority, New York, Dedicated Tax Fund Bonds, Climate Bond Certified, Green Series 2017B‑1 | 4.000 | 11/15/52 | 6,798,281 | ||||||||||||||
| 1,520,000 | Metropolitan Transportation Authority, New York, Dedicated Tax Fund Bonds, Green Series 2024A | 4.000 | 11/15/51 | 1,305,916 | ||||||||||||||
| 20,000,000 | Metropolitan Transportation Authority, New York, Dedicated Tax Fund Bonds, Green Series 2024B‑1 | 4.000 | 11/15/54 | 16,973,142 | ||||||||||||||
| 10,000,000 | Metropolitan Transportation Authority, New York, Dedicated Tax Fund Bonds, Series 2022A | 4.000 | 11/15/42 | 9,065,495 | ||||||||||||||
| 10,000,000 | Metropolitan Transportation Authority, New York, Dedicated Tax Fund Bonds, Series 2022A | 4.000 | 11/15/52 | 8,564,010 | ||||||||||||||
| 3,675,000 | Monroe County Industrial Development Agency, New York, School Facility Revenue Bonds, Rochester Schools Modernization Project, Series 2013 | 5.000 | 05/01/28 | 3,681,284 | ||||||||||||||
| See Notes to Financial Statements |
95 |
Portfolio of Investments August 31, 2025 (continued)
NRK
| PRINCIPAL | DESCRIPTION | RATE | MATURITY | VALUE | ||||||||||||||
| |
|
|||||||||||||||||
| TAX OBLIGATION/LIMITED (continued) | ||||||||||||||||||
| $ | 5,000,000 | New York City Transitional Finance Authority, New York, Building Aid Revenue Bonds, Fiscal 2018, Series 2017S‑3 | 5.000% | 07/15/43 | $ | 5,060,140 | ||||||||||||
| 7,945,000 | New York City Transitional Finance Authority, New York, Building Aid Revenue Bonds, Fiscal Series 2016S‑1 | 5.000 | 07/15/35 | 8,017,941 | ||||||||||||||
| 7,500,000 | New York City Transitional Finance Authority, New York, Building Aid Revenue Bonds, Fiscal Series 2016S‑1 | 4.000 | 07/15/40 | 7,021,735 | ||||||||||||||
| 5,400,000 | New York City Transitional Finance Authority, New York, Future Tax Secured Bonds, Subordinate Fiscal 2016 Series B‑1 | 5.000 | 11/01/33 | 5,413,675 | ||||||||||||||
| 4,000,000 | New York City Transitional Finance Authority, New York, Future Tax Secured Bonds, Subordinate Fiscal 2017 Series A‑1 | 5.000 | 05/01/40 | 4,018,964 | ||||||||||||||
| 8,100,000 | New York City Transitional Finance Authority, New York, Future Tax Secured Bonds, Subordinate Fiscal 2017 Series B‑1 | 4.000 | 08/01/41 | 7,450,284 | ||||||||||||||
| 1,375,000 | New York City Transitional Finance Authority, New York, Future Tax Secured Bonds, Subordinate Fiscal 2017 Series E‑1 | 5.000 | 02/01/39 | 1,393,832 | ||||||||||||||
| 5,625,000 | New York City Transitional Finance Authority, New York, Future Tax Secured Bonds, Subordinate Fiscal 2017 Series E‑1 | 5.000 | 02/01/43 | 5,662,792 | ||||||||||||||
| 7,500,000 | New York City Transitional Finance Authority, New York, Future Tax Secured Bonds, Subordinate Fiscal 2019 Subseries C‑1 | 4.000 | 11/01/42 | 6,775,629 | ||||||||||||||
| 8,065,000 | New York City Transitional Finance Authority, New York, Future Tax Secured Bonds, Subordinate Fiscal 2022 Subseries B‑1 | 4.000 | 08/01/45 | 7,087,754 | ||||||||||||||
| 14,120,000 | New York City Transitional Finance Authority, New York, Future Tax Secured Bonds, Subordinate Fiscal Series 2023F‑1 | 4.000 | 02/01/51 | 12,223,125 | ||||||||||||||
| 18,000,000 | New York City Transitional Finance Authority, New York, Future Tax Secured Bonds, Subordinate Series 2024C | 5.250 | 05/01/48 | 18,484,047 | ||||||||||||||
| 10,000,000 | New York City, New York, Educational Construction Fund Revenue Bonds, Series 2021B | 5.000 | 04/01/46 | 10,124,516 | ||||||||||||||
| 3,960,000 | New York City, New York, Educational Construction Fund Revenue Bonds, Series 2021B | 5.000 | 04/01/52 | 3,972,618 | ||||||||||||||
| 9,980,000 | New York State Dormitory Authority, Personal Income Tax Revenue Bonds, General Purpose Series 2019A | 4.000 | 03/15/49 | 8,605,689 | ||||||||||||||
| 21,000,000 | New York State Thruway Authority, State Personal Income Tax Revenue Bonds, Bidding Group 1 Series 2022A | 4.125 | 03/15/52 | 18,393,688 | ||||||||||||||
| 10,000,000 | (c) | New York State Thruway Authority, State Personal Income Tax Revenue Bonds, Bidding Group 3 Series Series 2025A, (UB) | 5.000 | 03/15/48 | 10,137,645 | |||||||||||||
| 7,500,000 | New York State Urban Development Corporation, State Personal Income Tax Revenue Bonds, General Purpose, Series 2020C | 5.000 | 03/15/47 | 7,524,922 | ||||||||||||||
| 18,525,000 | Puerto Rico Sales Tax Financing Corporation, Sales Tax Revenue Bonds, Restructured 2018A‑1 | 0.000 | 07/01/46 | 5,854,963 | ||||||||||||||
| 90,206,000 | Puerto Rico Sales Tax Financing Corporation, Sales Tax Revenue Bonds, Restructured 2018A‑1 | 0.000 | 07/01/51 | 21,055,497 | ||||||||||||||
| 47,925,000 | Puerto Rico Sales Tax Financing Corporation, Sales Tax Revenue Bonds, Restructured 2018A‑1 | 5.000 | 07/01/58 | 43,959,599 | ||||||||||||||
| 3,500,000 | Puerto Rico Sales Tax Financing Corporation, Sales Tax Revenue Bonds, Taxable Restructured Cofina Project Series 2019A‑2 | 4.329 | 07/01/40 | 3,246,048 | ||||||||||||||
| 3,000,000 | Puerto Rico Sales Tax Financing Corporation, Sales Tax Revenue Bonds, Taxable Restructured Cofina Project Series 2019A‑2 | 4.329 | 07/01/40 | 2,782,327 | ||||||||||||||
| 259,000 | Puerto Rico Sales Tax Financing Corporation, Sales Tax Revenue Bonds, Taxable Restructured Cofina Project Series 2019A‑2 | 4.536 | 07/01/53 | 223,389 | ||||||||||||||
| 5,140,000 | Triborough Bridge and Tunnel Authority, New York, Payroll Mobility Tax Bonds, Senior Lien Green Bonds, Series 2022D‑2 | 4.500 | 05/15/47 | 4,960,953 | ||||||||||||||
| 8,425,000 | Triborough Bridge and Tunnel Authority, New York, Payroll Mobility Tax Bonds, Senior Lien Series 2021B‑1 | 4.000 | 05/15/56 | 7,049,150 | ||||||||||||||
| 9,600,000 | Triborough Bridge and Tunnel Authority, New York, Payroll Mobility Tax Bonds, Senior Lien Subseries 2021A‑1 | 5.000 | 05/15/51 | 9,641,959 | ||||||||||||||
| 1,325,000 | Triborough Bridge and Tunnel Authority, New York, Payroll Mobility Tax Senior Lien Bonds, Series 2022C | 4.125 | 05/15/52 | 1,165,616 | ||||||||||||||
| 10,000,000 | Triborough Bridge and Tunnel Authority, New York, Payroll Mobility Tax Senior Lien Bonds, Series 2022C | 5.250 | 05/15/52 | 10,250,310 | ||||||||||||||
| 10,000,000 | Triborough Bridge and Tunnel Authority, New York, Sales Tax Revenue Bonds, MTA Bridges & Tunnels, TBTA Capital Lockbox- City Sales Tax, Series 2024A‑1 | 4.000 | 05/15/54 | 8,451,296 | ||||||||||||||
| |
|
|||||||||||||||||
| TOTAL TAX OBLIGATION/LIMITED | 446,682,311 | |||||||||||||||||
| |
||||||||||||||||||
| 96 |
See Notes to Financial Statements |
| PRINCIPAL | DESCRIPTION | RATE | MATURITY | VALUE | ||||||||||||||
| |
|
|||||||||||||||||
| TRANSPORTATION - 19.9% (11.5% of Total Investments) | ||||||||||||||||||
| $ | 1,500,000 | Metropolitan Transportation Authority, New York, Transportation Revenue Bonds, Green Climate Bond Certified Series 2017A‑1 | 5.250% | 11/15/57 | $ | 1,502,296 | ||||||||||||
| 7,775,000 | Metropolitan Transportation Authority, New York, Transportation Revenue Bonds, Green Climate Bond Certified Series 2020C‑1 | 5.000 | 11/15/50 | 7,618,337 | ||||||||||||||
| 19,315,000 | Metropolitan Transportation Authority, New York, Transportation Revenue Bonds, Green Climate Bond Certified Series 2020C‑1 | 5.250 | 11/15/55 | 19,255,510 | ||||||||||||||
| 10,135,000 | Metropolitan Transportation Authority, New York, Transportation Revenue Bonds, Green Refunding Series 2024A | 5.500 | 11/15/47 | 10,460,857 | ||||||||||||||
| 2,500,000 | Metropolitan Transportation Authority, New York, Transportation Revenue Bonds, Refunding Green Series 2016B | 5.000 | 11/15/37 | 2,526,354 | ||||||||||||||
| 5,000,000 | Metropolitan Transportation Authority, New York, Transportation Revenue Bonds, Refunding Series 2015D‑1 | 5.000 | 11/15/35 | 5,005,022 | ||||||||||||||
| 1,500,000 | Metropolitan Transportation Authority, New York, Transportation Revenue Bonds, Refunding Series 2015F | 5.000 | 11/15/35 | 1,501,507 | ||||||||||||||
| 2,500,000 | Metropolitan Transportation Authority, New York, Transportation Revenue Bonds, Refunding Series 2017D | 5.000 | 11/15/32 | 2,623,057 | ||||||||||||||
| 2,440,000 | Metropolitan Transportation Authority, New York, Transportation Revenue Bonds, Series 2016C‑1 | 5.000 | 11/15/39 | 2,457,402 | ||||||||||||||
| 2,500,000 | New York Liberty Development Corporation, New York, Liberty Revenue Bonds, Secured by Port Authority Consolidated Bonds, Refunding Series 1WTC-2021 - BAM Insured | 4.000 | 02/15/43 | 2,288,925 | ||||||||||||||
| 20,780,000 | New York State Thruway Authority, General Revenue Bonds, Maturity Group 1 Series 2021O | 4.000 | 01/01/46 | 18,217,049 | ||||||||||||||
| 2,280,000 | New York State Thruway Authority, General Revenue Bonds, Series 2020N | 4.000 | 01/01/43 | 2,053,455 | ||||||||||||||
| 5,720,000 | New York State Thruway Authority, General Revenue Bonds, Series 2020N | 4.000 | 01/01/45 | 5,028,474 | ||||||||||||||
| 8,940,000 | New York State Thruway Authority, General Revenue Junior Indebtedness Obligations, Series 2016A | 5.000 | 01/01/41 | 8,953,768 | ||||||||||||||
| 485,000 | New York State Thruway Authority, General Revenue Junior Indebtedness Obligations, Series 2016A | 5.000 | 01/01/51 | 482,375 | ||||||||||||||
| 8,200,000 | New York State Thruway Authority, General Revenue Junior Indebtedness Obligations, Series 2016A | 5.250 | 01/01/56 | 8,213,317 | ||||||||||||||
| 9,355,000 | New York State Thruway Authority, General Revenue Junior Indebtedness Obligations, Series 2019B | 4.000 | 01/01/50 | 7,998,317 | ||||||||||||||
| 1,175,000 | New York Transportation Development Corporation, New York, Special Facility Revenue Bonds, Terminal 4 John F Kennedy International Airport Project, Series 2020C | 5.000 | 12/01/32 | 1,266,221 | ||||||||||||||
| 3,750,000 | New York Transportation Development Corporation, New York, Special Facility Revenue Bonds, Terminal 4 John F Kennedy International Airport Project, Series 2020C | 5.000 | 12/01/34 | 3,988,301 | ||||||||||||||
| 3,465,000 | New York Transportation Development Corporation, New York, Special Facility Revenue Bonds, Terminal 4 John F Kennedy International Airport Project, Series 2020C | 4.000 | 12/01/39 | 3,237,591 | ||||||||||||||
| 1,800,000 | New York Transportation Development Corporation, New York, Special Facility Revenue Bonds, Terminal 4 John F Kennedy International Airport Project, Series 2020C | 4.000 | 12/01/40 | 1,660,454 | ||||||||||||||
| 1,515,000 | Port Authority of New York and New Jersey, Consolidated Revenue Bonds, Two Hundred Eleventh Series 2018 | 4.000 | 09/01/43 | 1,370,613 | ||||||||||||||
| 1,000,000 | Port Authority of New York and New Jersey, Consolidated Revenue Bonds, Two Hundred Eleventh Series 2018 | 5.000 | 09/01/48 | 1,004,545 | ||||||||||||||
| 1,000,000 | Port Authority of New York and New Jersey, Consolidated Revenue Bonds, Two Hundred Fifth Series 2017 | 5.000 | 11/15/47 | 1,004,815 | ||||||||||||||
| 7,495,000 | Port Authority of New York and New Jersey, Consolidated Revenue Bonds, Two Hundred Forty-Fourth Series 2024 | 5.000 | 07/15/54 | 7,596,769 | ||||||||||||||
| 6,000,000 | Port Authority of New York and New Jersey, Consolidated Revenue Bonds, Two Hundred Thirteenth Series 2019 | 5.000 | 09/01/37 | 6,257,740 | ||||||||||||||
| 11,500,000 | Triborough Bridge and Tunnel Authority, New York, General Purpose Revenue Bonds, MTA Bridges & Tunnels, Refunding Series 2017B | 5.000 | 11/15/38 | 11,731,897 | ||||||||||||||
| 7,715,000 | Triborough Bridge and Tunnel Authority, New York, General Purpose Revenue Bonds, MTA Bridges & Tunnels, Series 2018A | 5.000 | 11/15/43 | 7,778,811 | ||||||||||||||
| 9,000,000 | Triborough Bridge and Tunnel Authority, New York, General Purpose Revenue Bonds, MTA Bridges & Tunnels, Series 2019A | 5.000 | 11/15/49 | 9,003,863 | ||||||||||||||
| See Notes to Financial Statements |
97 |
Portfolio of Investments August 31, 2025 (continued)
NRK
| PRINCIPAL | DESCRIPTION | RATE | MATURITY | VALUE | ||||||||||||||
| |
|
|||||||||||||||||
| TRANSPORTATION (continued) | ||||||||||||||||||
| $ | 16,000,000 | Triborough Bridge and Tunnel Authority, New York, General Revenue Bonds, MTA Bridges & Tunnels, Series 2021A | 4.000% | 11/15/56 | $ | 13,398,053 | ||||||||||||
| 3,610,000 | Triborough Bridge and Tunnel Authority, New York, General Revenue Bonds, MTA Bridges & Tunnels, Series 2021A | 5.000 | 11/15/56 | 3,564,792 | ||||||||||||||
| |
|
|||||||||||||||||
| TOTAL TRANSPORTATION | 179,050,487 | |||||||||||||||||
| |
||||||||||||||||||
| U.S. GUARANTEED - 2.4% (d)(1.4% of Total Investments) | ||||||||||||||||||
| 1,625,000 | Dormitory Authority of the State of New York, Lease Revenue Bonds, State University Dormitory Facilities, Series 2017A, (Pre‑ refunded 7/01/27) | 5.000 | 07/01/46 | 1,704,692 | ||||||||||||||
| 5,000 | Dormitory Authority of the State of New York, State Personal Income Tax Revenue Bonds, General Purpose, Series 2019A, (Pre‑refunded 3/15/29) | 4.000 | 03/15/49 | 5,290 | ||||||||||||||
| 15,000 | Dormitory Authority of the State of New York, State Personal Income Tax Revenue Bonds, General Purpose, Series 2019A, (Pre‑refunded 3/15/29) | 4.000 | 03/15/49 | 15,871 | ||||||||||||||
| 7,190,000 | Long Island Power Authority, New York, Electric System General Revenue Bonds, Series 2000A, (ETM) | 0.000 | 06/01/26 | 7,052,703 | ||||||||||||||
| 12,810,000 | Long Island Power Authority, New York, Electric System General Revenue Bonds, Series 2000A, (ETM) |
0.000 | 06/01/26 | 12,565,385 | ||||||||||||||
| |
|
|||||||||||||||||
| TOTAL U.S. GUARANTEED | 21,343,941 | |||||||||||||||||
| |
||||||||||||||||||
| UTILITIES - 23.3% (13.4% of Total Investments) | ||||||||||||||||||
| 4,825,000 | Long Island Power Authority, New York, Electric System General Revenue Bonds, Green Series 2023E | 5.000 | 09/01/53 | 4,834,870 | ||||||||||||||
| 10,000,000 | Long Island Power Authority, New York, Electric System General Revenue Bonds, Series 2000A - AGM Insured | 0.000 | 06/01/27 | 9,507,311 | ||||||||||||||
| 15,000,000 | Long Island Power Authority, New York, Electric System General Revenue Bonds, Series 2000A - AGM Insured | 0.000 | 06/01/28 | 13,818,843 | ||||||||||||||
| 10,000,000 | Long Island Power Authority, New York, Electric System General Revenue Bonds, Series 2000A - AGM Insured | 0.000 | 06/01/29 | 8,908,589 | ||||||||||||||
| 520,000 | Long Island Power Authority, New York, Electric System General Revenue Bonds, Series 2016B | 5.000 | 09/01/46 | 520,004 | ||||||||||||||
| 1,000,000 | Long Island Power Authority, New York, Electric System General Revenue Bonds, Series 2017 | 5.000 | 09/01/47 | 1,001,917 | ||||||||||||||
| 5,000,000 | Long Island Power Authority, New York, Electric System General Revenue Bonds, Series 2018 | 5.000 | 09/01/38 | 5,150,080 | ||||||||||||||
| 5,000,000 | New York City Municipal Water Finance Authority, New York, Water and Sewer System Second General Resolution Revenue Bonds, Fiscal 2017 Series DD | 5.000 | 06/15/47 | 5,021,020 | ||||||||||||||
| 2,990,000 | New York City Municipal Water Finance Authority, New York, Water and Sewer System Second General Resolution Revenue Bonds, Fiscal 2017 Series DD | 5.250 | 06/15/47 | 3,013,645 | ||||||||||||||
| 5,035,000 | New York City Municipal Water Finance Authority, New York, Water and Sewer System Second General Resolution Revenue Bonds, Fiscal 2018 Series CC‑1 | 5.000 | 06/15/48 | 5,048,294 | ||||||||||||||
| 4,000,000 | New York City Municipal Water Finance Authority, New York, Water and Sewer System Second General Resolution Revenue Bonds, Fiscal 2018 Series EE | 5.000 | 06/15/39 | 4,012,102 | ||||||||||||||
| 21,815,000 | New York City Municipal Water Finance Authority, New York, Water and Sewer System Second General Resolution Revenue Bonds, Fiscal 2018 Series EE | 5.000 | 06/15/40 | 22,225,888 | ||||||||||||||
| 1,225,000 | New York City Municipal Water Finance Authority, New York, Water and Sewer System Second General Resolution Revenue Bonds, Fiscal 2020 Series DD‑3 | 4.000 | 06/15/42 | 1,122,996 | ||||||||||||||
| 2,000,000 | New York City Municipal Water Finance Authority, New York, Water and Sewer System Second General Resolution Revenue Bonds, Fiscal 2020 Series EE | 4.000 | 06/15/42 | 1,833,463 | ||||||||||||||
| 3,085,000 | New York City Municipal Water Finance Authority, New York, Water and Sewer System Second General Resolution Revenue Bonds, Fiscal 2020 Series GG‑1 | 5.000 | 06/15/50 | 3,094,094 | ||||||||||||||
| 2,500,000 | New York City Municipal Water Finance Authority, New York, Water and Sewer System Second General Resolution Revenue Bonds, Fiscal 2021 Series AA‑2 | 4.000 | 06/15/42 | 2,291,829 | ||||||||||||||
| 98 |
See Notes to Financial Statements |
| PRINCIPAL | DESCRIPTION | RATE | MATURITY | VALUE | ||||||||||||||
| |
|
|||||||||||||||||
| UTILITIES (continued) | ||||||||||||||||||
| $ | 2,925,000 | New York City Municipal Water Finance Authority, New York, Water and Sewer System Second General Resolution Revenue Bonds, Fiscal 2021 Series CC‑1 | 5.000% | 06/15/51 | $ | 2,925,987 | ||||||||||||
| 5,000,000 | New York City Municipal Water Finance Authority, New York, Water and Sewer System Second General Resolution Revenue Bonds, Fiscal 2022 Series AA‑1 | 4.000 | 06/15/51 | 4,306,431 | ||||||||||||||
| 6,855,000 | (c) | New York City Municipal Water Finance Authority, New York, Water and Sewer System Second General Resolution Revenue Bonds, Fiscal 2023 Series AA‑1, (UB) | 5.250 | 06/15/52 | 7,001,045 | |||||||||||||
| 32,000,000 | New York City Municipal Water Finance Authority, New York, Water and Sewer System Second General Resolution Revenue Bonds, Fiscal 2024 Series BB‑2 | 4.000 | 06/15/45 | 28,670,243 | ||||||||||||||
| 7,775,000 | New York Energy Finance Development Corporation, Energy Supply Revenue Bonds, Series 2025, (Mandatory Put 12/01/33) | 5.000 | 07/01/56 | 8,173,332 | ||||||||||||||
| 14,430,000 | New York State Environmental Facilities Corporation, State Clean Water and Drinking Water Revolving Funds Revenue Bonds, New York City Municipal Water Finance Authority Projects-Second Resolution Bonds, Subordinated SRF Series 2017A | 5.000 | 06/15/46 | 14,515,991 | ||||||||||||||
| 5,000,000 | New York State Environmental Facilities Corporation, State Revolving Funds Revenue Bonds, 2010 Master Financing Program, Green Series 2019A | 5.000 | 02/15/49 | 5,068,398 | ||||||||||||||
| 3,000,000 | New York State Environmental Facilities Corporation, State Revolving Funds Revenue Bonds, Green Series 2022B | 5.250 | 09/15/52 | 3,078,250 | ||||||||||||||
| 11,440,000 | New York State Power Authority, General Revenue Bonds, Series 2020A | 4.000 | 11/15/50 | 9,872,538 | ||||||||||||||
| 9,000,000 | New York State Power Authority, General Revenue Bonds, Series 2020A | 4.000 | 11/15/55 | 7,603,988 | ||||||||||||||
| 2,955,000 | New York State Power Authority, General Revenue Bonds, Series 2020A | 4.000 | 11/15/60 | 2,453,565 | ||||||||||||||
| 9,085,000 | New York State Power Authority, Green Transmission Project Revenue Bonds, Green Series 2023A - AGM Insured | 5.000 | 11/15/53 | 9,156,751 | ||||||||||||||
| 3,190,000 | (a) | Puerto Rico Aqueduct and Sewerage Authority, Revenue Bonds, Refunding Senior Lien Series 2020A | 5.000 | 07/01/47 | 2,984,193 | |||||||||||||
| 3,205,000 | (a) | Puerto Rico Aqueduct and Sewerage Authority, Revenue Bonds, Refunding Senior Lien Series 2021B | 5.000 | 07/01/37 | 3,290,424 | |||||||||||||
| 810,000 | Utility Debt Securitization Authority, New York, Restructuring Bonds, Refunding Series 2015 | 5.000 | 12/15/33 | 814,407 | ||||||||||||||
| 5,000,000 | Utility Debt Securitization Authority, New York, Restructuring Bonds, Refunding Series 2015 | 5.000 | 12/15/36 | 5,020,727 | ||||||||||||||
| 2,450,000 | Utility Debt Securitization Authority, New York, Restructuring Bonds, Series 2016B | 5.000 | 12/15/34 | 2,489,804 | ||||||||||||||
| 1,000,000 | Utility Debt Securitization Authority, New York, Restructuring Bonds, Series 2017 | 5.000 | 12/15/38 | 1,025,641 | ||||||||||||||
| |
|
|||||||||||||||||
| TOTAL UTILITIES | 209,856,660 | |||||||||||||||||
| |
||||||||||||||||||
| TOTAL MUNICIPAL BONDS (Cost $1,596,814,038) |
1,531,224,035 | |||||||||||||||||
| |
||||||||||||||||||
| TOTAL LONG-TERM INVESTMENTS (Cost $1,596,814,038) | 1,531,224,035 | |||||||||||||||||
| |
||||||||||||||||||
| PRINCIPAL | DESCRIPTION | RATE | MATURITY | VALUE | ||||||||||||||
| |
|
|||||||||||||||||
| SHORT-TERM INVESTMENTS - 3.1% (1.8% of Total Investments) | ||||||||||||||||||
| MUNICIPAL BONDS - 3.1% (1.8% of Total Investments) | ||||||||||||||||||
| HEALTH CARE - 1.5% (0.9% of Total Investments) | ||||||||||||||||||
| $ | 14,000,000 | (e) | New York City Health and Hospitals Corporation, New York, Health System Revenue Bonds, Variable Rate Demand Obligation Series 2008 |
2.780 | 02/15/31 | $ | 14,000,000 | |||||||||||
| |
|
|||||||||||||||||
| TOTAL HEALTH CARE | 14,000,000 | |||||||||||||||||
| |
||||||||||||||||||
| TAX OBLIGATION/GENERAL - 0.7% (0.4% of Total Investments) | ||||||||||||||||||
| 6,000,000 | (e) | New York City, New York, General Obligation Bonds, Fiscal 2017 Taxable Series A‑4 | 3.880 | 08/01/44 | 6,000,000 | |||||||||||||
| |
|
|||||||||||||||||
| TOTAL TAX OBLIGATION/GENERAL | 6,000,000 | |||||||||||||||||
| |
||||||||||||||||||
| See Notes to Financial Statements |
99 |
Portfolio of Investments August 31, 2025 (continued)
NRK
| PRINCIPAL | DESCRIPTION | RATE | MATURITY | VALUE | ||||||||||||||
| |
|
|||||||||||||||||
| UTILITIES - 0.9% (0.5% of Total Investments) | ||||||||||||||||||
| $ | 8,000,000 | (e) | New York City Municipal Water Finance Authority, New York, Water and Sewer System Second General Resolution Revenue Bonds, Fiscal 2019 Adjustable Rate Series BB-2 |
2.750% | 06/15/51 | $ | 8,000,000 | |||||||||||
| |
|
|||||||||||||||||
| TOTAL UTILITIES | 8,000,000 | |||||||||||||||||
| |
||||||||||||||||||
| TOTAL MUNICIPAL BONDS (Cost $28,000,000) |
28,000,000 | |||||||||||||||||
| |
||||||||||||||||||
| TOTAL SHORT-TERM INVESTMENTS (Cost $28,000,000) |
28,000,000 | |||||||||||||||||
| |
||||||||||||||||||
| TOTAL INVESTMENTS - 173.5% (Cost $1,624,814,038) |
1,559,224,035 | |||||||||||||||||
| |
||||||||||||||||||
| FLOATING RATE OBLIGATIONS - (1.5)% | (13,480,000) | |||||||||||||||||
| |
||||||||||||||||||
| MFP SHARES, NET - (8.9)% (f) | (79,634,566) | |||||||||||||||||
| |
||||||||||||||||||
| VRDP SHARES, NET - (64.8)% (g) | (582,368,702) | |||||||||||||||||
| |
||||||||||||||||||
| OTHER ASSETS & LIABILITIES, NET - 1.7% | 15,026,495 | |||||||||||||||||
| |
||||||||||||||||||
| NET ASSETS APPLICABLE TO COMMON SHARES - 100% | $ | 898,767,262 | ||||||||||||||||
| |
||||||||||||||||||
All percentages shown in the Portfolio of Investments are based on net assets applicable to common shares unless otherwise noted.
| ETM | Escrowed to maturity | |
| UB | Underlying bond of an inverse floating rate trust reflected as a financing transaction. Inverse floating rate trust is a Recourse Trust unless otherwise noted. | |
| (a) | Security is exempt from registration under Rule 144A of the Securities Act of 1933, as amended. These securities are deemed liquid and may be resold in transactions exempt from registration, which are normally those transactions with qualified institutional buyers. As of the end of the reporting period, the aggregate value of these securities is $84,847,528 or 5.4% of Total Investments. | |
| (b) | Defaulted security. A security whose issuer has failed to fully pay principal and/or interest when due, or is under the protection of bankruptcy. | |
| (c) | Investment, or portion of investment, has been pledged to collateralize the net payment obligations for investments in inverse floating rate transactions. | |
| (d) | Backed by an escrow or trust containing sufficient U.S. Government or U.S. Government agency securities, which ensure the timely payment of principal and interest. | |
| (e) | Investment has a maturity of greater than one year, but has variable rate and/or demand features which qualify it as a short-term investment. The rate disclosed, as well as the reference rate and spread, where applicable, is that in effect as of the end of the reporting period. This rate changes periodically based on market conditions or a specified market index. | |
| (f) | MFP Shares, Net as a percentage of Total Investments is 5.1%. | |
| (g) | VRDP Shares, Net as a percentage of Total Investments is 37.3%. | |
| 100 |
See Notes to Financial Statements |
Portfolio of Investments August 31, 2025
NNY
| PRINCIPAL | DESCRIPTION | RATE | MATURITY | VALUE | ||||||||||||||
| |
|
|||||||||||||||||
| LONG-TERM INVESTMENTS - 97.8% | ||||||||||||||||||
| MUNICIPAL BONDS - 97.8% | ||||||||||||||||||
| CONSUMER STAPLES - 2.9% | ||||||||||||||||||
| $ | 1,100,000 | Erie County Tobacco Asset Securitization Corporation, New York, Tobacco Settlement Asset-Backed Bonds, Series 2005A | 5.000% | 06/01/38 | $ | 991,943 | ||||||||||||
| 370,000 | New York Counties Tobacco Trust VI, New York, Tobacco Settlement Pass-Through Bonds, Series 2016A‑1 | 5.625 | 06/01/35 | 375,819 | ||||||||||||||
| 3,440,000 | New York Counties Tobacco Trust VI, New York, Tobacco Settlement Pass-Through Bonds, Series 2016A-1 |
5.750 | 06/01/43 | 3,249,702 | ||||||||||||||
| |
|
|||||||||||||||||
| TOTAL CONSUMER STAPLES | 4,617,464 | |||||||||||||||||
| |
||||||||||||||||||
| EDUCATION AND CIVIC ORGANIZATIONS - 13.2% | ||||||||||||||||||
| 660,000 | Buffalo and Erie County Industrial Land Development Corporation, New York, Revenue Bonds, Enterprise Charter School Project, Series 2011A | 7.500 | 12/01/40 | 644,233 | ||||||||||||||
| 1,250,000 | Build New York City Resource Corporation, New York, Revenue Bonds, City University of New York - Queens College, Q Student Residences, LLC Project, Refunding Series 2014A | 5.000 | 06/01/43 | 1,250,789 | ||||||||||||||
| 100,000 | Build New York City Resource Corporation, New York, Revenue Bonds, Classical Charter Schools Series 2023A | 4.500 | 06/15/43 | 90,873 | ||||||||||||||
| 140,000 | Build New York City Resource Corporation, New York, Revenue Bonds, Classical Charter Schools Series 2023A | 4.750 | 06/15/58 | 122,593 | ||||||||||||||
| 1,015,000 | Build New York City Resource Corporation, New York, Revenue Bonds, KIPP New York City Public School Facilities, Canal West Project, Series 2022 | 5.250 | 07/01/62 | 952,299 | ||||||||||||||
| 250,000 | (a) | Build NYC Resource Corporation Revenue Bonds, New York, East Harlem Scholars Academy Charter School Project, Series 2022 (Social Bonds) | 5.750 | 06/01/62 | 232,058 | |||||||||||||
| 220,000 | (a) | Build NYC Resource Corporation, New York, Revenue Bonds, Family Life Academy Charter School, Series 2020C‑1 | 5.000 | 06/01/40 | 198,484 | |||||||||||||
| 385,000 | (a) | Build NYC Resource Corporation, New York, Revenue Bonds, Richmond Preparatory Charter School Project, Social Impact Project Series 2021A | 5.000 | 06/01/56 | 290,549 | |||||||||||||
| 475,000 | (a) | Dormitory Authority of the State of New York, General Revenue Bonds, American Musical and Dramatic Academy Inc., Series 2023A | 7.250 | 07/01/53 | 475,020 | |||||||||||||
| 1,080,000 | Dormitory Authority of the State of New York, General Revenue Bonds, Yeshiva University, Series 2022A | 5.000 | 07/15/50 | 1,029,281 | ||||||||||||||
| 1,000,000 | Dormitory Authority of the State of New York, Housing Revenue Bonds, Fashion Institute of Technology, Series 2007 - FGIC Insured | 5.250 | 07/01/34 | 1,022,843 | ||||||||||||||
| 1,330,000 | Dormitory Authority of the State of New York, Revenue Bonds, Icahn School of Medicine at Mount Sinai, Refunding Series 2015A | 5.000 | 07/01/40 | 1,329,896 | ||||||||||||||
| 2,180,000 | Dormitory Authority of the State of New York, Revenue Bonds, Icahn School of Medicine at Mount Sinai, Refunding Series 2015A | 5.000 | 07/01/45 | 2,056,895 | ||||||||||||||
| 1,000,000 | Dormitory Authority of the State of New York, Revenue Bonds, New School University, Series 2016A | 5.000 | 07/01/41 | 1,003,648 | ||||||||||||||
| 385,000 | Dormitory Authority of the State of New York, Revenue Bonds, New School University, Series 2022A | 4.000 | 07/01/47 | 316,127 | ||||||||||||||
| 2,760,000 | Dormitory Authority of the State of New York, Revenue Bonds, New York University, Series 2016A | 5.000 | 07/01/35 | 2,800,524 | ||||||||||||||
| 175,000 | Dormitory Authority of the State of New York, Revenue Bonds, New York University, Series 2018A | 5.000 | 07/01/48 | 176,223 | ||||||||||||||
| 2,625,000 | Dormitory Authority of the State of New York, Revenue Bonds, Rockefeller University, Green Series 2019B | 5.000 | 07/01/50 | 2,625,787 | ||||||||||||||
| 670,000 | Dormitory Authority of the State of New York, Revenue Bonds, Rockefeller University, Series 2022A | 4.000 | 07/01/42 | 619,283 | ||||||||||||||
| 845,000 | (a) | Dormitory Authority of the State of New York, Revenue Bonds, Vaughn College of Aeronautics & Technology, Series 2016A | 5.500 | 12/01/36 | 751,985 | |||||||||||||
| 725,000 | Glen Cove Local Economic Assistance Corporation, New York, Revenue Bonds, Garvies Point Public Improvement Project, Capital Appreciation Series 2016C | 5.625 | 01/01/55 | 617,837 | ||||||||||||||
| See Notes to Financial Statements |
101 |
Portfolio of Investments August 31, 2025 (continued)
NNY
| PRINCIPAL | DESCRIPTION | RATE | MATURITY | VALUE | ||||||||||||||
| |
|
|||||||||||||||||
| EDUCATION AND CIVIC ORGANIZATIONS (continued) | ||||||||||||||||||
| $ | 100,000 | Hempstead Town Local Development Corporation, New York, Revenue Bonds, Adelphi University Project, Series 2013 | 5.000% | 09/01/38 | $ | 100,023 | ||||||||||||
| 300,000 | Hempstead Town Local Development Corporation, New York, Revenue Bonds, Adelphi University Project, Series 2013 | 5.000 | 09/01/43 | 295,161 | ||||||||||||||
| 405,000 | New York City Industrial Development Agency, New York, PILOT Payment in Lieu of Taxes Revenue Bonds, Queens Baseball Stadium Project, Refunding Series 2021A - AGM Insured | 3.000 | 01/01/37 | 356,578 | ||||||||||||||
| 500,000 | New York City Industrial Development Agency, New York, PILOT Payment in Lieu of Taxes Revenue Bonds, Yankee Stadium Project, Refunding Series 2020A - AGM Insured | 4.000 | 03/01/45 | 447,592 | ||||||||||||||
| 3,000,000 | New York City Industrial Development Agency, New York, PILOT Payment in Lieu of Taxes Revenue Bonds, Yankee Stadium Project, Series 2009A - AGC Insured | 0.000 | 03/01/40 | 1,474,863 | ||||||||||||||
| |
|
|||||||||||||||||
| TOTAL EDUCATION AND CIVIC ORGANIZATIONS | 21,281,444 | |||||||||||||||||
| |
||||||||||||||||||
| FINANCIALS - 0.7% | ||||||||||||||||||
| 1,000,000 | Liberty Development Corporation, New York, Goldman Sachs Headquarters Revenue Bonds Series 2007 | 5.500 | 10/01/37 | 1,138,916 | ||||||||||||||
| |
|
|||||||||||||||||
| TOTAL FINANCIALS | 1,138,916 | |||||||||||||||||
| |
||||||||||||||||||
| HEALTH CARE - 14.7% | | |||||||||||||||||
| 1,430,000 | Dormitory Authority of the State of New York, General Revenue Bonds, Northwell Health Obligated Group, Series 2022A | 4.000 | 05/01/45 | 1,234,942 | ||||||||||||||
| 2,700,000 | Dormitory Authority of the State of New York, General Revenue Bonds, Northwell Health Obligated Group, Series 2022A | 4.250 | 05/01/52 | 2,308,719 | ||||||||||||||
| 1,000,000 | Dormitory Authority of the State of New York, General Revenue Bonds, Northwell Health Obligated Group, Series 2022A | 5.000 | 05/01/52 | 977,268 | ||||||||||||||
| 2,270,000 | Dormitory Authority of the State of New York, General Revenue Bonds, Northwell Health Obligated Group, Series 2024A | 5.250 | 05/01/54 | 2,281,459 | ||||||||||||||
| 2,000,000 | Dormitory Authority of the State of New York, Revenue Bonds, Memorial Sloan Kettering Cancer Center, Series 2022‑1A | 4.000 | 07/01/51 | 1,710,481 | ||||||||||||||
| 2,100,000 | Dormitory Authority of the State of New York, Revenue Bonds, Montefiore Obligated Group, Series 2018A | 5.000 | 08/01/34 | 2,134,207 | ||||||||||||||
| 935,000 | Dormitory Authority of the State of New York, Revenue Bonds, Mount Sinai Health Obligated Group, Series 2025 | 5.250 | 07/01/50 | 905,564 | ||||||||||||||
| 2,000,000 | Dormitory Authority of the State of New York, Revenue Bonds, NYU Langone Hospitals Obligated Group, Series 2020A | 4.000 | 07/01/50 | 1,692,220 | ||||||||||||||
| 1,040,000 | Dormitory Authority of the State of New York, Revenue Bonds, NYU Langone Hospitals Obligated Group, Series 2020A | 4.000 | 07/01/53 | 851,268 | ||||||||||||||
| 800,000 | (a) | Dormitory Authority of the State of New York, Revenue Bonds, Orange Regional Medical Center Obligated Group, Series 2017 | 5.000 | 12/01/32 | 801,898 | |||||||||||||
| 1,160,000 | (a) | Dormitory Authority of the State of New York, Revenue Bonds, Orange Regional Medical Center Obligated Group, Series 2017 | 5.000 | 12/01/36 | 1,119,209 | |||||||||||||
| 475,000 | Dormitory Authority of the State of New York, Revenue Bonds, Roswell Park Cancer Institute Obligated Group, Series 2025A | 5.500 | 07/01/55 | 491,060 | ||||||||||||||
| 60,000 | Dormitory Authority of the State of New York, Revenue Bonds, White Plains Hospital, Series 2024 | 5.250 | 10/01/49 | 58,242 | ||||||||||||||
| 550,000 | Dormitory Authority of the State of New York, Revenue Bonds, White Plains Hospital, Series 2024 | 5.500 | 10/01/54 | 561,818 | ||||||||||||||
| 3,460,000 | Dutchess County Local Development Corporation, New York, Revenue Bonds, Health Quest Systems, Inc. Project, Series 2016B | 4.000 | 07/01/41 | 3,132,444 | ||||||||||||||
| 200,000 | Livingston County Industrial Development Agency, New York, Civic Facility Revenue Bonds, Nicholas H. Noyes Hospital, Series 2005 | 6.000 | 07/01/30 | 200,358 | ||||||||||||||
| 660,000 | Monroe County Industrial Development Corporation, New York, Revenue Bonds, Rochester General Hospital Project, Series 2017 | 5.000 | 12/01/46 | 638,497 | ||||||||||||||
| 2,875,000 | Westchester County Local Development Corporation, New York, Revenue Bonds, Westchester Medical Center Obligated Group Project, Series 2016 | 5.000 | 11/01/46 | 2,546,640 | ||||||||||||||
| 65,000 | Westchester County Local Development Corporation, New York, Revenue Bonds, Westchester Medical Center Obligated Group Project, Series 2023 | 6.250 | 11/01/52 | 67,785 | ||||||||||||||
| |
|
|||||||||||||||||
| TOTAL HEALTH CARE | 23,714,079 | |||||||||||||||||
| |
||||||||||||||||||
| 102 |
See Notes to Financial Statements |
| PRINCIPAL | DESCRIPTION | RATE | MATURITY | VALUE | ||||||||||||||
| |
|
|||||||||||||||||
| HOUSING/MULTIFAMILY - 0.1% | ||||||||||||||||||
| $ | 100,000 | New York City Housing Development Corporation, New York, Multi-Family Mortgage Revenue Bonds, 8 Spruce Street, Class F Series 2024 | 5.250% | 12/15/31 | $ | 102,655 | ||||||||||||
| |
|
|||||||||||||||||
| TOTAL HOUSING/MULTIFAMILY | 102,655 | |||||||||||||||||
| |
||||||||||||||||||
| INDUSTRIALS - 4.1% | ||||||||||||||||||
| 3,930,000 | (a) | New York Liberty Development Corporation, New York, Liberty Revenue Bonds, 3 World Trade Center Project, Class 1 Series 2014 | 5.000 | 11/15/44 | 3,819,215 | |||||||||||||
| 10,000 | New York Liberty Development Corporation, New York, Liberty Revenue Bonds, 7 World Trade Center Project, Refunding Green Series 2022A‑CL2 | 3.500 | 09/15/52 | 7,315 | ||||||||||||||
| 1,255,000 | New York Transportation Development Corporation, New York, Facility Revenue Bonds, Thruway Service Areas Project, Series 2021, (AMT) | 4.000 | 10/31/41 | 1,102,438 | ||||||||||||||
| 290,000 | New York Transportation Development Corporation, New York, Facility Revenue Bonds, Thruway Service Areas Project, Series 2021, (AMT) | 4.000 | 10/31/46 | 242,504 | ||||||||||||||
| 1,830,000 | New York Transportation Development Corporation, New York, Facility Revenue Bonds, Thruway Service Areas Project, Series 2021, (AMT) | 4.000 | 04/30/53 | 1,444,559 | ||||||||||||||
| |
|
|||||||||||||||||
| TOTAL INDUSTRIALS | 6,616,031 | |||||||||||||||||
| |
||||||||||||||||||
| LONG-TERM CARE - 0.2% | ||||||||||||||||||
| 220,000 | Dormitory Authority of the State of New York, Non‑State Supported Debt, Ozanam Hall of Queens Nursing Home Revenue Bonds, Series 2006 | 5.000 | 11/01/31 | 222,764 | ||||||||||||||
| 100,000 | Monroe County Industrial Development Corporation, New York, Revenue Bonds, Saint Ann’s Community Project, Series 2019 | 5.000 | 01/01/40 | 92,583 | ||||||||||||||
| |
|
|||||||||||||||||
| TOTAL LONG-TERM CARE | 315,347 | |||||||||||||||||
| |
||||||||||||||||||
| MATERIALS - 0.3% | ||||||||||||||||||
| 510,000 | (a) | Build New York City Resource Corporation, New York, Solid Waste Disposal Revenue Bonds, Pratt Paper NY, Inc. Project, Series 2014, (AMT) | 5.000 | 01/01/35 | 510,277 | |||||||||||||
| |
|
|||||||||||||||||
| TOTAL MATERIALS | 510,277 | |||||||||||||||||
| |
||||||||||||||||||
| TAX OBLIGATION/GENERAL - 7.4% | ||||||||||||||||||
| 1,000,000 | Nassau County, New York, General Obligation Bonds, General Improvement Bonds Series 2019B - AGM Insured | 5.000 | 04/01/44 | 1,021,891 | ||||||||||||||
| 5,000,000 | Nassau County, New York, General Obligation Bonds, General Improvement Series 2022A - AGM Insured | 4.125 | 04/01/47 | 4,532,084 | ||||||||||||||
| 1,000,000 | New York City, New York, General Obligation Bonds, Fiscal 2018 Series E‑1 | 5.000 | 03/01/40 | 1,016,448 | ||||||||||||||
| 835,000 | New York City, New York, General Obligation Bonds, Fiscal 2020 SeriesD‑1 | 4.000 | 03/01/50 | 715,375 | ||||||||||||||
| 1,900,000 | New York City, New York, General Obligation Bonds, Fiscal 2022 Series A‑1 | 5.000 | 08/01/47 | 1,900,116 | ||||||||||||||
| 1,000,000 | New York City, New York, General Obligation Bonds, Fiscal 2025 Series A | 5.000 | 08/01/38 | 1,071,696 | ||||||||||||||
| 1,250,000 | New York City, New York, General Obligation Bonds, Fiscal 2026 Series A‑1 | 5.250 | 08/01/53 | 1,283,388 | ||||||||||||||
| 409,000 | Puerto Rico, General Obligation Bonds, Restructured Series 2022A‑1 | 4.000 | 07/01/41 | 356,113 | ||||||||||||||
| |
|
|||||||||||||||||
| TOTAL TAX OBLIGATION/GENERAL | 11,897,111 | |||||||||||||||||
| |
||||||||||||||||||
| TAX OBLIGATION/LIMITED - 16.8% | ||||||||||||||||||
| 1,000,000 | Dormitory Authority of the State of New York, State Personal Income Tax Revenue Bonds, General Purpose, Bidding Group 1 Through 5, Series 2020A | 4.000 | 03/15/44 | 892,122 | ||||||||||||||
| 3,000,000 | Dormitory Authority of the State of New York, State Sales Tax Revenue Bonds, Series 2017A Group C | 5.000 | 03/15/41 | 3,031,386 | ||||||||||||||
| 2,500,000 | Government of Guam, Business Privilege Tax Bonds, Refunding Series 2015D | 5.000 | 11/15/26 | 2,512,351 | ||||||||||||||
| 540,000 | Hudson Yards Infrastructure Corporation, New York, Revenue Bonds, Second Indenture Fiscal 2017 Series A | 5.000 | 02/15/39 | 548,052 | ||||||||||||||
| 2,465,000 | New York City Transitional Finance Authority, New York, Building Aid Revenue Bonds, Fiscal 2020 Subseries S‑1B | 4.000 | 07/15/43 | 2,224,223 | ||||||||||||||
| See Notes to Financial Statements |
103 |
Portfolio of Investments August 31, 2025 (continued)
NNY
| PRINCIPAL | DESCRIPTION | RATE | MATURITY | VALUE | ||||||||||||||
| |
|
|||||||||||||||||
| TAX OBLIGATION/LIMITED (continued) | ||||||||||||||||||
| $ | 445,000 | New York City Transitional Finance Authority, New York, Building Aid Revenue Bonds, Fiscal Series 2016S‑1 | 5.000% | 07/15/34 | $ | 449,085 | ||||||||||||
| 1,125,000 | New York City Transitional Finance Authority, New York, Future Tax Secured Bonds, Subordinate Fiscal 2017 Series E‑1 | 5.000 | 02/01/39 | 1,140,408 | ||||||||||||||
| 1,000,000 | New York City Transitional Finance Authority, New York, Future Tax Secured Bonds, Subordinate Fiscal 2017 Series E‑1 | 5.000 | 02/01/43 | 1,006,719 | ||||||||||||||
| 1,875,000 | New York City Transitional Finance Authority, New York, Future Tax Secured Bonds, Subordinate Fiscal 2026 Subseries Series A‑1 | 5.000 | 05/01/54 | 1,886,843 | ||||||||||||||
| 1,000,000 | New York City Transitional Finance Authority, New York, Future Tax Secured Bonds, Subordinate Fiscal Series 2023F‑1 | 4.000 | 02/01/51 | 865,660 | ||||||||||||||
| 2,120,000 | New York City Transitional Finance Authority, New York, Future Tax Secured Bonds, Subordinate Fiscal Series 2025D | 4.250 | 05/01/54 | 1,907,097 | ||||||||||||||
| 565,000 | New York City Transitional Finance Authority, New York, Future Tax Secured Bonds, Subordinate Fiscal Series 2025H‑1 | 5.250 | 11/01/48 | 584,212 | ||||||||||||||
| 1,685,000 | New York State Thruway Authority, State Personal Income Tax Revenue Bonds, Bidding Group 1 Series 2022A | 5.000 | 03/15/45 | 1,717,122 | ||||||||||||||
| 1,000,000 | New York State Urban Development Corporation, State Personal Income Tax Revenue Bonds, General Purpose Group 1, Series 2019A | 4.000 | 03/15/48 | 860,753 | ||||||||||||||
| 2,000,000 | New York State Urban Development Corporation, State Personal Income Tax Revenue Bonds, General Purpose, Series 2020C | 4.000 | 03/15/49 | 1,710,728 | ||||||||||||||
| 6,509,000 | Puerto Rico Sales Tax Financing Corporation, Sales Tax Revenue Bonds, Restructured 2018A‑1 | 0.000 | 07/01/51 | 1,519,303 | ||||||||||||||
| 3,218,000 | Puerto Rico Sales Tax Financing Corporation, Sales Tax Revenue Bonds, Restructured 2018A‑1 | 5.000 | 07/01/58 | 2,951,737 | ||||||||||||||
| 17,000 | Puerto Rico Sales Tax Financing Corporation, Sales Tax Revenue Bonds, Taxable Restructured Cofina Project Series 2019A‑2 | 4.536 | 07/01/53 | 14,663 | ||||||||||||||
| 1,030,000 | Triborough Bridge and Tunnel Authority, New York, Payroll Mobility Tax Bonds, Senior Lien Series 2022A | 4.000 | 05/15/51 | 885,677 | ||||||||||||||
| 90,000 | Triborough Bridge and Tunnel Authority, New York, Payroll Mobility Tax Bonds, Senior Lien Subseries 2021A‑1 | 5.000 | 05/15/51 | 90,393 | ||||||||||||||
| 355,000 | Triborough Bridge and Tunnel Authority, New York, Payroll Mobility Tax Senior Lien Bonds, Series 2022C | 4.125 | 05/15/52 | 312,297 | ||||||||||||||
| |
|
|||||||||||||||||
| TOTAL TAX OBLIGATION/LIMITED | 27,110,831 | |||||||||||||||||
| |
||||||||||||||||||
| TRANSPORTATION - 22.2% | ||||||||||||||||||
| 785,000 | Build NYC Resource Corporation, New York, Airport Facilities Revenue Bonds. TrIPs Obligated Group, Senior Series 2025, (AMT) | 5.500 | 07/01/50 | 789,494 | ||||||||||||||
| 970,000 | Metropolitan Transportation Authority, New York, Transportation Revenue Bonds, Green Climate Bond Certified Series 2020C‑1 | 5.000 | 11/15/50 | 950,455 | ||||||||||||||
| 1,950,000 | Metropolitan Transportation Authority, New York, Transportation Revenue Bonds, Green Refunding Series 2024B | 4.000 | 11/15/44 | 1,683,100 | ||||||||||||||
| 1,315,000 | Metropolitan Transportation Authority, New York, Transportation Revenue Bonds, Refunding Series 2015F | 5.000 | 11/15/32 | 1,317,929 | ||||||||||||||
| 2,000,000 | (b) | New York City Industrial Development Agency, New York, Civic Facility Revenue Bonds, Bronx Parking Development Company, LLC Project, Series 2007 | 2.300 | 10/01/37 | 1,280,000 | |||||||||||||
| 1,500,000 | (b) | New York City Industrial Development Agency, New York, Civic Facility Revenue Bonds, Bronx Parking Development Company, LLC Project, Series 2007 | 2.350 | 10/01/46 | 960,000 | |||||||||||||
| 400,000 | New York Transportation Development Corporation, New York, Special Facilities Bonds, LaGuardia Airport Terminal B Redevelopment Project, Series 2016A, (AMT) | 5.000 | 07/01/46 | 378,874 | ||||||||||||||
| 3,815,000 | New York Transportation Development Corporation, New York, Special Facilities Bonds, LaGuardia Airport Terminal B Redevelopment Project, Series 2016A, (AMT) | 5.250 | 01/01/50 | 3,632,128 | ||||||||||||||
| 1,000,000 | New York Transportation Development Corporation, New York, Special Facilities Revenue Bonds, Terminal 6 John F Kennedy International Airport Redevelopment Project, Senior Green Series 2024A, (AMT) | 5.250 | 12/31/54 | 986,743 | ||||||||||||||
| 2,130,000 | New York Transportation Development Corporation, New York, Special Facilities Revenue Bonds, Terminal 6 John F Kennedy International Airport Redevelopment Project, Senior Green Series 2024A, (AMT) | 5.500 | 12/31/60 | 2,062,215 | ||||||||||||||
| 104 |
See Notes to Financial Statements |
| PRINCIPAL | DESCRIPTION | RATE | MATURITY | VALUE | ||||||||||||||
| |
|
|||||||||||||||||
| TRANSPORTATION (continued) | ||||||||||||||||||
| $ | 175,000 | New York Transportation Development Corporation, New York, Special Facility Revenue Bonds, American Airlines, Inc. John F Kennedy International Airport Project, Refunding Series 2016, (AMT) | 5.000% | 08/01/26 | $ | 175,005 | ||||||||||||
| 2,625,000 | New York Transportation Development Corporation, New York, Special Facility Revenue Bonds, American Airlines, Inc. John F Kennedy International Airport Project, Refunding Series 2016, (AMT) | 5.000 | 08/01/31 | 2,625,022 | ||||||||||||||
| 105,000 | New York Transportation Development Corporation, New York, Special Facility Revenue Bonds, American Airlines, Inc. John F Kennedy International Airport Project, Series 2020, (AMT) | 5.375 | 08/01/36 | 107,288 | ||||||||||||||
| 355,000 | New York Transportation Development Corporation, New York, Special Facility Revenue Bonds, John F Kennedy International Airport New Terminal 1 Project, Green Series 2023, (AMT) | 6.000 | 06/30/54 | 360,722 | ||||||||||||||
| 1,515,000 | New York Transportation Development Corporation, New York, Special Facility Revenue Bonds, John F Kennedy International Airport New Terminal 1 Project, Green Series 2023, (AMT) | 5.375 | 06/30/60 | 1,438,510 | ||||||||||||||
| 500,000 | New York Transportation Development Corporation, New York, Special Facility Revenue Bonds, John F Kennedy International Airport New Terminal 1 Project, Green Series 2024, (AMT) | 5.500 | 06/30/60 | 481,240 | ||||||||||||||
| 340,000 | New York Transportation Development Corporation, New York, Special Facility Revenue Bonds, Terminal 4 John F Kennedy International Airport Project, Series 2020C | 5.000 | 12/01/35 | 360,376 | ||||||||||||||
| 1,785,000 | New York Transportation Development Corporation, New York, Special Facility Revenue Bonds, Terminal 4 John F Kennedy International Airport Project, Series 2022, (AMT) | 5.000 | 12/01/35 | 1,878,943 | ||||||||||||||
| 2,000,000 | New York Transportation Development Corporation, Special Facility Revenue Bonds, Delta Air Lines, Inc. - LaGuardia Airport Terminals C&D Redevelopment Project, Series 2018, (AMT) | 5.000 | 01/01/27 | 2,034,519 | ||||||||||||||
| 400,000 | New York Transportation Development Corporation, Special Facility Revenue Bonds, Delta Air Lines, Inc. - LaGuardia Airport Terminals C&D Redevelopment Project, Series 2018, (AMT) | 5.000 | 01/01/28 | 411,939 | ||||||||||||||
| 850,000 | New York Transportation Development Corporation, Special Facility Revenue Bonds, Delta Air Lines, Inc. - LaGuardia Airport Terminals C&D Redevelopment Project, Series 2018, (AMT) | 5.000 | 01/01/31 | 869,154 | ||||||||||||||
| 400,000 | New York Transportation Development Corporation, Special Facility Revenue Bonds, Delta Air Lines, Inc. - LaGuardia Airport Terminals C&D Redevelopment Project, Series 2020, (AMT) | 5.000 | 10/01/40 | 397,560 | ||||||||||||||
| 1,000,000 | New York Transportation Development Corporation, Special Facility Revenue Bonds, Delta Air Lines, Inc. - LaGuardia Airport Terminals C&D Redevelopment Project, Series 2023, (AMT) | 6.000 | 04/01/35 | 1,084,926 | ||||||||||||||
| 3,000,000 | Port Authority of New York and New Jersey, Consolidated Revenue Bonds, One Hundred Ninety-Fourth Series 2015 | 5.000 | 10/15/41 | 3,002,752 | ||||||||||||||
| 1,930,000 | Port Authority of New York and New Jersey, Consolidated Revenue Bonds, Two Hundred Eleventh Series 2018 | 4.000 | 09/01/43 | 1,746,062 | ||||||||||||||
| 800,000 | Port Authority of New York and New Jersey, Consolidated Revenue Bonds, Two Hundred Fifth Series 2017 | 5.000 | 11/15/42 | 813,099 | ||||||||||||||
| 1,000,000 | Port Authority of New York and New Jersey, Consolidated Revenue Bonds, Two Hundred Twentieth Series 2019, (AMT) | 4.000 | 11/01/59 | 795,422 | ||||||||||||||
| 1,155,000 | Triborough Bridge and Tunnel Authority, New York, General Purpose Revenue Bonds, Refunding Subordinate Lien Series 2017A2 | 5.000 | 11/15/42 | 1,162,201 | ||||||||||||||
| 2,000,000 | Triborough Bridge and Tunnel Authority, New York, General Revenue Bonds, Refunding Series 2018C | 5.000 | 11/15/37 | 2,056,169 | ||||||||||||||
| |
|
|||||||||||||||||
| TOTAL TRANSPORTATION | 35,841,847 | |||||||||||||||||
| |
||||||||||||||||||
| UTILITIES - 15.2% | ||||||||||||||||||
| 300,000 | Buffalo Municipal Water Finance Authority, New York, Water System Revenue Bonds, Refunding Series 2015A | 5.000 | 07/01/29 | 300,511 | ||||||||||||||
| 3,440,000 | Long Island Power Authority, New York, Electric System General Revenue Bonds, Green Series 2023E | 5.000 | 09/01/53 | 3,447,037 | ||||||||||||||
| 580,000 | Long Island Power Authority, New York, Electric System General Revenue Bonds, Series 2016B | 5.000 | 09/01/46 | 580,004 | ||||||||||||||
| 3,000,000 | New York City Municipal Water Finance Authority, New York, Water and Sewer System Second General Resolution Revenue Bonds, Fiscal 2018 Series CC‑1 | 5.000 | 06/15/48 | 3,007,921 | ||||||||||||||
| See Notes to Financial Statements |
105 |
Portfolio of Investments August 31, 2025 (continued)
NNY
| PRINCIPAL | DESCRIPTION | RATE | MATURITY | VALUE | ||||||||||||||
| |
|
|||||||||||||||||
| UTILITIES (continued) | ||||||||||||||||||
| $ | 1,000,000 | New York City Municipal Water Finance Authority, New York, Water and Sewer System Second General Resolution Revenue Bonds, Fiscal 2018 Series EE | 5.000% | 06/15/39 | $ | 1,003,025 | ||||||||||||
| 2,200,000 | New York City Municipal Water Finance Authority, New York, Water and Sewer System Second General Resolution Revenue Bonds, Fiscal 2020 Series EE | 4.000 | 06/15/42 | 2,016,810 | ||||||||||||||
| 1,145,000 | New York City Municipal Water Finance Authority, New York, Water and Sewer System Second General Resolution Revenue Bonds, Fiscal 2023 Series AA‑1 | 5.250 | 06/15/52 | 1,169,394 | ||||||||||||||
| 1,000,000 | New York State Environmental Facilities Corporation, State Clean Water and Drinking Water Revolving Funds Revenue Bonds, New York City Municipal Water Finance Authority Projects-Second Resolution Bonds, Subordinated SRF Series 2017A | 5.000 | 06/15/46 | 1,005,959 | ||||||||||||||
| 1,300,000 | New York State Environmental Facilities Corporation, State Clean Water and Drinking Water Revolving Funds Revenue Bonds, New York City Municipal Water Finance Authority Projects-Second Resolution Bonds, Subordinated SRF Series 2017E | 5.000 | 06/15/47 | 1,307,369 | ||||||||||||||
| 1,895,000 | New York State Environmental Facilities Corporation, State Clean Water and Drinking Water Revolving Funds Revenue Bonds, New York City Municipal Water Finance Authority Projects-Second Resolution Bonds, Subordinated SRF Series 2022A | 5.000 | 06/15/51 | 1,912,037 | ||||||||||||||
| 2,000,000 | New York State Environmental Facilities Corporation, State Revolving Funds Revenue Bonds, Green Series 2022B | 5.250 | 09/15/52 | 2,052,167 | ||||||||||||||
| 780,000 | New York State Power Authority, General Revenue Bonds, Green Series 2024A | 4.000 | 11/15/54 | 663,932 | ||||||||||||||
| 5,000,000 | New York State Power Authority, General Revenue Bonds, Series 2020A | 4.000 | 11/15/55 | 4,224,438 | ||||||||||||||
| 650,000 | New York State Power Authority, Green Transmission Project Revenue Bonds, Green Series 2023A - AGM Insured | 5.000 | 11/15/48 | 659,545 | ||||||||||||||
| 500,000 | (a) | Niagara Area Development Corporation, New York, Solid Waste Disposal Facility Revenue Refunding Bonds, Covanta Energy Project, Series 2018A, (AMT) | 4.750 | 11/01/42 | 442,041 | |||||||||||||
| 775,000 | (a) | Puerto Rico Aqueduct and Sewerage Authority, Revenue Bonds, Refunding Senior Lien Series 2020A | 5.000 | 07/01/47 | 725,000 | |||||||||||||
| |
|
|||||||||||||||||
| TOTAL UTILITIES | 24,517,190 | |||||||||||||||||
| |
||||||||||||||||||
| TOTAL MUNICIPAL BONDS (Cost $164,114,977) |
157,663,192 | |||||||||||||||||
| |
||||||||||||||||||
| TOTAL LONG-TERM INVESTMENTS (Cost $164,114,977) |
157,663,192 | |||||||||||||||||
| |
||||||||||||||||||
| PRINCIPAL | DESCRIPTION | RATE | MATURITY | VALUE | ||||||||||||||
| |
|
|||||||||||||||||
| SHORT-TERM INVESTMENTS - 2.2% | ||||||||||||||||||
| MUNICIPAL BONDS - 2.2% | ||||||||||||||||||
| TAX OBLIGATION/GENERAL - 2.2% | ||||||||||||||||||
| $ | 3,500,000 | (c) | New York City, New York, General Obligation Bonds, Fiscal 2014 Series I‑2 | 3.950 | 03/01/40 | $ | 3,500,000 | |||||||||||
| |
|
|||||||||||||||||
| TOTAL TAX OBLIGATION/GENERAL | 3,500,000 | |||||||||||||||||
| |
||||||||||||||||||
| TOTAL SHORT-TERM INVESTMENTS (Cost $3,500,000) |
3,500,000 | |||||||||||||||||
| |
||||||||||||||||||
| TOTAL INVESTMENTS - 100.0% (Cost $167,614,977) |
161,163,192 | |||||||||||||||||
| |
||||||||||||||||||
| OTHER ASSETS & LIABILITIES, NET - 0.0% | 76,160 | |||||||||||||||||
| |
||||||||||||||||||
| NET ASSETS APPLICABLE TO COMMON SHARES - 100% | $ | 161,239,352 | ||||||||||||||||
| |
||||||||||||||||||
All percentages shown in the Portfolio of Investments are based on net assets applicable to common shares unless otherwise noted.
| AMT | Alternative Minimum Tax |
| 106 |
See Notes to Financial Statements |
| (a) | Security is exempt from registration under Rule 144A of the Securities Act of 1933, as amended. These securities are deemed liquid and may be resold in transactions exempt from registration, which are normally those transactions with qualified institutional buyers. As of the end of the reporting period, the aggregate value of these securities is $9,365,736 or 5.8% of Total Investments. | |
| (b) | Defaulted security. A security whose issuer has failed to fully pay principal and/or interest when due, or is under the protection of bankruptcy. | |
| (c) | Investment has a maturity of greater than one year, but has variable rate and/or demand features which qualify it as a short-term investment. The rate disclosed, as well as the reference rate and spread, where applicable, is that in effect as of the end of the reporting period. This rate changes periodically based on market conditions or a specified market index. | |
| See Notes to Financial Statements |
107 |
Portfolio of Investments August 31, 2025
NAN
| PRINCIPAL | DESCRIPTION | RATE | MATURITY | VALUE | ||||||||||||||
| |
|
|||||||||||||||||
| LONG-TERM INVESTMENTS - 170.8% (100.0% of Total Investments) | ||||||||||||||||||
| MUNICIPAL BONDS - 170.8% (100.0% of Total Investments) | ||||||||||||||||||
| CONSUMER STAPLES - 6.3% (3.7% of Total Investments) | ||||||||||||||||||
| $ | 12,500,000 | Erie County Tobacco Asset Securitization Corporation, New York, Tobacco Settlement Asset-Backed Bonds, Series 2005A | 5.000% | 06/01/38 | $ | 11,272,084 | ||||||||||||
| 3,210,000 | Erie County Tobacco Asset Securitization Corporation, New York, Tobacco Settlement Asset-Backed Bonds, Series 2005A | 5.000 | 06/01/45 | 2,595,790 | ||||||||||||||
| 120,000 | New York Counties Tobacco Trust VI, New York, Tobacco Settlement Pass-Through Bonds, Series 2016A‑1 | 5.625 | 06/01/35 | 121,887 | ||||||||||||||
| 1,145,000 | New York Counties Tobacco Trust VI, New York, Tobacco Settlement Pass-Through Bonds, Series 2016A‑1 | 5.750 | 06/01/43 | 1,081,660 | ||||||||||||||
| 7,155,000 | TSASC Inc., New York, Tobacco Asset-Backed Bonds, Series 2006 | 5.000 | 06/01/48 | 6,076,213 | ||||||||||||||
| |
|
|||||||||||||||||
| TOTAL CONSUMER STAPLES | 21,147,634 | |||||||||||||||||
| |
||||||||||||||||||
| EDUCATION AND CIVIC ORGANIZATIONS - 11.7% (6.8% of Total Investments) | ||||||||||||||||||
| 2,875,000 | Buffalo and Erie County Industrial Land Development Corporation, New York, Revenue Bonds, Enterprise Charter School Project, Series 2011A | 7.500 | 12/01/40 | 2,806,317 | ||||||||||||||
| 340,000 | Build New York City Resource Corporation, New York, Revenue Bonds, Classical Charter Schools Series 2023A | 4.500 | 06/15/43 | 308,970 | ||||||||||||||
| 550,000 | Build New York City Resource Corporation, New York, Revenue Bonds, Classical Charter Schools Series 2023A | 4.750 | 06/15/58 | 481,614 | ||||||||||||||
| 400,000 | Build New York City Resource Corporation, New York, Revenue Bonds, KIPP New York City Public School Facilities, Canal West Project, Series 2022 | 5.250 | 07/01/52 | 383,443 | ||||||||||||||
| 1,000,000 | Build New York City Resource Corporation, New York, Revenue Bonds, KIPP New York City Public School Facilities, Canal West Project, Series 2022 | 5.250 | 07/01/57 | 948,201 | ||||||||||||||
| 200,000 | Build New York City Resource Corporation, New York, Revenue Bonds, KIPP New York City Public School Facilities, Canal West Project, Series 2022 | 5.250 | 07/01/62 | 187,645 | ||||||||||||||
| 1,405,000 | (a) | Build New York City Resource Corporation, New York, Revenue Bonds, Metropolitan College of New York, Series 2014 | 5.250 | 11/01/34 | 983,500 | |||||||||||||
| 1,300,000 | (a) | Build New York City Resource Corporation, New York, Revenue Bonds, Metropolitan College of New York, Series 2014 | 5.000 | 11/01/39 | 910,000 | |||||||||||||
| 870,000 | (b) | Build NYC Resource Corporation Revenue Bonds, New York, East Harlem Scholars Academy Charter School Project, Series 2022 (Social Bonds) | 5.750 | 06/01/62 | 807,562 | |||||||||||||
| 1,000,000 | (b) | Build NYC Resource Corporation, New York, Revenue Bonds, Albert Einstein College of Medicine, Inc, Series 2023 | 7.250 | 06/01/55 | 1,027,517 | |||||||||||||
| 1,000,000 | (b) | Build NYC Resource Corporation, New York, Revenue Bonds, Family Life Academy Charter School, Series 2020A‑1 | 5.250 | 06/01/40 | 926,426 | |||||||||||||
| 290,000 | (b) | Build NYC Resource Corporation, New York, Revenue Bonds, Richmond Preparatory Charter School Project, Social Impact Project Series 2021A | 5.000 | 06/01/41 | 247,084 | |||||||||||||
| 1,000,000 | (b) | Build NYC Resource Corporation, New York, Revenue Bonds, Richmond Preparatory Charter School Project, Social Impact Project Series 2021A | 5.000 | 06/01/51 | 774,452 | |||||||||||||
| 1,670,000 | (b) | Dormitory Authority of the State of New York, General Revenue Bonds, American Musical and Dramatic Academy Inc., Series 2023A | 7.250 | 07/01/53 | 1,670,068 | |||||||||||||
| 4,030,000 | Dormitory Authority of the State of New York, General Revenue Bonds, Yeshiva University, Series 2022A | 5.000 | 07/15/50 | 3,840,744 | ||||||||||||||
| 2,000,000 | Dormitory Authority of the State of New York, Housing Revenue Bonds, Fashion Institute of Technology, Series 2007 - FGIC Insured | 5.250 | 07/01/29 | 2,076,102 | ||||||||||||||
| 1,565,000 | Dormitory Authority of the State of New York, Revenue Bonds, Fordham University, Series 2020 | 4.000 | 07/01/46 | 1,337,736 | ||||||||||||||
| 1,055,000 | Dormitory Authority of the State of New York, Revenue Bonds, New York University, Series 2016A | 5.000 | 07/01/35 | 1,070,490 | ||||||||||||||
| 2,000,000 | Dormitory Authority of the State of New York, Revenue Bonds, New York University, Series 2016A | 5.000 | 07/01/36 | 2,028,377 | ||||||||||||||
| 2,625,000 | Dormitory Authority of the State of New York, Revenue Bonds, Rockefeller University, Series 2020A | 5.000 | 07/01/53 | 2,602,653 | ||||||||||||||
| 108 |
See Notes to Financial Statements |
| PRINCIPAL | DESCRIPTION | RATE | MATURITY | VALUE | ||||||||||||||
| |
|
|||||||||||||||||
| EDUCATION AND CIVIC ORGANIZATIONS (continued) | ||||||||||||||||||
| $ | 3,140,000 | (b) | Dormitory Authority of the State of New York, Revenue Bonds, Vaughn College of Aeronautics & Technology, Series 2016A | 5.500% | 12/01/36 | $ | 2,794,357 | |||||||||||
| 2,705,000 | Glen Cove Local Economic Assistance Corporation, New York, Revenue Bonds, Garvies Point Public Improvement Project, Capital Appreciation Series 2016C | 5.625 | 01/01/55 | 2,305,171 | ||||||||||||||
| 1,005,000 | Hempstead Town Local Development Corporation, New York, Revenue Bonds, Adelphi University Project, Series 2013 | 5.000 | 09/01/38 | 1,005,236 | ||||||||||||||
| 265,000 | Hempstead Town Local Development Corporation, New York, Revenue Bonds, Adelphi University Project, Series 2013 | 5.000 | 09/01/43 | 260,725 | ||||||||||||||
| 5,000,000 | New York City Industrial Development Agency, New York, PILOT Payment in Lieu of Taxes Revenue Bonds, Yankee Stadium Project, Refunding Series 2020A | 4.000 | 03/01/45 | 4,311,405 | ||||||||||||||
| 2,055,000 | New York City Industrial Development Agency, New York, PILOT Payment in Lieu of Taxes Revenue Bonds, Yankee Stadium Project, Refunding Series 2020A - AGM Insured | 4.000 | 03/01/45 | 1,839,604 | ||||||||||||||
| 1,515,000 | Onondaga Civic Development Corporation, New York, Revenue Bonds, Le Moyne College Project, Series 2015 | 5.000 | 07/01/40 | 1,510,454 | ||||||||||||||
| |
|
|||||||||||||||||
| TOTAL EDUCATION AND CIVIC ORGANIZATIONS | 39,445,853 | |||||||||||||||||
| |
||||||||||||||||||
| FINANCIALS - 3.9% (2.3% of Total Investments) | ||||||||||||||||||
| 4,725,000 | Liberty Development Corporation, New York, Goldman Sachs Headquarter Revenue Bonds, Series 2005 | 5.250 | 10/01/35 | 5,321,417 | ||||||||||||||
| 6,885,000 | Liberty Development Corporation, New York, Goldman Sachs Headquarters Revenue Bonds Series 2007 | 5.500 | 10/01/37 | 7,841,438 | ||||||||||||||
| |
|
|||||||||||||||||
| TOTAL FINANCIALS | 13,162,855 | |||||||||||||||||
| |
||||||||||||||||||
| HEALTH CARE - 26.3% (15.4% of Total Investments) | ||||||||||||||||||
| 11,020,000 | Dormitory Authority of the State of New York, General Revenue Bonds, Northwell Health Obligated Group, Series 2022A | 4.250 | 05/01/52 | 9,422,995 | ||||||||||||||
| 4,745,000 | Dormitory Authority of the State of New York, General Revenue Bonds, Northwell Health Obligated Group, Series 2022A | 5.000 | 05/01/52 | 4,637,137 | ||||||||||||||
| 3,000,000 | Dormitory Authority of the State of New York, General Revenue Bonds, Northwell Health Obligated Group, Series 2024A | 4.000 | 05/01/54 | 2,456,495 | ||||||||||||||
| 7,950,000 | Dormitory Authority of the State of New York, General Revenue Bonds, Northwell Health Obligated Group, Series 2024A | 5.250 | 05/01/54 | 7,990,133 | ||||||||||||||
| 5,000,000 | Dormitory Authority of the State of New York, Revenue Bonds, Memorial Sloan Kettering Cancer Center, Series 2022‑1A | 4.000 | 07/01/51 | 4,276,202 | ||||||||||||||
| 2,420,000 | Dormitory Authority of the State of New York, Revenue Bonds, Montefiore Obligated Group, Series 2018A | 5.000 | 08/01/30 | 2,506,763 | ||||||||||||||
| 4,275,000 | Dormitory Authority of the State of New York, Revenue Bonds, Montefiore Obligated Group, Series 2018A | 5.000 | 08/01/33 | 4,360,510 | ||||||||||||||
| 3,060,000 | Dormitory Authority of the State of New York, Revenue Bonds, Montefiore Obligated Group, Series 2018A | 5.000 | 08/01/34 | 3,109,845 | ||||||||||||||
| 3,195,000 | Dormitory Authority of the State of New York, Revenue Bonds, Mount Sinai Health Obligated Group, Series 2025 | 5.250 | 07/01/50 | 3,094,413 | ||||||||||||||
| 9,150,000 | Dormitory Authority of the State of New York, Revenue Bonds, NYU Langone Hospitals Obligated Group, Series 2020A | 4.000 | 07/01/50 | 7,741,905 | ||||||||||||||
| 3,820,000 | Dormitory Authority of the State of New York, Revenue Bonds, NYU Langone Hospitals Obligated Group, Series 2020A | 4.000 | 07/01/53 | 3,126,772 | ||||||||||||||
| 2,000,000 | (b) | Dormitory Authority of the State of New York, Revenue Bonds, Orange Regional Medical Center Obligated Group, Series 2015 | 5.000 | 12/01/40 | 1,792,912 | |||||||||||||
| 5,900,000 | (b) | Dormitory Authority of the State of New York, Revenue Bonds, Orange Regional Medical Center Obligated Group, Series 2017 | 5.000 | 12/01/35 | 5,733,419 | |||||||||||||
| 1,625,000 | Dormitory Authority of the State of New York, Revenue Bonds, Roswell Park Cancer Institute Obligated Group, Series 2025A | 5.500 | 07/01/55 | 1,679,942 | ||||||||||||||
| 220,000 | Dormitory Authority of the State of New York, Revenue Bonds, White Plains Hospital, Series 2024 | 5.250 | 10/01/49 | 213,553 | ||||||||||||||
| 1,920,000 | Dormitory Authority of the State of New York, Revenue Bonds, White Plains Hospital, Series 2024 | 5.500 | 10/01/54 | 1,961,258 | ||||||||||||||
| 870,000 | Dutchess County Local Development Corporation, New York, Revenue Bonds, Health Quest Systems, Inc. Project, Series 2016B | 4.000 | 07/01/41 | 787,638 | ||||||||||||||
| 8,300,000 | Dutchess County Local Development Corporation, New York, Revenue Bonds, Health Quest Systems, Inc. Project, Series 2016B | 5.000 | 07/01/46 | 7,861,633 | ||||||||||||||
| 480,000 | Livingston County Industrial Development Agency, New York, Civic Facility Revenue Bonds, Nicholas H. Noyes Hospital, Series 2005 | 6.000 | 07/01/30 | 480,859 | ||||||||||||||
| See Notes to Financial Statements |
109 |
Portfolio of Investments August 31, 2025 (continued)
NAN
| PRINCIPAL | DESCRIPTION | RATE | MATURITY | VALUE | ||||||||||||||
| |
|
|||||||||||||||||
| HEALTH CARE (continued) | ||||||||||||||||||
| $ | 2,410,000 | Monroe County Industrial Development Corporation, New York, Revenue Bonds, Rochester General Hospital Project, Series 2017 | 5.000% | 12/01/46 | $ | 2,331,482 | ||||||||||||
| 4,470,000 | Monroe County Industrial Development Corporation, New York, Revenue Bonds, Rochester Regional Health Project, Series 2020A | 4.000 | 12/01/46 | 3,676,627 | ||||||||||||||
| 620,000 | New York State Dormitory Authority, Revenue Bonds, Memorial Sloan-Kettering Cancer Center Series 2025‑I | 5.250 | 07/01/54 | 638,705 | ||||||||||||||
| 9,795,000 | Westchester County Local Development Corporation, New York, Revenue Bonds, Westchester Medical Center Obligated Group Project, Series 2016 | 5.000 | 11/01/46 | 8,676,292 | ||||||||||||||
| 240,000 | Westchester County Local Development Corporation, New York, Revenue Bonds, Westchester Medical Center Obligated Group Project, Series 2023 | 6.250 | 11/01/52 | 250,283 | ||||||||||||||
| |
|
|||||||||||||||||
| TOTAL HEALTH CARE | 88,807,773 | |||||||||||||||||
| |
||||||||||||||||||
| HOUSING/MULTIFAMILY - 0.6% (0.4% of Total Investments) | ||||||||||||||||||
| 1,900,000 | New York City Housing Development Corporation, New York, Multifamily Housing Revenue Bonds, Sustainable Development Green Series 2024B‑1‑A | 4.650 | 11/01/49 | 1,816,451 | ||||||||||||||
| 325,000 | New York City Housing Development Corporation, New York, Multi-Family Mortgage Revenue Bonds, 8 Spruce Street, Class F Series 2024 | 5.250 | 12/15/31 | 333,631 | ||||||||||||||
| |
|
|||||||||||||||||
| TOTAL HOUSING/MULTIFAMILY | 2,150,082 | |||||||||||||||||
| |
||||||||||||||||||
| HOUSING/SINGLE FAMILY - 0.1% (0.1% of Total Investments) | ||||||||||||||||||
| 430,000 | Guam Housing Corporation, Mortgage-Backed Securities Program Single Family Mortgage Revenue Bonds, Series 1998A, (AMT) | 5.750 | 09/01/31 | 433,394 | ||||||||||||||
| |
|
|||||||||||||||||
| TOTAL HOUSING/SINGLE FAMILY | 433,394 | |||||||||||||||||
| |
||||||||||||||||||
| INDUSTRIALS - 5.9% (3.4% of Total Investments) | ||||||||||||||||||
| 7,625,000 | (b) | New York Liberty Development Corporation, New York, Liberty Revenue Bonds, 3 World Trade Center Project, Class 1 Series 2014 | 5.000 | 11/15/44 | 7,410,055 | |||||||||||||
| 2,500,000 | (b) | New York Liberty Development Corporation, New York, Liberty Revenue Bonds, 3 World Trade Center Project, Class 2 Series 2014 | 5.375 | 11/15/40 | 2,499,922 | |||||||||||||
| 40,000 | New York Liberty Development Corporation, New York, Liberty Revenue Bonds, 7 World Trade Center Project, Refunding Green Series 2022A‑CL2 | 3.500 | 09/15/52 | 29,258 | ||||||||||||||
| 4,200,000 | New York Transportation Development Corporation, New York, Facility Revenue Bonds, Thruway Service Areas Project, Series 2021, (AMT) | 4.000 | 10/31/41 | 3,689,434 | ||||||||||||||
| 1,060,000 | New York Transportation Development Corporation, New York, Facility Revenue Bonds, Thruway Service Areas Project, Series 2021, (AMT) | 4.000 | 10/31/46 | 886,394 | ||||||||||||||
| 6,750,000 | New York Transportation Development Corporation, New York, Facility Revenue Bonds, Thruway Service Areas Project, Series 2021, (AMT) | 4.000 | 04/30/53 | 5,328,292 | ||||||||||||||
| |
|
|||||||||||||||||
| TOTAL INDUSTRIALS | 19,843,355 | |||||||||||||||||
| |
||||||||||||||||||
| LONG-TERM CARE - 0.4% (0.2% of Total Investments) | ||||||||||||||||||
| 1,045,000 | Dormitory Authority of the State of New York, Non‑State Supported Debt, Ozanam Hall of Queens Nursing Home Revenue Bonds, Series 2006 | 5.000 | 11/01/31 | 1,058,127 | ||||||||||||||
| 340,000 | Monroe County Industrial Development Corporation, New York, Revenue Bonds, Saint Ann’s Community Project, Series 2019 | 5.000 | 01/01/40 | 314,783 | ||||||||||||||
| |
|
|||||||||||||||||
| TOTAL LONG-TERM CARE | 1,372,910 | |||||||||||||||||
| |
||||||||||||||||||
| MATERIALS - 0.5% (0.3% of Total Investments) | ||||||||||||||||||
| 1,860,000 | (b) | Build New York City Resource Corporation, New York, Solid Waste Disposal Revenue Bonds, Pratt Paper NY, Inc. Project, Series 2014, (AMT) | 5.000 | 01/01/35 | 1,861,010 | |||||||||||||
| |
|
|||||||||||||||||
| TOTAL MATERIALS | 1,861,010 | |||||||||||||||||
| |
||||||||||||||||||
| 110 |
See Notes to Financial Statements |
| PRINCIPAL | DESCRIPTION | RATE | MATURITY | VALUE | ||||||||||||||
| |
|
|||||||||||||||||
| TAX OBLIGATION/GENERAL — 5.5% (3.2% of Total Investments) | ||||||||||||||||||
| $ | 3,000,000 | Nassau County, New York, General Obligation Bonds, General Improvement Bonds Series 2019B — AGM Insured | 5.000% | 04/01/44 | $ | 3,065,674 | ||||||||||||
| 4,390,000 | New York City, New York, General Obligation Bonds, Fiscal 2018 Series E‑1 | 5.000 | 03/01/40 | 4,462,204 | ||||||||||||||
| 2,200,000 | New York City, New York, General Obligation Bonds, Fiscal 2018 Series F‑1 | 5.000 | 04/01/38 | 2,254,744 | ||||||||||||||
| 3,110,000 | New York City, New York, General Obligation Bonds, Fiscal 2021 Series C | 5.000 | 08/01/43 | 3,154,752 | ||||||||||||||
| 4,210,000 | New York City, New York, General Obligation Bonds, Fiscal 2023 Series B‑1 | 5.250 | 10/01/47 | 4,300,134 | ||||||||||||||
| 1,506,000 | Puerto Rico, General Obligation Bonds, Restructured Series 2022A-1 | 4.000 | 07/01/41 | 1,311,263 | ||||||||||||||
| |
|
|||||||||||||||||
| TOTAL TAX OBLIGATION/GENERAL | 18,548,771 | |||||||||||||||||
| |
||||||||||||||||||
| TAX OBLIGATION/LIMITED — 51.5% (30.2% of Total Investments) | ||||||||||||||||||
| 10,000,000 | Battery Park City Authority, New York, Revenue Bonds, Senior Sustainability Series 2019A | 5.000 | 11/01/49 | 10,130,476 | ||||||||||||||
| 7,500,000 | Dormitory Authority of the State of New York, State Personal Income Tax Revenue Bonds, General Purpose Series 2024A | 4.000 | 03/15/54 | 6,357,131 | ||||||||||||||
| 7,710,000 | Dormitory Authority of the State of New York, State Personal Income Tax Revenue Bonds, General Purpose, Bidding Group 1 Through 5, Series 2020A | 4.000 | 03/15/44 | 6,878,258 | ||||||||||||||
| 1,135,000 | Dormitory Authority of the State of New York, State Personal Income Tax Revenue Bonds, General Purpose, Series 2019D | 4.000 | 02/15/38 | 1,116,085 | ||||||||||||||
| 1,000,000 | Dormitory Authority of the State of New York, State Personal Income Tax Revenue Bonds, General Purpose, Series 2021A | 5.000 | 03/15/49 | 1,004,358 | ||||||||||||||
| 5,000,000 | Dormitory Authority of the State of New York, State Sales Tax Revenue Bonds, Series 2017A | 5.000 | 03/15/44 | 5,032,265 | ||||||||||||||
| 3,990,000 | Dormitory Authority of the State of New York, State Sales Tax Revenue Bonds, Series 2018A | 5.000 | 03/15/40 | 4,079,767 | ||||||||||||||
| 3,225,000 | Government of Guam, Business Privilege Tax Bonds, Refunding Series 2015D | 5.000 | 11/15/26 | 3,240,933 | ||||||||||||||
| 2,355,000 | Government of Guam, Business Privilege Tax Bonds, Refunding Series 2015D | 5.000 | 11/15/39 | 2,366,634 | ||||||||||||||
| 1,000,000 | Hudson Yards Infrastructure Corporation, New York, Revenue Bonds, Green Fiscal 2022 Series A | 4.000 | 02/15/36 | 1,015,206 | ||||||||||||||
| 3,750,000 | Hudson Yards Infrastructure Corporation, New York, Revenue Bonds, Second Indenture Fiscal 2017 Series A | 5.000 | 02/15/39 | 3,805,915 | ||||||||||||||
| 1,660,000 | Metropolitan Transportation Authority, New York, Dedicated Tax Fund Bonds, Green Series 2024A | 4.000 | 11/15/51 | 1,426,198 | ||||||||||||||
| 7,265,000 | Metropolitan Transportation Authority, New York, Dedicated Tax Fund Bonds, Series 2022A | 4.000 | 11/15/42 | 6,586,082 | ||||||||||||||
| 890,000 | New York City Transitional Finance Authority, New York, Building Aid Revenue Bonds, Fiscal Series 2016S‑1 | 5.000 | 07/15/35 | 898,171 | ||||||||||||||
| 2,000,000 | New York City Transitional Finance Authority, New York, Future Tax Secured Bonds, Subordinate Fiscal 2017 Series E‑1 | 5.000 | 02/01/43 | 2,013,437 | ||||||||||||||
| 845,000 | New York City Transitional Finance Authority, New York, Future Tax Secured Bonds, Subordinate Fiscal 2022 Subseries C‑1 | 4.000 | 02/01/42 | 766,096 | ||||||||||||||
| 5,295,000 | New York City Transitional Finance Authority, New York, Future Tax Secured Bonds, Subordinate Fiscal Series 2025D | 4.250 | 05/01/54 | 4,763,245 | ||||||||||||||
| 11,225,000 | (c) | New York City Transitional Finance Authority, New York, Future Tax Secured Bonds, Subordinate Series 2024C, (UB) | 5.250 | 05/01/50 | 11,496,990 | |||||||||||||
| 5,000,000 | New York City Transitional Finance Authority, New York, Future Tax Secured Bonds, Subordinate Series 2024C | 5.500 | 05/01/53 | 5,211,442 | ||||||||||||||
| 14,830,000 | (c) | New York City Transitional Finance Authority, New York, Future Tax Secured Bonds, Subordinate Series 2024C, (UB) | 5.500 | 05/01/53 | 15,457,137 | |||||||||||||
| 4,995,000 | New York State Dormitory Authority, Personal Income Tax Revenue Bonds, General Purpose Series 2019A | 4.000 | 03/15/49 | 4,307,156 | ||||||||||||||
| 3,730,000 | New York State Thruway Authority, State Personal Income Tax Revenue Bonds, Bidding Group 1 Series 2022A | 5.000 | 03/15/45 | 3,801,107 | ||||||||||||||
| 10,000,000 | (c) | New York State Thruway Authority, State Personal Income Tax Revenue Bonds, Bidding Group 3 Series Series 2025A, (UB) | 5.000 | 03/15/48 | 10,137,645 | |||||||||||||
| 4,135,000 | New York State Urban Development Corporation, State Personal Income Tax Revenue Bonds, General Purpose, Series 2020C | 5.000 | 03/15/47 | 4,148,741 | ||||||||||||||
| See Notes to Financial Statements |
111 |
Portfolio of Investments August 31, 2025 (continued)
NAN
| PRINCIPAL | DESCRIPTION | RATE | MATURITY | VALUE | ||||||||||||||
| |
|
|||||||||||||||||
| TAX OBLIGATION/LIMITED (continued) | ||||||||||||||||||
| $ | 3,000,000 | New York State Urban Development Corporation, State Personal Income Tax Revenue Bonds, General Purpose, Series 2020C | 4.000% | 03/15/49 | $ | 2,566,092 | ||||||||||||
| 7,700,000 | New York State Urban Development Corporation, State Personal Income Tax Revenue Bonds, General Purpose, Series 2022A | 5.000 | 03/15/48 | 7,771,314 | ||||||||||||||
| 4,415,000 | Puerto Rico Sales Tax Financing Corporation, Sales Tax Revenue Bonds, Restructured 2018A‑1 | 0.000 | 07/01/46 | 1,395,393 | ||||||||||||||
| 11,014,000 | Puerto Rico Sales Tax Financing Corporation, Sales Tax Revenue Bonds, Restructured 2018A‑1 | 0.000 | 07/01/51 | 2,570,841 | ||||||||||||||
| 22,975,000 | Puerto Rico Sales Tax Financing Corporation, Sales Tax Revenue Bonds, Restructured 2018A‑1 | 5.000 | 07/01/58 | 21,074,007 | ||||||||||||||
| 32,000 | Puerto Rico Sales Tax Financing Corporation, Sales Tax Revenue Bonds, Taxable Restructured Cofina Project Series 2019A‑2 | 4.536 | 07/01/53 | 27,600 | ||||||||||||||
| 1,000,000 | Puerto Rico Sales Tax Financing Corporation, Sales Tax Revenue Bonds, Taxable Restructured Cofina Project Series 2019A‑2 | 4.784 | 07/01/58 | 883,426 | ||||||||||||||
| 2,000,000 | Syracuse Industrial Development Authority, New York, PILOT Revenue Bonds, Carousel Center Project, Refunding Series 2016A, (AMT) | 5.000 | 01/01/29 | 1,606,218 | ||||||||||||||
| 1,000,000 | Syracuse Industrial Development Authority, New York, PILOT Revenue Bonds, Carousel Center Project, Refunding Series 2016A, (AMT) | 5.000 | 01/01/35 | 746,319 | ||||||||||||||
| 5,000,000 | Triborough Bridge and Tunnel Authority, New York, Payroll Mobility Tax Bonds, Senior Lien Series 2021B‑1 | 5.000 | 05/15/56 | 5,000,886 | ||||||||||||||
| 3,800,000 | Triborough Bridge and Tunnel Authority, New York, Payroll Mobility Tax Bonds, Senior Lien Series 2022A | 4.000 | 05/15/51 | 3,267,547 | ||||||||||||||
| 1,000,000 | Triborough Bridge and Tunnel Authority, New York, Payroll Mobility Tax Bonds, Senior Lien Subseries 2021A‑1 | 5.000 | 05/15/51 | 1,004,371 | ||||||||||||||
| 1,065,000 | Triborough Bridge and Tunnel Authority, New York, Payroll Mobility Tax Senior Lien Bonds, Series 2022C | 4.125 | 05/15/52 | 936,892 | ||||||||||||||
| 1,785,000 | Triborough Bridge and Tunnel Authority, New York, Payroll Mobility Tax Senior Lien Bonds, Series 2022C | 5.250 | 05/15/52 | 1,829,680 | ||||||||||||||
| 7,080,000 | Triborough Bridge and Tunnel Authority, New York, Sales Tax Revenue Bonds, MTA Bridges & Tunnels, TBTA Capital Lockbox- City Sales Tax, Series 2024A‑1 | 5.250 | 05/15/59 | 7,283,680 | ||||||||||||||
| |
|
|||||||||||||||||
| TOTAL TAX OBLIGATION/LIMITED | 174,004,741 | |||||||||||||||||
| |
||||||||||||||||||
| TRANSPORTATION - 47.8% (28.0% of Total Investments) | ||||||||||||||||||
| 2,610,000 | Build NYC Resource Corporation, New York, Airport Facilities Revenue Bonds. TrIPs Obligated Group, Senior Series 2025, (AMT) | 5.500 | 07/01/50 | 2,624,943 | ||||||||||||||
| 5,425,000 | Metropolitan Transportation Authority, New York, Transportation Revenue Bonds, Green Climate Bond Certified Series 2016A‑1 | 5.000 | 11/15/46 | 5,392,510 | ||||||||||||||
| 1,110,000 | Metropolitan Transportation Authority, New York, Transportation Revenue Bonds, Green Climate Bond Certified Series 2020C‑1 | 5.000 | 11/15/50 | 1,087,634 | ||||||||||||||
| 5,000,000 | Metropolitan Transportation Authority, New York, Transportation Revenue Bonds, Refunding Green Series 2016B | 5.000 | 11/15/37 | 5,052,708 | ||||||||||||||
| 5,000,000 | Metropolitan Transportation Authority, New York, Transportation Revenue Bonds, Refunding Series 2015C‑1 | 5.250 | 11/15/29 | 5,021,375 | ||||||||||||||
| 11,920,000 | Metropolitan Transportation Authority, New York, Transportation Revenue Bonds, Series 2016C‑1 | 5.250 | 11/15/56 | 11,828,649 | ||||||||||||||
| 200,000 | (a) | New York City Industrial Development Agency, New York, Civic Facility Revenue Bonds, Bronx Parking Development Company, LLC Project, Series 2007 | 2.300 | 10/01/37 | 128,000 | |||||||||||||
| 5,500,000 | (a) | New York City Industrial Development Agency, New York, Civic Facility Revenue Bonds, Bronx Parking Development Company, LLC Project, Series 2007 | 2.350 | 10/01/46 | 3,520,000 | |||||||||||||
| 5,495,000 | New York Liberty Development Corporation, New York, Liberty Revenue Bonds, Secured by Port Authority Consolidated Bonds, Refunding Series 1WTC-2021 - BAM Insured | 4.000 | 02/15/43 | 5,031,057 | ||||||||||||||
| 5,000,000 | New York State Thruway Authority, General Revenue Bonds, Series 2020N | 4.000 | 01/01/42 | 4,549,300 | ||||||||||||||
| 3,000,000 | New York State Thruway Authority, General Revenue Bonds, Series 2020N | 4.000 | 01/01/43 | 2,701,915 | ||||||||||||||
| 2,190,000 | New York State Thruway Authority, General Revenue Junior Indebtedness Obligations, Series 2016A | 5.250 | 01/01/56 | 2,193,557 | ||||||||||||||
| 112 |
See Notes to Financial Statements |
| PRINCIPAL | DESCRIPTION | RATE | MATURITY | VALUE | ||||||||||||||
| |
|
|||||||||||||||||
| TRANSPORTATION (continued) | ||||||||||||||||||
| $ | 1,000,000 | New York Transportation Development Corporation, New York, Special Facilities Bonds, LaGuardia Airport Terminal B Redevelopment Project, Series 2016A, (AMT) | 5.000% | 07/01/46 | $ | 947,185 | ||||||||||||
| 13,895,000 | New York Transportation Development Corporation, New York, Special Facilities Bonds, LaGuardia Airport Terminal B Redevelopment Project, Series 2016A, (AMT) | 5.250 | 01/01/50 | 13,228,943 | ||||||||||||||
| 7,450,000 | New York Transportation Development Corporation, New York, Special Facilities Revenue Bonds, Terminal 6 John F Kennedy International Airport Redevelopment Project, Senior Green Series 2024A, (AMT) | 5.500 | 12/31/60 | 7,212,913 | ||||||||||||||
| 770,000 | New York Transportation Development Corporation, New York, Special Facility Revenue Bonds, American Airlines, Inc. John F Kennedy International Airport Project, Refunding Series 2016, (AMT) | 5.000 | 08/01/26 | 770,021 | ||||||||||||||
| 9,730,000 | New York Transportation Development Corporation, New York, Special Facility Revenue Bonds, American Airlines, Inc. John F Kennedy International Airport Project, Refunding Series 2016, (AMT) | 5.000 | 08/01/31 | 9,730,084 | ||||||||||||||
| 400,000 | New York Transportation Development Corporation, New York, Special Facility Revenue Bonds, American Airlines, Inc. John F Kennedy International Airport Project, Series 2020, (AMT) | 5.375 | 08/01/36 | 408,716 | ||||||||||||||
| 1,340,000 | New York Transportation Development Corporation, New York, Special Facility Revenue Bonds, John F Kennedy International Airport New Terminal 1 Project, Green Series 2023, (AMT) | 6.000 | 06/30/54 | 1,361,598 | ||||||||||||||
| 6,850,000 | New York Transportation Development Corporation, New York, Special Facility Revenue Bonds, John F Kennedy International Airport New Terminal 1 Project, Green Series 2023 - BAM Insured, (AMT) | 5.375 | 06/30/60 | 6,833,437 | ||||||||||||||
| 1,000,000 | New York Transportation Development Corporation, New York, Special Facility Revenue Bonds, John F Kennedy International Airport New Terminal 1 Project, Green Series 2024, (AMT) | 5.500 | 06/30/60 | 962,479 | ||||||||||||||
| 6,950,000 | New York Transportation Development Corporation, New York, Special Facility Revenue Bonds, John F Kennedy International Airport Terminal One Project, Green Series 2025, (AMT) | 6.000 | 06/30/55 | 7,150,689 | ||||||||||||||
| 140,000 | New York Transportation Development Corporation, New York, Special Facility Revenue Bonds, Terminal 4 John F Kennedy International Airport Project, Series 2020A, (AMT) | 4.000 | 12/01/40 | 122,342 | ||||||||||||||
| 1,250,000 | New York Transportation Development Corporation, New York, Special Facility Revenue Bonds, Terminal 4 John F Kennedy International Airport Project, Series 2020C | 5.000 | 12/01/34 | 1,329,434 | ||||||||||||||
| 5,825,000 | New York Transportation Development Corporation, New York, Special Facility Revenue Bonds, Terminal 4 John F Kennedy International Airport Project, Series 2022, (AMT) | 5.000 | 12/01/35 | 6,131,564 | ||||||||||||||
| 8,515,000 | New York Transportation Development Corporation, Special Facility Revenue Bonds, Delta Air Lines, Inc. - LaGuardia Airport Terminals C&D Redevelopment Project, Series 2018, (AMT) | 5.000 | 01/01/27 | 8,661,964 | ||||||||||||||
| 2,000,000 | New York Transportation Development Corporation, Special Facility Revenue Bonds, Delta Air Lines, Inc. - LaGuardia Airport Terminals C&D Redevelopment Project, Series 2018, (AMT) | 5.000 | 01/01/31 | 2,045,068 | ||||||||||||||
| 2,745,000 | New York Transportation Development Corporation, Special Facility Revenue Bonds, Delta Air Lines, Inc. - LaGuardia Airport Terminals C&D Redevelopment Project, Series 2018, (AMT) | 5.000 | 01/01/36 | 2,767,111 | ||||||||||||||
| 3,100,000 | New York Transportation Development Corporation, Special Facility Revenue Bonds, Delta Air Lines, Inc. - LaGuardia Airport Terminals C&D Redevelopment Project, Series 2023, (AMT) | 6.000 | 04/01/35 | 3,363,272 | ||||||||||||||
| 5,000,000 | Port Authority of New York and New Jersey, Consolidated Revenue Bonds, One Hundred Ninety-Eighth Series 2016 | 5.250 | 11/15/56 | 5,024,732 | ||||||||||||||
| 3,975,000 | Port Authority of New York and New Jersey, Consolidated Revenue Bonds, Two Hundred Fifth Series 2017 | 5.000 | 11/15/47 | 3,994,138 | ||||||||||||||
| 4,000,000 | Port Authority of New York and New Jersey, Consolidated Revenue Bonds, Two Hundred Forty Second Series 2023, (AMT) | 5.000 | 12/01/53 | 3,958,714 | ||||||||||||||
| 5,000,000 | Port Authority of New York and New Jersey, Consolidated Revenue Bonds, Two Hundred Twentieth Series 2019, (AMT) | 4.000 | 11/01/59 | 3,977,109 | ||||||||||||||
| 2,810,000 | Port Authority of New York and New Jersey, Consolidated Revenue Bonds, Two Hundred Twenty‑One Series 2020, (AMT) | 4.000 | 07/15/55 | 2,275,729 | ||||||||||||||
| See Notes to Financial Statements |
113 |
Portfolio of Investments August 31, 2025 (continued)
NAN
| PRINCIPAL | DESCRIPTION | RATE | MATURITY | VALUE | ||||||||||||||
| |
|
|||||||||||||||||
| TRANSPORTATION (continued) | ||||||||||||||||||
| $ | 5,340,000 | Triborough Bridge and Tunnel Authority, New York, General Purpose Revenue Bonds, MTA Bridges & Tunnels, Series 2017A | 5.000% | 11/15/47 | $ | 5,341,004 | ||||||||||||
| 3,500,000 | Triborough Bridge and Tunnel Authority, New York, General Purpose Revenue Bonds, Refunding Subordinate Lien Series 2017A2 | 5.000 | 11/15/42 | 3,521,820 | ||||||||||||||
| 3,000,000 | Triborough Bridge and Tunnel Authority, New York, General Revenue Bonds, MTA Bridges & Tunnels, Series 2020A | 4.000 | 11/15/54 | 2,543,253 | ||||||||||||||
| 10,000,000 | Triborough Bridge and Tunnel Authority, New York, General Revenue Bonds, MTA Bridges & Tunnels, Series 2022A | 4.000 | 11/15/52 | 8,563,243 | ||||||||||||||
| |
|
|||||||||||||||||
| TOTAL TRANSPORTATION | 161,358,210 | |||||||||||||||||
| |
||||||||||||||||||
| U.S. GUARANTEED - 0.0% (d)(0.0% of Total Investments) | ||||||||||||||||||
| 5,000 | Dormitory Authority of the State of New York, State Personal Income Tax Revenue Bonds, General Purpose, Series 2019A, (Pre‑refunded 3/15/29) | 4.000 | 03/15/49 | 5,290 | ||||||||||||||
| |
|
|||||||||||||||||
| TOTAL U.S. GUARANTEED | 5,290 | |||||||||||||||||
| |
||||||||||||||||||
| UTILITIES - 10.3% (6.0% of Total Investments) | ||||||||||||||||||
| 2,945,000 | Long Island Power Authority, New York, Electric System General Revenue Bonds, Green Series 2023E | 5.000 | 09/01/53 | 2,951,025 | ||||||||||||||
| 1,310,000 | Long Island Power Authority, New York, Electric System General Revenue Bonds, Series 2016B | 5.000 | 09/01/46 | 1,310,009 | ||||||||||||||
| 90,000 | Long Island Power Authority, New York, Electric System General Revenue Bonds, Series 2017 | 5.000 | 09/01/42 | 90,867 | ||||||||||||||
| 5,000,000 | New York City Municipal Water Finance Authority, New York, Water and Sewer System Second General Resolution Revenue Bonds, Fiscal 2025 Series BB | 5.250 | 06/15/55 | 5,161,880 | ||||||||||||||
| 4,080,000 | New York State Environmental Facilities Corporation, State Clean Water and Drinking Water Revolving Funds Revenue Bonds, New York City Municipal Water Finance Authority Projects-Second Resolution Bonds, Subordinated SRF Series 2017A | 5.000 | 06/15/46 | 4,104,314 | ||||||||||||||
| 7,500,000 | New York State Environmental Facilities Corporation, State Clean Water and Drinking Water Revolving Funds Revenue Bonds, New York City Municipal Water Finance Authority Projects-Second Resolution Bonds, Subordinated SRF Series 2017E | 5.000 | 06/15/47 | 7,542,514 | ||||||||||||||
| 2,740,000 | New York State Power Authority, General Revenue Bonds, Green Series 2024A | 4.000 | 11/15/54 | 2,332,273 | ||||||||||||||
| 5,000,000 | New York State Power Authority, General Revenue Bonds, Series 2020A | 4.000 | 11/15/55 | 4,224,438 | ||||||||||||||
| 2,270,000 | New York State Power Authority, Green Transmission Project Revenue Bonds, Green Series 2023A - AGM Insured | 5.000 | 11/15/48 | 2,303,333 | ||||||||||||||
| 1,920,000 | (b) | Niagara Area Development Corporation, New York, Solid Waste Disposal Facility Revenue Refunding Bonds, Covanta Energy Project, Series 2018A, (AMT) | 4.750 | 11/01/42 | 1,697,436 | |||||||||||||
| 1,940,000 | (b) | Puerto Rico Aqueduct and Sewerage Authority, Revenue Bonds, Refunding Senior Lien Series 2020A | 5.000 | 07/01/47 | 1,814,838 | |||||||||||||
| 1,250,000 | Utility Debt Securitization Authority, New York, Restructuring Bonds, Series 2017 | 5.000 | 12/15/38 | 1,282,052 | ||||||||||||||
| |
|
|||||||||||||||||
| TOTAL UTILITIES | 34,814,979 | |||||||||||||||||
| |
||||||||||||||||||
| TOTAL MUNICIPAL BONDS (Cost $600,913,377) |
576,956,857 | |||||||||||||||||
| |
||||||||||||||||||
| TOTAL LONG-TERM INVESTMENTS (Cost $600,913,377) |
576,956,857 | |||||||||||||||||
| |
||||||||||||||||||
| FLOATING RATE OBLIGATIONS - (8.5)% | (28,840,000) | |||||||||||||||||
| |
||||||||||||||||||
| AMTP SHARES, NET - (37.6)% (e) | (126,968,403) | |||||||||||||||||
| |
||||||||||||||||||
| VRDP SHARES, NET - (26.2)% (f) | (88,341,245) | |||||||||||||||||
| |
||||||||||||||||||
| OTHER ASSETS & LIABILITIES, NET - 1.5% | 4,938,714 | |||||||||||||||||
| |
||||||||||||||||||
| NET ASSETS APPLICABLE TO COMMON SHARES - 100% | $ | 337,745,923 | ||||||||||||||||
| |
||||||||||||||||||
All percentages shown in the Portfolio of Investments are based on net assets applicable to common shares unless otherwise noted.
| AMT | Alternative Minimum Tax | |
| UB | Underlying bond of an inverse floating rate trust reflected as a financing transaction. Inverse floating rate trust is a Recourse Trust unless otherwise noted. | |
| 114 |
See Notes to Financial Statements |
| (a) | Defaulted security. A security whose issuer has failed to fully pay principal and/or interest when due, or is under the protection of bankruptcy. | |
| (b) | Security is exempt from registration under Rule 144A of the Securities Act of 1933, as amended. These securities are deemed liquid and may be resold in transactions exempt from registration, which are normally those transactions with qualified institutional buyers. As of the end of the reporting period, the aggregate value of these securities is $31,057,058 or 5.4% of Total Investments. | |
| (c) | Investment, or portion of investment, has been pledged to collateralize the net payment obligations for investments in inverse floating rate transactions. | |
| (d) | Backed by an escrow or trust containing sufficient U.S. Government or U.S. Government agency securities, which ensure the timely payment of principal and interest. | |
| (e) | AMTP Shares, Net as a percentage of Total Investments is 22.0%. | |
| (f) | VRDP Shares, Net as a percentage of Total Investments is 15.3%. | |
| See Notes to Financial Statements |
115 |
Portfolio of Investments August 31, 2025
NQP
| PRINCIPAL | DESCRIPTION | RATE | MATURITY | VALUE | ||||||||||||
| LONG-TERM INVESTMENTS - 168.4% (100.0% of Total Investments) | ||||||||||||||||
| MUNICIPAL BONDS - 168.4% (100.0% of Total Investments) | ||||||||||||||||
| CONSUMER STAPLES - 0.5% (0.3% of Total Investments) | ||||||||||||||||
| $ | 2,000,000 | Pennsylvania Economic Development Financing Authority, Solid Waste Disposal Revenue Bonds, Procter & Gamble Paper Project, Series 2001, (AMT) | 5.375% | 03/01/31 | $ | 2,229,307 | ||||||||||
| TOTAL CONSUMER STAPLES | 2,229,307 | |||||||||||||||
| EDUCATION AND CIVIC ORGANIZATIONS - 20.9% (12.4% of Total Investments) | ||||||||||||||||
| 20,000 | Berks County Municipal Authority, Pennsylvania, Revenue Bonds, Alvernia University Project, Series 2020 | 5.000 | 10/01/49 | 16,019 | ||||||||||||
| 3,215,000 | Bucks County Industrial Development Authority, Pennsylvania, Revenue Bonds, School Lane Charter School Project, Series 2016 | 5.125 | 03/15/36 | 3,230,960 | ||||||||||||
| 835,000 | Chester County Industrial Development Authority, Pennsylvania, Avon Grove Charter School Revenue Bonds, Series 2017A | 5.000 | 12/15/47 | 762,875 | ||||||||||||
| 1,000,000 | (a) | Chester County Industrial Development Authority, Pennsylvania, Revenue Bonds, Collegium Charter School Project, Series 2022 | 6.000 | 10/15/52 | 948,835 | |||||||||||
| 2,200,000 | Crawford County Industrial Development Authority, Pennsylvania, College Revenue Bonds, Allegheny College, Series 2016 | 3.000 | 05/01/34 | 1,920,878 | ||||||||||||
| 1,000,000 | Cumberland County Municipal Authority, Pennsylvania, Revenue Bonds, Dickinson College Project, Second Series 2017A | 5.000 | 11/01/39 | 1,017,578 | ||||||||||||
| 1,230,000 | Dallas Area Municipal Authority, Pennsylvania, Revenue Bonds, Misericordia University Project, Series 2019 | 5.000 | 05/01/48 | 1,041,572 | ||||||||||||
| 720,000 | Dallas Area Municipal Authority, Pennsylvania, Revenue Bonds, Misericordia University, Series 2014 | 5.000 | 05/01/37 | 688,560 | ||||||||||||
| 4,595,000 | Erie Higher Education Building Authority, Pennsylvania, Revenue Bonds, Gannon University, Series 2016 | 4.000 | 05/01/46 | 3,580,342 | ||||||||||||
| 1,350,000 | General Authority of Southcentral Pennsylvania, Revenue Bonds, AICUP Financing Program-York College of Pennsylvania, Series 2017 PP4 | 3.375 | 11/01/37 | 1,217,970 | ||||||||||||
| 590,000 | Huntingdon County General Authority, Pennsylvania, Revenue Bonds, Juniata College, Series 2016OO2 | 3.250 | 05/01/36 | 515,978 | ||||||||||||
| 1,555,000 | Huntingdon County General Authority, Pennsylvania, Revenue Bonds, Juniata College, Series 2016OO2 | 3.500 | 05/01/41 | 1,230,629 | ||||||||||||
| 1,515,000 | Indiana County Industrial Development Authority, Pennsylvania, Revenue Bonds, Foundation for Indiana University of Pennsylvania Project, Refunding Series 2022 - BAM Insured | 4.000 | 05/01/54 | 1,297,930 | ||||||||||||
| 350,000 | Lackawanna County Industrial Development Authority, Pennsylvania, Revenue Bonds, University of Scranton, Series 2017 | 3.375 | 11/01/33 | 335,206 | ||||||||||||
| 2,925,000 | Lackawanna County Industrial Development Authority, Pennsylvania, Revenue Bonds, University of Scranton, Series 2017 | 4.000 | 11/01/40 | 2,637,372 | ||||||||||||
| 985,000 | Lehigh County, Pennsylvania, Revenue Bonds, Lehigh Valley Dual Language Charter School, General Purpose Authority, Series 2023 | 7.000 | 06/01/53 | 1,025,649 | ||||||||||||
| 2,000,000 | McCandless Industrial Development Authority, Pennsylvania, University Revenue Bonds, La Roche university, Series 2022A | 6.750 | 12/01/46 | 1,756,032 | ||||||||||||
| 1,005,000 | Pennsylvania Economic Development Financing Authority, Pennsylvania, Revenue Bonds, Villanova University Project, Series 2024 | 4.000 | 08/01/54 | 853,718 | ||||||||||||
| 9,660,000 | (b) | Pennsylvania Economic Development Financing Authority, Pennsylvania, Revenue Bonds, Villanova University Project, Series 2024, (UB) | 4.000 | 08/01/54 | 8,205,880 | |||||||||||
| 1,060,000 | Pennsylvania Higher Education Assistance Agency, Education Loan Revenue Bonds, Senior Series 2021A, (AMT) | 2.625 | 06/01/42 | 939,902 | ||||||||||||
| 1,945,000 | Pennsylvania Higher Education Assistance Agency, Education Loan Revenue Bonds, Senior Series 2022A, (AMT) | 4.500 | 06/01/43 | 1,954,601 | ||||||||||||
| 1,095,000 | Pennsylvania Higher Education Assistance Agency, Education Loan Revenue Bonds, Senior Series 2023A, (AMT) | 4.000 | 06/01/44 | 1,073,728 | ||||||||||||
| 2,545,000 | Pennsylvania Higher Educational Facilities Authority, Revenue Bonds, Bryn Mawr College, Refunding Series 2014 | 5.000 | 12/01/38 | 2,546,801 | ||||||||||||
| 2,080,000 | Pennsylvania Higher Educational Facilities Authority, Revenue Bonds, Bryn Mawr College, Refunding Series 2014 | 5.000 | 12/01/44 | 2,080,678 | ||||||||||||
| 360,000 | Pennsylvania Higher Educational Facilities Authority, Revenue Bonds, LaSalle University, Series 2012 | 4.000 | 05/01/32 | 296,587 | ||||||||||||
| 116 |
See Notes to Financial Statements |
| PRINCIPAL | DESCRIPTION | RATE | MATURITY | VALUE | ||||||||||||
| EDUCATION AND CIVIC ORGANIZATIONS (continued) | ||||||||||||||||
| $ 5,750,000 | (b) | Pennsylvania Higher Educational Facilities Authority, Revenue Bonds, University of Pennsylvania Trustees, Series 2025A, (UB) | 4.250% | 02/15/55 | $ | 5,125,820 | ||||||||||
| 1,030,000 | Pennsylvania Higher Educational Facilities Authority, Revenue Bonds, University of the Sciences in Philadelphia, Series 2012 | 4.000 | 11/01/39 | 909,547 | ||||||||||||
| 4,300,000 | Pennsylvania Higher Educational Facilities Authority, Revenue Bonds, University of the Sciences in Philadelphia, Series 2012 | 5.000 | 11/01/42 | 4,188,601 | ||||||||||||
| 1,310,000 | Pennsylvania Higher Educational Facilities Authority, Revenue Bonds, University of the Sciences in Philadelphia, Series 2015A | 5.000 | 11/01/36 | 1,310,387 | ||||||||||||
| 1,440,000 | Pennsylvania Higher Educational Facilities Authority, Revenue Bonds, Widener University, Series 2021A | 4.000 | 07/15/46 | 1,139,517 | ||||||||||||
| 10,680,000 | Pennsylvania State University, Revenue Bonds, Series 2022A | 5.000 | 09/01/47 | 10,870,393 | ||||||||||||
| 1,000,000 | Pennsylvania State University, Revenue Bonds, Series 2023 | 5.250 | 09/01/48 | 1,038,659 | ||||||||||||
| 2,000,000 | Pennsylvania State University, Revenue Bonds, Series 2023 | 5.250 | 09/01/53 | 2,062,053 | ||||||||||||
| 2,000,000 | Pennsylvania State University, Revenue Bonds, Series 2024 | 5.000 | 09/01/49 | 2,040,662 | ||||||||||||
| 1,255,000 | Philadelphia Authority for Industrial Development, Pennsylvania, Revenue Bonds, La Salle University, Series 2017 | 3.625 | 05/01/35 | 905,112 | ||||||||||||
| 425,000 | Philadelphia Authority for Industrial Development, Pennsylvania, Revenue Bonds, Richard Allen Preparatory Charter School, Series 2006 | 6.250 | 05/01/33 | 425,107 | ||||||||||||
| 1,500,000 | Philadelphia Authority for Industrial Development, Pennsylvania, Revenue Bonds, Saint Joseph’s University Project, Refunding Forward Delivery Series 2020C | 4.000 | 11/01/36 | 1,410,738 | ||||||||||||
| 1,400,000 | Philadelphia Authority for Industrial Development, Pennsylvania, Revenue Bonds, Saint Joseph’s University Project, Refunding Forward Delivery Series 2020C | 4.000 | 11/01/37 | 1,293,736 | ||||||||||||
| 2,010,000 | Philadelphia Authority for Industrial Development, Pennsylvania, Revenue Bonds, Saint Joseph’s University Project, Refunding Series 2020A | 4.000 | 11/01/45 | 1,632,734 | ||||||||||||
| 3,000,000 | Philadelphia Authority for Industrial Development, Pennsylvania, Revenue Bonds, Saint Joseph’s University Project, Series 2022 | 5.500 | 11/01/60 | 3,040,505 | ||||||||||||
| 927,263 | (a),(c) | Philadelphia Authority for Industrial Development, Pennsylvania, Revenue Bonds, University of the Arts, Series 2017 | 1.750 | 03/15/45 | 463,631 | |||||||||||
| 2,320,000 | Scranton-Lackawanna Health and Welfare Authority, Pennsylvania, Revenue Bonds, University of Scranton, Series 2016 | 5.000 | 11/01/37 | 2,331,990 | ||||||||||||
| 5,250,000 | Scranton-Lackawanna Health and Welfare Authority, Pennsylvania, University Revenue Bonds, Marywood University, Series 2016 | 5.000 | 06/01/46 | 4,250,747 | ||||||||||||
| 3,555,000 | Washington County Industrial Development Authority, Pennsylvania, College Revenue Bonds, AICUP Financing Program-Washington and Jefferson College Project, Series 2017‑PP5 | 3.375 | 11/01/36 | 3,079,421 | ||||||||||||
| 1,890,000 | Wilkes-Barre Finance Authority, Pennsylvania, Revenue Bonds, University of Scranton, Series 2015A | 5.000 | 11/01/32 | 1,897,795 | ||||||||||||
| 740,000 | Wilkes-Barre Finance Authority, Pennsylvania, Revenue Bonds, University of Scranton, Series 2015A | 5.000 | 11/01/33 | 743,052 | ||||||||||||
| 675,000 | Wilkes-Barre Finance Authority, Pennsylvania, Revenue Bonds, University of Scranton, Series 2015A | 4.000 | 11/01/35 | 676,655 | ||||||||||||
| TOTAL EDUCATION AND CIVIC ORGANIZATIONS | 92,013,142 | |||||||||||||||
| ENERGY - 0.1% (0.1% of Total Investments) | ||||||||||||||||
| 600,000 | (a) | Pennsylvania Economic Development Financing Authority, Solid Waste Disposal Revenue Bonds, Core Natural Resources Inc., Project, Series 2025, (AMT), (Mandatory Put 3/27/35) | 5.450 | 01/01/51 | 611,105 | |||||||||||
| TOTAL ENERGY | 611,105 | |||||||||||||||
| HEALTH CARE - 26.8% (15.9% of Total Investments) | ||||||||||||||||
| 4,420,000 | Allegheny County Hospital Development Authority, Pennsylvania, Revenue Bonds, Allegheny Health Network Obligated Group Issue, Series 2018A | 4.000 | 04/01/44 | 3,819,640 | ||||||||||||
| 13,100,000 | Allegheny County Hospital Development Authority, Pennsylvania, Revenue Bonds, Allegheny Health Network Obligated Group Issue, Series 2018A | 4.000 | 04/01/44 | 11,620,356 | ||||||||||||
| 210,000 | Allegheny County Hospital Development Authority, Pennsylvania, Revenue Bonds, University of Pittsburgh Medical Center, Series 2019A | 4.000 | 07/15/35 | 206,653 | ||||||||||||
| See Notes to Financial Statements |
117 |
Portfolio of Investments August 31, 2025 (continued)
NQP
| PRINCIPAL | DESCRIPTION | RATE | MATURITY | VALUE | ||||||||||||
| HEALTH CARE (continued) | ||||||||||||||||
| $ 2,285,000 | Allegheny County Hospital Development Authority, Pennsylvania, Revenue Bonds, University of Pittsburgh Medical Center, Series 2019A | 4.000% | 07/15/36 | $ | 2,215,951 | |||||||||||
| 610,000 | Berks County Municipal Authority, Pennsylvania, Revenue Bonds, Tower Health Project, Series 2024A‑2 | 6.000 | 06/30/34 | 634,824 | ||||||||||||
| 8,187,000 | Berks County Municipal Authority, Pennsylvania, Revenue Bonds, Tower Health Project, Series 2024A‑3 | 5.000 | 06/30/39 | 7,335,109 | ||||||||||||
| 4,091,000 | (d) | Berks County Municipal Authority, Pennsylvania, Revenue Bonds, Tower Health Project, Series 2024B‑1 | 0.000 | 06/30/44 | 2,870,334 | |||||||||||
| 1,282,000 | Berks County Municipal Authority, Pennsylvania, Revenue Bonds, Tower Health Project, Taxable Series 2024A‑1 | 8.000 | 06/30/34 | 1,311,902 | ||||||||||||
| 10,170,000 | Bucks County Industrial Development Authority, Pennsylvania, Hospital Revenue Bonds, Saint Luke’s University Health Network Project, Series 2021 - BAM Insured | 3.000 | 08/15/53 | 6,916,139 | ||||||||||||
| 2,000,000 | Butler County Hospital Authority, Pennsylvania, Hospital Revenue Bonds, Butler Health System Project, Series 2015A | 5.000 | 07/01/39 | 1,802,149 | ||||||||||||
| 2,470,000 | Chester County Health and Education Facilities Authority, Pennsylvania, Health System Revenue Bonds, Main Line Health System, Series 2017A | 4.000 | 10/01/36 | 2,470,603 | ||||||||||||
| 1,580,000 | Chester County Health and Education Facilities Authority, Pennsylvania, Health System Revenue Bonds, Main Line Health System, Series 2017A | 4.000 | 10/01/37 | 1,543,608 | ||||||||||||
| 2,995,000 | Chester County Health and Education Facilities Authority, Pennsylvania, Health System Revenue Bonds, Main Line Health System, Series 2017A | 4.000 | 10/01/47 | 2,536,895 | ||||||||||||
| 1,500,000 | Cumberland County Municipal Authority, Pennsylvania, Revenue Bonds, Penn State Health, Series 2019 | 4.000 | 11/01/49 | 1,210,705 | ||||||||||||
| 1,845,000 | Doylestown Hospital Authority, Pennsylvania, Hospital Revenue Bonds, Series 2016A. Unenhanced Cusips | 5.000 | 07/01/41 | 1,849,480 | ||||||||||||
| 1,105,000 | Doylestown Hospital Authority, Pennsylvania, Hospital Revenue Bonds, Series 2019A. Enhanced Cusips | 4.000 | 07/01/45 | 969,456 | ||||||||||||
| 1,350,000 | Doylestown Hospital Authority, Pennsylvania, Hospital Revenue Bonds, Series 2019A. Enhanced Cusips | 5.000 | 07/01/49 | 1,341,351 | ||||||||||||
| 2,290,000 | Dubois Hospital Authority, Pennsylvania, Hospital Revenue Bonds, Penn Highlands Healthcare, Series 2018 | 5.000 | 07/15/48 | 1,952,768 | ||||||||||||
| 3,215,000 | Geisinger Authority, Montour County, Pennsylvania, Health System Revenue Bonds, Geisinger Health System, Series 2014A | 5.000 | 06/01/41 | 3,215,249 | ||||||||||||
| 1,650,000 | Lancaster County Hospital Authority, Pennsylvania, Revenue Bonds, Penn State Health, Series 2021 | 5.000 | 11/01/51 | 1,603,749 | ||||||||||||
| 2,200,000 | Lancaster County Hospital Authority, Revenue Bonds, University of Pennsylvania Health System, Refunding Series 2016B | 5.000 | 08/15/46 | 2,200,087 | ||||||||||||
| 3,000,000 | Lancaster County Hospital Authority, Revenue Bonds, University of Pennsylvania Health System, Series 2016A | 5.000 | 08/15/42 | 3,006,968 | ||||||||||||
| 1,490,000 | Lehigh County General Purpose Authority, Pennsylvania, Hospital Revenue Bonds, Lehigh Valley Health Network, Series 2012B | 4.000 | 07/01/43 | 1,292,047 | ||||||||||||
| 1,855,000 | Lehigh County General Purpose Authority, Pennsylvania, Hospital Revenue Bonds, Lehigh Valley Health Network, Series 2019A | 5.000 | 07/01/44 | 1,808,924 | ||||||||||||
| 1,265,000 | Lehigh County General Purpose Authority, Pennsylvania, Revenue Bonds, Good Shepherd Group, Refunding Series 2016 | 3.000 | 11/01/36 | 1,045,279 | ||||||||||||
| 2,850,000 | Lehigh County General Purpose Authority, Pennsylvania, Revenue Bonds, Good Shepherd Group, Refunding Series 2016 | 4.000 | 11/01/41 | 2,367,060 | ||||||||||||
| 4,955,000 | Lehigh County General Purpose Authority, Pennsylvania, Revenue Bonds, Good Shepherd Group, Refunding Series 2016 | 4.000 | 11/01/46 | 3,909,690 | ||||||||||||
| 1,020,000 | Monroe County Hospital Authority, Pennsylvania, Hospital Revenue Bonds, Pocono Medical Center, Series 2016 | 3.375 | 07/01/32 | 1,013,323 | ||||||||||||
| 2,675,000 | Montgomery County Higher Education and Health Authority, Pennsylvania, Revenue Bonds, Thomas Jefferson University, Series 2018A | 4.000 | 09/01/38 | 2,494,789 | ||||||||||||
| 2,590,000 | Montgomery County Higher Education and Health Authority, Pennsylvania, Revenue Bonds, Thomas Jefferson University, Series 2019 - BAM Insured | 4.000 | 09/01/44 | 2,360,274 | ||||||||||||
| 1,015,000 | Montgomery County Higher Education and Health Authority, Pennsylvania, Revenue Bonds, Thomas Jefferson University, Series 2019 | 4.000 | 09/01/49 | 815,762 | ||||||||||||
| 118 |
See Notes to Financial Statements |
| PRINCIPAL | DESCRIPTION | RATE | MATURITY | VALUE | ||||||||||||
| HEALTH CARE (continued) | ||||||||||||||||
| $ 3,400,000 | Montgomery County Higher Education and Health Authority, Pennsylvania, Revenue Bonds, Thomas Jefferson University, Series 2022B | 4.000% | 05/01/56 | $ | 2,681,866 | |||||||||||
| 200,000 | Pennsylvania Economic Development Financing Authority, Revenue Bonds, University of Pittsburgh Medical Center, Fixed Rate Series 2023A-2 | 4.000 | 05/15/48 | 169,334 | ||||||||||||
| 4,750,000 | Pennsylvania Economic Development Financing Authority, Revenue Bonds, University of Pittsburgh Medical Center, Series 2020A | 4.000 | 04/15/50 | 3,954,973 | ||||||||||||
| 2,095,000 | Pennsylvania Higher Educational Facilities Authority, Revenue Bonds, Thomas Jefferson University, Series 2024B-1 | 4.250 | 11/01/51 | 1,853,447 | ||||||||||||
| 14,445,000 | Pennsylvania Higher Educational Facilities Authority, Revenue Bonds, University of Pennsylvania Health System, Refunding Series 2016C | 4.000 | 08/15/41 | 13,630,756 | ||||||||||||
| 3,600,000 | Pennsylvania Higher Educational Facilities Authority, Revenue Bonds, University of Pennsylvania Health System, Series 2019 | 4.000 | 08/15/49 | 3,043,031 | ||||||||||||
| 1,800,000 | Philadelphia Hospitals and Higher Education Facilities Authority, Pennsylvania, Hospital Revenue Bonds, Temple University Health System Obligated Group, Series of 2017 | 5.000 | 07/01/30 | 1,840,020 | ||||||||||||
| 2,990,000 | Pocono Mountains Industrial Park Authority, Pennsylvania, Hospital Revenue Bonds, Saint Luke’s Hospital -Monroe Project, Series 2015A | 5.000 | 08/15/40 | 2,990,257 | ||||||||||||
| 1,170,000 | Pocono Mountains Industrial Park Authority, Pennsylvania, Hospital Revenue Bonds, Saint Luke’s Hospital -Monroe Project, Series 2015A | 4.000 | 08/15/45 | 998,472 | ||||||||||||
| 1,520,000 | Pottsville Hospital Authority, Pennsylvania, Hospital Revenue Bonds, Lehigh Valley Health Network, Series 2016B | 5.000 | 07/01/45 | 1,489,601 | ||||||||||||
| 1,305,000 | Southcentral Pennsylvania General Authority, Revenue Bonds, Wellspan Health Obligated Group, Series 2019A | 5.000 | 06/01/49 | 1,286,352 | ||||||||||||
| 3,500,000 | Union County Hospital Authority, Pennsylvania, Hospital Revenue Bonds, Evangelical Community Hospital Project, Series 2018B | 5.000 | 08/01/48 | 3,346,728 | ||||||||||||
| 705,000 | Westmoreland County Industrial Development Authority, Pennsylvania, Revenue Bonds, Excela Health Project, Series 2020A | 4.000 | 07/01/37 | 652,938 | ||||||||||||
| TOTAL HEALTH CARE | 117,678,899 | |||||||||||||||
| HOUSING/MULTIFAMILY - 0.6% (0.4% of Total Investments) | ||||||||||||||||
| 160,000 | Chester County Industrial Development Authority, Pennsylvania, Student Housing Revenue Bonds, University Student Housing, LLC Project at West Chester University Series 2013A | 5.000 | 08/01/45 | 141,288 | ||||||||||||
| 1,285,000 | (a) | Erie County, Industrial Development Authority, Pennsylvania, Essential Housing Revenue Bonds, Senior-CFC-Erie I LLC Erie Apartments, Series 2024A | 6.750 | 09/01/61 | 1,203,210 | |||||||||||
| 270,000 | Pennsylvania Higher Educational Facilities Authority, Revenue Bonds, University Properties Inc. Student Housing Project at East Stroudsburg University of Pennsylvania, Series 2016A | 5.000 | 07/01/31 | 270,239 | ||||||||||||
| 1,200,000 | Philadelphia Authority for Industrial Development, Pennsylvania, Multifamily Housing Revenue Bonds, Presbyterian Homes Germantown - Morrisville Project, Series 2005A | 5.625 | 07/01/35 | 1,222,629 | ||||||||||||
| TOTAL HOUSING/MULTIFAMILY | 2,837,366 | |||||||||||||||
| HOUSING/SINGLE FAMILY - 25.0% (14.8% of Total Investments) | ||||||||||||||||
| 2,560,000 | Pennsylvania Housing Finance Agency, Single Family Mortgage Revenue Bonds, Series 2015-117B | 3.900 | 10/01/35 | 2,550,344 | ||||||||||||
| 4,890,000 | Pennsylvania Housing Finance Agency, Single Family Mortgage Revenue Bonds, Series 2016-120 | 3.200 | 04/01/40 | 4,061,349 | ||||||||||||
| 20,335,000 | Pennsylvania Housing Finance Agency, Single Family Mortgage Revenue Bonds, Series 2016-121 | 3.200 | 10/01/41 | 16,584,293 | ||||||||||||
| 1,080,000 | Pennsylvania Housing Finance Agency, Single Family Mortgage Revenue Bonds, Series 2017-122 | 3.650 | 10/01/32 | 1,080,406 | ||||||||||||
| 3,895,000 | Pennsylvania Housing Finance Agency, Single Family Mortgage Revenue Bonds, Series 2017-123B | 3.450 | 10/01/32 | 3,899,021 | ||||||||||||
| 7,000,000 | Pennsylvania Housing Finance Agency, Single Family Mortgage Revenue Bonds, Series 2017-124B | 3.500 | 10/01/37 | 6,466,991 | ||||||||||||
| 2,000,000 | Pennsylvania Housing Finance Agency, Single Family Mortgage Revenue Bonds, Series 2019-130A | 2.700 | 10/01/39 | 1,614,728 | ||||||||||||
| See Notes to Financial Statements |
119 |
Portfolio of Investments August 31, 2025 (continued)
NQP
| PRINCIPAL | DESCRIPTION | RATE | MATURITY | VALUE | ||||||||||||
| HOUSING/SINGLE FAMILY (continued) | ||||||||||||||||
| $ 1,000,000 | Pennsylvania Housing Finance Agency, Single Family Mortgage Revenue Bonds, Series 2019-130A | 3.000% | 10/01/46 | $ | 717,597 | |||||||||||
| 1,380,000 | Pennsylvania Housing Finance Agency, Single Family Mortgage Revenue Bonds, Series 2019-131A | 3.000 | 10/01/39 | 1,145,126 | ||||||||||||
| 12,000,000 | Pennsylvania Housing Finance Agency, Single Family Mortgage Revenue Bonds, Series 2020-132A | 2.550 | 10/01/41 | 8,854,075 | ||||||||||||
| 1,500,000 | Pennsylvania Housing Finance Agency, Single Family Mortgage Revenue Bonds, Series 2020-133 | 2.350 | 10/01/40 | 1,100,524 | ||||||||||||
| 1,450,000 | Pennsylvania Housing Finance Agency, Single Family Mortgage Revenue Bonds, Series 2020-133 | 2.500 | 10/01/45 | 967,792 | ||||||||||||
| 4,105,000 | (b) | Pennsylvania Housing Finance Agency, Single Family Mortgage Revenue Bonds, Series 2023-141A, (UB) | 4.600 | 10/01/43 | 3,947,017 | |||||||||||
| 5,000,000 | (b) | Pennsylvania Housing Finance Agency, Single Family Mortgage Revenue Bonds, Series 2023-141A, (UB) | 4.700 | 10/01/46 | 4,794,027 | |||||||||||
| 5,000,000 | Pennsylvania Housing Finance Agency, Single Family Mortgage Revenue Bonds, Social Series 2021-134A | 1.850 | 04/01/36 | 3,758,992 | ||||||||||||
| 3,650,000 | Pennsylvania Housing Finance Agency, Single Family Mortgage Revenue Bonds, Social Series 2021-134A | 2.050 | 04/01/41 | 2,500,073 | ||||||||||||
| 2,505,000 | Pennsylvania Housing Finance Agency, Single Family Mortgage Revenue Bonds, Social Series 2021-134A | 2.100 | 10/01/43 | 1,616,726 | ||||||||||||
| 5,295,000 | Pennsylvania Housing Finance Agency, Single Family Mortgage Revenue Bonds, Social Series 2021-135A | 2.250 | 10/01/41 | 3,722,039 | ||||||||||||
| 6,855,000 | Pennsylvania Housing Finance Agency, Single Family Mortgage Revenue Bonds, Social Series 2021-135A | 2.375 | 10/01/46 | 4,532,439 | ||||||||||||
| 7,705,000 | Pennsylvania Housing Finance Agency, Single Family Mortgage Revenue Bonds, Social Series 2021-135A | 2.500 | 10/01/50 | 4,943,286 | ||||||||||||
| 1,565,000 | Pennsylvania Housing Finance Agency, Single Family Mortgage Revenue Bonds, Social Series 2021-136 | 2.550 | 10/01/51 | 995,140 | ||||||||||||
| 5,240,000 | Pennsylvania Housing Finance Agency, Single Family Mortgage Revenue Bonds, Social Series 2021-137 | 2.450 | 10/01/41 | 3,828,573 | ||||||||||||
| 6,545,000 | Pennsylvania Housing Finance Agency, Single Family Mortgage Revenue Bonds, Social Series 2021-137 | 2.600 | 04/01/46 | 4,416,202 | ||||||||||||
| 3,335,000 | Pennsylvania Housing Finance Agency, Single Family Mortgage Revenue Bonds, Social Series 2022-138A | 3.000 | 04/01/42 | 2,645,113 | ||||||||||||
| 2,410,000 | Pennsylvania Housing Finance Agency, Single Family Mortgage Revenue Bonds, Social Series 2022-139A | 4.150 | 10/01/42 | 2,208,638 | ||||||||||||
| 1,980,000 | Pennsylvania Housing Finance Agency, Single Family Mortgage Revenue Bonds, Social Series 2022-140A | 4.450 | 10/01/47 | 1,813,654 | ||||||||||||
| 10,000,000 | (b) | Pennsylvania Housing Finance Agency, Single Family Mortgage Revenue Bonds, Social Series 2023-142A, (UB) | 4.900 | 10/01/46 | 9,882,553 | |||||||||||
| 5,595,000 | Pennsylvania Housing Finance Agency, Single Family Mortgage Revenue Bonds, Social Series 2025-148A |
4.625 | 10/01/45 | 5,301,819 | ||||||||||||
| TOTAL HOUSING/SINGLE FAMILY | 109,948,537 | |||||||||||||||
| INDUSTRIALS - 2.4% (1.4% of Total Investments) | ||||||||||||||||
| 500,000 | (a),(c),(e) | Pennsylvania Economic Development Financing Authority, Exempt Facilities Revenue Bonds, KDC Agribusiness Fairless Hills LLC Project, Series 2020A-1 | 10.000 | 12/01/40 | 50 | |||||||||||
| 500,000 | (a),(c),(e) | Pennsylvania Economic Development Financing Authority, Exempt Facilities Revenue Bonds, KDC Agribusiness Fairless Hills LLC Project, Series 2020A-2, (AMT) | 10.000 | 12/01/40 | 50 | |||||||||||
| 6,455,000 | Pennsylvania Economic Development Financing Authority, Exempt Facilities Revenue Bonds, National Gypsum Company, Refunding Series 2014, (AMT) | 5.500 | 11/01/44 | 6,454,560 | ||||||||||||
| 3,880,000 | Pennsylvania Economic Development Financing Authority, Solid Waste Disposal Revenue Bonds, Waste Management Inc., Project, Series 2011, (AMT), (Mandatory Put 7/01/27) | 4.250 | 07/01/41 | 3,898,217 | ||||||||||||
| TOTAL INDUSTRIALS | 10,352,877 | |||||||||||||||
| 120 |
See Notes to Financial Statements |
| PRINCIPAL | DESCRIPTION | RATE | MATURITY | VALUE | ||||||||||||
| LONG-TERM CARE - 9.4% (5.6% of Total Investments) | ||||||||||||||||
| $ 2,065,000 | Adams County General Authority, Pennsylvania, Revenue Bonds, The Brethren Home Community Project, Series 2024A | 5.000% | 06/01/54 | $ | 1,857,122 | |||||||||||
| 2,000,000 | Adams County General Authority, Pennsylvania, Revenue Bonds, The Brethren Home Community Project, Series 2024A | 5.000 | 06/01/59 | 1,772,083 | ||||||||||||
| 940,000 | Berks County Industrial Development Authority, Pennsylvania, Healthcare Facilities Revenue Bonds, Highlands at Wyomissing, Series 2017A | 5.000 | 05/15/37 | 943,359 | ||||||||||||
| 1,160,000 | Berks County Industrial Development Authority, Pennsylvania, Healthcare Facilities Revenue Bonds, Highlands at Wyomissing, Series 2017A | 5.000 | 05/15/47 | 1,058,732 | ||||||||||||
| 230,000 | Chester County Health and Education Facilities Authority, Pennsylvania, Revenue Bonds, Simpson Senior Services Project, Series 2015A | 5.000 | 12/01/35 | 202,961 | ||||||||||||
| 1,760,000 | Chester County Health and Education Facilities Authority, Pennsylvania, Revenue Bonds, Simpson Senior Services Project, Series 2019 | 5.000 | 12/01/51 | 1,327,695 | ||||||||||||
| 3,910,000 | Chester County Health and Education Facilities Authority, Pennsylvania, Revenue Bonds, Simpson Senior Services Project, Series 2021A | 4.000 | 12/01/40 | 2,829,736 | ||||||||||||
| 2,000,000 | Chester County Health and Education Facilities Authority, Pennsylvania, Revenue Bonds, Simpson Senior Services Project, Series 2021A | 4.000 | 12/01/51 | 1,235,029 | ||||||||||||
| 3,005,000 | Cumberland County Municipal Authority, Pennsylvania, Revenue Bonds, Asbury Pennsylvania Obligated Group, Refunding Series 2019 | 5.000 | 01/01/45 | 2,595,387 | ||||||||||||
| 1,075,000 | Cumberland County Municipal Authority, Pennsylvania, Revenue Bonds, Diakon Lutheran Social Ministries Project, Series 2015 | 4.000 | 01/01/33 | 1,036,621 | ||||||||||||
| 1,935,000 | Cumberland County Municipal Authority, Pennsylvania, Revenue Bonds, Diakon Lutheran Social Ministries Project, Series 2015 | 5.000 | 01/01/38 | 1,911,504 | ||||||||||||
| 985,000 | Cumberland County Municipal Authority, Pennsylvania, Revenue Bonds, Diakon Lutheran Social Ministries Project, Series 2016 | 5.000 | 01/01/28 | 987,387 | ||||||||||||
| 1,815,000 | Cumberland County Municipal Authority, Pennsylvania, Revenue Bonds, Diakon Lutheran Social Ministries Project, Series 2016 | 5.000 | 01/01/29 | 1,819,153 | ||||||||||||
| 735,000 | Cumberland County Municipal Authority, Pennsylvania, Revenue Bonds, Diakon Lutheran Social Ministries Project, Series 2016 | 5.000 | 01/01/30 | 736,445 | ||||||||||||
| 300,000 | Cumberland County Municipal Authority, Pennsylvania, Revenue Bonds, Diakon Lutheran Social Ministries Project, Series 2016 | 3.250 | 01/01/36 | 260,232 | ||||||||||||
| 1,405,000 | Cumberland County Municipal Authority, Pennsylvania, Revenue Bonds, Diakon Lutheran Social Ministries Project, Series 2016 | 3.250 | 01/01/39 | 1,140,183 | ||||||||||||
| 690,000 | Cumberland County Municipal Authority, Pennsylvania, Revenue Bonds, Diakon Lutheran Social Ministries Project, Series 2019A | 4.125 | 01/01/38 | 629,926 | ||||||||||||
| 200,000 | Cumberland County Municipal Authority, Pennsylvania, Revenue Bonds, Diakon Lutheran Social Ministries Project, Series 2019A | 5.000 | 01/01/39 | 196,534 | ||||||||||||
| 975,000 | Lancaster County Hospital Authority, Pennsylvania, Health Center Revenue Bonds, Saint Anne’s Retirement Community, Inc., Series 2020 | 5.000 | 03/01/40 | 869,536 | ||||||||||||
| 715,000 | Lancaster County Hospital Authority, Pennsylvania, Health Center Revenue Bonds, Saint Anne’s Retirement Community, Inc., Series 2020 | 5.000 | 03/01/50 | 560,983 | ||||||||||||
| 1,500,000 | Lancaster County Hospital Authority, Pennsylvania, Revenue Bonds, Landis Homes Retirement Community Project, Refunding Series 2015A | 5.000 | 07/01/45 | 1,366,128 | ||||||||||||
| 875,000 | Lancaster Industrial Development Authority, Pennsylvania, Health Center Revenue Bonds, Landis Homes Retirement Community Project, Refunding Series 2021 | 4.000 | 07/01/51 | 664,189 | ||||||||||||
| 1,400,000 | Lancaster Industrial Development Authority, Pennsylvania, Health Center Revenue Bonds, Landis Homes Retirement Community Project, Refunding Series 2021 | 4.000 | 07/01/56 | 1,028,856 | ||||||||||||
| 5,000,000 | Maxatawny Township Municipal Authority, Pennsylvania, Revenue Bonds, Diakon Lutheran Social Ministries Project, Series 2022A | 4.500 | 01/01/45 | 4,349,269 | ||||||||||||
| 1,000,000 | Montgomery County Industrial Development Authority, Pennsylvania, Revenue Bonds, ACTS Retirement-Life Communities, Inc. Obligated Group, Series 2023A | 5.250 | 11/15/53 | 962,787 | ||||||||||||
| See Notes to Financial Statements |
121 |
Portfolio of Investments August 31, 2025 (continued)
NQP
| PRINCIPAL | DESCRIPTION | RATE | MATURITY | VALUE | ||||||||||||||
| |
|
|||||||||||||||||
| LONG-TERM CARE (continued) | ||||||||||||||||||
| $ | 1,000,000 | Montgomery County Industrial Development Authority, Pennsylvania, Revenue Bonds, ACTS Retirement-Life Communities, Inc. Obligated Group, Series 2025A | 5.000 | % | 11/15/49 | $ | 934,101 | |||||||||||
| 1,845,000 | Northampton County Industrial Development Authority, Pennsylvania, Revenue Bonds, Morningstar Senior Living, Inc., Series 2019 | 5.000 | 11/01/44 | 1,598,302 | ||||||||||||||
| 1,000,000 | Northampton County Industrial Development Authority, Pennsylvania, Revenue Bonds, Morningstar Senior Living, Inc., Series 2019 | 5.000 | 11/01/49 | 827,410 | ||||||||||||||
| 500,000 | Pennsylvania Economic Development Finance Authority, Revenue Bonds, Presbyterian Senior Living Project, Series 2023B‑2 | 5.000 | 07/01/42 | 493,362 | ||||||||||||||
| 1,250,000 | Pennsylvania Economic Development Finance Authority, Revenue Bonds, Presbyterian Senior Living Project, Series 2023B‑2 | 5.250 | 07/01/46 | 1,222,546 | ||||||||||||||
| 2,215,000 | Westmoreland County Industrial Development Authority, Pennsylvania, Retirement Community Revenue Bonds, Redstone Presbyterian SeniorCare Obligated Group, Refunding Bonds, Series 2021 | 4.000 | 05/15/41 | 1,758,837 | ||||||||||||||
| 2,785,000 | Westmoreland County Industrial Development Authority, Pennsylvania, Retirement Community Revenue Bonds, Redstone Presbyterian SeniorCare Obligated Group, Refunding Bonds, Series 2021 | 4.000 | 05/15/47 | 1,989,615 | ||||||||||||||
| |
|
|||||||||||||||||
| TOTAL LONG-TERM CARE | 41,166,010 | |||||||||||||||||
| |
||||||||||||||||||
| TAX OBLIGATION/GENERAL - 25.7% (15.3% of Total Investments) | ||||||||||||||||||
| 840,000 | Adams County, Pennsylvania, General Obligation Bonds, Series 2017B | 2.500 | 11/15/29 | 815,881 | ||||||||||||||
| 3,500,000 | Allegheny County, Pennsylvania, General Obligation Bonds, Refunding Series 2016C‑76 | 5.000 | 11/01/41 | 3,535,013 | ||||||||||||||
| 1,010,000 | Allegheny County, Pennsylvania, General Obligation Bonds, Series 2018C‑77 | 5.000 | 11/01/43 | 1,023,224 | ||||||||||||||
| 1,845,000 | Allegheny County, Pennsylvania, General Obligation Bonds, Series 2024C‑80 | 5.000 | 12/01/41 | 1,920,358 | ||||||||||||||
| 2,305,000 | Allegheny County, Pennsylvania, General Obligation Bonds, Series 2024C‑80 | 5.000 | 12/01/42 | 2,376,536 | ||||||||||||||
| 2,910,000 | Allegheny County, Pennsylvania, General Obligation Bonds, Series 2024C‑80 | 5.000 | 12/01/49 | 2,958,256 | ||||||||||||||
| 1,895,000 | Allegheny County, Pennsylvania, General Obligation Bonds, Series 2024C‑80 | 5.000 | 12/01/54 | 1,910,951 | ||||||||||||||
| 1,000,000 | Bristol Township School District, Bucks County, Pennsylvania, General Obligation Bonds, Series 2023 - BAM Insured | 4.125 | 06/01/40 | 989,003 | ||||||||||||||
| 2,900,000 | Colonial School District, Montgomery County, Pennsylvania, General Obligation Bonds, Series 2020 | 5.000 | 02/15/44 | 2,926,543 | ||||||||||||||
| 2,235,000 | Cumberland Valley School District, Cumberland County, Pennsylvania, General Obligation Bonds, Series 2023A - AGM Insured | 5.000 | 11/15/47 | 2,250,457 | ||||||||||||||
| 900,000 | Dallastown Area School District, York County, Pennsylvania, General Obligation Bonds, Series 2025 | 5.000 | 04/15/26 | 914,428 | ||||||||||||||
| 1,265,000 | Delaware County, Pennsylvania, General Obligation Bonds, Series 2024 | 5.000 | 08/01/46 | 1,290,078 | ||||||||||||||
| 3,455,000 | Delaware County, Pennsylvania, General Obligation Bonds, Series 2024 | 5.000 | 08/01/48 | 3,498,555 | ||||||||||||||
| 7,465,000 | Erie City School District, Erie County, Pennsylvania, General Obligation Bonds, Series 2000 - AMBAC Insured | 0.000 | 09/01/30 | 6,254,925 | ||||||||||||||
| 1,010,000 | Gateway School District, Allegheny County, Pennsylvania, General Obligation Bonds, Series 2021 - BAM Insured | 3.000 | 10/15/33 | 955,787 | ||||||||||||||
| 425,000 | Gateway School District, Allegheny County, Pennsylvania, General Obligation Bonds, Series 2021 - BAM Insured | 3.000 | 10/15/35 | 382,072 | ||||||||||||||
| 750,000 | Haverford Township School District, Delaware County, Pennsylvania, General Obligation Bonds, Series 2025 | 5.000 | 03/15/42 | 775,192 | ||||||||||||||
| 750,000 | Haverford Township School District, Delaware County, Pennsylvania, General Obligation Bonds, Series 2025 | 5.000 | 03/15/44 | 768,540 | ||||||||||||||
| 5,750,000 | Hempfield Area School District, Westmoreland County, Pennsylvania, General Obligation Bonds, Series 2022A - AGM Insured | 5.000 | 03/15/48 | 5,832,186 | ||||||||||||||
| 122 |
See Notes to Financial Statements |
| PRINCIPAL | DESCRIPTION | RATE | MATURITY | VALUE | ||||||||||||||
| |
|
|||||||||||||||||
| TAX OBLIGATION/GENERAL (continued) | ||||||||||||||||||
| $ 1,140,000 | Kennett Consolidated School District, Chester County, Pennsylvania, General Obligation Bonds, Series 2024 | 5.000% | 02/15/51 | $ 1,154,770 | ||||||||||||||
| 2,200,000 | Lancaster County, Pennsylvania, General Obligation Bonds, Series 2024 | 5.000 | 11/01/37 | 2,342,477 | ||||||||||||||
| 1,125,000 | Lancaster, Pennsylvania, General Obligation Bonds, Series 2016 - AGM Insured | 5.000 | 11/01/27 | 1,141,802 | ||||||||||||||
| 1,260,000 | Muhlenberg School District, Berks County, Pennsylvania, General Obligation Bonds, Series 2024 | 5.000 | 05/15/49 | 1,268,976 | ||||||||||||||
| 400,000 | Muhlenberg School District, Berks County, Pennsylvania, General Obligation Bonds, Series 2025 | 5.000 | 05/15/50 | 403,882 | ||||||||||||||
| 5,000,000 | North Allegheny School District, Allegheny County, Pennsylvania, General Obligation Bonds, Series 2015 | 5.000 | 05/01/31 | 5,009,047 | ||||||||||||||
| 4,000,000 | North Allegheny School District, Allegheny County, Pennsylvania, General Obligation Bonds, Series 2015 | 5.000 | 05/01/32 | 4,007,115 | ||||||||||||||
| 2,875,000 | North Allegheny School District, Allegheny County, Pennsylvania, General Obligation Bonds, Series 2015 | 5.000 | 05/01/33 | 2,880,092 | ||||||||||||||
| 1,000,000 | Penn Manor School District, Lancaster County, Pennsylvania, General Obligation Bonds, Series 2019A | 4.000 | 03/01/35 | 1,005,999 | ||||||||||||||
| 1,000,000 | Penn Manor School District, Lancaster County, Pennsylvania, General Obligation Bonds, Series 2019A | 4.000 | 03/01/36 | 1,005,177 | ||||||||||||||
| 630,000 | Pennsbury School District, Bucks County, Pennsylvania, General Obligation Bonds, Series 2024 | 5.000 | 08/01/44 | 645,666 | ||||||||||||||
| 3,925,000 | Philadelphia School District, Pennsylvania, General Obligation Bonds, Refunding Series 2007A - NPFG Insured | 5.000 | 06/01/34 | 4,373,118 | ||||||||||||||
| 10,000,000 | (b) | Philadelphia School District, Pennsylvania, General Obligation Bonds, Series 2023A, (UB) | 5.500 | 09/01/48 | 10,309,489 | |||||||||||||
| 1,000,000 | Pittsburgh, Pennsylvania, General Obligation Bonds, Capital Improvement Series 2024 | 5.000 | 09/01/43 | 1,031,038 | ||||||||||||||
| 1,000,000 | Pittsburgh, Pennsylvania, General Obligation Bonds, Capital Improvement Series 2025 | 4.250 | 09/01/44 | 908,219 | ||||||||||||||
| 1,355,000 | Pittsburgh, Pennsylvania, General Obligation Bonds, Capital Improvement Series 2025 | 4.250 | 09/01/45 | 1,221,765 | ||||||||||||||
| 11,440,000 | Reading School District, Berks County, Pennsylvania, General Obligation Bonds, Series 2003B - NPFG Insured | 0.000 | 01/15/32 | 8,803,740 | ||||||||||||||
| 385,000 | Rose Tree Media School District, Delaware County, Pennsylvania, General Obligation Bonds, Series 2025 | 5.000 | 04/01/33 | 435,967 | ||||||||||||||
| 21,000,000 | (b) | State Public School Building Authority, Pennsylvania, Lease Revenue Bonds, Philadelphia School District, Series 2003 - AGM Insured, (UB) | 5.500 | 06/01/28 | 22,604,977 | |||||||||||||
| 100,000 | The Redevelopment Authority of the City of Scranton, Lackawanna county, Pennsylvania, Guaranteed Lease Revenue Bonds, Series 2016A | 5.000 | 11/15/28 | 100,062 | ||||||||||||||
| 1,000,000 | Tredyffrin-Easttown School District, Chester County, Pennsylvania, General Obligation Bonds, Series 2024 | 5.000 | 02/15/43 | 1,035,581 | ||||||||||||||
| |
|
|||||||||||||||||
| TOTAL TAX OBLIGATION/GENERAL | 113,066,944 | |||||||||||||||||
| |
||||||||||||||||||
| TAX OBLIGATION/LIMITED - 12.4% (7.3% of Total Investments) | ||||||||||||||||||
| 180,000 | (a) | Allentown Neighborhood Improvement Zone Development Authority, Pennsylvania, Tax Revenue Bonds, 615 Waterfront Project, Senior Series 2021 | 6.000 | 05/01/42 | 183,916 | |||||||||||||
| 155,000 | (a) | Allentown Neighborhood Improvement Zone Development Authority, Pennsylvania, Tax Revenue Bonds, City Center Project, Series 2018 | 5.000 | 05/01/33 | 158,553 | |||||||||||||
| 1,115,000 | (a) | Allentown Neighborhood Improvement Zone Development Authority, Pennsylvania, Tax Revenue Bonds, City Center Refunding Project, Series 2017 | 5.000 | 05/01/42 | 1,077,566 | |||||||||||||
| 1,415,000 | (a) | Allentown Neighborhood Improvement Zone Development Authority, Pennsylvania, Tax Revenue Bonds, Neuweiler Lofts Project, Series 2023 | 6.250 | 05/01/42 | 1,357,610 | |||||||||||||
| 450,000 | (a) | Allentown Neighborhood Improvement Zone Development Authority, Pennsylvania, Tax Revenue Bonds, Waterfront-30 E Allen Street Project, Senior Series 2024A | 5.250 | 05/01/42 | 426,263 | |||||||||||||
| 1,500,000 | Commonwealth Financing Authority, Pennsylvania, State Appropriation Lease Bonds, Master Settlement, Series 2018 | 5.000 | 06/01/31 | 1,580,657 | ||||||||||||||
| See Notes to Financial Statements |
123 |
Portfolio of Investments August 31, 2025 (continued)
NQP
| PRINCIPAL | DESCRIPTION | RATE | MATURITY | VALUE | ||||||||||||||
| |
|
|||||||||||||||||
| TAX OBLIGATION/LIMITED (continued) | ||||||||||||||||||
| $ | 3,765,000 | Commonwealth Financing Authority, Pennsylvania, State Appropriation Lease Bonds, Master Settlement, Series 2018 - AGM Insured | 4.000% | 06/01/39 | $ | 3,600,815 | ||||||||||||
| 7,215,000 | (b) | Commonwealth Financing Authority, Pennsylvania, State Appropriation Lease Bonds, Master Settlement, Series 2018 - AGM Insured, (UB) | 4.000 | 06/01/39 | 6,900,368 | |||||||||||||
| 1,000,000 | Delaware County Vocational-Technical School Authority, Pennsylvania, Lease Revenue Bonds, Intermediate Unit Project, Series 2025 - BAM Insured | 5.500 | 11/01/50 | 1,027,907 | ||||||||||||||
| 1,100,000 | Montgomery County Redevelopment Authority, Pennsylvania, Special Obligation Revenue Bonds, River Pointe Project Series 2023 | 6.500 | 09/01/43 | 1,078,492 | ||||||||||||||
| 2,650,000 | Pennsylvania Turnpike Commission, Motor License Fund- Enhanced Turnpike Special Revenue Bonds, Subordinate Series 2014A | 4.750 | 12/01/37 | 2,684,432 | ||||||||||||||
| 4,000,000 | Pennsylvania Turnpike Commission, Motor License Fund- Enhanced Turnpike Special Revenue Bonds, Subordinate Series 2014A | 4.900 | 12/01/44 | 4,013,448 | ||||||||||||||
| 5,535,000 | Pennsylvania Turnpike Commission, Oil Franchise Tax Revenue Bonds, Senior Lien Series 2021A | 4.000 | 12/01/51 | 4,676,877 | ||||||||||||||
| 1,125,000 | Pennsylvania Turnpike Commission, Oil Franchise Tax Revenue Bonds, Senior Series 2018A | 5.250 | 12/01/44 | 1,131,360 | ||||||||||||||
| 1,245,000 | Pennsylvania Turnpike Commission, Oil Franchise Tax Revenue Bonds, Subordinate Series 2018B | 5.000 | 12/01/48 | 1,235,372 | ||||||||||||||
| 5,530,000 | Philadelphia Authority For Industrial Development, Pennsylvania, City Agreement Revenue Bonds, Cultural and Commercial Corridors Program, Refunding Series 2016A | 5.000 | 12/01/30 | 5,556,776 | ||||||||||||||
| 1,037,000 | Puerto Rico Sales Tax Financing Corporation, Sales Tax Revenue Bonds, Restructured 2018A-1 | 4.750 | 07/01/53 | 931,255 | ||||||||||||||
| 1,150,000 | Puerto Rico Sales Tax Financing Corporation, Sales Tax Revenue Bonds, Restructured 2018A-1 | 5.000 | 07/01/58 | 1,054,847 | ||||||||||||||
| 1,918,000 | Puerto Rico Sales Tax Financing Corporation, Sales Tax Revenue Bonds, Taxable Restructured Cofina Project Series 2019A-2 | 4.329 | 07/01/40 | 1,778,834 | ||||||||||||||
| 839,000 | Puerto Rico Sales Tax Financing Corporation, Sales Tax Revenue Bonds, Taxable Restructured Cofina Project Series 2019A-2 | 4.329 | 07/01/40 | 778,124 | ||||||||||||||
| 2,319,000 | Puerto Rico Sales Tax Financing Corporation, Sales Tax Revenue Bonds, Taxable Restructured Cofina Project Series 2019A-2 | 4.784 | 07/01/58 | 2,048,665 | ||||||||||||||
| 10,000,000 | (b) | Southeastern Pennsylvania Transportation Authority, Revenue Bonds, Asset Improvement Series 2022, (UB) | 5.250 | 06/01/47 | 10,247,201 | |||||||||||||
| 825,000 | Washington County Redevelopment Authority, Pennsylvania, Tanger Outlet Victory Center Tax Increment Bonds, Series 2018 | 5.000 | 07/01/35 | 813,476 | ||||||||||||||
| |
|
|||||||||||||||||
| TOTAL TAX OBLIGATION/LIMITED | 54,342,814 | |||||||||||||||||
| |
||||||||||||||||||
| TRANSPORTATION - 18.6% (11.1% of Total Investments) | ||||||||||||||||||
| 1,760,000 | Allegheny County Airport Authority, Pennsylvania, Airport Revenue Bonds, Pittsburgh International Airport, Series 2021A, (AMT) | 5.000 | 01/01/51 | 1,710,623 | ||||||||||||||
| 8,020,000 | (b) | Allegheny County Airport Authority, Pennsylvania, Airport Revenue Bonds, Pittsburgh International Airport, Series 2021B, (UB) | 5.000 | 01/01/56 | 7,920,789 | |||||||||||||
| 10,000,000 | (b) | Allegheny County Airport Authority, Pennsylvania, Airport Revenue Bonds, Pittsburgh International Airport, Series 2023A - AGM Insured, (AMT), (UB) | 5.500 | 01/01/53 | 10,187,094 | |||||||||||||
| 4,000,000 | Allegheny County Airport Authority, Pennsylvania, Airport Revenue Bonds, Pittsburgh International Airport, Series 2025A, (AMT) | 5.500 | 01/01/50 | 4,140,442 | ||||||||||||||
| 3,285,000 | Delaware River Port Authority, New Jersey and Pennsylvania, Revenue Bonds, Refunding Series 2025 | 5.000 | 01/01/36 | 3,684,422 | ||||||||||||||
| 1,340,000 | Delaware River Port Authority, New Jersey and Pennsylvania, Revenue Bonds, Series 2018A | 5.000 | 01/01/37 | 1,390,088 | ||||||||||||||
| 12,170,000 | Pennsylvania Turnpike Commission, Turnpike Revenue Bonds, Capital Appreciation Series 2009E | 6.375 | 12/01/38 | 12,747,588 | ||||||||||||||
| 2,845,000 | Pennsylvania Turnpike Commission, Turnpike Revenue Bonds, Refunding First Series 2024 | 5.000 | 12/01/42 | 2,964,587 | ||||||||||||||
| 8,735,000 | Pennsylvania Turnpike Commission, Turnpike Revenue Bonds, Series 2015B | 5.000 | 12/01/45 | 8,787,984 | ||||||||||||||
| 124 |
See Notes to Financial Statements |
| PRINCIPAL | DESCRIPTION | RATE MATURITY | VALUE | |||||||||||||||
| |
|
|||||||||||||||||
| TRANSPORTATION (continued) | ||||||||||||||||||
| $ | 1,215,000 | (b) | Pennsylvania Turnpike Commission, Turnpike Revenue Bonds, Series 2022B, (UB) | 5.250% | 12/01/47 | $ | 1,245,434 | |||||||||||
| 2,365,000 | (b) | Pennsylvania Turnpike Commission, Turnpike Revenue Bonds, Series 2022B, (UB) | 5.250 | 12/01/52 | 2,415,088 | |||||||||||||
| 11,500,000 | (b) | Pennsylvania Turnpike Commission, Turnpike Revenue Bonds, Series 2023A, (UB) | 5.000 | 12/01/48 | 11,590,770 | |||||||||||||
| 2,005,000 | Pennsylvania Turnpike Commission, Turnpike Revenue Bonds, Subordinate Series 2009C - AGM Insured | 6.250 | 06/01/33 | 2,050,176 | ||||||||||||||
| 1,435,000 | Pennsylvania Turnpike Commission, Turnpike Revenue Bonds, Subordinate Series 2017B-1 | 5.000 | 06/01/31 | 1,487,678 | ||||||||||||||
| 1,430,000 | Pennsylvania Turnpike Commission, Turnpike Revenue Bonds, Subordinate Series 2017B-1 | 5.000 | 06/01/33 | 1,475,321 | ||||||||||||||
| 780,000 | Philadelphia, Pennsylvania, Airport Revenue Bonds, Refunding Series 2017A - AGM Insured | 3.000 | 07/01/34 | 715,451 | ||||||||||||||
| 1,490,000 | Philadelphia, Pennsylvania, Airport Revenue Bonds, Refunding Series 2017B, (AMT) | 5.000 | 07/01/47 | 1,455,466 | ||||||||||||||
| 1,470,000 | Philadelphia, Pennsylvania, Airport Revenue Bonds, Refunding Series 2020C, (AMT) | 4.000 | 07/01/50 | 1,216,035 | ||||||||||||||
| 1,625,000 | Philadelphia, Pennsylvania, Airport Revenue Bonds, Refunding Series 2025B, (AMT) | 5.000 | 07/01/35 | 1,752,219 | ||||||||||||||
| 1,000,000 | Pittsburgh and Allegheny County Sports and Exhibition Authority, Pennsylvania, Parking Revenue Bonds, Series 2017 | 5.000 | 12/15/30 | 1,042,389 | ||||||||||||||
| 550,000 | Pittsburgh and Allegheny County Sports and Exhibition Authority, Pennsylvania, Parking Revenue Bonds, Series 2017 | 5.000 | 12/15/34 | 564,388 | ||||||||||||||
| 1,250,000 | Pittsburgh and Allegheny County Sports and Exhibition Authority, Pennsylvania, Parking Revenue Bonds, Series 2017 | 5.000 | 12/15/37 | 1,269,563 | ||||||||||||||
| |
|
|||||||||||||||||
| TOTAL TRANSPORTATION | 81,813,595 | |||||||||||||||||
| |
||||||||||||||||||
| U.S. GUARANTEED - 4.2% (f)(2.5% of Total Investments) | ||||||||||||||||||
| 455,000 | Allegheny County Higher Education Building Authority, Pennsylvania, College Revenue Refunding Bonds, Robert Morris College, Series 1998A, (ETM) | 6.000 | 05/01/28 | 480,625 | ||||||||||||||
| 735,000 | Allegheny County Higher Education Building Authority, Pennsylvania, Revenue Bonds, Robert Morris University, Series 2016, (Pre-refunded 10/15/26) | 3.000 | 10/15/30 | 738,009 | ||||||||||||||
| 1,000,000 | Allegheny County Higher Education Building Authority, Pennsylvania, Revenue Bonds, Robert Morris University, Series 2016, (Pre-refunded 10/15/26) | 5.000 | 10/15/38 | 1,026,339 | ||||||||||||||
| 1,625,000 | Allegheny County Higher Education Building Authority, Pennsylvania, Revenue Bonds, Robert Morris University, Series 2017, (Pre-refunded 10/15/27) | 5.000 | 10/15/47 | 1,706,530 | ||||||||||||||
| 805,000 | Centre County Hospital Authority, Pennsylvania, Hospital Revenue Bonds, Mount Nittany Medical Center Project, Series 2016A, (Pre-refunded 11/15/25) | 5.000 | 11/15/41 | 808,977 | ||||||||||||||
| 2,985,000 | Centre County Hospital Authority, Pennsylvania, Hospital Revenue Bonds, Mount Nittany Medical Center Project, Series 2016A, (Pre-refunded 11/15/25) | 5.000 | 11/15/46 | 2,999,747 | ||||||||||||||
| 610,000 | Cumberland County Municipal Authority, Pennsylvania, Revenue Bonds, Diakon Lutheran Social Ministries Project, Series 2016, (Pre-refunded 1/01/26) | 3.250 | 01/01/39 | 611,138 | ||||||||||||||
| 135,000 | Cumberland County Municipal Authority, Pennsylvania, Revenue Bonds, Diakon Lutheran Social Ministries Project, Series 2019A, (Pre-refunded 1/01/29) | 5.000 | 01/01/39 | 145,351 | ||||||||||||||
| 1,075,000 | Cumberland County Municipal Authority, Pennsylvania, Revenue Bonds, Diakon Lutheran Social Ministries Project, Series 2019A, (Pre-refunded 1/01/29) | 5.000 | 01/01/39 | 1,157,422 | ||||||||||||||
| 430,000 | Doylestown Hospital Authority, Pennsylvania, Hospital Revenue Bonds, Series 2016A, (Pre-refunded 7/01/26) | 5.000 | 07/01/41 | 437,992 | ||||||||||||||
| 120,000 | Doylestown Hospital Authority, Pennsylvania, Hospital Revenue Bonds, Series 2019A, (Pre-refunded 7/01/29) | 4.000 | 07/01/45 | 125,578 | ||||||||||||||
| 150,000 | Doylestown Hospital Authority, Pennsylvania, Hospital Revenue Bonds, Series 2019A, (Pre-refunded 7/01/29) | 5.000 | 07/01/49 | 162,394 | ||||||||||||||
| 2,350,000 | Monroe County Hospital Authority, Pennsylvania, Hospital Revenue Bonds, Pocono Medical Center, Series 2016, (Pre- refunded 7/01/26) | 5.000 | 07/01/41 | 2,400,517 | ||||||||||||||
| See Notes to Financial Statements |
125 |
Portfolio of Investments August 2025 (continued)
NQP
| PRINCIPAL | DESCRIPTION | RATE | MATURITY | VALUE | ||||||||||||||
| |
|
|||||||||||||||||
| U.S. GUARANTEED (f) (continued) | ||||||||||||||||||
| $ | 140,000 | (a) | Philadelphia Authority for Industrial Development, Pennsylvania, Revenue Bonds, University of the Arts, Series 2017, (Pre‑refunded 3/15/28) | 5.000% | 03/15/45 | $ | 149,061 | |||||||||||
| 4,140,000 | Pottsville Hospital Authority, Pennsylvania, Hospital Revenue Bonds, Lehigh Valley Health Network, Series 2016B, (Pre‑ refunded 1/01/27) | 5.000 | 07/01/45 | 4,286,472 | ||||||||||||||
| 1,335,000 | Saint Mary Hospital Authority, Pennsylvania, Hospital Revenue Bonds, Trinity Health Credit Group, Refunding Series 2019PA, (Pre‑refunded 12/01/28) | 5.000 | 12/01/48 | 1,443,790 | ||||||||||||||
| |
|
|||||||||||||||||
| TOTAL U.S. GUARANTEED | 18,679,942 | |||||||||||||||||
| |
||||||||||||||||||
| UTILITIES - 21.8% (12.9% of Total Investments) | ||||||||||||||||||
| 3,325,000 | Allegheny County Sanitary Authority, Pennsylvania, Sewer Revenue Bonds, Refunding Series 2015 | 5.000 | 12/01/40 | 3,339,606 | ||||||||||||||
| 3,320,000 | Allegheny County Sanitary Authority, Pennsylvania, Sewer Revenue Bonds, Refunding Series 2015 | 5.000 | 12/01/45 | 3,329,291 | ||||||||||||||
| 1,000,000 | Allegheny County Sanitary Authority, Pennsylvania, Sewer Revenue Bonds, Series 2018 | 5.000 | 06/01/43 | 1,011,583 | ||||||||||||||
| 4,165,000 | (b) | Allegheny County Sanitary Authority, Pennsylvania, Sewer Revenue Bonds, Series 2022, (UB) | 5.000 | 06/01/53 | 4,147,080 | |||||||||||||
| 6,500,000 | Beaver County Industrial Development Authority, Pennsylvania, Pollution Control Revenue Bonds, FirstEnergy Generation Project, Refunding Series 2006A, (Mandatory Put 7/01/33) | 4.750 | 01/01/35 | 6,688,178 | ||||||||||||||
| 2,000,000 | Bethel Park Municipal Authority, Pennsylvania, Guaranteed Sewer Revenue Bonds, Series 2020B | 3.000 | 09/01/47 | 1,480,622 | ||||||||||||||
| 7,000,000 | (b) | Bucks County Water and Sewer Authority, Pennsylvania, Sewer System Revenue Bonds, Series 2022A - AGM Insured, (UB) | 4.250 | 12/01/47 | 6,422,900 | |||||||||||||
| 1,090,000 | Bucks County Water and Sewer Authority, Pennsylvania, Water System Revenue Bonds, Series 2024 | 4.000 | 12/01/43 | 979,739 | ||||||||||||||
| 1,150,000 | Bucks County Water and Sewer Authority, Pennsylvania, Water System Revenue Bonds, Series 2024 | 4.000 | 12/01/46 | 1,023,544 | ||||||||||||||
| 1,110,000 | Delaware County Regional Water Quality Control Authority, Pennsylvania, Sewer Revenue Bonds, Series 2015 | 5.000 | 05/01/40 | 1,111,439 | ||||||||||||||
| 855,000 | Delaware County Regional Water Quality Control Authority, Pennsylvania, Sewer Revenue Bonds, Series 2015 | 4.000 | 05/01/45 | 763,439 | ||||||||||||||
| 7,295,000 | Lehigh County Authority, Pennsylvania, Water and Sewer Revenue Bonds, Allentown Concession, Capital Appreciation Series 2013B | 0.000 | 12/01/34 | 5,105,436 | ||||||||||||||
| 4,420,000 | Lehigh County Authority, Pennsylvania, Water and Sewer Revenue Bonds, Allentown Concession, Capital Appreciation Series 2013B | 0.000 | 12/01/35 | 2,927,668 | ||||||||||||||
| 2,000,000 | Lehigh County Authority, Pennsylvania, Water and Sewer Revenue Bonds, Allentown Concession, Series 2024 - BAM Insured | 4.000 | 12/01/46 | 1,751,309 | ||||||||||||||
| 295,000 | Luzerne County Industrial Development Authority, Pennsylvania, Revenue Bonds, Pennsylvania-American Water Company Project, Refunding Series 2019, (AMT), (Mandatory Put 12/03/29) | 2.450 | 12/01/39 | 271,961 | ||||||||||||||
| 4,440,000 | Pennsylvania Economic Development Financing Authority, Exempt Facilities Revenue Bonds, York Water Company Project, Refunding Series 2019A, (AMT) | 3.000 | 10/01/36 | 3,958,923 | ||||||||||||||
| 3,900,000 | Pennsylvania Economic Development Financing Authority, Exempt Facilities Revenue Bonds, York Water Company Project, Refunding Series 2019B, (AMT) | 3.100 | 11/01/38 | 3,333,240 | ||||||||||||||
| 10,500,000 | Pennsylvania Economic Development Financing Authority, Revenue Bonds, Pennsylvania-American Water Company, Refunding Series 2019 | 3.000 | 04/01/39 | 8,725,419 | ||||||||||||||
| 2,000,000 | Philadelphia Gas Works, Pennsylvania, Revenue Bonds, 1998 General Ordinance, Fifteenth Series 2017 | 5.000 | 08/01/37 | 2,031,361 | ||||||||||||||
| 1,000,000 | Philadelphia Gas Works, Pennsylvania, Revenue Bonds, 1998 General Ordinance, Sixteenth Series 2020A - AGM Insured | 5.000 | 08/01/50 | 1,000,766 | ||||||||||||||
| 7,000,000 | Philadelphia, Pennsylvania, Water and Wastewater Revenue Bonds, Series 2018A | 5.000 | 10/01/48 | 6,956,527 | ||||||||||||||
| 4,175,000 | Philadelphia, Pennsylvania, Water and Wastewater Revenue Bonds, Series 2018A | 5.000 | 10/01/53 | 4,174,981 | ||||||||||||||
| 4,695,000 | Philadelphia, Pennsylvania, Water and Wastewater Revenue Bonds, Series 2022C | 5.500 | 06/01/47 | 4,918,612 | ||||||||||||||
| 126 |
See Notes to Financial Statements |
| PRINCIPAL | DESCRIPTION | RATE | MATURITY | VALUE | ||||||||||||
| UTILITIES (continued) | ||||||||||||||||
| $ 12,000,000 | (b) | Philadelphia, Pennsylvania, Water and Wastewater Revenue Bonds, Series 2023B - AGM Insured, (UB) | 4.500% | 09/01/48 | $ | 11,477,477 | ||||||||||
| 3,250,000 | Pittsburgh Water and Sewer Authority, Pennsylvania, Water and Sewer System Revenue Bonds, First Lien Series 2023A - AGM Insured | 5.000 | 09/01/48 | 3,283,015 | ||||||||||||
| 2,630,000 | Pittsburgh Water and Sewer Authority, Pennsylvania, Water and Sewer System Revenue Bonds, First Lien Series 2023A - AGM Insured | 4.250 | 09/01/53 | 2,310,227 | ||||||||||||
| 1,925,000 | Pittsburgh Water and Sewer Authority, Pennsylvania, Water and Sewer System Revenue Bonds, First Lien Series 2025A | 5.000 | 09/01/55 | 1,929,512 | ||||||||||||
| 450,000 | University Area Joint Authority, Centre County, Pennsylvania, Sewer Revenue Bonds, Series 2025 - BAM Insured | 4.250 | 11/01/49 | 407,380 | ||||||||||||
| 1,000,000 | Westmoreland County Municipal Authority, Pennsylvania, Municipal Service Revenue Bonds, Refunding Series 2020 - AGM Insured | 2.450 | 08/15/37 | 791,895 | ||||||||||||
| TOTAL UTILITIES | 95,653,130 | |||||||||||||||
| TOTAL MUNICIPAL BONDS (Cost $793,402,850) |
740,393,668 | |||||||||||||||
| PRINCIPAL | DESCRIPTION | RATE | MATURITY | VALUE | ||||||||||||
| VARIABLE RATE SENIOR LOAN INTERESTS - 0.0% (0.0% of Total Investments) | ||||||||||||||||
| CAPITAL GOODS - 0.0% (0.0% of Total Investments) | ||||||||||||||||
| $ 64,338 | (c),(e) | KDC Agribusiness Fairless Hills LLC | 12.000 | 09/17/25 | $ | 6 | ||||||||||
| TOTAL CAPITAL GOODS | 6 | |||||||||||||||
| TOTAL VARIABLE RATE SENIOR LOAN INTERESTS (Cost $64,338) |
6 | |||||||||||||||
| TOTAL LONG-TERM INVESTMENTS (Cost $793,467,188) |
740,393,674 | |||||||||||||||
| FLOATING RATE OBLIGATIONS - (24.3)% | (106,940,000) | |||||||||||||||
| VRDP SHARES, NET - (49.3)% (g) | (216,906,167) | |||||||||||||||
| OTHER ASSETS & LIABILITIES, NET - 5.2% | 23,100,256 | |||||||||||||||
| NET ASSETS APPLICABLE TO COMMON SHARES - 100% | $ | 439,647,763 | ||||||||||||||
All percentages shown in the Portfolio of Investments are based on net assets applicable to common shares unless otherwise noted.
| AMT | Alternative Minimum Tax | |
| ETM | Escrowed to maturity | |
| UB | Underlying bond of an inverse floating rate trust reflected as a financing transaction. Inverse floating rate trust is a Recourse Trust unless otherwise noted. | |
| (a) | Security is exempt from registration under Rule 144A of the Securities Act of 1933, as amended. These securities are deemed liquid and may be resold in transactions exempt from registration, which are normally those transactions with qualified institutional buyers. As of the end of the reporting period, the aggregate value of these securities is $6,579,850 or 0.9% of Total Investments. | |
| (b) | Investment, or portion of investment, has been pledged to collateralize the net payment obligations for investments in inverse floating rate transactions. | |
| (c) | Defaulted security. A security whose issuer has failed to fully pay principal and/or interest when due, or is under the protection of bankruptcy. | |
| (d) | Step‑up coupon bond, a bond with a coupon that increases (“steps up”), usually at regular intervals, while the bond is outstanding. The rate shown is the coupon as of the end of the reporting period. | |
| (e) | For fair value measurement disclosure purposes, investment classified as Level 3. | |
| (f) | Backed by an escrow or trust containing sufficient U.S. Government or U.S. Government agency securities, which ensure the timely payment of principal and interest. | |
| (g) | VRDP Shares, Net as a percentage of Total Investments is 29.3%. | |
| See Notes to Financial Statements |
127 |
Statement of Assets and Liabilities
| August 31, 2025 | NAZ | NKX | NCA | NAC | NXJ | NRK | ||||||||||||||||||
| ASSETS |
||||||||||||||||||||||||
| Long-term investments, at value† |
$ | 218,032,750 | $ | 990,294,740 | $ | 280,198,957 | $ | 2,783,682,584 | $ | 874,297,575 | $ | 1,531,224,035 | ||||||||||||
| Short-term investments, at value◇ |
– | 16,000,000 | 10,000,000 | 23,600,000 | 1,960,000 | 28,000,000 | ||||||||||||||||||
| Cash |
– | – | 1,099,918 | – | 200,300 | – | ||||||||||||||||||
| Receivables: |
||||||||||||||||||||||||
| Interest |
2,200,870 | 10,820,126 | 2,830,115 | 31,161,389 | 8,992,541 | 19,008,208 | ||||||||||||||||||
| Investments sold |
4,060,807 | 1,430,000 | 25,000 | 4,940,000 | 425,000 | 4,020,000 | ||||||||||||||||||
| Shares sold |
– | 348,192 | – | 188,068 | – | – | ||||||||||||||||||
| Deferred offering costs |
90,440 | 73,428 | – | 85,265 | – | – | ||||||||||||||||||
| Other |
25,289 | 245,175 | 23,087 | 576,848 | 70,588 | 530,137 | ||||||||||||||||||
| Total assets |
224,410,156 | 1,019,211,661 | 294,177,077 | 2,844,234,154 | 885,946,004 | 1,582,782,380 | ||||||||||||||||||
| LIABILITIES |
||||||||||||||||||||||||
| Cash overdraft |
86,330 | 7,197,693 | – | 4,812,185 | – | 1,599,330 | ||||||||||||||||||
| Floating rate obligations |
– | 33,485,000 | – | 44,590,000 | 63,850,000 | 13,480,000 | ||||||||||||||||||
| AMTP Shares, Net* |
88,271,752 | – | – | – | – | – | ||||||||||||||||||
| MFP Shares, Net** |
– | 140,062,927 | – | 256,945,290 | – | 79,634,566 | ||||||||||||||||||
| VRDP Shares, Net*** |
– | 255,773,357 | – | 905,609,432 | 312,832,483 | 582,368,702 | ||||||||||||||||||
| Payables: |
||||||||||||||||||||||||
| Management fees |
113,670 | 484,400 | 121,288 | 1,333,818 | 425,333 | 759,321 | ||||||||||||||||||
| Dividends |
842,633 | 3,568,226 | 920,548 | 10,267,574 | 2,956,217 | 5,721,753 | ||||||||||||||||||
| Interest |
51 | 318,258 | 111 | 434,128 | 476,593 | 51,500 | ||||||||||||||||||
| Investments purchased - when-issued/delayed- delivery settlement |
437,236 | 3,699,930 | – | 8,248,400 | – | – | ||||||||||||||||||
| Accrued expenses: | ||||||||||||||||||||||||
| Custodian fees |
22,210 | 54,474 | 22,013 | 142,131 | 54,421 | 83,987 | ||||||||||||||||||
| Investor relations fees |
4,017 | 15,690 | 5,056 | 45,853 | 14,284 | 29,055 | ||||||||||||||||||
| Trustees fees |
5,361 | 74,698 | 20,920 | 253,897 | 70,263 | 140,862 | ||||||||||||||||||
| Professional fees |
33,285 | 33,636 | 33,386 | 25,032 | 15,689 | 30,130 | ||||||||||||||||||
| Shareholder reporting expenses |
8,216 | 21,477 | 15,649 | 47,223 | 23,034 | 18,649 | ||||||||||||||||||
| Shareholder servicing agent fees |
4,031 | 2,737 | 1,910 | 9,828 | 6,179 | 10,458 | ||||||||||||||||||
| Shelf offering costs |
– | – | – | 90,000 | – | – | ||||||||||||||||||
| Other |
468 | 18,699 | 869 | 31,483 | 2,722 | 86,805 | ||||||||||||||||||
| Total liabilities |
89,829,260 | 444,811,202 | 1,141,750 | 1,232,886,274 | 380,727,218 | 684,015,118 | ||||||||||||||||||
| Commitments and contingencies(1) |
||||||||||||||||||||||||
| Net assets applicable to common shares |
$ | 134,580,896 | $ | 574,400,459 | $ | 293,035,327 | $ | 1,611,347,880 | $ | 505,218,786 | $ | 898,767,262 | ||||||||||||
| Common shares outstanding |
12,097,770 | 49,701,832 | 33,108,196 | 145,728,087 | 41,232,935 | 87,235,304 | ||||||||||||||||||
| Net asset value (“NAV”) per common share outstanding | $ | 11.12 | $ | 11.56 | $ | 8.85 | $ | 11.06 | $ | 12.25 | $ | 10.30 | ||||||||||||
| NET ASSETS APPLICABLE TO COMMON SHARES CONSIST OF: | ||||||||||||||||||||||||
| Common shares, $0.01 par value per share | $ | 120,978 | $ | 497,018 | $ | 331,082 | $ | 1,457,281 | $ | 412,329 | $ | 872,353 | ||||||||||||
| Paid-in capital | 155,207,004 | 635,621,422 | 312,875,798 | 1,895,176,890 | 559,289,658 | 1,130,811,326 | ||||||||||||||||||
| Total distributable earnings (loss) | (20,747,086 | ) | (61,717,981 | ) | (20,171,553 | ) | (285,286,291 | ) | (54,483,201 | ) | (232,916,417 | ) | ||||||||||||
| Net assets applicable to common shares | $ | 134,580,896 | $ | 574,400,459 | $ | 293,035,327 | $ | 1,611,347,880 | $ | 505,218,786 | $ | 898,767,262 | ||||||||||||
| Authorized shares: |
||||||||||||||||||||||||
| Common |
Unlimited | Unlimited | Unlimited | Unlimited | Unlimited | Unlimited | ||||||||||||||||||
| Preferred |
Unlimited | Unlimited | – | Unlimited | Unlimited | Unlimited | ||||||||||||||||||
| † Long-term investments, cost |
$ | 229,492,535 | $ | 1,012,993,252 | $ | 288,972,029 | $ | 2,896,430,128 | $ | 912,286,109 | $ | 1,596,814,038 | ||||||||||||
| ◇ Short-term investments, cost |
$ | – | $ | 16,000,000 | $ | 10,000,000 | $ | 23,600,000 | $ | 1,960,000 | $ | 28,000,000 | ||||||||||||
| * AMTP Shares, liquidation preference |
$ | 88,300,000 | $ | – | $ | – | $ | – | $ | – | $ | – | ||||||||||||
| ** MFP Shares, liquidation preference |
$ | – | $ | 140,400,000 | $ | – | $ | 257,000,000 | $ | – | $ | 80,000,000 | ||||||||||||
| *** VRDP Shares, liquidation preference |
$ | – | $ | 256,700,000 | $ | – | $ | 907,800,000 | $ | 313,900,000 | $ | 583,800,000 | ||||||||||||
See Notes to Financial Statements
| 128 |
Statement of Assets and Liabilities (continued)
| August 31, 2025 | NNY | NAN | NQP | |||||||||
| ASSETS |
||||||||||||
| Long-term investments, at value† |
$ | 157,663,192 | $ | 576,956,857 | $ | 740,393,674 | ||||||
| Short-term investments, at value◇ |
3,500,000 | – | – | |||||||||
| Receivables: |
||||||||||||
| Interest |
2,009,804 | 7,723,729 | 9,871,077 | |||||||||
| Investments sold |
– | 30,000 | – | |||||||||
| Shares sold |
– | 161,894 | – | |||||||||
| Sale of Vistra Vision interest#(2) |
– | – | 21,380,811 | |||||||||
| Deferred offering costs |
– | 77,177 | – | |||||||||
| Other |
5,547 | 127,227 | 64,461 | |||||||||
| Total assets |
163,178,543 | 585,076,884 | 771,710,023 | |||||||||
| LIABILITIES |
||||||||||||
| Cash overdraft |
1,282,381 | 388,631 | 3,600,833 | |||||||||
| Floating rate obligations |
– | 28,840,000 | 106,940,000 | |||||||||
| AMTP Shares, Net* |
– | 126,968,403 | – | |||||||||
| VRDP Shares, Net*** |
– | 88,341,245 | 216,906,167 | |||||||||
| Payables: |
||||||||||||
| Management fees |
68,077 | 290,380 | 380,814 | |||||||||
| Dividends |
522,949 | 2,051,978 | 2,676,814 | |||||||||
| Interest |
61 | 216,307 | 848,531 | |||||||||
| Vistra Vision sale transactions costs(2) |
– | – | 522,328 | |||||||||
| Accrued expenses: |
||||||||||||
| Custodian fees |
16,026 | 35,125 | 47,736 | |||||||||
| Investor relations fees |
3,115 | 10,883 | 11,531 | |||||||||
| Trustees fees |
3,849 | 42,773 | 63,814 | |||||||||
| Professional fees |
33,295 | 29,661 | 30,069 | |||||||||
| Shareholder reporting expenses |
6,686 | 9,147 | 23,754 | |||||||||
| Shareholder servicing agent fees |
1,964 | 7,644 | 7,510 | |||||||||
| Shelf offering costs |
– | 80,000 | – | |||||||||
| Other |
788 | 18,784 | 2,359 | |||||||||
| Total liabilities |
1,939,191 | 247,330,961 | 332,062,260 | |||||||||
| Commitments and contingencies(1) |
||||||||||||
| Net assets applicable to common shares |
$ | 161,239,352 | $ | 337,745,923 | $ | 439,647,763 | ||||||
| |
18,886,052 | 37,217,802 | ||||||||||
| Net asset value (“NAV”) per common share outstanding |
$ | 8.54 | $ | 10.88 | $ | 11.81 | ||||||
| NET ASSETS APPLICABLE TO COMMON SHARES CONSIST OF: |
||||||||||||
| Common shares, $0.01 par value per share |
$ | 188,861 | $ | 310,435 | $ | 372,178 | ||||||
| Paid‑in capital |
178,431,300 | 422,608,795 | 501,380,791 | |||||||||
| Total distributable earnings (loss) |
(17,380,809 | ) | (85,173,307 | ) | (62,105,206 | ) | ||||||
| Net assets applicable to common shares |
$ | 161,239,352 | $ | 337,745,923 | $ | 439,647,763 | ||||||
| Authorized shares: |
||||||||||||
| Common |
Unlimited | Unlimited | Unlimited | |||||||||
| Preferred |
— | Unlimited | Unlimited | |||||||||
| † Long-term investments, cost |
$ | 164,114,977 | $ | 600,913,377 | $ | 793,467,188 | ||||||
| ◇ Short-term investments, cost |
$ | 3,500,000 | $ | – | – | |||||||
| * AMTP Shares, liquidation preference |
$ | – | $ | 127,000,000 | – | |||||||
| *** VRDP Shares, liquidation preference |
$ | – | $ | 89,000,000 | $ | 217,500,000 | ||||||
| # Net of discount of |
$ | – | $ | – | $ | 1,052,571 | ||||||
| (1) | As disclosed in Notes to Financial Statements. |
| (2) | Refer to Note 4 of the Notes to Financial Statements for more information. |
See Notes to Financial Statements
| 129 |
Statement of Operations
| Year Ended August 31, 2025 | NAZ | NKX | NCA | NAC | NXJ | |||||||||||||||
| INVESTMENT INCOME |
||||||||||||||||||||
| Interest |
$ | 9,586,572 | $ | 46,561,158 | $ | 13,183,892 | $ | 134,751,286 | $ | 37,357,152 | ||||||||||
| Total investment income |
9,586,572 | 46,561,158 | 13,183,892 | 134,751,286 | 37,357,152 | |||||||||||||||
| EXPENSES |
||||||||||||||||||||
| Management fees |
1,365,094 | 5,926,051 | 1,468,117 | 16,467,362 | 5,171,763 | |||||||||||||||
| Shareholder servicing agent fees |
16,220 | 12,235 | 7,921 | 45,388 | 13,345 | |||||||||||||||
| Interest expense and amortization of offering costs |
3,364,763 | 13,383,097 | 33,135 | 43,736,022 | 14,719,516 | |||||||||||||||
| Trustees fees |
8,595 | 37,804 | 11,502 | 110,523 | 32,186 | |||||||||||||||
| Custodian expenses, net |
6,847 | 13,956 | — | 89,681 | 53,940 | |||||||||||||||
| Excise tax liability expense |
— | 448 | — | 29,357 | 2,832 | |||||||||||||||
| Investor relations expenses |
24,633 | 95,147 | 12,164 | 251,128 | 93,662 | |||||||||||||||
| Liquidity fees |
— | 1,983,040 | — | 3,813,963 | — | |||||||||||||||
| Professional fees |
61,152 | 218,608 | 54,404 | 256,183 | 152,185 | |||||||||||||||
| Remarketing fees |
— | 664,967 | — | 504,815 | — | |||||||||||||||
| Shareholder reporting expenses |
22,807 | 41,298 | 34,709 | 83,502 | 62,130 | |||||||||||||||
| Stock exchange listing fees |
7,716 | 15,041 | 10,493 | 45,779 | 13,044 | |||||||||||||||
| Other |
43,167 | 118,212 | 11,579 | 168,036 | 53,028 | |||||||||||||||
| Total expenses |
4,920,994 | 22,509,904 | 1,644,024 | 65,601,739 | 20,367,631 | |||||||||||||||
| Net investment income (loss) |
4,665,578 | 24,051,254 | 11,539,868 | 69,149,547 | 16,989,521 | |||||||||||||||
| REALIZED AND UNREALIZED GAIN (LOSS) |
||||||||||||||||||||
| Realized gain (loss) from: |
||||||||||||||||||||
| Investments |
(831,469 | ) | (3,750,023 | ) | (764,730 | ) | (11,056,790 | ) | (2,866,267 | ) | ||||||||||
| Net realized gain (loss) |
(831,469 | ) | (3,750,023 | ) | (764,730 | ) | (11,056,790 | ) | (2,866,267 | ) | ||||||||||
| Change in unrealized appreciation (depreciation) on: |
||||||||||||||||||||
| Investments |
(11,152,391 | ) | (57,718,350 | ) | (17,888,504 | ) | (176,332,870 | ) | (33,829,130 | ) | ||||||||||
| Net change in unrealized appreciation (depreciation) |
(11,152,391 | ) | (57,718,350 | ) | (17,888,504 | ) | (176,332,870 | ) | (33,829,130 | ) | ||||||||||
| Net realized and unrealized gain (loss) |
(11,983,860 | ) | (61,468,373 | ) | (18,653,234 | ) | (187,389,660 | ) | (36,695,397 | ) | ||||||||||
| Net increase (decrease) in net assets applicable to common shares from operations |
$ | (7,318,282 | ) | $ | (37,417,119 | ) | $ | (7,113,366 | ) | $ | (118,240,113 | ) | $ | (19,705,876 | ) | |||||
See Notes to Financial Statements
| 130 |
Statement of Operations (continued)
| Year Ended August 31, 2025 | NRK | NNY | NAN | NQP | ||||||||||||
| INVESTMENT INCOME |
||||||||||||||||
| Interest |
$ | 76,695,840 | $ | 7,657,050 | $ | 28,795,244 | $ | 33,260,784 | ||||||||
| Total investment income |
76,695,840 | 7,657,050 | 28,795,244 | 33,260,784 | ||||||||||||
| EXPENSES |
||||||||||||||||
| Management fees |
9,439,942 | 820,753 | 3,567,760 | 4,621,356 | ||||||||||||
| Shareholder servicing agent fees |
45,169 | 8,303 | 33,992 | 35,334 | ||||||||||||
| Interest expense and amortization of offering costs |
20,381,519 | 16,603 | 8,897,129 | 12,401,515 | ||||||||||||
| Trustees fees |
62,159 | 6,315 | 21,949 | 26,158 | ||||||||||||
| Custodian expenses, net |
11,343 | 8,140 | 53,775 | 69,555 | ||||||||||||
| Excise tax liability expense |
10,126 | — | — | 17,921 | ||||||||||||
| Investor relations expenses |
156,825 | 6,747 | 67,209 | 89,329 | ||||||||||||
| Liquidity fees |
4,535,261 | — | 735,244 | — | ||||||||||||
| Professional fees |
185,696 | 49,722 | 91,727 | 114,968 | ||||||||||||
| Remarketing fees |
676,954 | — | 44,871 | — | ||||||||||||
| Shareholder reporting expenses |
504,968 | 22,859 | 30,366 | 64,901 | ||||||||||||
| Stock exchange listing fees |
27,594 | 7,716 | 9,754 | 11,774 | ||||||||||||
| Other |
149,195 | 11,557 | 76,128 | 79,859 | ||||||||||||
| Total expenses |
36,186,751 | 958,715 | 13,629,904 | 17,532,670 | ||||||||||||
| Net investment income (loss) |
40,509,089 | 6,698,335 | 15,165,340 | 15,728,114 | ||||||||||||
| REALIZED AND UNREALIZED GAIN (LOSS) |
||||||||||||||||
| Realized gain (loss) from: |
||||||||||||||||
| Investments |
(2,530,510 | ) | (163,189 | ) | (1,953,164 | ) | 14,663,304 | |||||||||
| Swap contracts |
— | — | — | (10,619,714 | ) | |||||||||||
| Net realized gain (loss) |
(2,530,510 | ) | (163,189 | ) | (1,953,164 | ) | 4,043,590 | |||||||||
| Change in unrealized appreciation (depreciation) on: |
||||||||||||||||
| Investments |
(115,012,924 | ) | (9,797,640 | ) | (36,361,886 | ) | (54,725,443 | ) | ||||||||
| Swap contracts |
— | — | — | 724,120 | ||||||||||||
| Net change in unrealized appreciation (depreciation) |
(115,012,924 | ) | (9,797,640 | ) | (36,361,886 | ) | (54,001,323 | ) | ||||||||
| Net realized and unrealized gain (loss) |
(117,543,434 | ) | (9,960,829 | ) | (38,315,050 | ) | (49,957,733 | ) | ||||||||
| Net increase (decrease) in net assets applicable to common shares from operations |
$ | (77,034,345 | ) | $ | (3,262,494 | ) | $ | (23,149,710 | ) | $ | (34,229,619 | ) | ||||
See Notes to Financial Statements
| 131 |
Statement of Changes in Net Assets
| NAZ | ||||||||||||
| Year Ended 8/31/25 |
Six Months Ended 8/31/24 |
Year Ended 2/29/24 |
||||||||||
| OPERATIONS |
||||||||||||
| Net investment income (loss) |
$ | 4,665,578 | $ | 1,982,295 | $ | 3,994,419 | ||||||
| Net realized gain (loss) |
(831,469 | ) | (180,610 | ) | (2,511,548 | ) | ||||||
| Net change in unrealized appreciation (depreciation) |
(11,152,391 | ) | 1,443,091 | 7,054,001 | ||||||||
| Net increase (decrease) in net assets applicable to common shares from operations |
(7,318,282 | ) | 3,244,776 | 8,536,872 | ||||||||
| DISTRIBUTIONS TO COMMON SHAREHOLDERS |
||||||||||||
| Dividends |
(4,670,083 | ) | (2,403,327 | ) | (4,405,935 | ) | ||||||
| Return of Capital |
(5,502,803 | ) | (1,595,349 | ) | (161,896 | ) | ||||||
| Total distributions |
(10,172,886 | ) | (3,998,676 | ) | (4,567,831 | ) | ||||||
| CAPITAL SHARE TRANSACTIONS |
||||||||||||
| Common shares: |
||||||||||||
| Proceeds from shelf offering, net of offering costs |
5,699,157 | – | – | |||||||||
| Reinvestments of distributions |
199,112 | – | – | |||||||||
| Cost of shares repurchased and retired |
– | – | (54,777 | ) | ||||||||
| Net increase (decrease) applicable to common shares from capital share transactions |
5,898,269 | – | (54,777 | ) | ||||||||
| Net increase (decrease) in net assets applicable to common shares |
(11,592,899 | ) | (753,900 | ) | 3,914,264 | |||||||
| Net assets applicable to common shares at the beginning of the period |
146,173,795 | 146,927,695 | 143,013,431 | |||||||||
| Net assets applicable to common shares at the end of the period |
$ | 134,580,896 | $ | 146,173,795 | $ | 146,927,695 | ||||||
See Notes to Financial Statements
| 132 |
| NKX | ||||||||||||
| Year Ended 8/31/25 |
Six Months Ended 8/31/24 |
Year Ended 2/29/24 |
||||||||||
| OPERATIONS |
||||||||||||
| Net investment income (loss) |
$ | 24,051,254 | $ | 10,640,503 | $ | 21,770,793 | ||||||
| Net realized gain (loss) |
(3,750,023 | ) | (1,361,689 | ) | (4,411,470 | ) | ||||||
| Net change in unrealized appreciation (depreciation) |
(57,718,350 | ) | 5,052,178 | 23,058,438 | ||||||||
| Net increase (decrease) in net assets applicable to common shares from operations |
(37,417,119 | ) | 14,330,992 | 40,417,761 | ||||||||
| DISTRIBUTIONS TO COMMON SHAREHOLDERS |
||||||||||||
| Dividends |
(23,818,712 | ) | (11,926,188 | ) | (24,425,453 | ) | ||||||
| Return of Capital |
(20,059,831 | ) | (6,179,059 | ) | – | |||||||
| Total distributions |
(43,878,543 | ) | (18,105,247 | ) | (24,425,453 | ) | ||||||
| CAPITAL SHARE TRANSACTIONS |
||||||||||||
| Common shares: |
||||||||||||
| Proceeds from shelf offering, net of offering costs |
24,501,438 | – | – | |||||||||
| Reinvestments of distributions |
1,748,791 | – | – | |||||||||
| Net increase (decrease) applicable to common shares from capital share transactions |
26,250,229 | – | – | |||||||||
| Net increase (decrease) in net assets applicable to common shares |
(55,045,433 | ) | (3,774,255 | ) | 15,992,308 | |||||||
| Net assets applicable to common shares at the beginning of the period |
629,445,892 | 633,220,147 | 617,227,839 | |||||||||
| Net assets applicable to common shares at the end of the period |
$ | 574,400,459 | $ | 629,445,892 | $ | 633,220,147 | ||||||
See Notes to Financial Statements
| 133 |
Statement of Changes in Net Assets (continued)
| NCA | ||||||||||||
| Year Ended 8/31/25 |
Six Months Ended 8/31/24 |
Year Ended 2/29/24 |
||||||||||
| OPERATIONS |
||||||||||||
| Net investment income (loss) |
$ | 11,539,868 | $ | 5,702,604 | $ | 11,546,054 | ||||||
| Net realized gain (loss) |
(764,730 | ) | (434,262 | ) | (1,746,380 | ) | ||||||
| Net change in unrealized appreciation (depreciation) |
(17,888,504 | ) | 1,006,720 | 7,735,274 | ||||||||
| Net increase (decrease) in net assets applicable to common shares from operations |
(7,113,366 | ) | 6,275,062 | 17,534,948 | ||||||||
| DISTRIBUTIONS TO COMMON SHAREHOLDERS |
||||||||||||
| Dividends |
(11,521,652 | ) | (5,760,826 | ) | (11,521,653 | ) | ||||||
| Total distributions |
(11,521,652 | ) | (5,760,826 | ) | (11,521,653 | ) | ||||||
| Net increase (decrease) in net assets applicable to common shares |
(18,635,018 | ) | 514,236 | 6,013,295 | ||||||||
| Net assets applicable to common shares at the beginning of the period |
311,670,345 | 311,156,109 | 305,142,814 | |||||||||
| Net assets applicable to common shares at the end of the period |
$ | 293,035,327 | $ | 311,670,345 | $ | 311,156,109 | ||||||
See Notes to Financial Statements
| 134 |
| NAC | ||||||||||||
| Year Ended 8/31/25 |
Six Months Ended 8/31/24 |
Year Ended 2/29/24 |
||||||||||
| OPERATIONS |
||||||||||||
| Net investment income (loss) |
$ | 69,149,547 | $ | 30,634,577 | $ | 62,721,594 | ||||||
| Net realized gain (loss) |
(11,056,790 | ) | (2,377,814 | ) | (16,440,501 | ) | ||||||
| Net change in unrealized appreciation (depreciation) |
(176,332,870 | ) | 14,864,584 | 65,112,604 | ||||||||
| Net increase (decrease) in net assets applicable to common shares from operations |
(118,240,113 | ) | 43,121,347 | 111,393,697 | ||||||||
| DISTRIBUTIONS TO COMMON SHAREHOLDERS |
||||||||||||
| Dividends |
(68,173,750 | ) | (34,524,644 | ) | (64,709,406 | ) | ||||||
| Return of Capital |
(59,498,838 | ) | (18,660,712 | ) | (2,155,459 | ) | ||||||
| Total distributions |
(127,672,588 | ) | (53,185,356 | ) | (66,864,865 | ) | ||||||
| CAPITAL SHARE TRANSACTIONS |
||||||||||||
| Common shares: |
||||||||||||
| Proceeds from shelf offering, net of offering costs |
11,173,911 | — | — | |||||||||
| Cost of shares repurchased and retired |
– | – | (129,790 | ) | ||||||||
| Net increase (decrease) applicable to common shares from capital share transactions |
11,173,911 | — | (129,790 | ) | ||||||||
| Net increase (decrease) in net assets applicable to common shares |
(234,738,790 | ) | (10,064,009 | ) | 44,399,042 | |||||||
| Net assets applicable to common shares at the beginning of the period |
1,846,086,670 | 1,856,150,679 | 1,811,751,637 | |||||||||
| Net assets applicable to common shares at the end of the period |
$ | 1,611,347,880 | $ | 1,846,086,670 | $ | 1,856,150,679 | ||||||
See Notes to Financial Statements
| 135 |
Statement of Changes in Net Assets (continued)
| NXJ | ||||||||||||
| Year Ended 8/31/25 |
Six Months Ended 8/31/24 |
Year Ended 2/29/24 |
||||||||||
| OPERATIONS |
||||||||||||
| Net investment income (loss) |
$ | 16,989,521 | $ | 7,621,231 | $ | 14,928,313 | ||||||
| Net realized gain (loss) |
(2,866,267 | ) | (2,906,584 | ) | (3,587,320 | ) | ||||||
| Net change in unrealized appreciation (depreciation) |
(33,829,130 | ) | 1,894,524 | 25,807,149 | ||||||||
| Net increase (decrease) in net assets applicable to common shares from operations |
(19,705,876 | ) | 6,609,171 | 37,148,142 | ||||||||
| DISTRIBUTIONS TO COMMON SHAREHOLDERS |
||||||||||||
| Dividends |
(16,622,814 | ) | (9,313,017 | ) | (14,725,528 | ) | ||||||
| Return of Capital |
(22,218,611 | ) | (6,149,334 | ) | (1,133,097 | ) | ||||||
| Total distributions |
(38,841,425 | ) | (15,462,351 | ) | (15,858,625 | ) | ||||||
| Common shares: |
||||||||||||
| Cost of shares repurchased and retired |
– | – | (2,862,180 | ) | ||||||||
| Net increase (decrease) applicable to common shares from capital share transactions |
— | — | (2,862,180 | ) | ||||||||
| Net increase (decrease) in net assets applicable to common shares |
(58,547,301 | ) | (8,853,180 | ) | 18,427,337 | |||||||
| Net assets applicable to common shares at the beginning of the period |
563,766,087 | 572,619,267 | 554,191,930 | |||||||||
| Net assets applicable to common shares at the end of the period |
$ | 505,218,786 | $ | 563,766,087 | $ | 572,619,267 | ||||||
See Notes to Financial Statements
| 136 |
| NRK | ||||||||||||
| Year Ended 8/31/25 |
Six Months Ended 8/31/24 |
Year Ended 2/29/24 |
||||||||||
| OPERATIONS |
||||||||||||
| Net investment income (loss) |
$ | 40,509,089 | $ | 18,291,973 | $ | 35,891,122 | ||||||
| Net realized gain (loss) |
(2,530,510 | ) | (121,479 | ) | (16,799,158 | ) | ||||||
| Net change in unrealized appreciation (depreciation) |
(115,012,924 | ) | (1,927,007 | ) | 54,973,374 | |||||||
| Net increase (decrease) in net assets applicable to common shares from operations |
(77,034,345 | ) | 16,243,487 | 74,065,338 | ||||||||
| DISTRIBUTIONS TO COMMON SHAREHOLDERS |
||||||||||||
| Dividends |
(39,862,750 | ) | (20,632,295 | ) | (38,383,535 | ) | ||||||
| Return of Capital |
(32,368,083 | ) | (9,594,738 | ) | – | |||||||
| Total distributions |
(72,230,833 | ) | (30,227,033 | ) | (38,383,535 | ) | ||||||
| Net increase (decrease) in net assets applicable to common shares |
(149,265,178 | ) | (13,983,546 | ) | 35,681,803 | |||||||
| Net assets applicable to common shares at the beginning of the period |
1,048,032,440 | 1,062,015,986 | 1,026,334,183 | |||||||||
| Net assets applicable to common shares at the end of the period |
$ | 898,767,262 | $ | 1,048,032,440 | $ | 1,062,015,986 | ||||||
See Notes to Financial Statements
| 137 |
Statement of Changes in Net Assets (continued)
| NNY | ||||||||||||
| Year Ended 8/31/25 |
Six Months Ended 8/31/24 |
Year Ended 2/29/24 |
||||||||||
| OPERATIONS |
||||||||||||
| Net investment income (loss) |
$ | 6,698,335 | $ | 3,288,116 | $ | 6,416,653 | ||||||
| Net realized gain (loss) |
(163,189 | ) | (4,845 | ) | (1,495,353 | ) | ||||||
| Net change in unrealized appreciation (depreciation) |
(9,797,640 | ) | (69,026 | ) | 4,783,598 | |||||||
| Net increase (decrease) in net assets applicable to common shares from operations |
(3,262,494 | ) | 3,214,245 | 9,704,898 | ||||||||
| DISTRIBUTIONS TO COMMON SHAREHOLDERS |
||||||||||||
| Dividends |
(6,685,663 | ) | (3,172,856 | ) | (6,307,941 | ) | ||||||
| Total distributions |
(6,685,663 | ) | (3,172,856 | ) | (6,307,941 | ) | ||||||
| Net increase (decrease) in net assets applicable to common shares |
(9,948,157 | ) | 41,389 | 3,396,957 | ||||||||
| Net assets applicable to common shares at the beginning of the period |
171,187,509 | 171,146,120 | 167,749,163 | |||||||||
| Net assets applicable to common shares at the end of the period |
$ | 161,239,352 | $ | 171,187,509 | $ | 171,146,120 | ||||||
See Notes to Financial Statements
| 138 |
| NAN | ||||||||||||
| Year Ended 8/31/25 |
Six Months Ended 8/31/24 |
Year Ended 2/29/24 |
||||||||||
| OPERATIONS |
||||||||||||
| Net investment income (loss) |
$ | 15,165,340 | $ | 7,025,206 | $ | 13,376,542 | ||||||
| Net realized gain (loss) |
(1,953,164 | ) | (155,900 | ) | (8,913,835 | ) | ||||||
| Net change in unrealized appreciation (depreciation) |
(36,361,886 | ) | 127,421 | 21,480,051 | ||||||||
| Net increase (decrease) in net assets applicable to common shares from operations |
(23,149,710 | ) | 6,996,727 | 25,942,758 | ||||||||
| DISTRIBUTIONS TO COMMON SHAREHOLDERS |
||||||||||||
| Dividends |
(14,970,712 | ) | (7,823,102 | ) | (14,373,601 | ) | ||||||
| Return of Capital |
(11,680,591 | ) | (3,324,232 | ) | - | |||||||
| Total distributions |
(26,651,303 | ) | (11,147,334 | ) | (14,373,601 | ) | ||||||
| CAPITAL SHARE TRANSACTIONS |
||||||||||||
| Common shares: |
||||||||||||
| Proceeds from shelf offering, net of offering costs |
1,811,164 | — | — | |||||||||
| Reinvestments of distributions |
444,021 | — | — | |||||||||
| Cost of shares repurchased and retired |
- | - | (147,986 | ) | ||||||||
| Net increase (decrease) applicable to common shares from capital share transactions |
2,255,185 | — | (147,986 | ) | ||||||||
| Net increase (decrease) in net assets applicable to common shares |
(47,545,828 | ) | (4,150,607 | ) | 11,421,171 | |||||||
| Net assets applicable to common shares at the beginning of the period |
385,291,751 | 389,442,358 | 378,021,187 | |||||||||
| Net assets applicable to common shares at the end of the period |
$ | 337,745,923 | $ | 385,291,751 | $ | 389,442,358 | ||||||
See Notes to Financial Statements
| 139 |
Statement of Changes in Net Assets (continued)
| NQP | ||||||||||||
| Year Ended 8/31/25 |
Six Months Ended 8/31/24 |
Year Ended 2/29/24 |
||||||||||
| OPERATIONS |
||||||||||||
| Net investment income (loss) |
$ | 15,728,114 | $ | 5,919,410 | $ | 12,616,649 | ||||||
| Net realized gain (loss) |
4,043,590 | 5,358,234 | (4,875,475 | ) | ||||||||
| Net change in unrealized appreciation (depreciation) |
(54,001,323 | ) | 5,036,324 | 24,812,407 | ||||||||
| Net increase (decrease) in net assets applicable to common shares from operations |
(34,229,619 | ) | 16,313,968 | 32,553,581 | ||||||||
| DISTRIBUTIONS TO COMMON SHAREHOLDERS |
||||||||||||
| Dividends |
(16,596,680 | ) | (7,526,922 | ) | (12,498,590 | ) | ||||||
| Return of Capital |
(18,239,183 | ) | (6,262,274 | ) | (988,269 | ) | ||||||
| Total distributions |
(34,835,863 | ) | (13,789,196 | ) | (13,486,859 | ) | ||||||
| Common shares: |
||||||||||||
| Cost of shares repurchased and retired |
- | - | (1,858,206 | ) | ||||||||
| Net increase (decrease) applicable to common shares from capital share transactions |
— | — | (1,858,206 | ) | ||||||||
| Net increase (decrease) in net assets applicable to common shares |
(69,065,482 | ) | 2,524,772 | 17,208,516 | ||||||||
| Net assets applicable to common shares at the beginning of the period |
508,713,245 | 506,188,473 | 488,979,957 | |||||||||
| Net assets applicable to common shares at the end of the period |
$ | 439,647,763 | $ | 508,713,245 | $ | 506,188,473 | ||||||
See Notes to Financial Statements
| 140 |
Statement of Cash Flows
| Year Ended August 31, 2025 | NAZ | NKX | NAC | NXJ | NRK | |||||||||||||||
| CASH FLOWS FROM OPERATING ACTIVITIES |
||||||||||||||||||||
| Net Increase (Decrease) in Net Assets Applicable to Common Shares from Operations | $ | (7,318,282 | ) | $ | (37,417,119 | ) | $ | (118,240,113 | ) | $ | (19,705,876 | ) | $ | (77,034,345 | ) | |||||
| Adjustments to reconcile the net increase (decrease) in net assets applicable to common shares from operations to net cash provided by (used in) operating activities: |
||||||||||||||||||||
| Purchases of investments |
(47,825,016 | ) | (195,612,589 | ) | (497,715,637 | ) | (151,136,455 | ) | (171,355,025 | ) | ||||||||||
| Proceeds from sale and maturities of investments |
50,789,551 | 197,134,975 | 569,076,876 | 151,956,808 | 217,541,995 | |||||||||||||||
| Proceeds from (Purchase of) short-term investments, net |
3,505,000 | (16,000,000 | ) | (17,100,000 | ) | 22,040,000 | (11,765,000 | ) | ||||||||||||
| Proceeds from litigation settlement |
319 | — | — | — | — | |||||||||||||||
| Amortization (Accretion) of premiums and discounts, net |
1,069,247 | (3,827,073 | ) | (3,479,979 | ) | (731,303 | ) | (2,922,366 | ) | |||||||||||
| Amortization of deferred offering costs |
8,690 | (276,541 | ) | (20,307 | ) | 60,283 | 107,284 | |||||||||||||
| (Increase) Decrease in: |
||||||||||||||||||||
| Receivable for interest |
(66,337 | ) | 494,051 | 2,056,179 | 738,049 | 618,764 | ||||||||||||||
| Receivable for investments sold |
(4,055,767 | ) | (76,341 | ) | 6,629,522 | 13,272,930 | (1,266,045 | ) | ||||||||||||
| Other assets |
3,454 | 80,843 | 121,626 | 48,892 | 104,971 | |||||||||||||||
| Increase (Decrease) in: |
||||||||||||||||||||
| Payable for interest |
51 | (511,813 | ) | (657,969 | ) | (799,669 | ) | (261,584 | ) | |||||||||||
| Payable for investments purchased - when-issued/delayed-delivery settlement |
(1,746,754 | ) | 3,699,930 | 8,248,400 | (2,102,786 | ) | — | |||||||||||||
| Payable for management fees |
(6,281 | ) | (37,574 | ) | (119,154 | ) | (28,609 | ) | (77,912 | ) | ||||||||||
| Accrued custodian fees |
(3,038 | ) | (46,213 | ) | (63,390 | ) | (9,457 | ) | (9,112 | ) | ||||||||||
| Accrued investor relations fees |
3,583 | 10,567 | 29,311 | 14,275 | 19,902 | |||||||||||||||
| Accrued Trustees fees |
1,477 | (3,222 | ) | (18,020 | ) | (3,958 | ) | (8,854 | ) | |||||||||||
| Accrued professional fees |
28,481 | 33,636 | 2,910 | 6,165 | 30,130 | |||||||||||||||
| Accrued shareholder reporting expenses |
2,629 | 2,099 | 1,164 | 998 | 18,649 | |||||||||||||||
| Accrued shareholder servicing agent fees |
1,591 | 1,632 | 5,810 | 6,179 | 6,076 | |||||||||||||||
| Accrued shelf offering costs |
— | — | 90,000 | — | — | |||||||||||||||
| Accrued other expenses |
214 | (327 | ) | (3,835 | ) | 2,500 | 16,401 | |||||||||||||
| Net realized (gain) loss from investments |
831,469 | 3,750,023 | 11,056,790 | 2,866,267 | 2,530,510 | |||||||||||||||
| Net change in unrealized (appreciation) depreciation of investments |
11,152,391 | 57,718,350 | 176,332,870 | 33,829,130 | 115,012,924 | |||||||||||||||
| Net cash provided by (used in) operating activities |
6,376,672 | 9,117,294 | 136,233,054 | 50,324,363 | 71,307,363 | |||||||||||||||
| CASH FLOWS FROM FINANCING ACTIVITIES |
||||||||||||||||||||
| Proceeds from borrowings |
6,353,180 | 13,723,440 | 163,724,127 | 8,282,468 | 12,522,490 | |||||||||||||||
| (Repayments) of borrowings |
(6,353,180 | ) | (13,723,440 | ) | (163,724,127 | ) | (8,282,468 | ) | (12,522,490 | ) | ||||||||||
| Proceeds from floating rate obligations |
— | — | 10,880,000 | 11,775,000 | 8,000,000 | |||||||||||||||
| (Repayments of) floating rate obligations |
— | — | (10,875,000 | ) | (11,980,000 | ) | (8,000,000 | ) | ||||||||||||
| (Repayments for) MFP Shares redeemed, at liquidation preference |
— | — | (18,000,000 | ) | — | — | ||||||||||||||
| (Payments for) deferred offering costs |
(90,440 | ) | (73,428 | ) | (85,265 | ) | — | — | ||||||||||||
| Increase (Decrease) in: |
||||||||||||||||||||
| Cash overdraft |
(2,049,096 | ) | 7,197,693 | (1,656,317 | ) | (11,030,861 | ) | 945,157 | ||||||||||||
| Cash distributions paid to common shareholders |
(9,936,293 | ) | (41,962,075 | ) | (127,670,383 | ) | (38,888,202 | ) | (72,252,520 | ) | ||||||||||
| Proceeds from shelf offering, net of offering costs |
5,699,157 | 24,501,438 | 11,173,911 | — | — | |||||||||||||||
| Net cash provided by (used in) financing activities |
(6,376,672 | ) | (10,336,372 | ) | (136,233,054 | ) | (50,124,063 | ) | (71,307,363 | ) | ||||||||||
| Net increase (decrease) in cash |
- | (1,219,078 | ) | - | 200,300 | - | ||||||||||||||
| Cash at the beginning of period |
— | 1,219,078 | — | — | — | |||||||||||||||
| Cash at the end of period |
$ | — | $ | — | $ | — | $ | 200,300 | $ | — | ||||||||||
See Notes to Financial Statements
| 141 |
Statement of Cash Flows (continued)
| Year Ended August 31, 2025 | NAN | NQP | ||||||
| CASH FLOWS FROM OPERATING ACTIVITIES |
||||||||
| Net Increase (Decrease) in Net Assets Applicable to Common Shares from Operations |
$ | (23,149,710 | ) | $ | (34,229,619 | ) | ||
| Adjustments to reconcile the net increase (decrease) in net assets applicable to common shares from operations to net cash provided by (used in) operating activities: |
||||||||
| Purchases of investments |
(83,317,352 | ) | (134,871,306 | ) | ||||
| Proceeds from sale and maturities of investments |
91,243,188 | 196,516,366 | ||||||
| Proceeds from (Purchase of) short-term investments, net |
— | 1,400,000 | ||||||
| Proceeds from litigation settlement |
— | 295 | ||||||
| Amortization (Accretion) of premiums and discounts, net |
608,202 | 1,723,836 | ||||||
| Amortization of deferred offering costs |
(106,779 | ) | 34,397 | |||||
| (Increase) Decrease in: |
||||||||
| Receivable for interest |
634,829 | 1,487,322 | ||||||
| Receivable for investments sold |
901,613 | 2,752,854 | ||||||
| Receivable for sale of Vistra Vision |
— | (21,380,811 | ) | |||||
| Other assets |
31,443 | 30,141 | ||||||
| Increase (Decrease) in: |
||||||||
| Payable for interest |
(509,545 | ) | (1,630,517 | ) | ||||
| Payable for investments purchased - when-issued/delayed-delivery settlement |
— | (20,534,434 | ) | |||||
| Payable for management fees |
(24,296 | ) | (31,964 | ) | ||||
| Payable for Vistra Vision sale transactions costs |
— | 522,328 | ||||||
| Accrued custodian fees |
(2,688 | ) | (2,980 | ) | ||||
| Accrued investor relations fees |
8,281 | 11,531 | ||||||
| Accrued Trustees fees |
(1,444 | ) | (3,674 | ) | ||||
| Accrued professional fees |
22,353 | 22,229 | ||||||
| Accrued shareholder reporting expenses |
(1,037 | ) | 526 | |||||
| Accrued shareholder servicing agent fees |
3,694 | 4,497 | ||||||
| Accrued shelf offering costs |
80,000 | — | ||||||
| Accrued other expenses |
18,530 | 2,137 | ||||||
| Net realized (gain) loss from investments |
1,953,164 | (14,663,304 | ) | |||||
| Net change in unrealized (appreciation) depreciation of investments |
36,361,886 | 54,725,443 | ||||||
| Net change in unrealized (appreciation) depreciation of swap contracts |
— | (724,120 | ) | |||||
| Net cash provided by (used in) operating activities |
24,754,332 | 31,161,173 | ||||||
| CASH FLOWS FROM FINANCING ACTIVITIES |
||||||||
| Proceeds from borrowings |
7,075,131 | 7,746,323 | ||||||
| (Repayments) of borrowings |
(7,075,131 | ) | (7,746,323 | ) | ||||
| Proceeds from floating rate obligations |
8,000,000 | 21,800,000 | ||||||
| (Repayments of) floating rate obligations |
(8,000,000 | ) | (23,450,000 | ) | ||||
| (Payments for) deferred offering costs |
(77,177 | ) | — | |||||
| Increase (Decrease) in: |
||||||||
| Cash overdraft |
(280,999 | ) | 3,600,833 | |||||
| Cash distributions paid to common shareholders |
(26,207,320 | ) | (34,838,392 | ) | ||||
| Proceeds from shelf offering, net of offering costs |
1,811,164 | — | ||||||
| Net cash provided by (used in) financing activities |
(24,754,332 | ) | (32,887,559 | ) | ||||
| Net increase (decrease) in cash |
- | (1,726,386 | ) | |||||
| Cash at the beginning of period |
— | 1,726,386 | ||||||
| Cash at the end of period |
$ | — | $ | — | ||||
| SUPPLEMENTAL DISCLOSURE OF CASH FLOW INFORMATION | NAZ | NKX | NAC | NXJ | ||||||||||||
| Cash paid for interest |
$ | 3,301,403 | $ | 13,687,051 | $ | 44,023,222 | $ | 15,353,774 | ||||||||
| Non‑cash financing activities not included herein consists of reinvestments of common share distributions |
199,112 | 1,748,791 | — | — | ||||||||||||
| SUPPLEMENTAL DISCLOSURE OF CASH FLOW INFORMATION | NRK | NAN | NQP | |||||||||||||
| Cash paid for interest |
$ | 20,366,198 | $ | 9,260,466 | $ | 13,895,605 | ||||||||||
| Non‑cash financing activities not included herein consists of reinvestments of common share distributions |
— | 444,021 | — | |||||||||||||
See Notes to Financial Statements
| 142 |
[This page intentionally left blank.]
143
Financial Highlights
The following data is for a common share outstanding for each fiscal year end unless otherwise noted:
| Investment Operations | Less Distributions to Common Shareholders |
Common Share | ||||||||||||||||||||||||||||||||||||||||
| Common Share Net Asset Value, Beginning of Period |
Net Investment Income (NII) (Loss)(a) |
Net Realized/ Unrealized Gain (Loss) |
Total | From NII |
From Net Realized Gains |
Return of Capital |
Total | Discount Per Share Repurchased and Retired |
Net Asset Value, End of Period |
Share Price, End of Period | ||||||||||||||||||||||||||||||||
| NAZ |
||||||||||||||||||||||||||||||||||||||||||
| 8/31/25 |
$12.61 | $0.40 | $(1.02) | $(0.62) | $(0.40) | $— | $(0.47) | $(0.87) | $— | $11.12 | $11.86 | |||||||||||||||||||||||||||||||
| 8/31/24(d) |
12.68 | 0.17 | 0.11 | 0.28 | (0.21) | — | (0.14) | (0.35) | — | 12.61 | 11.66 | |||||||||||||||||||||||||||||||
| 2/29/24 |
12.33 | 0.34 | 0.40 | 0.74 | (0.38) | — | (0.01) | (0.39) | —(f) | 12.68 | 10.83 | |||||||||||||||||||||||||||||||
| 2/28/23 |
14.50 | 0.47 | (2.12) | (1.65) | (0.52) | — | — | (0.52) | — | 12.33 | 11.30 | |||||||||||||||||||||||||||||||
| 2/28/22 |
15.07 | 0.61 | (0.58) | 0.03 | (0.60) | — | — | (0.60) | — | 14.50 | 13.78 | |||||||||||||||||||||||||||||||
| 2/28/21 |
15.56 | 0.61 | (0.53) | 0.08 | (0.57) | — | — | (0.57) | — | 15.07 | 15.17 | |||||||||||||||||||||||||||||||
| NKX |
||||||||||||||||||||||||||||||||||||||||||
| 8/31/25 |
13.25 | 0.50 | (1.28) | (0.78) | (0.49) | — | (0.42) | (0.91) | — | 11.56 | 11.82 | |||||||||||||||||||||||||||||||
| 8/31/24(d) |
13.33 | 0.22 | 0.08 | 0.30 | (0.25) | — | (0.13) | (0.38) | — | 13.25 | 13.34 | |||||||||||||||||||||||||||||||
| 2/29/24 |
12.99 | 0.46 | 0.39 | 0.85 | (0.51) | — | — | (0.51) | — | 13.33 | 11.48 | |||||||||||||||||||||||||||||||
| 2/28/23 |
15.64 | 0.56 | (2.60) | (2.04) | (0.61) | — | — | (0.61) | — | 12.99 | 11.72 | |||||||||||||||||||||||||||||||
| 2/28/22 |
16.48 | 0.68 | (0.85) | (0.17) | (0.67) | — | — | (0.67) | — | 15.64 | 14.15 | |||||||||||||||||||||||||||||||
| 2/28/21 |
17.27 | 0.66 | (0.80) | (0.14) | (0.65) | — | — | (0.65) | — | 16.48 | 15.13 | |||||||||||||||||||||||||||||||
| (a) | Based on average shares outstanding. |
| (b) | Total Return Based on Common Share NAV is the combination of changes in common share NAV, reinvested distributions at Common Share NAV, if any. The last distribution declared in the period, which is typically paid on the first business day of the following month, is assumed to be reinvested at the ending NAV. The actual reinvest price for the last distribution declared in the period may often be based on the Fund’s market price (and not its NAV), and therefore may be different from the price used in the calculation. Total returns are not annualized. |
Total Return Based on Common Share Price is the combination of changes in the market price per share and the effect of reinvested distributions, if any, at the average price paid per share at the time of reinvestment. The last distribution declared in the period, which is typically paid on the first business day of the following month, is assumed to be reinvested at the ending market price. The actual reinvestment for the last distribution declared in the period may take place over several days, and in some instances may not be based on the market price, so the actual reinvestment price may be different from the price used in the calculation. Total returns are not annualized.
| (c) | • Net Investment Income (Loss) ratios reflect income earned and expenses incurred on assets attributable to borrowings, preferred shares and/or reverse repurchase agreements (as described in Notes to Financial Statements), where applicable. |
• The expense ratios reflect, among other things, all interest expense and other costs related to borrowings, preferred shares and/or reverse repurchase agreements (as described in Notes to Financial Statements) and/or the interest expense deemed to have been paid by the Fund on the floating rate certificates issued by the special purpose trusts for the self-deposited inverse floaters held by the Fund (as described in Notes to Financial Statements), where applicable, as follows:
| Ratios of Interest Expense to Average Net Assets Applicable to Common Shares |
||||
| NAZ |
||||
| 8/31/25 |
2.43% | |||
| 8/31/24(d) |
2.61(e) | |||
| 2/29/24 |
2.74 | |||
| 2/28/23 |
1.57 | |||
| 2/28/22 |
0.48 | |||
| 2/28/21 |
0.68 | |||
| NKX |
||||
| 8/31/25 |
2.68 | |||
| 8/31/24(d) |
2.96(e) | |||
| 2/29/24 |
2.99 | |||
| 2/28/23 |
1.76 | |||
| 2/28/22 |
0.49 | |||
| 2/28/21 |
0.74 |
| (d) | For the six months ended August 31, 2024. Prior to March 1, 2024, the Fund’s fiscal year end was February 28/29th. |
| (e) | Annualized. |
| (f) | Value rounded to zero. |
| 144 |
| Common Share Supplemental Data/ Ratios Applicable to Common Shares | ||||||||||
| Common Share Total Returns |
Ratios to Average Net Assets |
|||||||||
| Based on Net Asset Value(b) |
Based on Share Price(b) |
Net Assets, End of Period (000) |
Expenses(c) | Net Investment Income (Loss)(c) |
Portfolio Turnover Rate | |||||
| |
||||||||||
| (5.10)% | 9.53% | $134,581 | 3.55% | 3.37% | 21% | |||||
| 2.22 | 11.08 | 146,174 | 3.72 (e) | 2.70 (e) | 9 | |||||
| 6.17 | (0.56) | 146,928 | 3.85 | 2.80 | 11 | |||||
| (11.40) | (14.48) | 143,013 | 2.68 | 3.65 | 25 | |||||
| 0.09 | (5.49) | 167,972 | 1.52 | 3.98 | 7 | |||||
| 0.62 | 13.67 | 174,401 | 1.75 | 4.06 | 13 | |||||
| (6.12) | (4.64) | 574,400 | 3.77 | 4.02 | 19 | |||||
| 2.31 | 19.82 | 629,446 | 4.02 (e) | 3.37 (e) | 8 | |||||
| 6.77 | 2.54 | 633,220 | 4.02 | 3.57 | 26 | |||||
| (13.14) | (13.15) | 617,228 | 2.82 | 4.15 | 58 | |||||
| (1.19) | (2.44) | 742,993 | 1.51 | 4.10 | 9 | |||||
| (0.77) | 1.67 | 783,202 | 1.72 | 4.03 | 8 | |||||
See Notes to Financial Statements
| 145 |
Financial Highlights (continued)
The following data is for a common share outstanding for each fiscal year end unless otherwise noted:
| Investment Operations | Less Distributions to Common Shareholders |
Common Share | ||||||||||||||||||||||||||||||||||||||||
| Common Share Net Asset Value, Beginning of Period |
Net Investment Income (NII) (Loss)(a) |
Net Realized/ Unrealized Gain (Loss) |
Total | From NII |
From Net Realized Gains |
Return of Capital |
Total | Discount Per Share Repurchased and Retired |
Net Asset Value, End of Period |
Share Price, End of Period | ||||||||||||||||||||||||||||||||
| NCA |
||||||||||||||||||||||||||||||||||||||||||
| 8/31/25 |
$9.41 | $0.35 | $(0.56) | $(0.21) | $(0.35) | $— | $— | $(0.35) | $— | $8.85 | $8.52 | |||||||||||||||||||||||||||||||
| 8/31/24(d) |
9.40 | 0.17 | 0.01 | 0.18 | (0.17) | — | — | (0.17) | — | 9.41 | 8.97 | |||||||||||||||||||||||||||||||
| 2/29/24 |
9.22 | 0.35 | 0.18 | 0.53 | (0.35) | — | — | (0.35) | — | 9.40 | 8.77 | |||||||||||||||||||||||||||||||
| 2/28/23 |
10.32 | 0.33 | (1.11) | (0.78) | (0.32) | — | — | (0.32) | — | 9.22 | 8.72 | |||||||||||||||||||||||||||||||
| 2/28/22 |
10.66 | 0.31 | (0.35) | (0.04) | (0.30) | — | — | (0.30) | — | 10.32 | 9.53 | |||||||||||||||||||||||||||||||
| 2/28/21 |
11.05 | 0.32 | (0.39) | (0.07) | (0.32) | — | — | (0.32) | — | 10.66 | 10.21 | |||||||||||||||||||||||||||||||
| NAC |
||||||||||||||||||||||||||||||||||||||||||
| 8/31/25 |
12.76 | 0.48 | (1.30) | (0.82) | (0.47) | — | (0.41) | (0.88) | — | 11.06 | 11.23 | |||||||||||||||||||||||||||||||
| 8/31/24(d) |
12.83 | 0.21 | 0.09 | 0.30 | (0.24) | — | (0.13) | (0.37) | — | 12.76 | 11.79 | |||||||||||||||||||||||||||||||
| 2/29/24 |
12.52 | 0.43 | 0.34 | 0.77 | (0.45) | — | (0.01) | (0.46) | —(f) | 12.83 | 10.97 | |||||||||||||||||||||||||||||||
| 2/28/23 |
15.07 | 0.55 | (2.53) | (1.98) | (0.57) | — | — | (0.57) | — | 12.52 | 10.87 | |||||||||||||||||||||||||||||||
| 2/28/22 |
15.91 | 0.66 | (0.85) | (0.19) | (0.65) | — | — | (0.65) | — | 15.07 | 13.71 | |||||||||||||||||||||||||||||||
| 2/28/21 |
16.71 | 0.64 | (0.80) | (0.16) | (0.64) | — | — | (0.64) | — | 15.91 | 14.57 | |||||||||||||||||||||||||||||||
| (a) | Based on average shares outstanding. |
| (b) | Total Return Based on Common Share NAV is the combination of changes in common share NAV, reinvested distributions at Common Share NAV, if any. The last distribution declared in the period, which is typically paid on the first business day of the following month, is assumed to be reinvested at the ending NAV. The actual reinvest price for the last distribution declared in the period may often be based on the Fund’s market price (and not its NAV), and therefore may be different from the price used in the calculation. Total returns are not annualized. |
Total Return Based on Common Share Price is the combination of changes in the market price per share and the effect of reinvested distributions, if any, at the average price paid per share at the time of reinvestment. The last distribution declared in the period, which is typically paid on the first business day of the following month, is assumed to be reinvested at the ending market price. The actual reinvestment for the last distribution declared in the period may take place over several days, and in some instances may not be based on the market price, so the actual reinvestment price may be different from the price used in the calculation. Total returns are not annualized.
| (c) | • Net Investment Income (Loss) ratios reflect income earned and expenses incurred on assets attributable to borrowings, preferred shares and/or reverse repurchase agreements (as described in Notes to Financial Statements), where applicable. |
• The expense ratios reflect, among other things, all interest expense and other costs related to borrowings, preferred shares and/or reverse repurchase agreements (as described in Notes to Financial Statements) and/or the interest expense deemed to have been paid by the Fund on the floating rate certificates issued by the special purpose trusts for the self-deposited inverse floaters held by the Fund (as described in Notes to Financial Statements), where applicable, as follows:
| Ratios of Interest Expense to Average Net Assets Applicable to Common Shares |
||||
| NCA |
||||
| 8/31/25 |
0.01% | |||
| 8/31/24(d) |
— (e) | |||
| 2/29/24 |
— | |||
| 2/28/23 |
— | |||
| 2/28/22 |
— | |||
| 2/28/21 |
— | |||
| NAC |
||||
| 8/31/25 |
2.78 | |||
| 8/31/24(d) |
2.99(e) | |||
| 2/29/24 |
3.04 | |||
| 2/28/23 |
1.73 | |||
| 2/28/22 |
0.55 | |||
| 2/28/21 |
0.74 |
| (d) | For the six months ended August 31, 2024. Prior to March 1, 2024, the Fund’s fiscal year end was February 28/29th. |
| (e) | Annualized. |
| (f) | Value rounded to zero. |
| 146 |
| Common Share Supplemental Data/ Ratios Applicable to Common Shares | ||||||||||
| Common Share Total Returns |
Ratios to Average Net Assets |
|||||||||
| Based on Net Asset Value(b) |
Based on Share Price(b) |
Net Assets, End of Period (000) |
Expenses(c) | Net Investment Income (Loss)(c) |
Portfolio Turnover Rate | |||||
| |
||||||||||
| (2.31)% | (1.12)% | $293,035 | 0.54% | 3.81% | 11% | |||||
| 1.99 | 4.32 | 311,670 | 0.55 (e) | 3.65 (e) | 7 | |||||
| 5.87 | 4.70 | 311,156 | 0.54 | 3.79 | 20 | |||||
| (7.58) | (5.13) | 305,143 | 0.53 | 3.52 | 58 | |||||
| (0.43) | (3.89) | 341,804 | 0.56 | 2.85 | 6 | |||||
| (0.62) | 0.73 | 299,625 | 0.60 | 2.94 | 9 | |||||
| (6.68) | 2.96 | 1,611,348 | 3.79 | 4.00 | 17 | |||||
| 2.37 | 11.00 | 1,846,087 | 3.98 (e) | 3.31 (e) | 4 | |||||
| 6.34 | 5.39 | 1,856,151 | 4.03 | 3.48 | 25 | |||||
| (13.20) | (16.78) | 1,811,752 | 2.72 | 4.19 | 69 | |||||
| (1.33) | (1.81) | 2,181,074 | 1.46 | 4.14 | 12 | |||||
| (0.90) | 0.88 | 2,302,711 | 1.67 | 4.00 | 17 | |||||
See Notes to Financial Statements
| 147 |
Financial Highlights (continued)
The following data is for a common share outstanding for each fiscal year end unless otherwise noted:
| Investment Operations | Less Distributions to Common Shareholders |
Common Share | ||||||||||||||||||||||||||||||||||||
| Common Share Net Asset Value, Beginning of Period |
Net Investment Income (NII) (Loss)(a) |
Net Realized/ Unrealized Gain (Loss) |
Total | From NII |
From Net Realized Gains |
Return of Capital |
Total | Net Asset Value, End of Period |
Share Price, End of Period | |||||||||||||||||||||||||||||
| NXJ |
||||||||||||||||||||||||||||||||||||||
| 8/31/25 |
$13.67 | $0.41 | $(0.89) | $(0.48) | $(0.40) | $— | $(0.54) | $(0.94) | $12.25 | $11.42 | ||||||||||||||||||||||||||||
| 8/31/24(d) |
13.89 | 0.18 | (0.02) | 0.16 | (0.23) | — | (0.15) | (0.38) | 13.67 | 12.75 | ||||||||||||||||||||||||||||
| 2/29/24 |
13.36 | 0.36 | 0.55 | 0.91 | (0.35) | — | (0.03) | (0.38) | 13.89 | 12.00 | ||||||||||||||||||||||||||||
| 2/28/23 |
15.49 | 0.52 | (2.09) | (1.57) | (0.56) | — | — | (0.56) | 13.36 | 11.37 | ||||||||||||||||||||||||||||
| 2/28/22 |
16.44 | 0.68 | (0.93) | (0.25) | (0.70) | — | — | (0.70) | 15.49 | 13.52 | ||||||||||||||||||||||||||||
| 2/28/21 |
17.12 | 0.71 | (0.72) | (0.01) | (0.67) | — | — | (0.67) | 16.44 | 14.09 | ||||||||||||||||||||||||||||
| NRK |
||||||||||||||||||||||||||||||||||||||
| 8/31/25 |
12.01 | 0.46 | (1.34) | (0.88) | (0.46) | — | (0.37) | (0.83) | 10.30 | 9.51 | ||||||||||||||||||||||||||||
| 8/31/24(d) |
12.17 | 0.21 | (0.02) | 0.19 | (0.24) | — | (0.11) | (0.35) | 12.01 | 11.09 | ||||||||||||||||||||||||||||
| 2/29/24 |
11.77 | 0.41 | 0.43 | 0.84 | (0.44) | — | — | (0.44) | 12.17 | 10.83 | ||||||||||||||||||||||||||||
| 2/28/23 |
14.18 | 0.50 | (2.38) | (1.88) | (0.53) | — | — | (0.53) | 11.77 | 10.29 | ||||||||||||||||||||||||||||
| 2/28/22 |
14.84 | 0.57 | (0.65) | (0.08) | (0.58) | — | — | (0.58) | 14.18 | 12.69 | ||||||||||||||||||||||||||||
| 2/28/21 |
15.45 | 0.60 | (0.64) | (0.04) | (0.57) | — | — | (0.57) | 14.84 | 13.44 | ||||||||||||||||||||||||||||
| (a) | Based on average shares outstanding. |
| (b) | Total Return Based on Common Share NAV is the combination of changes in common share NAV, reinvested distributions at Common Share NAV, if any. The last distribution declared in the period, which is typically paid on the first business day of the following month, is assumed to be reinvested at the ending NAV. The actual reinvest price for the last distribution declared in the period may often be based on the Fund’s market price (and not its NAV), and therefore may be different from the price used in the calculation. Total returns are not annualized. |
Total Return Based on Common Share Price is the combination of changes in the market price per share and the effect of reinvested distributions, if any, at the average price paid per share at the time of reinvestment. The last distribution declared in the period, which is typically paid on the first business day of the following month, is assumed to be reinvested at the ending market price. The actual reinvestment for the last distribution declared in the period may take place over several days, and in some instances may not be based on the market price, so the actual reinvestment price may be different from the price used in the calculation. Total returns are not annualized.
| (c) | • Net Investment Income (Loss) ratios reflect income earned and expenses incurred on assets attributable to borrowings, preferred shares and/or reverse repurchase agreements (as described in Notes to Financial Statements), where applicable. |
• The expense ratios reflect, among other things, all interest expense and other costs related to borrowings, preferred shares and/or reverse repurchase agreements (as described in Notes to Financial Statements) and/or the interest expense deemed to have been paid by the Fund on the floating rate certificates issued by the special purpose trusts for the self-deposited inverse floaters held by the Fund (as described in Notes to Financial Statements), where applicable, as follows:
| Ratios of Interest Expense to Average Net Assets Applicable to Common Shares |
||||
| NXJ |
||||
| 8/31/25 |
2.76% | |||
| 8/31/24(d) |
2.95(e) | |||
| 2/29/24 |
2.75 | |||
| 2/28/23 |
1.50 | |||
| 2/28/22 |
0.45 | |||
| 2/28/21 |
0.60 | |||
| NRK |
||||
| 8/31/25 |
2.61 | |||
| 8/31/24(d) |
2.84(e) | |||
| 2/29/24 |
2.89 | |||
| 2/28/23 |
1.80 | |||
| 2/28/22 |
0.55 | |||
| 2/28/21 |
0.80 |
| (d) | For the six months ended August 31, 2024. Prior to March 1, 2024, the Fund’s fiscal year end was February 28/29th. |
| (e) | Annualized. |
| 148 |
| Common Share Supplemental Data/ Ratios Applicable to Common Shares | ||||||||||
| Common Share Total Returns |
Ratios to Average Net Assets |
|||||||||
| Based on Net Asset Value(b) |
Based on Share Price(b) |
Net Assets, End of Period (000) |
Expenses(c) | Net Investment Income (Loss)(c) |
Portfolio Turnover Rate | |||||
| |
||||||||||
| (3.62)% | (3.08)% | $505,219 | 3.82% | 3.19% | 17% | |||||
| 1.17 | 9.54 | 563,766 | 4.00 (e) | 2.69 (e) | 9 | |||||
| 6.97 | 9.14 | 572,619 | 3.79 | 2.68 | 16 | |||||
| (10.16) | (11.96) | 554,192 | 2.53 | 3.82 | 17 | |||||
| (1.68) | 0.53 | 642,438 | 1.39 | 4.10 | 9 | |||||
| 0.08 | 0.42 | 681,846 | 1.55 | 4.36 | 12 | |||||
| (7.66) | (7.08) | 898,767 | 3.69 | 4.14 | 10 | |||||
| 1.58 | 5.68 | 1,048,032 | 3.87 (e) | 3.47 (e) | 9 | |||||
| 7.31 | 9.87 | 1,062,016 | 3.90 | 3.49 | 27 | |||||
| (13.32) | (14.87) | 1,026,334 | 2.84 | 4.07 | 69 | |||||
| (0.70) | (1.55) | 1,237,080 | 1.53 | 3.77 | 11 | |||||
| (0.16) | 2.31 | 1,294,269 | 1.80 | 4.10 | 22 | |||||
See Notes to Financial Statements
| 149 |
Financial Highlights (continued)
The following data is for a common share outstanding for each fiscal year end unless otherwise noted:
| Investment Operations | Less Distributions to Common Shareholders |
Common Share | ||||||||||||||||||||||||||||||||||||
| Common Share Net Asset Value, Beginning of Period |
Net Investment Income (NII) (Loss)(a) |
Net Realized/ Unrealized Gain (Loss) |
Total | From NII |
From Net Realized Gains |
Return of Capital |
Total | Net Asset Value, End of Period |
Share Price, End of Period | |||||||||||||||||||||||||||||
| NNY |
||||||||||||||||||||||||||||||||||||||
| 8/31/25 |
$9.06 | $0.35 | $(0.52) | $(0.17) | $(0.35) | $— | $— | $(0.35) | $8.54 | $8.09 | ||||||||||||||||||||||||||||
| 8/31/24(d) |
9.06 | 0.17 | — | (e) | 0.17 | (0.17) | — | — | (0.17) | 9.06 | 8.58 | |||||||||||||||||||||||||||
| 2/29/24 |
8.88 | 0.34 | 0.17 | 0.51 | (0.33) | — | — | (0.33) | 9.06 | 8.30 | ||||||||||||||||||||||||||||
| 2/28/23 |
9.84 | 0.31 | (0.97) | (0.66) | (0.30) | — | — | (0.30) | 8.88 | 8.31 | ||||||||||||||||||||||||||||
| 2/28/22 |
10.11 | 0.26 | (0.24) | 0.02 | (0.29) | — | — | (0.29) | 9.84 | 9.27 | ||||||||||||||||||||||||||||
| 2/28/21 |
10.46 | 0.31 | (0.34) | (0.03) | (0.32) | — | — | (0.32) | 10.11 | 9.63 | ||||||||||||||||||||||||||||
| NAN |
||||||||||||||||||||||||||||||||||||||
| 8/31/25 |
12.49 | 0.49 | (1.24) | (0.75) | (0.48) | — | (0.38) | (0.86) | 10.88 | 10.97 | ||||||||||||||||||||||||||||
| 8/31/24(d) |
12.63 | 0.23 | (0.01) | 0.22 | (0.25) | — | (0.11) | (0.36) | 12.49 | 11.48 | ||||||||||||||||||||||||||||
| 2/29/24 |
12.25 | 0.43 | 0.42 | 0.85 | (0.47) | — | — | (0.47) | 12.63 | 10.92 | ||||||||||||||||||||||||||||
| 2/28/23 |
14.67 | 0.51 | (2.39) | (1.88) | (0.54) | — | — | (0.54) | 12.25 | 10.60 | ||||||||||||||||||||||||||||
| 2/28/22 |
15.34 | 0.58 | (0.64) | (0.06) | (0.61) | — | — | (0.61) | 14.67 | 13.21 | ||||||||||||||||||||||||||||
| 2/28/21 |
16.04 | 0.65 | (0.73) | (0.08) | (0.62) | — | — | (0.62) | 15.34 | 13.92 | ||||||||||||||||||||||||||||
| (a) | Based on average shares outstanding. |
| (b) | Total Return Based on Common Share NAV is the combination of changes in common share NAV, reinvested distributions at Common Share NAV, if any. The last distribution declared in the period, which is typically paid on the first business day of the following month, is assumed to be reinvested at the ending NAV. The actual reinvest price for the last distribution declared in the period may often be based on the Fund’s market price (and not its NAV), and therefore may be different from the price used in the calculation. Total returns are not annualized. |
Total Return Based on Common Share Price is the combination of changes in the market price per share and the effect of reinvested distributions, if any, at the average price paid per share at the time of reinvestment. The last distribution declared in the period, which is typically paid on the first business day of the following month, is assumed to be reinvested at the ending market price. The actual reinvestment for the last distribution declared in the period may take place over several days, and in some instances may not be based on the market price, so the actual reinvestment price may be different from the price used in the calculation. Total returns are not annualized.
| (c) | • Net Investment Income (Loss) ratios reflect income earned and expenses incurred on assets attributable to borrowings, preferred shares and/or reverse repurchase agreements (as described in Notes to Financial Statements), where applicable. |
• The expense ratios reflect, among other things, all interest expense and other costs related to borrowings, preferred shares and/or reverse repurchase agreements (as described in Notes to Financial Statements) and/or the interest expense deemed to have been paid by the Fund on the floating rate certificates issued by the special purpose trusts for the self-deposited inverse floaters held by the Fund (as described in Notes to Financial Statements), where applicable, as follows:
| Ratios of Interest Expense to Average Net Assets Applicable to Common Shares |
||||
| NNY |
||||
| 8/31/25 |
0.01% | |||
| 8/31/24(d) |
—(f) | |||
| 2/29/24 |
0.01 | |||
| 2/28/23 |
— | |||
| 2/28/22 |
— | |||
| 2/28/21 |
— | |||
| NAN |
||||
| 8/31/25 |
2.67 | |||
| 8/31/24(d) |
2.79(f) | |||
| 2/29/24 |
2.78 | |||
| 2/28/23 |
1.64 | |||
| 2/28/22 |
0.53 | |||
| 2/28/21 |
0.70 |
| (d) | For the six months ended August 31, 2024. Prior to March 1, 2024, the Fund’s fiscal year end was February 28/29th. |
| (e) | Value rounded to zero. |
| (f) | Annualized. |
| 150 |
| Common Share Supplemental Data/ Ratios Applicable to Common Shares | ||||||||||
| Common Share Total Returns |
Ratios to Average Net Assets |
|||||||||
| Based on Net Asset Value(b) |
Based on Share Price(b) |
Net Assets, End of Period (000) |
Expenses(c) | Net Investment Income (Loss)(c) |
Portfolio Turnover Rate | |||||
| (1.89)% | (1.58)% | $161,239 | 0.58% | 4.02% | 13% | |||||
| 1.88 | 5.47 | 171,188 | 0.59 (f) | 3.83 (f) | 3 | |||||
| 5.91 | 3.96 | 171,146 | 0.56 | 3.81 | 24 | |||||
| (6.76) | (7.22) | 167,749 | 0.56 | 3.42 | 69 | |||||
| 0.10 | (0.91) | 185,909 | 0.60 | 2.55 | 10 | |||||
| (0.17) | (3.94) | 154,122 | 0.57 | 3.08 | 24 | |||||
| (6.24) | 3.08 | 337,746 | 3.77 | 4.19 | 14 | |||||
| 1.80 | 8.59 | 385,292 | 3.84 (f) | 3.62 (f) | 4 | |||||
| 7.07 | 7.65 | 389,442 | 3.82 | 3.53 | 35 | |||||
| (12.84) | (15.82) | 378,021 | 2.73 | 4.03 | 73 | |||||
| (0.55) | (1.06) | 452,687 | 1.51 | 3.71 | 16 | |||||
| (0.40) | 0.90 | 473,214 | 1.70 | 4.29 | 23 | |||||
See Notes to Financial Statements
| 151 |
Financial Highlights (continued)
The following data is for a common share outstanding for each fiscal year end unless otherwise noted:
| Investment Operations | Less Distributions to Common Shareholders |
Common Share | ||||||||||||||||||||||||||||||||||||
| Common Share Net Asset Value, Beginning of Period |
Net Investment Income (NII) (Loss)(a) |
Net Realized/ Unrealized Gain (Loss) |
Total | From NII |
From Net Realized Gains |
Return of Capital |
Total | Net Asset Value, End of Period |
Share Price, End of Period | |||||||||||||||||||||||||||||
| NQP |
||||||||||||||||||||||||||||||||||||||
| 8/31/25 |
$13.67 | $0.42 | $(1.34) | $(0.92) | $(0.45) | $— | $(0.49) | $(0.94) | $11.81 | $10.96 | ||||||||||||||||||||||||||||
| 8/31/24(d) |
13.60 | 0.16 | 0.28 | 0.44 | (0.20) | — | (0.17) | (0.37) | 13.67 | 12.50 | ||||||||||||||||||||||||||||
| 2/29/24 |
13.08 | 0.34 | 0.54 | 0.88 | (0.33) | — | (0.03) | (0.36) | 13.60 | 11.59 | ||||||||||||||||||||||||||||
| 2/28/23 |
15.30 | 0.47 | (2.19) | (1.72) | (0.50) | — | — | (0.50) | 13.08 | 11.19 | ||||||||||||||||||||||||||||
| 2/28/22 |
15.68 | 0.64 | (0.36) | 0.28 | (0.66) | — | — | (0.66) | 15.30 | 14.16 | ||||||||||||||||||||||||||||
| 2/28/21 |
16.37 | 0.67 | (0.71) | (0.04) | (0.65) | — | — | (0.65) | 15.68 | 14.15 | ||||||||||||||||||||||||||||
| (a) | Based on average shares outstanding. |
| (b) | Total Return Based on Common Share NAV is the combination of changes in common share NAV, reinvested distributions at Common Share NAV, if any. The last distribution declared in the period, which is typically paid on the first business day of the following month, is assumed to be reinvested at the ending NAV. The actual reinvest price for the last distribution declared in the period may often be based on the Fund’s market price (and not its NAV), and therefore may be different from the price used in the calculation. Total returns are not annualized. |
Total Return Based on Common Share Price is the combination of changes in the market price per share and the effect of reinvested distributions, if any, at the average price paid per share at the time of reinvestment. The last distribution declared in the period, which is typically paid on the first business day of the following month, is assumed to be reinvested at the ending market price. The actual reinvestment for the last distribution declared in the period may take place over several days, and in some instances may not be based on the market price, so the actual reinvestment price may be different from the price used in the calculation. Total returns are not annualized.
| (c) | • Net Investment Income (Loss) ratios reflect income earned and expenses incurred on assets attributable to borrowings, preferred shares and/or reverse repurchase agreements (as described in Notes to Financial Statements), where applicable. |
• The expense ratios reflect, among other things, all interest expense and other costs related to borrowings, preferred shares and/or reverse repurchase agreements (as described in Notes to Financial Statements) and/or the interest expense deemed to have been paid by the Fund on the floating rate certificates issued by the special purpose trusts for the self-deposited inverse floaters held by the Fund (as described in Notes to Financial Statements), where applicable, as follows:
| Ratios of Interest Expense to Average Net Assets Applicable to Common Shares |
||||||||
| NQP |
||||||||
| 8/31/25 |
2.65% | |||||||
| 8/31/24(d) |
2.79(e) | |||||||
| 2/29/24 |
2.84 | |||||||
| 2/28/23 |
1.53 | |||||||
| 2/28/22 |
0.43 | |||||||
| 2/28/21 |
0.64 | |||||||
| (d) | For the six months ended August 31, 2024. Prior to March 1, 2024, the Fund’s fiscal year end was February 28/29th. |
| (e) | Annualized. |
| 152 |
| Common Share Supplemental Data/ Ratios Applicable to Common Shares | ||||||||||
| Common Share Total Returns |
Ratios to Average Net Assets |
|||||||||
| Based on Net Asset Value(b) |
Based on Share Price(b) |
Net Assets, End of Period (000) |
Expenses(c) | Net Investment Income (Loss)(c) |
Portfolio Turnover Rate | |||||
| |
||||||||||
| (6.93)% | (4.89)% | $439,648 | 3.75% | 3.36% | 18% | |||||
| 3.30 | 11.19 | 508,713 | 3.84 (e) | 2.33 (e) | 12 | |||||
| 6.88 | 7.00 | 506,188 | 3.90 | 2.59 | 14 | |||||
| (11.31) | (17.61) | 488,980 | 2.57 | 3.48 | 15 | |||||
| 1.72 | 4.65 | 571,897 | 1.39 | 3.99 | 12 | |||||
| (0.29) | 2.56 | 586,028 | 1.62 | 4.28 | 10 | |||||
See Notes to Financial Statements
| 153 |
Financial Highlights (continued)
The following table sets forth information regarding each Fund’s outstanding senior securities as of the end of each of the Fund’s last five fiscal periods, as applicable.
| AMTP Shares | VMTP Shares | |||||||||||||
| Aggregate Amount Outstanding (000)(a) |
Asset Coverage Per $100,000(b) |
Aggregate Amount Outstanding (000)(a) |
Asset Coverage Per $100,000(b) | |||||||||||
| NAZ |
||||||||||||||
| 8/31/25 |
$88,300 | $252,413 | $– | $– | ||||||||||
| 8/31/24(c) |
88,300 | 265,542 | – | – | ||||||||||
| 2/29/24 |
88,300 | 266,396 | – | – | ||||||||||
| 2/28/23 |
88,300 | 261,963 | – | – | ||||||||||
| 2/28/22 |
88,300 | 290,229 | – | – | ||||||||||
| 2/28/21 |
88,300 | 297,509 | – | – | ||||||||||
| (a) | Aggregate Amount Outstanding: Aggregate amount outstanding represents the liquidation preference as of the end of the relevant fiscal year. |
| (b) | Asset Coverage Per $100,000: Asset coverage per $100,000 is calculated by subtracting the Fund’s liabilities and indebtedness not represented by senior securities from the Fund’s total assets, dividing the result by the aggregate amount of the Fund’s senior securities representing indebtedness then outstanding (if applicable,) plus the aggregate of the involuntary liquidation preference of the outstanding preferred shares, if applicable, and multiplying the result by 100,000. For purpose of asset coverage above, senior securities consist of preferred shares or borrowings of a Fund and does not include derivative transactions and other investments that have the economic effect of leverage such as reverse repurchase agreements and tender option bonds. If the leverage effects of such investments were included, the asset coverage amounts presented would be lower. |
| (c) | For the six months ended August 31, 2024. Prior to March 1, 2024, the Fund’s fiscal year end was February 28/29th. |
| 154 |
Financial Highlights (continued)
The following table sets forth information regarding each Fund’s outstanding senior securities as of the end of each of the Fund’s last five fiscal periods, as applicable.
| iMTP Shares | MFP Shares | VMTP Shares | VRDP Shares | |||||||||||||||||||||||||||||||
| Aggregate Amount Outstanding (000)(a) |
Asset Coverage Per $5,000(c) |
Aggregate Amount Outstanding (000)(a) |
Asset Coverage Per $100,000(b) |
Aggregate Amount Outstanding (000)(a) |
Asset Coverage Per $100,000(b) |
Aggregate Amount Outstanding (000)(a) |
Asset Coverage Per $100,000(b) |
Asset Coverage Per $1 Liquidation Preference(d) | ||||||||||||||||||||||||||
| NKX |
||||||||||||||||||||||||||||||||||
| 8/31/25 |
$— | $— | $140,400 | $244,649 | $— | $— | $256,700 | $244,649 | $2.45 | |||||||||||||||||||||||||
| 8/31/24(e) |
— | — | 140,400 | 258,511 | — | — | 256,700 | 258,511 | 2.59 | |||||||||||||||||||||||||
| 2/29/24 |
— | — | 140,400 | 259,461 | — | — | 256,700 | 259,461 | 2.59 | |||||||||||||||||||||||||
| 2/28/23 |
— | — | 140,400 | 255,434 | — | — | 256,700 | 255,434 | 2.55 | |||||||||||||||||||||||||
| 2/28/22 |
— | — | 140,400 | 271,751 | — | — | 292,200 | 271,751 | 2.72 | |||||||||||||||||||||||||
| 2/28/21 |
— | — | 140,400 | 281,045 | — | — | 292,200 | 281,045 | 2.81 | |||||||||||||||||||||||||
| NAC |
||||||||||||||||||||||||||||||||||
| 8/31/25 |
— | — | 257,000 | 238,337 | — | — | 907,800 | 238,337 | 2.38 | |||||||||||||||||||||||||
| 8/31/24(e) |
— | — | 275,000 | 256,078 | — | — | 907,800 | 256,078 | 2.56 | |||||||||||||||||||||||||
| 2/29/24 |
— | — | 275,000 | 256,929 | — | — | 907,800 | 256,929 | 2.57 | |||||||||||||||||||||||||
| 2/28/23 |
— | — | 320,000 | 247,561 | — | — | 907,800 | 247,561 | 2.48 | |||||||||||||||||||||||||
| 2/28/22 |
— | — | 320,000 | 270,716 | — | — | 957,600 | 270,716 | 2.71 | |||||||||||||||||||||||||
| 2/28/21 |
— | — | 320,000 | 280,237 | — | — | 957,600 | 280,237 | 2.80 | |||||||||||||||||||||||||
| NXJ |
||||||||||||||||||||||||||||||||||
| 8/31/25 |
— | — | — | — | — | — | 313,900 | 260,949 | — | |||||||||||||||||||||||||
| 8/31/24(e) |
— | — | — | — | — | — | 313,900 | 279,601 | — | |||||||||||||||||||||||||
| 2/29/24 |
— | — | — | — | — | — | 313,900 | 282,421 | — | |||||||||||||||||||||||||
| 2/28/23 |
— | — | — | — | — | — | 313,900 | 276,550 | — | |||||||||||||||||||||||||
| 2/28/22 |
— | — | — | — | — | — | 313,900 | 304,663 | — | |||||||||||||||||||||||||
| 2/28/21 |
— | — | — | — | — | — | 313,900 | 317,218 | — | |||||||||||||||||||||||||
| NRK |
||||||||||||||||||||||||||||||||||
| 8/31/25 |
— | — | 80,000 | 235,397 | — | — | 583,800 | 235,397 | 2.35 | |||||||||||||||||||||||||
| 8/31/24(e) |
— | — | 80,000 | 257,884 | — | — | 583,800 | 257,884 | 2.58 | |||||||||||||||||||||||||
| 2/29/24 |
— | — | 80,000 | 259,990 | — | — | 583,800 | 259,990 | 2.60 | |||||||||||||||||||||||||
| 2/28/23 |
— | — | 80,000 | 254,012 | — | — | 583,800 | 254,012 | 2.54 | |||||||||||||||||||||||||
| 2/28/22 |
— | — | 80,000 | 266,319 | — | — | 663,800 | 266,319 | 2.66 | |||||||||||||||||||||||||
| 2/28/21 |
— | — | 80,000 | 274,008 | — | — | 663,800 | 274,008 | 2.74 | |||||||||||||||||||||||||
| (a) | Aggregate Amount Outstanding: Aggregate amount outstanding represents the liquidation preference as of the end of the relevant fiscal year. | |
| (b) | Asset Coverage Per $100,000: Asset coverage per $100,000 is calculated by subtracting the Fund’s liabilities and indebtedness not represented by senior securities from the Fund’s total assets, dividing the result by the aggregate amount of the Fund’s senior securities representing indebtedness then outstanding (if applicable,) plus the aggregate of the involuntary liquidation preference of the outstanding preferred shares, if applicable, and multiplying the result by 100,000. For purpose of asset coverage above, senior securities consist of preferred shares or borrowings of a Fund and does not include derivative transactions and other investments that have the economic effect of leverage such as reverse repurchase agreements and tender option bonds. If the leverage effects of such investments were included, the asset coverage amounts presented would be lower. | |
| (c) | Asset Coverage Per $5,000: Asset coverage per $5,000 is calculated by subtracting the Fund’s liabilities and indebtedness not represented by senior securities from the Fund’s total assets, dividing the result by the aggregate amount of the Fund’s senior securities representing indebtedness then outstanding (if applicable,) plus the aggregate of the involuntary liquidation preference of the outstanding preferred shares, if applicable, and multiplying the result by 5,000. For purpose of asset coverage above, senior securities consist of preferred shares or borrowings of a Fund and does not include derivative transactions and other investments that have the economic effect of leverage such as reverse repurchase agreements and tender option bonds. If the leverage effects of such investments were included, the asset coverage amounts presented would be lower. | |
| (d) | Includes all preferred shares presented for the Fund. | |
| (e) | For the six months ended August 31, 2024. Prior to March 1, 2024, the Fund’s fiscal year end was February 28/29th. |
| 155 |
Financial Highlights (continued)
The following table sets forth information regarding each Fund’s outstanding senior securities as of the end of each of the Fund’s last five fiscal periods, as applicable.
| AMTP Shares | VMTP Shares | VRDP Shares | ||||||||||||||||||||||||
| Aggregate Amount Outstanding (000)(a) |
Asset Coverage Per $100,000(b) |
Aggregate Amount Outstanding (000)(a) |
Asset Coverage Per $100,000(b) |
Aggregate Amount Outstanding (000)(a) |
Asset Coverage Per $100,000(b) |
Asset Coverage Per $1 Liquidation Preference(c) | ||||||||||||||||||||
| NAN |
||||||||||||||||||||||||||
| 8/31/25 |
$127,000 | $256,364 | $— | $— | $89,000 | $256,364 | $2.56 | |||||||||||||||||||
| 8/31/24(d) |
127,000 | 278,376 | — | — | 89,000 | 278,376 | 2.78 | |||||||||||||||||||
| 2/29/24 |
127,000 | 280,297 | — | — | 89,000 | 280,297 | 2.80 | |||||||||||||||||||
| 2/28/23 |
127,000 | 275,010 | — | — | 89,000 | 275,010 | 2.75 | |||||||||||||||||||
| 2/28/22 |
147,000 | 291,007 | — | — | 89,000 | 291,007 | 2.91 | |||||||||||||||||||
| 2/28/21 |
147,000 | 300,514 | — | — | 89,000 | 300,514 | 3.01 | |||||||||||||||||||
| NQP |
||||||||||||||||||||||||||
| 8/31/25 |
— | — | — | — | 217,500 | 302,137 | — | |||||||||||||||||||
| 8/31/24(d) |
— | — | — | — | 217,500 | 333,891 | — | |||||||||||||||||||
| 2/29/24 |
— | — | — | — | 217,500 | 332,730 | — | |||||||||||||||||||
| 2/28/23 |
— | — | — | — | 217,500 | 324,818 | — | |||||||||||||||||||
| 2/28/22 |
— | — | — | — | 217,500 | 362,941 | — | |||||||||||||||||||
| 2/28/21 |
— | — | — | — | 217,500 | 369,438 | — | |||||||||||||||||||
| (a) | Aggregate Amount Outstanding: Aggregate amount outstanding represents the liquidation preference as of the end of the relevant fiscal year. |
| (b) | Asset Coverage Per $100,000: Asset coverage per $100,000 is calculated by subtracting the Fund’s liabilities and indebtedness not represented by senior securities from the Fund’s total assets, dividing the result by the aggregate amount of the Fund’s senior securities representing indebtedness then outstanding (if applicable,) plus the aggregate of the involuntary liquidation preference of the outstanding preferred shares, if applicable, and multiplying the result by 100,000. For purpose of asset coverage above, senior securities consist of preferred shares or borrowings of a Fund and does not include derivative transactions and other investments that have the economic effect of leverage such as reverse repurchase agreements and tender option bonds. If the leverage effects of such investments were included, the asset coverage amounts presented would be lower. |
| (c) | Includes all preferred shares presented for the Fund. |
| (d) | For the six months ended August 31, 2024. Prior to March 1, 2024, the Fund’s fiscal year end was February 28/29th. |
| 156 |
Notes to Financial Statements
1. General Information
Fund Information: The funds covered in this report and their corresponding New York Stock Exchange (“NYSE”) symbols are as follows (each a “Fund” and collectively, the “Funds”):
| • | Nuveen Arizona Quality Municipal Income Fund (NAZ) |
| • | Nuveen California AMT‑Free Quality Municipal Income Fund (NKX) |
| • | Nuveen California Municipal Value Fund (NCA) |
| • | Nuveen California Quality Municipal Income Fund (NAC) |
| • | Nuveen New Jersey Quality Municipal Income Fund (NXJ) |
| • | Nuveen New York AMT‑Free Quality Municipal Income Fund (NRK) |
| • | Nuveen New York Municipal Value Fund (NNY) |
| • | Nuveen New York Quality Municipal Income Fund (NAN) |
| • | Nuveen Pennsylvania Quality Municipal Income Fund (NQP) |
The Funds are registered under the Investment Company Act of 1940 (the “1940 Act”), as amended, as closed‑end management investment companies. NAZ, NKX, NCA, NAC, NXJ, NRK, NNY, NAN and NQP were organized as Massachusetts business trusts on August 24, 2012, July 29, 2002, March 8, 2021, December 1, 1998, June 1, 1999, April 19, 2002, April 12, 2021, December 1, 1998 and December 20, 1990, respectively. NAZ, NCA and NNY were previously organized as a Minnesota trust on September 15, 1992, July 15, 1987, and July 14, 1987, respectively.
Current Fiscal Period: The end of the reporting period for the Funds is August 31, 2025, and the period covered by these Notes to Financial Statements is the fiscal year ended August 31, 2025 (the “current fiscal period”).
Investment Adviser and Sub‑Adviser: The Funds’ investment adviser is Nuveen Fund Advisors, LLC (the “Adviser”), a subsidiary of Nuveen, LLC (“Nuveen”). Nuveen is the investment management arm of Teachers Insurance and Annuity Association of America (TIAA). The Adviser has overall responsibility for management of the Funds, oversees the management of the Funds’ portfolios, manages the Funds’ business affairs and provides certain clerical, bookkeeping and other administrative services, and, if necessary, asset allocation decisions. The Adviser has entered into sub‑advisory agreements with Nuveen Asset Management, LLC (the “Sub‑Adviser”), a subsidiary of the Adviser, under which the Sub‑Adviser manages the investment portfolios of the Funds.
2. Significant Accounting Policies
The accompanying financial statements were prepared in accordance with accounting principles generally accepted in the United States of America (“U.S. GAAP”), which may require the use of estimates made by management and the evaluation of subsequent events. Actual results may differ from those estimates. The Funds are investment companies and follow accounting guidance in the Financial Accounting Standards Board (“FASB”) Accounting Standards Codification 946, Financial Services — Investment Companies. The net asset value (“NAV”) for financial reporting purposes may differ from the NAV for processing security and common share transactions. The NAV for financial reporting purposes includes security and common share transactions through the date of the report. Total return is computed based on the NAV used for processing security and common share transactions. The following is a summary of the significant accounting policies consistently followed by the Funds.
Compensation: The Funds pay no compensation directly to those of its officers, all of whom receive remuneration for their services to the Funds from the Adviser or its affiliates. The Funds’ Board of Trustees (the “Board”) has adopted a deferred compensation plan for independent trustees that enables trustees to elect to defer receipt of all or a portion of the annual compensation they are entitled to receive from certain Nuveen-advised funds. Under the plan, deferred amounts are treated as though equal dollar amounts had been invested in shares of select Nuveen-advised funds.
Custodian Fee Credit: As an alternative to overnight investments, each Fund has an arrangement with its custodian bank, State Street Bank and Trust Company, (the “Custodian”) whereby certain custodian fees and expenses are reduced by net credits earned on each Fund’s cash on deposit with the bank. Credits for cash balances may be offset by charges for any days on which a Fund overdraws its account at the Custodian. The amount of custodian fee credit earned by a Fund is recognized on the Statement of Operations as a component of “Custodian expenses, net.” During the current fiscal period, the custodian fee credit earned by each Fund was as follows:
157
Notes to Financial Statements (continued)
| Fund | Gross Custodian Fee Credits |
|||
| |
||||
| NAZ |
$ | 30,887 | ||
| NKX |
71,770 | |||
| NCA |
36,990 | |||
| NAC |
129,387 | |||
| NXJ |
34,638 | |||
| NRK |
119,838 | |||
| NNY |
18,382 | |||
| NAN |
3,385 | |||
| NQP |
11,775 | |||
| |
||||
Distributions to Common Shareholders: Distributions to common shareholders are recorded on the ex-dividend date. The amount, character and timing of distributions are determined in accordance with federal income tax regulations, which may differ from U.S. GAAP.
The Funds’ distribution policy, which may be changed by the Board, is to make regular monthly cash distributions to holders of their common shares (stated in terms of a fixed cents per common share dividend distributions rate which may be set from time to time). Each Fund intends to distribute all or substantially all of its net investment income each year through its regular monthly distribution and to distribute realized capital gains at least annually. In addition, in any monthly period, to maintain its declared per common share distribution amount, a Fund may distribute more or less than its net investment income during the period. In the event a Fund distributes more than its net investment income during any yearly period, such distributions may also include realized gains and/or a return of capital. To the extent that a distribution includes a return of capital the NAV per share may erode.
Indemnifications: Under the Funds’ organizational documents, their officers and trustees are indemnified against certain liabilities arising out of the performance of their duties to the Funds. In addition, in the normal course of business, the Funds enter into contracts that provide general
indemnifications to other parties. The Funds’ maximum exposure under these arrangements is unknown as this would involve future claims that may be made against the Funds that have not yet occurred. However, the Funds have not had prior claims or losses pursuant to these contracts and expects the risk of loss to be remote.
Investments and Investment Income: Securities transactions are accounted for as of the trade date for financial reporting purposes. Realized gains and losses on securities transactions are based upon the specific identification method. Investment income is comprised of interest income, which is recorded on an accrual basis and includes accretion of discounts and amortization of premiums for financial reporting purposes. Investment income also reflects payment-in-kind (“PIK”) interest and paydown gains and losses, if any. PIK interest represents income received in the form of securities in lieu of cash.
Netting Agreements: In the ordinary course of business, the Funds may enter into transactions subject to enforceable International Swaps and Derivatives Association, Inc. (ISDA) master agreements or other similar arrangements (“netting agreements”). Generally, the right to offset in netting agreements allows each Fund to offset certain securities and derivatives with a specific counterparty, when applicable, as well as any collateral received or delivered to that counterparty based on the terms of the agreements. Generally, each Fund manages its cash collateral and securities collateral on a counterparty basis. With respect to certain counterparties, in accordance with the terms of the netting agreements, collateral posted to the Funds is held in a segregated account by the Funds’ custodian and/or with respect to those amounts which can be sold or repledged, are presented in the Funds’ Portfolio of Investments or Statement of Assets and Liabilities.
The Funds’ investments subject to netting agreements as of the end of the current fiscal period, if any, are further described later in these Notes to Financial Statements.
Segment Reporting: In November 2023, the FASB issued Accounting Standard Update (“ASU”) No. 2023-07, Segment Reporting (Topic 280) Improvements to Reportable Segment Disclosures (“ASU 2023-07”). The amendments in ASU 2023-07 improve reportable segment disclosure requirements, primarily through enhanced disclosures about significant segment expenses. ASU 2023-07 also requires a public entity that has a single reportable segment to provide all the disclosures required by the amendments in ASU 2023-07 and all existing segment disclosures in Topic 280. The amendments in ASU 2023-07 are effective for fiscal years beginning after December 15, 2023, and interim periods within fiscal years beginning after December 15, 2024. The Funds adopted ASU 2023-07 during the current fiscal period. Adoption of the new standard impacted financial statement disclosures only and did not affect the Funds’ financial positions or the results of their operations.
Each Fund represents a single operating segment. The officers of the Funds act as the chief operating decision maker (“CODM”). The CODM monitors the operating results of each Fund as a whole and is responsible for each Fund’s long-term strategic asset allocation in accordance with the terms of its prospectus, based on a defined investment strategy which is executed by the Fund’s portfolio managers as a team. The financial information in the form of the Fund’s portfolio composition, total returns, expense ratios and changes in net assets (i.e., changes in net assets resulting from operations, subscriptions and redemptions), which are used by the CODM to assess the segment’s performance versus the Fund’s
| 158 |
comparative benchmarks and to make resource allocation decisions for the Fund’s single segment, is consistent with that presented within the Fund’s financial statements. Segment assets are reflected on the Statement of Assets and Liabilities as “total assets” and significant segment revenues and expenses are listed on the Statement of Operations.
New Accounting Pronouncement: In December 2023, the FASB issued ASU No. 2023-09, Income Taxes (Topic 740) Improvements to Income tax disclosures (“ASU 2023-09”). The primary purpose of the amendments within ASU 2023-09 is to enhance the transparency and decision usefulness of income tax disclosures primarily related to the rate reconciliation table and income taxes paid information. The amendments in ASU 2023-09 are effective for annual periods beginning after December 15, 2024. Management is currently evaluating the implications of these changes on the financial statements.
3. Investment Valuation and Fair Value Measurements
The Funds’ investments in securities are recorded at their estimated fair value utilizing valuation methods approved by the Adviser, subject to oversight of the Board. Fair value is defined as the price that would be received upon selling an investment or transferring a liability in an orderly transaction to an independent buyer in the principal or most advantageous market for the investment. U.S. GAAP establishes the three-tier hierarchy which is used to maximize the use of observable market data and minimize the use of unobservable inputs and to establish classification of fair value measurements for disclosure purposes. Observable inputs reflect the assumptions market participants would use in pricing the asset or liability. Observable inputs are based on market data obtained from sources independent of the reporting entity. Unobservable inputs reflect management’s assumptions about the assumptions market participants would use in pricing the asset or liability. Unobservable inputs are based on the best information available in the circumstances. The following is a summary of the three-tiered hierarchy of valuation input levels.
Level 1 – Inputs are unadjusted and prices are determined using quoted prices in active markets for identical securities.
Level 2 – Prices are determined using other significant observable inputs (including quoted prices for similar securities, interest rates, credit spreads, etc.).
Level 3 – Prices are determined using significant unobservable inputs (including management’s assumptions in determining the fair value of investments).
A description of the valuation techniques applied to the Funds’ major classifications of assets and liabilities measured at fair value follows:
Prices of fixed-income securities are generally provided by pricing services approved by the Adviser, which is subject to review by the Adviser and oversight of the Board. Pricing services establish a security’s fair value using methods that may include consideration of the following: yields or prices of investments of comparable quality, type of issue, coupon, maturity and rating, market quotes or indications of value from security dealers, evaluations of anticipated cash flows or collateral, general market conditions and other information and analysis, including the obligor’s credit characteristics considered relevant. In pricing certain securities, particularly less liquid and lower quality securities, pricing services may consider information about a security, its issuer or market activity provided by the Adviser. These securities are generally classified as Level 2.
For any portfolio security or derivative for which market quotations are not readily available or for which the Adviser deems the valuations derived using the valuation procedures described above not to reflect fair value, the Adviser will determine a fair value in good faith using alternative procedures approved by the Adviser, subject to the oversight of the Board. As a general principle, the fair value of a security is the amount that the owner might reasonably expect to receive for it in a current sale. A variety of factors may be considered in determining the fair value of such securities, which may include consideration of the following: yields or prices of investments of comparable quality, type of issue, coupon, maturity and rating, market quotes or indications of value from security dealers, evaluations of anticipated cash flows or collateral, general market conditions and other information and analysis, including the obligor’s credit characteristics considered relevant. To the extent the inputs are observable and timely, the values would be classified as Level 2; otherwise they would be classified as Level 3.
The following table summarizes the market value of the Funds’ investments as of the end of the current fiscal period, based on the inputs used to value them:
| NAZ | Level 1 | Level 2 | Level 3 | Total | ||||||||||||
| |
||||||||||||||||
| Long-Term Investments: |
||||||||||||||||
| Municipal Bonds |
$ | – | $ | 218,032,750 | $ | – | $ | 218,032,750 | ||||||||
| |
||||||||||||||||
| Total |
$ | – | $ | 218,032,750 | $ | – | $ | 218,032,750 | ||||||||
| |
||||||||||||||||
| NKX | Level 1 | Level 2 | Level 3 | Total | ||||||||||||
| |
||||||||||||||||
| Long-Term Investments: |
||||||||||||||||
| Municipal Bonds |
$ | – | $ | 990,294,740 | $ | – | $ | 990,294,740 | ||||||||
| Short-Term Investments: |
||||||||||||||||
| Municipal Bonds |
– | 16,000,000 | – | 16,000,000 | ||||||||||||
| |
||||||||||||||||
| Total |
$ | – | $ | 1,006,294,740 | $ | – | $ | 1,006,294,740 | ||||||||
| |
||||||||||||||||
| 159 |
Notes to Financial Statements (continued)
| NCA | Level 1 | Level 2 | Level 3 | Total | ||||||||||||
| |
||||||||||||||||
| Long-Term Investments: |
||||||||||||||||
| Municipal Bonds |
$ | – | $ | 277,698,957 | $ | – | $ | 277,698,957 | ||||||||
| Variable Rate Demand Preferred Shares |
– | 2,500,000 | – | 2,500,000 | ||||||||||||
| Short-Term Investments: |
||||||||||||||||
| Municipal Bonds |
– | 10,000,000 | – | 10,000,000 | ||||||||||||
| |
||||||||||||||||
| Total |
$ | – | $ | 290,198,957 | $ | – | $ | 290,198,957 | ||||||||
| |
||||||||||||||||
| NAC | Level 1 | Level 2 | Level 3 | Total | ||||||||||||
| |
||||||||||||||||
| Long-Term Investments: |
||||||||||||||||
| Municipal Bonds |
$ | – | $ | 2,783,682,584 | $ | – | $ | 2,783,682,584 | ||||||||
| Short-Term Investments: |
||||||||||||||||
| Municipal Bonds |
– | 23,600,000 | – | 23,600,000 | ||||||||||||
| |
||||||||||||||||
| Total |
$ | – | $ | 2,807,282,584 | $ | – | $ | 2,807,282,584 | ||||||||
| |
||||||||||||||||
| NXJ | Level 1 | Level 2 | Level 3 | Total | ||||||||||||
| |
||||||||||||||||
| Long-Term Investments: |
||||||||||||||||
| Municipal Bonds |
$ | – | $ | 874,297,575 | $ | – | $ | 874,297,575 | ||||||||
| Short-Term Investments: |
||||||||||||||||
| Municipal Bonds |
– | 1,960,000 | – | 1,960,000 | ||||||||||||
| |
||||||||||||||||
| Total |
$ | – | $ | 876,257,575 | $ | – | $ | 876,257,575 | ||||||||
| |
||||||||||||||||
| NRK | Level 1 | Level 2 | Level 3 | Total | ||||||||||||
| |
||||||||||||||||
| Long-Term Investments: |
||||||||||||||||
| Municipal Bonds |
$ | – | $ | 1,531,224,035 | $ | – | $ | 1,531,224,035 | ||||||||
| Short-Term Investments: |
||||||||||||||||
| Municipal Bonds |
– | 28,000,000 | – | 28,000,000 | ||||||||||||
| |
||||||||||||||||
| Total |
$ | – | $ | 1,559,224,035 | $ | – | $ | 1,559,224,035 | ||||||||
| |
||||||||||||||||
| NNY | Level 1 | Level 2 | Level 3 | Total | ||||||||||||
| |
||||||||||||||||
| Long-Term Investments: |
||||||||||||||||
| Municipal Bonds |
$ | – | $ | 157,663,192 | $ | – | $ | 157,663,192 | ||||||||
| Short-Term Investments: |
||||||||||||||||
| Municipal Bonds |
– | 3,500,000 | – | 3,500,000 | ||||||||||||
| |
||||||||||||||||
| Total |
$ | – | $ | 161,163,192 | $ | – | $ | 161,163,192 | ||||||||
| |
||||||||||||||||
| NAN | Level 1 | Level 2 | Level 3 | Total | ||||||||||||
| |
||||||||||||||||
| Long-Term Investments: |
||||||||||||||||
| Municipal Bonds |
$ | – | $ | 576,956,857 | $ | – | $ | 576,956,857 | ||||||||
| |
||||||||||||||||
| Total |
$ | – | $ | 576,956,857 | $ | – | $ | 576,956,857 | ||||||||
| |
||||||||||||||||
| NQP | Level 1 | Level 2 | Level 3 | Total | ||||||||||||
| |
||||||||||||||||
| Long-Term Investments: |
||||||||||||||||
| Municipal Bonds |
$ | – | $ | 740,393,568 | $ | 100 | $ | 740,393,668 | ||||||||
| Variable Rate Senior Loan Interests |
– | – | 6 | 6 | ||||||||||||
| |
||||||||||||||||
| Total |
$ | – | $ | 740,393,568 | $ | 106 | $ | 740,393,674 | ||||||||
| |
||||||||||||||||
The Funds hold liabilities in floating rate obligations and preferred shares, where applicable, which are not reflected in the tables above. The fair values of the Funds’ liabilities for floating rate obligations approximate their liquidation values. Floating rate obligations are generally classified as Level 2 and further described in these Notes to Financial Statements. The fair values of the Funds’ liabilities for preferred shares approximate their liquidation preference. Preferred shares are generally classified as Level 2 and further described in these Notes to Financial Statements. The Funds, where applicable, have a receivable for the sale of their interest in Vistra Vision, which is not reflected in the tables above. The carrying value of this receivable approximates fair value. The “Receivable for sale of Vistra Vision interest” is generally classified as Level 2 and further described in these Notes to Financial Statements.
4. Portfolio Securities
Inverse Floating Rate Securities: Each Fund is authorized to invest in inverse floating rate securities. An inverse floating rate security is created by depositing a municipal bond (referred to as an “Underlying Bond”), typically with a fixed interest rate, into a special purpose tender option bond (“TOB”) trust (referred to as the “TOB Trust”) created by or at the direction of one or more Funds. In turn, the TOB Trust issues (a) floating
| 160 |
rate certificates (referred to as “Floaters”), in face amounts equal to some fraction of the Underlying Bond’s par amount or market value, and (b) an inverse floating rate certificate (referred to as an “Inverse Floater”) that represents all remaining or residual interest in the TOB Trust. Floaters typically pay short-term tax-exempt interest rates to third parties who are also provided a right to tender their certificate and receive its par value, which may be paid from the proceeds of a remarketing of the Floaters, by a loan to the TOB Trust from a third party liquidity provider (“Liquidity Provider”), or by the sale of assets from the TOB Trust. The Inverse Floater is issued to a long term investor, such as one or more Funds. The income received by the Inverse Floater holder varies inversely with the short-term rate paid to holders of the Floaters, and in most circumstances the Inverse Floater holder bears substantially all of the Underlying Bond’s downside investment risk and also benefits disproportionately from any potential appreciation of the Underlying Bond’s value. The value of an Inverse Floater will be more volatile than that of the Underlying Bond because the interest rate is dependent on not only the fixed coupon rate of the Underlying Bond but also on the short-term interest paid on the Floaters, and because the Inverse Floater essentially bears the risk of loss (and possible gain) of the greater face value of the Underlying Bond.
The Inverse Floater held by a Fund gives the Fund the right to (a) cause the holders of the Floaters to tender their certificates at par (or slightly more than par in certain circumstances), and (b) have the trustee of the TOB Trust (the “Trustee”) transfer the Underlying Bond held by the TOB Trust to the Fund, thereby collapsing the TOB Trust.
A Fund may acquire an Inverse Floater in a transaction where it (a) transfers an Underlying Bond that it owns to a TOB Trust created by a third party or (b) transfers an Underlying Bond that it owns, or that it has purchased in a secondary market transaction for the purpose of creating an Inverse Floater, to a TOB Trust created at its direction, and in return receives the Inverse Floater of the TOB Trust (referred to as a “self-deposited Inverse Floater”). A Fund may also purchase an Inverse Floater in a secondary market transaction from a third party creator of the TOB Trust without first owning the Underlying Bond (referred to as an “externally-deposited Inverse Floater”).
An investment in a self-deposited Inverse Floater is accounted for as a “financing” transaction (i.e., a secured borrowing). For a self-deposited Inverse Floater, the Underlying Bond deposited into the TOB Trust is identified in the Fund’s Portfolio of Investments as “(UB) – Underlying bond of an inverse floating rate trust reflected as a financing transaction,” with the Fund recognizing as liabilities, labeled “Floating rate obligations” on the Statement of Assets and Liabilities, (a) the liquidation value of Floaters issued by the TOB Trust, and (b) the amount of any borrowings by the TOB Trust from a Liquidity Provider to enable the TOB Trust to purchase outstanding Floaters in lieu of a remarketing. In addition, the Fund recognizes in “Investment Income” the entire earnings of the Underlying Bond, and recognizes (a) the interest paid to the holders of the Floaters or on the TOB Trust’s borrowings, and (b) other expenses related to remarketing, administration, trustee, liquidity and other services to a TOB Trust, as a component of “Interest expense and amortization of offering costs” on the Statement of Operations. Earnings due from the Underlying Bond and interest due to the holders of the Floaters as of the end of the current fiscal period are recognized as components of “Receivable for interest” and “Payable for interest” on the Statement of Assets and Liabilities, respectively.
In contrast, an investment in an externally-deposited Inverse Floater is accounted for as a purchase of the Inverse Floater and is identified in the Fund’s Portfolio of Investments as “(IF) – Inverse floating rate investment.” For an externally-deposited Inverse Floater, a Fund’s Statement of Assets and Liabilities recognizes the Inverse Floater and not the Underlying Bond as an asset, and the Fund does not recognize the Floaters, or any related borrowings from a Liquidity Provider, as a liability. Additionally, the Fund reflects in “Investment Income” only the net amount of earnings on the Inverse Floater (net of the interest paid to the holders of the Floaters or the Liquidity Provider as lender, and the expenses of the Trust), and does not show the amount of that interest paid or the expenses of the TOB Trust as described above as interest expense on the Statement of Operations.
Fees paid upon the creation of a TOB Trust for self-deposited Inverse Floaters and externally-deposited Inverse Floaters are recognized as part of the cost basis of the Inverse Floater and are capitalized over the term of the TOB Trust.
As of the end of the current fiscal period, the aggregate value of Floaters issued by each Fund’s TOB Trust for self-deposited Inverse Floaters and externally-deposited Inverse Floaters was as follows:
| Fund | Floating Rate Obligations: Self- Deposited Inverse Floaters |
Floating Rate Obligations: Externally‑Deposited Inverse Floaters |
Total | |||||||||
| |
||||||||||||
| NAZ |
$ | — | $ | — | $ | — | ||||||
| NKX |
33,485,000 | — | 33,485,000 | |||||||||
| NCA |
— | — | — | |||||||||
| NAC |
44,590,000 | — | 44,590,000 | |||||||||
| NXJ |
63,850,000 | — | 63,850,000 | |||||||||
| NRK |
13,480,000 | — | 13,480,000 | |||||||||
| NNY |
— | — | — | |||||||||
| NAN |
28,840,000 | — | 28,840,000 | |||||||||
| NQP |
106,940,000 | — | 106,940,000 | |||||||||
| |
||||||||||||
During the current fiscal period, the average amount of Floaters (including any borrowings from a Liquidity Provider) outstanding, and the average annual interest rates and fees related to self-deposited Inverse Floaters, were as follows:
| 161 |
Notes to Financial Statements (continued)
| Fund | Average Floating Rate Obligations Outstanding |
Average Annual Interest Rate And Fees |
||||||
| |
||||||||
| NAZ |
$ | — | —% | |||||
| NKX |
33,485,000 | 3.30 | ||||||
| NCA |
— | — | ||||||
| NAC |
44,616,849 | 3.45 | ||||||
| NXJ |
64,638,521 | 3.29 | ||||||
| NRK |
13,480,000 | 3.29 | ||||||
| NNY |
— | — | ||||||
| NAN |
28,840,000 | 3.29 | ||||||
| NQP |
107,689,863 | 3.38 | ||||||
| |
||||||||
TOB Trusts are supported by a liquidity facility provided by a Liquidity Provider pursuant to which the Liquidity Provider agrees, in the event that Floaters are (a) tendered to the Trustee for remarketing and the remarketing does not occur, or (b) subject to mandatory tender pursuant to the terms of the TOB Trust agreement, to either purchase Floaters or to provide the Trustee with an advance from a loan facility to fund the purchase of Floaters by the TOB Trust. In certain circumstances, the Liquidity Provider may otherwise elect to have the Trustee sell the Underlying Bond to retire the Floaters that were tendered and not remarketed prior to providing such a loan. In these circumstances, the Liquidity Provider remains obligated to provide a loan to the extent that the proceeds of the sale of the Underlying Bond are not sufficient to pay the purchase price of the Floaters.
The size of the commitment under the loan facility for a given TOB Trust is at least equal to the balance of that TOB Trust’s outstanding Floaters plus any accrued interest. In consideration of the loan facility, fee schedules are in place and are charged by the Liquidity Provider(s). Any loans made by the Liquidity Provider will be secured by the purchased Floaters held by the TOB Trust. Interest paid on any outstanding loan balances will be effectively borne by the Fund that owns the Inverse Floaters of the TOB Trust that has incurred the borrowing and may be at a rate that is greater than the rate that would have been paid had the Floaters been successfully remarketed.
As described above, any amounts outstanding under a liquidity facility are recognized as a component of “Floating rate obligations” on the Statement of Assets and Liabilities by the Fund holding the corresponding Inverse Floaters issued by the borrowing TOB Trust. As of the end of the current fiscal period, there were no loans outstanding under any such facility.
Each Fund may also enter into shortfall and forbearance agreements (sometimes referred to as a “recourse arrangement”) (TOB Trusts involving such agreements are referred to herein as “Recourse Trusts”), under which a Fund agrees to reimburse the Liquidity Provider for the Trust’s Floaters, in certain circumstances, for the amount (if any) by which the liquidation value of the Underlying Bond held by the TOB Trust may fall short of the sum of the liquidation value of the Floaters issued by the TOB Trust plus any amounts borrowed by the TOB Trust from the Liquidity Provider, plus any shortfalls in interest cash flows (sometimes referred to as “shortfall payments”). Under these agreements, a Fund’s potential exposure to losses related to or on an Inverse Floater may increase beyond the value of the Inverse Floater as a Fund may potentially be liable to fulfill all amounts owed to holders of the Floaters or the Liquidity Provider. Any such shortfall amount in the aggregate is recognized as “Unrealized depreciation on Recourse Trusts” on the Statement of Assets and Liabilities.
As of the end of the current fiscal period, each Fund’s maximum exposure to the Floaters issued by Recourse Trusts for self-deposited Inverse Floaters and externally-deposited Inverse Floaters was as follows:
| Fund | Maximum Exposure to Recourse Trusts: Self-Deposited Inverse Floaters |
Maximum Exposure to Recourse Trusts: Externally-Deposited Inverse Floaters |
Total | |||||||||
| |
||||||||||||
| NAZ |
$ | — | $ | — | $ | — | ||||||
| NKX |
33,485,000 | — | 33,485,000 | |||||||||
| NCA |
— | — | — | |||||||||
| NAC |
44,590,000 | — | 44,590,000 | |||||||||
| NXJ |
63,850,000 | — | 63,850,000 | |||||||||
| NRK |
13,480,000 | — | 13,480,000 | |||||||||
| NNY |
— | — | — | |||||||||
| NAN |
28,840,000 | — | 28,840,000 | |||||||||
| NQP |
106,940,000 | — | 106,940,000 | |||||||||
| |
||||||||||||
| 162 |
Zero Coupon Securities: A zero coupon security does not pay a regular interest coupon to its holders during the life of the security. Income to the holder of the security comes from accretion of the difference between the original purchase price of the security at issuance and the par value of the security at maturity and is effectively paid at maturity. The market prices of zero coupon securities generally are more volatile than the market prices of securities that pay interest periodically.
Purchases and Sales: Long-term purchases and sales during the current fiscal period were as follows:
| Fund | Non-U.S. Government Purchases |
Non-U.S. Government Sales and Maturities |
||||||
| |
||||||||
| NAZ |
$ | 47,825,016 | $ | 50,789,551 | ||||
| NKX |
195,612,589 | 197,134,975 | ||||||
| NCA |
31,251,356 | 38,356,393 | ||||||
| NAC |
497,715,637 | 569,076,876 | ||||||
| NXJ |
151,136,455 | 151,956,808 | ||||||
| NRK |
171,355,025 | 217,541,995 | ||||||
| NNY |
21,059,334 | 20,919,872 | ||||||
| NAN |
83,317,352 | 91,243,188 | ||||||
| NQP |
134,871,306 | 196,516,366 | ||||||
| |
||||||||
The Funds may purchase securities on a when-issued or delayed-delivery basis. Securities purchased on a when-issued or delayed-delivery basis may have extended settlement periods; interest income is not accrued until settlement date. Any securities so purchased are subject to market fluctuation during this period. If a Fund has outstanding when-issued/delayed-delivery purchases commitments as of the end of the current fiscal period, such amounts are recognized on the Statement of Assets and Liabilities.
Sale of Vistra Vision interests: On September 18, 2024, Vistra Corp. (“Vistra”) and Nuveen agreed to terms for the sale of the Vistra Vision interest. In exchange for its interest in Vistra Vision, the Funds will receive proceeds from the sale over a series of payments from Vistra through December 31, 2026. The resulting receivables have been discounted using an effective interest rate of 6.18%. The receivable, net of discount, and related transaction costs are recognized as “Receivable for sale of Vistra Vision interest” and “Payable for Vistra Vision sale transactions costs,” respectively, on the Statement of Assets and Liabilities. During the current fiscal period, NQP sold its interest back to Vistra and recognized a realized gain of $19,889,701 which is recognized as “Realized gain (loss) from investments” on the Statement of Operations.
5. Derivative Investments
Each Fund is authorized to invest in certain derivative instruments. As defined by U.S. GAAP, a derivative is a financial instrument whose value is derived from an underlying security price, foreign exchange rate, interest rate, index of prices or rates, or other variables. Investments in derivatives as of the end of and/or during the current fiscal period, if any, are included within the Statement of Assets and Liabilities and the Statement of Operations, respectively.
Total Return Swap Contracts: During the current fiscal period, NQP used total return swaps to help manage the equity risk of the portfolio’s Vistra Vision exposure.
In a total return swap, one party agrees to pay the other the total return of a defined underlying asset during a specified period, in return for periodic payments based on a fixed or variable interest rate or the total return from other underlying assets. A total return swap may be applied to any underlying asset but is most commonly used with equity indices, single stocks, bonds and defined baskets of loans and mortgages. The Fund entered into a total return swap involving an underlying index or basket of securities to create exposure to a number of securities in a single trade. An index total return swap can be used by the Fund to assume risk, without the complications of buying the component securities from what may not always be the most liquid of markets.
Total return swap contracts are valued daily. Changes in the value of a total return swap during the fiscal period are recognized as a component of “Change in net unrealized appreciation (depreciation) of swaps” and realized gains and losses are recognized as a component of “Net realized gain (loss) from swaps” on the Statement of Operations.
For over-the-counter (“OTC”) swaps, the daily change in market value of the swap contract, along with any daily interest accrued, are recognized as components of “Unrealized appreciation or depreciation on credit default swaps” on the Statement of Assets and Liabilities.
The average notional amount of Total Return swap contracts outstanding during the current fiscal period was as follows:
| Fund | Average Notional Amount of Swap Contracts Outstanding* |
|||
| |
||||
| NQP |
$28,171,038 | |||
| |
||||
* The average notional amount is calculated based on the absolute aggregate notional amount of contracts outstanding from September 1, 2024 through October 7, 2024 (last swap contract exited).
| 163 |
Notes to Financial Statements (continued)
During the current fiscal period, the effect of derivative contracts on the Funds’ Statements of Operations was as follows:
| Derivative Instrument | Risk Exposure | Net Realized Gain (Loss) |
Change in Unrealized Appreciation (Depreciation) |
|||||||||||
| |
||||||||||||||
| NQP |
||||||||||||||
| Swap contracts |
Equity | $(10,619,714) | $724,120 | |||||||||||
| |
||||||||||||||
Market and Counterparty Credit Risk: In the normal course of business each Fund may invest in financial instruments and enter into financial transactions where risk of potential loss exists due to changes in the market (market risk) or failure of the other party to the transaction to perform (counterparty credit risk). The potential loss could exceed the value of the financial assets recorded on the financial statements. Financial assets, which potentially expose each Fund to counterparty credit risk, consist principally of cash due from counterparties on forward, option and swap transactions, when applicable. The extent of each Fund’s exposure to counterparty credit risk in respect to these financial assets approximates their carrying value as recorded on the Statement of Assets and Liabilities.
Each Fund helps manage counterparty credit risk by entering into agreements only with counterparties the Adviser believes have the financial resources to honor their obligations and by having the Adviser monitor the financial stability of the counterparties. Additionally, counterparties may be required to pledge collateral daily (based on the daily valuation of the financial asset) on behalf of each Fund with a value approximately equal to the amount of any unrealized gain above a pre-determined threshold. Reciprocally, when each Fund has an unrealized loss, the Funds have instructed the custodian to pledge assets of the Funds as collateral with a value approximately equal to the amount of the unrealized loss above a pre-determined threshold. Collateral pledges are monitored and subsequently adjusted if and when the valuations fluctuate, either up or down, by at least the pre-determined threshold amount.
6. Fund Shares
Common Shares Equity Shelf Programs and Offering Costs: The following Funds have filed a registration statement with the Securities and Exchange Commission (“SEC”) authorizing each Fund to issue additional common shares through one or more equity shelf programs (“Shelf Offering”), which became effective with the SEC during the current fiscal period.
Under this Shelf Offering, the Funds, subject to market conditions, may raise additional equity capital by issuing additional common shares from time to time in varying amounts and by different offering methods at a net price at or above each Fund’s NAV per common share. In the event the Fund’s Shelf Offering registration statement is no longer current, the Fund may not issue additional common shares until a post-effective amendment to the registration statement has been filed with the SEC.
Maximum aggregate offering, common shares sold and offering proceeds, net of offering costs under the Fund’s Shelf Offering during the Fund’s current and prior fiscal period were as follows:
| NAZ | ||||||||||||
| |
|
|||||||||||
| Year Ended 8/31/25 |
Six Months Ended 8/31/24 |
Year Ended 2/29/24 |
||||||||||
| |
||||||||||||
| Maximum aggregate offering |
1,200,000 | — | — | |||||||||
| Common shares sold |
490,326 | – | – | |||||||||
| Offering proceeds, net of offering costs |
$5,699,157 | $– | $– | |||||||||
| |
||||||||||||
| NKX | ||||||||||||
| |
|
|||||||||||
| Year Ended 8/31/25 |
Six Months Ended 8/31/24 |
Year Ended 2/29/24 |
||||||||||
| |
||||||||||||
| Maximum aggregate offering |
4,800,000 | — | — | |||||||||
| Common shares sold |
2,040,416 | – | – | |||||||||
| Offering proceeds, net of offering costs |
$24,501,438 | $– | $– | |||||||||
| |
||||||||||||
| NAC | ||||||||||||
| |
|
|||||||||||
| Year Ended 8/31/25 |
Six Months Ended 8/31/24 |
Year Ended 2/29/24 |
||||||||||
| |
||||||||||||
| Maximum aggregate offering |
14,500,000 | — | — | |||||||||
| Common shares sold |
1,006,029 | – | – | |||||||||
| Offering proceeds, net of offering costs |
$11,173,911 | $– | $– | |||||||||
| |
||||||||||||
| 164 |
| NAN | ||||||||||||
| |
|
|||||||||||
| Year Ended 8/31/25 |
Six Months Ended 8/31/24 |
Year Ended 2/29/24 |
||||||||||
| |
||||||||||||
| Maximum aggregate offering |
3,100,000 | — | — | |||||||||
| Common shares sold |
166,880 | – | – | |||||||||
| Offering proceeds, net of offering costs |
$ | 1,811,164 | $– | $– | ||||||||
| |
||||||||||||
Costs incurred by the Funds’ in connection with their initial shelf registration are recorded as a prepaid expense and recognized as “Deferred offering costs” on the Statement of Assets and Liabilities. These costs are amortized pro rata as common shares are sold and are recognized as a component of “Proceeds from shelf offering, net of offering costs” on the Statement of Changes in Net Assets. Any deferred offering costs remaining one year after effectiveness of the initial shelf registration will be expensed. Costs incurred by the Fund to keep the shelf registration current are expensed as incurred and recognized as a component of “Other expenses” on the Statement of Operations.
Common Shares Repurchase Program: The Board reauthorized an open-market share repurchase program, allowing each Fund to repurchase and retire an aggregate of up to approximately 10% of its outstanding common shares.
Common Share Transactions: Transactions in common shares for the Funds during the Funds’ current and prior fiscal period, where applicable, were as follows:
| NAZ | ||||||||||||
| |
|
|||||||||||
| Year Ended 8/31/25 |
Six Months Ended 8/31/24 |
Year Ended 2/29/24 |
||||||||||
| |
||||||||||||
| Common Shares: |
||||||||||||
| Sold through shelf offering |
490,326 | — | — | |||||||||
| Issued to shareholders due to reinvestment of distributions |
17,078 | — | — | |||||||||
| Repurchased and retired |
— | — | (5,500) | |||||||||
| |
||||||||||||
| Total |
507,404 | — | (5,500) | |||||||||
| |
||||||||||||
| Price per share repurchased and retired |
– | – | 9.94 | |||||||||
| Discount per share repurchased and retired |
–% | –% | (16.65)% | |||||||||
| Premium to NAV per shelf offering sold |
4.97 | – | – | |||||||||
| |
||||||||||||
| NKX | ||||||||||||
| |
|
|||||||||||
| Year Ended 8/31/25 |
Six Months Ended 8/31/24 |
Year Ended 2/29/24 |
||||||||||
| |
||||||||||||
| Common Shares: |
||||||||||||
| Sold through shelf offering |
2,040,416 | — | — | |||||||||
| Issued to shareholders due to reinvestment of distributions |
141,083 | — | — | |||||||||
| |
||||||||||||
| Total |
2,181,499 | — | — | |||||||||
| |
||||||||||||
| Premium to NAV per shelf offering sold |
1.51% | –% | –% | |||||||||
| |
||||||||||||
| NAC | ||||||||||||
| |
|
|||||||||||
| Year Ended 8/31/25 |
Six Months Ended 8/31/24 |
Year Ended 2/29/24 |
||||||||||
| |
||||||||||||
| Common Shares: |
||||||||||||
| Sold through shelf offering |
1,006,029 | — | — | |||||||||
| Repurchased and retired |
— | — | (13,000) | |||||||||
| |
||||||||||||
| Total |
1,006,029 | — | (13,000) | |||||||||
| |
||||||||||||
| Price per share repurchased and retired |
– | – | 9.96 | |||||||||
| Discount per share repurchased and retired |
–% | –% | (16.91)% | |||||||||
| Premium to NAV per shelf offering sold |
1.41 | – | – | |||||||||
| |
||||||||||||
| NXJ | ||||||||||||
| |
|
|||||||||||
| Year Ended 8/31/25 |
Six Months Ended 8/31/24 |
Year Ended 2/29/24 |
||||||||||
| |
||||||||||||
| Common Shares: |
||||||||||||
| Repurchased and retired |
— | — | (250,000) | |||||||||
| |
||||||||||||
| 165 |
Notes to Financial Statements (continued)
| NXJ | ||||||||||||
| Year Ended 8/31/25 |
Six Months Ended 8/31/24 |
Year Ended 2/29/24 |
||||||||||
| Total |
– | – | (250,000) | |||||||||
| Price per share repurchased and retired |
– | – | 11.43 | |||||||||
| Discount per share repurchased and retired |
–% | –% | (16.32)% | |||||||||
| NAN | ||||||||||||
| Year Ended 8/31/25 |
Six Months Ended 8/31/24 |
Year Ended 2/29/24 |
||||||||||
| Common Shares: |
||||||||||||
| Sold through shelf offering |
166,880 | — | — | |||||||||
| Issued to shareholders due to reinvestment of distributions |
40,292 | — | — | |||||||||
| Repurchased and retired |
— | — | (15,000) | |||||||||
| Total |
207,172 | — | (15,000) | |||||||||
| Price per share repurchased and retired |
– | – | 9.85 | |||||||||
| Discount per share repurchased and retired |
– | % | – | % | (16.90)% | |||||||
| Premium to NAV per shelf offering sold |
0.87 | – | – | |||||||||
| NQP | ||||||||||||
| Year Ended 8/31/25 |
Six Months Ended 8/31/24 |
Year Ended 2/29/24 |
||||||||||
| Common Shares: |
||||||||||||
| Repurchased and retired |
— | — | (165,540 | ) | ||||||||
| Total |
— | — | (165,540 | ) | ||||||||
| Price per share repurchased and retired |
– | – | 11.21 | |||||||||
| Discount per share repurchased and retired |
– | % | – | % | (15.99)% | |||||||
Preferred Shares
Adjustable Rate MuniFund Term Preferred Shares: The following Funds have issued and has outstanding Adjustable Rate MuniFund Term Preferred (“AMTP”) Shares, with a $100,000 liquidation preference per share. AMTP Shares are issued via private placement and are not publicly available.
The details of the Funds’ AMTP Shares outstanding as of the end of the current fiscal period, were as follows:
| Fund | Series | Shares Outstanding |
Liquidation Preference |
Liquidation Preference, net of deferred offering costs |
||||||||||||
| NAZ |
2028 | 883 | $ | 88,300,000 | $ | 88,271,752 | ||||||||||
| NAN |
2028 | 1,270 | $ | 127,000,000 | $ | 126,968,403 | ||||||||||
The Fund is obligated to redeem its AMTP Shares by the date as specified in its offering document (“Term Redemption Date”), unless earlier redeemed by the Fund. AMTP Shares are subject to optional and mandatory redemption in certain circumstances. The AMTP Shares may be redeemed at the option of the Fund, subject to payment of premium for approximately six months following the date of issuance (“Premium Expiration Date”), and at the redemption price per share thereafter. The redemption price per share is equal to the sum of the liquidation preference per share plus any accumulated but unpaid dividends.
AMTP Shares are short-term or short/intermediate-term instruments that pay a variable dividend rate tied to a short-term index, plus an additional fixed “spread” amount which is initially established at the time of issuance and may be adjusted in the future based upon a mutual agreement between the majority owner and the Fund. From time-to-time the majority owner may propose to the Fund an adjustment to the dividend rate. Should the majority owner and the Fund fail to agree upon an adjusted dividend rate, and such proposed dividend rate adjustment is not withdrawn, the Fund will be required to redeem all outstanding shares upon the end of a notice period.
In addition, the Fund may be obligated to redeem a certain amount of the AMTP Shares if the Fund fails to maintain certain asset coverage and leverage ratio requirements and such failures are not cured by the applicable cure date. The Term Redemption Date and Premium Expiration Date for the Fund’s AMTP Shares are as follows:
| 166 |
| Fund | Notice Period |
Series | Term Redemption Date |
Premium Expiration Date |
||||||||||||||||
| NAZ |
180-day | 2028 | December 1, 2028 | * | February 13, 2019 | |||||||||||||||
| NAN |
180-day | 2028 | December 1, 2028 | * | November 30, 2019 | |||||||||||||||
* Subject to early termination by either the Fund or the holder.
The average liquidation preference of AMTP Shares outstanding and annualized dividend rate for the Fund during the current fiscal period were as follows:
| Fund | Average Liquidation Preference of AMTP Shares Outstanding |
Annualized Dividend Rate |
||||||
| NAZ |
$ | 88,300,000 | 3.74 | % | ||||
| NAN |
127,000,000 | 4.03 | ||||||
AMTP Shares are subject to restrictions on transfer, generally do not trade, and market quotations are generally not available. The fair value of AMTP Shares is expected to be approximately their liquidation preference so long as the fixed “spread” on the AMTP Shares remains roughly in line with the “spread” being demanded by investors on instruments having similar terms in the current market environment. In present market conditions, the Funds’ Adviser has determined that the fair value of AMTP Shares is approximately their liquidation preference, but their fair value could vary if market conditions change materially. For financial reporting purposes, the liquidation preference of AMTP Shares is a liability and is recognized as a component of “AMTP Shares, Net” on the Statement of Assets and Liabilities.
AMTP Share dividends are treated as interest payments for financial reporting purposes. Unpaid dividends on AMTP Shares are recognized as a component of “Payable for interest” on the Statement of Assets and Liabilities. Dividends accrued on AMTP Shares are recognized as a component of “Interest expense and amortization of offering costs” on the Statement of Operations.
Costs incurred in connection with the Fund’s offering of AMTP Shares were recorded as deferred charges, which are amortized over the life of the shares and are recognized as components of “AMTP Shares, Net” on the Statement of Assets and Liabilities and “Interest expense and amortization of offering costs” on the Statement of Operations.
MuniFund Preferred Shares: NKX, NAC and NRK have issued and have outstanding MuniFund Preferred (“MFP”) Shares, with a $100,000 liquidation preference per share. These MFP Shares were issued via private placement and are not publicly available.
The Funds are obligated to redeem their MFP Shares by the date as specified in its offering documents (“Term Redemption Date”), unless earlier redeemed by the Funds. MFP Shares are initially issued in a pre-specified mode, however, MFP Shares can be subsequently designated as an alternative mode at a later date at the discretion of the Funds. The modes within MFP Shares detail the dividend mechanics and are described as follows. At a subsequent date, the Funds may establish additional mode structures with the MFP Share.
● Variable Rate Remarketed Mode (“VRRM”) – Dividends for MFP Shares within this mode will be established by a remarketing agent; therefore, market value of the MFP Shares is expected to approximate its liquidation preference. Shareholders have the ability to request a best-efforts tender of its shares upon seven days notice. If the remarketing agent is unable to identify an alternative purchaser, the shares will be retained by the shareholder requesting tender and the subsequent dividend rate will increase to its step-up dividend rate. If after one consecutive year of unsuccessful remarketing attempts, the Fund will be required to designate an alternative mode or redeem the shares.
Each Fund will pay a remarketing fee on the aggregate principal amount of all MFP Shares while designated in VRRM. Payments made by the Fund to the remarketing agent are recognized as “Remarketing fees” on the Statement of Operations.
● Variable Rate Mode (“VRM”) – Dividends for MFP Shares designated in this mode are based upon a short-term index plus an additional fixed “spread” amount established at the time of issuance or renewal / conversion of its mode. At the end of the period of the mode, the Fund will be required to either extend the term of the mode, designate an alternative mode or redeem the MFP Shares.
The fair value of MFP Shares while in VRM are expected to approximate their liquidation preference so long as the fixed “spread” on the shares remains roughly in line with the “spread” being demanded by investors on instruments having similar terms in the current market. During the current fiscal period, the Adviser has determined that the fair value of the shares approximated their liquidation preference.
● Variable Rate Demand Mode (“VRDM”) – Dividends for MFP Shares designated in this mode will be established by a remarketing agent; therefore, the market value of the MFP Shares is expected to approximate its liquidation preference. While in this mode, shares will have an unconditional liquidity feature that enable its shareholders to require a liquidity provider, which the Fund has entered into a contractual agreement, to purchase shares in the event that the shares are not able to be successfully remarketed. In the event that shares within this mode are unable to be successfully
| 167 |
Notes to Financial Statements (continued)
remarketed and are purchased by the liquidity provider, the dividend rate will be the maximum rate which is designed to escalate according to a specified schedule in order to enhance the remarketing agent’s ability to successfully remarket the shares. Each Fund is required to redeem any shares that are still owned by a liquidity provider after six months of continuous, unsuccessful remarketing.
The Fund will pay a liquidity and remarketing fee on the aggregate principal amount of all MFP shares while within VRDM. Payments made by the Fund to the liquidity provider and remarketing agent are recognized as “Liquidity fees” and “Remarketing fees”, respectively, on the Statement Operations.
For financial reporting purposes, the liquidation preference of MFP Shares is recorded as a liability and is recognized as a component of “MFP Shares, Net” on the Statement of Assets and Liabilities. Dividends on the MFP shares are treated as interest payments for financial reporting purposes. Unpaid dividends on MFP shares are recognized as a component on “Payable for interest” on the Statement of Assets and Liabilities. Dividends accrued on MFP Shares are recognized as a component of “Interest expense and amortization of offering costs” on the Statement of Operations.
Subject to certain conditions, MFP Shares may be redeemed, in whole or in part, at any time at the option of the Fund. The Fund may also be required to redeem certain MFP Shares if the Fund fails to maintain certain asset coverage requirements and such failures are not cured by the applicable cure date. The redemption price per share in all circumstances is equal to the liquidation preference per share plus any accumulated but unpaid dividends.
Costs incurred in connection with the Fund’s offering of MFP Shares were recorded as a deferred charge and are being amortized over the life of the shares. These offering costs are recognized as a component of “MFP Shares, Net” on the Statement of Assets and Liabilities and “Interest expense and amortization of offering costs” on the Statement of Operations.
As of the end of the current fiscal period, NKX, NAC and NRK had $140,062,927, $256,945,290 and $79,634,566 respectively, of MFP Shares at liquidation preference, net of deferred offering costs. Further details of each Fund’s MFP Shares outstanding were as follows:
| Fund | Series | Shares Outstanding |
Liquidation Preference |
Term Redemption Date |
Mode | Mode Termination Date |
||||||||||||||||||
| NKX |
A | 1,404 | $ | 140,400,000 | October 1, 2047 | VRRM | N/A | |||||||||||||||||
| NAC |
A | 2,570 | $ | 257,000,000 | January 3, 2028 | VRM | January 3, 2028 | * | ||||||||||||||||
| NRK |
A | 800 | $80,000,000 | May 1, 2047 | VRRM | May 1, 2047 | ||||||||||||||||||
* Subject to early termination by either the Fund or the holder.
The average liquidation preference of MFP Shares outstanding and the annualized dividend rate for the Fund during the current fiscal period were as follows:
| Fund | Average Liquidation Preference of MFP Shares Outstanding |
Annualized Dividend Rate |
||||||
| NKX |
$ | 140,400,000 | 3.30 | % | ||||
| NAC |
273,273,973 | 4.20 | ||||||
| NRK |
80,000,000 | 3.30 | ||||||
Variable Rate Demand Preferred Shares: The following Funds have issued and have outstanding Variable Rate Demand Preferred (“VRDP”) Shares, with a $100,000 liquidation preference per share. VRDP Shares are issued via private placement and are not publicly available.
As of the end of the current fiscal period, NKX, NAC, NXJ, NRK, NAN and NQP had $255,773,357, $905,609,432, $312,832,483, $582,368,702, $88,341,245 and $216,906,167 VRDP Shares at liquidation preference, net of deferred offering costs, respectively. Further details of the Funds’ VRDP Shares outstanding as of the end of the current fiscal period, were as follows:
| 168 |
| Fund | Series | Shares Outstanding |
Remarketing Fees* |
Liquidation Preference |
Special Rate Period Expiration |
Maturity | ||||||||||||||||||
| NKX |
3 | 427 | 0.05 | % | $42,700,000 | N/A | March 1, 2040 | |||||||||||||||||
| 4 | 1,090 | 0.10 | % | $109,000,000 | N/A | December 1, 2040 | ||||||||||||||||||
| 6 | 1,050 | 0.10 | % | $105,000,000 | N/A | June 1, 2046 | ||||||||||||||||||
| NAC |
1 | 1,362 | 0.10 | % | $136,200,000 | N/A | June 1, 2041 | |||||||||||||||||
| 2 | 910 | N/A | ** | $91,000,000 | February 4, 2026 | December 1, 2040 | ||||||||||||||||||
| 4 | 1,056 | 0.10 | % | $105,600,000 | N/A | December 1, 2042 | ||||||||||||||||||
| 5 | 1,589 | N/A | ** | $158,900,000 | September 2, 2026 | August 1, 2040 | ||||||||||||||||||
| 6 | 1,581 | 0.10 | % | $158,100,000 | N/A | August 1, 2040 | ||||||||||||||||||
| 7 | 980 | 0.10 | % | $98,000,000 | N/A | August 3, 2043 | ||||||||||||||||||
| 8 | 1,600 | N/A | ** | $160,000,000 | November 6, 2026*** | November 6, 2026 | ||||||||||||||||||
| NXJ |
1 | 810 | N/A | ** | $81,000,000 | July 15, 2026 | August 3, 2043 | |||||||||||||||||
| 2 | 1,443 | N/A | ** | $144,300,000 | April 1, 2043*** | April 1, 2043 | ||||||||||||||||||
| 3 | 886 | N/A | ** | $88,600,000 | April 1, 2043*** | April 1, 2043 | ||||||||||||||||||
| NRK |
1 | 1,123 | 0.10 | % | $112,300,000 | N/A | August 1, 2040 | |||||||||||||||||
| 2 | 1,348 | 0.10 | % | $134,800,000 | N/A | August 1, 2040 | ||||||||||||||||||
| 3 | 1,617 | 0.10 | % | $161,700,000 | N/A | December 1, 2040 | ||||||||||||||||||
| 5 | 1,750 | 0.05 | % | $175,000,000 | N/A | June 1, 2046 | ||||||||||||||||||
| NAN |
1 | 890 | 0.05 | % | $89,000,000 | N/A | March 1, 2040 | |||||||||||||||||
| NQP |
2 | 1,125 | N/A | ** | $112,500,000 | December 1, 2042*** | December 1, 2042 | |||||||||||||||||
| 3 | 1,050 | N/A | ** | $105,000,000 | December 1, 2042*** | December 1, 2042 | ||||||||||||||||||
| * | Remarketing fees as a percentage of the aggregate principal amount of all VRDP Shares outstanding for each series. |
| ** | Not applicable. Series is considered to be Special Rate VRDP and therefore does not pay a remarketing fee. |
| *** | Subject to earlier termination by either the Fund or the holder. |
VRDP Shares include a liquidity feature that allows VRDP shareholders to have their shares purchased by a liquidity provider with whom each Fund has contracted in the event that the VRDP Shares are not able to be successfully remarketed. Each Fund is required to redeem any VRDP Shares that are still owned by the liquidity provider after six months of continuous, unsuccessful remarketing. Each Fund pays an annual remarketing fee on the aggregate principal amount of all VRDP Shares outstanding. Each Fund’s VRDP Shares have successfully remarketed since issuance.
NAC’s Series 2, Series 5 and Series 8 VRDP Shares and all series of NXJ and NQP’s VRDP Shares are considered to be Special Rate VRDP, which are sold to institutional investors. During the special rate period, the VRDP Shares will not be remarketed by a remarketing agent, be subject to optional or mandatory tender events, or be supported by a liquidity provider and are not subject to remarking fees or liquidity fees. During the special rate period, VRDP dividends will be set monthly as a floating rate based on the predetermined formula. Following the initial special rate period, Special Rate Period VRDP Shares may transition to traditional VRDP Shares with dividends set at weekly remarketings, and be supported by a designated liquidity provider, or the Board may approve a subsequent special rate period. The fair value of Special Rate VRDP Shares is expected to approximate their liquidation preference so long as the fixed “spread” on the shares remains roughly in line with the “spread” being demanded by investors on instruments having similar terms in the current market. During the current reporting period, the Adviser has determined that the fair value of the shares approximated their liquidation preference.
Dividends on the VRDP Shares (which are treated as interest payments for financial reporting purposes) are set at a rate established by a remarketing agent; therefore, the market value of the VRDP Shares is expected to approximate its liquidation preference. In the event that VRDP Shares are unable to be successfully remarketed, the dividend rate will be the maximum rate which is designed to escalate according to a specified schedule in order to enhance the remarketing agent’s ability to successfully remarket the VRDP Shares.
Subject to certain conditions, VRDP Shares may be redeemed, in whole or in part, at any time at the option of each Fund. Each Fund may also redeem certain of the VRDP Shares if the Fund fails to maintain certain asset coverage requirements and such failures are not cured by the applicable cure date. The redemption price per share is equal to the sum of the liquidation preference per share plus any accumulated but unpaid dividends.
The average liquidation preference of VRDP Shares outstanding and annualized dividend rate for each Fund during the current fiscal period were as follows:
| Fund | Average Liquidation Preference of VRDP Shares Outstanding |
Annualized Dividend Rate |
||||||
| NKX |
$ | 256,700,000 | 2.89 | % | ||||
| 169 |
Notes to Financial Statements (continued)
| Fund | Average Liquidation Preference of VRDP Shares Outstanding |
Annualized Dividend Rate |
||||||
| NAC |
$ | 907,800,000 | 3.32% | |||||
| NXJ |
313,900,000 | 3.96 | ||||||
| NRK |
583,800,000 | 2.91 | ||||||
| NAN |
89,000,000 | 3.01 | ||||||
| NQP |
217,500,000 | 3.97 | ||||||
For financial reporting purposes, the liquidation preference of VRDP Shares is a liability and is recognized as a component of “VRDP Shares, Net” on the Statement of Assets and Liabilities. Unpaid dividends on VRDP Shares are recognized as a component of “Payable for interest” on the Statement of Assets and Liabilities, when applicable. Dividends accrued on VRDP Shares are recognized as a component of “Interest expense and amortization of offering costs” on the Statement of Operations. Costs incurred by the Funds in connection with their offerings of VRDP Shares were recorded as a deferred charge, which are amortized over the life of the shares and are recognized as a component of “VRDP Shares, Net” on the Statement of Assets and Liabilities and “Interest expense and amortization of offering costs” on the Statement of Operations. In addition to interest expense, each Fund may also pay a per annum liquidity fee to the liquidity provider, as well as a remarketing fee, which are recognized as “Liquidity fees” and “Remarketing fees,” respectively, on the Statement of Operations.
Preferred Share Transactions: Transactions in preferred shares during the Funds’ current and prior fiscal period, where applicable, are noted in the following tables.
Transactions in MFP Shares for the Funds, where applicable, were as follows:
| Year Ended August 31, 2025 |
||||||||||||||||
| NAC | Series | Shares | Amount | |||||||||||||
| MFP Shares redeemed |
A | (180 | ) | $(18,000,000) | ||||||||||||
| Year Ended February 29, 2024 |
||||||||||||||||
| Series | Shares | Amount | ||||||||||||||
| MFP Shares redeemed |
A | (450 | ) | $(45,000,000) | ||||||||||||
Transactions in VRDP Shares for the Funds, where applicable, were as follows:
| Year Ended February 29, 2024 |
||||||||||||||||
| NAC | Series | Shares | Amount | |||||||||||||
| VRDP Shares redeemed |
3 | (498) | $ | (49,800,000 | ) | |||||||||||
| NKX | Series | Shares | Amount | |||||||||||||
| VRDP Shares redeemed |
2 | (355) | $ | (35,500,000 | ) | |||||||||||
| NRK | Series | Shares | Amount | |||||||||||||
| VRDP Shares redeemed |
2 | (300) | $ | (30,000,000 | ) | |||||||||||
| 4 | (500) | (50,000,000 | ) | |||||||||||||
| Total |
(800) | $ | (80,000,000 | ) | ||||||||||||
7. Income Tax Information
Each Fund is a separate taxpayer for federal income tax purposes. Each Fund intends to distribute substantially all of its net investment income and net capital gains to shareholders and otherwise comply with the requirements of Subchapter M of the Internal Revenue Code applicable to regulated investment companies. Therefore, no federal income tax provision is required.
Each Fund intends to satisfy conditions that will enable interest from municipal securities, which is exempt from regular federal and designated state income taxes, and in the case of NKX and NRK, the alternative minimum tax applicable to individuals, to retain such tax-exempt status when distributed to shareholders of the Funds. Net realized capital gains and ordinary income distributions paid by the Funds are subject to federal taxation.
170
Each Fund intends to satisfy conditions that will enable interest from municipal securities, which is exempt from regular federal and designated state income taxes, to retain such tax-exempt status when distributed to shareholders of the Funds. Net realized capital gains and ordinary income distributions paid by the Funds are subject to federal taxation.
Each Fund files income tax returns in U.S. federal and applicable state and local jurisdictions. A Fund’s federal income tax returns are generally subject to examination for a period of three fiscal years after being filed. State and local tax returns may be subject to examination for an additional period of time depending on the jurisdiction. Management has analyzed each Fund’s tax positions taken for all open tax years and has concluded that no provision for income tax is required in the Fund’s financial statements.
Differences between amounts for financial statement and federal income tax purposes are primarily due to timing differences in recognizing gains and losses on investment transactions. Temporary differences do not require reclassification. As of year end, permanent differences that resulted in reclassifications among the components of net assets relate primarily to investments in partnerships, nondeductible expenses, taxable market discount, taxes paid, and treatment of notional principal contracts. Temporary and permanent differences have no impact on a Fund’s net assets.
As of year end, the aggregate cost and the net unrealized appreciation/(depreciation) of all investments for federal income tax purposes were as follows:
| Fund | Tax Cost | Gross Unrealized Appreciation |
Gross Unrealized (Depreciation) |
Net Unrealized Appreciation (Depreciation) |
||||||||||||
| NAZ |
$ | 229,316,383 | $ | 1,174,194 | $ | (12,457,827 | ) | $ | (11,283,633 | ) | ||||||
| NKX |
994,623,675 | 27,592,410 | (49,406,345 | ) | (21,813,935 | ) | ||||||||||
| NCA |
298,751,889 | 6,688,359 | (15,241,291 | ) | (8,552,932 | ) | ||||||||||
| NAC |
2,875,262,549 | 47,052,796 | (159,622,761 | ) | (112,569,965 | ) | ||||||||||
| NXJ |
847,904,653 | 17,155,233 | (52,652,311 | ) | (35,497,078 | ) | ||||||||||
| NRK |
1,610,049,146 | 17,587,738 | (81,892,849 | ) | (64,305,111 | ) | ||||||||||
| NNY |
167,212,761 | 1,256,333 | (7,305,902 | ) | (6,049,569 | ) | ||||||||||
| NAN |
571,534,526 | 3,725,641 | (27,143,310 | ) | (23,417,669 | ) | ||||||||||
| NQP |
675,197,190 | 6,793,016 | (48,536,532 | ) | (41,743,516 | ) | ||||||||||
For purposes of this disclosure, tax cost generally includes the cost of portfolio investments as well as up-front fees or premiums exchanged on derivatives and any amounts unrealized for income statement reporting but realized income and/or capital gains for tax reporting, if applicable.
As of year end, the components of accumulated earnings on a tax basis were as follows:
| Fund | Undistributed Tax-Exempt Income1 |
Undistributed Ordinary Income |
Undistributed Long-Term Capital Gains |
Unrealized Appreciation (Depreciation) (Depreciation) |
Capital Loss Carryforwards |
Late‑Year Loss Deferrals |
Other Book‑to‑Tax Differences |
Total | ||||||||||||||||||||||||
| NAZ |
$ | — | $ | — | $ | — | $ | (11,283,633 | ) | $ | (8,588,658 | ) | $ | — | $ | (874,795 | ) | $ | (20,747,086 | ) | ||||||||||||
| NKX |
— | 8,689 | — | (21,813,935 | ) | (36,154,230 | ) | — | (3,758,505 | ) | (61,717,981 | ) | ||||||||||||||||||||
| NCA |
1,197,736 | 64,513 | — | (8,552,932 | ) | (11,920,732 | ) | — | (960,138 | ) | (20,171,553 | ) | ||||||||||||||||||||
| NAC |
— | 21,946 | — | (112,569,965 | ) | (162,073,468 | ) | — | (10,664,804 | ) | (285,286,291 | ) | ||||||||||||||||||||
| NXJ |
— | 393 | — | (35,497,078 | ) | (15,749,731 | ) | — | (3,236,785 | ) | (54,483,201 | ) | ||||||||||||||||||||
| NRK |
— | 18,332 | — | (64,305,111 | ) | (162,610,402 | ) | — | (6,019,236 | ) | (232,916,417 | ) | ||||||||||||||||||||
| NNY |
640,663 | — | — | (6,049,569 | ) | (11,414,764 | ) | — | (557,139 | ) | (17,380,809 | ) | ||||||||||||||||||||
| NAN |
— | — | — | (23,417,669 | ) | (59,529,598 | ) | — | (2,226,040 | ) | (85,173,307 | ) | ||||||||||||||||||||
| NQP |
— | 604,096 | — | (41,743,516 | ) | (18,062,797 | ) | — | (2,902,989 | ) | (62,105,206 | ) | ||||||||||||||||||||
| 1 | Undistributed tax-exempt income (on a tax basis) has not been reduced for the dividend declared on August 1, 2025 and paid on September 1, 2025. |
171
Notes to Financial Statements (continued)
The tax character of distributions paid was as follows:
| 8/31/25 | 8/31/24 | |||||||||||||||||||||||||||||||||||
| Fund | Tax‑Exempt Income1 |
Ordinary Income | Long‑Term Capital Gains |
Return of Capital |
|
Tax‑Exempt Income |
Ordinary Income |
Long‑Term Capital Gains |
Return of Capital |
|||||||||||||||||||||||||||
| NAZ |
$ | 4,670,083 | $ | — | $ | — | $ | 5,502,803 | $ | 2,403,327 | $ | — | $ | — | $ | 1,595,349 | ||||||||||||||||||||
| NKX |
23,798,874 | 19,838 | — | 20,059,831 | 11,921,842 | 4,346 | — | 6,179,059 | ||||||||||||||||||||||||||||
| NCA |
11,457,665 | 63,987 | — | — | 5,760,826 | — | — | — | ||||||||||||||||||||||||||||
| NAC |
68,128,913 | 44,837 | — | 59,498,838 | 34,523,783 | 861 | — | 18,660,712 | ||||||||||||||||||||||||||||
| NXJ |
16,621,587 | 1,227 | — | 22,218,611 | 9,312,199 | 818 | — | 6,149,334 | ||||||||||||||||||||||||||||
| NRK |
39,820,118 | 42,632 | — | 32,368,083 | 20,531,002 | 101,293 | — | 9,594,738 | ||||||||||||||||||||||||||||
| NNY |
6,685,663 | — | — | — | 3,172,856 | — | — | — | ||||||||||||||||||||||||||||
| NAN |
14,970,712 | — | — | 11,680,591 | 7,823,102 | — | — | 3,324,232 | ||||||||||||||||||||||||||||
| NQP |
$ | 14,929,801 | $ | 1,666,879 | $ | — | $ | 18,239,183$ | $ | 7,325,183 | $ | 201,739 | $ | — | $ | 6,262,274 | ||||||||||||||||||||
| 1 | Each Fund designates these amounts paid during the period as Exempt Interest Dividends. |
As of year end, the Funds had capital loss carryforwards, which will not expire:
| Fund | Short‑Term | Long‑Term | Total | |||||||||
| NAZ |
$ | 3,449,252 | $ | 5,139,406 | $ | 8,588,658 | ||||||
| NKX |
14,139,534 | 22,014,696 | 36,154,230 | |||||||||
| NCA |
5,106,209 | 6,814,523 | 11,920,732 | |||||||||
| NAC |
87,436,438 | 74,637,030 | 162,073,468 | |||||||||
| NXJ |
1,941,347 | 13,808,384 | 15,749,731 | |||||||||
| NRK |
103,110,661 | 59,499,741 | 162,610,402 | |||||||||
| NNY1 |
6,410,025 | 5,004,739 | 11,414,764 | |||||||||
| NAN |
37,765,230 | 21,764,368 | 59,529,598 | |||||||||
| NQP |
15,235,187 | 2,827,610 | 18,062,797 | |||||||||
| 1 | A portion of NNY’s capital loss carryforwards is subject to an annual limitation under the Internal Revenue Code and related regulations. |
| 8. | Management Fees and Other Transactions with Affiliates |
Management Fees: Each Fund’s management fee compensates the Adviser for overall investment advisory and administrative services and general office facilities. The Sub-Adviser is compensated for its services to the Funds from the management fees paid to the Adviser.
Each Fund’s management fee consists of two components – a fund-level fee, based only on the amount of assets within each individual Fund, and a complex-level fee, based on the aggregate amount of all eligible fund assets managed by the Adviser, and for NCA and NNY a gross interest income component. This pricing structure enables Fund shareholders to benefit from growth in the assets within their respective Fund as well as from growth in the amount of complex-wide assets managed by the Adviser.
NCA and NNY pay an annual fund-level fee, payable monthly, of 0.15% of the average daily net assets of each Fund, as well as 4.125% of the gross interest income (excluding interest on bonds underlying a “self-deposited inverse floater” trust that is attributed to the Fund over and above the net interest earned on the inverse floater itself) of each Fund.
The annual fund-level fee, payable monthly, for NAZ, NKX, NAC, NXJ, NRK, NAN and NQP is calculated according to the following schedules:
| 172 |
| Average Daily Managed Assets* |
NAZ | NKX | NAC | NXJ | NRK | NAN | NQP | |||||||||||||||||||||
| For the first $125 million |
0.4500 | % | 0.4500 | % | 0.4500 | % | 0.4500 | % | 0.4500 | % | 0.4500 | % | 0.4500 | % | ||||||||||||||
| For the next $125 million |
0.4375 | 0.4375 | 0.4375 | 0.4375 | 0.4375 | 0.4375 | 0.4375 | |||||||||||||||||||||
| For the next $250 million |
0.4250 | 0.4250 | 0.4250 | 0.4250 | 0.4250 | 0.4250 | 0.4250 | |||||||||||||||||||||
| For the next $500 million |
0.4125 | 0.4125 | 0.4125 | 0.4125 | 0.4125 | 0.4125 | 0.4125 | |||||||||||||||||||||
| For the next $1 billion |
0.4000 | 0.4000 | 0.4000 | 0.4000 | 0.4000 | 0.4000 | 0.4000 | |||||||||||||||||||||
| For the next $3 billion |
0.3750 | 0.3750 | 0.3750 | 0.3750 | 0.3750 | 0.3750 | 0.3750 | |||||||||||||||||||||
| For managed assets over $5 billion |
0.3625 | 0.3625 | 0.3625 | 0.3625 | 0.3625 | 0.3625 | 0.3625 |
The annual complex-level fee, payable monthly, for each fund is calculated according to the following schedule:
| Complex-Level Asset Breakpoint Level* |
Complex‑Level Fee | |||
| For the first $124.3 billion |
0.1600 | % | ||
| For the next $75.7 billion |
0.1350 | |||
| For the next $200 billion |
0.1325 | |||
| For eligible assets over $400 billion |
0.1300 |
| * | The complex-level fee is calculated based upon the aggregate daily “eligible assets” of all Nuveen-branded closed-end funds and Nuveen branded open-end funds (“Nuveen Mutual Funds”). Except as described below, eligible assets include the assets of all Nuveen-branded closed-end funds and Nuveen Mutual Funds organized in the United States. Eligible assets do not include the net assets of: Nuveen fund-of-funds, Nuveen money market funds, Nuveen index funds, Nuveen Large Cap Responsible Equity Fund or Nuveen Life Large Cap Responsible Equity Fund. In addition, eligible assets include a fixed percentage of the aggregate net assets of the active equity and fixed income Nuveen Mutual Funds advised by the Adviser’s affiliate, Teachers Advisors, LLC (except those identified above). The fixed percentage will increase annually until May 1, 2033, at which time eligible assets will include all of the aggregate net assets of the active equity and fixed income Nuveen Mutual Funds advised by Teachers Advisors, LLC (except those identified above). Eligible assets include closed-end fund assets managed by the Adviser that are attributable to financial leverage. For these purposes, financial leverage includes the closed-end funds’ use of preferred stock and borrowings and certain investments in the residual interest certificates (also called inverse floating rate securities) in tender option bond (TOB) trusts, including the portion of assets held by a TOB trust that has been effectively financed by the trust’s issuance of floating rate securities, subject to an agreement by the Adviser as to certain funds to limit the amount of such assets for determining eligible assets in certain circumstances. |
As of the end of the current fiscal period, the annual complex-level fee for each Fund was as follows:
| Fund |
Complex‑Level Fee | |||
| NAZ |
0.1568 | % | ||
| NKX |
0.1568 | |||
| NCA |
0.1568 | |||
| NAC |
0.1568 | |||
| NXJ |
0.1568 | |||
| NRK |
0.1568 | |||
| NNY |
0.1568 | |||
| NAN |
0.1568 | |||
| NQP |
0.1568 |
Other Transactions with Affiliates: Each Fund is permitted to purchase or sell securities from or to certain other funds or accounts managed by the Sub-Adviser or by an affiliate of the Adviser (each an, “Affiliated Entity”) under specified conditions outlined in procedures adopted by the Board (“cross-trade”). These procedures have been designed to ensure that any cross-trade of securities by the Fund from or to an Affiliated Entity by virtue of having a common investment adviser (or affiliated investment adviser), common officer and/or common trustee complies with Rule 17a-7 under the 1940 Act. These transactions are effected at the current market price (as provided by an independent pricing service) without incurring broker commissions.
During the current fiscal period, the Funds engaged in cross-trades pursuant to these procedures as follows:
| 173 |
Notes to Financial Statements (continued)
| Fund | Purchases | Sales | Realized Gain (Loss) |
|||||||||
| NAZ |
$ | 11,236,554 | $ | 12,600,517 | $ | (574,740 | ) | |||||
| NKX |
7,257,856 | — | — | |||||||||
| NCA |
2,342,652 | — | — | |||||||||
| NAC |
16,757,970 | — | — | |||||||||
| NXJ |
1,628,154 | — | — | |||||||||
| NRK |
— | — | — | |||||||||
| NNY |
— | — | — | |||||||||
| NAN |
— | — | — | |||||||||
| NQP |
2,188,493 | 6,047,255 | 1,946 | |||||||||
9. Commitments and Contingencies
In the normal course of business, each Fund enters into a variety of agreements that may expose the Fund to some risk of loss. These could include recourse arrangements for certain TOB Trusts and certain agreements related to preferred shares, which are described elsewhere in these Notes to Financial Statements. The risk of future loss arising from such agreements, while not quantifiable, is expected to be remote. As of the end of the current fiscal period, the Funds did not have any unfunded commitments other then those disclosed in the Notes to Financial Statements, when applicable.
From time to time, the Funds may be party to certain legal proceedings in the ordinary course of business, including proceedings relating to the enforcement of the Funds’ rights under contracts. As of the end of the current fiscal period, management has determined that any legal proceeding(s) the Funds are subject to, including those described within this report, are unlikely to have a material impact to any of the Funds’ financial statements.
10. Borrowing Arrangements
Line of Credit: The Funds, along with certain funds managed by the Adviser or by an affiliate of the Adviser (“Participating Funds”), have established a 364-day, $2.7 billion standby credit facility with a group of lenders, under which the Participating Funds may borrow for temporary purposes (other than on-going leveraging for investment purposes). Each Participating Fund is allocated a designated proportion of the facility’s capacity (and its associated costs, as described below) based upon a multi-factor assessment of the likelihood and frequency of its need to draw on the facility, the size of the Fund and its anticipated draws, and the potential importance of such draws to the operations and well-being of the Fund, relative to those of the other Funds. A Fund may effect draws on the facility in excess of its designated capacity if and to the extent that other Participating Funds have undrawn capacity. The credit facility expires in June 2026, unless extended or renewed.
The credit facility has the following terms: 0.15% per annum on unused commitment amounts and a drawn interest rate equal to the higher of (a) OBFR (Overnight Bank Funding Rate) plus 1.20% per annum or (b) the Fed Funds Effective Rate plus 1.20% per annum on amounts borrowed. Interest expense incurred by the Participating Funds, when applicable, is recognized as a component of “Interest expense and amortization of offering costs” on the Statement of Operations. Participating Funds paid administration, legal and arrangement fees, which are recognized as a component of “Interest expense and amortization of offering costs” on the Statement of Operations, and along with commitment fees, have been allocated among such Participating Funds based upon the relative proportions of the facility’s aggregate capacity reserved for them and other factors deemed relevant by the Adviser and the Board of each Participating Fund.
During the current fiscal period, the following Funds utilized this facility. The Fund’s maximum outstanding balance during the utilization period was as follows:
| Fund | Maximum Outstanding Balance |
|||
| NAZ |
$ | 3,658,804 | ||
| NKX |
8,200,000 | |||
| NCA |
6,944,904 | |||
| NAC |
51,100,000 | |||
| NXJ |
8,178,738 | |||
| NRK |
7,459,128 | |||
| NNY |
— | |||
| NAN |
3,822,516 | |||
| NQP |
7,467,833 | |||
174
During the Fund’s utilization period(s) during the current fiscal period, the average daily balance outstanding and average annual interest rate on the Borrowings were as follows:
| Fund | Utilization Period (Days Outstanding) |
Average Daily Balance Outstanding |
Average Annual Interest Rate |
|||||||||
| NAZ |
5 | $ | 1,370,440 | 5.63 | % | |||||||
| NKX |
12 | 5,751,953 | 5.57 | |||||||||
| NCA |
3 | 3,298,246 | 5.70 | |||||||||
| NAC |
48 | 22,946,261 | 5.64 | |||||||||
| NXJ |
3 | 5,487,069 | 5.53 | |||||||||
| NRK |
10 | 2,798,162 | 5.58 | |||||||||
| NNY |
— | — | — | |||||||||
| NAN |
4 | 2,724,412 | 5.66 | |||||||||
| NQP |
2 | 3,873,161 | 5.78 | |||||||||
Borrowings outstanding as of the end of the current fiscal period, if any, are recognized as “Borrowings” on the Statement of Assets and Liabilities, where applicable.
Inter-Fund Borrowing and Lending: The SEC has granted an exemptive order permitting registered open-end and closed-end Nuveen funds to participate in an inter-fund lending facility whereby the Nuveen funds may directly lend to and borrow money from each other for temporary purposes (e.g., to satisfy redemption requests or when a sale of securities “fails,” resulting in an unanticipated cash shortfall) (the “Inter-Fund Program”). The closed-end Nuveen funds, including the Funds covered by this shareholder report, will participate only as lenders, and not as borrowers, in the Inter-Fund Program because such closed-end funds rarely, if ever, need to borrow cash to meet redemptions. The Inter-Fund Program is subject to a number of conditions, including, among other things, the requirements that (1) no fund may borrow or lend money through the Inter-Fund Program unless it receives a more favorable interest rate than is typically available from a bank or other financial institution for a comparable transaction; (2) no fund may borrow on an unsecured basis through the Inter-Fund Program unless the fund’s outstanding borrowings from all sources immediately after the inter-fund borrowing total 10% or less of its total assets; provided that if the borrowing fund has a secured borrowing outstanding from any other lender, including but not limited to another fund, the inter-fund loan must be secured on at least an equal priority basis with at least an equivalent percentage of collateral to loan value; (3) if a fund’s total outstanding borrowings immediately after an inter-fund borrowing would be greater than 10% of its total assets, the fund may borrow through the inter-fund loan on a secured basis only; (4) no fund may lend money if the loan would cause its aggregate outstanding loans through the Inter-Fund Program to exceed 15% of its net assets at the time of the loan; (5) a fund’s inter-fund loans to any one fund shall not exceed 5% of the lending fund’s net assets; (6) the duration of inter- fund loans will be limited to the time required to receive payment for securities sold, but in no event more than seven days; and (7) each inter-fund loan may be called on one business day’s notice by a lending fund and may be repaid on any day by a borrowing fund. In addition, a Nuveen fund may participate in the Inter-Fund Program only if and to the extent that such participation is consistent with the fund’s investment objective and investment policies. The Board is responsible for overseeing the Inter-Fund Program.
The limitations detailed above and the other conditions of the SEC exemptive order permitting the Inter-Fund Program are designed to minimize the risks associated with Inter-Fund Program for both the lending fund and the borrowing fund. However, no borrowing or lending activity is without risk. When a fund borrows money from another fund, there is a risk that the loan could be called on one day’s notice or not renewed, in which case the fund may have to borrow from a bank at a higher rate or take other actions to payoff such loan if an inter-fund loan is not available from another fund. Any delay in repayment to a lending fund could result in a lost investment opportunity or additional borrowing costs.
During the current fiscal period, none of the Funds covered by this shareholder report have entered into any inter-fund loan activity.
11. Subsequent Event
Fund Merger: On September 17, 2025, the Board approved a merger of NXJ, NQP and Nuveen Missouri Quality Municipal Income Fund (NOM) into the Nuveen Municipal High Income Opportunity Fund (NMZ). The merger is pending shareholder approval and satisfying other closing conditions.
| 175 |
Shareholder Update
(Unaudited)
CURRENT INVESTMENT OBJECTIVES, INVESTMENT POLICIES AND PRINCIPAL RISKS OF THE FUNDS
NUVEEN ARIZONA QUALITY MUNICIPAL INCOME FUND (NAZ)
Investment Objectives
The Fund’s primary investment objective is current income exempt from both regular federal income taxes and Arizona individual income taxes, and its secondary investment objective is the enhancement of portfolio value relative to the Arizona municipal bond market through investments in tax-exempt Arizona Municipal Obligations (as defined below) that, in the opinion of the Fund’s investment adviser, are underrated or undervalued or that represent municipal market sectors that are undervalued.
Investment Policies
As a fundamental policy, under normal circumstances, the Fund will invest at least 80% of its Assets (as defined below) in municipal securities and other related investments the income from which is exempt from regular federal and Arizona income taxes.
“Assets” mean the net assets of the Fund plus the amount of any borrowings for investment purposes. “Managed Assets” mean the total assets of the Fund, minus the sum of its accrued liabilities (other than Fund liabilities incurred for the express purpose of creating leverage). Total assets for this purpose shall include assets attributable to the Fund’s use of leverage (whether or not those assets are reflected in the Fund’s financial statements for purposes of generally accepted accounting principles), and derivatives will be valued at their market value.
Under normal circumstances:
| ● | The Fund will invest at least 80% of its Managed Assets in investment grade securities that, at the time of investment, are rated within the four highest grades (Baa or BBB or better) by at least one nationally recognized statistical rating organization (“NRSRO”) or are unrated but judged to be of comparable quality by the Fund’s sub-adviser. |
| ● | The Fund may invest up to 20% of its Managed Assets in municipal securities that at the time of investment are rated below investment grade or are unrated but judged to be of comparable quality by the Fund’s sub-adviser. |
| ● | No more than 10% of the Fund’s Managed Assets may be invested in municipal securities rated below B3/B- or that are unrated but judged to be of comparable quality by the Fund’s sub-adviser. |
| ● | The Fund may invest up to 20% of its Managed Assets in municipal securities that pay interest that is taxable under the federal alternative minimum tax. |
| ● | The Fund may invest up to 15% of its Managed Assets in inverse floating rate securities. |
| ● | The Fund will generally maintain an investment portfolio with an overall weighted average maturity of greater than 10 years. |
The foregoing policies apply only at the time of any new investment.
Approving Changes in Investment Policies
The Board of Trustees of the Fund may change the policies described above without a shareholder vote. However, the Fund’s (i) investment objectives, (ii) policy of investing at least 80% of its Assets in municipal securities and other related investments the income from which is exempt from regular federal and Arizona income taxes, (iii) policy (as described below) that it may not issue debt securities that rank senior to Preferred Shares (as defined below) other than for temporary or emergency purposes and (iv) policy (as described below) that it may not borrow money, except from banks for temporary or emergency purposes, or to repurchase its shares, subject to certain restrictions, may not be changed without the approval of the holders of a majority of the outstanding common shares and preferred shares voting together as a single class, and the approval of the holders of a majority of the outstanding preferred shares, voting separately as a single class. A “majority of the outstanding” shares means (i) 67% or more of the shares present at a meeting, if the holders of more than 50% of the shares are present or represented by proxy or (ii) more than 50% of the shares, whichever is less.
Portfolio Contents
The Fund invests in various municipal securities, including municipal bonds and notes, other securities issued to finance and refinance public projects, and other related securities and derivative instruments creating exposure to municipal bonds, notes and securities that provide for the payment of interest income that is exempt from federal and Arizona income tax (for purposes of the Fund’s investment objectives, “Arizona Municipal Obligations”).
The Fund generally invests in municipal securities. Municipal securities include municipal bonds, notes, securities issued to finance and refinance public projects, certificates of participation, variable rate demand obligations, lease obligations, municipal notes, pre-refunded municipal bonds, private activity bonds, securities issued by tender option bond trusts (“TOB trusts”), including inverse floating rate securities, and other forms of municipal bonds and securities, and other related instruments that create exposure to municipal bonds, notes and securities that provide for the payment of interest income that is exempt from regular U.S. federal income tax and Arizona income taxes.
| 176 |
Municipal securities are debt obligations generally issued by states, cities and local authorities and certain possessions and territories of the United States (such as Puerto Rico and Guam) to finance or refinance public purpose projects such as roads, schools, and water supply systems.
The Fund may also invest in municipal securities that pay interest that is taxable under the federal alternative minimum tax applicable to noncorporate taxpayers (“AMT Bonds”). AMT Bonds may trigger adverse tax consequences for Fund shareholders who are subject to the federal alternative minimum tax.
The municipal securities in which the Fund invests are generally issued by the State of Arizona, a municipality of Arizona, or a political subdivision of either, and pay interest that, in the opinion of bond counsel to the issuer (or on the basis of other authority believed by the Fund’s sub-adviser to be reliable), is exempt from regular federal and Arizona income taxes, although the interest may be subject to the federal alternative minimum tax. The Fund may invest in municipal securities issued by U.S. territories (such as Puerto Rico or Guam) that are exempt from regular federal and Arizona income taxes.
The Fund may invest in municipal securities that represent lease obligations and certificates of participation in such leases. A municipal lease is an obligation in the form of a lease or installment purchase that is issued by a state or local government to acquire equipment and facilities. Income from such obligations generally is exempt from state and local taxes in the state of issuance. A certificate of participation represents an undivided interest in an unmanaged pool of municipal leases, an installment purchase agreement or other instruments. The certificates typically are issued by a municipal agency, a trust or other entity that has received an assignment of the payments to be made by the state or political subdivision under such leases or installment purchase agreements. Such certificates provide the Fund with the right to a pro rata undivided interest in the underlying municipal securities. In addition, such participations generally provide the Fund with the right to demand payment, on not more than seven days’ notice, of all or any part of the Fund’s participation interest in the underlying municipal securities, plus accrued interest.
The Fund may invest in municipal notes. Municipal securities in the form of notes generally are used to provide for short-term capital needs, in anticipation of an issuer’s receipt of other revenues or financing, and typically have maturities of up to three years. Such instruments may include tax anticipation notes, revenue anticipation notes, bond anticipation notes, tax and revenue anticipation notes and construction loan notes. Tax anticipation notes are issued to finance the working capital needs of governments. Generally, they are issued in anticipation of various tax revenues, such as income, sales, property, use and business taxes, and are payable from these specific future taxes. Revenue anticipation notes are issued in expectation of receipt of other kinds of revenue, such as federal revenues available under federal revenue sharing programs. Bond anticipation notes are issued to provide interim financing until long-term bond financing can be arranged. In most cases, the long-term bonds then provide the funds needed for repayment of the bond anticipation notes. Tax and revenue anticipation notes combine the funding sources of both tax anticipation notes and revenue anticipation notes. Construction loan notes are sold to provide construction financing. Mortgage notes insured by the Federal Housing Authority secure these notes; however, the proceeds from the insurance may be less than the economic equivalent of the payment of principal and interest on the mortgage note if there has been a default. The anticipated revenues from taxes, grants or bond financing generally secure the obligations of an issuer of municipal notes.
The Fund may invest in “tobacco settlement bonds.” Tobacco settlement bonds are municipal securities that are secured or payable solely from the collateralization of the proceeds from class action or other litigation against the tobacco industry.
The Fund may invest in pre-refunded municipal securities. The principal of and interest on pre-refunded municipal securities are no longer paid from the original revenue source for the securities. Instead, the source of such payments is typically an escrow fund consisting of U.S. government securities. The assets in the escrow fund are derived from the proceeds of refunding bonds issued by the same issuer as the pre-refunded municipal securities. Issuers of municipal securities use this advance refunding technique to obtain more favorable terms with respect to securities that are not yet subject to call or redemption by the issuer. For example, advance refunding enables an issuer to refinance debt at lower market interest rates, restructure debt to improve cash flow or eliminate restrictive covenants in the indenture or other governing instrument for the pre-refunded municipal securities. However, except for a change in the revenue source from which principal and interest payments are made, the pre- refunded municipal securities remain outstanding on their original terms until they mature or are redeemed by the issuer.
The Fund may invest in private activity bonds. Private activity bonds are issued by or on behalf of public authorities to obtain funds to provide privately operated housing facilities, airport, mass transit or port facilities, sewage disposal, solid waste disposal or hazardous waste treatment or disposal facilities and certain local facilities for water supply, gas or electricity. Other types of private activity bonds, the proceeds of which are used for the construction, equipment, repair or improvement of privately operated industrial or commercial facilities, may constitute municipal securities, although the current federal tax laws place substantial limitations on the size of such issues.
The Fund may invest in inverse floating rate securities issued by a TOB trust, the interest rate on which varies inversely with the Securities Industry Financial Markets Association short-term rate, which resets weekly, or a similar short-term rate, and is reduced by the expenses related to the TOB trust. Typically, inverse floating rate securities represent beneficial interests in a special purpose trust (sometimes called a TOB trust) formed by a third party sponsor for the purpose of holding municipal bonds. Inverse floating rate securities may increase or decrease in value at a greater rate than the underlying interest rate on the municipal bond held by the TOB trust, which effectively leverages the Fund’s investment.
The Fund may invest in floating rate securities issued by special purpose trusts. Floating rate securities may take the form of short-term floating rate securities or the option period may be substantially longer. Generally, the interest rate earned will be based upon the market rates for municipal securities with maturities or remarketing provisions that are comparable in duration to the periodic interval of the tender option, which may vary from weekly, to monthly, to extended periods of one year or multiple years. Since the option feature has a shorter term than the final maturity or first call date of the underlying bond deposited in the trust, the Fund as the holder of the floating rate security relies upon the terms of the agreement with the financial institution furnishing the option as well as the credit strength of that institution. As further assurance of liquidity, the terms of the trust provide for a liquidation of the municipal security deposited in the trust and the application of the proceeds to pay off the floating rate security. The trusts that are organized to issue both short-term floating rate securities and inverse floaters generally include liquidation triggers to protect the investor in the floating rate security.
| 177 |
Shareholder Update (continued)
The Fund may invest in municipal securities issued by special taxing districts. Special taxing districts are organized to plan and finance infrastructure developments to induce residential, commercial and industrial growth and redevelopment. The bond financing methods such as tax increment finance, tax assessment, special services district and Mello-Roos bonds, are generally payable solely from taxes or other revenues attributable to the specific projects financed by the bonds without recourse to the credit or taxing power of related or overlapping municipalities.
The Fund may invest in zero coupon bonds. A zero coupon bond is a bond that typically does not pay interest for the entire life of the obligation or for an initial period after the issuance of the obligation.
The Fund may buy and sell securities on a when-issued or delayed delivery basis, making payment or taking delivery at a later date, normally within 15 to 45 days of the trade date.
The Fund may utilize structured notes and similar instruments for investment purposes and also for hedging purposes. Structured notes are privately negotiated debt obligations where the principal and/or interest is determined by reference to the performance of a benchmark asset, market or interest rate (an “embedded index”), such as selected securities, an index of securities or specified interest rates, or the differential performance of two assets or markets.
The Fund may invest in illiquid securities (i.e., securities that are not readily marketable), including, but not limited to, restricted securities (securities the disposition of which is restricted under the federal securities laws), securities that may be resold only pursuant to Rule 144A under the Securities Act of 1933, as amended (the “1933 Act”), and repurchase agreements with maturities in excess of seven days. Illiquid securities may also include securities legally restricted as to resale, such as securities issued pursuant to Section 4(a)(2) of the 1933 Act.
The Fund may enter into certain derivative instruments in pursuit of its investment objectives, including to seek to enhance return, to hedge certain risks of its investments in municipal securities or as a substitute for a position in the underlying asset. Such instruments include financial futures contracts, swap contracts (including interest rate swaps, credit default swaps and municipal market data rate locks (“MMD Rate Locks”)), options on financial futures, options on swap contracts or other derivative instruments.
The Fund may purchase and sell MMD Rate Locks. An MMD Rate Lock permits the Fund to lock in a specified municipal interest rate for a portion of its portfolio to preserve a return on a particular investment or a portion of its portfolio as a duration management technique or to protect against any increase in the price of securities to be purchased at a later date. By using an MMD Rate Lock, the Fund can create a synthetic long or short position, allowing the Fund to select what the manager believes is an attractive part of the yield curve. The Fund will ordinarily use these transactions as a hedge or for duration or risk management although it is permitted to enter into them to enhance income or gain or to increase the Fund’s yield, for example, during periods of steep interest rate yield curves (i.e., wide differences between short term and long-term interest rates).
The Fund may also invest in securities of other open- or closed-end investment companies (including exchange traded funds (“ETFs”)) that invest primarily in municipal securities of the types in which the Fund may invest directly, to the extent permitted by the Investment Company Act of 1940, as amended (the “1940 Act”), the rules and regulations issued thereunder and applicable exemptive orders issued by the Securities and Exchange Commission (“SEC”).
The Fund may invest in distressed securities but may not invest in the securities of an issuer which, at the time of investment, is in default on its obligations to pay principal or interest thereon when due or that is involved in a bankruptcy proceeding (i.e., rated below C-, at the time of investment); provided, however, that the Fund’s sub-adviser may determine that it is in the best interest of shareholders in pursuing a workout arrangement with issuers of defaulted securities to make loans to the defaulted issuer or another party, or purchase a debt, equity or other interest from the defaulted issuer or another party, or take other related or similar steps involving the investment of additional monies, but only if that issuer’s securities are already held by the Fund.
Use of Leverage
The Fund uses leverage to pursue its investment objectives. The Fund may source leverage through the issuance of “senior securities” as defined under the 1940 Act, which include the issuance of preferred shares of beneficial interest (“Preferred Shares”) and borrowings, except that the Fund may not issue debt securities. However, the Fund’s use of borrowings (which may include reverse repurchase agreements) for leverage is limited by certain fundamental investment restrictions. Additionally, the Fund may use certain derivatives and other financing instruments that have the economic effect of leverage by creating additional investment exposures, such as investments in inverse floating rate securities. The amount and sources of leverage will vary depending on market conditions.
Temporary Defensive Periods
During temporary defensive periods (e.g., times when, in the Fund’s investment adviser’s and/or the Fund’s sub-adviser’s opinion, temporary imbalances of supply and demand or other temporary dislocations in the tax-exempt bond market adversely affect the price at which long-term or intermediate-term municipal securities are available), the Fund may invest up to 100% of its net assets in cash or cash equivalents, short-term investments or municipal bonds and deviate from its investment policies including the Fund’s 80% names rule policy. Also, during these periods, the Fund may not achieve its investment objectives.
| 178 |
NUVEEN CALIFORNIA AMT-FREE QUALITY MUNICIPAL INCOME FUND (NKX)
Investment Objectives
The Fund’s investment objectives are (i) to provide current income exempt from regular federal income tax, the federal alternative minimum tax applicable to individuals and California income tax and (ii) to enhance portfolio value relative to the municipal bond market by investing in tax- exempt municipal securities that the Fund’s investment adviser and/or the Fund’s sub-adviser, believes are underrated or undervalued or that represent municipal market sectors that are undervalued.
Investment Policies
As a fundamental policy, under normal circumstances, the Fund will invest at least 80% of its Assets (as defined below) in municipal securities and other related investments the income from which is exempt from federal and California income taxes.
As a non-fundamental policy, under normal circumstances, the Fund will invest 100% of its Managed Assets (as defined below) in municipal securities and other related investments the income from which is exempt from the federal alternative minimum tax applicable to individuals at the time of purchase.
“Assets” mean the net assets of the Fund plus the amount of any borrowings for investment purposes. “Managed Assets” mean the total assets of the Fund, minus the sum of its accrued liabilities (other than Fund liabilities incurred for the express purpose of creating leverage). Total assets for this purpose shall include assets attributable to the Fund’s use of leverage (whether or not those assets are reflected in the Fund’s financial statements for purposes of generally accepted accounting principles), and derivatives will be valued at their market value.
Under normal circumstances:
| ● | The Fund will invest at least 80% of its Assets in municipal securities and other related investments the income from which is exempt from the federal alternative minimum tax applicable to individuals at the time of purchase. |
| ● | The Fund will invest at least 80% of its Managed Assets in investment grade municipal securities that, at the time of investment, are rated within the four highest grades (Baa or BBB or better) by at least one nationally recognized statistical rating organization ( “NRSRO”) or are unrated but judged to be of comparable quality by the Fund’s investment adviser and/or the Fund’s sub-adviser. |
| ● | The Fund may invest up to 20% of its Managed Assets in municipal securities that at the time of investment are rated below investment grade (Ba or BB or lower) or are unrated but judged to be of comparable quality by the Fund’s investment adviser and/or the Fund’s sub- adviser. |
| ● | The Fund may invest up to 10% of its Managed Assets in municipal securities rated below B3/B- or that are unrated but judged to be of comparable quality by the Fund’s investment adviser and/or the Fund’s sub-adviser. |
| ● | The Fund may invest up to 15% of its Managed Assets in inverse floating rate securities. |
| ● | The Fund will generally maintain an investment portfolio with an overall weighted average maturity of greater than 10 years |
The foregoing policies apply only at the time of any new investment.
Approving Changes in Investment Policies
The Board of Trustees of the Fund may change the policies described above without a shareholder vote. However, the Fund’s policy of investing at least 80% of its Assets in municipal securities and other related investments the income from which is exempt from federal and California income taxes, may not be changed without the approval of the holders of a majority of the outstanding common shares and preferred shares voting together as a single class, and the approval of the holders of a majority of the outstanding preferred shares, voting separately as a single class. A “majority of the outstanding” shares means (i) 67% or more of the shares present at a meeting, if the holders of more than 50% of the shares are present or represented by proxy or (ii) more than 50% of the shares, whichever is less.
Additionally, with respect to the Fund’s policy of investing at least 80% of its Assets in municipal securities and other related investments the income from which is exempt from the federal alternative minimum tax applicable to individuals at the time of purchase, such policy may not be changed without 60 days’ prior notice to shareholders.
Portfolio Contents
The Fund generally invests in municipal securities. Municipal securities include municipal bonds, notes, securities issued to finance and refinance public projects, certificates of participation, variable rate demand obligations, lease obligations, municipal notes, pre-refunded municipal bonds, private activity bonds, securities issued by tender option bond trusts (“TOB trusts”), including inverse floating rate securities, and other forms of municipal bonds and securities, and other related instruments that create exposure to municipal bonds, notes and securities that provide for the payment of interest income that is exempt from U.S. federal and California income tax.
Municipal securities are debt obligations generally issued by states, cities and local authorities and certain possessions and territories of the United States (such as Puerto Rico and Guam) to finance or refinance public purpose projects such as roads, schools, and water supply systems.
| 179 |
Shareholder Update (continued)
The municipal securities in which the Fund generally invests are issued by the State of California, a municipality in California, or a political subdivision or agency or instrumentality of such state or municipality, and pay interest that, in the opinion of bond counsel to the issuer (or on the basis of other authority believed by the Fund’s sub-adviser to be reliable), is exempt from regular federal and California personal income taxes and is also exempt from the federal alternative minimum tax applicable to individuals.
The Fund may invest in municipal securities that represent lease obligations and certificates of participation in such leases. A municipal lease is an obligation in the form of a lease or installment purchase that is issued by a state or local government to acquire equipment and facilities. Income from such obligations generally is exempt from state and local taxes in the state of issuance. A certificate of participation represents an undivided interest in an unmanaged pool of municipal leases, an installment purchase agreement or other instruments. The certificates typically are issued by a municipal agency, a trust or other entity that has received an assignment of the payments to be made by the state or political subdivision under such leases or installment purchase agreements. Such certificates provide the Fund with the right to a pro rata undivided interest in the underlying municipal securities. In addition, such participations generally provide the Fund with the right to demand payment, on not more than seven days’ notice, of all or any part of the Fund’s participation interest in the underlying municipal securities, plus accrued interest.
The Fund may invest in municipal notes. Municipal securities in the form of notes generally are used to provide for short-term capital needs, in anticipation of an issuer’s receipt of other revenues or financing, and typically have maturities of up to three years. Such instruments may include tax anticipation notes, revenue anticipation notes, bond anticipation notes, tax and revenue anticipation notes and construction loan notes. Tax anticipation notes are issued to finance the working capital needs of governments. Generally, they are issued in anticipation of various tax revenues, such as income, sales, property, use and business taxes, and are payable from these specific future taxes. Revenue anticipation notes are issued in expectation of receipt of other kinds of revenue, such as federal revenues available under federal revenue sharing programs. Bond anticipation notes are issued to provide interim financing until long-term bond financing can be arranged. In most cases, the long-term bonds then provide the funds needed for repayment of the bond anticipation notes. Tax and revenue anticipation notes combine the funding sources of both tax anticipation notes and revenue anticipation notes. Construction loan notes are sold to provide construction financing. Mortgage notes insured by the Federal Housing Authority secure these notes; however, the proceeds from the insurance may be less than the economic equivalent of the payment of principal and interest on the mortgage note if there has been a default. The anticipated revenues from taxes, grants or bond financing generally secure the obligations of an issuer of municipal notes.
The Fund may invest in “tobacco settlement bonds.” Tobacco settlement bonds are municipal securities that are secured or payable solely from the collateralization of the proceeds from class action or other litigation against the tobacco industry.
The Fund may invest in pre-refunded municipal securities. The principal of and interest on pre-refunded municipal securities are no longer paid from the original revenue source for the securities. Instead, the source of such payments is typically an escrow fund consisting of U.S. government securities. The assets in the escrow fund are derived from the proceeds of refunding bonds issued by the same issuer as the pre-refunded municipal securities. Issuers of municipal securities use this advance refunding technique to obtain more favorable terms with respect to securities that are not yet subject to call or redemption by the issuer. For example, advance refunding enables an issuer to refinance debt at lower market interest rates, restructure debt to improve cash flow or eliminate restrictive covenants in the indenture or other governing instrument for the pre- refunded municipal securities. However, except for a change in the revenue source from which principal and interest payments are made, the pre- refunded municipal securities remain outstanding on their original terms until they mature or are redeemed by the issuer.
The Fund may invest in private activity bonds. Private activity bonds, formerly referred to as industrial development bonds, are issued by or on behalf of public authorities to obtain funds to provide privately operated housing facilities, airport, mass transit or port facilities, sewage disposal, solid waste disposal or hazardous waste treatment or disposal facilities and certain local facilities for water supply, gas or electricity. Other types of private activity bonds, the proceeds of which are used for the construction, equipment, repair or improvement of privately operated industrial or commercial facilities, may constitute municipal securities, although the current federal tax laws place substantial limitations on the size of such issues. The Fund’s distributions of its interest income from private activity bonds may subject certain investors to the federal alternative minimum tax applicable to individuals. However, the Fund will only invest in private activity bonds that are not subject to the federal alternative minimum tax.
The Fund may invest in inverse floating rate securities issued by a TOB trust, the interest rate on which varies inversely with the Securities Industry Financial Markets Association short-term rate, which resets weekly, or a similar short-term rate, and is reduced by the expenses related to the TOB trust. Typically, inverse floating rate securities represent beneficial interests in a special purpose trust (sometimes called a TOB trust) formed by a third party sponsor for the purpose of holding municipal bonds. Inverse floating rate securities may increase or decrease in value at a greater rate than the underlying interest rate on the municipal bond held by the TOB trust, which effectively leverages the Fund’s investment.
The Fund may invest in floating rate securities issued by special purpose trusts. Floating rate securities may take the form of short-term floating rate securities or the option period may be substantially longer. Generally, the interest rate earned will be based upon the market rates for municipal securities with maturities or remarketing provisions that are comparable in duration to the periodic interval of the tender option, which may vary from weekly, to monthly, to extended periods of one year or multiple years. Since the option feature has a shorter term than the final maturity or first call date of the underlying bond deposited in the trust, the Fund as the holder of the floating rate security relies upon the terms of the agreement with the financial institution furnishing the option as well as the credit strength of that institution. As further assurance of liquidity, the terms of the trust provide for a liquidation of the municipal security deposited in the trust and the application of the proceeds to pay off the floating rate security. The trusts that are organized to issue both short-term floating rate securities and inverse floaters generally include liquidation triggers to protect the investor in the floating rate security.
The Fund may invest in municipal securities issued by special taxing districts. Special taxing districts are organized to plan and finance infrastructure developments to induce residential, commercial and industrial growth and redevelopment. The bond financing methods such as tax increment finance, tax assessment, special services district and Mello-Roos bonds, are generally payable solely from taxes or other revenues attributable to the specific projects financed by the bonds without recourse to the credit or taxing power of related or overlapping municipalities.
| 180 |
The Fund may invest in zero coupon bonds. A zero coupon bond is a bond that typically does not pay interest for the entire life of the obligation or for an initial period after the issuance of the obligation.
The Fund may buy and sell securities on a when-issued or delayed delivery basis, making payment or taking delivery at a later date, normally within 15 to 45 days of the trade date
The Fund may utilize structured notes and similar instruments for investment purposes and also for hedging purposes. Structured notes are privately negotiated debt obligations where the principal and/or interest is determined by reference to the performance of a benchmark asset, market or interest rate (an “embedded index”), such as selected securities, an index of securities or specified interest rates, or the differential performance of two assets or markets.
The Fund may invest in illiquid securities (i.e., securities that are not readily marketable), including, but not limited to, restricted securities (securities the disposition of which is restricted under the federal securities laws), securities that may be resold only pursuant to Rule 144A under the Securities Act of 1933, as amended (the “1933 Act”), and repurchase agreements with maturities in excess of seven days. Illiquid securities may also include securities legally restricted as to resale, such as securities issued pursuant to Section 4(a)(2) of the 1933 Act.
The Fund may enter into certain derivative instruments in pursuit of its investment objectives, including to seek to enhance return, to hedge certain risks of its investments in municipal securities or as a substitute for a position in the underlying asset. Such instruments include financial futures contracts, swap contracts (including interest rate swaps, credit default swaps and municipal market data rate locks (“MMD Rate Locks”)), options on financial futures, options on swap contracts or other derivative instruments.
The Fund may purchase and sell MMD Rate Locks. An MMD Rate Lock permits the Fund to lock in a specified municipal interest rate for a portion of its portfolio to preserve a return on a particular investment or a portion of its portfolio as a duration management technique or to protect against any increase in the price of securities to be purchased at a later date. By using an MMD Rate Lock, the Fund can create a synthetic long or short position, allowing the Fund to select what the manager believes is an attractive part of the yield curve. The Fund will ordinarily use these transactions as a hedge or for duration or risk management although it is permitted to enter into them to enhance income or gain or to increase the Fund’s yield, for example, during periods of steep interest rate yield curves (i.e., wide differences between short term and long-term interest rates).
The Fund may also invest in securities of other open- or closed-end investment companies (including exchange traded funds (“ETFs”)) that invest primarily in municipal securities of the types in which the Fund may invest directly, to the extent permitted by the Investment Company Act of 1940, as amended (the “1940 Act”), the rules and regulations issued thereunder and applicable exemptive orders issued by the Securities and Exchange Commission (“SEC”). In addition, the Fund may invest a portion of its Managed Assets in pooled investment vehicles (other than investment companies) that invest primarily in municipal securities of the types in which the Fund may invest directly.
The Fund may invest in distressed securities but may not invest in the securities of an issuer which, at the time of investment, is in default on its obligations to pay principal or interest thereon when due or that is involved in a bankruptcy proceeding (i.e., rated below C-, at the time of investment); provided, however, that the Fund’s sub-adviser may determine that it is in the best interest of shareholders in pursuing a workout arrangement with issuers of defaulted securities to make loans to the defaulted issuer or another party, or purchase a debt, equity or other interest from the defaulted issuer or another party, or take other related or similar steps involving the investment of additional monies, but only if that issuer’s securities are already held by the Fund.
Use of Leverage
The Fund uses leverage to pursue its investment objectives. The Fund may source leverage through the issuance of “senior securities” as defined under the 1940 Act, which include (1) borrowings, including loans from financial institutions; (2) the issuance of debt securities; and (3) the issuance of preferred shares of beneficial interest (“Preferred Shares”). However, the Fund’s use of borrowings (which may include reverse repurchase agreements) for leverage is limited by certain fundamental investment restrictions. Additionally, the Fund may use certain derivatives and other financing instruments that have the economic effect of leverage by creating additional investment exposures, such as investments in inverse floating rate securities. The amount and sources of leverage will vary depending on market conditions.
Temporary Defensive Periods
During temporary defensive periods (e.g., times when, in the Fund’s investment adviser’s and/or the Fund’s sub-adviser’s opinion, temporary imbalances of supply and demand or other temporary dislocations in the tax-exempt bond market adversely affect the price at which long-term or intermediate-term municipal securities are available), the Fund may invest up to 100% of its net assets in cash or cash equivalents, short-term investments or municipal bonds and deviate from its investment policies including the Fund’s 80% names rule policy. Also, during these periods, the Fund may not achieve its investment objectives.
| 181 |
Shareholder Update (continued)
NUVEEN CALIFORNIA MUNICIPAL VALUE FUND (NCA)
Investment Objectives
The Fund’s primary investment objective is to provide current income exempt from regular federal and California income taxes. The Fund’s secondary investment objective is to enhance portfolio value relative to the California municipal bond market by investing in tax-exempt California municipal securities that the Fund’s investment adviser and/or the Fund’s sub-adviser believes are underrated or undervalued or that represent municipal market sectors that are undervalued.
Investment Policies
As a fundamental policy, under normal circumstances, the Fund will invest at least 80% of its Assets (as defined below) in municipal securities and other related investments, the income from which is exempt from regular federal and California income taxes.
“Assets” mean the net assets of the Fund plus the amount of any borrowings for investment purposes. “Managed Assets” mean the total assets of the Fund, minus the sum of its accrued liabilities (other than Fund liabilities incurred for the express purpose of creating leverage). Total assets for this purpose shall include assets attributable to the Fund’s use of leverage (whether or not those assets are reflected in the Fund’s financial statements for purposes of generally accepted accounting principles), and derivatives will be valued at their market value.
Under normal circumstances:
| • | The Fund will invest at least 80% of its Managed Assets in municipal securities that, at the time of investment, are rated within the four highest grades (Baa or BBB or better) by at least one nationally recognized statistical rating organization (“NRSRO”) or are unrated but judged to be of comparable quality by the Fund’s investment adviser and/or the Fund’s sub-adviser. Investment grade securities may include securities that, at the time of investment, are rated below investment grade, so long as at least one NRSRO rates such securities within the four highest grades (such securities are commonly referred to as split-rated securities). |
| • | The Fund may invest up to 20% of its Managed Assets in municipal securities that at the time of investment are rated below investment grade or are unrated but judged to be of comparable quality by the Fund’s investment adviser and/or the Fund’s sub-adviser. |
| • | No more than 10% of the Fund’s Managed Assets may be invested in municipal securities rated below B3/B- by all NRSROs that rate the security or that are unrated but judged to be of comparable quality by the Fund’s investment adviser and/or the Fund’s sub-adviser. |
| • | The Fund may invest up to 20% of its Managed Assets in municipal securities that pay interest that is taxable under the federal alternative minimum tax applicable to individuals. |
| • | The Fund may invest up to 15% of its Managed Assets in inverse floating rate securities. |
| • | The Fund will not invest more than 25% of its total assets in municipal securities in any one industry. |
| • | The Fund will generally maintain an investment portfolio with an overall weighted average maturity of greater than 10 years. |
The foregoing policies apply only at the time of any new investment.
Approving Changes in Investment Policies
The Board of Trustees of the Fund may change the policies described above without a shareholder vote. However, the Fund’s (i) investment objectives, (ii) policy of investing at least 80% of its Assets in municipal securities and other related investments, the income from which is exempt from regular federal and California income taxes and (iii) policy (as described below) that it will not leverage its capital structure by issuing senior securities such as Preferred Shares or debt instruments, may not be changed without the approval of the holders of a majority of the outstanding common shares and preferred shares voting together as a single class, and the approval of the holders of a majority of the outstanding preferred shares, voting separately as a single class. A “majority of the outstanding” shares means (i) 67% or more of the shares present at a meeting, if the holders of more than 50% of the shares are present or represented by proxy or (ii) more than 50% of the shares, whichever is less.
Additionally, with respect to the Fund’s policy of investing at least 80% of its Managed Assets in municipal securities that, at the time of investment, are rated within the four highest grades (Baa or BBB or better) by at least one NRSRO or are unrated but judged to be of comparable quality by the Fund’s investment adviser and/or the Fund’s sub-adviser, such policy may not be changed without 60 days’ prior notice to shareholders.
Portfolio Contents
The Fund generally invests in municipal securities. Municipal securities include municipal bonds, notes, securities issued to finance and refinance public projects, certificates of participation, variable rate demand obligations, lease obligations, municipal notes, pre-refunded municipal bonds, private activity bonds, securities issued by tender option bond trusts (“TOB trusts”), including inverse floating rate securities, and other forms of municipal bonds and securities, and other related instruments that create exposure to municipal bonds, notes and securities that provide for the payment of interest income that is exempt from regular U.S. federal income tax and California income taxes.
Municipal securities are debt obligations generally issued by states, cities and local authorities and certain possessions and territories of the United States (such as Puerto Rico and Guam) to finance or refinance public purpose projects such as roads, schools, and water supply systems.
| 182 |
The Fund may also invest in AMT Bonds. AMT Bonds may trigger adverse tax consequences for Fund shareholders who are subject to the federal alternative minimum tax.
The municipal securities in which the Fund invests are generally issued by the State of California, a municipality in California, or a political subdivision or agency or instrumentality of such state or municipality, and pay interest that, in the opinion of bond counsel to the issuer (or on the basis of other authority believed by the investment adviser to be reliable), is exempt from both regular federal income taxes and California personal income tax, although the interest may be subject to the federal alternative minimum tax.
The Fund may invest in municipal securities that represent lease obligations and certificates of participation in such leases. A municipal lease is an obligation in the form of a lease or installment purchase that is issued by a state or local government to acquire equipment and facilities. Income from such obligations generally is exempt from state and local taxes in the state of issuance. A certificate of participation represents an undivided interest in an unmanaged pool of municipal leases, an installment purchase agreement or other instruments. The certificates typically are issued by a municipal agency, a trust or other entity that has received an assignment of the payments to be made by the state or political subdivision under such leases or installment purchase agreements. Such certificates provide the Fund with the right to a pro rata undivided interest in the underlying municipal securities. In addition, such participations generally provide the Fund with the right to demand payment, on not more than seven days’ notice, of all or any part of the Fund’s participation interest in the underlying municipal securities, plus accrued interest.
The Fund may invest in municipal notes. Municipal securities in the form of notes generally are used to provide for short-term capital needs, in anticipation of an issuer’s receipt of other revenues or financing, and typically have maturities of up to three years. Such instruments may include tax anticipation notes, revenue anticipation notes, bond anticipation notes, tax and revenue anticipation notes and construction loan notes. Tax anticipation notes are issued to finance the working capital needs of governments. Generally, they are issued in anticipation of various tax revenues, such as income, sales, property, use and business taxes, and are payable from these specific future taxes. Revenue anticipation notes are issued in expectation of receipt of other kinds of revenue, such as federal revenues available under federal revenue sharing programs. Bond anticipation notes are issued to provide interim financing until long-term bond financing can be arranged. In most cases, the long-term bonds then provide the funds needed for repayment of the bond anticipation notes. Tax and revenue anticipation notes combine the funding sources of both tax anticipation notes and revenue anticipation notes. Construction loan notes are sold to provide construction financing. Mortgage notes insured by the Federal Housing Authority secure these notes; however, the proceeds from the insurance may be less than the economic equivalent of the payment of principal and interest on the mortgage note if there has been a default. The anticipated revenues from taxes, grants or bond financing generally secure the obligations of an issuer of municipal notes.
The Fund may invest in “tobacco settlement bonds.” Tobacco settlement bonds are municipal securities that are secured or payable solely from the collateralization of the proceeds from class action or other litigation against the tobacco industry.
The Fund may invest in pre-refunded municipal securities. The principal of and interest on pre-refunded municipal securities are no longer paid from the original revenue source for the securities. Instead, the source of such payments is typically an escrow fund consisting of U.S. government securities. The assets in the escrow fund are derived from the proceeds of refunding bonds issued by the same issuer as the pre-refunded municipal securities. Issuers of municipal securities use this advance refunding technique to obtain more favorable terms with respect to securities that are not yet subject to call or redemption by the issuer. For example, advance refunding enables an issuer to refinance debt at lower market interest rates, restructure debt to improve cash flow or eliminate restrictive covenants in the indenture or other governing instrument for the pre-refunded municipal securities. However, except for a change in the revenue source from which principal and interest payments are made, the pre-refunded municipal securities remain outstanding on their original terms until they mature or are redeemed by the issuer.
The Fund may invest in private activity bonds. Private activity bonds are issued by or on behalf of public authorities to obtain funds to provide privately operated housing facilities, airport, mass transit or port facilities, sewage disposal, solid waste disposal or hazardous waste treatment or disposal facilities and certain local facilities for water supply, gas or electricity. Other types of private activity bonds, the proceeds of which are used for the construction, equipment, repair or improvement of privately operated industrial or commercial facilities, may constitute municipal securities, although the current federal tax laws place substantial limitations on the size of such issues.
The Fund may invest in inverse floating rate securities issued by a TOB trust, the interest rate on which varies inversely with the Securities Industry Financial Markets Association short-term rate, which resets weekly, or a similar short-term rate, and is reduced by the expenses related to the TOB trust. Typically, inverse floating rate securities represent beneficial interests in a special purpose trust (sometimes called a TOB trust) formed by a third party sponsor for the purpose of holding municipal bonds. Inverse floating rate securities may increase or decrease in value at a greater rate than the underlying interest rate on the municipal bond held by the TOB trust, which effectively leverages the Fund’s investment.
The Fund may invest in floating rate securities issued by special purpose trusts. Floating rate securities may take the form of short-term floating rate securities or the option period may be substantially longer. Generally, the interest rate earned will be based upon the market rates for municipal securities with maturities or remarketing provisions that are comparable in duration to the periodic interval of the tender option, which may vary from weekly, to monthly, to extended periods of one year or multiple years. Since the option feature has a shorter term than the final maturity or first call date of the underlying bond deposited in the trust, the Fund as the holder of the floating rate security relies upon the terms of the agreement with the financial institution furnishing the option as well as the credit strength of that institution. As further assurance of liquidity, the terms of the trust provide for a liquidation of the municipal security deposited in the trust and the application of the proceeds to pay off the floating rate security. The trusts that are organized to issue both short-term floating rate securities and inverse floaters generally include liquidation triggers to protect the investor in the floating rate security.
The Fund may invest in municipal securities issued by special taxing districts. Special taxing districts are organized to plan and finance infrastructure developments to induce residential, commercial and industrial growth and redevelopment. The bond financing methods such as tax increment finance, tax assessment, special services district and Mello-Roos bonds, are generally payable solely from taxes or other revenues attributable to the specific projects financed by the bonds without recourse to the credit or taxing power of related or overlapping municipalities.
| 183 |
Shareholder Update (continued)
The Fund may invest in zero coupon bonds. A zero coupon bond is a bond that typically does not pay interest for the entire life of the obligation or for an initial period after the issuance of the obligation.
The Fund may buy and sell securities on a when-issued or delayed delivery basis, making payment or taking delivery at a later date, normally within 15 to 45 days of the trade date.
The Fund may utilize structured notes and similar instruments for investment purposes and also for hedging purposes. Structured notes are privately negotiated debt obligations where the principal and/or interest is determined by reference to the performance of a benchmark asset, market or interest rate (an “embedded index”), such as selected securities, an index of securities or specified interest rates, or the differential performance of two assets or markets.
The Fund may invest in illiquid securities (i.e., securities that are not readily marketable), including, but not limited to, restricted securities (securities the disposition of which is restricted under the federal securities laws), securities that may be resold only pursuant to Rule 144A under the Securities Act of 1933, as amended (the “1933 Act”), and repurchase agreements with maturities in excess of seven days. Illiquid securities may also include securities legally restricted as to resale, such as securities issued pursuant to Section 4(a)(2) of the 1933 Act.
The Fund may enter into certain derivative instruments in pursuit of its investment objectives, including to seek to enhance return, to hedge certain risks of its investments in municipal securities or as a substitute for a position in the underlying asset. Such instruments include financial futures contracts, swap contracts (including interest rate swaps, credit default swaps and municipal market data rate locks (“MMD Rate Locks”)), options on financial futures, options on swap contracts or other derivative instruments.
The Fund may purchase and sell MMD Rate Locks. An MMD Rate Lock permits the Fund to lock in a specified municipal interest rate for a portion of its portfolio to preserve a return on a particular investment or a portion of its portfolio as a duration management technique or to protect against any increase in the price of securities to be purchased at a later date. By using an MMD Rate Lock, the Fund can create a synthetic long or short position, allowing the Fund to select what the manager believes is an attractive part of the yield curve. The Fund will ordinarily use these transactions as a hedge or for duration or risk management although it is permitted to enter into them to enhance income or gain or to increase the Fund’s yield, for example, during periods of steep interest rate yield curves (i.e., wide differences between short term and long-term interest rates).
The Fund may also invest in securities of other open- or closed-end investment companies (including exchange traded funds (“ETFs”)) that invest primarily in municipal securities of the types in which the Fund may invest directly, to the extent permitted by the Investment Company Act of 1940, as amended (the “1940 Act”), the rules and regulations issued thereunder and applicable exemptive orders issued by the Securities and Exchange Commission (“SEC”).
The Fund may invest in distressed securities but may not invest in the securities of an issuer which, at the time of investment, is in default on its obligations to pay principal or interest thereon when due or that is involved in a bankruptcy proceeding (i.e., rated below C-, at the time of investment); provided, however, that the Fund’s sub-adviser may determine that it is in the best interest of shareholders in pursuing a workout arrangement with issuers of defaulted securities to make loans to the defaulted issuer or another party, or purchase a debt, equity or other interest from the defaulted issuer or another party, or take other related or similar steps involving the investment of additional monies, but only if that issuer’s securities are already held by the Fund.
Use of Leverage
As a fundamental policy, the Fund will not leverage its capital structure by issuing senior securities (as defined under the 1940 Act), such as preferred shares or debt instruments. However, the Fund may borrow (which may include reverse repurchase agreements) for temporary or emergency purposes, and use certain derivatives and other financing instruments that have the economic effect of leverage by creating additional investment exposures, including inverse floating rate securities.
Temporary Defensive Periods
During temporary defensive periods (e.g., times when, in the Fund’s investment adviser’s and/or the Fund’s sub-adviser’s opinion, temporary imbalances of supply and demand or other temporary dislocations in the tax-exempt bond market adversely affect the price at which long-term or intermediate-term municipal securities are available), the Fund may invest up to 100% of its net assets in cash or cash equivalents, short-term investments or municipal bonds and deviate from its investment policies including the Fund’s 80% names rule policy. Also, during these periods, the Fund may not achieve its investment objectives.
| 184 |
NUVEEN CALIFORNIA QUALITY MUNICIPAL VALUE FUND (NAC)
Investment Objectives
The Fund’s investment objectives are to provide current income exempt from regular federal and California income tax, and to enhance portfolio value relative to the municipal bond market by investing in tax-exempt municipal bonds that the Fund’s investment adviser believes are underrated or undervalued or that represent municipal market sectors that are undervalued.
Investment Policies
As a fundamental policy, under normal circumstances, the Fund will invest at least 80% of its Assets (as defined below) in municipal securities and other related investments, that pay interest exempt from federal and California income taxes.
“Assets” mean the net assets of the Fund plus the amount of any borrowings for investment purposes. “Managed Assets” mean the total assets of the Fund, minus the sum of its accrued liabilities (other than Fund liabilities incurred for the express purpose of creating leverage). Total assets for this purpose shall include assets attributable to the Fund’s use of leverage (whether or not those assets are reflected in the Fund’s financial statements for purposes of generally accepted accounting principles), and derivatives will be valued at their market value.
Under normal circumstances:
| • | The Fund will invest at least 80% of its Managed Assets in investment grade securities that, at the time of investment, are rated within the four highest grades (Baa or BBB or better) by at least one nationally recognized statistical rating organization (“NRSRO”) or are unrated but judged to be of comparable quality by the Fund’s investment adviser and/or the Fund’s sub-adviser. |
| • | The Fund may invest up to 20% of its Managed Assets in municipal securities that at the time of investment are rated below investment grade or are unrated but judged to be of comparable quality by the Fund’s investment adviser and/or the Fund’s sub-adviser. |
| • | No more than 10% of the Fund’s Managed Assets may be invested in municipal securities rated below B3/B- or that are unrated but judged to be of comparable quality by the Fund’s investment adviser and/or the Fund’s sub-adviser. |
| • | The Fund may invest up to 20% of its Managed Assets in municipal securities that pay interest that is taxable under the federal alternative minimum tax. |
| • | The Fund may invest up to 15% of its Managed Assets in inverse floating rate securities |
| • | The Fund may invest 25% or more of its total assets in municipal securities in the same economic sector. |
| • | The Fund will generally maintain an investment portfolio with an overall weighted average maturity of greater than 10 years. |
The foregoing policies apply only at the time of any new investment.
Approving Changes in Investment Policies
The Board of Trustees of the Fund may change the policies described above without a shareholder vote. However, the Fund’s policy of investing at least 80% of its Assets in municipal securities and other related investments that pay interest exempt from federal and California income taxes, may not be changed without the approval of the holders of a majority of the outstanding common shares and preferred shares voting together as a single class, and the approval of the holders of a majority of the outstanding preferred shares, voting separately as a single class. A “majority of the outstanding” shares means (i) 67% or more of the shares present at a meeting, if the holders of more than 50% of the shares are present or represented by proxy or (ii) more than 50% of the shares, whichever is less.
Additionally, with respect to the Fund’s policy of investing at least 80% of its Managed Assets in investment grade securities that, at the time of investment, are rated within the four highest grades (Baa or BBB or better) by at least one NRSRO or are unrated but judged to be of comparable quality by the Fund’s investment adviser and/or the Fund’s sub-adviser, such policy may not be changed without 60 days’ prior notice to shareholders.
Portfolio Contents
The Fund generally invests in municipal securities. Municipal securities include municipal bonds, notes, securities issued to finance and refinance public projects, certificates of participation, variable rate demand obligations, lease obligations, municipal notes, pre-refunded municipal bonds, private activity bonds, securities issued by tender option bond trusts (“TOB trusts”), including inverse floating rate securities, and other forms of municipal bonds and securities, and other related instruments that create exposure to municipal bonds, notes and securities that provide for the payment of interest income that is exempt from regular U.S. federal income tax and California person income taxes.
Municipal securities are debt obligations generally issued by states, cities and local authorities and certain possessions and territories of the United States (such as Puerto Rico and Guam) to finance or refinance public purpose projects such as roads, schools, and water supply systems.
The Fund may also invest in municipal securities that pay interest that is taxable under the federal alternative minimum tax applicable to noncorporate taxpayers (“AMT Bonds”). AMT Bonds may trigger adverse tax consequences for Fund shareholders who are subject to the federal alternative minimum tax.
| 185 |
Shareholder Update (continued)
The municipal securities in which the Fund invests are generally issued by the State of California, a municipality in California, or a political subdivision or agency or instrumentality of such state or municipality, and pay interest that, in the opinion of bond counsel to the issuer (or on the basis of other authority believed by the investment adviser to be reliable), is exempt from both regular federal income taxes and California personal income tax, although the interest may be subject to the federal alternative minimum tax.
The Fund may invest in municipal securities that represent lease obligations and certificates of participation in such leases. A municipal lease is an obligation in the form of a lease or installment purchase that is issued by a state or local government to acquire equipment and facilities. Income from such obligations generally is exempt from state and local taxes in the state of issuance. A certificate of participation represents an undivided interest in an unmanaged pool of municipal leases, an installment purchase agreement or other instruments. The certificates typically are issued by a municipal agency, a trust or other entity that has received an assignment of the payments to be made by the state or political subdivision under such leases or installment purchase agreements. Such certificates provide the Fund with the right to a pro rata undivided interest in the underlying municipal securities. In addition, such participations generally provide the Fund with the right to demand payment, on not more than seven days’ notice, of all or any part of the Fund’s participation interest in the underlying municipal securities, plus accrued interest.
The Fund may invest in municipal notes. Municipal securities in the form of notes generally are used to provide for short-term capital needs, in anticipation of an issuer’s receipt of other revenues or financing, and typically have maturities of up to three years. Such instruments may include tax anticipation notes, revenue anticipation notes, bond anticipation notes, tax and revenue anticipation notes and construction loan notes. Tax anticipation notes are issued to finance the working capital needs of governments. Generally, they are issued in anticipation of various tax revenues, such as income, sales, property, use and business taxes, and are payable from these specific future taxes. Revenue anticipation notes are issued in expectation of receipt of other kinds of revenue, such as federal revenues available under federal revenue sharing programs. Bond anticipation notes are issued to provide interim financing until long-term bond financing can be arranged. In most cases, the long-term bonds then provide the funds needed for repayment of the bond anticipation notes. Tax and revenue anticipation notes combine the funding sources of both tax anticipation notes and revenue anticipation notes. Construction loan notes are sold to provide construction financing. Mortgage notes insured by the Federal Housing Authority secure these notes; however, the proceeds from the insurance may be less than the economic equivalent of the payment of principal and interest on the mortgage note if there has been a default. The anticipated revenues from taxes, grants or bond financing generally secure the obligations of an issuer of municipal notes.
The Fund may invest in “tobacco settlement bonds.” Tobacco settlement bonds are municipal securities that are secured or payable solely from the collateralization of the proceeds from class action or other litigation against the tobacco industry.
The Fund may invest in pre-refunded municipal securities. The principal of and interest on pre-refunded municipal securities are no longer paid from the original revenue source for the securities. Instead, the source of such payments is typically an escrow fund consisting of U.S. government securities. The assets in the escrow fund are derived from the proceeds of refunding bonds issued by the same issuer as the pre-refunded municipal securities. Issuers of municipal securities use this advance refunding technique to obtain more favorable terms with respect to securities that are not yet subject to call or redemption by the issuer. For example, advance refunding enables an issuer to refinance debt at lower market interest rates, restructure debt to improve cash flow or eliminate restrictive covenants in the indenture or other governing instrument for the pre-refunded municipal securities. However, except for a change in the revenue source from which principal and interest payments are made, the pre-refunded municipal securities remain outstanding on their original terms until they mature or are redeemed by the issuer.
The Fund may invest in private activity bonds. Private activity bonds are issued by or on behalf of public authorities to obtain funds to provide privately operated housing facilities, airport, mass transit or port facilities, sewage disposal, solid waste disposal or hazardous waste treatment or disposal facilities and certain local facilities for water supply, gas or electricity. Other types of private activity bonds, the proceeds of which are used for the construction, equipment, repair or improvement of privately operated industrial or commercial facilities, may constitute municipal securities, although the current federal tax laws place substantial limitations on the size of such issues.
The Fund may invest in inverse floating rate securities issued by a TOB trust, the interest rate on which varies inversely with the Securities Industry Financial Markets Association short-term rate, which resets weekly, or a similar short-term rate, and is reduced by the expenses related to the TOB trust. Typically, inverse floating rate securities represent beneficial interests in a special purpose trust (sometimes called a TOB trust) formed by a third party sponsor for the purpose of holding municipal bonds. Inverse floating rate securities may increase or decrease in value at a greater rate than the underlying interest rate on the municipal bond held by the TOB trust, which effectively leverages the Fund’s investment.
The Fund may invest in floating rate securities issued by special purpose trusts. Floating rate securities may take the form of short-term floating rate securities or the option period may be substantially longer. Generally, the interest rate earned will be based upon the market rates for municipal securities with maturities or remarketing provisions that are comparable in duration to the periodic interval of the tender option, which may vary from weekly, to monthly, to extended periods of one year or multiple years. Since the option feature has a shorter term than the final maturity or first call date of the underlying bond deposited in the trust, the Fund as the holder of the floating rate security relies upon the terms of the agreement with the financial institution furnishing the option as well as the credit strength of that institution. As further assurance of liquidity, the terms of the trust provide for a liquidation of the municipal security deposited in the trust and the application of the proceeds to pay off the floating rate security. The trusts that are organized to issue both short-term floating rate securities and inverse floaters generally include liquidation triggers to protect the investor in the floating rate security.
The Fund may invest in municipal securities issued by special taxing districts. Special taxing districts are organized to plan and finance infrastructure developments to induce residential, commercial and industrial growth and redevelopment. The bond financing methods such as tax increment finance, tax assessment, special services district and Mello-Roos bonds, are generally payable solely from taxes or other revenues attributable to the specific projects financed by the bonds without recourse to the credit or taxing power of related or overlapping municipalities.
The Fund may invest in zero coupon bonds. A zero coupon bond is a bond that typically does not pay interest for the entire life of the obligation or for an initial period after the issuance of the obligation.
| 186 |
The Fund may buy and sell securities on a when-issued or delayed delivery basis, making payment or taking delivery at a later date, normally within 15 to 45 days of the trade date.
The Fund may utilize structured notes and similar instruments for investment purposes and also for hedging purposes. Structured notes are privately negotiated debt obligations where the principal and/or interest is determined by reference to the performance of a benchmark asset, market or interest rate (an “embedded index”), such as selected securities, an index of securities or specified interest rates, or the differential performance of two assets or markets.
The Fund may invest in illiquid securities (i.e., securities that are not readily marketable), including, but not limited to, restricted securities (securities the disposition of which is restricted under the federal securities laws), securities that may be resold only pursuant to Rule 144A under the Securities Act of 1933, as amended (the “1933 Act”), and repurchase agreements with maturities in excess of seven days. Illiquid securities may also include securities legally restricted as to resale, such as securities issued pursuant to Section 4(a)(2) of the 1933 Act.
The Fund may enter into certain derivative instruments in pursuit of its investment objectives, including to seek to enhance return, to hedge certain risks of its investments in municipal securities or as a substitute for a position in the underlying asset. Such instruments include financial futures contracts, swap contracts (including interest rate swaps, credit default swaps and municipal market data rate locks (“MMD Rate Locks”)), options on financial futures, options on swap contracts or other derivative instruments.
The Fund may purchase and sell MMD Rate Locks. An MMD Rate Lock permits the Fund to lock in a specified municipal interest rate for a portion of its portfolio to preserve a return on a particular investment or a portion of its portfolio as a duration management technique or to protect against any increase in the price of securities to be purchased at a later date. By using an MMD Rate Lock, the Fund can create a synthetic long or short position, allowing the Fund to select what the manager believes is an attractive part of the yield curve. The Fund will ordinarily use these transactions as a hedge or for duration or risk management although it is permitted to enter into them to enhance income or gain or to increase the Fund’s yield, for example, during periods of steep interest rate yield curves (i.e., wide differences between short term and long-term interest rates).
The Fund may also invest in securities of other open- or closed-end investment companies (including exchange-traded funds (“ETFs”)) that invest primarily in municipal securities of the types in which the Fund may invest directly, to the extent permitted by the Investment Company Act of 1940, as amended (the “1940 Act”), the rules and regulations issued thereunder and applicable exemptive orders issued by the Securities and Exchange Commission (“SEC”).
The Fund may invest in distressed securities but may not invest in the securities of an issuer which, at the time of investment, is in default on its obligations to pay principal or interest thereon when due or that is involved in a bankruptcy proceeding (i.e., rated below C-, at the time of investment); provided, however, that the Fund’s sub-adviser may determine that it is in the best interest of shareholders in pursuing a workout arrangement with issuers of defaulted securities to make loans to the defaulted issuer or another party, or purchase a debt, equity or other interest from the defaulted issuer or another party, or take other related or similar steps involving the investment of additional monies, but only if that issuer’s securities are already held by the Fund.
Use of Leverage
The Fund uses leverage to pursue its investment objectives. The Fund may source leverage through the issuance of “senior securities” as defined under the 1940 Act, which include (1) borrowings, including loans from financial institutions; (2) the issuance of debt securities; and (3) the issuance of preferred shares of beneficial interest (“Preferred Shares”). However, the Fund’s use of borrowings (which may include reverse repurchase agreements) for leverage is limited by certain fundamental investment restrictions. Additionally, the Fund may use certain derivatives and other financing instruments that have the economic effect of leverage by creating additional investment exposures, such as investments in inverse floating rate securities. The amount and sources of leverage will vary depending on market conditions.
Temporary Defensive Periods
During temporary defensive periods (e.g., times when, in the Fund’s investment adviser’s and/or the Fund’s sub-adviser’s opinion, temporary imbalances of supply and demand or other temporary dislocations in the tax-exempt bond market adversely affect the price at which long-term or intermediate-term municipal securities are available), the Fund may invest up to 100% of its net assets in cash or cash equivalents, short-term investments or municipal bonds and deviate from its investment policies including the Fund’s 80% names rule policy. Also, during these periods, the Fund may not achieve its investment objectives.
| 187 |
Shareholder Update (continued)
NUVEEN NEW JERSEY QUALITY MUNICIPAL INCOME FUND (NXJ)
Investment Objectives
The Fund’s investment objectives are to provide current income exempt from regular federal and New Jersey income tax, and to enhance portfolio value relative to the municipal bond market by investing in tax-exempt municipal bonds that the Fund’s investment adviser believes are underrated or undervalued or that represent municipal market sectors that are undervalued.
Investment Policies
As a fundamental policy, under normal circumstances, at least 80% of its Assets (as defined below), in municipal securities and other related investments, the income from which is exempt from regular federal and New Jersey state income taxes.
“Assets” mean the net assets of the Fund plus the amount of any borrowings for investment purposes. “Managed Assets” mean the total assets of the Fund, minus the sum of its accrued liabilities (other than Fund liabilities incurred for the express purpose of creating leverage). Total assets for this purpose shall include assets attributable to the Fund’s use of leverage (whether or not those assets are reflected in the Fund’s financial statements for purposes of generally accepted accounting principles), and derivatives will be valued at their market value.
Under normal circumstances:
| • | The Fund will invest at least 80% of its Managed Assets in investment grade municipal securities that, at the time of investment, are rated within the four highest grades (Baa or BBB or better) by at least one nationally recognized statistical rating organization (“NRSRO”) or are unrated but judged to be of comparable quality by the Fund’s investment adviser and/or the Fund’s sub-adviser. |
| • | The Fund may invest up to 20% of its Managed Assets in municipal securities that at the time of investment are rated below investment grade (Ba or BB or lower) or are unrated but judged to be of comparable quality by the Fund’s investment adviser and/or the Fund’s sub-adviser. |
| • | No more than 10% of the Fund’s Managed Assets may be invested in municipal securities rated below B3/B- or that are unrated but judged to be of comparable quality by the Fund’s investment adviser and/or the Fund’s sub-adviser. |
| • | The Fund may invest up to 20% of its Managed Assets in municipal securities that pay interest that is taxable under the federal alternative minimum tax applicable to individuals. |
| • | The Fund may not enter into a futures contract or related options or forward contracts if more than 30% of its Managed Assets would be represented by futures contracts or more than 5% of its Managed Assets would be committed to initial margin deposits and premiums on futures contracts or related options. |
| • | The Fund will generally maintain an investment portfolio with an overall weighted average maturity of greater than 10 years. |
The foregoing policies apply only at the time of any new investment.
Approving Changes in Investment Policies
The Board of Trustees of the Fund may change the policies described above without a shareholder vote. However, the Fund’s (i) investment objectives, (ii) policy of investing at least 80% of its Assets, in municipal securities and other related investments, the income from which is exempt from regular federal and New Jersey income taxes and (iii) policy that it may not issue debt securities that rank senior to Preferred Shares other than for temporary or emergency purposes, may not be changed without the approval of the holders of a majority of the outstanding common shares and preferred shares voting together as a single class, and the approval of the holders of a majority of the outstanding preferred shares, voting separately as a single class. A “majority of the outstanding” shares means (i) 67% or more of the shares present at a meeting, if the holders of more than 50% of the shares are present or represented by proxy or (ii) more than 50% of the shares, whichever is less.
Portfolio Contents
The Fund generally invests in municipal securities. Municipal securities include municipal bonds, notes, securities issued to finance and refinance public projects, certificates of participation, variable rate demand obligations, lease obligations, municipal notes, pre-refunded municipal bonds, private activity bonds, securities issued by tender option bond trusts (“TOB trusts”), including inverse floating rate securities, and other forms of municipal bonds and securities, and other related instruments that create exposure to municipal bonds, notes and securities that provide for the payment of interest income that is exempt from U.S. federal and New Jersey personal income taxes.
Municipal securities are debt obligations generally issued by states, cities and local authorities and certain possessions and territories of the United States (such as Puerto Rico and Guam) to finance or refinance public purpose projects such as roads, schools, and water supply systems.
The Fund may also invest in AMT Bonds. AMT Bonds may trigger adverse tax consequences for Fund shareholders who are subject to the federal alternative minimum tax.
The municipal securities in which the Fund invests are generally issued by the State of New Jersey, a municipality in New Jersey, or a political subdivision or agency or instrumentality of such State or municipality, and pay interest that, in the opinion of bond counsel to the issuer (or on the basis of other authority believed by the Fund’s investment adviser and/or the Fund’s sub-adviser to be reliable), is exempt from regular federal
| 188 |
income tax and New Jersey personal income taxes, although the interest may be subject to the federal alternative minimum tax. The Fund may invest in municipal bonds issued by United States territories and possessions (such as Puerto Rico or Guam) that are exempt from regular federal and New Jersey income taxes.
The Fund may invest in municipal securities that represent lease obligations and certificates of participation in such leases. A municipal lease is an obligation in the form of a lease or installment purchase that is issued by a state or local government to acquire equipment and facilities. Income from such obligations generally is exempt from state and local taxes in the state of issuance. A certificate of participation represents an undivided interest in an unmanaged pool of municipal leases, an installment purchase agreement or other instruments. The certificates typically are issued by a municipal agency, a trust or other entity that has received an assignment of the payments to be made by the state or political subdivision under such leases or installment purchase agreements. Such certificates provide the Fund with the right to a pro rata undivided interest in the underlying municipal securities. In addition, such participations generally provide the Fund with the right to demand payment, on not more than seven days’ notice, of all or any part of the Fund’s participation interest in the underlying municipal securities, plus accrued interest.
The Fund may invest in municipal notes. Municipal securities in the form of notes generally are used to provide for short-term capital needs, in anticipation of an issuer’s receipt of other revenues or financing, and typically have maturities of up to three years. Such instruments may include tax anticipation notes, revenue anticipation notes, bond anticipation notes, tax and revenue anticipation notes and construction loan notes. Tax anticipation notes are issued to finance the working capital needs of governments. Generally, they are issued in anticipation of various tax revenues, such as income, sales, property, use and business taxes, and are payable from these specific future taxes. Revenue anticipation notes are issued in expectation of receipt of other kinds of revenue, such as federal revenues available under federal revenue sharing programs. Bond anticipation notes are issued to provide interim financing until long-term bond financing can be arranged. In most cases, the long-term bonds then provide the funds needed for repayment of the bond anticipation notes. Tax and revenue anticipation notes combine the funding sources of both tax anticipation notes and revenue anticipation notes. Construction loan notes are sold to provide construction financing. Mortgage notes insured by the Federal Housing Authority secure these notes; however, the proceeds from the insurance may be less than the economic equivalent of the payment of principal and interest on the mortgage note if there has been a default. The anticipated revenues from taxes, grants or bond financing generally secure the obligations of an issuer of municipal notes.
The Fund may invest in “tobacco settlement bonds.” Tobacco settlement bonds are municipal securities that are secured or payable solely from the collateralization of the proceeds from class action or other litigation against the tobacco industry.
The Fund may invest in pre-refunded municipal securities. The principal of and interest on pre-refunded municipal securities are no longer paid from the original revenue source for the securities. Instead, the source of such payments is typically an escrow fund consisting of U.S. government securities. The assets in the escrow fund are derived from the proceeds of refunding bonds issued by the same issuer as the pre-refunded municipal securities. Issuers of municipal securities use this advance refunding technique to obtain more favorable terms with respect to securities that are not yet subject to call or redemption by the issuer. For example, advance refunding enables an issuer to refinance debt at lower market interest rates, restructure debt to improve cash flow or eliminate restrictive covenants in the indenture or other governing instrument for the pre-refunded municipal securities. However, except for a change in the revenue source from which principal and interest payments are made, the pre-refunded municipal securities remain outstanding on their original terms until they mature or are redeemed by the issuer.
The Fund may invest in private activity bonds. Private activity bonds, formerly referred to as industrial development bonds, are issued by or on behalf of public authorities to obtain funds to provide privately operated housing facilities, airport, mass transit or port facilities, sewage disposal, solid waste disposal or hazardous waste treatment or disposal facilities and certain local facilities for water supply, gas or electricity. Other types of private activity bonds, the proceeds of which are used for the construction, equipment, repair or improvement of privately operated industrial or commercial facilities, may constitute municipal securities, although the current federal tax laws place substantial limitations on the size of such issues. The Fund’s distributions of its interest income from private activity bonds may subject certain investors to the federal alternative minimum tax applicable to individuals. However, the Fund will only invest in private activity bonds that are not subject to the federal alternative minimum tax.
The Fund may invest in inverse floating rate securities issued by a TOB trust, the interest rate on which varies inversely with the Securities Industry Financial Markets Association short-term rate, which resets weekly, or a similar short-term rate, and is reduced by the expenses related to the TOB trust. Typically, inverse floating rate securities represent beneficial interests in a special purpose trust (sometimes called a TOB trust) formed by a third party sponsor for the purpose of holding municipal bonds. Inverse floating rate securities may increase or decrease in value at a greater rate than the underlying interest rate on the municipal bond held by the TOB trust, which effectively leverages the Fund’s investment.
The Fund may invest in floating rate securities issued by special purpose trusts. Floating rate securities may take the form of short-term floating rate securities or the option period may be substantially longer. Generally, the interest rate earned will be based upon the market rates for municipal securities with maturities or remarketing provisions that are comparable in duration to the periodic interval of the tender option, which may vary from weekly, to monthly, to extended periods of one year or multiple years. Since the option feature has a shorter term than the final maturity or first call date of the underlying bond deposited in the trust, the Fund as the holder of the floating rate security relies upon the terms of the agreement with the financial institution furnishing the option as well as the credit strength of that institution. As further assurance of liquidity, the terms of the trust provide for a liquidation of the municipal security deposited in the trust and the application of the proceeds to pay off the floating rate security. The trusts that are organized to issue both short-term floating rate securities and inverse floaters generally include liquidation triggers to protect the investor in the floating rate security.
The Fund may invest in municipal securities issued by special taxing districts. Special taxing districts are organized to plan and finance infrastructure developments to induce residential, commercial and industrial growth and redevelopment. The bond financing methods such as tax increment finance, tax assessment, special services district and Mello-Roos bonds, are generally payable solely from taxes or other revenues attributable to the specific projects financed by the bonds without recourse to the credit or taxing power of related or overlapping municipalities.
| 189 |
Shareholder Update (continued)
The Fund may invest in zero coupon bonds. A zero coupon bond is a bond that typically does not pay interest for the entire life of the obligation or for an initial period after the issuance of the obligation.
The Fund may buy and sell securities on a when-issued or delayed delivery basis, making payment or taking delivery at a later date, normally within 15 to 45 days of the trade date.
The Fund may utilize structured notes and similar instruments for investment purposes and also for hedging purposes. Structured notes are privately negotiated debt obligations where the principal and/or interest is determined by reference to the performance of a benchmark asset, market or interest rate (an “embedded index”), such as selected securities, an index of securities or specified interest rates, or the differential performance of two assets or markets.
The Fund may invest in illiquid securities (i.e., securities that are not readily marketable), including, but not limited to, restricted securities (securities the disposition of which is restricted under the federal securities laws), securities that may be resold only pursuant to Rule 144A under the Securities Act of 1933, as amended (the “1933 Act”), and repurchase agreements with maturities in excess of seven days. Illiquid securities may also include securities legally restricted as to resale, such as securities issued pursuant to Section 4(a)(2) of the 1933 Act.
The Fund may enter into certain derivative instruments in pursuit of its investment objectives, including to seek to enhance return, to hedge certain risks of its investments in municipal securities or as a substitute for a position in the underlying asset. Such instruments include financial futures contracts, swap contracts (including interest rate swaps, credit default swaps and municipal market data rate locks (“MMD Rate Locks”)), options on financial futures, options on swap contracts or other derivative instruments.
The Fund may purchase and sell MMD Rate Locks. An MMD Rate Lock permits the Fund to lock in a specified municipal interest rate for a portion of its portfolio to preserve a return on a particular investment or a portion of its portfolio as a duration management technique or to protect against any increase in the price of securities to be purchased at a later date. By using an MMD Rate Lock, the Fund can create a synthetic long or short position, allowing the Fund to select what the manager believes is an attractive part of the yield curve. The Fund will ordinarily use these transactions as a hedge or for duration or risk management although it is permitted to enter into them to enhance income or gain or to increase the Fund’s yield, for example, during periods of steep interest rate yield curves (i.e., wide differences between short-term and long term interest rates).
The Fund may also invest in securities of other open- or closed-end investment companies (including exchange traded funds (“ETFs”)) that invest primarily in municipal securities of the types in which the Fund may invest directly, to the extent permitted by the Investment Company Act of 1940, as amended (the “1940 Act”), the rules and regulations issued thereunder and applicable exemptive orders issued by the Securities and Exchange Commission (“SEC”). In addition, the Fund may invest a portion of its Managed Assets in pooled investment vehicles (other than investment companies) that invest primarily in municipal securities of the types in which the Fund may invest directly.
The Fund may invest in distressed securities but may not invest in the securities of an issuer which, at the time of investment, is in default on its obligations to pay principal or interest thereon when due or that is involved in a bankruptcy proceeding (i.e., rated below C-, at the time of investment); provided, however, that the Fund’s sub-adviser may determine that it is in the best interest of shareholders in pursuing a workout arrangement with issuers of defaulted securities to make loans to the defaulted issuer or another party, or purchase a debt, equity or other interest from the defaulted issuer or another party, or take other related or similar steps involving the investment of additional monies, but only if that issuer’s securities are already held by the Fund.
Use of Leverage
The Fund uses leverage to pursue its investment objectives. The Fund may source leverage through the issuance of “senior securities” as defined under the 1940 Act, which include (1) borrowings, including loans from financial institutions; (2) the issuance of debt securities; and (3) the issuance of preferred shares of beneficial interest (“Preferred Shares”). However, the Fund’s use of borrowings (which may include reverse repurchase agreements) for leverage is limited by certain fundamental investment restrictions. Additionally, the Fund may use certain derivatives and other financing instruments that have the economic effect of leverage by creating additional investment exposures, such as investments in inverse floating rate securities. The amount and sources of leverage will vary depending on market conditions.
Temporary Defensive Periods
During temporary defensive periods (e.g., times when, in the Fund’s investment adviser’s and/or the Fund’s sub-adviser’s opinion, temporary imbalances of supply and demand or other temporary dislocations in the tax-exempt bond market adversely affect the price at which long-term or intermediate-term municipal securities are available), the Fund may invest up to 100% of its net assets in cash or cash equivalents, short-term investments or municipal bonds and deviate from its investment policies including the Fund’s 80% names rule policy. Also, during these periods, the Fund may not achieve its investment objectives.
| 190 |
NUVEEN NEW YORK AMT-FREE QUALITY MUNICIPAL INCOME FUND (NRK)
Investment Objectives
The Fund’s investment objectives are to provide current income exempt from regular federal, New York State and New York City income taxes and from the federal alternative minimum tax applicable to individuals, and to enhance portfolio value relative to the municipal bond market by investing in tax-exempt municipal bonds that the Fund’s investment adviser believes are underrated or undervalued or that represent municipal market sectors that are undervalued.
Investment Policies
As a fundamental policy, under normal circumstances, the Fund will invest at least 80% of its Assets (as defined below) in municipal securities and other related investments the income from which is exempt from regular federal and New York State and New York City income taxes and from the federal alternative minimum tax applicable to individuals.
As a non-fundamental policy, under normal circumstances, the Fund will invest 100% of its Managed Assets (as defined below) in municipal securities and other related investments the income from which is exempt from the federal alternative minimum tax applicable to individuals at the time of purchase.
“Assets” mean the net assets of the Fund plus the amount of any borrowings for investment purposes. “Managed Assets” mean the total assets of the Fund, minus the sum of its accrued liabilities (other than Fund liabilities incurred for the express purpose of creating leverage). Total assets for this purpose shall include assets attributable to the Fund’s use of leverage (whether or not those assets are reflected in the Fund’s financial statements for purposes of generally accepted accounting principles), and derivatives will be valued at their market value.
Under normal circumstances:
| • | The Fund will invest at least 80% of its Managed Assets in investment grade municipal securities that, at the time of investment, are rated within the four highest grades (Baa or BBB or better) by at least one nationally recognized statistical rating organization (“NRSRO”) or are unrated but judged to be of comparable quality by the Fund’s sub-adviser. |
| • | The Fund may invest up to 20% of its Managed Assets in municipal securities that at the time of investment are rated below investment grade (Ba or BB or lower) or are unrated but judged to be of comparable quality by the Fund’s investment adviser and/or the Fund’s sub-adviser. |
| • | No more than 10% of the Fund’s Managed Assets may be invested in municipal securities rated below B3/B- or that are unrated but judged to be of comparable quality by the Fund’s investment adviser and/or the Fund’s sub-adviser. |
| • | The Fund may invest up to 15% of its Managed Assets in inverse floating rate securities. |
| • | The Fund will generally maintain an investment portfolio with an overall weighted average maturity of greater than 10 years. |
The foregoing policies apply only at the time of any new investment.
Approving Changes in Investment Policies
The Board of Trustees of the Fund may change the policies described above without a shareholder vote. However, the Fund’s policy of investing at least 80% of its Assets in municipal securities and other related investments the income from which is exempt from regular federal and New York State and New York City income taxes and from the federal alternative minimum tax applicable to individuals, may not be changed without the approval of the holders of a majority of the outstanding common shares and preferred shares voting together as a single class, and the approval of the holders of a majority of the outstanding preferred shares, voting separately as a single class. A “majority of the outstanding” shares means (i) 67% or more of the shares present at a meeting, if the holders of more than 50% of the shares are present or represented by proxy or (ii) more than 50% of the shares, whichever is less.
Portfolio Contents
The Fund invests in various municipal securities, including municipal bonds and notes, other securities issued to finance and refinance public projects, and other related securities and derivative instruments creating exposure to municipal bonds, notes and securities that provide for the payment of interest income that is exempt from federal, New York State and New York City income tax.
Municipal securities include municipal bonds, notes, securities issued to finance and refinance public projects, certificates of participation, variable rate demand obligations, lease obligations, municipal notes, pre-refunded municipal bonds, private activity bonds, securities issued by tender option bond trusts (“TOB trusts”), including inverse floating rate securities, and other forms of municipal bonds and securities, and other related instruments that create exposure to municipal bonds, notes and securities that provide for the payment of interest income that is exempt from U.S. federal income tax and New York State and New York City income taxes.
Municipal securities are debt obligations generally issued by states, cities and local authorities and certain possessions and territories of the United States (such as Puerto Rico and Guam) to finance or refinance public purpose projects such as roads, schools, and water supply systems.
| 191 |
Shareholder Update (continued)
The municipal securities in which the Fund invests are generally issued by the State of New York, a municipality in New York, or a political subdivision or agency or instrumentality of such State or municipality, and pay interest that, in the opinion of bond counsel to the issuer (or on the basis of other authority believed by the Investment Adviser to be reliable), is exempt from regular federal, New York State and New York City personal income taxes and the federal alternative minimum tax. The Fund may invest in municipal bonds issued by United States territories and possessions (such as Puerto Rico or Guam) that are exempt from regular federal, New York State and New York City personal income taxes and the federal alternative minimum tax.
The Fund may invest in “tobacco settlement bonds.” Tobacco settlement bonds are municipal securities that are secured or payable solely from the collateralization of the proceeds from class action or other litigation against the tobacco industry.
The Fund may invest in municipal securities that represent lease obligations and certificates of participation in such leases. A municipal lease is an obligation in the form of a lease or installment purchase that is issued by a state or local government to acquire equipment and facilities. Income from such obligations generally is exempt from state and local taxes in the state of issuance. A certificate of participation represents an undivided interest in an unmanaged pool of municipal leases, an installment purchase agreement or other instruments. The certificates typically are issued by a municipal agency, a trust or other entity that has received an assignment of the payments to be made by the state or political subdivision under such leases or installment purchase agreements. Such certificates provide the Fund with the right to a pro rata undivided interest in the underlying municipal securities. In addition, such participations generally provide the Fund with the right to demand payment, on not more than seven days’ notice, of all or any part of the Fund’s participation interest in the underlying municipal securities, plus accrued interest.
The Fund may invest in municipal notes. Municipal securities in the form of notes generally are used to provide for short-term capital needs, in anticipation of an issuer’s receipt of other revenues or financing, and typically have maturities of up to three years. Such instruments may include tax anticipation notes, revenue anticipation notes, bond anticipation notes, tax and revenue anticipation notes and construction loan notes. Tax anticipation notes are issued to finance the working capital needs of governments. Generally, they are issued in anticipation of various tax revenues, such as income, sales, property, use and business taxes, and are payable from these specific future taxes. Revenue anticipation notes are issued in expectation of receipt of other kinds of revenue, such as federal revenues available under federal revenue sharing programs. Bond anticipation notes are issued to provide interim financing until long-term bond financing can be arranged. In most cases, the long-term bonds then provide the funds needed for repayment of the bond anticipation notes. Tax and revenue anticipation notes combine the funding sources of both tax anticipation notes and revenue anticipation notes. Construction loan notes are sold to provide construction financing. Mortgage notes insured by the Federal Housing Authority secure these notes; however, the proceeds from the insurance may be less than the economic equivalent of the payment of principal and interest on the mortgage note if there has been a default. The anticipated revenues from taxes, grants or bond financing generally secure the obligations of an issuer of municipal notes.
The Fund may invest in pre-refunded municipal securities. The principal of and interest on pre-refunded municipal securities are no longer paid from the original revenue source for the securities. Instead, the source of such payments is typically an escrow fund consisting of U.S. government securities. The assets in the escrow fund are derived from the proceeds of refunding bonds issued by the same issuer as the pre-refunded municipal securities. Issuers of municipal securities use this advance refunding technique to obtain more favorable terms with respect to securities that are not yet subject to call or redemption by the issuer. For example, advance refunding enables an issuer to refinance debt at lower market interest rates, restructure debt to improve cash flow or eliminate restrictive covenants in the indenture or other governing instrument for the pre-refunded municipal securities. However, except for a change in the revenue source from which principal and interest payments are made, the pre-refunded municipal securities remain outstanding on their original terms until they mature or are redeemed by the issuer.
The Fund may invest in private activity bonds. Private activity bonds, formerly referred to as industrial development bonds, are issued by or on behalf of public authorities to obtain funds to provide privately operated housing facilities, airport, mass transit or port facilities, sewage disposal, solid waste disposal or hazardous waste treatment or disposal facilities and certain local facilities for water supply, gas or electricity. Other types of private activity bonds, the proceeds of which are used for the construction, equipment, repair or improvement of privately operated industrial or commercial facilities, may constitute municipal securities, although the current federal tax laws place substantial limitations on the size of such issues. The Fund’s distributions of its interest income from private activity bonds may subject certain investors to the federal alternative minimum tax applicable to individuals. However, the Fund will only invest in private activity bonds that are not subject to the federal alternative minimum tax.
The Fund may invest in inverse floating rate securities issued by a TOB trust, the interest rate on which varies inversely with the Securities Industry Financial Markets Association short-term rate, which resets weekly, or a similar short-term rate, and is reduced by the expenses related to the TOB trust. Typically, inverse floating rate securities represent beneficial interests in a special purpose trust (sometimes called a TOB trust) formed by a third party sponsor for the purpose of holding municipal bonds. Inverse floating rate securities may increase or decrease in value at a greater rate than the underlying interest rate on the municipal bond held by the TOB trust, which effectively leverages the Fund’s investment.
The Fund may invest in floating rate securities issued by special purpose trusts. Floating rate securities may take the form of short-term floating rate securities or the option period may be substantially longer. Generally, the interest rate earned will be based upon the market rates for municipal securities with maturities or remarketing provisions that are comparable in duration to the periodic interval of the tender option, which may vary from weekly, to monthly, to extended periods of one year or multiple years. Since the option feature has a shorter term than the final maturity or first call date of the underlying bond deposited in the trust, the Fund as the holder of the floating rate security relies upon the terms of the agreement with the financial institution furnishing the option as well as the credit strength of that institution. As further assurance of liquidity, the terms of the trust provide for a liquidation of the municipal security deposited in the trust and the application of the proceeds to pay off the floating rate security. The trusts that are organized to issue both short-term floating rate securities and inverse floaters generally include liquidation triggers to protect the investor in the floating rate security.
| 192 |
The Fund may invest in municipal securities issued by special taxing districts. Special taxing districts are organized to plan and finance infrastructure developments to induce residential, commercial and industrial growth and redevelopment. The bond financing methods such as tax increment finance, tax assessment, special services district and Mello-Roos bonds, are generally payable solely from taxes or other revenues attributable to the specific projects financed by the bonds without recourse to the credit or taxing power of related or overlapping municipalities.
The Fund may invest in zero coupon bonds. A zero coupon bond is a bond that typically does not pay interest for the entire life of the obligation or for an initial period after the issuance of the obligation.
The Fund may buy and sell securities on a when-issued or delayed delivery basis, making payment or taking delivery at a later date, normally within 15 to 45 days of the trade date.
The Fund may utilize structured notes and similar instruments for investment purposes and also for hedging purposes. Structured notes are privately negotiated debt obligations where the principal and/or interest is determined by reference to the performance of a benchmark asset, market or interest rate (an “embedded index”), such as selected securities, an index of securities or specified interest rates, or the differential performance of two assets or markets.
The Fund may invest in illiquid securities (i.e., securities that are not readily marketable), including, but not limited to, restricted securities (securities the disposition of which is restricted under the federal securities laws), securities that may be resold only pursuant to Rule 144A under the Securities Act of 1933, as amended (the “1933 Act”), and repurchase agreements with maturities in excess of seven days. Illiquid securities may also include securities legally restricted as to resale, such as securities issued pursuant to Section 4(a)(2) of the 1933 Act.
The Fund may enter into certain derivative instruments in pursuit of its investment objectives, including to seek to enhance return, to hedge certain risks of its investments in municipal securities or as a substitute for a position in the underlying asset. Such instruments include financial futures contracts, swap contracts (including interest rate swaps, credit default swaps and municipal market data rate locks (“MMD Rate Locks”)), options on financial futures, options on swap contracts or other derivative instruments.
The Fund may purchase and sell MMD Rate Locks. An MMD Rate Lock permits the Fund to lock in a specified municipal interest rate for a portion of its portfolio to preserve a return on a particular investment or a portion of its portfolio as a duration management technique or to protect against any increase in the price of securities to be purchased at a later date. By using an MMD Rate Lock, the Fund can create a synthetic long or short position, allowing the Fund to select what the manager believes is an attractive part of the yield curve. The Fund will ordinarily use these transactions as a hedge or for duration or risk management although it is permitted to enter into them to enhance income or gain or to increase the Fund’s yield, for example, during periods of steep interest rate yield curves (i.e., wide differences between short-term and long term interest rates).
The Fund may also invest in securities of other open- or closed-end investment companies (including exchange-traded funds (“ETFs”)) that invest primarily in municipal securities of the types in which the Fund may invest directly, to the extent permitted by the Investment Company Act of 1940, as amended (the “1940 Act”), the rules and regulations issued thereunder and applicable exemptive orders issued by the Securities and Exchange Commission (“SEC”). In addition, the Fund may invest a portion of its Managed Assets in pooled investment vehicles (other than investment companies) that invest primarily in municipal securities of the types in which the Fund may invest directly.
The Fund may invest in distressed securities but may not invest in the securities of an issuer which, at the time of investment, is in default on its obligations to pay principal or interest thereon when due or that is involved in a bankruptcy proceeding (i.e., rated below C-, at the time of investment); provided, however, that the Fund’s sub-adviser may determine that it is in the best interest of shareholders in pursuing a workout arrangement with issuers of defaulted securities to make loans to the defaulted issuer or another party, or purchase a debt, equity or other interest from the defaulted issuer or another party, or take other related or similar steps involving the investment of additional monies, but only if that issuer’s securities are already held by the Fund.
Use of Leverage
The Fund uses leverage to pursue its investment objectives. The Fund may source leverage through the issuance of “senior securities” as defined under the 1940 Act, which include (1) borrowings, including loans from financial institutions; (2) the issuance of debt securities; and (3) the issuance of preferred shares of beneficial interest (“Preferred Shares”). However, the Fund’s use of borrowings (which may include reverse repurchase agreements) for leverage is limited by certain fundamental investment restrictions. Additionally, the Fund may use certain derivatives and other financing instruments that have the economic effect of leverage by creating additional investment exposures, such as investments in inverse floating rate securities. The amount and sources of leverage will vary depending on market conditions.
Temporary Defensive Periods
During temporary defensive periods (e.g., times when, in the Fund’s investment adviser’s and/or the Fund’s sub-adviser’s opinion, temporary imbalances of supply and demand or other temporary dislocations in the tax-exempt bond market adversely affect the price at which long-term or intermediate-term municipal securities are available), the Fund may invest up to 100% of its net assets in cash or cash equivalents, short-term investments or municipal bonds and deviate from its investment policies including the Fund’s 80% names rule policy. Also, during these periods, the Fund may not achieve its investment objectives.
| 193 |
Shareholder Update (continued)
NUVEEN NEW YORK MUNICIPAL VALUE FUND (NNY)
Investment Objectives
The Fund’s primary investment objective is to provide, through investment in a professionally managed portfolio of tax-exempt New York municipal obligations, current interest income exempt from both federal and New York State and New York City personal income taxes. The Fund’s secondary investment objective is to achieve enhancement of portfolio value through investments in tax-exempt New York municipal obligations that, in the opinion of the Fund’s investment adviser and/or the Fund’s sub-adviser, are underrated or represent municipal market sectors that are undervalued.
Investment Policies
As a fundamental policy, under normal circumstances, the Fund will invest at least 80% of its Assets (as defined below) in municipal securities and other related investments, the income from which is exempt from regular federal, New York State and New York City income taxes.
“Assets” mean the net assets of the Fund plus the amount of any borrowings for investment purposes. “Managed Assets” mean the total assets of the Fund, minus the sum of its accrued liabilities (other than Fund liabilities incurred for the express purpose of creating leverage). Total assets for this purpose shall include assets attributable to the Fund’s use of leverage (whether or not those assets are reflected in the Fund’s financial statements for purposes of generally accepted accounting principles), and derivatives will be valued at their market value.
Under normal circumstances:
| • | The Fund will invest at least 80% of its Managed Assets in municipal securities that, at the time of investment, are rated within the four highest grades (Baa or BBB or better) by at least one nationally recognized statistical rating organization (“NRSRO”) or are unrated but judged to be of comparable quality by the Fund’s investment adviser and/or the Fund’s sub-adviser. Investment grade securities may include securities that, at the time of investment, are rated below investment grade, so long as at least one NRSRO rates such securities within the four highest grades (such securities are commonly referred to as split-rated securities). |
| • | The Fund may invest up to 20% of its Managed Assets in municipal securities that at the time of investment are rated below investment grade or are unrated but judged to be of comparable quality by the Fund’s investment adviser and/or the Fund’s sub-adviser. |
| • | No more than 10% of the Fund’s Managed Assets may be invested in municipal securities rated below B3/B- by all NRSROs that rate the security or that are unrated but judged to be of comparable quality by the Fund’s investment adviser and/or the Fund’s sub-adviser. |
| • | The Fund may invest up to 20% of its Managed Assets in municipal securities that pay interest that is taxable under the federal alternative minimum tax applicable to individuals. |
| • | The Fund will not invest more than 25% of its total assets in municipal securities in any one industry. |
| • | The Fund will generally maintain an investment portfolio with an overall weighted average maturity of greater than 10 years. The foregoing policies apply only at the time of any new investment. |
Approving Changes in Investment Policies
The Board of Trustees of the Fund may change the policies described above without a shareholder vote. However, the Fund’s (i) investment objectives, (ii) policy of investing at least at least 80% of its Assets in municipal securities and other related investments, the income from which is exempt from regular federal, New York State and New York City income taxes and (iii) policy (as described below) that it will not leverage its capital structure by issuing senior securities such as Preferred Shares or debt instruments, may not be changed without the approval of the holders of a majority of the outstanding common shares and preferred shares voting together as a single class, and the approval of the holders of a majority of the outstanding preferred shares, voting separately as a single class. A “majority of the outstanding” shares means (i) 67% or more of the shares present at a meeting, if the holders of more than 50% of the shares are present or represented by proxy or (ii) more than 50% of the shares, whichever is less.
Portfolio Contents
The Fund invests in various municipal securities, including municipal bonds and notes, other securities issued to finance and refinance public projects, and other related securities and derivative instruments creating exposure to municipal bonds, notes and securities that provide for the payment of interest income that is exempt from federal, New York State and New York City income tax.
Municipal securities include municipal bonds, notes, securities issued to finance and refinance public projects, certificates of participation, variable rate demand obligations, lease obligations, municipal notes, pre-refunded municipal bonds, private activity bonds, securities issued by tender option bond trusts (“TOB trusts”), including inverse floating rate securities, and other forms of municipal bonds and securities, and other related instruments that create exposure to municipal bonds, notes and securities that provide for the payment of interest income that is exempt from regular U.S. federal income tax and New York State and New York City income taxes.
Municipal securities are debt obligations generally issued by states, cities and local authorities and certain possessions and territories of the United States (such as Puerto Rico and Guam) to finance or refinance public purpose projects such as roads, schools, and water supply systems.
| 194 |
The Fund may also invest in AMT Bonds. AMT Bonds may trigger adverse tax consequences for Fund shareholders who are subject to the federal alternative minimum tax.
The municipal securities in which the Fund invests are generally issued by the State of New York, a municipality of New York, or a political subdivision of either, and pay interest that, in the opinion of bond counsel to the issuer (or on the basis of other authority believed by Nuveen Asset Management to be reliable), is exempt from regular federal, New York State and New York City income taxes, although the interest may be subject to the federal alternative minimum tax. The Fund may invest in municipal securities issued by U.S. territories (such as Puerto Rico or Guam) that are exempt from regular federal, New York State and New York City income taxes.
The Fund may invest in municipal securities that represent lease obligations and certificates of participation in such leases. A municipal lease is an obligation in the form of a lease or installment purchase that is issued by a state or local government to acquire equipment and facilities. Income from such obligations generally is exempt from state and local taxes in the state of issuance. A certificate of participation represents an undivided interest in an unmanaged pool of municipal leases, an installment purchase agreement or other instruments. The certificates typically are issued by a municipal agency, a trust or other entity that has received an assignment of the payments to be made by the state or political subdivision under such leases or installment purchase agreements. Such certificates provide the Fund with the right to a pro rata undivided interest in the underlying municipal securities. In addition, such participations generally provide the Fund with the right to demand payment, on not more than seven days’ notice, of all or any part of the Fund’s participation interest in the underlying municipal securities, plus accrued interest.
The Fund may invest in municipal notes. Municipal securities in the form of notes generally are used to provide for short-term capital needs, in anticipation of an issuer’s receipt of other revenues or financing, and typically have maturities of up to three years. Such instruments may include tax anticipation notes, revenue anticipation notes, bond anticipation notes, tax and revenue anticipation notes and construction loan notes. Tax anticipation notes are issued to finance the working capital needs of governments. Generally, they are issued in anticipation of various tax revenues, such as income, sales, property, use and business taxes, and are payable from these specific future taxes. Revenue anticipation notes are issued in expectation of receipt of other kinds of revenue, such as federal revenues available under federal revenue sharing programs. Bond anticipation notes are issued to provide interim financing until long-term bond financing can be arranged. In most cases, the long-term bonds then provide the funds needed for repayment of the bond anticipation notes. Tax and revenue anticipation notes combine the funding sources of both tax anticipation notes and revenue anticipation notes. Construction loan notes are sold to provide construction financing. Mortgage notes insured by the Federal Housing Authority secure these notes; however, the proceeds from the insurance may be less than the economic equivalent of the payment of principal and interest on the mortgage note if there has been a default. The anticipated revenues from taxes, grants or bond financing generally secure the obligations of an issuer of municipal notes.
The Fund may invest in “tobacco settlement bonds.” Tobacco settlement bonds are municipal securities that are secured or payable solely from the collateralization of the proceeds from class action or other litigation against the tobacco industry.
The Fund may invest in pre-refunded municipal securities. The principal of and interest on pre-refunded municipal securities are no longer paid from the original revenue source for the securities. Instead, the source of such payments is typically an escrow fund consisting of U.S. government securities. The assets in the escrow fund are derived from the proceeds of refunding bonds issued by the same issuer as the pre-refunded municipal securities. Issuers of municipal securities use this advance refunding technique to obtain more favorable terms with respect to securities that are not yet subject to call or redemption by the issuer. For example, advance refunding enables an issuer to refinance debt at lower market interest rates, restructure debt to improve cash flow or eliminate restrictive covenants in the indenture or other governing instrument for the pre-refunded municipal securities. However, except for a change in the revenue source from which principal and interest payments are made, the pre-refunded municipal securities remain outstanding on their original terms until they mature or are redeemed by the issuer.
The Fund may invest in private activity bonds. Private activity bonds are issued by or on behalf of public authorities to obtain funds to provide privately operated housing facilities, airport, mass transit or port facilities, sewage disposal, solid waste disposal or hazardous waste treatment or disposal facilities and certain local facilities for water supply, gas or electricity. Other types of private activity bonds, the proceeds of which are used for the construction, equipment, repair or improvement of privately operated industrial or commercial facilities, may constitute municipal securities, although the current federal tax laws place substantial limitations on the size of such issues.
The Fund may invest in inverse floating rate securities issued by a TOB trust, the interest rate on which varies inversely with the Securities Industry Financial Markets Association short-term rate, which resets weekly, or a similar short-term rate, and is reduced by the expenses related to the TOB trust. Typically, inverse floating rate securities represent beneficial interests in a special purpose trust (sometimes called a TOB trust) formed by a third party sponsor for the purpose of holding municipal bonds. Inverse floating rate securities may increase or decrease in value at a greater rate than the underlying interest rate on the municipal bond held by the TOB trust, which effectively leverages the Fund’s investment.
The Fund may invest in floating rate securities issued by special purpose trusts. Floating rate securities may take the form of short-term floating rate securities or the option period may be substantially longer. Generally, the interest rate earned will be based upon the market rates for municipal securities with maturities or remarketing provisions that are comparable in duration to the periodic interval of the tender option, which may vary from weekly, to monthly, to extended periods of one year or multiple years. Since the option feature has a shorter term than the final maturity or first call date of the underlying bond deposited in the trust, the Fund as the holder of the floating rate security relies upon the terms of the agreement with the financial institution furnishing the option as well as the credit strength of that institution. As further assurance of liquidity, the terms of the trust provide for a liquidation of the municipal security deposited in the trust and the application of the proceeds to pay off the floating rate security. The trusts that are organized to issue both short-term floating rate securities and inverse floaters generally include liquidation triggers to protect the investor in the floating rate security.
| 195 |
Shareholder Update (continued)
The Fund may invest in municipal securities issued by special taxing districts. Special taxing districts are organized to plan and finance infrastructure developments to induce residential, commercial and industrial growth and redevelopment. The bond financing methods such as tax increment finance, tax assessment, special services district and Mello-Roos bonds, are generally payable solely from taxes or other revenues attributable to the specific projects financed by the bonds without recourse to the credit or taxing power of related or overlapping municipalities.
The Fund may invest in zero coupon bonds. A zero coupon bond is a bond that typically does not pay interest for the entire life of the obligation or for an initial period after the issuance of the obligation.
The Fund may buy and sell securities on a when-issued or delayed delivery basis, making payment or taking delivery at a later date, normally within 15 to 45 days of the trade date.
The Fund may utilize structured notes and similar instruments for investment purposes and also for hedging purposes. Structured notes are privately negotiated debt obligations where the principal and/or interest is determined by reference to the performance of a benchmark asset, market or interest rate (an “embedded index”), such as selected securities, an index of securities or specified interest rates, or the differential performance of two assets or markets.
The Fund may invest in illiquid securities (i.e., securities that are not readily marketable), including, but not limited to, restricted securities (securities the disposition of which is restricted under the federal securities laws), securities that may be resold only pursuant to Rule 144A under the Securities Act of 1933, as amended (the “1933 Act”), and repurchase agreements with maturities in excess of seven days. Illiquid securities may also include securities legally restricted as to resale, such as securities issued pursuant to Section 4(a)(2) of the 1933 Act.
The Fund may enter into certain derivative instruments in pursuit of its investment objectives, including to seek to enhance return, to hedge certain risks of its investments in municipal securities or as a substitute for a position in the underlying asset. Such instruments include financial futures contracts, swap contracts (including interest rate swaps, credit default swaps and municipal market data rate locks (“MMD Rate Locks”)), options on financial futures, options on swap contracts or other derivative instruments.
The Fund may purchase and sell MMD Rate Locks. An MMD Rate Lock permits the Fund to lock in a specified municipal interest rate for a portion of its portfolio to preserve a return on a particular investment or a portion of its portfolio as a duration management technique or to protect against any increase in the price of securities to be purchased at a later date. By using an MMD Rate Lock, the Fund can create a synthetic long or short position, allowing the Fund to select what the manager believes is an attractive part of the yield curve. The Fund will ordinarily use these transactions as a hedge or for duration or risk management although it is permitted to enter into them to enhance income or gain or to increase the Fund’s yield, for example, during periods of steep interest rate yield curves (i.e., wide differences between short-term and long term interest rates).
The Fund may also invest in securities of other open- or closed-end investment companies (including exchange-traded funds (“ETFs”)) that invest primarily in municipal securities of the types in which the Fund may invest directly, to the extent permitted by the Investment Company Act of 1940, as amended (the “1940 Act”), the rules and regulations issued thereunder and applicable exemptive orders issued by the Securities and Exchange Commission (“SEC”).
The Fund may invest in distressed securities but may not invest in the securities of an issuer which, at the time of investment, is in default on its obligations to pay principal or interest thereon when due or that is involved in a bankruptcy proceeding (i.e., rated below C-, at the time of investment); provided, however, that the Fund’s sub-adviser may determine that it is in the best interest of shareholders in pursuing a workout arrangement with issuers of defaulted securities to make loans to the defaulted issuer or another party, or purchase a debt, equity or other interest from the defaulted issuer or another party, or take other related or similar steps involving the investment of additional monies, but only if that issuer’s securities are already held by the Fund.
Use of Leverage
As a fundamental policy, the Fund will not leverage its capital structure by issuing senior securities (as defined under the 1940 Act), such as preferred shares or debt instruments. However, the Fund may borrow (which may include reverse repurchase agreements) for temporary or emergency purposes, and use certain derivatives and other financing instruments that have the economic effect of leverage by creating additional investment exposures, including inverse floating rate securities.
Temporary Defensive Periods
During temporary defensive periods (e.g., times when, in the Fund’s investment adviser’s and/or the Fund’s sub-adviser’s opinion, temporary imbalances of supply and demand or other temporary dislocations in the tax-exempt bond market adversely affect the price at which long-term or intermediate-term municipal securities are available), the Fund may invest up to 100% of its net assets in cash or cash equivalents, short-term investments or municipal bonds and deviate from its investment policies including the Fund’s 80% names rule policy. Also, during these periods, the Fund may not achieve its investment objectives.
| 196 |
NUVEEN NEW YORK QUALITY MUNICIPAL INCOME FUND (NAN)
Investment Objectives
The Fund’s investment objectives are to provide current income exempt from regular federal, New York State and New York City income tax, and to enhance portfolio value relative to the municipal bond market by investing in tax-exempt municipal bonds that the Fund’s investment adviser and/or the Fund’s sub-adviser believes are underrated or undervalued or that represent municipal market sectors that are undervalued.
Investment Policies
As a fundamental policy, under normal circumstances, the Fund will invest at least 80% of its Assets (as defined below) in municipal securities and other related investments the income from which is exempt from regular federal, New York State and New York City income taxes.
“Assets” mean the net assets of the Fund plus the amount of any borrowings for investment purposes. “Managed Assets” mean the total assets of the Fund, minus the sum of its accrued liabilities (other than Fund liabilities incurred for the express purpose of creating leverage). Total assets for this purpose shall include assets attributable to the Fund’s use of leverage (whether or not those assets are reflected in the Fund’s financial statements for purposes of generally accepted accounting principles), and derivatives will be valued at their market value.
Under normal circumstances:
| • | The Fund will invest at least 80% of its Managed Assets in investment grade securities that, at the time of investment, are rated within the four highest grades (Baa or BBB or better) by at least one nationally recognized statistical rating organization (“NRSRO”) or are unrated but judged to be of comparable quality by the Fund’s investment adviser and/or the Fund’s sub-adviser. |
| • | The Fund may invest up to 20% of its Managed Assets in municipal securities that at the time of investment are rated below investment grade or are unrated but judged to be of comparable quality by the Fund’s investment adviser and/or the Fund’s sub-adviser. |
| • | No more than 10% of the Fund’s Managed Assets may be invested in municipal securities rated below B3/B- or that are unrated but judged to be of comparable quality by the Fund’s investment adviser and/or the Fund’s sub-adviser. |
| • | The Fund also may invest up to 15% of its Managed Assets in inverse floating rate securities. |
| • | The Fund will generally maintain an investment portfolio with an overall weighted average maturity of greater than 10 years. |
The foregoing policies apply only at the time of any new investment.
Approving Changes in Investment Policies
The Board of Trustees of the Fund may change the policies described above without a shareholder vote. However, the Fund’s investment objectives and its policy of investing at least 80% of its Assets in municipal securities and other related investments, the income from which is exempt from regular federal, New York State and New York City income taxes, may not be changed without the approval of the holders of a majority of the outstanding common shares and preferred shares voting together as a single class, and the approval of the holders of a majority of the outstanding preferred shares, voting separately as a single class. A “majority of the outstanding” shares means (i) 67% or more of the shares present at a meeting, if the holders of more than 50% of the shares are present or represented by proxy or (ii) more than 50% of the shares, whichever is less.
Portfolio Contents
The Fund invests in various municipal securities, including municipal bonds and notes, other securities issued to finance and refinance public projects, and other related securities and derivative instruments creating exposure to municipal bonds, notes and securities that provide for the payment of interest income that is exempt from federal, New York State and New York City income tax.
Municipal securities include municipal bonds, notes, securities issued to finance and refinance public projects, certificates of participation, variable rate demand obligations, lease obligations, municipal notes, pre-refunded municipal bonds, private activity bonds, securities issued by tender option bond trusts (“TOB trusts”), including inverse floating rate securities, and other forms of municipal bonds and securities, and other related instruments that create exposure to municipal bonds, notes and securities that provide for the payment of interest income that is exempt from regular U.S. federal income tax and New York State and New York City personal income taxes.
Municipal securities are debt obligations generally issued by states, cities and local authorities and certain possessions and territories of the United States (such as Puerto Rico and Guam) to finance or refinance public purpose projects such as roads, schools, and water supply systems.
The municipal securities in which the Fund invests are generally issued by the State of New York, a municipality of New York, or a political subdivision of either, and pay interest that, in the opinion of bond counsel to the issuer (or on the basis of other authority believed by Nuveen Asset Management to be reliable), is exempt from regular federal, New York State and New York City income taxes, although the interest may be subject to the federal alternative minimum tax. The Fund may invest in municipal securities issued by U.S. territories (such as Puerto Rico or Guam) that are exempt from regular federal, New York State and New York City income taxes.
The Fund may also invest in municipal securities that pay interest that is taxable under the federal alternative minimum tax applicable to noncorporate taxpayers (“AMT Bonds”). AMT Bonds may trigger adverse tax consequences for Fund shareholders who are subject to the federal alternative minimum tax.
| 197 |
Shareholder Update (continued)
The Fund may invest in municipal securities that represent lease obligations and certificates of participation in such leases. A municipal lease is an obligation in the form of a lease or installment purchase that is issued by a state or local government to acquire equipment and facilities. Income from such obligations generally is exempt from state and local taxes in the state of issuance. A certificate of participation represents an undivided interest in an unmanaged pool of municipal leases, an installment purchase agreement or other instruments. The certificates typically are issued by a municipal agency, a trust or other entity that has received an assignment of the payments to be made by the state or political subdivision under such leases or installment purchase agreements. Such certificates provide the Fund with the right to a pro rata undivided interest in the underlying municipal securities. In addition, such participations generally provide the Fund with the right to demand payment, on not more than seven days’ notice, of all or any part of the Fund’s participation interest in the underlying municipal securities, plus accrued interest.
The Fund may invest in municipal notes. Municipal securities in the form of notes generally are used to provide for short-term capital needs, in anticipation of an issuer’s receipt of other revenues or financing, and typically have maturities of up to three years. Such instruments may include tax anticipation notes, revenue anticipation notes, bond anticipation notes, tax and revenue anticipation notes and construction loan notes. Tax anticipation notes are issued to finance the working capital needs of governments. Generally, they are issued in anticipation of various tax revenues, such as income, sales, property, use and business taxes, and are payable from these specific future taxes. Revenue anticipation notes are issued in expectation of receipt of other kinds of revenue, such as federal revenues available under federal revenue sharing programs. Bond anticipation notes are issued to provide interim financing until long-term bond financing can be arranged. In most cases, the long-term bonds then provide the funds needed for repayment of the bond anticipation notes. Tax and revenue anticipation notes combine the funding sources of both tax anticipation notes and revenue anticipation notes. Construction loan notes are sold to provide construction financing. Mortgage notes insured by the Federal Housing Authority secure these notes; however, the proceeds from the insurance may be less than the economic equivalent of the payment of principal and interest on the mortgage note if there has been a default. The anticipated revenues from taxes, grants or bond financing generally secure the obligations of an issuer of municipal notes.
The Fund may invest in “tobacco settlement bonds.” Tobacco settlement bonds are municipal securities that are secured or payable solely from the collateralization of the proceeds from class action or other litigation against the tobacco industry.
The Fund may invest in pre-refunded municipal securities. The principal of and interest on pre-refunded municipal securities are no longer paid from the original revenue source for the securities. Instead, the source of such payments is typically an escrow fund consisting of U.S. government securities. The assets in the escrow fund are derived from the proceeds of refunding bonds issued by the same issuer as the pre-refunded municipal securities. Issuers of municipal securities use this advance refunding technique to obtain more favorable terms with respect to securities that are not yet subject to call or redemption by the issuer. For example, advance refunding enables an issuer to refinance debt at lower market interest rates, restructure debt to improve cash flow or eliminate restrictive covenants in the indenture or other governing instrument for the pre-refunded municipal securities. However, except for a change in the revenue source from which principal and interest payments are made, the pre-refunded municipal securities remain outstanding on their original terms until they mature or are redeemed by the issuer.
The Fund may invest in private activity bonds. Private activity bonds are issued by or on behalf of public authorities to obtain funds to provide privately operated housing facilities, airport, mass transit or port facilities, sewage disposal, solid waste disposal or hazardous waste treatment or disposal facilities and certain local facilities for water supply, gas or electricity. Other types of private activity bonds, the proceeds of which are used for the construction, equipment, repair or improvement of privately operated industrial or commercial facilities, may constitute municipal securities, although the current federal tax laws place substantial limitations on the size of such issues.
The Fund may invest in inverse floating rate securities issued by a TOB trust, the interest rate on which varies inversely with the Securities Industry Financial Markets Association short-term rate, which resets weekly, or a similar short-term rate, and is reduced by the expenses related to the TOB trust. Typically, inverse floating rate securities represent beneficial interests in a special purpose trust (sometimes called a TOB trust) formed by a third party sponsor for the purpose of holding municipal bonds. Inverse floating rate securities may increase or decrease in value at a greater rate than the underlying interest rate on the municipal bond held by the TOB trust, which effectively leverages the Fund’s investment.
The Fund may invest in floating rate securities issued by special purpose trusts. Floating rate securities may take the form of short-term floating rate securities or the option period may be substantially longer. Generally, the interest rate earned will be based upon the market rates for municipal securities with maturities or remarketing provisions that are comparable in duration to the periodic interval of the tender option, which may vary from weekly, to monthly, to extended periods of one year or multiple years. Since the option feature has a shorter term than the final maturity or first call date of the underlying bond deposited in the trust, the Fund as the holder of the floating rate security relies upon the terms of the agreement with the financial institution furnishing the option as well as the credit strength of that institution. As further assurance of liquidity, the terms of the trust provide for a liquidation of the municipal security deposited in the trust and the application of the proceeds to pay off the floating rate security. The trusts that are organized to issue both short-term floating rate securities and inverse floaters generally include liquidation triggers to protect the investor in the floating rate security.
The Fund may invest in municipal securities issued by special taxing districts. Special taxing districts are organized to plan and finance infrastructure developments to induce residential, commercial and industrial growth and redevelopment. The bond financing methods such as tax increment finance, tax assessment, special services district and Mello-Roos bonds, are generally payable solely from taxes or other revenues attributable to the specific projects financed by the bonds without recourse to the credit or taxing power of related or overlapping municipalities.
The Fund may invest in zero coupon bonds. A zero coupon bond is a bond that typically does not pay interest for the entire life of the obligation or for an initial period after the issuance of the obligation.
The Fund may buy and sell securities on a when-issued or delayed delivery basis, making payment or taking delivery at a later date, normally within 15 to 45 days of the trade date.
| 198 |
The Fund may utilize structured notes and similar instruments for investment purposes and also for hedging purposes. Structured notes are privately negotiated debt obligations where the principal and/or interest is determined by reference to the performance of a benchmark asset, market or interest rate (an “embedded index”), such as selected securities, an index of securities or specified interest rates, or the differential performance of two assets or markets.
The Fund may invest in illiquid securities (i.e., securities that are not readily marketable), including, but not limited to, restricted securities (securities the disposition of which is restricted under the federal securities laws), securities that may be resold only pursuant to Rule 144A under the Securities Act of 1933, as amended (the “1933 Act”), and repurchase agreements with maturities in excess of seven days. Illiquid securities may also include securities legally restricted as to resale, such as securities issued pursuant to Section 4(a)(2) of the 1933 Act.
The Fund may enter into certain derivative instruments in pursuit of its investment objectives, including to seek to enhance return, to hedge certain risks of its investments in fixed-income securities or as a substitute for a position in the underlying asset. Such instruments include financial futures contracts, swap contracts (including interest rate swaps, credit default swaps and municipal market data rate locks (“MMD Rate Locks”)), options on financial futures, options on swap contracts or other derivative instruments.
The Fund may purchase and sell MMD Rate Locks. An MMD Rate Lock permits the Fund to lock in a specified municipal interest rate for a portion of its portfolio to preserve a return on a particular investment or a portion of its portfolio as a duration management technique or to protect against any increase in the price of securities to be purchased at a later date. By using an MMD Rate Lock, the Fund can create a synthetic long or short position, allowing the Fund to select what the manager believes is an attractive part of the yield curve. The Fund will ordinarily use these transactions as a hedge or for duration or risk management although it is permitted to enter into them to enhance income or gain or to increase the Fund’s yield, for example, during periods of steep interest rate yield curves (i.e., wide differences between short-term and long term interest rates).
The Fund may also invest in securities of other open- or closed-end investment companies (including exchange-traded funds (“ETFs”)) that invest primarily in municipal securities of the types in which the Fund may invest directly, to the extent permitted by the Investment Company Act of 1940, as amended (the “1940 Act”), the rules and regulations issued thereunder and applicable exemptive orders issued by the Securities and Exchange Commission (“SEC”).
The Fund may invest in distressed securities but may not invest in the securities of an issuer which, at the time of investment, is in default on its obligations to pay principal or interest thereon when due or that is involved in a bankruptcy proceeding (i.e., rated below C-, at the time of investment); provided, however, that the Fund’s sub-adviser may determine that it is in the best interest of shareholders in pursuing a workout arrangement with issuers of defaulted securities to make loans to the defaulted issuer or another party, or purchase a debt, equity or other interest from the defaulted issuer or another party, or take other related or similar steps involving the investment of additional monies, but only if that issuer’s securities are already held by the Fund.
Use of Leverage
The Fund uses leverage to pursue its investment objectives. The Fund may source leverage through the issuance of “senior securities” as defined under the 1940 Act, which include (1) borrowings, including loans from financial institutions; (2) the issuance of debt securities; and (3) the issuance of preferred shares of beneficial interest (“Preferred Shares”). However, the Fund’s use of borrowings (which may include reverse repurchase agreements) for leverage is limited by certain fundamental investment restrictions. Additionally, the Fund may use certain derivatives and other financing instruments that have the economic effect of leverage by creating additional investment exposures, such as investments in inverse floating rate securities. The amount and sources of leverage will vary depending on market conditions.
Temporary Defensive Periods
During temporary defensive periods (e.g., times when, in the Fund’s investment adviser’s and/or the Fund’s sub-adviser’s opinion, temporary imbalances of supply and demand or other temporary dislocations in the tax-exempt bond market adversely affect the price at which municipal obligations are available), the Fund may invest up to 100% of its net assets in cash or cash equivalents, short-term investments or municipal bonds and deviate from its investment policies including the Fund’s 80% names rule policy. Also, during these periods, the Fund may not achieve its investment objectives.
| 199 |
Shareholder Update (continued)
NUVEEN PENNSYLVANIA QUALITY MUNICIPAL FUND (NQP)
Investment Objectives
The Fund’s investment objectives are to provide current income exempt from regular federal and Pennsylvania income taxes, and to enhance portfolio value relative to the Pennsylvania municipal bond market by investing in tax-exempt Pennsylvania municipal bonds that the Fund’s investment adviser believes are underrated or undervalued or that represent municipal market sectors that are undervalued.
Investment Policies
As a fundamental policy, under normal circumstances, the Fund will invest at least 80% of its Assets (as defined below) in municipal securities and other related investments that pay interest exempt from regular federal and Pennsylvania income taxes.
“Assets” mean the net assets of the Fund plus the amount of any borrowings for investment purposes. “Managed Assets” mean the total assets of the Fund, minus the sum of its accrued liabilities (other than Fund liabilities incurred for the express purpose of creating leverage). Total assets for this purpose shall include assets attributable to the Fund’s use of leverage (whether or not those assets are reflected in the Fund’s financial statements for purposes of generally accepted accounting principles), and derivatives will be valued at their market value.
Under normal circumstances:
| • | The Fund will invest at least 80% of its Managed Assets in municipal securities that, at the time of investment, are rated within the four highest grades (Baa or BBB or better) by at least one nationally recognized statistical rating organization (“NRSRO”) or are unrated but judged to be of comparable quality by the Fund’s sub-adviser. |
| • | The Fund may invest up to 20% of its Managed Assets in municipal securities that at the time of investment are rated below investment grade or are unrated but judged to be of comparable quality by the Fund’s sub-adviser. |
| • | No more than 10% of the Fund’s Managed Assets may be invested in municipal securities rated below B3/B- or that are unrated but judged to be of comparable quality by the Fund’s sub-adviser. |
| • | The Fund may invest up to 20% of its Managed Assets in municipal securities that pay interest that is taxable under the federal alternative minimum tax applicable to individuals. |
| • | The Fund may not enter into a futures contract or related options or forward contracts if more than 30% of the Fund’s Managed Assets would be represented by futures contracts or more than 5% of the Fund’s Managed Assets would be committed to initial margin deposits and premiums on futures contracts or related options. |
| • | The Fund will generally maintain an investment portfolio with an overall weighted average maturity of greater than 10 years. |
The foregoing policies apply only at the time of any new investment.
Approving Changes in Investment Policies
The Board of Trustees of the Fund may change the policies described above without a shareholder vote. However, the Fund’s (i) investment objectives (ii) policy of investing at least 80% of its Assets in municipal securities and other related investments that pay interest exempt from regular federal and Pennsylvania income taxes and (iii) policy (as described below) that it may not borrow money, except from banks for temporary or emergency purposes, or to repurchase its shares, subject to certain restrictions, may not be changed without the approval of the holders of a majority of the outstanding common shares and preferred shares voting together as a single class, and the approval of the holders of a majority of the outstanding preferred shares, voting separately as a single class. A “majority of the outstanding” shares means (i) 67% or more of the shares present at a meeting, if the holders of more than 50% of the shares are present or represented by proxy or (ii) more than 50% of the shares, whichever is less.
Portfolio Contents
The Fund generally invests in municipal securities. Municipal securities include municipal bonds, notes, securities issued to finance and refinance public projects, certificates of participation, variable rate demand obligations, lease obligations, municipal notes, pre-refunded municipal bonds, private activity bonds, securities issued by tender option bond trusts (“TOB trusts”), including inverse floating rate securities, and other forms of municipal bonds and securities, and other related instruments that create exposure to municipal bonds, notes and securities that provide for the payment of interest income that is exempt from regular U.S. federal income tax and Pennsylvania personal income taxes.
Municipal securities are debt obligations generally issued by states, cities and local authorities and certain possessions and territories of the United States (such as Puerto Rico and Guam) to finance or refinance public purpose projects such as roads, schools, and water supply systems.
The Fund may also invest in AMT Bonds. AMT Bonds may trigger adverse tax consequences for Fund shareholders who are subject to the federal alternative minimum tax.
| 200 |
The municipal securities in which the Fund invests are generally issued by the Commonwealth of Pennsylvania (the “Commonwealth”), a municipality in Pennsylvania, or a political subdivision or agency or instrumentality of such state or municipality, and pay interest that, in the opinion of bond counsel to the issuer (or on the basis of other authority believed by the Fund’s investment adviser to be reliable), is exempt from both regular federal income taxes and Pennsylvania personal income tax, although the interest may be subject to the federal alternative minimum tax.
The Fund may invest in municipal securities that represent lease obligations and certificates of participation in such leases. A municipal lease is an obligation in the form of a lease or installment purchase that is issued by a state or local government to acquire equipment and facilities. Income from such obligations generally is exempt from state and local taxes in the state of issuance. A certificate of participation represents an undivided interest in an unmanaged pool of municipal leases, an installment purchase agreement or other instruments. The certificates typically are issued by a municipal agency, a trust or other entity that has received an assignment of the payments to be made by the state or political subdivision under such leases or installment purchase agreements. Such certificates provide the Fund with the right to a pro rata undivided interest in the underlying municipal securities. In addition, such participations generally provide the Fund with the right to demand payment, on not more than seven days’ notice, of all or any part of the Fund’s participation interest in the underlying municipal securities, plus accrued interest.
The Fund may invest in municipal notes. Municipal securities in the form of notes generally are used to provide for short-term capital needs, in anticipation of an issuer’s receipt of other revenues or financing, and typically have maturities of up to three years. Such instruments may include tax anticipation notes, revenue anticipation notes, bond anticipation notes, tax and revenue anticipation notes and construction loan notes. Tax anticipation notes are issued to finance the working capital needs of governments. Generally, they are issued in anticipation of various tax revenues, such as income, sales, property, use and business taxes, and are payable from these specific future taxes. Revenue anticipation notes are issued in expectation of receipt of other kinds of revenue, such as federal revenues available under federal revenue sharing programs. Bond anticipation notes are issued to provide interim financing until long-term bond financing can be arranged. In most cases, the long-term bonds then provide the funds needed for repayment of the bond anticipation notes. Tax and revenue anticipation notes combine the funding sources of both tax anticipation notes and revenue anticipation notes. Construction loan notes are sold to provide construction financing. Mortgage notes insured by the Federal Housing Authority secure these notes; however, the proceeds from the insurance may be less than the economic equivalent of the payment of principal and interest on the mortgage note if there has been a default. The anticipated revenues from taxes, grants or bond financing generally secure the obligations of an issuer of municipal notes.
The Fund may invest in “tobacco settlement bonds.” Tobacco settlement bonds are municipal securities that are secured or payable solely from the collateralization of the proceeds from class action or other litigation against the tobacco industry.
The Fund may invest in pre-refunded municipal securities. The principal of and interest on pre-refunded municipal securities are no longer paid from the original revenue source for the securities. Instead, the source of such payments is typically an escrow fund consisting of U.S. government securities. The assets in the escrow fund are derived from the proceeds of refunding bonds issued by the same issuer as the pre-refunded municipal securities. Issuers of municipal securities use this advance refunding technique to obtain more favorable terms with respect to securities that are not yet subject to call or redemption by the issuer. For example, advance refunding enables an issuer to refinance debt at lower market interest rates, restructure debt to improve cash flow or eliminate restrictive covenants in the indenture or other governing instrument for the pre-refunded municipal securities. However, except for a change in the revenue source from which principal and interest payments are made, the pre-refunded municipal securities remain outstanding on their original terms until they mature or are redeemed by the issuer.
The Fund may invest in private activity bonds. Private activity bonds are issued by or on behalf of public authorities to obtain funds to provide privately operated housing facilities, airport, mass transit or port facilities, sewage disposal, solid waste disposal or hazardous waste treatment or disposal facilities and certain local facilities for water supply, gas or electricity. Other types of private activity bonds, the proceeds of which are used for the construction, equipment, repair or improvement of privately operated industrial or commercial facilities, may constitute municipal securities, although the current federal tax laws place substantial limitations on the size of such issues.
The Fund may invest in inverse floating rate securities issued by a TOB trust, the interest rate on which varies inversely with the Securities Industry Financial Markets Association short-term rate, which resets weekly, or a similar short-term rate, and is reduced by the expenses related to the TOB trust. Typically, inverse floating rate securities represent beneficial interests in a special purpose trust (sometimes called a TOB trust) formed by a third party sponsor for the purpose of holding municipal bonds. Inverse floating rate securities may increase or decrease in value at a greater rate than the underlying interest rate on the municipal bond held by the TOB trust, which effectively leverages the Fund’s investment.
The Fund may invest in floating rate securities issued by special purpose trusts. Floating rate securities may take the form of short-term floating rate securities or the option period may be substantially longer. Generally, the interest rate earned will be based upon the market rates for municipal securities with maturities or remarketing provisions that are comparable in duration to the periodic interval of the tender option, which may vary from weekly, to monthly, to extended periods of one year or multiple years. Since the option feature has a shorter term than the final maturity or first call date of the underlying bond deposited in the trust, the Fund as the holder of the floating rate security relies upon the terms of the agreement with the financial institution furnishing the option as well as the credit strength of that institution. As further assurance of liquidity, the terms of the trust provide for a liquidation of the municipal security deposited in the trust and the application of the proceeds to pay off the floating rate security. The trusts that are organized to issue both short-term floating rate securities and inverse floaters generally include liquidation triggers to protect the investor in the floating rate security.
The Fund may invest in municipal securities issued by special taxing districts. Special taxing districts are organized to plan and finance infrastructure developments to induce residential, commercial and industrial growth and redevelopment. The bond financing methods such as tax increment finance, tax assessment, special services district and Mello-Roos bonds, are generally payable solely from taxes or other revenues attributable to the specific projects financed by the bonds without recourse to the credit or taxing power of related or overlapping municipalities.
The Fund may invest in zero coupon bonds. A zero coupon bond is a bond that typically does not pay interest for the entire life of the obligation or for an initial period after the issuance of the obligation.
201
Shareholder Update (continued)
The Fund may buy and sell securities on a when-issued or delayed delivery basis, making payment or taking delivery at a later date, normally within 15 to 45 days of the trade date.
The Fund may utilize structured notes and similar instruments for investment purposes and also for hedging purposes. Structured notes are privately negotiated debt obligations where the principal and/or interest is determined by reference to the performance of a benchmark asset, market or interest rate (an “embedded index”), such as selected securities, an index of securities or specified interest rates, or the differential performance of two assets or markets.
The Fund may invest in illiquid securities (i.e., securities that are not readily marketable), including, but not limited to, restricted securities (securities the disposition of which is restricted under the federal securities laws), securities that may be resold only pursuant to Rule 144A under the Securities Act of 1933, as amended (the “1933 Act”), and repurchase agreements with maturities in excess of seven days. Illiquid securities may also include securities legally restricted as to resale, such as securities issued pursuant to Section 4(a)(2) of the 1933 Act.
The Fund may enter into certain derivative instruments in pursuit of its investment objectives, including to seek to enhance return, to hedge certain risks of its investments in municipal securities or as a substitute for a position in the underlying asset. Such instruments include financial futures contracts, swap contracts (including interest rate swaps, credit default swaps and municipal market data rate locks (“MMD Rate Locks”)), options on financial futures, options on swap contracts or other derivative instruments.
The Fund may purchase and sell MMD Rate Locks. An MMD Rate Lock permits the Fund to lock in a specified municipal interest rate for a portion of its portfolio to preserve a return on a particular investment or a portion of its portfolio as a duration management technique or to protect against any increase in the price of securities to be purchased at a later date. By using an MMD Rate Lock, the Fund can create a synthetic long or short position, allowing the Fund to select what the manager believes is an attractive part of the yield curve. The Fund will ordinarily use these transactions as a hedge or for duration or risk management although it is permitted to enter into them to enhance income or gain or to increase the Fund’s yield, for example, during periods of steep interest rate yield curves (i.e., wide differences between short-term and long term interest rates).
The Fund may also invest in securities of other open- or closed-end investment companies (including exchange-traded funds (“ETFs”)) that invest primarily in municipal securities of the types in which the Fund may invest directly, to the extent permitted by the Investment Company Act of 1940, as amended (the “1940 Act”), the rules and regulations issued thereunder and applicable exemptive orders issued by the Securities and Exchange Commission (“SEC”).
The Fund may invest in distressed securities but may not invest in the securities of an issuer which, at the time of investment, is in default on its obligations to pay principal or interest thereon when due or that is involved in a bankruptcy proceeding (i.e., rated below C-, at the time of investment); provided, however, that the Fund’s sub-adviser may determine that it is in the best interest of shareholders in pursuing a workout arrangement with issuers of defaulted securities to make loans to the defaulted issuer or another party, or purchase a debt, equity or other interest from the defaulted issuer or another party, or take other related or similar steps involving the investment of additional monies, but only if that issuer’s securities are already held by the Fund.
Use of Leverage
The Fund uses leverage to pursue its investment objectives. The Fund may source leverage through the issuance of “senior securities” as defined under the 1940 Act, which include the issuance of preferred shares of beneficial interest (“Preferred Shares”) and borrowings, except that the Fund may not issue debt securities. However, the Fund’s use of borrowings (which may include reverse repurchase agreements) for leverage is limited by certain fundamental investment restrictions. Additionally, the Fund may use certain derivatives and other financing instruments that have the economic effect of leverage by creating additional investment exposures, such as investments in inverse floating rate securities. The amount and sources of leverage will vary depending on market conditions.
Temporary Defensive Periods
During temporary defensive periods (e.g., times when, in the Fund’s investment adviser’s and/or the Fund’s sub-adviser’s opinion, temporary imbalances of supply and demand or other temporary dislocations in the tax-exempt bond market adversely affect the price at which long-term or intermediate-term municipal securities are available), the Fund may invest up to 100% of its net assets in cash or cash equivalents, short-term investments or municipal bonds and deviate from its investment policies including the Fund’s 80% names rule policy. Also, during these periods, the Fund may not achieve its investment objectives.
| 202 |
PRINCIPAL RISKS OF THE FUNDS
The factors that are most likely to have a material effect on a particular Fund’s portfolio as a whole are called “principal risks.” Each Fund is subject to the principal risks indicated below, whether through direct investment or derivative positions. Each Fund may be subject to additional risks other than those identified and described below because the types of investments made by a Fund can change over time.
| Risk | NAZ | NKX | NCA | NAC | NXJ | NRK | NNY | NAN | NQP | |||||||||
| Portfolio Level Risks |
||||||||||||||||||
| Alternative Minimum Tax Risk |
X | - | X | X | X | - | X | X | X | |||||||||
| Below Investment Grade Risk |
X | X | X | X | X | X | X | X | X | |||||||||
| Call Risk |
X | X | X | X | X | X | X | X | X | |||||||||
| Credit Risk |
X | X | X | X | X | X | X | X | X | |||||||||
| Credit Spread Risk |
X | X | X | X | X | X | X | X | X | |||||||||
| Deflation Risk |
X | X | X | X | X | X | X | X | X | |||||||||
| Derivatives Risk |
X | X | X | X | X | X | X | X | X | |||||||||
| Distressed or Defaulted Securities Risk |
X | X | X | X | X | X | X | X | X | |||||||||
| Duration Risk |
X | X | X | X | X | X | X | X | X | |||||||||
| Economic Sector Risk |
X | X | X | X | X | X | X | X | X | |||||||||
| Floating and Variable Rate Securities Risk |
X | X | X | X | X | X | X | X | X | |||||||||
| Financial Futures and Options Transactions Risk |
X | X | X | X | X | X | X | X | X | |||||||||
| Hedging Risk |
X | X | X | X | X | X | X | X | X | |||||||||
| Income Risk |
X | X | X | X | X | X | X | X | X | |||||||||
| Inflation Risk |
X | X | X | X | X | X | X | X | X | |||||||||
| Insurance Risk |
X | X | X | X | X | X | X | X | X | |||||||||
| Interest Rate Risk |
X | X | X | X | X | X | X | X | X | |||||||||
| Inverse Floating Rate Securities Risk |
X | X | X | X | X | X | X | X | X | |||||||||
| Municipal Securities Risk |
X | X | X | X | X | X | X | X | X | |||||||||
| Municipal Securities Market Liquidity Risk |
X | X | X | X | X | X | X | X | X | |||||||||
| Municipal Securities Market Risk |
X | X | X | X | X | X | X | X | X | |||||||||
| Other Investment Companies Risk |
X | X | X | X | X | X | X | X | X | |||||||||
| Puerto Rico Municipal Securities Market Risk |
X | X | X | X | X | X | X | X | X | |||||||||
| Reinvestment Risk |
X | X | X | X | X | X | X | X | X | |||||||||
| Restricted and Illiquid Investments Risk |
X | X | X | X | X | X | X | X | X | |||||||||
| Special Considerations Related to Single State Concentration Risk | X | X | X | X | X | X | X | X | X | |||||||||
| Special Risks Related to Certain Municipal Obligations |
X | X | X | X | X | X | X | X | X | |||||||||
| Structured Products Risk |
X | X | X | X | X | X | X | X | X | |||||||||
| Swap Transactions Risk |
X | X | X | X | X | X | X | X | X | |||||||||
| Tax Risk |
X | X | X | X | X | X | X | X | X | |||||||||
| Taxability Risk |
X | X | X | X | X | X | X | X | X | |||||||||
| Tobacco Settlement Bond Risk |
X | X | X | X | X | X | X | X | X | |||||||||
| Unrated Securities Risk |
X | X | X | X | X | X | X | X | X | |||||||||
| Valuation Risk |
X | X | X | X | X | X | X | X | X | |||||||||
| When-Issued and Delayed-Delivery Transactions Risks |
X | X | X | X | X | X | X | X | X | |||||||||
| Zero Coupon Bonds Risk or Pay-In-Kind Securities Risk |
X | X | X | X | X | X | X | X | X | |||||||||
203
Shareholder Update (continued)
| Risk | NAZ | NKX | NCA | NAC | NXJ | NRK | NNY | NAN | NQP | |||||||||
| Fund Level and Other Risks |
||||||||||||||||||
| Anti-Takeover Provisions Risk |
X | X | X | X | X | X | X | X | X | |||||||||
| Counterparty Risk |
X | X | X | X | X | X | X | X | X | |||||||||
| Cybersecurity Risk |
X | X | X | X | X | X | X | X | X | |||||||||
| Economic and Political Events Risk |
X | X | X | X | X | X | X | X | X | |||||||||
| Fund Tax Risk |
X | X | X | X | X | X | X | X | X | |||||||||
| Global Economic Risk |
X | X | X | X | X | X | X | X | X | |||||||||
| Investment and Market Risk |
X | X | X | X | X | X | X | X | X | |||||||||
| Legislation and Regulatory Risk |
X | X | X | X | X | X | X | X | X | |||||||||
| Leverage Risk |
X | X | - | X | X | X | - | X | X | |||||||||
| Market Discount from Net Asset Value |
X | X | X | X | X | X | X | X | X | |||||||||
| Recent Market Conditions |
X | X | X | X | X | X | X | X | X | |||||||||
| Reverse Repurchase Agreement Risk |
X | X | X | X | X | X | X | X | X | |||||||||
| 204 |
Portfolio Level Risks:
Alternative Minimum Tax Risk. As a result of the Fund’s investments in AMT Bonds, a portion of the Fund’s otherwise exempt-interest dividends may be taxable to those shareholders subject to the federal alternative minimum tax.
Below Investment Grade Risk. Municipal securities of below investment grade quality are regarded as having speculative characteristics with respect to the issuer’s capacity to pay dividends or interest and repay principal, and may be subject to higher price volatility and default risk than investment grade municipal securities of comparable terms and duration. Issuers of lower grade municipal securities may be highly leveraged and may not have available to them more traditional methods of financing. The prices of these lower grade securities are typically more sensitive to negative developments, such as a decline in the issuer’s revenues or a general economic downturn. The secondary market for lower rated municipal securities may not be as liquid as the secondary market for more highly rated municipal securities, a factor which may have an adverse effect on the Fund’s ability to dispose of a particular municipal security. If a below investment grade municipal security goes into default, or its issuer enters bankruptcy, it might be difficult to sell that security in a timely manner at a reasonable price.
Call Risk. The Fund may invest in municipal securities that are subject to call risk. Such municipal securities may be redeemed at the option of the issuer, or “called,” before their stated maturity or redemption date. In general, an issuer will call its instruments if they can be refinanced by issuing new instruments that bear a lower interest rate. The Fund is subject to the possibility that during periods of falling interest rates, an issuer will call its high yielding municipal securities. The Fund would then be forced to invest the unanticipated proceeds at lower interest rates, resulting in a decline in the Fund’s income.
Credit Risk. Issuers of municipal securities in which the Fund may invest may default on their obligations, including to pay principal or interest when due. This non-payment would result in a reduction of income to the Fund, a reduction in the value of a municipal security experiencing non-payment and potentially a decrease in the net asset value (“NAV”) of the Fund. To the extent that the credit rating assigned to a municipal security in the Fund’s portfolio is downgraded, the market price and liquidity of such security may be adversely affected.
Credit Spread Risk. Credit spread risk is the risk that credit spreads (i.e., the difference in yield between securities that is due to differences in their credit quality) may increase when the market believes that municipal securities generally have a greater risk of default. Increasing credit spreads may reduce the market values of the Fund’s securities. Credit spreads often increase more for lower rated and unrated securities than for investment grade securities. In addition, when credit spreads increase, reductions in market value will generally be greater for longer-maturity securities.
Deflation Risk. Deflation risk is the risk that prices throughout the economy decline over time. Deflation may have an adverse effect on the creditworthiness of issuers and may make issuer default more likely, which may result in a decline in the value of the Fund’s portfolio.
Derivatives Risk. The use of derivatives involves additional risks and transaction costs which could leave the Fund in a worse position than if it had not used these instruments. Derivative instruments can be used to acquire or to transfer the risk and returns of a municipal security or other asset without buying or selling the municipal security or asset. These instruments may entail investment exposures that are greater than their cost would suggest. As a result, a small investment in derivatives can result in losses that greatly exceed the original investment. Derivatives can be highly volatile, illiquid and difficult to value. An over-the-counter derivative transaction between the Fund and a counterparty that is not cleared through a central counterparty also involves the risk that a loss may be sustained as a result of the failure of the counterparty to the contract to make required payments. The payment obligation for a cleared derivative transaction is guaranteed by a central counterparty, which exposes the Fund to the creditworthiness of the central counterparty. The use of certain derivatives involves leverage, which can cause the Fund’s portfolio to be more volatile than if the portfolio had not been leveraged. Leverage can significantly magnify the effect of price movements of the reference asset, disproportionately increasing the Fund’s losses and reducing the Fund’s opportunities for gains when the reference asset changes in unexpected ways. In some instances, such leverage could result in losses that exceed the original amount invested.
It is possible that regulatory or other developments in the derivatives market, including changes in government regulation, could adversely impact the Fund’s ability to invest in certain derivatives or successfully use derivative instruments.
Distressed or Defaulted Securities Risk. Investments in “distressed” securities, meaning those whose issuers are experiencing financial difficulties or distress at the time the security is acquired, present a substantial risk of future default. In the event distressed securities become defaulted securities or the Fund otherwise holds defaulted securities, the Fund may incur losses, including additional expenses, to the extent it is required to seek recovery upon a default in the payment of principal or interest on those investments. In any reorganization or liquidation proceeding relating to a portfolio investment, the Fund may lose its entire investment or may be required to accept cash or securities with a value less than its original investment. Defaulted or distressed securities may be subject to restrictions on resale.
Duration Risk. Duration is the sensitivity, expressed in years, of the price of a fixed-income security to changes in the general level of interest rates (or yields). Securities with longer durations tend to be more sensitive to interest rate (or yield) changes, which typically corresponds to increased volatility and risk, than securities with shorter durations. For example, if a security or portfolio has a duration of three years and interest rates increase by 1%, then the security or portfolio would decline in value by approximately 3%. Duration differs from maturity in that it considers potential changes to interest rates, and a security’s coupon payments, yield, price and par value and call features, in addition to the amount of time until the security matures. The duration of a security will be expected to change over time with changes in market factors and time to maturity.
Economic Sector Risk. The Fund may invest a significant amount of its total assets in municipal securities in the same economic sector. This may make the Fund more susceptible to adverse economic, political or regulatory occurrences affecting an economic sector, making the Fund more vulnerable to unfavorable developments in that sector than funds that invest more broadly. As the percentage of the Fund’s Managed Assets invested in a particular sector increases, so does the potential for fluctuation in the value of the Fund’s assets. In addition, the Fund may invest a significant portion of its assets in certain sectors of the municipal securities market, such as health care facilities, private educational facilities, special taxing districts and start-up utility districts, and private activity bonds including industrial development bonds on behalf of transportation companies, whose
| 205 |
Shareholder Update (continued)
credit quality and performance may be more susceptible to economic, business, political, regulatory and other developments than other sectors of municipal issuers. If the Fund invests a significant portion of its assets in one or more particular sectors, the Fund’s performance may be subject to additional risk and variability.
Floating and Variable Rate Securities Risk. Floating and variable rate securities provide for adjustment in the interest rate paid on the obligations. The terms of such obligations typically provide that interest rates are adjusted based upon an interest or market rate adjustment as provided in the respective obligations. The adjustment intervals may be regular, and range from daily up to annually, or may be event-based, such as based on a change in the prime rate. Because of the interest rate adjustment feature, floating and variable rate securities provide an investor with a certain degree of protection against rises in interest rates, although the investor will participate in any declines in interest rates as well. Generally, changes in interest rates will have a smaller effect on the market value of floating and variable rate securities than on the market value of comparable fixed-income obligations. Thus, investing in floating and variable rate securities generally allows less opportunity for capital appreciation and depreciation than investing in comparable fixed-income securities. Floating and variable rate securities may be subject to greater liquidity risk than other debt securities, meaning that there may be limitations on the Fund’s ability to sell the securities at any given time. Such securities also may lose value.
Financial Futures and Options Transactions Risk. The Fund may use certain transactions for hedging the portfolio’s exposure to credit risk and the risk of increases in interest rates, which could result in poorer overall performance for the Fund. There may be an imperfect correlation between price movements of the futures and options and price movements of the portfolio securities being hedged.
If the Fund engages in futures transactions or in the writing of options on futures, it will be required to maintain initial margin and maintenance margin and may be required to make daily variation margin payments in accordance with applicable rules of the exchanges and the Commodity Futures Trading Commission (“CFTC”). If the Fund purchases a financial futures contract or a call option or writes a put option in order to hedge the anticipated purchase of municipal securities, and if the Fund fails to complete the anticipated purchase transaction, the Fund may have a loss or a gain on the futures or options transaction that will not be offset by price movements in the municipal securities that were the subject of the anticipatory hedge. There can be no assurance that a liquid market will exist at a time when the Fund seeks to close out a derivatives or futures or a futures option position, and the Fund would remain obligated to meet margin requirements until the position is closed.
Hedging Risk. The Fund’s use of derivatives or other transactions to reduce risk involves costs and will be subject to the investment adviser’s and/or the sub-adviser’s ability to predict correctly changes in the relationships of such hedge instruments to the Fund’s portfolio holdings or other factors. No assurance can be given that the investment adviser’s and/or the sub-adviser’s judgment in this respect will be correct, and no assurance can be given that the Fund will enter into hedging or other transactions at times or under circumstances in which it may be advisable to do so. Hedging activities may reduce the Fund’s opportunities for gain by offsetting the positive effects of favorable price movements and may result in net losses.
Income Risk. The Fund’s level of current income could decline due to falling market interest rates. This is because, in a falling interest rate environment, the Fund generally will have to invest the proceeds from maturing portfolio securities in lower-yielding securities.
Inflation Risk. Inflation risk is the risk that the value of assets or income from investments will be worth less in the future as inflation decreases the value of money. As inflation increases, the real value of the common shares and distributions can decline. Currently, inflation rates are elevated relative to normal market conditions and could increase.
Insurance Risk. The Fund may purchase municipal securities that are secured by insurance, bank credit agreements or escrow accounts. The credit quality of the companies that provide such credit enhancements will affect the value of those securities. Certain significant providers of insurance for municipal securities have incurred significant losses as a result of exposure to sub-prime mortgages and other lower credit quality investments. As a result, such losses reduced the insurers’ capital and called into question their continued ability to perform their obligations under such insurance if they are called upon to do so in the future. While an insured municipal security will typically be deemed to have the rating of its insurer, if the insurer of a municipal security suffers a downgrade in its credit rating or the market discounts the value of the insurance provided by the insurer, the value of the municipal security would more closely, if not entirely, reflect such rating. In such a case, the value of insurance associated with a municipal security may not add any value. The insurance feature of a municipal security does not guarantee the full payment of principal and interest through the life of an insured obligation, the market value of the insured obligation or the NAV of the common shares represented by such insured obligation.
Interest Rate Risk. Interest rate risk is the risk that municipal securities in the Fund’s portfolio will decline in value because of changes in market interest rates. Generally, when market interest rates rise, the market value of such securities will fall, and vice versa. As interest rates decline, issuers of municipal securities may prepay principal earlier than scheduled, forcing the Fund to reinvest in lower-yielding securities and potentially reducing the Fund’s income. As interest rates increase, slower than expected principal payments may extend the average life of municipal securities, potentially locking in a below-market interest rate and reducing the Fund’s value. In typical market interest rate environments, the prices of longer- term municipal securities generally fluctuate more than prices of shorter-term municipal securities as interest rates change. If the Fund invests in floating rate securities, the market value of such securities may fall in a declining interest rate environment and may also fall in a rising interest rate environment if there is a lag between the rise in interest rates and the reset. A secondary risk associated with declining interest rates is the risk that income earned by the Fund on floating rate securities may decline due to lower coupon payments on floating-rate securities.
Inverse Floating Rate Securities Risk. In general, income on inverse floating rate securities will decrease when short-term interest rates increase and increase when short-term interest rates decrease. Investments in inverse floating rate securities may subject the Fund to the risks of reduced or eliminated interest payments and losses of principal. In addition, inverse floating rate securities may increase or decrease in value at a greater rate than the underlying interest rate, which effectively leverages the Fund’s investment. As a result, the market value of such securities generally will be more volatile than that of fixed rate securities.
The Fund may invest in inverse floating rate securities issued by special purpose trusts that have recourse to the Fund. In such instances, the Fund may be at risk of loss that exceeds its investment in the inverse floating rate securities.
| 206 |
The Fund may be required to sell its inverse floating rate securities at less than favorable prices, or liquidate other Fund portfolio holdings in certain circumstances, including, but not limited to, the following:
| • | If the Fund has a need for cash and the securities in a special purpose trust are not actively trading due to adverse market conditions; |
| • | If special purpose trust sponsors (as a collective group or individually) experience financial hardship and consequently seek to terminate their respective outstanding special purpose trusts; and |
| • | If the value of an underlying security declines significantly and if additional collateral has not been posted by the Fund. |
Municipal Securities Risk. The values of municipal securities may be adversely affected by local political and economic conditions and developments. Adverse conditions in an industry significant to a local economy could have a correspondingly adverse effect on the financial condition of local issuers. Other factors that could affect municipal securities include a change in the local, state, or national economy, a downgrade of a state’s credit rating or the rating of authorities or political subdivisions of the state, demographic factors, ecological or environmental concerns, inability or perceived inability of a government authority to collect sufficient tax or other revenues, statutory limitations on the issuer’s ability to increase taxes, and other developments generally affecting the revenue of issuers (for example, legislation or court decisions reducing state aid to local governments or mandating additional services). This risk would be heightened to the extent that the Fund invests a substantial portion of the below-investment grade quality portion of its portfolio in the bonds of similar projects (such as those relating to the education, health care, housing, transportation, or utilities industries), in industrial development bonds, or in particular types of municipal securities (such as general obligation bonds, municipal lease obligations, private activity bonds or moral obligation bonds) that are particularly exposed to specific types of adverse economic, business or political events. The value of municipal securities may also be adversely affected by rising health care costs, increasing unfunded pension liabilities, and by the phasing out of federal programs providing financial support. In recent periods, a number of municipal issuers have defaulted on obligations, been downgraded or commenced insolvency proceedings. Financial difficulties of municipal issuers may continue or get worse. In addition, the amount of public information available about municipal bonds is generally less than for certain corporate equities or bonds, meaning that the investment performance of the Fund may be more dependent on the analytical abilities of the Fund’s sub‑adviser than funds that invest in stock or other corporate investments.
To the extent that a fund invests a significant portion of its assets in the securities of issuers located in a given state or U.S. territory, it will be disproportionally affected by political and economic conditions and developments in that state or territory and may involve greater risk than funds that invest in a larger universe of securities. In addition, economic, political or regulatory changes in that state or territory could adversely affect municipal securities issuers in that state or territory and therefore the value of a fund’s investment portfolio.
Municipal Securities Market Liquidity Risk. Inventories of municipal securities held by brokers and dealers have decreased in recent years, lessening their ability to make a market in these securities. This reduction in market making capacity has the potential to decrease the Fund’s ability to buy or sell municipal securities at attractive prices, and increase municipal security price volatility and trading costs, particularly during periods of economic or market stress. In addition, recent federal banking regulations may cause certain dealers to reduce their inventories of municipal securities, which may further decrease the Fund’s ability to buy or sell municipal securities. As a result, the Fund may be forced to accept a lower price to sell a security, to sell other securities to raise cash, or to give up an investment opportunity, any of which could have a negative effect on performance. If the Fund needed to sell large blocks of municipal securities to raise cash to meet its obligations, those sales could further reduce the municipal securities’ prices and hurt performance.
Municipal Securities Market Risk. The amount of public information available about the municipal securities in the Fund’s portfolio is generally less than that for corporate equities or bonds, and the investment performance of the Fund may therefore be more dependent on the analytical abilities of the sub-adviser than if the Fund were a stock fund or taxable bond fund. The secondary market for municipal securities, particularly below investment grade municipal securities, also tends to be less well-developed or liquid than many other securities markets, which may adversely affect the Fund’s ability to sell its municipal securities at attractive prices.
Other Investment Companies Risk. Investing in an investment company exposes the Fund to all of the risks of that investment company’s investments. The Fund, as a holder of the securities of other investment companies, will bear its pro rata portion of the other investment companies’ expenses, including advisory fees. These expenses are in addition to the direct expenses of the Fund’s own operations. As a result, the cost of investing in investment company shares may exceed the costs of investing directly in its underlying investments. In addition, securities of other investment companies may be leveraged. As a result, the Fund may be indirectly exposed to leverage through an investment in such securities and therefore magnify the Fund’s leverage risk.
With respect to ETF’s, an ETF that is based on a specific index may not be able to replicate and maintain exactly the composition and relative weighting of securities in the index. The value of an ETF based on a specific index is subject to change as the values of its respective component assets fluctuate according to market volatility. ETFs typically rely on a limited pool of authorized participants to create and redeem shares, and an active trading market for ETF shares may not develop or be maintained. The market value of shares of ETFs and closed-end funds may differ from their NAV.
Puerto Rico Municipal Securities Market Risk. To the extent that the Fund invests a significant portion of its assets in the securities issued by the Commonwealth of Puerto Rico or its political subdivisions, agencies, instrumentalities, or public corporations (collectively referred to as “Puerto Rico” or the “Commonwealth”), it will be disproportionally affected by political, social and economic conditions and developments in the Commonwealth. In addition, economic, political or regulatory changes in that territory could adversely affect the value of the Fund’s investment portfolio.
Puerto Rico currently is experiencing significant fiscal and economic challenges, including substantial debt service obligations, high levels of unemployment, underfunded public retirement systems, and persistent government budget deficits. These challenges may negatively affect the value of the Fund’s investments in Puerto Rican municipal securities. Several major ratings agencies have downgraded the general obligation debt of Puerto Rico to below investment grade and continue to maintain a negative outlook for this debt, which increases the likelihood that the rating will
| 207 |
Shareholder Update (continued)
be lowered further. In both August 2015 and January 2016, Puerto Rico defaulted on its debt by failing to make full payment due on its outstanding bonds, and there can be no assurance that Puerto Rico will be able to satisfy its future debt obligations. Further downgrades or defaults may place additional strain on the Puerto Rico economy and may negatively affect the value, liquidity, and volatility of the Fund’s investments in Puerto Rican municipal securities. Additionally, numerous issuers have entered Title III of the Puerto Rico Oversite, Management and Economic Stability Act (“PROMESA”), which is similar to bankruptcy protection, through which the Commonwealth of Puerto Rico can restructure its debt. While most of Puerto Rico’s debt has been restructured, proceedings under PROMESA remain ongoing, and it is unclear at this time how those proceedings will be resolved or what impact they will have on the value of the Fund’s investments in Puerto Rico municipal securities. There can be no assurances that these debt restructuring efforts will be effective or that Puerto Rico will be able to service debt payments following the completion of such debt restructuring. In addition, any restructurings approved by a federal court could be appealed and overturned. The mediation process and certain litigation is ongoing with respect to certain municipal securities issued by Puerto Rico and its political subdivisions, instrumentalities and authorities. It is not presently possible to predict the results of this mediation and litigation, but such outcomes will have a significant impact on bondholders of those municipal securities. Further legislation by the U.S. Congress, or actions by the oversight board established by PROMESA, or court approval of an unfavorable debt restructuring deal could have a negative impact on the marketability, liquidity or value of certain investments held by the Fund and could reduce the Fund’s performance.
These challenges and uncertainties have been exacerbated by Hurricanes Irma and Maria and the resulting natural disasters in Puerto Rico since 2017. In September 2017, Hurricanes Irma and Maria struck Puerto Rico, causing major damage across the Commonwealth, including damage to its water, power, and telecommunications infrastructure. The length of time needed to rebuild Puerto Rico’s infrastructure is unclear, but could amount to years, during which the commonwealth is likely to be in an uncertain economic state. The full extent of the natural disasters’ impact on Puerto Rico’s economy and foreign investment in Puerto Rico is difficult to estimate.
More recently, in late December 2019 and January 2020, a series of earthquakes hit Puerto Rico, including a magnitude 6.4 earthquake, the most powerful earthquake to hit the island in more than a century, causing an estimated $200 million in damage. In addition, in early 2020, as the population of Puerto Rico worked to recover from these natural disasters, the island was significantly impacted by Covid, resulting in the Commonwealth’s authorization of a $787 million relief package to fight the pandemic and its economic impacts. Any reduction in the
Commonwealth’s, revenues as a result of the pandemic could have a negative ability on the Commonwealth to meet its debt service obligations, including with respect to debt held by the Fund. Puerto Rico’s political and economic conditions could have a negative impact on the liquidity or value of Puerto Rican municipal securities, and consequently may affect the Fund’s investments and its performance if the Fund invests a significant portion of its assets in Puerto Rican municipal securities.
Reinvestment Risk. Reinvestment risk is the risk that income from the Fund’s portfolio will decline if and when the Fund invests the proceeds from matured, traded or called municipal securities at market interest rates that are below the portfolio’s current earnings rate. A decline in income could affect the common shares’ market price, NAV and/or a common shareholder’s overall returns.
Restricted and Illiquid Investments Risk. Illiquid investments are investments that are not readily marketable. These investments may include restricted investments, including Rule 144A securities, which cannot be resold to the public without an effective registration statement under the 1933 Act, or, if they are unregistered, may be sold only in a privately negotiated transaction or pursuant to an available exemption from registration. The Fund may not be able to readily dispose of such investments at prices that approximate those at which the Fund could sell such investments if they were more widely traded and, as a result of such illiquidity, the Fund may have to sell other investments or engage in borrowing transactions if necessary to raise cash to meet its obligations. Limited liquidity can also affect the market price of investments, thereby adversely affecting the Fund’s NAV and ability to make dividend distributions. The financial markets in general have in recent years experienced periods of extreme secondary market supply and demand imbalance, resulting in a loss of liquidity during which market prices were suddenly and substantially below traditional measures of intrinsic value. During such periods, some investments could be sold only at arbitrary prices and with substantial losses. Periods of such market dislocation may occur again at any time.
Special Considerations Related to Single State Concentration Risk. Because the Fund primarily invests in municipal securities from a single state, the Fund is more susceptible to political, economic or regulatory factors affecting issuers of single state municipal securities. Information regarding the financial condition of the state is ordinarily included in various public documents issued thereby, such as the official statements prepared in connection with the issuance of general obligation bonds for the state.
Additionally, the states are party to numerous legal proceedings, many of which normally occur in governmental operations. The creditworthiness of obligations issued by local issuers of the state may be unrelated to the creditworthiness of obligations issued by the state, and that there is no obligation on the part of the state to make payment on such local obligations in the event of default.
Special Risks Related to Certain Municipal Obligations. Municipal leases and certificates of participation involve special risks not normally associated with general obligations or revenue bonds. Leases and installment purchase or conditional sale contracts (which normally provide for title to the leased asset to pass eventually to the governmental issuer) have evolved as a means for governmental issuers to acquire property and equipment without meeting the constitutional and statutory requirements for the issuance of debt. The debt issuance limitations are deemed to be inapplicable because of the inclusion in many leases or contracts of “non-appropriation” clauses that relieve the governmental issuer of any obligation to make future payments under the lease or contract unless money is appropriated for such purpose by the appropriate legislative body. In addition, such leases or contracts may be subject to the temporary abatement of payments in the event that the governmental issuer is prevented from maintaining occupancy of the leased premises or utilizing the leased equipment. Although the obligations may be secured by the leased equipment or facilities, the disposition of the property in the event of non-appropriation or foreclosure might prove difficult, time consuming and costly, and may result in a delay in recovering or the failure to fully recover the Fund’s original investment. In the event of non-appropriation, the issuer would be in default and taking ownership of the assets may be a remedy available to the Fund, although the Fund does not anticipate that such a remedy would normally be pursued.
| 208 |
Certificates of participation involve the same risks as the underlying municipal leases. In addition, the Fund may be dependent upon the municipal authority issuing the certificates of participation to exercise remedies with respect to the underlying securities. Certificates of participation also entail a risk of default or bankruptcy, both of the issuer of the municipal lease and also the municipal agency issuing the certificate of participation.
Structured Products Risk. In addition to the general risks associated with investments in debt securities, holders of structured products bear risks of the underlying investments, index or reference obligation (collectively, the “reference instrument”) and are subject to counterparty, valuation and liquidity risks. The Fund may have the right to receive payments to which it is entitled only from the structured product, and generally does not have direct rights against the issuer or the entity that sold assets to the special purpose trust. While certain structured products enable the investor to acquire interests in a pool of securities without the brokerage and other expenses associated with directly holding the same securities, investors in structured products generally pay their share of the structured product’s administrative and other expenses. When investing in structured products, it is impossible to predict whether the reference instrument will rise or fall, but prices of the reference instrument (and, therefore, the prices of structured products) will be influenced by the same types of political and economic events that affect particular issuers of securities and capital markets generally. Structured products may also be less liquid, more volatile and more difficult to price than other types of securities.
Swap Transactions Risk. Like most derivative instruments, the use of swaps is a highly specialized activity that involves investment techniques and risks different from those associated with ordinary portfolio securities transactions. In addition, the use of swaps requires an understanding by the investment adviser and/or the sub-adviser of not only the referenced asset, rate or index, but also of the swap itself. If the investment adviser and/ or the sub-adviser is incorrect in its forecasts of default risks, market spreads or other applicable factors or events, the investment performance of the Fund would diminish compared with what it would have been if these techniques were not used.
Tax Risk. The value of the Fund’s investments and its NAV may be adversely affected by changes in tax rates, rules and policies. Additionally, the Fund is not a suitable investment for individual retirement accounts, for other tax exempt or tax-deferred accounts, for investors who are not sensitive to the federal income tax consequences of their investments.
Taxability Risk. The Fund will invest in municipal securities in reliance at the time of purchase on an opinion of bond counsel to the issuer that the interest paid on those securities will be excludable from gross income for regular federal income tax purposes, and the sub-adviser will not independently verify that opinion. Subsequent to the Fund’s acquisition of such a municipal security, however, the security may be determined to pay, or to have paid, taxable income. As a result, the treatment of dividends previously paid or to be paid by the Fund as “exempt-interest dividends” could be adversely affected, subjecting the Fund’s shareholders to increased federal income tax liabilities. Certain other investments made by the Fund, including derivatives transactions, may result in the receipt of taxable income or gains by the Fund.
Tobacco Settlement Bond Risk. Tobacco settlement bonds are municipal securities that are backed solely by expected revenues to be derived from lawsuits involving tobacco related deaths and illnesses which were settled between certain states and American tobacco companies. Tobacco settlement bonds are secured by an issuing state’s proportionate share in the Master Settlement Agreement, an agreement between 46 states and nearly all of the U.S. tobacco manufacturers (the “MSA”). Under the terms of the MSA, the actual amount of future settlement payments by tobacco-manufacturers is dependent on many factors, including, among other things, reduced cigarette consumption. Payments made by tobacco manufacturers could be negatively impacted if the decrease in tobacco consumption is significantly greater than the forecasted decline.
Unrated Securities Risk. Unrated securities determined by the Fund’s investment adviser to be of comparable quality to rated investments which the Fund may purchase may pay a higher dividend or interest rate than such rated investments and be subject to a greater risk of illiquidity or price changes. Less public information is typically available about unrated investments or issuers than rated investments or issuers. Some unrated securities may not have an active trading market or may be difficult to value, which means the Fund might have difficulty selling them promptly at an acceptable price. To the extent that the Fund invests in unrated securities, the Fund’s ability to achieve its investment objectives will be more dependent on the investment adviser’s credit analysis than would be the case when the Fund invests in rated securities.
Valuation Risk. The municipal securities in which the Fund invests typically are valued by a pricing service utilizing a range of market-based inputs and assumptions, including readily available market quotations obtained from broker-dealers making markets in such instruments, cash flows and transactions for comparable instruments. There is no assurance that the Fund will be able to sell a portfolio security at the price established by the pricing service, which could result in a loss to the Fund. Pricing services generally price municipal securities assuming orderly transactions of an institutional “round lot” size, but some trades may occur in smaller, “odd lot” sizes, often at lower prices than institutional round lot trades. Different pricing services may incorporate different assumptions and inputs into their valuation methodologies, potentially resulting in different values for the same securities. As a result, if the Fund were to change pricing services, or if the Fund’s pricing service were to change its valuation methodology, there could be a material impact, either positive or negative, on the Fund’s NAV.
When-Issued and Delayed-Delivery Transactions Risk. When-issued and delayed-delivery transactions may involve an element of risk because no interest accrues on the securities prior to settlement and, because securities are subject to market fluctuations, the value of the securities at time of delivery may be less (or more) than their cost. A separate account of the Fund will be established with its custodian consisting of cash equivalents or liquid securities having a market value at all times at least equal to the amount of any delayed payment commitment.
Zero Coupon Bonds Risk or Pay-In-Kind Securities Risk. Zero Coupon and pay-in-kind securities may be subject to greater fluctuation in value and less liquidity in the event of adverse market conditions than comparably rated securities paying cash interest at regular interest payment periods. Prices on non-cash-paying instruments may be more sensitive to changes in the issuer’s financial condition, fluctuation in interest rates and market demand/ supply imbalances than cash-paying securities with similar credit ratings, and thus may be more speculative.
| 209 |
Shareholder Update (continued)
Fund Level and Other Risks:
Anti-Takeover Provisions. The Declaration of Trust and the Fund’s by-laws include provisions that could limit the ability of other entities or persons to acquire control of the Fund or convert the Fund to open-end status. These provisions could have the effect of depriving the Common Shareholders of opportunities to sell their Common Shares at a premium over the then-current market price of the Common Shares.
Counterparty Risk. Changes in the credit quality of the companies that serve as the Fund’s counterparties with respect to derivatives or other transactions supported by another party’s credit will affect the value of those instruments. Certain entities that have served as counterparties in the markets for these transactions have incurred or may incur in the future significant financial hardships including bankruptcy and losses as a result of exposure to sub-prime mortgages and other lower-quality credit investments. As a result, such hardships have reduced these entities’ capital and called into question their continued ability to perform their obligations under such transactions. By using such derivatives or other transactions, the Fund assumes the risk that its counterparties could experience similar financial hardships. In the event of the insolvency of a counterparty, the Fund may sustain losses or be unable to liquidate a derivatives position.
Cybersecurity Risk. The Fund and its service providers are susceptible to operational and information security risk resulting from cyber incidents. Cyber incidents refer to both intentional attacks and unintentional events including: processing errors, human errors, technical errors including computer glitches and system malfunctions, inadequate or failed internal or external processes, market-wide technical-related disruptions, unauthorized access to digital systems (through “hacking” or malicious software coding), computer viruses, and cyber-attacks which shut down, disable, slow or otherwise disrupt operations, business processes or website access or functionality (including denial of service attacks). Cyber incidents could adversely impact the Fund and cause the Fund to incur financial loss and expense, as well as face exposure to regulatory penalties, reputational damage, and additional compliance costs associated with corrective measures. In addition, substantial costs may be incurred in order to prevent any cyber incidents in the future. Furthermore, the Fund cannot control the cybersecurity plans and systems put in place by its service providers or any other third parties whose operations may affect the Fund.
Economic and Political Events Risk. The Fund may be more sensitive to adverse economic, business or political developments if it invests a substantial portion of its assets in the municipal securities of similar projects (such as those relating to the education, health care, housing, transportation, or utilities industries), industrial development bonds, or in particular types of municipal securities (such as general obligation bonds, private activity bonds or moral obligation bonds). Such developments may adversely affect a specific industry or local political and economic conditions, and thus may lead to declines in the creditworthiness and value of such municipal securities.
Fund Tax Risk. The Fund has elected to be treated and intends to qualify each year as a Regulated Investment Company (“RIC”) under the Internal Revenue Code of 1986, as amended (the “Code”). As a RIC, the Fund is not expected to be subject to U.S. federal income tax to the extent that it distributes its investment company taxable income and net capital gains. To qualify for the special tax treatment available to a RIC, the Fund must comply with certain investment, distribution, and diversification requirements. Under certain circumstances, the Fund may be forced to sell certain assets when it is not advantageous in order to meet these requirements, which may reduce the Fund’s overall return. If the Fund fails to meet any of these requirements, subject to the opportunity to cure such failures under applicable provisions of the Code, the Fund’s income would be subject to a double level of U.S. federal income tax. The Fund’s income, including its net capital gain, would first be subject to U.S. federal income tax at regular corporate rates, even if such income were distributed to shareholders and, second, all distributions by the Fund from earnings and profits, including distributions of net capital gain (if any), would be taxable to shareholders as dividends.
Global Economic Risk. National and regional economies and financial markets are becoming increasingly interconnected, which increases the possibilities that conditions in one country, region or market might adversely impact issuers in a different country, region or market. Changes in legal, political, regulatory, tax and economic conditions may cause fluctuations in markets and asset prices around the world, which could negatively impact the value of the Fund’s investments. Major economic or political disruptions, particularly in large economies, may have global negative economic and market repercussions. Additionally, instability in various countries, war, natural and environmental disasters, the spread of infectious illnesses or other public health emergencies, terrorist attacks in the United States and around the world, growing social and political discord in the United States, debt crises, the response of the international community—through economic sanctions and otherwise—to international events, further downgrade of U.S. government securities, changes in the U.S. president or political shifts in Congress, trade disputes and other similar events may adversely affect the global economy and the markets and issuers in which the Fund invests. These events could reduce consumer demand or economic output, result in market closure, travel restrictions or quarantines, and generally have a significant impact on the global economy. These events could also impair the information technology and other operational systems upon which the Fund’s service providers, including the Fund’s sub-adviser, rely, and could otherwise disrupt the ability of employees of the Fund’s service providers to perform essential tasks on behalf of the Fund.
The Fund does not know and cannot predict how long the securities markets may be affected by these events, and the future impact of these and similar events on the global economy and securities markets is uncertain. The Fund may be adversely affected by abrogation of international agreements and national laws which have created the market instruments in which the Fund may invest, failure of the designated national and international authorities to enforce compliance with the same laws and agreements, failure of local, national and international organizations to carry out the duties prescribed to them under the relevant agreements, revisions of these laws and agreements which dilute their effectiveness or conflicting interpretation of provisions of the same laws and agreements.
Governmental and quasi-governmental authorities and regulators throughout the world have in the past responded to major economic disruptions with a variety of significant fiscal and monetary policy changes, including but not limited to, direct capital infusions into companies, new monetary programs and dramatically lower interest rates. An unexpected or quick reversal of these policies, or the ineffectiveness of these policies, could increase volatility in securities markets, which could adversely affect the Fund’s investments.
| 210 |
Investment and Market Risk. An investment in common shares is subject to investment risk, including the possible loss of the entire principal amount that you invest. Common shares frequently trade at a discount to their NAV. An investment in common shares represents an indirect investment in the securities owned by the Fund. Common shares at any point in time may be worth less than your original investment, even after taking into account the reinvestment of Fund dividends and distributions.
Legislation and Regulatory Risk. At any time after the date of this report, legislation or additional regulations may be enacted that could negatively affect the assets of the Fund, securities held by the Fund or the issuers of such securities. Fund shareholders may incur increased costs resulting from such legislation or additional regulation. There can be no assurance that future legislation, regulation or deregulation will not have a material adverse effect on the Fund or will not impair the ability of the Fund to achieve its investment objectives.
Leverage Risk. The use of leverage creates special risks for common shareholders, including potential interest rate risks and the likelihood of greater volatility of NAV and market price of, and distributions on, the common shares. The use of leverage in a declining market will likely cause a greater decline in the Fund’s NAV, which may result at a greater decline of the common share price, than if the Fund were not to have used leverage.
Certain types of leverage may result in the Fund being subject to certain covenants, asset coverage or other portfolio composition limits by its lenders, debt or preferred securities purchasers, rating agencies that may rate the debt or preferred securities, or reverse repurchase counterparties. Such limitations may be more stringent than those imposed by the 1940 Act and may impact whether the Fund is able to maintain its desired amount of leverage. In addition, whenever the Fund incurs borrowings and/or preferred shares are outstanding, Common Shareholders will not be entitled to receive any cash distributions from the Fund unless all interest on such borrowings has been paid and all accumulated dividends on preferred shares have been paid, unless asset coverage (as defined in the 1940 Act) with respect to any borrowings would be at least 300% after giving effect to the distributions and asset coverage (as defined in the 1940 Act) with respect to preferred shares would be at least 200% after giving effect to the distributions.
The Fund will pay (and common shareholders will bear) any costs and expenses relating to the Fund’s use of leverage, which will result in a reduction in the Fund’s NAV. The investment adviser may, based on its assessment of market conditions and composition of the Fund’s holdings, increase or decrease the amount of leverage. Such changes may impact the Fund’s distributions and the price of the common shares in the secondary market. There is no assurance that the Fund’s use of leverage will be successful.
The Fund may seek to refinance its leverage over time, in the ordinary course, as current forms of leverage mature or it is otherwise desirable to refinance; however, the form that such leverage will take cannot be predicted at this time. If the Fund is unable to replace existing leverage on comparable terms, its costs of leverage will increase. Accordingly, there is no assurance that the use of leverage may result in a higher yield or return to common shareholders.
The amount of fees paid to the investment adviser and the sub-adviser for investment advisory services will be higher if the Fund uses leverage because the fees will be calculated based on the Fund’s Managed Assets – this may create an incentive for the investment adviser and the sub- adviser to leverage the Fund or increase the Fund’s leverage.
Market Discount from Net Asset Value. Shares of closed-end investment companies like the Fund frequently trade at prices lower than their NAV. This characteristic is a risk separate and distinct from the risk that the Fund’s NAV could decrease as a result of investment activities. Whether investors will realize gains or losses upon the sale of the common shares will depend not upon the Fund’s NAV but entirely upon whether the market price of the common shares at the time of sale is above or below the investor’s purchase price for the common shares. Furthermore, management may have difficulty meeting the Fund’s investment objectives and managing its portfolio when the underlying securities are redeemed or sold during periods of market turmoil and as investors’ perceptions regarding closed-end funds or their underlying investments change. Because the market price of the common shares will be determined by factors such as relative supply of and demand for the common shares in the market, general market and economic circumstances, and other factors beyond the control of the Fund, the Fund cannot predict whether the common shares will trade at, below or above NAV. The common shares are designed primarily for long-term investors, and you should not view the Fund as a vehicle for short-term trading purposes.
Recent Market Conditions. Periods of unusually high financial market volatility and restrictive credit conditions, at times limited to a particular sector or geographic area, have occurred in the past and may be expected to recur in the future. Some countries, including the United States, have adopted or have signaled protectionist trade measures, including the imposition of tariffs, relaxation of the financial industry regulations that followed the financial crisis, and/or reductions to corporate taxes. The scope of these policy changes is still developing, but the equity and debt markets may react strongly to expectations of change, which could increase volatility, particularly if a resulting policy runs counter to the market’s expectations. The outcome of such changes cannot be foreseen at the present time. In addition, geopolitical and other risks, including environmental and public health risks, may add to instability in the world economy and markets generally. As a result of increasingly interconnected global economies and financial markets, the value and liquidity of the Fund’s investments may be negatively affected by events impacting a country or region, regardless of whether the Fund invests in issuers located in or with significant exposure to such country or region.
Ukraine has experienced ongoing military conflict, most recently commencing in February 2022 when Russia invaded Ukraine; this conflict may expand and military attacks could occur elsewhere in Europe. Europe has also been struggling with mass migration from the Middle East and Africa. The ultimate effects of these events and other socio-political or geographical issues are not known but could profoundly affect global economies and markets. Additionally, in October 2023 armed conflict broke out between Israel and the militant group Hamas after Hamas infiltrated Israel’s southern border from the Gaza Strip. Israel has since declared war against Hamas and this conflict has escalated into a greater regional conflict. The ultimate effects of these events and other socio-political or geographical issues are not known but could profoundly affect global economies and markets.
The ongoing trade war between China and the United States, including the imposition of tariffs by each country on the other country’s products, has created a tense political environment. These actions may trigger a significant reduction in international trade, adverse effects in the supply of certain manufactured goods, substantial adverse price changes for goods and possible failure of individual companies and/or large segments of China’s export industry and U.S. importers, which could have a negative impact on the Fund’s performance. U.S. companies that source material and goods
| 211 |
Shareholder Update (continued)
from China and those that make large amounts of sales in China are particularly vulnerable to an escalation of trade tensions. Beginning in early 2025, the United States also imposed tariffs on other countries, including Mexico and Canada. The possibility of additional tariffs being imposed or the outbreak of a trade war may adversely impact U.S. and international markets. Uncertainty regarding the outcome of the trade tensions and the potential for a trade war could cause the U.S. dollar to decline further. Events such as these and their consequences are difficult to predict and it is unclear whether further tariffs may be imposed or other escalating actions may be taken in the future. Additionally, political uncertainty regarding U.S. policy, including the U.S. government’s approach to trade, may impact the markets and the Fund’s performance.
The U.S. Federal Reserve (the “Fed”) has in the past sharply raised interest rates, and has signaled an intention to maintain relatively higher interest rates until current inflation levels re-align with the Fed’s long-term inflation target. Changing interest rate environments impact the various sectors of the economy in different ways. For example, in March 2023, the Federal Deposit Insurance Corporation (“FDIC”) was appointed receiver for each of Silicon Valley Bank and Signature Bank, the second- and third-largest bank failures in U.S. history, which failures may be attributable, in part, to rising interest rates. Bank failures may have a destabilizing impact on the broader banking industry or markets generally.
The impact of these developments in the near- and long-term is unknown and could have additional adverse effects on economies, financial markets and asset valuations around the world.
Reverse Repurchase Agreement Risk. A reverse repurchase agreement, in economic essence, constitutes a securitized borrowing by the Fund from the security purchaser. The Fund may enter into reverse repurchase agreements for the purpose of creating a leveraged investment exposure and, as such, their usage involves essentially the same risks associated with a leveraging strategy generally since the proceeds from these agreements may be invested in additional portfolio securities. Reverse repurchase agreements tend to be short-term in tenor, and there can be no assurances that the purchaser (lender) will commit to extend or “roll” a given agreement upon its agreed-upon repurchase date or an alternative purchaser can be identified on similar terms. Reverse repurchase agreements also involve the risk that the purchaser fails to return the securities as agreed upon, files for bankruptcy or becomes insolvent. The Fund may be restricted from taking normal portfolio actions during such time, could be subject to loss to the extent that the proceeds of the agreement are less than the value of securities subject to the agreement and may experience adverse tax consequences.
| 212 |
EFFECTS OF LEVERAGE
The following table is furnished in response to requirements of the SEC. It is designed to illustrate the effects of leverage through the use of senior securities, as that term is defined under Section 18 of the 1940 Act, as well as certain other forms of leverage, such as reverse repurchase agreements and investments in inverse floating rate securities, on common share total return, assuming investment portfolio total returns (consisting of income and changes in the value of investments held in a Fund’s portfolio) of -10%, -5%, 0%, 5% and 10%. The table below reflects each Fund’s (i) continued use of leverage as of August 31, 2025 as a percentage of Managed Assets (including assets attributable to such leverage), (ii) the estimated annual effective interest expense rate payable by the Fund on such instruments (based on actual leverage costs incurred during the fiscal year ended August 31, 2025) as set forth in the table, and (iii) the annual return that the Fund’s portfolio must experience (net of expenses) in order to cover such costs of leverage based on such estimated annual effective interest expense rate. The information below does not reflect any Fund’s use of certain other forms of economic leverage achieved through the use of other instruments or transactions not considered to be senior securities under the 1940 Act, such as certain derivative instruments and investments in inverse floating rate securities.
The numbers are merely estimates, used for illustration. The costs of leverage may vary frequently and may be significantly higher or lower than the estimated rate. The assumed investment portfolio returns in the table below are hypothetical figures and are not necessarily indicative of the investment portfolio returns experienced or expected to be experienced by the Fund. Your actual returns may be greater or less than those appearing below.
| NAZ | NKX | NAC | NXJ | NRK | NAN | NQP | ||||||||||||||||||||||
| Estimated Leverage as a Percentage of Managed Assets (Including Assets Attributable to Leverage) |
39.62 | % | 42.86 | % | 42.88 | % | 42.78 | % | 42.97 | % | % | 42.46 | % | |||||||||||||||
| Estimated Annual Effective Leverage Expense Rate Payable by Fund on Leverage |
3.75 | % | 3.69 | % | 3.89 | % | 3.86 | % | 3.75 | % | % | 3.78 | % | |||||||||||||||
| Annual Return Fund Portfolio Must Experience (net of expenses) to Cover Estimated Annual Effective Interest Expense Rate on Leverage |
1.48 | % | 1.58 | % | 1.67 | % | 1.65 | % | 1.61 | % | % | 1.61 | % | |||||||||||||||
| Common Share Total Return for (10.00)% Assumed Portfolio Total Return |
(19.02 | )% | (20.27 | )% | (20.42 | )% | (20.36 | )% | (20.36 | )% | ( |
)% | (20.17 | )% | ||||||||||||||
| Common Share Total Return for (5.00)% Assumed Portfolio Total Return |
(10.74 | )% | (11.52 | )% | (11.67 | )% | (11.62 | )% | (11.59 | )% | ( |
)% | (11.48 | )% | ||||||||||||||
| Common Share Total Return for 0.00% Assumed Portfolio Total Return |
(2.46 | )% | (2.77 | )% | (2.92 | )% | (2.89 | )% | (2.83 | )% | ( |
)% | (2.79 | )% | ||||||||||||||
| Common Share Total Return for 5.00% Assumed Portfolio Total Return |
5.82 | % | 5.98 | % | 5.84 | % | 5.85 | % | 5.94 | % | % | 5.90 | % | |||||||||||||||
| Common Share Total Return for 10.00% Assumed Portfolio Total Return |
14.10 | % | 14.73 | % | 14.59 | % | 14.59 | % | 14.71 | % | % | 14.59 | % | |||||||||||||||
Common Share total return is composed of two elements — the distributions paid by a Fund to holders of common shares (the amount of which is largely determined by the net investment income of the Fund after paying dividend payments on any preferred shares issued by the Fund and expenses on any forms of leverage outstanding) and gains or losses on the value of the securities and other instruments the Fund owns. As required by SEC rules, the table assumes that a Fund is more likely to suffer capital losses than to enjoy capital appreciation. For example, to assume a total return of 0%, a Fund must assume that the income it receives on its investments is entirely offset by losses in the value of those investments. This table reflects hypothetical performance of a Fund’s portfolio and not the actual performance of the Fund’s common shares, the value of which is determined by market forces and other factors. Should a Fund elect to add additional leverage to its portfolio, any benefits of such additional leverage cannot be fully achieved until the proceeds resulting from the use of such leverage have been received by the Fund and invested in accordance with the Fund’s investment objectives and policies. As noted above, a Fund’s willingness to use additional leverage, and the extent to which leverage is used at any time, will depend on many factors.
| 213 |
Shareholder Update (continued)
DIVIDEND REINVESTMENT PLAN
Nuveen Closed-End Funds Automatic Reinvestment Plan
Your Nuveen Closed-End Fund allows you to conveniently reinvest distributions in additional Fund shares. By choosing to reinvest, you’ll be able to invest money regularly and automatically, and watch your investment grow through the power of compounding. Just like distributions in cash, there may be times when income or capital gains taxes may be payable on distributions that are reinvested. It is important to note that an automatic reinvestment plan does not ensure a profit, nor does it protect you against loss in a declining market.
Easy and convenient
To make recordkeeping easy and convenient, each month you’ll receive a statement showing your total distributions, the date of investment, the shares acquired and the price per share, and the total number of shares you own.
How shares are purchased
The shares you acquire by reinvesting will either be purchased on the open market or newly issued by the Fund. If the shares are trading at or above NAV at the time of valuation, the Fund will issue new shares at the greater of the NAV or 95% of the then-current market price. If the shares are trading at less than NAV, shares for your account will be purchased on the open market. If Computershare Trust Company, N.A. (the “Plan Agent”) begins purchasing Fund shares on the open market while shares are trading below NAV, but the Fund’s shares subsequently trade at or above their NAV before the Plan Agent is able to complete its purchases, the Plan Agent may cease open-market purchases and may invest the uninvested portion of the distribution in newly-issued Fund shares at a price equal to the greater of the shares’ NAV or 95% of the shares’ market value on the last business day immediately prior to the purchase date. Distributions received to purchase shares in the open market will normally be invested shortly after the distribution payment date. No interest will be paid on distributions awaiting reinvestment. Because the market price of the shares may increase before purchases are completed, the average purchase price per share may exceed the market price at the time of valuation, resulting in the acquisition of fewer shares than if the distribution had been paid in shares issued by the Fund. A pro rata portion of any applicable brokerage commissions on open market purchases will be paid by Dividend Reinvestment Plan (the “Plan”) participants. These commissions usually will be lower than those charged on individual transactions.
Flexible
You may change your distribution option or withdraw from the Plan at any time, should your needs or situation change. You can reinvest whether your shares are registered in your name, or in the name of a brokerage firm, bank, or other nominee. Ask your investment advisor if his or her firm will participate on your behalf. Participants whose shares are registered in the name of one firm may not be able to transfer the shares to another firm and continue to participate in the Plan. The Fund reserves the right to amend or terminate the Plan at any time. Although the Fund reserves the right to amend the Plan to include a service charge payable by the participants, there is no direct service charge to participants in the Plan at this time.
If you withdraw or the Plan is terminated, you will receive whole shares in your account under the Plan and you will receive a cash payment for any fraction of a share in your account. If you wish, the Plan Agent will sell your shares and send you the proceeds, minus brokerage commissions and a $2.50 service fee.
Fractional Shares
The Plan Agent will confirm your acquisition made for your account as soon as practicable but not later than 60 days after the date thereof. Although you may from time to time have an undivided fractional interest (computed up to six decimal places) in a share (“fractional shares”) of the Fund within the operation of the Plan, and distributions on fractional shares will be credited to your account, no fractional shares will be transferred. In the event of termination of your account under the Plan, the Plan Agent will either (a) continue to hold your Common Shares in book-entry form, or (b) transfer a whole number of Common Shares to an intermediary of your choosing, in either case disbursing to the investor an amount of cash equal to the value of any such fractional shares valued at the then-current market value of the Fund’s Common Shares at the time of termination, less any applicable fees.
Call today to start reinvesting distributions
For more information on the Nuveen Automatic Reinvestment Plan or to enroll in or withdraw from the Plan, speak with your financial professional or call us at (800) 257-8787.
| 214 |
CHANGES OCCURRING DURING THE FISCAL YEAR
The following information in this annual report is a summary of certain changes during the most recent fiscal year. This information may not reflect all of the changes that have occurred since you purchased shares of a Fund.
During the most recent fiscal year, there have been no changes required to be reported in connection with: (i) the Funds’ investment objectives and principal investment policies that have not been approved by shareholders, (ii) the principal risks of the Fund, (iii) the portfolio managers of the Funds; (iv) a Fund’s charter or by-laws that would delay or prevent a change of control of the Fund that have not been approved by shareholders.
CHANGES OCCURRING AFTER THE FISCAL YEAR END
Portfolio Managers
Nuveen New Jersey Quality Municipal Income Fund (NXJ)
Effective September 18, 2025, Kristen DeJong was added as a portfolio manager to NXJ. The biography of Kristen M. DeJong, CFA, is presented below:
Kristen M. DeJong, CFA, Managing Director at Nuveen Asset Management, is a portfolio manager responsible for managing taxable municipal fixed income strategies for customized institutional portfolios and closed-end funds. She began her career in the investment industry in 2005 and joined Nuveen Asset Management in 2008. Prior to her current role, she served as senior research analyst for Nuveen Asset Management’s municipal fixed income team, responsible for conducting credit analysis and providing trade recommendations for separately managed accounts. Previously, she worked as a research associate at Nuveen in the wealth management services area, where she provided research and developed reports on various topics involving retirement, tax and investment planning. Before joining Nuveen, she was a financial advisor at Ameriprise Financial. She received her B.S. in Business from Miami University. Ms. DeJong holds the Chartered Financial Analyst designation and is a member of the CFA Institute and the CFA Society of Chicago. Ms. DeJong is also a past president of the Chicago Municipal Analysts society and a former board member of the National Federation of Municipal Analysts.
| 215 |
Shareholder Update (continued)
ADDITIONAL DISCLOSURES FOR CERTAIN FUNDS AS OF THE FISCAL YEAR ENDED AUGUST 31, 2025
This annual report includes additional disclosures for certain Funds that have, or intend to have, an effective shelf offering registration statement on file with the Securities and Exchange Commission (SEC) at the time this report was prepared. Refer to Note 6, Fund Shares of the Notes to Financial Statements for further details on the shelf offering program.
NUVEEN ARIZONA QUALITY MUNICIPAL INCOME FUND (NAZ)
NUVEEN CALIFORNIA AMT-FREE QUALITY MUNICIPAL INCOME FUND (NKX)
NUVEEN CALIFORNIA QUALITY MUNICIPAL INCOME FUND (NAC)
NUVEEN NEW YORK QUALITY MUNICIPAL INCOME FUND (NAN)
SUMMARY OF FUND EXPENSES
The purpose of the tables and the example below are to help you understand all fees and expenses that you, as a common shareholder, would bear directly or indirectly. The tables show the expenses of the Fund as a percentage of the average net assets applicable to Common Shares and not as a percentage of total assets or managed assets.
| Shareholder Transaction Expenses | NAZ | NKX | NAC | NAN | ||||
| Maximum Sales Charge ( |
1.00% | 1.00% | 1.00% | |||||
| Dividend Reinvestment Plan Fees (2) |
$2.50 | $2.50 | $2.50 | $ | ||||
| (1) | The maximum sales charge for offerings made at-the-market is 1.00%. If the Common Shares are sold to or through underwriters in an offering that is not made at-the-market, the applicable Prospectus Supplement will set forth any other applicable sales load. Additionally, the applicable Prospectus Supplement will set forth the offering expenses (if any) borne by Fund common shareholders. |
| (2) | You will be charged a $2.50 service charge and pay brokerage charges if you direct Computershare Inc. and Computershare Trust Company, N.A., as agent for the common shareholders, to sell your Common Shares held in a dividend reinvestment account. |
| Annual Expenses ( |
NAZ | NKX | NAC | NAN | ||||||||||||
| Management Fees |
0.98% | 0.99% | 0.95% | |||||||||||||
| Interest and Other Related Expenses (2) |
2.43% | 2.68% | 2.78% | |||||||||||||
| Other Expenses (3) |
0.14% | 0.10% | 0.06% | |||||||||||||
| Total Annual Expenses |
3.55% | 3.77% | 3.79% | |||||||||||||
| (1) | Stated as percentages of average net assets attributable to Common Shares for the fiscal year ended August 31, 2025. |
| (2) | Interest and Other Related Expenses reflect actual expenses and fees for leverage incurred by a Fund for the fiscal year ended August 31, 2025. The types of leverage used by the Fund during the fiscal year ended August 31, 2025 are described in the Fund Leverage and the Notes to Financial Statements sections of this annual report. Actual Interest and Other Related Expenses incurred in the future may be higher or lower. If short-term market interest rates rise in the future, and if the Fund continues to maintain leverage, the cost of which is tied to short-term interest rates, the Fund’s interest expenses on its short-term borrowings can be expected to rise in tandem. The Fund’s use of leverage will increase the amount of management fees paid to the Fund’s adviser and sub-advisor(s). |
| (3) | Other Expenses are based on estimated amounts for the current fiscal year. Expenses attributable to the Fund’s investments, if any, in other investment companies are currently estimated not to exceed 0.01%. |
Example
The following example illustrates the expenses, including the applicable transaction fees (referred to as the “Maximum Sales Charge” in the Shareholder Transaction Expenses table above), if any, that a common shareholder would pay on a $1,000 investment that is held for the time periods provided in the table. The example assumes that all dividends and other distributions are reinvested in the Fund and that the Fund’s Annual Expenses, as provided above, remain the same. The example also assumes a 5% annual return. Actual expenses may be greater or less than those assumed. Moreover, the Fund’s actual rate of return may be greater or less than the hypothetical 5% return shown in the example.
| 216 |
Example # 1 (At-the-Market Transaction)
The following example assumes a transaction fee of 1.00%, as a percentage of the offering price.
| 1 Year | 3 Years | 5 Years | 10 Years | |||||||||||||
| NAZ |
$45 | $118 | $192 | $388 | ||||||||||||
| NKX |
$48 | $124 | $202 | $407 | ||||||||||||
| NAC |
$48 | $125 | $203 | $409 | ||||||||||||
| NAN |
$ |
$ |
$ |
$ |
||||||||||||
The example should not be considered a representation of future expenses. Actual expenses may be greater or less than those shown above.
TRADING AND NET ASSET VALUE INFORMATION
The following table shows for the periods indicated: (i) the high and low sales prices for the Common Shares reported as of the end of the day on the NYSE, (ii) the corresponding NAV per share; and (iii) the premium/(discount) to NAV per share at which the Common Shares were trading as of such date.
NAZ
| Closing Market Price per Common Share |
NAV per Common Share on Date of Market Price |
Premium/(Discount) on Date of Market Price |
||||||||||||||||||||||
| Fiscal Quarter Ended |
High | Low | High | Low | High | Low | ||||||||||||||||||
| |
||||||||||||||||||||||||
| August 2025 |
$11.90 | $11.51 | $11.07 | $11.22 | 7.50% | 2.58% | ||||||||||||||||||
| May 2025 |
$13.44 | $11.45 | $12.16 | $11.20 | 10.53% | 2.23% | ||||||||||||||||||
| February 2025 |
$12.70 | $11.28 | $12.17 | $12.09 | 4.35% | (6.70)% | ||||||||||||||||||
| November 2024 |
$12.29 | $11.54 | $12.49 | $12.35 | (1.60)% | (6.56)% | ||||||||||||||||||
| August 2024 |
$11.77 | $10.68 | $12.73 | $12.33 | (7.54)% | (13.38)% | ||||||||||||||||||
| May 2024 |
$11.05 | $10.55 | $12.76 | $12.33 | (13.40)% | (14.44)% | ||||||||||||||||||
| February 2024 |
$10.94 | $10.57 | $12.63 | $12.39 | (13.38)% | (14.69)% | ||||||||||||||||||
| November 2023 |
$10.47 | $9.26 | $12.36 | $11.20 | (15.29)% | (17.32)% | ||||||||||||||||||
| |
||||||||||||||||||||||||
NKX
| Closing Market Price per Common Share |
NAV per Common Share on Date of Market Price |
Premium/(Discount) on Date of Market Price |
||||||||||||||||||||||
| Fiscal Quarter Ended |
High | Low | High | Low | High | Low | ||||||||||||||||||
| |
||||||||||||||||||||||||
| August 2025 |
$12.07 | $11.46 | $11.61 | $11.74 | 3.96% | (2.39)% | ||||||||||||||||||
| May 2025 |
$13.05 | $11.70 | $12.83 | $11.65 | 1.71% | 0.43% | ||||||||||||||||||
| February 2025 |
$13.08 | $12.30 | $13.24 | $12.83 | (1.21)% | (4.13)% | ||||||||||||||||||
| November 2024 |
$14.06 | $12.85 | $13.37 | $13.17 | 5.16% | (2.43)% | ||||||||||||||||||
| August 2024 |
$13.40 | $11.48 | $13.26 | $12.90 | 1.06% | (11.01)% | ||||||||||||||||||
| May 2024 |
$12.23 | $11.40 | $13.26 | $12.89 | (7.77)% | (11.56)% | ||||||||||||||||||
| February 2024 |
$11.65 | $11.24 | $13.45 | $13.12 | (13.38)% | (14.33)% | ||||||||||||||||||
| November 2023 |
$11.57 | $9.80 | $12.50 | $11.69 | (7.44)% | (16.17)% | ||||||||||||||||||
| |
||||||||||||||||||||||||
| 217 |
Shareholder Update (continued)
NAC
| Closing Market Price per Common Share |
NAV per Common Share on Date of Market Price |
Premium/(Discount) on Date of Market Price |
||||||||||||||||||||||
| Fiscal Quarter Ended |
High | Low | High | Low | High | Low | ||||||||||||||||||
| |
||||||||||||||||||||||||
| August 2025 |
$11.33 | $10.88 | $11.10 | $11.22 | 2.07% | (3.03)% | ||||||||||||||||||
| May 2025 |
$11.61 | $10.51 | $12.34 | $11.18 | (5.92)% | (5.99)% | ||||||||||||||||||
| February 2025 |
$11.88 | $11.12 | $12.79 | $12.27 | (7.11)% | (9.37)% | ||||||||||||||||||
| November 2024 |
$11.99 | $11.34 | $12.93 | $12.57 | (7.27)% | (9.79)% | ||||||||||||||||||
| August 2024 |
$11.81 | $10.94 | $12.87 | $12.44 | (8.24)% | (12.06)% | ||||||||||||||||||
| May 2024 |
$11.17 | $10.64 | $12.92 | $12.57 | (13.54)% | (15.35)% | ||||||||||||||||||
| February 2024 |
$11.15 | $10.67 | $12.92 | $12.60 | (13.70)% | (15.32)% | ||||||||||||||||||
| November 2023 |
$10.65 | $9.33 | $12.40 | $11.21 | (14.11)% | (16.77)% | ||||||||||||||||||
| |
||||||||||||||||||||||||
NAN
| Closing Market Price per Common Share |
NAV per Common Share on Date of Market Price |
Premium/(Discount) on Date of Market Price |
||||||||||||||||||||||
| Fiscal Quarter Ended |
High | Low | High | Low | High | Low | ||||||||||||||||||
| |
||||||||||||||||||||||||
| August 2025 |
$ |
$ |
$ |
$ |
||||||||||||||||||||
| May 2025 |
$ |
$ |
$ |
$ |
( |
( |
||||||||||||||||||
| February 2025 |
$ |
$ |
$ |
$ |
( |
( |
||||||||||||||||||
| November 2024 |
$ |
$ |
$ |
$ |
( |
( |
||||||||||||||||||
| August 2024 |
$ |
$ |
$ |
$ |
( |
( |
||||||||||||||||||
| May 2024 |
$ |
$ |
$ |
$ |
( |
( |
||||||||||||||||||
| February 2024 |
$ |
$ |
$ |
$ |
( |
( |
||||||||||||||||||
| November 2023 |
$ |
$ |
$ |
$ |
( |
( |
||||||||||||||||||
| |
||||||||||||||||||||||||
The following table shows, as of August 31, 2025 each Fund’s: (i) NAV per Common Share, (ii) market price, (iii) percentage of premium/(discount) to NAV per Common Share and, (iv) net assets attributable to Common Shares.
| August 31, 2025 | NAZ | NKX | NAC | NAN | ||||||||||||
| NAV per Common Share |
$ 11.12 | $ 11.56 | $ 11.06 | $ |
||||||||||||
| Market Price |
$ 11.86 | $ 11.82 | $ 11.23 | $ |
||||||||||||
| Percentage of Premium/(Discount) to NAV per Common Share |
6.65% | 2.25% | 1.54% | |||||||||||||
| Net Assets Attributable to Common Shares |
$ 134,580,896 | $ 574,400,459 | $ 1,611,347,880 | $ 337,745,923 | ||||||||||||
| |
||||||||||||||||
Shares of closed-end investment companies, including those of the Funds, may frequently trade at prices lower than NAV, the Funds’ Board of Trustees (Board) has currently determined that, at least annually, it will consider action that might be taken to reduce or eliminate any material discount from NAV in respect of Common Shares, which may include the repurchase of such shares in the open market or in private transactions, the making of a tender offer for such shares at NAV, or the conversion of the Fund to an open-end investment company. The Funds cannot assure you that their Board will decide to take any of these actions, or that share repurchases or tender offers will actually reduce market discount.
SENIOR SECURITIES
The following table sets forth information regarding each Fund’s outstanding senior securities as of the end of each of the Fund’s last ten fiscal years, as applicable. Each Fund’s senior securities during this time period are comprised of borrowings that constitute “senior securities” as defined in the Investment Company Act of 1940, as amended (1940 Act). The information in this table is derived from the financial statements. The financial statements for the year ended August 31, 2025 have been audited by PricewaterhouseCoopers LLP (“PwC”), independent registered public accounting firm. The financial statements with respect to the fiscal years ended prior to 2025, where applicable, have been audited by other auditors. The Funds’ audited financial statements for the year ended August 31, 2025, including the report of PwC thereon, and accompanying notes thereto, are included in this Annual Report.
| 218 |
| NAZ | ||||||||||||||||
| Adjustable Rate MuniFund Term Preferred (AMTP) Shares at the End of Period |
Variable Rate MuniFund Term Preferred (VMTP) Shares at the End of Period |
|||||||||||||||
| Aggregate Amount Outstanding (000) (1) |
Asset Coverage Per $100,000 (3) |
Aggregate Amount Outstanding (000) (1) |
Asset Coverage Per $100,000 (3) |
|||||||||||||
| 2025 |
$ 88,300 | $ 252,413 | $ 0 | $ 0 | ||||||||||||
| 2024 (5) |
$ 88,300 | $ 265,542 | $ 0 | $ 0 | ||||||||||||
| 2024 |
$ 88,300 | $ 266,396 | $ 0 | $ 0 | ||||||||||||
| 2023 |
$ 88,300 | $ 261,963 | $ 0 | $ 0 | ||||||||||||
| 2022 |
$ 88,300 | $ 290,229 | $ 0 | $ 0 | ||||||||||||
| 2021 |
$ 88,300 | $ 297,509 | $ 0 | $ 0 | ||||||||||||
| 2020 |
$ 88,300 | $ 303,878 | $ 0 | $ 0 | ||||||||||||
| 2019 |
$ 88,300 | $ 285,822 | $ 0 | $ 0 | ||||||||||||
| 2018 |
$ 0 | $ 0 | $ 88,300 | $ 286,891 | ||||||||||||
| 2017 |
$ 0 | $ 0 | $ 88,300 | $ 287,022 | ||||||||||||
| 2016 |
$ 0 | $ 0 | $ 79,000 | $ 319,959 | ||||||||||||
| NKX | ||||||||||||||||||||||||||||
| Institutional MuniFund Term Preferred (iMTP) Shares at the End of Period |
MuniFund Preferred (MFP) Shares at the End of Period |
Variable Rate Demand Preferred (VRDP) Shares at the End of Period |
||||||||||||||||||||||||||
| Aggregate Amount Outstanding (000) (1) |
Asset Coverage Per $5,000 (2) |
Aggregate Amount Outstanding (000) (1) |
Asset Coverage Per $100,000 (3) |
Aggregate Amount Outstanding (000) (1) |
Asset Coverage Per $100,000 (3) |
Asset Coverage Per $1 Liquidation (4) |
||||||||||||||||||||||
| 2025 |
$ 0 | $ 0 | $ 140,400 | $ 244,649 | $ 256,700 | $ 244,649 | $ 2.45 | |||||||||||||||||||||
| 2024 (5) |
$ 0 | $ 0 | $ 140,400 | $ 258,511 | $ 256,700 | $ 258,511 | $ 2.59 | |||||||||||||||||||||
| 2024 |
$ 0 | $ 0 | $ 140,400 | $ 259,461 | $ 256,700 | $ 259,461 | $ 2.59 | |||||||||||||||||||||
| 2023 |
$ 0 | $ 0 | $ 140,400 | $ 255,434 | $ 256,700 | $ 255,434 | $ 2.55 | |||||||||||||||||||||
| 2022 |
$ 0 | $ 0 | $ 140,400 | $ 271,751 | $ 292,200 | $ 271,751 | $ 2.72 | |||||||||||||||||||||
| 2021 |
$ 0 | $ 0 | $ 140,400 | $ 281,045 | $ 292,200 | $ 281,045 | $2.81 | |||||||||||||||||||||
| 2020 |
$ 0 | $ 0 | $ 140,400 | $ 289,705 | $ 292,200 | $ 289,705 | $ 2.90 | |||||||||||||||||||||
| 2019 |
$ 0 | $ 0 | $ 140,400 | $ 266,617 | $ 292,200 | $ 266,617 | $ 2.67 | |||||||||||||||||||||
| 2018 |
$ 0 | $ 0 | $ 140,400 | $ 268,438 | $ 292,200 | $ 268,438 | $ 2.68 | |||||||||||||||||||||
| 2017 |
$ 36,000 | $ 13,468 | $ 0 | $ 0 | $ 396,600 | $ 269,359 | $ 2.69 | |||||||||||||||||||||
| 2016 |
$ 36,000 | $ 16,775 | $ 0 | $ 0 | $ 291,600 | $ 335,490 | $ 3.35 | |||||||||||||||||||||
| 219 |
Shareholder Update (continued)
| NAC | ||||||||||||||||||||||||||||
| MuniFund Preferred (MFP) Shares at the End of Period |
Variable Rate MuniFund Term Preferred (VMTP) Shares at the End of Period |
Variable Rate Demand Preferred (VRDP) Shares at the End of Period |
||||||||||||||||||||||||||
| Aggregate Amount Outstanding (000) (1) |
Asset Coverage Per $100,000 (3) |
Aggregate Amount Outstanding (000) (1) |
Asset Coverage Per $100,000 (3) |
Aggregate Amount Outstanding (000) (1) |
Asset Coverage Per $100,000 (3) |
Asset Coverage Per $1 Liquidation (4) |
||||||||||||||||||||||
| 2025 |
$ 257,000 | $ 238,337 | $ 0 | $ 0 | $ 907,800 | $ 238,337 | $ 2.38 | |||||||||||||||||||||
| 2024 (5) |
$ 275,000 | $ 256,078 | $ 0 | $ 0 | $ 907,800 | $ 256,078 | $ 2.56 | |||||||||||||||||||||
| 2024 |
$ 275,000 | $ 256,929 | $ 0 | $ 0 | $ 907,800 | $ 256,929 | $ 2.57 | |||||||||||||||||||||
| 2023 |
$ 320,000 | $ 247,561 | $ 0 | $ 0 | $ 907,800 | $ 247,561 | $ 2.48 | |||||||||||||||||||||
| 2022 |
$ 320,000 | $ 270,716 | $ 0 | $ 0 | $ 957,600 | $ 270,716 | $ 2.71 | |||||||||||||||||||||
| 2021 |
$ 320,000 | $ 280,237 | $ 0 | $ 0 | $ 957,600 | $ 280,237 | $ 2.80 | |||||||||||||||||||||
| 2020 |
$ 320,000 | $ 289,294 | $ 0 | $ 0 | $ 957,600 | $ 289,294 | $ 2.89 | |||||||||||||||||||||
| 2019 |
$ 320,000 | $ 269,324 | $ 0 | $ 0 | $ 957,600 | $ 269,324 | $ 2.69 | |||||||||||||||||||||
| 2018 |
$ 320,000 | $ 272,351 | $ 0 | $ 0 | $ 957,600 | $ 272,351 | $ 2.72 | |||||||||||||||||||||
| 2017 |
$ 0 | $ 0 | $ 145,000 | $ 301,487 | $ 957,600 | $ 301,487 | $ 3.01 | |||||||||||||||||||||
| 2016 |
$ 0 | $ 0 | $ 0 | $ 0 | $ 699,600 | $ 346,533 | $ 0 | |||||||||||||||||||||
| NAN | ||||||||||||||||||||||||||||
| Adjustable Rate MuniFund Term Preferred (AMTP) Shares at the End of Period |
Variable Rate MuniFund Term Preferred (VMTP) Shares at the End of Period |
Variable Rate Demand Preferred (VRDP) Shares at the End of Period |
||||||||||||||||||||||||||
| Aggregate Amount Outstanding (000) (1) |
Asset Coverage Per $100,000 (3) |
Aggregate Amount Outstanding (000) (1) |
Asset Coverage Per $100,000 (3) |
Aggregate Amount Outstanding (000) (1) |
Asset Coverage Per $100,000 (3) |
Asset Coverage Per $1 Liquidation (4) |
||||||||||||||||||||||
| 2025 |
$ |
$ |
$ |
$ |
$ |
$ |
$ |
|||||||||||||||||||||
| 2024 (5) |
$ |
$ |
$ |
$ |
$ |
$ |
$ |
|||||||||||||||||||||
| 2024 |
$ |
$ |
$ |
$ |
$ |
$ |
$ |
|||||||||||||||||||||
| 2023 |
$ |
$ |
$ |
$ |
$ |
$ |
$ |
|||||||||||||||||||||
| 2022 |
$ |
$ |
$ |
$ |
$ |
$ |
$ |
|||||||||||||||||||||
| 2021 |
$ |
$ |
$ |
$ |
$ |
$ |
$ |
|||||||||||||||||||||
| 2020 |
$ |
$ |
$ |
$ |
$ |
$ |
$ |
|||||||||||||||||||||
| 2019 |
$ |
$ |
$ |
$ |
$ |
$ |
$ |
|||||||||||||||||||||
| 2018 |
$ |
$ |
$ |
$ |
$ |
$ |
$ |
|||||||||||||||||||||
| 2017 (6) |
$ |
$ |
$ |
$ |
$ |
$ |
$ |
|||||||||||||||||||||
| 2016 |
$ |
$ |
$ |
$ |
$ |
$ |
$ |
|||||||||||||||||||||
| 2015 |
$ |
$ |
$ |
$ |
$ |
$ |
$ |
|||||||||||||||||||||
| (1) | Aggregate Amount Outstanding: Aggregate amount outstanding represents the principal amount outstanding or liquidation preference, if applicable, as of the end of the relevant fiscal year and does not include any preferred shares noticed for redemption as noted on the Statement of Assets and Liabilities, if applicable. |
| (2) | Asset Coverage Per $5,000: Asset coverage per $5,000 is calculated by subtracting the Fund’s liabilities and indebtedness not represented by senior securities from the Fund’s total assets, dividing the result by the aggregate of the involuntary liquidation preference of the outstanding preferred shares and multiplying the result by 5,000. For purpose of asset coverage above, senior securities consist of preferred shares or borrowings (excluding temporary borrowings) of a Fund and does not include derivative transactions and other investments that have the economic effect of leverage such as reverse repurchase agreements and tender option bonds. If the leverage effects of such investments were included, the asset coverage amounts presented would be lower. |
| 220 |
| (3) | Asset Coverage Per $100,000: Asset coverage per $100,000 is calculated by subtracting the Fund’s liabilities and indebtedness not represented by senior securities from the Fund’s total assets, dividing the result by the aggregate of the involuntary liquidation preference of the outstanding preferred shares and multiplying the result by 100,000. For purpose of asset coverage above, senior securities consist of preferred shares or borrowings (excluding temporary borrowings) of a Fund and does not include derivative transactions and other investments that have the economic effect of leverage such as reverse repurchase agreements and tender option bonds. If the leverage effects of such investments were included, the asset coverage amounts presented would be lower. |
| (4) | Includes all borrowings and preferred shares presented for the fund. |
| (5) | For the six months ended August 31, 2024. Prior to March 1, 2024, the Fund’s fiscal year end was February 29th. |
| (6) | For the five months ended February 28, 2017. Prior to October 1, 2016, the Fund’s fiscal year end was September 30th. |
UNRESOLVED STAFF COMMENTS
Each Fund believes that there are no material unresolved written comments, received 180 days or more before August 31, 2025, from the Staff of the Securities and Exchange Commission (SEC) regarding any of its periodic or current reports under the Securities Exchange Act or Investment Company Act of 1940, or its registration statement.
| 221 |
Important Tax Information
(Unaudited)
As required by the Internal Revenue Code and Treasury Regulations, certain tax information, as detailed below, must be provided to shareholders. Shareholders are advised to consult their tax advisor with respect to the tax implications of their investment. The amounts listed below may differ from the actual amounts reported on Form 1099-DIV, which will be sent to shareholders shortly after calendar year end.
Long-Term Capital Gains
As of year end, each Fund designates the following distribution amounts, or maximum amount allowable, as being from net long-term capital gains pursuant to Section 852(b)(3) of the Internal Revenue Code:
| Fund | Net Long-Term Capital Gains | |
| NAZ |
$— | |
| NKX |
— | |
| NCA |
— | |
| NAC |
— | |
| NXJ |
— | |
| NRK |
— | |
| NNY |
— | |
| NAN |
— | |
| NQP |
— | |
| 222 |
Shareholder Meeting Report
(Unaudited)
The annual meeting of shareholders for NRK and NAN was held on August 14, 2025; at this meeting the shareholders were asked to elect Board Members.
The vote totals for NRK and NAN are set forth below:
| NRK | NAN | |||||||||||||||
| |
Common and Preferred shares voting together as a class |
|
|
Preferred shares |
|
|
Common and Preferred shares voting together as a class |
|
|
Preferred shares |
| |||||
| Approval of the Board Members was reached as follows: |
||||||||||||||||
| Michael A. Forrester |
||||||||||||||||
| For |
50,576,870 | — | 24,241,557 | — | ||||||||||||
| Withhold |
20,592,096 | — | 559,144 | — | ||||||||||||
| Total |
71,168,966 | — | 24,800,701 | — | ||||||||||||
| Thomas J. Kenny |
||||||||||||||||
| For |
50,712,896 | — | 24,233,756 | — | ||||||||||||
| Withhold |
20,456,070 | — | 566,945 | — | ||||||||||||
| Total |
71,168,966 | — | 24,800,701 | — | ||||||||||||
| Robert L. Young |
||||||||||||||||
| For |
50,719,430 | — | 24,256,973 | — | ||||||||||||
| Withhold |
20,449,536 | — | 543,728 | — | ||||||||||||
| Total |
71,168,966 | — | 24,800,701 | — | ||||||||||||
| Albin F. Moschner |
||||||||||||||||
| For |
— | 6,606 | — | 2,160 | ||||||||||||
| Withhold |
— | — | — | — | ||||||||||||
| Total |
— | 6,606 | — | 2,160 | ||||||||||||
| Margaret L. Wolff |
||||||||||||||||
| For |
— | 6,606 | — | 2,160 | ||||||||||||
| Withhold |
— | — | — | — | ||||||||||||
| Total |
— | 6,606 | — | 2,160 | ||||||||||||
| 223 |
Shareholder Meeting Report (continued)
The annual meeting of shareholders for NNY was held on August 14, 2025; at this meeting the shareholders were asked to elect Board Members.
The vote totals for NNY are set forth below:
| NNY | ||||
| Common shares |
||||
| Approval of the Board Members was reached as follows: |
||||
| Michael A. Forrester |
||||
| For |
15,990,843 | |||
| Withhold |
318,514 | |||
| Total |
16,309,357 | |||
| Thomas J. Kenny |
||||
| For |
15,990,160 | |||
| Withhold |
319,197 | |||
| Total |
16,309,357 | |||
| Margaret L. Wolff |
||||
| For |
15,952,009 | |||
| Withhold |
357,348 | |||
| Total |
16,309,357 | |||
| Robert L. Young |
||||
| For |
15,991,949 | |||
| Withhold |
317,408 | |||
| Total |
16,309,357 | |||
| 224 |
Additional Fund Information
(Unaudited)
| Board of Trustees | ||||||||||||
| Joseph A. Boateng | Michael A. Forrester | Thomas J. Kenny | Amy B.R. Lancellotta | Joanne T. Medero | Albin F. Moschner | John K. Nelson | ||||||
| Loren M. Starr | Matthew Thornton III | Terence J. Toth | Margaret L. Wolff | Robert L. Young |
| Investment Adviser Nuveen Fund Advisors, LLC 333 West Wacker Drive Chicago, IL 60606 |
Custodian State Street Bank & Trust Company One Congress Street Suite 1 Boston, MA 02114-2016 |
Legal Counsel Chapman and Cutler LLP Chicago, IL 60606 |
Independent Registered Public Accounting Firm PricewaterhouseCoopers LLP One North Wacker Drive Chicago, IL 60606 |
Transfer Agent and Shareholder Services Computershare Trust Company, N.A. 150 Royall Street Canton, MA 02021 (800) 257-8787 |
Portfolio of Investments Information The Fund is required to file its complete schedule of portfolio holdings with the Securities and Exchange Commission (SEC) for the first and third quarters of each fiscal year as an exhibit to its report on Form N-PORT. You may obtain this information on the SEC’s website at http://www.sec.gov.
Nuveen Funds’ Proxy Voting Information You may obtain (i) information regarding how each fund voted proxies relating to portfolio securities held during the most recent twelve-month period ended June 30, without charge, upon request, by calling Nuveen toll-free at (800) 257-8787 or on Nuveen’s website at www.nuveen.com and (ii) a description of the policies and procedures that each fund used to determine how to vote proxies relating to portfolio securities without charge, upon request, by calling Nuveen toll-free at (800) 257-8787. You may also obtain this information directly from the SEC. Visit the SEC on-line at http://www.sec.gov.
CEO Certification Disclosure The Fund’s Chief Executive Officer (CEO) has submitted to the New York Stock Exchange (NYSE) the annual CEO certification as required by Section 303A.12(a) of the NYSE Listed Company Manual. Each Fund has filed with the SEC the certification of its CEO and Chief Financial Officer required by Section 302 of the Sarbanes-Oxley Act.
Common Share Repurchases Each Fund intends to repurchase, through its open-market share repurchase program, shares of its own common stock at such times and in such amounts as is deemed advisable. During the period covered by this report, each Fund repurchased shares of its common stock as shown in the accompanying table. Any future repurchases will be reported to shareholders in the next annual or semi-annual report.
| NAZ | NKX | NCA | NAC | NXJ | ||||||||||||||||
| Common Shares Repurchased |
0 | 0 | 0 | 0 | 0 | |||||||||||||||
| NRK | NNY | NAN | NQP | |||||||||||||||||
| Common Shares Repurchased |
0 | 0 | 0 | 0 | ||||||||||||||||
FINRA BrokerCheck: The Financial Industry Regulatory Authority (FINRA) provides information regarding the disciplinary history of FINRA member firms and associated investment professionals. This information as well as an investor brochure describing FINRA BrokerCheck is available to the public by calling the FINRA BrokerCheck Hotline number at (800) 289-9999 or by visiting www.FINRA.org.
225
Glossary of Terms Used in this Report
(Unaudited)
Average Annual Total Return: This is a commonly used method to express an investment’s performance over a particular, usually multi-year time period. It expresses the return that would have been necessary each year to equal the investment’s actual cumulative performance (including change in NAV or offer price and reinvested dividends and capital gains distributions, if any) over the time period being considered.
Effective Leverage: Effective leverage is a fund’s effective economic leverage, and includes both regulatory leverage (see leverage) and the leverage effects of certain derivative investments in the fund’s portfolio. Currently, the leverage effects of Tender Option Bond (TOB) inverse floater holdings are included in effective leverage values, in addition to any regulatory leverage.
Inverse Floating Rate Securities: Inverse floating rate securities, are the residual interest in a tender option bond (TOB) trust, sometimes referred to as “inverse floaters”, are created by depositing a municipal bond, typically with a fixed interest rate, into a special purpose trust. This trust, in turn, (a) issues floating rate certificates typically paying short-term tax-exempt interest rates to third parties in amounts equal to some fraction of the deposited bond’s par amount or market value, and (b) issues an inverse floating rate certificate (sometimes referred to as an “inverse floater”) to an investor (such as a Fund) interested in gaining investment exposure to a long-term municipal bond. The income received by the holder of the inverse floater varies inversely with the short-term rate paid to the floating rate certificates’ holders, and in most circumstances the holder of the inverse floater bears substantially all of the underlying bond’s downside investment risk. The holder of the inverse floater typically also benefits disproportionately from any potential appreciation of the underlying bond’s value. Hence, an inverse floater essentially represents an investment in the underlying bond on a leveraged basis.
Leverage: Leverage is created whenever a fund has investment exposure (both reward and/or risk) equivalent to more than 100% of the investment capital.
Net Asset Value (NAV) Per Share: A fund’s Net Assets is equal to its total assets (securities, cash, accrued earnings and receivables) less its total liabilities. NAV per share is equal to the fund’s Net Assets divided by its number of shares outstanding.
Pre-Refunded Bond/Pre-Refunding: Pre-Refunded Bond/Pre-Refunding, also known as advanced refundings or refinancings, is a procedure used by state and local governments to refinance municipal bonds to lower interest expenses. The issuer sells new bonds with a lower yield and uses the proceeds to buy U.S. Treasury securities, the interest from which is used to make payments on the higher-yielding bonds. Because of this collateral, pre-refunding generally raises a bond’s credit rating and thus its value.
Regulatory Leverage: Regulatory leverage consists of preferred shares issued by or borrowings of a fund. Both of these are part of a fund’s capital structure. Regulatory leverage is subject to asset coverage limits set in the Investment Company Act of 1940.
Tax Obligation/General Bonds: Bonds backed by the general revenues of an issuer, including taxes, where the issuer has the ability to increase taxes by an unlimited amount to pay the bonds back.
Tax Obligation/Limited Bonds: Bonds backed by the general revenues of an issuer, including taxes, where the issuer doesn’t have the ability to increase taxes by an unlimited amount to pay the bonds back.
Total Investment Exposure: Total investment exposure is a fund’s assets managed by the Adviser that are attributable to financial leverage. For these purposes, financial leverage includes a fund’s use of preferred stock and borrowings and investments in the residual interest certificates (also called inverse floating rate securities) in tender option bond (TOB) trusts, including the portion of assets held by a TOB trust that has been effectively financed by the trust’s issuance of floating rate securities.
| 226 |
[This page intentionally left blank.]
[This page intentionally left blank.]
[This page intentionally left blank.]
Statement Regarding Basis for Approval of
Investment Advisory Contract
(Unaudited)
Nuveen Arizona Quality Municipal Income Fund
Nuveen California AMT-Free Quality Municipal Income Fund
Nuveen California Municipal Value Fund
Nuveen California Quality Municipal Income Fund
Nuveen New Jersey Quality Municipal Income Fund
Nuveen New York AMT-Free Quality Municipal Income Fund
Nuveen New York Municipal Value Fund
Nuveen New York Quality Municipal Income Fund
Nuveen Pennsylvania Quality Municipal Income Fund
The Approval Process
At meetings held on April 28 and 29, 2025 (the “Meeting”), the Boards of Directors or Trustees (as the case may be) of the group of funds advised by Nuveen Fund Advisors, LLC (“NFAL” or the “Adviser”), including the Funds (as defined below), and the group of funds advised by Teachers Advisors, LLC (“TAL” and all such funds, collectively, the “Nuveen funds” or the “funds”) approved the renewal of the investment management agreements (each, an “Investment Management Agreement”) with NFAL and TAL, respectively. TAL and NFAL are affiliates as NFAL is a subsidiary of Nuveen, LLC, the investment arm of Teachers Insurance and Annuity Association of America (“TIAA”), and TAL is an indirect wholly owned subsidiary of TIAA. The Boards of Trustees of the Funds also approved the renewal of the sub-advisory agreements (each, a “Sub-Advisory Agreement”) with Nuveen Asset Management, LLC (the “Sub-Adviser”). The Sub-Adviser is also an affiliate of the Adviser.
The Boards of Directors or Trustees of the Nuveen funds are each a “Board” or collectively the “Board” (as the context may dictate) and the directors or trustees (as the case may be) are each a “Board Member.” The Board Members of each Board are not “interested persons” (as defined under the Investment Company Act of 1940 (the “1940 Act”)) and, therefore, each Board is deemed to be comprised of all disinterested Board Members. References to a Board and the Board Members are interchangeable.
In accordance with applicable law, following up to an initial two-year period, the Board of each Fund considers the renewal of each Investment Management Agreement and Sub-Advisory Agreement on behalf of the Fund on an annual basis. The Investment Management Agreements and Sub-Advisory Agreements are collectively referred to as the “Advisory Agreements,” and the Adviser and the Sub-Adviser are collectively the “Fund Advisers” and each a “Fund Adviser.” Below is a summary of the annual review process the Board undertook related to its most recent renewal of the Advisory Agreements with respect to each Nuveen fund covered by this report (each, a “Fund” and, collectively, the “Funds”).
To reach their determination, the Board Members considered the review of the Advisory Agreements to be an ongoing process. The Board Members employed the accumulated information, knowledge and experience they had gained during their tenure as disinterested Board Members on the respective Board of the Nuveen funds and its committees in overseeing the applicable funds and working with the respective investment advisers and sub-advisers in their review of the advisory agreements for the fund complex. The Board and/or its committees meet regularly throughout the year and at these meetings, the Board Members received materials and discussed information covering a wide range of topics pertinent to the annual consideration of the renewal of the Advisory Agreements. Such topics include, but are not limited to, the investment performance of the funds over various periods; investment oversight matters; economic, market and regulatory developments; any significant organizational or other developments impacting a Fund Adviser and its strategic plans for its business; product initiatives for various funds; fund expenses; compliance, regulatory and risk management matters; trading practices; the derivatives risk management program; management of distributions; valuation of securities; payments to financial intermediaries; securities lending (as applicable); and closed-end fund market activity, capital management initiatives, institutional ownership, management of leverage financing, the secondary market trading of the closed-end funds and any actions taken to address market discounts to net asset value. The Board also seeks to meet at its regular quarterly meetings with members of senior management to discuss various topics, including market conditions, industry developments and any significant developments or strategic plans for the Fund Advisers, if any.
To help with the review of performance, the Board and/or its committees periodically received and discussed presentations from member(s) of investment teams throughout the year, culminating in an annual performance review of the Nuveen funds at the Board’s meeting held on February 25-26, 2025 (the “February Meeting”). The presentations, discussions and meetings during the year provide a means for the Board Members to evaluate and consider the level, breadth and quality of services provided by the Fund Advisers and any changes to such services over time in light of new or modified regulatory requirements, changes to market conditions or other factors.
In addition to the materials and discussions that occurred at prior meetings, the Board, through its independent legal counsel, requested and received extensive materials and information prepared specifically for its review of the Advisory Agreements. During the year, management worked with an ad hoc committee established by the Board to help enhance and streamline the materials provided in connection with the annual review of the Advisory Agreements. The materials provided at the Meeting and/or prior meetings covered a wide range of matters including, but not limited to, a description of the nature, extent and quality of services provided by the Fund Advisers; a review of the Sub-Adviser and applicable investment team; an analysis of fund performance with a focus on funds considered to have met certain challenged performance measurements; an analysis of
| 230 |
the fees and expense ratios of the Nuveen funds with a focus on funds considered to have certain expense characteristics; a list of management fee and sub-advisory fee schedules; an analysis of advisory fees compared to fees assessed to other types of clients; a description of portfolio manager compensation; certain profitability and/or financial data; and a description of indirect benefits received by the Fund Advisers as a result of their relationships with the Nuveen funds. The Board also considered information provided by Broadridge Financial Solutions, Inc. (“Broadridge”), an independent provider of investment company data, comparing fee and expense levels of each respective Fund to those of a peer universe.
The information prepared specifically for the annual review supplemented the information provided to the Board and its committees and the evaluations of the Nuveen funds by the Board and its committees during the year. The Board’s review of the Advisory Agreements is based on all the information provided to the Board and its committees over time. The performance, fee and expense data and other information provided by a Fund Adviser, Broadridge or other service providers were not independently verified by the Board Members.
As part of their review, the Board Members and independent legal counsel met in executive session on April 9, 2025 to review and discuss materials provided in connection with their annual review of the Advisory Agreements. After reviewing this information, the Board Members requested, directly or through independent legal counsel, additional information, and the Board subsequently reviewed and discussed the responses to these follow-up questions and requests. The Board Members and independent legal counsel met again in executive session on April 17, 2025 (together with the April 9, 2025 executive session, the “Executive Sessions”) to discuss the responses to the initial supplemental information request and, following their review of the data provided, requested management present certain additional information at the Meeting. In addition to the Executive Sessions, the Board Members met in additional executive sessions prior to and during the Meeting. During the Meeting, the Board Members considered the responses, invited representatives of management to provide additional information and determined that the information provided (whether oral or written) was responsive to their requests.
The Board Members were advised by independent legal counsel during the annual review process as well as throughout the year, including meeting in executive sessions with such counsel at which no representatives of management were present. In connection with their annual review, the Board Members also received a memorandum from independent legal counsel outlining their fiduciary duties and legal standards in reviewing the Advisory Agreements, including guidance from court cases evaluating advisory fees.
After the discussions and with the background and knowledge described above, the Board Members approved the continuation of the Advisory Agreements on behalf of the applicable Funds for an additional one-year period. The Board did not identify any single factor as all-important or controlling, but rather each decision reflected the comprehensive consideration of all the information (written or oral) provided to the Board and its committees throughout the year as well as the materials prepared specifically in connection with the annual review process. The contractual arrangements may reflect the results of prior year(s) of review, negotiation and information provided in connection with the Board’s annual review of the Funds’ advisory arrangements and oversight of the Funds. Each Board Member may have attributed different levels of importance to the various factors and information considered in connection with the annual review process and may have placed different emphasis on the relevant information year to year in light of, among other things, changing market and economic conditions. A summary of the principal factors and information, but not all the factors, the Board considered in deciding to renew the Advisory Agreements is set forth below.
A. Nature, Extent and Quality of Services
In evaluating the renewal of the Advisory Agreements, the Board Members received and considered information regarding the nature, extent and quality of the applicable Fund Adviser’s services provided to each respective Fund. With this approach, they considered the roles of the Adviser and the Sub-Adviser in providing services to the Funds.
The Board considered that the Adviser provides a wide array of management, oversight and other services to manage and operate the Funds. The Board considered the Adviser and its affiliates’ dedication of resources, time, people and capital as well as consistent program of improvement and innovation aimed at keeping the Nuveen fund complex relevant and attractive for existing and new investors and meeting the needs of an increasingly complex regulatory environment. Among the information provided in connection with the review of services at the Meeting and/or prior meetings, the Board considered a description of the organizational changes at the Adviser during the year, the management teams that comprise the various support and investment functions for the funds and the background of certain personnel who support the funds. The Board considered the significant resources, both financial and personnel, the Adviser and its affiliates had committed over the past several years in working to bring the asset management businesses of Nuveen and TIAA under one centralized umbrella and to consolidate their respective fund families to the benefit of the funds through, among other things, enhanced operating efficiencies, centralized investment leadership and a centralized shared resources and support model. To help ensure the continuation of services, the Board considered, among other things, management’s emphasis on succession planning and key person risk evaluation pursuant to which certain management team(s) meet annually to conduct a comprehensive review of successors to key positions, to develop and monitor corporate-wide standards and procedures in seeking to help ensure the firm may continue to operate in the event of business disruptions, and to review staffing and compensation levels to help remain competitive with peers in the industry. The Board considered a description of the application of business continuity plans and the periodic testing and review of such plans. As noted below, the Board also considered certain financial data of the Adviser and TIAA in assessing the financial stability and condition of the Adviser to provide a high level of quality of services to the Funds.
In its review, the Board considered that the Funds operated in a highly regulated industry and the scope and complexity of the services and resources that the Adviser and its affiliates must provide to manage and operate the Funds have expanded over the years due to regulatory, market and other developments. Such services included maintaining and monitoring the Nuveen funds’ compliance programs, risk management programs, liquidity risk management programs, derivatives risk management programs and cybersecurity programs. The Board and/or its Compliance, Risk Management and Regulatory Oversight Committee received reports regarding the funds’ compliance policies and procedures and matters undertaken thereunder as well as other compliance initiatives on a regular basis.
| 231 |
Statement Regarding Basis for Approval of Investment Advisory Contract (continued)
In considering the breadth and quality of services the Adviser and its various teams provide, the Board considered that the Adviser provides investment advisory services. With respect to the Funds, such Funds utilize the Sub-Adviser to manage the portfolios of the Funds subject to the supervision of the Adviser. Accordingly, the Board considered that the Adviser and its affiliates, among other things, oversee and review the performance of the Sub-Adviser and its investment team(s); evaluate Fund performance and market conditions; evaluate investment strategies and recommend changes thereto; oversee trade execution and, as applicable, securities lending; evaluate investment risks; and manage valuation matters. As noted below, the Board also considered the Nuveen funds’ performance over various time periods throughout the year.
In addition to the portfolio management services provided to the Funds (including indirectly by overseeing the Sub-Adviser), the Board considered the extensive compliance, regulatory, administrative and other services the Adviser and its various teams or affiliates provide to manage and operate the applicable funds, including but not limited to: distribution management services pursuant to which management seeks to implement distribution policies and set distribution levels consistent with each fund’s product design and positioning; compliance services including establishing and maintaining broad-based compliance policies across the Nuveen fund complex, evaluating the compliance programs of various fund services providers, conducting ongoing risk assessments and testing, monitoring portfolio compliance with investment and regulatory requirements and providing a comprehensive compliance training program; providing regulatory advocacy services, including submitting comments on regulatory proposals and monitoring regulatory developments that may impact the fund(s); providing support to the Board and its committees throughout the year, including providing reports on a wide range of topics relating to the operations and management of the funds, helping to refine the materials provided to the Board and/or its committees and providing educational sessions on various topics; establishing and reviewing the services provided by other fund service providers (such as a fund’s custodian, accountant, and transfer agent); providing legal support services; and evaluating trade allocation and execution.
Such services also include managing leverage; providing capital management and secondary market services (such as implementing common share shelf offerings, capital return programs and common share repurchases); and maintaining a closed-end fund investor relations program. The Board considered that management actively monitors any discount from net asset value per share at which a fund’s common stock trades and evaluates potential avenues to mitigate the discount, including evaluating the level of distributions that the fund pays.
Aside from the services provided, the Board considered the financial resources of the Adviser and/or its affiliates and their willingness to make investments to support the funds. The Board considered the funds’ access to a seed capital budget provided by the Adviser and/or its affiliates to support new or existing funds and/or facilitate changes for a respective fund. The Board considered the benefits to shareholders of investing in a Fund that is a part of a large fund complex with a variety of investment disciplines, capabilities, and expertise. The Board considered the overall reputation and capabilities of the Adviser and its affiliates and the Adviser’s continuing commitment to provide high quality services.
In its review, the Board also considered the significant risks borne by the Adviser and its affiliates in connection with their services to the Nuveen funds, including entrepreneurial risks in sponsoring and supporting new funds and smaller funds and ongoing risks with managing the Funds, such as investment, operational, reputational, regulatory, compliance and litigation risks.
The Board considered the division of responsibilities between the Adviser and the Sub-Adviser and considered that the Sub-Adviser and its investment personnel, as noted, generally are responsible for the management of the respective Fund’s portfolio under the oversight of the Adviser and the Board. The Board considered an analysis of the Sub-Adviser provided by the Adviser which included, among other things, a summary of changes (if any) in the leadership teams and/or portfolio manager teams; the performance of the funds sub-advised by the Sub-Adviser over various periods of time that met certain performance screening measurements; and data reflecting product changes (if any) taken with respect to certain funds. The Board considered that the Adviser recommended the renewal of the Sub-Advisory Agreements.
Based on its review, the Board determined, in the exercise of its reasonable business judgment, that it was satisfied with the nature, extent and quality of services provided to the respective Funds under each applicable Advisory Agreement.
B. The Investment Performance of the Funds and Fund Advisers
In evaluating the quality of the services provided by the Fund Advisers, the Board also considered a variety of investment performance data of the Funds. In leading up to the annual review, the Board and/or its Investment Committee considered, among other things, Fund performance (based on net asset value net of fees) over the quarter, one-, three- and five-year periods ending December 31, 2024 on an absolute basis and as compared to the performance of comparable peers (the “Performance Peer Group”) and to a benchmark for the prescribed periods. Prior to the Meeting, the Board also received updated Fund performance over the quarter, one-, three- and five-year periods ended March 31, 2025 on an absolute basis and in comparison to the Performance Peer Group and a benchmark for the prescribed periods. In its review of relative performance, the Board considered a Fund’s performance relative to its Performance Peer Group, among other things, by evaluating its quartile ranking with the 1st quartile representing the top performing funds within the Performance Peer Group and the 4th quartile representing the lowest performing funds.
The Board took into account the performance data, presentations and discussions (written and oral) that were provided at the Meeting and in prior meetings over time in evaluating fund performance, including particular focus on management’s analysis of the performance of funds that met certain screening measurements as determined pursuant to a methodology approved by the Board or additional measurements as determined by management’s investment analysts. As various Nuveen funds have modified their portfolio teams and/or made significant changes to their portfolio strategies over time, the Board reviewed, among other things, certain tracking performance data over specific periods comparing performance before and after such changes.
In evaluating performance, the Board considered some of the limitations of the performance data. The Board considered, among other things, that performance data reflects performance over a specified period which may differ significantly depending on the ending dates selected, particularly during periods of market volatility. Further, the Board considered that regardless of the performance period reviewed by the Board, shareholders may evaluate performance based on their own respective holding periods which may differ from the performance periods reviewed by the Board and lead to differing results. With respect to comparative performance, the Board considered that differing investment objectives, investment
| 232 |
strategies, dates of inception, type and cost of leverage (if any), asset size and other factors between the Performance Peer Group and the respective Fund necessarily lead to differences in performance results. Similarly, differences in the investment objective(s) and strategies of a Fund and its benchmark (particularly an actively managed fund that does not directly follow an index) as well as the costs of operating a Fund would contribute to differences in performance results. To assist the Board in its review of the comparability of the relative performance, management generally has ranked the relevancy of the Performance Peer Groups to the applicable funds (subject to certain exceptions) as low, medium or high.
The Board also considered that secondary market trading of shares of the closed-end funds also continues to be a priority for the Board given its importance to shareholders, and therefore, the Board and/or its Closed-End Fund Committee reviews certain performance data reflecting, among other things, the premiums and discounts at which the shares of the closed-end funds have traded as of specified dates at their quarterly meetings with an annual review of the closed-end fund market for the 2024 calendar year at its February Meeting. In its review, the Board considered, among other things, market conditions for closed-end funds, changes to investment mandates and guidelines, distribution policies, and leverage management; additional share offerings, share repurchases (if any) and similar capital market actions; and effective communications programs to build greater awareness and deepen understanding of closed-end funds. As applicable, the Board considered, among other things, the impact of leverage on a closed-end fund’s common share earnings and total return.
The Board evaluated performance in light of various relevant factors which may include, among other things, general market conditions, issuer- specific information, asset class information, leverage and fund cash flows. The Board considered that long-term performance could be impacted by even one period of significant outperformance or underperformance and that a single investment theme could disproportionately affect performance. Further, the Board considered that market and economic conditions may significantly impact a Fund’s performance, particularly over shorter periods, and such performance may be more reflective of such economic or market events and not necessarily reflective of management skill. Although the Board reviews short-, intermediate- and longer-term performance data, the Board considered that longer periods of performance may reflect full market cycles.
In their review from year to year, the Board Members consider and may place different emphasis on the relevant information in light of changing circumstances in market and economic conditions. In evaluating performance, the Board focused particular attention on funds with less favorable performance records. However, depending on the facts and circumstances, including any differences between the respective fund and its benchmark and/or Performance Peer Group, the Board may be satisfied with a fund’s performance notwithstanding that its performance may be below that of its benchmark and/or peer group for certain periods. With respect to any funds for which the Board has identified performance issues, the Board seeks to monitor such funds more closely until performance improves, discuss with the Adviser the reasons for such results, consider whether any steps are necessary or appropriate to address such issues, discuss and evaluate the potential consequences of such steps and review the results of any steps undertaken.
The performance determinations with respect to each Fund are summarized below:
| • | For Nuveen Arizona Quality Municipal Income Fund, the Board considered that although the Fund’s performance was below the performance of its benchmark for the one-, three- and five-year periods ended December 31, 2024, the Fund ranked in the second quartile of its Performance Peer Group for the one- and three-year periods and first quartile for the five-year period ended December 31, 2024. In its review, the Board considered that the Performance Peer Group was classified as low for relevancy. On the basis of the Board’s ongoing review of investment performance and all relevant factors, including the relative market conditions during certain reporting periods, the Fund’s investment objective(s) and management’s discussion of performance, the Board concluded that the Fund’s performance supported renewal of the Advisory Agreements. |
| • | For Nuveen California AMT-Free Quality Municipal Income Fund, the Board considered that although the Fund’s performance was below the performance of its benchmark for the one-, three- and five-year periods ended December 31, 2024, the Fund ranked in the second quartile of its Performance Peer Group for the one-year period and third quartile for the three- and five-year periods ended December 31, 2024. On the basis of the Board’s ongoing review of investment performance and all relevant factors, including the relative market conditions during certain reporting periods, the Fund’s investment objective(s) and management’s discussion of performance, the Board concluded that the Fund’s performance supported renewal of the Advisory Agreements. |
| • | For Nuveen California Municipal Value Fund, the Board considered that although the Fund’s performance was below the performance of its benchmark for the three- and five-year periods ended December 31, 2024, the Fund outperformed its benchmark for the one-year period ended December 31, 2024. In addition, the Fund ranked in the first quartile of its Performance Peer Group for the one-, three- and five-year periods ended December 31, 2024. In its review, the Board considered that the Performance Peer Group was classified as low for relevancy. On the basis of the Board’s ongoing review of investment performance and all relevant factors, including the relative market conditions during certain reporting periods, the Fund’s investment objective(s) and management’s discussion of performance, the Board concluded that the Fund’s performance supported renewal of the Advisory Agreements. |
| • | For Nuveen California Quality Municipal Income Fund, the Board considered that although the Fund’s performance was below the performance of its benchmark for the one-, three- and five-year periods ended December 31, 2024, the Fund ranked in the third quartile of its Performance Peer Group for such periods. On the basis of the Board’s ongoing review of investment performance and all relevant factors, including the relative market conditions during certain reporting periods, the Fund’s investment objective(s) and management’s discussion of performance, the Board concluded that the Fund’s performance supported renewal of the Advisory Agreements. |
| 233 |
Statement Regarding Basis for Approval of Investment Advisory Contract (continued)
| • | For Nuveen New Jersey Quality Municipal Income Fund, the Board considered that although the Fund’s performance was below the performance of its benchmark for the one-, three- and five-year periods ended December 31, 2024, the Fund ranked in the third quartile of its Performance Peer Group for such periods. In its review, the Board considered that the Performance Peer Group was classified as low for relevancy. On the basis of the Board’s ongoing review of investment performance and all relevant factors, including the relative market conditions during certain reporting periods, the Fund’s investment objective(s) and management’s discussion of performance, the Board concluded that the Fund’s performance supported renewal of the Advisory Agreements. |
| • | For Nuveen New York AMT-Free Quality Municipal Income Fund, the Board considered that although the Fund’s performance was below the performance of its benchmark for the one-, three- and five-year periods ended December 31, 2024, the Fund ranked in the second quartile of its Performance Peer Group for the one- and five-year periods ended December 31, 2024 and third quartile for the three- year period ended December 31, 2024. On the basis of the Board’s ongoing review of investment performance and all relevant factors, including the relative market conditions during certain reporting periods, the Fund’s investment objective(s) and management’s discussion of performance, the Board concluded that the Fund’s performance supported renewal of the Advisory Agreements. |
| • | For Nuveen New York Municipal Value Fund , the Board considered that although the Fund’s performance was below the performance of its benchmark for the three- and five-year periods ended December 31, 2024, the Fund outperformed its benchmark for the one-year period ended December 31, 2024. In addition, the Fund ranked in the first quartile of its Performance Peer Group for the one-, three- and five-year periods ended December 31, 2024. In its review, the Board considered that the Performance Peer Group was classified as low for relevancy. On the basis of the Board’s ongoing review of investment performance and all relevant factors, including the relative market conditions during certain reporting periods, the Fund’s investment objective(s) and management’s discussion of performance, the Board concluded that the Fund’s performance supported renewal of the Advisory Agreements. |
| • | For Nuveen New York Quality Municipal Income Fund, the Board considered that although the Fund’s performance was below the performance of its benchmark for the one-, three- and five-year periods ended December 31, 2024, the Fund ranked in the second quartile of its Performance Peer Group for such periods. On the basis of the Board’s ongoing review of investment performance and all relevant factors, including the relative market conditions during certain reporting periods, the Fund’s investment objective(s) and management’s discussion of performance, the Board concluded that the Fund’s performance supported renewal of the Advisory Agreements. |
| • | For Nuveen Pennsylvania Quality Municipal Income Fund, the Board considered that although the Fund’s performance was below the performance of its benchmark for the one-, three- and five-year periods ended December 31, 2024, the Fund ranked in the third quartile of its Performance Peer Group for the one-year period ended December 31, 2024 and second quartile of its Performance Peer Group for the three- and five-year periods ended December 31, 2024. In its review, the Board considered that the Performance Peer Group was classified as low for relevancy. On the basis of the Board’s ongoing review of investment performance and all relevant factors, including the relative market conditions during certain reporting periods, the Fund’s investment objective(s) and management’s discussion of performance, the Board concluded that the Fund’s performance supported renewal of the Advisory Agreements. |
C. Fees, Expenses and Profitability
| 1. | Fees and Expenses |
As part of the annual review, the Board Members considered, among other things, the management fee schedules for the respective Fund. In addition to the management fee arrangements, the Board Members considered a Fund’s operating expense ratio as it more directly reflected a shareholder’s total costs in investing in the respective Fund.
In its review, the Board considered that the management fees of the Funds were generally comprised of two components, a fund-level component and a complex-level component, each with its own breakpoint schedule, subject to certain exceptions. The Board considered that in 2024, the Board approved a revised complex-wide breakpoint schedule which simplified and reduced the complex-level fee rates at various thresholds and expanded the eligible funds whose assets would be included in calculating the complex-level fee, effective May 1, 2024. The Board considered that the complex-level component is intended to be an efficient mechanism designed to help share cost efficiencies with shareholders as the complex-wide assets grow.
The Board also considered comparative fee and expense information prepared by an independent third-party provider of fund data. More specifically, the Board Members generally reviewed, among other things, each Fund’s management fee rates and net total expense ratio in relation to similar data for a comparable universe of peers (the “Expense Universe”). In their review, the Board Members considered, in particular, each fund with a net total expense ratio (based on common assets and excluding investment-related costs such as the costs of leverage and taxes) meeting certain expense screening criteria adopted by the Board when compared to its Expense Universe and management’s commentary as to the factors contributing to each such fund’s relative net total expense ratio. The Board also considered, in relevant part, a fund’s management fee in light of its performance history with particular focus on any fund identified as having a higher management fee and/or expense ratio compared to peers coupled with experiencing a period of challenged performance.
In their review, the Board Members considered the methodology Broadridge employed to establish its Expense Universe. The Board further considered that differences between the applicable Fund and its Expense Universe, as well as changes to the composition of the Expense Universe from year to year, may limit some of the value of the comparative data. The Board Members also considered that it can be difficult to compare management fees among funds with peers as there are variations in the services that are included for the fees paid. The Board Members took these limitations and differences into account when reviewing comparative peer data.
| 234 |
In addition, although the Board reviewed net total expense ratio both including and excluding investment-related expenses (e.g., leverage costs), as applicable, the Board considered that leverage expenses will vary across funds and peers because of differences in the forms and terms of leverage employed by the respective fund and therefore generally considered each closed-end fund’s net total expense ratio and fees excluding investment-related costs and taxes. The Board also considered that the use of leverage may create a conflict of interest for the respective Adviser and Sub-Adviser given the increase of assets from leverage upon which an advisory or sub-advisory fee is based but also considered the impact of leverage on the fund’s return. The Board Members considered, however, that the Adviser and Sub-Adviser would seek to manage the potential conflict by recommending to the Board to leverage the applicable fund or increase such leverage when the respective Fund Adviser has determined that such action would be in the best interests of the respective fund and its common shareholders and by periodically reviewing with the Board the fund’s performance and the impact of the use of leverage on that performance.
With respect to the Sub-Adviser, the Board also considered, among other things, the sub-advisory fee schedule paid to the Sub-Adviser in light of the sub-advisory services provided to the respective Fund. In its review, the Board considered that the compensation paid to the Sub-Adviser is the responsibility of the Adviser, not the Funds.
The Board’s considerations regarding the comparative fee data for each Fund are set forth below:
| • | For Nuveen Arizona Quality Municipal Income Fund, the Fund’s contractual management fee rate, actual management fee rate and net total expense ratio were each below the Expense Universe median. In its review, the Board, however, also considered, among other things, the composition of the Expense Universe, which was comprised of a small peer set with only two of the peers unaffiliated with Nuveen funds. |
| • | For Nuveen California AMT-Free Quality Municipal Income Fund, although the Fund’s actual management fee rate was above the Expense Universe median, the Fund’s contractual management fee rate matched and the net total expense ratio was slightly above (within 5 basis points) the Expense Universe median. |
| • | For Nuveen California Municipal Value Fund, the Fund’s contractual management fee rate, actual management fee rate and net total expense ratio were each below the Expense Universe median. |
| • | For Nuveen California Quality Municipal Income Fund, the Fund’s contractual management fee rate matched, the actual management fee rate was slightly above (within 5 basis points) and the net total expense ratio was below the Expense Universe median. |
| • | For Nuveen New Jersey Quality Municipal Income Fund, although the Fund’s actual management fee rate and net total expense ratio were each above the Expense Universe median, the Fund’s contractual management fee rate was slightly above (within 5 basis points) the Expense Universe median. In its review, the Board, however, considered, among other things, that there was only one peer other than the Fund in the Expense Universe. |
| • | For Nuveen New York AMT-Free Quality Municipal Income Fund, although the Fund’s actual management fee rate was above the Expense Universe median, the Fund’s contractual management fee rate was slightly above (within 5 basis points) the Expense Universe median, and the Fund’s net total expense ratio was below the Expense Universe median. |
| • | For Nuveen New York Municipal Value Fund, the Fund’s contractual management fee rate, actual management fee rate and net total expense ratio were each below the Expense Universe median. |
| • | For Nuveen New York Quality Municipal Income Fund, although the Fund’s actual management fee rate was above the Expense Universe median, the Fund’s contractual management fee rate and net total expense ratio were slightly above (within 5 basis points) the Expense Universe median. |
| • | For Nuveen Pennsylvania Quality Municipal Income Fund, although the Fund’s actual management fee rate was above the Expense Universe median, the Fund’s contractual management fee rate was slightly above (within 5 basis points) the Expense Universe median, and the net total expense ratio matched the Expense Universe median. In its review, the Board, however, considered, among other things, that there were only two peers other than the Fund in the Expense Universe. |
Based on its review of the information provided, the Board determined that each Fund’s management fees (as applicable) to a Fund Adviser were reasonable in light of the nature, extent and quality of services provided to the Fund.
| 235 |
Statement Regarding Basis for Approval of Investment Advisory Contract (continued)
| 2. | Comparisons with the Fees of Other Clients |
In evaluating the appropriateness of fees, the Board also considered that the Adviser, the Sub-Adviser and/or their affiliate(s) provide investment management services to other types of clients which may include, among others: separately managed accounts (“SMAs”), retail managed accounts, foreign funds (UCITS), other investment companies (as sub-advisers), limited partnerships and collective investment trusts. The Board considered certain fee data for these other types of clients managed in a similar manner to certain of the funds compared to the management fee of the applicable fund. The Board considered a description of various factors which contribute to the differences in the management fee rates of the funds compared to those charged to these other types of clients which limited the comparability of the data. In this regard, the Board considered that the differences in, among other things, the breadth of services provided by the Adviser and its affiliates to the funds compared to those provided to other clients; the expenses the Adviser and its affiliates incur in launching, operating and supporting a fund; the support services provided to shareholders; the extensive regulatory, disclosure and governance requirements applicable to funds; the establishment and maintenance of servicing relationships with various service providers for the funds; the manner of managing such assets; investment policies; investor profiles; and account sizes all may contribute to the variations in relative fee rates. Differences in the level of advisory services required for passively managed funds also contribute to differences in the management fee levels of such funds compared to actively managed funds. In addition, differences in the client base; governing bodies, regulatory and legal requirements; distribution; jurisdiction and operational complexities also would contribute to variations in management fees assessed the funds compared to foreign fund clients. Further, differences in the level of advisory and non-advisory services required and risk incurred when serving as a sub-adviser to other investment companies compared to serving as the Adviser to a Nuveen fund contribute to differences in the fees assessed. In this regard, the Board further considered the significant entrepreneurial, legal and regulatory risks that the Adviser incurs in sponsoring and managing the Funds. As a general matter, higher fee levels reflect higher levels of service provided by the Adviser, increased investment management complexity, greater product management requirements, and higher levels of business risk or some combination of these factors. The Board further considered that the Sub-Adviser’s fee is essentially for portfolio management services and therefore more comparable to the fees received for retail wrap accounts and other external sub-advisory mandates. The Board concluded that the varying levels of fees were reasonable given the foregoing.
| 3. | Profitability of the Fund Advisers |
In considering the costs of services to be provided and profits to be realized by the Adviser (which encompassed the Sub-Adviser) from its relationship with the Funds, the Board Members considered a variety of estimated profitability data from various perspectives including, among other things, (a) historical pre-distribution and post-distribution margins over specified periods for the Adviser’s services to the applicable funds; (b) certain profitability data on behalf of the Adviser attributable to servicing all applicable funds for 2024 and 2023; (c) certain profitability data of both the Adviser and TAL (as an adviser of certain other Nuveen funds) on a combined basis derived from types of funds in the aggregate (i.e., from closed-end funds, exchange-traded funds, interval funds and open-end funds) for 2024 and 2023; and (d) certain profitability data of both the Adviser and TAL on a combined basis by asset grouping of Nuveen funds in the aggregate (i.e., from equity, fund of funds, index, municipal bond and taxable fixed income funds). In addition, the Board considered profitability data at the per fund level for the respective adviser.
In reviewing the profitability data, the Board Members considered the subjective nature of calculating profitability as the information is not audited and is necessarily dependent on cost allocation methodologies to allocate expenses throughout the complex and among the various advisory products. The Board reviewed, among other things, a description of the cost allocation methodology employed to develop the profitability data. However, the Board Members considered that given there is no single universally recognized expense allocation methodology, other reasonable and valid allocation methodologies could be employed and could lead to significantly different profit and loss results and therefore developing profitability data is difficult, particularly on a per fund level.
Further, in considering the comparative margin data with peers, the Board Members considered the limitations of the comparative data given that peer data is not generally public and the calculation of profitability is subjective and affected by numerous factors (such as types of funds a peer manages, its business mix, its cost of capital, the numerous assumptions underlying the methodology used to allocate expenses and other factors) that can have a significant impact on the results. Given that the peer profitability data may reflect the different business mix of the respective peer firm, the Board also considered the pre- and post-distribution margins of Nuveen, LLC for each of the calendar years from 2020 through 2024.
Aside from the foregoing profitability data, the Board also considered, among other things, the audited statutory-basis financial statements of TIAA as of December 31, 2024 and 2023 and the related statutory-basis statements of operations, of changes in capital and contingency reserves and of cash flows for the years ended December 31, 2024, December 31, 2023 and December 31, 2022. The Board considered the benefit of an investment adviser and its parent with significant resources, particularly during periods of market volatility. The Board also considered the investments the Adviser, its parent and/or other affiliates made into their business.
In evaluating the reasonableness of the compensation, the Board Members also considered the indirect benefits the Adviser or Sub-Adviser received that were directly attributable to the management of the applicable funds as discussed in further detail below. Based on its review, the Board was satisfied that the Adviser’s (together with the Sub-Adviser) level of profitability from its relationship with the applicable Fund was not unreasonable in light of the nature, extent and quality of services provided.
D. Economies of Scale and Whether Fee Levels Reflect These Economies of Scale
The Board considered whether there have been economies of scale with respect to the management of the funds, whether these economies of scale have been appropriately shared with the funds and whether there is potential for realization of further economies of scale. Although the Board considered that economies of scale are difficult to measure with any precision and the rates at which certain expenses are incurred may not decline
236
with a rise in assets, the Board considered that there are a variety of methods that may be employed to help share the benefits of economies of scale, including, among other things, through the use of breakpoints in the management fee schedule, the pricing of funds at scale at inception and investments in the Adviser’s business which can enhance the services provided to the funds for the fees paid. The Board considered such factors applicable to the particular Fund’s advisory fee structure.
As noted above, the Board considered that the management fee of the Adviser for the Funds generally was comprised of a fund-level component and a complex-level component each with its own breakpoint schedule. The Board also approved a revised complex-wide breakpoint schedule in 2024 which reduced the complex-level fee rates at various thresholds and expanded the assets included when calculating the complex-level fee. With this structure, the Board considered that the complex-level breakpoint schedule was designed to deliver the benefits of economies of scale to shareholders when the assets of the eligible participating funds in the complex pass certain thresholds even if the assets of a particular fund are unchanged or have declined, and the fund-level breakpoint schedules were designed to share economies of scale with shareholders if the particular fund grows. The Board reviewed the fund-level and complex-level fee schedules.
Although closed-end funds may make additional share offerings from time to time, the Board considered that closed-end funds have a more limited ability to increase their assets to attain additional economies of scale because the growth of their assets will occur primarily from the appreciation of their investment portfolios.
The Board Members also considered the continued reinvestment in Nuveen’s business to enhance its capabilities and services to the benefit of its various clients. The Board considered that many of these investments were not specific to individual Nuveen funds, but rather initiatives from which the family of funds as a whole may benefit. The Board further considered that the scope of the services of the Adviser and its affiliates have expanded over time without raising advisory fees to the funds, and this was also a means of sharing economies of scale with the funds and their shareholders. The Board considered the Adviser’s and/or its affiliates’ ongoing efforts to streamline the product line-up, among other things, to create more scaled funds which may help improve both expense and trading economies for participating funds.
Based on its review, the Board was satisfied that the current fee arrangements together with the reinvestment in management’s business appropriately shared any economies of scale with shareholders.
E. Indirect Benefits
The Board Members received and considered information regarding various indirect benefits the respective Fund Adviser or its affiliates may receive as a result of their relationship with the funds. These benefits included, among other things, economies of scale to the extent the Adviser or its affiliates share investment resources and/or personnel with other clients of the Adviser. Certain funds may also be used as investment options for other products or businesses offered by the Adviser and/or its affiliates, such as variable products, fund of funds and 529 education savings plans, and the Adviser and/or affiliates of the Adviser may serve as sub-adviser to various funds in which case all advisory and sub-advisory fees generated by such funds stay within Nuveen.
Further, the funds may pay the Adviser and/or its affiliates for other services, such as distribution. In this regard, the Board considered that an affiliate of the Adviser received compensation in 2024 for serving as an underwriter on shelf offerings of existing closed-end funds and reviewed the amounts paid for such services in 2024 and 2023.
In addition, the Board Members considered that the Adviser and Sub-Adviser (except as noted) may utilize soft dollar brokerage arrangements attributable to the respective fund(s) to obtain research and other services for any or all of their clients, although the Board Members also considered with respect to the Nuveen funds advised by the Adviser, reimbursements of such costs by the Adviser and/or the Sub-Adviser.
The Adviser and its affiliates may also benefit from the advisory relationships with the Nuveen funds to the extent this relationship results in potential investors viewing the TIAA group of companies as a leading retirement plan provider in the academic and nonprofit market and a single source for all their financial service needs. The Adviser and/or its affiliates may further benefit to the extent that they have pricing or other information regarding vendors the funds utilize in establishing arrangements with such vendors for other products.
Based on its review, the Board concluded that any indirect benefits received by a Fund Adviser as a result of its relationship with the Funds were reasonable in light of the services provided.
F. Other Considerations
The Board Members did not identify any single factor discussed previously as all-important or controlling. The Board Members concluded that the terms of each Advisory Agreement were reasonable, that the respective Fund Adviser’s fees were reasonable in light of the services provided to each Fund and that the Advisory Agreements be renewed for an additional one-year period.
237
Board Members & Officers
(Unaudited)
The management of the Funds, including general supervision of the duties performed for the Funds by the Adviser, is the responsibility of the Board of Trustees of the Funds. None of the trustees who are not “interested” persons of the Funds (referred to herein as “independent board members”) has ever been a director or employee of, or consultant to, Nuveen or its affiliates. The names and business addresses of the trustees and officers of the Funds, their principal occupations and other affiliations during the past five years, the number of portfolios each Trustee oversees and other directorships they hold are set forth below.
| Name, Year of Birth & Address |
Position(s) Held with the Funds |
Year First Elected or Appointed and Term(1) | Principal Occupation(s) Including other Directorships During Past 5 Years |
Number of Portfolios in Fund Complex Overseen By Board Member | ||||
| Independent Trustees: | ||||||||
| Joseph A. Boateng 1963 333 W. Wacker Drive Chicago, IL 60606 |
Board Member | 2019 Class II |
Chief Investment Officer, Casey Family Programs (since 2007); formerly, Director of U.S. Pension Plans, Johnson & Johnson (2002–2006); Board Member, Lumina Foundation (since 2019) and Waterside School (since 2021); Board Member (2012–2019) and Emeritus Board Member (since 2020), Year-Up Puget Sound; Investment Advisory Committee Member and Former Chair (since 2007), Seattle City Employees’ Retirement System; Investment Committee Member (since 2019), The Seattle Foundation; Trustee (2018–2023), the College Retirement Equities Fund; Manager (2019–2023), TIAA Separate Account VA-1. | 219 | ||||
| Michael A. Forrester 1967 333 W. Wacker Drive Chicago, IL 60606 |
Board Member | 2007 Class I |
Formerly, Chief Executive Officer (2014–2021) and Chief Operating Officer (2007–2014), Copper Rock Capital Partners, LLC; Director, Aflac Incorporated (since 2025); Trustee, Dexter Southfield School (since 2019); Member (since 2020), Governing Council of the Independent Directors Council (IDC); Trustee, the College Retirement Equities Fund and Manager, TIAA Separate Account VA-1 (2007–2023). | 219 | ||||
| Thomas J. Kenny 1963 333 W. Wacker Drive Chicago, IL 60606 |
Board Member | 2011 Class I |
Formerly, Advisory Director (2010–2011), Partner (2004–2010), Managing Director (1999–2004) and Co-Head of Global Cash and Fixed Income Portfolio Management Team (2002–2010), Goldman Sachs Asset Management; Director (since 2015) and Chair of the Finance and Investment Committee (since 2018), Aflac Incorporated; Director (since 2018), ParentSquare; formerly, Director (2021–2022) and Finance Committee Chair (2016–2022), Sansum Clinic; formerly, Advisory Board Member (2017–2019), B’Box; formerly, Member (2011–2012), the University of California at Santa Barbara Arts and Lectures Advisory Council; formerly, Investment Committee Member (2012–2020), Cottage Health System; formerly, Board member (2009–2019) and President of the Board (2014–2018), Crane Country Day School; Trustee (2011– 2023) and Chairman (2017–2023), the College Retirement Equities Fund; Manager (2011–2023) and Chairman (2017–2023), TIAA Separate Account VA-1. | 220 | ||||
| Amy B. R. Lancellotta 1959 333 W. Wacker Drive Chicago, IL 60606 |
Board Member | 2021 Class II |
Formerly, Managing Director, IDC (supports the fund independent director community and is part of the Investment Company Institute (ICI), which represents regulated investment companies) (2006-2019); formerly, various positions with ICI (1989-2006); President (since 2023) and Member (since 2020) of the Board of Directors, Jewish Coalition Against Domestic Abuse (JCADA). | 220 |
238
| Name, Year of Birth & Address |
Position(s) Held with the Funds |
Year First Elected or Appointed and Term(1) |
Principal Occupation(s) Including other Directorships During Past 5 Years |
Number of Portfolios in Fund Complex Overseen By Board Member | ||||
| Joanne T. Medero 1954 333 W. Wacker Drive Chicago, IL 60606 |
Board Member | 2021 Class III |
Formerly, Managing Director, Government Relations and Public Policy (2009-2020) and Senior Advisor to the Vice Chairman (2018- 2020), BlackRock, Inc. (global investment management firm); formerly, Managing Director, Global Head of Government Relations and Public Policy, Barclays Group (IBIM) (investment banking, investment management and wealth management businesses) (2006-2009); formerly, Managing Director, Global General Counsel and Corporate Secretary, Barclays Global Investors (global investment management firm) (1996-2006); formerly, Partner, Orrick, Herrington & Sutcliffe LLP (law firm) (1993-1995); formerly, General Counsel, Commodity Futures Trading Commission (government agency overseeing U.S. derivatives markets) (1989-1993); formerly, Deputy Associate Director/Associate Director for Legal and Financial Affairs, Office of Presidential Personnel, The White House (1986-1989); Member of the Board of Directors, Baltic-American Freedom Foundation (seeks to provide opportunities for citizens of the Baltic states to gain education and professional development through exchanges in the U.S.) (since 2019). | 220 | ||||
| Albin F. Moschner 1952 333 W. Wacker Drive Chicago, IL 60606 |
Board Member | 2016 Class III |
Founder and Chief Executive Officer, Northcroft Partners, LLC, (management consulting) (since 2012); formerly, Chairman (2019), and Director (2012-2019), USA Technologies, Inc., (provider of solutions and services to facilitate electronic payment transactions); formerly, Director, Wintrust Financial Corporation (1996-2016); previously, held positions at Leap Wireless International, Inc. (consumer wireless services), including Consultant (2011-2012), Chief Operating Officer (2008-2011), and Chief Marketing Officer (2004-2008); formerly, President, Verizon Card Services division of Verizon Communications, Inc. (2000-2003); formerly, President, One Point Services at One Point Communications (telecommunication services) (1999-2000); formerly, Vice Chairman of the Board, Diba, Incorporated (internet technology provider) (1996-1997); formerly, various executive positions (1991-1996) including Chief Executive Officer (1995-1996) of Zenith Electronics Corporation (consumer electronics). | 220 | ||||
| John K. Nelson 1962 333 W. Wacker Drive Chicago, IL 60606 |
Board Member | 2013 Class II |
Formerly, Member of Board of Directors of Core12 LLC (2008– 2023) (private firm which develops branding, marketing and communications strategies for clients); formerly, Member of The President’s Council of Fordham University (2010–2019); formerly, Director of the Curran Center for Catholic American Studies (2009–2018); formerly, senior external advisor to the Financial Services practice of Deloitte Consulting LLP. (2012–2014); formerly, Trustee and Chairman of the Board of Trustees of Marian University (2010–2013); formerly Chief Executive Officer of ABN AMRO Bank N.V., North America, and Global Head of the Financial Markets Division (2007–2008), with various executive leadership roles in ABN AMRO Bank N.V. between 1996 and 2007. | 220 |
239
Board Members & Officers (continued)
| Name, Year of Birth & Address |
Position(s) Held with the Funds |
Year First Elected or Appointed and Term(1) | Principal Occupation(s) Including other Directorships During Past 5 Years |
Number of Portfolios in Fund Complex Overseen By Board Member | ||||
| Loren M. Starr 1961 333 W. Wacker Drive Chicago, IL 60606 |
Board Member | 2022 Class III |
Independent Consultant/Advisor (since 2021); formerly, Vice Chair, Senior Managing Director (2020–2021), Chief Financial Officer, Senior Managing Director (2005–2020), Invesco Ltd.; Director (since 2023) and Chair of the Board (since 2025), formerly, Chair of the Audit Committee (2024-2025), AMG; formerly, Chair and Member of the Board of Directors (2014–2021), Georgia Leadership Institute for School Improvement (GLISI); formerly, Chair and Member of the Board of Trustees (2014–2018), Georgia Council on Economic Education (GCEE); Trustee, the College Retirement Equities Fund and Manager, TIAA Separate Account VA-1 (2022–2023). | 219 | ||||
| Matthew Thornton III 1958 333 W. Wacker Drive Chicago, IL 60606 |
Board Member | 2020 Class III |
Formerly, Executive Vice President and Chief Operating Officer (2018-2019), FedEx Freight Corporation, a subsidiary of FedEx Corporation (FedEx) (provider of transportation, e-commerce and business services through its portfolio of companies); formerly, Senior Vice President, U.S. Operations (2006-2018), Federal Express Corporation, a subsidiary of FedEx; formerly Member of the Board of Directors (2012-2018), Safe Kids Worldwide® (a non-profit organization dedicated to preventing childhood injuries). Member of the Board of Directors (since 2014), The Sherwin-Williams Company (develops, manufactures, distributes and sells paints, coatings and related products); Director (since 2020), Crown Castle International (provider of communications infrastructure). | 220 | ||||
| Terence J. Toth 1959 333 W. Wacker Drive Chicago, IL 60606 |
Board Member | 2008 Class II |
Formerly, a Co–Founding Partner, Promus Capital (investment advisory firm) (2008–2017); formerly, Director, Quality Control Corporation (manufacturing) (2012–2021); formerly, Chair and Member of the Board of Directors (2021–2024), Kehrein Center for the Arts (philanthropy); Member of the Board of Directors (since 2008), Catalyst Schools of Chicago (philanthropy); Member of the Board of Directors (since 2012), formerly, Investment Committee Chair (2017–2022), Mather Foundation Board (philanthropy); formerly, Member (2005–2016), Chicago Fellowship Board (philanthropy); formerly, Director, Fulcrum IT Services LLC (information technology services firm to government entities) (2010–2019); formerly, Director, LogicMark LLC (health services) (2012–2016); formerly, Director, Legal & General Investment Management America, Inc. (asset management) (2008–2013); formerly, CEO and President, Northern Trust Global Investments (financial services) (2004–2007); Executive Vice President, Quantitative Management & Securities Lending (2000–2004); prior thereto, various positions with Northern Trust Company (financial services) (since 1994); formerly, Member, Northern Trust Mutual Funds Board (2005–2007), Northern Trust Global Investments Board (2004–2007), Northern Trust Japan Board (2004–2007), Northern Trust Securities Inc. Board (2003–2007) and Northern Trust Hong Kong Board (1997–2004). | 220 | ||||
240
| Name, Year of Birth & Address |
Position(s) Held with the Funds |
Year First Elected or Appointed and Term(1) |
Principal Occupation(s) Including other Directorships During Past 5 Years |
Number of Portfolios in Fund Complex Overseen By Board Member | ||||
| Margaret L. Wolff 1955 333 W. Wacker Drive Chicago, IL 60606 |
Board Member | 2016 Class I |
Formerly, member of the Board of Directors (2013-2017) of Travelers Insurance Company of Canada and The Dominion of Canada General Insurance Company (each, a part of Travelers Canada, the Canadian operation of The Travelers Companies, Inc.); formerly, Of Counsel, Skadden, Arps, Slate, Meagher & Flom LLP (Mergers & Acquisitions Group) (legal services) (2005- 2014); Member of the Board of Trustees of New York-Presbyterian Hospital (since 2005); Member of the Board of Trustees (since 2004) formerly, Chair (2015-2022) of The John A. Hartford Foundation (a philanthropy dedicated to improving the care of older adults); formerly, Member (2005-2015) and Vice Chair (2011- 2015) of the Board of Trustees of Mt. Holyoke College. | 220 | ||||
| Robert L. Young 1963 333 W. Wacker Drive Chicago, IL 60606 |
Chair and Board Member | 2017 Class I |
Formerly, Chief Operating Officer and Director, J.P. Morgan Investment Management Inc. (financial services) (2010-2016); formerly, President and Principal Executive Officer (2013-2016), and Senior Vice President and Chief Operating Officer (2005-2010), of J.P. Morgan Funds; formerly, Director and various officer positions for J.P. Morgan Investment Management Inc. (formerly, JPMorgan Funds Management, Inc. and formerly, One Group Administrative Services) and JPMorgan Distribution Services, Inc. (financial services) (formerly, One Group Dealer Services, Inc.) (1999-2017). | 220 | ||||
| Name, Year of Birth & Address |
Position(s) Held with the Funds |
Year First Elected or Appointed(2) |
Principal Occupation(s) Including other Directorships During Past 5 Years |
|||||
| Officers of the Funds: | ||||||||
| David J. Lamb 1963 333 W. Wacker Drive Chicago, IL 60606 |
Chief Administrative Officer (Principal Executive Officer) |
2015 | Senior Managing Director of Nuveen Fund Advisors, LLC, Nuveen Securities, LLC and Nuveen; has previously held various positions with Nuveen. | |||||
| Brett E. Black 1972 333 W. Wacker Drive Chicago, IL 60606 |
Vice President and Chief Compliance Officer |
2022 | Managing Director, Chief Compliance Officer of Nuveen; formerly, Vice President (2014-2022), Chief Compliance Officer and Anti-Money Laundering Compliance Officer (2017-2022) of BMO Funds, Inc. | |||||
| Marc Cardella 1984 8500 Andrew Carnegie Blvd. Charlotte, NC 28262 |
Vice President and Controller (Principal Financial Officer) |
2024 | Senior Managing Director, Head of Public Investment Finance of Nuveen; Senior Managing Director of Nuveen Fund Advisors, LLC, Nuveen Asset Management, LLC, Teachers Advisors, LLC and TIAA-CREF Investment Management, LLC, Managing Director of Teachers Insurance and Annuity Association of America and TIAA SMA Strategies LLC; Principal Financial Officer, Principal Accounting Officer and Treasurer of TIAA Separate Account VA-1 and the College Retirement Equities Fund. | |||||
| Joseph T. Castro 1964 333 W. Wacker Drive Chicago, IL 60606 |
Vice President | 2025 | Executive Vice President, Chief Risk and Compliance Officer, formerly, Senior Managing Director and Head of Compliance, Nuveen; Executive Vice President, formerly, Senior Managing Director, Nuveen Securities, LLC; Senior Managing Director, Nuveen Fund Advisors, LLC and Nuveen, LLC. | |||||
| Mark J. Czarniecki 1979 901 Marquette Avenue Minneapolis, MN 55402 |
Vice President and Assistant Secretary |
2013 | Managing Director and Assistant Secretary of Nuveen Securities, LLC and Nuveen Fund Advisors, LLC; Managing Director and Associate General Counsel of Nuveen; Managing Director, Assistant Secretary and Associate General Counsel of Nuveen Asset Management, LLC; has previously held various positions with Nuveen; Managing Director, Associate General Counsel and Assistant Secretary of Teachers Advisors, LLC and TIAA-CREF Investment Management, LLC. | |||||
| 241 |
Board Members & Officers (continued)
| Name, Year of Birth & Address |
Position(s) Held with the Funds |
Year First Elected or Appointed(2) |
Principal Occupation(s) Including other Directorships During Past 5 Years | |||
| Jeremy D. Franklin 1983 8500 Andrew Carnegie Blvd. Charlotte, NC 28262 |
Vice President and Assistant Secretary |
2024 | Managing Director and Assistant Secretary, Nuveen Fund Advisors, LLC; Managing Director, Associate General Counsel and Assistant Secretary, Nuveen Asset Management, LLC, Teachers Advisors, LLC and TIAA-CREF Investment Management, LLC; Vice President and Associate General Counsel, Teachers Insurance and Annuity Association of America; Vice President and Assistant Secretary, TIAA-CREF Funds and TIAA-CREF Life Funds; Vice President, Associate General Counsel, and Assistant Secretary, TIAA Separate Account VA-1 and College Retirement Equities Fund. | |||
| Diana R. Gonzalez 1978 8500 Andrew Carnegie Blvd. Charlotte, NC 28262 |
Vice President and Assistant Secretary |
2017 | Vice President and Assistant Secretary of Nuveen Fund Advisors, LLC; Vice President, Associate General Counsel and Assistant Secretary of Nuveen Asset Management, LLC, Teachers Advisors, LLC and TIAA-CREF Investment Management, LLC; Vice President and Associate General Counsel of Nuveen. | |||
| Nathaniel T. Jones 1979 333 W. Wacker Drive Chicago, IL 60606 |
Vice President | 2016 | Senior Managing Director, Head of Public Product of Nuveen; President. formerly, Senior Managing Director, of Nuveen Fund Advisors, LLC; has previously held various positions with Nuveen; Chartered Financial Analyst. | |||
| Brian H. Lawrence 1982 8500 Andrew Carnegie Blvd. Charlotte, NC 28262 |
Vice President and Assistant Secretary |
2023 | Vice President and Associate General Counsel of Nuveen; Vice President, Associate General Counsel and Assistant Secretary of Teachers Advisors, LLC and TIAA-CREF Investment Management, LLC; formerly Corporate Counsel of Franklin Templeton (2018-2022). | |||
| Tina M. Lazar 1961 333 W. Wacker Drive Chicago, IL 60606 |
Vice President | 2002 | Managing Director of Nuveen Securities, LLC. | |||
| Brian J. Lockhart 1974 333 W. Wacker Drive Chicago, IL 60606 |
Vice President | 2019 | Senior Managing Director and Head of Investment Oversight of Nuveen; Senior Managing Director of Nuveen Fund Advisors, LLC; has previously held various positions with Nuveen; Chartered Financial Analyst and Certified Financial Risk Manager. | |||
| John M. McCann 1975 8500 Andrew Carnegie Blvd. Charlotte, NC 28262 |
Vice President and Assistant Secretary |
2022 | Senior Managing Director, Division General Counsel of Nuveen; Senior Managing Director, General Counsel and Secretary of Nuveen Fund Advisors, LLC; Senior Managing Director, Associate General Counsel and Assistant Secretary of Nuveen Asset Management, LLC Teachers Advisors, LLC and TIAA-CREF Investment Management, LLC; Managing Director and Assistant Secretary of TIAA SMA Strategies LLC; Managing Director, Associate General Counsel and Assistant Secretary of College Retirement Equities Fund, TIAA Separate Account VA-1, TIAA-CREF Funds, TIAA-CREF Life Funds, Teachers Insurance and Annuity Association of America and Nuveen Alternative Advisors LLC; has previously held various positions with Nuveen/TIAA. | |||
| Kevin J. McCarthy 1966 333 W. Wacker Drive Chicago, IL 60606 |
Vice President and Assistant Secretary |
2007 | Executive Vice President, Secretary and General Counsel of Nuveen Investments, Inc.; Executive Vice President and Assistant Secretary of Nuveen Securities, LLC and Nuveen Fund Advisors, LLC; Executive Vice President and Secretary of Nuveen Asset Management, LLC, Teachers Advisors, LLC, TIAA-CREF Investment Management, LLC and Nuveen Alternative Investments, LLC; Executive Vice President, Associate General Counsel and Assistant Secretary of TIAA-CREF Funds and TIAA-CREF Life Funds; has previously held various positions with Nuveen; Vice President and Secretary of Winslow Capital Management, LLC; formerly, Vice President (2007-2021) and Secretary (2016-2021) of NWQ Investment Management Company, LLC and Santa Barbara Asset Management, LLC. | |||
| R. Tanner Page 1985 333 W. Wacker Drive Chicago, IL 60606 |
Vice President and Treasurer |
2025 | Managing Director, formerly, Vice President of Nuveen; has previously held various positions with Nuveen. | |||
| William A. Siffermann 1975 333 W. Wacker Drive Chicago, IL 60606 |
Vice President | 2017 | Senior Managing Director of Nuveen. |
| 242 |
| Name, Year of Birth & Address |
Position(s) Held with the Funds |
Year First Elected or Appointed(2) | Principal Occupation(s) Including other Directorships During Past 5 Years | |||
| Mark L. Winget 1968 333 W. Wacker Drive Chicago, IL 60606 |
Vice President and Secretary |
2008 | Vice President and Assistant Secretary of Nuveen Securities, LLC and Nuveen Fund Advisors, LLC; Vice President, Associate General Counsel and Assistant Secretary of Teachers Advisors, LLC and TIAA-CREF Investment Management, LLC and Nuveen Asset Management, LLC; Vice President and Associate General Counsel of Nuveen. | |||
| Rachael Zufall 1973 8500 Andrew Carnegie Blvd. Charlotte, NC 28262 |
Vice President and Assistant Secretary |
2022 | Managing Director and Assistant Secretary of Nuveen Fund Advisors, LLC; Managing Director, Associate General Counsel and Assistant Secretary of the College Retirement Equities Fund, TIAA Separate Account VA-1, TIAA-CREF Funds and TIAA-CREF Life Funds; Managing Director, Associate General Counsel and Assistant Secretary of Teacher Advisors, LLC and TIAA-CREF Investment Management, LLC; Managing Director of Nuveen, LLC and of TIAA. |
| (1) | The Board of Trustees is divided into three classes, Class I, Class II, and Class III, with each being elected to serve until the third succeeding annual shareholders’ meeting subsequent to its election or thereafter in each case when its respective successors are duly elected or appointed, except two board members are elected by the holders of Preferred Shares, when applicable, to serve until the next annual shareholders’ meeting subsequent to its election or thereafter in each case when its respective successors are duly elected or appointed. The year first elected or appointed represents the year in which the board member was first elected or appointed to any fund in the Nuveen complex. |
| (2) | Officers serve indefinite terms until their successor has been duly elected and qualified, their death or their resignation or removal. The year first elected or appointed represents the year in which the Officer was first elected or appointed to any fund in the Nuveen Complex. |
| 243 |

Nuveen:
Serving Investors for Generations
Since 1898, financial advisors and their clients have relied on Nuveen to provide dependable investment solutions through continued adherence to proven, long-term investing principles. Today, we offer a range of high quality solutions designed to be integral components of a well-diversified core portfolio.
Focused on meeting investor needs.
Nuveen is the investment manager of TIAA. We have grown into one of the world’s premier global asset managers, with specialist knowledge across all major asset classes and particular strength in solutions that provide income for investors and that draw on our expertise in alternatives and responsible investing. Nuveen is driven not only by the independent investment processes across the firm, but also the insights, risk management, analytics and other tools and resources that a truly world-class platform provides. As a global asset manager, our mission is to work in partnership with our clients to create solutions which help them secure their financial future.
Find out how we can help you.
To learn more about how the products and services of Nuveen may be able to help you meet your financial goals, talk to your financial advisor, or call us at (800) 257-8787. Please read the information provided carefully before you invest. Investors should consider the investment objective and policies, risk considerations, charges and expenses of any investment carefully. Where applicable, be sure to obtain a prospectus, which contains this and other relevant information. To obtain a prospectus, please contact your securities representative or Nuveen, 333 W. Wacker Dr., Chicago, IL 60606. Please read the prospectus carefully before you invest or send money.
Learn more about Nuveen Funds at: www.nuveen.com/closed-end-funds
NOT FDIC INSURED MAY LOSE VALUE NO BANK GUARANTEE
| Nuveen Securities, LLC, member FINRA and SIPC |333 West Wacker Drive | Chicago, IL 60606 |www.nuveen.com | EAN-A-0825P | 4786774 |