
Annual Report 2021
March 10, 2022

| Term |
Definition | |
| “Big 3” segments |
Our combined Legal Professionals, Corporates and Tax & Accounting Professionals segments | |
| Blackstone’s consortium |
The Blackstone Group and its subsidiaries, and private equity funds affiliated with Blackstone | |
| bp |
Basis points – one basis point is equal to 1/100 th of 1%, “100bp” is equivalent to 1% | |
| Change Program |
A two-year initiative focused on transforming our company from a holding company to an operating company and from a content provider into a content-driven technology company | |
| constant currency |
A non-IFRS measure derived by applying the same foreign currency exchange rates to the financial results of the current and equivalent prior-year period | |
| COVID-19 |
A novel strain of coronavirus that was characterized a pandemic by the World Health Organization during March 2020 | |
| EPS |
Earnings per share | |
| F&R |
Our former Financial & Risk business, now the Refinitiv business of LSEG | |
| IFRS |
International Financial Reporting Standards | |
| LSEG | London Stock Exchange Group plc | |
| n/a |
Not applicable | |
| n/m |
Not meaningful | |
| organic or organically |
A non-IFRS measure that represents changes in revenues of our existing businesses at constant currency. The metric excludes the distortive impacts of acquisitions and dispositions from not owning the business in both comparable periods | |
| Refinitiv |
Our former F&R business, which is now the Refinitiv business of LSEG. We owned 45% of Refinitiv from October 1, 2018 through January 29, 2021 | |
| YPL |
York Parent Limited, the entity that owns LSEG shares, which is jointly owned by our company and the Blackstone consortium. A group of current LSEG and former members of Refinitiv senior management also owns part of YPL. References to YPL also include its subsidiaries. YPL was previously known as Refinitiv Holdings Limited prior to the sale of Refinitiv to LSEG on January 29, 2021. | |
| $ and US$ |
U.S. dollars | |
| 2 | ||||
| 2 | ||||
| 6 | ||||
| 6 | ||||
| 7 | ||||
| 7 | ||||
| 8 | ||||
| 8 | ||||
| 8 | ||||
| 10 | ||||
| 10 | ||||
| 10 | ||||
| 11 | ||||
| 11 | ||||
| 11 | ||||
| 11 | ||||
| 11 | ||||
| 12 | ||||
| 13 | ||||
| 16 | ||||
| 17 | ||||
| 31 | ||||
| 94 | ||||
| 167 | ||||
| 167 | ||||
| 170 | ||||
| 174 | ||||
| 175 | ||||
| 176 | ||||
| 176 | ||||
| 177 | ||||
| 178 | ||||
| 179 | ||||
| 179 | ||||
| 180 | ||||
| 180 | ||||
| 181 | ||||
| 182 | ||||
| 183 | ||||
| 184 | ||||
| 185 | ||||
| 186 | ||||
| 189 | ||||
| 190 | ||||
| 190 | ||||
| 192 | ||||
| 192 | ||||
| 193 |
 |
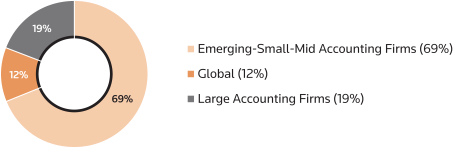
Legal Professionals Serves law firms and governments with research and workflow products, focusing on intuitive legal research powered by emerging technologies and integrated legal workflow solutions that combine content, tools and analytics. | |
 |
Corporates Serves corporate customers from small businesses to multinational organizations, including the seven largest global accounting firms, with our full suite of content-enabled technology solutions for in-house legal, tax, regulatory, compliance and IT professionals. | |
 |
Tax & Accounting Professionals Serves tax, accounting and audit professionals in accounting firms (other than the seven largest, which are served by our Corporates segment) with research and workflow products, focusing on intuitive tax offerings and automating tax workflows. | |
 |
Reuters News Supplies business, financial and global news to the world’s media organizations, professionals and news consumers through Reuters News Agency, Reuters.com, Reuters Events, Thomson Reuters products and the Refinitiv business of LSEG. | |
 |
Global Print Provides legal and tax information primarily in print format to customers around the world. |
| Attractive Industry · · |
Balanced and Diversified Leadership · · COVID-19 pandemic· |
Attractive Business Model · · · |
Strong Competitive Positioning · · · |
Disciplined Financial Policies · · · · |
| * | The news and editorial contract with the Refinitiv business of LSEG represented approximately 5% of our 2021 revenues. |
· |
2019 |
· |
2020 COVID-19 pandemic created unprecedented health risks to our employees, customers and suppliers, and containment measures intended to mitigate the impact of the pandemic resulted in a global economic crisis and ongoing uncertainty. In response to the pandemic, we immediately transitioned most of our staff to a virtual work environment. At the same time, we worked with our approximately 500,000 customers to ensure continued access to our products and services. Our 2020 performance reflected the resiliency of our markets and our business. |
· |
2021 two-year Change Program that is intended to drive growth and efficiency by transitioning our company from a holding company into an operating company, and from a content provider into a content-driven technology company. For additional information about the Change Program, please see the “2022 Key Priorities – Our Change Program” section of this annual report. In 2021, we and private equity funds affiliated with Blackstone closed the sale of Refinitiv to LSEG. For additional information about the transaction, please see the “Executive Summary – Sale of Refinitiv to LSEG” section of the “Management’s Discussion and Analysis” and “Additional Information – LSEG Transaction” section of this annual report. |
· |
Make it easier for our customers to do business with us; |
· |
Significantly modernize and simplify our product portfolio and product development groups; |
· |
Reduce complexity in our operations and technology organization; and |
· |
Continue to simplify our organizational structure to enable a more innovative culture. |
| Key Focus Areas |
Priority Workstreams |
2021 Key Achievements |
2023 Goals | |||||
 |
Reimagine the Customer Experience |
· · · AI-powered sales and marketing |
· · · · · |
· · | ||||
 |
Optimize Products & Portfolio |
· · · |
· · |
· · | ||||
 |
Simplify Operations & Leverage Technology |
· · re-engineer underlying processes· |
· · · · · · |
· · | ||||
 |
Create Inclusive Culture of World- Class Talent |
· · · |
· · |
· · | ||||
| Brand |
Type of Product/Service |
Legal Professionals |
Corporates |
Tax & Accounting Professionals | ||||
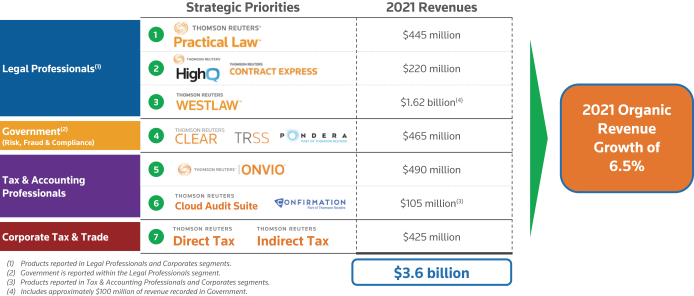
| Westlaw Westlaw Edge (U.S., U.K. & Canada) Sweet & Maxwell (U.K.) La Ley (Argentina) |
Legal, regulatory and compliance information-based products and services. Westlaw is our primary online legal research delivery platform. Westlaw offers authoritative content, powerful search functionality and research organization, team collaboration features and navigation tools to find and share specific points of law and search for analytical commentary. Localized versions of online legal research services are provided in Argentina, Australia, Brazil, Canada, Chile, China, France, India, Ireland, Japan, New Zealand, South Korea, Spain, the United Kingdom, Uruguay and other countries. Through Westlaw International, Westlaw Asia and Westlaw Middle East, we offer our online products and services to customers in markets where we do not offer a fully localized Westlaw service. |
 |
|
|||||
| Practical Law Practical Law Connect Practical Law Dynamic Tool Set |
Legal know-how, current awareness and workflow tools with embedded guidance from expert practitioners. Practice notes, standard documents, checklists and What’s Market tools cover a wide variety of practice areas such as commercial, corporate, labor and employment, intellectual property, finance and litigation. Practical Law currently has offerings in the United Kingdom, United States, Canada, Australia and China. |
|
|
|||||
| Brand |
Type of Product/Service |
Legal Professionals |
Corporates |
Tax & Accounting Professionals | ||||
| CLEAR CLEAR Risk Inform PeopleMap |
Public and proprietary records about individuals and companies with tools for immediately usable results. |
|
|
|||||
| HighQ HighQ Contract Analysis |
Cloud-based collaboration and workflow platform for the legal and regulatory market segment. |
|
|
|||||
| Digital Evidence Center Case Center |
Cloud-based crime scene to court digital exhibit and evidence-sharing platform for sharing documents and multimedia between justice agencies for trial preparation and courtroom presentation. |
|
||||||
| Pondera Solutions |
A suite of data and analytics solutions to help auditors, investigators and managers detect fraud, waste and abuse in healthcare and large government subsidy programs. |
|
|
|||||
Checkpoint Checkpoint Edge (U.S. & Canada) |
Integrated tax and accounting information solution that addresses market disruption through integrated research, editorial insight, workflow productivity tools, online learning and news updates, along with intelligent links to related content and software. |
|
|
| ||||
| FindLaw |
Online legal directory, website creation and hosting services, law firm marketing solutions and peer rating services. |
|
||||||
| 3E 3E Cloud ProLaw Legal One Firm Central |
Suites of integrated software applications that assist with business management functions, including financial and practice management, matter management, document and email management, accounting and billing, timekeeping and records management. |
|
||||||
| Legal Tracker |
Online spend and matter management, e-billing, legal analytics services, and document storage, search and retrieval. |
|
||||||
| Regulatory Intelligence |
Information and software products that provide a single source for regulatory news, analysis, rules and developments, with global coverage of more than 400 regulators and exchanges. |
|
||||||
| Compliance Learning |
Training programs that assist in changing behavior and supporting a culture of integrity and compliance. |
|
||||||
| ONESOURCE ONESOURCE Global Trade |
Comprehensive global tax solution with local and country content focused on managing a company’s entire tax lifecycle, including direct and indirect tax compliance, indirect tax determination, tax accounting, transfer pricing documentation and calculations, trade and customs supporting global supply chain, trust taxation, tax information reporting, property tax, tax planning, and overall workflow and process management. |
|
| |||||
| Confirmation |
Cloud-based platform to automate the workflow of the confirmations process of an audit. Used by a global network of audit firms, banks and law firms to increase efficiency and reduce risk. |
|
| |||||
| Brand |
Type of Product/Service |
Legal Professionals |
Corporates |
Tax & Accounting Professionals | ||||
| Dominio |
Accounting management and tax management software solutions for accounting firms, and micro and small companies in Brazil. |
| ||||||
| Cloud Audit Suite |
End-to-end cloud-based technology offers the ability to work from anywhere, collaborate with colleagues in real time, and securely access audit data. |
| ||||||
| CS Professional Suite |
Scalable, integrated suite of desktop and online software applications that encompass key aspects of a professional accounting firm’s operations, from collecting customer data and posting finished tax returns to the overall management of the accounting practice. |
| ||||||
| Onvio |
International suite of cloud-based products that bring aspects of accounting firm operations - including document management, file sharing and collaboration, time and billing, workpaper management and project management - into a single, accessible online platform. |
| ||||||
| By Region |
||||
| Americas |
|
14,700 |
| |
| Asia Pacific |
|
6,100 |
| |
| Europe, Middle East and Africa (EMEA) |
|
3,600 |
| |
| By Unit |
||||
| Legal Professionals |
|
1,700 |
| |
| Corporates |
|
1,100 |
| |
| Tax & Accounting Professionals |
|
700 |
| |
| Global Print |
|
600 |
| |
| Reuters News |
|
3,000 |
| |
| Product & Editorial |
|
3,200 |
| |
| Operations & Technology |
|
9,000 |
| |
| Corporate Center (Enabling Functions) |
|
1,400 |
| |
| Commercial Functions (1) |
|
900 |
| |
| Other (2) |
|
2,800 |
| |
| Thomson Reuters |
|
24,400 |
|
| We post a Social Impact Report annually on our website, www.tr.com/social-impact-report , which summarizes our strategy, includes stories of progress and tracks performance, tying our efforts to our business strategy and commercial expertise. The report highlights how we run our business with purpose, manage our sustainability goals, foster an inclusive workplace, and make a difference in communities through wider-ranging social impact programs pursuing access to justice, truth and transparency. We encourage you to review the Social Impact Report to gain a better understanding of our accomplishments and practices in these areas. |
· |
We are using 100% renewable energy for all our operations as of 2020 and we are working closely with our suppliers to drive lower emissions within our supply chain. |
· |
We joined the Science Based Targets Initiative (SBTi) in 2020, aligning to the most ambitious 1.5-degree Celsius pathway. Thomson Reuters is among a leading group of approximately 1,200 companies globally to have done so. |
· |
In 2020, we announced our commitment to targeting net-zero emissions by 2050. In 2021, we announced that we had reduced our greenhouse gas emissions by 93% as of the end of 2020 from our 2018 baseline and we are significantly ahead of our SBTi commitment. We will continue to measure and manage our own emissions and environmental impacts and continue to identify ways to further assess, monitor and improve our carbon footprint. |
· |
We have decreased our carbon footprint by reducing the number of our office locations from 102 at the beginning of 2021 to 46 at the end of 2021. The ongoing COVID-19 pandemic has also resulted in less business travel and increased use of more virtual and collaboration tools by our employees. As many of our employees are expected to work in a hybrid arrangement in the future, we expect this will result in less emissions and a reduced environment impact. Our strategy to migrate 90% or more of our revenue to the cloud by 2023 should also help reduce our environmental footprint as we will be less reliant on company-managed data centers. |
· |
Some of our content and other information products help our customers address climate change matters. For example, Practical Law includes a tracker covering key Biden Administration actions and initiatives on climate, energy and environmental issues and other resources related to climate change disclosures for U.S. public companies. |

· |
America’s Best Employers For Diversity and Best Place for Working Parents (Dallas) |
· |
Canada’s Best Employers, Great Place to Work, Canada and Greater Toronto’s Top Employers |
· |
Comparably – Best Companies for Best Global Culture, Best Teams Product & Design, and Best Company Outlook |
· |
Human Rights Campaign Best Places to Work for LGBTQ Equality and 100% score, Human Rights Campaign’s Corporate Equality Index |
| Goal |
2020 |
2021 |
2022 Goal | |||
| Women in senior leadership |
39% | 41% | 45% | |||
| Racially/ethnically diverse talent in senior leadership |
14% | 16% | 20% | |||
| Number of Black employees in senior leadership |
32 | 38 | 60 | |||
· |
Corporate partnerships and programs to attract and retain underrepresented talent; |
· |
Sponsorship of over 70 business employee resource groups, which play a critical role in driving awareness, understanding of diverse backgrounds and execution against our diversity and inclusion strategy; |
· |
Training programs and innovative learning opportunities, which includes a “Breaking Bias” program that we launched to all employees globally in 2021; |
· |
Internal initiatives such as “Count Me In” to help build our diversity data and deepen our talent insights; and |
· |
Expanded external reporting. |
| Facility |
Approx. Sq. Ft. |
Owned/Leased |
Principal Use | |||
| 610 Opperman Drive, Eagan, Minnesota, United States |
2,792,000 | Owned | Legal Professionals headquarters and Global Print operating facilities | |||
| 2395 Midway Road, Carrollton, Texas, United States |
409,150 | Owned | Tax & Accounting Professionals and Corporates headquarters and operating facilities | |||
| 6300 Interfirst Drive, Ann Arbor, Michigan, United States |
247,250 | Owned | Tax & Accounting Professionals operating facility | |||
| 5 Canada Square, London, United Kingdom |
133,400 | Subleased (1) |
Legal Professionals, Tax & Accounting Professionals and Reuters News operating facility | |||
| 3 Times Square, New York, New York, United States |
99,850 | Owned/leased (2) |
Corporates and Reuters News operating facility | |||
| Paseo de la Reforma 26, Mexico City, Mexico |
90,280 | Leased | Thomson Reuters shared services center | |||
| 333 Bay Street, Toronto, Ontario, Canada |
59,250 (3) |
Leased | Thomson Reuters headquarters and Legal Professionals operating facilities | |||
| Landis & Gyr 3, Zug, Switzerland |
50,250 | Leased | Enterprise Centre | |||
| (1) | The primary lease (which covers approximately 353,000 sq. ft.) is held by Refinitiv. We are utilizing approximately 133,400 sq. ft. from Refinitiv. |
| (2) | The landlord (3XSQ Associates) is an entity owned by one of our subsidiaries and Rudin Times Square Associates LLC. 3XSQ Associates was formed to build and operate the 3 Times Square property. |
| (3) | Represents our net occupied area. Our main lease is for 81,250 sq. ft. and we subleased 22,000 sq. ft. to Refinitiv. |
· |
Cost-cutting, reduced spending or reduced activity by customers may decrease demand for, and usage of, some of our products and services. This could adversely affect our financial results by reducing our revenues, which could in turn reduce the profitability of some of our products and services. Some of our customers may also slow down decision-making or delay planned renewals or implementations because of economic conditions, which may disrupt historical spending patterns. |
· |
While many law firms increased revenues in 2021, law firms continue to be challenged in their efforts as corporate counsels keep more work in-house in an effort to deliver greater business value and insights internally, limit increases in billing rates and hours, and insist on increased transparency and efficiency from law firms. Some law firms have also been impacted by COVID-19 and related containment measures. |
· |
Accounting firms are also adapting their business models related to service offerings, technology and pricing to address their clients’ evolving needs, priorities and expectations. In particular, accounting firms continue to experience commoditization in audit and tax compliance and are looking to expand into more profitable advisory services and identify more areas to use automation. |
· |
As expected, Global Print (10% of our 2021 revenues) experienced a 3% revenue decline (in constant currency) in 2021, as customers continued to migrate from traditional print formats to digital solutions and also due to COVID-19. An increase in |
| hybrid and virtual working arrangements in the future could also cause certain customers to reduce or discontinue orders from our Global Print business. Declines in Global Print revenues can adversely affect our profitability (as Global Print has higher margins than our overall business) as well as our cash flows. |
· |
Relative to our Reuters News business, the media sector continues to transform, with the traditional news agency business declining. While demand in the financial professional segment is growing, Reuters News is limited in its ability to participate in a number of sectors due to its exclusive agreement with Refinitiv. COVID-19 has also impacted our Reuters Events business, which held nearly all of its events virtually last year. |
· |
Many of our principal competitors are established companies and firms that have substantial financial resources, recognized brands, technological expertise and market experience and these competitors sometimes have more established positions in certain product segments and geographic regions than we do. Some firms which compete with us have traditionally been our customers as well as go-to-market |
· |
We increasingly compete with smaller and sometimes newer companies, some of which seek to differentiate themselves from the breadth of our offerings by being specialized, with a narrower focus than our company. As a result, they may be able to adopt new or emerging technologies, including AI and analytic capabilities, or address customer requirements more quickly than we can. New and emerging technologies can also have the impact of allowing start-up companies to enter the market more quickly than they would have been able to in the past. |
· |
Public sources of free or relatively inexpensive information are available online and more of this information is expected to be available in the future. Some governmental and regulatory agencies have increased the amount of information they make publicly available at no cost. Several companies and organizations have made certain legal and tax information publicly available at no cost. “Open source” software that is available for free may also provide some functionality similar to that in some of our products. Public sources of free or relatively inexpensive information may reduce demand for our products and services if certain customers choose to use these public sources as a substitute for our products or services. |
· |
Some of our customers independently develop products and services that compete with ours, including through the formation of partnerships or consortia. If more of our customers become self-sufficient, demand for our products and services may be reduced. |
· |
We may also face increased competition from search providers that could pose a threat to some of our businesses by providing more in-depth offerings, adapting their products and services to meet the demands of their customers or combining with one of their traditional competitors to enhance their products and services. |
· |
Cyber-attacks on our networks, websites, hosting environments or infrastructure on which many of our service offerings operate using computer viruses or other malware, distributed denial of service attacks, ransomware, phishing, social engineering, or destructive attacks against information systems; |
· |
Vulnerabilities existing in our products or internally-built applications, some of which may be undetected and only discovered after an extended period of time and after installation or integration by our company or our customers; |
· |
Vulnerabilities in purchased or licensed third-party software, adopted open source software, or in newly integrated technologies resulting from an acquisition or partnership, some of which may be undetected and only discovered after an extended period of time and after installation or integration by our company or our customers; |
· |
Actions taken by individuals or groups of hackers and sophisticated organizations, including nation-states, state-sponsored or aligned, or criminal organizations; |
· |
Attacks on, or vulnerabilities in underlying networks and services that power the Internet and supporting power and water supply, most of which are not under our direct control or the control of our suppliers, partners or customers; |
· |
Human errors by employees, contractors or customers or intentional acts by employees, contractors or customers with access to our systems that compromise our security measures; and |
· |
Attacks against employee or contractor work from home or hybrid working environments (e.g., home networks, residential internet service providers) that allow an unauthorized party to gain remote or physical access to the employee’s devices or information used to access corporate resources. |
· |
In 2020, Steve Hasker became our new CEO and Mike Eastwood became our new CFO. Throughout 2020 and 2021, we also brought new key talent into the organization, including in Product, Engineering, Marketing, Data and Analytics, Design and Technology. This talent has brought different perspectives and approaches which have complemented the skills and experiences of existing leadership. However, any change to senior management can disrupt our business. |
· |
In the first quarter of 2021, we began a new Change Program, which is a two-year initiative to transform our company into a leading content driven technology company by making it easier for our customers to do business with us, modernizing and reducing complexity in our operations and technology organization and simplifying our product portfolio. As part of the Change Program, we also have reduced staff, moved the location of various jobs and significantly reduced our office portfolio around the world. |
· |
Difficulties in penetrating new markets due to established and entrenched competitors or unavailability of local companies for acquisition or joint venture partners or restrictions on foreign ownership; |
· |
Difficulties in developing products and services that are tailored to the needs of local customers; |
· |
Local lack of recognition of our brands or acceptance or knowledge of our products and services; |
· |
Economic, political or social instability in local markets; |
· |
Exposure to possibly adverse governmental or regulatory actions in countries where we operate or conduct business; |
· |
Higher inflation rates and increased credit risk; |
· |
The impact of foreign currency fluctuations on prices charged to local customers, notably when there is strengthening of the U.S. dollar, and other controls, regulations and orders that might restrict our ability to repatriate cash or limit our ability to move or invest cash freely; |
· |
Difficulties hiring and retaining staff for foreign operations, differing employee/employer relationships, and other challenges caused by distance, language and cultural differences; |
· |
Reduced protection for intellectual property rights; |
· |
Changes in laws and policies affecting trade and investment in other jurisdictions; and |
· |
Managing compliance with local laws and regulations (notably related to data privacy, data use and data protection) and varying and sometimes conflicting laws and regulations across the countries in which we do business. |
· |
GDPR provides data protection requirements and related compliance obligations in the E.U. Serious breaches of the GDPR can result in administrative fines of up to 4% of annual worldwide revenues and fines up to 2% of annual worldwide revenues can be imposed for other types of violations. We are also subject to U.K. data protection law, which imposes obligations and penalties similar to GDPR. |
· |
Various U.S. state privacy laws reflect requirements for the handling of personal data and provide data privacy rights to their residents. Violations can result in civil penalties and in some instances, provide consumers with a private right of action for data breaches, which may increase data breach litigation. Other U.S. state and federal legislative and regulatory bodies have implemented or are considering similar legislation, which, if passed, could create more risks, compliance complexity and potential costs for us. |
· |
In the E.U., proposed legislation known as the Regulation on Privacy and Electronic Communications, or ePrivacy Regulation, would replace an E.U. regulation known as the ePrivacy Directive, which we are currently subject to. The ePrivacy Regulation is focused on privacy regarding electronic communications services and data processed by electronic communications services. The ePrivacy Regulation is still under development and in draft form and the timeline for adoption and effectiveness is unclear. The ePrivacy Regulation may require us to further modify some of our data practices and compliance could result in additional costs for our company. In addition, the proposed EU Digital Services Act (DSA) and Digital Markets Act (DMA) will add further complexity and increased consumer protection and technology regulation. |
· |
Proposed and existing legislation in other countries and regions around the world related to privacy, data security, data protection and other related areas may also impact how we provide products and services and how we collect and use information. |
· |
Impose limits on our collection and use of certain kinds of information and our ability to communicate such information effectively to our customers; |
· |
Impose restrictions on the collection and use of product and user data analytics; |
· |
Increase our cost of doing business or require us to change some of our existing business practices; and |
· |
Conflict on a global basis (such as the U.S. Foreign Corrupt Practices Act, the U.K. Bribery Act and similar laws). |
| |
Legal Professionals Serves law firms and governments with research and workflow products, focusing on intuitive legal research powered by emerging technologies and integrated legal workflow solutions that combine content, tools and analytics. |
 | ||
| |
Corporates Serves corporate customers from small businesses to multinational organizations, including the seven largest global accounting firms, with our full suite of content-enabled technology solutions for in-house legal, tax, regulatory, compliance and IT professionals. | |||
| |
Tax & Accounting Professionals Serves tax, accounting and audit professionals in accounting firms (other than the seven largest, which are served by our Corporates segment) with research and workflow products, focusing on intuitive tax offerings and automating tax workflows. | |||
| |
Reuters News Supplies business, financial, and global news to the world’s media organizations, professionals and news consumers through Reuters News Agency, Reuters.com, Reuters Events, Thomson Reuters products and the Refinitiv business of LSEG. | |||
|
Global Print Provides legal and tax information, primarily in print format, to customers around the world. |
| Attractive Industry · · |
Balanced and Diversified Leadership · · COVID-19 pandemic· |
Attractive Business Model · · · |
Strong Competitive Positioning · · · |
Disciplined Financial Policies · · · · |
* |
The news and editorial contract with the Refinitiv business of LSEG represented approximately 5% of our 2021 revenues. |
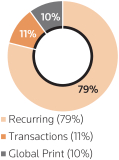 |
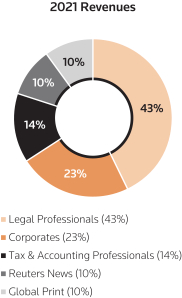
Revenues by type Recurring revenues one-off arrangements. However, as we generally recognize recurring revenues ratably over the contract term, there is a lag in realizing the impact of current sales or cancellations in our reported revenues. As a result, our revenues are typically slower to decline when economic conditions worsen, but slower to return to growth when economic activity improves, compared to other businesses that are not subscription-based.Transactions revenues Global Print revenues | |
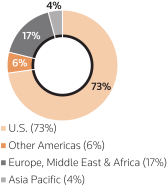 |
Revenues by geography In 2021, we earned 73% of our revenues in the U.S. We also operate regional teams outside of the U.S., including in emerging markets, where we serve regional customers by either modifying existing products and services for their needs or developing specific products for the local market. Changes in foreign currency exchange rates relative to our business outside the U.S. may cause variation in our revenue performance from period to period. In 2021, changes in foreign exchange rates increased our revenues by 1% compared to the prior year. | |
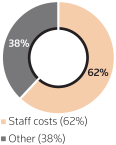 |
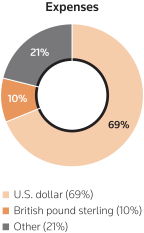
Expenses Most of our operating expenses are fixed. As a result, when our revenues increase, we become more profitable and our adjusted EBITDA margin increases. Likewise, when our revenues decline, we become less profitable and our adjusted EBITDA margin decreases. However, the full impact of incremental revenues is not always reflected in our profitability as we reinvest in our business. In 2021, staff costs, which are largely comprised of salaries, performance bonuses, commissions, benefits and share-based compensation, comprised 62% of our total expenses. Approximately 69% of our 2021 operating expenses were denominated in U.S. dollars with the balance denominated in currencies other than the U.S. dollar. In 2021, changes in foreign exchange rates increased our expenses by 1% compared to the prior year. In 2021, we incurred significant expenses associated with our Change Program to transition our company from a holding company to an operating company and from a content provider to a content-driven technology company. Our corporate costs within adjusted EBITDA included $183 million related to these efforts, and we expect to incur additional costs of between $160 million and $200 million in 2022. |
| Year ended December 31, |
||||||||||||||||
| Change |
||||||||||||||||
(millions of U.S. dollars, except per share amounts and margins) |
2021 |
2020 |
Total |
Constant Currency |
||||||||||||
| IFRS Financial Measures |
||||||||||||||||
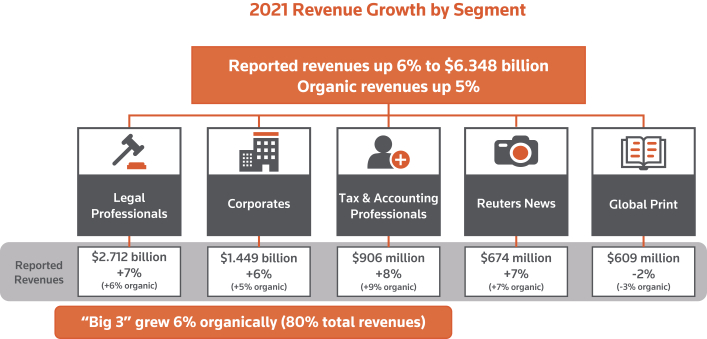
| Revenues |
|
6,348 |
|
|
5,984 |
|
|
6% |
|
|||||||
| Operating profit |
|
1,242 |
|
|
1,929 |
|
|
(36%) |
|
|||||||
| Diluted EPS |
|
$11.50 |
|
|
$2.25 |
|
|
n/m |
|
|||||||
| Net cash provided by operating activities |
|
1,773 |
|
|
1,745 |
|
|
2% |
|
|||||||
| Non-IFRS Financial Measures(1) |
||||||||||||||||
| Revenues |
|
6,348 |
|
|
5,984 |
|
|
6% |
|
|
5% |
| ||||
| Organic revenue growth |
|
5% |
| |||||||||||||
| Adjusted EBITDA |
|
1,970 |
|
|
1,975 |
|
|
- |
|
|
(1%) |
| ||||
| Adjusted EBITDA margin |
|
31.0% |
|
|
33.0% |
|
|
(200)bp |
|
|
(190)bp |
| ||||
| Adjusted EPS |
|
$1.95 |
|
|
$1.85 |
|
|
5% |
|
|
5% |
| ||||
| Free cash flow |
|
1,256 |
|
|
1,330 |
|
|
(6%) |
|
|||||||
| Year ended December 31, |
||||||||||||||||
| Change |
||||||||||||||||
(millions of U.S. dollars, except margins) |
2021 |
2020 |
Total |
Constant Currency |
||||||||||||
| Non-IFRS Financial Measures(1) |
||||||||||||||||
| Revenues |
|
5,067 |
|
|
4,738 |
|
|
7% |
|
|
6% |
| ||||
| Organic revenue growth |
|
6% |
| |||||||||||||
| Adjusted EBITDA |
|
1,966 |
|
|
1,791 |
|
|
10% |
|
|
9% |
| ||||
| Adjusted EBITDA margin |
|
38.8% |
|
|
37.8% |
|
|
100bp |
|
|
90bp |
| ||||
| Total Thomson Reuters |
November 2, 2021 Updated Outlook |
2021 Actual Performance (Before currency) (1) |
||||||
| Revenue growth |
4.5% - 5.0% |
5.3% |
 |
|||||
| Organic revenue growth (2) |
4.5% - 5.0% |
5.2% |
|
|||||
| Adjusted EBITDA margin (2) |
31% - 32% |
31.3% |
|
|||||
| Corporate costs |
$305 million - $330 million |
$319 million |
|
|||||
| Core corporate costs |
$130 million - $140 million |
$137 million |
|
|||||
| Change Program operating expenses |
$175 million - $190 million |
$182 million |
|
|||||
| Free cash flow (2) |
Approximately $1.2 billion |
$1.3 billion |
|
|||||
| Accrued capital expenditures as a percentage of revenues (2) |
9.0% - 9.5% |
8.6% |
|
|||||
| Change Program accrued capital expenditures |
$115 million - $130 million |
$112 million |
|
|||||
| Depreciation and amortization of computer software |
$650 million - $675 million |
$647 million |
|
|||||
| Interest expense |
$190 million - $210 million |
$196 million |
|
|||||
| Effective tax rate on adjusted earnings (2)(3) |
14% - 16% |
13.9% |
|
|||||
| “Big 3” (2) |
November 2, 2021 Updated Outlook |
2021 Actual Performance (Before currency) (1) |
||||||
| Revenue Growth |
Approximately 6.0% |
6.2% |
|
|||||
| Organic revenue growth |
Approximately 6.0% |
6.2% |
|
|||||
| Adjusted EBITDA margin |
Approximately 39% |
38.8% |
|
|||||
· |
Make it easier for our customers to do business with us; |
· |
Significantly modernize and simplify our product portfolio and product development groups; |
· |
Reduce complexity in our operations and technology organization; and |
· |
Continue to simplify our organizational structure to enable a more innovative culture. |
| Year ended December 31, |
||||||||||||||||
| Change |
||||||||||||||||
(millions of U.S. dollars, except per share amounts and margins) |
2021 |
2020 |
Total |
Constant Currency |
||||||||||||
| IFRS Financial Measures |
||||||||||||||||
| Revenues |
|
6,348 |
|
|
5,984 |
|
|
6% |
|
|||||||
| Operating profit |
|
1,242 |
|
|
1,929 |
|
|
(36%) |
|
|||||||
| Diluted EPS |
|
$11.50 |
|
|
$2.25 |
|
|
n/m |
|
|||||||
| Non-IFRS Financial Measures |
||||||||||||||||
| Revenues |
|
6,348 |
|
|
5,984 |
|
|
6% |
|
|
5% |
| ||||
| Organic revenue growth |
|
5% |
| |||||||||||||
| Adjusted EBITDA |
|
1,970 |
|
|
1,975 |
|
|
- |
|
|
(1%) |
| ||||
| Adjusted EBITDA margin |
|
31.0% |
|
|
33.0% |
|
|
(200)bp |
|
|
(190)bp |
| ||||
| Adjusted EBITDA less accrued capital expenditures (1) |
|
1,429 |
|
|
1,508 |
|
|
(5%) |
|
|||||||
| Adjusted EBITDA less accrued capital expenditures margin (1) |
|
22.5% |
|
|
25.2% |
|
|
(270)bp |
|
|||||||
| Adjusted EPS |
|
$1.95 |
|
|
$1.85 |
|
|
5% |
|
|
5% |
| ||||
| Year ended December 31, |
||||||||||||||||
| Change |
||||||||||||||||
(millions of U.S. dollars, except margins) |
2021 |
2020 |
Total |
Constant Currency |
||||||||||||
| Non-IFRS Financial Measures |
||||||||||||||||
| Revenues |
|
5,067 |
|
|
4,738 |
|
|
7% |
|
|
6% |
| ||||
| Organic revenue growth |
|
6% |
| |||||||||||||
| Adjusted EBITDA |
|
1,966 |
|
|
1,791 |
|
|
10% |
|
|
9% |
| ||||
| Adjusted EBITDA margin |
|
38.8% |
|
|
37.8% |
|
|
100bp |
|
|
90bp |
| ||||
| Year ended December 31, |
||||||||||||||||||||
| Change |
||||||||||||||||||||
(millions of U.S. dollars) |
2021 |
2020 |
Total |
Constant Currency |
Organic |
|||||||||||||||
| Recurring revenues |
5,050 |
4,758 | 6% | 5% | 5% | |||||||||||||||
| Transactions revenues |
691 |
608 | 14% | 13% | 13% | |||||||||||||||
| Global Print revenues |
609 |
620 | (2%) | (3%) | (3%) | |||||||||||||||
| Eliminations/Rounding |
(2) |
(2) | ||||||||||||||||||
| Revenues |
6,348 |
5,984 | 6% | 5% | 5% | |||||||||||||||
| Year ended December 31, |
||||||||||||||||
| Change |
||||||||||||||||
(millions of U.S. dollars) |
2021 |
2020 |
Total |
Constant Currency |
||||||||||||
| Operating expenses |
|
4,370 |
|
|
3,999 |
|
|
9% |
|
|
8% |
| ||||
| Year ended December 31, |
||||||||||||
| (millions of U.S. dollars) |
2021 |
2020 |
Change |
|||||||||
| Depreciation |
|
177 |
|
|
184 |
|
|
(4%) |
| |||
| Amortization of computer software |
|
474 |
|
|
485 |
|
|
(2%) |
| |||
| Subtotal |
|
651 |
|
|
669 |
|
|
(3%) |
| |||
| Amortization of other identifiable intangible assets |
|
119 |
|
|
123 |
|
|
(4%) |
| |||
· |
Depreciation and amortization of computer software on a combined basis decreased primarily because the prior year included write-downs of certain software that we stopped using as well as the write-downs of assets associated with real estate leases that we vacated. |
· |
Amortization of other identifiable intangible assets decreased as the completion of amortization of assets acquired in previous years more than offset expenses associated with recent acquisitions. |
| Year ended December 31, |
||||||||
| (millions of U.S. dollars) |
2021 |
2020 |
||||||
| Other operating gains, net |
|
34 |
|
|
736 |
| ||
| Year ended December 31, |
||||||||||||
| (millions of U.S. dollars) |
2021 |
2020 |
Change |
|||||||||
| Net interest expense |
|
196 |
|
|
195 |
|
|
1% |
| |||
| Year ended December 31, | ||||||
| (millions of U.S. dollars) |
2021 |
2020 | ||||
| Other finance income |
|
8 |
|
30 | ||
| Year ended December 31, |
||||||||
| (millions of U.S. dollars) |
2021 |
2020 |
||||||
| YPL (formerly Refinitiv Holdings Ltd.) |
6,233 |
(554) | ||||||
| Other equity method investments |
7 |
10 | ||||||
| Share of post-tax earnings (losses) in equity method investments |
6,240 |
(544) | ||||||
| Year ended December 31, |
||||||||
| (millions of U.S. dollars) |
2021 |
2020 |
||||||
| Tax expense |
1,607 |
71 | ||||||
| Year ended December 31, |
||||||||
| (millions of U.S. dollars) |
2021 |
2020 |
||||||
| Tax (benefit) expense |
||||||||
| Tax items impacting comparability: |
||||||||
| Corporate tax laws and rates (1) |
|
(17) |
|
|
- |
| ||
| Deferred tax adjustments (2) |
|
(7) |
|
|
(136) |
| ||
| Subtotal |
(24) |
(136) | ||||||
| Tax related to: |
||||||||
| Amortization of other identifiable intangible assets |
|
(26) |
|
|
(23) |
| ||
| Share of post-tax earnings (losses) in equity method investments(3) |
|
1,497 |
|
|
(134) |
| ||
| Other operating gains, net (4) |
|
9 |
|
|
175 |
| ||
| Other items |
|
(5) |
|
|
1 |
| ||
| Subtotal |
1,475 |
19 | ||||||
| Total |
|
1,451 |
|
|
(117) |
| ||
| Year ended December 31, |
||||||||
| (millions of U.S. dollars) |
2021 |
2020 |
||||||
| Tax expense |
|
1,607 |
|
|
71 |
| ||
| Remove: Items from above impacting comparability |
|
(1,451) |
|
|
117 |
| ||
| Total tax expense on adjusted earnings |
|
156 |
|
|
188 |
| ||
| Year ended December 31, |
||||||||
| Income taxes paid (received) (millions of U.S. dollars) |
2021 |
2020 |
||||||
| Operating activities – continuing operations |
|
172 |
|
|
52 |
| ||
| Operating activities – discontinued operations |
|
2 |
|
|
(2) |
| ||
| Investing activities – continuing operations |
|
850 |
|
|
114 |
| ||
| Investing activities – discontinued operations |
|
42 |
|
|
- |
| ||
| Total income taxes paid |
|
1,066 |
|
|
164 |
| ||
| Year ended December 31, |
||||||||
| (millions of U.S. dollars) |
2021 |
2020 |
||||||
| Earnings (loss) from discontinued operations, net of tax |
2 |
(27) | ||||||
| Year ended December 31, |
||||||||||||
| (millions of U.S. dollars, except per share amounts) |
2021 |
2020 |
Change |
|||||||||
| Net earnings |
|
5,689 |
|
|
1,122 |
|
|
n/m |
| |||
| Diluted EPS |
|
$11.50 |
|
|
$2.25 |
|
|
n/m |
| |||
| Year ended December 31, |
||||||||||||||||
| Change |
||||||||||||||||
(millions of U.S. dollars, except per share amounts) |
2021 |
2020 |
Total |
Constant Currency |
||||||||||||
| Adjusted earnings |
|
965 |
|
|
921 |
|
|
5% |
|
|||||||
| Adjusted EPS |
$ |
1.95 |
|
$ |
1.85 |
|
|
5% |
|
|
5% |
| ||||
| Year ended December 31, |
||||||||||||||||||||
| Change |
||||||||||||||||||||
(millions of U.S. dollars, except margins) |
2021 |
2020 |
Total |
Constant Currency |
Organic |
|||||||||||||||
| Recurring revenues |
|
2,523 |
|
2,367 | 7% | 6% | 5% | |||||||||||||
| Transactions revenues |
|
189 |
|
168 | 13% | 11% | 12% | |||||||||||||
| Revenues |
2,712 |
2,535 | 7% | 6% | 6% | |||||||||||||||
| Segment adjusted EBITDA |
|
1,091 |
|
1,001 | 9% | 7% | ||||||||||||||
| Segment adjusted EBITDA margin |
|
40.2% |
|
39.5% | 70bp | 50bp | ||||||||||||||
| Year ended December 31, |
||||||||||||||||||||
| Change |
||||||||||||||||||||
(millions of U.S. dollars, except margins) |
2021 |
2020 |
Total |
Constant Currency |
Organic |
|||||||||||||||
| Recurring revenues |
1,218 |
1,143 | 7% | 6% | 6% | |||||||||||||||
| Transactions revenues |
231 |
224 | 3% | 3% | 3% | |||||||||||||||
| Revenues |
1,449 |
1,367 | 6% | 5% | 5% | |||||||||||||||
| Segment adjusted EBITDA |
502 |
460 | 9% | 9% | ||||||||||||||||
| Segment adjusted EBITDA margin |
34.6% |
33.7% | 90bp | 100bp | ||||||||||||||||
| Year ended December 31, |
||||||||||||||||||||
| Change |
||||||||||||||||||||
(millions of U.S. dollars, except margins) |
2021 |
2020 |
Total |
Constant Currency |
Organic |
|||||||||||||||
| Recurring revenues |
733 |
682 | 8% | 8% | 8% | |||||||||||||||
| Transactions revenues |
173 |
154 | 12% | 12% | 12% | |||||||||||||||
| Revenues |
906 |
836 | 8% | 9% | 9% | |||||||||||||||
| Segment adjusted EBITDA |
373 |
330 | 13% | 13% | ||||||||||||||||
| Segment adjusted EBITDA margin |
41.1% |
39.5% | 160bp | 170bp | ||||||||||||||||
| Year ended December 31, |
||||||||||||||||||||
| Change |
||||||||||||||||||||
(millions of U.S. dollars, except margins) |
2021 |
2020 |
Total |
Constant Currency |
Organic |
|||||||||||||||
| Recurring revenues |
576 |
566 | 2% | 1% | 1% | |||||||||||||||
| Transactions revenues |
98 |
62 | 57% | 55% | 55% | |||||||||||||||
| Revenues |
674 |
628 | 7% | 7% | 7% | |||||||||||||||
| Segment adjusted EBITDA |
103 |
73 | 40% | 51% | ||||||||||||||||
| Segment adjusted EBITDA margin |
15.2% |
11.7% | 350bp | 500bp | ||||||||||||||||
| Year ended December 31, |
||||||||||||||||||||
| Change |
||||||||||||||||||||
(millions of U.S. dollars, except margins) |
2021 |
2020 |
Total |
Constant Currency |
Organic |
|||||||||||||||
| Revenues |
609 |
620 | (2%) | (3%) | (3%) | |||||||||||||||
| Segment adjusted EBITDA |
226 |
242 | (7%) | (8%) | ||||||||||||||||
| Segment adjusted EBITDA margin |
37.1% |
39.0% | (190)bp | (210)bp | ||||||||||||||||
| Year ended December 31, |
||||||||
| (millions of U.S. dollars) |
2021 |
2020 |
||||||
| Corporate costs |
325 |
131 | ||||||
| Three months ended December 31, |
||||||||||||||||
| Change |
||||||||||||||||
(millions of U.S. dollars, except per share amounts and margins) |
2021 |
2020 |
Total |
Constant Currency |
||||||||||||
| IFRS Financial Measures |
||||||||||||||||
| Revenues |
1,710 |
1,616 | 6% | |||||||||||||
| Operating profit |
257 |
956 | (73%) | |||||||||||||
| Net (loss) earnings |
(175) |
562 | n/m | |||||||||||||
| Diluted (loss) earnings per share |
$(0.36) |
$1.13 | n/m | |||||||||||||
| Net cash provided by operating activities |
397 |
566 | (30%) | |||||||||||||
| Net cash (used in) provided by investing activities |
(299) |
266 | n/m | |||||||||||||
| Net cash used in financing activities |
(829) |
(201) | 312% | |||||||||||||
| Non-IFRS Financial Measures(1) |
||||||||||||||||
| Revenues |
1,710 |
1,616 | 6% | 6% | ||||||||||||
| Organic revenue growth |
6% |
|||||||||||||||
| Adjusted EBITDA |
452 |
525 | (14%) | (14%) | ||||||||||||
| Adjusted EBITDA margin |
26.4% |
32.5% | (610)bp | (610)bp | ||||||||||||
| Adjusted EBITDA less accrued capital expenditures |
275 |
409 | (33%) | |||||||||||||
| Adjusted EBITDA less accrued capital expenditures margin |
16.1% |
25.3% | (920)bp | |||||||||||||
| Adjusted earnings |
210 |
269 | (22%) | |||||||||||||
| Adjusted EPS |
$0.43 |
$0.54 | (20%) | (20%) | ||||||||||||
| Free cash flow |
255 |
449 | (43%) | |||||||||||||
| Three months ended December 31, |
||||||||||||||||||||
| |
Change |
| ||||||||||||||||||
(millions of U.S. dollars, except margins) |
2021 |
2020 |
Total |
Constant Currency |
Organic |
|||||||||||||||
| Revenues |
||||||||||||||||||||
| Legal Professionals |
689 |
653 | 5% | 5% | 6% | |||||||||||||||
| Corporates |
361 |
338 | 7% | 7% | 7% | |||||||||||||||
| Tax & Accounting Professionals |
309 |
285 | 9% | 9% | 9% | |||||||||||||||
| “Big 3” Segments Combined |
1,359 |
1,276 | 6% | 7% | 7% | |||||||||||||||
| Reuters News |
182 |
164 | 11% | 12% | 12% | |||||||||||||||
| Global Print |
170 |
177 | (4%) | (4%) | (4%) | |||||||||||||||
| Eliminations/ Rounding |
(1) |
(1) | ||||||||||||||||||
| Revenues |
|
1,710 |
|
|
1,616 |
|
|
6% |
|
|
6% |
|
|
6% |
| |||||
| Adjusted EBITDA |
||||||||||||||||||||
| Legal Professionals |
239 |
245 | (3%) | (2%) | ||||||||||||||||
| Corporates |
95 |
105 | (10%) | (10%) | ||||||||||||||||
| Tax & Accounting Professionals |
154 |
145 | 6% | 7% | ||||||||||||||||
| “Big 3” Segments Combined |
488 |
495 | (2%) | (1%) | ||||||||||||||||
| Reuters News |
15 |
6 | 139% | 107% | ||||||||||||||||
| Global Print |
61 |
61 | – | (1%) | ||||||||||||||||
| Corporate costs |
(112) |
(37) | n/a | n/a | ||||||||||||||||
| Adjusted EBITDA |
|
452 |
|
|
525 |
|
|
(14%) |
|
|
(14%) |
|
||||||||
| Adjusted EBITDA margin |
||||||||||||||||||||
| Legal Professionals |
34.5% |
37.5% | (300)bp | (270)bp | ||||||||||||||||
| Corporates |
26.3% |
31.1% | (480)bp | (480)bp | ||||||||||||||||
| Tax & Accounting Professionals |
49.8% |
51.1% | (130)bp | (120)bp | ||||||||||||||||
| “Big 3” Segments Combined |
35.8% |
38.8% | (300)bp | (280)bp | ||||||||||||||||
| Reuters News |
8.3% |
3.9% | 440bp | 450bp | ||||||||||||||||
| Global Print |
35.9% |
34.6% | 130bp | 110bp | ||||||||||||||||
| Corporate costs |
n/a |
n/a | n/a | n/a | ||||||||||||||||
| Adjusted EBITDA margin |
|
26.4% |
|
|
32.5% |
|
|
(610)bp |
|
|
(610)bp |
|
||||||||
| Year ended December 31, | ||||||||
| (millions of U.S. dollars) |
2021 |
2020 |
$ Change | |||||
| Net cash provided by operating activities |
1,773 |
1,745 | 28 | |||||
| Net cash used in investing activities |
(504) |
(138) | (366) | |||||
| Net cash used in financing activities |
(2,273) |
(644) | (1,629) | |||||
| (Decrease) increase in cash and bank overdrafts |
(1,004) |
963 | (1,967) | |||||
| Translation adjustments |
(5) |
(1) | (4) | |||||
| Cash and bank overdrafts at beginning of period |
1,787 |
825 | 962 | |||||
| Cash and bank overdrafts at end of period |
|
778 |
|
1,787 |
(1,009) | |||
| Non-IFRS Financial Measures(1) |
||||||||
| Free cash flow |
1,256 |
1,330 | (74) | |||||
· |
Commercial paper program. |
· |
Credit facilities. |
· |
Long-term debt |
Month/Year |
Transaction |
Principal Amount (in millions) | ||
Notes issued |
||||
| May 2020 |
2.239% Notes, due 2025 | C$1,400 | ||
Notes repaid |
||||
| January 2020 |
3.309% Notes, due 2021 | C$550 | ||
| January 2020 |
3.95% Notes, due 2021 | US$139 | ||
· |
Credit ratings. |
| Moody’s |
S&P Global Ratings |
DBRS Limited |
Fitch | |||||||||||||||||
| Long-term debt |
Baa2 |
BBB |
BBB (high) |
BBB+ | ||||||||||||||||
| Commercial paper |
P-2 |
A-2 |
R-2 (high) |
F1 | ||||||||||||||||
| Trend/Outlook |
Positive |
Stable |
Stable |
Stable | ||||||||||||||||
· |
Dividends. |
| Year ended December 31, |
||||||||
| (millions of U.S. dollars, except per share amounts) |
2021 |
2020 |
||||||
| Dividends declared per common share |
|
$1.62 |
|
|
$1.52 |
| ||
| Dividends declared |
|
797 |
|
|
753 |
| ||
| Dividends reinvested |
|
(24) |
|
|
(23) |
| ||
| Dividends paid |
|
773 |
|
|
730 |
| ||
· |
Share repurchases – Normal Course Issuer Bid (NCIB). |
| Year ended December 31, |
||||||||
| 2021 |
2020 |
|||||||
| Share repurchases (millions of U.S. dollars) |
1,400 |
200 | ||||||
| Shares repurchased (number in millions) |
12.8 |
2.6 | ||||||
| Share repurchases – average price per share in U.S. dollars |
$109.42 |
$78.37 | ||||||
| December 31, |
||||||||
| (millions of U.S. dollars) |
2021 |
2020 |
||||||
| Long-term indebtedness |
|
3,786 |
|
|
3,772 |
| ||
| Total debt |
|
3,786 |
|
|
3,772 |
| ||
| Swaps |
|
(99) |
|
|
(100) |
| ||
| Total debt after swaps |
|
3,687 |
|
|
3,672 |
| ||
| Remove fair value adjustments for hedges (1) |
|
(10) |
|
|
1 |
| ||
| Total debt after currency hedging arrangements |
|
3,677 |
|
|
3,673 |
| ||
| Remove transaction costs, premiums or discounts included in the carrying value of debt |
|
33 |
|
|
38 |
| ||
| Add: Lease liabilities (current and non-current) |
|
261 |
|
|
306 |
| ||
| Less: cash and cash equivalents (2) |
|
(778) |
|
|
(1,787) |
| ||
| Net debt (3) |
|
3,193 |
|
|
2,230 |
| ||
| Leverage ratio of net debt to adjusted EBITDA |
||||||||
| Adjusted EBITDA (3) |
|
1,970 |
|
|
1,975 |
| ||
| Net debt/adjusted EBITDA (3) |
|
1.6:1 |
|
|
1.1:1 |
| ||
 |
 |
| (millions of U.S. dollars) |
2022 |
2023 |
2024 |
2025 |
2026 |
Thereafter |
Total |
|||||||||||||||||||||
| Long-term debt (1) |
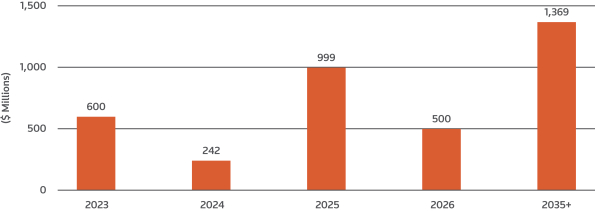
- | 600 | 242 | 1,108 | 500 | 1,369 | 3,819 | |||||||||||||||||||||
| Interest payable (1) |
153 | 153 | 127 | 105 | 84 | 1,019 | 1,641 | |||||||||||||||||||||
| Debt-related hedges outflows (2) |
22 | 22 | 22 | 1,010 | - | - | 1,076 | |||||||||||||||||||||
| Debt-related hedges inflows (1) |
(25) | (25) | (25) | (1,120) | - | - | (1,195) | |||||||||||||||||||||
| Lease obligations (3) |
76 | 66 | 49 | 38 | 29 | 140 | 398 | |||||||||||||||||||||
| Foreign exchange contracts outflows (4) |
- | 1,746 | 1,743 | - | - | - | 3,489 | |||||||||||||||||||||
| Foreign exchange contracts inflows (5) |
- | (1,738) | (1,732) | - | - | - | (3,470) | |||||||||||||||||||||
| Unconditional purchase obligations |
374 | 273 | 199 | 136 | 47 | 3 | 1,032 | |||||||||||||||||||||
| Defined benefit obligations |
34 | - | - | - | - | - | 34 | |||||||||||||||||||||
| Total |
634 | 1,097 | 625 | 1,277 | 660 | 2,531 | 6,824 | |||||||||||||||||||||
· |
Subsidiary guarantees |
· |
Unconditional purchase obligations |
· |
Defined benefit obligations |
· |
Disposition contingencies |
· |
Legal Professionals: COVID-19 has accelerated the pace of adoption for digital collaboration tools among lawyers within firms as well as with their clients. Government customers are increasingly using technology to manage compliance with policies and regulations, minimize fraud, provide greater access to justice via virtual courts, and to maintain global security. |
· |
Corporates: |
· |
Tax & Accounting Professionals: on-premises systems are gradually being replaced by cloud-based, Software-as-a-Service |
· |
Make it easier for our customers to do business with us; |
· |
Significantly modernize and simplify our product portfolio and product development groups; |
· |
Reduce complexity in our operations and technology organization; and |
· |
Continue to simplify our organizational structure to enable a more innovative culture. |
· |
Organic revenue growth of 5.5% - 6.0%, including additional annual revenues of $100 million; |
· |
Adjusted EBITDA margin of 39% - 40%; |
· |
Free cash flow of $1.9 billion – $2.0 billion; |
· |
Annual operating expense savings of $600 million, of which $200 million is expected to be reinvested in growth initiatives; and |
· |
Accrued capital expenditures as a percentage of revenues between 6.0% - 6.5%. |
| Total Thomson Reuters |
2021 Actual |
2022 Outlook |
2023 Outlook |
|||||||||
| Revenue growth Organic revenue growth (1) |
|
6.1% 5.2% |
|
|
Approximately 5.0% Approximately 5.0% |
|
|
5.5% – 6.0% 5.5% – 6.0% |
| |||
| Adjusted EBITDA margin (1) |
31.0% | Approximately 35% | 39% – 40% | |||||||||
| Corporate costs Core corporate costs Change Program operating expenses |
|
$325 million $142 million $183 million |
|
|
$280 million – $330 million $120 million – $130 million $160 million – $200 million |
|
|
$110 million – $120 million $110 million – $120 million $0 |
| |||
| Free cash flow (1) |
$1.3 billion | Approximately $1.3 billion | $1.9 billion – $2.0 billion | |||||||||
| Accrued capital expenditures as a percentage of revenues (1) Change Program accrued capital expenditures |
|
8.5% $112 million |
|
|
7.5% – 8.0% $100 million – $140 million |
|
|
6.0% – 6.5% $0 |
| |||
| Depreciation and amortization of computer software |
$651 million | $620 million – $645 million | $580 million – $605 million | |||||||||
| Interest expense |
$196 million | $190 million –$210 million | $190 million – $210 million | |||||||||
| Effective tax rate on adjusted earnings (1) |
13.9% | 19% – 21% | n/a | |||||||||
| “Big 3” Segments (1) |
2021 Actual |
2022 Outlook |
2023 Outlook |
|||||||||
| Revenue growth Organic revenue growth |
|
6.9% 6.2% |
|
|
6.0% – 6.5% 6.0% – 6.5% |
|
|
6.5% – 7.0% 6.5% – 7.0% |
| |||
| Adjusted EBITDA margin |
38.8% | Approximately 42% | 44% – 45% | |||||||||
Revenues | ||
| Material assumptions |
Material risks | |
| · COVID-19 and the measures intended to mitigate its impact· · · · |
· COVID-19 pandemic, including government enforced quarantines and stay-at-home · COVID-19 pandemic, related regulatory reform, changes in the political environment or other events and macroeconomic factors may lead to limited business opportunities for our customers, creating significant cost pressures for some of them and potentially constraining the number of professionals employed, which could lead to lower demand for our products and services· · · | |
Adjusted EBITDA margin | ||
| Material assumptions |
Material risks | |
| · · · · |
· · · | |
Free Cash Flow | ||
| Material assumptions |
Material risks | |
| · · |
· · · · | |
Effective tax rate on adjusted earnings | ||
| Material assumptions |
Material risks | |
| · · pre-tax profit or losses in 2021 does not significantly change· · · · · |
· · pre-tax profits and losses· · | |
How We Define It |
Why We Use It and Why It Is Useful to Investors |
Most Directly Comparable IFRS Measure | ||
| Adjusted EBITDA and the related margin | ||||
| Represents earnings or losses from continuing operations before tax expense or benefit, net interest expense, other finance costs or income, depreciation, amortization of software and other identifiable intangible assets, our share of post-tax earnings or losses in equity method investments, other operating gains and losses, certain asset impairment charges and fair value adjustments.Adjusted EBITDA margin is adjusted EBITDA expressed as a percentage of revenues. |
Provides a consistent basis to evaluate operating profitability and performance trends by excluding items that we do not consider to be controllable activities for this purpose. Also represents a measure commonly reported and widely used by investors as a valuation metric, as well as to assess our ability to incur and service debt. |
Earnings from continuing operations | ||
| Adjusted EBITDA less accrued capital expenditures and the related margin | ||||
| Represents adjusted EBITDA less accrued capital expenditures, where accrued capital expenditures include amounts that remain unpaid at the reporting date. The related margin is adjusted EBITDA less accrued capital expenditures expressed as a percentage of revenues. |
Provides a basis for evaluating the operating profitability and capital intensity of a business in a single measure. This measure captures investments regardless of whether they are expensed or capitalized, and reflects the basis on which management measures capital spending. |
Earnings from continuing operations | ||
| Accrued capital expenditures as a percentage of revenues | ||||
| Accrued capital expenditures divided by revenues, where accrued capital expenditures include amounts that remain unpaid at the reporting date. |
Reflects the basis on how we manage capital expenditures for internal budgeting purposes. |
Capital expenditures | ||
| How We Define It |
Why We Use It and Why It Is Useful to Investors |
Most Directly Comparable IFRS Measure | ||
| Adjusted earnings and adjusted EPS | ||||
| Net earnings or loss including dividends declared on preference shares but excluding the post-tax impacts of fair value adjustments, amortization of other identifiable intangible assets, other operating gains and losses, certain asset impairment charges, other finance costs or income, our share of post-tax earnings or losses in equity method investments, discontinued operations and other items affecting comparability.The post-tax amount of each item is excluded from adjusted earnings based on the specific tax rules and tax rates associated with the nature and jurisdiction of each item.Adjusted EPS is calculated from adjusted earnings using diluted weighted-average shares and does not represent actual earnings or loss per share attributable to shareholders. |
Provides a more comparable basis to analyze earnings. These measures are commonly used by shareholders to measure performance. |
Net earnings and diluted earnings per share | ||
| Effective tax rate on adjusted earnings | ||||
| Adjusted tax expense divided by pre-tax adjusted earnings. Adjusted tax expense is computed as income tax (benefit) expense plus or minus the income tax impacts of all items impacting adjusted earnings (as described above), and other tax items impacting comparability. |
Provides a basis to analyze the effective tax rate associated with adjusted earnings. |
Tax expense | ||
| In interim periods, we also make an adjustment to reflect income taxes based on the estimated full-year effective tax rate. Earnings or losses for interim periods under IFRS reflect income taxes based on the estimated effective tax rates of each of the jurisdictions in which we operate. The non-IFRS adjustment reallocates estimated full-year income taxes between interim periods but has no effect on full-year income taxes. |
Because the geographical mix of pre-tax profits and losses in interim periods may be different from that for the full year, our effective tax rate computed in accordance with IFRS may be more volatile by quarter. Therefore, we believe that using the expected full-year effective tax rate provides more comparability among interim periods. |
|||
| How We Define It |
Why We Use It and Why It Is Useful to Investors |
Most Directly Comparable IFRS Measure | ||
| Net debt and leverage ratio of net debt to adjusted EBITDA | ||||
| Net debt: Total indebtedness (excluding the associated unamortized transaction costs and premiums or discount) plus the currency related fair value of associated hedging instruments, and lease liabilities less cash and cash equivalents. |
Provides a commonly used measure of a company’s leverage. Given that we hedge some of our debt to reduce risk, we include hedging instruments as we believe it provides a better measure of the total obligation associated with our outstanding debt. However, because we intend to hold our debt and related hedges to maturity, we do not consider the interest components of the associated fair value of hedges in our measurements. We reduce gross indebtedness by cash and cash equivalents. |
Total debt (current indebtedness plus long-term indebtedness) | ||
| Net debt to adjusted EBITDA: Net debt is divided by adjusted EBITDA for the previous twelve-month period ending with the current fiscal quarter. |
Provides a commonly used measure of a company’s ability to pay its debt. Our non-IFRS measure is aligned with the calculation of our internal target and is more conservative than the maximum ratio allowed under our contractual covenants in our credit facility. |
For adjusted EBITDA, refer to the definition above for the most directly comparable IFRS measure | ||
| Free cash flow | ||||
| Net cash provided by operating activities, proceeds from disposals of property and equipment, and other investing activities, less capital expenditures, payments of lease principal and dividends paid on our preference shares. |
Helps assess our ability, over the long term, to create value for our shareholders as it represents cash available to repay debt, pay common dividends and fund share repurchases and new acquisitions. | Net cash provided by operating activities | ||
| Return on invested capital (ROIC) | ||||
| Adjusted operating profit (operating profit excluding amortization of other identifiable intangible assets, other operating gains and losses, and fair value adjustments) less net taxes paid expressed as a percentage of the average adjusted invested capital during the period. |
Provides a measure of how efficiently we allocate resources to profitable activities and is indicative of our ability to create value for our shareholders. | IFRS does not require a measure comparable to ROIC. Refer to our calculation of ROIC in Appendix D for a reconciliation of the components in the calculation to the most directly comparable IFRS measure. | ||
| How We Define It |
Why We Use It and Why It Is Useful to Investors |
Most Directly Comparable IFRS Measure | ||
| Changes before the impact of foreign currency or at “constant currency” | ||||
| Applicable measures where changes are reported before the impact of foreign currency or at “constant currency” IFRS Measures: · · Non-IFRS Measures and ratios:· · Our reporting currency is the U.S. dollar. However, we conduct activities in currencies other than the U.S. dollar. We measure our performance before the impact of foreign currency (or at “constant currency”), which means that we apply the same foreign currency exchange rates for the current and equivalent prior period. To calculate the foreign currency impact between periods, we convert the current and equivalent prior period’s local currency results using the same foreign currency exchange rate. |
Provides better comparability of business trends from period to period. | For each non-IFRS measure and ratio, refer to the definitions above for the most directly comparable IFRS measure. | ||
| Changes in revenues computed on an “organic” basis | ||||
| Represent changes in revenues of our existing businesses at constant currency. The metric excludes the distortive impacts of acquisitions and dispositions from not owning the business in both comparable periods. · · |
Provides further insight into the performance of our existing businesses by excluding distortive impacts and serves as a better measure of our ability to grow our business over the long term. | Revenues | ||
| “Big 3” segments | ||||
| Our combined Legal Professionals, Corporates and Tax & Accounting Professionals segments. All measures reported for the “Big 3” segments are non-IFRS financial measures. |
Information for the “Big 3” segments comprise 80% of revenues and represent the core of our business information service product offerings. | Revenues Earnings from continuing operations | ||
| Three months ended December 31, |
Year ended December 31, |
|||||||||||||||
| (millions of U.S. dollars, except margins) |
2021 |
2020 |
2021 |
2020 |
||||||||||||
| (Loss) earnings from continuing operations |
|
(177) |
|
|
587 |
|
|
5,687 |
|
|
1,149 |
| ||||
| Adjustments to remove: |
||||||||||||||||
| Tax (benefit) expense |
|
(115) |
|
|
155 |
|
|
1,607 |
|
|
71 |
| ||||
| Other finance costs (income) |
|
22 |
|
|
6 |
|
|
(8) |
|
|
(30) |
| ||||
| Net interest expense |
|
50 |
|
|
49 |
|
|
196 |
|
|
195 |
| ||||
| Amortization of other identifiable intangible assets |
|
29 |
|
|
31 |
|
|
119 |
|
|
123 |
| ||||
| Amortization of computer software |
|
118 |
|
|
123 |
|
|
474 |
|
|
485 |
| ||||
| Depreciation |
|
49 |
|
|
40 |
|
|
177 |
|
|
184 |
| ||||
| EBITDA |
|
(24) |
|
|
991 |
|
|
8,252 |
|
|
2,177 |
| ||||
| Adjustments to remove: |
||||||||||||||||
| Share of post-tax losses (earnings) in equity method investments |
|
477 |
|
|
159 |
|
|
(6,240) |
|
|
544 |
| ||||
| Other operating losses (gains), net |
|
1 |
|
|
(632) |
|
|
(34) |
|
|
(736) |
| ||||
| Fair value adjustments (1) |
|
(2) |
|
|
7 |
|
|
(8) |
|
|
(10) |
| ||||
| Adjusted EBITDA |
|
452 |
|
|
525 |
|
|
1,970 |
|
|
1,975 |
| ||||
| Deduct: accrued capital expenditures |
|
(177) |
|
|
(116) |
|
|
(541) |
|
|
(467) |
| ||||
| Adjusted EBITDA less accrued capital expenditures |
|
275 |
|
|
409 |
|
|
1,429 |
|
|
1,508 |
| ||||
| Adjusted EBITDA margin |
|
26.4% |
|
|
32.5% |
|
|
31.0% |
|
|
33.0% |
| ||||
| Adjusted EBITDA less accrued capital expenditures margin |
|
16.1% |
|
|
25.3% |
|
|
22.5% |
|
|
25.2% |
| ||||
| Three months ended December 31, |
Year ended December 31 |
|||||||||||||||
| (millions of U.S. dollars) |
2021 |
2020 |
2021 |
2020 |
||||||||||||
| Capital expenditures |
|
123 |
|
|
100 |
|
|
487 |
|
|
504 |
| ||||
| Remove IFRS adjustment to cash basis |
|
54 |
|
|
16 |
|
|
54 |
|
|
(37) |
| ||||
| Accrued capital expenditures |
|
177 |
|
|
116 |
|
|
541 |
|
|
467 |
| ||||
| Accrued capital expenditures as a percentage of revenues (1) |
|
10.4% |
|
|
7.2% |
|
|
8.5% |
|
|
7.8% |
| ||||
| Three months ended December 31, |
Year ended December 31, |
|||||||||||||||
| (millions of U.S. dollars, except per share amounts and share data) |
2021 |
2020 |
2021 |
2020 |
||||||||||||
| Net (loss) earnings |
|
(175) |
|
|
562 |
|
|
5,689 |
|
|
1,122 |
| ||||
| Adjustments to remove: |
||||||||||||||||
| Fair value adjustments (1) |
|
(2) |
|
|
7 |
|
|
(8) |
|
|
(10) |
| ||||
| Amortization of other identifiable intangible assets |
|
29 |
|
|
31 |
|
|
119 |
|
|
123 |
| ||||
| Other operating losses (gains), net |
|
1 |
|
|
(632) |
|
|
(34) |
|
|
(736) |
| ||||
| Other finance costs (income) |
|
22 |
|
|
6 |
|
|
(8) |
|
|
(30) |
| ||||
| Share of post-tax losses (earnings) in equity method investments |
|
477 |
|
|
159 |
|
|
(6,240) |
|
|
544 |
| ||||
| Tax on above items (2) |
|
(141) |
|
|
119 |
|
|
1,475 |
|
|
19 |
| ||||
| Tax items impacting comparability (2) |
|
(9) |
|
|
(29) |
|
|
(24) |
|
|
(136) |
| ||||
| (Earnings) loss from discontinued operations, net of tax |
|
(2) |
|
|
25 |
|
|
(2) |
|
|
27 |
| ||||
| Interim period effective tax rate normalization |
|
10 |
|
|
21 |
|
|
- |
|
|
- |
| ||||
| Dividends declared on preference shares |
|
- |
|
|
- |
|
|
(2) |
|
|
(2) |
| ||||
| Adjusted earnings |
|
210 |
|
|
269 |
|
|
965 |
|
|
921 |
| ||||
| Adjusted EPS |
|
$0.43 |
|
|
$0.54 |
|
|
$1.95 |
|
|
$1.85 |
| ||||
| Diluted weighted-average common shares (millions) |
|
488.6 |
|
|
498.8 |
|
|
494.5 |
|
|
498.0 |
| ||||
| Year ended December 31, |
||||||||
| (millions of U.S. dollars, except tax rate calculation) |
2021 |
2020 |
||||||
| Tax expense on adjusted earnings |
|
156 |
|
|
188 |
| ||
| Divided by: pre-tax adjusted earnings |
|
1,123 |
|
|
1,111 |
| ||
| Effective tax rate on adjusted earnings |
|
13.9% |
|
|
16.9% |
| ||
| Year ended December 31, |
||||||||
| (millions of U.S. dollars) |
2021 |
2020 |
||||||
| Adjusted earnings |
|
965 |
|
|
921 |
| ||
| Plus: Dividends declared on preference shares |
|
2 |
|
|
2 |
| ||
| Plus: Tax expense on adjusted earnings. |
|
156 |
|
|
188 |
| ||
| Pre-tax adjusted earnings |
|
1,123 |
|
|
1,111 |
| ||
| Three months ended December 31, |
||||
| (weighted-average common shares) |
2021 |
|||
| IFRS: Basic and diluted |
|
487,297,738 |
| |
| Effect of stock options and other equity incentive awards |
|
1,291,196 |
| |
| Non-IFRS diluted |
|
488,588,934 |
| |
| Three months ended December 31, |
Year ended December 31, |
|||||||||||||||
| (millions of U.S. dollars) |
2021 |
2020 |
2021 |
2020 |
||||||||||||
| Net cash provided by operating activities |
|
397 |
|
|
566 |
|
|
1,773 |
|
|
1,745 |
| ||||
| Capital expenditures |
|
(123) |
|
|
(100) |
|
|
(487) |
|
|
(504) |
| ||||
| Proceeds from disposals of property and equipment |
|
- |
|
|
- |
|
|
- |
|
|
162 |
| ||||
| Other investing activities |
|
25 |
|
|
2 |
|
|
81 |
|
|
4 |
| ||||
| Payments of lease principal |
|
(44) |
|
|
(19) |
|
|
(109) |
|
|
(75) |
| ||||
| Dividends paid on preference shares |
|
- |
|
|
- |
|
|
(2) |
|
|
(2) |
| ||||
| Free cash flow |
|
255 |
|
|
449 |
|
|
1,256 |
|
|
1,330 |
| ||||
| Three months ended December 31, |
||||||||||||||||||||||||||||
| Change |
||||||||||||||||||||||||||||
(millions of U.S. dollars) |
2021 |
2020 |
Total |
Foreign Currency |
Subtotal Constant Currency |
Acquisitions/ (Divestitures) |
Organic |
|||||||||||||||||||||
| Revenues |
||||||||||||||||||||||||||||
| Legal Professionals |
689 |
653 | 5% | - | 5% | - | 6% | |||||||||||||||||||||
| Corporates |
361 |
338 | 7% | - | 7% | - | 7% | |||||||||||||||||||||
| Tax & Accounting Professionals |
309 |
285 | 9% | (1%) | 9% | - | 9% | |||||||||||||||||||||
| “Big 3” Segments Combined |
1,359 |
1,276 | 6% | - | 7% | - | 7% | |||||||||||||||||||||
| Reuters News |
182 |
164 | 11% | (1%) | 12% | - | 12% | |||||||||||||||||||||
| Global Print |
170 |
177 | (4%) | - | (4%) | - | (4%) | |||||||||||||||||||||
| Eliminations/Rounding |
(1) |
(1) | ||||||||||||||||||||||||||
| Total revenues |
1,710 |
1,616 | 6% | - | 6% | - | 6% | |||||||||||||||||||||
| Three months ended December 31, |
||||||||||||||||||||||||||||
| Change |
||||||||||||||||||||||||||||
(millions of U.S. dollars) |
2021 |
2020 |
Total |
Foreign Currency |
Subtotal Constant Currency |
Acquisitions/ (Divestitures) |
Organic |
|||||||||||||||||||||
| Recurring Revenues |
||||||||||||||||||||||||||||
| Legal Professionals |
642 |
608 | 6% | - | 5% | - | 6% | |||||||||||||||||||||
| Corporates |
314 |
293 | 7% | - | 7% | - | 7% | |||||||||||||||||||||
| Tax & Accounting Professionals |
276 |
255 | 9% | - | 9% | - | 9% | |||||||||||||||||||||
| “Big 3” Segments Combined |
1,232 |
1,156 | 7% | - | 7% | - | 7% | |||||||||||||||||||||
| Reuters News |
145 |
142 | 2% | (1%) | 3% | - | 3% | |||||||||||||||||||||
| Total recurring revenues |
1,377 |
1,298 | 6% | - | 6% | - | 6% | |||||||||||||||||||||
| Three months ended December 31, |
||||||||||||||||||||||||||||
| Change |
||||||||||||||||||||||||||||
(millions of U.S. dollars) |
2021 |
2020 |
Total |
Foreign Currency |
Subtotal Constant Currency |
Acquisitions/ (Divestitures) |
Organic |
|||||||||||||||||||||
| Transactions Revenues |
||||||||||||||||||||||||||||
| Legal Professionals |
47 |
45 | 4% | - | 4% | (2%) | 6% | |||||||||||||||||||||
| Corporates |
47 |
45 | 4% | - | 4% | - | 4% | |||||||||||||||||||||
| Tax & Accounting Professionals |
33 |
30 | 9% | (1%) | 10% | - | 10% | |||||||||||||||||||||
| “Big 3” Segments Combined |
127 |
120 | 5% | - | 6% | (1%) | 6% | |||||||||||||||||||||
| Reuters News |
37 |
22 | 66% | 2% | 64% | - | 64% | |||||||||||||||||||||
| Total transactions revenues |
164 |
142 | 15% | - | 15% | (1%) | 16% | |||||||||||||||||||||
| Year ended December 31, |
||||||||||||||||||||||||||||
| Change |
||||||||||||||||||||||||||||
(millions of U.S. dollars) |
2021 |
2020 |
Total |
Foreign Currency |
Subtotal Constant Currency |
Acquisitions/ (Divestitures) |
Organic |
|||||||||||||||||||||
| Revenues |
||||||||||||||||||||||||||||
| Legal Professionals |
2,712 |
2,535 | 7% | 1% | 6% | - | 6% | |||||||||||||||||||||
| Corporates |
1,449 |
1,367 | 6% | 1% | 5% | - | 5% | |||||||||||||||||||||
| Tax & Accounting Professionals |
906 |
836 | 8% | - | 9% | - | 9% | |||||||||||||||||||||
| “Big 3” Segments Combined |
5,067 |
4,738 | 7% | 1% | 6% | - | 6% | |||||||||||||||||||||
| Reuters News |
674 |
628 | 7% | 1% | 7% | - | 7% | |||||||||||||||||||||
| Global Print |
609 |
620 | (2%) | 1% | (3%) | - | (3%) | |||||||||||||||||||||
| Eliminations/Rounding |
(2) |
(2) | ||||||||||||||||||||||||||
| Total revenues |
6,348 |
5,984 | 6% | 1% | 5% | - | 5% | |||||||||||||||||||||
| Year ended December 31, |
||||||||||||||||||||||||||||
| Change |
||||||||||||||||||||||||||||
(millions of U.S. dollars) |
2021 |
2020 |
Total |
Foreign Currency |
Subtotal Constant Currency |
Acquisitions/ (Divestitures) |
Organic |
|||||||||||||||||||||
| Recurring Revenues |
||||||||||||||||||||||||||||
| Legal Professionals |
2,523 |
2,367 | 7% | 1% | 6% | - | 5% | |||||||||||||||||||||
| Corporates |
1,218 |
1,143 | 7% | 1% | 6% | - | 6% | |||||||||||||||||||||
| Tax & Accounting Professionals |
733 |
682 | 8% | - | 8% | - | 8% | |||||||||||||||||||||
| “Big 3” Segments Combined |
4,474 |
4,192 | 7% | 1% | 6% | - | 6% | |||||||||||||||||||||
| Reuters News |
576 |
566 | 2% | 1% | 1% | - | 1% | |||||||||||||||||||||
| Total recurring revenues |
5,050 |
4,758 | 6% | 1% | 5% | - | 5% | |||||||||||||||||||||
| Year ended December 31, |
||||||||||||||||||||||||||||
| Change |
||||||||||||||||||||||||||||
(millions of U.S. dollars) |
2021 |
2020 |
Total |
Foreign Currency |
Subtotal Constant Currency |
Acquisitions/ (Divestitures) |
Organic |
|||||||||||||||||||||
| Transactions Revenues |
||||||||||||||||||||||||||||
| Legal Professionals |
189 |
168 | 13% | 2% | 11% | (1%) | 12% | |||||||||||||||||||||
| Corporates |
231 |
224 | 3% | - | 3% | - | 3% | |||||||||||||||||||||
| Tax & Accounting Professionals |
173 |
154 | 12% | - | 12% | - | 12% | |||||||||||||||||||||
| “Big 3” Segments Combined |
593 |
546 | 9% | 1% | 8% | - | 8% | |||||||||||||||||||||
| Reuters News |
98 |
62 | 57% | 2% | 55% | - | 55% | |||||||||||||||||||||
| Total transactions revenues |
691 |
608 | 14% | 1% | 13% | - | 13% | |||||||||||||||||||||
| Three months ended December 31, |
||||||||||||||||||||
| Change |
||||||||||||||||||||
| (millions of U.S. dollars, except margins and per share amounts) |
2021 |
2020 |
Total |
Foreign Currency |
Constant Currency |
|||||||||||||||
| Adjusted EBITDA |
||||||||||||||||||||
| Legal Professionals |
239 |
245 | (3%) | - | (2%) | |||||||||||||||
| Corporates |
95 |
105 | (10%) | - | (10%) | |||||||||||||||
| Tax & Accounting Professionals |
154 |
145 | 6% | (1%) | 7% | |||||||||||||||
| “Big 3” Segments Combined |
488 |
495 | (2%) | - | (1%) | |||||||||||||||
| Reuters News |
15 |
6 | 139% | 32% | 107% | |||||||||||||||
| Global Print |
61 |
61 | - | 1% | (1%) | |||||||||||||||
| Corporate costs |
(112) |
(37) | n/a | n/a | n/a | |||||||||||||||
| Adjusted EBITDA |
452 |
525 | (14%) | - | (14%) | |||||||||||||||
| Adjusted EBITDA margin |
||||||||||||||||||||
| Legal Professionals |
34.5% |
37.5% | (300)bp | (30)bp | (270)bp | |||||||||||||||
| Corporates |
26.3% |
31.1% | (480)bp | - | (480)bp | |||||||||||||||
| Tax & Accounting Professionals |
49.8% |
51.1% | (130)bp | (10)bp | (120)bp | |||||||||||||||
| “Big 3” Segments Combined |
35.8% |
38.8% | (300)bp | (20)bp | (280)bp | |||||||||||||||
| Reuters News |
8.3% |
3.9% | 440bp | (10)bp | 450bp | |||||||||||||||
| Global Print |
35.9% |
34.6% | 130bp | 20bp | 110bp | |||||||||||||||
| Corporate costs |
n/a |
n/a | n/a | n/a | n/a | |||||||||||||||
| Adjusted EBITDA margin |
26.4% |
32.5% | (610)bp | - | (610)bp | |||||||||||||||
| Operating expenses |
1,256 |
1,098 | 15% | - | 16% | |||||||||||||||
| Adjusted EPS |
$0.43 |
$0.54 | (20%) | - | (20%) | |||||||||||||||
| Year ended December 31, |
||||||||||||||||||||
| Change |
||||||||||||||||||||
| (millions of U.S. dollars, except margins and per share amounts) |
2021 |
2020 |
Total |
Foreign Currency |
Constant Currency |
|||||||||||||||
| Adjusted EBITDA |
||||||||||||||||||||
| Legal Professionals |
1,091 |
1,001 | 9% | 2% | 7% | |||||||||||||||
| Corporates |
502 |
460 | 9% | - | 9% | |||||||||||||||
| Tax & Accounting Professionals |
373 |
330 | 13% | - | 13% | |||||||||||||||
| “Big 3” Segments Combined |
1,966 |
1,791 | 10% | 1% | 9% | |||||||||||||||
| Reuters News |
103 |
73 | 40% | (11%) | 51% | |||||||||||||||
| Global Print |
226 |
242 | (7%) | 2% | (8%) | |||||||||||||||
| Corporate costs |
(325) |
(131) | n/a | n/a | n/a | |||||||||||||||
| Adjusted EBITDA |
1,970 |
1,975 | - | - | (1%) | |||||||||||||||
| Adjusted EBITDA margin |
||||||||||||||||||||
| Legal Professionals |
40.2% |
39.5% | 70bp | 20bp | 50bp | |||||||||||||||
| Corporates |
34.6% |
33.7% | 90bp | (10)bp | 100bp | |||||||||||||||
| Tax & Accounting Professionals |
41.1% |
39.5% | 160bp | (10)bp | 170bp | |||||||||||||||
| “Big 3” Segments Combined |
38.8% |
37.8% | 100bp | 10bp | 90bp | |||||||||||||||
| Reuters News |
15.2% |
11.7% | 350bp | (150)bp | 500bp | |||||||||||||||
| Global Print |
37.1% |
39.0% | (190)bp | 20bp | (210)bp | |||||||||||||||
| Corporate costs |
n/a |
n/a | n/a | n/a | n/a | |||||||||||||||
| Adjusted EBITDA margin |
31.0% |
33.0% | (200)bp | (10)bp | (190)bp | |||||||||||||||
| Operating expenses |
4,370 |
3,999 | 9% | 1% | 8% | |||||||||||||||
| Adjusted EPS |
$1.95 |
$1.85 | 5% | 1% | 5% | |||||||||||||||
| As Revised |
Year ended December 31, 2021 |
Year ended December 31, 2020 |
||||||||||||||||||||||
| (millions of U.S. dollars, except for margins) |
As Reported |
Adjustments |
As Revised |
As Reported |
Adjustments |
As Revised |
||||||||||||||||||
| Revenues |
||||||||||||||||||||||||
| Legal Professionals |
2,712 |
- |
2,712 |
2,535 | - | 2,535 | ||||||||||||||||||
| Corporates |
1,449 |
(9) |
1,440 |
1,367 | (6) | 1,361 | ||||||||||||||||||
| Tax & Accounting Professionals |
906 |
9 |
915 |
836 | 6 | 842 | ||||||||||||||||||
| “Big 3” Segments Combined |
5,067 |
- |
5,067 |
4,738 | - | 4,738 | ||||||||||||||||||
| Reuters News |
674 |
20 |
694 |
628 | 17 | 645 | ||||||||||||||||||
| Global Print |
609 |
- |
609 |
620 | - | 620 | ||||||||||||||||||
| Eliminations /Rounding |
(2) |
(20) |
(22) |
(2) | (17) | (19) | ||||||||||||||||||
| Total revenues |
6,348 |
- |
6,348 |
5,984 | - | 5,984 | ||||||||||||||||||
| Adjusted EBITDA |
||||||||||||||||||||||||
| Legal Professionals |
1,091 |
- |
1,091 |
1,001 | - | 1,001 | ||||||||||||||||||
| Corporates |
502 |
(6) |
496 |
460 | (4) | 456 | ||||||||||||||||||
| Tax & Accounting Professionals |
373 |
6 |
379 |
330 | 4 | 334 | ||||||||||||||||||
| “Big 3” Segments Combined |
1,966 |
- |
1,966 |
1,791 | - | 1,791 | ||||||||||||||||||
| Reuters News |
103 |
- |
103 |
73 | - | 73 | ||||||||||||||||||
| Global Print |
226 |
- |
226 |
242 | - | 242 | ||||||||||||||||||
| Corporate costs |
(325) |
- |
(325) |
(131) | - | (131) | ||||||||||||||||||
| Adjusted EBITDA |
1,970 |
- |
1,970 |
1,975 | - | 1,975 | ||||||||||||||||||
| Adjusted EBITDA margin (1) |
||||||||||||||||||||||||
| Legal Professionals |
40.2% |
- |
40.2% |
39.5% | - | 39.5% | ||||||||||||||||||
| Corporates |
34.6% |
(0.2%) |
34.4% |
33.7% | (0.2%) | 33.5% | ||||||||||||||||||
| Tax & Accounting Professionals |
41.1% |
0.2% |
41.3% |
39.5% | 0.2% | 39.7% | ||||||||||||||||||
| “Big 3” Segments Combined |
38.8% |
- |
38.8% |
37.8% | - | 37.8% | ||||||||||||||||||
| Reuters News |
15.2% |
(0.4%) |
14.8% |
11.7% | (0.3%) | 11.4% | ||||||||||||||||||
| Global Print |
37.1% |
- |
37.1% |
39.0% | - | 39.0% | ||||||||||||||||||
| Corporate costs |
n/a |
n/a |
n/a | n/a | ||||||||||||||||||||
| Adjusted EBITDA margin (1) |
31.0% |
- |
31.0% |
33.0% | - | 33.0% | ||||||||||||||||||
| As Revised |
2021 |
|||||||||||||||
| (millions of U.S. dollars, except for margins) |
First Quarter |
Second Quarter |
Third Quarter |
Fourth Quarter |
||||||||||||
| Revenues |
||||||||||||||||
| Legal Professionals |
668 |
673 |
682 |
689 |
||||||||||||
| Corporates |
382 |
346 |
354 |
358 |
||||||||||||
| Tax & Accounting Professionals |
227 |
199 |
177 |
312 |
||||||||||||
| “Big 3” Segments Combined |
1,277 |
1,218 |
1,213 |
1,359 |
||||||||||||
| Reuters News |
165 |
173 |
169 |
187 |
||||||||||||
| Global Print |
143 |
147 |
149 |
170 |
||||||||||||
| Eliminations /Rounding |
(5) |
(6) |
(5) |
(6) |
||||||||||||
| Total revenues |
1,580 |
1,532 |
1,526 |
1,710 |
||||||||||||
| Adjusted EBITDA |
||||||||||||||||
| Legal Professionals |
279 |
285 |
288 |
239 |
||||||||||||
| Corporates |
145 |
128 |
130 |
93 |
||||||||||||
| Tax & Accounting Professionals |
99 |
74 |
50 |
156 |
||||||||||||
| “Big 3” Segments Combined |
523 |
487 |
468 |
488 |
||||||||||||
| Reuters News |
28 |
35 |
25 |
15 |
||||||||||||
| Global Print |
57 |
56 |
52 |
61 |
||||||||||||
| Corporate costs |
(50) |
(76) |
(87) |
(112) |
||||||||||||
| Adjusted EBITDA |
558 |
502 |
458 |
452 |
||||||||||||
| Adjusted EBITDA margin (1) |
||||||||||||||||
| Legal Professionals |
41.8% |
42.3% |
42.3% |
34.5% |
||||||||||||
| Corporates |
38.0% |
37.0% |
36.7% |
26.0% |
||||||||||||
| Tax & Accounting Professionals |
43.7% |
36.7% |
28.4% |
49.9% |
||||||||||||
| “Big 3” Segments Combined |
41.0% |
39.9% |
38.6% |
35.8% |
||||||||||||
| Reuters News |
17.1% |
20.2% |
14.5% |
8.1% |
||||||||||||
| Global Print |
39.9% |
37.9% |
35.0% |
35.9% |
||||||||||||
| Corporate costs |
n/a |
n/a |
n/a |
n/a |
||||||||||||
| Adjusted EBITDA margin (1) |
35.3% |
32.7% |
30.0% |
26.4% |
||||||||||||
| For the years ended and as at December 31, |
||||||||
| (millions of U.S. dollars) |
2021 |
2020 |
||||||
| Calculation of adjusted operating profit after taxes |
||||||||
| Operating profit |
1,242 |
1,929 | ||||||
| Adjustments to remove: |
||||||||
| Amortization of other identifiable intangible assets |
119 |
123 | ||||||
| Fair value adjustments |
(8) |
(10) | ||||||
| Other operating gains, net |
(34) |
(736) | ||||||
| Adjusted operating profit – continuing operations |
1,319 |
1,306 | ||||||
| Net cash taxes paid on continuing operations |
(172) |
(52) | ||||||
| Post-tax adjusted operating profit- continuing operations |
1,147 |
1,254 | ||||||
| Post-tax adjusted operating loss- discontinued operations |
(8) |
(3) | ||||||
| Consolidated post-tax adjusted operating profit |
1,139 |
1,251 | ||||||
| Calculation of invested capital |
||||||||
| Trade and other receivables |
1,057 |
1,151 | ||||||
| Prepaid expenses and other current assets |
510 |
425 | ||||||
| Property and equipment, net |
502 |
545 | ||||||
| Computer software, net |
822 |
830 | ||||||
| Other identifiable intangible assets (excludes accumulated amortization) |
5,987 |
6,020 | ||||||
| Goodwill (1) |
4,962 |
4,996 | ||||||
| Payables, accruals and provisions |
(1,363) |
(1,159) | ||||||
| Current tax liabilities |
(169) |
(251) | ||||||
| Deferred revenue |
(874) |
(866) | ||||||
| Total invested capital (2) |
11,434 |
11,691 | ||||||
| Average invested capital |
11,563 |
11,798 | ||||||
| Return on invested capital |
9.9% |
10.6% | ||||||
· |
Most critical estimates and assumptions in determining the value of assets and liabilities; and |
· |
Most critical judgments in applying accounting policies. |
| Cash-Generating Unit |
Perpetual growth rate (1) |
Discount rate |
Tax rate |
|||||||||
| Legal Professionals |
2.5% | 7.0% | 25.6% | |||||||||
| Corporates |
2.5% | 8.0% | 25.9% | |||||||||
| Tax & Accounting Professionals |
3.0% | 8.5% | 26.8% | |||||||||
| Reuters News |
2.5% | 9.0% | 20.8% | |||||||||
| Global Print |
(4.4%) | 9.0% | 25.8% | |||||||||
· |
TRGP: Pri-2012/MP-2021 |
· |
TTC plan: SAPS S3 Light Tables with allowances for plan demographic specifics and longevity improvements. |
| For the years ended and as at December 31, |
||||||||||||
| (millions of U.S. dollars, except per share amounts) |
2021 |
2020 |
2019 |
|||||||||
| IFRS Consolidated Income Statement Data |
||||||||||||
| Revenues |
6,348 |
5,984 | 5,906 | |||||||||
| Operating profit |
1,242 |
1,929 | 1,199 | |||||||||
| Earnings from continuing operations |
5,687 |
1,149 | 1,570 | |||||||||
| Earnings (loss) from discontinued operations, net of tax |
2 |
(27) | (6) | |||||||||
| Net earnings |
5,689 |
1,122 | 1,564 | |||||||||
| Earnings attributable to common shareholders |
5,689 |
1,122 | 1,564 | |||||||||
| Basic earnings per share from continuing operations |
$11.52 |
$2.31 | $3.13 | |||||||||
| Basic earnings (loss) per share from discontinued operations |
$0.01 |
$(0.06) | $(0.01) | |||||||||
| Basic earnings per share |
$11.53 |
$2.25 | $3.12 | |||||||||
| Diluted earnings per share from continuing operations |
$11.50 |
$2.30 | $3.12 | |||||||||
| Diluted loss per share from discontinued operations |
- |
$(0.05) | ($0.01) | |||||||||
| Diluted earnings per share |
$11.50 |
$2.25 | $3.11 | |||||||||
| IFRS Consolidated Statement of Financial Position Data: |
||||||||||||
| Total assets |
22,149 |
17,881 | 17,295 | |||||||||
| Total long-term financial liabilities (1) |
4,020 |
3,996 | 2,932 | |||||||||
| Dividend Data: |
||||||||||||
| Dividends per Thomson Reuters Corporation common share (US$) |
$1.62 |
$1.52 | $1.44 | |||||||||
| Dividends per Thomson Reuters Corporation Series II preference share (C$) |
C$0.43 |
C$0.49 | C$0.69 | |||||||||
| Quarters ended |
||||||||||||||||||||||||||||||||
| (millions of U.S. dollars, except per share amounts) |
December 31, 2021 |
September 30, 2021 |
June 30, 2021 |
March 31, 2021 |
December 31, 2020 |
September 30, 2020 |
June 30, 2020 |
March 31, 2020 |
||||||||||||||||||||||||
| Revenues |
1,710 |
1,526 |
1,532 |
1,580 |
1,616 | 1,443 | 1,405 | 1,520 | ||||||||||||||||||||||||
| Operating profit |
257 |
282 |
316 |
387 |
956 | 318 | 365 | 290 | ||||||||||||||||||||||||
| (Loss) earnings from continuing operations |
(177) |
(241) |
1,072 |
5,033 |
587 | 240 | 131 | 191 | ||||||||||||||||||||||||
| Earnings (loss) from discontinued operations, net of tax |
|
2 |
|
|
1 |
|
|
(4) |
|
|
3 |
|
|
(25) |
|
|
1 |
|
|
(5) |
|
|
2 |
| ||||||||
| Net (loss) earnings |
|
(175) |
|
|
(240) |
|
|
1,068 |
|
|
5,036 |
|
|
562 |
|
|
241 |
|
|
126 |
|
|
193 |
| ||||||||
| (Loss) earnings attributable to common shareholders |
|
(175) |
|
|
(240) |
|
|
1,068 |
|
|
5,036 |
|
|
562 |
|
|
241 |
|
|
126 |
|
|
193 |
| ||||||||
| Basic (loss) earnings per share |
||||||||||||||||||||||||||||||||
| From continuing operations |
$ |
(0.36) |
|
$ |
(0.49) |
|
|
$2.16 |
|
|
$10.15 |
|
|
$1.18 |
|
|
$0.48 |
|
|
$0.26 |
|
|
$0.38 |
| ||||||||
| From discontinued operations |
|
- |
|
|
- |
|
|
(0.01) |
|
|
- |
|
|
(0.05) |
|
|
- |
|
|
(0.01) |
|
|
0.01 |
| ||||||||
| $ |
(0.36) |
|
$ |
(0.49) |
|
|
$2.15 |
|
|
$10.15 |
|
|
$1.13 |
|
|
$0.48 |
|
|
$0.25 |
|
|
$0.39 |
| |||||||||
| Diluted (loss) earnings per share |
||||||||||||||||||||||||||||||||
| From continuing operations |
$ |
(0.36) |
|
$ |
(0.49) |
|
|
$2.16 |
|
|
$10.13 |
|
|
$1.18 |
|
|
$0.48 |
|
|
$0.26 |
|
|
$0.38 |
| ||||||||
| From discontinued operations |
|
- |
|
|
- |
|
|
(0.01) |
|
|
- |
|
|
(0.05) |
|
|
- |
|
|
(0.01) |
|
|
0.01 |
| ||||||||
| $ |
(0.36) |
|
$ |
(0.49) |
|
|
$2.15 |
|
|
$10.13 |
|
|
$1.13 |
|
|
$0.48 |
|
|
$0.25 |
|
|
$0.39 |
| |||||||||
· |
Parent – Thomson Reuters Corporation, the direct or indirect owner of all of its subsidiaries |
· |
Subsidiary Issuer – TR Finance LLC |
· |
Guarantor Subsidiaries on a combined basis |
· |
Non-Guarantor Subsidiaries – Other subsidiaries of Thomson Reuters Corporation on a combined basis that will not guarantee TR Finance LLC debt securities |
· |
Eliminations – Consolidating adjustments |
· |
Thomson Reuters on a consolidated basis |
· |
Thomson Reuters Applications Inc., which operates part of the Company’s Legal Professionals, Tax & Accounting Professionals and Corporates businesses; |
· |
Thomson Reuters (Tax & Accounting) Inc., which operates part of the Company’s Tax & Accounting Professionals and Corporates businesses; and |
· |
West Publishing Corporation, which operates part of the Company’s Legal Professionals, Corporates and Global Print businesses. |
| Year ended December 31, 2021 | ||||||||||||||||||||||
| (millions of U.S. dollars) |
Parent |
Subsidiary Issuer |
Guarantor Subsidiaries |
Non-Guarantor Subsidiaries |
Eliminations |
Consolidated | ||||||||||||||||
| CONTINUING OPERATIONS |
|
|
|
|
|
|
|
|
|
|
|
|
|
|
|
| ||||||
| Revenues |
|
- |
|
|
- |
|
|
4,398 |
|
|
3,437 |
|
|
(1,487) |
|
6,348 | ||||||
| Operating expenses |
|
(11) |
|
|
- |
|
|
(3,815) |
|
|
(2,031) |
|
|
1,487 |
|
(4,370) | ||||||
| Depreciation |
|
- |
|
|
- |
|
|
(66) |
|
|
(111) |
|
|
- |
|
(177) | ||||||
| Amortization of computer software |
|
- |
|
|
- |
|
|
(19) |
|
|
(458) |
|
|
3 |
|
(474) | ||||||
| Amortization of other identifiable intangible assets |
|
- |
|
|
- |
|
|
(51) |
|
|
(68) |
|
|
- |
|
(119) | ||||||
| Other operating gains (losses), net |
|
- |
|
|
- |
|
|
78 |
|
|
(44) |
|
|
- |
|
34 | ||||||
| Operating (loss) profit |
|
(11) |
|
|
- |
|
|
525 |
|
|
725 |
|
|
3 |
|
1,242 | ||||||
| Finance (costs) income, net: |
|
|
|
|
|
|
|
|
|
|
|
|
|
|
|
| ||||||
| Net interest expense |
|
(157) |
|
|
- |
|
|
(1) |
|
|
(38) |
|
|
- |
|
(196) | ||||||
| Other finance income (costs) |
|
10 |
|
|
- |
|
|
- |
|
|
(2) |
|
|
- |
|
8 | ||||||
| Intercompany net interest income (expense) |
|
111 |
|
|
- |
|
|
(50) |
|
|
(61) |
|
|
- |
|
- | ||||||
| (Loss) income before tax and equity method investments |
|
(47) |
|
|
- |
|
|
474 |
|
|
624 |
|
|
3 |
|
1,054 | ||||||
| Share of post-tax earnings in equity methodinvestments |
|
- |
|
|
- |
|
|
- |
|
|
6,240 |
|
|
- |
|
6,240 | ||||||
| Share of post-tax earnings in subsidiaries |
|
5,736 |
|
|
- |
|
|
12 |
|
|
370 |
|
|
(6,118) |
|
- | ||||||
| Tax expense |
|
- |
|
|
- |
|
|
(104) |
|
|
(1,503) |
|
|
- |
|
(1,607) | ||||||
| Earnings from continuing operations |
|
5,689 |
|
|
- |
|
|
382 |
|
|
5,731 |
|
|
(6,115) |
|
5,687 | ||||||
| Earnings from discontinued operations, net of tax |
|
- |
|
|
- |
|
|
- |
|
|
2 |
|
|
- |
|
2 | ||||||
| Net earnings |
|
5,689 |
|
|
- |
|
|
382 |
|
|
5,733 |
|
|
(6,115) |
|
5,689 | ||||||
| Earnings attributable to common shareholders |
|
5,689 |
|
|
- |
|
|
382 |
|
|
5,733 |
|
|
(6,115) |
|
5,689 | ||||||
| Year ended December 31, 2020 | ||||||||||||||||||||||
| (millions of U.S. dollars) |
Parent |
Subsidiary Issuer |
Guarantor Subsidiaries |
Non-Guarantor Subsidiaries |
Eliminations |
Consolidated | ||||||||||||||||
| CONTINUING OPERATIONS |
|
|
|
|
|
|
|
|
|
|
|
|
|
|
|
| ||||||
| Revenues |
|
- |
|
|
- |
|
|
4,222 |
|
|
3,215 |
|
|
(1,453) |
|
5,984 | ||||||
| Operating expenses |
|
(12) |
|
|
- |
|
|
(3,680) |
|
|
(1,760) |
|
|
1,453 |
|
(3,999) | ||||||
| Depreciation |
|
- |
|
|
- |
|
|
(74) |
|
|
(110) |
|
|
- |
|
(184) | ||||||
| Amortization of computer software |
|
- |
|
|
- |
|
|
(23) |
|
|
(465) |
|
|
3 |
|
(485) | ||||||
| Amortization of other identifiable intangible assets |
|
- |
|
|
- |
|
|
(53) |
|
|
(70) |
|
|
- |
|
(123) | ||||||
| Other operating (losses) gains, net |
|
- |
|
|
- |
|
|
(14) |
|
|
750 |
|
|
- |
|
736 | ||||||
| Operating (loss) profit |
|
(12) |
|
|
- |
|
|
378 |
|
|
1,560 |
|
|
3 |
|
1,929 | ||||||
| Finance (costs) income, net: |
|
|
|
|
|
|
|
|
|
|
|
|
|
|
|
| ||||||
| Net interest expense |
|
(155) |
|
|
- |
|
|
(1) |
|
|
(39) |
|
|
- |
|
(195) | ||||||
| Other finance income (costs) |
|
19 |
|
|
- |
|
|
(1) |
|
|
12 |
|
|
- |
|
30 | ||||||
| Intercompany net interest income (expense) |
|
111 |
|
|
- |
|
|
(51) |
|
|
(60) |
|
|
- |
|
- | ||||||
| (Loss) income before tax and equity method investments |
|
(37) |
|
|
- |
|
|
325 |
|
|
1,473 |
|
|
3 |
|
1,764 | ||||||
| Share of post-tax losses in equity methodinvestments |
|
- |
|
|
- |
|
|
- |
|
|
(544) |
|
|
- |
|
(544) | ||||||
| Share of post-tax earnings in subsidiaries |
|
1,159 |
|
|
- |
|
|
18 |
|
|
245 |
|
|
(1,422) |
|
- | ||||||
| Tax (expense) benefit |
|
- |
|
|
- |
|
|
(77) |
|
|
6 |
|
|
- |
|
(71) | ||||||
| Earnings from continuing operations |
|
1,122 |
|
|
- |
|
|
266 |
|
|
1,180 |
|
|
(1,419) |
|
1,149 | ||||||
| Loss from discontinued operations, net of tax |
|
- |
|
|
- |
|
|
(3) |
|
|
(24) |
|
|
- |
|
(27) | ||||||
| Net earnings |
|
1,122 |
|
|
- |
|
|
263 |
|
|
1,156 |
|
|
(1,419) |
|
1,122 | ||||||
| Earnings attributable to common shareholders |
|
1,122 |
|
|
- |
|
|
263 |
|
|
1,156 |
|
|
(1,419) |
|
1,122 | ||||||
| December 31, 2021 |
||||||||||||||||||||||||
| (millions of U.S. dollars) |
Parent |
Subsidiary Issuer |
Guarantor Subsidiaries |
Non-Guarantor Subsidiaries |
Eliminations |
Consolidated |
||||||||||||||||||
| Cash and cash equivalents |
|
15 |
|
|
- |
|
|
237 |
|
|
526 |
|
|
- |
|
|
778 |
| ||||||
| Trade and other receivables |
|
- |
|
|
- |
|
|
690 |
|
|
367 |
|
|
- |
|
|
1,057 |
| ||||||
| Intercompany receivables |
|
3,477 |
|
|
- |
|
|
648 |
|
|
2,545 |
|
|
(6,670) |
|
|
- |
| ||||||
| Other financial assets |
|
- |
|
|
- |
|
|
6 |
|
|
102 |
|
|
- |
|
|
108 |
| ||||||
| Prepaid expenses and other current assets |
|
2 |
|
|
- |
|
|
244 |
|
|
264 |
|
|
- |
|
|
510 |
| ||||||
| Current assets |
|
3,494 |
|
|
- |
|
|
1,825 |
|
|
3,804 |
|
|
(6,670) |
|
|
2,453 |
| ||||||
| Property and equipment, net |
|
- |
|
|
- |
|
|
201 |
|
|
301 |
|
|
- |
|
|
502 |
| ||||||
| Computer software, net |
|
- |
|
|
- |
|
|
12 |
|
|
810 |
|
|
- |
|
|
822 |
| ||||||
| Other identifiable intangible assets, net |
|
- |
|
|
- |
|
|
1,136 |
|
|
2,195 |
|
|
- |
|
|
3,331 |
| ||||||
| Goodwill |
|
- |
|
|
- |
|
|
3,822 |
|
|
2,118 |
|
|
- |
|
|
5,940 |
| ||||||
| Equity method investments |
|
- |
|
|
- |
|
|
- |
|
|
6,736 |
|
|
- |
|
|
6,736 |
| ||||||
| Other non-current assets |
|
100 |
|
|
- |
|
|
144 |
|
|
982 |
|
|
- |
|
|
1,226 |
| ||||||
| Intercompany receivables |
|
230 |
|
|
- |
|
|
- |
|
|
778 |
|
|
(1,008) |
|
|
- |
| ||||||
| Investments in subsidiaries |
|
15,899 |
|
|
- |
|
|
71 |
|
|
4,526 |
|
|
(20,496) |
|
|
- |
| ||||||
| Deferred tax |
|
- |
|
|
- |
|
|
- |
|
|
1,139 |
|
|
- |
|
|
1,139 |
| ||||||
| Total assets |
|
19,723 |
|
|
- |
|
|
7,211 |
|
|
23,389 |
|
|
(28,174) |
|
|
22,149 |
| ||||||
| |
|
|
|
|
|
|
|
|
|
|
|
|
|
|
|
|
|
| ||||||
| LIABILITIES AND EQUITY |
|
|
|
|
|
|
|
|
|
|
|
|
|
|
|
|
|
| ||||||
| Liabilities |
|
|
|
|
|
|
|
|
|
|
|
|
|
|
|
|
|
| ||||||
| Payables, accruals and provisions |
|
51 |
|
|
- |
|
|
409 |
|
|
903 |
|
|
- |
|
|
1,363 |
| ||||||
| Current tax liabilities |
|
- |
|
|
- |
|
|
- |
|
|
169 |
|
|
- |
|
|
169 |
| ||||||
| Deferred revenue |
|
- |
|
|
- |
|
|
634 |
|
|
240 |
|
|
- |
|
|
874 |
| ||||||
| Intercompany payables |
|
2,049 |
|
|
- |
|
|
497 |
|
|
4,124 |
|
|
(6,670) |
|
|
- |
| ||||||
| Other financial liabilities |
|
- |
|
|
- |
|
|
22 |
|
|
153 |
|
|
- |
|
|
175 |
| ||||||
| Current liabilities |
|
2,100 |
|
|
- |
|
|
1,562 |
|
|
5,589 |
|
|
(6,670) |
|
|
2,581 |
| ||||||
| Long-term indebtedness |
|
3,786 |
|
|
- |
|
|
- |
|
|
- |
|
|
- |
|
|
3,786 |
| ||||||
| Provisions and other non-current liabilities |
|
3 |
|
|
- |
|
|
74 |
|
|
866 |
|
|
- |
|
|
943 |
| ||||||
| Intercompany payables |
|
- |
|
|
- |
|
|
779 |
|
|
229 |
|
|
(1,008) |
|
|
- |
| ||||||
| Deferred tax |
|
- |
|
|
- |
|
|
199 |
|
|
806 |
|
|
- |
|
|
1,005 |
| ||||||
| Total liabilities |
|
5,889 |
|
|
- |
|
|
2,614 |
|
|
7,490 |
|
|
(7,678) |
|
|
8,315 |
| ||||||
| Equity |
|
- |
|
|||||||||||||||||||||
| Total equity |
|
13,834 |
|
|
- |
|
|
4,597 |
|
|
15,899 |
|
|
(20,496) |
|
|
13,834 |
| ||||||
| Total liabilities and equity |
|
19,723 |
|
|
- |
|
|
7,211 |
|
|
23,389 |
|
|
(28,174) |
|
|
22,149 |
| ||||||
| December 31, 2020 |
||||||||||||||||||||||||
| (millions of U.S. dollars) |
Parent |
Subsidiary Issuer |
Guarantor Subsidiaries |
Non-Guarantor Subsidiaries |
Eliminations |
Consolidated |
||||||||||||||||||
| Cash and cash equivalents |
3 | - | 359 | 1,425 | - | 1,787 | ||||||||||||||||||
| Trade and other receivables |
1 | - | 735 | 415 | - | 1,151 | ||||||||||||||||||
| Intercompany receivables |
3,406 | - | 245 | 3,298 | (6,949) | - | ||||||||||||||||||
| Other financial assets |
- | - | 5 | 607 | - | 612 | ||||||||||||||||||
| Prepaid expenses and other current assets |
1 | - | 212 | 212 | - | 425 | ||||||||||||||||||
| Current assets |
3,411 | - | 1,556 | 5,957 | (6,949) | 3,975 | ||||||||||||||||||
| Property and equipment, net |
- | - | 241 | 304 | - | 545 | ||||||||||||||||||
| Computer software, net |
- | - | 12 | 821 | (3) | 830 | ||||||||||||||||||
| Other identifiable intangible assets, net |
- | - | 1,150 | 2,277 | - | 3,427 | ||||||||||||||||||
| Goodwill |
- | - | 3,731 | 2,245 | - | 5,976 | ||||||||||||||||||
| Equity method investments |
- | - | - | 1,136 | - | 1,136 | ||||||||||||||||||
| Other non-current assets |
101 | - | 132 | 555 | - | 788 | ||||||||||||||||||
| Intercompany receivables |
245 | - | - | 778 | (1,023) | - | ||||||||||||||||||
| Investments in subsidiaries |
12,854 | - | 175 | 4,056 | (17,085) | - | ||||||||||||||||||
| Deferred tax |
- | - | - | 1,204 | - | 1,204 | ||||||||||||||||||
| Total assets |
16,611 | - | 6,997 | 19,333 | (25,060) | 17,881 | ||||||||||||||||||
| LIABILITIES AND EQUITY |
|
|
|
|
|
|
|
|
|
|
|
|
|
|
|
|
|
| ||||||
| Liabilities |
|
|
|
|
|
|
|
|
|
|
|
|
|
|
|
|
|
| ||||||
| Payables, accruals and provisions |
39 | - | 421 | 699 | - | 1,159 | ||||||||||||||||||
| Current tax liabilities |
- | - | 1 | 250 | - | 251 | ||||||||||||||||||
| Deferred revenue |
- | - | 611 | 255 | - | 866 | ||||||||||||||||||
| Intercompany payables |
2,617 | - | 681 | 3,651 | (6,949) | - | ||||||||||||||||||
| Other financial liabilities |
200 | - | 19 | 157 | - | 376 | ||||||||||||||||||
| Current liabilities |
2,856 | - | 1,733 | 5,012 | (6,949) | 2,652 | ||||||||||||||||||
| Long-term indebtedness |
3,772 | - | - | - | - | 3,772 | ||||||||||||||||||
| Provisions and other non-current liabilities |
3 | - | 72 | 1,008 | - | 1,083 | ||||||||||||||||||
| Intercompany payables |
- | - | 778 | 245 | (1,023) | - | ||||||||||||||||||
| Deferred tax |
- | - | 183 | 211 | - | 394 | ||||||||||||||||||
| Total liabilities |
6,631 | - | 2,766 | 6,476 | (7,972) | 7,901 | ||||||||||||||||||
| Equity |
|
|
|
- | |
|
|
|
|
|
|
|
|
|
|
| ||||||||
| Total equity |
9,980 | - | 4,231 | 12,857 | (17,088) | 9,980 | ||||||||||||||||||
| Total liabilities and equity |
16,611 | - | 6,997 | 19,333 | (25,060) | 17,881 | ||||||||||||||||||
| (millions of U.S. dollars) |
Parent |
Subsidiary Issuer |
Guarantor Subsidiaries |
Non-Guarantor Subsidiaries |
Eliminations |
Consolidated |
||||||||||||||||||
| Year ended December 31, 2021 |
||||||||||||||||||||||||
| Net cash (used in) provided by operating activities |
(33) |
- |
237 |
1,569 |
- |
1,773 |
||||||||||||||||||
| Net cash provided by (used in) investing activities |
2,697 |
- |
(322) |
(147) |
(2,732) |
(504) |
||||||||||||||||||
| Net cash used in financing activities |
(2,652) |
- |
(37) |
(2,316) |
2,732 |
(2,273) |
||||||||||||||||||
| Increase (decrease) in cash and bank overdrafts |
12 |
- |
(122) |
(894) |
- |
(1,004) |
||||||||||||||||||
| |
|
|
|
|
|
|
|
|
|
|
|
|
|
|
|
|
|
| ||||||
| Year ended December 31, 2020 |
||||||||||||||||||||||||
| Net cash (used in) provided by operating activities |
(64) | - | 474 | 1,335 | - | 1,745 | ||||||||||||||||||
| Net cash (used in) provided by investing activities |
(61) | - | (30) | 118 | (165) | (138) | ||||||||||||||||||
| Net cash provided by (used in) financing activities |
123 | - | (254) | (678) | 165 | (644) | ||||||||||||||||||
| (Decrease) increase in cash and bank overdrafts |
(2) | - | 190 | 775 | - | 963 | ||||||||||||||||||
 Steve Hasker President and Chief Executive Officer March 10, 2022 |
 Michael Eastwood Chief Financial Officer |
 Steve Hasker President and Chief Executive Officer |
 Michael Eastwood Chief Financial Officer | |
| March 10, 2022 | ||

| Year ended December 31, |
||||||||||
| (millions of U.S. dollars, except per share amounts) |
Notes |
2021 |
2020 |
|||||||
| CONTINUING OPERATIONS |
|
|
|
|
|
|
| |||
| Revenues |
3 |
|
|
|
|
|
| |||
| Operating expenses |
5 |
|
( |
|
|
( |
| |||
| Depreciation |
|
|
( |
|
|
( |
| |||
| Amortization of computer software |
|
|
( |
|
|
( |
| |||
| Amortization of other identifiable intangible assets |
|
|
( |
|
|
( |
| |||
| Other operating gains, net |
6 |
|
|
|
|
|
| |||
| Operating profit |
|
|
|
|
|
|
| |||
| Finance costs, net: |
|
|
|
|
|
|
| |||
| Net interest expense |
7 |
|
( |
|
|
( |
| |||
| Other finance income |
7 |
|
|
|
|
|
| |||
| Income before tax and equity method investments |
|
|
|
|
|
|
| |||
| Share of post-tax earnings (losses) in equity method investments |
8 |
|
|
|
|
( |
| |||
| Tax expense |
9 |
|
( |
|
|
( |
| |||
| Earnings from continuing operations |
|
|
|
|
|
|
| |||
| Earnings (loss) from discontinued operations, net of tax |
10 |
|
|
|
|
( |
| |||
| Net earnings |
|
|
|
|
|
| ||||
| Earnings attributable to common shareholders |
|
|
|
|
|
| ||||
| Earnings (loss) per share: |
11 |
|
|
|
|
|
| |||
| Basic earnings per share |
|
|
|
|
|
|
| |||
| From continuing operations |
|
|
$ |
|
|
$ |
| |||
| From discontinued operations |
|
|
|
|
( |
| ||||
| Basic earnings per share |
|
$ |
|
|
$ |
| ||||
| Diluted earnings per share |
|
|
|
|
|
|
| |||
| From continuing operations |
|
|
$ |
|
|
$ |
| |||
| From discontinued operations |
|
- |
|
|
( |
| ||||
| Diluted earnings per share |
|
$ |
|
|
$ |
| ||||
| Year ended December 31, |
||||||||||||
| (millions of U.S. dollars) |
Notes |
2021 |
2020 |
|||||||||
| Net earnings |
||||||||||||
| Other comprehensive (loss) income: |
|
|
|
|
|
|
|
|
| |||
| Items that have been or may be subsequently reclassified to net earnings: |
|
|
|
|
|
|
|
|
| |||
| Cash flow hedges adjustments to net earnings |
19 |
( |
( |
|||||||||
| Cash flow hedges adjustments to equity |
19 |
( |
||||||||||
| Foreign currency translation adjustments to equity |
19 |
( |
( |
|||||||||
| Share of other comprehensive (loss) income in equity method investments |
8 |
( |
||||||||||
| Related tax benefit (expense) on share of other comprehensive (loss) income in equity method investments |
9 |
( |
||||||||||
| Reclassification of foreign currency translation adjustments on disposal of equity method investment |
- |
|||||||||||
| |
|
|
|
( |
||||||||
| Items that will not be reclassified to net earnings: |
|
|
|
|
|
|
|
|
| |||
| Fair value adjustments on financial assets |
19 |
|||||||||||
| Remeasurement on defined benefit pension plans |
26 |
|||||||||||
| Related tax expense on remeasurement on defined benefit pension plans |
9 |
( |
( |
|||||||||
| Share of other comprehensive income in equity method investments |
8 |
|||||||||||
| Related tax expense on share of other comprehensive income in equity method investments |
9 |
( |
||||||||||
| Other comprehensive income |
||||||||||||
| Total comprehensive income |
||||||||||||
| Comprehensive income (loss) for the period attributable to: |
|
|
|
|
|
|
|
|
| |||
| Common shareholders: |
|
|
|
|
|
|
|
|
| |||
| Continuing operations |
|
|
|
|||||||||
| Discontinued operations |
( |
|||||||||||
| Total comprehensive income |
||||||||||||
| December 31, |
||||||||||||
| (millions of U.S. dollars) |
Notes |
2021 |
2020 |
|||||||||
| ASSETS |
|
|
|
|
|
|
|
|
| |||
| Cash and cash equivalents |
12 |
|||||||||||
| Trade and other receivables |
13 |
|||||||||||
| Other financial assets |
19 |
|||||||||||
| Prepaid expenses and other current assets |
14 |
|||||||||||
| Current assets |
|
|
|
|||||||||
| Property and equipment, net |
15 |
|||||||||||
| Computer software, net |
16 |
|||||||||||
| Other identifiable intangible assets, net |
17 |
|||||||||||
| Goodwill |
18 |
|||||||||||
| Equity method investments |
8 |
|||||||||||
| Other non-current assets |
20 |
|||||||||||
| Deferred tax |
23 |
|||||||||||
| Total assets |
||||||||||||
| LIABILITIES AND EQUITY |
|
|
|
|
|
|
|
|
| |||
| Liabilities |
|
|
|
|
|
|
|
|
| |||
| Payables, accruals and provisions |
21 |
|||||||||||
| Current tax liabilities |
|
|
|
|||||||||
| Deferred revenue |
3 |
|||||||||||
| Other financial liabilities |
19 |
|||||||||||
| Current liabilities |
|
|
|
|||||||||
| Long-term indebtedness |
19 |
|||||||||||
| Provisions and other non-current liabilities |
22 |
|||||||||||
| Deferred tax |
23 |
|||||||||||
| Total liabilities |
|
|
|
|||||||||
| Equity |
|
|
|
|
|
|
|
|
| |||
| Capital |
24 |
|||||||||||
| Retained earnings |
|
|
|
|||||||||
| Accumulated other comprehensive loss |
( |
( |
||||||||||
| Total equity |
||||||||||||
| Total liabilities and equity |
||||||||||||
| Contingencies (note 30) |
|
|
|
|
|
|
|
|
| |||
 |
 | |
| David Thomson Director |
Steve Hasker Director |
| Year ended December 31, |
||||||||||||
| (millions of U.S. dollars) |
Notes |
2021 |
2020 |
|||||||||
| Cash provided by (used in): |
|
|
|
|
|
|
|
|
| |||
| OPERATING ACTIVITIES |
|
|
|
|
|
|
|
|
| |||
| Earnings from continuing operations |
|
|
|
|||||||||
| Adjustments for: |
|
|
|
|
|
|
|
|
| |||
| Depreciation |
|
|
|
|||||||||
| Amortization of computer software |
|
|
|
|||||||||
| Amortization of other identifiable intangible assets |
|
|
|
|||||||||
| Share of post-tax (earnings) losses in equity method investments |
8 |
( |
||||||||||
| Net gains on disposals of businesses and investments |
|
|
|
( |
( |
|||||||
| Deferred tax |
23 |
( |
||||||||||
| Other |
28 |
( |
||||||||||
| Changes in working capital and other items |
28 |
|||||||||||
| Operating cash flows from continuing operations |
|
|
|
|||||||||
| Operating cash flows from discontinued operations |
( |
( |
||||||||||
| Net cash provided by operating activities |
||||||||||||
| INVESTING ACTIVITIES |
|
|
|
|
|
|
|
|
| |||
| Acquisitions, net of cash acquired |
29 |
( |
( |
|||||||||
| Proceeds from disposals of businesses and investments, net of taxes paid |
||||||||||||
| Dividend from sale of LSEG shares |
|
|
8 |
|
|
|||||||
| Capital expenditures |
|
|
|
( |
( |
|||||||
| Proceeds from disposals of property and equipment |
|
|
|
|||||||||
| Other investing activities |
8 |
|||||||||||
| Taxes paid on sale of Refinitiv and LSEG shares |
8 |
( |
- |
|||||||||
| Investing cash flows from continuing operations |
( |
( |
||||||||||
| Investing cash flows from discontinued operations |
( |
|||||||||||
| Net cash used in investing activities |
( |
( |
||||||||||
| FINANCING ACTIVITIES |
|
|
|
|
|
|
|
|
| |||
| Proceeds from debt |
19 |
|||||||||||
| Repayments of debt |
19 |
( |
||||||||||
| Net repayments under short-term loan facilities |
19 |
( |
||||||||||
| Payments of lease principal |
27 |
( |
( |
|||||||||
| Repurchases of common shares |
24 |
( |
( |
|||||||||
| Dividends paid on preference shares |
|
|
|
( |
( |
|||||||
| Dividends paid on common shares |
24 |
( |
( |
|||||||||
| Other financing activities |
( |
|||||||||||
| Net cash used in financing activities |
( |
( |
||||||||||
| (Decrease) increase in cash and bank overdrafts |
|
|
|
( |
||||||||
| Translation adjustments |
|
|
|
( |
( |
|||||||
| Cash and bank overdrafts at beginning of period |
||||||||||||
| Cash and bank overdrafts at end of period |
||||||||||||
| Cash and bank overdrafts at end of period comprised of: |
|
|
|
|
|
|
|
|
| |||
| Cash and cash equivalents |
12 |
|||||||||||
| Supplemental cash flow information is provided in note 28. |
|
|
|
|
|
|
|
|
| |||
| Interest paid, net of debt-related hedges |
|
|
|
( |
( |
|||||||
| Interest received |
|
|
|
|||||||||
| Income taxes paid |
28 |
( |
( |
|||||||||
(millions of U.S. dollars) |
Stated share capital |
Contributed surplus |
Total capital |
|
Retained earnings |
Unrecognized (loss) gain on financial instruments |
Foreign currency translation adjustments |
Total accumulated other comprehensive loss (“AOCL”) |
Total equity |
|||||||||||||||||||||||||
| Balance, December 31, 2020 |
|
( |
) |
( |
) |
( |
) |
|||||||||||||||||||||||||||
| Net earnings |
- |
- |
- |
|
- |
- |
- |
|||||||||||||||||||||||||||
| Other comprehensive income (loss) |
- |
- |
- |
( |
) |
( |
) |
|||||||||||||||||||||||||||
| Total comprehensive income (loss) |
|
- |
|
|
- |
|
|
- |
|
|
|
|
|
|
|
|
( |
) |
|
( |
) |
|
|
| ||||||||||
| Dividends declared on preference shares |
- |
- |
- |
|
( |
) |
- |
- |
- |
( |
) | |||||||||||||||||||||||
| Dividends declared on common shares |
- |
- |
- |
|
( |
) |
- |
- |
- |
( |
) | |||||||||||||||||||||||
| Shares issued under Dividend Reinvestment Plan (“DRIP”) |
- |
|
- |
- |
- |
- |
||||||||||||||||||||||||||||
| Repurchases of common shares (see note 24) |
( |
) |
- |
( |
) |
|
( |
) |
- |
- |
- |
( |
) | |||||||||||||||||||||
| Stock compensation plans |
( |
) |
- |
- |
- |
- |
||||||||||||||||||||||||||||
| Balance, December 31, 2021 |
|
|
|
|
|
|
|
|
|
|
|
|
|
|
|
|
( |
) |
|
( |
) |
|
|
| ||||||||||
(millions of U.S. dollars) |
Stated share capital |
Contributed surplus |
Total capital |
|
Retained earnings |
Unrecognized loss on financial instruments |
Foreign currency translation adjustments |
AOCL |
Total equity |
|||||||||||||||||||||||||
| Balance, December 31, 2019 |
|
( |
( |
( |
||||||||||||||||||||||||||||||
| Net earnings |
- |
- |
- |
|
- |
- |
- |
|||||||||||||||||||||||||||
| Other comprehensive income (loss) |
- |
- |
- |
( |
||||||||||||||||||||||||||||||
| Total comprehensive income (loss) |
- |
- |
- |
( |
||||||||||||||||||||||||||||||
| Dividends declared on preference shares |
- |
- |
- |
|
( |
- |
- |
- |
( |
|||||||||||||||||||||||||
| Dividends declared on common shares |
- |
- |
- |
|
( |
- |
- |
- |
( |
|||||||||||||||||||||||||
| Shares issued under DRIP |
- |
|
- |
- |
- |
- |
||||||||||||||||||||||||||||
| Repurchases of common shares (see note 24) |
- |
|
( |
- |
- |
- |
- |
|||||||||||||||||||||||||||
| Pre-defined share repurchase plan |
( |
- |
( |
|
( |
- |
- |
- |
( |
|||||||||||||||||||||||||
| Stock compensation plans |
( |
- |
- |
- |
- |
|||||||||||||||||||||||||||||
| Balance, December 31, 2020 |
( |
( |
( |
|||||||||||||||||||||||||||||||
· |
Acquisition cost is measured as the fair value of the assets given, equity instruments issued, and liabilities incurred or assumed at the date of exchange, excluding transaction costs which are expensed as incurred; |
· |
Identifiable assets acquired and liabilities assumed are measured at their fair values at the acquisition date; |
· |
The excess of acquisition cost over the fair value of the identifiable net assets acquired is recorded as goodwill; |
· |
If the acquisition cost is less than the fair value of the net assets acquired, the fair value of the net assets is re-assessed, and any remaining difference is recognized directly in the consolidated income statement; |
· |
Contingent consideration is measured at fair value on the acquisition date, with subsequent changes in the fair value recorded through the consolidated income statement when the contingent consideration is a financial liability. Contingent consideration is not re-measured when it is an equity instrument; and |
· |
Upon gaining control in a step acquisition, the existing ownership interest is re-measured to fair value through the consolidated income statement. |
· |
Investments are initially recognized at cost and are reported in the consolidated statement of financial position; |
· |
Equity method investees include goodwill identified on acquisition, net of any accumulated impairment loss; |
· |
The Company’s share of post-acquisition profits or losses is recognized in the consolidated income statement and the Company’s share of other comprehensive income or losses is recognized in the consolidated statement of comprehensive income, and both are adjusted against the carrying amount of the investments; |
· |
When the Company’s share of losses equals or exceeds its interest in the investee, the Company does not recognize further losses, unless it has incurred obligations or made payments on behalf of the investee; |
· |
Gains and losses on transactions between the Company and its equity method investees are eliminated to the extent of the Company’s interest in these entities; |
· |
Dividends received or a receivable from equity method investees are recognized as a reduction in the carrying amount of the investment. Dividends received are included within “Net cash used in investing activities” in the consolidated statement of cash flow; and |
· |
Equity method investees are assessed for impairment whenever events or changes in circumstances indicate that their carrying value may not be recoverable and at the end of each reporting period for indicators of impairment. |
· |
Assets and liabilities of entities with functional currencies other than U.S. dollars are translated to U.S. dollars at the period end rates of exchange, and the results of their operations are translated at average rates of exchange for the period. The resulting translation adjustments are included in accumulated other comprehensive loss in shareholders’ equity. For entities operating in countries where the currency has been designated as hyperinflationary, the assets, liabilities and results of their operations are translated at the period end rates of exchange, after re-indexing the local currency balances for the most recent inflation rates. |
· |
Foreign currency transactions are translated into the functional currency using the exchange rates prevailing at the dates of the transaction. Foreign exchange gains and losses resulting from the settlement of such transactions as well as from the translation of monetary assets and liabilities not denominated in the functional currency of the subsidiary, are recognized in the consolidated income statement, except for qualifying cash flow hedges which are deferred in accumulated other comprehensive loss in shareholders’ equity. |
· |
Foreign exchange gains and losses arising from borrowings and related hedging instruments, cash and cash equivalents, intercompany loans that are not permanent in nature and foreign exchange contracts are presented in the consolidated income statement within “Finance costs, net”. |
· |
Foreign exchange gains and losses related to certain intercompany loans that are permanent in nature are included in accumulated other comprehensive loss. |
· |
All other foreign exchange gains and losses are presented in the consolidated income statement within “Operating expenses”. |
· |
Volume-based fees related to online searches are recognized based on usage; |
· |
Fees from software licenses with no future obligations are recognized at the point of delivery; and |
· |
Professional fees from service and consulting arrangements are recognized as services are performed, generally based on hours incurred, reflecting the continuous transfer of control to the customer. |
· |
Assets related to new customer contracts are amortized over |
· |
Assets related to renewal of customer contracts are amortized over the term of the contract if they are commensurate with previous renewals commissions. |
| Buildings and building improvements |
||||
| Computer equipment |
3 years |
|||
| Furniture, fixtures and other equipment |
· |
It is technically feasible to complete the software product so that it will be available for use; |
· |
Management intends to complete the software product and use or sell it; |
· |
There is an ability to use or sell the software product; |
· |
It can be demonstrated how the software product will generate probable future economic benefits; |
· |
Adequate technical, financial and other resources to complete the development and to use or sell the software product are available; and |
· |
The expenditure attributable to the software product during its development can be reliably measured. |
· |
It has the contractual right to take possession of the software from the cloud provider without significant penalty; and |
· |
It can demonstrate that it is feasible for the Company to run the software on its own hardware or that of another provider. |
| Trade names |
||||
| Customer relationships |
||||
| Databases and content |
||||
| Other |
· |
Goodwill is allocated to cash-generating units (“CGUs”) or groups of CGUs based on the level at which management monitors it, which is not higher than an operating segment. Goodwill is allocated to those CGUs or groups of CGUs that are expected to benefit from the business combination in which the goodwill arose; and |
· |
Identifiable intangible assets with indefinite lives are allocated to the CGU with which they are associated, or compared to the excess fair value of all the CGUs if they are a corporate asset. |
· |
Represent a separate major line of business or geographical area of operations; |
· |
Are part of a single coordinated plan to dispose of a separate major line of business or geographical area of operations; or |
· |
Are a subsidiary acquired exclusively with a view to resale. |
· |
The initial amount of the lease liability; |
· |
Lease payments made at or before the commencement date; and |
· |
Initial direct costs and expected restoration costs. |
· |
Fixed payments (including in-substance fixed payments), less any lease incentives receivable; |
· |
Variable lease payments that are based on an index or a rate (including inflation-linked payments); |
· |
Amounts expected to be payable under residual value guarantees; |
· |
Exercise price of a purchase option if the Company is reasonably certain to exercise that option; and |
· |
Penalty payments for terminating the lease, if the lease term reflects the Company exercising that option. |
· |
Classification |
· |
Recognition and measurement |
· |
Classification |
· |
Recognition and measurement |
· |
Classification |
· |
Recognition and measurement |
· |
Fair value hedges |
· |
Cash flow hedges |
— |
amounts accumulated in other comprehensive income or loss are recycled to the consolidated income statement in the period when the hedged item will affect earnings; |
— |
when a hedging instrument expires or is sold, or when a hedge no longer meets the criteria for hedge accounting, any cumulative gain or loss in other comprehensive income or loss remains in other comprehensive income or loss and is recognized when the forecast transaction is ultimately recognized in the consolidated income statement; and |
— |
when a forecast transaction is no longer expected to occur, the cumulative gain or loss that was reported in other comprehensive income or loss is immediately recognized in the consolidated income statement. |
· |
Are generally recognized for all taxable temporary differences; |
· |
Are recognized for taxable temporary differences arising on investments in subsidiaries, associates and joint ventures, except where the reversal of the temporary difference can be controlled, and it is probable that the difference will not reverse in the foreseeable future or create a tax liability; and |
· |
Are not recognized on temporary differences that arise from goodwill that is not deductible for tax purposes. |
· |
Are recognized to the extent it is probable that taxable profits will be available against which the deductible temporary differences can be utilized; and |
· |
Are reviewed at the end of the reporting period and reduced to the extent that it is no longer probable that sufficient taxable profits will be available to allow all or part of the asset to be recovered. |
· |
Most critical estimates and assumptions in determining the value of assets and liabilities; and |
· |
Most critical judgments in applying accounting policies. |
Revenues by type |
Legal Professionals |
Corporates |
Tax & Accounting Professionals |
Reuters News |
Global Print |
Total |
||||||||||||||||||||||||||||||||||||||||||
| Year ended December 31, |
2021 |
2020 | 2021 |
2020 | 2021 |
2020 | 2021 |
2020 | 2021 |
2020 | 2021 |
2020 | ||||||||||||||||||||||||||||||||||||
| Recurring |
- |
- |
||||||||||||||||||||||||||||||||||||||||||||||
| Transactions |
- |
- |
||||||||||||||||||||||||||||||||||||||||||||||
| Global Print |
- |
- |
- |
- |
- |
- |
- |
- |
||||||||||||||||||||||||||||||||||||||||
| Eliminations/Rounding |
- |
- |
- |
- |
- |
- |
- |
- |
- |
- |
( |
( |
||||||||||||||||||||||||||||||||||||
| Total |
|
|
|
|||||||||||||||||||||||||||||||||||||||||||||
| Revenues by geography (country of destination) |
Legal Professionals |
Corporates |
Tax & Accounting Professionals |
Reuters News |
Global Print |
Total |
||||||||||||||||||||||||||||||||||||||||||
| Year ended December 31, |
2021 |
2020 | 2021 |
2020 | 2021 |
2020 | 2021 |
(1) |
2020 | 2021 |
2020 | 2021 |
2020 | |||||||||||||||||||||||||||||||||||
| U.S. |
||||||||||||||||||||||||||||||||||||||||||||||||
| Canada (country of domicile) |
||||||||||||||||||||||||||||||||||||||||||||||||
| Other |
||||||||||||||||||||||||||||||||||||||||||||||||
| Americas (North America, Latin America, South America) |
||||||||||||||||||||||||||||||||||||||||||||||||
| U.K. |
||||||||||||||||||||||||||||||||||||||||||||||||
| Other |
||||||||||||||||||||||||||||||||||||||||||||||||
| EMEA (Europe, Middle East and Africa) |
||||||||||||||||||||||||||||||||||||||||||||||||
| Asia Pacific |
||||||||||||||||||||||||||||||||||||||||||||||||
| Eliminations/Rounding |
- |
- |
- |
- |
- |
- |
- |
- |
- |
- |
( |
( |
||||||||||||||||||||||||||||||||||||
| Total |
|
|
|
|
|
| ||||||||||||||||||||||||||||||||||||||||||
| December 31, |
||||||||||||
| 2021 |
2020 |
2019 |
||||||||||
| Deferred revenue |
||||||||||||
| December 31, |
||||||||
| 2021 |
2020 |
|||||||
| 1 year |
% |
|||||||
| Between 1 and 2 years |
% |
|||||||
| Between 2 and 3 years |
% |
|||||||
| Later than 3 years |
% |
|||||||
| Year ended December 31, |
||||||||
| 2021 |
2020 |
|||||||
| Revenues |
|
|
|
|
|
| ||
| Legal Professionals |
||||||||
| Corporates |
||||||||
| Tax & Accounting Professionals |
||||||||
| Reuters News |
||||||||
| Global Print |
||||||||
| Eliminations/Rounding |
|
( |
|
|
( |
| ||
| Revenues |
|
|
|
|
|
| ||
| Adjusted EBITDA |
||||||||
| Legal Professionals |
||||||||
| Corporates |
||||||||
| Tax & Accounting Professionals |
||||||||
| Reuters News |
||||||||
| Global Print |
||||||||
| Total reportable segments adjusted EBITDA |
||||||||
| Corporate costs |
|
( |
|
( |
||||
| Fair value adjustments (see note 5) |
||||||||
| Depreciation |
( |
( |
||||||
| Amortization of computer software |
( |
( |
||||||
| Amortization of other identifiable intangible assets |
( |
( |
||||||
| Other operating gains, net |
|
|
|
|
|
| ||
| Operating profit |
||||||||
| Net interest expense |
( |
( |
||||||
| Other finance income |
||||||||
| Share of post-tax earnings (losses) in equity method investments |
( |
|||||||
| Tax expense |
|
( |
|
|
( |
| ||
| Earnings from continuing operations |
|
|
|
|
|
| ||
Additions to Capital Assets (1) and Goodwill |
||||||||
December 31, |
||||||||
2021 |
2020 | |||||||
| Legal Professionals |
||||||||
| Corporates |
||||||||
| Tax & Accounting Professionals |
||||||||
| Reuters News |
||||||||
| Global Print |
|
|
|
|
|
| ||
| Reportable segments |
||||||||
| Corporate assets |
|
|
|
|
|
| ||
| Total |
|
|
|
|
|
| ||
| Geographic Information |
Non-Current Assets (1) |
|||||||
December 31, |
||||||||
2021 |
2020 |
|||||||
| U.S. |
||||||||
| Canada (country of domicile) |
||||||||
| Other |
||||||||
| Americas (North America, Latin America, South America) |
||||||||
| U.K. |
||||||||
| Other |
||||||||
| EMEA (Europe, Middle East and Africa) |
||||||||
| Asia Pacific |
||||||||
| Total |
|
|
|
|
|
| ||
· |
Segment adjusted EBITDA represents earnings from continuing operations before tax expense or benefit, net interest expense, other finance costs or income, depreciation, amortization of software and other identifiable intangible assets, the Company’s share of post-tax earnings or losses in equity method investments, other operating gains and losses, certain asset impairment charges, fair value adjustments, and corporate related items. |
· |
The Company does not consider these excluded items to be controllable operating activities for purposes of assessing the current performance of the reportable segments. |
· |
Each segment includes an allocation of costs, based on usage or other applicable measures, for centralized support services such as technology, customer service, commercial policy, facilities management, and product and content development. Additionally, product costs are allocated when one segment sells products managed by another segment. |
| Year ended December 31, |
||||||||
| 2021 |
2020 |
|||||||
| Electronic, software & services |
||||||||
| Global Print |
||||||||
| Total |
|
|
|
|
|
| ||
Year ended December 31, |
||||||||
2021 |
2020 |
|||||||
Salaries, commissions and allowances |
||||||||
Share-based payments |
||||||||
Post-employment benefits |
||||||||
Total staff costs |
||||||||
Goods and services (1) |
||||||||
Content |
||||||||
Telecommunications |
||||||||
Facilities |
||||||||
Fair value adjustments (2) |
( |
( |
||||||
Total operating expenses |
||||||||
Year ended December 31, |
||||||||
2021 |
2020 |
|||||||
Interest expense: |
||||||||
Debt |
||||||||
Derivative financial instruments - hedging activities |
( |
( |
||||||
Other, net |
||||||||
Fair value gains on cash flow hedges, transfer from equity (see note 19) |
( |
( |
||||||
Net foreign exchange losses on debt |
||||||||
Net interest expense - debt and other |
||||||||
Net interest expense - leases |
||||||||
Net interest expense - pension and other post-employment benefit plans |
||||||||
Interest income |
( |
( |
||||||
Net interest expense |
||||||||
Year ended December 31 , |
||||||||
2021 |
2020 |
|||||||
Net gains due to changes in foreign currency exchange rates |
( |
( |
||||||
Net losses (gains) on derivative instruments |
( |
|||||||
Other finance income |
( |
( ) |
||||||
Year ended December 31, |
||||||||
2021 |
2020 |
|||||||
YPL (formerly RHL) |
( |
|||||||
Other equity method investments |
||||||||
Total share of post-tax earnings (losses) in equity method investments |
( |
|||||||
December 31, |
||||||||
2021 |
2020 |
|||||||
YPL (formerly RHL) |
||||||||
Other equity method investments |
||||||||
Total equity method investments |
||||||||
Year ended December 31, |
||||||||
2021 |
2020 |
|||||||
Revenues |
||||||||
Gain related to the sale of Refinitiv to LSEG |
- |
|||||||
Mark-to-market |
( |
- |
||||||
Dividend income |
- |
|||||||
Refinitiv net loss prior to its sale to LSEG |
( |
( |
||||||
Net earnings (loss) |
( |
|||||||
Remove: Net earnings attributable to non-controlling interests |
( |
( |
||||||
Net earnings (loss) attributable to YPL (formerly RHL) |
( |
|||||||
Other comprehensive (loss) income attributable to YPL (formerly RHL) |
( |
|||||||
Total comprehensive income (loss) attributable to YPL (formerly RHL) |
( |
|||||||
| December 31, |
||||||||
| 2021 |
2020 |
|||||||
| Assets |
|
|
|
|
|
| ||
| Current assets |
||||||||
| Non-current assets |
||||||||
| Total assets |
||||||||
| Liabilities |
|
|
|
|
|
| ||
| Current liabilities |
||||||||
| Non-current liabilities |
||||||||
| Total liabilities |
||||||||
| Net assets |
||||||||
| Non-controlling interests |
- |
( |
||||||
| Net assets attributable to YPL (formerly RHL) |
||||||||
| Net assets attributable to YPL (formerly RHL) - beginning period |
||||||||
| Net earnings (loss) attributable to YPL (formerly RHL) |
( ) |
|||||||
| Other comprehensive (loss) income attributable to YPL (formerly RHL) |
( |
|||||||
| Other adjustments (1) |
||||||||
| Distribution to owners |
( |
- |
||||||
| Net assets attributable to YPL (formerly RHL) - ending period |
||||||||
| Thomson Reuters % share |
% |
|||||||
| Thomson Reuters $ share |
||||||||
| Historical excluded equity adjustment (2) |
( |
( |
||||||
| Thomson Reuters carrying amount |
||||||||
| Year ended December 31, |
||||||||
| 2021 |
2020 |
|||||||
| Current tax expense |
||||||||
| Deferred tax expense (benefit) |
( |
|||||||
| Total tax expense |
||||||||
| Year ended December 31, |
||||||||
| 2021 |
2020 |
|||||||
| Included in Other comprehensive (loss) income |
|
|
|
|
|
| ||
| Deferred tax expense on remeasurement on defined benefit pension plans |
||||||||
| Deferred tax (benefit) expense on share of other comprehensive (loss) income in equity method investments |
( |
|||||||
| Included in Equity |
|
|
|
|
|
| ||
| Deferred tax benefit on share-based payments |
( |
( |
||||||
| Current tax benefit on share-based payments |
( |
( |
||||||
| Year ended December 31, |
||||||||
| 2021 |
2020 |
|||||||
| Income before tax |
||||||||
| Income before tax multiplied by the standard rate of Canadian corporate tax of |
||||||||
| Effects of: |
|
|
|
|
|
| ||
| Income taxes recorded at rates different from the Canadian tax rate |
( |
( |
||||||
| Tax losses for which no benefit is recognized |
||||||||
| Net (non-taxable) non-deductible foreign exchange and other gains and losses |
( |
|||||||
| Tax on revers statutory intercompany investment valuesal of(1) |
||||||||
| Recognition of tax losses that arose in prior years due to changes in statutory intercompany investment values (1) |
( |
( |
||||||
| Provision for uncertain tax positions |
||||||||
| Recognition of tax losses that arose in prior years |
( |
( |
||||||
| U.S. base erosion minimum tax |
- |
|||||||
| Impact of tax law changes |
( |
- |
||||||
| Research and development credits |
( |
( |
||||||
| Other adjustments related to prior years |
( |
|||||||
| Withholding taxes |
||||||||
| Other differences |
( |
|||||||
| Total tax expense |
||||||||
| Year ended December 31, | ||||||||
| 2021 |
2020 | |||||||
| Earnings attributable to common shareholders |
||||||||
| Less: Dividends declared on preference shares |
( |
( |
||||||
| Earnings used in consolidated earnings per share |
||||||||
| Less: ( E arnings) loss from discontinued operations, net of tax |
( |
|||||||
| Earnings used in earnings per share from continuing operations |
||||||||
| Year ended December 31, |
||||||||
| 2021 |
2020 |
|||||||
| Weighted-average number of common shares outstanding |
||||||||
| Weighted-average number of vested DSUs |
||||||||
| Basic |
||||||||
| Effect of stock options and TRSUs |
||||||||
| Diluted |
||||||||
December 31, |
||||||||
2021 |
2020 |
|||||||
Cash |
||||||||
Cash at bank and on hand |
||||||||
Cash equivalents |
||||||||
Money market accounts |
||||||||
Cash and cash equivalents |
||||||||
December 31, |
||||||||
2021 |
2020 |
|||||||
Trade receivables |
||||||||
Less: allowance for doubtful accounts |
( |
( |
||||||
Less: allowance for sales adjustments |
( |
( |
||||||
Net trade receivables |
||||||||
Other receivables |
||||||||
Trade and other receivables |
||||||||
December 31, |
||||||||
2021 |
2020 |
|||||||
Current - 30 days |
||||||||
Past due 31-60 days |
||||||||
Past due 61-90 days |
||||||||
Past due 91-180 days |
||||||||
Past due >180 days |
||||||||
Balance at December 31 |
||||||||
December 31, |
||||||||
2021 |
2020 |
|||||||
Balance at beginning of year |
||||||||
Charges |
||||||||
Write-offs |
( |
( |
||||||
Balance at end of year |
||||||||
December 31, |
||||||||
2021 |
2020 |
|||||||
Inventory |
||||||||
Prepaid expenses |
||||||||
Current tax receivables (1) |
||||||||
Deferred commissions |
||||||||
Other current assets |
||||||||
Prepaid expenses and other current assets |
||||||||
Land, Buildings and Building Improvements |
Computer Equipment |
Furniture, Fixtures and Other Equipment |
Total |
|||||||
Cost: |
||||||||||
December 31, 2019 |
||||||||||
Additions: |
||||||||||
Capital expenditures |
||||||||||
Leases |
||||||||||
Removed from service |
( |
( |
( |
( |
||||||
Disposals of businesses |
( |
- |
( |
( |
||||||
Translation and other, net |
( |
( |
( |
|||||||
December 31, 2020 |
||||||||||
Additions: |
||||||||||
Capital expenditures |
||||||||||
Leases |
- |
|||||||||
Removed from service |
( ) |
( |
( |
( ) |
||||||
Disposals of businesses |
( ) |
( |
( |
( ) |
||||||
Translation and other, net |
( ) |
( |
( |
( ) |
||||||
December 31, 2021 |
||||||||||
Accumulated depreciation: |
||||||||||
December 31, 2019 |
( |
( |
( |
( |
||||||
Depreciation |
( |
( |
( |
( |
||||||
Removed from service |
||||||||||
Disposals of businesses |
- |
|||||||||
Translation and other, net |
||||||||||
December 31, 2020 |
( |
( |
( |
( |
||||||
Depreciation |
( |
( |
( |
( |
||||||
Removed from service |
||||||||||
Disposals of businesses |
- |
|||||||||
Translation and other, net |
||||||||||
December 31, 2021 |
( |
( |
( |
( |
||||||
Carrying amount: |
||||||||||
December 31, 2020 |
||||||||||
December 31, 2021 |
||||||||||
2021 |
2020 |
|||||||
Cost: |
||||||||
Balance at January 1, |
||||||||
Additions: |
||||||||
Internally developed |
||||||||
Purchased |
||||||||
Acquisitions |
||||||||
Removed from service |
( |
( |
||||||
Disposals of businesses |
( |
( |
||||||
Translation and other, net |
( |
|||||||
Balance at December 31, |
||||||||
Accumulated amortization: |
||||||||
Balance at January 1, |
( |
( |
||||||
Amortization |
( |
( |
||||||
Removed from service |
||||||||
Disposals of businesses |
||||||||
Translation and other, net |
( |
|||||||
Balance at December 31, |
( |
( |
||||||
Carrying amount at December 31: |
||||||||
Indefinite Useful Life |
Finite Useful Life |
|||||||||||||||||||||||||||||||
Trade Names |
Trade Names |
Customer Relationships |
Databases and Content |
Other |
Total |
|||||||||||||||||||||||||||
Cost: |
||||||||||||||||||||||||||||||||
December 31, 2019 |
||||||||||||||||||||||||||||||||
Acquisitions |
||||||||||||||||||||||||||||||||
Removed from service |
( |
( |
( |
|||||||||||||||||||||||||||||
Translation and other, net |
( |
|||||||||||||||||||||||||||||||
December 31, 2020 |
||||||||||||||||||||||||||||||||
Acquisitions |
||||||||||||||||||||||||||||||||
Removed from service |
( |
( |
( |
( |
( |
|||||||||||||||||||||||||||
Disposals of businesses |
( |
( |
( |
|||||||||||||||||||||||||||||
Translation and other, net |
( |
( |
( |
( |
( |
|||||||||||||||||||||||||||
December 31, 2021 |
||||||||||||||||||||||||||||||||
Accumulated amortization: |
||||||||||||||||||||||||||||||||
December 31, 2019 |
( |
( |
( |
( |
( |
|||||||||||||||||||||||||||
Amortization |
( |
( |
( |
( |
( |
|||||||||||||||||||||||||||
Removed from service |
||||||||||||||||||||||||||||||||
Translation and other, net |
( |
( |
( |
( |
||||||||||||||||||||||||||||
December 31, 2020 |
( |
( |
( |
( |
( |
|||||||||||||||||||||||||||
Amortization |
( |
( |
( |
( |
( |
|||||||||||||||||||||||||||
Removed from service |
||||||||||||||||||||||||||||||||
Disposals of businesses |
||||||||||||||||||||||||||||||||
Translation and other, net |
||||||||||||||||||||||||||||||||
December 31, 2021 |
( |
( |
( |
( |
( |
|||||||||||||||||||||||||||
Carrying amount: |
||||||||||||||||||||||||||||||||
December 31, 2020 |
||||||||||||||||||||||||||||||||
December 31, 2021 |
||||||||||||||||||||||||||||||||
2021 |
2020 |
|||||||
Cost: |
||||||||
Balance at January 1, |
||||||||
Acquisitions |
||||||||
Disposals of businesses |
( |
|||||||
Translation and other, net |
( |
( |
||||||
Carrying amount at December 31: |
||||||||
Cash-Generating Unit |
2021 |
|||
Legal Professionals |
||||
Corporates |
||||
Tax & Accounting Professionals |
||||
Reuters News |
||||
Global Print |
||||
Cash-Generating Unit |
Perpetual Growth Rate (1) |
Discount Rate |
Tax Rate |
|||||||||
Legal Professionals |
% |
% |
% |
|||||||||
Corporates |
% |
% |
% |
|||||||||
Tax & Accounting Professionals |
% |
% |
% |
|||||||||
Reuters News |
% |
% |
% |
|||||||||
Global Print |
( % |
) |
% |
% |
||||||||
December 31, 2021 |
Assets/(Liabilities) at Amortized Cost |
Assets/(Liabilities) at Fair Value through Earnings |
Assets at Fair Value through Other Comprehensive Income or Loss |
Derivatives Used for Hedging (1) |
Total |
|||||||||||||||
Cash and cash equivalents |
||||||||||||||||||||
Trade and other receivables |
||||||||||||||||||||
Other financial assets – current |
||||||||||||||||||||
Other financial assets – non-current (see note 20) |
||||||||||||||||||||
Trade payables (see note 21) |
( |
( |
||||||||||||||||||
Accruals (see note 21) |
( |
( |
||||||||||||||||||
Other financial liabilities – current (2) |
( |
( |
( |
|||||||||||||||||
Long-term indebtedness |
( |
( |
||||||||||||||||||
Other financial liabilities – non-current (see note 22) (3) |
( |
( |
( |
|||||||||||||||||
Total |
( |
( |
||||||||||||||||||
December 31, 2020 |
Assets/(Liabilities) at Amortized Cost |
Assets/(Liabilities) at Fair Value through Earnings |
Assets at Fair Value through Other Comprehensive Income or Loss |
Derivatives Used for Hedging (1) |
Total |
|||||||||||||||
Cash and cash equivalents |
- |
|||||||||||||||||||
Trade and other receivables |
- |
- |
- |
|||||||||||||||||
Other financial assets – current |
- |
- |
||||||||||||||||||
Other financial assets – non-current (see note 20) |
||||||||||||||||||||
Trade payables (see note 21) |
( |
- |
- |
- |
( |
|||||||||||||||
Accruals (see note 21) |
( |
- |
- |
- |
( |
|||||||||||||||
Other financial liabilities – current (2)(4) |
( |
( |
- |
- |
( |
|||||||||||||||
Long-term indebtedness |
( |
- |
- |
- |
( |
|||||||||||||||
Other financial liabilities – non-current (see note 22) (3) |
( |
( |
- |
- |
( |
|||||||||||||||
Total |
( |
( |
||||||||||||||||||
Carrying Amount |
Fair Value |
|||||||||||||||||||||||
December 31, 2021 |
Primary Debt Instruments |
Derivative Instruments (Asset) |
Primary Debt Instruments |
Derivative Instruments (Asset) |
||||||||||||||||||||
$ |
( |
( |
||||||||||||||||||||||
- |
- |
|||||||||||||||||||||||
(1) |
- |
- |
||||||||||||||||||||||
- |
- |
|||||||||||||||||||||||
(1) |
- |
- |
||||||||||||||||||||||
- |
- |
|||||||||||||||||||||||
- |
- |
|||||||||||||||||||||||
- |
- |
|||||||||||||||||||||||
Total |
( |
( |
||||||||||||||||||||||
Long-term |
( |
|||||||||||||||||||||||
Carrying Amount |
Fair Value |
|||||||||||||||||||||||
December 31, 2020 |
Primary Debt Instruments |
Derivative Instruments (Asset) |
Primary Debt Instruments |
Derivative Instruments (Asset) |
||||||||||||||||||||
$ |
( |
( |
||||||||||||||||||||||
- |
- |
|||||||||||||||||||||||
(1) |
- |
- |
||||||||||||||||||||||
- |
- |
|||||||||||||||||||||||
(1) |
- |
- |
||||||||||||||||||||||
- |
- |
|||||||||||||||||||||||
- |
- |
|||||||||||||||||||||||
- |
- |
|||||||||||||||||||||||
Total |
( |
( |
||||||||||||||||||||||
Long-term portion |
( |
|||||||||||||||||||||||
Month/Year |
Transaction |
Principal Amount (in millions) | ||
Notes issued |
||||
May 2020 |
% Notes, due |
C$ | ||
Notes repaid |
||||
January 2020 |
% Notes, due |
C$ | ||
January 2020 |
% Notes, due |
US$ | ||
Received |
Paid |
Hedged Risk |
Year of Maturity |
Principal Amount | ||||
Cash flow hedges |
||||||||
Canadian dollar fixed |
U.S. dollar fixed |
Foreign exchange |
US$ |
Before Currency Hedging Arrangements |
After Currency Hedging Arrangements |
|||||||||||||||||||
December 31, |
December 31, |
|||||||||||||||||||
2021 |
2020 |
2021 |
2020 |
|||||||||||||||||
Canadian dollar |
- |
|||||||||||||||||||
U.S. dollar |
||||||||||||||||||||
Year ended December 31, |
||||||||||||||||||||
2021 |
2020 |
|||||||||||||||||||
| |
|
Fair Value Gain (Loss) Through Earnings |
Fair Value Loss Through Equity |
Fair Value Gain Through Earnings |
Fair Value Loss Through Equity |
|||||||||||||||
Warrants |
- |
- |
||||||||||||||||||
Foreign exchange contracts |
( |
- |
- |
|||||||||||||||||
Hedging instruments: |
||||||||||||||||||||
Cross currency interest rate swaps – cash flow hedges |
( |
( |
||||||||||||||||||
Forward interest rate swaps – cash flow hedges |
- |
- |
||||||||||||||||||
- |
( |
( |
||||||||||||||||||
Increase (decrease) impact on earnings from: |
£ |
€ |
C$ |
Other Currencies |
Total |
|||||||||||||||
Financial assets and liabilities (1) |
( |
|||||||||||||||||||
Receivables under indemnification arrangement |
( |
- |
- |
- |
( |
|||||||||||||||
Non-permanent intercompany loans |
||||||||||||||||||||
Indirect investment in LSEG shares |
( |
- |
- |
- |
( |
|||||||||||||||
Foreign exchange contracts (2) |
- |
- |
- |
|||||||||||||||||
Total impact on earnings |
( |
( |
||||||||||||||||||
· |
Cash investments are placed with high-quality financial institutions with limited exposure to any one institution. At December 31, 2021, approximately “A-“ or higher by at least one of the major credit rating agencies; |
· |
Counterparties to derivative contracts are major investment-grade international financial institutions and exposure to any single counterparty is monitored and limited; and |
· |
The Company assesses the creditworthiness of its customers. |
December 31, 2021 |
2022 |
2023 |
2024 |
2025 |
2026 |
Thereafter |
Total |
|||||||||||||||||||||
Long-term debt (1) |
||||||||||||||||||||||||||||
Interest payable (1) |
||||||||||||||||||||||||||||
Debt-related hedges outflows (2) |
||||||||||||||||||||||||||||
Debt-related hedges inflows (1) |
( |
( |
( |
( |
( |
|||||||||||||||||||||||
Trade payables |
||||||||||||||||||||||||||||
Accruals |
||||||||||||||||||||||||||||
Lease liabilities |
||||||||||||||||||||||||||||
Foreign exchange contracts outflows (3) |
||||||||||||||||||||||||||||
Foreign exchange contracts inflows (4) |
( |
( |
( |
|||||||||||||||||||||||||
Other financial liabilities |
||||||||||||||||||||||||||||
Total |
||||||||||||||||||||||||||||
December 31, 2020 |
2021 |
2022 |
2023 |
2024 |
2025 |
Thereafter |
Total |
|||||||||||||||||||||
Long-term debt (5) |
||||||||||||||||||||||||||||
Interest payable (5) |
||||||||||||||||||||||||||||
Debt-related hedges outflows (2) |
||||||||||||||||||||||||||||
Debt-related hedges inflows (5) |
( |
( |
( |
( |
( |
( |
||||||||||||||||||||||
Trade payables |
||||||||||||||||||||||||||||
Accruals |
||||||||||||||||||||||||||||
Lease liabilities |
||||||||||||||||||||||||||||
Other financial liabilities |
||||||||||||||||||||||||||||
Total |
||||||||||||||||||||||||||||
Moody’s |
S&P Global Ratings |
DBRS Limited |
Fitch | |||||
Long-term debt |
||||||||
Commercial paper |
||||||||
Trend/Outlook |
||||||||
December 31, |
||||||||||||
2021 |
2020 |
|||||||||||
Long-term indebtedness |
||||||||||||
Total debt |
||||||||||||
Swaps |
( |
( |
||||||||||
Total debt after swaps |
||||||||||||
Remove fair value adjustments for hedges ( 1 ) |
( |
|||||||||||
Total debt after currency hedging arrangements |
||||||||||||
Remove transaction costs, premiums or discounts included in the carrying value of debt |
||||||||||||
Add: Lease liabilities (current and non-current) |
||||||||||||
Less: cash and cash equivalents |
( |
( |
||||||||||
Net debt |
||||||||||||
| Notes and Debentures |
Credit Facilities |
Derivative Instruments Liabilities (Assets) |
Lease Liabilities |
Total Liabilities From Financing Activities |
||||||||||||||||
| December 31, 2019 |
||||||||||||||||||||
| Proceeds from debt |
- |
- |
||||||||||||||||||
| Repayments of debt |
( |
( |
( |
- |
( |
|||||||||||||||
| Payments of lease principal |
- |
- |
- |
( |
( |
|||||||||||||||
| Additional leases |
- |
- |
- |
|||||||||||||||||
| Foreign exchange movements |
- |
( |
||||||||||||||||||
| Other, net (1) |
( |
- |
- |
( |
( |
|||||||||||||||
| December 31, 2020 |
|
|
|
|
|
|
|
( |
|
|
|
|
|
|
| |||||
| Payments of lease principal (2) |
( |
( |
||||||||||||||||||
| Additional leases |
||||||||||||||||||||
| Foreign exchange movements |
( |
( |
( |
|||||||||||||||||
| Other, net(3) |
( |
|||||||||||||||||||
| December 31, 2021 |
|
|
|
|
|
|
|
( |
|
|
|
|
|
|
| |||||
| · Level 1 |
quoted prices (unadjusted) in active markets for identical assets or liabilities; | |
| · Level 2 |
inputs other than quoted prices included within level 1 that are observable for the asset or liability, either directly (that is, as prices) or indirectly (that is, derived from prices); and | |
| · Level 3 |
inputs for the asset or liability that are not based on observable market data (that is, unobservable inputs). | |
| December 31, 2021 |
Total |
|||||||||||||||||
Assets |
Level 1 |
Level 2 |
Level 3 |
Balance |
||||||||||||||
| Money market accounts |
|
- |
- |
|||||||||||||||
| Other receivables (1) |
- |
- |
||||||||||||||||
| Financial assets at fair value through earnings |
|
- |
|
|
|
|
|
|
|
|
|
| ||||||
| Financial assets at fair value through other comprehensive income (2) |
|
|
|
|
|
|
|
- |
|
|
|
| ||||||
| Derivatives used for hedging (3) |
|
- |
|
|
|
|
|
- |
|
|
|
| ||||||
| Total assets |
|
|
|
|
|
|
|
|
|
|
|
| ||||||
| Liabilities |
|
|
|
|
|
|
|
|
|
|
|
|
| |||||
| Contingent consideration (4) |
- |
- |
( |
( |
||||||||||||||
| Foreign exchange contracts (5) |
- |
( |
- |
( |
||||||||||||||
| Financial liabilities at fair value through earnings |
|
- |
|
|
( |
|
|
( |
|
|
( |
| ||||||
| Total liabilities |
|
- |
|
|
( |
|
|
( |
|
|
( |
| ||||||
| December 31, 2020 |
Total |
|||||||||||||||||
Assets |
Level 1 |
Level 2 |
Level 3 |
Balance |
||||||||||||||
| Money market accounts |
|
- |
- |
|||||||||||||||
| Warrants (6) |
|
- |
- |
|||||||||||||||
| Other receivables (1) |
|
- |
|
|
- |
|
|
|
|
|
|
| ||||||
| Financial assets at fair value through earnings |
|
- |
|
|
|
|
|
|
|
|
|
| ||||||
| Financial assets at fair value through other comprehensive income (2) |
|
|
|
|
|
|
|
- |
|
|
|
| ||||||
| Derivatives used for hedging (3) |
|
- |
|
|
|
|
|
- |
|
|
|
| ||||||
| Total assets |
|
|
|
|
|
|
|
|
|
|
|
| ||||||
| Liabilities |
|
|
|
|
|
|
|
|
|
|
|
|
| |||||
| Contingent consideration (4) |
|
- |
|
|
- |
|
|
( |
|
|
( |
| ||||||
| Financial liabilities at fair value through earnings |
|
- |
|
|
- |
|
|
( |
|
|
( |
| ||||||
| Total liabilities |
|
- |
|
|
- |
|
|
( |
|
|
( |
| ||||||
| Year ended December 31, |
||||||||||
| 2021 |
2020 |
|||||||||
| January 1, |
| |||||||||
| Gain recognized prior to the sale of Refinitiv to LSEG within other operating gains, net |
| |||||||||
| Exercise of warrants on date of sale of Refinitiv to LSEG (see note 8) |
|
( |
|
|
|
|
||||
| December 31, |
|
|
|
|
|
|
||||
· |
Quoted market prices or dealer quotes for similar instruments; |
· |
The fair value of cross-currency interest rate swaps and foreign exchange contracts are calculated as the present value of the estimated future cash flows based on observable yield curves; |
· |
The fair value of other receivables considers estimated future cash flows, current market interest rates and non-performance risk; and |
· |
The fair value of contingent consideration is calculated based on estimates of future revenue performance. |
· |
On August 1, 2019, the Company and Blackstone’s consortium agreed to sell Refinitiv, in which the Company owned a |
· |
The Monte Carlo simulation approach, which was incorporated into the valuation of the Refinitiv warrants, generates values based on the random outcomes from a probability distribution. Key inputs under the Monte Carlo approach included: the estimated equity value of Refinitiv; the capitalization structure of Refinitiv; the expected volatility; the risk-free rate of return; annual dividends or distributions; and assumptions about the timing of a liquidity event. |
| Financial assets |
Gross Financial Assets |
Gross Financial Liabilities Netted Against Assets |
Net Financial Assets in the Consolidated Statement of Financial Position |
Related Financial Liabilities Not Netted |
Net Amount | |||||
| Derivative financial assets |
|
- |
(1) |
- |
| |||||
| Cash and cash equivalents |
|
- |
(2) |
- |
| |||||
| December 31, 2021 |
|
- |
|
- |
| |||||
| Derivative financial assets |
- |
(1) |
- |
|||||||
| Cash and cash equivalents |
- |
(2) |
- |
|||||||
| December 31, 2020 |
- |
- |
||||||||
| Financial liabilities |
Gross Financial Liabilities |
Gross Financial Assets Netted Against Liabilities |
Net Financial Liabilities in the Consolidated Statement of Financial Position |
Related Financial Assets Not Netted |
Net Amount | |||||
| Derivative financial liabilities |
|
- |
(3) |
- |
| |||||
| December 31, 2021 |
|
- |
|
- |
|
| December 31, | ||||
| 2021 |
2020 | |||
| Net defined benefit plan surpluses (see note 26) |
|
| ||
| Cash surrender value of life insurance policies |
|
| ||
| Deferred commissions |
|
| ||
| Other financial assets (see note 19) |
|
| ||
| Other non-current assets(1) |
|
| ||
| Total other non-current assets |
|
| ||
| December 31, | ||||
| 2021 |
2020 | |||
| Trade payables |
|
| ||
| Accruals |
|
| ||
| Provisions (see note 22) |
|
| ||
| Other current liabilities |
|
| ||
| Total payables, accruals and provisions |
|
| ||
| December 31, | ||||
| 2021 |
2020 | |||
| Net defined benefit plan obligations (see note 26) |
|
| ||
| Other financial liabilities (see note 19) |
|
| ||
| Deferred compensation and employee incentives |
|
| ||
| Provisions |
|
| ||
| Other non-current liabilities |
|
| ||
| Total provisions and other non-current liabilities |
|
| ||
| Employee- Related |
Restructuring |
Facilities- Related |
Other |
Total |
||||||||||||||||
| Balance at December 31, 2019 |
- |
|||||||||||||||||||
| Charges |
|
|
|
|
- |
|
|
|
|
|
|
|
|
|
| |||||
| Utilization |
|
( |
|
|
( |
|
|
( |
|
|
( |
|
|
( |
| |||||
| Translation and other, net |
- |
- |
( |
( |
||||||||||||||||
| Balance at December 31, 2020 |
||||||||||||||||||||
| Less: short-term provisions |
||||||||||||||||||||
| Long-term provisions |
|
- |
|
|
- |
|
|
|
|
|
|
|
|
|
| |||||
| Balance at December 31, 2020 |
|
|
|
|
|
|
|
|
|
|
|
|
|
|
| |||||
| Charges |
|
|
|
|
- |
|
|
|
|
|
( |
|
|
|
| |||||
| Utilization |
|
( |
|
|
( |
|
|
( |
|
|
( |
|
|
( |
||||||
| Translation and other, net |
|
1 |
|
|
|
|
|
- |
|
|
( |
|
( |
| ||||||
| Balance at December 31, 2021 |
|
|
|
|
|
|
|
|
|
|
|
|
|
|
| |||||
| Less: short-term provisions |
|
|
|
|
|
|
|
|
|
|
|
|
|
|
| |||||
| Long-term provisions |
|
|
|
|
|
|
|
|
|
|
|
|
|
|
| |||||
| Deferred tax liabilities |
Goodwill and Other Identifiable Intangible Assets |
Equity Method Investments |
Other |
Total |
||||||||||||
| December 31, 2019 |
||||||||||||||||
| Acquisitions |
||||||||||||||||
| (Benefit) expense to income statement - continuing operations |
( |
( |
( |
|||||||||||||
| Expense to other comprehensive income |
- |
|||||||||||||||
| Translation and other, net |
( |
|||||||||||||||
| December 31, 2020 |
||||||||||||||||
| Acquisitions |
||||||||||||||||
| (Benefit) expense to income statement - continuing operations |
( |
|||||||||||||||
| Benefit to other comprehensive income |
- |
( |
- |
( |
||||||||||||
| Translation and other, net |
( |
|||||||||||||||
| December 31, 2021 |
||||||||||||||||
| Deferred tax assets |
Tax Losses and Other Attributes |
Goodwill and Other Identifiable Intangible Assets |
Employee Benefits and Compensation |
Other |
Total |
|||||||||||||||
| December 31, 2019 |
||||||||||||||||||||
| Benefit (expense) to income statement - continuing operations |
( |
( |
||||||||||||||||||
| Benefit to income statement - discontinued operations |
- |
- |
||||||||||||||||||
| Expense to other comprehensive income |
- |
- |
( |
- |
( |
|||||||||||||||
| Benefit to equity |
- |
- |
- |
|||||||||||||||||
| Translation and other, net |
( |
|||||||||||||||||||
| December 31, 2020 |
||||||||||||||||||||
| Acquisitions |
- |
- |
- |
|||||||||||||||||
| Benefit (expense) to income statement - continuing operations |
( |
( |
( |
( |
||||||||||||||||
| Expense to income statement - discontinued operations |
- |
- |
- |
( |
( |
|||||||||||||||
| Expense to other comprehensive income |
- |
- |
( |
- |
( |
|||||||||||||||
| Benefit to equity |
- |
- |
- |
|||||||||||||||||
| Translation and other, net |
||||||||||||||||||||
| December 31, 2021 |
||||||||||||||||||||
| Net deferred tax asset at December 31, 2020 |
|
|
|
|
|
|
|
|
|
|
||||||||||
| Net deferred tax asset at December 31, 2021 |
|
|||||||||||||||||||
December 31, |
||||||||
2021 |
2020 |
|||||||
Deferred tax liabilities |
||||||||
Deferred tax liabilities to be recovered after more than 12 months |
||||||||
Deferred tax liabilities to be recovered within 12 months |
||||||||
Total deferred tax liabilities |
||||||||
Deferred tax assets |
||||||||
Deferred tax assets to be recovered after more than 12 months |
||||||||
Deferred tax assets to be recovered within 12 months |
||||||||
Total deferred tax assets |
||||||||
Net deferred tax asset |
||||||||
Carry Forward Loss/ Tax Attributes |
Tax Value |
Unrecognized Deferred Tax Assets |
Net Deferred Tax Assets |
|||||||||||||
Canadian net operating losses |
( |
|||||||||||||||
Net operating losses – other jurisdictions |
( |
|||||||||||||||
Capital losses |
( |
|||||||||||||||
Investment in subsidiaries |
( |
|||||||||||||||
Other deductible temporary differences |
( |
|||||||||||||||
U.S. state net operating losses (1) |
n/m |
( |
||||||||||||||
Other attributes and credits (2) |
n/m |
( |
||||||||||||||
Total |
( ) |
|||||||||||||||
Number of Common Shares |
Stated Capital |
Series II, Cumulative Redeemable Preference Share Capital |
Contributed Surplus |
Total Capital |
||||||||||||||||
Balance, December 31, 2019 |
||||||||||||||||||||
Shares issued under DRIP |
- |
- |
||||||||||||||||||
Stock compensation plans (1) |
- |
( |
||||||||||||||||||
Repurchases of common shares (2) |
( |
( |
- |
- |
( |
|||||||||||||||
Balance, December 31, 2020 |
||||||||||||||||||||
Shares issued under DRIP |
||||||||||||||||||||
Stock compensation plans (1) |
( |
|||||||||||||||||||
Repurchases of common shares |
( |
( |
( |
|||||||||||||||||
Balance, December 31, 2021 |
||||||||||||||||||||
Year ended December 31, |
||||||||
2021 |
2020 |
|||||||
Dividends declared per common share |
$ |
$ |
||||||
Dividends declared |
||||||||
Dividends reinvested |
( |
( |
||||||
Dividends paid |
||||||||
Year ended December 31, |
||||||||
2021 |
2020 |
|||||||
Share repurchases (millions of U.S. dollars) |
||||||||
Shares repurchased (number in millions) |
||||||||
Share repurchases - average price per share in U.S. dollars |
$ |
$ |
||||||
Equity-settled | ||||||
Type of award |
Vesting period |
Fair Value Measure |
Compensation expense based on: | |||
Stock options |
Black-Scholes option pricing model |
|||||
TRSUs |
Closing common share price |
|||||
PRSUs |
Three-year performance period |
Closing common share price |
||||
| 2021 |
2020 |
|||||||
| Weighted-average fair value ($) |
||||||||
| Weighted-average of key assumptions: |
|
|
|
|
|
| ||
| Share price ($) |
||||||||
| Exercise price ($) |
||||||||
| Risk-free interest rate |
||||||||
| Dividend yield |
||||||||
| Volatility factor |
||||||||
| Expected life (in years) |
||||||||
| Stock Options |
TRSUs |
PRSUs |
Total |
Weighted- Average Exercise Price($) (1) |
||||||||||||||||
| Awards outstanding (in thousands): |
|
|
|
|
|
|
|
|
|
|
|
|
|
|
| |||||
| Outstanding at December 31, 2019 |
||||||||||||||||||||
| Granted |
||||||||||||||||||||
| Exercised |
( |
( |
( |
( |
||||||||||||||||
| Forfeited |
( |
( |
( |
( |
- |
|||||||||||||||
| Outstanding at December 31, 2020 |
||||||||||||||||||||
| Exercisable at December 31, 2020 |
- |
- |
||||||||||||||||||
| Granted |
||||||||||||||||||||
| Exercised |
( |
( |
( |
|||||||||||||||||
| Forfeited |
( |
( |
( |
( |
- |
|||||||||||||||
| Outstanding at December 31, 2021 |
|
|
|
|
|
|
|
|
|
|
|
|
|
|
| |||||
| Exercisable at December 31, 2021 |
|
|
|
|
|
|
|
|
|
|
|
|
|
|
| |||||
| Stock Options |
TRSUs |
PRSUs |
ESPP |
Total | ||||||
| December 31, 2021 |
||||||||||
| December 31, 2020 |
||||||||||
| Range of exercise prices (1) |
Number Outstanding (in thousands) |
Weighted-Average Remaining Contractual Life (years) |
Weighted-Average Exercise Price for Awards Outstanding |
Number Exercisable (in thousands) |
Weighted-Average Exercise Price for Awards Exercisable | |||||
| 35.01 - 40.00 |
$ |
$ | ||||||||
| 40.01 - 45.00 |
$ |
$ | ||||||||
| 50.01 - 55.00 |
$ |
$ | ||||||||
| 60.01 - 65.00 |
$ |
$ | ||||||||
| 75.01 - 80.00 |
$ |
$ | ||||||||
| 85.01 - 90.00 |
$ |
|||||||||
| Total |
||||||||||
| Pension Plans (1) |
OPEB (1) |
Total (1) |
||||||||||||||||||||||
| 2021 |
2020 |
2021 |
2020 |
2021 |
2020 |
|||||||||||||||||||
| As of January 1 |
( |
( |
( |
( |
( |
( |
||||||||||||||||||
| Plan (expense) income recognized in income statement: |
( |
( |
( |
( |
||||||||||||||||||||
| Actuarial gains (losses) |
( |
|||||||||||||||||||||||
| Exchange differences |
( |
|||||||||||||||||||||||
| Contributions paid |
||||||||||||||||||||||||
| Other |
( |
- |
||||||||||||||||||||||
| Net plan obligations as of December 31 |
|
( |
|
|
( |
|
|
( |
|
|
( |
|
|
( |
|
|
( |
| ||||||
| Net plan surpluses recognized in non-current assets |
|
|
|
|
|
|
|
|
|
|
|
|
|
|
|
|
|
| ||||||
| Net plan obligations recognized in non-current liabilities |
|
( |
|
|
( |
| ||||||||||||||||||
| Funded |
Unfunded (1) |
OPEB |
Total |
|||||||||||||||||||||||||||||
| As of December 31, |
2021 |
2020 |
2021 |
2020 |
2021 |
2020 |
2021 |
2020 |
||||||||||||||||||||||||
| Present value of plan obligations |
|
( |
|
|
( |
|
|
( |
|
|
( |
|
|
( |
|
|
( |
|
|
( |
|
|
( |
| ||||||||
| Fair value of plan assets |
|
|
|
|
|
|
|
- |
|
|
- |
|
|
- |
|
|
- |
|
|
|
|
|
|
| ||||||||
| Net plan assets (obligations) |
|
|
|
|
( |
|
|
( |
|
|
( |
|
|
( |
|
|
( |
|
|
( |
|
|
( |
| ||||||||
| Net plan surpluses |
|
|
|
|
|
|
|
- |
|
|
- |
|
|
- |
|
|
- |
|
|
|
|
|
|
| ||||||||
| Net plan obligations |
|
( |
|
|
( |
|
|
( |
|
|
( |
|
|
( |
|
|
( |
|
|
( |
|
|
( |
| ||||||||
| Present Value of Defined Benefit Obligations |
Funded |
Unfunded |
OPEB |
Total |
||||||||||||||||||||||||||||
| As of December 31, |
2021 |
2020 |
2021 |
2020 |
2021 |
2020 |
2021 |
2020 |
||||||||||||||||||||||||
| Opening defined benefit obligation |
( |
( |
( |
( |
( |
( |
( |
( |
||||||||||||||||||||||||
| Current service cost |
( |
( |
( |
( |
( |
- |
( |
( |
||||||||||||||||||||||||
| Administration fees |
( |
( |
( |
( |
- |
- |
( |
( |
||||||||||||||||||||||||
| Interest cost |
( |
( |
( |
( |
( |
( |
( |
( |
||||||||||||||||||||||||
| Actuarial gains (losses) from changes in financial assumptions (1) |
( |
( |
( |
( |
||||||||||||||||||||||||||||
| Actuarial (losses) gains from changes in demographic assumptions |
( |
- |
- |
( |
||||||||||||||||||||||||||||
| Experience (losses) gains (2) |
- |
( |
( |
( |
( |
( |
||||||||||||||||||||||||||
| Contributions by employees |
( |
( |
- |
- |
( |
( |
( |
( |
||||||||||||||||||||||||
| Benefits paid |
||||||||||||||||||||||||||||||||
| Administration fees disbursements |
- |
- |
- |
- |
||||||||||||||||||||||||||||
| Plan amendments (3) |
- |
( |
- |
- |
||||||||||||||||||||||||||||
| Exchange differences |
( |
- |
( |
- |
- |
( |
||||||||||||||||||||||||||
| Other |
- |
( |
- |
- |
- |
|||||||||||||||||||||||||||
| Closing defined benefit obligation |
( |
( |
( |
( |
( |
( |
( |
( |
||||||||||||||||||||||||
As of December 31, |
2021 |
2020 |
As of December 31, |
2021 |
2020 |
|||||||||||||||
| Active employees |
|
|
|
|
% |
|
|
U.S. |
|
|
|
|
% |
| ||||||
| Deferred |
|
|
|
|
% |
|
U.K. |
|
|
|
|
% |
| |||||||
| Retirees |
|
|
|
|
% |
|
Rest of world |
|
|
|
|
% |
| |||||||
| Closing defined benefit obligation |
|
|
|
|
% |
|
|
|
|
|
% |
| ||||||||
| Fair Value of Plan Assets |
Funded |
Unfunded |
OPEB |
Total |
||||||||||||||||||||||||||||
| As of December 31, |
2021 |
2020 |
2021 |
2020 |
2021 |
2020 |
2021 |
2020 |
||||||||||||||||||||||||
| Opening fair value of plan assets |
- |
- |
- |
- |
||||||||||||||||||||||||||||
| Interest income (1) |
- |
- |
- |
- |
||||||||||||||||||||||||||||
| Return on plan assets excluding amounts included in interest income (2) |
- |
- |
- |
- |
||||||||||||||||||||||||||||
| Contributions by employer |
||||||||||||||||||||||||||||||||
| Contributions by employees |
- |
- |
||||||||||||||||||||||||||||||
| Benefits paid |
( |
( |
( |
( |
( |
( |
( |
( |
||||||||||||||||||||||||
| Administration fees disbursements |
( |
( |
- |
- |
- |
- |
( |
( |
||||||||||||||||||||||||
| Exchange differences |
( |
- |
- |
- |
- |
( |
||||||||||||||||||||||||||
| Other |
- |
- |
- |
- |
- |
- |
||||||||||||||||||||||||||
| Closing fair value of plan assets |
|
|
|
|
|
|
|
- |
|
|
- |
|
|
- |
|
|
- |
|
|
|
|
|
|
| ||||||||
| Quoted (1) |
Unquoted |
Total |
||||||||||||||||||||||
| As of December 31, |
2021 |
2020 |
2021 |
2020 |
2021 |
2020 |
||||||||||||||||||
| Equities (2) |
|
|
|
|
|
|
|
|
|
|
|
|
|
|
|
|
|
| ||||||
| U.S. |
||||||||||||||||||||||||
| U.K. |
- |
- |
||||||||||||||||||||||
| All other |
||||||||||||||||||||||||
| Total Equities |
||||||||||||||||||||||||
| Bonds (3) |
|
|
|
|
|
|
|
|
|
|
|
|
|
|
|
|
|
| ||||||
| Corporate |
|
|
|
|
|
|
|
|
|
|
|
|
|
|
|
|
|
| ||||||
| U.S. |
||||||||||||||||||||||||
| U.K. |
|
|
- |
|
|
|
- |
|
|
|
|
|
|
|
- |
|
|
|
|
|
|
|
- |
|
| All other |
||||||||||||||||||||||||
| Government |
|
|
|
|
|
|
|
|
|
|
|
|
|
|
|
| ||||||||
| U.S. |
||||||||||||||||||||||||
| All other |
||||||||||||||||||||||||
| Other fixed income |
||||||||||||||||||||||||
| Total Bonds |
||||||||||||||||||||||||
| Multi-asset (4) |
||||||||||||||||||||||||
| Property |
- |
- |
||||||||||||||||||||||
| Insurance |
- |
- |
||||||||||||||||||||||
| Derivatives |
- |
|||||||||||||||||||||||
| Cash and cash equivalents |
||||||||||||||||||||||||
| Other |
- |
|||||||||||||||||||||||
| Total |
||||||||||||||||||||||||
| Funded |
Unfunded |
OPEB | ||||||||||
| As of December 31, |
2021 |
2020 |
2021 |
2020 |
2021 |
2020 | ||||||
| Discount rate |
||||||||||||
| Inflation assumption |
||||||||||||
| Rate of increase in salaries |
||||||||||||
| Rate of increase in pension payments |
||||||||||||
| Medical cost trend |
||||||||||||
· |
TRGP: Pri 2012/MP-2021 Generational Table; and |
· |
TTC plan: SAPS S3 Light Tables with allowances for plan demographic specifics and longevity improvements. |
| December 31, 2021 |
Life Expectation in Years | |||||
| Male |
Female | |||||
| Employee retiring as of December 31, 2021 at age 65 |
||||||
| Employee age 40 as of December 31, 2021 retiring at age 65 |
||||||
| December 31, 2020 |
Life Expectation in Years | |||||
| Male |
Female | |||||
| |
||||||
| |
||||||
· |
Investment risk: |
· |
Interest rate risk: |
· |
Inflation risk: |
· |
Currency risk: |
· |
Liquidity risk: |
· |
Mortality risk: |
| Income Statement (1) |
Funded |
Unfunded |
OPEB |
Total | ||||||||||||
| Year ended December 31, |
2021 |
2020 |
2021 |
2020 |
2021 |
2020 |
2021 |
2020 | ||||||||
| Current service cost |
- |
|||||||||||||||
| Net interest cost |
||||||||||||||||
| Administration fees |
- |
- |
||||||||||||||
| Plan amendments (2) |
( |
( |
- |
- |
- |
( |
( | |||||||||
| Defined benefit plan expense (income) |
( |
( | ||||||||||||||
| Other Comprehensive (Income) Loss |
Funded |
Unfunded |
OPEB |
Total | ||||||||||||
| Year ended December 31, |
2021 |
2020 |
2021 |
2020 |
2021 |
2020 |
2021 |
2020 | ||||||||
| Remeasurement (gains) losses on defined benefit obligation: |
|
|
|
|
|
|
|
| ||||||||
| Due to financial assumption changes |
( |
( |
( |
( |
||||||||||||
| Due to demographic assumption changes |
( |
( |
( |
( | ||||||||||||
| Due to experience |
( |
( | ||||||||||||||
| Return on plan assets greater than discount rate |
( |
( |
- |
- |
( |
( | ||||||||||
| Total recognized in other comprehensive (income) loss before taxation |
( |
( |
( |
( |
( |
( | ||||||||||
| Accumulated Comprehensive Loss (Income) |
Funded |
Unfunded |
OPEB |
Total | ||||||||||||
| 2021 |
2020 |
2021 |
2020 |
2021 |
2020 |
2021 |
2020 | |||||||||
| Balance of accumulated comprehensive loss (income) at January 1 |
( |
( |
||||||||||||||
| Net actuarial (gains) losses recognized in the year |
( |
( |
( |
( |
( |
( | ||||||||||
| Total accumulated comprehensive loss (income) at December 31, |
( |
( |
||||||||||||||
| Land, Buildings and Building Improvements |
Computer Equipment (1) |
Furniture, Fixtures and Other Equipment |
Total |
|||||||||||||
| Year ended December 31, 2021 |
|
|
|
|
|
|
|
|
|
|
|
| ||||
| Carrying amount |
||||||||||||||||
| Depreciation |
||||||||||||||||
| Year ended December 31, 2020 |
|
|
|
|
|
|
|
|
|
|
|
| ||||
| Carrying amount |
||||||||||||||||
| Depreciation |
||||||||||||||||
| December 31, |
||||||||
| 2021 |
2020 |
|||||||
| Within 1 year |
|
|
| |||||
| Between 1 and 2 years |
|
|
| |||||
| Between 2 and 3 years |
|
|
| |||||
| Between 3 and 4 years |
|
|
| |||||
| Between 4 and 5 years |
|
|
| |||||
| Later than 5 years |
|
|
| |||||
| Total undiscounted cash flows |
|
|
| |||||
| Lease liabilities included in the consolidated statement of financial position |
|
|
|
|
|
| ||
| Current |
|
|
| |||||
| Non-current |
|
|
| |||||
| December 31, |
||||||||
| 2021 |
2020 |
|||||||
| Within 1 year |
||||||||
| Between 1 and 2 years |
||||||||
| Between 2 and 3 years |
||||||||
| Between 3 and 4 years |
||||||||
| Between 4 and 5 years |
||||||||
| Later than 5 years |
||||||||
| Total undiscounted lease payments to be received |
||||||||
| Unearned finance income |
( |
( |
||||||
| Net investment in leases |
||||||||
| Year ended December 31, | ||||
| 2021 |
2020 | |||
| Non-cash employee benefit charges |
||||
| Net gains on foreign exchange and derivative financial instruments |
( |
( | ||
| Revaluation of Refinitiv warrants (see note 19) |
( |
( | ||
| Fair value adjustments (see note 5) |
( |
( | ||
| Other (1) |
( |
( | ||
| ( | ||||
| Year ended December 31, | ||||
| 2021 |
2020 | |||
| Trade and other receivables |
||||
| Prepaid expenses and other current assets |
( |
|||
| Other financial assets |
( |
|||
| Payables, accruals and provisions |
( | |||
| Deferred revenue |
||||
| Other financial liabilities |
( | |||
| Income taxes (1) |
||||
| Other |
( |
( | ||
| Year ended December 31, | ||||
| 2021 |
2020 | |||
| Operating activities - continuing operations |
( |
( | ||
| Operating activities - discontinued operations |
( |
|||
| Investing activities - continuing operations |
( |
( | ||
| Investing activities - discontinued operations (1) |
( |
|||
| Total income taxes paid |
( |
( | ||
| Year ended December 31, | ||||
| 2021 |
2020 | |||
| Cash Consideration | ||||
| Businesses acquired |
||||
| Less: Cash acquired |
( | |||
| Businesses acquired, net of cash |
||||
| Investments in businesses |
||||
| Asset acquisitions (1) |
||||
| Contingent consideration payments |
||||
| Date |
Company |
Acquiring Segments |
Description | |||
| March 2020 | Pondera Solutions | Legal Professionals | A provider of technology and advanced analytics to combat fraud, waste and abuse in healthcare and large government programs. | |||
| August 2020 | CaseLines, now known as Case Center | Legal Professionals | A provider of a cloud-based, evidence sharing platform that allows courts, law enforcement, prosecutors and legal practitioners to digitally collaborate, share and participate in virtual and physical court proceedings. | |||
| Year ended December 31, |
||||||
| 2020 |
||||||
| Cash and cash equivalents |
|
| ||||
| Trade receivables |
|
| ||||
| Prepaid expenses and other current assets |
||||||
| Current assets |
|
| ||||
| Computer software |
|
| ||||
| Other identifiable intangible assets |
||||||
| Total assets |
||||||
| Payables and accruals |
|
( |
| |||
| Deferred revenue |
|
( |
| |||
| Other financial liabilities |
( |
|||||
| Current liabilities |
|
( |
| |||
| Provisions and other non-current liabilities |
|
( |
| |||
| Deferred tax |
( |
|||||
| Total liabilities |
( |
|||||
| Net assets acquired |
|
| ||||
| Goodwill |
||||||
| Total |
||||||
| December 31, |
||||||
| 2021 |
2020 |
|||||
| Within 1 year |
| |||||
| Between 1 and 2 years |
| |||||
| Between 2 and 3 years |
| |||||
| Between 3 and 4 years |
| |||||
| Between 4 and 5 years |
| |||||
| Later than 5 years |
||||||
| Year ended December 31, | ||||
| 2021 |
2020 | |||
| Salaries and other benefits |
||||
| Share-based payments |
||||
| Total compensation |
||||
| Name |
Age |
Title | ||
| Steve Hasker |
52 |
President & Chief Executive Officer | ||
| Michael Eastwood |
55 |
Chief Financial Officer | ||
| Brian Peccarelli |
61 |
Chief Operating Officer, Customer Markets | ||
| Kirsty Roth |
46 |
Chief Operations & Technology Officer | ||
| David Wong |
37 |
Chief Product Officer | ||
| Paul Fischer |
56 |
President, Legal Professionals | ||
| Elizabeth Beastrom |
54 |
President, Tax & Accounting Professionals | ||
| Sunil Pandita |
42 |
President, Corporates | ||
| Matthew Keen |
43 |
Interim President, Reuters News | ||
| Mary Alice Vuicic |
54 |
Chief People Officer | ||
| Thomas Kim |
50 |
Chief Legal Officer & Company Secretary | ||
 |
Steve Hasker non-executive director of Appen Limited. He is a member of the Australia and New Zealand Institute of Chartered Accountants. Steve is based in Toronto, Ontario, Canada. | |
 |
Michael Eastwood | |
 |
Brian Peccarelli | |
 |
Kirsty Roth | |
 |
David Wong | |
 |
Paul Fischer | |
 |
Elizabeth Beastrom | |
 |
Sunil Pandita | |
 |
Matthew Keen re-joined Thomson Reuters in October 2010 after holding senior positions at The British Broadcasting Corporation (BBC) between January 2009 and October 2010. Matthew joined Thomson Reuters in October 2002 and held senior roles including Head of Finance, UK & Ireland (Financial & Risk division) and Business Support Manager, Global Sales, Service & Operations. Prior to joining Thomson Reuters, Matthew became an ICAEW Chartered Accountant working at Deloitte Touche Tohmatsu Limited. He holds a bachelor’s degree in psychology from the University of Warwick and resides in Chipstead, Surrey, United Kingdom. | |
 |
Mary Alice Vuicic | |
 |
Tom Kim | |
Committee Memberships |
||||||||||||
| Name |
Age |
Audit |
Corporate Governance |
Human Resources |
Risk |
Director Since | ||||||
| David Thomson, Chairman |
64 | 1988 | ||||||||||
| Steve Hasker |
52 | 2020 | ||||||||||
| Kirk E. Arnold |
62 | • | • | Chair | 2020 | |||||||
| David W. Binet, Deputy Chairman |
64 | • | • | • | 2013 | |||||||
| W. Edmund Clark, C.M. |
74 | • | Chair | 2015 | ||||||||
| LaVerne Council |
60 | • | 2022 | |||||||||
| Michael E. Daniels |
67 | • | Chair | • | • | 2014 | ||||||
| Kirk Koenigsbauer |
54 | • | • | 2020 | ||||||||
| Deanna Oppenheimer |
63 | • | • | 2020 | ||||||||
| Vance K. Opperman, Lead Independent Director |
79 | • | • | • | • | 1996 | ||||||
| Simon Paris |
52 | • | 2020 | |||||||||
| Kim M. Rivera |
53 | • | • | 2019 | ||||||||
| Barry Salzberg |
68 | Chair | • | • | 2015 | |||||||
| Peter J. Thomson |
56 | • | 1995 | |||||||||
| Wulf von Schimmelmann |
75 | • | • | 2011 | ||||||||
 |
David Thomson | |
| |
Steve Hasker non-executive director of Appen Limited. He is a member of the Australia and New Zealand Institute of Chartered Accountants. Steve is based in Toronto, Ontario, Canada. | |
 |
Kirk E. Arnold Executive-in-Residence non-executive director of Epiphany Technology Acquisition Corp., IngersollRand plc and Trane Technologies. Kirk serves on the boards of several private companies. In addition, she is a Senior Lecturer at MIT Sloan School of Management and an advisor to the Center for MIT Entrepreneurship. Kirk received a bachelor’s degree from Dartmouth College. Kirk resides in Kennebunk, Maine, United States. | |
 |
David W. Binet | |
 |
W. Edmund Clark, C.M. non-executive director of Spin Master Corp. Ed has a BA from the University of Toronto, and an MA and Doctorate in Economics from Harvard University. Ed has also received honorary degrees from Mount Allison University, Queen’s University, Western University and the University of Toronto. In 2010, he was made an Officer of the Order of Canada, one of the country’s highest distinctions. Ed resides in Toronto, Ontario, Canada. | |
 |
LaVerne Council non-executive director of CONMED Corporation and Concentrix Corporation. She received her Master of Business Administration from Illinois State University and her Bachelor of Business Administration in Computer Science from Western Illinois University. LaVerne also holds an honorary Doctorate of Business Administration from Drexel University. LaVerne resides in Great Falls, Virginia, United States. | |
 |
Michael E. Daniels non-executive director of SS&C Technologies Holdings, Inc. and Johnson Controls International plc. Corporation. Mike has a bachelor’s degree in political science from Holy Cross College. Mike resides in Hilton Head, South Carolina, United States. | |
 |
Kirk Koenigsbauer | |
 |
Deanna Oppenheimer | |
 |
Vance K. Opperman not-for-profit | |
 |
Simon Paris | |
 |
Kim M. Rivera | |
 |
Barry Salzberg | |
 |
Peter J. Thomson | |
 |
Wulf von Schimmelmann | |
| Audit Committee Member |
Education/Experience | |
| Barry Salzberg (Chair) |
• Former Global Chief Executive Officer of Deloitte Touche Tohmatsu Limited• Former Professor at Columbia Business School• Degree in accounting from Brooklyn College, a JD from Brooklyn Law School and an LLM in tax from the New York University | |
| LaVerne Council |
• MBA and bachelor’s degree in business administration• Member of CONMED Corporation and Concentrix Corporation boards of directors | |
| Michael E. Daniels |
• Over 25 years of executive experience at IBM• Former member of the Tyco International Ltd. audit committee• Member of SS&C Technologies Holdings, Inc. and Johnson Controls International plc boards of directors | |
| Kirk Koenigsbauer |
• Over 18 years of executive experience at Microsoft• Responsible for product planning, pricing, sales, marketing and ecosystem development for various Microsoft offerings | |
| Deanna Oppenheimer |
• Former Vice Chair of Global Retail Banking of Barclays PLC• Former President of Consumer Banking of Washington Mutual, Inc.• Former member of AXA Global Insurance audit committee• Former member of NCR Corporation audit committee | |
| Vance K. Opperman |
• Former President and COO of West Publishing Company• President and CEO of Key Investment, Inc.• Former Chair of Audit Committee of Thomson Reuters for over 15 years• Member of TCF Financial Corporation audit committee• Represented financial institutions in securities and financial regulations matters as a practicing attorney | |
| Simon Paris |
• Chief Executive Officer of Finastra• Chair of the World Trade Board | |
| Kim M. Rivera |
• Former President, Strategy and Business Management and Chief Legal Officer of HP Inc.• Supported audit committees of two publicly-traded Fortune 500 companies | |
| (in millions of U.S. dollars) |
2021 |
2020 |
||||||
| Audit fees |
$ | 11.5 | $ | 11.9 | ||||
| Audit-related fees |
1.3 | 1.3 | ||||||
| Tax fees |
2.5 | 3.3 | ||||||
| All other fees |
– | 0.1 | ||||||
| Total |
$ |
15.3 |
$ |
16.6 |
||||
· |
The policy gives detailed guidance to management as to the specific types of services that have been pre-approved by the Audit Committee. |
· |
The policy requires the Audit Committee’s specific pre-approval of all other permitted types of services that have not already been pre-approved. |
· |
The Audit Committee’s charter allows the Audit Committee to delegate to one or more members the authority to evaluate and approve engagements in the event that the need arises for approval between Audit Committee meetings. Pursuant to this charter provision, the Audit Committee has delegated this authority to its Chair. If the Chair approves any such engagements, he must report his approval decisions to the full Audit Committee at its next meeting. |
· |
For the year ended December 31, 2021, none of the fees of Thomson Reuters described above made use of the de minimis exception to pre-approval provisions as provided for by Rule 2-01(c)(7)(i)(C) of SEC Regulation S-X and Section 2.4 of the Canadian Securities Administrators’ Multilateral Instrument 52-110 (Audit Committees). |
· |
Corporate governance, including the effectiveness of our Board; |
· |
Appointment of the Chief Executive Officer and other members of senior management and related succession planning; |
· |
Development of the long-term business strategy of Thomson Reuters and assessment of its implementation; and |
· |
Capital strategy. |
| Thomson Reuters’ corporate governance practices include the following, which we believe are best practices for a Canadian public company with a controlling shareholder: · · · · · · · |
· |
The roles and responsibilities of the Chairman (David Thomson) and the CEO (Steve Hasker) are separate; |
· |
We have a Lead Independent Director (Vance Opperman); and |
· |
The Audit Committee is comprised entirely of independent directors (as required by applicable law) and the Corporate Governance Committee, Human Resources Committee and Risk Committee each have a majority of independent directors. |
Director Independence | ||||||||
Name of Director Nominee |
Management |
Independent |
Not Independent |
Reason for Non-Independence | ||||
David Thomson |
✓ |
A Chairman of Woodbridge | ||||||
Steve Hasker |
✓ |
✓ |
President & Chief Executive Officer of Thomson Reuters | |||||
Kirk E. Arnold |
✓ |
|||||||
David W. Binet |
✓ |
President of Woodbridge | ||||||
W. Edmund Clark, C.M. |
✓ |
Advisor to the trustee of the 2003 TIL Settlement and Woodbridge | ||||||
LaVerne Council |
✓ |
|||||||
Michael E. Daniels |
✓ |
|||||||
Kirk Koenigsbauer |
✓ |
|||||||
Deanna Oppenheimer |
✓ |
|||||||
Vance K. Opperman |
✓ |
|||||||
Simon Paris |
✓ |
|||||||
Kim M. Rivera |
✓ |
|||||||
Barry Salzberg |
✓ |
|||||||
Peter J. Thomson |
✓ |
A Chairman of Woodbridge | ||||||
Wulf von Schimmelmann |
✓ |
|||||||
Total |
1 |
10 |
5 |
|||||
· |
Our authorized share capital consisted of an unlimited number of common shares, an unlimited number of preference shares, issuable in series, and a Thomson Reuters Founders Share; and |
· |
We had outstanding 486,288,134 common shares, 6,000,000 Series II preference shares and one Thomson Reuters Founders Share. |
| Common Shares (C$) |
Common Shares (US$) |
Series II Preference Shares (C$) |
||||||||||||||||||||||||||||||||||||||||||||||
High |
Low |
Closing |
Trading volume |
High |
Low |
Closing |
Trading volume |
High |
Low |
Closing |
Trading volume |
|||||||||||||||||||||||||||||||||||||
| 2021 |
||||||||||||||||||||||||||||||||||||||||||||||||
| January |
106.16 | 99.11 | 104.27 | 8,427,354 | 83.26 | 78.04 | 81.55 | 8,998,144 | 12.05 | 11.64 | 12.00 | 16,492 | ||||||||||||||||||||||||||||||||||||
| February |
113.41 | 101.02 | 110.70 | 8,497,013 | 89.97 | 80.16 | 86.89 | 10,642,433 | 14.00 | 11.91 | 13.51 | 57,060 | ||||||||||||||||||||||||||||||||||||
| March |
113.24 | 107.66 | 110.09 | 11,885,223 | 89.82 | 85.15 | 87.57 | 12,869,914 | 14.40 | 12.90 | 14.40 | 165,165 | ||||||||||||||||||||||||||||||||||||
| April |
116.22 | 110.30 | 113.99 | 5,185,599 | 93.19 | 87.67 | 92.71 | 6,579,908 | 14.47 | 13.76 | 14.31 | 152,089 | ||||||||||||||||||||||||||||||||||||
| May |
122.03 | 111.72 | 116.78 | 7,770,939 | 99.14 | 92.22 | 97.97 | 12,938,457 | 15.50 | 14.15 | 14.85 | 143,348 | ||||||||||||||||||||||||||||||||||||
| June |
123.17 | 116.82 | 123.13 | 6,343,188 | 99.42 | 96.74 | 99.32 | 6,975,816 | 15.45 | 14.02 | 14.74 | 46,646 | ||||||||||||||||||||||||||||||||||||
| July |
132.37 | 122.71 | 132.20 | 5,016,582 | 106.29 | 98.35 | 105.99 | 5,293,456 | 14.95 | 14.52 | 14.52 | 21,008 | ||||||||||||||||||||||||||||||||||||
| August |
148.93 | 131.37 | 147.42 | 7,119,217 | 118.00 | 104.60 | 116.86 | 11,960,029 | 14.75 | 13.86 | 13.90 | 67,100 | ||||||||||||||||||||||||||||||||||||
| September |
152.03 | 139.92 | 140.05 | 8,247,880 | 120.31 | 110.46 | 110.48 | 8,595,866 | 14.75 | 13.26 | 14.75 | 344,907 | ||||||||||||||||||||||||||||||||||||
| October |
149.49 | 136.25 | 148.87 | 6,848,188 | 120.75 | 108.26 | 120.33 | 9,988,802 | 15.45 | 14.30 | 15.45 | 112,928 | ||||||||||||||||||||||||||||||||||||
| November |
156.62 | 142.78 | 152.85 | 8,340,197 | 123.60 | 115.24 | 119.56 | 9,559,442 | 16.25 | 15.50 | 15.79 | 275,300 | ||||||||||||||||||||||||||||||||||||
| December |
155.94 | 146.84 | 151.27 | 7,647,830 | 122.25 | 113.41 | 119.62 | 7,487,286 | 16.00 | 15.30 | 15.60 | 33,909 | ||||||||||||||||||||||||||||||||||||
| 2022 |
||||||||||||||||||||||||||||||||||||||||||||||||
| January |
150.51 | 130.14 | 136.46 | 8,259,508 | 119.28 | 101.84 | 107.36 | 8,898,357 | 17,52 | 15.36 | 16.74 | 48,436 | ||||||||||||||||||||||||||||||||||||
| February |
138.50 | 123.08 | 128.16 | 9,028,168 | 109.15 | 95.94 | 101.05 | 11,231,521 | 16.98 | 16.25 | 16.25 | 27,019 | ||||||||||||||||||||||||||||||||||||
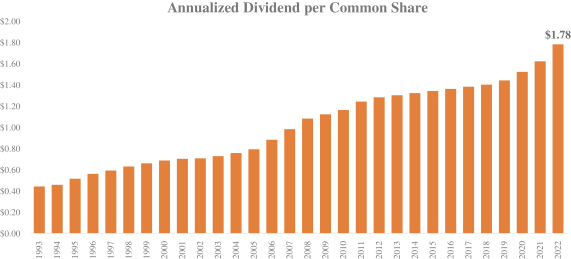
| Dividend Currency (Default) |
Dividend Currency (For Electing Holders) | |||
Common shares |
U.S. dollars | Canadian dollars British pounds sterling | ||
DIs (representing common shares) |
British pounds sterling | U.S. dollars Canadian dollars | ||
Series II preference shares |
Canadian dollars | N/A | ||
| Common Shares (US$) |
Series II Preference Shares (C$) | |||||||
| 2019 |
||||||||
| Q1 |
$ | 0.360000 | C$ | 0.170445 | ||||
| Q2 |
$ | 0.360000 | C$ | 0.172339 | ||||
| Q3 |
$ | 0.360000 | C$ | 0.174233 | ||||
| Q4 |
$ | 0.360000 | C$ | 0.174233 | ||||
| 2020 |
||||||||
| Q1 |
$ | 0.380000 | C$ | 0.168820 | ||||
| Q2 |
$ | 0.380000 | C$ | 0.106602 | ||||
| Q3 |
$ | 0.380000 | C$ | 0.107773 | ||||
| Q4 |
$ | 0.380000 | C$ | 0.107773 | ||||
| 2021 |
||||||||
| Q1 |
$ | 0.405000 | C$ | 0.105719 | ||||
| Q2 |
$ | 0.405000 | C$ | 0.106894 | ||||
| Q3 |
$ | 0.405000 | C$ | 0.108068 | ||||
| Q4 |
$ | 0.405000 | C$ | 0.108068 | ||||
| 2022 |
||||||||
| Q1 |
$ | 0.445000 | C$ | * | ||||
| *The first quarter 2022 dividend on our Series II preference shares had not yet been declared by our company as of the date of this annual report. | ||||||||
Type of Shares |
Country |
Transfer Agent/Registrar |
Location of Transfer Facilities | |||
Common shares |
Canada | Computershare Trust Company of Canada | Toronto; Montreal; Calgary; and Vancouver | |||
| United States | Computershare Trust Company N.A. | Canton, Massachusetts; Jersey City, New Jersey; and College Station, Texas | ||||
| United Kingdom | Computershare Investor Services PLC | Bristol, England | ||||
Depositary interests |
United Kingdom | Computershare Investor Services PLC | Bristol, England | |||
Series II preference shares |
Canada | Computershare Trust Company of Canada | Toronto | |||
· |
Thomson Reuters and Blackstone’s consortium are entitled to nominate three non-executive LSEG directors for as long as they hold at least 25% of the LSEG shares, two LSEG directors for as long as they hold at least 17.5% but less than 25% of the LSEG shares and one LSEG director for as long as they hold at least 10% but less than 17.5% of the LSEG shares. For so long as Thomson Reuters and Blackstone’s consortium are entitled to nominate three directors, one nominee will be a Thomson Reuters representative. |
· |
While Thomson Reuters expects that the LSEG transaction will be predominantly tax deferred, $627 million of tax became payable when the deal closed. As permitted under a lock-up exception within a transaction agreement, in March 2021, Thomson Reuters sold approximately 10.1 million of its LSEG shares to generate approximately $994 million of pre-tax total net proceeds. In 2021, we paid $223 million on the sale of these shares and used the remaining after-tax proceeds to pay the $627 million of tax on the LSEG transaction. |
· |
Subject to certain exceptions, Thomson Reuters and Blackstone’s consortium have otherwise agreed to be subject to a lock-up for our LSEG shares through January 29, 2023. In each of years three and four following closing (starting on January 30, 2023 and January 30, 2024, respectively), Thomson Reuters and Blackstone’s consortium will become entitled to sell in aggregate one-third of the LSEG shares issued. The lock-up arrangement will terminate on January 29, 2025. Once Thomson Reuters and Blackstone’s consortium are released from the lock-up, any disposals of LSEG shares will be subject to orderly marketing restrictions. |
· |
A standstill restriction applies to the entity that we jointly own with Blackstone’s consortium under which we (and the underlying investors) have agreed not to, among other matters, acquire further LSEG shares, or make a takeover offer for LSEG for designated time periods. |
· |
During a specified voting commitment period, the entity that we jointly own with Blackstone’s consortium has committed to vote its LSEG shares in line with the LSEG Board’s recommendation, subject to certain exceptions. |
· |
The entity that we jointly own with Blackstone’s consortium has agreed to a customary non-compete for three years after the closing. |
· |
Each of LSEG and the entity that we jointly own with Blackstone’s consortium has agreed to a customary non-solicit with respect to certain officers and senior executives of the other party for a period of two years after closing. A separate agreement contains the same customary non-solicit provisions with respect to certain officers and senior executives of LSEG, on the one hand, and each of Thomson Reuters, Blackstone, GIC and CPPIB, on the other hand, for two years after closing. |
· |
That Reuters shall at no time pass into the hands of any one interest, group or faction; |
· |
That the integrity, independence and freedom from bias of Thomson Reuters shall at all times be fully preserved; |
· |
That Reuters shall supply unbiased and reliable news services to newspapers, news agencies, broadcasters and other media subscribers and to businesses, governments, institutions, individuals and others with whom Reuters has or may have contracts; |
· |
That Thomson Reuters shall pay due regard to the many interests which it serves in addition to those of the media; and |
· |
That no effort shall be spared to expand, develop and adapt the news and other services and products of Thomson Reuters so as to maintain its leading position in the international news and information business. |
Name |
Country |
Director Since | ||
| Kim Williams (Chairman) |
Australia | 2016 | ||
| Steven Turnbull (Deputy Chairman) |
U.K. | 2013 | ||
| Beverly LW Sunn |
Hong Kong | 2012 | ||
| Lord Jay of Ewelme |
U.K. | 2013 | ||
| Vikram Singh Mehta |
India | 2013 | ||
| Lawton Fitt |
U.S. | 2014 | ||
| Nicholas Lemann |
U.S. | 2014 | ||
| Ory Okolloh |
Kenya | 2015 | ||
| President Tarja Halonen |
Finland | 2016 | ||
| Ronald G. Close |
Canada | 2016 | ||
| Linda Robinson |
U.K. | 2019 | ||
| Baroness Lucy Neville-Rolfe |
U.K. | 2019 | ||
| Pawel Dangel |
Poland | 2020 | ||
| Anne Bouverot |
France | 2021 | ||
| Aiko Doden |
Japan | 2021 | ||
| Murilo Portugal |
Brazil | 2022 |
· |
Consent for Sale of Reuters News |
· |
Business of Reuters News |
· |
Refinitiv Agreement |
· |
Brand License Agreements |
| Subsidiary |
Jurisdiction of Incorporation/Formation | |
| 3276838 Nova Scotia Company |
Nova Scotia, Canada | |
| Acritas Limited |
England | |
| Bedrijfsbeheer TRA B.V. |
The Netherlands | |
| Capital Confirmation Inc. |
Delaware, United States | |
| HighQ Solutions Limited |
England | |
| International Thomson Reuters BV |
The Netherlands | |
| LawBook Holdings BV |
The Netherlands | |
| LiveNote Technologies Limited |
England | |
| LN Holdings Limited |
Bermuda | |
| Netmaster Solutions Limited |
England | |
| Reuters News & Media Inc. |
Delaware, United States | |
| Reuters News & Media Limited |
England | |
| Thomson Reuters (Australia) Pty Limited |
Australia | |
| Thomson Reuters (Legal) Inc. |
Minnesota, United States | |
| Thomson Reuters (Professional) Australia Limited |
Australia | |
| Thomson Reuters (Professional) UK Limited |
England | |
| Thomson Reuters (Tax & Accounting) Inc. |
Texas, United States | |
| Thomson Reuters (TRI) Inc. |
Delaware, United States | |
| Thomson Reuters America Corporation |
Delaware, United States | |
| Thomson Reuters Brasil Conteúdo e Tecnologia Ltda. |
Brazil | |
| Thomson Reuters Canada Limited |
Ontario, Canada | |
| Thomson Reuters Enterprise Centre GmbH |
Switzerland | |
| Thomson Reuters Finance S.A. |
Luxembourg | |
| Thomson Reuters Group Limited |
England | |
| Thomson Reuters Holdco LLC |
Delaware, United States | |
| Thomson Reuters Holdings B.V. |
The Netherlands | |
| Thomson Reuters Holdings Inc. |
Delaware, United States | |
| Thomson Reuters Holdings S.A. |
Luxembourg | |
| Thomson Reuters Investment Holdings Limited |
England | |
| Thomson Reuters MX Servicios, S.A. de D.V. |
Mexico | |
| Thomson Reuters No. 4 Inc. |
Delaware, United States | |
| Thomson Reuters No. 5 LLC |
Delaware, United States | |
| Thomson Reuters No. 8 LLC |
Delaware, United States | |
| Thomson Reuters U.S. LLC |
Delaware, United States | |
| TR (2008) Limited |
England | |
| TR Finance LLC |
Delaware, United States | |
| TR Holdings Limited |
Bermuda | |
| TR U.S. Inc. |
Delaware, United States | |
| TTC (1994) Limited |
England | |
| TTC Holdings Limited |
Bermuda | |
| West Publishing Corporation |
Minnesota, United States |
Page/Document | ||||
| Item 1. |
Cover Page |
Cover | ||
| Item 2. |
Table of Contents |
1 | ||
| Item 3. |
Corporate Structure |
|||
| 3.1 Name, Address And Incorporation |
180 | |||
| 3.2 Intercorporate Relationships |
189 | |||
| Item 4. |
General Development of the Business |
|||
| 4.1 Three Year History |
3 | |||
| 4.2 Significant Acquisitions |
11-12, 38 | |||
| Item 5. |
Describe the Business |
|||
| 5.1 General |
2-16 | |||
| 5.2 Risk Factors |
17-30 | |||
| 5.3 Companies With Asset-Backed Securities Outstanding |
N/A | |||
| 5.4 Companies With Mineral Projects |
N/A | |||
| 5.5 Companies With Oil And Gas Activities |
N/A | |||
| Item 6. |
Dividends |
182-184 | ||
| Item 7. |
Description of Capital Structure |
|||
| 7.1 General Description Of Capital Structure |
180-181 | |||
| 7.2 Constraints |
N/A | |||
| 7.3 Ratings |
184 | |||
| Item 8. |
Market for Securities |
|||
| 8.1 Trading Price And Volume |
181 | |||
| 8.2 Prior Sales |
N/A | |||
| Item 9. |
Escrowed Securities and Securities Subject to Contractual Restriction on Transfer |
N/A | ||
| Item 10. |
Directors and Officers |
|||
| 10.1 Name, Occupation And Security Holding |
167-179 | |||
| 10.2 Cease Trade Orders, Bankruptcies, Penalties Or Sanctions |
190 | |||
| 10.3 Conflicts Of Interest |
N/A | |||
| Item 11. |
Promoters |
N/A |
Page/Document | ||||
| Item 12. |
Legal Proceedings and Regulatory Actions |
|||
| 12.1 Legal Proceedings |
58 | |||
| 12.2 Regulatory Actions |
58 | |||
| Item 13. |
Interest of Management and Others in Material Transactions |
63-64 | ||
| Item 14. |
Transfer Agents and Registrars |
183 | ||
| Item 15. |
Material Contracts |
186-188 | ||
| Item 16. |
Interest of Experts |
|||
| 16.1 Names Of Experts |
190 | |||
| 16.2 Interests Of Experts |
190 | |||
| Item 17. |
Additional Information |
190-191 | ||
| Item 18. |
Additional Disclosure for Companies Not Sending Information Circulars |
N/A |
Page/Document | ||
| Annual Information Form |
See AIF Table | |
| Audited Annual Financial Statements |
94-166 | |
| Management’s Discussion And Analysis |
31-93 | |
| Disclosure Controls And Procedures |
65 | |
| Internal Control Over Financial Reporting |
||
| a. Changes In Internal Controls Over Financial Reporting |
65 | |
| b. Management’s Report On Internal Control Over Financial Reporting |
94 | |
| c. Independent Auditor’s Report On Internal Control Over Financial Reporting |
95-96 | |
| Notice Pursuant To Regulation BTR |
N/A | |
| Audit Committee Financial Expert |
174 | |
| Code Of Ethics |
179 | |
| Principal Accountant Fees And Services |
175 | |
| Off-Balance Sheet Arrangements |
57 | |
| Material Cash Requirements |
51, 57 | |
| Identification Of The Audit Committee |
174 | |
| Disclosure Regarding Foreign Jurisdictions that Prevent Inspections |
N/A |
| THOMSON REUTERS 333 Bay Street, Suite 300 Toronto, Ontario M5H 2R2 Canada tel: +1 647 480 7000 www.tr.com |
|