
Annual Report 2024
March 6, 2025

Term |
Definition | |
AI |
Artificial intelligence | |
“Big 3” segments |
Our combined Legal Professionals, Corporates and Tax & Accounting Professionals segments | |
Blackstone’s consortium |
The Blackstone Group and its subsidiaries, and private equity funds affiliated with Blackstone | |
bp |
Basis points – one basis point is equal to 1/100th of 1%,“100bp” is equivalent to 1% | |
constant currency |
A non-IFRS measure derived by applying the same foreign currency exchange rates to the financial results of the current and equivalent prior-year period | |
EBITDA |
Earnings before interest, tax, depreciation and amortization | |
EPS |
Earnings per share | |
IFRS |
International Financial Reporting Standards | |
LSEG |
London Stock Exchange Group plc | |
ML |
Machine learning | |
n/a |
Not applicable | |
n/m |
Not meaningful | |
organic or organically |
A non-IFRS measure that represents changes in revenues of our existing businesses at constant currency. The metric excludes the distortive impacts of acquisitions and dispositions from not owning the business in both comparable periods | |
Woodbridge |
The Woodbridge Company Limited, our principal and controlling shareholder | |
YPL |
York Parent Limited, the entity that owned LSEG shares, which is jointly owned by our company and the Blackstone consortium. References to YPL also include its subsidiaries. | |
$ and US$ |
U.S. dollars | |

2 |
||||
| 2 | ||||
| 5 | ||||
| 5 | ||||
| 5 | ||||
| 6 | ||||
| 6 | ||||
| 6 | ||||
| 7 | ||||
| 10 | ||||
| 10 | ||||
| 10 | ||||
| 10 | ||||
| 10 | ||||
| 10 | ||||
| 11 | ||||
| 11 | ||||
| 11 | ||||
| 12 | ||||
| 13 | ||||
| 15 | ||||
16 |
||||
28 |
||||
81 |
||||
142 |
||||
| 142 | ||||
| 144 | ||||
| 147 | ||||
| 148 | ||||
| 149 | ||||
| 149 | ||||
| 150 | ||||
| 151 | ||||
| 151 | ||||
| 151 | ||||
152 |
||||
| 152 | ||||
| 153 | ||||
| 154 | ||||
| 155 | ||||
| 155 | ||||
| 156 | ||||
| 156 | ||||
| 159 | ||||
| 160 | ||||
| 160 | ||||
162 |
||||
| 162 | ||||
| 163 | ||||
 |
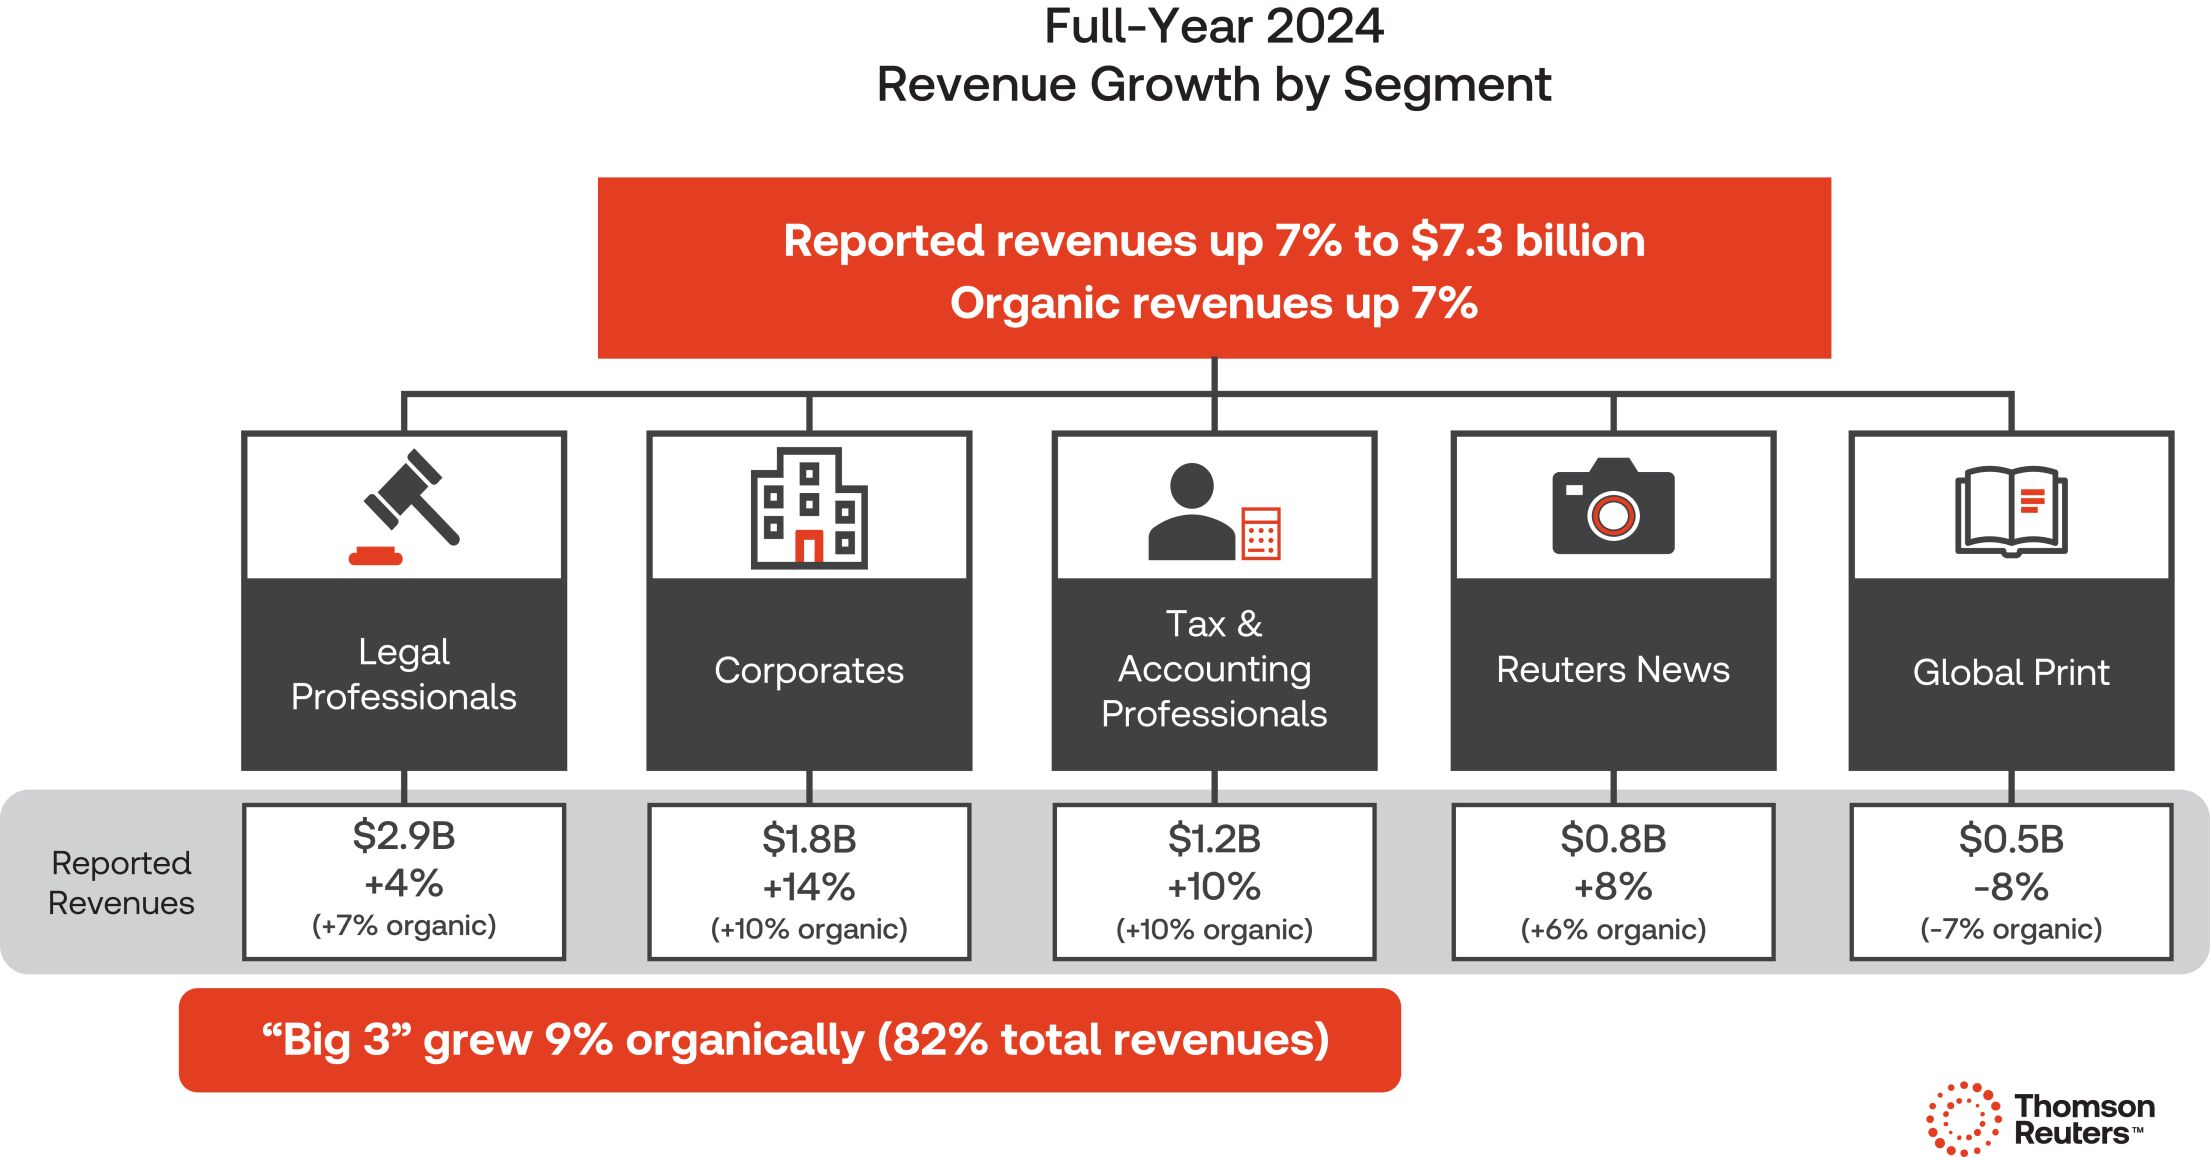
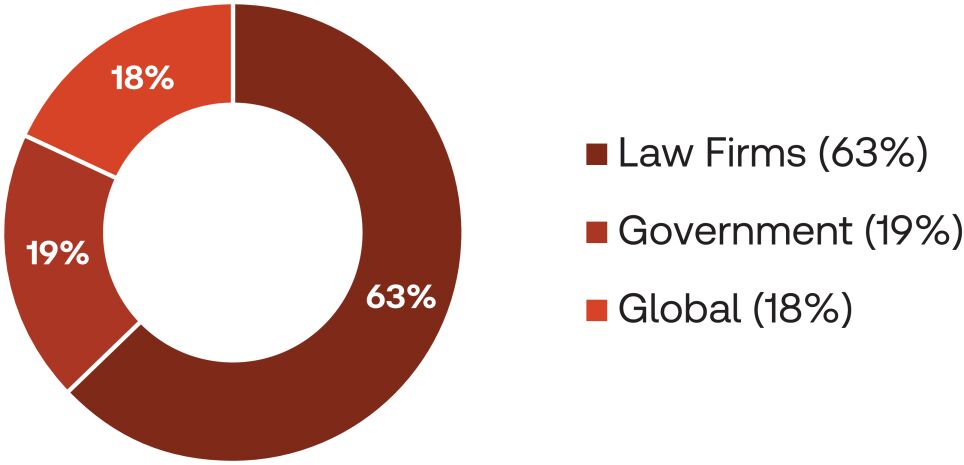
Legal Professionals Serves law firms and governments with research and workflow products powered by leading-edge technologies, including generative AI, focusing on intuitive legal research and integrated legal workflow solutions that combine content, tools and analytics. | |
 |
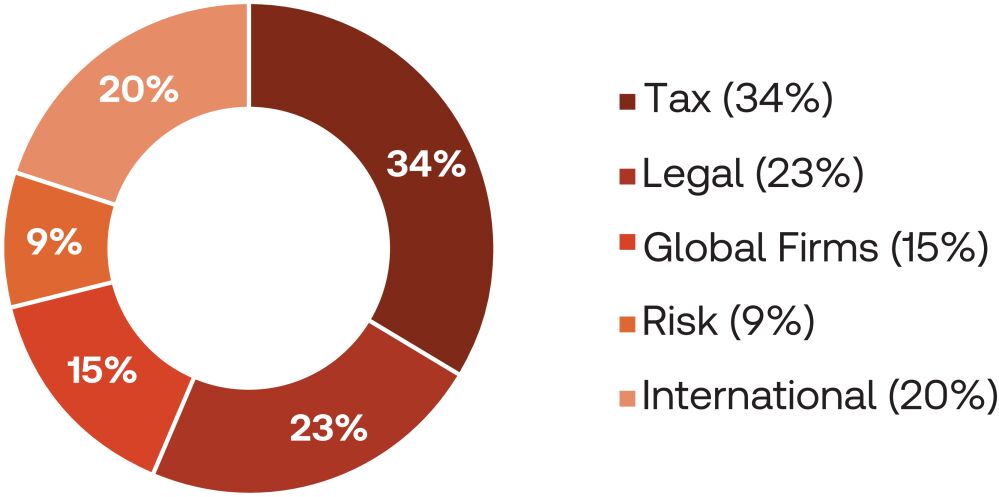
Corporates Serves corporations, ranging from small businesses to multinational organizations, including the seven largest global accounting firms, with our full suite of content-driven products, powered by leading-edge technologies, including generative AI, and integrated compliance workflow solutions to help them achieve their business outcomes. | |
 |
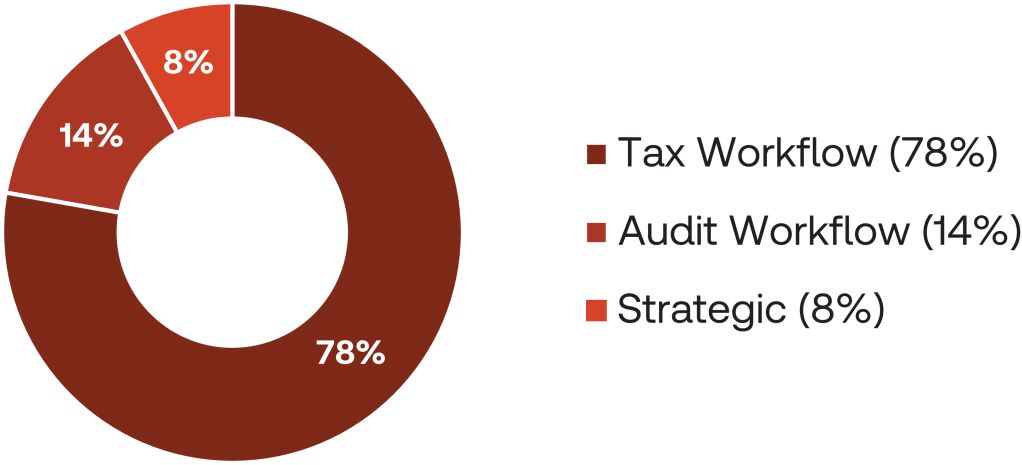
Tax & Accounting Professionals Serves tax, audit and accounting firms (other than the seven largest, which are served by our Corporates segment) with research and workflow products powered by leading-edge technologies, including generative AI. | |
 |
Reuters News Supplies business, financial and global news and data to the world’s media organizations, professionals and news consumers through Reuters News Agency, Reuters.com, Reuters Events, Thomson Reuters products and to financial firms exclusively via LSEG products. | |
 |
Global Print Provides legal and tax information primarily in print format to customers around the world and provides commercial printing services to a wide range of book publishers. |
| Page 2 | Thomson Reuters Annual Report 2024 |
Attractive Industry • Currently our “Big 3” segments operate in an estimated $28 billion market expected to grow between 8% and 11% over the next 5 years• Legal, Tax & Risk markets are prime for content-driven innovation |
Balanced and Diversified Leadership • A leader in key Legal Professionals, Corporates, Tax & Accounting Professionals and News segments• Resilient businesses, historically stable, through periods of macroeconomic uncertainty• Approximately 450,000 customers; largest customer is approximately 5% of revenues* |
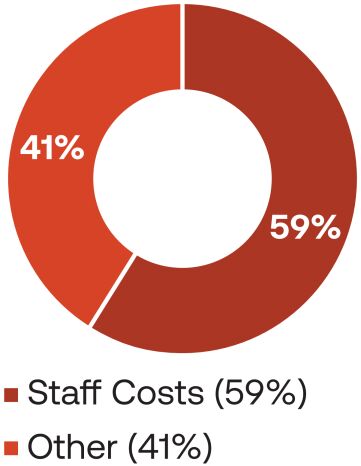
Attractive Business Model • 81% of revenues were recurring in 2024• Fixed cost model supports operating leverage as we grow• Strong and consistent cash generation capabilities |
Strong Competitive Positioning • Proprietary content plus data and human expertise combined with AI and ML are key differentiators• Products deeply embedded in customers’ daily workflows• 91% retention rate in 2024 |
Disciplined Financial Policies • Focused and incentivized on organic revenue growth and free cash flow growth• Balance investing in business and returning capital to shareholders• Committed to maintaining investment grade rating with stable capital structure• · Significant potential capital capacity affords optionality |
| * | The news agreement with the Data & Analytics business of LSEG. |
• |
2022 two-year Change Program (an initiative that focused on transforming our company from a holding company to an operating company and from a content provider into a content-driven technology company) was completed by the end of 2022. We achieved $540 million of annualized run-rate operating expense savings and made significant progress transforming Thomson Reuters into a more streamlined and scalable business that we believe has a strong foundation for sustainable future growth. In 2022, LSEG repurchased approximately 1.2 million ordinary shares from YPL under a buyback program announced by LSEG in August 2022. We received proceeds of $43 million, for approximately 0.5 million shares, related to our portion of the buyback. In 2022, we also launched Westlaw Precision, a new version of Westlaw designed to dramatically improve research speed and quality by enabling lawyers to target precisely what they are looking for. |
• |
2023 AI-based initiatives, including generative AI. In November 2023, we announced a series of generative AI initiatives designed to assist in the transformation of the legal profession. Most notably, the commercial releases of AI-Assisted Research on Westlaw Precision and CoCounsel Core AI Assistant for lawyers. In 2023, we further deepened our focus on content-enabled technology with the acquisitions of SurePrep, LLC, Imagen Ltd., Casetext, Inc., and the remaining interest in Westlaw Japan. |
• |
2024 AI-enabled tools to automate internal processes, including in the Reuters newsroom and our editorial and go-to-market |
Thomson Reuters Annual Report 2024 |
Page 3 |
| Page 4 | Thomson Reuters Annual Report 2024 |
• |
Continue evolving our transformative AI capabilities through ongoing product innovation and enhancements to our flagship products |
• |
Continue to roll out our AI assistant, CoCounsel, across our customer base |
• |
Maintain and build on our deep domain expertise and comprehensive collection of richly enhanced data and content |
• |
Further enhance our go-to-market |
• |
Extend our channel partnerships to integrate our products and services into broader ecosystems |
• |
Ongoing expansion of our international offerings |
• |
Accelerate our pace of execution to move fast and win in a competitive market |
• |
Leverage our significant capital capacity to fund organic investment and execute a balanced capital allocation approach including annual dividend growth, strategic acquisitions and shareholder returns |
Thomson Reuters Annual Report 2024 |
Page 5 |
| Page 6 | Thomson Reuters Annual Report 2024 |
Brand |
Type of Product/Service |
Legal Professionals |
Corporates |
Tax & Accounting Professionalss | ||||
Westlaw Westlaw Edge (U.S., U.K. & Canada) Westlaw Precision (U.S.) |
Legal, regulatory and compliance information-based products and services. Westlaw is our primary online legal research delivery platform. Westlaw offers authoritative content, powerful search functionality and research organization, team collaboration features and navigation tools to find and share specific points of law and search for analytical commentary. Westlaw employs proprietary, innovative technology including generative AI. Localized country-specific online legal research platforms are provided for Argentina, Australia, Brazil, Canada, Chile, Ireland, Japan, New Zealand, the United Kingdom, United States, Uruguay and other countries. Through Westlaw International and Westlaw Asia, we offer our region-based online legal research platforms to customers in markets where we do not offer a country-specific Westlaw service. |
 |
|
|||||
Practical Law Practical Law Practical Law Connect Practical Law Dynamic Tool Set |
Legal know-how, current awareness and workflow tools with embedded guidance from expert practitioners. Practice notes, standard documents, checklists and What’s Market tools cover a wide variety of practice areas such as commercial, corporate, labor and employment, intellectual property, finance and litigation. Practical Law currently has localized product offerings in the United Kingdom, United States, Canada and Australia. Through Practical Law Global and our local Practical Law offerings, we offer our online products and services to customers in markets where we do not have a fully localized service. |
|
|
|||||
CoCounsel CoCounsel Drafting |
Our professional-grade generative AI assistant that is trained by TR domain experts and leverages our TR proprietary content in generating answers to users across the legal, tax, risk & fraud, and media domains. This AI assistant also integrates functionality from other software products across the TR estate, allowing users to navigate seamlessly from one application to another. It also has the capability to integrate customer content directly to help ground the responses in customer proprietary content in addition to TR’s world-class content assets. |
|
|
| ||||
Thomson Reuters Annual Report 2024 |
Page 7 |
Brand |
Type of Product/Service |
Legal Professionals |
Corporates |
Tax & Accounting Professionalss | ||||
CLEAR CLEAR Risk Inform CLEAR ID Confirm CLEAR Adverse Media Sanctions PeopleMap |
Prevent fraud, detect risk and investigate crime with powerful online software. |
|
|
|||||
HighQ |
Cloud-based collaboration and workflow platform for the legal and regulatory market segment. |
|
|
|||||
Case Center |
Cloud-based evidence-sharing platform for sharing documents and multimedia between justice agencies for trial preparation and courtroom presentation. |
|
||||||
Fraud Analytics Fraud Detect ID Risk Analytics Case Tracking |
A suite of data and analytics solutions to help auditors, investigators and managers detect fraud, waste and abuse in healthcare and large government subsidy programs. |
|
|
|||||
Checkpoint Checkpoint Edge (U.S. & Canada) |
Integrated tax, audit and accounting research solution that delivers news, editorial insights, advisory tools, authoritative content and linked primary sources integrated throughout Thomson Reuters workflow productivity tools, applications and software. |
|
|
| ||||
Legal Tracker |
Online spend and matter management, e-billing, legal analytics services and document storage, search and retrieval. |
|
||||||
ONESOURCE |
Global cloud-based tax and trade solutions that reduce risk and regulatory complexity, improving the accuracy of a company’s entire tax or trade lifecycle. Integrating openly with existing technology and ecosystem solutions to manage direct and indirect tax compliance, indirect tax determination, statutory reporting, trust taxation, tax information reporting, tax planning, trade compliance, trade operations, trade special programs, trade regulatory content and overall data and process management. |
|
| |||||
Confirmation |
Cloud-based platform to automate the workflow of the confirmations process of an audit. Used by a global network of audit firms, banks and law firms to increase efficiency and reduce risk. |
|
| |||||
Pagero |
A provider of e-invoicing and continuous transaction controls compliance solutions for the global market. Pagero provides a Smart Business Network that connects buyers and sellers for automated, compliant and secure exchange of orders, invoices, payment instructions and other business documents. |
|
||||||
Dominio |
Accounting management and tax management software solutions for accounting firms and micro and small companies in Brazil. |
| ||||||
| Page 8 | Thomson Reuters Annual Report 2024 |
Brand |
Type of Product/Service |
Legal Professionals |
Corporates |
Tax & Accounting Professionalss | ||||
Cloud Audit Suite |
End-to-end |
| ||||||
UltraTax & CS Professional Suite |
Scalable, integrated suite of desktop and online software applications that encompass key aspects of a professional accounting firm’s operations, from collecting client data and preparing and filing tax returns to the overall management of the accounting practice. |
| ||||||
SafeSend |
Cloud-based software that automates assembly, review, e-signature and secure delivery of tax returns for individuals and entities. |
|
| |||||
SurePrep |
Software and services that automate tax preparation, supporting a digital tax workflow for accounting firms and their clients. Solutions TaxCaddy, 1040SCAN and SPbinder streamline the entire 1040 tax process for tax professionals and taxpayers. |
|
| |||||

Thomson Reuters Annual Report 2024 |
Page 9 |
| Page 10 | Thomson Reuters Annual Report 2024 |
Thomson Reuters Annual Report 2024 |
Page 11 |
By Region |
||||
Americas |
14,100 | |||
Asia Pacific |
8,300 | |||
Europe, Middle East and Africa (EMEA) |
4,000 | |||
By Unit |
||||
Legal Professionals |
700 | |||
Corporates |
1,900 | |||
Tax & Accounting Professionals |
1,300 | |||
Global Print |
800 | |||
Government |
650 | |||
Reuters News |
3,500 | |||
Product & Editorial |
3,300 | |||
Operations & Technology |
9,100 | |||
Corporate Center (Enabling Functions) |
1,300 | |||
Commercial Functions (1) |
1,200 | |||
Other (2) |
2,650 | |||
Thomson Reuters |
26,400 |
| (1) | Reflects employees in Marketing, Commercial Excellence and Strategy. |
| (2) | Reflects employees in our Latin America, Asia and Emerging Markets businesses. |
| Page 12 | Thomson Reuters Annual Report 2024 |
We post a Social Impact & ESG Report annually on our website, www.tr.com/social-impact-report, which summarizes our strategy, includes stories of progress and tracks performance, tying our efforts to our business strategy and commercial expertise. We encourage you to review the Social Impact & ESG Report to gain a better understanding of our accomplishments and practices in these areas. |
Thomson Reuters Annual Report 2024 |
Page 13 |
| Page 14 | Thomson Reuters Annual Report 2024 |

Facility |
Approx. Sq. Ft. |
Owned/Leased |
Principal Use | |||
610 Opperman Drive, Eagan, Minnesota, United States |
1,331,130 | Owned | Global Print operating facility | |||
2900 Ames Crossing Rd. Eagan, Minnesota, United States |
308,070 | Subleased | Legal Professionals operating facility | |||
6300 Interfirst Drive, Ann Arbor, Michigan, United States |
247,210 | Owned | Tax & Accounting Professionals operating facility | |||
Knowledge Court, Bangalore, India |
150,760 | Leased | Thomson Reuters shared services center | |||
5 Canada Square, London, United Kingdom |
133,400 | Subleased | Legal Professionals, Tax & Accounting Professionals and Reuters News operating facility | |||
Hyderabad, Bldg. 11 Madhapur, Hyderabad, India |
130,320 | Leased | Global shared service center | |||
19 Duncan Street Toronto, Ontario, Canada |
129,950 | Leased | Thomson Reuters headquarters | |||
Reforma Cuarzo 26 Paseo de la Reforma, Mexico City, Mexico |
118,200 | Leased | Global shared service center | |||
6160 Warren Parkway Frisco, TX, United States |
56,700 | Leased (1) |
Tax & Accounting Professionals and Corporates operating facility | |||
3 Times Square, New York, New York, United States |
46,100 | Owned/leased (2) |
Reuters News, Legal Professionals and Corporates operating facility | |||
Landis & Gyr 3, Zug, Switzerland |
31,870 | Leased | Enterprise Centre | |||
| (1) | New Tax & Accounting Professionals operating facility lease which replaces former Thomson Reuters-owned Carrolton TX facility. |
| (2) | The landlord (3XSQ Associates) is an entity owned by one of our subsidiaries and Rudin Times Square Associates LLC. 3XSQ Associates was formed to build and operate the 3 Times Square property. |
Thomson Reuters Annual Report 2024 |
Page 15 |
Risk Category |
Page |
|||
| 16 | ||||
| 20 | ||||
| 22 | ||||
| 23 | ||||
| 26 | ||||
| 27 | ||||
• |
We have seen an increase in well-funded new competitors focused on leveraging technological advancements, particularly generative AI, which has reduced barriers to entry. Some of these new entrants also differentiate themselves by being specialized, with a narrower focus than our company, and therefore may be able to adopt and implement newer technology faster than we can or at lower price points. |
• |
The application of generative AI technologies across public sources of free or relatively inexpensive information which is available online increases the competition risk and can diminish the perceived value of packaging this content for our target customers. |
• |
Some of our customers may independently develop products and services that compete with ours, including through the formation of partnerships or consortia. In addition, the growing awareness and understanding of use cases of transformative AI technologies may see us facing displacement from our own customers as they explore internal development of products and services that compete with our offerings. If customers become internally self-sufficient, demand for our products may be reduced. |
• |
Some of our competitors aggressively market their products as a lower cost alternative and offer price incentives to acquire new business. As some of our competitors offer products and services that may be viewed as more cost effective than ours or which may be seen as having greater functionality or performance than ours, the relative value of some of our products or services could be diminished. Competition may require us to reduce the price of some of our products and services (which may result in lower revenues) or make additional capital investments (which might result in lower profit margins). If we are unable or unwilling to reduce prices or make additional investments for some of our products and services in the future, we may lose customers and our financial results may be adversely affected. |
| Page 16 | Thomson Reuters Annual Report 2024 |
• |
Some of our principal competitors are established companies and firms that have substantial financial resources, recognized brands in certain product segments, or have more established positions in certain geographic regions than we do. Some larger companies that compete with us, such as enterprise resource planning companies, have large installed customer bases and may change or expand the focus of their business strategies to target our customers. |
• |
Law firms continue to be challenged by corporate counsels, which are seeking to keep more work in-house to deliver greater business value and insights internally, limit increases in billing rates and hours, and insist on increased transparency and efficiency from law firms. The emergence of generative AI as a tool in the legal space could also have significant impacts on law firms, such as their headcount, service delivery, and pricing. While generative AI introduces productivity and efficiency improvement opportunities for law firms, it also adds uncertainties to how law firms and legal professionals need to evolve with technology in the future. These trends could impact the future ability to spend by a select set of our law firm customers on our products which in turn could adversely affect our revenues as well as our cash flows. |
• |
Accounting firms are also adapting their business models related to service offerings, technology and pricing to address their clients’ evolving needs, priorities and expectations. Amid an ongoing talent shortage and increasing regulatory complexity, accounting firms continue to increase efficiency and automation while ongoing commoditization of tax and audit work is driving expansion into more profitable advisory services. |
• |
Corporations continue to be under pressure to become more efficient and drive margins which may put pressure on their ability to spend on our products. Their behavior is also closely linked to economic cycles with spending pressures tied to periods of economic downturn. Their focus on data privacy and cybersecurity continues to increase, requiring additional security reviews of our products and lengthening sales cycles. Corporations are also focusing on consolidating vendors which adds an additional dimension of competition. |
• |
Relative to our Reuters News business, the media sector continues to transform, with the traditional news agency market under pressure due to audiences’ shift to digital and streaming services. |
• |
We continue to expect revenue declines in our Global Print business as customers migrate to online delivery, which has been compounded by the influence of the virtual and hybrid work environment. |
Thomson Reuters Annual Report 2024 |
Page 17 |
| Page 18 | Thomson Reuters Annual Report 2024 |
Thomson Reuters Annual Report 2024 |
Page 19 |
• |
Cyber-attacks on our own and third-party information technology systems and infrastructure that we rely upon, including without limitation attacks using and incidents arising from computer viruses or other malware, distributed denial of service attacks, ransomware, data theft, phishing, social engineering, destructive attacks against information systems, and other attacks or incidents. This also includes those cyber-attacks and incidents that have in the past resulted in, and could in the future result in, the unauthorized access to, loss, manipulation, destruction of, or disclosure of personal and business information and/or the temporary or sustained unavailability of personal and business information, content, or information technology systems and infrastructure. As technologies like AI develop rapidly, malicious third parties are using these technologies to create new sophisticated attack methods that are increasingly automated, widespread and coordinated making these cyber-attacks more difficult to defend against; |
• |
The introduction or exploitation of vulnerabilities existing in our own and third-party information technology systems and infrastructure, including without limitation the products and services of our key brands and generative AI products and services, some of which may be undetected and only discovered after an extended period of time (including after exploitation) and after installation or integration by our company or our customers. This also includes vulnerabilities in purchased or licensed third-party software, adopted open source software, or in newly integrated technologies resulting from an acquisition or partnership; |
• |
Unauthorized access or attacks obtaining access to sensitive data, including compromise or manipulation of AI, ML and large language model (LLM) solutions embedded in product offerings; |
• |
Actions taken by individuals, groups of hackers, or sophisticated organizations, including without limitation nation-states, state-sponsored, state-aligned, or criminal organizations; |
• |
Attacks on, incidents affecting, or vulnerabilities in underlying cloud service provider environments, communication networks, services, and other technologies or infrastructure that support the Internet, power and water supply, and other utilities, most of which are not under our direct control or the control of our suppliers, partners or customers but can adversely affect our company and our business; |
• |
Insider threats that compromise our security measures, including without limitation malicious acts and human errors by employees, contractors, third-party providers, or others with access to our information technology systems and infrastructure; |
• |
Unauthorized persons could gain access to customer accounts if customers do not maintain effective security or access controls of their systems and software. Inadvertent exposure of data or access to our systems may also be caused by members of our workforce, including by their error or use of AI; and |
• |
Attacks against or incidents involving employee or contractor work from home or hybrid working environments (e.g., home networks, residential internet service providers) that allow an unauthorized party to gain remote or physical access to an employee’s or contractor’s devices or information used to access our information technology systems and infrastructure. |
| Page 20 | Thomson Reuters Annual Report 2024 |
Thomson Reuters Annual Report 2024 |
Page 21 |
• |
Difficulties in penetrating new markets due to established and entrenched competitors or unavailability of local companies for acquisition or joint venture partners or restrictions on foreign ownership; |
• |
Difficulties in developing products and services that are tailored to the needs of local customers; |
• |
Local lack of recognition of our brands or acceptance or knowledge of our products and services; |
• |
The impact of geopolitical tensions in local markets, including the impact of the Russian invasion of Ukraine and related government sanctions and the ongoing Israel-Hamas conflict, potential new tariffs and ongoing protectionism measures due to a decline in global alignment (including retaliatory measures related to the imposition of tariffs), changes in monetary policy, weaker global demand, supply chain disruptions, labour shortages and other events; |
• |
Challenges protecting the safety, security and wellbeing of staff in all locations; |
| Page 22 | Thomson Reuters Annual Report 2024 |
• |
Economic, political or social instability in local markets; |
• |
Exposure to possibly adverse governmental or regulatory actions in countries where we operate or conduct business; |
• |
Higher inflation rates and increased credit risk; |
• |
The impact of foreign currency fluctuations on prices charged to local customers, notably when there is strengthening of the U.S. dollar, and other controls, regulations and orders that might restrict our ability to repatriate cash or limit our ability to move or invest cash freely; |
• |
Difficulties hiring and retaining staff for foreign operations and protecting their safety, differing employee/employer relationships and workplace cultures, and other challenges caused by distance, language and cultural differences; |
• |
Reduced protection for intellectual property rights; |
• |
Changes in laws and policies affecting trade and investment in other jurisdictions; and |
• |
Managing compliance with local laws and regulations (notably related to data privacy, data use and data protection) and varying and sometimes conflicting laws and regulations across the countries in which we do business. |
Thomson Reuters Annual Report 2024 |
Page 23 |
• |
Impose limits on our collection, retention and use of certain kinds of information or data and our ability to communicate such information effectively to our customers; |
• |
Impose limits on our ability to develop and offer our products, services, and content in certain countries; |
• |
Frustrate or disrupt our ability to do business with certain customers and other third parties or collect or pay third parties, including without limitation as a result of newly issued sanctions and export/import restrictions; |
• |
Increase compliance complexity and add more compliance related costs; |
• |
Increase our cost of doing business or require us to change some of our existing products, services or business practices; and |
• |
Conflict or increase complexity on a global basis (such as the U.S. Foreign Corrupt Practices Act, the U.K. Bribery Act and similar laws). |
| Page 24 | Thomson Reuters Annual Report 2024 |
Thomson Reuters Annual Report 2024 |
Page 25 |
| Page 26 | Thomson Reuters Annual Report 2024 |
Thomson Reuters Annual Report 2024 |
Page 27 |
| Page 28 | Thomson Reuters Annual Report 2024 |
|
|
Legal Professionals Serves law firms and governments with research and workflow products powered by leading-edge technologies, including generative AI, focusing on intuitive legal research and integrated legal workflow solutions that combine content, tools and analytics. |
2024 Revenues 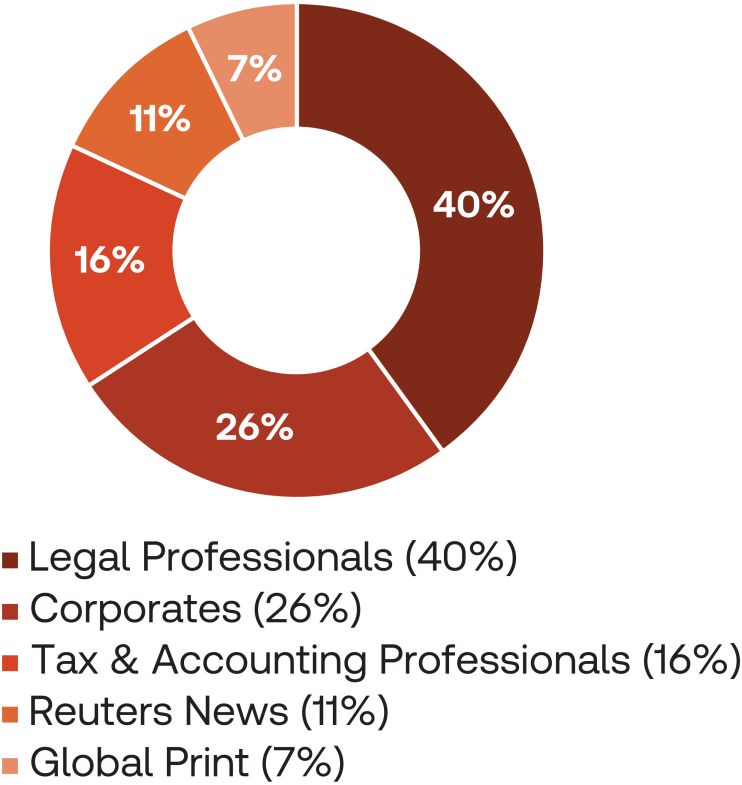 | ||
|
Corporates Serves corporations, ranging from small businesses to multinational organizations, including the seven largest global accounting firms, with our full suite of content-driven products, powered by leading-edge technologies, including generative AI, and integrated compliance workflow solutions to help them achieve their business outcomes. | |||
|
Tax & Accounting Professionals Serves tax, audit and accounting firms (other than the seven largest, which are served by our Corporates segment) with research and workflow products powered by leading-edge technologies, including generative AI. | |||
|
Reuters News Supplies business, financial and global news to the world’s media organizations, professionals and news consumers through Reuters News Agency, Reuters.com, Reuters Events, Thomson Reuters products and to financial firms exclusively via LSEG products. | |||
|
|
Global Print Provides legal and tax information primarily in print format to customers around the world and provides commercial printing services to a wide range of book publishers. |
Thomson Reuters Annual Report 2024 |
Page 29 |
Attractive Industry |
Balanced and Diversified Leadership |
Attractive Business Model |
Strong Competitive Positioning |
Disciplined Financial Policies | ||||
• Currently our “Big 3” segments operate in an estimated $28 billion market expected to grow between 8% and 11% over the next 5 years• Legal, Tax & Risk markets are prime for content-driven innovation |
• A leader in key Legal Professionals, Corporates, Tax & Accounting Professionals and News segments• Resilient businesses, historically stable, through periods of macroeconomic uncertainty• Approximately 450,000 customers; largest customer is approximately 5% of revenues* |
• 81% of revenues were recurring in 2024• Fixed cost model supports operating leverage as we grow• Strong and consistent cash generation capabilities |
• Proprietary content plus data and human expertise combined with AI and ML are key differentiators• Products deeply embedded in customers’ daily workflows• 91% retention rate in 2024 |
• Focused and incentivized on organic revenue growth and free cash flow growth• Balance investing in business and returning capital to shareholders• Committed to maintaining investment grade rating with stable capital structure• Significant potential capital capacity affords optionality | ||||
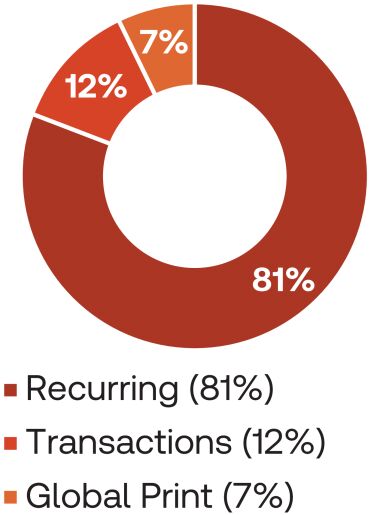 |
Revenues by type Recurring revenues one-off arrangements. However, as we generally recognize recurring revenues ratably over the contract term, there is a lag in realizing the impact of current sales or cancellations in our reported revenues. As a result, our revenues are typically slower to decline when economic conditions worsen, but slower to return to growth when economic activity improves, compared to other businesses that are not subscription-based.Transactions revenues Global Print revenues | |
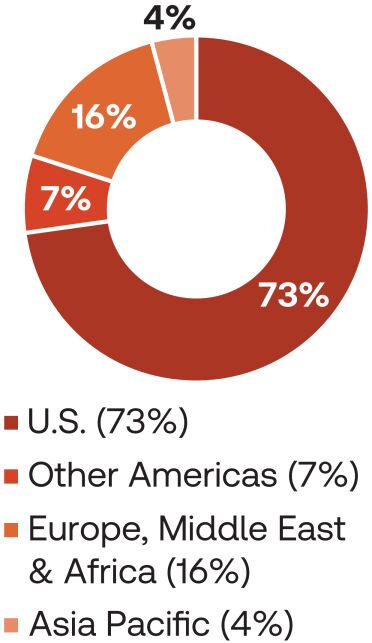 |
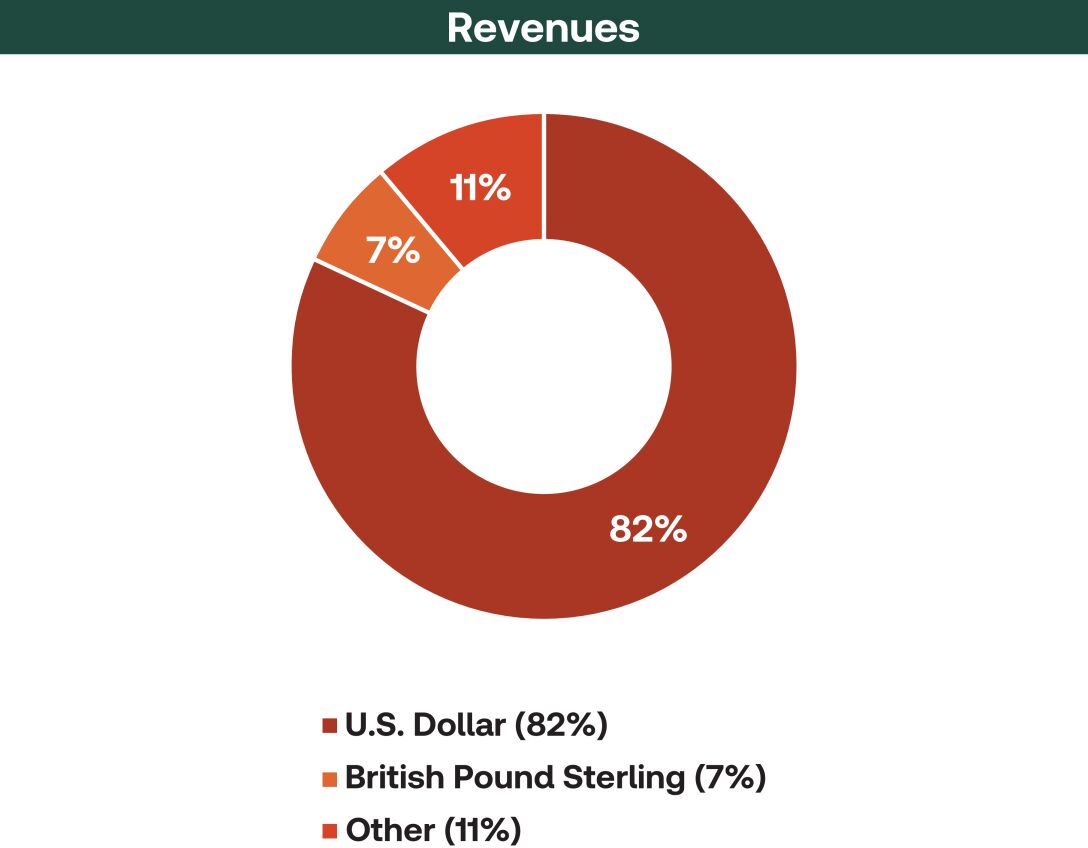
Revenues by geography In 2024, 73% of our revenues were U.S.-based. We also operate regional teams outside of the U.S., including in emerging markets, where we serve regional customers by either modifying existing products and services for their needs or developing specific products for the local market. Changes in foreign currency exchange rates relative to our business outside the U.S. may cause variation in our revenue performance from period to period. In 2024, however, changes in foreign exchange rates had a less than 1% negative impact on our revenue growth compared to the prior year. |
| Page 30 | Thomson Reuters Annual Report 2024 |
 |
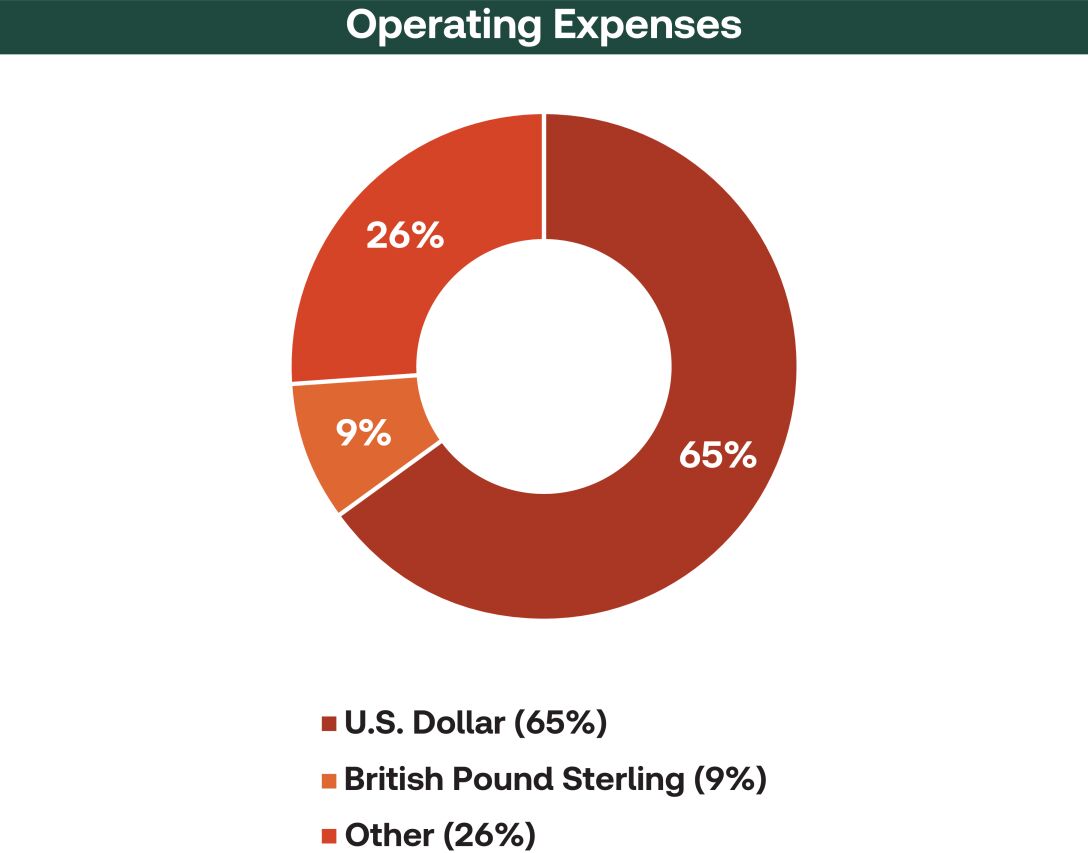
Operating Expenses Most of our expenses are fixed in the short-to-medium |
Thomson Reuters Annual Report 2024 |
Page 31 |
Total Thomson Reuters |
2024 Updated Outlook |
2024 Actual Performance (Before currency) (1) |
||||
Revenue growth |
~7.0% | 7.1% |
✓ | |||
Organic revenue growth ( 2) |
~7.0% |
7.1% |
✓ | |||
Adjusted EBITDA margin (2) |
~38% | 38.1% |
✓ | |||
Corporate costs |
$120-$130 million | $108 million |
✓ | |||
Free cash flow (2) |
~$1.8 billion | $1.8 billion |
✓ | |||
Accrued capital expenditures as a percentage of revenues (2) |
~8.5% | 8.4% |
✓ | |||
Depreciation and amortization of computer software |
$730-$750 million |
$732 million |
✓ | |||
Depreciation and amortization of internally developed software |
$580-$600 million |
$585 million |
✓ | |||
Amortization of acquired software |
~$150 million | $147 million |
✓ | |||
Interest expense |
$125-$145 million |
$125 million |
✓ | |||
Effective tax rate on adjusted earnings (2)(3) |
~18% |
17.9% |
✓ | |||
“Big 3” Segments (2) |
2024 Updated Outlook |
2024 Actual Performance (Before currency) (1) |
||||
Revenue growth |
~8.5% | 8.4% |
✓ | |||
Organic revenue growth |
~8.5% |
8.7% |
✓ | |||
Adjusted EBITDA margin |
~43% |
42.0% |
× | |||
Legend |
||||||
✓ - Achieved or exceeded updated outlook. × - Did not meet updated outlook. |
• |
January 2024: Pagero, a global leader in e-invoicing and indirect tax solutions; |
• |
January 2024: World Business Media Limited (The Insurer), a cross-platform and subscription-based provider of editorial coverage for the global P&C and specialty (re)insurance industry; |
• |
August 2024: Safe Sign Technologies, a U.K.-based startup that is developing legal-specific large language models; and |
• |
October 2024: Credere Technologies, Inc., doing business as Materia, a U.S.-based startup that specializes in the development of an agentic AI assistant for the tax, audit and accounting profession. |
| Page 32 | Thomson Reuters Annual Report 2024 |
• |
January 2023: SurePrep LLC, a provider of tax automation software and services; |
• |
July 2023: Imagen Ltd, a media asset management company now part of our Reuters News segment; and |
• |
August 2023: Casetext, a business that uses AI and ML to enable legal professionals to work more efficiently. |
Year ended December 31, |
||||||||||||||||
Change |
||||||||||||||||
(millions of U.S. dollars, except per share amounts and margins) |
2024 |
2023 |
Total |
Constant Currency |
||||||||||||
| IFRS Financial Measures | ||||||||||||||||
| Revenues | 7,258 |
6,794 | 7% | |||||||||||||
| Operating profit | 2,109 |
2,332 | (10%) | |||||||||||||
| Diluted EPS | $4.89 |
$5.80 | (16%) | |||||||||||||
Non-IFRS Financial Measures |
||||||||||||||||
| Revenues | 7,258 |
6,794 | 7% | 7% | ||||||||||||
Organic revenue growth |
7% |
|||||||||||||||
| Adjusted EBITDA | 2,779 |
2,678 | 4% | 4% | ||||||||||||
| Adjusted EBITDA margin | 38.2% |
39.3% | (110)bp | (130)bp | ||||||||||||
| Adjusted EBITDA less accrued capital expenditures | 2,170 |
2,146 | 1% | |||||||||||||
| Adjusted EBITDA less accrued capital expenditures margin | 29.9% |
31.5% | (160)bp | |||||||||||||
| Adjusted EPS | $3.77 |
$3.51 | 7% | 7% | ||||||||||||
| “Big 3” Segments | ||||||||||||||||
| Revenues | 5,931 |
5,485 | 8% | 8% | ||||||||||||
Organic revenue growth |
9% |
|||||||||||||||
| Adjusted EBITDA | 2,500 |
2,408 | 4% | 4% | ||||||||||||
| Adjusted EBITDA margin | 42.1% |
43.8% | (170)bp | (180)bp | ||||||||||||
Thomson Reuters Annual Report 2024 |
Page 33 |
Year ended December 31, | ||||||||||
Change | ||||||||||
(millions of U.S. dollars) |
2024 |
2023 |
Total |
Constant Currency |
Organic | |||||
Recurring revenues |
5,882 |
5,458 | 8% | 8% | 8% | |||||
Transactions revenues |
857 |
774 | 11% | 11% | 10% | |||||
Global Print revenues |
519 |
562 | (8%) | (7%) | (7%) | |||||
Revenues |
7,258 |
6,794 | 7% | 7% | 7% | |||||
Year ended December 31, |
||||||||||||||||
Change |
||||||||||||||||
(millions of U.S. dollars) |
2024 |
2023 |
Total |
Constant Currency |
||||||||||||
Operating expenses |
4,471 |
4,134 | 8% | 9% | ||||||||||||
Remove fair value adjustments (1) |
17 |
(2) | ||||||||||||||
Operating expenses excluding fair value adjustments |
4,488 |
4,132 | 9% | 9% | ||||||||||||
| (1) | Fair value adjustments primarily represent gains or losses due to changes in foreign currency exchange rates on intercompany balances that arise in the ordinary course of business. |
| Page 34 | Thomson Reuters Annual Report 2024 |
Year ended December 31, | ||||||
(millions of U.S. dollars) |
2024 |
2023 |
Change | |||
Depreciation |
113 |
116 | (2%) | |||
Amortization of computer software |
||||||
Internally developed |
471 |
440 | 7% | |||
Acquisition related |
147 |
72 | 104% | |||
Total amortization of computer software |
618 |
512 | 21% | |||
Amortization of other identifiable intangible assets |
91 |
97 | (6%) | |||
• |
Depreciation decreased primarily due to assets acquired in previous years becoming fully depreciated. |
• |
Total amortization of computer software increased primarily due to acquisitions, and to a lesser extent, internal product development. |
• |
Amortization of other identifiable intangible assets decreased as the completion of amortization of assets acquired in previous years more than offset expenses associated with recent acquisitions. |
Year ended December 31, |
||||||||
(millions of U.S. dollars) |
2024 |
|||||||
Other operating gains, net |
144 |
397 | ||||||
Year ended December 31, | ||||||
(millions of U.S. dollars) |
2024 |
2023 |
Change | |||
Net interest expense |
125 |
152 | (18%) | |||
Year ended December 31, |
||||||||
(millions of U.S. dollars) |
2024 |
2023 |
||||||
Other finance income (costs) |
45 |
(192 | ) | |||||
Thomson Reuters Annual Report 2024 |
Page 35 |
Year ended December 31, |
||||||||
(millions of U.S. dollars) |
2024 |
|||||||
YPL |
68 |
1,099 | ||||||
Other equity method investments |
(28) |
(24) | ||||||
Share of post-tax earnings in equity method investments |
40 |
1,075 | ||||||
Year ended December 31, |
||||||||
(millions of U.S. dollars) |
2024 (1) |
2023 |
||||||
(Decrease) increase in LSEG share price |
(86) |
785 | ||||||
Foreign exchange (losses) gains on LSEG shares |
(3) |
251 | ||||||
Dividend income |
6 |
58 | ||||||
Loss from forward contract |
- |
(77) | ||||||
Gain (loss) from call options |
22 |
(15) | ||||||
Historical excluded equity adjustment (2) |
129 |
97 | ||||||
YPL – Share of post-tax earnings in equity method investments |
68 |
1,099 | ||||||
| (1) | Activity through May 2024, when the investment was fully divested. |
| (2) | Represents income from the recognition of the remaining cumulative impact of equity transactions that were excluded from our investment in YPL. |
Year ended December 31, |
||||||||
(millions of U.S. dollars) |
2024 |
2023 |
||||||
Tax (benefit) expense |
(123 |
) |
417 | |||||
| Page 36 | Thomson Reuters Annual Report 2024 |
Year ended December 31, |
||||||||
(millions of U.S. dollars) |
2024 |
|||||||
(Benefit) expense |
||||||||
Tax items impacting comparability: |
||||||||
| Recognition of deferred tax asset (1) |
(468) |
- | ||||||
| Discrete changes to uncertain tax positions (2) |
(15) |
(61) | ||||||
| Corporate tax laws and rates (3) |
7 |
(100) | ||||||
| Deferred tax adjustments (4) |
(2) |
(11) | ||||||
| Subtotal | (478) |
(172) | ||||||
Tax related to: |
||||||||
| Amortization of acquired computer software | (33) |
(17) | ||||||
| Amortization of other identifiable intangible assets | (22) |
(22) | ||||||
| Other operating gains, net | 56 |
81 | ||||||
| Other finance income (costs) | (19) |
(31) | ||||||
| Share of post-tax earnings in equity method investments |
7 |
253 | ||||||
| Other items | 2 |
1 | ||||||
| Subtotal | (9) |
265 | ||||||
Total |
(487) |
93 | ||||||
| (1) | Relates to new tax legislation enacted in Canada. |
| (2) | In 2024, relates to the release of tax reserves that are no longer required due to the settlement of a tax dispute. In 2023, relates to tax reserves no longer required due to the expiration of statutes of limitation. |
| (3) | Relates primarily to adjustments to deferred tax balances due to changes in the applicable statutory tax rate in a jurisdiction outside of the U.S. and adjustments to deferred tax balances due to changes in effective state tax rates. |
| (4) | Relates primarily to adjustments to deferred tax assets attributable to a non-U.S. subsidiary. |
Year ended December 31, |
||||||||
(millions of U.S. dollars) |
2024 |
|||||||
Tax (benefit) expense |
(123) |
417 | ||||||
| Remove: Items from above impacting comparability | 487 |
(93) | ||||||
Total tax expense on adjusted earnings |
364 |
324 | ||||||
Year ended December 31, |
||||||||
Income taxes paid (millions of U.S. dollars) |
2024 |
|||||||
Operating activities – continuing operations |
234 |
163 | ||||||
Investing activities – continuing operations |
317 |
705 | ||||||
Investing activities – discontinued operations |
- |
1 | ||||||
Total income taxes paid |
551 |
869 | ||||||
Thomson Reuters Annual Report 2024 |
Page 37 |
Year ended December 31, |
||||||||
(millions of U.S. dollars) |
2024 |
|||||||
Earnings from discontinued operations, net of tax |
15 |
49 | ||||||
Year ended December 31, |
||||||||||||||||
Change |
||||||||||||||||
(millions of U.S. dollars, except per share amounts) |
2024 |
2023 |
Total |
Constant Currency |
||||||||||||
IFRS Financial Measures |
||||||||||||||||
| Net earnings | 2,207 |
2,695 | (18%) | |||||||||||||
| Diluted EPS | $4.89 |
$5.80 | (16%) | |||||||||||||
Non- IFRS Financial Measures |
||||||||||||||||
| Adjusted earnings | 1,701 |
1,629 | 4% | |||||||||||||
| Adjusted EPS | $3.77 |
$3.51 | 7% | 7% | ||||||||||||
Year ended December 31, | ||||||||||
Change | ||||||||||
(millions of U.S. dollars, except margins) |
2024 |
2023 |
Total |
Constant Currency |
Organic | |||||
Recurring revenues |
2,828 |
2,674 | 6% | 6% | 8% | |||||
Transactions revenues |
94 |
133 | (29%) | (28%) | (2%) | |||||
Revenues |
2,922 |
2,807 | 4% | 4% | 7% | |||||
Segment adjusted EBITDA |
1,302 |
1,299 | - | - | ||||||
Segment adjusted EBITDA margin |
44.6% |
46.2% | (160)bp | (180)bp | ||||||
| Page 38 | Thomson Reuters Annual Report 2024 |
Year ended December 31, | ||||||||||
Change | ||||||||||
(millions of U.S. dollars, except margins) |
2024 |
2023 |
Total |
Constant Currency |
Organic | |||||
Recurring revenues |
1,543 |
1,373 | 12% | 13% | 10% | |||||
Transactions revenues |
301 |
247 | 22% | 22% | 11% | |||||
Revenues |
1,844 |
1,620 | 14% | 14% | 10% | |||||
Segment adjusted EBITDA |
671 |
619 | 8% | 8% | ||||||
Segment adjusted EBITDA margin |
36.3% |
38.1% | (180)bp | (220)bp | ||||||
Year ended December 31, | ||||||||||
Change | ||||||||||
(millions of U.S. dollars, except margins) |
2024 |
2023 |
Total |
Constant Currency |
Organic | |||||
Recurring revenues |
867 |
808 | 7% | 9% | 9% | |||||
Transactions revenues |
298 |
250 | 19% | 19% | 14% | |||||
Revenues |
1,165 |
1,058 | 10% | 11% | 10% | |||||
Segment adjusted EBITDA |
527 |
490 | 8% | 9% | ||||||
Segment adjusted EBITDA margin |
45.2% |
45.8% | (60)bp | (50)bp | ||||||
Thomson Reuters Annual Report 2024 |
Page 39 |
Year ended December 31, | ||||||||||
Change | ||||||||||
(millions of U.S. dollars, except margins) |
2024 |
2023 |
Total |
Constant Currency |
Organic | |||||
Recurring revenues |
668 |
625 | 7% | 7% | 5% | |||||
Transactions revenues |
164 |
144 | 14% | 13% | 9% | |||||
Revenues |
832 |
769 | 8% | 8% | 6% | |||||
Segment adjusted EBITDA |
196 |
172 | 14% | 16% | ||||||
Segment adjusted EBITDA margin |
23.6% |
22.4% | 120bp | 150bp | ||||||
Year ended December 31, | ||||||||||
Change | ||||||||||
(millions of U.S. dollars, except margins) |
2024 |
2023 |
Total |
Constant Currency |
Organic | |||||
Revenues |
519 |
562 | (8%) | (7%) | (7%) | |||||
Segment adjusted EBITDA |
188 |
213 | (12%) | (12%) | ||||||
Segment adjusted EBITDA margin |
36.2% |
38.0% | (180)bp | (180)bp | ||||||
Year ended December 31, |
||||||||
(millions of U.S. dollars) |
2024 |
2023 |
||||||
Corporate costs |
105 |
115 | ||||||
| Page 40 | Thomson Reuters Annual Report 2024 |
Three months ended December 31, | ||||||||
Change | ||||||||
(millions of U.S. dollars, except per share amounts and margins) |
2024 |
2023 |
Total |
Constant Currency | ||||
IFRS Financial Measures |
||||||||
| Revenues | 1,909 |
1,815 | 5% | |||||
| Operating profit | 722 |
558 | 29% | |||||
| Net earnings | 587 |
678 | (14%) | |||||
| Diluted EPS | $1.30 |
$1.49 | (13%) | |||||
| Net cash provided by operating activities | 564 |
705 | (20%) | |||||
| Net cash used in investing activities | (69) |
(223) | (71%) | |||||
| Net cash used in financing activities | (252) |
(1,702) | (85%) | |||||
Non-IFRS Financial Measures(1) |
||||||||
| Revenues | 1,909 |
1,815 | 5% | 5% | ||||
| Organic revenue growth |
5% | |||||||
| Adjusted EBITDA | 718 |
707 | 2% | 1% | ||||
| Adjusted EBITDA margin | 37.6% |
38.9% | (130)bp | (160)bp | ||||
| Adjusted EBITDA less accrued capital expenditures | 546 |
554 | (1%) | |||||
| Adjusted EBITDA less accrued capital expenditures margin | 28.6% |
30.5% | (190)bp | |||||
| Adjusted earnings | 454 |
446 | 2% | |||||
| Adjusted EPS | $1.01 |
$0.98 | 3% | 1% | ||||
| Free cash flow | 425 |
613 | (31%) | |||||
| “Big 3” Segments | ||||||||
| Revenues | 1,553 |
1,446 | 7% | 7% | ||||
| Organic revenue growth | 8% | |||||||
| Adjusted EBITDA | 648 |
624 | 4% | 3% | ||||
| Adjusted EBITDA margin | 41.7% |
43.1% | (140)bp | (190)bp | ||||
| (1) | Refer to Appendices A and B of this management’s discussion and analysis for additional information and reconciliations of our non-IFRS financial measures to the most directly comparable IFRS financial measures. |
Thomson Reuters Annual Report 2024 |
Page 41 |
| Page 42 | Thomson Reuters Annual Report 2024 |
Three months ended December 31, | ||||||||||
Change | ||||||||||
(millions of U.S. dollars, except margins) |
2024 |
2023 |
Total |
Constant Currency (1) |
Organic (1) | |||||
Revenues |
||||||||||
| Legal Professionals | 729 |
700 | 4% | 4% | 7% | |||||
| Corporates | 458 |
402 | 14% | 15% | 10% | |||||
| Tax & Accounting Professionals | 366 |
344 | 6% | 7% | 7% | |||||
| “Big 3” Segments Combined (1) |
1,553 |
1,446 | 7% | 7% | 8% | |||||
| Reuters News | 218 |
220 | (1%) | (1%) | (3%) | |||||
| Global Print | 144 |
154 | (6%) | (6%) | (6%) | |||||
| Eliminations/ Rounding | (6) |
(5) | ||||||||
Revenues |
1,909 |
1,815 | 5% | 5% | 5% | |||||
Adjusted EBITDA (1) |
||||||||||
| Legal Professionals | 299 |
298 | - | (1%) | ||||||
| Corporates | 153 |
138 | 11% | 8% | ||||||
| Tax & Accounting Professionals | 196 |
188 | 4% | 5% | ||||||
| “Big 3” Segments Combined | 648 |
624 | 4% | 3% | ||||||
| Reuters News | 45 |
61 | (26%) | (26%) | ||||||
| Global Print | 55 |
55 | (1%) | (1%) | ||||||
| Corporate costs | (30) |
(33) | ||||||||
Adjusted EBITDA |
718 |
707 | 2% | 1% | ||||||
Adjusted EBITDA margin (1) |
||||||||||
| Legal Professionals | 41.0% |
42.5% | (150)bp | (200)bp | ||||||
| Corporates | 33.5% |
34.5% | (100)bp | (190)bp | ||||||
| Tax & Accounting Professionals | 53.4% |
54.6% | (120)bp | (90)bp | ||||||
| “Big 3” Segments Combined | 41.7% |
43.1% | (140)bp | (190)bp | ||||||
| Reuters News | 20.8% |
27.9% | (710)bp | (670)bp | ||||||
| Global Print | 38.2% |
36.4% | 180bp | 190bp | ||||||
Adjusted EBITDA margin |
37.6% |
38.9% | (130)bp | (160)bp | ||||||
| (1) | Refer to Appendices A and B of this management’s discussion and analysis for additional information and reconciliations of our non-IFRS financial measures to the most directly comparable IFRS financial measures. |
Thomson Reuters Annual Report 2024 |
Page 43 |
| Page 44 | Thomson Reuters Annual Report 2024 |
Year ended December 31, | ||||||
(millions of U.S. dollars) |
2024 |
2023 |
$ Change | |||
Net cash provided by operating activities |
2,457 |
2,341 | 116 | |||
Net cash provided by investing activities |
680 |
3,513 | (2,833) | |||
Net cash used in financing activities |
(2,459) |
(5,626) | 3,167 | |||
Translation adjustments |
(8) |
1 | (9) | |||
Increase in cash and cash equivalents |
670 |
229 | 441 | |||
Cash and cash equivalents at beginning of period |
1,298 |
1,069 | 229 | |||
Cash and cash equivalents at end of period |
1,968 |
1,298 | 670 | |||
Non-IFRS Financial Measure(1): |
||||||
Free cash flow |
1,828 |
1,871 | (43) | |||
| (1) | Refer to Appendices A and B of this management’s discussion and analysis for additional information and reconciliations of our non-IFRS financial measures to the most directly comparable IFRS financial measures. |
Thomson Reuters Annual Report 2024 |
Page 45 |
• |
Commercial paper program. |
• |
Credit facility. |
We guarantee borrowings by our subsidiaries under the credit facility. We must also maintain a ratio of net debt as defined in the credit agreement (total debt after swaps less cash and cash equivalents) as of the last day of each fiscal quarter to EBITDA as defined in the credit agreement (earnings before interest, income taxes, depreciation and amortization and other modifications described in the credit agreement) for the last four quarters ended of not more than 4.5:1. If we complete an acquisition with a purchase price of over $500 million, we may elect, subject to notification, to temporarily increase the ratio of net debt to EBITDA to 5.0:1 at the end of the quarter within which the transaction closed and for each of the three immediately following fiscal quarters. At the end of that period, the ratio would revert to 4.5:1. As of December 31, 2024, we complied with this covenant as our ratio of net debt to EBITDA, as calculated under the terms of our syndicated credit facility, was 0.3:1. |
• |
Long-term debt |
| Page 46 | Thomson Reuters Annual Report 2024 |
In June 2024, we filed a new base shelf prospectus pursuant to which Thomson Reuters Corporation (TRC) and one of its U.S. subsidiaries, TR Finance LLC (TR Finance), may collectively issue up to $3.0 billion of unsecured debt securities from time to time through July 19, 2026. Any debt securities issued by TR Finance LLC will be fully and unconditionally guaranteed on an unsecured basis by TRC and three U.S. subsidiary guarantors, which are also indirect 100%-owned and consolidated subsidiaries of TRC. Except for TR Finance and the subsidiary guarantors, none of Thomson Reuters Corporation’s other subsidiaries have guaranteed or would otherwise become obligated with respect to any issued TR Finance debt securities. As of December 31, 2024, neither TRC nor TR Finance have issued any debt securities under the prospectus. Please refer to Appendix G of this management’s discussion and analysis for condensed consolidating financial information of the Company, including TR Finance and the subsidiary guarantors. |
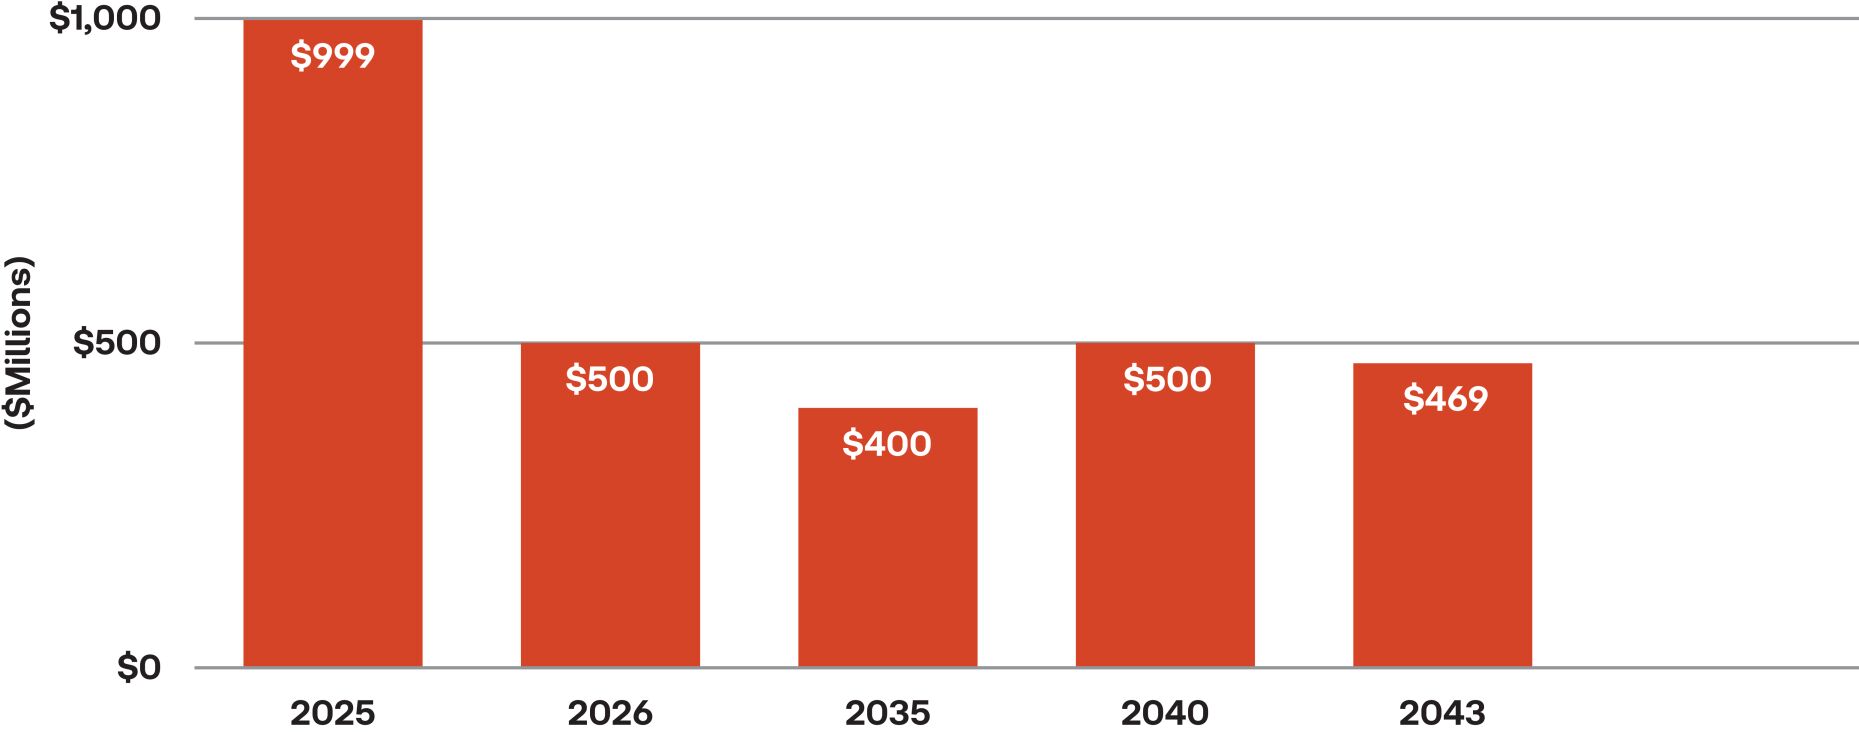
On February 11, 2025, we commenced offers to exchange any or all validly tendered and accepted notes of TRC of the series of notes below for new notes issued by TR Finance, an indirect 100% owned U.S. subsidiary of TRC in order to optimize the Thomson Reuters group capital structure, align revenue generation to indebtedness, and give existing holders of the existing notes the option to receive notes issued by TR Finance with the same financial terms and substantially similar covenants as the applicable series of the existing notes: |
• |
$500 million 3.35% Notes due 2026; |
• |
$500 million 5.85% Notes due 2040; |
• |
$119 million 4.50% Notes due 2043; |
• |
$350 million 5.65% Notes due 2043; and |
• |
$400 million 5.50% Debentures due 2035. |
The exchange offers will not have a significant impact on our annual interest expense and will not change our debt maturity profile. Following completion of the exchange offers, we plan to update our base shelf prospectus to reflect the finalized terms of the TR Finance indenture and the guarantee of the TRC notes by the three U.S. subsidiary guarantors. |
• |
Credit ratings. |
In May 2024, S&P Global Ratings upgraded our long-term debt to BBB+ from BBB. |
The following table sets forth the credit ratings from rating agencies in respect of our outstanding securities as of the date of this management’s discussion and analysis: |
Moody’s |
S&P Global Ratings |
DBRS Limited |
Fitch | |||||
Long-term debt |
Baa1 | BBB+ | BBB (high) | BBB+ | ||||
Commercial paper |
P-2 |
A-2 |
R-2 (high) |
F1 | ||||
Trend/Outlook |
Stable | Stable | Stable | Stable | ||||
These credit ratings are not recommendations to purchase, hold, or sell securities and do not address the market price or suitability of a specific security for a particular investor. Credit ratings may not reflect the potential impact of all risks on the value of securities. We cannot ensure that our credit ratings will not be lowered in the future or that rating agencies will not issue adverse commentaries regarding our securities. |
• |
Dividends. |
Details of dividends declared per common share and dividends paid on common shares are as follows: |
Year ended December 31, | ||||
(millions of U.S. dollars, except per share amounts) |
2024 |
2023 | ||
Dividends declared per common share |
$2.16 |
$1.96 | ||
Dividends declared |
973 |
908 | ||
Dividends reinvested |
(29) |
(21) | ||
Dividends paid |
944 |
887 | ||
In February 2025, we announced a 10% or $0.22 per share increase in the annualized dividend rate to $2.38 per common share (beginning with the common share dividend that we plan to pay in March 2025). See the “Subsequent Events” section of this management’s discussion and analysis for additional information. |
Thomson Reuters Annual Report 2024 |
Page 47 |
• |
Share repurchases - Normal Course Issuer Bid (NCIB). |
Year ended December 31, | ||||
2024 |
2023 | |||
Share repurchases (millions of U.S. dollars) |
639 |
1,079 | ||
Shares repurchased (number in millions) |
4.1 |
8.6 | ||
Share repurchases – average price per share |
$156.92 |
$125.07 | ||
From time to time when we do not possess material nonpublic information about ourselves or our securities, we may enter into a pre-defined plan with our broker to allow for the repurchase of shares at times when we ordinarily would not be active in the market due to our own internal trading blackout periods, insider trading rules or otherwise. Any such plans entered into with our broker will be adopted in accordance with applicable Canadian securities laws and the requirements of Rule 10b5-1 under the U.S. Securities Exchange Act of 1934, as amended. |
• |
Return of capital and share consolidation. pre-consolidated share for 0.963957 post-consolidated shares. Shareholders who were subject to income tax in a jurisdiction other than Canada were given the opportunity to opt-out of the transaction. The share consolidation was proportional to the cash distribution and the share consolidation ratio was based on the volume weighted-average trading price of the shares on the New York Stock Exchange (NYSE), the stock exchange on which our shares were listed at the time (see the “Subsequent Events” section of this management’s discussion and analysis for additional information) for the five-trading day period immediately preceding June 23, 2023, the effective date for the return of capital transaction. Woodbridge, our principal shareholder, participated in this transaction. As a result of the share consolidation, our company’s outstanding common shares were reduced by 15.8 million common shares. |
December 31, | ||||
(millions of U.S. dollars) |
2024 |
2023 | ||
Net debt (1) |
1,156 |
2,207 | ||
Leverage ratio of net debt to adjusted EBITDA: |
||||
Adjusted EBITDA (1) |
2,779 |
2,678 | ||
Net debt/adjusted EBITDA (1) |
0.4:1 |
0.8:1 | ||
| (1) | Represent non-IFRS financial measures. Refer to Appendices A and B of this management’s discussion and analysis for additional information and reconciliations of our non-IFRS financial measures to the most directly comparable IFRS financial measures. |
| Page 48 | Thomson Reuters Annual Report 2024 |
 |
 |
Thomson Reuters Annual Report 2024 |
Page 49 |
(millions of U.S. dollars) |
2025 |
2026 |
2027 |
2028 |
2029 |
Thereafter |
Total | |||||||
Notes/debentures (1) |
973 | 500 | - | - | - | 1,369 | 2,842 | |||||||
Interest payable (1) |
104 | 84 | 76 | 76 | 76 | 791 | 1,207 | |||||||
Debt-related hedges outflows (2) |
1,011 | - | - | - | - | - | 1,011 | |||||||
Debt-related hedges inflows (1) |
(984) | - | - | - | - | - | (984) | |||||||
Lease obligations (3) |
74 | 61 | 47 | 37 | 31 | 127 | 377 | |||||||
Unconditional purchase obligations |
479 | 267 | 92 | 34 | 7 | 4 | 883 | |||||||
Defined benefit obligations |
33 | - | - | - | - | - | 33 | |||||||
Total |
1,690 | 912 | 215 | 147 | 114 | 2,291 | 5,369 | |||||||
| (1) | Represents contractual cash flows calculated using spot foreign exchange rates as of December 31, 2024. |
| (2) | Represents contractual U.S. dollar cash flows. |
| (3) | Includes leases with a term of 12 months or less, certain low-value assets and lease commitments that have not commenced, all of which are not recognized in the consolidated statement of financial position. |
• |
Subsidiary guarantees |
• |
Guarantees |
• |
Unconditional purchase obligations |
• |
Defined benefit obligations |
The amount and timing of any future required contributions to pension plans could differ significantly from our estimates as of December 31, 2024. We cannot estimate contributions beyond 2025 because they depend on future economic conditions, plan performance and potential future government legislation. For certain plans, the trustees have the right to call for special valuations, which could subsequently result in us having to make an unexpected contribution. Additionally, from time to time, we may elect to make voluntary contributions to improve the funded status of the plans. |
• |
Disposition contingencies |
| Page 50 | Thomson Reuters Annual Report 2024 |
Thomson Reuters Annual Report 2024 |
Page 51 |
• |
Legal Professionals: |
• |
Corporates: |
• |
Tax & Accounting Professionals: on-premises tax, audit, accounting, and practice management systems are gradually being replaced by cloud-based offerings. |
| Page 52 | Thomson Reuters Annual Report 2024 |
• |
Continue evolving our transformative AI capabilities through ongoing product innovation and enhancements to our flagship products |
• |
Continue to roll out our AI assistant, CoCounsel, across our customer base |
• |
Maintain and build on our deep domain expertise and comprehensive collection of richly enhanced data and content |
• |
Further enhance our go-to-market |
• |
Extend our channel partnerships to integrate our products and services into broader ecosystems |
• |
Ongoing expansion of our international offerings |
• |
Accelerate our pace of execution to move fast and win in a competitive market; and |
• |
Leverage our significant capital capacity to fund organic investment and execute a balanced capital allocation approach including annual dividend growth, strategic acquisitions, and shareholder returns. |
Total Thomson Reuters |
2024 Actual |
2025 Outlook | ||
Revenue growth Organic revenue growth (1) |
7% 7% |
3.0% – 3.5% (2) 7.0% – 7.5% | ||
Adjusted EBITDA margin (1) |
38.2% | ~39% | ||
Corporate costs |
$105 million | $120 – $130 million | ||
Free cash flow (1) |
$1.8 billion | ~$1.9 billion | ||
Accrued capital expenditures as a percentage of revenues (1) |
8.4% | ~8% | ||
Depreciation and amortization of computer software Depreciation and amortization of internally developed software Amortization of acquired software |
$731 million $584 million $147 million |
$835 – $855 million $635 – $655 million ~$200 million | ||
Interest expense |
$125 million | ~$150 million | ||
Effective tax rate on adjusted earnings (1) |
17.6% | ~19% | ||
“Big 3” Segments (1) |
2024 Actual |
2025 Outlook | ||
Revenue growth Organic revenue growth |
8% 9% |
~4% ~9% | ||
Adjusted EBITDA margin |
42.1% | ~43% | ||
| (1) | Non-IFRS financial measures. Refer to Appendices A and B of this management’s discussion and analysis for additional information and reconciliations of our non-IFRS financial measures to the most directly comparable IFRS financial measures. |
| (2) | Total revenue growth reflects the impact of the divestitures of FindLaw and other non-core businesses in December 2024. |
Thomson Reuters Annual Report 2024 |
Page 53 |
• |
Organic revenue growth to be in the range of 5% to 6%; and |
• |
Adjusted EBITDA margin to be approximately 40%. |
Revenues | ||
Material assumptions |
Material risks | |
• Uncertain macroeconomic and geopolitical conditions will continue to disrupt the economy and cause periods of volatility• Continued need for trusted products and services that help customers navigate evolving and complex legal, tax, accounting, regulatory, geopolitical and commercial changes, developments and environments, and for cloud-based digital tools that drive productivity• Continued ability to deliver innovative products that meet evolving customer demands• Acquisition of new customers through expanded and improved digital platforms, simplification of the product portfolio and through other sales initiatives• Improvement in customer retention through commercial simplification efforts and customer service improvements |
• Ongoing geopolitical and macroeconomic uncertainty continue to impact the global economy. The severity and duration of this uncertainty could lead to lower demand for our products and services (beyond our assumption that these disruptions will cause periods of volatility)• Uncertainty in the legal regulatory regime relating to AI. Potential future legislation may make it harder for us to conduct business using AI, lead to regulatory fines or penalties, require us to change product offerings or business practices, or prevent or limit our use of AI• Demand for our products and services could be reduced by changes in customer buying patterns, or our inability to execute on key product design or customer support initiatives• Competitive pricing actions and product innovation could impact our revenues• Our sales, commercial simplification and product design initiatives may be insufficient to retain customers or generate new sales | |
Adjusted EBITDA margin | ||
Material assumptions |
Material risks | |
• Our ability to achieve revenue growth targets• Business mix continues to shift to higher-growth product offerings• Integration expenses associated with recent acquisitions will reduce margins |
• Same as the risks above related to the revenue outlook• Higher than expected inflation may lead to greater than anticipated increase in labor costs, third-party supplier costs and costs of print materials• Acquisition and disposal activity may dilute adjusted EBITDA margin | |
Free Cash Flow | ||
Material assumptions |
Material risks | |
• Our ability to achieve our revenue and adjusted EBITDA margin targets• Accrued capital expenditures expected to approximate 8% of revenues in 2025 and 2026 |
• Same as the risks above related to the revenue and adjusted EBITDA margin outlook• A weaker macroeconomic environment could negatively impact working capital performance, including the ability of our customers to pay us• Accrued capital expenditures may be higher than currently expected• The timing and amount of tax payments to governments may differ from our expectations | |
| Page 54 | Thomson Reuters Annual Report 2024 |
Effective tax rate on adjusted earnings | ||
Material assumptions |
Material risks | |
• Our ability to achieve our adjusted EBITDA target• The mix of taxing jurisdictions where we recognized pre-tax profit or losses in 2024 does not significantly change in 2025 or 2026• Minimal changes in currently enacted tax laws and treaties within the jurisdictions where we operate• No significant charges or benefits from the finalization of prior tax years• Depreciation and amortization of internally developed computer software of $835 - $855 million in 2025• Interest expense of approximately $150 million in 2025 |
• Same as the risks above related to adjusted EBITDA• A material change in the geographical mix of our pre-tax profits and losses• A material change in current tax laws or treaties to which we are subject, and did not expect• Depreciation and amortization of internally developed computer software as well as interest expense may be significantly higher or lower than expected | |
Thomson Reuters Annual Report 2024 |
Page 55 |
Year ended December 31, |
||||||||
(millions of U.S. dollars) |
2024 |
2023 |
||||||
Salaries and other benefits |
25 |
23 | ||||||
Share-based payments |
19 |
17 | ||||||
Total compensation |
44 |
40 | ||||||
• |
$500 million 3.35% Notes due 2026; |
• |
$500 million 5.85% Notes due 2040; |
• |
$119 million 4.50% Notes due 2043; |
• |
$350 million 5.65% Notes due 2043; and |
• |
$400 million 5.50% Debentures due 2035. |
| Page 56 | Thomson Reuters Annual Report 2024 |
• |
The consolidated income statement to be structured according to operating, investing and financing categories, and include additional subtotals for “Operating Profit” and “Profit Before Financing and Income Taxes”; |
• |
Management-defined performance measurements (MPM’s), which represent certain of our non-IFRS measures, to be identified, defined, and have an explanation why each one is useful. Each MPM must be reconciled to the most directly comparable IFRS subtotal. All disclosures related to MPM’s must be disclosed in a single footnote within the consolidated financial statements; and |
• |
The application of enhanced guidance related to the grouping of financial information associated with amounts presented within the financial statements, otherwise known as aggregation or disaggregation. |
• |
An election permitting derecognition of financial liabilities that are settled through an electronic payment system before the actual settlement date, if certain conditions are met; and |
• |
Expanded disclosures for (a) investments in equity instruments and (b) financial liabilities that have features unrelated to basic lending risks, such as achieving sustainability targets, that could affect the cash flows of those liabilities. |
Thomson Reuters Annual Report 2024 |
Page 57 |
| Page 58 | Thomson Reuters Annual Report 2024 |
Thomson Reuters Annual Report 2024 |
Page 59 |
How We Define It |
Why We Use It and Why It Is Useful to Investors |
Most Directly Comparable IFRS Measure | ||
Adjusted EBITDA and the related margin | ||||
Represents earnings or losses from continuing operations before tax expense or benefit, net interest expense, other finance costs or income, depreciation, amortization of computer software and other identifiable intangible assets, our share of post-tax earnings or losses in equity method investments, other operating gains and losses, certain asset impairment charges and fair value adjustments, including those related to acquired deferred revenue.The related margin is adjusted EBITDA expressed as a percentage of revenues. For purposes of this calculation, revenues are before fair value adjustments to acquired deferred revenue. |
Provides a consistent basis to evaluate operating profitability and performance trends by excluding items that we do not consider to be controllable activities for this purpose. Also represents a measure commonly reported and widely used by investors as a valuation metric, as well as to assess our ability to incur and service debt. |
Earnings from continuing operations | ||
Adjusted EBITDA less accrued capital expenditures and the related margin | ||||
Represents adjusted EBITDA less accrued capital expenditures, where accrued capital expenditures include amounts that remain unpaid at the reporting date. The related margin is adjusted EBITDA less accrued capital expenditures expressed as a percentage of revenues. For purposes of this calculation, revenues are before fair value adjustments to acquired deferred revenue. |
Provides a basis for evaluating the operating profitability and capital intensity of a business in a single measure. This measure captures investments regardless of whether they are expensed or capitalized, and reflects the basis on which management measures capital spending. | Earnings from continuing operations | ||
Accrued capital expenditures as a percentage of revenues | ||||
Accrued capital expenditures expressed as a percentage of revenues. For purposes of this calculation, revenues are before fair value adjustments to acquired deferred revenue. |
Reflects the basis on how we manage capital expenditures for internal budgeting purposes. | Capital expenditures | ||
| Page 60 | Thomson Reuters Annual Report 2024 |
How We Define It |
Why We Use It and Why It Is Useful to Investors |
Most Directly Comparable IFRS Measure | ||
Adjusted earnings and adjusted EPS | ||||
Net earnings or loss including dividends declared on preference shares but excluding the post-tax impacts of fair value adjustments, including those related to acquired deferred revenue, amortization of acquired intangible assets (attributable to other identifiable intangible assets and acquired computer software), other operating gains and losses, certain asset impairment charges, other finance costs or income, our share of post-tax earnings or losses in equity method investments, discontinued operations and other items affecting comparability. Acquired intangible assets contribute to the generation of revenues from acquired companies, which are included in our computation of adjusted earnings.The post-tax amount of each item is excluded from adjusted earnings based on the specific tax rules and tax rates associated with the nature and jurisdiction of each item.Adjusted EPS is calculated from adjusted earnings using diluted weighted-average shares and does not represent actual earnings or loss per share attributable to shareholders. |
Provides a more comparable basis to analyze earnings. These measures are commonly used by shareholders to measure performance. |
Net earnings and diluted EPS | ||
Effective tax rate on adjusted earnings | ||||
Adjusted tax expense divided by pre-tax adjusted earnings. Adjusted tax expense is computed as income tax (benefit) expense plus or minus the income tax impacts of all items impacting adjusted earnings (as described above), and other tax items impacting comparability. |
Provides a basis to analyze the effective tax rate associated with adjusted earnings. | Tax benefit (expense) | ||
In interim periods, we also make an adjustment to reflect income taxes based on the estimated full-year effective tax rate. Earnings or losses for interim periods under IFRS reflect income taxes based on the estimated effective tax rates of each of the jurisdictions in which we operate. The non-IFRS adjustment reallocates estimated full-year income taxes between interim periods but has no effect on full-year income taxes. |
Our effective tax rate computed in accordance with IFRS may be more volatile by quarter because the geographical mix of pre-tax profits and losses in interim periods may be different from that for the full year. Therefore, we believe that using the expected full-year effective tax rate provides more comparability among interim periods. |
|||
Thomson Reuters Annual Report 2024 |
Page 61 |
How We Define It |
Why We Use It and Why It Is Useful to Investors |
Most Directly Comparable IFRS Measure | ||
Net debt and leverage ratio of net debt to adjusted EBITDA | ||||
Net debt: Total indebtedness (excluding the associated unamortized transaction costs and premiums or discount) plus the currency related fair value of associated hedging instruments, and lease liabilities less cash and cash equivalents. |
Provides a commonly used measure of a company’s leverage. Given that we hedge some of our debt to reduce risk, we include hedging instruments as we believe it provides a better measure of the total obligation associated with our outstanding debt. However, because we intend to hold our debt and related hedges to maturity, we do not consider the interest components of the associated fair value of hedges in our measurements. We reduce gross indebtedness by cash and cash equivalents. |
Total debt (current indebtedness plus long-term indebtedness) | ||
Net debt to adjusted EBITDA: Net debt is divided by adjusted EBITDA for the previous twelve-month period ending with the current fiscal quarter. |
Provides a commonly used measure of a company’s ability to pay its debt. Our non-IFRS measure is aligned with the calculation of our internal target and is more conservative than the maximum ratio allowed under the contractual covenants in our credit facility. |
For adjusted EBITDA, refer to the definition above for the most directly comparable IFRS measure | ||
Free cash flow | ||||
Net cash provided by operating activities and other investing activities, less capital expenditures, payments of lease principal and dividends paid on our preference shares. |
Helps assess our ability, over the long term, to create value for our shareholders as it represents cash available to repay debt, pay common dividends and fund share repurchases and acquisitions. | Net cash provided by operating activities | ||
Return on invested capital (ROIC) | ||||
Adjusted operating profit (operating profit excluding amortization of acquired intangible assets attributable to other identifiable intangible assets and acquired computer software, other operating gains and losses, and fair value adjustments) less net taxes paid expressed as a percentage of the average adjusted invested capital during the period. |
Provides a measure of how efficiently we allocate resources to profitable activities and is indicative of our ability to create value for our shareholders. | IFRS does not require a measure comparable to ROIC. Refer to our calculation of ROIC in Appendix C for a reconciliation of the components in the calculation to the most directly comparable IFRS measure. | ||
Changes before the impact of foreign currency or at “constant currency” | ||||
Applicable measures where changes are reported before the impact of foreign currency or at “constant currency” IFRS Measures: • Revenues• Operating expensesNon-IFRS Measures and ratios:• Adjusted EBITDA and adjusted EBITDA margin• Adjusted EPSOur reporting currency is the U.S. dollar. However, we conduct activities in currencies other than the U.S. dollar. We measure our performance before the impact of foreign currency (or at “constant currency” or excluding the effects of currency), which is determined by converting the current and equivalent prior period’s local currency results using the same foreign currency exchange rate. |
Provides better comparability of business trends from period to period. | For each non-IFRS measure and ratio, refer to the definitions above for the most directly comparable IFRS measure. | ||
| Page 62 | Thomson Reuters Annual Report 2024 |
How We Define It |
Why We Use It and Why It Is Useful to Investors |
Most Directly Comparable IFRS Measure | ||
Changes in revenues computed on an “organic” basis | ||||
Represent changes in revenues of our existing businesses at constant currency. The metric excludes the distortive impacts of acquisitions and dispositions from not owning the business in both comparable periods. • For acquisitions, we calculate organic growth as though we had owned the acquired business in both periods. We compare revenues for the acquired business for the period we owned the business to the same prior-year period revenues for that business, when we did not own it. |
Provides further insight into the performance of our existing businesses by excluding distortive impacts and serves as a better measure of our ability to grow our business over the long term. | Revenues | ||
• For dispositions, we calculate organic growth only for the time we owned the business in the current period, compared to the same period in the prior year. |
||||
“Big 3” segments | ||||
Our combined Legal Professionals, Corporates and Tax & Accounting Professionals segments. All measures reported for the “Big 3” segments are non-IFRS financial measures. |
The “Big 3” segments comprised 82% of revenues in 2024 and represent the core of our business information service product offerings. | Revenues Earnings from continuing operations | ||
Thomson Reuters Annual Report 2024 |
Page 63 |
Three months ended December 31, |
Year ended December 31, |
|||||||||||||||
(millions of U.S. dollars, except margins) |
2024 |
2023 |
2024 |
2023 |
||||||||||||
Earnings from continuing operations |
607 |
650 | 2,192 |
2,646 | ||||||||||||
Adjustments to remove: |
||||||||||||||||
Tax expense (benefit) |
135 |
20 | (123) |
417 | ||||||||||||
Other finance (income) costs |
(53) |
117 | (45) |
192 | ||||||||||||
Net interest expense |
28 |
31 | 125 |
152 | ||||||||||||
Amortization of other identifiable intangible assets |
22 |
25 | 91 |
97 | ||||||||||||
Amortization of computer software |
160 |
135 | 618 |
512 | ||||||||||||
Depreciation |
26 |
29 | 113 |
116 | ||||||||||||
EBITDA |
925 |
1,007 | 2,971 |
4,132 | ||||||||||||
Adjustments to remove: |
||||||||||||||||
Share of post-tax losses (earnings) in equity method investments |
5 |
(260) | (40) |
(1,075) | ||||||||||||
Other operating gains, net |
(204) |
(44) | (144) |
(397) | ||||||||||||
Fair value adjustments (1) |
(8) |
4 | (8) |
18 | ||||||||||||
Adjusted EBITDA |
718 |
707 | 2,779 |
2,678 | ||||||||||||
Deduct: Accrued capital expenditures |
(172) |
(153) | (609) |
(532) | ||||||||||||
Adjusted EBITDA less accrued capital expenditures |
546 |
554 | 2,170 |
2,146 | ||||||||||||
Adjusted EBITDA margin |
37.6% |
38.9% | 38.2% |
39.3% | ||||||||||||
Adjusted EBITDA less accrued capital expenditures margin |
28.6% |
30.5% | 29.9% |
31.5% | ||||||||||||
| (1) | Fair value adjustments primarily represent gains or losses due to changes in foreign currency exchange rates on intercompany balances that arise in the ordinary course of business, a component of operating expenses, as well as adjustments related to acquired deferred revenue. |
Three months ended December 31, |
Year ended December 31, |
|||||||||||||||
(millions of U.S. dollars) |
2024 |
2023 |
2024 |
2023 |
||||||||||||
Capital expenditures |
161 |
132 | 607 |
544 | ||||||||||||
Remove: IFRS adjustment to cash basis |
11 |
21 | 2 |
(12) | ||||||||||||
Accrued capital expenditures |
172 |
153 | 609 |
532 | ||||||||||||
Accrued capital expenditures as a percentage of revenues |
n/a |
n/a | 8.4% |
7.8% | ||||||||||||
| Page 64 | Thomson Reuters Annual Report 2024 |
Three months ended December 31, |
Year ended December 31, |
|||||||||||||||
(millions of U.S. dollars, except per share amounts and share data) |
2024 |
2023 |
2024 |
2023 |
||||||||||||
Net earnings |
587 |
678 | 2,207 |
2,695 | ||||||||||||
Adjustments to remove: |
||||||||||||||||
Fair value adjustments (1) |
(8) |
4 | (8) |
18 | ||||||||||||
Amortization of acquired computer software |
38 |
24 | 147 |
72 | ||||||||||||
Amortization of other identifiable intangible assets |
22 |
25 | 91 |
97 | ||||||||||||
Other operating gains, net |
(204) |
(44) | (144) |
(397) | ||||||||||||
Interest benefit impacting comparability (2)(3) |
- |
- | - |
(12) | ||||||||||||
Other finance (income) costs |
(53) |
117 | (45) |
192 | ||||||||||||
Share of post-tax losses (earnings) in equity method investments |
5 |
(260) | (40) |
(1,075) | ||||||||||||
Tax on above items (3) |
36 |
38 | (9) |
265 | ||||||||||||
Tax items impacting comparability (2)(3) |
5 |
(108) | (478) |
(172) | ||||||||||||
Loss (earnings) loss from discontinued operations, net of tax |
20 |
(28) | (15) |
(49) | ||||||||||||
Interim period effective tax rate normalization (3) |
7 |
1 | - |
- | ||||||||||||
Dividends declared on preference shares |
(1) |
(1) | (5) |
(5) | ||||||||||||
Adjusted earnings (4) |
454 |
446 | 1,701 |
1,629 | ||||||||||||
Adjusted EPS (4) |
$1.01 |
$0.98 | $3.77 |
$3.51 | ||||||||||||
Diluted weighted-average common shares (millions) |
450.6 |
455.2 | 451.2 |
464.0 | ||||||||||||
| (1) | Fair value adjustments primarily represent gains or losses due to changes in foreign currency exchange rates on intercompany balances that arise in the ordinary course of business, a component of operating expenses, as well as adjustments related to acquired deferred revenue. |
| (2) | In 2023, relates to the release of tax and interest reserves due to the expiration of statutes of limitation. |
| (3) | See the “Results of Operations -Tax (benefit) expense” section of this management’s discussion and analysis for additional information. |
| (4) | The adjusted earnings impact of non-controlling interests, which was applicable only to the year ended December 31, 2024, was not material. |
Year ended December 31, |
||||||||
(millions of U.S. dollars, except percentages) |
2024 |
2023 |
||||||
Adjusted earnings |
1,701 |
1,629 |
||||||
| Plus: Dividends declared on preference shares | 5 | 5 | ||||||
| Plus: Tax expense on adjusted earnings | 364 | 324 | ||||||
Pre-tax adjusted earnings |
2,070 |
1,958 |
||||||
IFRS tax (benefit) expense |
(123) |
417 |
||||||
| Remove tax related to: | ||||||||
Amortization of acquired computer software |
33 | 17 | ||||||
Amortization of other identifiable intangible assets |
22 | 22 | ||||||
Share of post-tax earnings in equity method investments |
(7) | (253) | ||||||
Other finance (income) costs |
19 | 31 | ||||||
Other operating gains, net |
(56) | (81) | ||||||
Other items |
(2) | (1) | ||||||
Subtotal - Remove tax benefit (expense) on pre-tax items removed from adjusted earnings |
9 | (265) | ||||||
| Remove: Tax items impacting comparability | 478 | 172 | ||||||
| Total - Remove all items impacting comparability | 487 | (93) | ||||||
Tax expense on adjusted earnings |
364 |
324 |
||||||
Effective tax rate on adjusted earnings |
17.6% |
16.5% |
||||||
Thomson Reuters Annual Report 2024 |
Page 65 |
Three months ended December 31, |
Year ended December 31, |
|||||||||||||||
(millions of U.S. dollars) |
2024 |
2023 |
2024 |
2023 |
||||||||||||
Net cash provided by operating activities |
564 |
705 | 2,457 |
2,341 | ||||||||||||
Capital expenditures |
(161) |
(132) | (607) |
(544) | ||||||||||||
Other investing activities |
40 |
55 | 46 |
137 | ||||||||||||
Payments of lease principal |
(17) |
(14) | (63) |
(58) | ||||||||||||
Dividends paid on preference shares |
(1) |
(1) | (5) |
(5) | ||||||||||||
Free cash flow |
425 |
613 | 1,828 |
1,871 | ||||||||||||
December 31, |
||||||||
(millions of U.S. dollars) |
2024 |
2023 |
||||||
Current indebtedness |
973 |
372 | ||||||
Long-term indebtedness |
1,847 |
2,905 | ||||||
Total debt |
2,820 |
3,277 | ||||||
Swaps |
21 |
(65) | ||||||
Total debt after swaps |
2,841 |
3,212 | ||||||
Remove fair value adjustments for hedges (1) |
5 |
2 | ||||||
Total debt after currency hedging arrangements |
2,846 |
3,214 | ||||||
Remove transaction costs, premiums or discounts included in the carrying value of debt |
22 |
26 | ||||||
Add: Lease liabilities (current and non-current) |
256 |
265 | ||||||
Less: Cash and cash equivalents (2) |
(1,968) |
(1,298) | ||||||
Net debt |
1,156 |
2,207 | ||||||
Leverage ratio of net debt to adjusted EBITDA |
||||||||
Adjusted EBITDA |
2,779 |
2,678 | ||||||
Net debt/adjusted EBITDA |
0.4:1 |
0.8:1 | ||||||
| (1) | Represents the interest-related fair value component of hedging instruments that are removed to reflect net cash outflow upon maturity. |
| (2) | Includes cash and cash equivalents of $115 million and $100 million as of December 31, 2024 and 2023, respectively, held in subsidiaries which have regulatory restrictions, contractual restrictions or operate in countries where exchange controls and other legal restrictions apply and are therefore not available for general use by our company. |
| Page 66 | Thomson Reuters Annual Report 2024 |
Three months ended December 31, |
||||||||||||||||||||||||||||
Change |
||||||||||||||||||||||||||||
(millions of U.S. dollars) |
2024 |
2023 |
Total |
Foreign Currency |
Subtotal Constant Currency |
Acquisitions/ Divestitures |
Organic |
|||||||||||||||||||||
Revenues |
||||||||||||||||||||||||||||
Legal Professionals |
729 |
700 |
4% |
- |
4% |
(4%) |
7% |
|||||||||||||||||||||
Corporates |
458 |
402 |
14% |
(1%) |
15% |
5% |
10% |
|||||||||||||||||||||
Tax & Accounting Professionals |
366 |
344 |
6% |
- |
7% |
- |
7% |
|||||||||||||||||||||
“Big 3” Segments Combined |
1,553 |
1,446 |
7% |
- |
7% |
(1%) |
8% |
|||||||||||||||||||||
Reuters News |
218 |
220 |
(1%) |
- |
(1%) |
1% |
(3%) |
|||||||||||||||||||||
Global Print |
144 |
154 |
(6%) |
- |
(6%) |
- |
(6%) |
|||||||||||||||||||||
Eliminations/Rounding |
(6) |
(5) |
||||||||||||||||||||||||||
Total revenues |
1,909 |
1,815 |
5% |
- |
5% |
- |
5% |
|||||||||||||||||||||
Recurring Revenues |
||||||||||||||||||||||||||||
Legal Professionals |
707 |
674 |
5% |
- |
4% |
(4%) |
8% |
|||||||||||||||||||||
Corporates |
401 |
358 |
12% |
- |
13% |
3% |
10% |
|||||||||||||||||||||
Tax & Accounting Professionals |
319 |
305 |
4% |
(1%) |
5% |
- |
5% |
|||||||||||||||||||||
“Big 3” Segments Combined |
1,427 |
1,337 |
7% |
- |
7% |
(1%) |
8% |
|||||||||||||||||||||
Reuters News |
173 |
157 |
10% |
- |
10% |
2% |
8% |
|||||||||||||||||||||
Eliminations/Rounding |
(6) |
(5) |
||||||||||||||||||||||||||
Total recurring revenues |
1,594 |
1,489 |
7% |
- |
7% |
(1%) |
8% |
|||||||||||||||||||||
Transactions Revenues |
||||||||||||||||||||||||||||
Legal Professionals |
22 |
26 |
(11%) |
(1%) |
(10%) |
(5%) |
(4%) |
|||||||||||||||||||||
Corporates |
57 |
44 |
25% |
(3%) |
28% |
17% |
12% |
|||||||||||||||||||||
Tax & Accounting Professionals |
47 |
39 |
22% |
1% |
21% |
- |
21% |
|||||||||||||||||||||
“Big 3” Segments Combined |
126 |
109 |
16% |
(1%) |
17% |
5% |
11% |
|||||||||||||||||||||
Reuters News |
45 |
63 |
(29%) |
1% |
(29%) |
1% |
(30%) |
|||||||||||||||||||||
Total transactions revenues |
171 |
172 |
(1%) |
(1%) |
- |
3% |
(4%) |
|||||||||||||||||||||
Year ended December 31, |
||||||||||||||||||||||||||||
Change |
||||||||||||||||||||||||||||
(millions of U.S. dollars) |
2024 |
2023 |
Total |
Foreign Currency |
Subtotal Constant Currency |
Acquisitions/ Divestitures |
Organic |
|||||||||||||||||||||
Revenues |
||||||||||||||||||||||||||||
Legal Professionals |
2,922 |
2,807 |
4% |
- |
4% |
(3%) |
7% |
|||||||||||||||||||||
Corporates |
1,844 |
1,620 |
14% |
- |
14% |
4% |
10% |
|||||||||||||||||||||
Tax & Accounting Professionals |
1,165 |
1,058 |
10% |
(1%) |
11% |
1% |
10% |
|||||||||||||||||||||
“Big 3” Segments Combined |
5,931 |
5,485 |
8% |
- |
8% |
- |
9% |
|||||||||||||||||||||
Reuters News |
832 |
769 |
8% |
- |
8% |
2% |
6% |
|||||||||||||||||||||
Global Print |
519 |
562 |
(8%) |
- |
(7%) |
- |
(7%) |
|||||||||||||||||||||
Eliminations/Rounding |
(24) |
(22) |
||||||||||||||||||||||||||
Total revenues |
7,258 |
6,794 |
7% |
- |
7% |
- |
7% |
|||||||||||||||||||||
Recurring Revenues |
||||||||||||||||||||||||||||
Legal Professionals |
2,828 |
2,674 |
6% |
- |
6% |
(2%) |
8% |
|||||||||||||||||||||
Corporates |
1,543 |
1,373 |
12% |
- |
13% |
3% |
10% |
|||||||||||||||||||||
Tax & Accounting Professionals |
867 |
808 |
7% |
(2%) |
9% |
- |
9% |
|||||||||||||||||||||
“Big 3” Segments Combined |
5,238 |
4,855 |
8% |
- |
8% |
- |
9% |
|||||||||||||||||||||
Reuters News |
668 |
625 |
7% |
(1%) |
7% |
2% |
5% |
|||||||||||||||||||||
Eliminations/Rounding |
(24) |
(22) |
||||||||||||||||||||||||||
Total recurring revenues |
5,882 |
5,458 |
8% |
- |
8% |
- |
8% |
|||||||||||||||||||||
Transactions Revenues |
||||||||||||||||||||||||||||
Legal Professionals |
94 |
133 |
(29%) |
(2%) |
(28%) |
(25%) |
(2%) |
|||||||||||||||||||||
Corporates |
301 |
247 |
22% |
(1%) |
22% |
11% |
11% |
|||||||||||||||||||||
Tax & Accounting Professionals |
298 |
250 |
19% |
- |
19% |
5% |
14% |
|||||||||||||||||||||
“Big 3” Segments Combined |
693 |
630 |
10% |
(1%) |
11% |
- |
10% |
|||||||||||||||||||||
Reuters News |
164 |
144 |
14% |
1% |
13% |
4% |
9% |
|||||||||||||||||||||
Total transactions revenues |
857 |
774 |
11% |
(1%) |
11% |
1% |
10% |
|||||||||||||||||||||
Thomson Reuters Annual Report 2024 |
Page 67 |
Three months ended December 31, |
||||||||||||||||||||
Change |
||||||||||||||||||||
(millions of U.S. dollars, except margins and per share amounts) |
2024 |
2023 |
Total |
Foreign Currency |
Constant Currency |
|||||||||||||||
Adjusted EBITDA |
||||||||||||||||||||
Legal Professionals |
299 |
298 |
- |
2% |
(1%) |
|||||||||||||||
Corporates |
153 |
138 |
11% |
2% |
8% |
|||||||||||||||
Tax & Accounting Professionals |
196 |
188 |
4% |
(1%) |
5% |
|||||||||||||||
“Big 3” Segments Combined |
648 |
624 |
4% |
1% |
3% |
|||||||||||||||
Reuters News |
45 |
61 |
(26%) |
(1%) |
(26%) |
|||||||||||||||
Global Print |
55 |
55 |
(1%) |
- |
(1%) |
|||||||||||||||
Corporate costs |
(30) |
(33) |
n/a |
n/a |
n/a |
|||||||||||||||
Adjusted EBITDA |
718 |
707 |
2% |
1% |
1% |
|||||||||||||||
Adjusted EBITDA margin |
||||||||||||||||||||
Legal Professionals |
41.0% |
42.5% |
(150)bp |
50bp |
(200)bp |
|||||||||||||||
Corporates |
33.5% |
34.5% |
(100)bp |
90bp |
(190)bp |
|||||||||||||||
Tax & Accounting Professionals |
53.4% |
54.6% |
(120)bp |
(30)bp |
(90)bp |
|||||||||||||||
“Big 3” Segments Combined |
41.7% |
43.1% |
(140)bp |
50bp |
(190)bp |
|||||||||||||||
Reuters News |
20.8% |
27.9% |
(710)bp |
(40)bp |
(670)bp |
|||||||||||||||
Global Print |
38.2% |
36.4% |
180bp |
(10)bp |
190bp |
|||||||||||||||
Adjusted EBITDA margin |
37.6% |
38.9% |
(130)bp |
30bp |
(160)bp |
|||||||||||||||
Operating expenses |
1,183 |
1,112 |
6% |
(2%) |
8% |
|||||||||||||||
Adjusted EPS |
$1.01 |
$0.98 |
3% |
2% |
1% |
|||||||||||||||
Year ended December 31, |
||||||||||||||||||||
Change |
||||||||||||||||||||
(millions of U.S. dollars, except margins and per share amounts) |
2024 |
2023 |
Total |
Foreign Currency |
Constant Currency |
|||||||||||||||
Adjusted EBITDA |
||||||||||||||||||||
Legal Professionals |
1,302 |
1,299 |
- |
- |
- |
|||||||||||||||
Corporates |
671 |
619 |
8% |
1% |
8% |
|||||||||||||||
Tax & Accounting Professionals |
527 |
490 |
8% |
(1%) |
9% |
|||||||||||||||
“Big 3” Segments Combined |
2,500 |
2,408 |
4% |
- |
4% |
|||||||||||||||
Reuters News |
196 |
172 |
14% |
(2%) |
16% |
|||||||||||||||
Global Print |
188 |
213 |
(12%) |
- |
(12%) |
|||||||||||||||
Corporate costs |
(105) |
(115) |
n/a |
n/a |
n/a |
|||||||||||||||
Adjusted EBITDA |
2,779 |
2,678 |
4% |
- |
4% |
|||||||||||||||
Adjusted EBITDA margin |
||||||||||||||||||||
Legal Professionals |
44.6% |
46.2% |
(160)bp |
20bp |
(180)bp |
|||||||||||||||
Corporates |
36.3% |
38.1% |
(180)bp |
40bp |
(220)bp |
|||||||||||||||
Tax & Accounting Professionals |
45.2% |
45.8% |
(60)bp |
(10)bp |
(50)bp |
|||||||||||||||
“Big 3” Segments Combined |
42.1% |
43.8% |
(170)bp |
10bp |
(180)bp |
|||||||||||||||
Reuters News |
23.6% |
22.4% |
120bp |
(30)bp |
150bp |
|||||||||||||||
Global Print |
36.2% |
38.0% |
(180)bp |
- |
(180)bp |
|||||||||||||||
Adjusted EBITDA margin |
38.2% |
39.3% |
(110)bp |
20bp |
(130)bp |
|||||||||||||||
Operating expenses |
4,471 |
4,134 |
8% |
(1%) |
9% |
|||||||||||||||
Adjusted EPS |
$3.77 |
$3.51 |
7% |
1% |
7% |
|||||||||||||||
| Page 68 | Thomson Reuters Annual Report 2024 |
Three months ended December 31, 2024 |
||||||||||||||||||||
(millions of U.S. dollars, except margins) |
IFRS revenues |
Remove fair value adjustments to acquired deferred revenue |
Revenues excluding fair value adjustments to acquired deferred revenue |
Adjusted EBITDA |
Adjusted EBITDA margin |
|||||||||||||||
Revenues |
||||||||||||||||||||
Legal Professionals |
729 |
- |
729 |
299 |
41.0% |
|||||||||||||||
Corporates |
458 |
1 |
459 |
153 |
33.5% |
|||||||||||||||
Tax & Accounting Professionals |
366 |
- |
366 |
196 |
53.4% |
|||||||||||||||
“Big 3” Segments Combined |
1,553 |
1 |
1,554 |
648 |
41.7% |
|||||||||||||||
Reuters News |
218 |
- |
218 |
45 |
20.8% |
|||||||||||||||
Global Print |
144 |
- |
144 |
55 |
38.2% |
|||||||||||||||
Eliminations/Rounding |
(6) |
- |
(6) |
- |
n/a |
|||||||||||||||
Corporate costs |
- |
- |
- |
(30) |
n/a |
|||||||||||||||
Consolidated totals |
1,909 |
1 |
1,910 |
718 |
37.6% |
|||||||||||||||
Year ended December 31, 2024 |
||||||||||||||||||||
(millions of U.S. dollars, except margins) |
IFRS revenues |
Remove fair value adjustments to acquired deferred revenue |
Revenues excluding fair value adjustments to acquired deferred revenue |
Adjusted EBITDA |
Adjusted EBITDA margin |
|||||||||||||||
Revenues |
||||||||||||||||||||
Legal Professionals |
2,922 |
1 |
2,923 |
1,302 |
44.6% |
|||||||||||||||
Corporates |
1,844 |
6 |
1,850 |
671 |
36.3% |
|||||||||||||||
Tax & Accounting Professionals |
1,165 |
- |
1,165 |
527 |
45.2% |
|||||||||||||||
“Big 3” Segments Combined |
5,931 |
7 |
5,938 |
2,500 |
42.1% |
|||||||||||||||
Reuters News |
832 |
2 |
834 |
196 |
23.6% |
|||||||||||||||
Global Print |
519 |
- |
519 |
188 |
36.2% |
|||||||||||||||
Eliminations/Rounding |
(24) |
- |
(24) |
- |
n/a |
|||||||||||||||
Corporate costs |
- |
- |
- |
(105) |
n/a |
|||||||||||||||
Consolidated totals |
7,258 |
9 |
7,267 |
2,779 |
38.2% |
|||||||||||||||
Three months ended December 31, 2023 |
||||||||||||||||||||
(millions of U.S. dollars, except margins) |
IFRS revenues |
Remove fair value adjustments to acquired deferred revenue |
Revenues excluding fair value adjustments to acquired deferred revenue |
Adjusted EBITDA |
Adjusted EBITDA margin |
|||||||||||||||
Revenues |
||||||||||||||||||||
Legal Professionals |
700 | 1 | 701 | 298 | 42.5% | |||||||||||||||
Corporates |
402 | - | 402 | 138 | 34.5% | |||||||||||||||
Tax & Accounting Professionals |
344 | - | 344 | 188 | 54.6% | |||||||||||||||
“Big 3” Segments Combined |
1,446 | 1 | 1,447 | 624 | 43.1% | |||||||||||||||
Reuters News |
220 | - | 220 | 61 | 27.9% | |||||||||||||||
Global Print |
154 | - | 154 | 55 | 36.4% | |||||||||||||||
Eliminations/Rounding |
(5) | - | (5) | - | n/a | |||||||||||||||
Corporate costs |
- | - | - | (33) | n/a | |||||||||||||||
Consolidated totals |
1,815 | 1 | 1,816 | 707 | 38.9% | |||||||||||||||
Year ended December 31, 2023 |
||||||||||||||||||||
(millions of U.S. dollars, except margins) |
IFRS revenues |
Remove fair value adjustments to acquired deferred revenue |
Revenues excluding fair value adjustments to acquired deferred revenue |
Adjusted EBITDA |
Adjusted EBITDA margin |
|||||||||||||||
Revenues |
||||||||||||||||||||
Legal Professionals |
2,807 | 1 | 2,808 | 1,299 | 46.2% | |||||||||||||||
Corporates |
1,620 | 3 | 1,623 | 619 | 38.1% | |||||||||||||||
Tax & Accounting Professionals |
1,058 | 11 | 1,069 | 490 | 45.8% | |||||||||||||||
“Big 3” Segments Combined |
5,485 | 15 | 5,500 | 2,408 | 43.8% | |||||||||||||||
Reuters News |
769 | 1 | 770 | 172 | 22.4% | |||||||||||||||
Global Print |
562 | - | 562 | 213 | 38.0% | |||||||||||||||
Eliminations/Rounding |
(22) | - | (22) | - | n/a | |||||||||||||||
Corporate costs |
- | - | - | (115) | n/a | |||||||||||||||
Consolidated totals |
6,794 | 16 | 6,810 | 2,678 | 39.3% | |||||||||||||||
Thomson Reuters Annual Report 2024 |
Page 69 |
For the years ended and as of December 31, | ||||||
(millions of U.S. dollars) |
2024 |
2023 | ||||
Calculation of adjusted operating profit after taxes |
||||||
| Operating profit | 2,109 |
2,332 | ||||
| Adjustments to remove: | ||||||
| Amortization of acquired computer software | 147 |
72 | ||||
| Amortization of other identifiable intangible assets | 91 |
97 | ||||
| Fair value adjustments | (8) |
18 | ||||
| Other operating gains, net | (144) |
(397) | ||||
| Adjusted operating profit – continuing operations | 2,195 |
2,122 | ||||
| Net cash taxes paid on continuing operations | (234) |
(163) | ||||
Post-tax adjusted operating profit- continuing operations |
1,961 |
1,959 | ||||
| Post–tax adjusted operating loss- discontinued operations (1) |
(4) |
(5) | ||||
| Consolidated post-tax adjusted operating profit |
1,957 |
1,954 | ||||
Calculation of invested capital |
||||||
| Trade and other receivables | 1,087 |
1,122 | ||||
| Prepaid expenses and other current assets | 400 |
435 | ||||
| Property and equipment, net | 386 |
447 | ||||
| Computer software (excludes accumulated amortization of acquired software) (2) |
1,857 |
1,492 | ||||
| Other identifiable intangible assets (excludes accumulated amortization) | 5,957 |
5,942 | ||||
| Goodwill (3) |
6,195 |
5,685 | ||||
| Payables, accruals and provisions | (1,091) |
(1,114) | ||||
| Current tax liabilities | (197) |
(248) | ||||
| Deferred revenue | (1,062) |
(992) | ||||
Total invested capital (4) |
13,532 |
12,769 | ||||
| Average invested capital |
13,151 |
12,109 | ||||
Return on invested capital |
14.9% |
16.1% | ||||
| (1) | Excludes $8 million of other operating gains and $11 million related to the release of tax and interest reserves in 2024 (2023 - $54 million of other operating gains) from discontinued operations. |
| (2) | Computer software excludes accumulated amortization of acquired software of $404 million and $256 million in 2024 and 2023, respectively. |
| (3) | Goodwill excludes deferred tax impacts of $1,067 million and $1,034 million in 2024 and 2023, respectively, arising from acquisition accounting. |
| (4) | Invested capital excludes other financial assets and liabilities, including cash, debt and lease liabilities, equity method investments, other non-current assets, deferred taxes, and provisions and other non-current liabilities. |
| Page 70 | Thomson Reuters Annual Report 2024 |
• |
Most critical estimates and assumptions in determining the value of assets and liabilities; and |
• |
Most critical judgments in applying accounting policies. |
Thomson Reuters Annual Report 2024 |
Page 71 |
| Page 72 | Thomson Reuters Annual Report 2024 |
Cash-Generating Unit |
Perpetual growth rate (1) |
Discount rate |
Tax rate | |||
| Legal Professionals | 2.5% | 11.0% | 26.6% | |||
| Corporates | 2.5% | 11.0% | 26.8% | |||
| Tax & Accounting Professionals | 3.0% | 11.5% | 27.6% | |||
| Reuters News | 2.5% | 13.0% | 25.0% | |||
| Global Print | (5.5%) | 11.5% | 26.8% | |||
| (1) | The perpetual growth rate is applied to the final year of cash flow projections. |
• |
TRGP: Pri-2012/MP-2021 |
• |
TTC plan: SAPS S3 Light Tables with allowances for plan demographic specifics and longevity improvements. |
Thomson Reuters Annual Report 2024 |
Page 73 |
| Page 74 | Thomson Reuters Annual Report 2024 |
For the years ended and as of December 31, |
||||||||||||
(millions of U.S. dollars, except per share amounts) |
2024 |
2023 |
2022 |
|||||||||
IFRS Consolidated Income Statement Data |
||||||||||||
Revenues |
7,258 |
6,794 | 6,627 | |||||||||
Operating profit |
2,109 |
2,332 | 1,834 | |||||||||
Earnings from continuing operations |
2,192 |
2,646 | 1,391 | |||||||||
Earnings (loss) from discontinued operations, net of tax |
15 |
49 | (53) | |||||||||
Net earnings |
2,207 |
2,695 | 1,338 | |||||||||
Earnings attributable to common shareholders |
2,210 |
2,695 | 1,338 | |||||||||
Loss attributable to non-controlling interests |
(3) |
- | - | |||||||||
Basic earnings per share from continuing operations |
$4.86 |
$5.70 | $2.87 | |||||||||
Basic earnings (loss) per share from discontinued operations |
$0.03 |
$0.11 | $(0.11) | |||||||||
Basic earnings per share |
$4.89 |
$5.81 | $2.76 | |||||||||
Diluted earnings per share from continuing operations |
$4.85 |
$5.69 | $2.86 | |||||||||
Diluted earnings (loss) per share from discontinued operations |
$0.04 |
$0.11 | $(0.11) | |||||||||
Diluted earnings per share |
$4.89 |
$5.80 | $2.75 | |||||||||
IFRS Consolidated Statement of Financial Position Data: |
||||||||||||
Total assets |
18,437 |
18,684 | 21,711 | |||||||||
Total long-term financial liabilities (1) |
2,079 |
3,142 | 3,347 | |||||||||
Dividend Data: |
||||||||||||
Dividends per Thomson Reuters Corporation common share (US$) |
$2.16 |
$1.96 | $1.78 | |||||||||
Dividends per Thomson Reuters Corporation Series II preference share (C$) |
C$1.19 |
C$1.21 | C$0.71 | |||||||||
| (1) | Comprised of “Long-term indebtedness” and “Other financial liabilities – non-current”. |
Thomson Reuters Annual Report 2024 |
Page 75 |
Quarters ended |
||||||||||||||||||||||||||||||||
(millions of U.S. dollars, except per share amounts) |
December 31, 2024 |
September 30, 2024 |
June 30, 2024 |
March 31, 2024 |
December 31, 2023 |
September 30, 2023 |
June 30, 2023 |
March 31, 2023 |
||||||||||||||||||||||||
Revenues |
1,909 |
1,724 |
1,740 |
1,885 |
1,815 | 1,594 | 1,647 | 1,738 | ||||||||||||||||||||||||
Operating profit |
722 |
415 |
415 |
557 |
558 | 441 | 825 | 508 | ||||||||||||||||||||||||
Earnings from continuing operations |
607 |
277 |
844 |
464 |
650 | 370 | 889 | 737 | ||||||||||||||||||||||||
(Loss) earnings from discontinued operations, net of tax |
(20) |
24 |
(3) |
14 |
28 | (3) | 5 | 19 | ||||||||||||||||||||||||
Net earnings |
587 |
301 |
841 |
478 |
678 | 367 | 894 | 756 | ||||||||||||||||||||||||
Earnings (loss) attributable to |
||||||||||||||||||||||||||||||||
Common shareholders |
587 |
301 |
841 |
481 |
678 | 367 | 894 | 756 | ||||||||||||||||||||||||
Non-controlling interests |
- |
- |
- |
(3) |
- | - | - | - | ||||||||||||||||||||||||
Basic earnings (loss) per share |
||||||||||||||||||||||||||||||||
From continuing operations |
$1.35 |
$0.61 |
$1.87 |
$1.03 |
$1.43 | $0.81 | $1.89 | $1.56 | ||||||||||||||||||||||||
From discontinued operations |
(0.05) |
0.06 |
(0.01) |
0.03 |
0.06 | (0.01) | 0.01 | 0.04 | ||||||||||||||||||||||||
$1.30 |
$0.67 |
$1.86 |
$1.06 |
$1.49 | $0.80 | $1.90 | $1.60 | |||||||||||||||||||||||||
Diluted earnings (loss) per share |
||||||||||||||||||||||||||||||||
From continuing operations |
$1.34 |
$0.61 |
$1.87 |
$1.03 |
$1.43 | $0.81 | $1.89 | $1.55 | ||||||||||||||||||||||||
From discontinued operations |
(0.04) |
0.06 |
(0.01) |
0.03 |
0.06 | (0.01) | 0.01 | 0.04 | ||||||||||||||||||||||||
$1.30 |
$0.67 |
$1.86 |
$1.06 |
$1.49 | $0.80 | $1.90 | $1.59 | |||||||||||||||||||||||||
| Page 76 | Thomson Reuters Annual Report 2024 |
• |
Parent – Thomson Reuters Corporation, the direct or indirect owner of all of its subsidiaries |
• |
Subsidiary Issuer – TR Finance LLC |
• |
Subsidiary Guarantors on a combined basis |
• |
Non-Guarantor Subsidiaries – Other subsidiaries of Thomson Reuters Corporation on a combined basis that will not guarantee TR Finance LLC debt securities |
• |
Eliminations – Consolidating adjustments |
• |
Thomson Reuters on a consolidated basis |
• |
Thomson Reuters Applications Inc., which operates part of the Company’s Legal Professionals, Tax & Accounting Professionals and Corporates businesses; |
• |
Thomson Reuters (Tax & Accounting) Inc., which operates part of the Company’s Tax & Accounting Professionals and Corporates businesses; and |
• |
West Publishing Corporation, which operates part of the Company’s Legal Professionals, Corporates and Global Print businesses. |
Thomson Reuters Annual Report 2024 |
Page 77 |
Year ended December 31, 2024 |
||||||||||||||||||||||||
(millions of U.S. dollars) |
Parent |
Subsidiary Issuer |
Subsidiary Guarantors |
Non- Guarantor Subsidiaries |
Eliminations |
Consolidated |
||||||||||||||||||
CONTINUING OPERATIONS |
||||||||||||||||||||||||
Revenues |
- |
- |
2,122 |
5,679 |
(543) |
7,258 |
||||||||||||||||||
Operating expenses |
(15) |
- |
(1,575) |
(3,424) |
543 |
(4,471) |
||||||||||||||||||
Depreciation |
- |
- |
(36) |
(77) |
- |
(113) |
||||||||||||||||||
Amortization of computer software |
- |
- |
(16) |
(602) |
- |
(618) |
||||||||||||||||||
Amortization of other identifiable intangible assets |
- |
- |
(40) |
(51) |
- |
(91) |
||||||||||||||||||
Other operating (losses) gains, net |
(1) |
- |
56 |
89 |
- |
144 |
||||||||||||||||||
Operating (loss) profit |
(16) |
- |
511 |
1,614 |
- |
2,109 |
||||||||||||||||||
Finance (costs) income, net: |
||||||||||||||||||||||||
Net interest (expense) income |
(137) |
- |
6 |
6 |
- |
(125) |
||||||||||||||||||
Other finance (costs) income |
(30) |
- |
1 |
74 |
- |
45 |
||||||||||||||||||
Intercompany net interest income (expense) |
116 |
- |
(59) |
(57) |
- |
- |
||||||||||||||||||
(Loss) income before tax and equity method investments |
(67) |
- |
459 |
1,637 |
- |
2,029 |
||||||||||||||||||
Share of post-tax earnings in equity method investments |
- |
- |
- |
40 |
- |
40 |
||||||||||||||||||
Share of post-tax earnings (losses) in subsidiaries |
2,034 |
- |
(2) |
340 |
(2,372) |
- |
||||||||||||||||||
Tax benefit (expense) |
240 |
- |
(119) |
2 |
- |
123 |
||||||||||||||||||
Earnings from continuing operations |
2,207 |
- |
338 |
2,019 |
(2,372) |
2,192 |
||||||||||||||||||
Earnings from discontinued operations, net of tax |
- |
- |
- |
15 |
- |
15 |
||||||||||||||||||
Net earnings |
2,207 |
- |
338 |
2,034 |
(2,372) |
2,207 |
||||||||||||||||||
Earnings (loss) attributable to: |
||||||||||||||||||||||||
Common shareholders |
2,207 |
- |
338 |
2,037 |
(2,372) |
2,210 |
||||||||||||||||||
Non-controlling interests |
- |
- |
- |
(3) |
- |
(3) |
||||||||||||||||||
Year ended December 31, 2023 |
||||||||||||||||||||||||
(millions of U.S. dollars) |
Parent |
Subsidiary Issuer |
Subsidiary Guarantors |
Non- Guarantor Subsidiaries |
Eliminations |
Consolidated |
||||||||||||||||||
CONTINUING OPERATIONS |
||||||||||||||||||||||||
Revenues |
- | - | 2,165 | 5,411 | (782) | 6,794 | ||||||||||||||||||
Operating expenses |
(13) | - | (1,607) | (3,296) | 782 | (4,134) | ||||||||||||||||||
Depreciation |
- | - | (39) | (77) | - | (116) | ||||||||||||||||||
Amortization of computer software |
- | - | (17) | (495) | - | (512) | ||||||||||||||||||
Amortization of other identifiable intangible assets |
- | - | (45) | (52) | - | (97) | ||||||||||||||||||
Other operating gains, net |
42 | - | 20 | 335 | - | 397 | ||||||||||||||||||
Operating profit |
29 | - | 477 | 1,826 | - | 2,332 | ||||||||||||||||||
Finance (costs) income, net: |
||||||||||||||||||||||||
Net interest (expense) income |
(190) | - | 14 | 24 | - | (152) | ||||||||||||||||||
Other finance (costs) income |
(18) | - | 2 | (176) | - | (192) | ||||||||||||||||||
Intercompany net interest income (expense) |
203 | - | (54) | (149) | - | - | ||||||||||||||||||
Income before tax and equity method investments |
24 | - | 439 | 1,525 | - | 1,988 | ||||||||||||||||||
Share of post-tax earnings in equity method investments |
- | - | - | 1,075 | - | 1,075 | ||||||||||||||||||
Share of post-tax earnings in subsidiaries |
2,673 | - | 57 | 337 | (3,067) | - | ||||||||||||||||||
Tax expense |
- | - | (102) | (315) | - | (417) | ||||||||||||||||||
Earnings from continuing operations |
2,697 | - | 394 | 2,622 | (3,067) | 2,646 | ||||||||||||||||||
(Loss) earnings from discontinued operations, net of tax |
(2) | - | - | 51 | - | 49 | ||||||||||||||||||
Net earnings |
2,695 | - | 394 | 2,673 | (3,067) | 2,695 | ||||||||||||||||||
Earnings attributable to: |
||||||||||||||||||||||||
Common shareholders |
2,695 | - | 394 | 2,673 | (3,067) | 2,695 | ||||||||||||||||||
Non-controlling interests |
- | - | - | - | - | - | ||||||||||||||||||
| Page 78 | Thomson Reuters Annual Report 2024 |
December 31, 2024 |
||||||||||||||||||||||||
(millions of U.S. dollars) |
Parent |
Subsidiary Issuer |
Subsidiary Guarantors |
Non- Guarantor Subsidiaries |
Eliminations |
Consolidated |
||||||||||||||||||
Cash and cash equivalents |
14 |
- |
230 |
1,724 |
- |
1,968 |
||||||||||||||||||
Trade and other receivables |
- |
- |
257 |
830 |
- |
1,087 |
||||||||||||||||||
Intercompany receivables |
1,032 |
- |
505 |
1,674 |
(3,211) |
- |
||||||||||||||||||
Other financial assets |
- |
- |
23 |
12 |
- |
35 |
||||||||||||||||||
Prepaid expenses and other current assets |
- |
- |
170 |
230 |
- |
400 |
||||||||||||||||||
Current assets |
1,046 |
- |
1,185 |
4,470 |
(3,211) |
3,490 |
||||||||||||||||||
Property and equipment, net |
- |
- |
158 |
228 |
- |
386 |
||||||||||||||||||
Computer software, net |
- |
- |
34 |
1,419 |
- |
1,453 |
||||||||||||||||||
Other identifiable intangible assets, net |
- |
- |
981 |
2,153 |
- |
3,134 |
||||||||||||||||||
Goodwill |
- |
- |
3,727 |
3,535 |
- |
7,262 |
||||||||||||||||||
Equity method investments |
- |
- |
- |
269 |
- |
269 |
||||||||||||||||||
Other financial assets |
82 |
- |
46 |
314 |
- |
442 |
||||||||||||||||||
Other non-current assets |
- |
- |
105 |
520 |
- |
625 |
||||||||||||||||||
Intercompany receivables |
160 |
- |
2 |
778 |
(940) |
- |
||||||||||||||||||
Investments in subsidiaries |
14,584 |
- |
465 |
4,041 |
(19,090) |
- |
||||||||||||||||||
Deferred tax |
243 |
- |
- |
1,133 |
- |
1,376 |
||||||||||||||||||
Total assets |
16,115 |
- |
6,703 |
18,860 |
(23,241) |
18,437 |
||||||||||||||||||
LIABILITIES AND EQUITY |
||||||||||||||||||||||||
Liabilities |
||||||||||||||||||||||||
Current indebtedness |
973 |
- |
- |
- |
- |
973 |
||||||||||||||||||
Payables, accruals and provisions |
52 |
- |
276 |
763 |
- |
1,091 |
||||||||||||||||||
Current tax liabilities |
- |
- |
- |
197 |
- |
197 |
||||||||||||||||||
Deferred revenue |
- |
- |
350 |
712 |
- |
1,062 |
||||||||||||||||||
Intercompany payables |
1,214 |
- |
461 |
1,536 |
(3,211) |
- |
||||||||||||||||||
Other financial liabilities |
20 |
- |
11 |
82 |
- |
113 |
||||||||||||||||||
Current liabilities |
2,259 |
- |
1,098 |
3,290 |
(3,211) |
3,436 |
||||||||||||||||||
Long-term indebtedness |
1,847 |
- |
- |
- |
- |
1,847 |
||||||||||||||||||
Provisions and other non-current liabilities |
3 |
- |
4 |
668 |
- |
675 |
||||||||||||||||||
Other financial liabilities |
- |
- |
80 |
152 |
- |
232 |
||||||||||||||||||
Intercompany payables |
- |
- |
778 |
162 |
(940) |
- |
||||||||||||||||||
Deferred tax |
- |
- |
237 |
4 |
- |
241 |
||||||||||||||||||
Total liabilities |
4,109 |
- |
2,197 |
4,276 |
(4,151) |
6,431 |
||||||||||||||||||
Equity |
||||||||||||||||||||||||
Total equity |
12,006 |
- |
4,506 |
14,584 |
(19,090) |
12,006 |
||||||||||||||||||
Total liabilities and equity |
16,115 |
- |
6,703 |
18,860 |
(23,241) |
18,437 |
||||||||||||||||||
Thomson Reuters Annual Report 2024 |
Page 79 |
December 31, 2023 | ||||||||||||
(millions of U.S. dollars) |
Parent |
Subsidiary Issuer |
Subsidiary Guarantors |
Non- Guarantor Subsidiaries |
Eliminations |
Consolidated | ||||||
| Cash and cash equivalents | 24 | - | 182 | 1,092 | - | 1,298 | ||||||
| Trade and other receivables | - | - | 276 | 846 | - | 1,122 | ||||||
| Intercompany receivables | 2,666 | - | 465 | 3,402 | (6,533) | - | ||||||
| Other financial assets | - | - | 6 | 60 | - | 66 | ||||||
| Prepaid expenses and other current assets | - | - | 212 | 223 | - | 435 | ||||||
| Current assets | 2,690 | - | 1,141 | 5,623 | (6,533) | 2,921 | ||||||
| Property and equipment, net | - | - | 200 | 247 | - | 447 | ||||||
| Computer software, net | - | - | 49 | 1,187 | - | 1,236 | ||||||
| Other identifiable intangible assets, net | - | - | 1,021 | 2,144 | - | 3,165 | ||||||
| Goodwill | - | - | 3,803 | 2,916 | - | 6,719 | ||||||
| Equity method investments | - | - | - | 2,030 | - | 2,030 | ||||||
| Other financial assets | 116 | - | 6 | 322 | - | 444 | ||||||
| Other non-current assets |
- | - | 116 | 502 | - | 618 | ||||||
| Intercompany receivables | 188 | - | 2 | 778 | (968) | - | ||||||
| Investments in subsidiaries | 14,572 | - | 489 | 3,943 | (19,004) | - | ||||||
| Deferred tax | - | - | - | 1,104 | - | 1,104 | ||||||
| Total assets | 17,566 | - | 6,827 | 20,796 | (26,505) | 18,684 | ||||||
LIABILITIES AND EQUITY |
||||||||||||
Liabilities |
||||||||||||
| Current indebtedness | 372 | - | - | - | - | 372 | ||||||
| Payables, accruals and provisions | 55 | - | 317 | 742 | - | 1,114 | ||||||
| Current tax liabilities | - | - | - | 248 | - | 248 | ||||||
| Deferred revenue | - | - | 337 | 655 | - | 992 | ||||||
| Intercompany payables | 2,768 | - | 634 | 3,131 | (6,533) | - | ||||||
| Other financial liabilities | 400 | - | 15 | 92 | - | 507 | ||||||
| Current liabilities | 3,595 | - | 1,303 | 4,868 | (6,533) | 3,233 | ||||||
| Long-term indebtedness | 2,905 | - | - | - | - | 2,905 | ||||||
| Provisions and other non-current liabilities |
2 | - | 6 | 684 | - | 692 | ||||||
| Other financial liabilities | - | - | 76 | 161 | - | 237 | ||||||
| Intercompany payables | - | - | 778 | 190 | (968) | - | ||||||
| Deferred tax | - | - | 232 | 321 | - | 553 | ||||||
| Total liabilities | 6,502 | - | 2,395 | 6,224 | (7,501) | 7,620 | ||||||
Equity |
||||||||||||
| Total equity | 11,064 | - | 4,432 | 14,572 | (19,004) | 11,064 | ||||||
| Total liabilities and equity | 17,566 | - | 6,827 | 20,796 | (26,505) | 18,684 | ||||||
| Page 80 | Thomson Reuters Annual Report 2024 |
Thomson Reuters Annual Report 2024 |
Page 81 |
| Page 82 | Thomson Reuters Annual Report 2024 |
Thomson Reuters Annual Report 2024 |
Page 83 |
Year ended December 31, |
||||||||||||
(millions of U.S. dollars, except per share amounts) |
Notes |
2024 |
2023 |
|||||||||
CONTINUING OPERATIONS |
||||||||||||
| Revenues | 3 | |||||||||||
| Operating expenses | 5 | ( |
( |
|||||||||
| Depreciation | ( |
( |
||||||||||
| Amortization of computer software | ( |
( |
||||||||||
| Amortization of other identifiable intangible assets | ( |
( |
||||||||||
| Other operating gains, net | 6 | |||||||||||
| Operating profit | ||||||||||||
| Finance costs, net: | ||||||||||||
Net interest expense |
8 | ( |
( |
|||||||||
Other finance income (costs) |
8 | ( |
||||||||||
| Income before tax and equity method investments | ||||||||||||
| Share of post-tax earnings in equity method investments |
9 | |||||||||||
| Tax benefit (expense) | 10 | ( |
||||||||||
Earnings from continuing operations |
||||||||||||
| Earnings from discontinued operations, net of tax | 11 | |||||||||||
| Net earnings | ||||||||||||
| Earnings (loss) attributable to: | ||||||||||||
Common shareholders |
||||||||||||
Non-controlling interests |
( |
|||||||||||
Earnings per share |
12 | |||||||||||
| Basic earnings per share: | ||||||||||||
From continuing operations |
$ |
$ |
||||||||||
From discontinued operations |
||||||||||||
| Basic earnings per share | $ |
$ |
||||||||||
| Diluted earnings per share: | ||||||||||||
From continuing operations |
$ |
$ |
||||||||||
From discontinued operations |
||||||||||||
| Diluted earnings per share | $ |
$ |
||||||||||
Page 84 |
Thomson Reuters Annual Report 2024 |
Year ended December 31, |
||||||||||||
(millions of U.S. dollars) |
Notes |
2024 |
2023 |
|||||||||
| Net earnings | ||||||||||||
| Other comprehensive (loss) income | ||||||||||||
| Items that have been or may be subsequently reclassified to net earnings: | ||||||||||||
| Cash flow hedges adjustments to net earnings |
20 | ( |
||||||||||
| Cash flow hedges adjustments to equity |
20 | ( |
||||||||||
| Related tax expense on cash flow hedges adjustments to equity |
10 | ( |
||||||||||
| Foreign currency translation adjustments to equity |
20 | ( |
||||||||||
( |
||||||||||||
| Items that will not be reclassified to net earnings: |
||||||||||||
| Fair value adjustments on financial assets |
20 | |||||||||||
| Related tax expense on fair value adjustments on financial assets |
10 | ( |
||||||||||
| Remeasurement on defined benefit pension plans |
27 | |||||||||||
| Related tax expense on remeasurement on defined benefit pension plans |
10 | ( |
||||||||||
| Other comprehensive (loss) income | ( |
|||||||||||
| Total comprehensive income | ||||||||||||
| Comprehensive income (loss) for the period attributable to: | ||||||||||||
| Common shareholders: | ||||||||||||
| Continuing operations |
||||||||||||
| Discontinued operations |
||||||||||||
Non-controlling interests |
( |
|||||||||||
| Total comprehensive income | ||||||||||||
Thomson Reuters Annual Report 2024 |
Page 85 |
| December 31, |
||||||||||||
(millions of U.S. dollars) |
Notes |
2024 |
2023 |
|||||||||
ASSETS |
||||||||||||
| Cash and cash equivalents | 13 | |||||||||||
| Trade and other receivables | 14 | |||||||||||
| Other financial assets | 20 | |||||||||||
| Prepaid expenses and other current assets | 15 | |||||||||||
| Current assets | ||||||||||||
| Property and equipment, net | 16 | |||||||||||
| Computer software, net | 17 | |||||||||||
| Other identifiable intangible assets, net | 18 | |||||||||||
| Goodwill | 19 | |||||||||||
| Equity method investments | 9 | |||||||||||
| Other financial assets | 20 | |||||||||||
| Other non-current assets |
21 | |||||||||||
| Deferred tax | 24 | |||||||||||
| Total assets | ||||||||||||
LIABILITIES AND EQUITY |
||||||||||||
Liabilities |
||||||||||||
| Current indebtedness | 20 | |||||||||||
| Payables, accruals and provisions | 22 | |||||||||||
| Current tax liabilities | ||||||||||||
| Deferred revenue | 3 | |||||||||||
| Other financial liabilities | 20 | |||||||||||
| Current liabilities | ||||||||||||
| Long-term indebtedness | 20 | |||||||||||
| Provisions and other non-current liabilities |
23 | |||||||||||
| Other financial liabilities | 20 | |||||||||||
| Deferred tax | 24 | |||||||||||
| Total liabilities | ||||||||||||
Equity |
||||||||||||
| Capital | 25 | |||||||||||
| Retained earnings | ||||||||||||
| Accumulated other comprehensive loss | ( |
( |
||||||||||
| Total equity | ||||||||||||
| Total liabilities and equity | ||||||||||||
/s/ David Thomson |
/s/ Steve Hasker | |
| David Thomson |
Steve Hasker | |
| Director |
Director | |
Page 86 |
Thomson Reuters Annual Report 2024 |
Year ended December 31, |
||||||||||||
(millions of U.S. dollars) |
Notes |
2024 |
2023 |
|||||||||
Cash provided by (used in): |
||||||||||||
OPERATING ACTIVITIES |
||||||||||||
| Earnings from continuing operations | ||||||||||||
| Adjustments for: | ||||||||||||
Depreciation |
||||||||||||
Amortization of computer software |
||||||||||||
Amortization of other identifiable intangible assets |
||||||||||||
Share of post-tax earnings in equity method investments |
9 | ( |
( |
|||||||||
Net gains on disposals of businesses and investments |
( |
( |
||||||||||
Deferred tax |
24 | ( |
( |
|||||||||
Other |
29 | |||||||||||
| Changes in working capital and other items | 29 | |||||||||||
| Operating cash flows from continuing operations | ||||||||||||
| Operating cash flows from discontinued operations | ( |
|||||||||||
| Net cash provided by operating activities | ||||||||||||
INVESTING ACTIVITIES |
||||||||||||
| Acquisitions, net of cash acquired | 30 | ( |
( |
|||||||||
| Proceeds related to disposals of businesses and investments | 7 |
|||||||||||
| Proceeds from sales of LSEG shares | 9 | |||||||||||
| Capital expenditures | ( |
( |
||||||||||
| Other investing activities | 9 | |||||||||||
| Taxes paid on sales of LSEG shares and disposals of businesses | ( |
( |
||||||||||
| Investing cash flows from continuing operations | ||||||||||||
| Investing cash flows from discontinued operations | ( |
|||||||||||
| Net cash provided by investing activities | ||||||||||||
FINANCING ACTIVITIES |
||||||||||||
| Repayments of debt | 20 | ( |
( |
|||||||||
| Net repayments under short-term loan facilities | 20 | ( |
( |
|||||||||
| Payments of lease principal | 28 | ( |
( |
|||||||||
| Payments for return of capital on common shares | 25 | ( |
||||||||||
| Repurchases of common shares | 25 | ( |
( |
|||||||||
| Dividends paid on preference shares | ( |
( |
||||||||||
| Dividends paid on common shares | 25 | ( |
( |
|||||||||
| Purchase of non-controlling interests |
30 | ( |
||||||||||
| Other financing activities | ||||||||||||
| Net cash used in financing activities | ( |
( |
||||||||||
| Translation adjustments | ( |
|||||||||||
| Increase in cash and cash equivalents | ||||||||||||
| Cash and cash equivalents at beginning of period | ||||||||||||
| Cash and cash equivalents at end of period | 13 | |||||||||||
Supplemental cash flow information is provided in note 29. |
||||||||||||
| Interest paid, net of debt-related hedges | 8 |
( |
( |
|||||||||
| Interest received | 8 |
|||||||||||
| Income taxes paid | 29 | ( |
( |
|||||||||
Thomson Reuters Annual Report 2024 |
Page 87 |
(millions of U.S. dollars) |
Stated share capital |
Contributed surplus |
Total capital |
Retained earnings |
Unrecognized gain (loss) on financial instruments |
Foreign currency translation adjustments |
Total accumulated other comprehensive loss (“AOCL”) |
Shareholders’ equity |
Non- controlling interests (see note 30) |
Total equity |
||||||||||||||||||||||||||||||||||
| Balance, December 31, 2023 | ( |
( |
||||||||||||||||||||||||||||||||||||||||||
| Net earnings | - |
- |
- |
- |
- |
- |
( |
|||||||||||||||||||||||||||||||||||||
| Other comprehensive income (loss) | - |
- |
- |
- |
( |
( |
( |
( |
( |
|||||||||||||||||||||||||||||||||||
| Total comprehensive income (loss) | - |
- |
- |
( |
( |
( |
||||||||||||||||||||||||||||||||||||||
| Non-controlling interests on acquisition of subsidiaries |
- |
- |
- |
- |
- |
- |
- |
- |
||||||||||||||||||||||||||||||||||||
| Purchase of non-controlling interests |
- |
- |
- |
( |
- |
- |
- |
( |
( |
( |
||||||||||||||||||||||||||||||||||
| Transfer of gain on disposal of equity investments to retained earnings |
- |
- |
- |
( |
- |
( |
- |
- |
||||||||||||||||||||||||||||||||||||
| Dividends declared on preference shares | - |
- |
- |
( |
- |
- |
- |
( |
( |
|||||||||||||||||||||||||||||||||||
| Dividends declared on common shares |
- |
- |
- |
( |
- |
- |
- |
( |
- |
( |
||||||||||||||||||||||||||||||||||
| Shares issued under Dividend Reinvestment Plan (“DRIP”) |
- |
- |
- |
- |
- |
- |
||||||||||||||||||||||||||||||||||||||
| Repurchases of common shares (see note 25) | ( |
- |
( |
( |
- |
- |
- |
( |
- |
( |
||||||||||||||||||||||||||||||||||
| Stock compensation plans | ( |
- |
- |
- |
- |
|||||||||||||||||||||||||||||||||||||||
| Balance, December 31, 2024 | ( |
( |
||||||||||||||||||||||||||||||||||||||||||
(millions of U.S. dollars) |
Stated share capital |
Contributed surplus |
Total capital |
Retained earnings |
Unrecognized gain on financial instruments |
Foreign currency translation adjustments |
AOCL |
Shareholders’ equity |
Non- controlling interests |
Total equity |
||||||||||||||||||||||||||||||||||
| Balance, December 31, 2022 | ( |
( |
||||||||||||||||||||||||||||||||||||||||||
| Net earnings | - | - | - | - | - | - | - | |||||||||||||||||||||||||||||||||||||
| Other comprehensive income | - | - | - | - | - | |||||||||||||||||||||||||||||||||||||||
| Total comprehensive income | - | - | - | - | ||||||||||||||||||||||||||||||||||||||||
| Return of capital on common shares (see note 25) |
( |
( |
- | - | - | - | ( |
- | ( |
|||||||||||||||||||||||||||||||||||
| Dividends declared on preference shares | - | - | - | ( |
- | - | - | ( |
- | ( |
||||||||||||||||||||||||||||||||||
| Dividends declared on common shares | - | - | - | ( |
- | - | - | ( |
- | ( |
||||||||||||||||||||||||||||||||||
| Shares issued under DRIP | - | - | - | - | - | - | ||||||||||||||||||||||||||||||||||||||
| Repurchases of common shares (see note 25) | ( |
- | ( |
( |
- | - | - | ( |
- | ( |
||||||||||||||||||||||||||||||||||
| Pre-defined share repurchase plan (see note 25) |
( |
- | ( |
( |
- | - | - | ( |
- | ( |
||||||||||||||||||||||||||||||||||
| Stock compensation plans | ( |
( |
- | - | - | - | ||||||||||||||||||||||||||||||||||||||
| Balance, December 31, 2023 | ( |
( |
||||||||||||||||||||||||||||||||||||||||||
Page 88 |
Thomson Reuters Annual Report 2024 |
• |
Acquisition cost is measured as the fair value of the assets given and liabilities incurred or assumed at the date of exchange, excluding transaction costs which are expensed as incurred; |
• |
Identifiable assets acquired and liabilities assumed are measured at their fair values at the acquisition date; |
• |
The excess of acquisition cost over the fair value of the identifiable net assets acquired is recorded as goodwill; and |
• |
Contingent cash consideration, a financial liability, is measured at fair value on the acquisition date, with subsequent changes in fair value recorded through the consolidated income statement. |
• |
Investments are initially recognized at cost and are reported in the consolidated statement of financial position; |
Thomson Reuters Annual Report 2024 |
Page 89 |
• |
The Company’s share of post-acquisition profits or losses is recognized in the consolidated income statement and the Company’s share of other comprehensive income or losses is recognized in the consolidated statement of comprehensive income, and both are adjusted against the carrying amount of the investments; |
• |
When the Company’s share of losses equals or exceeds its interest in the investee, the Company does not recognize further losses, unless it has incurred obligations or made payments on behalf of the investee; |
• |
Gains and losses on transactions between the Company and its equity method investees are eliminated to the extent of the Company’s interest in these entities; |
• |
Dividends received or receivable from equity method investees are recognized as a reduction in the carrying amount of the investment. Dividends received are included within the investing activities section of the consolidated statement of cash flow; and |
• |
Equity method investees are assessed for impairment whenever events or changes in circumstances indicate that their carrying value may not be recoverable and at the end of each reporting period for indicators of impairment. |
• |
Assets and liabilities of entities with functional currencies other than U.S. dollars are translated to U.S. dollars at the period end rates of exchange, and the results of their operations are translated at average rates of exchange for the period. The resulting translation adjustments are included in accumulated other comprehensive loss in shareholders’ equity. For entities operating in countries where the currency has been designated as hyperinflationary, the assets, liabilities and results of their operations are translated at the period end rates of exchange, after re-indexing the local currency balances for the most recent inflation rates. |
• |
Foreign currency transactions are translated into the functional currency using the exchange rates prevailing at the dates of the transaction. Foreign exchange gains and losses resulting from the settlement of such transactions as well as from the translation of monetary assets and liabilities not denominated in the functional currency of the subsidiary, are recognized in the consolidated income statement, except for qualifying cash flow hedges which are deferred in accumulated other comprehensive loss in shareholders’ equity. |
• |
Foreign exchange gains and losses arising from borrowings and related hedging instruments, cash and cash equivalents, intercompany loans that are not permanent in nature and foreign exchange contracts are presented in the consolidated income statement within “Finance costs, net”. |
• |
Foreign exchange gains and losses related to certain intercompany loans that are permanent in nature are included in accumulated other comprehensive loss. |
• |
All other foreign exchange gains and losses are presented in the consolidated income statement within “Operating expenses”. |
| Page 90 | Thomson Reuters Annual Report 2024 |
• |
Volume-based revenues are recognized based on usage, such as certain fees related to online searches and tax filings, and transactions in the Company’s Confirmation, Reuters Events and SurePrep businesses; |
• |
Fees for software licenses with no future obligations are recognized at the point of delivery; and |
• |
Professional fees for service and consulting arrangements are recognized as services are performed, generally based on hours incurred, reflecting the continuous transfer of control to the customer. |
• |
Assets related to new customer contracts are amortized over |
• |
Assets related to renewal of customer contracts are amortized over the term of the contract if they are commensurate with previous renewals commissions. |
Thomson Reuters Annual Report 2024 |
Page 91 |
Buildings and building improvements |
||
Computer equipment |
||
Furniture, fixtures and other equipment |
7 |
| Page 92 | Thomson Reuters Annual Report 2024 |
• |
It is technically feasible to complete the software product so that it will be available for use; |
• |
Management intends to complete the software product and use or sell it; |
• |
There is an ability to use or sell the software product; |
• |
It can be demonstrated how the software product will generate probable future economic benefits; |
• |
Adequate technical, financial and other resources to complete the development and to use or sell the software product are available; and |
• |
The expenditure attributable to the software product during its development can be reliably measured. |
• |
It has the contractual right to take possession of the software from the cloud provider without significant penalty; and |
• |
It can demonstrate that it is feasible for the Company to run the software on its own hardware or that of another provider. |
Trade names |
15 | |
Customer relationships |
||
Databases and content |
||
Other |
Thomson Reuters Annual Report 2024 |
Page 93 |
• |
Goodwill is allocated to cash-generating units (“CGUs”) based on the level at which management monitors it. The Company’s CGUs are the same as its operating segments. Goodwill is allocated to its CGUs based on the expected benefits of each business combination in which the goodwill arose; and |
• |
Identifiable intangible assets with indefinite lives are comprised of the Reuters and West tradenames, reflecting their widespread brand recognition, long history, and expected future use. For purposes of impairment testing, the West tradename is allocated to the Legal Professionals, Corporates and Global Print CGUs as it primarily benefits those CGUs. As the Reuters tradename is considered a corporate asset because it is used in the Company’s name, its carrying value is compared to the excess fair value of all the Company’s CGUs for purposes of impairment testing. |
• |
Represent a separate major line of business or geographical area of operations; |
• |
Are part of a single coordinated plan to dispose of a separate major line of business or geographical area of operations; or |
• |
Are a subsidiary acquired exclusively with a view to resale. |
| Page 94 | Thomson Reuters Annual Report 2024 |
• |
The initial amount of the lease liability; |
• |
Lease payments made at or before the commencement date; and |
• |
Initial direct costs and expected restoration costs. |
• |
Fixed payments (including in-substance fixed payments), less any lease incentives receivable; |
• |
Variable lease payments that are based on an index or a rate (including inflation-linked payments); |
• |
Amounts expected to be payable under residual value guarantees; |
• |
Exercise price of a purchase option if the Company is reasonably certain to exercise that option; and |
• |
Penalty payments for terminating the lease, if the lease term reflects the Company exercising that option. |
• |
Classification |
This category includes assets acquired primarily for the purpose of selling in the short-term, such as financial assets held for trading, or when designated by management. Examples include money market accounts, a receivable under an indemnification arrangement, contingent receivables, as well as foreign exchange contracts not designated as hedges for accounting purposes. |
Thomson Reuters Annual Report 2024 |
Page 95 |
• |
Recognition and measurement |
Financial assets in this category are initially recognized, and subsequently carried, at fair value, with changes recognized in the consolidated income statement. Transaction costs are expensed. |
• |
Classification |
This category includes cash as well as trade and other receivables, which represent non-derivative financial assets that are held for the purpose of collecting their contractually fixed or determinable payments. |
• |
Recognition and measurement |
Trade and other receivables are initially recognized at the transaction price and subsequently measured at amortized cost using the effective interest method. Allowances for expected credit losses provide for impairment of receivables. |
• |
Classification |
These financial assets are non-derivatives that are irrevocably designated in this category. This category includes equity investments, which are not held-for-trading |
• |
Recognition and measurement |
These financial instruments are initially recognized at fair value plus transaction costs and are subsequently carried at fair value with changes recognized in other comprehensive income or loss. The amounts recorded in accumulated other comprehensive income or loss are not subsequently recycled to the consolidated income statement, but rather are reclassified directly to retained earnings. |
• |
Fair value hedges |
These are hedges of the exposure to changes in fair value of a recognized asset or liability or unrecognized firm commitment. Changes in the fair value of derivatives that are designated as fair value hedges are recorded in the consolidated income statement together with any changes in the fair value of the hedged asset or liability that are attributable to the hedged risk. |
• |
Cash flow hedges |
These are hedges of the exposure to variability in cash flows of a recognized asset or liability or a highly probable forecast transaction. The effective portion of changes in the fair value of derivatives that are designated as a cash flow hedge is recognized in other comprehensive income or loss. The gain or loss relating to the ineffective portion is recognized immediately in the consolidated income statement. Additionally: |
– |
amounts in accumulated other comprehensive loss are recycled to the consolidated income statement in the period when the hedged item will affect earnings; |
– |
when a hedging instrument expires or is sold, or when a hedge no longer meets the criteria for hedge accounting, any cumulative gain or loss in accumulated other comprehensive loss remains in accumulated other comprehensive loss and is recognized when the forecast transaction is ultimately recognized in the consolidated income statement; and |
– |
when a forecast transaction is no longer expected to occur, the cumulative gain or loss that was reported in accumulated other comprehensive loss is immediately recognized in the consolidated income statement. |
| Page 96 | Thomson Reuters Annual Report 2024 |
• |
Are generally recognized for all taxable temporary differences; |
• |
Are recognized for taxable temporary differences arising on investments in subsidiaries and associates, except where the reversal of the temporary difference can be controlled, and it is probable that the difference will not reverse in the foreseeable future or create a tax liability; and |
• |
Are not recognized on temporary differences that arise from goodwill that is not deductible for tax purposes. |
• |
Are recognized to the extent it is probable that taxable profits will be available against which the deductible temporary differences can be utilized; and |
• |
Are reviewed at the end of the reporting period and reduced to the extent that it is no longer probable that sufficient taxable profits will be available to allow all or part of the asset to be recovered. |
• |
The consolidated income statement to be structured according to operating, investing and financing categories, and include additional subtotals for “Operating Profit” and “Profit Before Financing and Income Taxes”; |
• |
Management-defined performance measurements (“MPM’s”), which represent certain of the Company’s non-IFRS measures, to be identified, defined, and have an explanation why each one is useful. Each MPM must be reconciled to the most directly comparable IFRS subtotal. All disclosures related to MPM’s must be disclosed in a single footnote within the consolidated financial statements; and |
• |
The application of enhanced guidance related to the grouping of financial information associated with amounts presented within the financial statements, otherwise known as aggregation or disaggregation. |
Thomson Reuters Annual Report 2024 |
Page 97 |
• |
An election permitting derecognition of financial liabilities that are settled through an electronic payment system before the actual settlement date, if certain conditions are met; and |
• |
Expanded disclosures for (a) investments in equity instruments and (b) financial liabilities that have features unrelated to basic lending risks, such as achieving sustainability targets, that could affect the cash flows of those liabilities. |
• |
Most critical estimates and assumptions in determining the value of assets and liabilities; and |
• |
Most critical judgments in applying accounting policies. |
| Page 98 | Thomson Reuters Annual Report 2024 |
Thomson Reuters Annual Report 2024 |
Page 99 |
Revenues by type |
Legal Professionals |
Corporates |
Tax & Accounting Professionals |
Reuters News |
Global Print |
Eliminations/ Rounding |
Total |
|||||||||||||||||||||||||||||||||||||||||||||||||
Year ended December 31, |
2024 |
2023 |
2024 |
2023 |
2024 |
2023 |
2024 |
2023 |
2024 |
2023 |
2024 |
2023 |
2024 |
2023 |
||||||||||||||||||||||||||||||||||||||||||
Recurring |
- |
- |
( |
( |
||||||||||||||||||||||||||||||||||||||||||||||||||||
Transactions |
- |
- |
- |
- |
||||||||||||||||||||||||||||||||||||||||||||||||||||
Global Print |
- |
- |
- |
- |
- |
- |
- |
- |
- |
- |
||||||||||||||||||||||||||||||||||||||||||||||
Total |
( |
( |
||||||||||||||||||||||||||||||||||||||||||||||||||||||
Revenues by geography (1) |
Legal Professionals |
Corporates |
Tax & Accounting Professionals |
Reuters News |
Global Print |
Eliminations/ Rounding |
Total |
|||||||||||||||||||||||||||||||||||||||||||||||||
Year ended December 31, |
2024 |
2023 |
2024 |
2023 |
2024 |
2023 |
2024 |
2023 |
2024 |
2023 |
2024 |
2023 |
2024 |
2023 |
||||||||||||||||||||||||||||||||||||||||||
U.S. |
( |
( |
||||||||||||||||||||||||||||||||||||||||||||||||||||||
Canada (country of domicile) |
- |
- |
||||||||||||||||||||||||||||||||||||||||||||||||||||||
Other |
- |
- |
||||||||||||||||||||||||||||||||||||||||||||||||||||||
Americas (North America, Latin America, South America) |
( |
( |
||||||||||||||||||||||||||||||||||||||||||||||||||||||
U.K. |
- |
- |
||||||||||||||||||||||||||||||||||||||||||||||||||||||
Other |
- |
- |
||||||||||||||||||||||||||||||||||||||||||||||||||||||
EMEA (Europe, Middle East and Africa) |
- |
- |
||||||||||||||||||||||||||||||||||||||||||||||||||||||
Asia Pacific |
- |
- |
||||||||||||||||||||||||||||||||||||||||||||||||||||||
Total |
( |
( |
||||||||||||||||||||||||||||||||||||||||||||||||||||||
(1) |
Revenues by geography are based on the location of the customer. Revenues from the Reuters News agreement with LSEG’s Data & Analytics business, the Company’s largest customer, are included in the U.K. |
| Page 100 | Thomson Reuters Annual Report 2024 |
December 31, | ||||||
2024 |
2023 |
2022 | ||||
| Deferred revenue | ||||||
December 31, |
||||||||
2024 |
2023 |
|||||||
| 1 year | ||||||||
| Between 1 and 2 years | ||||||||
| Between 2 and 3 years | ||||||||
| Later than 3 years | ||||||||
Thomson Reuters Annual Report 2024 |
Page 101 |
Legal Professionals |
Corporates |
Tax & Accounting Professionals |
Reuters News |
Global Print |
Eliminations/ Rounding |
Total |
||||||||||||||||||||||||||||||||||||||||||||||||||
Year ended December 31, |
2024 |
2023 | 2024 |
2023 | 2024 |
2023 | 2024 |
2023 | 2024 |
2023 | 2024 |
2023 | 2024 |
2023 | ||||||||||||||||||||||||||||||||||||||||||
| Revenues | ( |
( |
||||||||||||||||||||||||||||||||||||||||||||||||||||||
| Staff costs (1) |
( |
( |
( |
( |
( |
( |
( |
( |
( |
( |
( |
( |
||||||||||||||||||||||||||||||||||||||||||||
| Goods and services (1) |
( |
( |
( |
( |
( |
( |
( |
( |
( |
( |
( |
( |
||||||||||||||||||||||||||||||||||||||||||||
| Other expenses | ( |
( |
( |
( |
( |
( |
( |
( |
( |
( |
- |
- |
( |
( |
||||||||||||||||||||||||||||||||||||||||||
Fair value adjustments on acquired deferred revenue |
- |
- |
||||||||||||||||||||||||||||||||||||||||||||||||||||||
Reportable segments adjusted EBITDA |
||||||||||||||||||||||||||||||||||||||||||||||||||||||||
Corporate costs |
( |
( |
||||||||||||||||||||||||||||||||||||||||||||||||||||||
Remove fair value adjustments on acquired deferred revenue |
( |
( |
||||||||||||||||||||||||||||||||||||||||||||||||||||||
Fair value adjustments (see note 5) |
( |
|||||||||||||||||||||||||||||||||||||||||||||||||||||||
Depreciation |
( |
( |
||||||||||||||||||||||||||||||||||||||||||||||||||||||
Amortization of computer software |
( |
( |
||||||||||||||||||||||||||||||||||||||||||||||||||||||
Amortization of other identifiable intangible assets |
( |
( |
||||||||||||||||||||||||||||||||||||||||||||||||||||||
Other operating gains, net |
||||||||||||||||||||||||||||||||||||||||||||||||||||||||
Operating profit |
||||||||||||||||||||||||||||||||||||||||||||||||||||||||
Net interest expense |
( |
( |
||||||||||||||||||||||||||||||||||||||||||||||||||||||
Other finance income (costs) |
( |
|||||||||||||||||||||||||||||||||||||||||||||||||||||||
Share of post-tax earnings in equity method investments |
||||||||||||||||||||||||||||||||||||||||||||||||||||||||
Tax benefit (expense) |
( |
|||||||||||||||||||||||||||||||||||||||||||||||||||||||
Earnings from continuing operations |
||||||||||||||||||||||||||||||||||||||||||||||||||||||||
(1) |
Refer to note 5 for components of staff costs and definition of goods and services. |
• |
Segment adjusted EBITDA represents earnings or loss from continuing operations before tax expense or benefit, net interest expense, other finance costs or income, depreciation, amortization of computer software and other identifiable intangible assets, the Company’s share of post-tax earnings or losses in equity method investments, other operating gains and losses, certain asset impairment charges, corporate related items and fair value adjustments, including those related to acquired deferred revenue. |
• |
The Company does not consider these excluded items to be controllable operating activities for purposes of assessing the current performance of the reportable segments. |
• |
Each segment includes an allocation of costs, based on usage or other applicable measures, for centralized support services such as technology-related services, commercial operations, marketing costs, and product and content development. Additionally, product costs are allocated when one segment sells products managed by another segment. |
Year ended December 31, |
||||||||
2024 |
2023 |
|||||||
| Electronic, software & services | ||||||||
| Global Print | ||||||||
| Total | ||||||||
| Page 102 | Thomson Reuters Annual Report 2024 |
Geographic Information |
Non-Current Assets (1) |
|||||||
December 31, |
||||||||
2024 |
2023 |
|||||||
| U.S. | ||||||||
| Canada (country of domicile) | ||||||||
| Other | ||||||||
| Americas (North America, Latin America, South America) | ||||||||
| Switzerland | ||||||||
| U.K. | ||||||||
| Other | ||||||||
| EMEA (Europe, Middle East and Africa) | ||||||||
| Asia Pacific | ||||||||
| Total | ||||||||
| (1) | Non-current assets are primarily comprised of property and equipment, computer software, other identifiable intangible assets, goodwill and investments in equity method investees. |
Year ended December 31, |
||||||||
2024 |
2023 |
|||||||
| Salaries, commissions and allowances | ||||||||
| Share-based payments | ||||||||
| Post-employment benefits | ||||||||
| Total staff costs | ||||||||
| Goods and services (1) |
||||||||
| Content | ||||||||
| Telecommunications | ||||||||
| Facilities | ||||||||
| Fair value adjustments (2) |
( |
|||||||
| Total operating expenses | ||||||||
(1) |
Goods and services include technology-related expenses, professional fees, consulting, contractors, marketing and other general and administrative costs. |
| (2) | Fair value adjustments primarily represent gains or losses due to changes in foreign currency exchange rates on intercompany balances that arise in the ordinary course of business. |
Thomson Reuters Annual Report 2024 |
Page 103 |
Year ended December 31, |
||||||||
2024 |
2023 |
|||||||
| Consideration received or receivable: | ||||||||
| Cash and cash equivalents | ||||||||
| Fair value of contingent consideration | ||||||||
| Total consideration | ||||||||
| Trade and other receivables | ( |
( |
||||||
| Prepaid expenses and other current assets | ( |
( |
||||||
| Computer software | ( |
( |
||||||
| Goodwill | ( |
( |
||||||
| Other non-current assets |
( |
( |
||||||
| Total assets | ( |
( |
||||||
| Payables, accruals and provisions | ||||||||
| Deferred revenue | ||||||||
| Total liabilities | ||||||||
| Net assets disposed | ( |
( |
||||||
| Opening balance |
||||||||
| Other | ( |
( |
||||||
| Gain on sale before income tax | ||||||||
Year ended December 31, |
||||||||
2024 |
2023 |
|||||||
| Interest expense: | ||||||||
Debt |
||||||||
Derivative financial instruments - hedging activities |
( |
|||||||
Other, net (1) |
||||||||
| Fair value losses (gains) on cash flow hedges, transfer from equity (see note 20) | ( |
|||||||
| Net foreign exchange (gains) losses on debt | ( |
|||||||
| Net interest expense - debt and other | ||||||||
| Net interest expense - leases | ||||||||
| Net interest expense - pension and other post-employment benefit plans | ||||||||
| Interest income | ( |
( |
||||||
| Net interest expense | ||||||||
| (1) | The year ended December 31, 2023 included $ |
Year ended December 31, |
||||||||
2024 |
2023 |
|||||||
| Net (gains) losses due to changes in foreign currency exchange rates | ( |
|||||||
| Net losses on derivative instruments | ||||||||
| Other | ( |
|||||||
| Other finance (income) costs | ( |
|||||||
| Page 104 | Thomson Reuters Annual Report 2024 |
| December 31, |
||||||||
2024 |
||||||||
| YPL | ||||||||
| Other equity method investments | ||||||||
| Total equity method investments | ||||||||
Year ended December 31, |
||||||||
2024 |
||||||||
| YPL | ||||||||
| Other equity method investments | ( |
( |
||||||
| Total share of post-tax earnings in equity method investments |
||||||||
Year ended December 31, |
||||||||
2024 |
2023 |
|||||||
| (Decrease) increase in LSEG share price | ( |
|||||||
| Foreign exchange (losses) gains on LSEG shares | ( |
|||||||
| Dividend income | ||||||||
| Loss from forward contract | ( |
|||||||
| Gain (loss) from call options | ( |
|||||||
| Historical excluded equity adjustment (1) |
||||||||
| YPL - Share of post-tax earnings in equity method investments |
||||||||
(1) |
Represents income from the recognition of the remaining cumulative impact of equity transactions that were excluded from the Company’s investment in YPL. |
Thomson Reuters Annual Report 2024 |
Page 105 |
Six months ended June 30, |
Year ended December 31, |
|||||||
2024 |
2023 |
|||||||
Mark-to-market |
( |
|||||||
| Dividend income | ||||||||
| Loss from forward contract | ( |
|||||||
| Gain (loss) from call options | ( |
|||||||
| Net (loss) earnings | ( |
|||||||
| Total comprehensive (loss) income | ( |
|||||||
December 31, |
||||
2023 |
||||
| Assets | ||||
| Current assets | ||||
Non-current assets |
||||
| Total assets | ||||
Liabilities |
||||
| Current liabilities | ||||
Non-current liabilities |
||||
| Total liabilities | ||||
| Net assets attributable to YPL | ||||
| Net assets attributable to YPL - beginning period | ||||
| Net earnings attributable to YPL | ||||
| Distribution to owners | ( |
|||
| Net assets attributable to YPL - ending period | ||||
| Thomson Reuters % share | ||||
| Thomson Reuters $ share | ||||
| Historical excluded equity adjustment (1) |
( |
|||
| Thomson Reuters carrying amount | ||||
| (1) | Represents the cumulative impact of equity transactions excluded from the Company’s investment in YPL. |
Year ended December 31, |
||||||||
2024 |
2023 |
|||||||
| Current tax expense | ||||||||
| Deferred tax benefit | ( |
( |
||||||
| Total tax (benefit) expense | ( |
|||||||
| Page 106 | Thomson Reuters Annual Report 2024 |
Year ended December 31, |
||||||||
2024 |
2023 |
|||||||
Included in Other comprehensive (loss) income |
||||||||
| Deferred tax expense on cash flow hedges adjustments to equity | ||||||||
| Deferred tax expense on fair value adjustments on financial assets | ||||||||
| Deferred tax expense on remeasurement on defined benefit pension plans | ||||||||
Included in Equity |
||||||||
| Deferred tax expense on share-based payments | ||||||||
| Current tax benefit on share-based payments | ( |
( |
||||||
Year ended December 31, | ||||
2024 |
2023 | |||
| Income before tax | ||||
| Income before tax multiplied by the standard rate of Canadian corporate tax of 26.5% | ||||
| Effects of: | ||||
| Income taxes recorded at rates different from the Canadian tax rate | ( |
( | ||
| Tax losses for which no benefit is recognized | ||||
| Net non-taxable foreign exchange and other gains and losses |
||||
| Tax expense on changes in statutory intercompany investment values | ||||
| Recognition of tax losses that arose in prior years due to changes in statutory intercompany investment values |
( |
( | ||
| Provision for uncertain tax positions | ( |
( | ||
| Recognition of tax assets that arose in prior years | ( |
( | ||
| Derecognition of tax assets that arose in prior years | ||||
| Impact of changes in tax laws and rates | ( | |||
| Research and development credits | ( |
( | ||
| Other adjustments related to prior years | ||||
| Pillar Two top-up tax |
||||
| Withholding taxes | ||||
| Other differences | ||||
| Total tax (benefit) expense | ( |
|||
Thomson Reuters Annual Report 2024 |
Page 107 |
Year ended December 31, |
||||||||
2024 |
2023 |
|||||||
| Earnings attributable to common shareholders | ||||||||
Less: Dividends declared on preference shares |
( |
( |
||||||
| Earnings used in consolidated earnings per share | ||||||||
Less: Earnings from discontinued operations, net of tax |
( |
( |
||||||
| Earnings used in earnings per share from continuing operations | ||||||||
Year ended December 31, |
||||||||
2024 |
2023 |
|||||||
| Weighted-average number of common shares outstanding | ||||||||
Weighted-average number of vested DSUs |
||||||||
| Basic | ||||||||
Effect of stock options and TRSUs |
||||||||
Diluted |
||||||||
December 31, |
||||||||
2024 |
2023 |
|||||||
Cash |
||||||||
Cash at banks and on hand (1) |
||||||||
| Cash equivalents | ||||||||
Money market accounts and other securities |
||||||||
Cash and cash equivalents |
||||||||
| (1) | On January 2, 2025, the Company acquired cPaperless, LLC, doing business as SafeSend (“SafeSend”), for $million in cash, which was funded from cash at banks and on hand as of December 31, 2024. See note 33. |
| Page 108 | Thomson Reuters Annual Report 2024 |
December 31, |
||||||||
2024 |
2023 |
|||||||
| Trade receivables | ||||||||
| Less: allowance for expected credit losses | ( |
( |
||||||
| Less: allowance for sales adjustments | ( |
( |
||||||
| Net trade receivables | ||||||||
| Other receivables | ||||||||
| Trade and other receivables | ||||||||
December 31, |
||||||||
2024 |
2023 |
|||||||
| Current - 30 days | ||||||||
| Past due 31-60 days |
||||||||
| Past due 61-90 days |
||||||||
| Past due 91-180 days |
||||||||
| Past due >180 days | ||||||||
| Balance as of December 31 | ||||||||
December 31, |
||||||||
2024 |
2023 |
|||||||
| Balance at beginning of year | ||||||||
| Bad debt expense | ||||||||
| Write-offs | ( |
( |
||||||
| Acquisitions | ||||||||
| Disposals of businesses | ( |
( |
||||||
| Translation and other, net | ||||||||
| Balance at end of year | ||||||||
December 31, |
||||||||
2024 |
2023 |
|||||||
| Prepaid expenses | ||||||||
| Deferred commissions | ||||||||
| Current tax receivables | ||||||||
| Inventory | ||||||||
| Other current assets | ||||||||
| Prepaid expenses and other current assets | ||||||||
Thomson Reuters Annual Report 2024 |
Page 109 |
Land, Buildings and Building Improvements |
Computer Equipment |
Furniture, Fixtures and Other Equipment |
Total |
|||||||||||||||||||||||||
Cost: |
||||||||||||||||||||||||||||
| December 31, 2022 | ||||||||||||||||||||||||||||
| Additions: | ||||||||||||||||||||||||||||
Capital expenditures |
||||||||||||||||||||||||||||
Leases |
||||||||||||||||||||||||||||
Acquisitions |
||||||||||||||||||||||||||||
| Removed from service | ( |
( |
( |
( |
||||||||||||||||||||||||
| Disposals of businesses and property | ( |
( |
( |
( |
||||||||||||||||||||||||
| Translation and other, net | ||||||||||||||||||||||||||||
| December 31, 2023 | ||||||||||||||||||||||||||||
| Additions: | ||||||||||||||||||||||||||||
Capital expenditures |
||||||||||||||||||||||||||||
Leases |
||||||||||||||||||||||||||||
Acquisitions |
||||||||||||||||||||||||||||
| Removed from service | ( |
( |
( |
( |
||||||||||||||||||||||||
| Disposals of businesses and property | ( |
( |
( |
|||||||||||||||||||||||||
| Translation and other, net | ( |
( |
( |
( |
||||||||||||||||||||||||
December 31, 2024 |
||||||||||||||||||||||||||||
Accumulated depreciation: |
||||||||||||||||||||||||||||
| December 31, 2022 | ( |
( |
( |
( |
||||||||||||||||||||||||
| Depreciation | ( |
( |
( |
( |
||||||||||||||||||||||||
| Removed from service | ||||||||||||||||||||||||||||
| Disposals of businesses and property | ||||||||||||||||||||||||||||
| Translation and other, net | ( |
( |
( |
|||||||||||||||||||||||||
| December 31, 2023 | ( |
( |
( |
( |
||||||||||||||||||||||||
| Depreciation | ( |
( |
( |
( |
||||||||||||||||||||||||
| Removed from service | ||||||||||||||||||||||||||||
| Disposals of businesses and property | ||||||||||||||||||||||||||||
| Translation and other, net | ||||||||||||||||||||||||||||
December 31, 2024 |
( |
( |
( |
( |
||||||||||||||||||||||||
Carrying amount: |
||||||||||||||||||||||||||||
| December 31, 2023 | ||||||||||||||||||||||||||||
December 31, 2024 |
||||||||||||||||||||||||||||
| Page 110 | Thomson Reuters Annual Report 2024 |
Internally Developed |
Acquisitions – Business Combinations (1) |
Purchased |
Total |
|||||||
Cost: |
||||||||||
December 31, 2022 |
||||||||||
Additions |
||||||||||
Removed from service |
( |
( |
( |
|||||||
Disposals of businesses |
( |
( |
||||||||
| Translation and other, net | ||||||||||
| December 31, 2023 | ||||||||||
Additions |
||||||||||
Removed from service |
( |
( |
||||||||
Disposals of businesses |
( |
( |
||||||||
| Translation and other, net | ( |
( |
( |
|||||||
December 31, 2024 |
||||||||||
Accumulated amortization: |
||||||||||
December 31, 2022 |
( |
( |
( |
( |
||||||
Amortization |
( |
( |
( |
( |
||||||
Removed from service |
||||||||||
Disposals of businesses |
||||||||||
| Translation and other, net | ( |
( |
||||||||
| December 31, 2023 | ( |
( |
( |
( |
||||||
Amortization |
( |
( |
( |
( |
||||||
Removed from service |
||||||||||
Disposals of businesses |
||||||||||
| Translation and other, net | ( |
( |
( |
|||||||
December 31, 2024 |
( |
( |
( |
( |
||||||
Carrying amount: |
||||||||||
December 31, 2023 |
||||||||||
December 31, 2024 |
(1) |
See note 30 for further information on acquired software assets. |
Thomson Reuters Annual Report 2024 |
Page 111 |
Indefinite Useful Life |
Finite Useful Life |
|||||||||||||||||||||||||||
Trade Names |
Trade Names |
Customer Relationships |
Databases and Content |
Other |
Total |
|||||||||||||||||||||||
Cost: |
||||||||||||||||||||||||||||
December 31, 2022 |
||||||||||||||||||||||||||||
Acquisitions |
||||||||||||||||||||||||||||
Disposals of businesses |
( |
( |
( |
|||||||||||||||||||||||||
Translation and other, net |
||||||||||||||||||||||||||||
December 31, 2023 |
||||||||||||||||||||||||||||
Acquisitions |
||||||||||||||||||||||||||||
Disposals of businesses |
( |
( |
||||||||||||||||||||||||||
Translation and other, net |
( |
( |
( |
( |
( |
|||||||||||||||||||||||
December 31, 2024 |
||||||||||||||||||||||||||||
Accumulated amortization: |
||||||||||||||||||||||||||||
December 31, 2022 |
( |
( |
( |
( |
( |
|||||||||||||||||||||||
Amortization |
( |
( |
( |
( |
( |
|||||||||||||||||||||||
Disposals of businesses |
||||||||||||||||||||||||||||
Translation and other, net |
( |
( |
( |
( |
||||||||||||||||||||||||
December 31, 2023 |
( |
( |
( |
( |
( |
|||||||||||||||||||||||
Amortization |
( |
( |
( |
( |
||||||||||||||||||||||||
Disposals of businesses |
||||||||||||||||||||||||||||
Translation and other, net |
||||||||||||||||||||||||||||
December 31, 2024 |
( |
( |
( |
( |
( |
|||||||||||||||||||||||
Carrying amount: |
||||||||||||||||||||||||||||
December 31, 2023 |
||||||||||||||||||||||||||||
December 31, 2024 |
||||||||||||||||||||||||||||
December 31, |
||||||||
2024 |
2023 |
|||||||
Cost: |
||||||||
Balance as of January 1, |
||||||||
Acquisitions |
||||||||
Disposals of businesses |
( |
( |
||||||
Translation and other, net |
( |
|||||||
Carrying amount as of December 31: |
||||||||
| Page 112 | Thomson Reuters Annual Report 2024 |
October 1, |
||||
2024 |
||||
Legal Professionals |
||||
Corporates |
||||
Tax & Accounting Professionals |
||||
Reuters News |
||||
Global Print |
||||
Thomson Reuters Annual Report 2024 |
Page 113 |
Cash-Generating Unit |
Perpetual Growth Rate (1) |
Discount Rate |
Tax Rate |
|||||||||
Legal Professionals |
||||||||||||
Corporates |
||||||||||||
Tax & Accounting Professionals |
||||||||||||
Reuters News |
||||||||||||
Global Print |
( |
|||||||||||
| (1) | The perpetual growth rate is applied to the final year of cash flow projections. |
December 31, 2024 |
Assets/ (Liabilities) at Amortized Cost |
Assets/ (Liabilities) at Fair Value through Earnings |
Assets at Fair Value through Other Comprehensive Income or Loss |
Derivatives Used for Hedging (1) |
Total |
|||||||||||||||
| Cash and cash equivalents | ||||||||||||||||||||
| Trade and other receivables | ||||||||||||||||||||
| Other financial assets - current | ||||||||||||||||||||
| Other financial assets - non-current |
||||||||||||||||||||
| Current indebtedness | ( |
( |
||||||||||||||||||
| Trade payables (see note 22) | ( |
( |
||||||||||||||||||
| Accruals (see note 22) | ( |
( |
||||||||||||||||||
| Other financial liabilities - current (2) |
( |
( |
( |
( |
||||||||||||||||
| Long-term indebtedness | ( |
( |
||||||||||||||||||
| Other financial liabilities - non-current (3) |
( |
( |
( |
|||||||||||||||||
| Total | ( |
( |
( |
|||||||||||||||||
| Page 114 | Thomson Reuters Annual Report 2024 |
December 31, 2023 |
Assets/ (Liabilities) at Amortized Cost |
Assets/ (Liabilities) at Fair Value through Earnings |
Assets at Fair Value through Other Comprehensive Income or Loss |
Derivatives Used for Hedging (1) |
Total |
|||||||||||||||
| Cash and cash equivalents | ||||||||||||||||||||
| Trade and other receivables | ||||||||||||||||||||
| Other financial assets - current | ||||||||||||||||||||
| Other financial assets - non-current |
||||||||||||||||||||
| Current indebtedness | ( |
( |
||||||||||||||||||
| Trade payables (see note 22) | ( |
( |
||||||||||||||||||
| Accruals (see note 22) | ( |
( |
||||||||||||||||||
| Other financial liabilities - current (2)(4) |
( |
( |
( |
|||||||||||||||||
| Long-term indebtedness | ( |
( |
||||||||||||||||||
| Other financial liabilities - non-current (3) |
( |
( |
( |
|||||||||||||||||
| Total | ( |
( |
||||||||||||||||||
| (1) | Derivatives are entered into with specific objectives for each transaction, and are linked to specific assets, liabilities, firm commitments or highly probable forecasted transactions. |
| (2) | Includes lease liabilities of $ |
| (3) | Includes lease liabilities of $ |
| (4) | Includes a commitment to repurchase up to $ pre-defined plan with its broker to repurchase the Company’s shares during its internal trading blackout period. See note 25. |
Carrying Amount |
Fair Value |
|||||||||||||||||||||||
December 31, 2024 |
Primary Debt Instruments |
Derivative Instruments |
Primary Debt Instruments |
Derivative Instruments |
||||||||||||||||||||
| $ |
||||||||||||||||||||||||
| |
||||||||||||||||||||||||
| |
||||||||||||||||||||||||
| (1) |
||||||||||||||||||||||||
| |
||||||||||||||||||||||||
| |
||||||||||||||||||||||||
| Total | ||||||||||||||||||||||||
| Current portion | ||||||||||||||||||||||||
| Long-term portion | ||||||||||||||||||||||||
Thomson Reuters Annual Report 2024 |
Page 115 |
Carrying Amount |
Fair Value |
|||||||||||||||||||||||
December 31, 2023 |
Primary Debt Instruments |
Derivative Instruments (Asset) |
Primary Debt Instruments |
Derivative Instruments (Asset) |
||||||||||||||||||||
| Commercial paper | ||||||||||||||||||||||||
| $ |
( |
( |
||||||||||||||||||||||
| (2) |
||||||||||||||||||||||||
| |
||||||||||||||||||||||||
| |
- |
- |
||||||||||||||||||||||
| (1) |
||||||||||||||||||||||||
| |
||||||||||||||||||||||||
| |
||||||||||||||||||||||||
| Total | ( |
( |
||||||||||||||||||||||
| Current portion | ||||||||||||||||||||||||
| Long-term portion | ( |
|||||||||||||||||||||||
| (1) | Originally issued $ |
| (2) | Originally issued $ |
• |
$ |
• |
$ |
• |
$ |
• |
$ |
• |
$ |
Received |
Paid |
Hedged Risk |
Year of Maturity |
Principal Amount | ||||
Cash flow hedges |
||||||||
| |
US$ | |||||||
| Page 116 | Thomson Reuters Annual Report 2024 |
December 31, |
December 31, |
|||||||||||||||||||
2024 |
2023 |
2024 |
2023 |
|||||||||||||||||
Before Currency Hedging Arrangements |
After Currency Hedging Arrangements (1) |
|||||||||||||||||||
| Canadian dollar | ||||||||||||||||||||
| U.S. dollar | ||||||||||||||||||||
| (1) | Includes fair value adjustments of $ |
Year ended December 31, |
||||||||||||||||||||
2024 |
2023 | |||||||||||||||||||
Fair Value Loss Through Earnings |
Fair Value Gain Through Equity |
Fair Value (Loss) Gain Through Earnings |
Fair Value Loss Through Equity |
|||||||||||||||||
| Foreign exchange contracts | ( |
( |
||||||||||||||||||
| Hedging instruments: | ||||||||||||||||||||
Cross currency interest rate swaps - cash flow hedges |
( |
( |
||||||||||||||||||
Forward interest rate swaps - cash flow hedges |
||||||||||||||||||||
( |
( |
( |
||||||||||||||||||
Thomson Reuters Annual Report 2024 |
Page 117 |
Increase (decrease) impact on earnings from: |
£ |
€ |
C$ |
Other Currencies |
Total |
|||||||||||||||
| Financial assets and liabilities (1) |
( |
|||||||||||||||||||
| Receivables under indemnification arrangement | ( |
( |
( |
( |
||||||||||||||||
Non-permanent intercompany loans |
||||||||||||||||||||
| Total impact on earnings | ( |
|||||||||||||||||||
| (1) | Excludes debt which has been swapped into U.S. dollar obligations. |
• |
Cash investments are placed with high-quality financial institutions with limited exposure to any one institution. As of December 31, 2024, approximately “A-“ or higher by at least one of the major credit rating agencies; |
• |
Counterparties to derivative contracts are major investment-grade international financial institutions and exposure to any single counterparty is monitored and limited; and |
• |
The Company assesses the creditworthiness of its customers. |
| Page 118 | Thomson Reuters Annual Report 2024 |
December 31, 2024 |
2025 |
2026 |
2027 |
2028 |
2029 |
Thereafter |
Total |
|||||||||||||||||||||
| Notes/debentures (1) |
||||||||||||||||||||||||||||
| Interest payable (1) |
||||||||||||||||||||||||||||
| Debt-related hedges outflows (2) |
||||||||||||||||||||||||||||
| Debt-related hedges inflows (1) |
( |
( |
||||||||||||||||||||||||||
| Trade payables | ||||||||||||||||||||||||||||
| Accruals | ||||||||||||||||||||||||||||
| Lease liabilities | ||||||||||||||||||||||||||||
| Other financial liabilities | ||||||||||||||||||||||||||||
| Total | ||||||||||||||||||||||||||||
| December 31, 2023 | 2024 |
2025 |
2026 |
2027 |
2028 |
Thereafter |
Total |
|||||||||||||||||||||
| Commercial paper | ||||||||||||||||||||||||||||
| Notes/debentures (1) |
||||||||||||||||||||||||||||
| Interest payable (1) |
||||||||||||||||||||||||||||
| Debt-related hedges outflows (2) |
||||||||||||||||||||||||||||
| Debt-related hedges inflows (1) |
( |
( |
( |
|||||||||||||||||||||||||
| Trade payables | ||||||||||||||||||||||||||||
| Accruals | ||||||||||||||||||||||||||||
| Lease liabilities | ||||||||||||||||||||||||||||
| Foreign exchange contracts outflows (3) |
||||||||||||||||||||||||||||
| Foreign exchange contracts inflows (4) |
( |
( |
||||||||||||||||||||||||||
| Other financial liabilities | ||||||||||||||||||||||||||||
| Total | ||||||||||||||||||||||||||||
| (1) | Represents contractual cash flows calculated using spot foreign exchange rates as of the period then ended. |
| (2) | Represents contractual U.S. dollar cash flows. |
| (3) | Represents contractual cash flows translated at the contract rate. |
| (4) | Represents contractual cash flows calculated using forward foreign exchange rates as of the period then ended. |
Thomson Reuters Annual Report 2024 |
Page 119 |
Moody’s |
S&P Global Ratings |
DBRS Limited |
Fitch | |||||
| Long-term debt | ||||||||
| Commercial paper | ||||||||
| Trend/Outlook |
December 31, |
||||||||
2024 |
2023 |
|||||||
| Current indebtedness | ||||||||
| Long-term indebtedness | ||||||||
| Total debt | ||||||||
| Swaps | ( |
|||||||
| Total debt after swaps | ||||||||
| Remove fair value adjustments for hedges (1) |
||||||||
| Total debt after currency hedging arrangements | ||||||||
| Remove transaction costs, premiums or discounts, included in the carrying value of debt | ||||||||
| Add: Lease liabilities (current and non-current) |
||||||||
| Less: cash and cash equivalents | ( |
( |
||||||
| Net debt | ||||||||
| (1) | Represents the interest-related fair value component of hedging instruments that are removed to reflect net cash outflow upon maturity. |
| Page 120 | Thomson Reuters Annual Report 2024 |
Notes and Debentures |
Commercial Paper |
Derivative Instruments (Assets) Liabilities |
Lease Liabilities |
Total Liabilities From Financing Activities |
||||||||||||||||
| December 31, 2022 | ( |
|||||||||||||||||||
| Repayments of debt | ( |
( |
||||||||||||||||||
| Proceeds from commercial paper | ||||||||||||||||||||
| Repayments of commercial paper | ( |
( |
||||||||||||||||||
| Payments of lease principal | ( |
( |
||||||||||||||||||
| Additional leases | ||||||||||||||||||||
| Foreign exchange movements | ( |
|||||||||||||||||||
| Other, net (1) |
||||||||||||||||||||
| December 31, 2023 | ( |
|||||||||||||||||||
| Repayments of debt | ( |
( |
||||||||||||||||||
| Proceeds from commercial paper | ||||||||||||||||||||
| Repayments of commercial paper | ( |
( |
||||||||||||||||||
| Payments of lease principal | ( |
( |
||||||||||||||||||
| Additional leases | ||||||||||||||||||||
| Acquisitions | ||||||||||||||||||||
| Foreign exchange movements | ( |
( |
( |
|||||||||||||||||
| Other, net (1) |
( |
|||||||||||||||||||
December 31, 2024 |
||||||||||||||||||||
| (1) | Includes amortization of transaction and discount costs as well as fair value movements on derivatives. |
• |
Level 1 – quoted prices (unadjusted) in active markets for identical assets or liabilities; |
• |
Level 2 – inputs other than quoted prices included within level 1 that are observable for the asset or liability, either directly (that is, as prices) or indirectly (that is, derived from prices); and |
• |
Level 3 – inputs for the asset or liability that are not based on observable market data (that is, unobservable inputs). |
December 31, 2024 |
Level 1 |
Level 2 |
Level 3 |
Total Balance |
||||||||||||
Assets | ||||||||||||||||
Money market accounts and other securities |
||||||||||||||||
Other receivables (1) |
||||||||||||||||
| Financial assets at fair value through earnings | ||||||||||||||||
| Financial assets at fair value through other comprehensive income (2) |
||||||||||||||||
| Total assets | ||||||||||||||||
| Liabilities | ||||||||||||||||
Derivatives used for hedging (3) |
( |
( |
||||||||||||||
Contingent consideration (4) |
( |
( |
||||||||||||||
| Financial liabilities at fair value through earnings | ( |
( |
( |
|||||||||||||
| Total liabilities | ( |
( |
( |
|||||||||||||
Thomson Reuters Annual Report 2024 |
Page 121 |
December 31, 2023 |
Level 1 |
Level 2 |
Level 3 |
Total Balance |
||||||||||||
Assets | ||||||||||||||||
Money market accounts |
||||||||||||||||
Other receivables (1) |
||||||||||||||||
Foreign exchange contracts (5) |
||||||||||||||||
| Financial assets at fair value through earnings | ||||||||||||||||
| Financial assets at fair value through other comprehensive income (2) |
||||||||||||||||
| Derivatives used for hedging (3) |
||||||||||||||||
| Total assets | ||||||||||||||||
| Liabilities | ||||||||||||||||
Foreign exchange contracts (5) |
( |
( |
||||||||||||||
Contingent consideration (4) |
( |
( |
||||||||||||||
| Financial liabilities at fair value through earnings | ( |
( |
( |
|||||||||||||
| Total liabilities | ( |
( |
( |
|||||||||||||
| (1) | Receivable under an indemnification arrangement and contingent receivable (see below). |
| (2) | Investments in entities over which the Company does not have control, joint control or significant influence. |
| (3) | Comprised of fixed-to-fixed |
| (4) | Obligations to pay additional consideration for prior acquisitions, based upon performance measures contractually agreed at the time of purchase, and to purchase shares from minority owners of a subsidiary. |
| (5) | Related to the management of foreign exchange risk on a portion of the Company’s former indirect investment in LSEG. |
• |
The fair value of investments reflect pricing from equity funding rounds, as applicable, and quoted market prices; |
• |
The fair value of cross-currency interest rate swaps and foreign exchange contracts are calculated as the present value of the estimated future cash flows based on observable yield curves; |
• |
The fair value of receivables due under indemnification arrangement considers estimated future cash flows, current market interest rates and non-performance risk; |
• |
The fair value of contingent receivables from the sale of FindLaw are based on a discounted cash flow analysis; |
• |
The fair value of contingent consideration liability is calculated based on estimates of future revenue performance or the achievement of certain commercial milestones. |
| Page 122 | Thomson Reuters Annual Report 2024 |
Financial assets |
Gross Financial Assets |
Gross Financial Liabilities Netted Against Assets |
Net Financial Assets in the Consolidated Statement of Financial Position |
Related Financial Liabilities Not Netted |
Net Amount |
|||||||||||||||
Cash and cash equivalents |
(1) |
|||||||||||||||||||
December 31, 2024 |
||||||||||||||||||||
Derivative financial assets |
(2) |
|||||||||||||||||||
Cash and cash equivalents |
(1) |
|||||||||||||||||||
December 31, 2023 |
||||||||||||||||||||
Financial liabilities |
Gross Financial Liabilities |
Gross Financial Assets Netted Against Liabilities |
Net Financial Liabilities in the Consolidated Statement of Financial Position |
Related Financial Assets Not Netted |
Net Amount |
|||||||||||||||
Derivative financial liabilities |
(3) |
|||||||||||||||||||
December 31, 2024 |
||||||||||||||||||||
Derivative financial liabilities |
(3) |
|||||||||||||||||||
December 31, 2023 |
||||||||||||||||||||
| (1) | Included within “Cash and cash equivalents” in the consolidated statement of financial position. |
| (2) | Included within “Other financial assets”, current or non-current as appropriate, in the consolidated statement of financial position. |
| (3) | Included within “Other financial liabilities”, current or non-current as appropriate, in the consolidated statement of financial position. |
December 31, |
||||||||
2024 |
2023 |
|||||||
| Cash surrender value of life insurance policies | ||||||||
| Deferred commissions | ||||||||
| Net defined benefit plan surpluses (see note 27) | ||||||||
| Other non-current assets(1) |
||||||||
| Total other non-current assets |
||||||||
| (1) | Includes a tax receivable from HM Revenue & Customs (“HMRC”) of $ |
December 31, |
||||||||
2024 |
2023 |
|||||||
| Trade payables | ||||||||
| Accruals | ||||||||
| Provisions (see note 23) | ||||||||
| Other current liabilities | ||||||||
| Total payables, accruals and provisions | ||||||||
Thomson Reuters Annual Report 2024 |
Page 123 |
December 31, |
||||||||
2024 |
2023 |
|||||||
| Net defined benefit plan obligations (see note 27) | ||||||||
| Deferred compensation and employee incentives | ||||||||
| Provisions | ||||||||
| Other non-current liabilities |
||||||||
| Total provisions and other non-current liabilities |
||||||||
Employee-Related |
Facilities-Related |
Other |
Total |
|||||||||||||
| Balance as of December 31, 2022 | ||||||||||||||||
| Charges (releases) | ( |
|||||||||||||||
| Utilization | ( |
( |
( |
( |
||||||||||||
| Translation and other, net | ( |
( |
||||||||||||||
| Balance as of December 31, 2023 | ||||||||||||||||
| Less: short-term provisions | ||||||||||||||||
| Long-term provisions | ||||||||||||||||
| Balance as of December 31, 2023 | ||||||||||||||||
| Charges | ||||||||||||||||
| Utilization | ( |
( |
( |
( |
||||||||||||
| Translation and other, net | ( |
( |
( |
|||||||||||||
Balance as of December 31, 2024 |
||||||||||||||||
Less: short-term provisions |
||||||||||||||||
Long-term provisions |
||||||||||||||||
Deferred tax liabilities |
Goodwill and Other Identifiable Intangible Assets |
Equity Method Investments |
Other |
Total |
||||||||||||
| December 31, 2022 | |
|
||||||||||||||
| Acquisitions | ||||||||||||||||
(Benefit) expense to income statement - continuing operations |
( |
( |
( |
|||||||||||||
| Translation and other, net | ( |
( |
||||||||||||||
| December 31, 2023 | ||||||||||||||||
| Acquisitions | ||||||||||||||||
Benefit to income statement - continuing operations |
( |
( |
( |
( |
||||||||||||
Expense to other comprehensive income |
||||||||||||||||
| Translation and other, net | ( |
( |
||||||||||||||
December 31, 2024 |
||||||||||||||||
| Page 124 | Thomson Reuters Annual Report 2024 |
Deferred tax assets |
Tax Losses and Other Attributes |
Goodwill and Other Identifiable Intangible Assets |
Employee Benefits and Compensation |
Other |
Total |
|||||||||||||||
| December 31, 2022 | |
|
||||||||||||||||||
| Acquisitions | ||||||||||||||||||||
Benefit (expense) to income statement – continuing operations |
( |
) | ||||||||||||||||||
| Expense to equity | ( |
) | ( |
) | ||||||||||||||||
| Translation and other, net | ( |
) | ||||||||||||||||||
| December 31, 2023 | ||||||||||||||||||||
| Acquisitions | ||||||||||||||||||||
Benefit (expense) to income statement – continuing operations |
( |
) |
||||||||||||||||||
| Expense to other comprehensive income | ( |
) |
( |
) |
( |
) | ||||||||||||||
| Expense to equity | ( |
) |
( |
) | ||||||||||||||||
| Translation and other, net | ( |
) |
( |
) |
( |
) |
( |
) | ||||||||||||
December 31, 2024 |
||||||||||||||||||||
| Net deferred tax asset as of December 31, 2023 | ||||||||||||||||||||
Net deferred tax asset as of December 31, 2024 |
||||||||||||||||||||
December 31, |
||||||||
2024 |
2023 |
|||||||
Deferred tax liabilities |
||||||||
| Deferred tax liabilities to be recovered after more than 12 months | ||||||||
| Deferred tax liabilities to be recovered within 12 months | ||||||||
| Total deferred tax liabilities | ||||||||
| Deferred tax assets | ||||||||
| Deferred tax assets to be recovered after more than 12 months | ||||||||
| Deferred tax assets to be recovered within 12 months | ||||||||
| Total deferred tax assets | ||||||||
| Net deferred tax asset | ||||||||
Carry Forward Loss/ Tax Attributes |
Tax Value |
Unrecognized Deferred Tax Assets |
Net Deferred Tax Assets |
|||||||||||||
| Canadian net operating losses | ( |
|||||||||||||||
| Net operating losses - other jurisdictions | ( |
|||||||||||||||
| Capital losses | ( |
|||||||||||||||
| Investment in subsidiaries | ( |
|||||||||||||||
| Other deductible temporary differences | ( |
|||||||||||||||
| U.S. state net operating losses (1) |
n/m |
( |
||||||||||||||
| Total | ( |
|||||||||||||||
(1) |
The aggregation of U.S. state net operating losses is not meaningful due to differing combination and apportionment rules in various states. |
Thomson Reuters Annual Report 2024 |
Page 125 |
Number of Common Shares |
Stated Share Capital |
Cumulative Redeemable Preference Share Capital |
Contributed Surplus |
Total Capital |
||||||||||||||||
| Balance, December 31, 2022 | $ |
$ |
$ |
$ |
||||||||||||||||
| Return of capital | ( |
( |
- | ( |
||||||||||||||||
| Shares issued under DRIP | - | - | ||||||||||||||||||
| Stock compensation plans (1) |
- | ( |
||||||||||||||||||
| Repurchases of common shares (2) |
( |
( |
- | - | ( |
|||||||||||||||
| Balance, December 31, 2023 | ||||||||||||||||||||
| Shares issued under DRIP | ||||||||||||||||||||
| Stock compensation plans (1) |
( |
|||||||||||||||||||
| Repurchases of common shares | ( |
( |
( |
|||||||||||||||||
Balance, December 31, 2024 |
$ |
$ |
$ |
$ |
||||||||||||||||
| (1) | Movements in contributed surplus include cash payments related to withholding tax on stock compensation plans. |
| (2) | Stated share capital was reduced by $pre-defined share repurchase plan. See share repurchases below. |
Year ended December 31, |
||||||||
2024 |
2023 |
|||||||
| Dividends declared per common share | $ |
$ | ||||||
| Dividends declared | ||||||||
| Dividends reinvested | ( |
( |
||||||
| Dividends paid | ||||||||
| Page 126 | Thomson Reuters Annual Report 2024 |
Year ended December 31, |
||||||||
2024 |
2023 |
|||||||
| Share repurchases (millions of U.S. dollars) | ||||||||
| Shares repurchased (number in millions) | ||||||||
| Share repurchases - average price per share | $ |
$ | ||||||
| Equity-settled | ||||||
| Type of award |
Vesting period |
Fair Value Measure |
Compensation expense based on: | |||
| Stock options |
option pricing model |
to grant date | ||||
| TRSUs |
share price |
to grant date | ||||
| PRSUs |
performance period |
share price |
to grant date and adjusting the number of awards expected to vest based on company performance |
Thomson Reuters Annual Report 2024 |
Page 127 |
Year ended December 31, |
||||||||
2024 |
2023 |
|||||||
| Weighted-average fair value | $ |
$ |
||||||
| Weighted-average of key assumptions: | ||||||||
Share price |
$ |
$ |
||||||
Exercise price |
$ |
$ |
||||||
Risk-free interest rate |
||||||||
Dividend yield |
||||||||
Volatility factor |
||||||||
Expected life (in years) |
||||||||
Awards outstanding (in thousands): |
Stock Options |
TRSUs |
PRSUs |
Total |
Weighted- Average Exercise Price (1) |
|||||||||||||||
| Outstanding as of December 31, 2022 | $ |
|||||||||||||||||||
| Granted | $ |
|||||||||||||||||||
| Exercised | ( |
) | ( |
) | ( |
) | ( |
) | $ |
|||||||||||
| Forfeited | ( |
) | ( |
) | ( |
) | ( |
) | $ |
|||||||||||
Outstanding as of December 31, 2023 |
$ |
|||||||||||||||||||
| Exercisable as of December 31, 2023 | - | - | $ |
|||||||||||||||||
Granted |
$ |
|||||||||||||||||||
Exercised |
( |
) |
( |
) |
( |
) |
( |
) |
$ |
|||||||||||
Forfeited |
( |
) |
( |
) |
( |
) |
( |
) |
$ |
|||||||||||
Outstanding as of December 31, 2024 |
$ |
|||||||||||||||||||
Exercisable as of December 31, 2024 |
- |
- |
$ |
|||||||||||||||||
| (1) | Represents the weighted-average exercise price for stock options. TRSUs and PRSUs are excluded as they entitle holders to receive common shares upon vesting without an associated exercise price. |
| Page 128 | Thomson Reuters Annual Report 2024 |
Stock Options |
TRSUs |
PRSUs |
ESPP |
Total | ||||||
December 31, 2024 |
||||||||||
| December 31, 2023 |
Range of exercise prices (1) |
Number Outstanding (in thousands) |
Weighted- Average Remaining Contractual Life (years) |
Weighted- Average Exercise Price for Awards Outstanding |
Number Exercisable (in thousands) |
Weighted- Average Exercise Price for Awards Exercisable | |||||
$50.01 - $55.00 |
$ |
$ | ||||||||
$75.01 - $80.00 |
$ |
$ | ||||||||
$85.01 - $90.00 |
$ |
$ | ||||||||
$100.01 - $105.00 |
$ |
$ | ||||||||
$120.01 - $125.00 |
$ |
$ | ||||||||
$155.01 - $160.00 |
$ |
$ | ||||||||
$165.01 - $170.00 |
$ |
$ | ||||||||
Total |
| (1) | TRSUs and PRSUs are excluded as they entitle holders to receive common shares upon vesting without an associated exercise price. |
Thomson Reuters Annual Report 2024 |
Page 129 |
Pension Plans (1) |
OPEB (1) |
Total (1) |
||||||||||||||||||||||
2024 |
2023 |
2024 |
2023 |
2024 |
2023 |
|||||||||||||||||||
| As of January 1 | ( |
( |
( |
( |
( |
( |
||||||||||||||||||
| Plan (expense) benefit recognized in income statement | ( |
( |
( |
( |
( |
|||||||||||||||||||
| Actuarial gains (losses) | ( |
( |
||||||||||||||||||||||
| Exchange differences | ||||||||||||||||||||||||
| Contributions paid | ||||||||||||||||||||||||
Net plan obligations as of December 31 |
( |
( |
( |
( |
( |
( |
||||||||||||||||||
Net plan surpluses recognized in non-current assets |
||||||||||||||||||||||||
Net plan obligations recognized in non-current liabilities |
( |
( |
||||||||||||||||||||||
(1) |
Includes amounts for immaterial defined benefit and OPEB plans that are not included in the detailed analysis below. |
Funded |
Unfunded (1) |
OPEB |
Total |
|||||||||||||||||||||||||||||
As of December 31, |
2024 |
2023 |
2024 |
2023 |
2024 |
2023 |
2024 |
2023 |
||||||||||||||||||||||||
| Present value of plan obligations | ( |
( |
( |
( |
( |
( |
( |
( |
||||||||||||||||||||||||
| Fair value of plan assets | ||||||||||||||||||||||||||||||||
| Net plan obligations | ( |
( |
( |
( |
( |
( |
( |
( |
||||||||||||||||||||||||
| Net plan surpluses | ||||||||||||||||||||||||||||||||
| Net plan obligations | ( |
( |
( |
( |
( |
( |
( |
( |
||||||||||||||||||||||||
| (1) | Unfunded pension plans consist of SERPs. |
Present Value of Defined Benefit Obligations |
Funded |
Unfunded |
OPEB |
Total |
||||||||||||||||||||||||||||
As of December 31, |
2024 |
2023 |
2024 |
2023 |
2024 |
2023 |
2024 |
2023 |
||||||||||||||||||||||||
| Opening defined benefit obligation | ( |
( |
( |
( |
( |
( |
( |
( |
||||||||||||||||||||||||
| Current service cost | ( |
( |
( |
( |
( |
( |
( |
( |
||||||||||||||||||||||||
| Administration fees | ( |
( |
( |
( |
||||||||||||||||||||||||||||
| Interest cost | ( |
( |
( |
( |
( |
( |
( |
( |
||||||||||||||||||||||||
Actuarial gains (losses) from changes in financial assumptions (1) |
( |
( |
( |
|||||||||||||||||||||||||||||
Actuarial gains from changes in demographic assumptions |
||||||||||||||||||||||||||||||||
| Experience losses | ( |
( |
( |
( |
( |
( |
( |
( |
||||||||||||||||||||||||
| Contributions by employees | ( |
( |
( |
( |
( |
( |
||||||||||||||||||||||||||
| Benefits paid | ||||||||||||||||||||||||||||||||
| Administration fees disbursements | ||||||||||||||||||||||||||||||||
| Plan amendments | ( |
|||||||||||||||||||||||||||||||
| Exchange differences | ( |
( |
( |
|||||||||||||||||||||||||||||
Closing defined benefit obligation |
( |
( |
( |
( |
( |
( |
( |
( |
||||||||||||||||||||||||
| (1) | For funded plans, gains in 2024, were primarily associated with an increase in discount rates and losses in 2023, were primarily associated with a decrease in discount rates, used to measure the obligation. |
| Page 130 | Thomson Reuters Annual Report 2024 |
As of December 31, |
2024 |
2023 | As of December 31, |
2024 |
2023 | |||||||||||||||||
| Active employees | U.S. | |||||||||||||||||||||
| Deferred | U.K. | |||||||||||||||||||||
| Retirees | Rest of world | |||||||||||||||||||||
Closing defined benefit obligation |
||||||||||||||||||||||
Fair Value of Plan Assets |
Funded |
Unfunded |
OPEB |
Total |
||||||||||||||||||||||||||||
As of December 31, |
2024 |
2023 |
2024 |
2023 |
2024 |
2023 |
2024 |
2023 |
||||||||||||||||||||||||
| Opening fair value of plan assets | ||||||||||||||||||||||||||||||||
| Interest income (1) |
||||||||||||||||||||||||||||||||
Return on plan assets excluding amounts included in interest income (2) |
( |
( |
||||||||||||||||||||||||||||||
| Contributions by employer | ||||||||||||||||||||||||||||||||
| Contributions by employees | ||||||||||||||||||||||||||||||||
| Benefits paid | ( |
( |
( |
( |
( |
( |
( |
( |
||||||||||||||||||||||||
| Administration fees disbursements | ( |
( |
( |
( |
||||||||||||||||||||||||||||
| Exchange differences | ( |
( |
||||||||||||||||||||||||||||||
Closing fair value of plan assets |
||||||||||||||||||||||||||||||||
| (1) | Interest income is calculated using the discount rate for the period. |
| (2) | Return on plan assets represents the difference between the actual return on plan assets and the interest income computed using the discount rate. |
Thomson Reuters Annual Report 2024 |
Page 131 |
Quoted (1) |
Unquoted |
Total |
||||||||||||||||||||||
| As of December 31, |
2024 |
2023 | 2024 |
2023 | 2024 |
2023 | ||||||||||||||||||
| Equities (2) |
||||||||||||||||||||||||
| Bonds (3) |
||||||||||||||||||||||||
Corporate |
||||||||||||||||||||||||
Government |
||||||||||||||||||||||||
Other fixed income |
||||||||||||||||||||||||
| Total Bonds |
||||||||||||||||||||||||
| Multi-asset (4) |
||||||||||||||||||||||||
| Derivatives |
( |
( |
||||||||||||||||||||||
| Cash and cash equivalents |
||||||||||||||||||||||||
| Other (5) |
||||||||||||||||||||||||
| Total |
||||||||||||||||||||||||
| (1) | Asset valuation based on Lev e l 1 evidence under the fair value hierarchy: quoted prices (unadjusted) in active markets for identical assets or liabilities. |
| (2) | Equities include direct shareholdings and funds focused on equity strategies. |
| (3) | Bonds include direct credit holdings and funds focused on fixed income strategies. Within this grouping, Government includes debt issued by national, state and local government agencies. In 2024 government bonds included an offset of $ |
| (4) | Multi-asset includes funds that invest in a range of asset classes. |
| (5) | Other is primarily real estate investments. |
Funded |
Unfunded |
OPEB |
||||||||||||||||||||||
As of December 31, |
2024 |
2023 |
2024 |
2023 |
2024 |
2023 |
||||||||||||||||||
| Discount rate | ||||||||||||||||||||||||
| Inflation assumption | ||||||||||||||||||||||||
| Rate of increase in pension payments | ||||||||||||||||||||||||
| Medic a l cost trend(1) |
||||||||||||||||||||||||
| (1) | Not applicable as of December 31, 2024 due to adoption of an HRA design for U.S. retiree medical plan benefits effective January 1, 2025. See “Plan amendment” above for additional information. |
| Page 132 | Thomson Reuters Annual Report 2024 |
• |
TRGP: Pri-2012/MP-2021 |
• |
TTC plan: SAPS S3 Light Tables with allowances for plan demographic specifics and longevity improvements. |
Life Expectation in Years | ||||||||||
December 31, 2024 |
Male |
Female | ||||||||
| Employee retiring as of December 31, 2024 at age 65 | ||||||||||
| Employee age 40 as of December 31, 2024 retiring at age 65 | ||||||||||
Life Expectation in Years | ||||||||||
| December 31, 2023 | Male |
Female | ||||||||
| Employee retiring as of December 31, 2023 at age 65 | ||||||||||
| Employee age 40 as of December 31, 2023 retiring at age 65 | ||||||||||
• |
Investment risk |
• |
Interest rate risk |
• |
Inflation risk |
• |
Currency risk: |
• |
Liquidity risk |
• |
Mortality risk |
Thomson Reuters Annual Report 2024 |
Page 133 |
Income Statement (1) |
Funded |
Unfunded |
OPEB |
Total | ||||||||||||
Year ended December 31, |
2024 |
2023 |
2024 |
2023 |
2024 |
2023 |
2024 |
2023 | ||||||||
| Current service cost | ||||||||||||||||
| Net interest cost | ||||||||||||||||
| Administration fees | ||||||||||||||||
| Plan amendments | ( |
( |
||||||||||||||
Defined benefit plan expense (income) |
( |
|||||||||||||||
| (1) | Current service cost and administration fees are included in the “Post-employment benefits” component of “Operating expenses” as set out in note 5. Net interest cost is reported in “Finance costs, net” as set out in note 8. Plan amendments are reported in “Other operating gains, net” in the consolidated income statement. |
Other Comprehensive (Income) Loss |
Funded |
Unfunded |
OPEB |
Total | ||||||||||||
Year ended December 31, |
2024 |
2023 |
2024 |
2023 |
2024 |
2023 |
2024 |
2023 | ||||||||
Remeasurement (gains) losses on defined benefit obligation: |
||||||||||||||||
| Due to financial assumption changes | ( |
( |
( |
( |
( |
|||||||||||
| Due to demographic assumption changes | ( |
( |
( | |||||||||||||
| Due to experience | ||||||||||||||||
| Return on plan assets less than (greater than) discount rate | ( |
( | ||||||||||||||
Total recognized in other comprehensive (income) loss before taxation |
( |
( |
( |
( |
||||||||||||
Accumulated Comprehensive Loss (Income) |
Funded |
Unfunded |
OPEB |
Total | ||||||||||||
2024 |
2023 |
2024 |
2023 |
2024 |
2023 |
2024 |
2023 | |||||||||
| Balance of accumulated comprehensive loss (income) as of January 1 | ( |
( |
||||||||||||||
| Net actuarial (gains) losses recognized in the year | ( |
( |
( |
( |
||||||||||||
Total accumulated comprehensive loss (income) as of December 31, |
( |
( |
||||||||||||||
Land, Buildings and Building Improvements |
Computer Equipment |
Furniture, Fixtures and Other Equipment |
Total | |||||
Year ended December 31, 2024 |
||||||||
| Carrying amount | ||||||||
| Depreciation | ||||||||
| Year ended December 31, 2023 | ||||||||
| Carrying amount | ||||||||
| Depreciation |
| Page 134 | Thomson Reuters Annual Report 2024 |
December 31, | ||||
2024 |
2023 | |||
| Within 1 year | ||||
| Between 1 and 2 years | ||||
| Between 2 and 3 years | ||||
| Between 3 and 4 years | ||||
| Between 4 and 5 years | ||||
| Later than 5 years | ||||
| Total undiscounted cash flows | ||||
| Lease liabilities included in the consolidated statement of financial position | ||||
| Current | ||||
Non-current |
||||
Year ended December 31, | ||||
2024 |
2023 | |||
Non-cash employee benefit charges |
||||
| Net (gains) losses on foreign exchange and derivative financial instruments | ( |
|||
| Fair value adjustments (see note 5) | ( |
|||
| Other | ( | |||
Year ended December 31, | ||||
2024 |
2023 | |||
| Trade and other receivables | ( | |||
| Prepaid expenses and other current assets | ||||
| Payables, accruals and provisions | ( |
( | ||
| Deferred revenue | ||||
| Income taxes (1) |
||||
| Other | ( |
( | ||
| (1) | Both periods include current tax liabilities that were recorded on the sale of LSEG shares (see note 9), for which the tax payments are included in investing activities. |
Thomson Reuters Annual Report 2024 |
Page 135 |
Year ended December 31, | ||||
2024 |
2023 | |||
| Operating activities - continuing operations | ( |
( | ||
| Investing activities - continuing operations | ( |
( | ||
| Investing activities - discontinued operations | ( | |||
| Total income taxes paid | ( |
( | ||
Year ended December 31, | ||||||||
2024 |
2023 | |||||||
Number of Transactions |
Cash Consideration |
Number of Transactions |
Cash Consideration | |||||
| Businesses acquired, net of cash | ||||||||
| Investments in businesses | ||||||||
| Asset acquisitions | ||||||||
| Deferred and contingent consideration payments | ||||||||
Date |
Company |
Acquiring Segments |
Description | |||
| Page 136 | Thomson Reuters Annual Report 2024 |
2024 | ||||||
Pagero |
Other |
Total | ||||
| Cash and cash equivalents | ||||||
| Trade receivables | ||||||
| Prepaid expenses and other current assets | ||||||
| Current assets | ||||||
| Property and equipment | ||||||
| Computer software | ||||||
| Other identifiable intangible assets | ||||||
| Equity method investments | ||||||
| Other non-current assets |
||||||
| Total assets | ||||||
| Payables and accruals | ( |
( |
( | |||
| Current taxes payable | ( |
( |
( | |||
| Deferred revenue | ( |
( |
( | |||
| Other financial liabilities | ( |
( |
( | |||
| Current liabilities | ( |
( |
( | |||
| Long-term indebtedness | ( |
( | ||||
| Provisions and other non-current liabilities |
( |
( | ||||
| Other financial liabilities | ( |
( |
( | |||
| Deferred tax | ( |
( |
( | |||
| Total liabilities | ( |
( |
( | |||
| Net assets acquired | ||||||
| Goodwill | ||||||
| Less: Fair value of previously held financial asset through other comprehensive income |
( |
( | ||||
| Total | ||||||
| Businesses acquired, net of cash | ||||||
Non-controlling interests |
||||||
2023 | ||||||||
Sureprep LLC |
Casetext, Inc. |
Other |
Total | |||||
| Cash and cash equivalents | ||||||||
| Trade receivables | ||||||||
| Prepaid expenses and other current assets | ||||||||
| Current assets | ||||||||
| Property and equipment | ||||||||
| Computer software | ||||||||
| Other identifiable intangible assets | ||||||||
| Other non-current assets |
||||||||
| Total assets | ||||||||
| Payables and accruals | ( |
( |
( |
( | ||||
| Deferred revenue | ( |
( |
( |
( | ||||
| Current liabilities | ( |
( |
( |
( | ||||
| Provisions and other non-current liabilities |
( |
( |
( | |||||
| Other financial liabilities | ||||||||
| Deferred tax | ( |
( |
( |
( | ||||
| Total liabilities | ( |
( |
( |
( | ||||
| Net assets acquired | ||||||||
| Goodwill | ||||||||
| Total | ||||||||
| Businesses acquired, net of cash | ||||||||
Thomson Reuters Annual Report 2024 |
Page 137 |
Page 138 |
Thomson Reuters Annual Report 2024 |
December 31, | ||||
2024 |
2023 | |||
| Within 1 year | ||||
| Between 1 and 2 years | ||||
| Between 2 and 3 years | ||||
| Between 3 and 4 years | ||||
| Between 4 and 5 years | ||||
| Later than 5 years | - | |||
Thomson Reuters Annual Report 2024 |
Page 139 |
Year ended December 31, | ||||
2024 |
2023 | |||
| Salaries and other benefits | ||||
| Share-based payments | ||||
| Total compensation | ||||
• |
$ |
• |
$ |
• |
$ |
• |
$ |
• |
$ |
Page 140 |
Thomson Reuters Annual Report 2024 |
Thomson Reuters Annual Report 2024 |
Page 141 |
Name |
Age |
Title | ||
Steve Hasker |
55 |
President & Chief Executive Officer | ||
Michael Eastwood |
58 |
Chief Financial Officer | ||
Kirsty Roth |
49 |
Chief Operations & Technology Officer | ||
David Wong |
40 | Chief Product Officer | ||
Ragunath Ramanathan |
53 |
President, Legal Professionals | ||
Elizabeth Beastrom |
57 |
President, Tax & Accounting Professionals | ||
Laura A. Clayton |
64 |
President, Corporates | ||
Paul Bascobert |
60 |
President, Reuters News | ||
Mary Alice Vuicic |
57 |
Chief People Officer | ||
Norie Campbell |
53 |
Chief Legal Officer & Company Secretary | ||
 |
Steve Hasker non-executive director of Appen Limited. He is a member of the Australia and New Zealand Institute of Chartered Accountants. Steve is based in Toronto, Ontario, Canada. | |
 |
Michael Eastwood | |
 |
Kirsty Roth | |
 |
David Wong | |
| Page 142 | Thomson Reuters Annual Report 2024 |
 |
Ragunath (Raghu) Ramanathan . | |
 |
Elizabeth Beastrom | |
 |
Laura A. Clayton (professionally known as Laura Clayton McDonnell) has been President, Corporates since March 2023. Prior to joining Thomson Reuters in March 2023, Laura was Senior Vice President, Sales – East, Canada and Latin America from January 2019 through February 2023 at ServiceNow, Inc., a cloud computing platform that helps companies manage digital workflows for enterprise operations. From November 2015 through December 2018, Laura was a Vice President at Microsoft Corporation, leading a team of industry sales, technical and business professionals in the New York area. Prior to that, she was Senior Vice President, North America Sales at Aspect Software from May 2014 through October 2015. From 2003 through 2014, Laura served in a number of positions at IBM, with her last role as Vice President, Strategic Services. Laura is a Trustee on the Thomson Reuters Foundation Board and serves on the board of directors of Signal AI, a private company, which provides insights for entities from data collected from traditional and social media. Laura holds a bachelor’s degree with honors in international business from San Jose State University and a JD and MBA in international business and finance from the University of California at Berkeley. She is licensed to practice law in the State of California and the District of Columbia. Laura resides in New York, New York, United States. | |
 |
Paul Bascobert . | |
 |
Mary Alice Vuicic | |
 |
Norie Campbell | |
Thomson Reuters Annual Report 2024 |
Page 143 |
Committee Memberships |
||||||||||||
Name |
Age |
Audit |
Corporate Governance |
Human Resources |
Risk |
Director Since | ||||||
David Thomson, Chairman |
67 | 1988 | ||||||||||
Steve Hasker |
55 | 2020 | ||||||||||
Kirk E. Arnold |
65 | • | • | Chair | 2020 | |||||||
W. Edmund Clark, C.M. (1) |
77 | • | Chair | 2015 | ||||||||
LaVerne Council |
63 | • | • | 2022 | ||||||||
Michael E. Daniels |
70 | • | Chair | • | • | 2014 | ||||||
Kirk Koenigsbauer |
57 | • | • | 2020 | ||||||||
Deanna Oppenheimer |
67 | • | • | 2020 | ||||||||
Simon Paris |
55 | • | • | • | 2020 | |||||||
Kim M. Rivera |
56 | • | • | 2019 | ||||||||
Barry Salzberg |
71 | Chair | • | • | 2015 | |||||||
Peter J. Thomson |
59 | • | 1995 | |||||||||
Beth Wilson |
56 | • | • | 2022 | ||||||||
| (1) | On December 23, 2024, it was announced that Mr. Clark will complete his service on the Thomson Reuters Board at the 2025 annual general meeting of shareholders, to be held on June 4, 2025. |
 |
David Thomson | |
|
Steve Hasker non-executive director of Appen Limited. He is a member of the Australia and New Zealand Institute of Chartered Accountants. Steve is based in Toronto, Ontario, Canada. | |
| Page 144 | Thomson Reuters Annual Report 2024 |
 |
Kirk E. Arnold non-executive director of IngersollRand plc and Trane Technologies. Kirk also serves on the boards of several private companies, including Housecall Pro and The Predictive Index. In addition, she is a Senior Lecturer at MIT Sloan School of Management and an advisor to the Center for MIT Entrepreneurship. Kirk received a bachelor’s degree from Dartmouth College. Kirk resides in Kennebunk, Maine, United States. | |
 |
W. Edmund Clark, C.M. non-executive director at Spin Master Corp. Ed has a BA from the University of Toronto, and an MA and Doctorate in Economics from Harvard University. Ed has also received honorary degrees from Mount Allison University, Queen’s University, Western University and the University of Toronto. In 2010, he was made an Officer of the Order of Canada, one of the country’s highest distinctions. Ed resides in Toronto, Ontario, Canada. | |
 |
LaVerne Council non-executive director of CONMED Corporation and Concentrix Corporation. She received her MBA from Illinois State University and her Bachelor of Business Administration in Computer Science from Western Illinois University. LaVerne also holds an honorary Doctorate of Business Administration from Drexel University. LaVerne resides in Great Falls, Virginia, United States. | |
 |
Michael E. Daniels | |
 |
Kirk Koenigsbauer | |
 |
Deanna Oppenheimer non-executive chair of the board of directors of InterContinental Hotels Group PLC, a director of the King’s Trust UK, a royal charity and a non-executive director of Slalom and is the founder of BoardReady. Deanna received a BA from the University of Puget Sound. Deanna resides in Seattle, Washington, United States. | |
Thomson Reuters Annual Report 2024 |
Page 145 |
 |
Simon Paris | |
 |
Kim M. Rivera | |
 |
Barry Salzberg | |
 |
Peter J. Thomson | |
 |
Beth Wilson non-executive director at IGM Financial Inc. and Power Corporation of Canada. Beth has a BComm from the University of Toronto and is a CPA. Beth resides in Toronto, Ontario, Canada. | |
| Page 146 | Thomson Reuters Annual Report 2024 |
Audit Committee Member |
Education/Experience | |
Barry Salzberg (Chair) |
• Former Global Chief Executive Officer of Deloitte Touche Tohmatsu Limited• Former Professor at Columbia Business School• Degree in accounting from Brooklyn College, a JD from Brooklyn Law School and an LLM in tax from the New York University | |
LaVerne Council |
• MBA and bachelor’s degree in business administration• Member of CONMED Corporation and Concentrix Corporation boards of directors and audit committees | |
Michael E. Daniels |
• Over 25 years of executive experience at IBM• Former member of the Tyco International Ltd. audit committee | |
Deanna Oppenheimer |
• Former Vice Chair of Global Retail Banking of Barclays PLC• Former President of Consumer Banking of Washington Mutual, Inc.• Former member of AXA Global Insurance audit committee• Former member of NCR Corporation audit committee | |
Simon Paris |
• Chief Executive Officer of Unit4• Former Chief Executive Officer of Finastra• Former Chair of the World Trade Board | |
Kim M. Rivera |
• Chief Legal and Business Affairs Officer of One Trust, LLC• Former President, Strategy and Business Management and Chief Legal Officer of HP Inc.• Supported audit committees of two publicly-traded Fortune 500 companies | |
Beth Wilson |
• Chair of the Chartered Professional Accountants of Canada• Audit Committee Chair at The Hospital for Sick Children and Woodgreen Foundation• Member of Power Corporation of Canada and IGM Financial Inc. audit committees• Bachelor of Commerce degree from University of Toronto and a Certified Professional Accountant in good standing with the Chartered Professional Accountants of Ontario• Former Chief Executive Officer of Dentons Canada LLP• Former audit partner and Managing Partner at KPMG | |
Thomson Reuters Annual Report 2024 |
Page 147 |
(in millions of U.S. dollars) |
2024 |
2023 |
||||||
Audit fees |
$ 13.4 | $ 12.8 | ||||||
Audit-related fees |
1.1 | 1.0 | ||||||
Tax fees |
0.7 | 1.4 | ||||||
All other fees |
- | - | ||||||
Total |
$ 15.2 |
$ 15.2 |
||||||
• |
The policy gives detailed guidance to management as to the specific types of services that have been pre-approved by the Audit Committee. |
• |
The policy requires the Audit Committee’s specific pre-approval of all other permitted types of services that have not already been pre-approved. |
• |
The Audit Committee’s charter allows the Audit Committee to delegate to one or more members the authority to evaluate and approve engagements in the event that the need arises for approval between Audit Committee meetings. Pursuant to this charter provision, the Audit Committee has delegated this authority to its Chair. If the Chair approves any such engagements, he must report his approval decisions to the full Audit Committee at its next meeting. |
• |
For the year ended December 31, 2024, none of the fees of Thomson Reuters described above made use of the de minimis exception to pre-approval provisions as provided for by Rule 2-01(c)(7)(i)(C) of SEC Regulation S-X and Section 2.4 of the Canadian Securities Administrators’ Multilateral Instrument 52-110 (Audit Committees). |
| Page 148 | Thomson Reuters Annual Report 2024 |
• |
Corporate governance, including the effectiveness of our Board; |
• |
Appointment of the Chief Executive Officer and other members of senior management and related succession planning; |
• |
Development of the long-term business strategy of Thomson Reuters and assessment of its implementation; and |
• |
Capital strategy. |
Thomson Reuters’ corporate governance practices include the following, which we believe are best practices for a Canadian public company with a controlling shareholder: • No members of the day-to-day • Woodbridge beneficially owns common shares that have one vote per share. Thomson Reuters has not issued a separate class of shares to Woodbridge with super-voting rights.• The Thomson Reuters Board of Directors is comprised of a majority of independent directors and the number of directors affiliated with Woodbridge is lower than the proportion of common shares controlled by it. Woodbridge’s beneficial ownership (together with its affiliates) as of March 3, 2025 was approximately 70% of our common shares and its representatives on the Thomson Reuters Board comprise approximately 23% of our directors.• As David Thomson is the Chairman of the Board, we have a separate Lead Independent Director.• As part of each Board meeting, the independent directors meet separately without management or Woodbridge-affiliated directors present.• All committees are comprised of a majority of independent directors (other than the Audit Committee, which is 100% independent directors).• The Board has an effective and transparent process to deal with related party transactions or conflicts of interest between Thomson Reuters and Woodbridge or directors affiliated with Woodbridge. The Corporate Governance Committee of our Board utilizes a policy for considering related party transactions that may take place between our company and Woodbridge, with any committee members related to Woodbridge abstaining from voting. In addition, any transactions between Woodbridge and our company are subject to public disclosure and other requirements under applicable Canadian securities laws. |
Thomson Reuters Annual Report 2024 |
Page 149 |
• |
The roles and responsibilities of the Chairman (David Thomson) and the CEO (Steve Hasker) are separate; |
• |
We have a Lead Independent Director (Michael E. Daniels); and |
• |
The Audit Committee is comprised entirely of independent directors (as required by applicable law) and the Corporate Governance Committee, Human Resources Committee and Risk Committee each have a majority of independent directors. |
Director Independence | ||||||||
Name of Director Nominee |
Management |
Independent |
Not Independent |
Reason for Non-Independence | ||||
David Thomson |
✓ |
A Chairman of Woodbridge | ||||||
Steve Hasker |
✓ |
✓ |
President & Chief Executive Officer of Thomson Reuters | |||||
Kirk E. Arnold |
✓ |
|||||||
W. Edmund Clark, C.M. (1) |
✓ |
Due to role as advisor to the trustee of the 2003 TIL Settlement and Woodbridge during the period | ||||||
LaVerne Council |
✓ |
|||||||
Michael E. Daniels |
✓ |
|||||||
Kirk Koenigsbauer |
✓ |
|||||||
Deanna Oppenheimer |
✓ |
|||||||
Simon Paris |
✓ |
|||||||
Kim M. Rivera |
✓ |
|||||||
Barry Salzberg |
✓ |
|||||||
Peter J. Thomson |
✓ |
A Chairman of Woodbridge | ||||||
Beth Wilson |
✓ |
|||||||
Total |
1 |
9 |
4 |
|||||
| (1) | On December 23, 2024, it was announced that Mr. Clark will complete his service on the Thomson Reuters Board at the 2025 annual general meeting of shareholders, to be held on June 4, 2025. |
| Page 150 | Thomson Reuters Annual Report 2024 |
Thomson Reuters Annual Report 2024 |
Page 151 |
• |
Our authorized share capital consisted of an unlimited number of common shares, an unlimited number of preference shares, issuable in series, and a Thomson Reuters Founders Share; and |
• |
We had outstanding 450,096,872 common shares, 6,000,000 Series II preference shares and one Thomson Reuters Founders Share. |
| Page 152 | Thomson Reuters Annual Report 2024 |
Common Shares (C$) |
Common Shares (US$) |
Preference Shares (C$) |
||||||||||||||||||||||||||||||||||||||||||||||
High |
Low |
Closing |
Trading Volume |
High |
Low |
Closing |
Trading Volume |
High |
Low |
Closing |
Trading Volume |
|||||||||||||||||||||||||||||||||||||
2024 |
||||||||||||||||||||||||||||||||||||||||||||||||
January |
203.14 | 191.42 | 199.61 | 4,755,621 | 151.17 | 143.31 | 148.62 | 5,742,000 | 13.70 | 13.20 | 13.55 | 32,876 | ||||||||||||||||||||||||||||||||||||
February |
216.26 | 200.99 | 214.24 | 5,879,633 | 160.29 | 149.09 | 157.79 | 7,200,462 | 14.15 | 13.38 | 13.95 | 73,791 | ||||||||||||||||||||||||||||||||||||
March |
215.90 | 210.75 | 210.80 | 5,567,023 | 159.29 | 155.09 | 155.83 | 6,265,818 | 13.99 | 13.50 | 13.50 | 32,836 | ||||||||||||||||||||||||||||||||||||
April |
211.35 | 206.11 | 207.93 | 4,795,058 | 155.30 | 150.22 | 151.10 | 6,382,294 | 13.61 | 13.10 | 13.40 | 82,575 | ||||||||||||||||||||||||||||||||||||
May |
240.37 | 208.41 | 234.54 | 6,536,746 | 175.79 | 151.48 | 172.11 | 9,572,702 | 14.36 | 13.50 | 14.01 | 55,122 | ||||||||||||||||||||||||||||||||||||
June |
235.46 | 225.74 | 230.61 | 11,115,811 | 172.25 | 165.22 | 168.57 | 8,937,378 | 14.01 | 13.40 | 13.60 | 58,364 | ||||||||||||||||||||||||||||||||||||
July |
231.51 | 222.56 | 223.75 | 8,938,123 | 169.22 | 160.63 | 161.92 | 11,998,162 | 14.02 | 13.50 | 13.90 | 62,087 | ||||||||||||||||||||||||||||||||||||
August |
230.82 | 217.02 | 230.82 | 7,442,213 | 171.18 | 154.77 | 171.18 | 8,861,804 | 13.85 | 13.47 | 13.70 | 29,718 | ||||||||||||||||||||||||||||||||||||
September |
235.98 | 225.52 | 230.69 | 7,258,037 | 173.76 | 166.24 | 170.60 | 5,302,649 | 13.92 | 13.55 | 13.63 | 37,424 | ||||||||||||||||||||||||||||||||||||
October |
233.36 | 225.22 | 227.91 | 5,111,249 | 170.54 | 163.64 | 163.64 | 5,263,783 | 13.82 | 13.50 | 13.82 | 40,758 | ||||||||||||||||||||||||||||||||||||
November |
236.87 | 224.36 | 228.44 | 6,650,680 | 171.14 | 160.72 | 162.59 | 6,848,919 | 14.25 | 13.65 | 14.25 | 92,580 | ||||||||||||||||||||||||||||||||||||
December |
241.65 | 228.44 | 230.82 | 5,690,651 | 170.56 | 160.38 | 160.38 | 5,086,668 | 15.15 | 14.25 | 14.99 | 95,514 | ||||||||||||||||||||||||||||||||||||
2025 |
||||||||||||||||||||||||||||||||||||||||||||||||
January |
244.65 | 221.65 | 244.23 | 5,550,283 | 169.04 | 154.46 | 168.25 | 6,157,382 | 15.25 | 14.70 | 15.15 | 76,461 | ||||||||||||||||||||||||||||||||||||
February |
258.63 | 237.57 | 258.63 | 9,524,739 | 179.32 | 168.06 | 178.82 | 12,599,643 | 15.30 | 14.80 | 15.03 | 180,344 | ||||||||||||||||||||||||||||||||||||
Thomson Reuters Annual Report 2024 |
Page 153 |
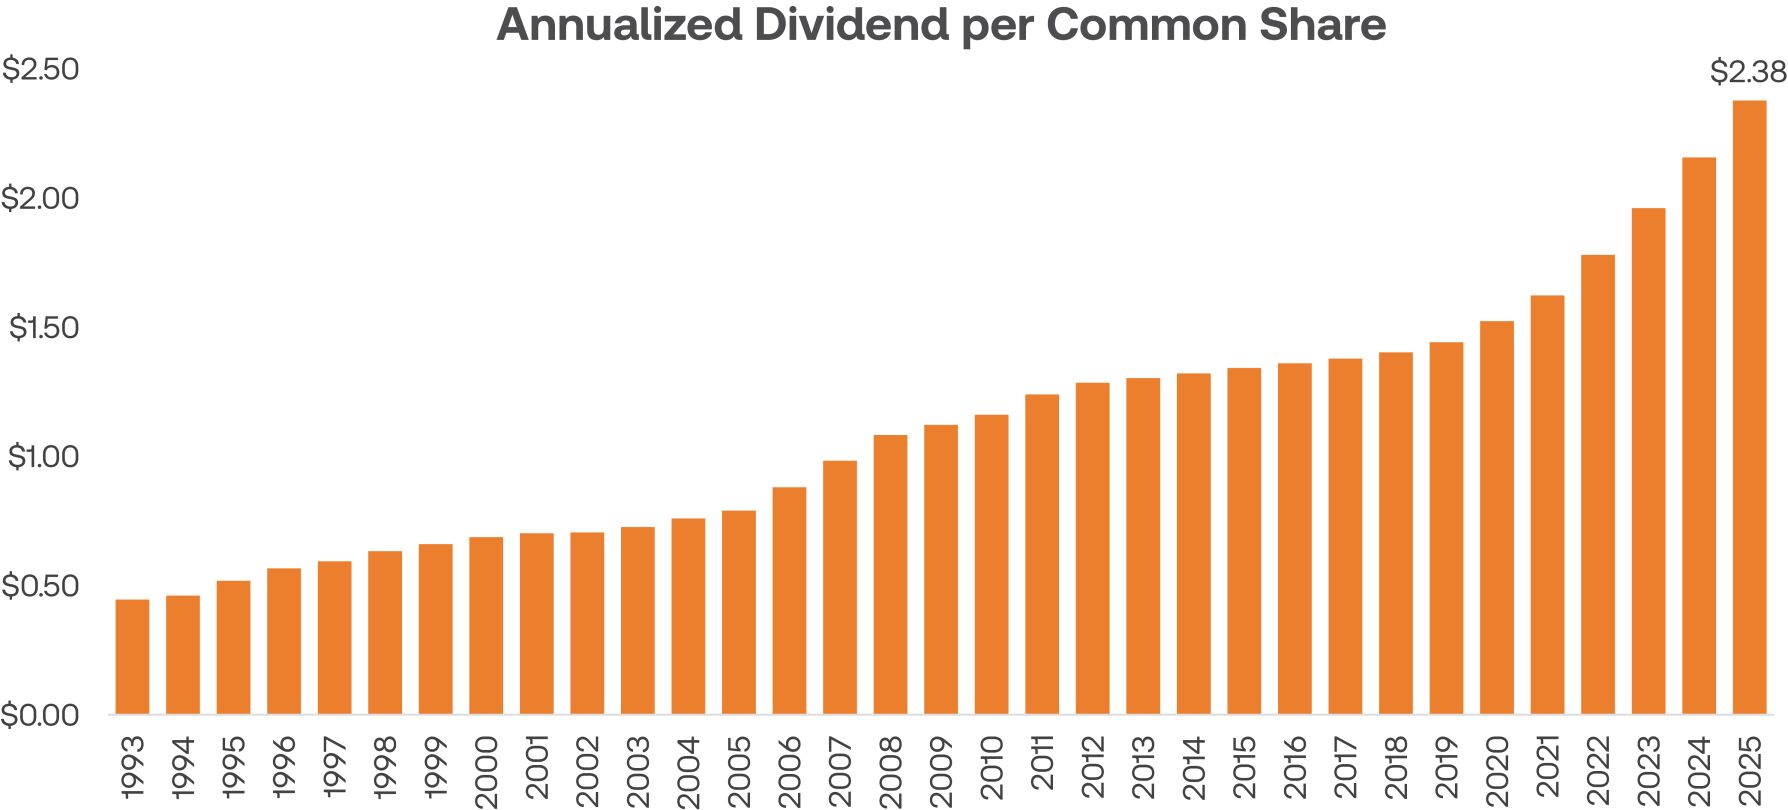
Dividend Currency (Default) |
Dividend Currency (For Electing Holders) | |||
Common shares |
U.S. dollars | Canadian dollars British pounds sterling | ||
DIs (representing common shares) |
British pounds sterling | U.S. dollars Canadian dollars | ||
Series II preference shares |
Canadian dollars | N/A | ||
| Page 154 | Thomson Reuters Annual Report 2024 |
Common Shares (US$) |
Series II Preference Shares (C$) | |||||||
2022 |
||||||||
Q1 |
$ | 0.445000 | C$ | 0.107445 | ||||
Q2 |
$ | 0.445000 | C$ | 0.140053 | ||||
Q3 |
$ | 0.445000 | C$ | 0.203345 | ||||
Q4 |
$ | 0.445000 | C$ | 0.257159 | ||||
2023 |
||||||||
Q1 |
$ | 0.490000 | C$ | 0.285658 | ||||
Q2 |
$ | 0.490000 | C$ | 0.293631 | ||||
Q3 |
$ | 0.490000 | C$ | 0.315825 | ||||
Q4 |
$ | 0.490000 | C$ | 0.317589 | ||||
2024 |
||||||||
Q1 |
$ | 0.540000 | C$ | 0.313279 | ||||
Q2 |
$ | 0.540000 | C$ | 0.311973 | ||||
Q3 |
$ | 0.540000 | C$ | 0.296486 | ||||
Q4 |
$ | 0.540000 | C$ | 0.267014 | ||||
2025 |
||||||||
Q1 |
$ | 0.595000 | C$ | * | ||||
*As of the date of this annual report, our company had not yet finalized the final dividend amount for the first quarter 2025 dividend on our Series II preference shares. | ||||||||
Type of Shares |
Country |
Transfer Agent/Registrar |
Location of Transfer Facilities | |||
Common shares |
Canada | Computershare Trust Company of Canada | Toronto; Montreal; Calgary; and Vancouver | |||
| United States | Computershare Trust Company N.A. | Canton, Massachusetts; and Jersey City, New Jersey | ||||
| United Kingdom | Computershare Investor Services PLC | Bristol, England | ||||
Depositary interests |
United Kingdom | Computershare Investor Services PLC | Bristol, England | |||
Series II preference shares |
Canada | Computershare Trust Company of Canada | Toronto | |||
Thomson Reuters Annual Report 2024 |
Page 155 |
| Page 156 | Thomson Reuters Annual Report 2024 |
• |
That Reuters shall at no time pass into the hands of any one interest, group or faction; |
• |
That the integrity, independence and freedom from bias of Thomson Reuters shall at all times be fully preserved; |
• |
That Reuters shall supply unbiased and reliable news services to newspapers, news agencies, broadcasters and other media subscribers and to businesses, governments, institutions, individuals and others with whom Reuters has or may have contracts; |
• |
That Thomson Reuters shall pay due regard to the many interests which it serves in addition to those of the media; and |
• |
That no effort shall be spared to expand, develop and adapt the news and other services and products of Thomson Reuters so as to maintain its leading position in the international news and information business. |
Thomson Reuters Annual Report 2024 |
Page 157 |
Name |
Country |
Director Since | ||
Kim Williams (Chairman) |
Australia | 2016 | ||
Linda Robinson |
U.K. | 2019 | ||
Pawel Dangel |
Poland | 2020 | ||
Anne Bouverot |
France | 2021 | ||
Aiko Doden |
Japan | 2021 | ||
Murilo Portugal |
Brazil | 2022 | ||
Nikiwe Bikitsha |
South Africa | 2023 | ||
Yuen Yuen Ang |
U.S. | 2023 | ||
Stephen Toope |
Canada | 2024 | ||
Naushad Forbes |
India | 2024 | ||
Michael Froman |
U.S. | 2024 | ||
Ann Marie Lipinski |
U.S. | 2024 | ||
Sharmila Nebhrajani |
U.K. | 2024 | ||
Tim Gardam |
U.K. | 2024 | ||
Aidan Eyakuze |
Tanzania | 2025 | ||
| Page 158 | Thomson Reuters Annual Report 2024 |
Subsidiary |
Jurisdiction of Incorporation/Formation | |
3276838 Nova Scotia Company |
Nova Scotia, Canada | |
Bedrijfsbeheer TRA B.V. |
The Netherlands | |
Capital Confirmation Inc. |
Delaware, United States | |
Casetext, Inc. |
Delaware, United States | |
HighQ Solutions Limited |
England | |
LiveNote Technologies Limited |
England | |
LN Holdings Limited |
Bermuda | |
Pagero AB |
Sweden | |
Pagero GmbH |
Germany | |
Pagero Sverge AB |
Sweden | |
Pagero UK Ltd. |
England | |
Reuters News & Media Inc. |
Delaware, United States | |
Reuters News & Media Limited |
England | |
SurePrep, LLC |
Delaware, United States | |
Thomson Reuters (Australia) Pty Limited |
Australia | |
Thomson Reuters (Legal) Inc. |
Minnesota, United States | |
Thomson Reuters (Professional) Australia Limited |
Australia | |
Thomson Reuters (Professional) UK Limited |
England | |
Thomson Reuters (Tax & Accounting) Inc. |
Texas, United States | |
Thomson Reuters (TRI) Inc. |
Delaware, United States | |
Thomson Reuters America Corporation |
Delaware, United States | |
Thomson Reuters Applications Inc. |
Delaware, United States | |
Thomson Reuters Brasil Conteúdo e Tecnologia Ltda |
Brazil | |
Thomson Reuters Canada Limited |
Ontario, Canada | |
Thomson Reuters Contact Center, S.A. de C.V. |
Mexico | |
Thomson Reuters Enterprise Centre GmbH |
Switzerland | |
Thomson Reuters Finance S.A. |
Luxembourg | |
Thomson Reuters Group Limited |
England | |
Thomson Reuters Holdco LLC |
Delaware, United States | |
Thomson Reuters Holdings B.V. |
The Netherlands | |
Thomson Reuters Holdings Inc. |
Delaware, United States | |
Thomson Reuters Holdings S.A. |
Luxembourg | |
Thomson Reuters Investment Holdings Limited |
England | |
Thomson Reuters MX Servicios, S.A. de C.V. |
Mexico | |
Thomson Reuters No. 4 Inc. |
Delaware, United States | |
Thomson Reuters No. 5 LLC |
Delaware, United States | |
Thomson Reuters No. 8 LLC |
Delaware, United States | |
Thomson Reuters U.S. LLC |
Delaware, United States | |
TR (2008) Limited |
England | |
TR 2023 LLC |
Delaware, United States | |
Thomson Reuters Annual Report 2024 |
Page 159 |
Subsidiary |
Jurisdiction of Incorporation/Formation | |
TR Finance LLC |
Delaware, United States | |
TR Holdings Limited |
Bermuda | |
TR U.S. Inc. |
Delaware, United States | |
TTC (1994) Limited |
England | |
TTC Holdings Limited |
Bermuda | |
West Publishing Corporation |
Minnesota, United States | |
| Page 160 | Thomson Reuters Annual Report 2024 |
Thomson Reuters Annual Report 2024 |
Page 161 |
Page/Document | ||||
Item 1. |
Cover Page |
Cover | ||
Item 2. |
Table of Contents |
1 | ||
Item 3. |
Corporate Structure |
|||
3.1 Name, Address And Incorporation |
152 | |||
3.2 Intercorporate Relationships |
159 | |||
Item 4. |
General Development of the Business |
|||
4.1 Three Year History |
3 | |||
4.2 Significant Acquisitions |
11, 32 | |||
Item 5. |
Describe the Business |
|||
5.1 General |
2-15 | |||
5.2 Risk Factors |
16-27 | |||
5.3 Companies With Asset-Backed Securities Outstanding |
N/A | |||
5.4 Companies With Mineral Projects |
N/A | |||
5.5 Companies With Oil And Gas Activities |
N/A | |||
Item 6. |
Dividends |
154-155 | ||
Item 7. |
Description of Capital Structure |
|||
7.1 General Description Of Capital Structure |
152-153 | |||
7.2 Constraints |
N/A | |||
7.3 Ratings |
155-156 | |||
Item 8. |
Market for Securities |
|||
8.1 Trading Price And Volume |
153 | |||
8.2 Prior Sales |
N/A | |||
Item 9. |
Escrowed Securities and Securities Subject to Contractual Restriction on Transfer |
N/A | ||
Item 10. |
Directors and Officers |
|||
10.1 Name, Occupation And Security Holding |
142-151 | |||
10.2 Cease Trade Orders, Bankruptcies, Penalties Or Sanctions |
161 | |||
10.3 Conflicts Of Interest |
N/A | |||
Item 11. |
Promoters |
N/A | ||
Item 12. |
Legal Proceedings and Regulatory Actions |
|||
12.1 Legal Proceedings |
51 | |||
12.2 Regulatory Actions |
51 | |||
Item 13. |
Interest of Management and Others in Material Transactions |
55 | ||
Item 14. |
Transfer Agents and Registrars |
155 |
| Page 162 | Thomson Reuters Annual Report 2024 |
Page/Document | ||||
Item 15. |
Material Contracts |
156-158 | ||
Item 16. |
Interest of Experts |
|||
16.1 Names Of Experts |
160 | |||
16.2 Interests Of Experts |
160 | |||
Item 17. |
Additional Information |
161 | ||
Item 18. |
Additional Disclosure for Companies Not Sending Information Circulars |
N/A |
Page/Document | ||
Annual Information Form |
See AIF Table | |
Audited Annual Financial Statements |
81-141 | |
Management’s Discussion And Analysis |
28-80 | |
Disclosure Controls And Procedures |
58 | |
Internal Control Over Financial Reporting |
||
a. Changes In Internal Controls Over Financial Reporting |
58 | |
b. Management’s Report On Internal Control Over Financial Reporting |
81 | |
c. Independent Auditor’s Report On Internal Control Over Financial Reporting |
82-83 | |
Notice Pursuant To Regulation BTR |
N/A | |
Audit Committee Financial Expert |
147 | |
Code Of Ethics |
151 | |
Principal Accountant Fees And Services |
148 | |
Off-Balance Sheet Arrangements |
50 | |
Material Cash Requirements |
45, 46, 50 | |
Identification Of The Audit Committee |
147 | |
Disclosure Regarding Foreign Jurisdictions that Prevent Inspections |
N/A |
Thomson Reuters Annual Report 2024 |
Page 163 |
THOMSON REUTERS 19 Duncan Street Toronto, Ontario M5H 3H1 Canada tel: +1 647 480 7000 tr.com |
|