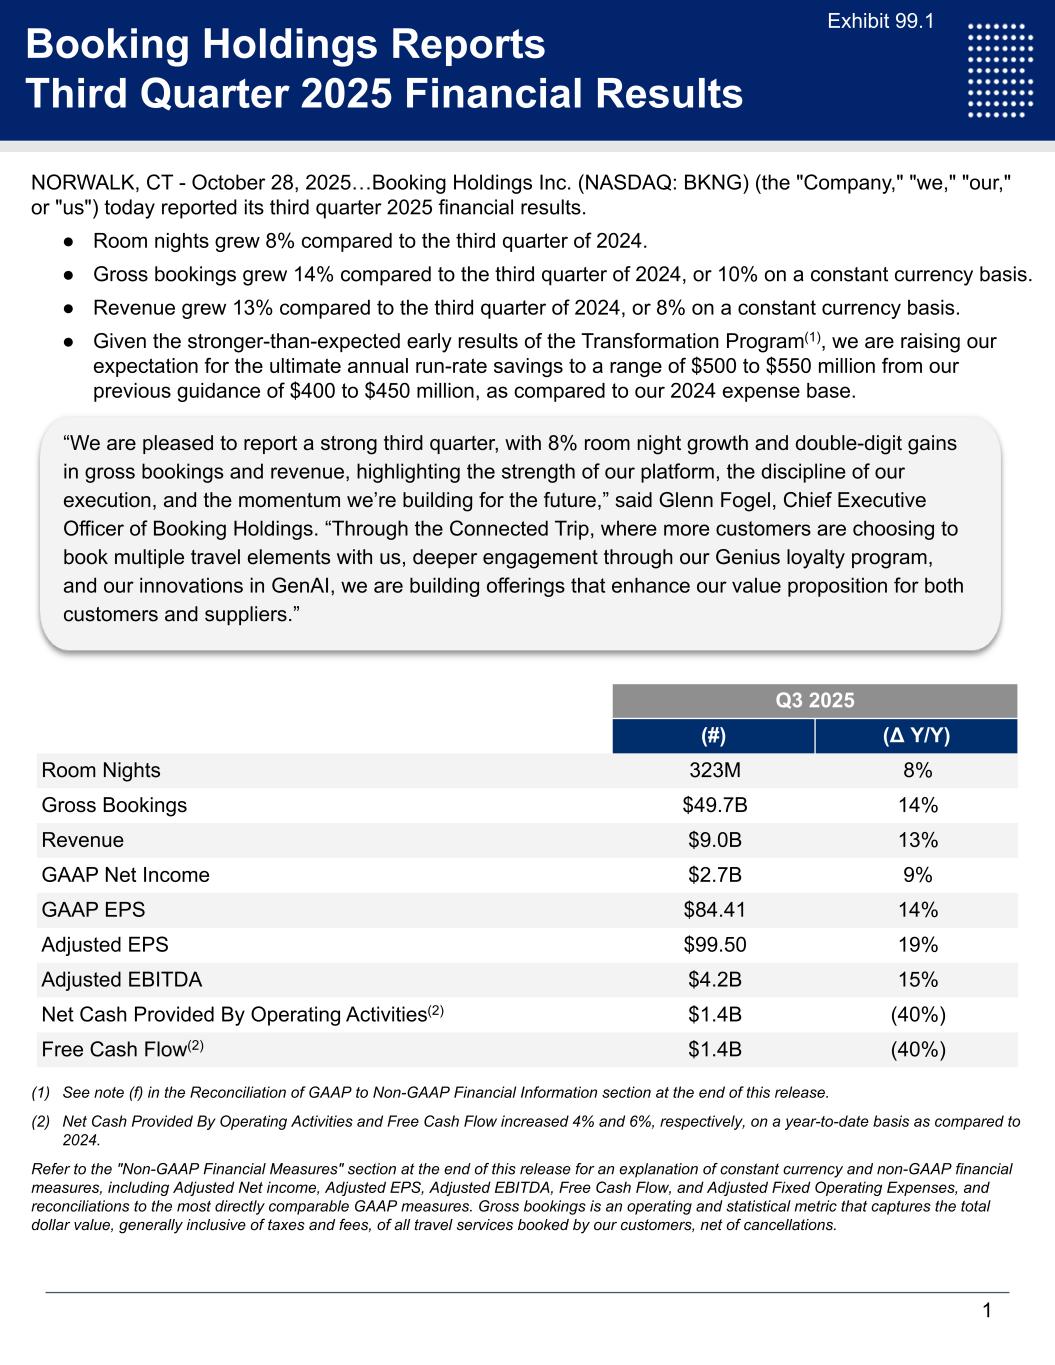
NORWALK, CT - October 28, 2025…Booking Holdings Inc. (NASDAQ: BKNG) (the "Company," "we," "our," or "us") today reported its third quarter 2025 financial results. ● Room nights grew 8% compared to the third quarter of 2024. ● Gross bookings grew 14% compared to the third quarter of 2024, or 10% on a constant currency basis. ● Revenue grew 13% compared to the third quarter of 2024, or 8% on a constant currency basis. ● Given the stronger-than-expected early results of the Transformation Program(1), we are raising our expectation for the ultimate annual run-rate savings to a range of $500 to $550 million from our previous guidance of $400 to $450 million, as compared to our 2024 expense base. Q3 2025 (#) (Δ Y/Y) Room Nights 323M 8% Gross Bookings $49.7B 14% Revenue $9.0B 13% GAAP Net Income $2.7B 9% GAAP EPS $84.41 14% Adjusted EPS $99.50 19% Adjusted EBITDA $4.2B 15% Net Cash Provided By Operating Activities(2) $1.4B (40%) Free Cash Flow(2) $1.4B (40%) (1) See note (f) in the Reconciliation of GAAP to Non-GAAP Financial Information section at the end of this release. (2) Net Cash Provided By Operating Activities and Free Cash Flow increased 4% and 6%, respectively, on a year-to-date basis as compared to 2024. Refer to the "Non-GAAP Financial Measures" section at the end of this release for an explanation of constant currency and non-GAAP financial measures, including Adjusted Net income, Adjusted EPS, Adjusted EBITDA, Free Cash Flow, and Adjusted Fixed Operating Expenses, and reconciliations to the most directly comparable GAAP measures. Gross bookings is an operating and statistical metric that captures the total dollar value, generally inclusive of taxes and fees, of all travel services booked by our customers, net of cancellations. 1 Non-GAAP Financial Measures Booking Holdings Reports Third Quarter 2025 Financial Results “We are pleased to report a strong third quarter, with 8% room night growth and double-digit gains in gross bookings and revenue, highlighting the strength of our platform, the discipline of our execution, and the momentum we’re building for the future,” said Glenn Fogel, Chief Executive Officer of Booking Holdings. “Through the Connected Trip, where more customers are choosing to book multiple travel elements with us, deeper engagement through our Genius loyalty program, and our innovations in GenAI, we are building offerings that enhance our value proposition for both customers and suppliers.”
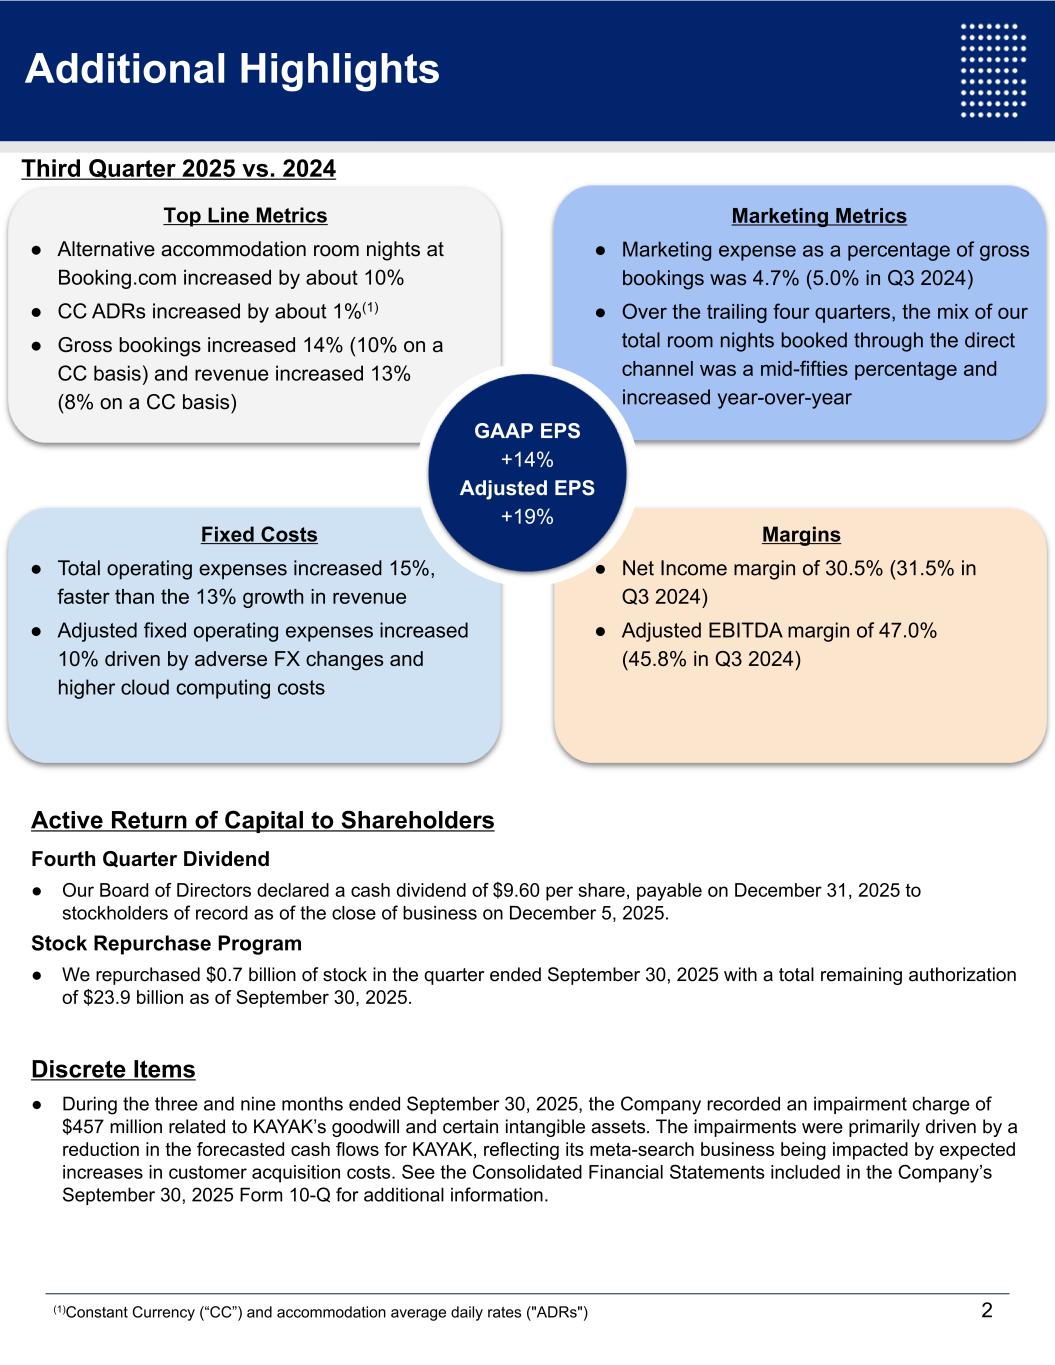
Active Return of Capital to Shareholders Fourth Quarter Dividend ● Our Board of Directors declared a cash dividend of $9.60 per share, payable on December 31, 2025 to stockholders of record as of the close of business on December 5, 2025. Stock Repurchase Program ● We repurchased $0.7 billion of stock in the quarter ended September 30, 2025 with a total remaining authorization of $23.9 billion as of September 30, 2025. Discrete Items ● During the three and nine months ended September 30, 2025, the Company recorded an impairment charge of $457 million related to KAYAK’s goodwill and certain intangible assets. The impairments were primarily driven by a reduction in the forecasted cash flows for KAYAK, reflecting its meta-search business being impacted by expected increases in customer acquisition costs. See the Consolidated Financial Statements included in the Company’s September 30, 2025 Form 10-Q for additional information. 2 OutlookAdditional Highlights Third Quarter 2025 vs. 2024 Top Line Metrics ● Alternative accommodation room nights at Booking.com increased by about 10% ● CC ADRs increased by about 1%(1) ● Gross bookings increased 14% (10% on a CC basis) and revenue increased 13% (8% on a CC basis) Margins ● Net Income margin of 30.5% (31.5% in Q3 2024) ● Adjusted EBITDA margin of 47.0% (45.8% in Q3 2024) Fixed Costs ● Total operating expenses increased 15%, faster than the 13% growth in revenue ● Adjusted fixed operating expenses increased 10% driven by adverse FX changes and higher cloud computing costs Marketing Metrics ● Marketing expense as a percentage of gross bookings was 4.7% (5.0% in Q3 2024) ● Over the trailing four quarters, the mix of our total room nights booked through the direct channel was a mid-fifties percentage and increased year-over-year GAAP EPS +14% Adjusted EPS +19% (1)Constant Currency (“CC”) and accommodation average daily rates ("ADRs")
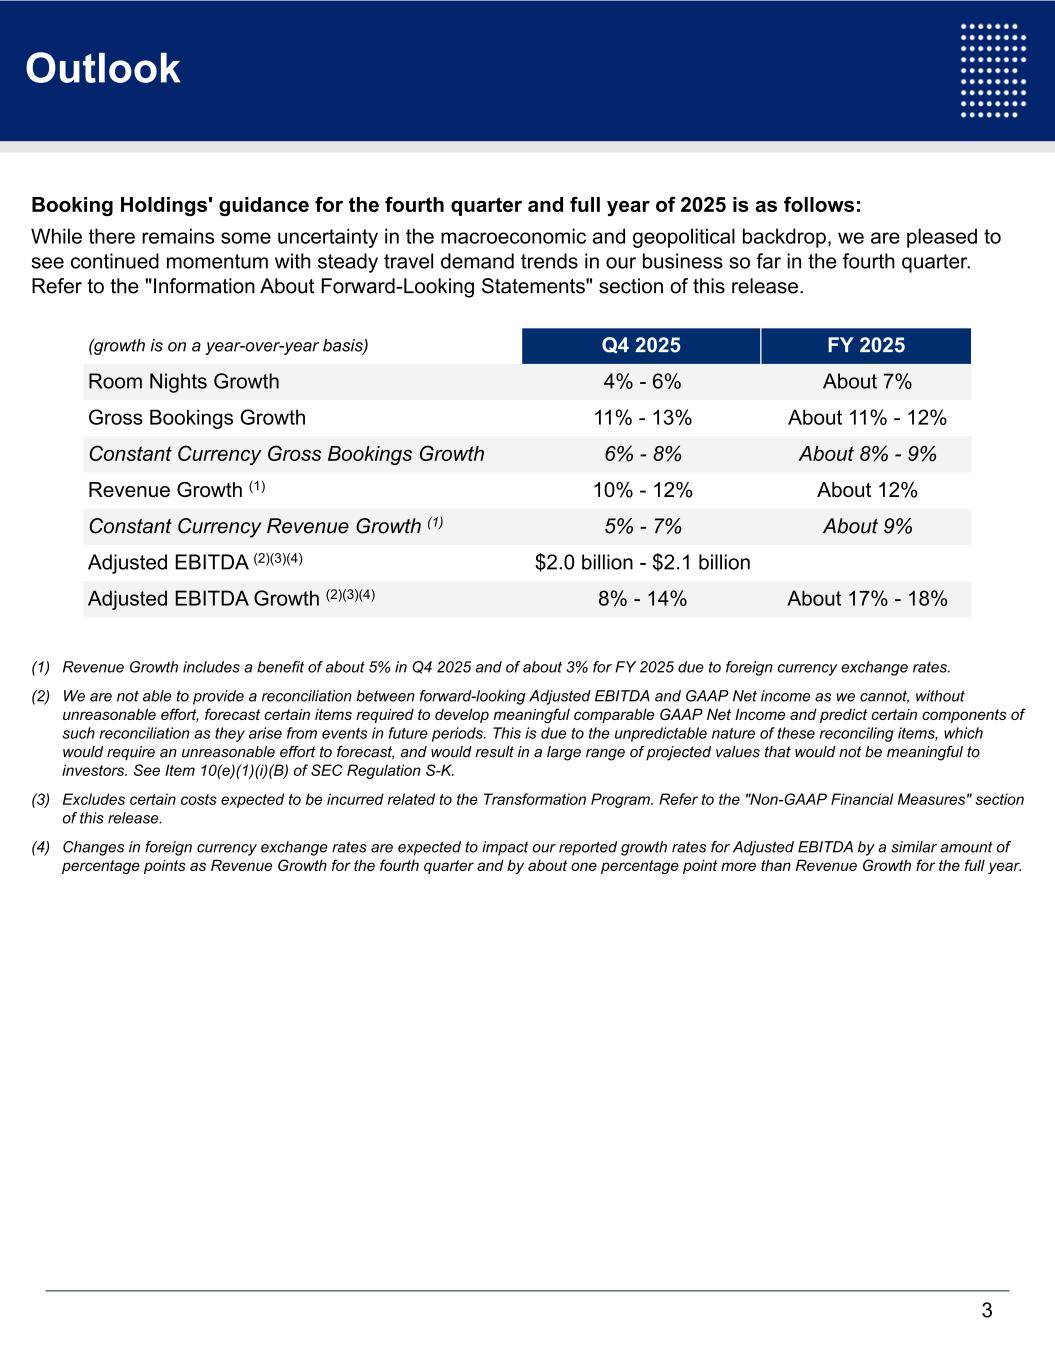
Booking Holdings' guidance for the fourth quarter and full year of 2025 is as follows: While there remains some uncertainty in the macroeconomic and geopolitical backdrop, we are pleased to see continued momentum with steady travel demand trends in our business so far in the fourth quarter. Refer to the "Information About Forward-Looking Statements" section of this release. (growth is on a year-over-year basis) Q4 2025 FY 2025 Room Nights Growth 4% - 6% About 7% Gross Bookings Growth 11% - 13% About 11% - 12% Constant Currency Gross Bookings Growth 6% - 8% About 8% - 9% Revenue Growth (1) 10% - 12% About 12% Constant Currency Revenue Growth (1) 5% - 7% About 9% Adjusted EBITDA (2)(3)(4) $2.0 billion - $2.1 billion Adjusted EBITDA Growth (2)(3)(4) 8% - 14% About 17% - 18% (1) Revenue Growth includes a benefit of about 5% in Q4 2025 and of about 3% for FY 2025 due to foreign currency exchange rates. (2) We are not able to provide a reconciliation between forward-looking Adjusted EBITDA and GAAP Net income as we cannot, without unreasonable effort, forecast certain items required to develop meaningful comparable GAAP Net Income and predict certain components of such reconciliation as they arise from events in future periods. This is due to the unpredictable nature of these reconciling items, which would require an unreasonable effort to forecast, and would result in a large range of projected values that would not be meaningful to investors. See Item 10(e)(1)(i)(B) of SEC Regulation S-K. (3) Excludes certain costs expected to be incurred related to the Transformation Program. Refer to the "Non-GAAP Financial Measures" section of this release. (4) Changes in foreign currency exchange rates are expected to impact our reported growth rates for Adjusted EBITDA by a similar amount of percentage points as Revenue Growth for the fourth quarter and by about one percentage point more than Revenue Growth for the full year. 3 Non-GAAP Financial MeasuresOutlook
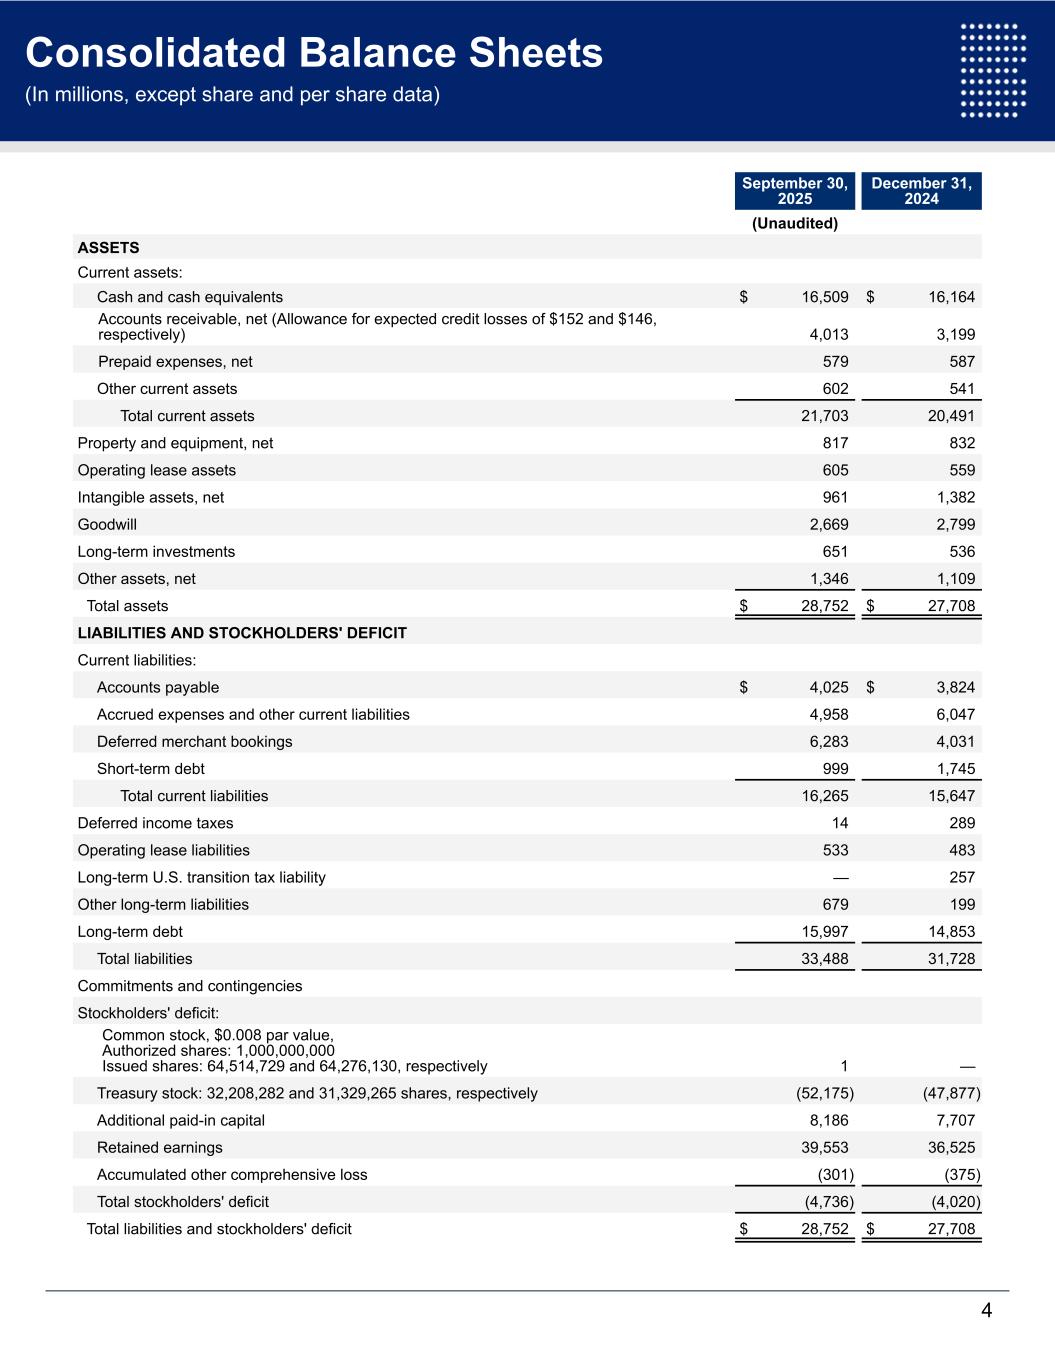
September 30, 2025 December 31, 2024 (Unaudited) ASSETS Current assets: Cash and cash equivalents $ 16,509 $ 16,164 Accounts receivable, net (Allowance for expected credit losses of $152 and $146, respectively) 4,013 3,199 Prepaid expenses, net 579 587 Other current assets 602 541 Total current assets 21,703 20,491 Property and equipment, net 817 832 Operating lease assets 605 559 Intangible assets, net 961 1,382 Goodwill 2,669 2,799 Long-term investments 651 536 Other assets, net 1,346 1,109 Total assets $ 28,752 $ 27,708 LIABILITIES AND STOCKHOLDERS' DEFICIT Current liabilities: Accounts payable $ 4,025 $ 3,824 Accrued expenses and other current liabilities 4,958 6,047 Deferred merchant bookings 6,283 4,031 Short-term debt 999 1,745 Total current liabilities 16,265 15,647 Deferred income taxes 14 289 Operating lease liabilities 533 483 Long-term U.S. transition tax liability — 257 Other long-term liabilities 679 199 Long-term debt 15,997 14,853 Total liabilities 33,488 31,728 Commitments and contingencies Stockholders' deficit: Common stock, $0.008 par value, Authorized shares: 1,000,000,000 Issued shares: 64,514,729 and 64,276,130, respectively 1 — Treasury stock: 32,208,282 and 31,329,265 shares, respectively (52,175) (47,877) Additional paid-in capital 8,186 7,707 Retained earnings 39,553 36,525 Accumulated other comprehensive loss (301) (375) Total stockholders' deficit (4,736) (4,020) Total liabilities and stockholders' deficit $ 28,752 $ 27,708 4 Unaudited Consolidated Statements of Operations (In millions, except share and per share data) Consolidated Balance Sheets (In millions, except share and per share data)
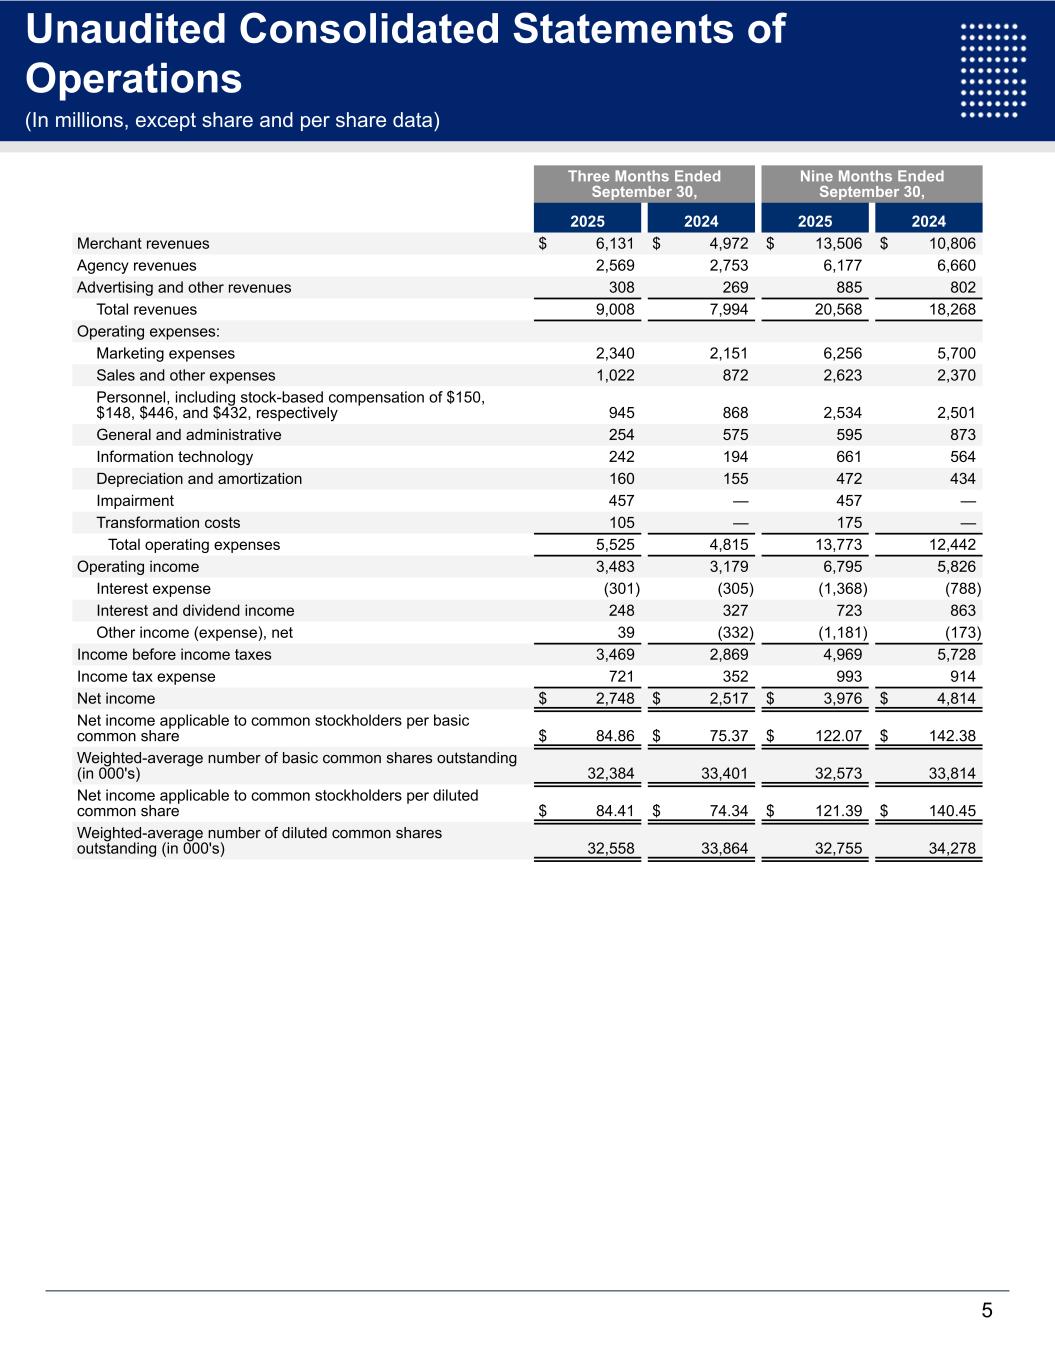
Three Months Ended September 30, Nine Months Ended September 30, 2025 2024 2025 2024 Merchant revenues $ 6,131 $ 4,972 $ 13,506 $ 10,806 Agency revenues 2,569 2,753 6,177 6,660 Advertising and other revenues 308 269 885 802 Total revenues 9,008 7,994 20,568 18,268 Operating expenses: Marketing expenses 2,340 2,151 6,256 5,700 Sales and other expenses 1,022 872 2,623 2,370 Personnel, including stock-based compensation of $150, $148, $446, and $432, respectively 945 868 2,534 2,501 General and administrative 254 575 595 873 Information technology 242 194 661 564 Depreciation and amortization 160 155 472 434 Impairment 457 — 457 — Transformation costs 105 — 175 — Total operating expenses 5,525 4,815 13,773 12,442 Operating income 3,483 3,179 6,795 5,826 Interest expense (301) (305) (1,368) (788) Interest and dividend income 248 327 723 863 Other income (expense), net 39 (332) (1,181) (173) Income before income taxes 3,469 2,869 4,969 5,728 Income tax expense 721 352 993 914 Net income $ 2,748 $ 2,517 $ 3,976 $ 4,814 Net income applicable to common stockholders per basic common share $ 84.86 $ 75.37 $ 122.07 $ 142.38 Weighted-average number of basic common shares outstanding (in 000's) 32,384 33,401 32,573 33,814 Net income applicable to common stockholders per diluted common share $ 84.41 $ 74.34 $ 121.39 $ 140.45 Weighted-average number of diluted common shares outstanding (in 000's) 32,558 33,864 32,755 34,278 5 Unaudited Consolidated Statements of Cash Flows (In millions) it li t t t t f Operations , except share and per share data)
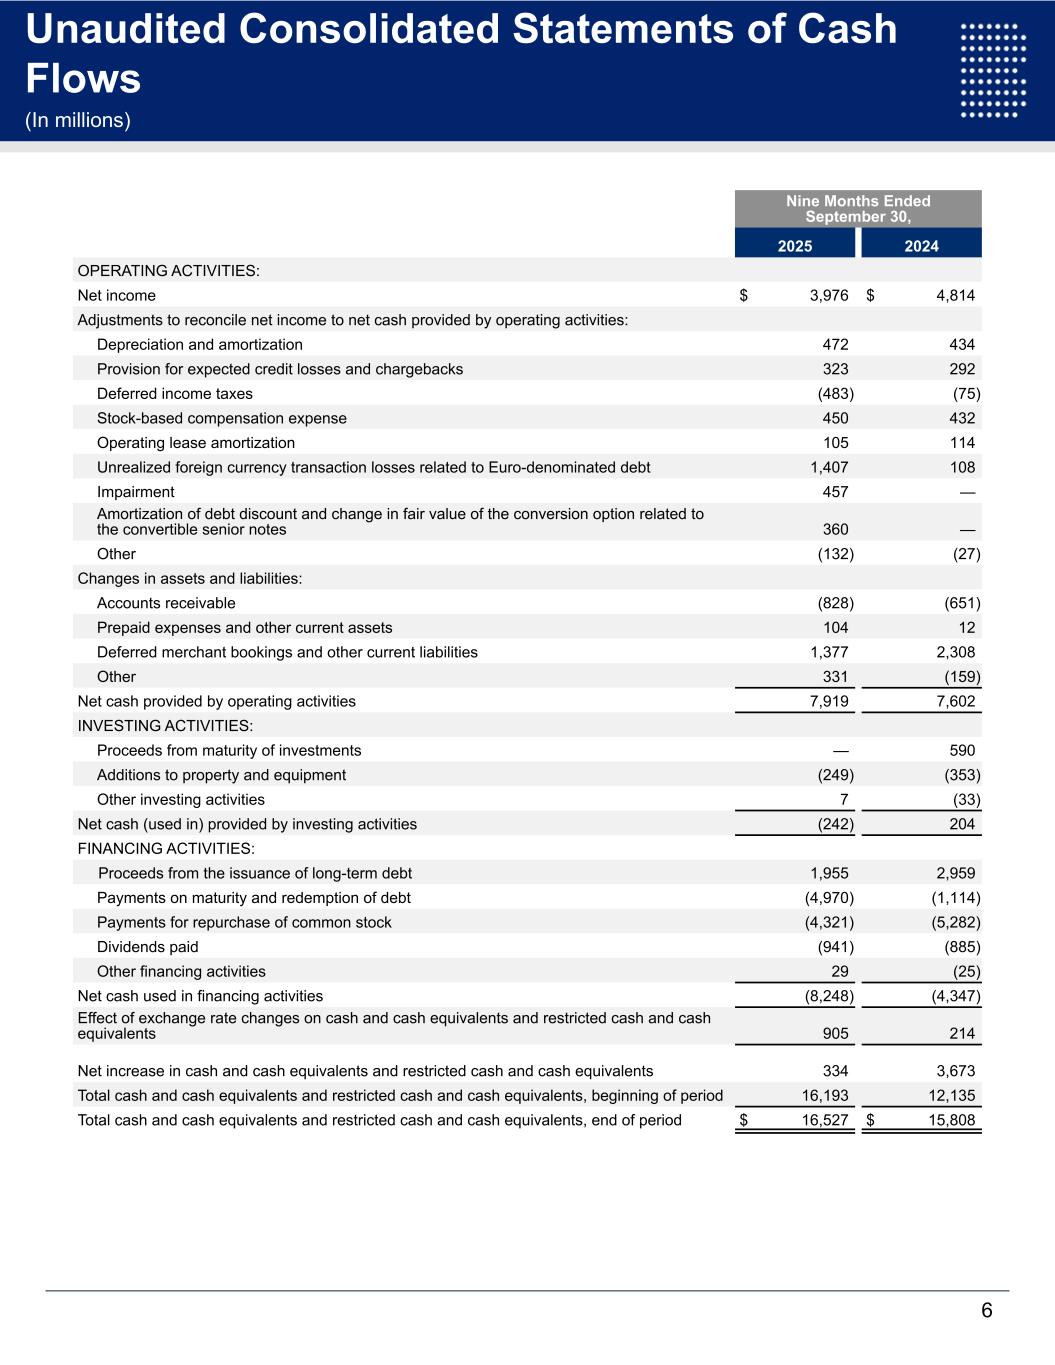
Nine Months Ended September 30, 2025 2024 OPERATING ACTIVITIES: Net income $ 3,976 $ 4,814 Adjustments to reconcile net income to net cash provided by operating activities: Depreciation and amortization 472 434 Provision for expected credit losses and chargebacks 323 292 Deferred income taxes (483) (75) Stock-based compensation expense 450 432 Operating lease amortization 105 114 Unrealized foreign currency transaction losses related to Euro-denominated debt 1,407 108 Impairment 457 — Amortization of debt discount and change in fair value of the conversion option related to the convertible senior notes 360 — Other (132) (27) Changes in assets and liabilities: Accounts receivable (828) (651) Prepaid expenses and other current assets 104 12 Deferred merchant bookings and other current liabilities 1,377 2,308 Other 331 (159) Net cash provided by operating activities 7,919 7,602 INVESTING ACTIVITIES: Proceeds from maturity of investments — 590 Additions to property and equipment (249) (353) Other investing activities 7 (33) Net cash (used in) provided by investing activities (242) 204 FINANCING ACTIVITIES: Proceeds from the issuance of long-term debt 1,955 2,959 Payments on maturity and redemption of debt (4,970) (1,114) Payments for repurchase of common stock (4,321) (5,282) Dividends paid (941) (885) Other financing activities 29 (25) Net cash used in financing activities (8,248) (4,347) Effect of exchange rate changes on cash and cash equivalents and restricted cash and cash equivalents 905 214 Net increase in cash and cash equivalents and restricted cash and cash equivalents 334 3,673 Total cash and cash equivalents and restricted cash and cash equivalents, beginning of period 16,193 12,135 Total cash and cash equivalents and restricted cash and cash equivalents, end of period $ 16,527 $ 15,808 6 Non-GAAP Financial Measures Unaudited Consolidated Statements of Cash Flows (In millions)
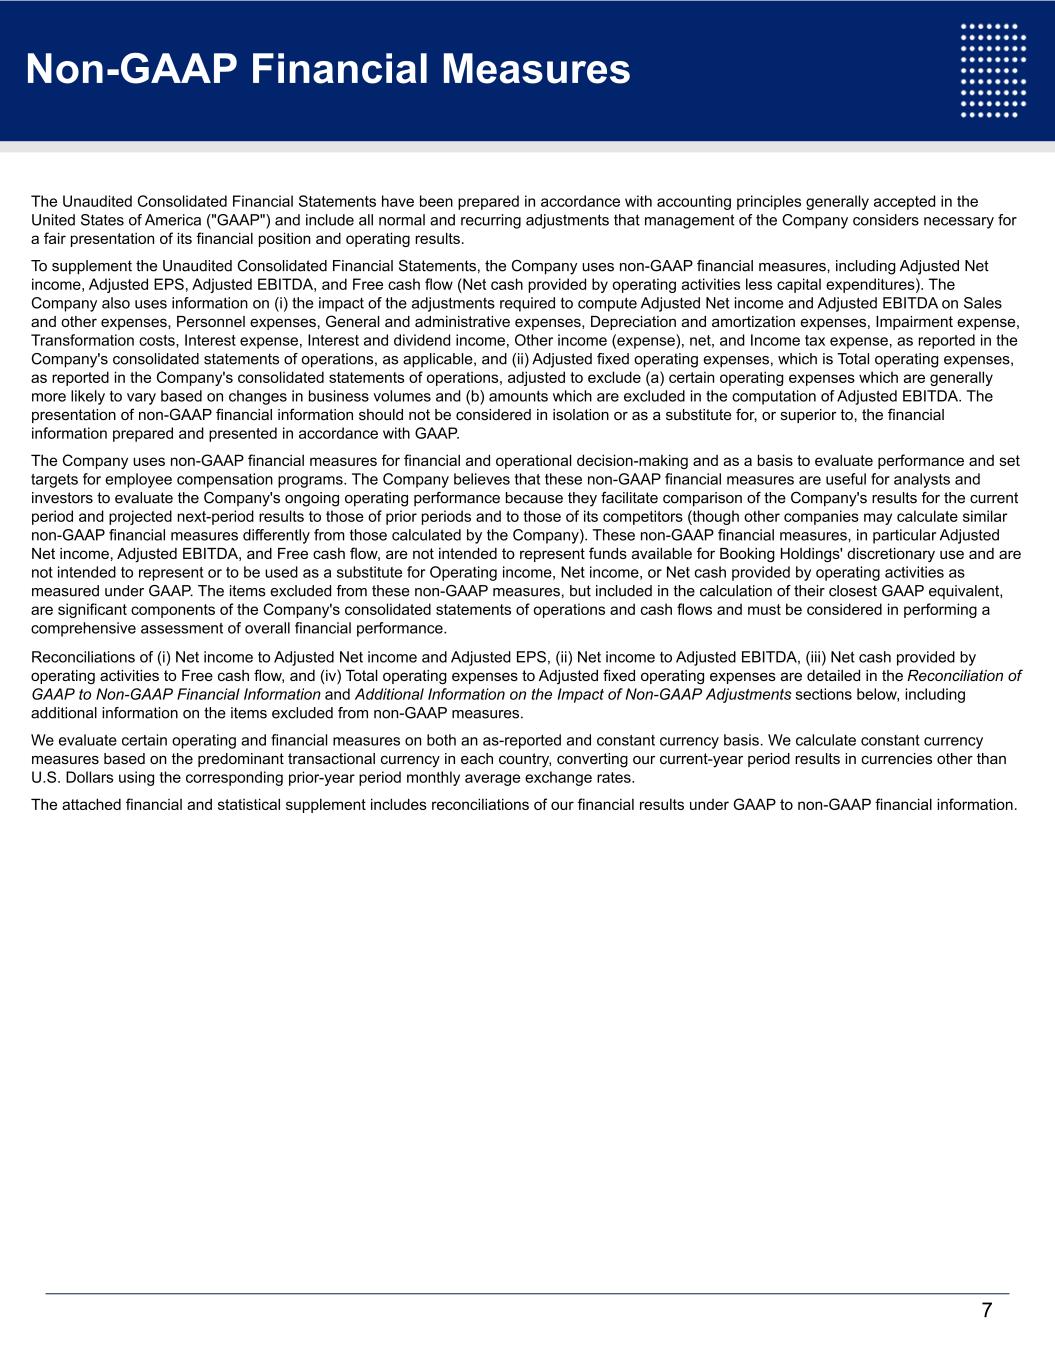
The Unaudited Consolidated Financial Statements have been prepared in accordance with accounting principles generally accepted in the United States of America ("GAAP") and include all normal and recurring adjustments that management of the Company considers necessary for a fair presentation of its financial position and operating results. To supplement the Unaudited Consolidated Financial Statements, the Company uses non-GAAP financial measures, including Adjusted Net income, Adjusted EPS, Adjusted EBITDA, and Free cash flow (Net cash provided by operating activities less capital expenditures). The Company also uses information on (i) the impact of the adjustments required to compute Adjusted Net income and Adjusted EBITDA on Sales and other expenses, Personnel expenses, General and administrative expenses, Depreciation and amortization expenses, Impairment expense, Transformation costs, Interest expense, Interest and dividend income, Other income (expense), net, and Income tax expense, as reported in the Company's consolidated statements of operations, as applicable, and (ii) Adjusted fixed operating expenses, which is Total operating expenses, as reported in the Company's consolidated statements of operations, adjusted to exclude (a) certain operating expenses which are generally more likely to vary based on changes in business volumes and (b) amounts which are excluded in the computation of Adjusted EBITDA. The presentation of non-GAAP financial information should not be considered in isolation or as a substitute for, or superior to, the financial information prepared and presented in accordance with GAAP. The Company uses non-GAAP financial measures for financial and operational decision-making and as a basis to evaluate performance and set targets for employee compensation programs. The Company believes that these non-GAAP financial measures are useful for analysts and investors to evaluate the Company's ongoing operating performance because they facilitate comparison of the Company's results for the current period and projected next-period results to those of prior periods and to those of its competitors (though other companies may calculate similar non-GAAP financial measures differently from those calculated by the Company). These non-GAAP financial measures, in particular Adjusted Net income, Adjusted EBITDA, and Free cash flow, are not intended to represent funds available for Booking Holdings' discretionary use and are not intended to represent or to be used as a substitute for Operating income, Net income, or Net cash provided by operating activities as measured under GAAP. The items excluded from these non-GAAP measures, but included in the calculation of their closest GAAP equivalent, are significant components of the Company's consolidated statements of operations and cash flows and must be considered in performing a comprehensive assessment of overall financial performance. Reconciliations of (i) Net income to Adjusted Net income and Adjusted EPS, (ii) Net income to Adjusted EBITDA, (iii) Net cash provided by operating activities to Free cash flow, and (iv) Total operating expenses to Adjusted fixed operating expenses are detailed in the Reconciliation of GAAP to Non-GAAP Financial Information and Additional Information on the Impact of Non-GAAP Adjustments sections below, including additional information on the items excluded from non-GAAP measures. We evaluate certain operating and financial measures on both an as-reported and constant currency basis. We calculate constant currency measures based on the predominant transactional currency in each country, converting our current-year period results in currencies other than U.S. Dollars using the corresponding prior-year period monthly average exchange rates. The attached financial and statistical supplement includes reconciliations of our financial results under GAAP to non-GAAP financial information. 7 Statistical Data (Units Sold in millions and Gross Bookings and Total Revenues in billions)(1) Non-GAAP Financial Measures
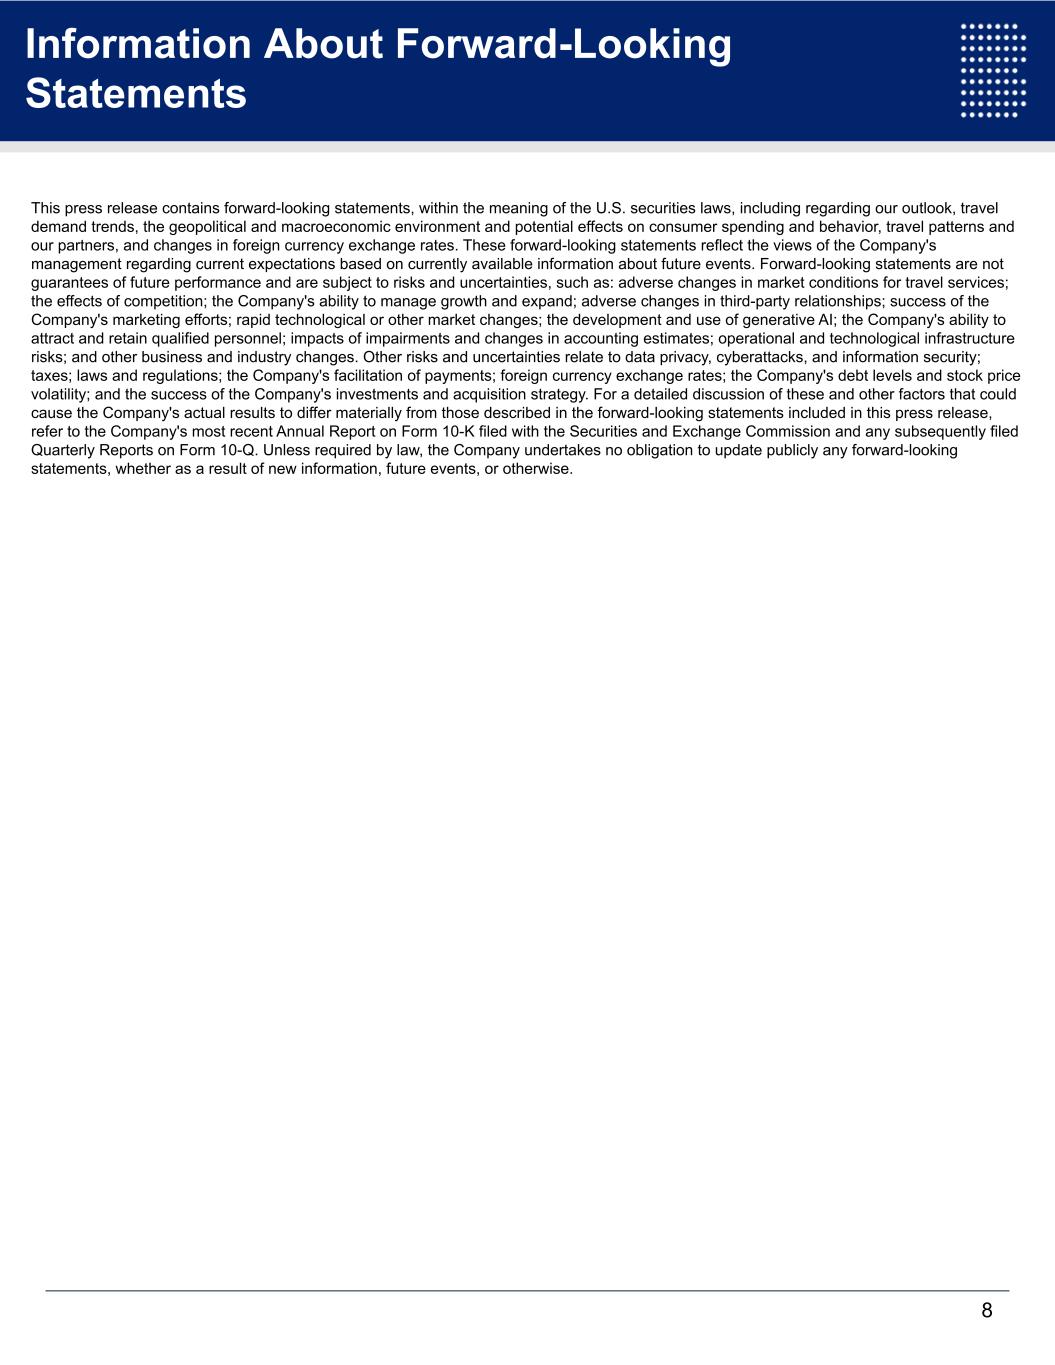
This press release contains forward-looking statements, within the meaning of the U.S. securities laws, including regarding our outlook, travel demand trends, the geopolitical and macroeconomic environment and potential effects on consumer spending and behavior, travel patterns and our partners, and changes in foreign currency exchange rates. These forward-looking statements reflect the views of the Company's management regarding current expectations based on currently available information about future events. Forward-looking statements are not guarantees of future performance and are subject to risks and uncertainties, such as: adverse changes in market conditions for travel services; the effects of competition; the Company's ability to manage growth and expand; adverse changes in third-party relationships; success of the Company's marketing efforts; rapid technological or other market changes; the development and use of generative AI; the Company's ability to attract and retain qualified personnel; impacts of impairments and changes in accounting estimates; operational and technological infrastructure risks; and other business and industry changes. Other risks and uncertainties relate to data privacy, cyberattacks, and information security; taxes; laws and regulations; the Company's facilitation of payments; foreign currency exchange rates; the Company's debt levels and stock price volatility; and the success of the Company's investments and acquisition strategy. For a detailed discussion of these and other factors that could cause the Company's actual results to differ materially from those described in the forward-looking statements included in this press release, refer to the Company's most recent Annual Report on Form 10-K filed with the Securities and Exchange Commission and any subsequently filed Quarterly Reports on Form 10-Q. Unless required by law, the Company undertakes no obligation to update publicly any forward-looking statements, whether as a result of new information, future events, or otherwise. 8 Additional Information on the Impact of Non-GAAP Adjustments (In millions) Information About Forward-Looking Statements

We will be posting our prepared remarks and a summary earnings presentation to the Booking Holdings investor relations website after the conclusion of the earnings call. About Booking Holdings Inc. Booking Holdings (NASDAQ: BKNG) is the world's leading provider of online travel and related services, provided to consumers and local partners in more than 220 countries and territories through five primary consumer-facing brands: Booking.com, Priceline, Agoda, KAYAK and OpenTable. The mission of Booking Holdings is to make it easier for everyone to experience the world. For more information, visit BookingHoldings.com and follow us on X @BookingHoldings. For Press Information: Leslie Cafferty communications@bookingholdings.com For Investor Relations: Grace Lee ir@bookingholdings.com #BKNG_Earnings 9 Additional Information on the Impact of Non-GAAP Adjustments (In millions) About Booking Holdi gs
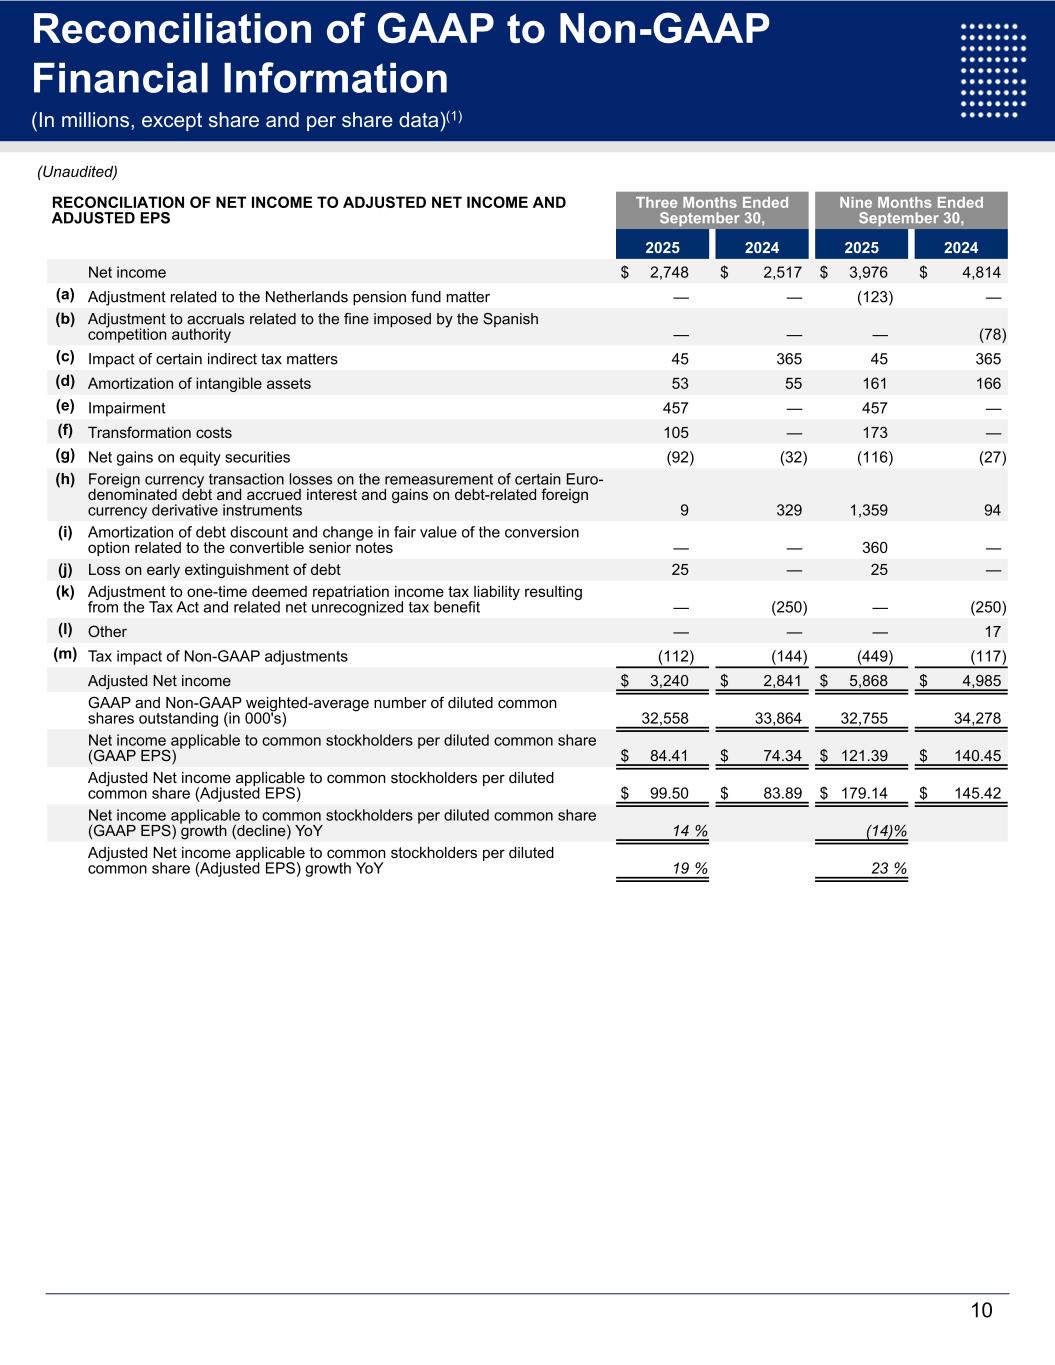
RECONCILIATION OF NET INCOME TO ADJUSTED NET INCOME AND ADJUSTED EPS Three Months Ended September 30, Nine Months Ended September 30, 2025 2024 2025 2024 Net income $ 2,748 $ 2,517 $ 3,976 $ 4,814 (a) Adjustment related to the Netherlands pension fund matter — — (123) — (b) Adjustment to accruals related to the fine imposed by the Spanish competition authority — — — (78) (c) Impact of certain indirect tax matters 45 365 45 365 (d) Amortization of intangible assets 53 55 161 166 (e) Impairment 457 — 457 — (f) Transformation costs 105 — 173 — (g) Net gains on equity securities (92) (32) (116) (27) (h) Foreign currency transaction losses on the remeasurement of certain Euro- denominated debt and accrued interest and gains on debt-related foreign currency derivative instruments 9 329 1,359 94 (i) Amortization of debt discount and change in fair value of the conversion option related to the convertible senior notes — — 360 — (j) Loss on early extinguishment of debt 25 — 25 — (k) Adjustment to one-time deemed repatriation income tax liability resulting from the Tax Act and related net unrecognized tax benefit — (250) — (250) (l) Other — — — 17 (m) Tax impact of Non-GAAP adjustments (112) (144) (449) (117) Adjusted Net income $ 3,240 $ 2,841 $ 5,868 $ 4,985 GAAP and Non-GAAP weighted-average number of diluted common shares outstanding (in 000's) 32,558 33,864 32,755 34,278 Net income applicable to common stockholders per diluted common share (GAAP EPS) $ 84.41 $ 74.34 $ 121.39 $ 140.45 Adjusted Net income applicable to common stockholders per diluted common share (Adjusted EPS) $ 99.50 $ 83.89 $ 179.14 $ 145.42 Net income applicable to common stockholders per diluted common share (GAAP EPS) growth (decline) YoY 14 % (14) % Adjusted Net income applicable to common stockholders per diluted common share (Adjusted EPS) growth YoY 19 % 23 % 10 Reconciliation of GAAP to Non-GAAP Financial Information (In millions, except share and per share data)(1) ili ti f to Non- AAP i i l I f r ti (In millions, except share and per share data)(1) (Unaudited)
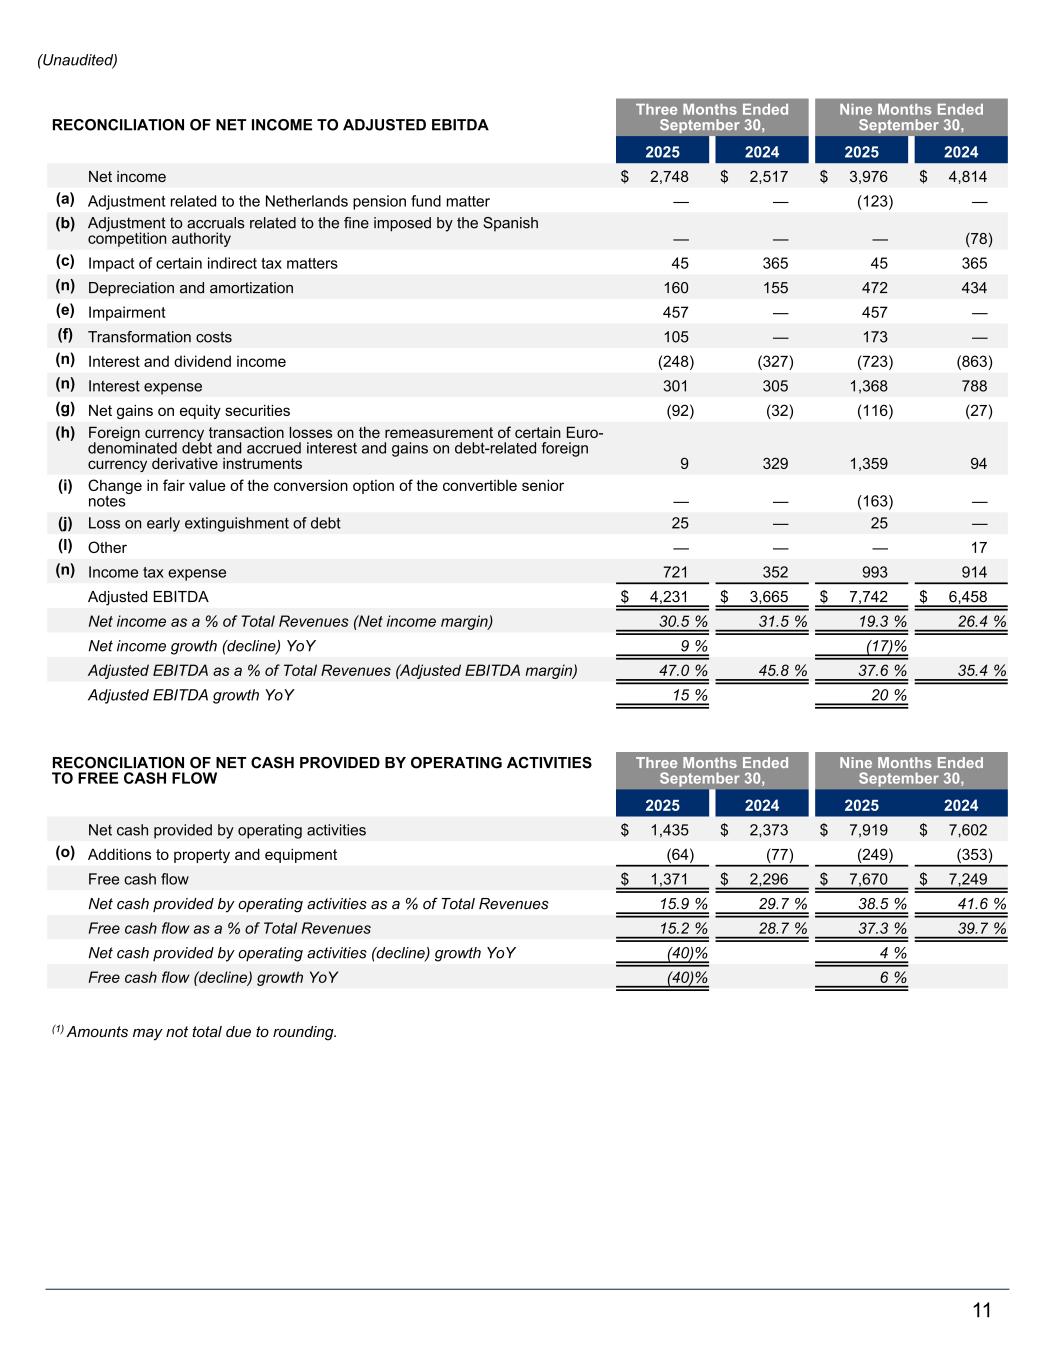
RECONCILIATION OF NET INCOME TO ADJUSTED EBITDA Three Months Ended September 30, Nine Months Ended September 30, 2025 2024 2025 2024 Net income $ 2,748 $ 2,517 $ 3,976 $ 4,814 (a) Adjustment related to the Netherlands pension fund matter — — (123) — (b) Adjustment to accruals related to the fine imposed by the Spanish competition authority — — — (78) (c) Impact of certain indirect tax matters 45 365 45 365 (n) Depreciation and amortization 160 155 472 434 (e) Impairment 457 — 457 — (f) Transformation costs 105 — 173 — (n) Interest and dividend income (248) (327) (723) (863) (n) Interest expense 301 305 1,368 788 (g) Net gains on equity securities (92) (32) (116) (27) (h) Foreign currency transaction losses on the remeasurement of certain Euro- denominated debt and accrued interest and gains on debt-related foreign currency derivative instruments 9 329 1,359 94 (i) Change in fair value of the conversion option of the convertible senior notes — — (163) — (j) Loss on early extinguishment of debt 25 — 25 — (l) Other — — — 17 (n) Income tax expense 721 352 993 914 Adjusted EBITDA $ 4,231 $ 3,665 $ 7,742 $ 6,458 Net income as a % of Total Revenues (Net income margin) 30.5 % 31.5 % 19.3 % 26.4 % Net income growth (decline) YoY 9 % (17) % Adjusted EBITDA as a % of Total Revenues (Adjusted EBITDA margin) 47.0 % 45.8 % 37.6 % 35.4 % Adjusted EBITDA growth YoY 15 % 20 % RECONCILIATION OF NET CASH PROVIDED BY OPERATING ACTIVITIES TO FREE CASH FLOW Three Months Ended September 30, Nine Months Ended September 30, 2025 2024 2025 2024 Net cash provided by operating activities $ 1,435 $ 2,373 $ 7,919 $ 7,602 (o) Additions to property and equipment (64) (77) (249) (353) Free cash flow $ 1,371 $ 2,296 $ 7,670 $ 7,249 Net cash provided by operating activities as a % of Total Revenues 15.9 % 29.7 % 38.5 % 41.6 % Free cash flow as a % of Total Revenues 15.2 % 28.7 % 37.3 % 39.7 % Net cash provided by operating activities (decline) growth YoY (40) % 4 % Free cash flow (decline) growth YoY (40) % 6 % (1) Amounts may not total due to rounding. 11 (Unaudited)
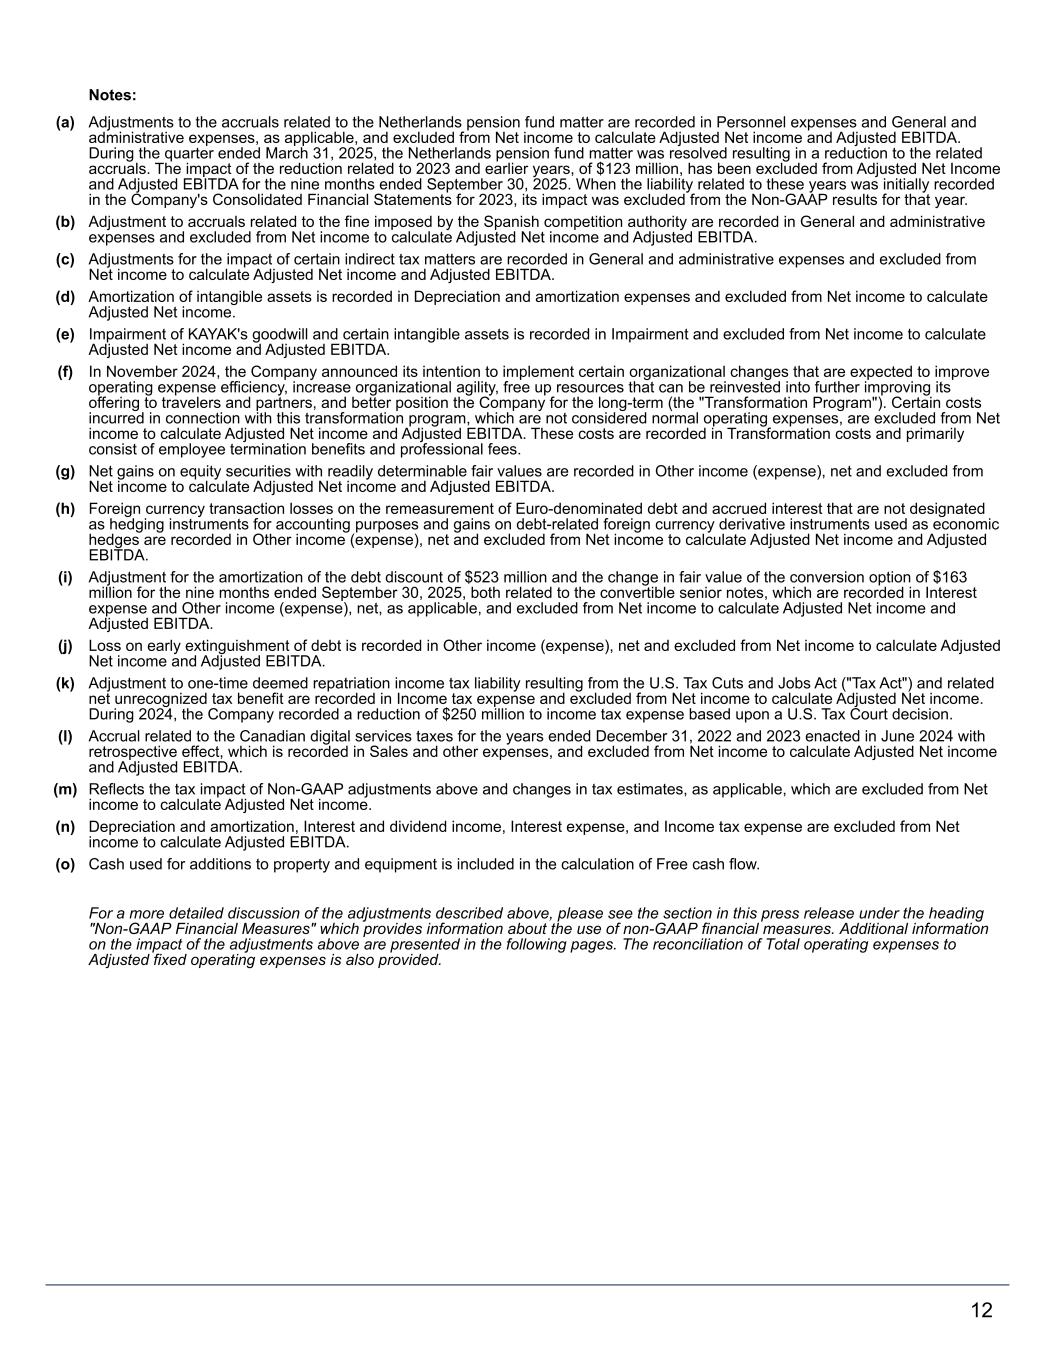
Notes: (a) Adjustments to the accruals related to the Netherlands pension fund matter are recorded in Personnel expenses and General and administrative expenses, as applicable, and excluded from Net income to calculate Adjusted Net income and Adjusted EBITDA. During the quarter ended March 31, 2025, the Netherlands pension fund matter was resolved resulting in a reduction to the related accruals. The impact of the reduction related to 2023 and earlier years, of $123 million, has been excluded from Adjusted Net Income and Adjusted EBITDA for the nine months ended September 30, 2025. When the liability related to these years was initially recorded in the Company's Consolidated Financial Statements for 2023, its impact was excluded from the Non-GAAP results for that year. (b) Adjustment to accruals related to the fine imposed by the Spanish competition authority are recorded in General and administrative expenses and excluded from Net income to calculate Adjusted Net income and Adjusted EBITDA. (c) Adjustments for the impact of certain indirect tax matters are recorded in General and administrative expenses and excluded from Net income to calculate Adjusted Net income and Adjusted EBITDA. (d) Amortization of intangible assets is recorded in Depreciation and amortization expenses and excluded from Net income to calculate Adjusted Net income. (e) Impairment of KAYAK's goodwill and certain intangible assets is recorded in Impairment and excluded from Net income to calculate Adjusted Net income and Adjusted EBITDA. (f) In November 2024, the Company announced its intention to implement certain organizational changes that are expected to improve operating expense efficiency, increase organizational agility, free up resources that can be reinvested into further improving its offering to travelers and partners, and better position the Company for the long-term (the "Transformation Program"). Certain costs incurred in connection with this transformation program, which are not considered normal operating expenses, are excluded from Net income to calculate Adjusted Net income and Adjusted EBITDA. These costs are recorded in Transformation costs and primarily consist of employee termination benefits and professional fees. (g) Net gains on equity securities with readily determinable fair values are recorded in Other income (expense), net and excluded from Net income to calculate Adjusted Net income and Adjusted EBITDA. (h) Foreign currency transaction losses on the remeasurement of Euro-denominated debt and accrued interest that are not designated as hedging instruments for accounting purposes and gains on debt-related foreign currency derivative instruments used as economic hedges are recorded in Other income (expense), net and excluded from Net income to calculate Adjusted Net income and Adjusted EBITDA. (i) Adjustment for the amortization of the debt discount of $523 million and the change in fair value of the conversion option of $163 million for the nine months ended September 30, 2025, both related to the convertible senior notes, which are recorded in Interest expense and Other income (expense), net, as applicable, and excluded from Net income to calculate Adjusted Net income and Adjusted EBITDA. (j) Loss on early extinguishment of debt is recorded in Other income (expense), net and excluded from Net income to calculate Adjusted Net income and Adjusted EBITDA. (k) Adjustment to one-time deemed repatriation income tax liability resulting from the U.S. Tax Cuts and Jobs Act ("Tax Act") and related net unrecognized tax benefit are recorded in Income tax expense and excluded from Net income to calculate Adjusted Net income. During 2024, the Company recorded a reduction of $250 million to income tax expense based upon a U.S. Tax Court decision. (l) Accrual related to the Canadian digital services taxes for the years ended December 31, 2022 and 2023 enacted in June 2024 with retrospective effect, which is recorded in Sales and other expenses, and excluded from Net income to calculate Adjusted Net income and Adjusted EBITDA. (m) Reflects the tax impact of Non-GAAP adjustments above and changes in tax estimates, as applicable, which are excluded from Net income to calculate Adjusted Net income. (n) Depreciation and amortization, Interest and dividend income, Interest expense, and Income tax expense are excluded from Net income to calculate Adjusted EBITDA. (o) Cash used for additions to property and equipment is included in the calculation of Free cash flow. For a more detailed discussion of the adjustments described above, please see the section in this press release under the heading "Non-GAAP Financial Measures" which provides information about the use of non-GAAP financial measures. Additional information on the impact of the adjustments above are presented in the following pages. The reconciliation of Total operating expenses to Adjusted fixed operating expenses is also provided. 12
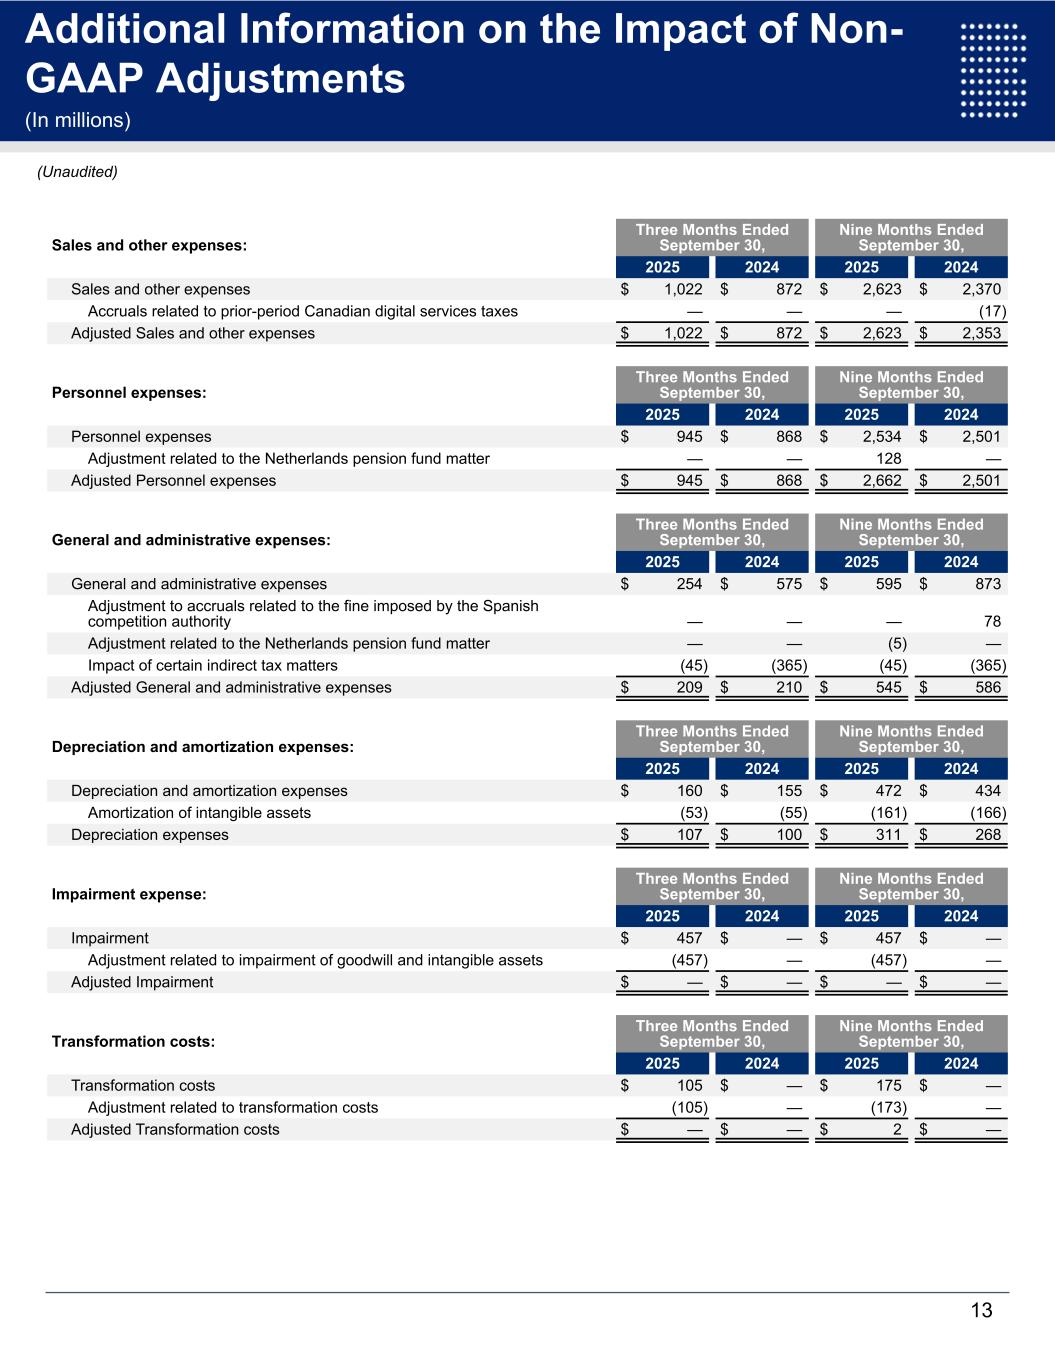
Sales and other expenses: Three Months Ended September 30, Nine Months Ended September 30, 2025 2024 2025 2024 Sales and other expenses $ 1,022 $ 872 $ 2,623 $ 2,370 Accruals related to prior-period Canadian digital services taxes — — — (17) Adjusted Sales and other expenses $ 1,022 $ 872 $ 2,623 $ 2,353 Personnel expenses: Three Months Ended September 30, Nine Months Ended September 30, 2025 2024 2025 2024 Personnel expenses $ 945 $ 868 $ 2,534 $ 2,501 Adjustment related to the Netherlands pension fund matter — — 128 — Adjusted Personnel expenses $ 945 $ 868 $ 2,662 $ 2,501 General and administrative expenses: Three Months Ended September 30, Nine Months Ended September 30, 2025 2024 2025 2024 General and administrative expenses $ 254 $ 575 $ 595 $ 873 Adjustment to accruals related to the fine imposed by the Spanish competition authority — — — 78 Adjustment related to the Netherlands pension fund matter — — (5) — Impact of certain indirect tax matters (45) (365) (45) (365) Adjusted General and administrative expenses $ 209 $ 210 $ 545 $ 586 Depreciation and amortization expenses: Three Months Ended September 30, Nine Months Ended September 30, 2025 2024 2025 2024 Depreciation and amortization expenses $ 160 $ 155 $ 472 $ 434 Amortization of intangible assets (53) (55) (161) (166) Depreciation expenses $ 107 $ 100 $ 311 $ 268 Impairment expense: Three Months Ended September 30, Nine Months Ended September 30, 2025 2024 2025 2024 Impairment $ 457 $ — $ 457 $ — Adjustment related to impairment of goodwill and intangible assets (457) — (457) — Adjusted Impairment $ — $ — $ — $ — Transformation costs: Three Months Ended September 30, Nine Months Ended September 30, 2025 2024 2025 2024 Transformation costs $ 105 $ — $ 175 $ — Adjustment related to transformation costs (105) — (173) — Adjusted Transformation costs $ — $ — $ 2 $ — 13 Reconciliation of GAAP to Non-GAAP Financial Information (In millions, except share and per share data)(1) Additional Information on the Impact of Non- GAAP Adjustments ) (Unaudited)
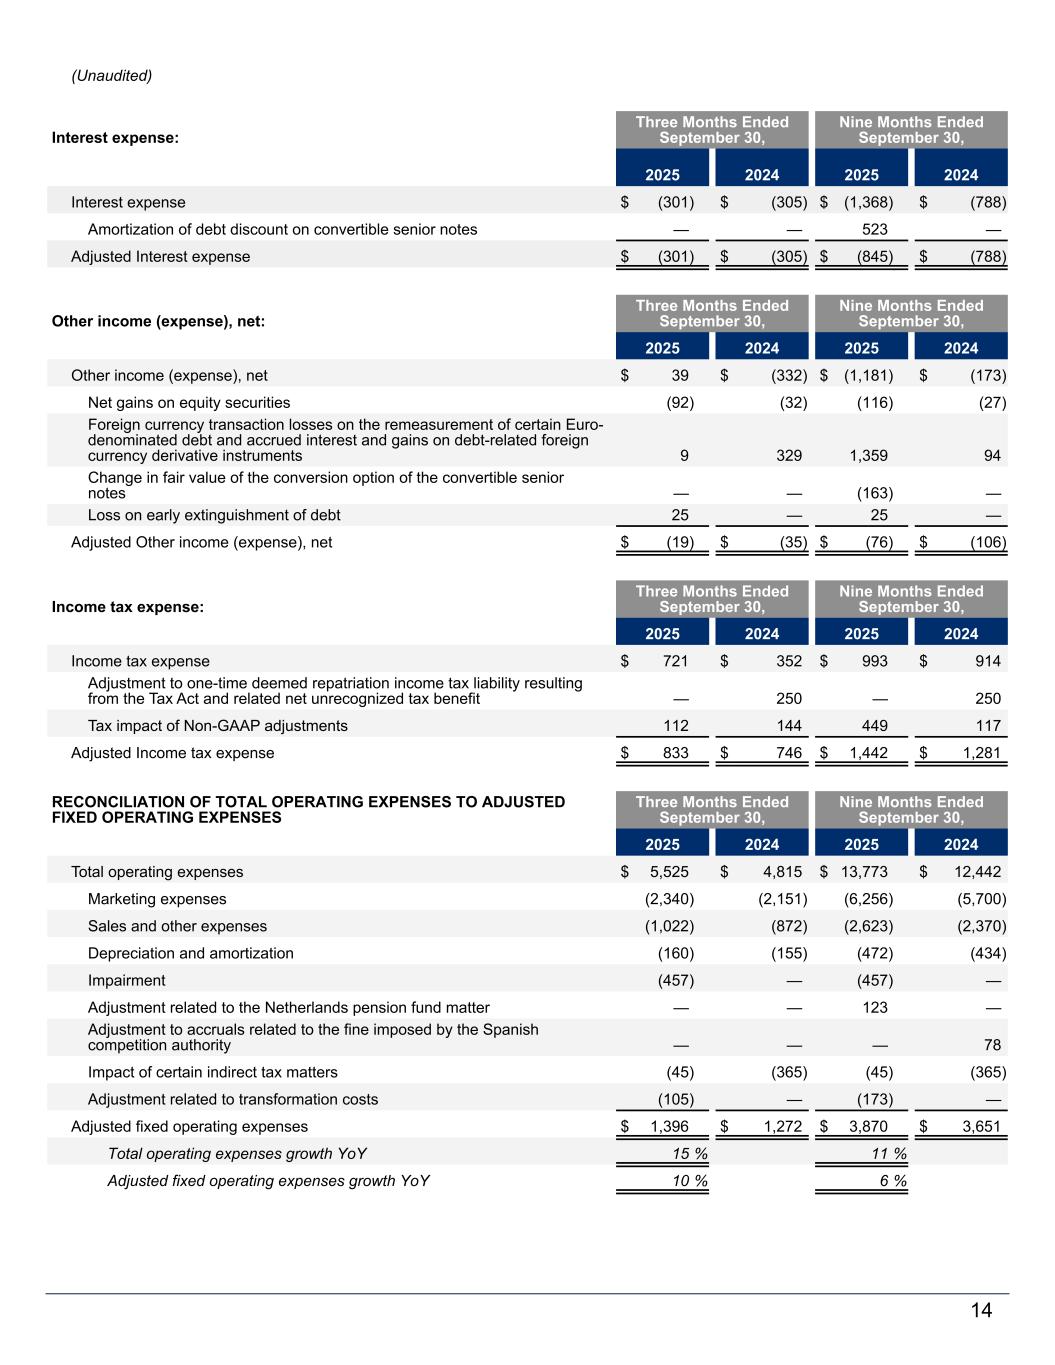
(Unaudited) Interest expense: Three Months Ended September 30, Nine Months Ended September 30, 2025 2024 2025 2024 Interest expense $ (301) $ (305) $ (1,368) $ (788) Amortization of debt discount on convertible senior notes — — 523 — Adjusted Interest expense $ (301) $ (305) $ (845) $ (788) Other income (expense), net: Three Months Ended September 30, Nine Months Ended September 30, 2025 2024 2025 2024 Other income (expense), net $ 39 $ (332) $ (1,181) $ (173) Net gains on equity securities (92) (32) (116) (27) Foreign currency transaction losses on the remeasurement of certain Euro- denominated debt and accrued interest and gains on debt-related foreign currency derivative instruments 9 329 1,359 94 Change in fair value of the conversion option of the convertible senior notes — — (163) — Loss on early extinguishment of debt 25 — 25 — Adjusted Other income (expense), net $ (19) $ (35) $ (76) $ (106) Income tax expense: Three Months Ended September 30, Nine Months Ended September 30, 2025 2024 2025 2024 Income tax expense $ 721 $ 352 $ 993 $ 914 Adjustment to one-time deemed repatriation income tax liability resulting from the Tax Act and related net unrecognized tax benefit — 250 — 250 Tax impact of Non-GAAP adjustments 112 144 449 117 Adjusted Income tax expense $ 833 $ 746 $ 1,442 $ 1,281 RECONCILIATION OF TOTAL OPERATING EXPENSES TO ADJUSTED FIXED OPERATING EXPENSES Three Months Ended September 30, Nine Months Ended September 30, 2025 2024 2025 2024 Total operating expenses $ 5,525 $ 4,815 $ 13,773 $ 12,442 Marketing expenses (2,340) (2,151) (6,256) (5,700) Sales and other expenses (1,022) (872) (2,623) (2,370) Depreciation and amortization (160) (155) (472) (434) Impairment (457) — (457) — Adjustment related to the Netherlands pension fund matter — — 123 — Adjustment to accruals related to the fine imposed by the Spanish competition authority — — — 78 Impact of certain indirect tax matters (45) (365) (45) (365) Adjustment related to transformation costs (105) — (173) — Adjusted fixed operating expenses $ 1,396 $ 1,272 $ 3,870 $ 3,651 Total operating expenses growth YoY 15 % 11 % Adjusted fixed operating expenses growth YoY 10 % 6 % 14
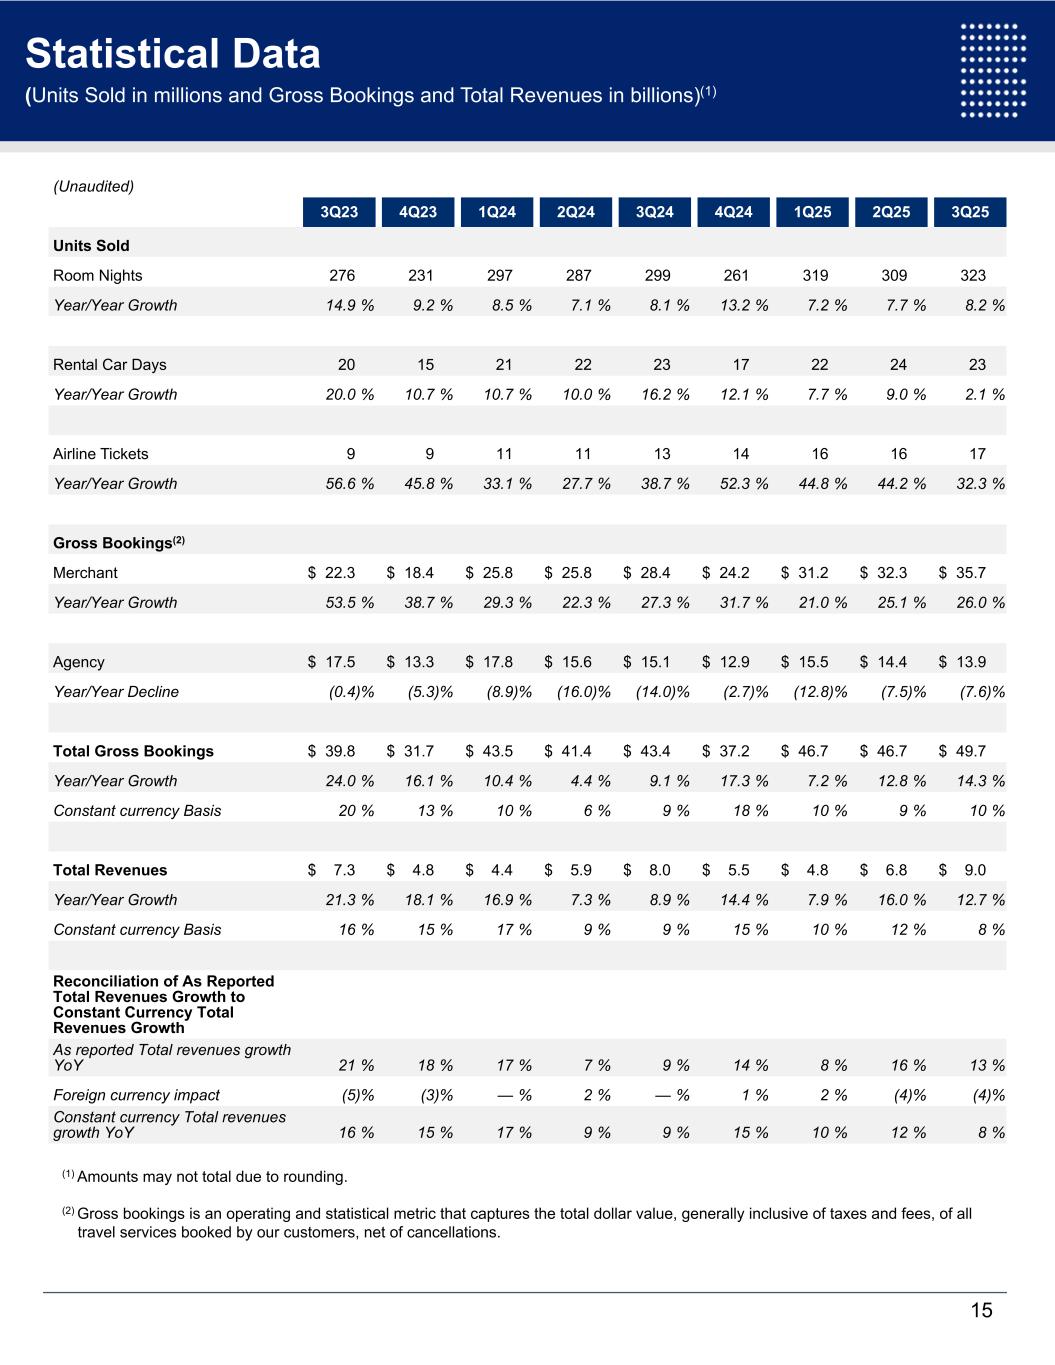
(Unaudited) 3Q23 4Q23 1Q24 2Q24 3Q24 4Q24 1Q25 2Q25 3Q25 Units Sold Room Nights 276 231 297 287 299 261 319 309 323 Year/Year Growth 14.9 % 9.2 % 8.5 % 7.1 % 8.1 % 13.2 % 7.2 % 7.7 % 8.2 % Rental Car Days 20 15 21 22 23 17 22 24 23 Year/Year Growth 20.0 % 10.7 % 10.7 % 10.0 % 16.2 % 12.1 % 7.7 % 9.0 % 2.1 % Airline Tickets 9 9 11 11 13 14 16 16 17 Year/Year Growth 56.6 % 45.8 % 33.1 % 27.7 % 38.7 % 52.3 % 44.8 % 44.2 % 32.3 % Gross Bookings(2) Merchant $ 22.3 $ 18.4 $ 25.8 $ 25.8 $ 28.4 $ 24.2 $ 31.2 $ 32.3 $ 35.7 Year/Year Growth 53.5 % 38.7 % 29.3 % 22.3 % 27.3 % 31.7 % 21.0 % 25.1 % 26.0 % Agency $ 17.5 $ 13.3 $ 17.8 $ 15.6 $ 15.1 $ 12.9 $ 15.5 $ 14.4 $ 13.9 Year/Year Decline (0.4) % (5.3) % (8.9) % (16.0) % (14.0) % (2.7) % (12.8) % (7.5) % (7.6) % Total Gross Bookings $ 39.8 $ 31.7 $ 43.5 $ 41.4 $ 43.4 $ 37.2 $ 46.7 $ 46.7 $ 49.7 Year/Year Growth 24.0 % 16.1 % 10.4 % 4.4 % 9.1 % 17.3 % 7.2 % 12.8 % 14.3 % Constant currency Basis 20 % 13 % 10 % 6 % 9 % 18 % 10 % 9 % 10 % Total Revenues $ 7.3 $ 4.8 $ 4.4 $ 5.9 $ 8.0 $ 5.5 $ 4.8 $ 6.8 $ 9.0 Year/Year Growth 21.3 % 18.1 % 16.9 % 7.3 % 8.9 % 14.4 % 7.9 % 16.0 % 12.7 % Constant currency Basis 16 % 15 % 17 % 9 % 9 % 15 % 10 % 12 % 8 % Reconciliation of As Reported Total Revenues Growth to Constant Currency Total Revenues Growth As reported Total revenues growth YoY 21 % 18 % 17 % 7 % 9 % 14 % 8 % 16 % 13 % Foreign currency impact (5) % (3) % — % 2 % — % 1 % 2 % (4) % (4) % Constant currency Total revenues growth YoY 16 % 15 % 17 % 9 % 9 % 15 % 10 % 12 % 8 % (1) Amounts may not total due to rounding. (2) Gross bookings is an operating and statistical metric that captures the total dollar value, generally inclusive of taxes and fees, of all travel services booked by our customers, net of cancellations. 15 OutlookStatistical Data (Units Sold in millions and Gross Bookings and Total Revenues in billions)(1)