Exhibit 3 Third Quarter 2025 Results River Phase 1 project, Miami, Florida
Except as the context otherwise may require, references in this presentation to “Cemex,” “we,” “us,” or “our,” refer to Cemex, S.A.B. de C.V. (NYSE: CX) and its consolidated entities. The information included in this presentation contains forward-looking statements within the meaning of Section 27A of the U.S. Securities Act of 1933, as amended, and Section 21E of the U.S. Securities Exchange Act of 1934, as amended. We intend these forward-looking statements to be covered by the “safe harbor” provisions for forward-looking statements within the meaning of the U.S. Private Securities Litigation Reform Act of 1995. These forward-looking statements and information are necessarily subject to risks, uncertainties, and assumptions, including but not limited to statements related to Cemex’s plans, objectives, goals, targets, and expectations (operative, financial or otherwise), and typically can be identified by the use of words such as, but not limited to, “will,” “may,” “assume,” “might,” “should,” “could,” “continue,” “would,” “can,” “consider,” “anticipate,” “estimate,” “expect,” “envision,” “plan,” “believe,” “foresee,” “predict,” “potential,” “target”, “goal”, “strategy,” “intend,” “aimed”, or other forward-looking words. These forward-looking statements reflect, as of the date such forward-looking statements are made, unless otherwise indicated, our current expectations and projections about future events based on our knowledge of present facts and circumstances and assumptions about future events. Although Cemex believes that its expectations are reasonable, it can give no assurance that these expectations will prove to be correct, and actual results may vary, including materially from historical results or those anticipated by forward-looking statements due to various factors. Among others, such risks, uncertainties, assumptions, and other important factors that could cause results and any guidance presented in this presentation to differ, or that otherwise could have an impact on us, include those discussed in Cemex’s most recent annual report and those detailed from time to time in Cemex’s other filings with the U.S. Securities and Exchange Commission (“SEC”), the Mexican National Banking and Securities Commission (Comisión Nacional Bancaria y de Valores) and the Mexican Stock Exchange (Bolsa Mexicana de Valores), which factors are incorporated herein by reference, including, but not limited to: changes in general economic, political and social conditions, including government shutdowns, new governments and decisions implemented by such new governments, changes in laws or regulations in the countries in which we do business, elections, changes in inflation, interest and foreign exchange rates, employment levels, population growth, any slowdown in the flow of remittances into countries where we operate, consumer confidence and the liquidity of the financial and capital markets in Mexico, the United States of America, the European Union (the “EU”), the United Kingdom, or other countries in which we operate; the cyclical activity of the construction sector and reduced construction activity in our end markets or reduced use in our end markets for our products; our exposure to sectors that impact our and our clients’ businesses, particularly those operating in the commercial and residential construction sectors, and the public and private infrastructure and energy sectors; volatility in pension plan asset values and liabilities, which may require cash or other contributions to the pension plans; changes in spending levels for residential and commercial construction and general infrastructure projects; the availability of short-term credit lines or working capital facilities, which can assist us in connection with market cycles; any impact of not maintaining investment grade debt rating or not obtaining investment grade debt ratings from additional rating agencies on our cost of capital and on the cost of the products and services we purchase; availability of raw materials and related fluctuating prices of raw materials, as well as of goods and services in general, in particular increases in prices of raw materials, good and services, as a result of inflation, trade barriers, measures imposed by governments or as a result of conflicts between countries that disrupt supply chains; our ability to maintain and expand our distribution network and maintain favorable relationships with third parties who supply us with equipment, services and essential suppliers; competition in the markets in which we offer our products and services; the impact of environmental cleanup costs and other remedial actions, and other environmental, climate and related liabilities relating to existing and/or divested businesses, assets and/or operations; our ability to secure and permit aggregates reserves in strategically located areas in amounts that our operations require to operate or operate in a cost-efficient manner; the timing and amount of federal, state, and local funding for infrastructure; changes in our effective tax rate; our ability to comply with regulations and implement technologies and other initiatives that aim to reduce and/or capture CO2 emissions and comply with related carbon emissions regulations in place in the jurisdictions where we have operations; the legal and regulatory environment, including environmental, climate, trade, energy, tax, antitrust, sanctions, export controls, construction, human rights and labor welfare, and acquisition-related rules and regulations in the countries and regions in which we have operations; the effects of currency fluctuations on our results of operations and financial condition; our ability to satisfy our obligations under our debt agreements, the indentures that govern our outstanding notes, and our other debt instruments and financial obligations, and also regarding our subordinated notes with no fixed maturity and other financial obligations; adverse legal or regulatory proceedings or disputes, such as class actions or enforcement or other proceedings brought by third parties, government and regulatory agencies, including antitrust investigations and claims; our ability to protect our reputation and intellectual property; our ability to consummate asset sales or consummate asset sales in terms favorable to Cemex, fully integrate newly acquired businesses, achieve cost-savings from our cost-reduction initiatives, implement our pricing and commercial initiatives for our products and services, and generally meet our business strategy’s goals; the increasing reliance on information technology infrastructure for our sales, invoicing, procurement, financial statements, and other processes that can adversely affect our sales and operations in the event that the infrastructure does not work as intended, experiences technical difficulties, or is subjected to invasion, disruption, or damage caused by circumstances beyond our control, including cyber-attacks, catastrophic events, power outages, natural disasters, computer system or network failures, or other security breaches; the effects of climate change, in particular reflected in weather conditions, including but not limited to excessive rain and snow, shortage of usable water, wildfires and natural disasters, such as earthquakes, hurricanes, tornadoes and floods, that could affect our facilities or the markets in which we offer our products and services or from where we source our raw materials; trade barriers, including but not limited to tariffs or import taxes, including those imposed by the United States to key markets in which we operate, in particular, Mexico and the EU, and changes in existing trade policies or changes to, or withdrawals from, free trade agreements, including the United States-Mexico-Canada Agreement (the “USMCA”), and the overall impact that the imposition or threat of trade barriers may cause on the overall economy of the countries in which we do business or that are part of our global supply chain; availability and cost of trucks, railcars, barges, and ships, terminals, warehouses, as well as their licensed operators, drivers, staff and workers for transport, loading and unloading of our materials or that are otherwise a part of our supply chain; labor shortages and constraints; our ability to hire, effectively compensate and retain our key personnel and maintain satisfactory labor relations; our ability to detect and prevent money laundering, terrorism financing and corruption, as well as other illegal activities, and how any measures implemented by governments to detect and prevent money laundering, terrorism financing and corruption, and other illegal activities, affect our customers, suppliers and countries in which we do business in general; defaults, losses or disruptions in agreements, financial transactions or operations resulting from sanctions or restrictions imposed on any financial institution, including but not limited to banks, trustees, payment processors, paying agents or other financial intermediaries, or any related parties; terrorist and organized criminal activities, social unrest, as well as geopolitical events, such as hostilities, war, and armed conflicts, including the current war between Russia and Ukraine, conflicts in the Middle East and any insecurity and hostilities in Mexico related to illegal activities or organized crime and any actions any government takes to prevent these illegal activities and organized crime; the impact of pandemics, epidemics, or outbreaks of infectious diseases and the response of governments and other third parties, which could adversely affect, among other matters, the ability of our operating facilities to operate at full or any capacity, supply chains, international operations, availability of liquidity, investor confidence and consumer spending, as well as the availability of, and demand for, our products and services; changes in the economy that affect demand for consumer goods, consequently affecting demand for our products and services; the depth and duration of an economic slowdown or recession, instability in the business landscape and lack of availability of credit; declarations of insolvency or bankruptcy, or becoming subject to similar proceedings; natural disasters and other unforeseen events (including global health hazards such as, for example, COVID-19); and our ability to implement our “Future in Action” climate action program and achieve our sustainability goals and objectives. Many factors could cause Cemex’s expectations, expected results, and/or projections expressed in this presentation not being reached and/or not producing the expected benefits and/or results, as any such benefits or results are subject to uncertainties, costs, performance, and rate of success and/or implementation of technologies, some of which are not yet proven, among other factors. Should one or more of these risks or uncertainties materialize, or should underlying assumptions prove incorrect, actual results may vary materially from historical results, performance, or achievements and/or results, performance or achievements expressly or implicitly anticipated by the forward-looking statements, or otherwise could have an impact on us or our consolidated entities. Forward-looking statements should not be considered guarantees of future performance, nor the results or developments are indicative of results or developments in subsequent periods. Actual results of Cemex’s operations and the development of market conditions in which Cemex operates, or other circumstances that may materialize, may differ materially from those described in, or suggested by, the forward-looking statements contained in the information disclosed in this presentation. Any or all of Cemex’s forward-looking statements may turn out to be inaccurate and the factors identified above are not exhaustive. Accordingly, undue reliance on forward-looking statements should not be placed, as such forward-looking statements speak only as of the dates on which they are made. The forward-looking statements and the information contained in this presentation are made and stated as of the dates specified in this presentation and are subject to change without notice, and except to the extent legally required, we expressly disclaim any obligation or undertaking to update or correct the information contained in this presentation or revise any forward-looking statements in this presentation, whether to reflect new information, the occurrence of anticipated or unanticipated future events or circumstances, any change in our expectations regarding those forward-looking statements, any change in events, conditions, or circumstances on which any such statement is based, or otherwise. Readers should review future reports filed or furnished by us with the SEC, the Mexican National Banking and Securities Commission (Comisión Nacional Bancaria y de Valores) and the Mexican Stock Exchange (Bolsa Mexicana de Valores). Market data used in this presentation not attributed to a specific source are estimates of Cemex and have not been independently verified. Certain financial and statistical information contained in this presentation is subject to rounding adjustments. Accordingly, any discrepancies between the totals and the sums of the amounts listed are due to rounding. Unless otherwise specified, all references to records are internal records. This presentation includes certain non-International Financial Reporting Standards (“IFRS”) financial measures that differ from financial information presented by Cemex in accordance with IFRS in its financial statements and reports containing financial information. The aforementioned non-IFRS financial measures include “Operating EBITDA” (operating earnings before other expenses, net plus depreciation and amortization) and “Operating EBITDA Margin” (Operating EBITDA for the period divided by our revenues as reported in our financial statements). The closest IFRS financial measure to Operating EBITDA is “Operating earnings before other expenses, net”, as Operating EBITDA adds depreciation and amortization to the IFRS financial measure. Our Operating EBITDA Margin is calculated by dividing our Operating EBITDA for the period by our revenues as reported in our financial statements. We believe there is no close IFRS financial measure to compare Operating EBITDA Margin. These non-IFRS financial measures are designed to complement and should not be considered superior to financial measures calculated in accordance with IFRS. Although Operating EBITDA and Operating EBITDA Margin are not measures of operating performance, an alternative to cash flows or a measure of financial position under IFRS, Operating EBITDA is the financial measure used by Cemex’s management to review operating performance and profitability, for decision-making purposes and to allocate resources. Moreover, our Operating EBITDA is a measure used by Cemex’s creditors to review our ability to internally fund capital expenditures, service or incur debt and comply with financial covenants under our financing agreements. Furthermore, Cemex’s management regularly reviews our Operating EBITDA Margin by reportable segment and on a consolidated basis as a measure of performance and profitability. These non-IFRS financial measures do not have any standardized meaning and are therefore unlikely to be comparable to similarly titled measures presented by other companies. Non-IFRS financial measures presented in the presentation are being provided for informative purposes only and shall not be construed as investment, financial, or other advice. Also, this presentation includes statistical data regarding the production, distribution, marketing and sale of cement, ready-mix concrete, clinker, aggregates, and Urbanization Solutions. Cemex generated some of this data internally, and some was obtained from independent industry publications and reports that Cemex believes to be reliable sources. Cemex has not independently verified this data nor sought the consent of any organization to refer to their reports in this presentation. Cemex acts in strict compliance of antitrust laws and as such, among other measures, maintains an independent pricing policy that has been independently developed and its core element is to price Cemex’s products and services based upon their quality and characteristics as well as their value to Cemex’s customers. Cemex does not accept any communications or agreements of any type with competitors regarding the determination of Cemex’s prices for Cemex’s products and services. Unless the context indicates otherwise, all references to pricing initiatives, price increases or decreases, refer to Cemex’s prices for Cemex’s products. The information, statements, and opinions contained in this presentation do not constitute a public offer under any applicable legislation, an offer to sell, or solicitation of any offer to buy any securities or financial instruments, or any advice or recommendation with respect to such securities or other financial instruments. Cautionary Statement Regarding Environmental, Social, and Governance (“ESG”) and Sustainability-Related Data, Metrics, and Methodologies This presentation may include non-financial metrics, estimates, or other information related to ESG and sustainability matters that are subject to significant uncertainties, which may include the methodology, collection, and verification of data, various estimates, and assumptions, and/or underlying data that is obtained from third parties, some of which cannot be independently verified. The preparation of certain information on ESG and sustainability matters that may be contained in the presentation requires the application of a number of key judgments, assumptions, and estimates. The reported measures reflect good faith estimates, assumptions, and judgments at the given point in time. There is a risk that these judgments, estimates, or assumptions may subsequently prove to be incorrect and/or, to the extent legally required, may need to be restated or changed. In addition, the underlying data, systems, and controls that support non-financial reporting are generally considerably less sophisticated than the systems and internal control for financial reporting and rely on manual processes. This may result in non-comparable information between organizations and/or between reporting periods within organizations as methodologies continue to develop and/or be socialized. The further development of or changes to accounting and/or reporting standards could materially impact the performance metrics, data points, and targets contained in the presentation, and the reader may not be able to compare non-financial information performance metrics, data points, or targets between reporting periods on a direct like-for-like basis. Additionally, the information disclosed in this presentation may contain references to “green,” “social,” “sustainable,” or equivalent-labelled activities, products, assets, or projects. There is currently no single globally recognized or accepted, consistent, and comparable set of definitions or standards (legal, regulatory, or otherwise) of, nor widespread cross-market consensus i) as to what constitutes, a “green”, “social”, or “sustainable” or having equivalent-labelled activity, product, or asset; or ii) as to what precise attributes are required for a particular activity, product, or asset to be defined as “green”, “social”, or “sustainable” or such other equivalent label; or iii) as to climate and sustainable funding and financing activities and their classification and reporting. Therefore, there is little certainty, and no assurance or representation is given that our activities, products, or assets and/or reporting of such activities and/or reporting of those activities, products, or assets will meet any present or future expectations or requirements for describing or classifying such activities, products, or assets as “green”, “social”, or “sustainable” or attributing similar labels. We expect policies, regulatory requirements, standards, and definitions to be developed and continuously evolve over time. Cautionary Statement Regarding Forward-Looking ESG or Sustainability Statements Certain sections in the presentation may contain ESG- or sustainability-related forward-looking statements, such as aims, ambitions, estimates, forecasts, plans, projections, targets, goals and other metrics, including but not limited to: climate and emissions, business and human rights, corporate governance, research and development and partnerships, development of products and services that intend to address sustainability-related concerns and sustainability related targets/ambitions when finalized, including the implementation of technologies and other initiatives that aim to reduce and/or capture CO2 emissions. These forward-looking statements may also include references to specific programs, such as our “Future in Action” climate action program, as well various ESG-related indicators, objectives or metrics disclosed previously or that may be disclosed in the future, none of which are guarantees and any and all of which may ultimately not be achieved or may be abandoned at any time, whether in part, in full, or within any specific timeframe. There are many significant uncertainties, assumptions, judgements, opinions, estimates, forecasts and statements made of future expectations underlying these forward-looking statements which could cause actual results, performance, outcomes or events to differ materially from those expressed or implied in these forward-looking statements, which include, but are not limited to: the extent and pace of climate change, including the timing and manifestation of physical and transition risks; the macroeconomic environment; uncertainty around future climate- related policy, including the timely implementation and integration of adequate government policies; the effectiveness of actions of governments, legislators, regulators, businesses, investors, customers, and other stakeholders to mitigate the impact of climate and sustainability-related risks; changes in customer behavior and demand, changes in the available technology for mitigation and the effectiveness of any such technologies, as some of these new technologies may be unproven; excessive costs and expenses related to acquire and/or develop technology for mitigation; the roll-out of low carbon infrastructure; the availability and adoption of renewable energy within in our value chain; the development of carbon capture, circular utilization, and sequestration technologies, including the adoption of cost- effective carbon-related technologies such as carbon capture, utilization, and storage ; the availability of accurate, verifiable, reliable, consistent, and comparable climate-related data; lack of transparency and comparability of climate-related forward-looking methodologies; variation in approaches and outcomes, as variations in methodologies may lead to under or overestimates and consequently present exaggerated indication of climate-related risk; and reliance on assumptions and future uncertainty (calculations of forward-looking metrics are complex and require many methodological choices and assumptions). Accordingly, undue reliance should not be placed on these forward-looking statements. Furthermore, changing national and international standards, industry and scientific practices, regulatory requirements, and market expectations regarding climate change, which remain under continuous development, are subject to different interpretations. There can be no assurance that these standards, practices, requirements, and expectations will not be interpreted differently than our understanding when defining sustainability-related ambitions and targets or change in a manner that substantially increases the cost or effort for us to achieve such ambitions and targets. UNLESS OTHERWISE NOTED, ALL FIGURES ARE PRESENTED IN DOLLARS, BASED ON INTERNATIONAL FINANCIAL REPORTING STANDARDS, AS APPLICABLE 2 2 Copyright Cemex, S.A.B. de C.V. and its subsidiaries
Our Strategic Framework Operational Best-in-class operational Continuously Excellence performance with assess all assets on a increased return on capital profitability and FCF basis generation Shareholder return Disciplined capital allocation with Build robust growth strategy shareholder return focusing on small to platform mid-side M&A in US 3
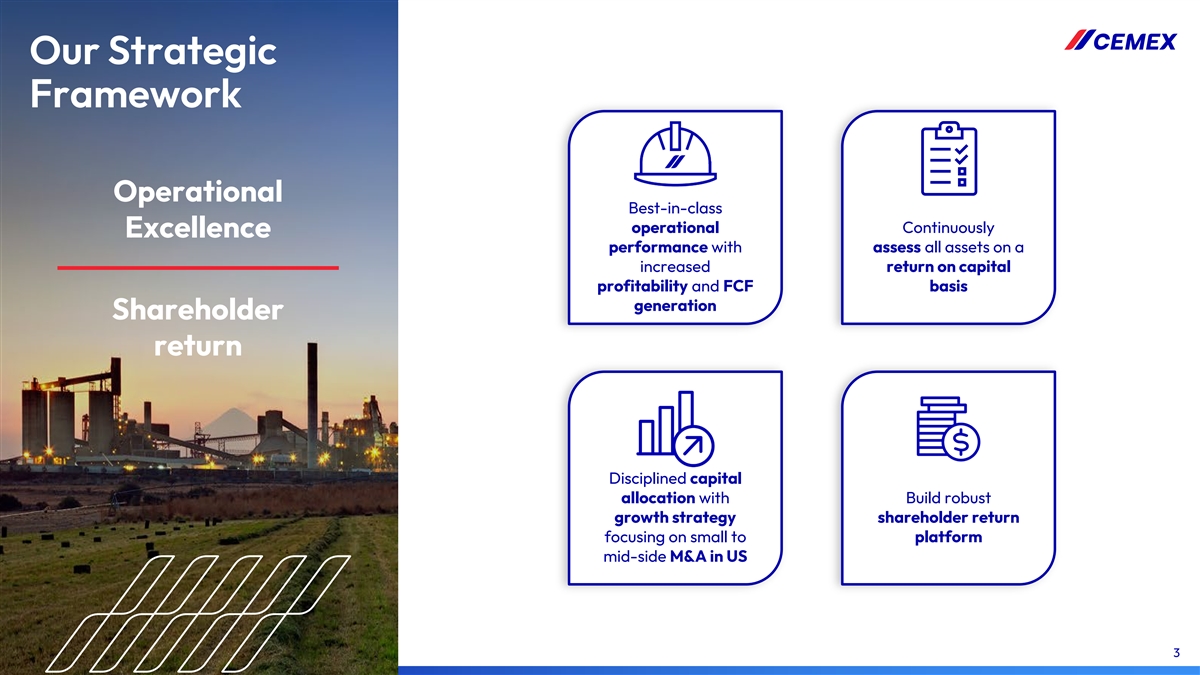
3Q25 Highlights As anticipated, stronger results across all regions in third quarter Double-digit EBITDA growth with relevant margin expansion and strong FCF from operations Project Cutting Edge delivering ~$90 M in EBITDA savings in 3Q25 1 Portfolio rebalancing: Sale of Panama with acquisition of majority stake in aggregates producer in southeastern U.S. Progress in decarbonization: Cemex Europe already achieved 2 European Cement Association’s 2030 net CO emissions target 2 1) On October 3rd , 2025, Cemex successfully closed the divestment of its cement, ready-mix, aggregates assets, and rights to acquire reserves in Panama, while retaining the admixtures business. 2) Excluding downstream reductions in ready-mix and construction carbonation. 4
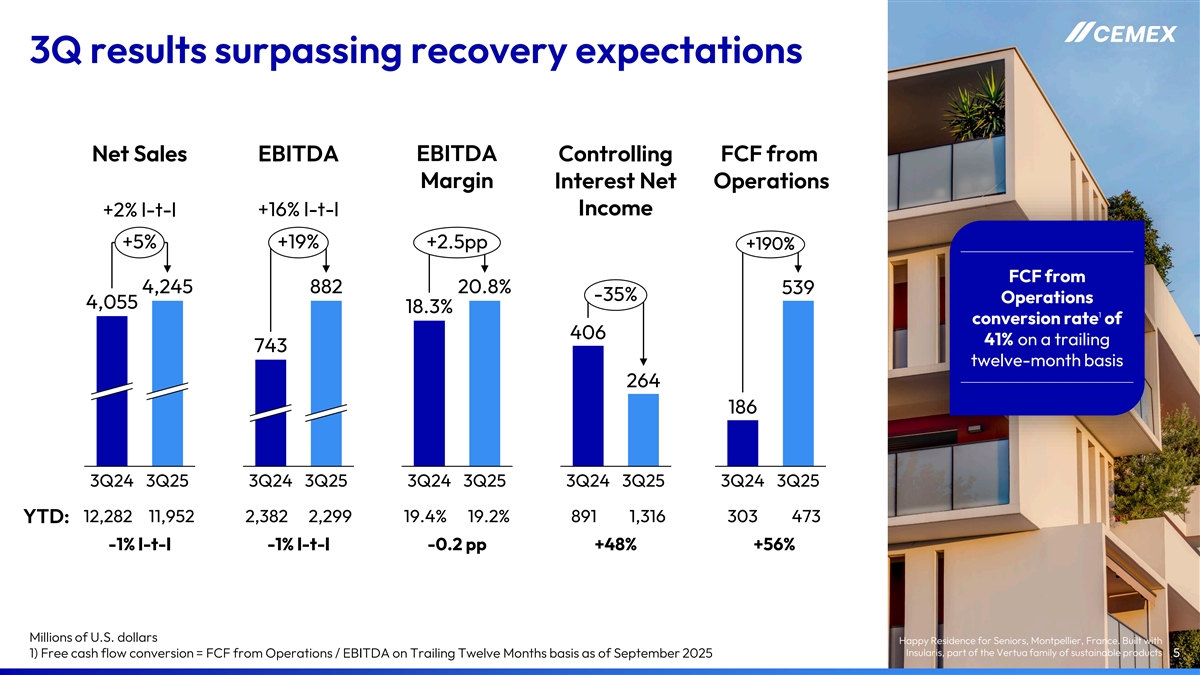
3Q results surpassing recovery expectations Net Sales EBITDA EBITDA Controlling FCF from Margin Interest Net Operations Income +2% l-t-l +16% l-t-l +5% +19% +2.5pp +190% FCF from 4,245 882 20.8% 539 -35% Operations 4,055 18.3% 1 conversion rate of 406 41% on a trailing 743 twelve-month basis 264 186 3Q24 3Q25 3Q24 3Q25 3Q24 3Q25 3Q24 3Q25 3Q24 3Q25 12,282 11,952 2,382 2,299 19.4% 19.2% 891 1,316 303 473 YTD: -1% l-t-l -1% l-t-l -0.2 pp +48% +56% Millions of U.S. dollars Happy Residence for Seniors, Montpellier, France. Built with Insularis, part of the Vertua family of sustainable products 1) Free cash flow conversion = FCF from Operations / EBITDA on Trailing Twelve Months basis as of September 2025 5
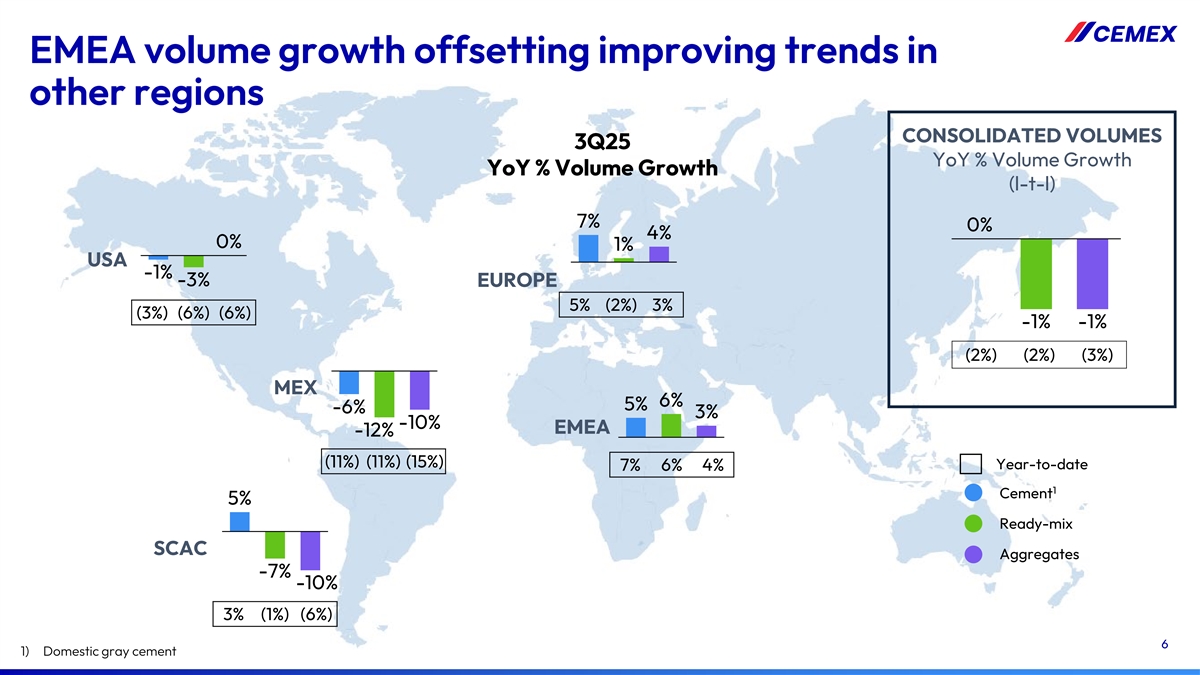
EMEA volume growth offsetting improving trends in other regions CONSOLIDATED VOLUMES 3Q25 YoY % Volume Growth YoY % Volume Growth (l-t-l) 7% 0% 4% 0% 1% USA -1% -3% EUROPE 5% (2%) 3% (3%) (6%) (6%) -1% -1% (2%) (2%) (3%) MEX 6% 5% -6% 3% -10% EMEA -12% (11%) (11%) (15%) Year-to-date 7% 6% 4% 1 Cement 5% Ready-mix SCAC Aggregates -7% -10% 3% (1%) (6%) 6 1) Domestic gray cement
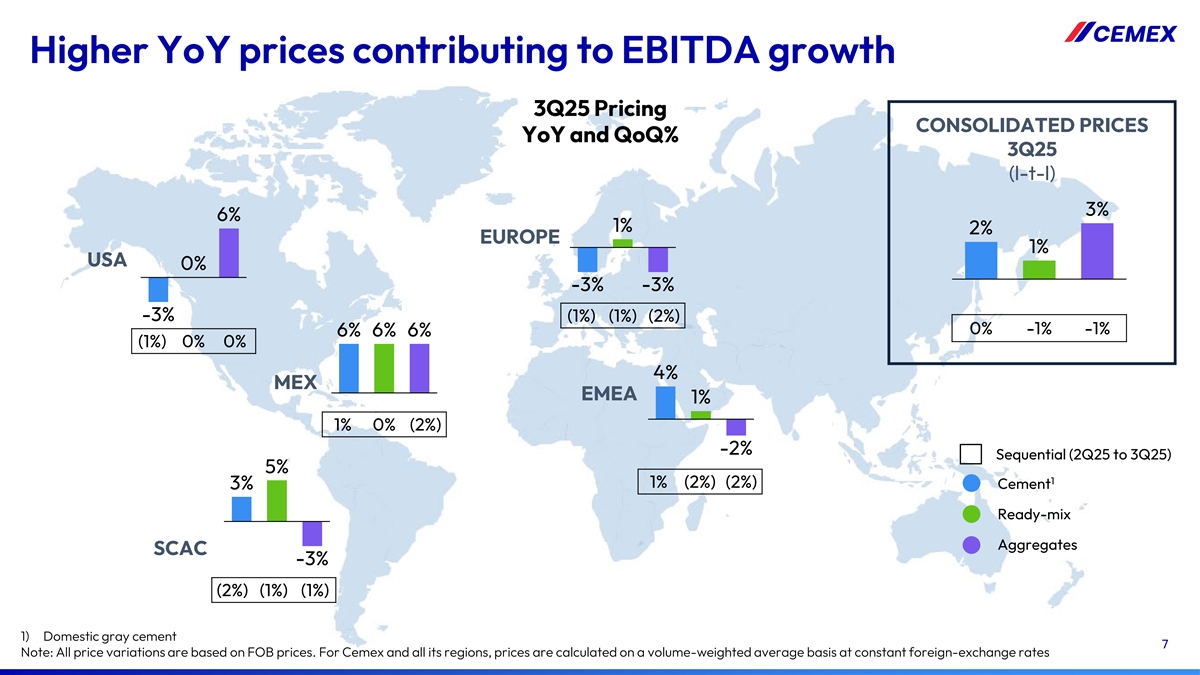
Higher YoY prices contributing to EBITDA growth 3Q25 Pricing CONSOLIDATED PRICES YoY and QoQ% 3Q25 (l-t-l) 3% 6% 1% 2% EUROPE 1% USA 0% -3% -3% -3% (1%) (1%) (2%) 0% -1% -1% 6% 6% 6% (1%) 0% 0% 4% MEX EMEA 1% 1% 0% (2%) -2% Sequential (2Q25 to 3Q25) 5% 1 1% (2%) (2%) Cement 3% Ready-mix Aggregates SCAC -3% (2%) (1%) (1%) 1) Domestic gray cement 7 Note: All price variations are based on FOB prices. For Cemex and all its regions, prices are calculated on a volume-weighted average basis at constant foreign-exchange rates
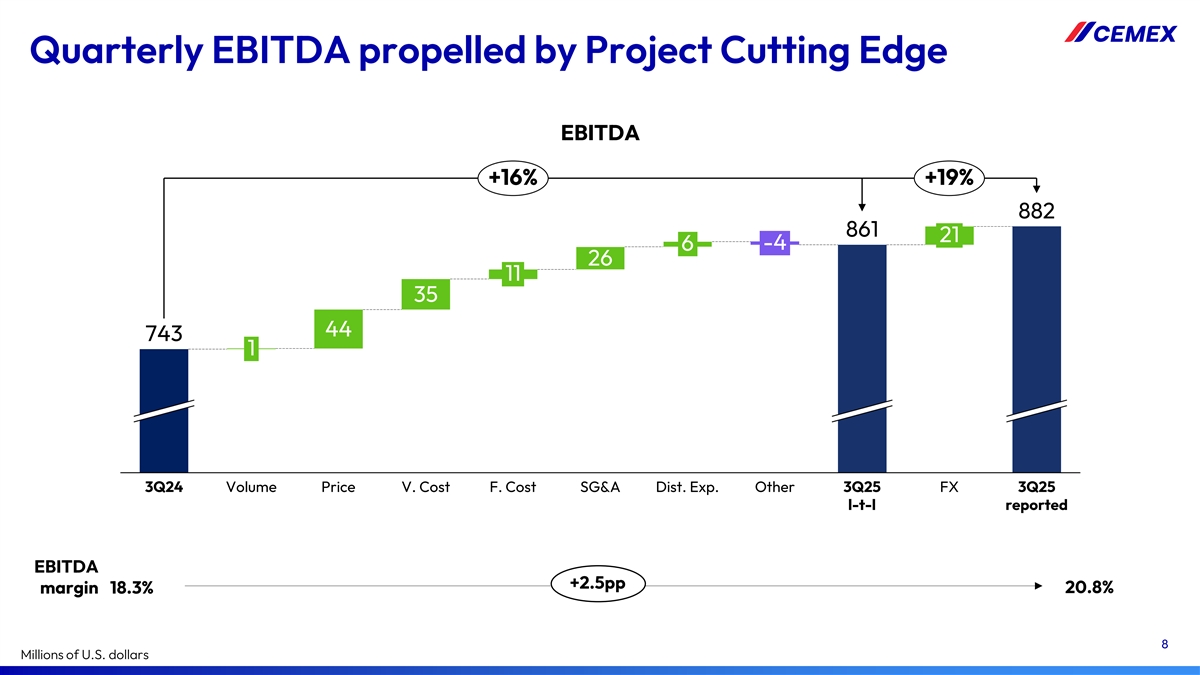
Quarterly EBITDA propelled by Project Cutting Edge EBITDA +16% +19% 882 861 21 -4 6 26 11 35 44 743 1 3Q24 Volume Price V. Cost F. Cost SG&A Dist. Exp. Other 3Q25 FX 3Q25 l-t-l reported EBITDA +2.5pp margin 18.3% 20.8% 8 Millions of U.S. dollars
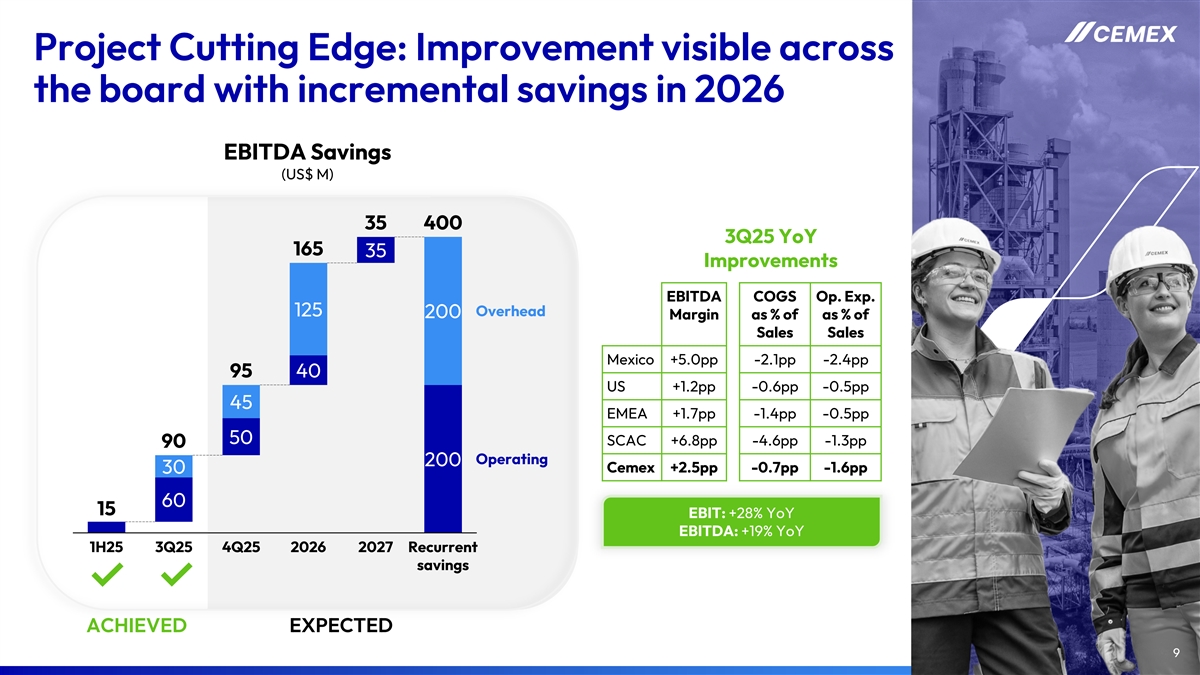
Project Cutting Edge: Improvement visible across the board with incremental savings in 2026 EBITDA Savings (US$ M) 35 400 3Q25 YoY 165 35 Improvements EBITDA COGS Op. Exp. 125 Overhead 200 Margin as % of as % of Sales Sales Mexico +5.0pp -2.1pp -2.4pp 95 40 US +1.2pp -0.6pp -0.5pp 45 EMEA +1.7pp -1.4pp -0.5pp 50 SCAC +6.8pp -4.6pp -1.3pp 90 Operating 200 Cemex +2.5pp -0.7pp -1.6pp 30 60 15 EBIT: +28% YoY EBITDA: +19% YoY 1H25 3Q25 4Q25 2026 2027 Recurrent savings ACHIEVED EXPECTED 9
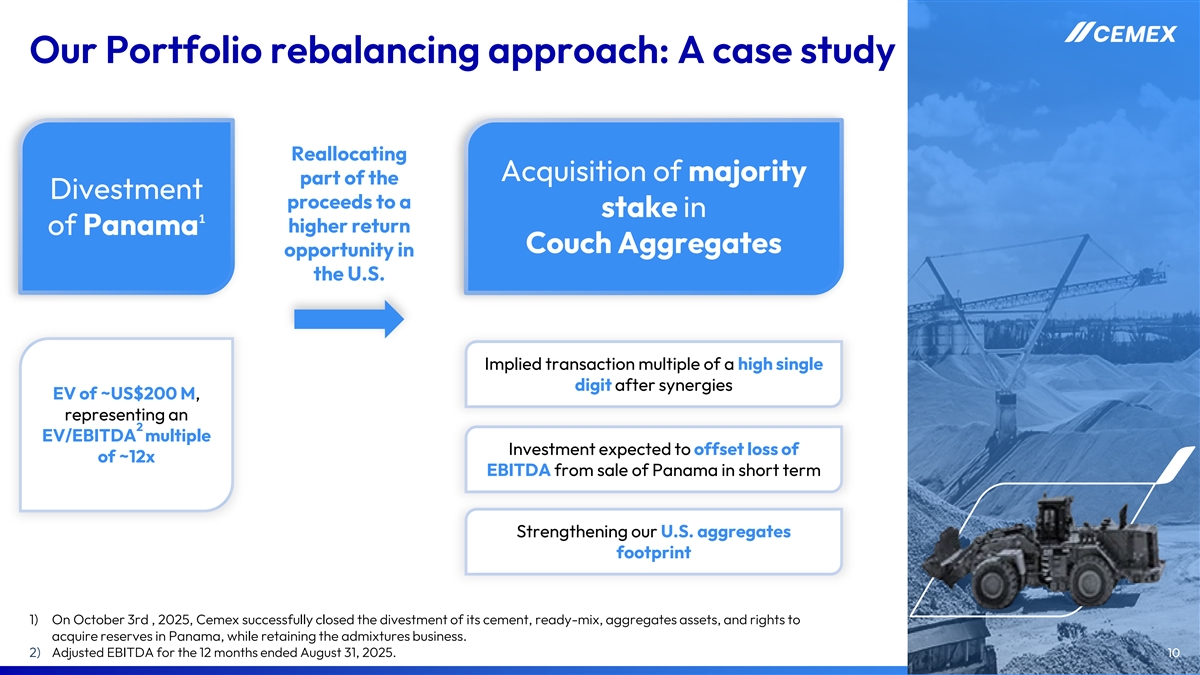
Our Portfolio rebalancing approach: A case study Reallocating Acquisition of majority part of the Divestment proceeds to a stake in 1 higher return of Panama Couch Aggregates opportunity in the U.S. Implied transaction multiple of a high single digit after synergies EV of ~US$200 M, representing an 2 EV/EBITDA multiple Investment expected to offset loss of of ~12x EBITDA from sale of Panama in short term Strengthening our U.S. aggregates footprint 1) On October 3rd , 2025, Cemex successfully closed the divestment of its cement, ready-mix, aggregates assets, and rights to acquire reserves in Panama, while retaining the admixtures business. 2) Adjusted EBITDA for the 12 months ended August 31, 2025. 10

Regional Highlights Aldea Nizuc, Cancún, Mexico 11
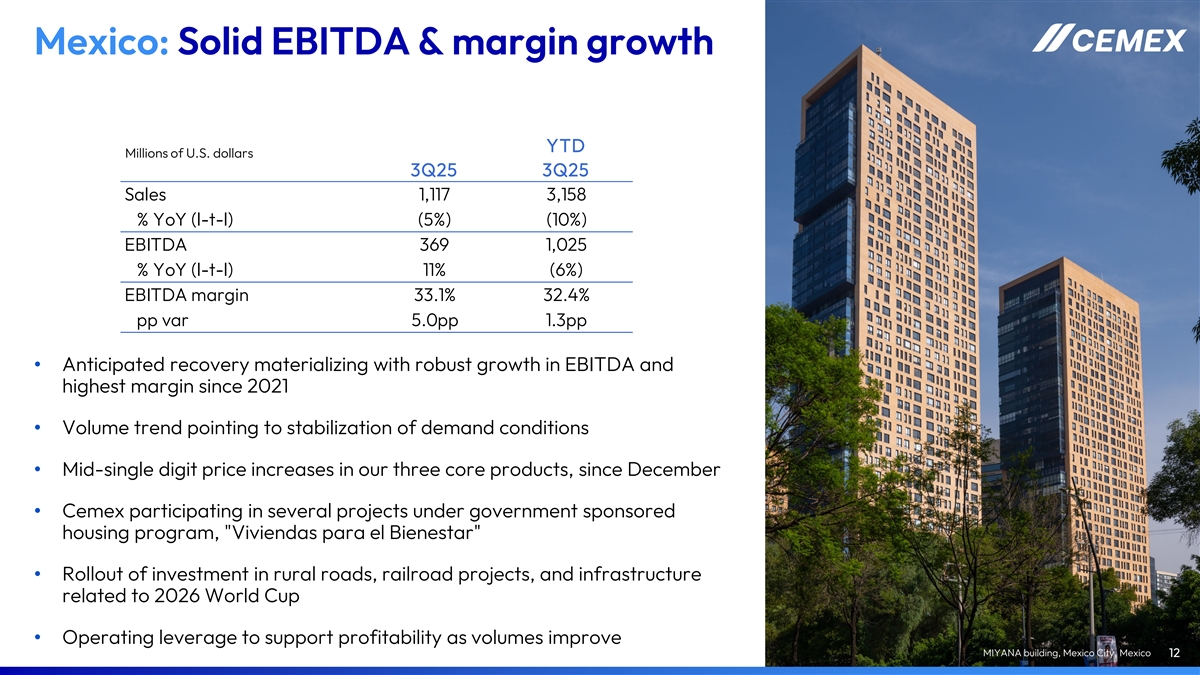
Mexico: Solid EBITDA & margin growth YTD Millions of U.S. dollars 3Q25 3Q25 Sales 1,117 3,158 % YoY (l-t-l) (5%) (10%) EBITDA 369 1,025 % YoY (l-t-l) 11% (6%) EBITDA margin 33.1% 32.4% pp var 5.0pp 1.3pp • Anticipated recovery materializing with robust growth in EBITDA and highest margin since 2021 • Volume trend pointing to stabilization of demand conditions • Mid-single digit price increases in our three core products, since December • Cemex participating in several projects under government sponsored housing program, Viviendas para el Bienestar • Rollout of investment in rural roads, railroad projects, and infrastructure related to 2026 World Cup • Operating leverage to support profitability as volumes improve MIYANA building, Mexico City, Mexico 12
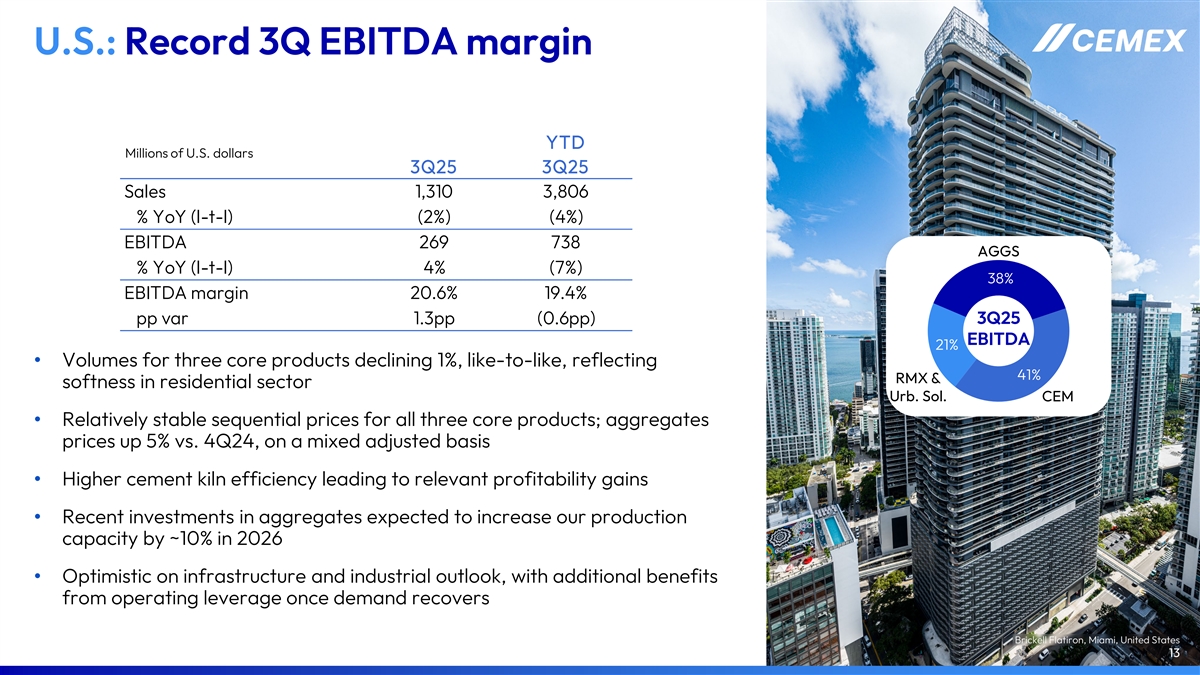
U.S.: Record 3Q EBITDA margin YTD Millions of U.S. dollars 3Q25 3Q25 Sales 1,310 3,806 % YoY (l-t-l) (2%) (4%) EBITDA 269 738 AGGS % YoY (l-t-l) 4% (7%) 38% EBITDA margin 20.6% 19.4% 3Q25 pp var 1.3pp (0.6pp) EBITDA 21% • Volumes for three core products declining 1%, like-to-like, reflecting 41% RMX & softness in residential sector Urb. Sol. CEM • Relatively stable sequential prices for all three core products; aggregates prices up 5% vs. 4Q24, on a mixed adjusted basis • Higher cement kiln efficiency leading to relevant profitability gains • Recent investments in aggregates expected to increase our production capacity by ~10% in 2026 • Optimistic on infrastructure and industrial outlook, with additional benefits from operating leverage once demand recovers Brickell Flatiron, Miami, United States 13
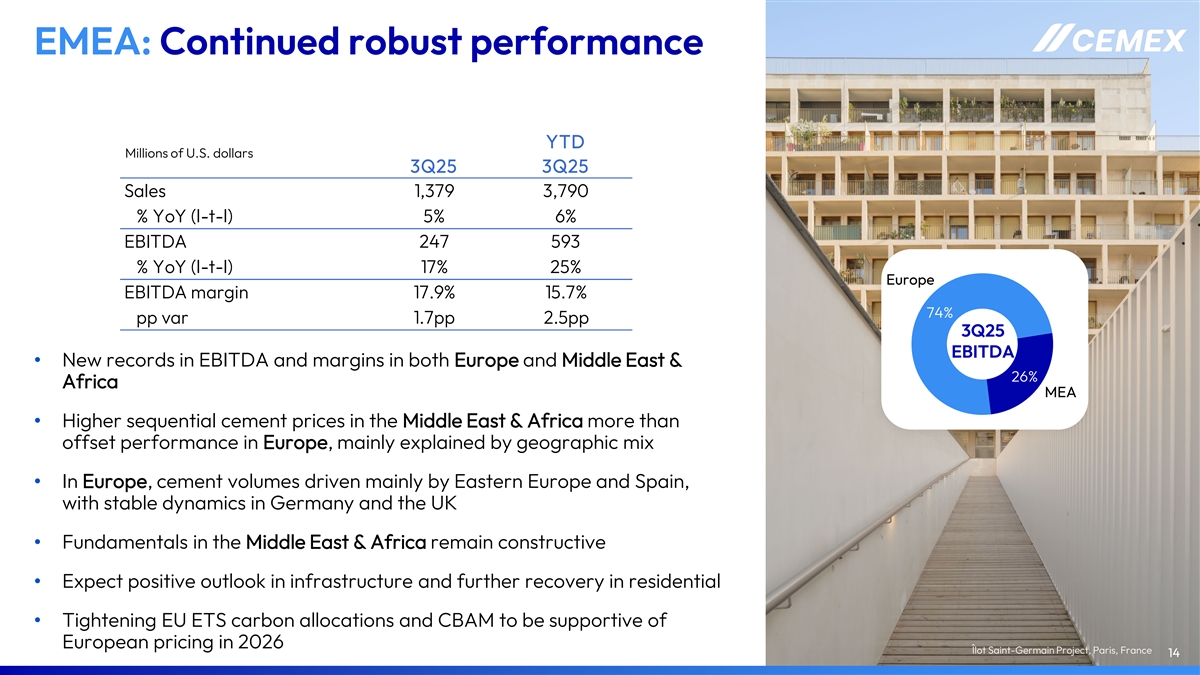
EMEA: Continued robust performance YTD Millions of U.S. dollars 3Q25 3Q25 Sales 1,379 3,790 % YoY (l-t-l) 5% 6% EBITDA 247 593 % YoY (l-t-l) 17% 25% Europe EBITDA margin 17.9% 15.7% 74% pp var 1.7pp 2.5pp 3Q25 EBITDA • New records in EBITDA and margins in both Europe and Middle East & 26% Africa MEA • Higher sequential cement prices in the Middle East & Africa more than offset performance in Europe, mainly explained by geographic mix • In Europe, cement volumes driven mainly by Eastern Europe and Spain, with stable dynamics in Germany and the UK • Fundamentals in the Middle East & Africa remain constructive • Expect positive outlook in infrastructure and further recovery in residential • Tightening EU ETS carbon allocations and CBAM to be supportive of European pricing in 2026 Îlot Saint-Germain Project, Paris, France 14
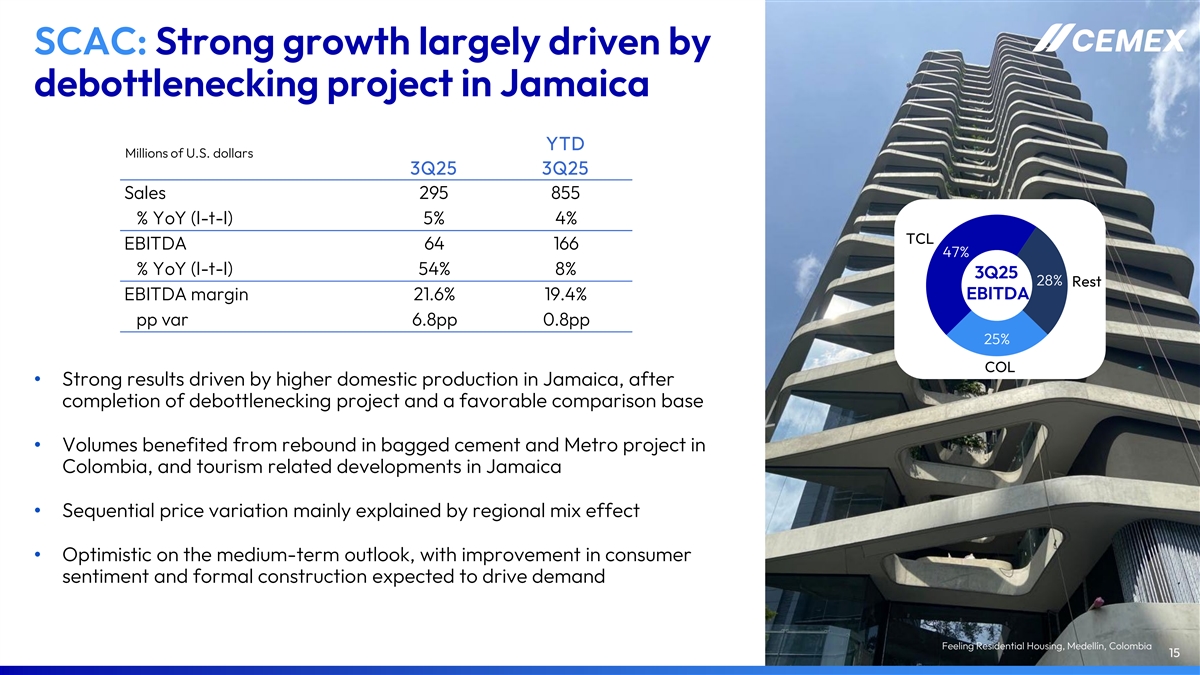
SCAC: Strong growth largely driven by debottlenecking project in Jamaica YTD Millions of U.S. dollars 3Q25 3Q25 Sales 295 855 % YoY (l-t-l) 5% 4% TCL EBITDA 64 166 47% % YoY (l-t-l) 54% 8% 3Q25 28% Rest EBITDA margin 21.6% 19.4% EBITDA pp var 6.8pp 0.8pp 25% COL • Strong results driven by higher domestic production in Jamaica, after completion of debottlenecking project and a favorable comparison base • Volumes benefited from rebound in bagged cement and Metro project in Colombia, and tourism related developments in Jamaica • Sequential price variation mainly explained by regional mix effect • Optimistic on the medium-term outlook, with improvement in consumer sentiment and formal construction expected to drive demand Feeling Residential Housing, Medellín, Colombia 15

Financial Developments Pelješac Bridge, Pelješac, Croatia Built with Vertua Concrete, part of our Vertua family of products with sustainable attributes
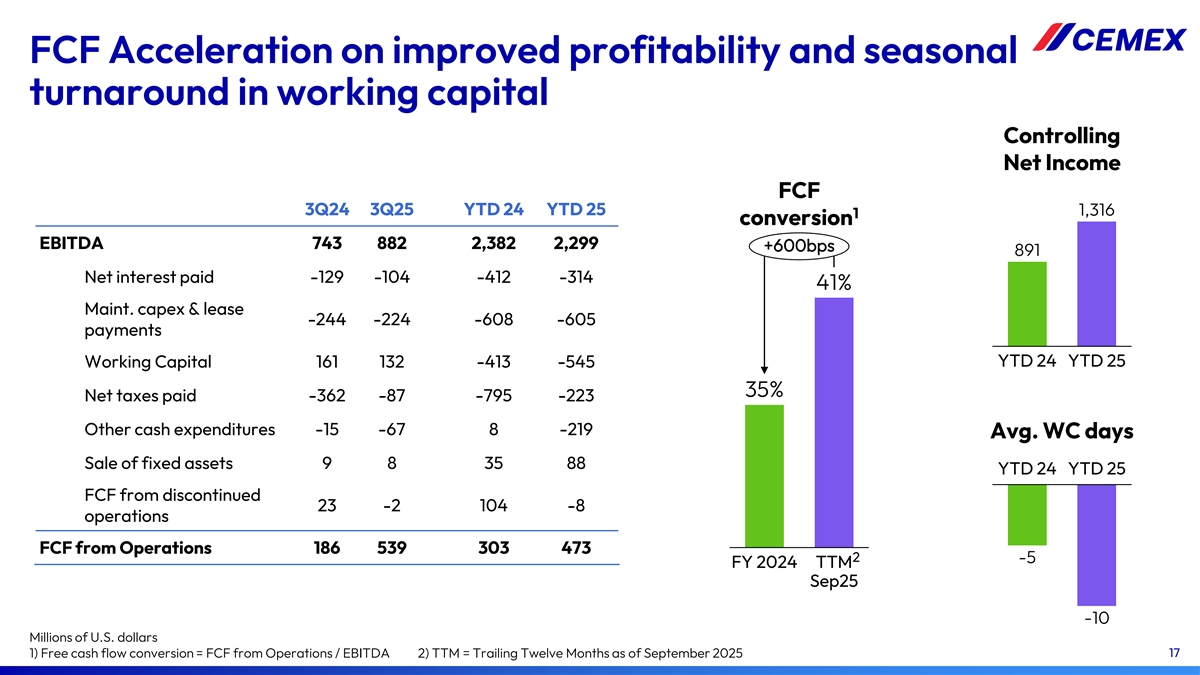
FCF Acceleration on improved profitability and seasonal turnaround in working capital Controlling Net Income FCF 3Q24 3Q25 YTD 24 YTD 25 1,316 1 conversion EBITDA 743 882 2,382 2,299 +600bps 891 Net interest paid -129 -104 -412 -314 41% Maint. capex & lease -244 -224 -608 -605 payments Working Capital 161 132 -413 -545 YTD 24 YTD 25 35% Net taxes paid -362 -87 -795 -223 Other cash expenditures -15 -67 8 -219 Avg. WC days Sale of fixed assets 9 8 35 88 YTD 24 YTD 25 FCF from discontinued 23 -2 104 -8 operations FCF from Operations 186 539 303 473 2 -5 FY 2024 TTM Sep25 -10 Millions of U.S. dollars 1) Free cash flow conversion = FCF from Operations / EBITDA 2) TTM = Trailing Twelve Months as of September 2025 17

2025 Outlook Gilbert Chabroux School, Lyon, France Built with Insularis, part of our Vertua family of products with sustainable attributes
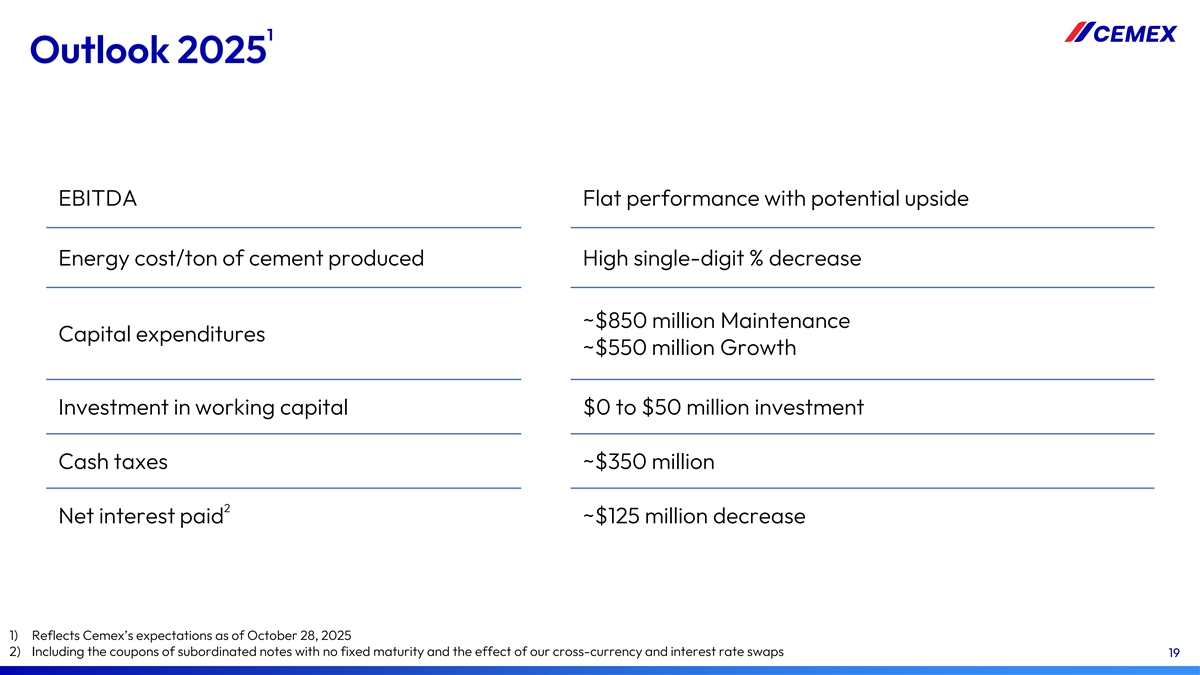
1 Outlook 2025 EBITDA Flat performance with potential upside Energy cost/ton of cement produced High single-digit % decrease ~$850 million Maintenance Capital expenditures ~$550 million Growth Investment in working capital $0 to $50 million investment Cash taxes ~$350 million 2 Net interest paid ~$125 million decrease 1) Reflects Cemex’s expectations as of October 28, 2025 2) Including the coupons of subordinated notes with no fixed maturity and the effect of our cross-currency and interest rate swaps 19

Appendix International Museum of Baroque, Puebla, Mexico
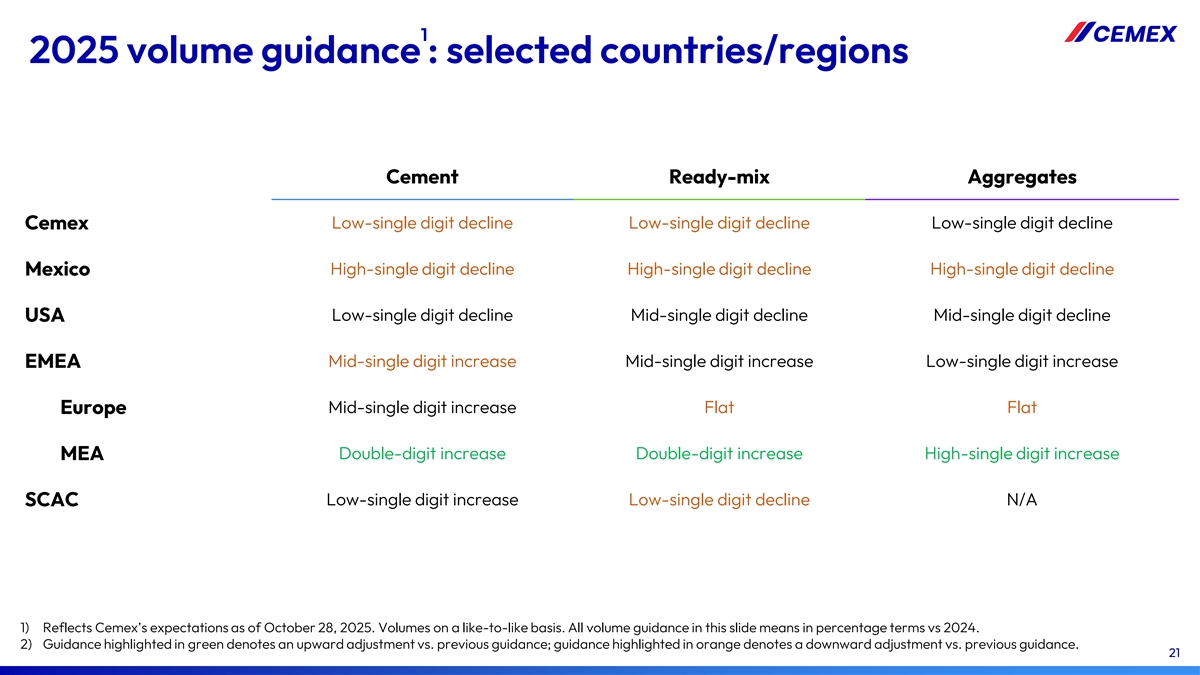
1 2025 volume guidance : selected countries/regions Cement Ready-mix Aggregates Low-single digit decline Low-single digit decline Low-single digit decline Cemex High-single digit decline High-single digit decline High-single digit decline Mexico Low-single digit decline Mid-single digit decline Mid-single digit decline USA EMEA Mid-single digit increase Mid-single digit increase Low-single digit increase Europe Mid-single digit increase Flat Flat MEA Double-digit increase Double-digit increase High-single digit increase Low-single digit increase Low-single digit decline N/A SCAC 1) Reflects Cemex’s expectations as of October 28, 2025. Volumes on a like-to-like basis. All volume guidance in this slide means in percentage terms vs 2024. 2) Guidance highlighted in green denotes an upward adjustment vs. previous guidance; guidance highlighted in orange denotes a downward adjustment vs. previous guidance. 21
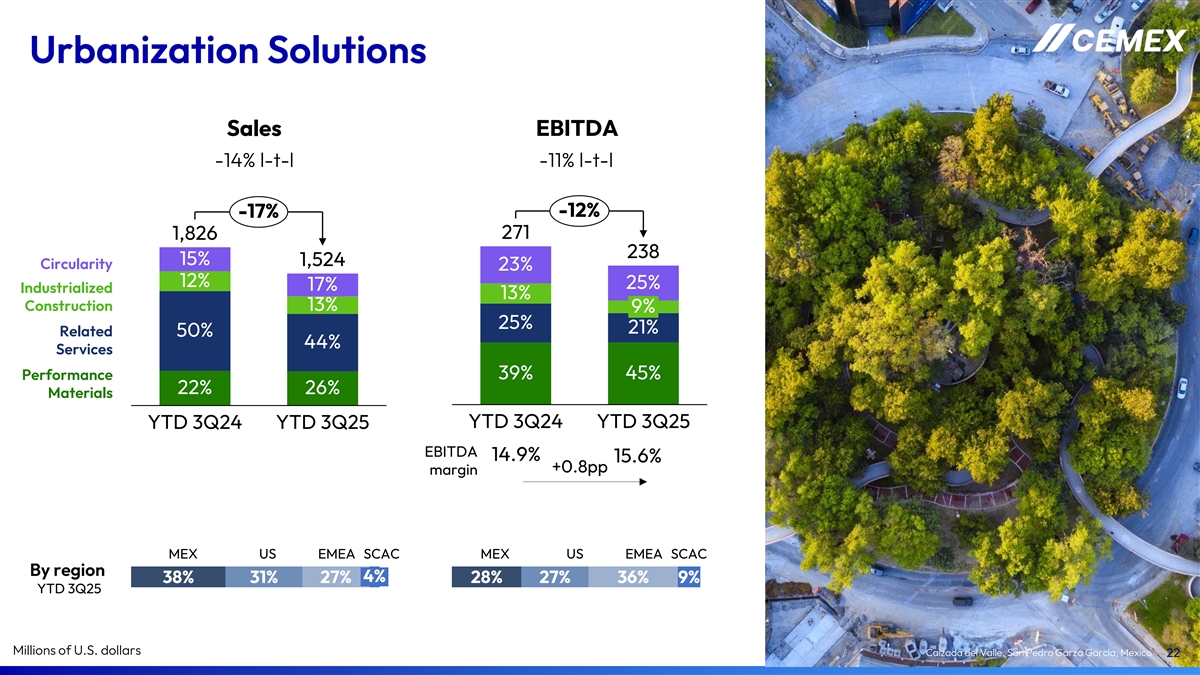
Urbanization Solutions Sales EBITDA -14% l-t-l -11% l-t-l -17% -12% 271 1,826 238 15% 1,524 Circularity 23% 12% 25% 17% Industrialized 13% Construction 13% 9% 25% 21% Related 50% 44% Services Performance 39% 45% 22% 26% Materials YTD 3Q24 YTD 3Q25 YTD 3Q24 YTD 3Q25 EBITDA 14.9% 15.6% +0.8pp margin MEX US EMEA SCAC MEX US EMEA SCAC By region 4% 38% 31% 27% 28% 27% 36% 9% YTD 3Q25 Millions of U.S. dollars Calzada del Valle, San Pedro Garza García, Mexico 22
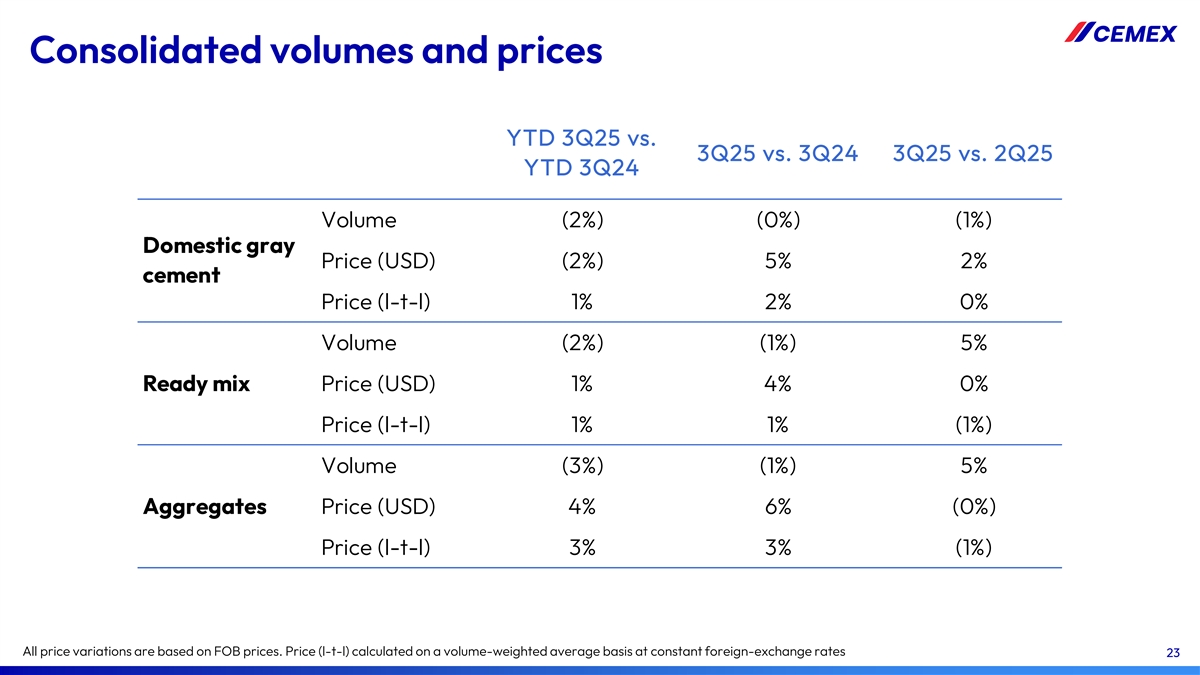
Consolidated volumes and prices YTD 3Q25 vs. 3Q25 vs. 3Q24 3Q25 vs. 2Q25 YTD 3Q24 Volume (2%) (0%) (1%) Domestic gray Price (USD) (2%) 5% 2% cement Price (l-t-l) 1% 2% 0% Volume (2%) (1%) 5% Ready mix Price (USD) 1% 4% 0% Price (l-t-l) 1% 1% (1%) Volume (3%) (1%) 5% Aggregates Price (USD) 4% 6% (0%) Price (l-t-l) 3% 3% (1%) All price variations are based on FOB prices. Price (l-t-l) calculated on a volume-weighted average basis at constant foreign-exchange rates 23
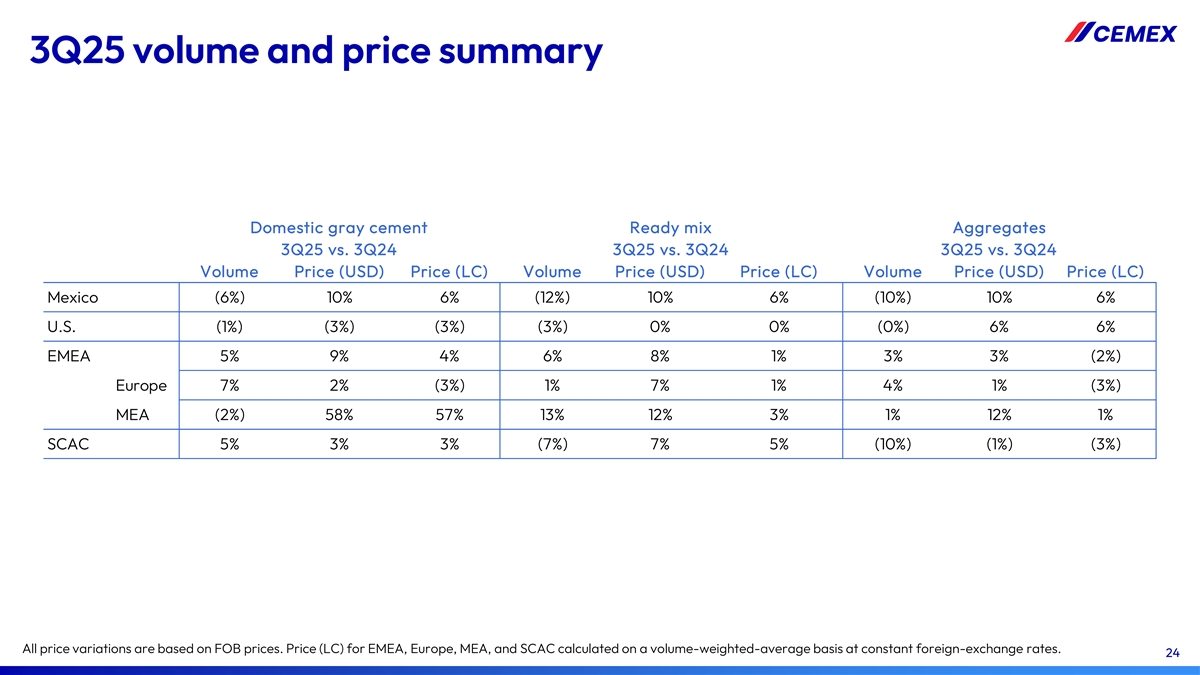
3Q25 volume and price summary Domestic gray cement Ready mix Aggregates 3Q25 vs. 3Q24 3Q25 vs. 3Q24 3Q25 vs. 3Q24 Volume Price (USD) Price (LC) Volume Price (USD) Price (LC) Volume Price (USD) Price (LC) Mexico (6%) 10% 6% (12%) 10% 6% (10%) 10% 6% U.S. (1%) (3%) (3%) (3%) 0% 0% (0%) 6% 6% EMEA 5% 9% 4% 6% 8% 1% 3% 3% (2%) Europe 7% 2% (3%) 1% 7% 1% 4% 1% (3%) MEA (2%) 58% 57% 13% 12% 3% 1% 12% 1% SCAC 5% 3% 3% (7%) 7% 5% (10%) (1%) (3%) All price variations are based on FOB prices. Price (LC) for EMEA, Europe, MEA, and SCAC calculated on a volume-weighted-average basis at constant foreign-exchange rates. 24
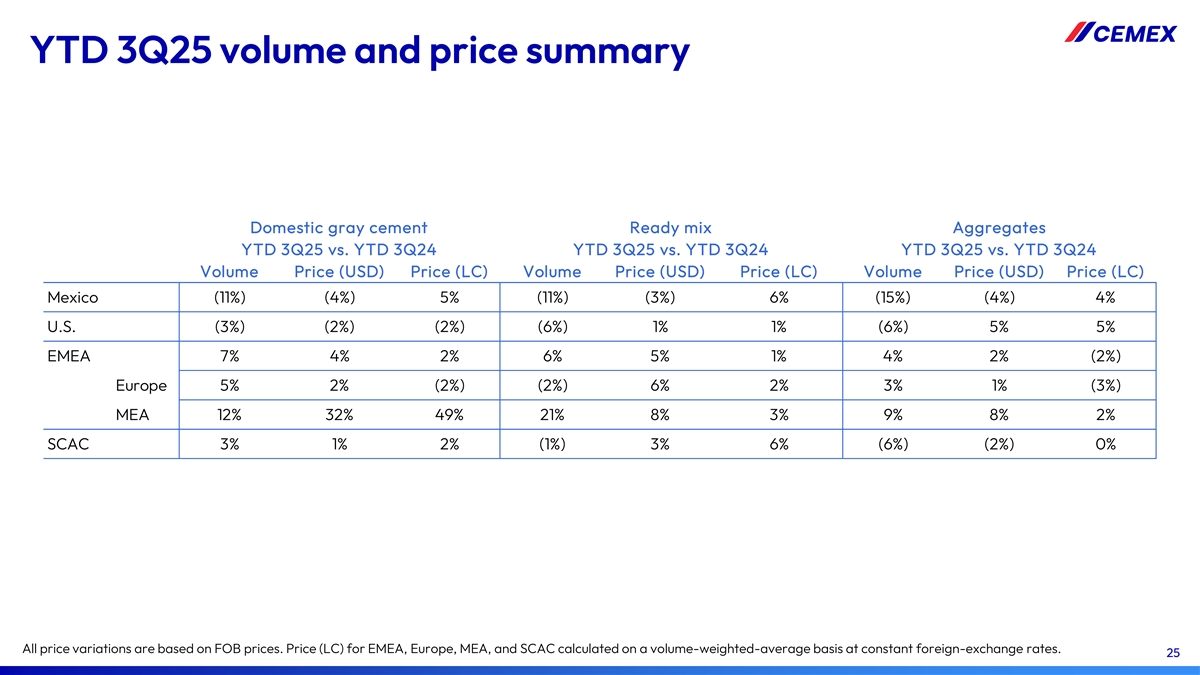
YTD 3Q25 volume and price summary Domestic gray cement Ready mix Aggregates YTD 3Q25 vs. YTD 3Q24 YTD 3Q25 vs. YTD 3Q24 YTD 3Q25 vs. YTD 3Q24 Volume Price (USD) Price (LC) Volume Price (USD) Price (LC) Volume Price (USD) Price (LC) Mexico (11%) (4%) 5% (11%) (3%) 6% (15%) (4%) 4% U.S. (3%) (2%) (2%) (6%) 1% 1% (6%) 5% 5% EMEA 7% 4% 2% 6% 5% 1% 4% 2% (2%) Europe 5% 2% (2%) (2%) 6% 2% 3% 1% (3%) MEA 12% 32% 49% 21% 8% 3% 9% 8% 2% SCAC 3% 1% 2% (1%) 3% 6% (6%) (2%) 0% All price variations are based on FOB prices. Price (LC) for EMEA, Europe, MEA, and SCAC calculated on a volume-weighted-average basis at constant foreign-exchange rates. 25
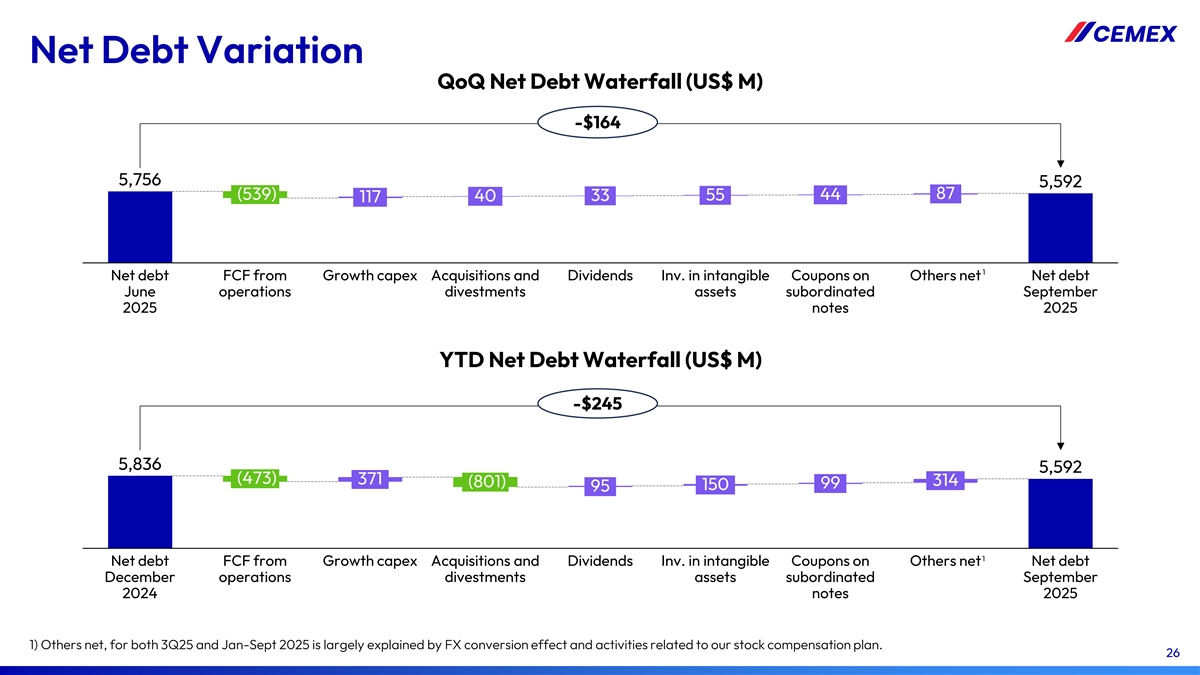
Net Debt Variation QoQ Net Debt Waterfall (US$ M) -$164 5,756 5,592 87 (539) 44 40 33 55 117 1 Net debt FCF from Growth capex Acquisitions and Dividends Inv. in intangible Coupons on Others net Net debt June operations divestments assets subordinated September 2025 notes 2025 YTD Net Debt Waterfall (US$ M) -$245 5,836 5,592 (473) 371 314 (801) 99 150 95 1 Net debt FCF from Growth capex Acquisitions and Dividends Inv. in intangible Coupons on Others net Net debt December operations divestments assets subordinated September 2024 notes 2025 1) Others net, for both 3Q25 and Jan-Sept 2025 is largely explained by FX conversion effect and activities related to our stock compensation plan. 26
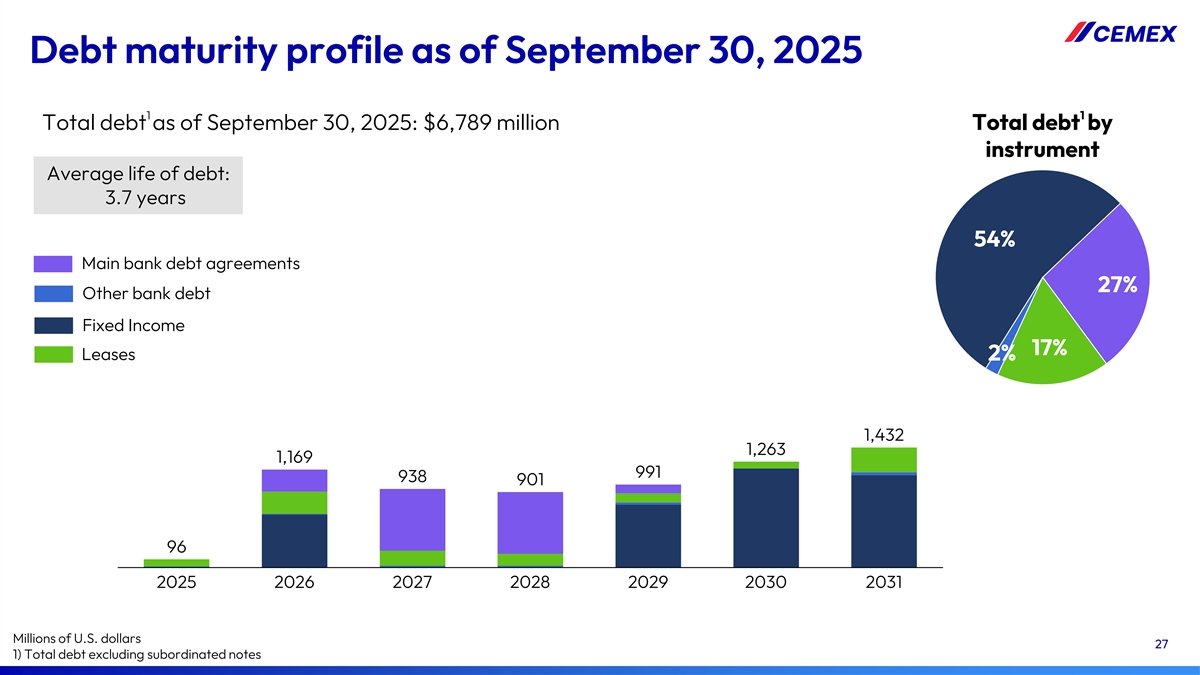
Debt maturity profile as of September 30, 2025 1 1 Total debt as of September 30, 2025: $6,789 million Total debt by instrument Average life of debt: 3.7 years 54% Main bank debt agreements 27% Other bank debt Fixed Income 17% Leases 2% 1,432 1,263 1,169 991 938 901 96 2025 2026 2027 2028 2029 2030 2031 Millions of U.S. dollars 27 1) Total debt excluding subordinated notes
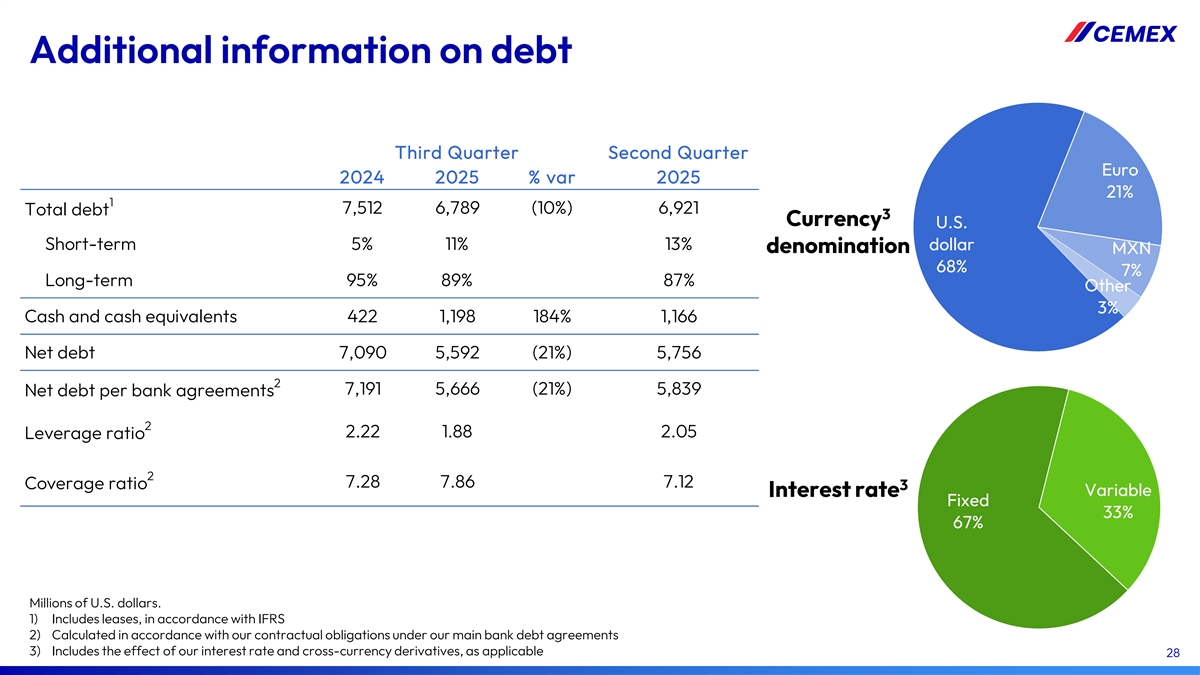
Additional information on debt Third Quarter Second Quarter Euro 2024 2025 % var 2025 21% 1 7,512 6,789 (10%) 6,921 Total debt 3 Currency U.S. Short-term 5% 11% 13% dollar denomination MXN 68% 7% Long-term 95% 89% 87% Other 3% Cash and cash equivalents 422 1,198 184% 1,166 Net debt 7,090 5,592 (21%) 5,756 2 7,191 5,666 (21%) 5,839 Net debt per bank agreements 2 2.22 1.88 2.05 Leverage ratio 2 7.28 7.86 7.12 Coverage ratio 3 Variable Interest rate Fixed 33% 67% Millions of U.S. dollars. 1) Includes leases, in accordance with IFRS 2) Calculated in accordance with our contractual obligations under our main bank debt agreements 3) Includes the effect of our interest rate and cross-currency derivatives, as applicable 28
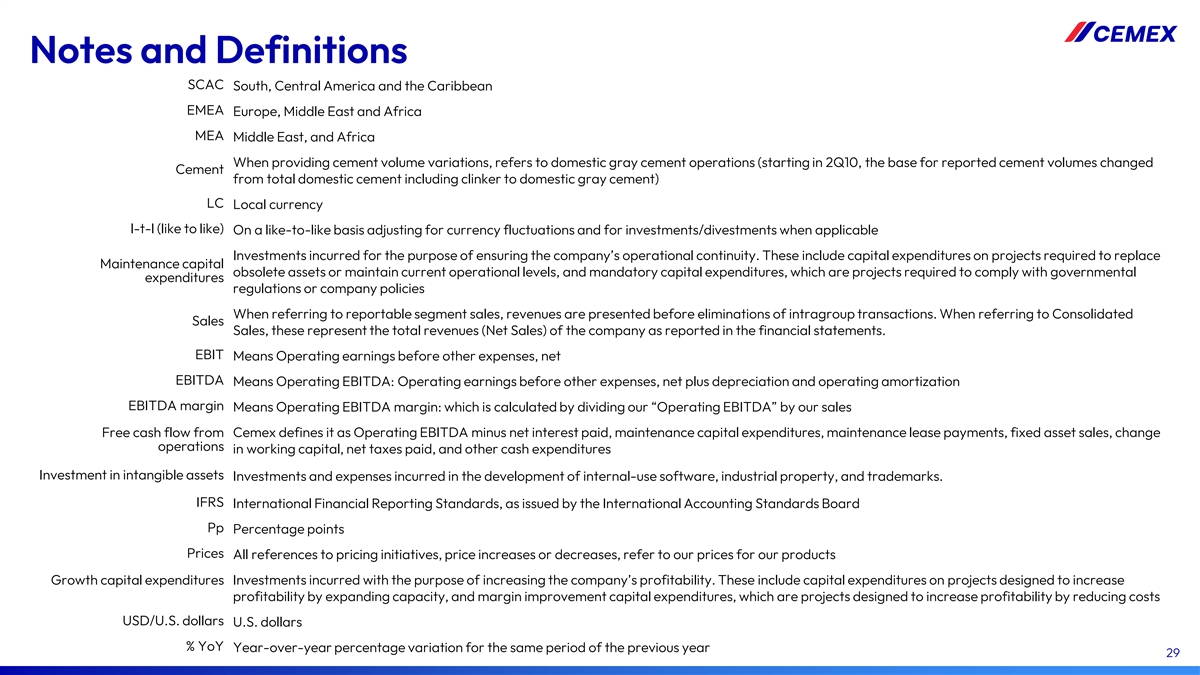
Notes and Definitions SCAC South, Central America and the Caribbean EMEA Europe, Middle East and Africa MEA Middle East, and Africa When providing cement volume variations, refers to domestic gray cement operations (starting in 2Q10, the base for reported cement volumes changed Cement from total domestic cement including clinker to domestic gray cement) LC Local currency l-t-l (like to like) On a like-to-like basis adjusting for currency fluctuations and for investments/divestments when applicable Investments incurred for the purpose of ensuring the company’s operational continuity. These include capital expenditures on projects required to replace Maintenance capital obsolete assets or maintain current operational levels, and mandatory capital expenditures, which are projects required to comply with governmental expenditures regulations or company policies When referring to reportable segment sales, revenues are presented before eliminations of intragroup transactions. When referring to Consolidated Sales Sales, these represent the total revenues (Net Sales) of the company as reported in the financial statements. EBIT Means Operating earnings before other expenses, net EBITDA Means Operating EBITDA: Operating earnings before other expenses, net plus depreciation and operating amortization EBITDA margin Means Operating EBITDA margin: which is calculated by dividing our “Operating EBITDA” by our sales Free cash flow from Cemex defines it as Operating EBITDA minus net interest paid, maintenance capital expenditures, maintenance lease payments, fixed asset sales, change operations in working capital, net taxes paid, and other cash expenditures Investment in intangible assets Investments and expenses incurred in the development of internal-use software, industrial property, and trademarks. IFRS International Financial Reporting Standards, as issued by the International Accounting Standards Board Pp Percentage points Prices All references to pricing initiatives, price increases or decreases, refer to our prices for our products Growth capital expenditures Investments incurred with the purpose of increasing the company’s profitability. These include capital expenditures on projects designed to increase profitability by expanding capacity, and margin improvement capital expenditures, which are projects designed to increase profitability by reducing costs USD/U.S. dollars U.S. dollars % YoY Year-over-year percentage variation for the same period of the previous year 29
Contact Information Investors Relations Stock Information In the United States: NYSE (ADS): +1 877 7CX NYSE CX In Mexico: Mexican Stock Exchange +52 81 8888 4327 (CPO): CEMEX.CPO ir@cemex.com Ratio of CPO to ADS: 10 to 1