
© 2025 Texas Capital Bank Member FDIC November 2025 Annual Governance Discussion Materials
2 Forward-Looking Statements This communication contains “forward-looking statements” within the meaning of and pursuant to the Private Securities Litigation Reform Act of 1995 regarding, among other things, Texas Capital Bancshares, Inc.’s (TCBI or Texas Capital or the Firm) financial condition, results of operations, business plans and future performance. These statements are not historical in nature and may often be identified by the use of words such as “believes,” “projects,” “expects,” “may,” “estimates,” “should,” “plans,” “targets,” “intends” “could,” “would,” “anticipates,” “potential,” “confident,” “optimistic” or the negative thereof, or other variations thereon, or comparable terminology, or by discussions of strategy, objectives, estimates, trends, guidance, expectations and future plans. Because forward-looking statements relate to future results and occurrences, they are subject to inherent and various uncertainties, risks, and changes in circumstances that are difficult to predict, may change over time, are based on management’s expectations and assumptions at the time the statements are made and are not guarantees of future results. Numerous risks and other factors, many of which are beyond management’s control, could cause actual results to differ materially from future results expressed or implied by such forward-looking statements. While there can be no assurance that any list of risks is complete, important risks and other factors that could cause actual results to differ materially from those contemplated by forward- looking statements include, but are not limited to: economic or business conditions in Texas, the United States or globally that impact TCBI or its customers; negative credit quality developments arising from the foregoing or other factors; TCBI’s ability to effectively manage its liquidity and maintain adequate regulatory capital to support its businesses; TCBI’s ability to pursue and execute upon growth plans, whether as a function of capital, liquidity or other limitations; TCBI’s ability to successfully execute its business strategy, including its strategic plan and developing and executing new lines of business and new products and services; the extensive regulations to which TCBI is subject and its ability to comply with applicable governmental regulations, including legislative and regulatory changes; TCBI’s ability to effectively manage information technology systems, including third party vendors, cyber or data privacy incidents or other failures, disruptions or security breaches; elevated or further changes in interest rates, including the impact of interest rates on TCBI’s securities portfolio and funding costs, as well as related balance sheet implications stemming from the fair value of our assets and liabilities; the effectiveness of TCBI’s risk management processes strategies and monitoring; fluctuations in commercial and residential real estate values, especially as they relate to the value of collateral supporting TCBI’s loans; the failure to identify, attract and retain key personnel and other employees; increased or expanded competition from banks and other financial service providers in TCBI’s markets; adverse developments in the banking industry and the potential impact of such developments on customer confidence, liquidity and regulatory responses to these developments, including in the context of regulatory examinations and related findings and actions; negative press and social media attention with respect to the banking industry or TCBI, in particular; claims, litigation or regulatory investigations and actions that TCBI may become subject to; severe weather, natural disasters, climate change, acts of war, terrorism, global conflict (including those already reported by the media, as well as others that may arise), or other external events, as well as related legislative and regulatory initiatives; and the risks and factors more fully described in TCBI’s most recent Annual Report on Form 10-K, Quarterly Reports on Form 10- Q and other documents and filings with the SEC. The information contained in this communication speaks only as of its date. Except to the extent required by applicable law or regulation, we disclaim any obligation to update such factors or to publicly announce the results of any revisions to any of the forward-looking statements included herein to reflect future events or developments.
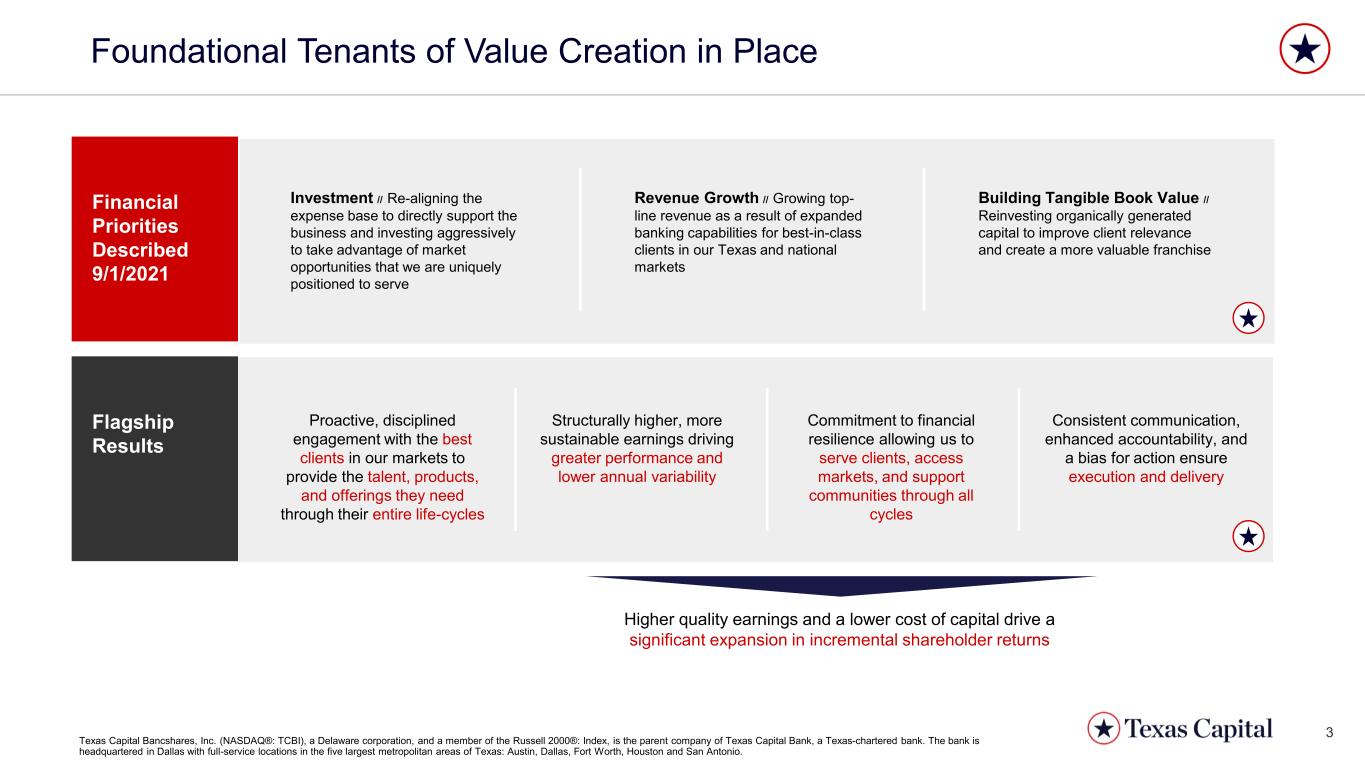
3 Foundational Tenants of Value Creation in Place Financial Priorities Described 9/1/2021 Building Tangible Book Value // Reinvesting organically generated capital to improve client relevance and create a more valuable franchise Investment // Re-aligning the expense base to directly support the business and investing aggressively to take advantage of market opportunities that we are uniquely positioned to serve Revenue Growth // Growing top- line revenue as a result of expanded banking capabilities for best-in-class clients in our Texas and national markets Flagship Results Proactive, disciplined engagement with the best clients in our markets to provide the talent, products, and offerings they need through their entire life-cycles Structurally higher, more sustainable earnings driving greater performance and lower annual variability Consistent communication, enhanced accountability, and a bias for action ensure execution and delivery Commitment to financial resilience allowing us to serve clients, access markets, and support communities through all cycles Higher quality earnings and a lower cost of capital drive a significant expansion in incremental shareholder returns Texas Capital Bancshares, Inc. (NASDAQ®: TCBI), a Delaware corporation, and a member of the Russell 2000®: Index, is the parent company of Texas Capital Bank, a Texas-chartered bank. The bank is headquartered in Dallas with full-service locations in the five largest metropolitan areas of Texas: Austin, Dallas, Fort Worth, Houston and San Antonio.
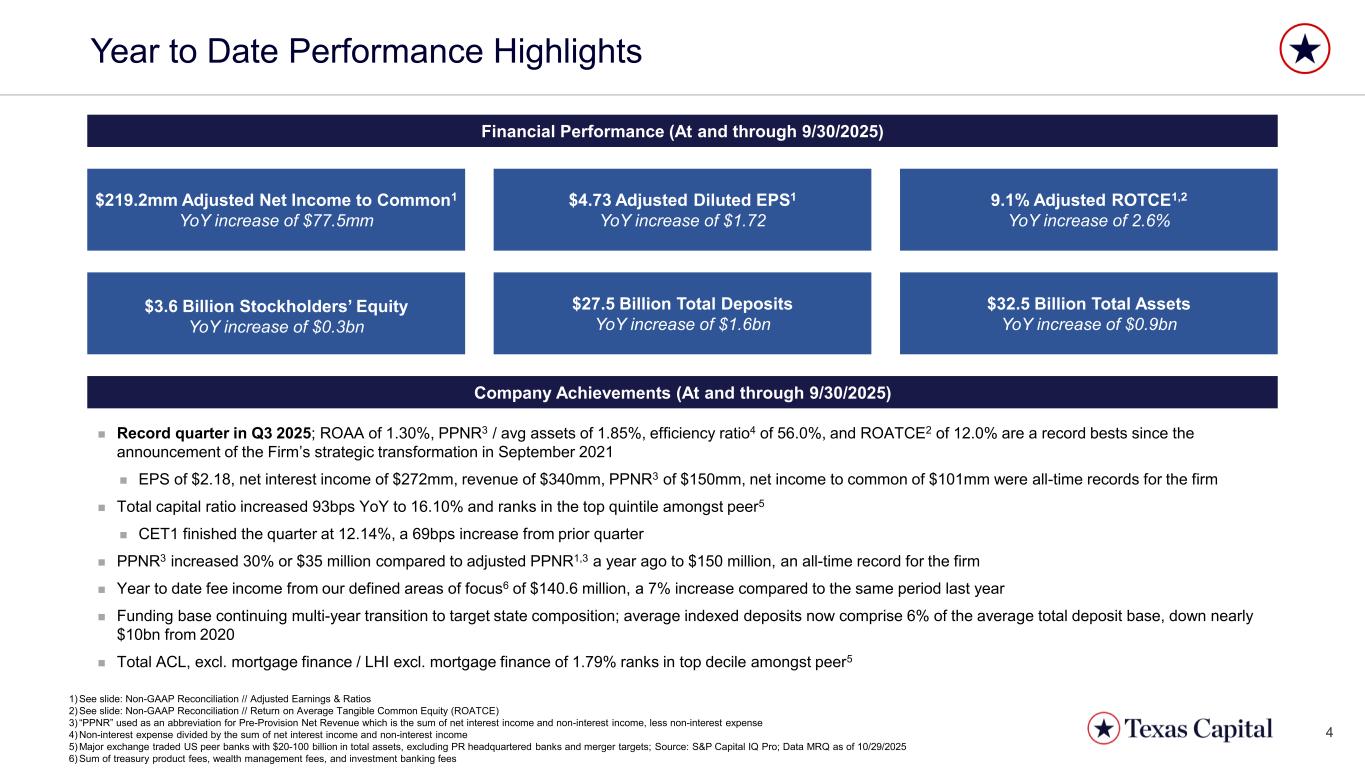
4 Year to Date Performance Highlights Financial Performance (At and through 9/30/2025) $4.73 Adjusted Diluted EPS1 YoY increase of $1.72 9.1% Adjusted ROTCE1,2 YoY increase of 2.6% $219.2mm Adjusted Net Income to Common1 YoY increase of $77.5mm $3.6 Billion Stockholders’ Equity YoY increase of $0.3bn $27.5 Billion Total Deposits YoY increase of $1.6bn $32.5 Billion Total Assets YoY increase of $0.9bn Company Achievements (At and through 9/30/2025) ◼ Record quarter in Q3 2025; ROAA of 1.30%, PPNR3 / avg assets of 1.85%, efficiency ratio4 of 56.0%, and ROATCE2 of 12.0% are a record bests since the announcement of the Firm’s strategic transformation in September 2021 ◼ EPS of $2.18, net interest income of $272mm, revenue of $340mm, PPNR3 of $150mm, net income to common of $101mm were all-time records for the firm ◼ Total capital ratio increased 93bps YoY to 16.10% and ranks in the top quintile amongst peer5 ◼ CET1 finished the quarter at 12.14%, a 69bps increase from prior quarter ◼ PPNR3 increased 30% or $35 million compared to adjusted PPNR1,3 a year ago to $150 million, an all-time record for the firm ◼ Year to date fee income from our defined areas of focus6 of $140.6 million, a 7% increase compared to the same period last year ◼ Funding base continuing multi-year transition to target state composition; average indexed deposits now comprise 6% of the average total deposit base, down nearly $10bn from 2020 ◼ Total ACL, excl. mortgage finance / LHI excl. mortgage finance of 1.79% ranks in top decile amongst peer5 1) See slide: Non-GAAP Reconciliation // Adjusted Earnings & Ratios 2) See slide: Non-GAAP Reconciliation // Return on Average Tangible Common Equity (ROATCE) 3) “PPNR” used as an abbreviation for Pre-Provision Net Revenue which is the sum of net interest income and non-interest income, less non-interest expense 4) Non-interest expense divided by the sum of net interest income and non-interest income 5) Major exchange traded US peer banks with $20-100 billion in total assets, excluding PR headquartered banks and merger targets; Source: S&P Capital IQ Pro; Data MRQ as of 10/29/2025 6) Sum of treasury product fees, wealth management fees, and investment banking fees
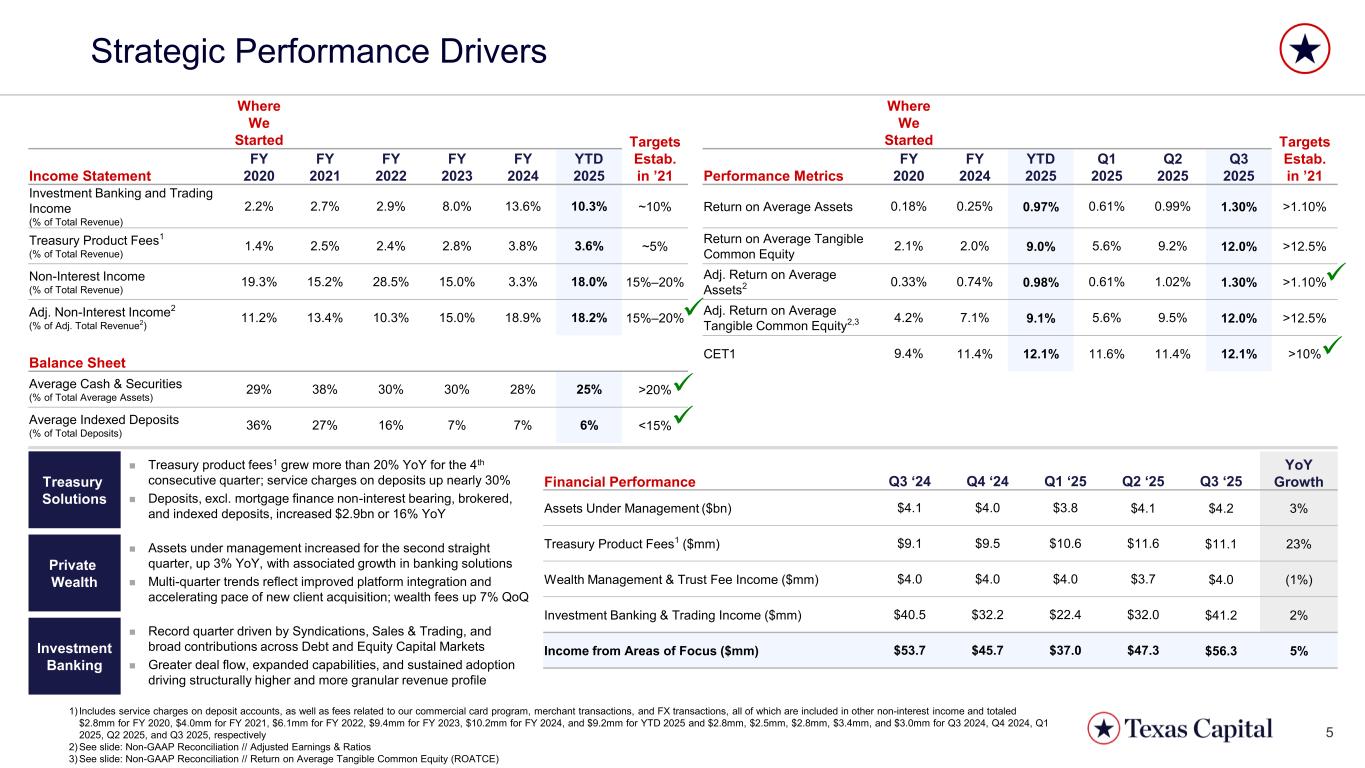
5 Where We Started Targets Estab. in ’21 Where We Started Targets Estab. in ’21Income Statement FY 2020 FY 2021 FY 2022 FY 2023 FY 2024 YTD 2025 Performance Metrics FY 2020 FY 2024 YTD 2025 Q1 2025 Q2 2025 Q3 2025 Investment Banking and Trading Income (% of Total Revenue) 2.2% 2.7% 2.9% 8.0% 13.6% 10.3% ~10% Return on Average Assets 0.18% 0.25% 0.97% 0.61% 0.99% 1.30% >1.10% Treasury Product Fees1 (% of Total Revenue) 1.4% 2.5% 2.4% 2.8% 3.8% 3.6% ~5% Return on Average Tangible Common Equity 2.1% 2.0% 9.0% 5.6% 9.2% 12.0% >12.5% Non-Interest Income (% of Total Revenue) 19.3% 15.2% 28.5% 15.0% 3.3% 18.0% 15%–20% Adj. Return on Average Assets2 0.33% 0.74% 0.98% 0.61% 1.02% 1.30% >1.10% Adj. Non-Interest Income2 (% of Adj. Total Revenue2) 11.2% 13.4% 10.3% 15.0% 18.9% 18.2% 15%–20% Adj. Return on Average Tangible Common Equity2,3 4.2% 7.1% 9.1% 5.6% 9.5% 12.0% >12.5% Balance Sheet CET1 9.4% 11.4% 12.1% 11.6% 11.4% 12.1% >10% Average Cash & Securities (% of Total Average Assets) 29% 38% 30% 30% 28% 25% >20% Average Indexed Deposits (% of Total Deposits) 36% 27% 16% 7% 7% 6% <15% Strategic Performance Drivers Treasury Solutions Private Wealth Investment Banking Financial Performance Q3 ‘24 Q4 ‘24 Q1 ‘25 Q2 ‘25 Q3 ‘25 YoY Growth Assets Under Management ($bn) $4.1 $4.0 $3.8 $4.1 $4.2 3% Treasury Product Fees1 ($mm) $9.1 $9.5 $10.6 $11.6 $11.1 23% Wealth Management & Trust Fee Income ($mm) $4.0 $4.0 $4.0 $3.7 $4.0 (1%) Investment Banking & Trading Income ($mm) $40.5 $32.2 $22.4 $32.0 $41.2 2% Income from Areas of Focus ($mm) $53.7 $45.7 $37.0 $47.3 $56.3 5% ◼ Treasury product fees1 grew more than 20% YoY for the 4th consecutive quarter; service charges on deposits up nearly 30% ◼ Deposits, excl. mortgage finance non-interest bearing, brokered, and indexed deposits, increased $2.9bn or 16% YoY ◼ Record quarter driven by Syndications, Sales & Trading, and broad contributions across Debt and Equity Capital Markets ◼ Greater deal flow, expanded capabilities, and sustained adoption driving structurally higher and more granular revenue profile ◼ Assets under management increased for the second straight quarter, up 3% YoY, with associated growth in banking solutions ◼ Multi-quarter trends reflect improved platform integration and accelerating pace of new client acquisition; wealth fees up 7% QoQ ✓ ✓ ✓ ✓ ✓ 1) Includes service charges on deposit accounts, as well as fees related to our commercial card program, merchant transactions, and FX transactions, all of which are included in other non-interest income and totaled $2.8mm for FY 2020, $4.0mm for FY 2021, $6.1mm for FY 2022, $9.4mm for FY 2023, $10.2mm for FY 2024, and $9.2mm for YTD 2025 and $2.8mm, $2.5mm, $2.8mm, $3.4mm, and $3.0mm for Q3 2024, Q4 2024, Q1 2025, Q2 2025, and Q3 2025, respectively 2) See slide: Non-GAAP Reconciliation // Adjusted Earnings & Ratios 3) See slide: Non-GAAP Reconciliation // Return on Average Tangible Common Equity (ROATCE)
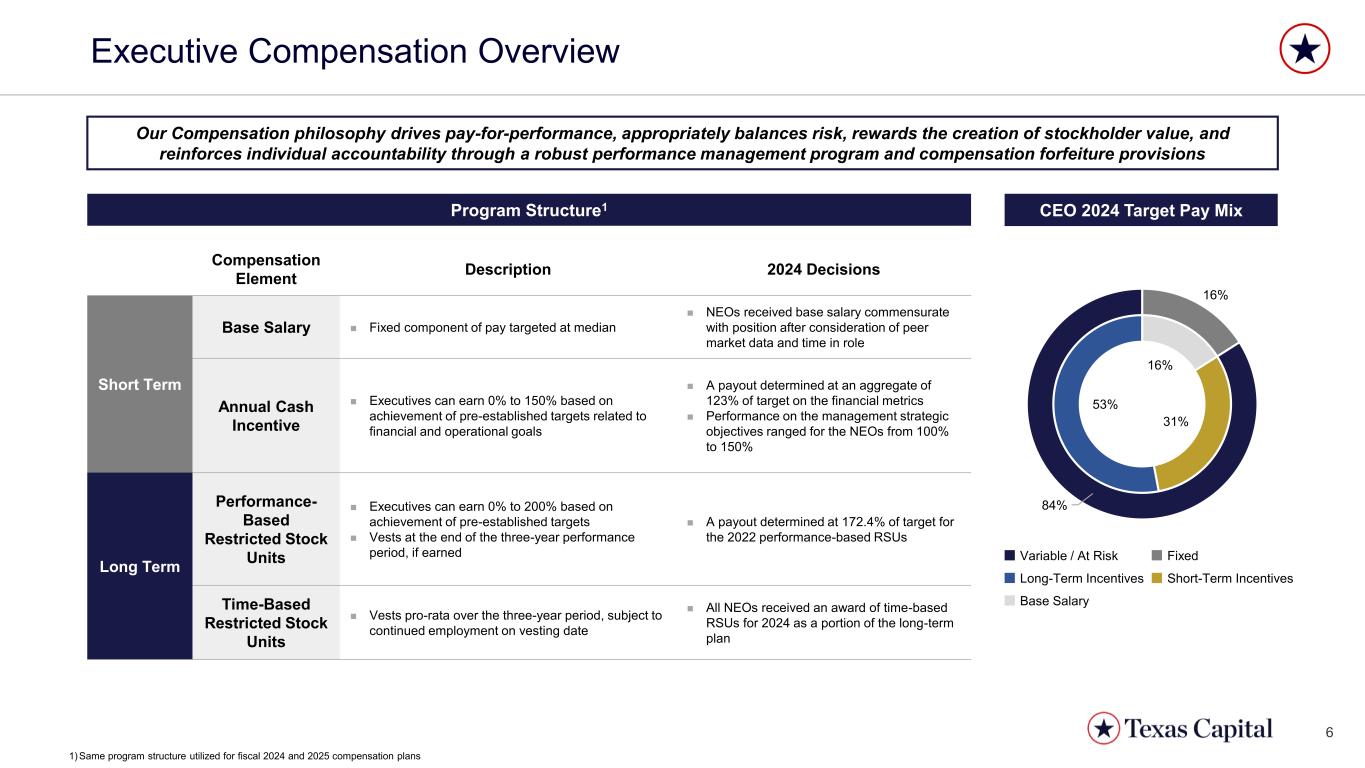
6 16% 31% 53% 16% 84% Executive Compensation Overview Our Compensation philosophy drives pay-for-performance, appropriately balances risk, rewards the creation of stockholder value, and reinforces individual accountability through a robust performance management program and compensation forfeiture provisions Program Structure1 CEO 2024 Target Pay Mix Compensation Element Description 2024 Decisions Short Term Base Salary ◼ Fixed component of pay targeted at median ◼ NEOs received base salary commensurate with position after consideration of peer market data and time in role Annual Cash Incentive ◼ Executives can earn 0% to 150% based on achievement of pre-established targets related to financial and operational goals ◼ A payout determined at an aggregate of 123% of target on the financial metrics ◼ Performance on the management strategic objectives ranged for the NEOs from 100% to 150% Long Term Performance- Based Restricted Stock Units ◼ Executives can earn 0% to 200% based on achievement of pre-established targets ◼ Vests at the end of the three-year performance period, if earned ◼ A payout determined at 172.4% of target for the 2022 performance-based RSUs Time-Based Restricted Stock Units ◼ Vests pro-rata over the three-year period, subject to continued employment on vesting date ◼ All NEOs received an award of time-based RSUs for 2024 as a portion of the long-term plan Variable / At Risk Long-Term Incentives Base Salary Fixed Short-Term Incentives 1) Same program structure utilized for fiscal 2024 and 2025 compensation plans
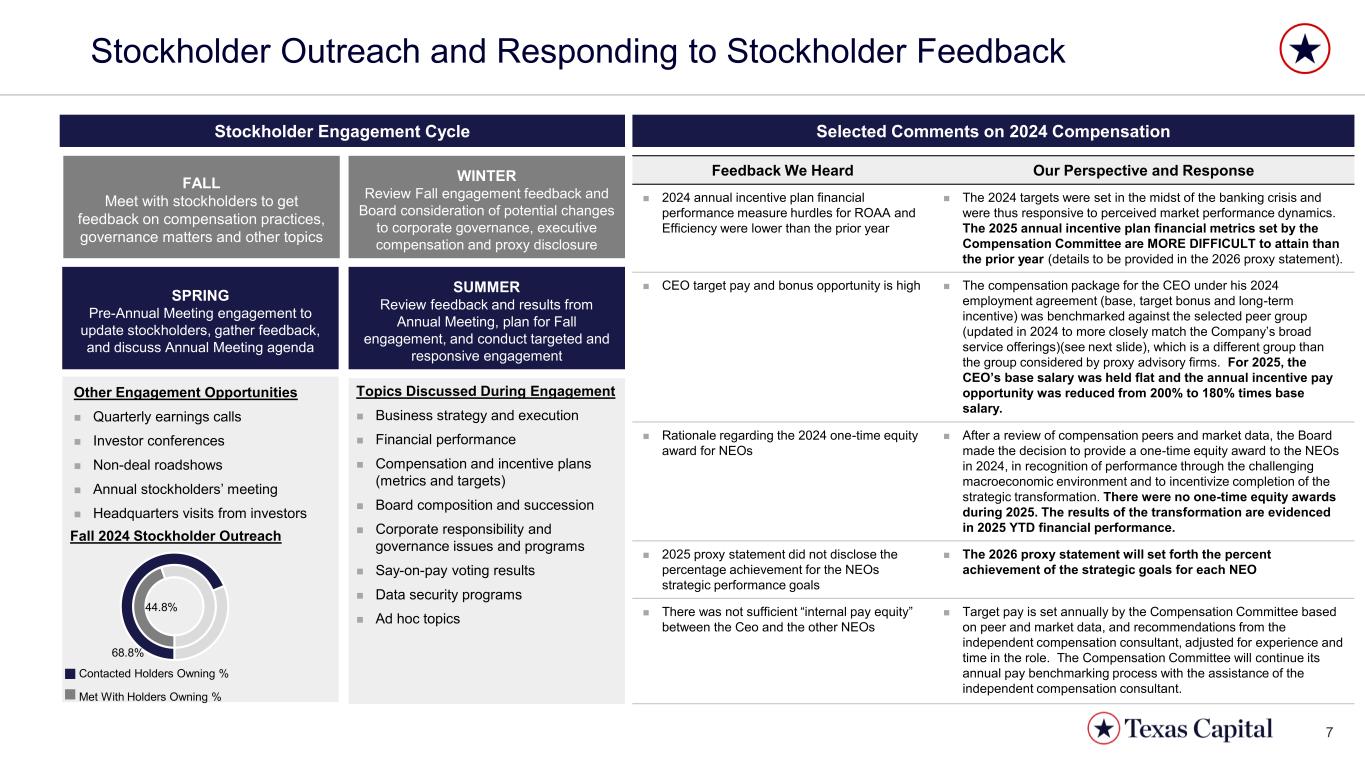
7 Contacted Holders Owning % Met With Holders Owning % Stockholder Outreach and Responding to Stockholder Feedback Stockholder Engagement Cycle FALL Meet with stockholders to get feedback on compensation practices, governance matters and other topics Selected Comments on 2024 Compensation WINTER Review Fall engagement feedback and Board consideration of potential changes to corporate governance, executive compensation and proxy disclosure SPRING Pre-Annual Meeting engagement to update stockholders, gather feedback, and discuss Annual Meeting agenda SUMMER Review feedback and results from Annual Meeting, plan for Fall engagement, and conduct targeted and responsive engagement Feedback We Heard Our Perspective and Response ◼ 2024 annual incentive plan financial performance measure hurdles for ROAA and Efficiency were lower than the prior year ◼ The 2024 targets were set in the midst of the banking crisis and were thus responsive to perceived market performance dynamics. The 2025 annual incentive plan financial metrics set by the Compensation Committee are MORE DIFFICULT to attain than the prior year (details to be provided in the 2026 proxy statement). ◼ CEO target pay and bonus opportunity is high ◼ The compensation package for the CEO under his 2024 employment agreement (base, target bonus and long-term incentive) was benchmarked against the selected peer group (updated in 2024 to more closely match the Company’s broad service offerings)(see next slide), which is a different group than the group considered by proxy advisory firms. For 2025, the CEO’s base salary was held flat and the annual incentive pay opportunity was reduced from 200% to 180% times base salary. ◼ Rationale regarding the 2024 one-time equity award for NEOs ◼ After a review of compensation peers and market data, the Board made the decision to provide a one-time equity award to the NEOs in 2024, in recognition of performance through the challenging macroeconomic environment and to incentivize completion of the strategic transformation. There were no one-time equity awards during 2025. The results of the transformation are evidenced in 2025 YTD financial performance. ◼ 2025 proxy statement did not disclose the percentage achievement for the NEOs strategic performance goals ◼ The 2026 proxy statement will set forth the percent achievement of the strategic goals for each NEO ◼ There was not sufficient “internal pay equity” between the Ceo and the other NEOs ◼ Target pay is set annually by the Compensation Committee based on peer and market data, and recommendations from the independent compensation consultant, adjusted for experience and time in the role. The Compensation Committee will continue its annual pay benchmarking process with the assistance of the independent compensation consultant. Other Engagement Opportunities ◼ Quarterly earnings calls ◼ Investor conferences ◼ Non-deal roadshows ◼ Annual stockholders’ meeting ◼ Headquarters visits from investors 44.8% 68.8% Fall 2024 Stockholder Outreach Topics Discussed During Engagement ◼ Business strategy and execution ◼ Financial performance ◼ Compensation and incentive plans (metrics and targets) ◼ Board composition and succession ◼ Corporate responsibility and governance issues and programs ◼ Say-on-pay voting results ◼ Data security programs ◼ Ad hoc topics
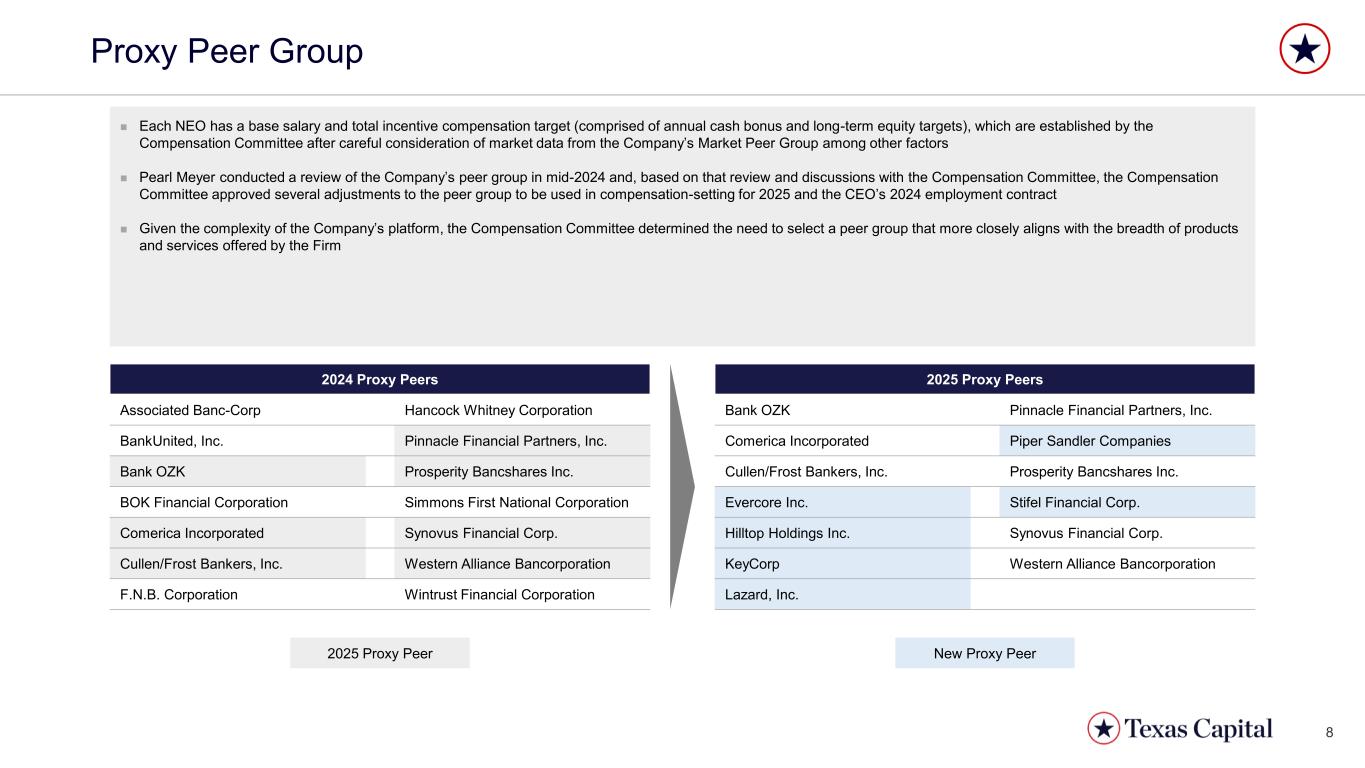
8 Proxy Peer Group ◼ Each NEO has a base salary and total incentive compensation target (comprised of annual cash bonus and long-term equity targets), which are established by the Compensation Committee after careful consideration of market data from the Company’s Market Peer Group among other factors ◼ Pearl Meyer conducted a review of the Company’s peer group in mid-2024 and, based on that review and discussions with the Compensation Committee, the Compensation Committee approved several adjustments to the peer group to be used in compensation-setting for 2025 and the CEO’s 2024 employment contract ◼ Given the complexity of the Company’s platform, the Compensation Committee determined the need to select a peer group that more closely aligns with the breadth of products and services offered by the Firm 2024 Proxy Peers Associated Banc-Corp Hancock Whitney Corporation BankUnited, Inc. Pinnacle Financial Partners, Inc. Bank OZK Prosperity Bancshares Inc. BOK Financial Corporation Simmons First National Corporation Comerica Incorporated Synovus Financial Corp. Cullen/Frost Bankers, Inc. Western Alliance Bancorporation F.N.B. Corporation Wintrust Financial Corporation 2025 Proxy Peers Bank OZK Pinnacle Financial Partners, Inc. Comerica Incorporated Piper Sandler Companies Cullen/Frost Bankers, Inc. Prosperity Bancshares Inc. Evercore Inc. Stifel Financial Corp. Hilltop Holdings Inc. Synovus Financial Corp. KeyCorp Western Alliance Bancorporation Lazard, Inc. New Proxy Peer2025 Proxy Peer
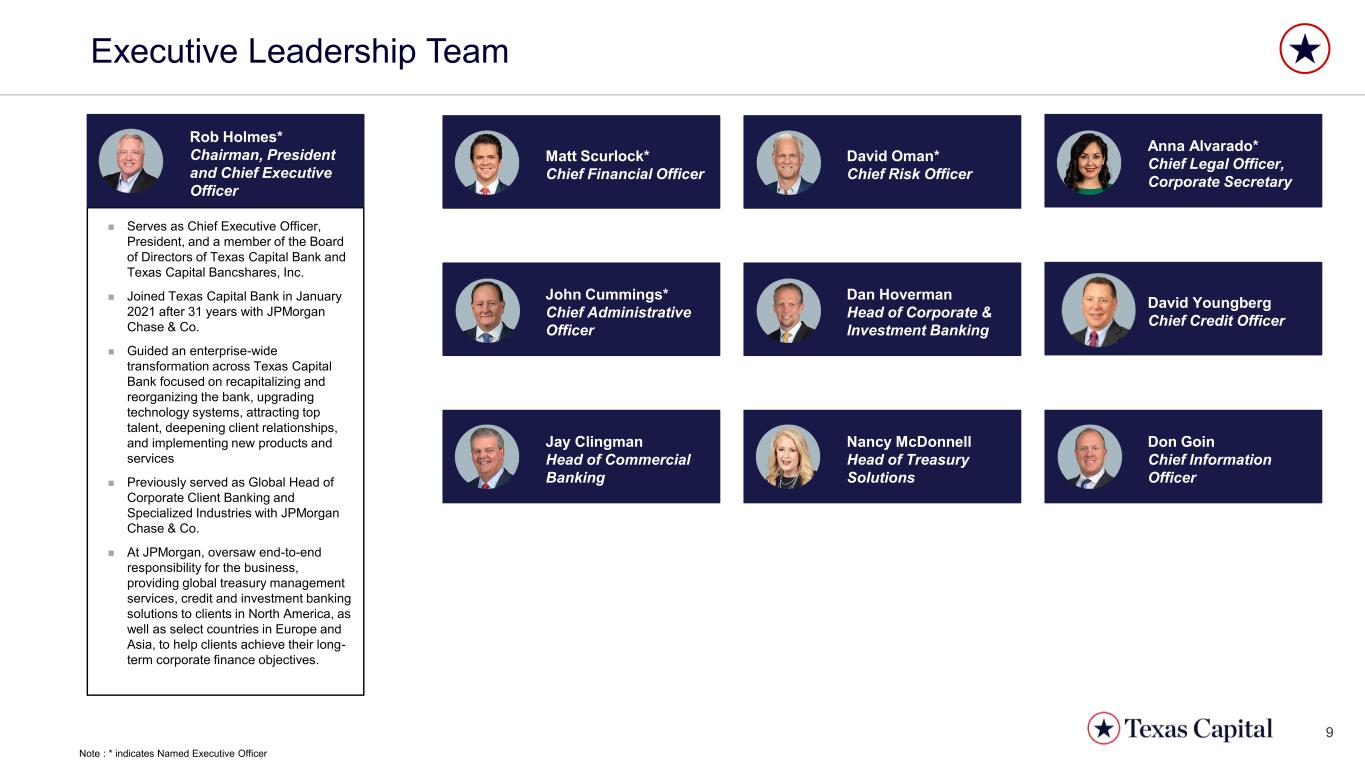
9 David Oman* Chief Risk Officer Nancy McDonnell Head of Treasury Solutions Executive Leadership Team ◼ Serves as Chief Executive Officer, President, and a member of the Board of Directors of Texas Capital Bank and Texas Capital Bancshares, Inc. ◼ Joined Texas Capital Bank in January 2021 after 31 years with JPMorgan Chase & Co. ◼ Guided an enterprise-wide transformation across Texas Capital Bank focused on recapitalizing and reorganizing the bank, upgrading technology systems, attracting top talent, deepening client relationships, and implementing new products and services ◼ Previously served as Global Head of Corporate Client Banking and Specialized Industries with JPMorgan Chase & Co. ◼ At JPMorgan, oversaw end-to-end responsibility for the business, providing global treasury management services, credit and investment banking solutions to clients in North America, as well as select countries in Europe and Asia, to help clients achieve their long- term corporate finance objectives. Rob Holmes* Chairman, President and Chief Executive Officer Don Goin Chief Information Officer Matt Scurlock* Chief Financial Officer John Cummings* Chief Administrative Officer Anna Alvarado* Chief Legal Officer, Corporate Secretary Jay Clingman Head of Commercial Banking Dan Hoverman Head of Corporate & Investment Banking David Youngberg Chief Credit Officer Note : * indicates Named Executive Officer
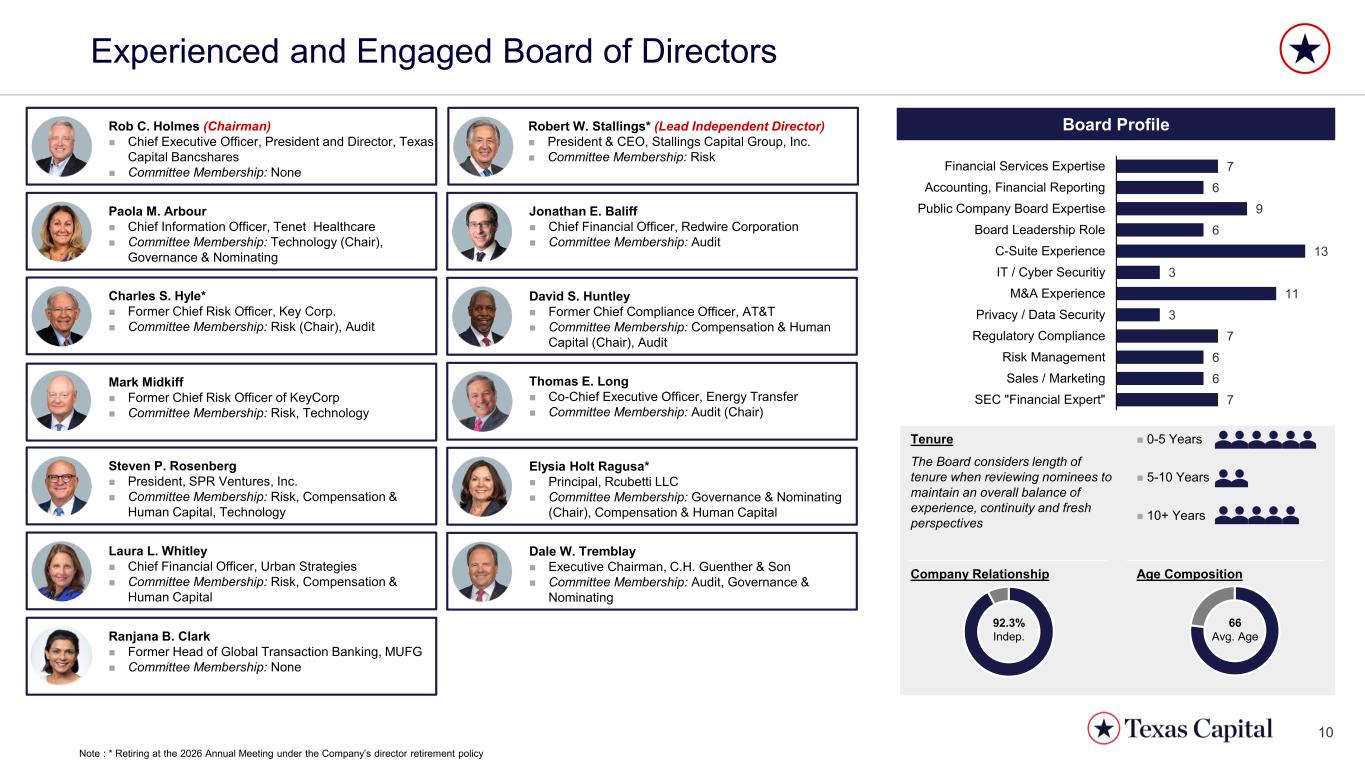
10 Robert W. Stallings* (Lead Independent Director) ◼ President & CEO, Stallings Capital Group, Inc. ◼ Committee Membership: Risk Experienced and Engaged Board of Directors Rob C. Holmes (Chairman) ◼ Chief Executive Officer, President and Director, Texas Capital Bancshares ◼ Committee Membership: None Jonathan E. Baliff ◼ Chief Financial Officer, Redwire Corporation ◼ Committee Membership: Audit Thomas E. Long ◼ Co-Chief Executive Officer, Energy Transfer ◼ Committee Membership: Audit (Chair) Charles S. Hyle* ◼ Former Chief Risk Officer, Key Corp. ◼ Committee Membership: Risk (Chair), Audit Mark Midkiff ◼ Former Chief Risk Officer of KeyCorp ◼ Committee Membership: Risk, Technology Paola M. Arbour ◼ Chief Information Officer, Tenet Healthcare ◼ Committee Membership: Technology (Chair), Governance & Nominating David S. Huntley ◼ Former Chief Compliance Officer, AT&T ◼ Committee Membership: Compensation & Human Capital (Chair), Audit Elysia Holt Ragusa* ◼ Principal, Rcubetti LLC ◼ Committee Membership: Governance & Nominating (Chair), Compensation & Human Capital Steven P. Rosenberg ◼ President, SPR Ventures, Inc. ◼ Committee Membership: Risk, Compensation & Human Capital, Technology Dale W. Tremblay ◼ Executive Chairman, C.H. Guenther & Son ◼ Committee Membership: Audit, Governance & Nominating Laura L. Whitley ◼ Chief Financial Officer, Urban Strategies ◼ Committee Membership: Risk, Compensation & Human Capital 7 6 9 6 13 3 11 3 7 6 6 7 Financial Services Expertise Accounting, Financial Reporting Public Company Board Expertise Board Leadership Role C-Suite Experience IT / Cyber Securitiy M&A Experience Privacy / Data Security Regulatory Compliance Risk Management Sales / Marketing SEC "Financial Expert" Board Profile Tenure The Board considers length of tenure when reviewing nominees to maintain an overall balance of experience, continuity and fresh perspectives ◼ 0-5 Years ◼ 5-10 Years ◼ 10+ Years Ranjana B. Clark ◼ Former Head of Global Transaction Banking, MUFG ◼ Committee Membership: None Company Relationship Age Composition 66 Avg. Age 92.3% Indep. Note : * Retiring at the 2026 Annual Meeting under the Company’s director retirement policy
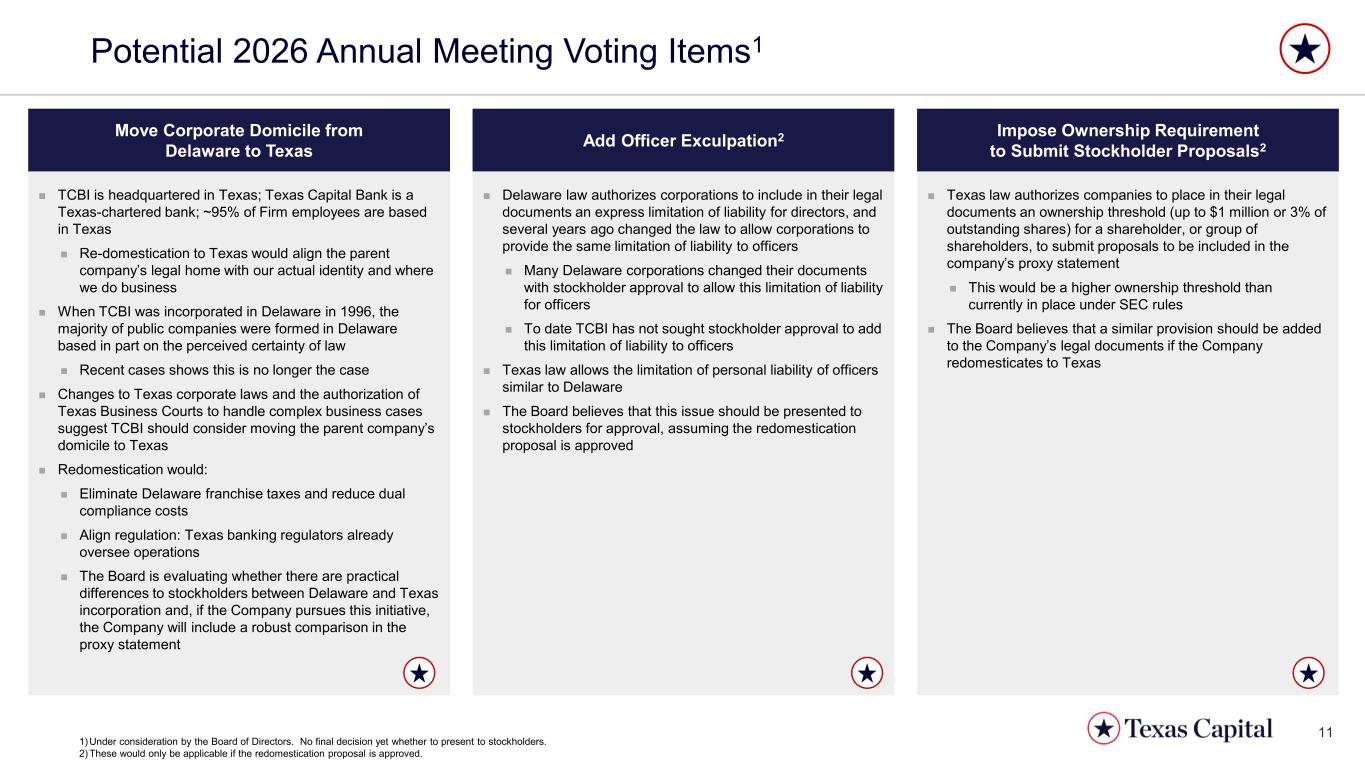
11 Potential 2026 Annual Meeting Voting Items1 ◼ TCBI is headquartered in Texas; Texas Capital Bank is a Texas-chartered bank; ~95% of Firm employees are based in Texas ◼ Re-domestication to Texas would align the parent company’s legal home with our actual identity and where we do business ◼ When TCBI was incorporated in Delaware in 1996, the majority of public companies were formed in Delaware based in part on the perceived certainty of law ◼ Recent cases shows this is no longer the case ◼ Changes to Texas corporate laws and the authorization of Texas Business Courts to handle complex business cases suggest TCBI should consider moving the parent company’s domicile to Texas ◼ Redomestication would: ◼ Eliminate Delaware franchise taxes and reduce dual compliance costs ◼ Align regulation: Texas banking regulators already oversee operations ◼ The Board is evaluating whether there are practical differences to stockholders between Delaware and Texas incorporation and, if the Company pursues this initiative, the Company will include a robust comparison in the proxy statement Move Corporate Domicile from Delaware to Texas ◼ Delaware law authorizes corporations to include in their legal documents an express limitation of liability for directors, and several years ago changed the law to allow corporations to provide the same limitation of liability to officers ◼ Many Delaware corporations changed their documents with stockholder approval to allow this limitation of liability for officers ◼ To date TCBI has not sought stockholder approval to add this limitation of liability to officers ◼ Texas law allows the limitation of personal liability of officers similar to Delaware ◼ The Board believes that this issue should be presented to stockholders for approval, assuming the redomestication proposal is approved Add Officer Exculpation2 ◼ Texas law authorizes companies to place in their legal documents an ownership threshold (up to $1 million or 3% of outstanding shares) for a shareholder, or group of shareholders, to submit proposals to be included in the company’s proxy statement ◼ This would be a higher ownership threshold than currently in place under SEC rules ◼ The Board believes that a similar provision should be added to the Company’s legal documents if the Company redomesticates to Texas Impose Ownership Requirement to Submit Stockholder Proposals2 1) Under consideration by the Board of Directors. No final decision yet whether to present to stockholders. 2) These would only be applicable if the redomestication proposal is approved.
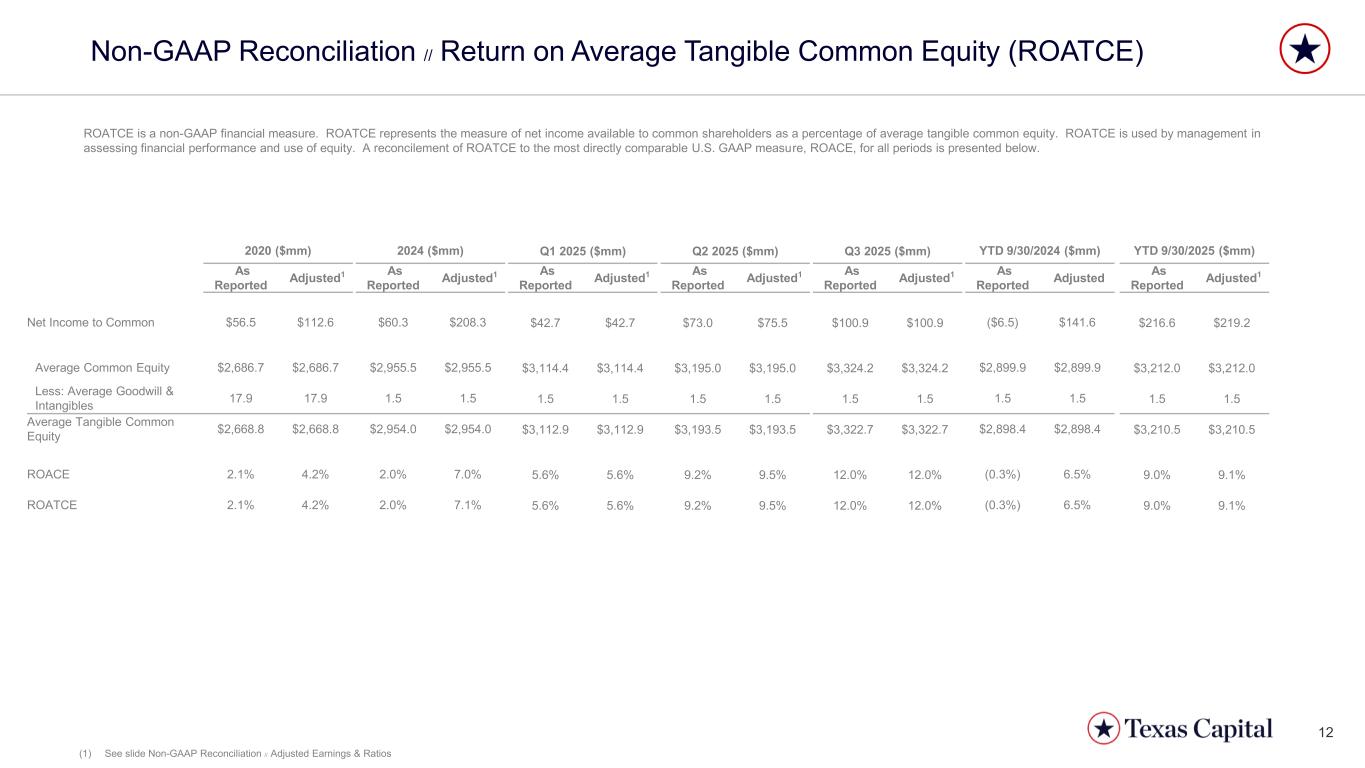
12 Non-GAAP Reconciliation // Return on Average Tangible Common Equity (ROATCE) ROATCE is a non-GAAP financial measure. ROATCE represents the measure of net income available to common shareholders as a percentage of average tangible common equity. ROATCE is used by management in assessing financial performance and use of equity. A reconcilement of ROATCE to the most directly comparable U.S. GAAP measure, ROACE, for all periods is presented below. 2020 ($mm) 2024 ($mm) Q1 2025 ($mm) Q2 2025 ($mm) Q3 2025 ($mm) YTD 9/30/2024 ($mm) YTD 9/30/2025 ($mm) As Reported Adjusted1 As Reported Adjusted1 As Reported Adjusted1 As Reported Adjusted1 As Reported Adjusted1 As Reported Adjusted As Reported Adjusted1 Net Income to Common $56.5 $112.6 $60.3 $208.3 $42.7 $42.7 $73.0 $75.5 $100.9 $100.9 ($6.5) $141.6 $216.6 $219.2 Average Common Equity $2,686.7 $2,686.7 $2,955.5 $2,955.5 $3,114.4 $3,114.4 $3,195.0 $3,195.0 $3,324.2 $3,324.2 $2,899.9 $2,899.9 $3,212.0 $3,212.0 Less: Average Goodwill & Intangibles 17.9 17.9 1.5 1.5 1.5 1.5 1.5 1.5 1.5 1.5 1.5 1.5 1.5 1.5 Average Tangible Common Equity $2,668.8 $2,668.8 $2,954.0 $2,954.0 $3,112.9 $3,112.9 $3,193.5 $3,193.5 $3,322.7 $3,322.7 $2,898.4 $2,898.4 $3,210.5 $3,210.5 ROACE 2.1% 4.2% 2.0% 7.0% 5.6% 5.6% 9.2% 9.5% 12.0% 12.0% (0.3%) 6.5% 9.0% 9.1% ROATCE 2.1% 4.2% 2.0% 7.1% 5.6% 5.6% 9.2% 9.5% 12.0% 12.0% (0.3%) 6.5% 9.0% 9.1% (1) See slide Non-GAAP Reconciliation // Adjusted Earnings & Ratios
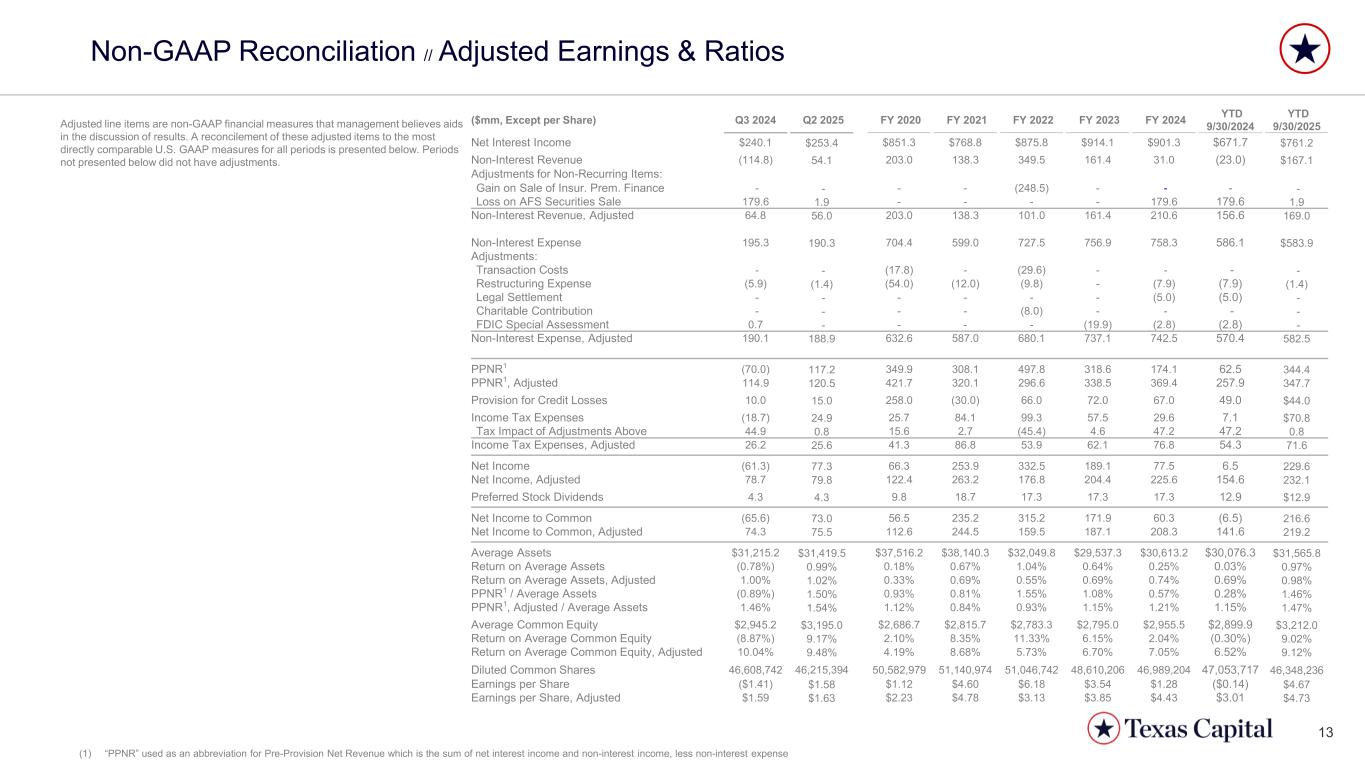
13 Non-GAAP Reconciliation // Adjusted Earnings & Ratios Adjusted line items are non-GAAP financial measures that management believes aids in the discussion of results. A reconcilement of these adjusted items to the most directly comparable U.S. GAAP measures for all periods is presented below. Periods not presented below did not have adjustments. ($mm, Except per Share) Q3 2024 Q2 2025 FY 2020 FY 2021 FY 2022 FY 2023 FY 2024 YTD 9/30/2024 YTD 9/30/2025 Net Interest Income $240.1 $253.4 $851.3 $768.8 $875.8 $914.1 $901.3 $671.7 $761.2 Non-Interest Revenue (114.8) 54.1 203.0 138.3 349.5 161.4 31.0 (23.0) $167.1 Adjustments for Non-Recurring Items: Gain on Sale of Insur. Prem. Finance - - - - (248.5) - - - - Loss on AFS Securities Sale 179.6 1.9 - - - - 179.6 179.6 1.9 Non-Interest Revenue, Adjusted 64.8 56.0 203.0 138.3 101.0 161.4 210.6 156.6 169.0 Non-Interest Expense 195.3 190.3 704.4 599.0 727.5 756.9 758.3 586.1 $583.9 Adjustments: Transaction Costs - - (17.8) - (29.6) - - - - Restructuring Expense (5.9) (1.4) (54.0) (12.0) (9.8) - (7.9) (7.9) (1.4) Legal Settlement - - - - - - (5.0) (5.0) - Charitable Contribution - - - - (8.0) - - - - FDIC Special Assessment 0.7 - - - - (19.9) (2.8) (2.8) - Non-Interest Expense, Adjusted 190.1 188.9 632.6 587.0 680.1 737.1 742.5 570.4 582.5 PPNR1 (70.0) 117.2 349.9 308.1 497.8 318.6 174.1 62.5 344.4 PPNR1, Adjusted 114.9 120.5 421.7 320.1 296.6 338.5 369.4 257.9 347.7 Provision for Credit Losses 10.0 15.0 258.0 (30.0) 66.0 72.0 67.0 49.0 $44.0 Income Tax Expenses (18.7) 24.9 25.7 84.1 99.3 57.5 29.6 7.1 $70.8 Tax Impact of Adjustments Above 44.9 0.8 15.6 2.7 (45.4) 4.6 47.2 47.2 0.8 Income Tax Expenses, Adjusted 26.2 25.6 41.3 86.8 53.9 62.1 76.8 54.3 71.6 Net Income (61.3) 77.3 66.3 253.9 332.5 189.1 77.5 6.5 229.6 Net Income, Adjusted 78.7 79.8 122.4 263.2 176.8 204.4 225.6 154.6 232.1 Preferred Stock Dividends 4.3 4.3 9.8 18.7 17.3 17.3 17.3 12.9 $12.9 Net Income to Common (65.6) 73.0 56.5 235.2 315.2 171.9 60.3 (6.5) 216.6 Net Income to Common, Adjusted 74.3 75.5 112.6 244.5 159.5 187.1 208.3 141.6 219.2 Average Assets $31,215.2 $31,419.5 $37,516.2 $38,140.3 $32,049.8 $29,537.3 $30,613.2 $30,076.3 $31,565.8 Return on Average Assets (0.78%) 0.99% 0.18% 0.67% 1.04% 0.64% 0.25% 0.03% 0.97% Return on Average Assets, Adjusted 1.00% 1.02% 0.33% 0.69% 0.55% 0.69% 0.74% 0.69% 0.98% PPNR1 / Average Assets (0.89%) 1.50% 0.93% 0.81% 1.55% 1.08% 0.57% 0.28% 1.46% PPNR1, Adjusted / Average Assets 1.46% 1.54% 1.12% 0.84% 0.93% 1.15% 1.21% 1.15% 1.47% Average Common Equity $2,945.2 $3,195.0 $2,686.7 $2,815.7 $2,783.3 $2,795.0 $2,955.5 $2,899.9 $3,212.0 Return on Average Common Equity (8.87%) 9.17% 2.10% 8.35% 11.33% 6.15% 2.04% (0.30%) 9.02% Return on Average Common Equity, Adjusted 10.04% 9.48% 4.19% 8.68% 5.73% 6.70% 7.05% 6.52% 9.12% Diluted Common Shares 46,608,742 46,215,394 50,582,979 51,140,974 51,046,742 48,610,206 46,989,204 47,053,717 46,348,236 Earnings per Share ($1.41) $1.58 $1.12 $4.60 $6.18 $3.54 $1.28 ($0.14) $4.67 Earnings per Share, Adjusted $1.59 $1.63 $2.23 $4.78 $3.13 $3.85 $4.43 $3.01 $4.73 (1) “PPNR” used as an abbreviation for Pre-Provision Net Revenue which is the sum of net interest income and non-interest income, less non-interest expense