
Investor Presentation March 2026
2 Forward Looking Statements This presentation contains forward - looking statements within the meaning of the Private Securities Litigation Reform Act of 1995 , Section 27A of the Securities Act and Section 21E of the Exchange Act. Forward - looking statements include any statements about the Company's business, financial condition, operating results, plans, objectives, ex pec tations and intentions, expansion plans, estimates of our total addressable market, our ability to successfully complete and realize the benefits of anticipated acquisitions, integration of acquired companies and any project ion s of earnings, revenue, EBITDA, Adjusted EBITDA, adjusted EPS – diluted, free cas h flow or other financial items, such as the Company's projected capitation and future liquidity, as well as statements regarding the C omp any’s expectations regarding the timing of filing its Form 10 - K for the year ended December 31, 2025 (“2025 Form 10 - K”), the expected material weakness in internal control over financial reporting and the Company’s ability t o remediate any such material weakness in a timely manner, the consistency of the financial statements in the 2025 Form 10 - K with the financial information in the earnings release and this presentation and the completion of matters necessary to permit filing by the extension deadline, and may be identified by the use of forward - looking terms such as “anticipate,” “could,” “can,” “may,” “might,” “potential,” “predict,” “should,” “estimate,” “expect,” “project,” “believe,” “plan,” “envision,” “intend,” “continue,” “target,” “seek,” “will,” “would,” and the negative of such terms, other variations on such terms or other similar or comparable words, phrases or terminology. For ward - looking statements reflect current views with respect to future events and financial performance and therefore cannot be guaranteed. Such statements are based on the current expectations and certain assumptions of the Company’s management, and some or all of such expectations and assumptions may not materialize or may vary significantly from actual results. Actual results may also vary materially from forward - looking stat ements due to risks, uncertainties and other factors, known and unknown, including the risk factors described from time to time in the Company’s reports to the U.S. Securities and Exchange Commission (the “SEC”), including wi tho ut limitation the risk factors discussed in the Company’s last Annual Report on Form 10 - K and subsequent quarterly reports on Form 10 - Q filed with the SEC. Because the factors referred to above could cause actual results or outcomes to differ materially from those expressed or imp lie d in any forward - looking statements, you should not place undue reliance on any such forward - looking statements. Any forward - looking statements speak only as of the date of this presentation and, unless legally required, the Company does not undertake any obligation to update any forward - looking statement, as a result of new information, future events or otherwise. This presentation may contain statistics and other data that in some cases has been obtained from or compiled from informatio n m ade available by third - party service providers. The Company makes no representation or warranty, express or implied, with respect to the accuracy, reasonableness or completeness of such information. Use of Non - GAAP Financial Measures This presentation contains the non - GAAP financial measures EBITDA, Adjusted EBITDA, adjusted net income attributable to Astrana , and adjusted EPS – diluted of which the most directly comparable financial measure presented in accordance with U.S. generally accepted accounting principles (“GAAP”) is net income (loss). This presentation a lso contains the non - GAAP financial measure free cash flow, of which the most directly comparable financial measure presented in accordance with U.S. generally accepted accounting principles (“GAAP”) is net cash pro vided by operating activities. These measures are not in accordance with, or alternatives to, GAAP, and may be calculated differently from similar non - GAAP financial measures used by other companies. The Company uses Adjus ted EBITDA, adjusted EPS – diluted, and free cash flow as supplemental performance measures of our operations, for financial and operational decision - making, and as supplemental means of evaluating period - to - per iod comparisons on a consistent basis. Adjusted EBITDA is calculated as earnings before interest expense, interest income, income taxes, depreciation, and amortization, excluding income or loss from equity method inv estments, non - recurring and non - cash transactions, stock - based compensation, and, for periods on or prior to December 31, 2023, APC excluded assets costs. Beginning in the third quarter ended September 30, 2022 , t he Company has revised the calculation for Adjusted EBITDA to exclude provider bonus payments and losses from recently acquired IPAs, which it believes to be more reflective of its business. The Company defines Ad justed EBITDA margin as Adjusted EBITDA over total revenue. Adjusted net income attributable to Astrana is calculated as net income (loss), excluding income or loss from equity method investments, non - recurring and non - cash transac tions, stock - based compensation, amortization of intangibles, certain tax adjustments, and amounts related to non - controlling interest. The Company defines adjusted EPS - diluted as adjusted net inc ome attributable to Astrana over weighted average shares of common stock outstanding - diluted. The Company defines free cash flow as net cash provided by operating activities and cash used in purchases of proper ty and equipment. The Company believes the presentation of these non - GAAP financial measures provides investors with relevant and useful informati on, as it allows investors to evaluate the operating performance of the business activities without having to account for differences recognized because of non - core or non - recurring financial information. When GAAP finan cial measures are viewed in conjunction with non - GAAP financial measures, investors are provided with a more meaningful understanding of the Company’s ongoing operating performance. In addition, these non - GAAP financ ial measures are among those indicators the Company uses as a basis for evaluating operational performance, allocating resources, and planning and forecasting future periods. Non - GAAP financial measures are not intended to be considered in isolation, or as a substitute for, GAAP financial measures. Other companies may calculate EBITDA, Adjusted EBITDA, adjusted net income attributable to Astrana , adjusted EPS – diluted, and free cash flow differently, limiting the usefulness of these measures for comparative purposes. To the extent this Presentation contains historical or future non - GAAP financial measures, the Company has provided corresponding G AAP financial measures for comparative purposes. The reconciliation between certain GAAP and non - GAAP measures is provided in the Appendix. The Company has not provided a quantitative reconciliation of applicable non - GAAP measures, such as the projected adjusted EBITD A to the most comparable GAAP measure, such as net income, on a forward - looking basis within this presentation because the Company is unable, without unreasonable efforts, to provide reconciling information with re spect to certain line items that cannot be calculated. These items, which could materially affect the computation of forward - looking GAAP net income, are inherently uncertain and depend on various factors, some of which are ou tside of the Company’s control.AS1
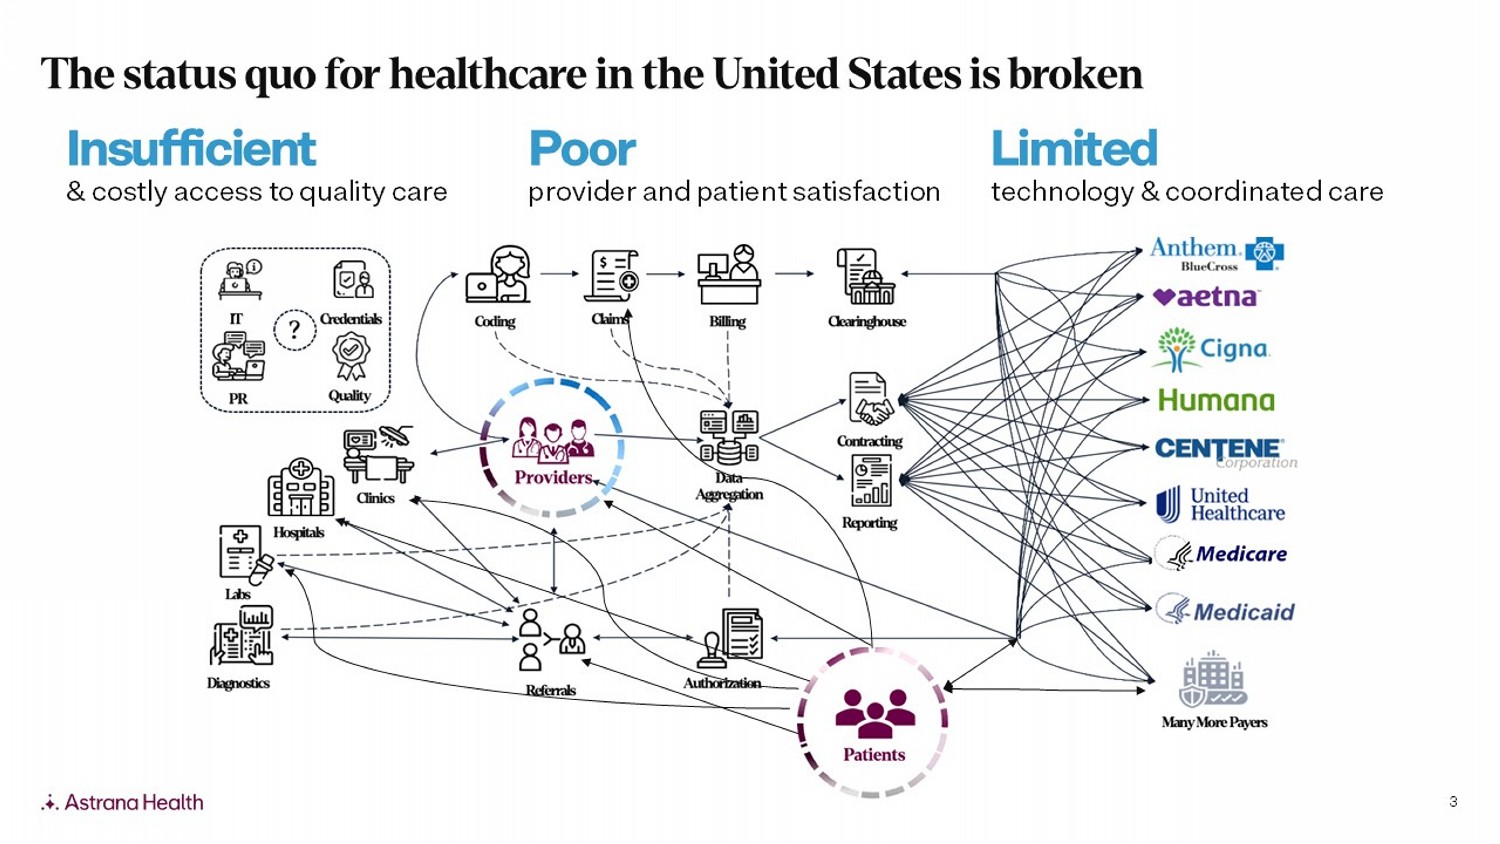
3 Poor provider and patient satisfaction Insufficient & costly access to quality care Limited technology & coordinated care The status quo for healthcare in the United States is broken
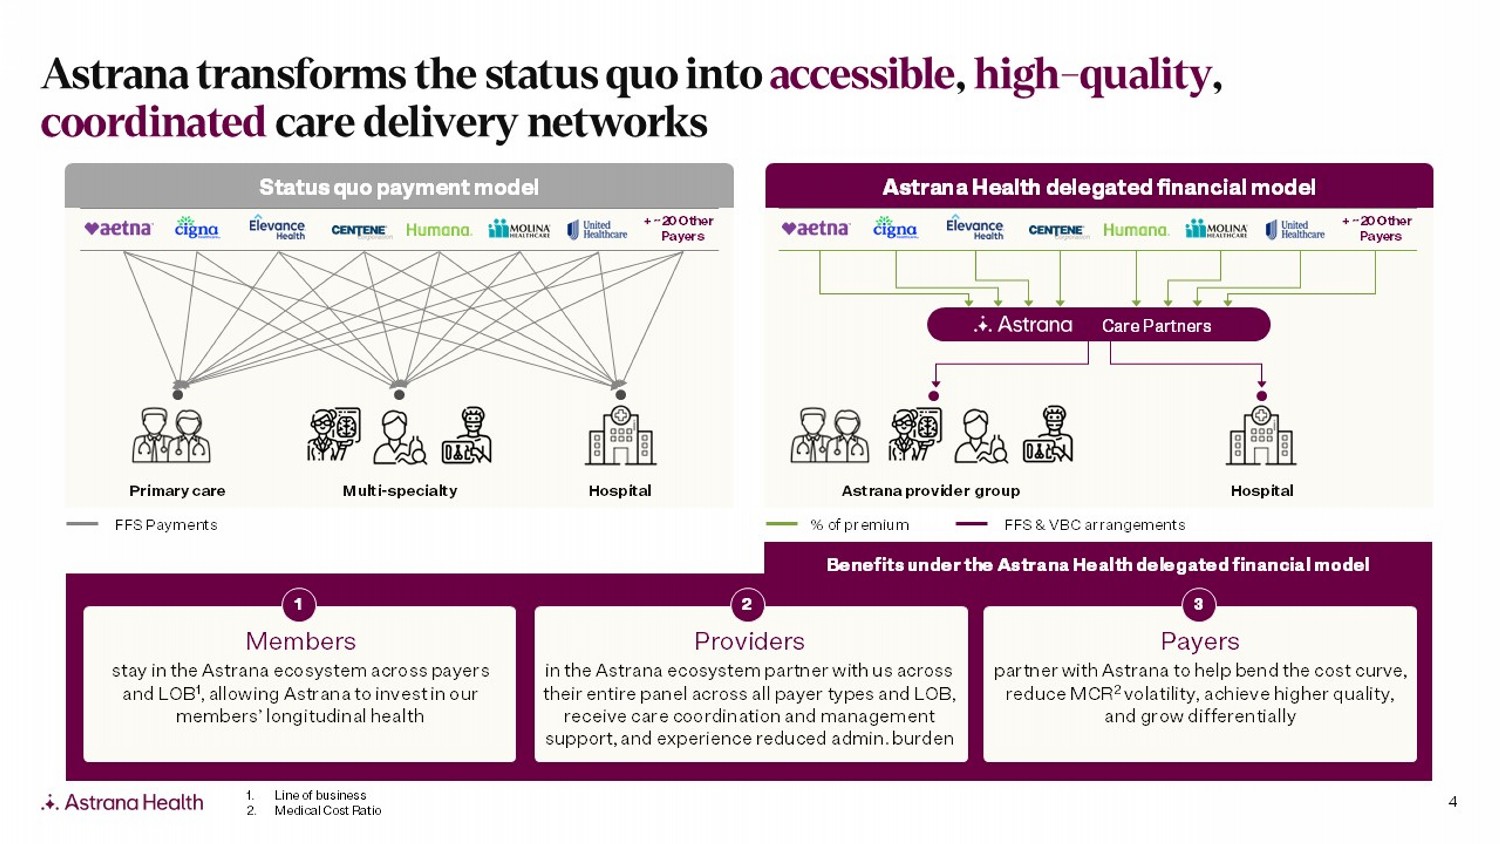
4 Astrana transforms the status quo into accessible , high - quality , coordinated care delivery networks Astrana Health delegated financial model Status quo payment model Primary care Multi - specialty Hospital Members stay in the Astrana ecosystem across payers and LOB 1 , allowing Astrana to invest in our members’ longitudinal health Providers in the Astrana ecosystem partner with us across their entire panel across all payer types and LOB, receive care coordination and management support, and experience reduced admin. burden Payers partner with Astrana to help bend the cost curve, reduce MCR 2 volatility, achieve higher quality, and grow differentially Astrana provider group Hospital Care Partners + ~20 Other Payer s FFS Payments % of premium FFS & VBC arrangements + ~20 Other Payer s 1 3 2 Benefits under the Astrana Health delegated financial model 1. Line of business 2. Medical Cost Ratio
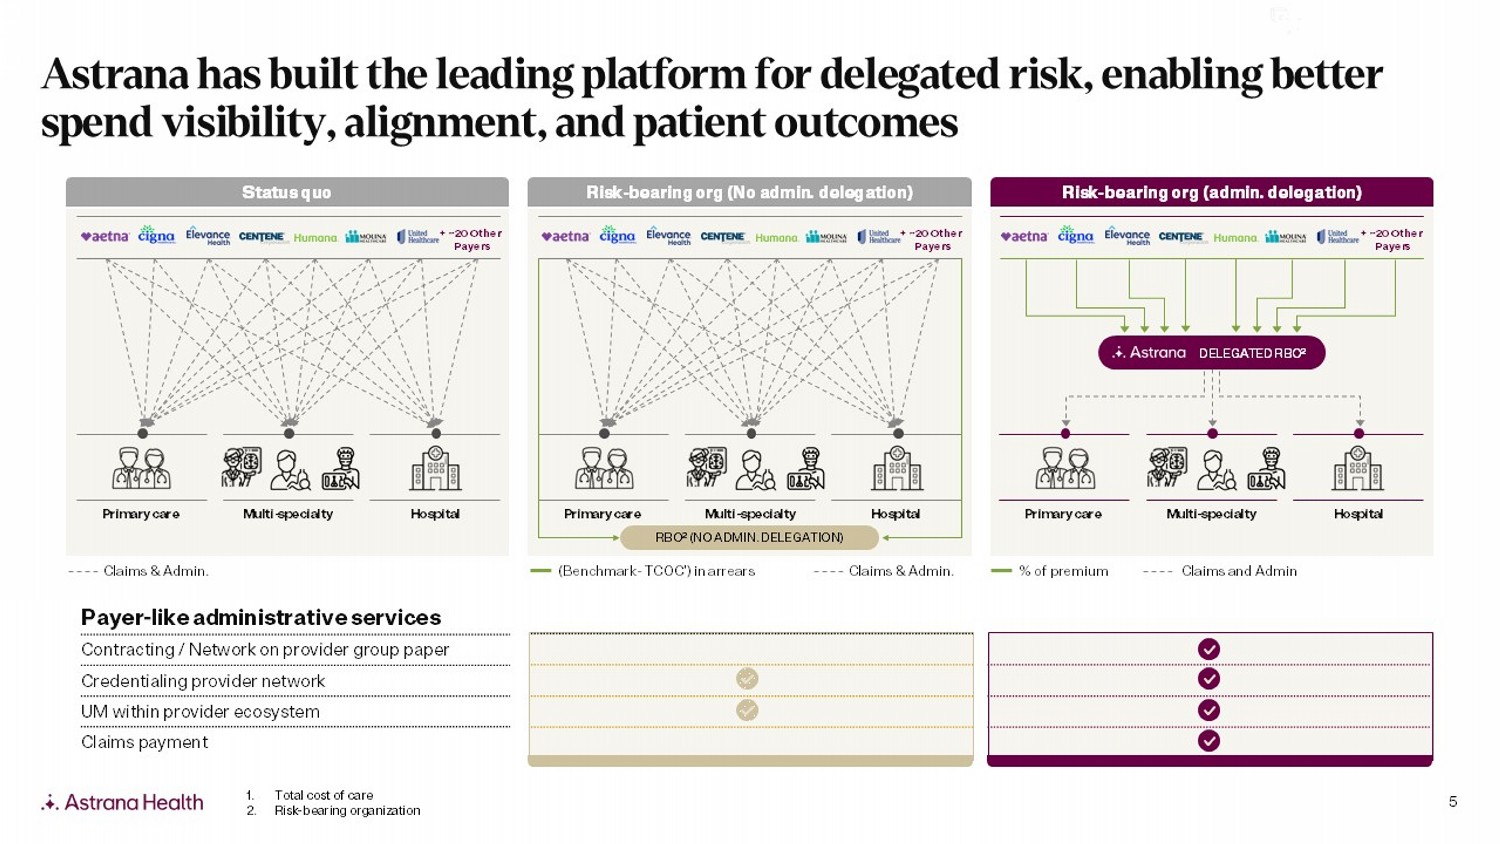
5 Astrana has built the leading platform for delegated risk, enabling better spend visibility, alignment, and patient outcomes Status quo Primary care Multi - specialty Hospital Claims & Admin. Risk - bearing org (admin. delegation) % of premium Claims and Admin Risk - bearing org (No admin. delegation) Primary care Multi - specialty Hospital Primary care Multi - specialty Hospital + ~20 Other Payer s + ~20 Other Payer s + ~20 Other Payer s (Benchmark - TCOC') in arrears Claims & Admin. RBO 2 (NO ADMIN. DELEGATION) DELEGATED RBO 2 Payer - like administrative services Contracting / Network on provider group paper Credentialing provider network UM within provider ecosystem Claims payment 1. Total cost of care 2. Risk - bearing organization
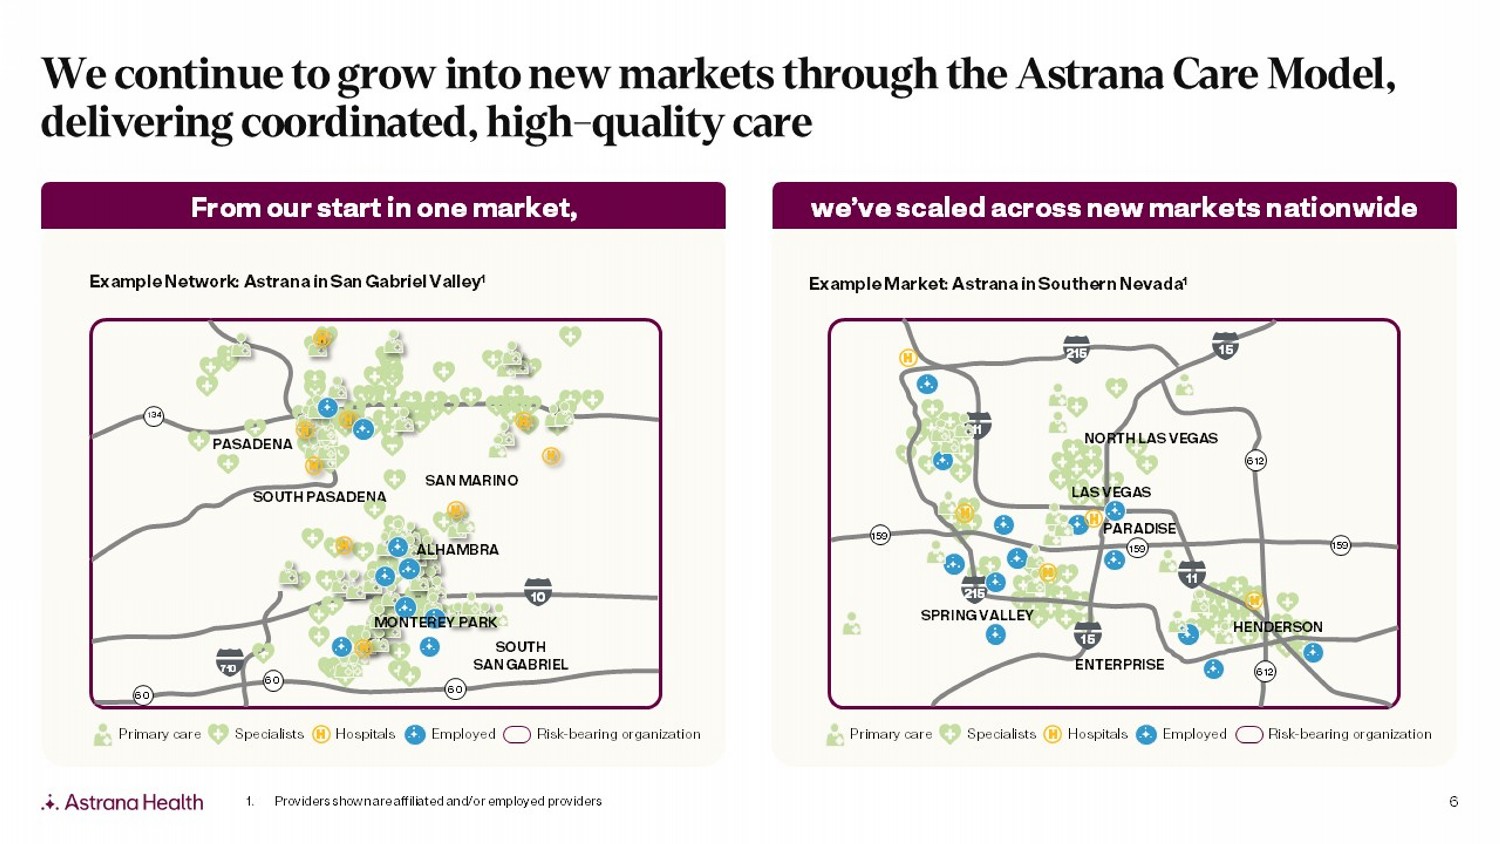
6 we’ve scaled across new markets nationwide From our start in one market, We continue to grow into new markets through the Astrana Care Model, delivering coordinated, high - quality care 159 159 159 15 1 1 215 1 1 15 215 612 612 ENTERPRISE HENDERSON LAS VEGAS NORTH LAS VEGAS PARADISE SPRING VALLEY Example Market: Astrana in Southern Nevada 1 1. Providers shown are affiliated and/or employed providers Hospitals Specialists Employed Risk - bearing organization Primary care Example Network: Astrana in San Gabriel Valley 1 Hospitals Specialists Employed Risk - bearing organization Primary care SAN MARINO SOUTH SAN GABRIEL 60 60 60 134 10 710 PASADENA SOUTH PASADENA ALHAMBRA MONTEREY PARK
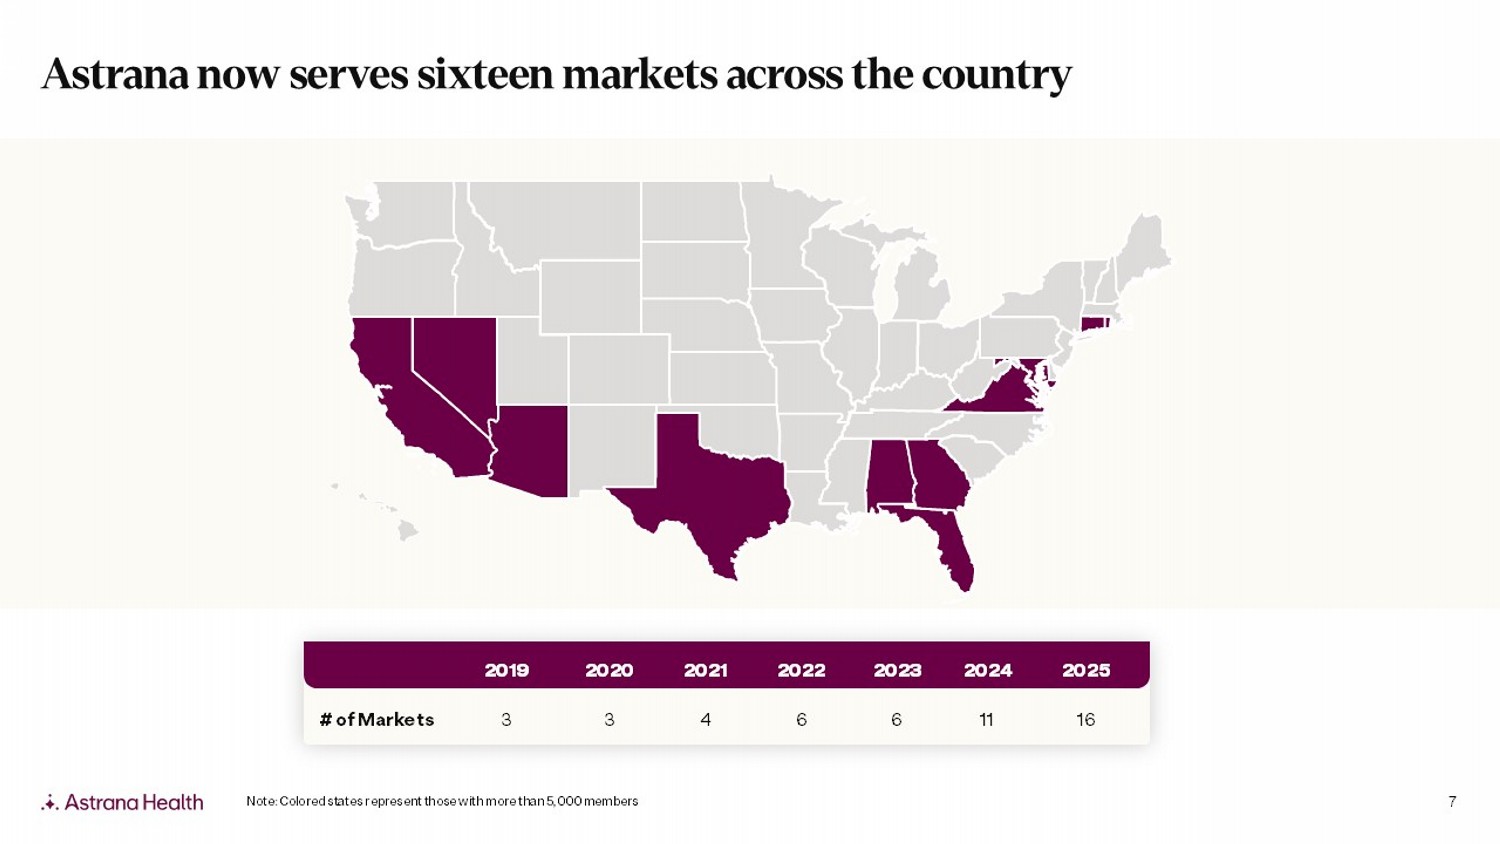
7 2025 2024 2023 2022 2021 2020 2019 16 11 6 6 4 3 3 # of Markets Astrana now serves sixteen markets across the country Note: Colored states represent those with more than 5,000 members
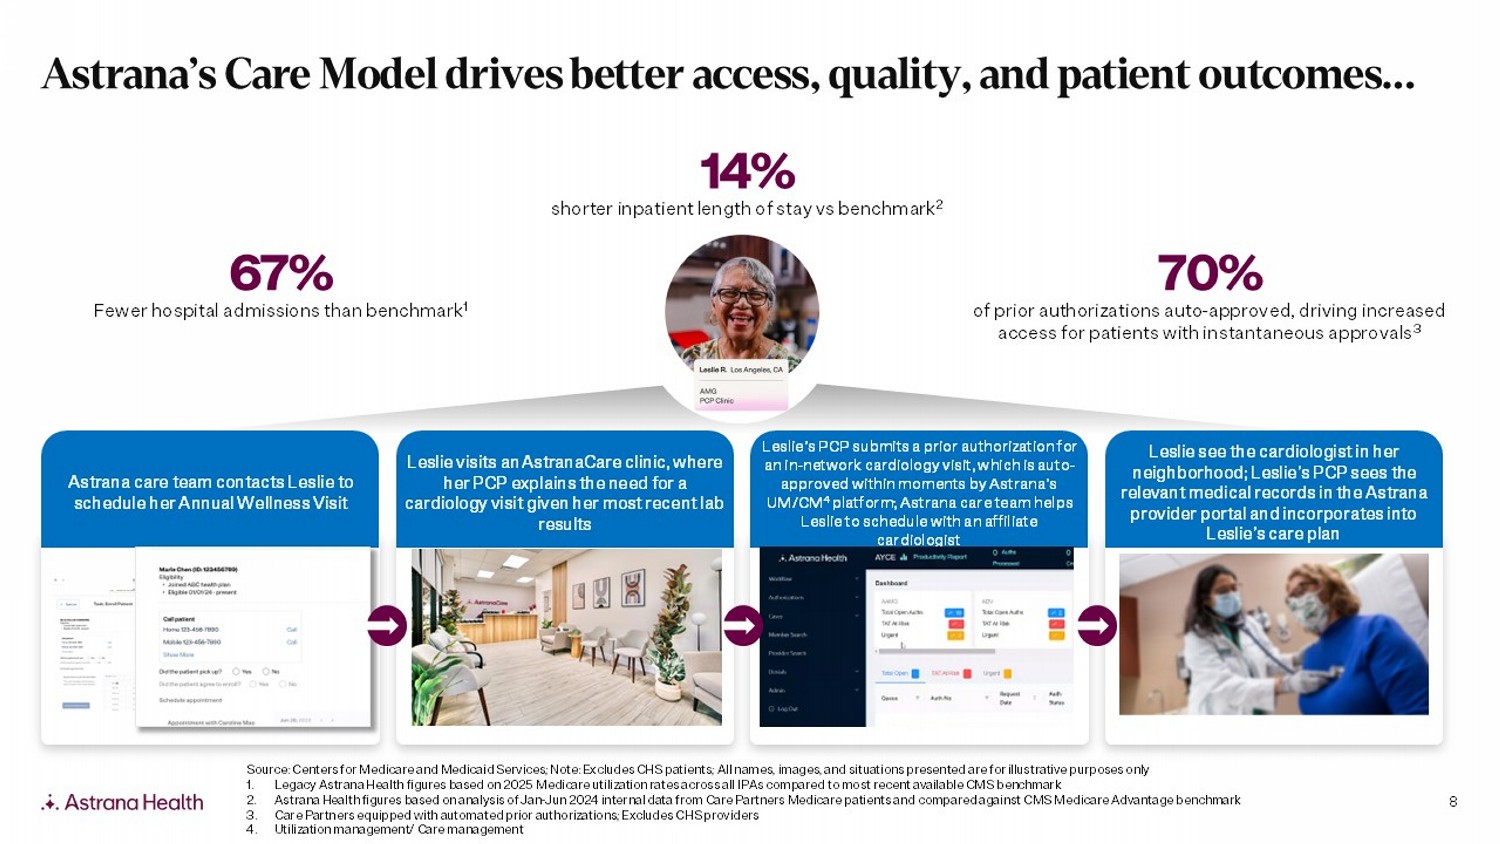
8 Astrana’s Care Model drives better access, quality, and patient outcomes… Astrana care team contacts Leslie to schedule her Annual Wellness Visit Leslie visits an AstranaCare clinic, where her PCP explains the need for a cardiology visit given her most recent lab results Leslie’s PCP submits a prior authorization for an in - network cardiology visit, which is auto - approved within moments by Astrana’s UM/CM 4 platform; Astrana care team helps Leslie to schedule with an affiliate cardiologist Leslie see the cardiologist in her neighborhood; Leslie’s PCP sees the relevant medical records in the Astrana provider portal and incorporates into Leslie’s care plan Source: Centers for Medicare and Medicaid Services; Note: Excludes CHS patients; All names, images, and situations presented are for illustrative purposes only 1. Legacy Astrana Health figures based on 2025 Medicare utilization rates across all IPAs compared to most recent available CMS ben chmark 2. Astrana Health figures based on analysis of Jan - Jun 2024 internal data from Care Partners Medicare patients and compared against CMS Medicare Advantage benchmark 3. Care Partners equipped with automated prior authorizations; Excludes CHS providers 4. Utilization management/ Care management 14% shorter inpatient length of stay vs benchmark 2 67% Fewer hospital admissions than benchmark 1 70% of prior authorizations auto - approved, driving increased access for patients with instantaneous approvals 3
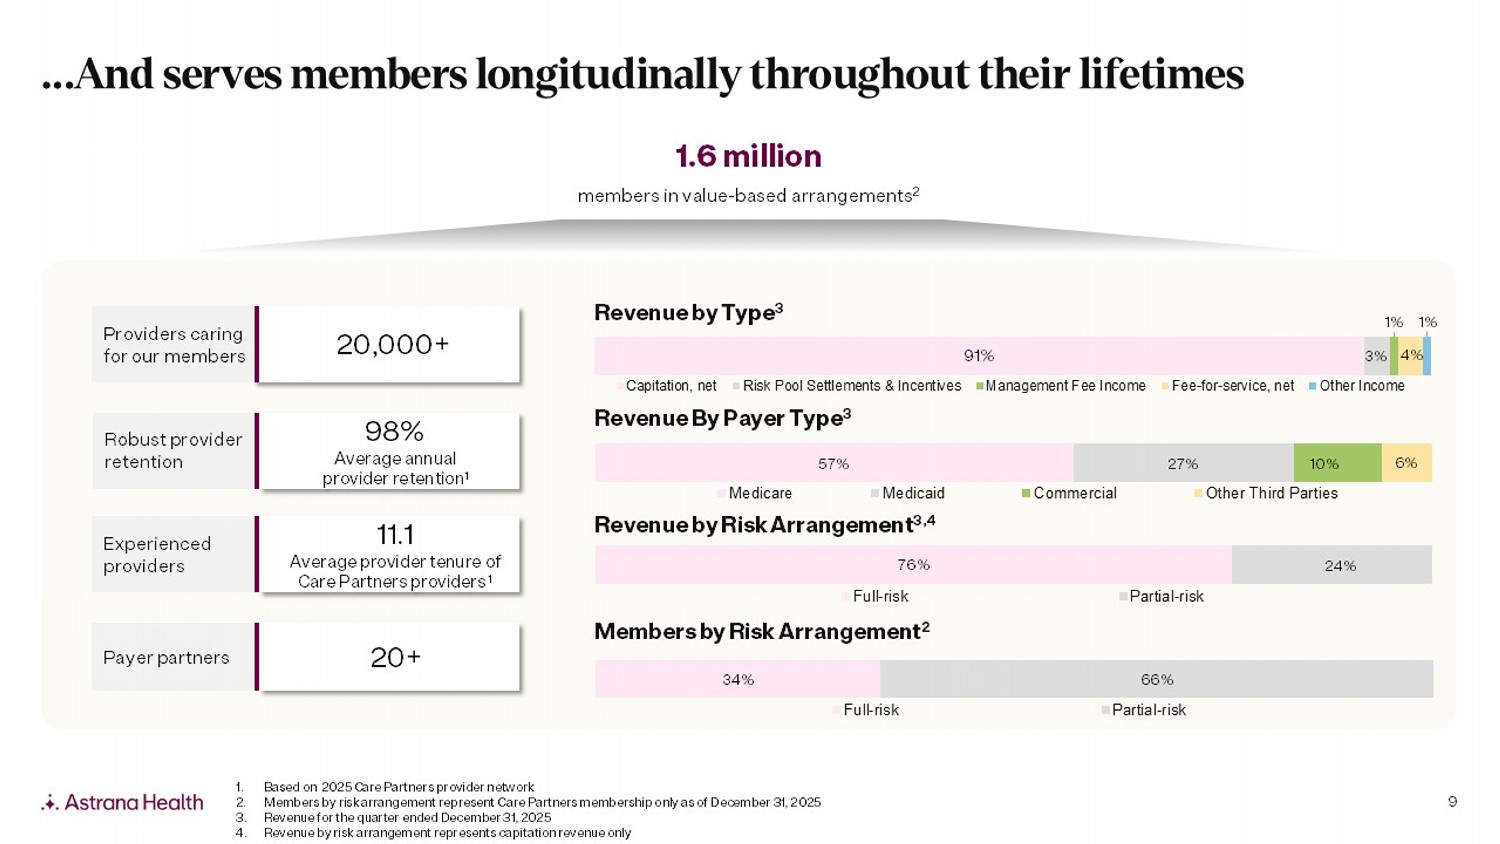
9 …And serves members longitudinally throughout their lifetimes 1.6 million members in value - based arrangements 2 20,000+ Providers caring for our members 98% Average annual provider retention 1 Experienced providers 11.1 Average provider tenure of Care Partners providers 1 Payer partners 20+ Robust provider retention 91% 3% 1% 4% Capitation, net Risk Pool Settlements & Incentives Management Fee Income Fee-for-service, net Other Income Revenue by Type 3 57% 27% 10% 6% Medicare Medicaid Commercial Other Third Parties Revenue By Payer Type 3 76% 24% Full-risk Partial-risk Revenue by Risk Arrangement 3,4 34% 66% Full-risk Partial-risk Members by Risk Arrangement 2 1% 1. Based on 2025 Care Partners provider network 2. Members by risk arrangement represent Care Partners membership only as of December 31, 2025 3. Revenue for the quarter ended December 31, 2025 4. Revenue by risk arrangement represents capitation revenue only AS1
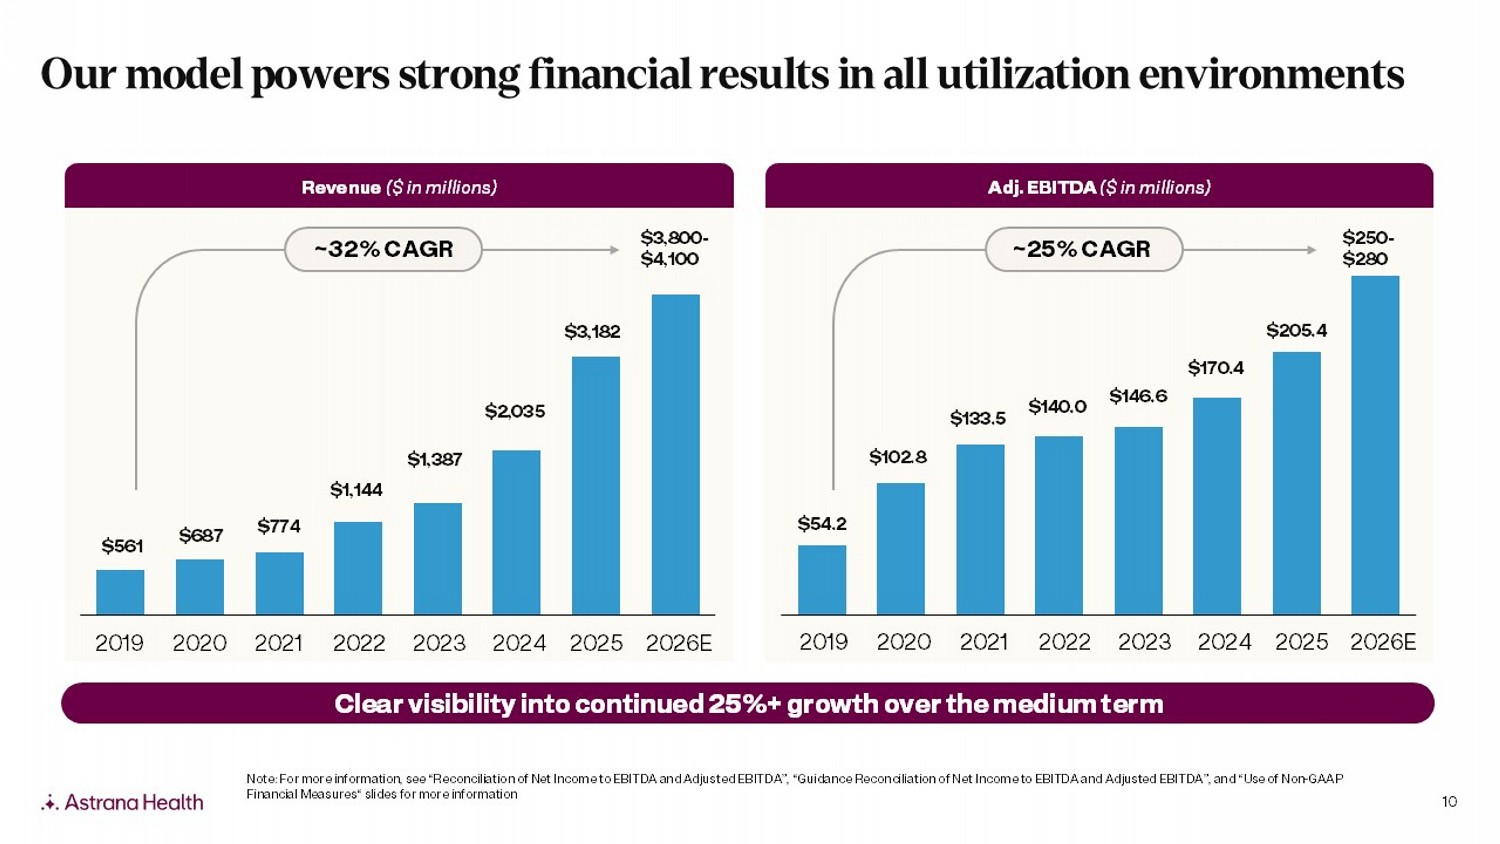
10 $54.2 $102.8 $133.5 $140.0 $146.6 $170.4 $205.4 $561 $687 $774 $1,144 $1,387 $2,035 $3,182 Our model powers strong financial results in all utilization environments Adj. EBITDA ($ in millions) Revenue ($ in millions) ~25% CAGR Clear visibility into continued 25%+ growth over the medium term $3,800 - $4,100 2019 2020 2021 2022 2023 2024 2026E ~ 32 % CAGR $250 - $280 Note: For more information, see “Reconciliation of Net Income to EBITDA and Adjusted EBITDA”, “Guidance Reconciliation of Net In come to EBITDA and Adjusted EBITDA”, and “Use of Non - GAAP Financial Measures“ slides for more information 2025 2019 2020 2021 2022 2023 2024 2026E 2025AS1 AS2
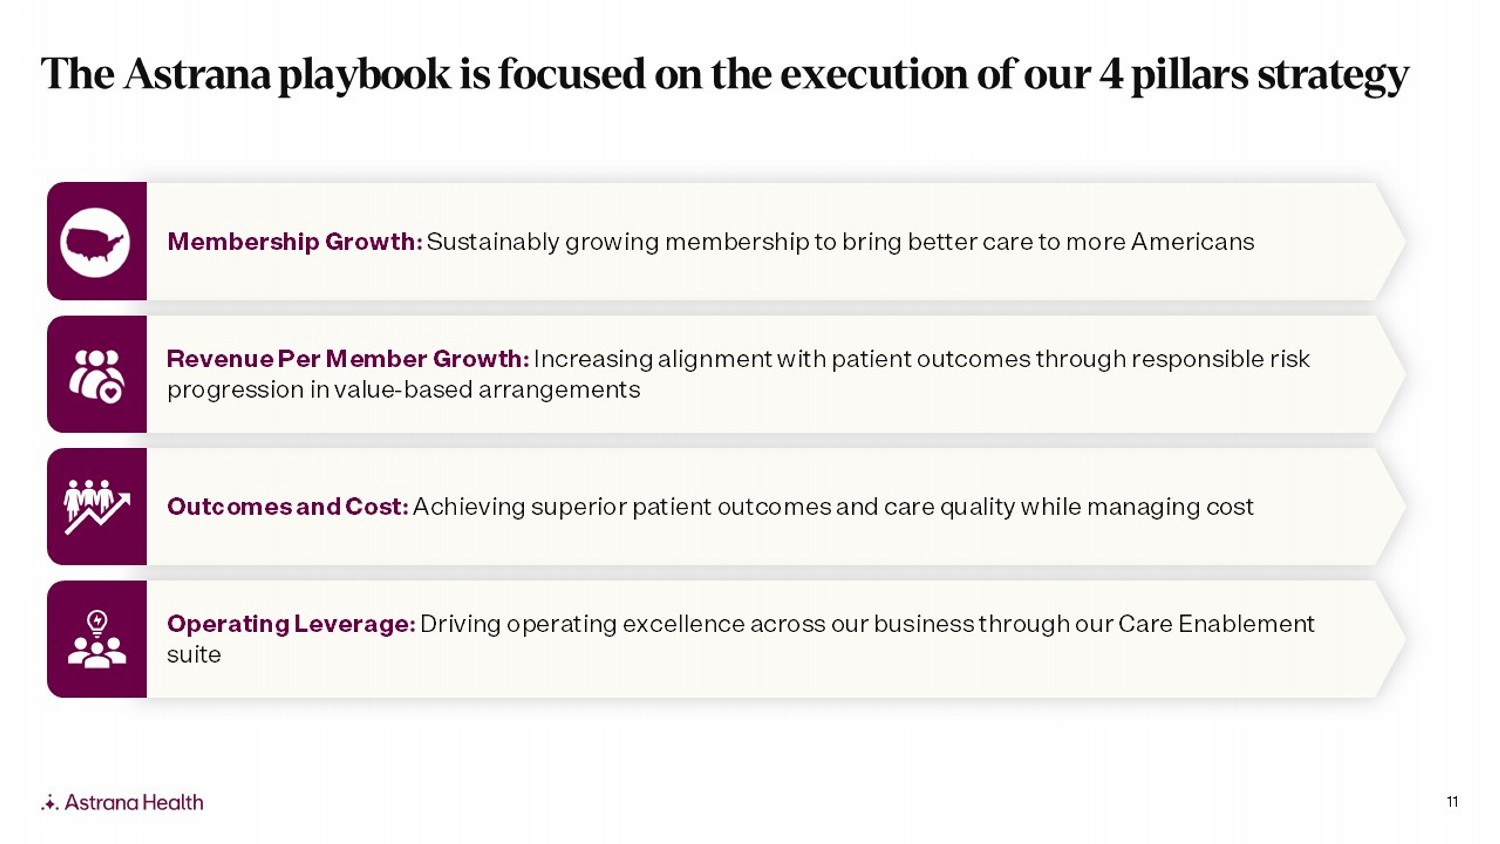
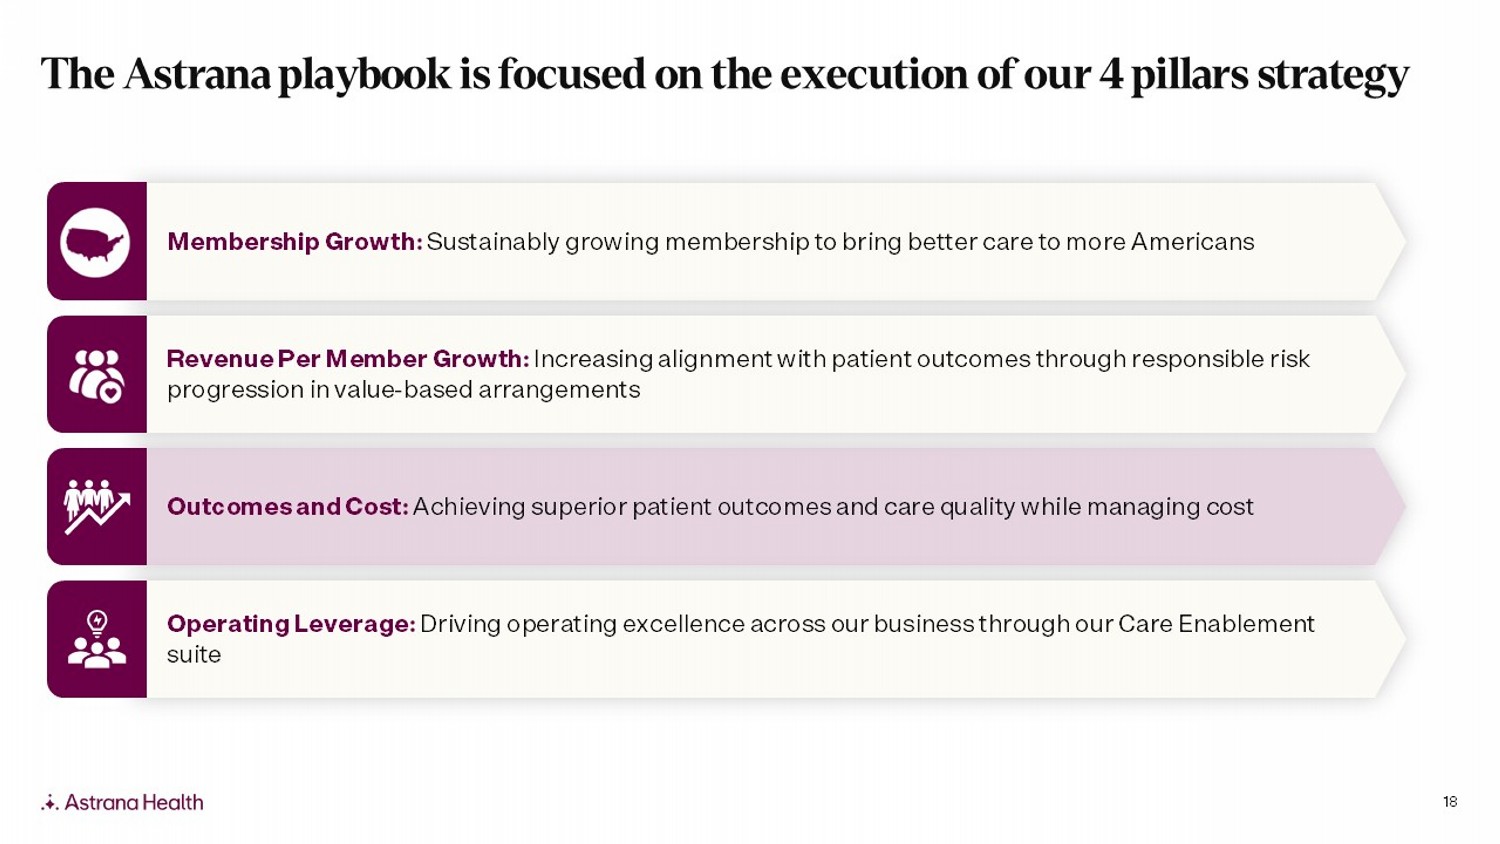
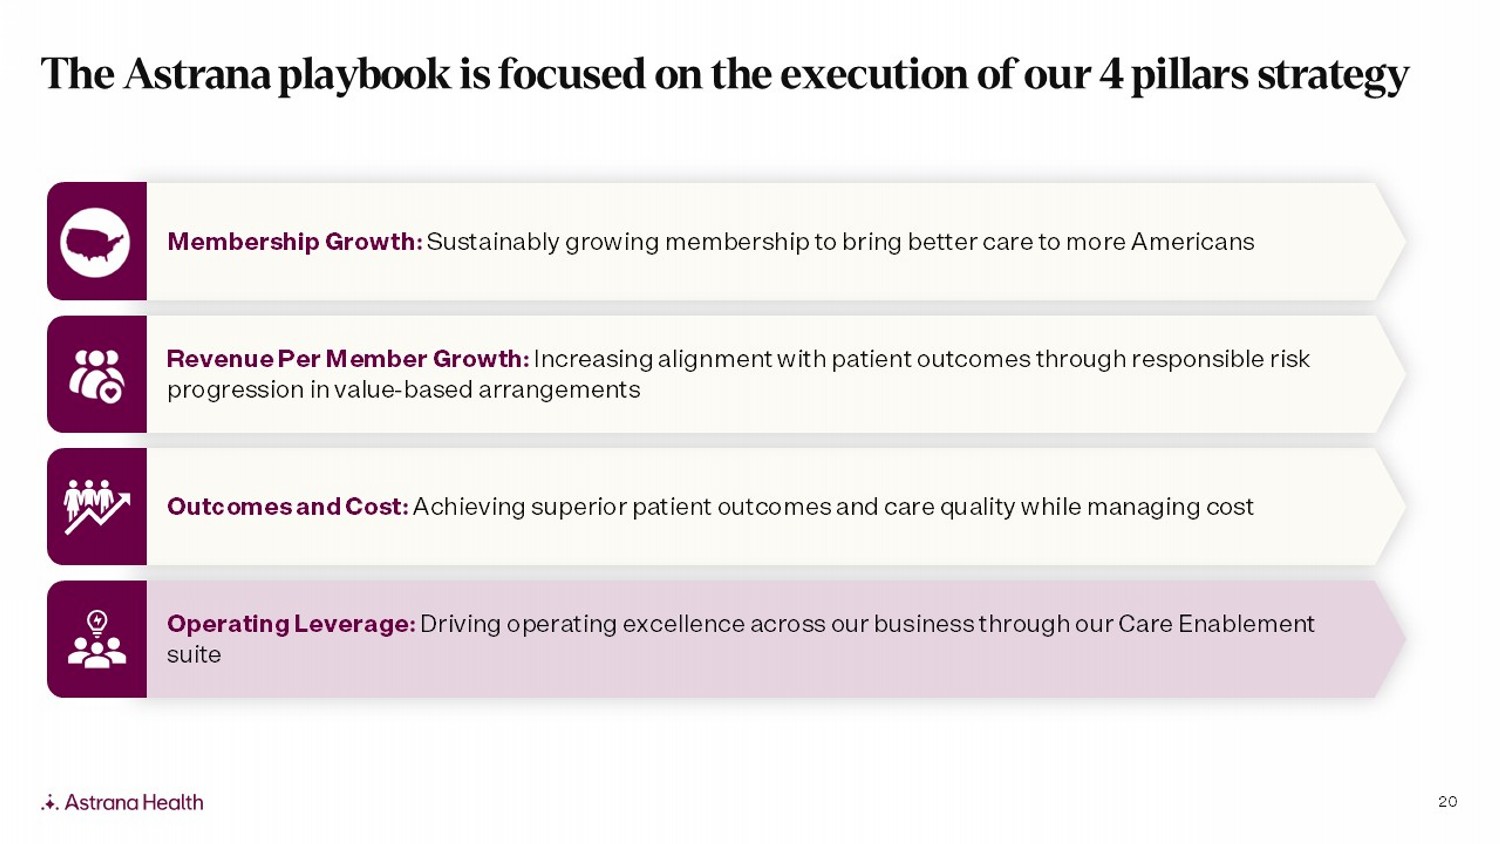
11 Outcomes and Cost: Achieving superior patient outcomes and care quality while managing cost Membership Growth : Sustainably growing membership to bring better care to more Americans Revenue Per Member Growth : Increasing alignment with patient outcomes through responsible risk progression in value - based arrangements Operating Leverage: Driving operating excellence across our business through our Care Enablement suite The Astrana playbook is focused on the execution of our 4 pillars strategy
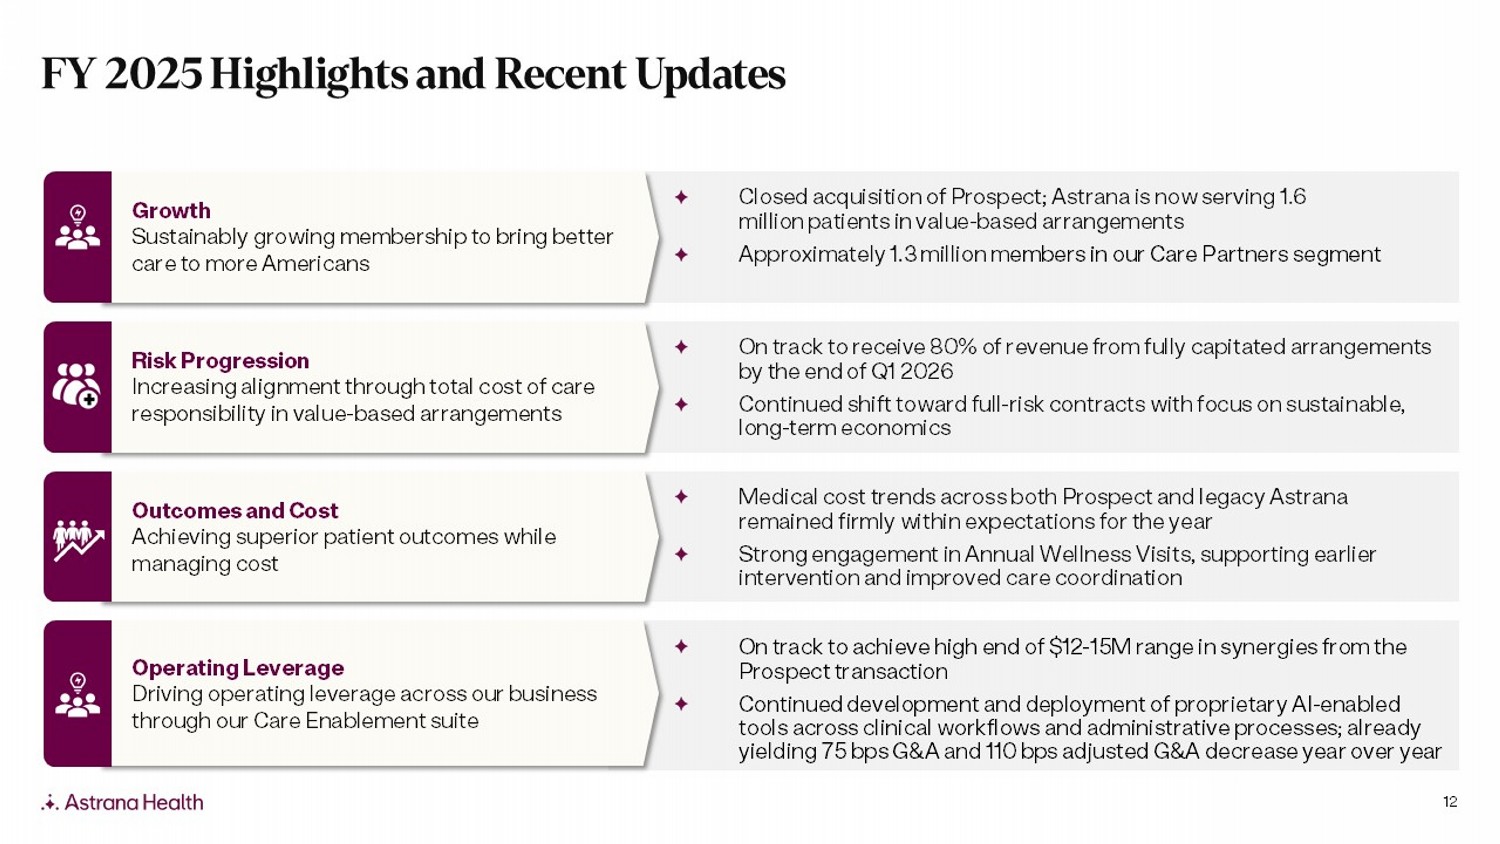
12 Growth Sustainably growing membership to bring better care to more Americans Closed acquisition of Prospect; Astrana is now serving 1.6 million patients in value - based arrangements Approximately 1.3 million m embers in our Care Partners segment Growth Operating Leverage Driving operating leverage across our business through our Care Enablement suite On track to achieve high end of $12 - 15M range in synergies from the Prospect transaction Continued development and deployment of proprietary AI - enabled tools across clinical workflows and administrative processes; already yielding 75 bps G&A and 110 bps adjusted G&A decrease year over year Risk Progression Increasing alignment through total cost of care responsibility in value - based arrangements On track to receive 80% of revenue from fully capitated arrangements by the end of Q1 2026 Continued shift toward full - risk contracts with focus on sustainable, long - term economics Outcomes and Cost Achieving superior patient outcomes while managing cost Medical cost trends across both Prospect and legacy Astrana remained firmly within expectations for the year Strong engagement in Annual Wellness Visits, supporting earlier intervention and improved care coordination FY 2025 Highlights and Recent UpdatesAS1
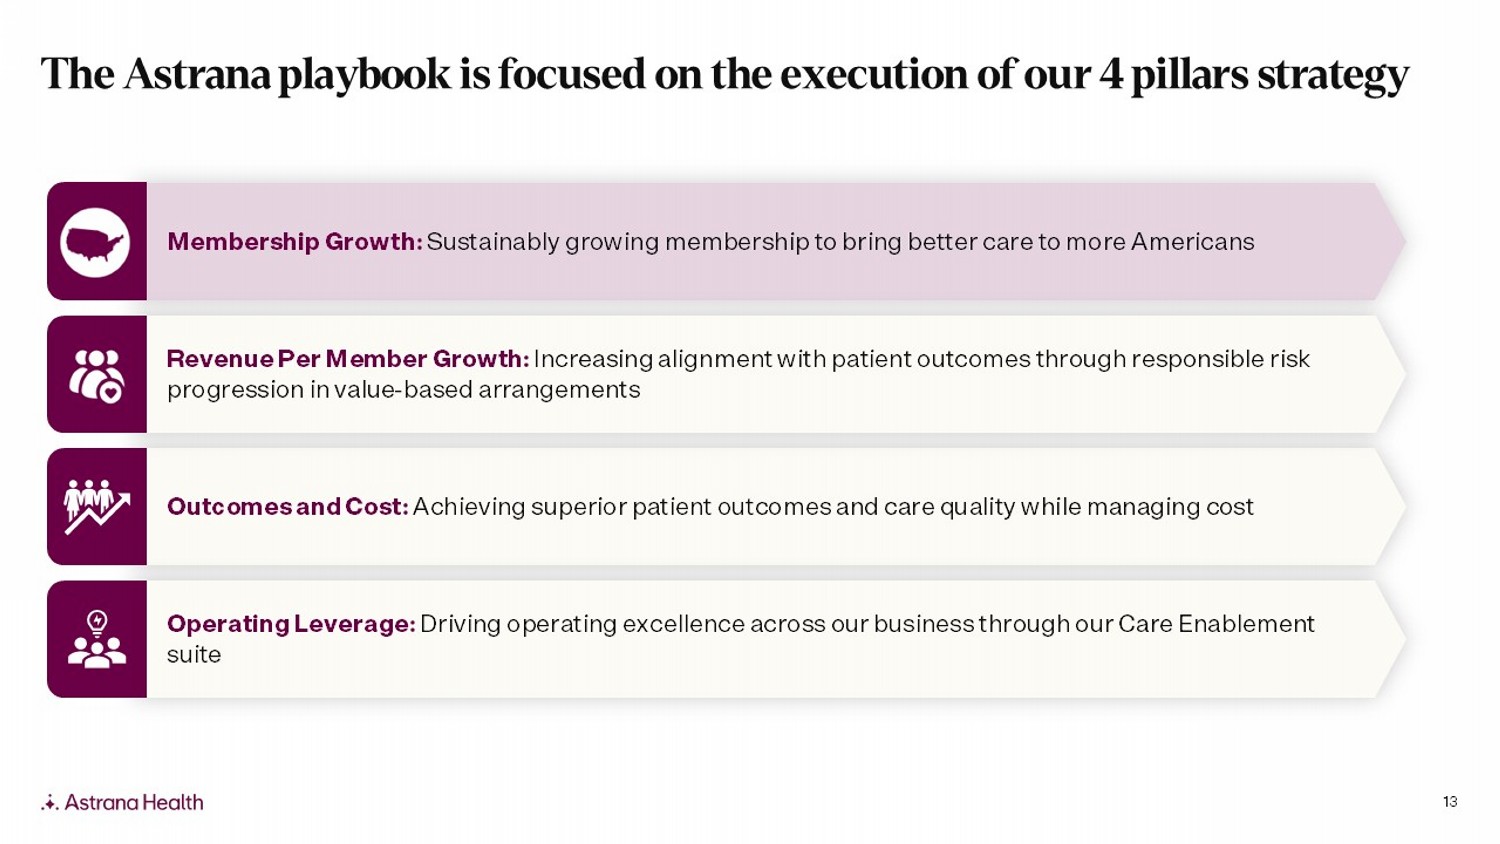
13 Outcomes and Cost: Achieving superior patient outcomes and care quality while managing cost Membership Growth : Sustainably growing membership to bring better care to more Americans Revenue Per Member Growth : Increasing alignment with patient outcomes through responsible risk progression in value - based arrangements Operating Leverage: Driving operating excellence across our business through our Care Enablement suite The Astrana playbook is focused on the execution of our 4 pillars strategy
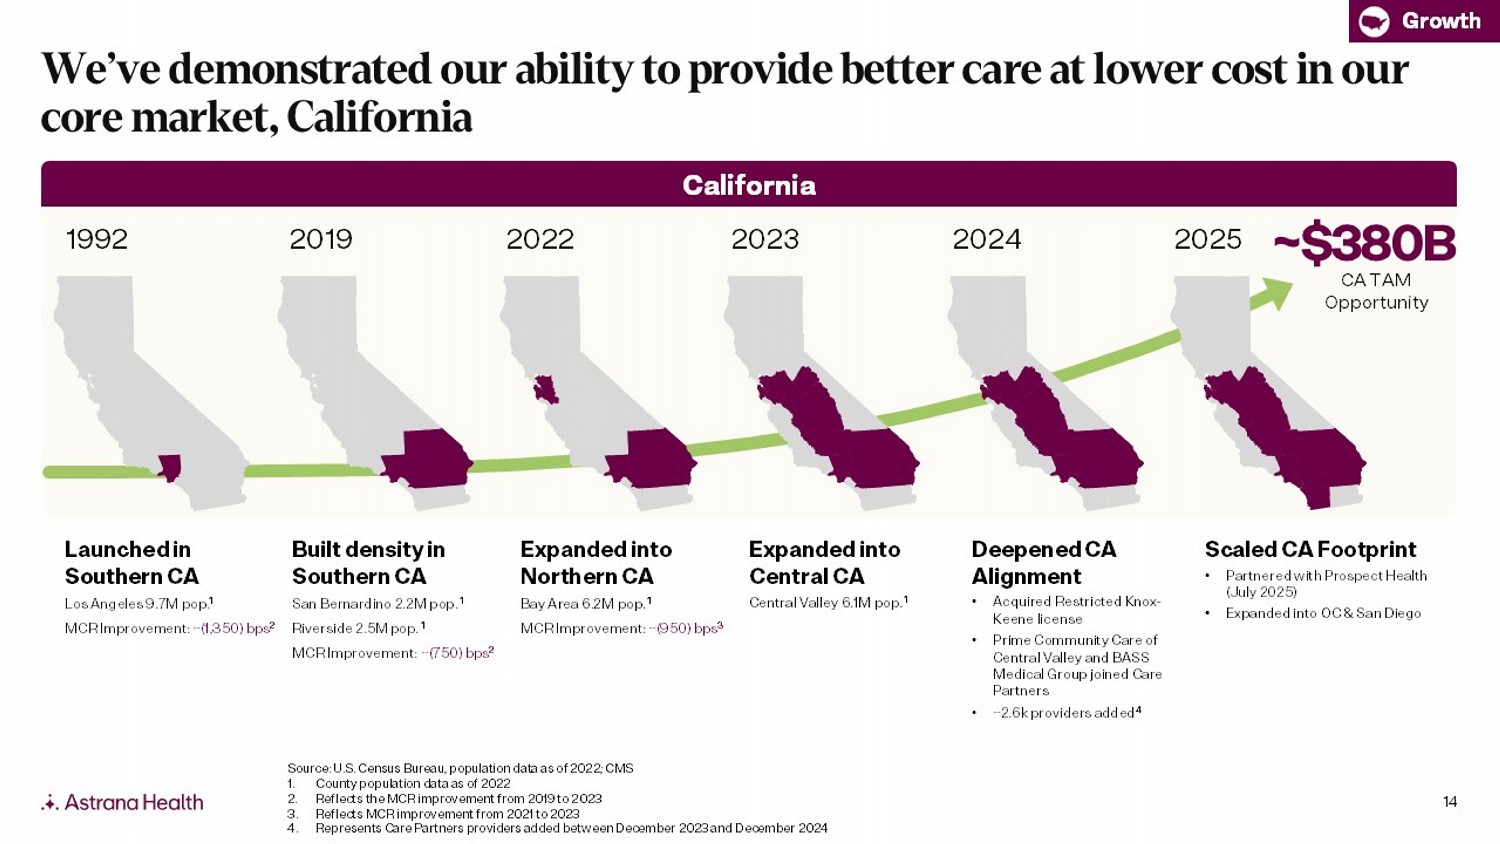
14 California 1992 2019 2022 2023 Built density in Southern CA San Bernardino 2.2M pop. 1 Riverside 2.5M pop. 1 MCR Improvement: ~(750) bps 2 Expanded into Northern CA Bay Area 6.2M pop. 1 MCR Improvement: ~(950) bps 3 Expanded into Central CA Central Valley 6.1M pop. 1 Launched in Southern CA Los Angeles 9.7M pop. 1 MCR Improvement: ~(1,350) bps 2 Source: U.S. Census Bureau, population data as of 2022; CMS 1. County population data as of 2022 2. Reflects the MCR improvement from 2019 to 2023 3. Reflects MCR improvement from 2021 to 2023 4. Represents Care Partners providers added between December 2023 and December 2024 2024 Deepened CA Alignment • Acquired Restricted Knox - Keene license • Prime Community Care of Central Valley and BASS Medical Group joined Care Partners • ~2.6k providers added 4 We’ve demonstrated our ability to provide better care at lower cost in our core market, California Growth ~$380B CA TAM Opportunity 2025 Scaled CA Footprint • Partnered with Prospect Health (July 2025) • Expanded into OC & San Diego
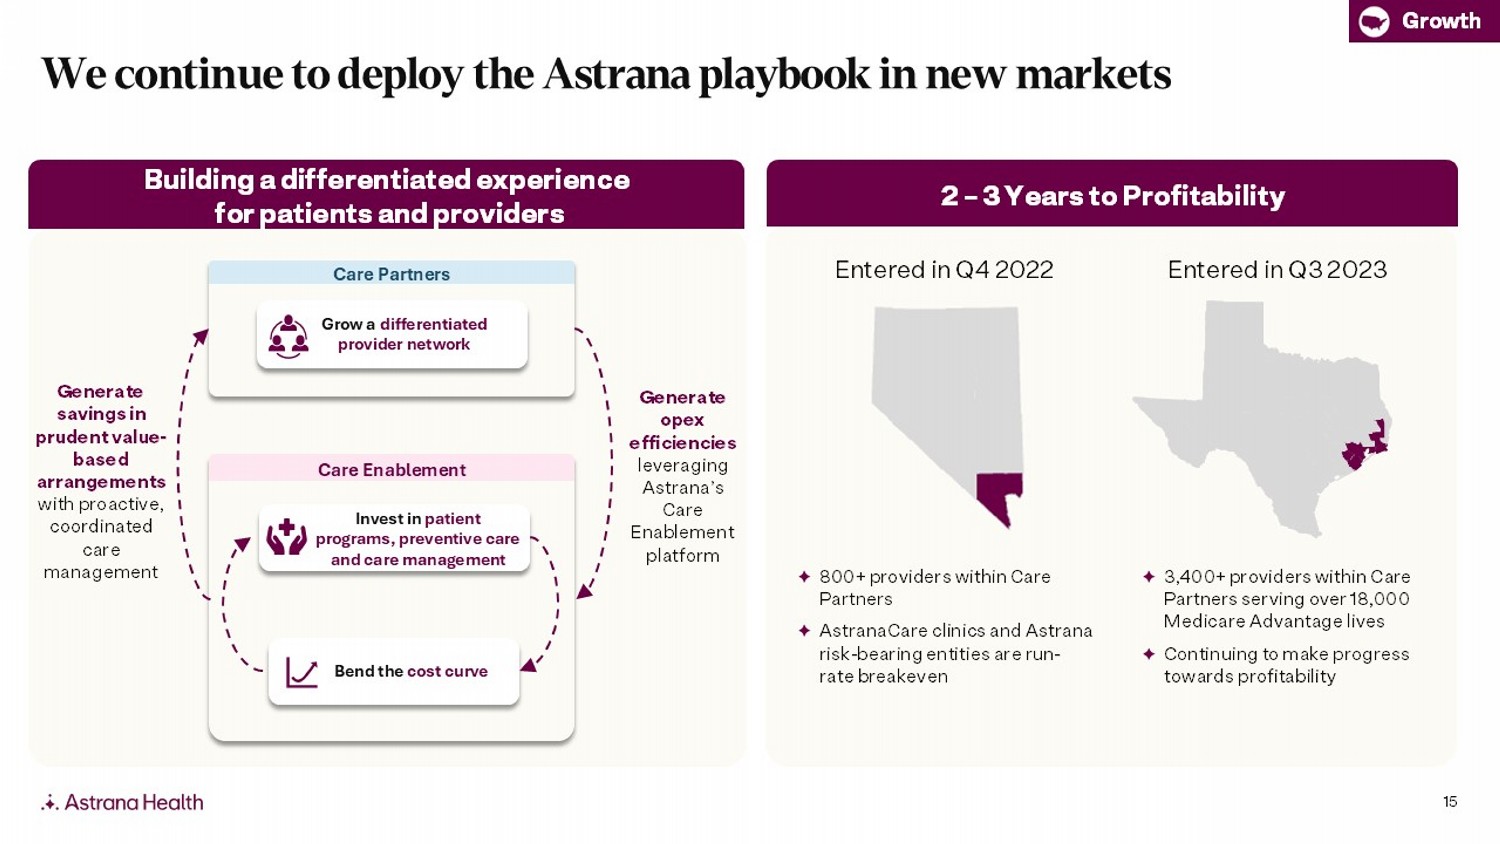
15 2 – 3 Years to Profitability 800+ providers within Care Partners AstranaCare clinics and Astrana risk - bearing entities are run - rate breakeven 3,400+ providers within Care Partners serving over 18,000 Medicare Advantage lives Continuing to make progress towards profitability Entered in Q3 2023 Entered in Q4 2022 Growth Building a differentiated experience for patients and providers We continue to deploy the Astrana playbook in new markets Grow a differentiated provider network Bend the cost curve Invest in patient programs, preventive care and care management Care Enablement Care Partners Generate savings in prudent value - based arrangements with proactive, coordinated care management Generate opex efficiencies leveraging Astrana’s Care Enablement platform
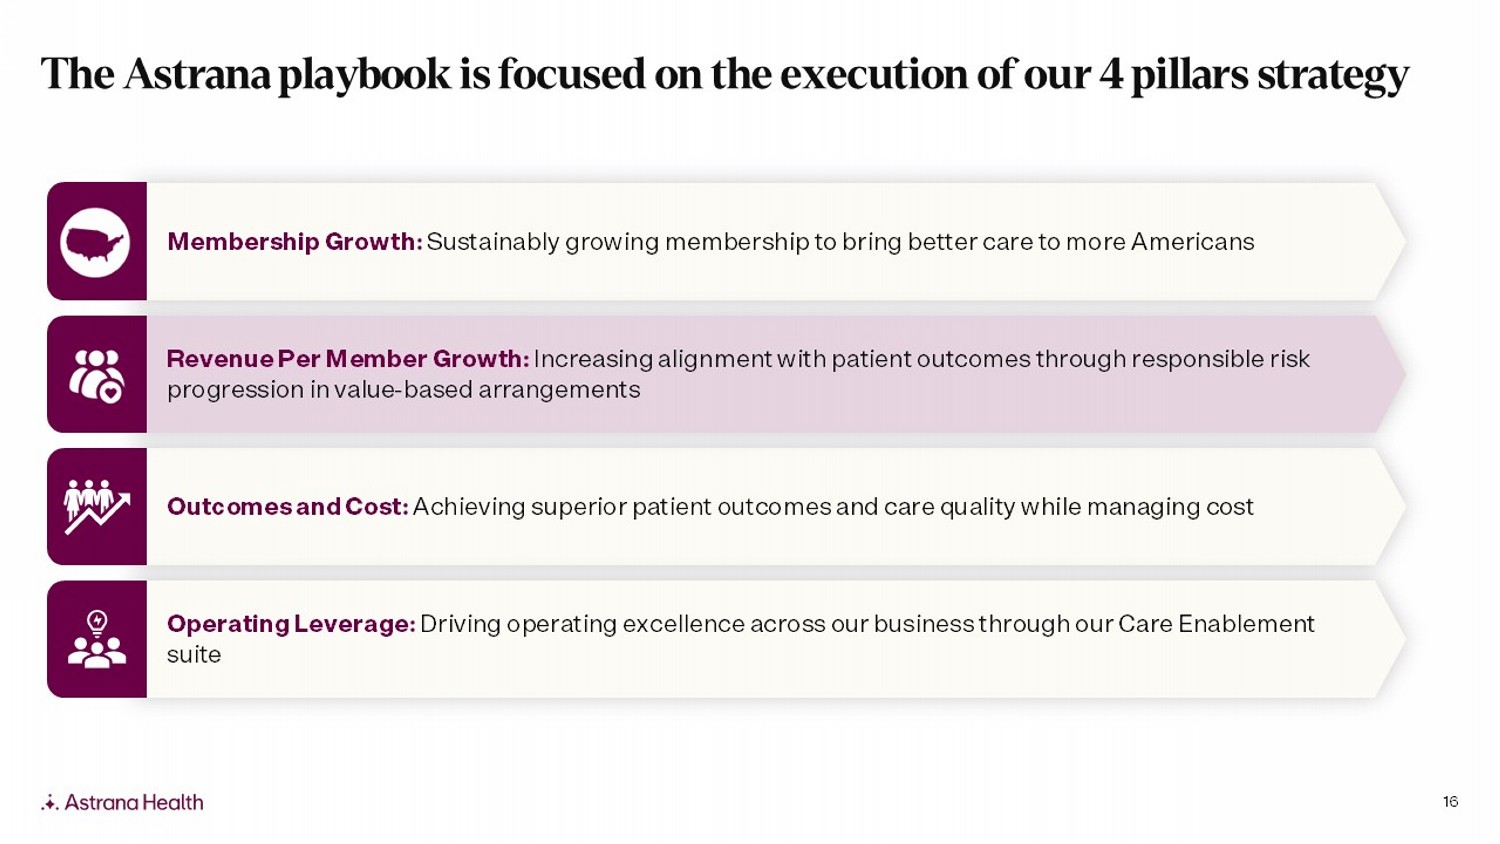
16 Outcomes and Cost: Achieving superior patient outcomes and care quality while managing cost Membership Growth : Sustainably growing membership to bring better care to more Americans Revenue Per Member Growth : Increasing alignment with patient outcomes through responsible risk progression in value - based arrangements Operating Leverage: Driving operating excellence across our business through our Care Enablement suite The Astrana playbook is focused on the execution of our 4 pillars strategy
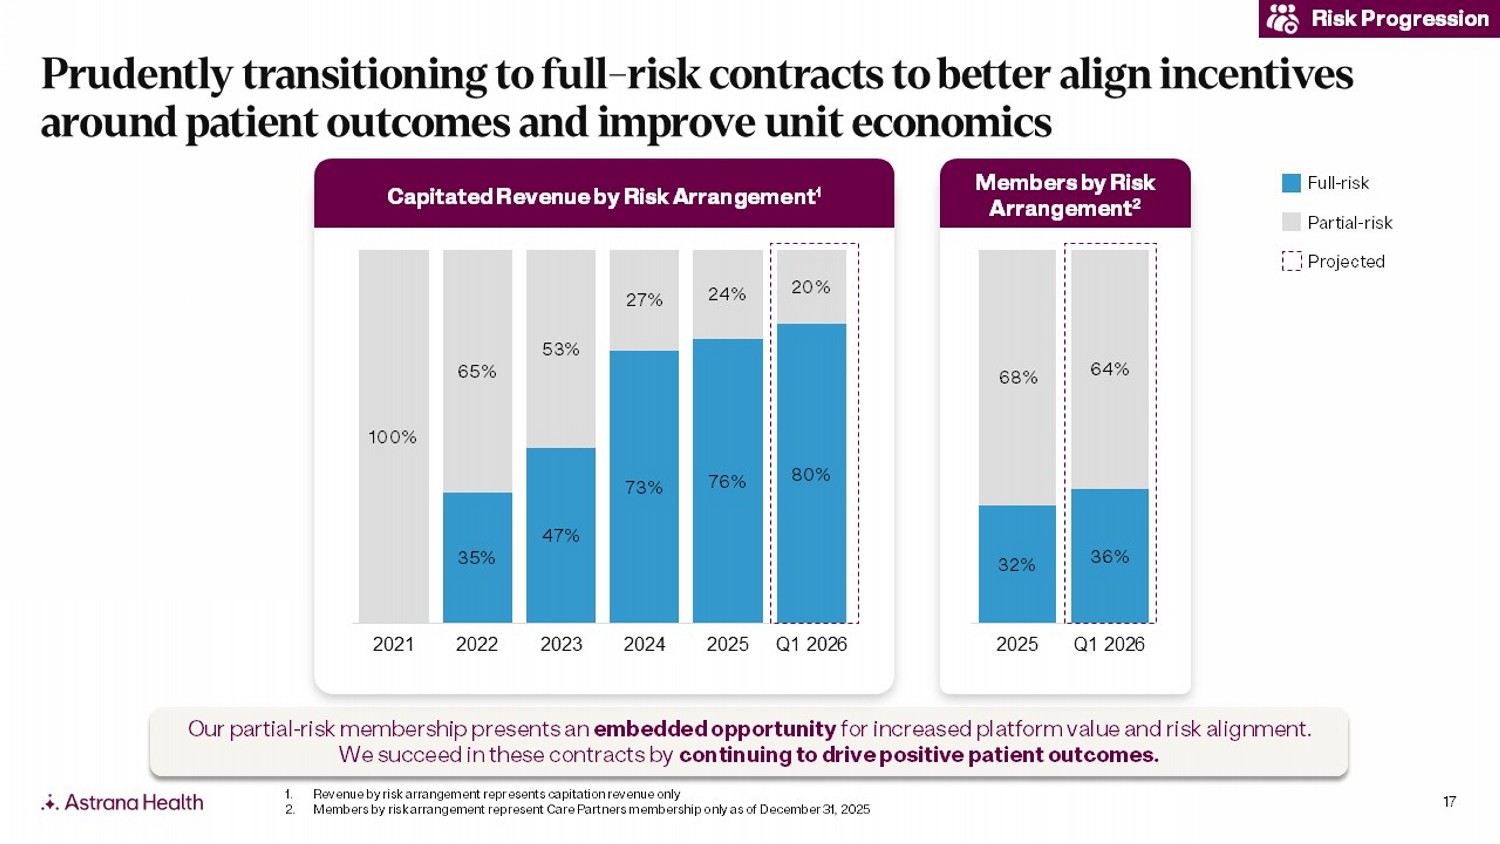
17 Risk Progression Prudently transitioning to full - risk contracts to better align incentives around patient outcomes and improve unit economics Our partial - risk membership presents an embedded opportunity for increased platform value and risk alignment. We succeed in these contracts by continuing to drive positive patient outcomes. 1. Revenue by risk arrangement represents capitation revenue only 2. Members by risk arrangement represent Care Partners membership only as of December 31, 2025 Projected Full - risk P artial - risk Members by Risk Arrangement 2 35% 47% 73% 76% 80% 100% 65% 53% 27% 24% 20% 2021 2022 2023 2024 2025 Q1 2026 32% 36% 68% 64% 2025 Q1 2026 Capitated Revenue by Risk Arrangement 1 AS1AS2
18 Outcomes and Cost: Achieving superior patient outcomes and care quality while managing cost Membership Growth : Sustainably growing membership to bring better care to more Americans Revenue Per Member Growth : Increasing alignment with patient outcomes through responsible risk progression in value - based arrangements Operating Leverage: Driving operating excellence across our business through our Care Enablement suite The Astrana playbook is focused on the execution of our 4 pillars strategy
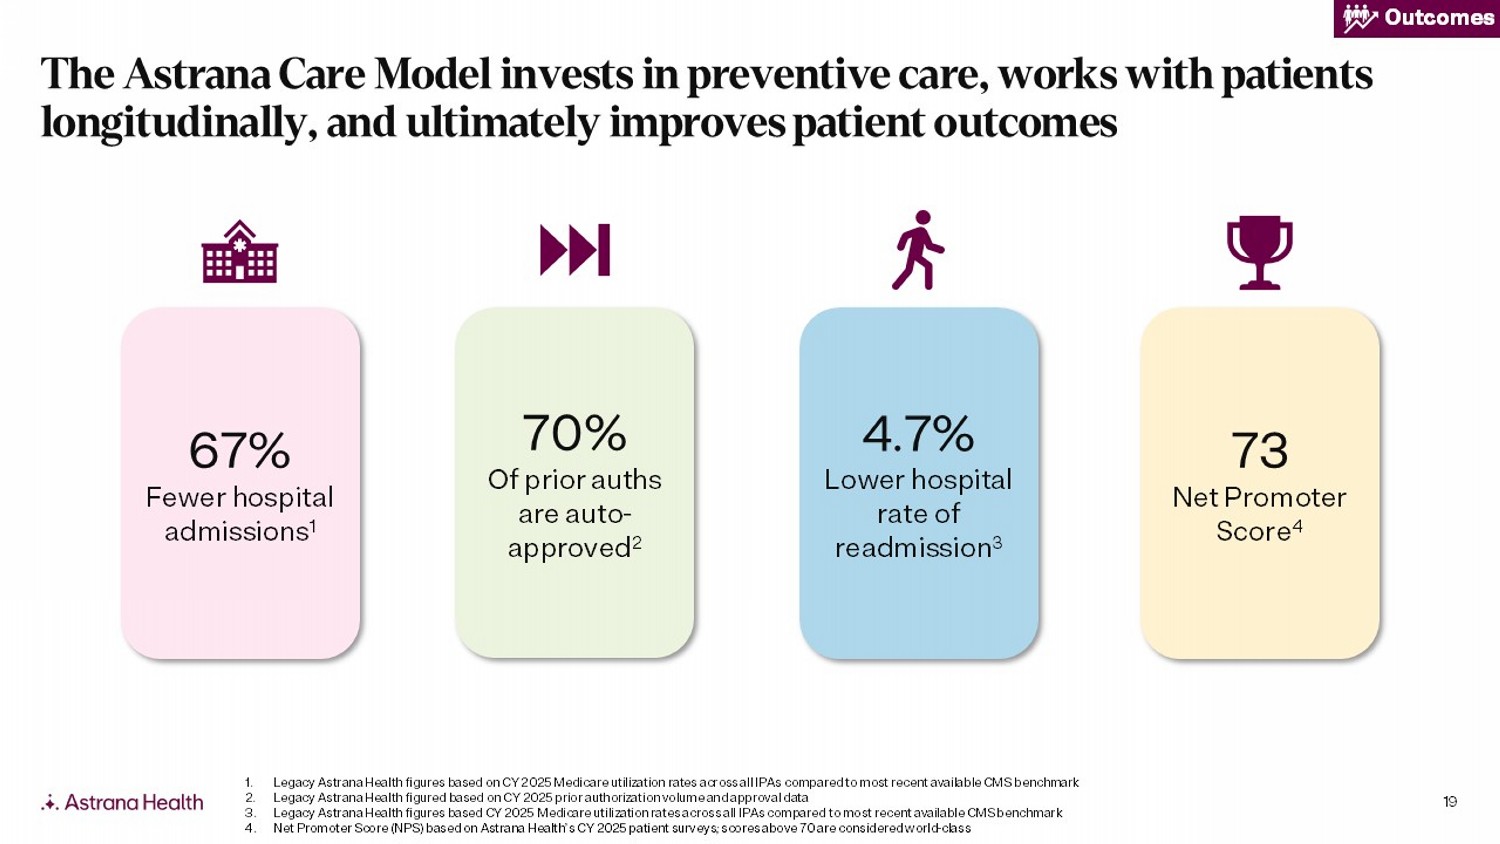
19 73 Net Promoter Score 4 4.7% Lower hospital rate of readmission 3 67% Fewer hospital admissions 1 70% Of prior auths are auto - approved 2 Outcomes 1. Legacy Astrana Health figures based on CY 2025 Medicare utilization rates across all IPAs compared to most recent available C MS benchmark 2. Legacy Astrana Health figured based on CY 2025 prior authorization volume and approval data 3. Legacy Astrana Health figures based CY 2025 Medicare utilization rates across all IPAs compared to most recent available CMS ben chmark 4. Net Promoter Score (NPS) based on Astrana Health’s CY 2025 patient surveys; scores above 70 are considered world - class The Astrana Care Model invests in preventive care, works with patients longitudinally, and ultimately improves patient outcomes
20 Outcomes and Cost: Achieving superior patient outcomes and care quality while managing cost Membership Growth : Sustainably growing membership to bring better care to more Americans Revenue Per Member Growth : Increasing alignment with patient outcomes through responsible risk progression in value - based arrangements Operating Leverage: Driving operating excellence across our business through our Care Enablement suite The Astrana playbook is focused on the execution of our 4 pillars strategy
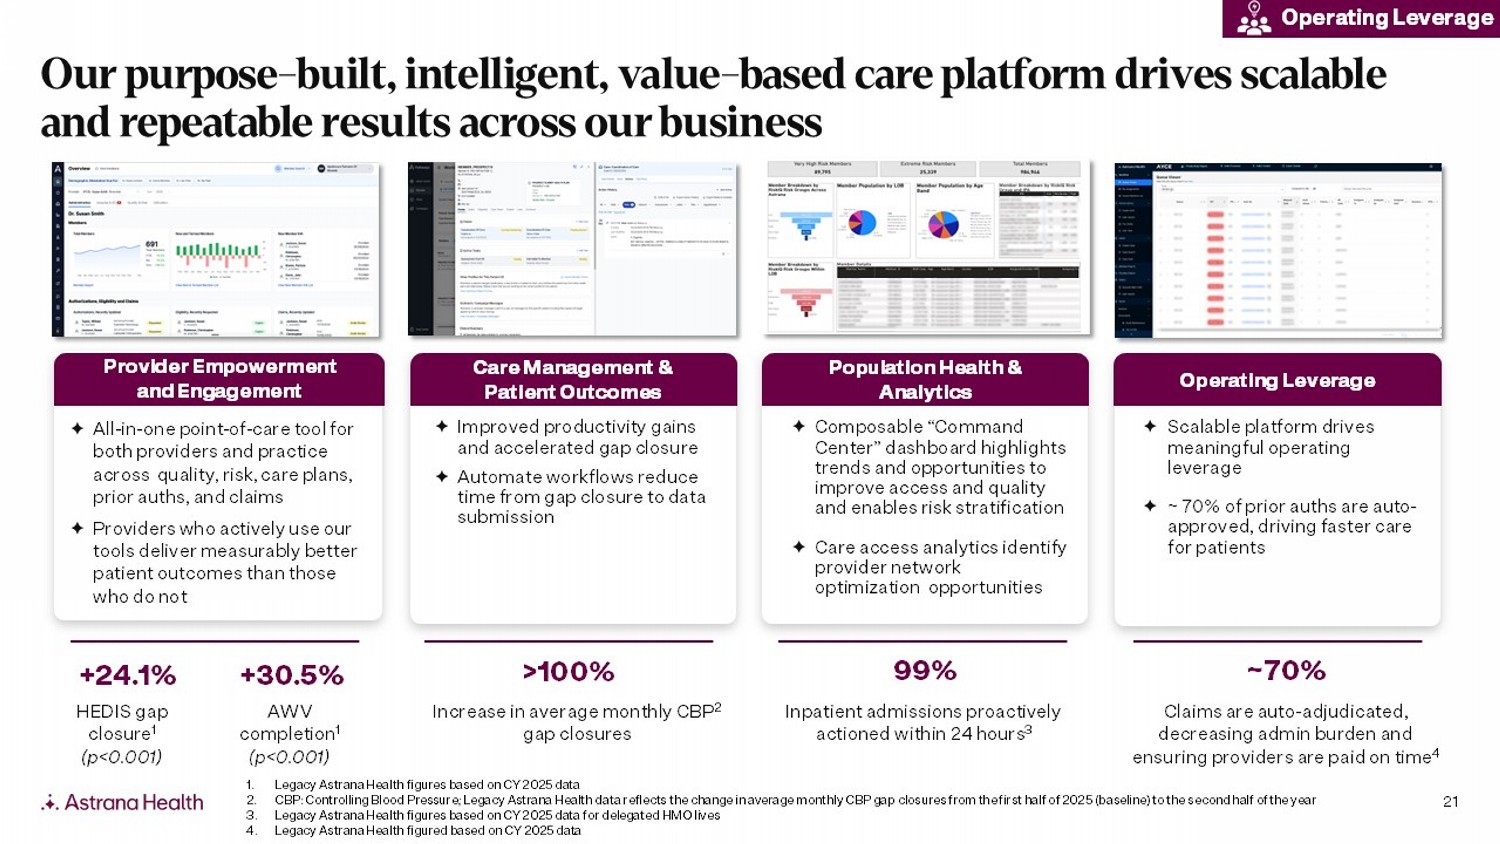
21 Provider Empowerment and Engagement All - in - one point - of - care tool for both providers and practice across quality, risk, care plans, prior auths , and claims Providers who actively use our tools deliver measurably better patient outcomes than those who do not Care Management & Patient Outcomes Improved productivity gains and accelerated gap closure Automate workflows reduce time from gap closure to data submission Population Health & Analytics Composable “Command Center” dashboard highlights trends and opportunities to improve access and quality and enables risk stratification Care access analytics identify provider network optimization opportunities Operating Leverage Scalable platform drives meaningful operating leverage ~ 70% of prior auths are auto - approved, driving faster care for patients Our purpose - built, intelligent, value - based care platform drives scalable and repeatable results across our business +24.1% >100% 99% ~70% HEDIS gap closure 1 (p<0.001) Increase in average monthly CBP 2 gap closures Inpatient admissions proactively actioned within 24 hours 3 Claims are auto - adjudicated, decreasing admin burden and ensuring providers are paid on time 4 1. Legacy Astrana Health figures based on CY 2025 data 2. CBP: Controlling Blood Pressure; Legacy Astrana Health data reflects the change in average monthly CBP gap closures from the fir st half of 2025 (baseline) to the second half of the year 3. Legacy Astrana Health figures based on CY 2025 data for delegated HMO lives 4. Legacy Astrana Health figured based on CY 2025 data Operating Leverage +30.5% AWV completion 1 (p<0.001)
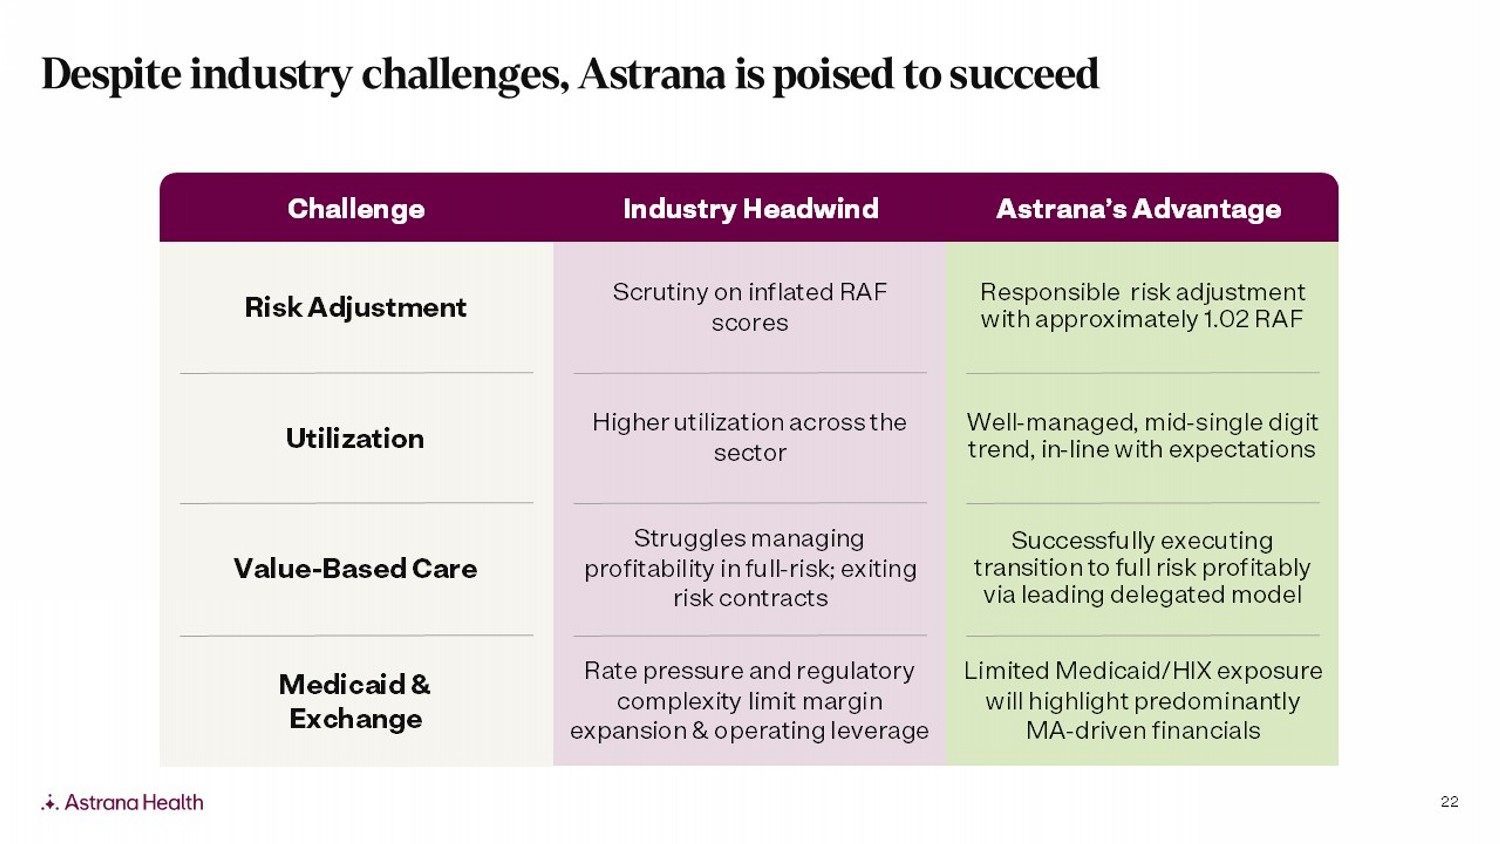
22 Industry Headwind Astrana’s Advantage Challenge Risk Adjustment Utilization Value - Based Care Scrutiny on inflated RAF scores Higher utilization across the sector Struggles managing profitability in full - risk; exiting risk contracts Responsible risk adjustment with approximately 1.02 RAF Well - managed, mid - single digit trend, in - line with expectations Successfully executing transition to full risk profitably via leading delegated model Medicaid & Exchange Rate pressure and regulatory complexity limit margin expansion & operating leverage Limited Medicaid/HIX exposure will highlight predominantly MA - driven financials Despite industry challenges, Astrana is poised to succeed
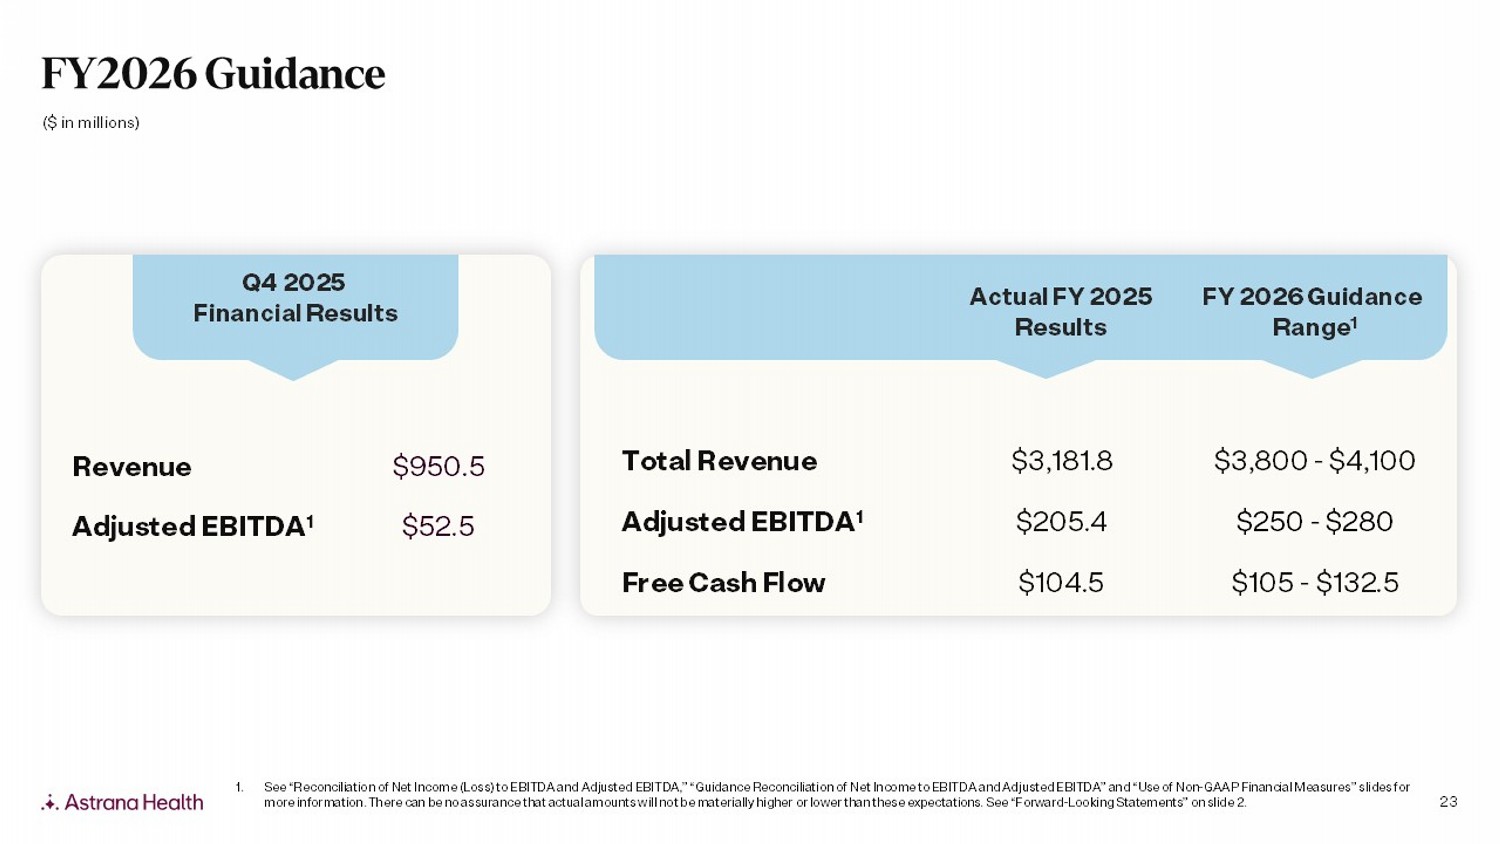
23 ($ in millions) FY2026 Guidance Q4 202 5 Financial Results FY 2026 Guidance Range 1 Actual FY 2025 Results $3,800 - $4,100 $3,181.8 Total Revenue $250 - $280 $205.4 Adjusted EBITDA 1 $105 - $132.5 $104.5 Free Cash Flow $950.5 Revenue $52.5 Adjusted EBITDA 1 1. See “Reconciliation of Net Income (Loss) to EBITDA and Adjusted EBITDA,” “Guidance Reconciliation of Net Income to EBITDA and Ad justed EBITDA” and “Use of Non - GAAP Financial Measures” slides for more information. There can be no assurance that actual amounts will not be materially higher or lower than these expectation s. See “Forward - Looking Statements” on slide 2.AS1
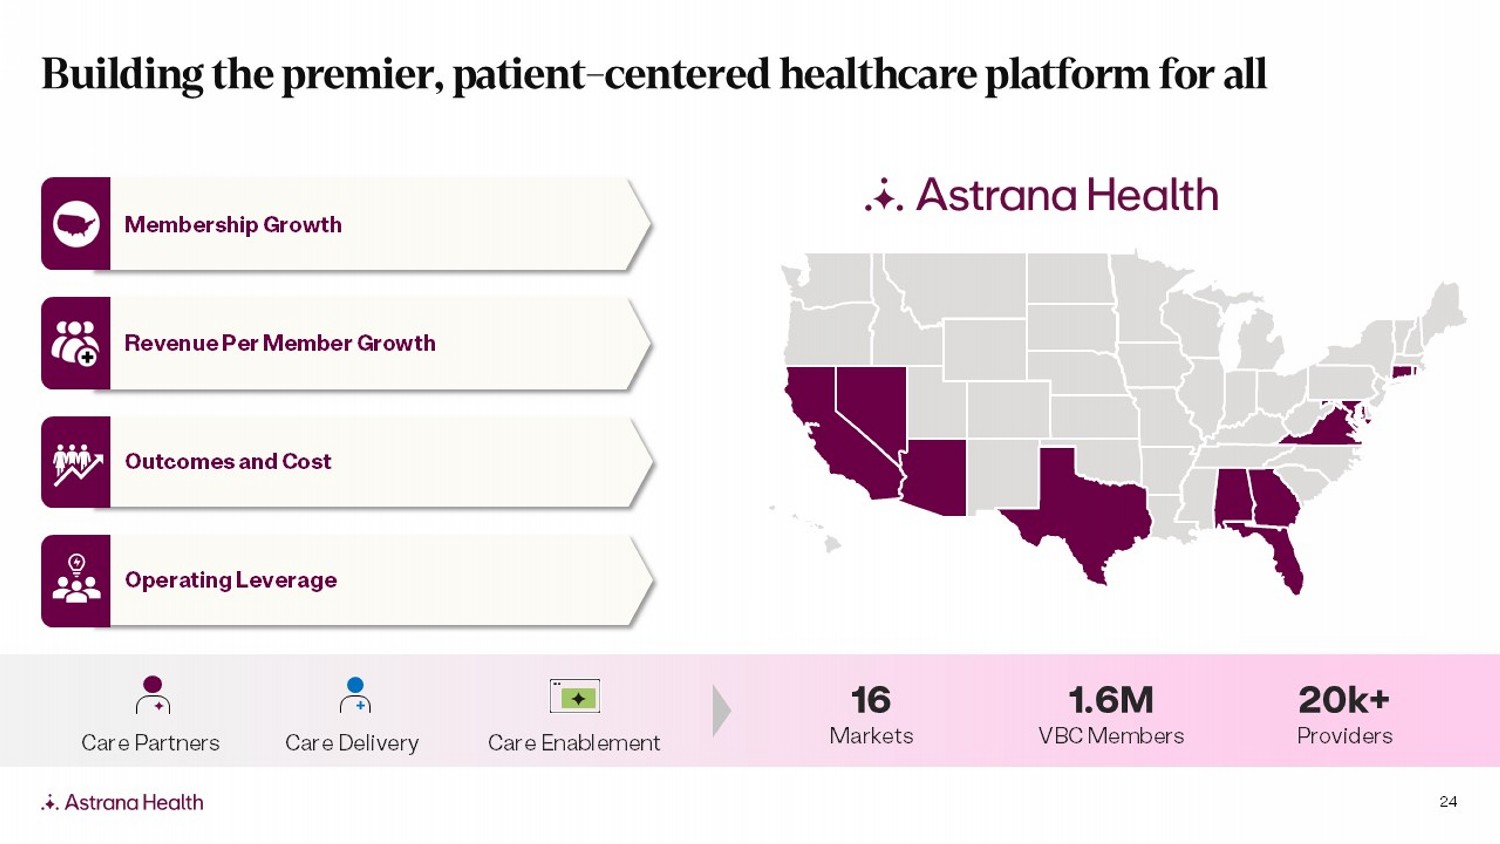
24 16 Markets 1.6M VBC Members 20k+ Providers Membership Growth Outcomes and Cost Care Partners Care Delivery Care Enablement Operating Leverage Revenue Per Member Growth Building the premier, patient - centered healthcare platform for all

25 Appendix
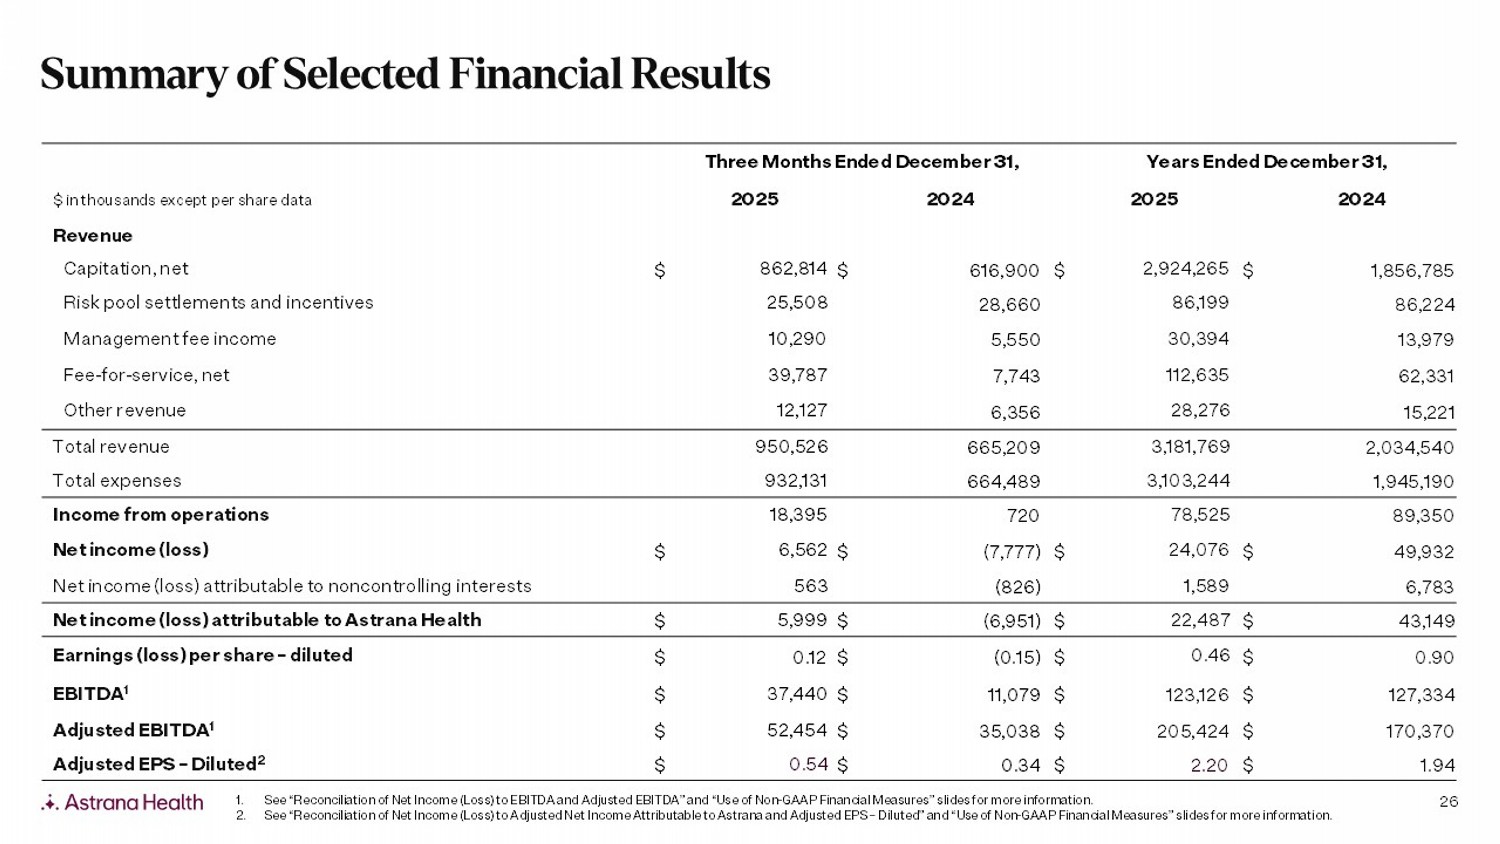
26 Years Ended December 31, Three Months Ended December 31, 2024 2025 2024 2025 $ in thousands except per share data Revenue 1,856,785 $ 2,924,265 $ 616,900 $ 862,814 $ Capitation, net 86,224 86,199 28,660 25,508 Risk pool settlements and incentives 13,979 30,394 5,550 10,290 Management fee income 62,331 112,635 7,743 39,787 Fee - for - service, net 15,221 28,276 6,356 12,127 Other revenue 2,034,540 3,181,769 665,209 950,526 Total revenue 1,945,190 3,103,244 664,489 932,131 Total expenses 89,350 78,525 720 18,395 Income from operations 49,932 $ 24,076 $ (7,777) $ 6,562 $ Net income (loss) 6,783 1,589 (826) 563 Net income (loss) attributable to noncontrolling interests 43,149 $ 22,487 $ (6,951) $ 5,999 $ Net income (loss) attributable to Astrana Health 0.90 $ 0.46 $ (0.15) $ 0.12 $ Earnings (loss) per share – diluted 127,334 $ 123,126 $ 11,079 $ 37,440 $ EBITDA 1 170,370 $ 205,424 $ 35,038 $ 52,454 $ Adjusted EBITDA 1 1.94 $ 2.20 $ 0.34 $ 0.54 $ Adjusted EPS – Diluted 2 1. See “Reconciliation of Net Income (Loss) to EBITDA and Adjusted EBITDA” and “Use of Non - GAAP Financial Measures” slides for more information. 2. See “Reconciliation of Net Income (Loss) to Adjusted Net Income Attributable to Astrana and Adjusted EPS – Diluted” and “Use of Non - GAAP Financial Measures” slides for more information. Summary of Selected Financial ResultsAS1
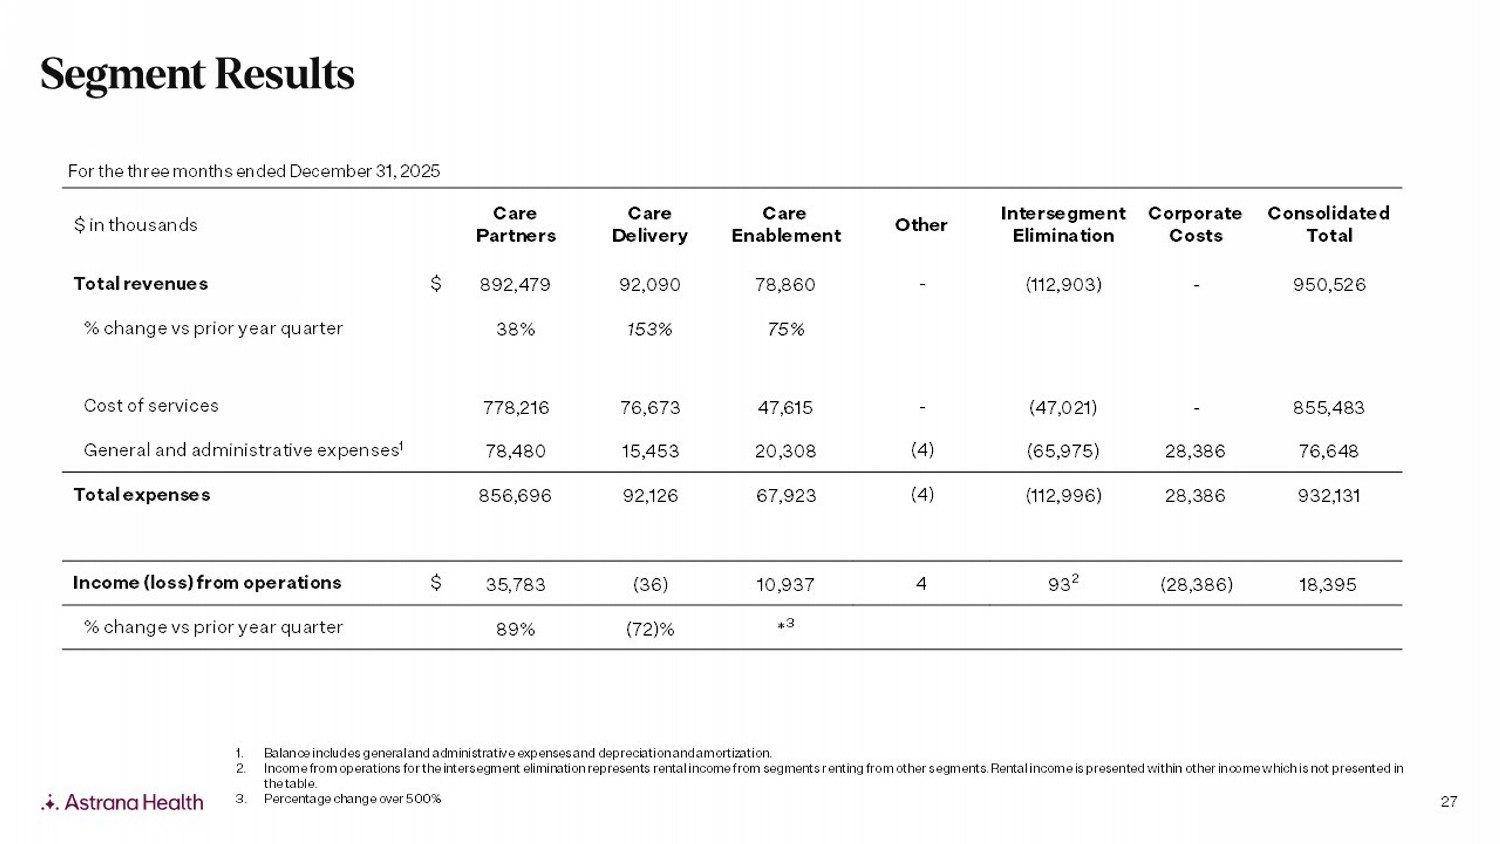
27 Consolidated Total Corporate Costs Intersegment Elimination Other Care Enablement Care Delivery Care Partners $ in thousands 950,526 - (112,903) - 78,860 92,090 892,479 $ Total revenues 75% 153% 38% % change vs prior year quarter 855,483 - (47,021) - 47,615 76,673 778,216 Cost of services 76,648 28,386 (65,975) (4) 20,308 15,453 78,480 General and administrative expenses 1 932,131 28,386 (112,996) (4) 67,923 92,126 856,696 Total expenses 18,395 (28,386) 93 2 4 10,937 (36) 35,783 $ Income (loss) from operations * 3 (72)% 89% % change vs prior year quarter For the three months ended December 31, 2025 1. Balance includes general and administrative expenses and depreciation and amortization. 2. Income from operations for the intersegment elimination represents rental income from segments renting from other segments. R ent al income is presented within other income which is not presented in the table. 3. Percentage change over 500% Segment Results
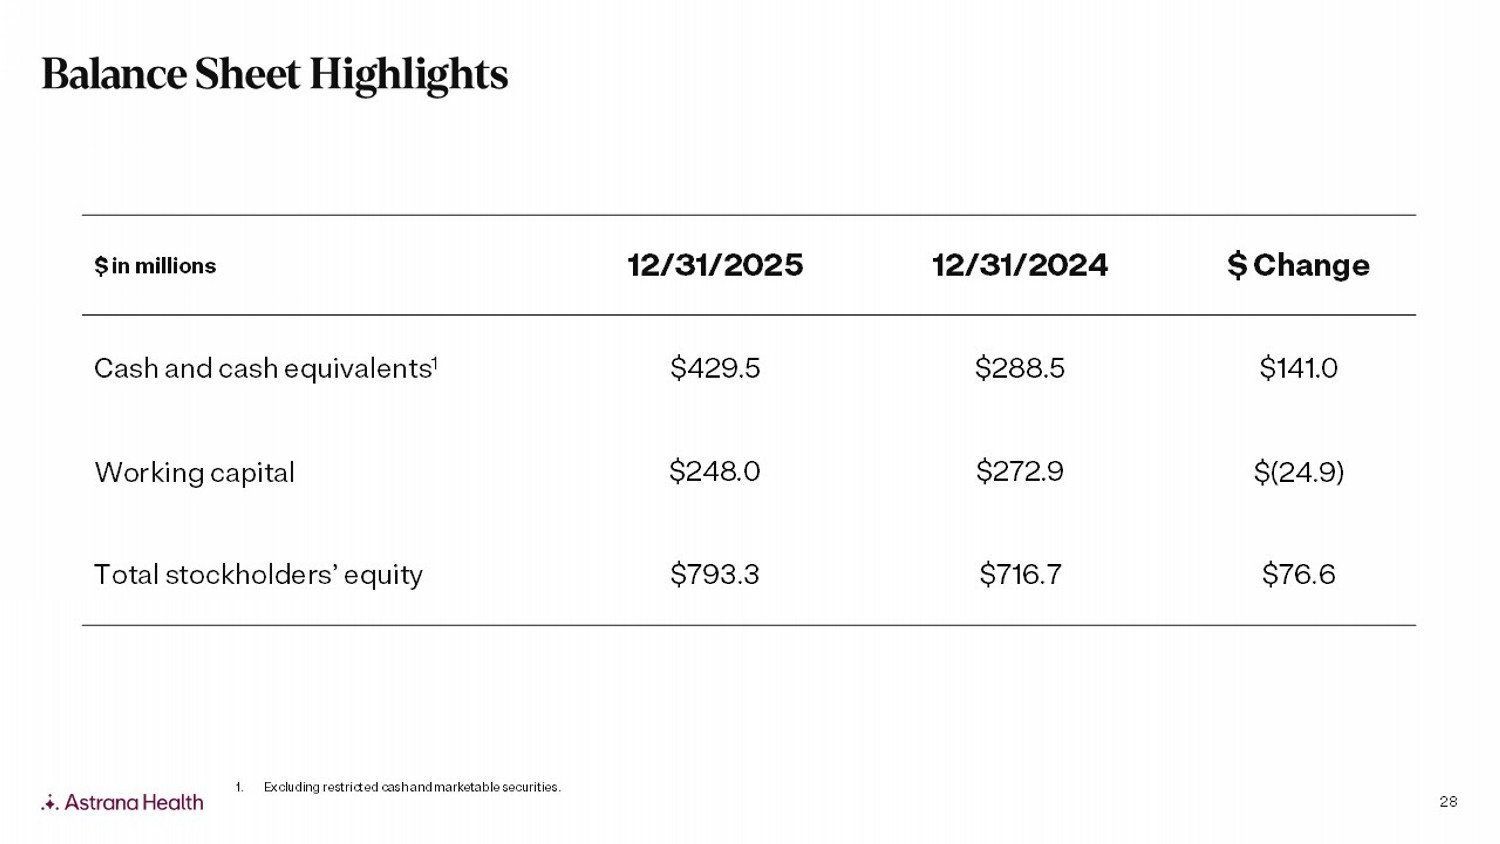
28 $ Change 12/31/2024 12/31/2025 $ in millions $141.0 $288.5 $429.5 Cash and cash equivalents 1 $(24.9) $272.9 $248.0 Working capital $76.6 $716.7 $793.3 Total stockholders’ equity 1. Excluding restricted cash and marketable securities. Balance Sheet Highlights
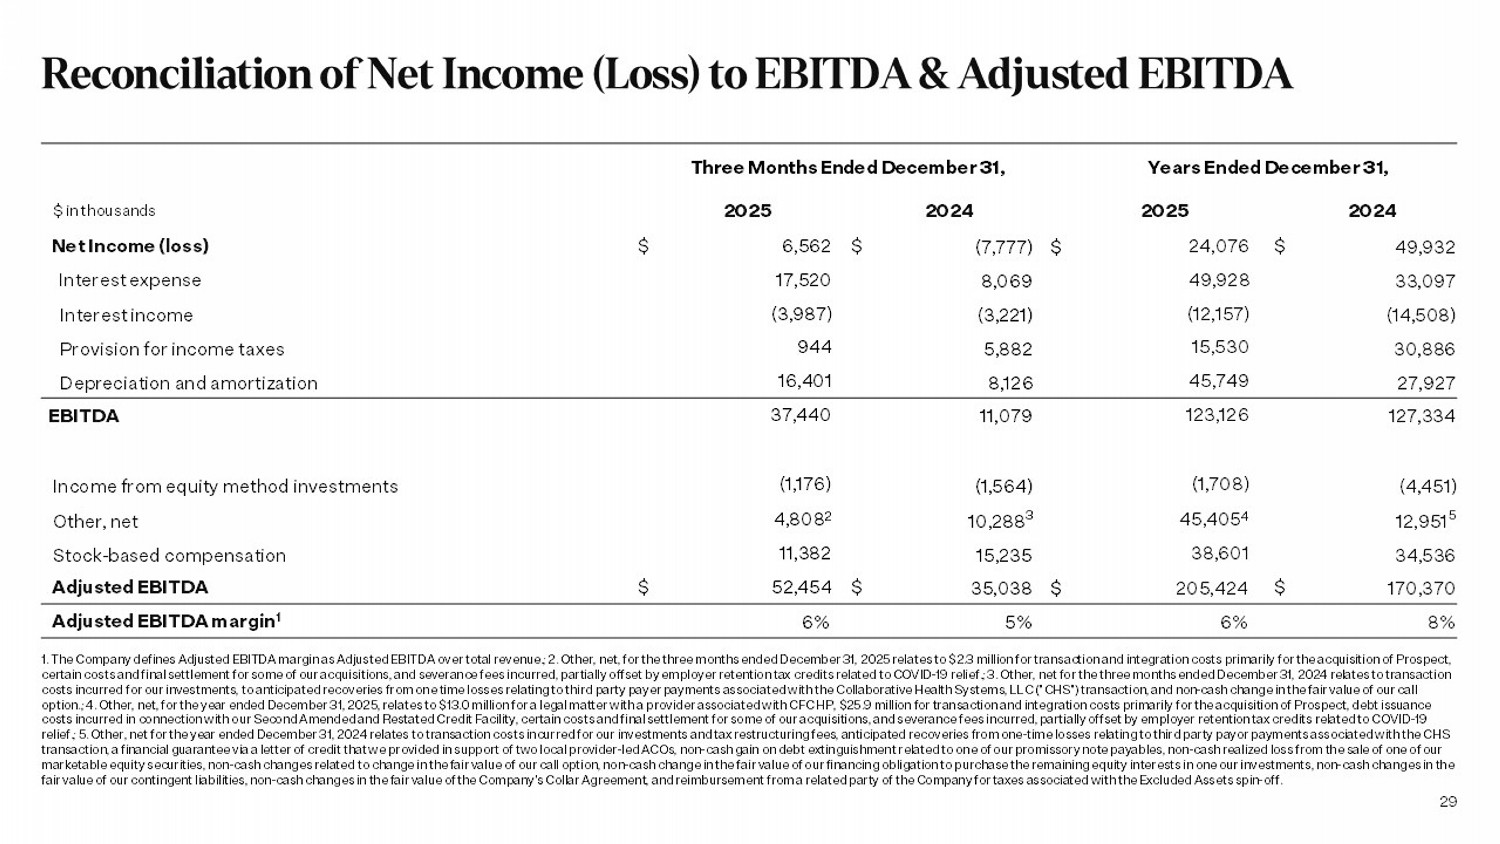
29 Years Ended December 31, Three Months Ended December 31, 2024 2025 2024 2025 $ in thousands 49,932 $ 24,076 $ (7,777) $ 6,562 $ Net Income (loss) 33,097 49,928 8,069 17,520 Interest expense (14,508) (12,157) (3,221) (3,987) Interest income 30,886 15,530 5,882 944 Provision for income taxes 27,927 45,749 8,126 16,401 Depreciation and amortization 127,334 123,126 11,079 37,440 EBITDA (4,451) (1,708) (1,564) (1,176) Income from equity method investments 12,951 5 45,405 4 10,288 3 4,808 2 Other, net 34,536 38,601 15,235 11,382 Stock - based compensation 170,370 $ 205,424 $ 35,038 $ 52,454 $ Adjusted EBITDA 8% 6% 5% 6% Adjusted EBITDA margin 1 1. The Company defines Adjusted EBITDA margin as Adjusted EBITDA over total revenue.; 2. Other, net, for the three months end ed December 31, 2025 relates to $2.3 million for transaction and integration costs primarily for the acquisition of Prospect, certain costs and final settlement for some of our acquisitions, and severance fees incurred, partially offset by employer re ten tion tax credits related to COVID - 19 relief.; 3. Other, net for the three months ended December 31, 2024 relates to transaction costs incurred for our investments, to anticipated recoveries from one time losses relating to third party payer payments ass oci ated with the Collaborative Health Systems, LLC ("CHS") transaction, and non - cash change in the fair value of our call option.; 4. Other, net, for the year ended December 31, 2025, relates to $13.0 million for a legal matter with a provider ass oci ated with CFC HP, $25.9 million for transaction and integration costs primarily for the acquisition of Prospect, debt issuanc e costs incurred in connection with our Second Amended and Restated Credit Facility, certain costs and final settlement for som e o f our acquisitions, and severance fees incurred, partially offset by employer retention tax credits related to COVID - 19 relief.; 5. Other, net for the year ended December 31, 2024 relates to transaction costs incurred for our investments and tax re structuring fees, anticipated recoveries from one - time losses relating to third party payor payments associated with the CHS transaction, a financial guarantee via a letter of credit that we provided in support of two local provider - led ACOs, non - cash g ain on debt extinguishment related to one of our promissory note payables, non - cash realized loss from the sale of one of our marketable equity securities, non - cash changes related to change in the fair value of our call option, non - cash change in the fa ir value of our financing obligation to purchase the remaining equity interests in one our investments, non - cash changes in the fair value of our contingent liabilities, non - cash changes in the fair value of the Company's Collar Agreement, and reimbursemen t from a related party of the Company for taxes associated with the Excluded Assets spin - off. Reconciliation of Net Income (Loss) to EBITDA & Adjusted EBITDA
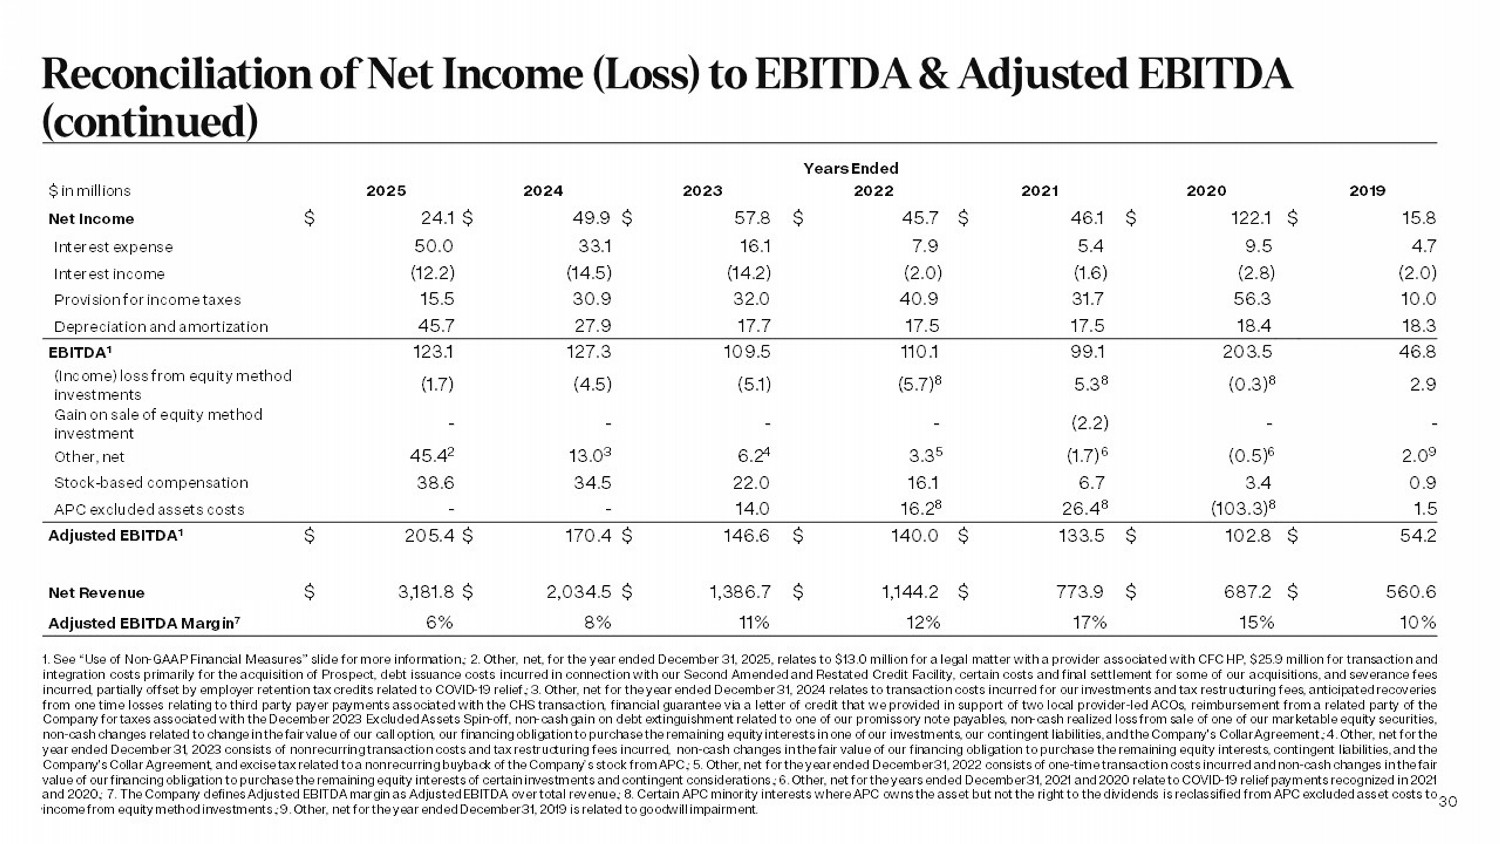
30 Years Ended 2019 2020 2021 2022 2023 2024 2025 $ in millions 15.8 $ 122.1 $ 46.1 $ 45.7 $ 57.8 $ 49.9 $ 24.1 $ Net Income 4.7 9.5 5.4 7.9 16.1 33.1 50.0 Interest expense (2.0) (2.8) (1.6) (2.0) (14.2) (14.5) (12.2) Interest income 10.0 56.3 31.7 40.9 32.0 30.9 15.5 Provision for income taxes 18.3 18.4 17.5 17.5 17.7 27.9 45.7 Depreciation and amortization 46.8 203.5 99.1 110.1 109.5 127.3 123.1 EBITDA 1 2.9 ( 0.3) 8 5.3 8 ( 5.7) 8 (5.1) (4.5) (1.7) (Income) loss from equity method investments - - (2.2) - - - - Gain on sale of equity method investment 2.0 9 (0.5) 6 (1.7) 6 3.3 5 6.2 4 13.0 3 45.4 2 Other, net 0.9 3.4 6.7 16.1 22.0 34.5 38.6 Stock - based compensation 1.5 (103.3) 8 26.4 8 16.2 8 14.0 - - APC excluded assets costs 54.2 $ 102.8 $ 133.5 $ 140.0 $ 146.6 $ 170.4 $ 205.4 $ Adjusted EBITDA 1 560.6 $ 687.2 $ 773.9 $ 1,144.2 $ 1,386.7 $ 2,034.5 $ 3,181.8 $ Net Revenue 10% 15% 17% 12% 11% 8% 6% Adjusted EBITDA Margin 7 1 . See “Use of Non - GAAP Financial Measures” slide for more information .; 2 . Other, net, for the year ended December 31 , 2025 , relates to $ 13 . 0 million for a legal matter with a provider associated with CFC HP, $ 25 . 9 million for transaction and integration costs primarily for the acquisition of Prospect, debt issuance costs incurred in connection with our Second Amended and Restated Credit Facility, certain costs and final settlement for some of our acquisitions, and severance fees incurred, partially offset by employer retention tax credits related to COVID - 19 relief .; 3 . Other, net for the year ended December 31 , 2024 relates to transaction costs incurred for our investments and tax restructuring fees, anticipated recoveries from one time losses relating to third party payer payments associated with the CHS transaction, financial guarantee via a letter of credit that we provided in support of two local provider - led ACOs, reimbursement from a related party of the Company for taxes associated with the December 2023 Excluded Assets Spin - off, non - cash gain on debt extinguishment related to one of our promissory note payables, non - cash realized loss from sale of one of our marketable equity securities, non - cash changes related to change in the fair value of our call option, our financing obligation to purchase the remaining equity interests in one of our investments, our contingent liabilities, and the Company's Collar Agreement .; 4 . Other, net for the year ended December 31 , 2023 consists of nonrecurring transaction costs and tax restructuring fees incurred, non - cash changes in the fair value of our financing obligation to purchase the remaining equity interests, contingent liabilities, and the Company's Collar Agreement, and excise tax related to a nonrecurring buyback of the Company’s stock from APC .; 5 . Other, net for the year ended December 31 , 2022 consists of one - time transaction costs incurred and non - cash changes in the fair value of our financing obligation to purchase the remaining equity interests of certain investments and contingent considerations .; 6 . Other, net for the years ended December 31 , 2021 and 2020 relate to COVID - 19 relief payments recognized in 2021 and 2020 .; 7 . The Company defines Adjusted EBITDA margin as Adjusted EBITDA over total revenue .; 8 . Certain APC minority interests where APC owns the asset but not the right to the dividends is reclassified from APC excluded asset costs to income from equity method investments .; 9 . Other, net for the year ended December 31 , 2019 is related to goodwill impairment . Reconciliation of Net Income (Loss) to EBITDA & Adjusted EBITDA (continued)
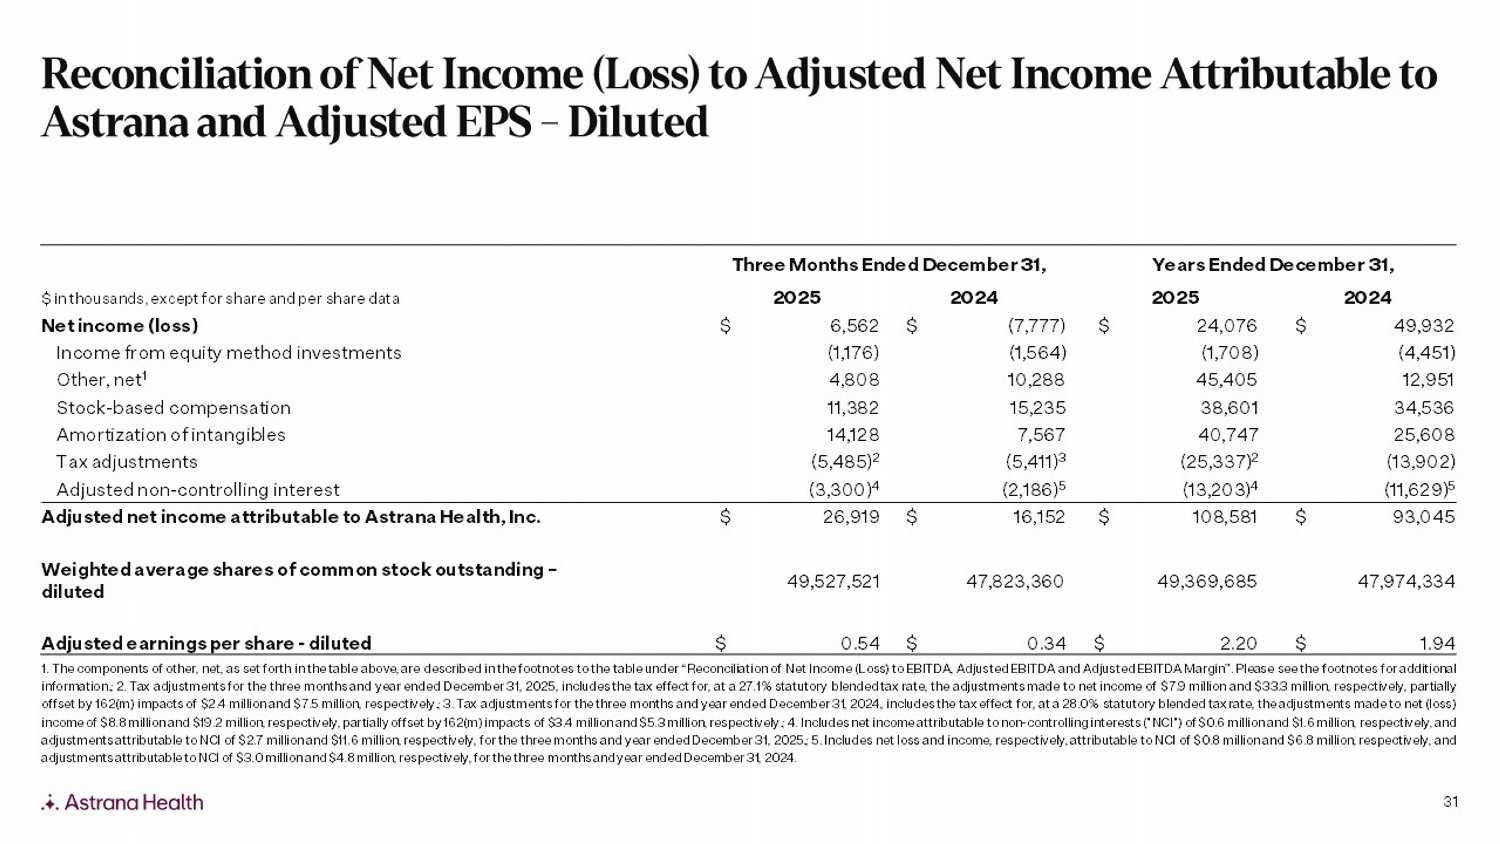
31 Years Ended December 31, Three Months Ended December 31, 2024 2025 2024 2025 $ in thousands, except for share and per share data 49,932 $ 24,076 $ (7,777) $ 6,562 $ Net income (loss) (4,451) (1,708) (1,564) (1,176) Income from equity method investments 12,951 45,405 10,288 4,808 Other, net 1 34,536 38,601 15,235 11,382 Stock - based compensation 25,608 40,747 7,567 14,128 Amortization of intangibles (13,902) (25,337) 2 (5,411) 3 (5,485) 2 Tax adjustments (11,629) 5 (13,203) 4 (2,186) 5 (3,300) 4 Adjusted non - controlling interest 93,045 $ 108,581 $ 16,152 $ 26,919 $ Adjusted net income attributable to Astrana Health, Inc. 47,974,334 49,369,685 47,823,360 49,527,521 Weighted average shares of common stock outstanding – diluted 1.94 $ 2.20 $ 0.34 $ 0.54 $ Adjusted earnings per share - diluted 1 . The components of other, net, as set forth in the table above, are described in the footnotes to the table under “Reconciliation of Net Income (Loss) to EBITDA, Adjusted EBITDA and Adjusted EBITDA Margin” . Please see the footnotes for additional information .; 2 . Tax adjustments for the three months and year ended December 31 , 2025 , includes the tax effect for, at a 27 . 1 % statutory blended tax rate, the adjustments made to net income of $ 7 . 9 million and $ 33 . 3 million, respectively, partially offset by 162 (m) impacts of $ 2 . 4 million and $ 7 . 5 million, respectively .; 3 . Tax adjustments for the three months and year ended December 31 , 2024 , includes the tax effect for, at a 28 . 0 % statutory blended tax rate, the adjustments made to net (loss) income of $ 8 . 8 million and $ 19 . 2 million, respectively, partially offset by 162 (m) impacts of $ 3 . 4 million and $ 5 . 3 million, respectively .; 4 . Includes net income attributable to non - controlling interests ("NCI") of $ 0 . 6 million and $ 1 . 6 million, respectively, and adjustments attributable to NCI of $ 2 . 7 million and $ 11 . 6 million, respectively, for the three months and year ended December 31 , 2025 .; 5 . Includes net loss and income, respectively, attributable to NCI of $ 0 . 8 million and $ 6 . 8 million, respectively, and adjustments attributable to NCI of $ 3 . 0 million and $ 4 . 8 million, respectively, for the three months and year ended December 31 , 2024 . Reconciliation of Net Income (Loss) to Adjusted Net Income Attributable to Astrana and Adjusted EPS - Diluted
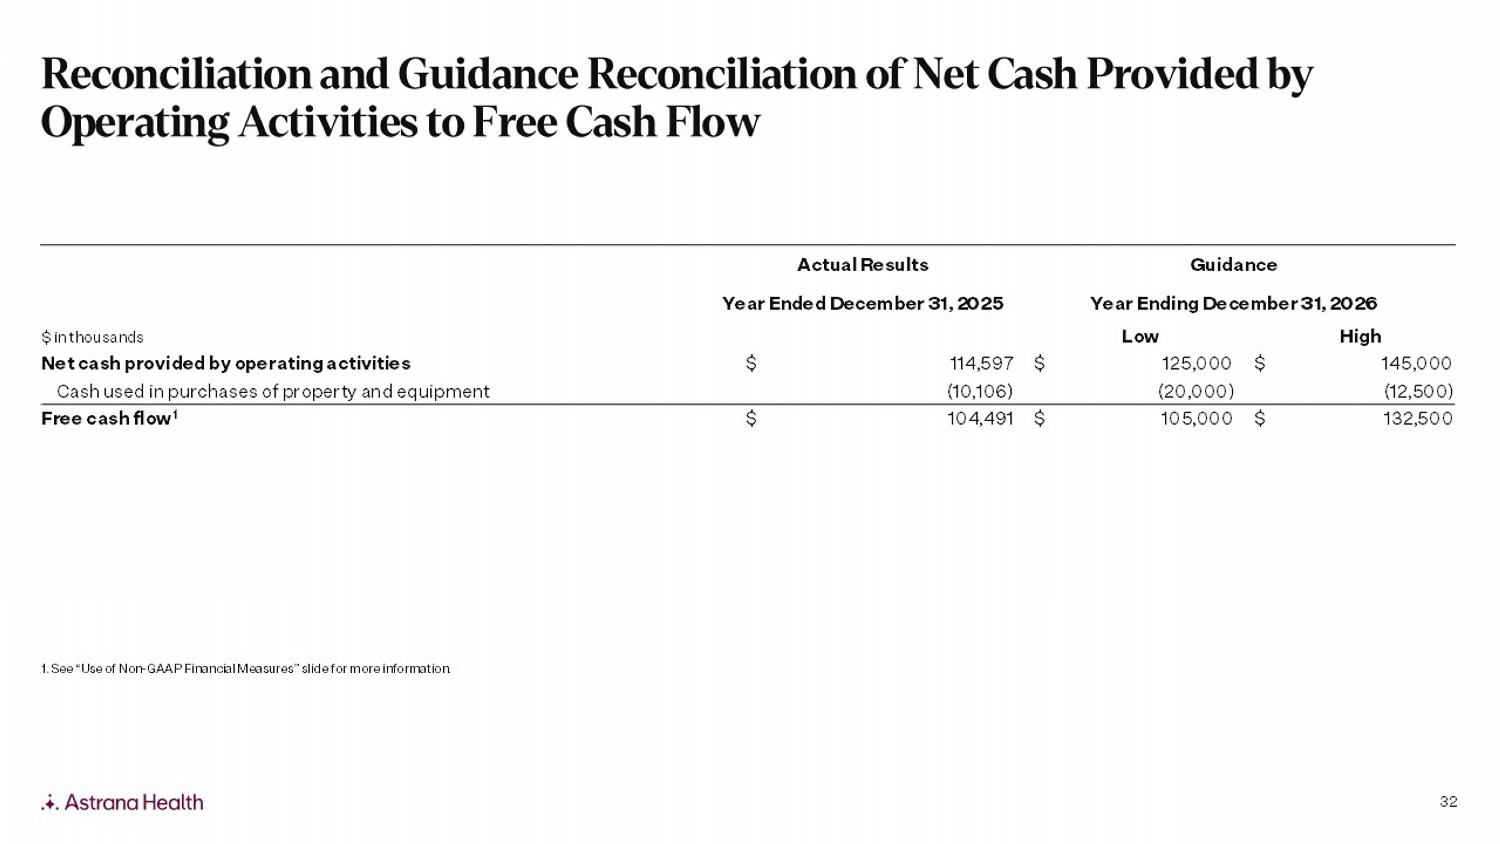
32 Guidance Actual Results Year Ending December 31, 2026 Year Ended December 31, 2025 High Low $ in thousands 145,000 $ 125,000 $ 114,597 $ Net cash provided by operating activities (12,500) (20,000) (10,106) Cash used in purchases of property and equipment 132,500 $ 105,000 $ 104,491 $ Free cash flow 1 1 . See “Use of Non - GAAP Financial Measures” slide for more information . Reconciliation and Guidance Reconciliation of Net Cash Provided by Operating Activities to Free Cash Flow
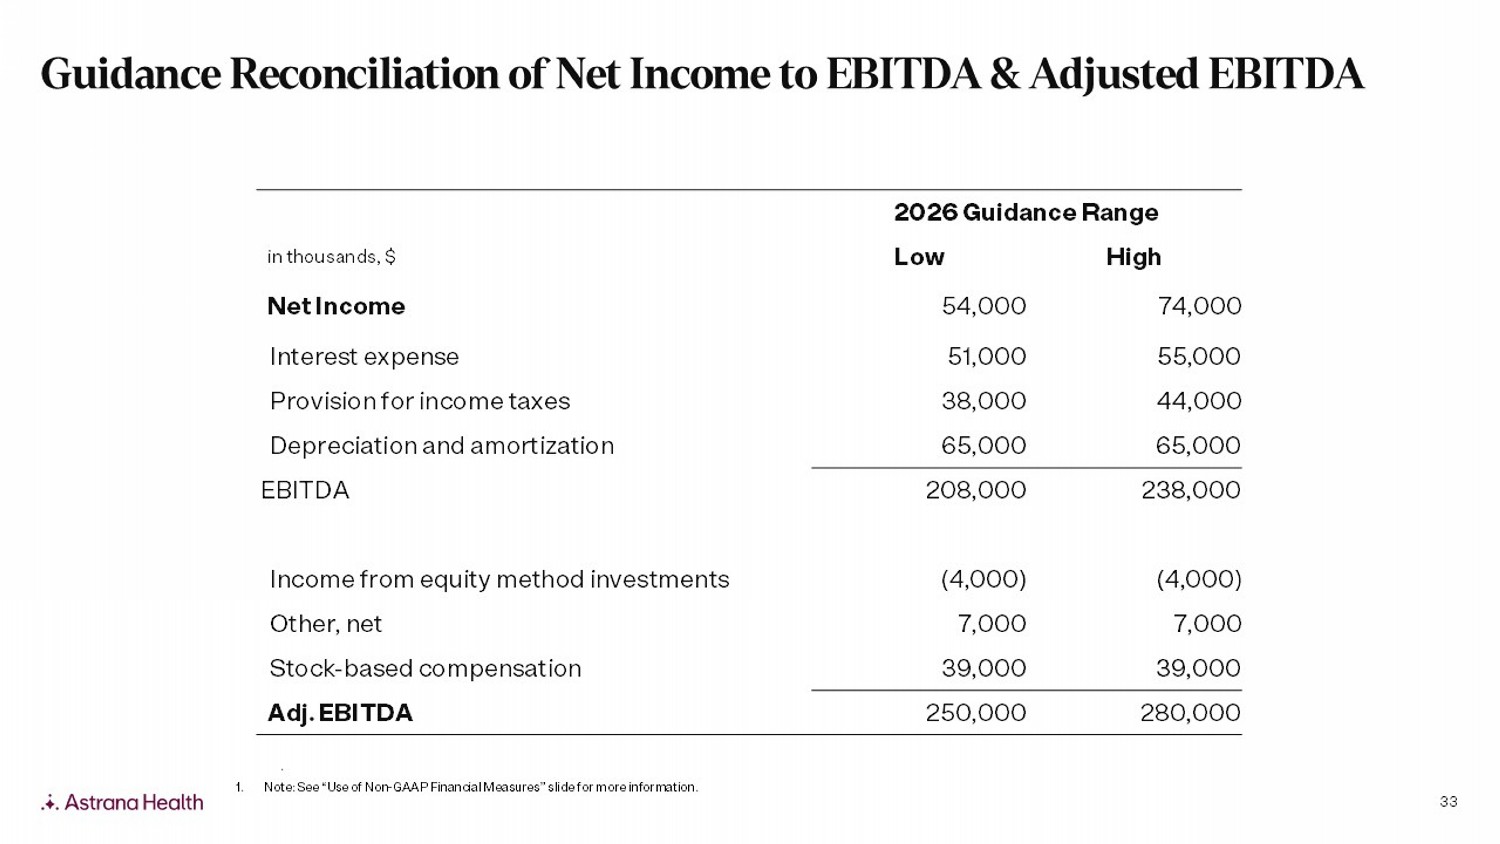
33 . 2026 Guidance Range High Low in thousands, $ 74,000 54,000 Net Income 55,000 51,000 Interest expense 44,000 38,000 Provision for income taxes 65,000 65,000 Depreciation and amortization 238,000 208,000 EBITDA (4,000) (4,000) Income from equity method investments 7,000 7,000 Other, net 39,000 39,000 Stock - based compensation 280,000 250,000 Adj. EBITDA 1. Note: See “Use of Non - GAAP Financial Measures” slide for more information. Guidance Reconciliation of Net Income to EBITDA & Adjusted EBITDA

Investor Relations Carolyne Sohn investors@astranahealth.com