Please wait
Dear Stockholders,
| | | | | | | | | | | | | | |
| | Reflecting on fiscal year 2025, this year was really about building for a future we know is coming: faster, more connected, and more demanding than ever before.
While others stick to fixed courses, we’ve redesigned how we operate so we can turn on a dime, bringing the right expertise to clients exactly when and where they need it.
We live in a time when organizations can’t afford to stand still. The challenge isn’t finding talent. It’s finding the right talent, right now, for the moments that matter most. This is the new reality, and it plays directly to RGP’s strengths. |
|
|
The Shift We’re Leading
The professional services industry is undergoing the same kind of shift technology went through when cloud-based replaced on-premise software. Companies no longer want big, inflexible contracts that assume the future will look like the past. They want speed. Precision. Specialists who can plug in instantly, deliver, and move on, leaving the organization stronger.
We’re leading that shift with a model that blends:
▪On-Demand Talent for immediate needs
▪Consulting Teams for transformational work
▪Outsourced Services powered by AI and human expertise for startups, spinouts, and carveouts that need to invest in growth, not back-office complexity
▪Global Reach to serve multinational clients anywhere
Together, these create a one-stop, flexible experience for solving the most complex business problems.
Where We’re Focused
Through strategic acquisitions and organizational realignment, we’ve honed in on two areas where the need and opportunity are robust. These will serve as the core growth engines for RGP’s future:
(1)The Office of the CFO: Our recent research shows nearly 70% of CFOs expect their organization’s financial health to remain stable, and 60% anticipate a stronger outlook over the next year. But optimism doesn’t erase risk. Concerns over tariffs, supply chain fragility, and geopolitical volatility remain high. In this environment, CFOs need partners who combine
financial expertise with flexibility. We’ll help finance leaders modernize ERP and cloud finance systems, enhance financial planning and analysis, streamline the accounting close process, ensure SEC compliance, integrate acquisitions, and manage risk, all while keeping their organizations resilient in uncertain markets.
(2)Digital, Data and Cloud: Through our acquisitions of CloudGo and Reference Point, we’ve expanded our capabilities in cloud platform implementation, data strategy, analytics, AI adoption, and enterprise digital transformation. We’ll continue to help clients modernize systems, drive employee engagement in system investments, reveal the value hidden in their data, and scale technology to meet evolving market demands.
The Year in Perspective
We faced a tough market in 2025, and we made deliberate choices to adapt. We evolved and streamlined our consulting practices, improved average bill rate, reduced costs without cutting capability, modernized our technology stack, and maintained a strong balance sheet. We will continue to improve and align our cost structure to serve our business today and to position ourselves for scale when demand accelerates again.
We also earned recognition from Forbes and U.S. News & World Report as top employers and consulting firms, and, most importantly, from our clients, as we’ve served 88% of the Fortune 100 as of May 2025. That’s trust built over years, and it’s what gives us the confidence in our future.
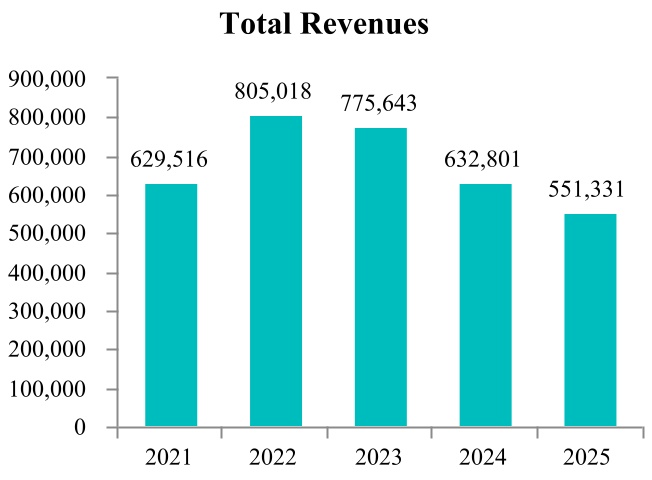
Fiscal 2025 Key Highlights & Financial Performance Amid Market Adversity
▪Revenue: $551.3 million, down ~13% year-over-year (–13.9% constant currency), reflecting continued macroeconomic pressure.
▪Gross Margin: 37.6%, reflecting lower utilization in a slower demand environment and deleveraging of cost of services.
▪Net Loss: $191.8 million primarily attributable to non-cash goodwill impairments of $194.4 million, reflecting a decline in our market capitalization amid uncertain market recovery.
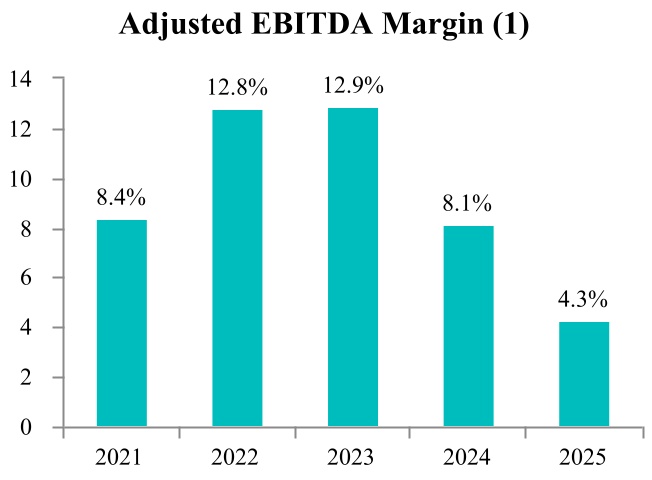
▪Adjusted EBITDA: $23.5 million (4.3% margin), reflecting a softer topline, mitigated by significant progress in cost structure redesign given market disruptions.
▪Cash Flow from Operations: Generated $18.9 million in cash flow from operations.
▪Client Retention: Retained 78% of our top 100 clients.
▪Key Accomplishments: Despite these challenges, we completed the sale of our Irvine office (gain recognized), modernized our technology stack, including new ERP systems, and secured a new $50 million credit facility in July 2025 – actions that strengthen financial flexibility.
Looking Ahead
While fiscal 2025 presented headwinds, our investments have laid a stronger foundation for agile, scalable, and profitable growth. We remain committed to:
▪Deepening client partnerships through our diversified services platform.
▪Expanding our high-growth solutions in the Office of the CFO and Digital, Data, and Cloud.
▪Leveraging value-based pricing and expanding cross-sell opportunities.
▪Continuing disciplined cost management while investing in innovation.
With a unified brand, improving cost structure, and solutions portfolio aligned to high-demand areas, RGP is well-positioned to deliver sustainable shareholder value.
In Closing
Fiscal 2025 tested our resilience and adaptability. Yet, we remain confident. Our realigned structure, strategic acquisitions, focused solutions relevant for today’s business needs, strong client base, expanded footprint and technology upgrade provide clear advantages. We believe RGP is well-positioned to navigate the current uncertainty and emerge stronger – delivering value to shareholders, clients and our people alike.
Thank you for your continued support.
Best,
| | | | | | | | | | | |
| | | |
| | | |
| | | |
| Kate W. Duchene Chief Executive Officer | | |
| | |
| | | |
RESOURCES CONNECTION, INC.
TABLE OF CONTENTS
rgp. 2025 Annual Report — 1
FORWARD LOOKING STATEMENTS
This Annual Report, including information incorporated herein by reference, contains “forward-looking statements” within the meaning of Section 27A of the Securities Act of 1933, as amended, and Section 21E of the Securities Exchange Act of 1934, as amended. These statements relate to expectations concerning matters that are not historical facts. Such forward-looking statements may be identified by words such as “anticipates,” “believes,” “can,” “continue,” “could,” “estimates,” “expects,” “forecast,” “future,” “intends,” “may,” “plans,” “potential,” “predicts,” “remain,” “should,” “strategy,” or “will” or the negative of these terms or other comparable terminology. In this Annual Report, such statements include statements regarding our expectations regarding our expected recovery and growth and operational plans. Such statements and all phases of the Company’s operations are subject to known and unknown risks, uncertainties and other factors that could cause our actual results, levels of activity, performance or achievements and those of our industry to differ materially from those expressed or implied by these forward-looking statements. Risks and uncertainties include, but are not limited to, the following: risks related to an economic downturn or deterioration of general macroeconomic conditions, potential adverse effects to our and our clients’ liquidity and financial performances from bank failures or other events affecting financial institutions, the highly competitive nature of the market for professional services, risks related to the loss of a significant number of our consultants, or an inability to attract and retain new consultants, the possible impact on our business from the loss of the services of one or more key members of our senior management or key sales professionals, risks related to potential significant increases in wages or payroll-related costs, our ability to secure new projects from clients, our ability to achieve or maintain a suitable pay/bill ratio, our ability to compete effectively in the competitive bidding process, risks related to unfavorable provisions in our contracts which may permit our clients to, among other things, terminate the contracts partially or completely at any time prior to completion, our ability to realize the level of benefit that we expect from our restructuring initiatives, risks that our recent digital expansion and technology transformation efforts may not be successful, our ability to build an efficient support structure as our business continues to grow and transform, our ability to grow our business, manage our growth or sustain our current business, our ability to serve clients internationally, additional operational challenges from our international activities, possible disruption of our business from our past and future acquisitions, the possibility that our recent rebranding efforts may not be successful, our potential inability to adequately protect our intellectual property rights, risks that our computer hardware and software and telecommunications systems are damaged, breached or interrupted, risks related to the failure to comply with data privacy laws and regulations and the adverse effect it may have on our reputation, results of operations or financial condition, our ability to comply with governmental, regulatory and legal requirements and company policies, the possible legal liability for damages resulting from the performance of projects by our consultants or for our clients’ mistreatment of our personnel, risks arising from changes in applicable tax laws or adverse results in tax audits or interpretations, the possible adverse effect on our business model from the reclassification of our independent contractors by foreign tax and regulatory authorities, the possible difficulty for a third party to acquire us and resulting depression of our stock price, the operating and financial restrictions from our credit facility, risks related to the variable rate of interest in our credit facility, the possible impact of activist shareholders, the possibility that we are unable to or elect not to pay our quarterly dividend payment, and other factors and uncertainties as are identified in our most recent Annual Report on Form 10-K for the year ended May 31, 2025, which was filed on July 28, 2025, and our other public filings made with the Securities and Exchange Commission (File No. 0-32113). Additional risks and uncertainties not presently known to us or that we currently deem immaterial may also affect our business or operating results. Readers are cautioned not to place undue reliance on these forward-looking statements, which speak only as of the date hereof. The Company does not intend, and undertakes no obligation, to update the forward-looking statements in this Annual Report to reflect events or circumstances after the date hereof or to reflect the occurrence of unanticipated events, unless required by law to do so.
2 — rgp. 2025 Annual Report
FINANCIAL HIGHLIGHTS
| | | | | | | | | | | | | | |
| | Years Ended |
| (In thousands, except per share data) | | May 31, 2025 | | May 25, 2024 |
| Financial Results: | | | | |
| Revenue ................................................................................................................ | | $ | 551,331 | | $ | 632,801 |
| Gross margin ........................................................................................................ | | 207,424 | | | 246,068 | |
| Restructuring charges............................................................................................ | | 5,061 | | | 4,087 | |
| Operating income ................................................................................................. | | (196,757) | | | 28,776 | |
| Net income ............................................................................................................ | | (191,780) | | | 21,034 | |
| Net Income per common share - Diluted ............................................................. | | $ | (5.80) | | $ | 0.62 |
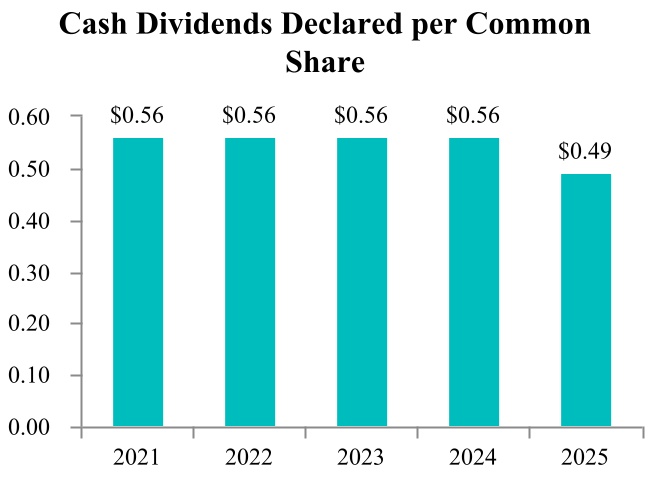
| Cash dividends declared per common share......................................................... | | $ | 0.49 | | $ | 0.56 |
| | | | |
| | | May 31, 2025 | | May 25, 2024 |
| Balance Sheet Data: | | | | |
| Cash, cash equivalents …..................................................................................... | | $ | 86,147 | | | $ | 108,892 | |
| Trade accounts receivable, net.............................................................................. | | 99,210 | | | 108,515 | |
| Total assets............................................................................................................ | | 304,688 | | | 510,914 | |
| Total Stockholders’ equity.................................................................................... | | 207,081 | | | 418,763 | |
| | | | |
| | | | |
| | | May 31, 2025 | | May 25, 2024 |
| Cash Flow Data: | | | | |
| Cash flows from operating activities..................................................................... | | $ | 18,899 | | | $ | 21,919 | |
| Cash flows from investing activities..................................................................... | | (13,571) | | | (8,554) | |
| Cash flows from financing activities..................................................................... | | (27,731) | | | (20,709) | |
rgp. 2025 Annual Report — 3
(1)Adjusted EBITDA is a key performance indicator we use to assess our financial and operating performance. We define Adjusted EBITDA as net income (loss) before amortization expense, depreciation expense, interest and income taxes, excluding stock-based compensation expense, amortized Enterprise Resource Planning (“ERP”) system costs, technology transformation costs, goodwill impairment, acquisition costs, gain on sale of assets, restructuring costs, and contingent consideration adjustments. Adjusted EBITDA is a non-GAAP financial measure. A non-GAAP financial measure is defined as a numerical measure of a company’s financial performance that (i) excludes amounts, or is subject to adjustments that have the effect of excluding amounts, that are included in the comparable measure calculated and presented in accordance with generally accepted accounting principles (“GAAP”) in the Consolidated Statements of Operations; or (ii) includes amounts, or is subject to adjustments that have the effect of including amounts, that are excluded from the comparable GAAP measure so calculated and presented. Adjusted EBITDA Margin is calculated by dividing Adjusted EBITDA by revenue. For further discussion of Adjusted EBITDA and Adjusted EBITDA margin, see page 23.
4 — rgp. 2025 Annual Report
SERVICES AND STRATEGY OF RESOURCES GLOBAL PROFESSIONALS
Resources Global Professionals (“RGP”) is a professional services firm based in Dallas, Texas (with offices worldwide) focused on delivering flexible and high impact solutions to businesses through strategic and execution consulting, on-demand resourcing, and fully outsourcing services. As a next-generation human capital partner for our clients, we are a trusted partner to the C suite, specializing in navigating complex business challenges typically precipitated by business transformation, strategic transactions, or regulatory compliance. Our engagements are designed to leverage a combination of bench and agile talent that are highly experienced to deliver practical solutions and more impactful results that power our clients’, employees’ and partners’ success.
We attract top-caliber professionals with in-demand skill sets who seek a workplace environment characterized by choice and control, collaboration and human connection. The trends in today’s marketplace favor flexibility and agility as businesses confront transformation pressures and skilled labor shortages even in the face of protracted economic uncertainty. Our client engagement and talent delivery model offer speed and agility, strongly positioning us to help our clients transform their businesses and workplaces.
We serve more than 1,600 clients around the world with approximately 3,100 professionals collectively engaged from 41 physical practice offices and multiple virtual offices. Headquartered in Dallas, Texas, we are proud to have served 88% of the Fortune 100 as of May 2025.
Business Segments
During the first quarter of fiscal 2025, the Company reorganized the Company’s business by forming multiple discrete operational business units. To align the new operating model and financial reporting, the Company made management organizational changes and implemented new reporting modules and processes to provide discrete information to manage the business. During the first quarter of fiscal 2025, the Company completed its assessment of the Company's operating segments and identified the following newly defined operating segments:
•On-Demand Talent – this segment provides businesses with a go-to source for bringing in experts to fill resource gaps when they need them.
•Consulting – this segment drives transformation across people, processes and technology across domain areas including accounting and finance, technology and digital, risk and compliance and supply chain transformation.
•Europe & Asia Pacific – is a geographically defined segment that offers both on-demand and consulting services to clients throughout Europe and Asia Pacific.
•Outsourced Services – operating under the Countsy by RGPTM brand, this segment offers finance, accounting and human resources (“HR”) services provided to startups, spinouts and scale-up enterprises, utilizing a technology platform and fractional team.
•Sitrick – a crisis communications and public relations firm that provides corporate, financial, transactional and crisis communication and management services.
Each of these segments reports through a separate segment manager to the Company’s Chief Executive Officer and Chief Operating Officer, who are collectively designated as the Company's Chief Operating Decision Maker (“CODM”) for segment reporting purposes. The Company's reportable segments are comprised of On-Demand Talent, Consulting, Europe & Asia Pacific, and Outsourced Services. Sitrick does not individually meet the quantitative thresholds to qualify as a reportable segment. Therefore, Sitrick is disclosed under the “All Other” segment. Each of these segments represents a reporting unit for the purposes of assessing goodwill for impairment.
rgp. 2025 Annual Report — 5
Industry Background and Trends
Changing Market for Project- or Initiative-Based Professional Services
Our services respond to what we believe is a permanent marketplace shift: namely, organizations are increasingly choosing to address their workforce needs in more flexible ways. Permanent professional personnel positions are being reduced as organizations engage agile talent for project initiatives and transformation work.
Organizations use a mix of alternative resources to execute initiatives and projects. Some companies rely solely on their own employees who may lack the requisite time, experience or skills for specific projects. Other companies may outsource entire projects to consulting firms, which provides them access to the expertise of the firm but often entails significant cost, insufficient management control of the project and a lack of ultimate ownership at project completion. As a more cost-efficient alternative, companies sometimes use temporary employees from traditional and internet-based staffing firms, although these employees may be less experienced or less qualified than employees from professional services firms. Finally, companies can supplement their internal resources with employees from agile consulting or other traditional professional services firms, like RGP. The use of project consultants as a viable alternative to traditional accounting, consulting, and law firms allows companies to:
•Strategically access specialized skills and expertise for projects of set durations;
•Engage the very best expert talent across regions and geographies;
•Be nimble and mobilize quickly;
•Blend independent and fresh points of view;
•Effectively supplement internal resources;
•Increase labor flexibility; and
•Reduce overall hiring, training and termination costs.
Supply of Project Consultants
Based on our review of labor market dynamics and discussions with our consultants, we believe that there is sustained demand among professionals seeking to work on an agile basis due to a desire for:
•More flexible hours and work arrangements, coupled with an evolving professional culture that offers competitive wages and benefits;
•The ability to learn and contribute to different environments and collaborate with diverse team members;
•Challenging engagements that advance their careers, develop their skills and add to their portfolio of experience;
•A work environment that provides a diversity of, and more control over, client engagements; and
•Alternative employment opportunities throughout the world.
The traditional employment options available to professionals may fulfill some, but not all, of an individual’s career objectives. A professional working for a Big Four firm or a consulting firm may receive challenging assignments and training; however, he or she may encounter a career path with less choice and less flexible hours, extensive travel demands and limited control over work engagements. On the other hand, a professional who works as an independent contractor assumes the ongoing burden of sourcing assignments and significant administrative obligations, including potential tax and legal issues.
RGP’s Solution
We believe RGP is ideally positioned to capitalize on the confluence of the industry shifts described above. We believe, based on discussions with our clients, that RGP provides the agility companies desire in today’s highly competitive and quickly evolving business environment. Our solution offers the following elements:
•A relationship-oriented and collaborative approach to client service;
•Flexible engagement models to meet clients where they need us, whether it's embedded expertise, strategic and execution oriented consulting or fully outsourced solutions;
•A dedicated talent acquisition and management team adept at developing, managing and deploying a project-based workforce;
6 — rgp. 2025 Annual Report
•Deep functional and/or technical experts who can assess clients’ project needs and customize solutions to meet those needs;
•Highly qualified and pedigreed consultants with the requisite expertise, experience and points of view;
•Competitive rates on an hourly basis as well as on a project basis; and
•Significant client control of their projects with effective knowledge transfer and change management.
RGP’s Strategic Priorities
Our Business Strategy
We are dedicated to serving our clients with flexible engagement models and highly qualified and experienced talent in support of projects and initiatives in a broad array of functional areas, including:
| | | | | |
| |
Transactions •Integration and divestitures •Bankruptcy/restructuring •Going public readiness and support •Financial process optimization •System implementation | Regulations •Accounting regulations •Internal audit and compliance •Data privacy and security •Healthcare compliance •Regulatory compliance |
Transformations •Finance transformation •Digital transformation •Supply chain management •Cloud migration •Data design and analytics | |
Our objective is to build and maintain RGP’s reputation as the premier provider of project execution services for companies facing transformation, change and compliance challenges. We have developed the following business strategies to achieve our objectives:
•Hire and retain highly qualified, experienced consultants. We believe our highly qualified, experienced consultants provide us with a distinct competitive advantage. Therefore, one of our top priorities is to continue to attract and retain high-caliber consultants who are committed to serving clients and solving their problems. We believe we have been successful in attracting and retaining qualified professionals by providing interesting work assignments within a blue-chip client base, competitive compensation and benefits, and continuing professional development and learning opportunities, as well as membership in an exclusive community of like-minded professionals, while offering flexible work schedules and more control over choosing client engagements.
•Maintain our distinctive culture. Our corporate culture is a core pillar of our business strategy, and we believe it has been a significant component of our success. See “Human Capital Management” below for further discussions about our culture.
•Deepen our consulting capabilities and establish consultative relationships with clients. We emphasize a relationship-oriented approach to business rather than a transaction-oriented or assignment-oriented approach. We believe the professional services experience of our management and consultants enables us to understand the needs of our clients and deliver an integrated, relationship-based approach to meeting those needs. Client relationships and needs are addressed from a client-centric, not geographic, perspective. Our team regularly meets with our existing and prospective clients to understand their business issues and identify tailored solutions to meet the clients’ objectives, whether it’s resourcing with highly skilled experts or strategic consulting with RGP's specific points of view. We believe that by establishing relationships with our clients to solve their professional service needs, we are more likely to identify new opportunities to serve them. The strength and depth of our client relationships is demonstrated by the 78% retention rate of our top 100 clients over the last five fiscal years.
rgp. 2025 Annual Report — 7
•Build the RGP brand. We have historically built our brand through the consistent and reliable delivery of high-quality, value-added services to our clients as well as a significant referral network of approximately 2,400 consultants and approximately 700 management and administrative employees as of May 31, 2025. In recent years, we have invested in global, regional and local marketing and brand building and activation efforts that reinforce our brand. In fiscal 2025, we launched a brand refresh to clarify what we do, who we serve, when to engage us, and the impact we deliver, reflected across our updated digital properties to enhance understanding of our full capabilities and client value. We expect to continue to engage in these efforts in the upcoming fiscal year. We rely on trademark registrations and common law trademark rights to protect the distinctiveness of our brand.
Our Growth Strategy
Since inception, our growth has been primarily organic with certain strategic acquisitions along the way that augmented our geographic presence or solution offerings. We believe we have significant opportunity for continued organic growth in our core business as well as through strategic and highly targeted acquisitions. Key elements of our growth strategy include:
•Increase penetration of existing client base. A principal component of our strategy is to secure additional work from the clients that we serve. Based on discussions with our clients, we believe that the amount of revenue that we currently generate from many of our clients represents a relatively small percentage of the total amount that they spend on professional services. We believe our clients may increase that spend as businesses adopt a more agile workforce strategy. We believe that by continuing to deliver high-quality services and by deepening our relationships with our clients, we can capture a significantly larger share of our clients’ professional services budgets. We maintain our Strategic Client Account program to serve a number of our largest clients with dedicated global account teams. We have and will continue to expand the Strategic Client Account program by taking a more client-centric and borderless approach to serving these clients. In addition to serving our largest clients with a differentiated focus, we also segment our clients by industry verticals. We believe this focus enhances our opportunity to develop in-depth knowledge of these clients’ needs and the ability to increase the scope and size of projects with those clients. The Strategic Client Account and Industry Vertical programs have been key drivers for our revenue and business development.
•Grow our client base. We continue to focus on attracting new clients. We strive to develop new client relationships primarily by leveraging the significant contact networks of our management and consultants, through referrals from existing clients and through a dedicated business development team targeting specific clients. We believe we can continue to attract new clients by building our brand identity and reputation, supplemented by our global, regional and local marketing efforts. We anticipate our growth efforts will continue to focus on identifying strategic target accounts especially in the large and middle-market client segments and within certain focus industries, such as healthcare, technology and financial services.
•Optimize service offerings with a focus on digital capabilities. We continue to evolve and optimize our portfolio of professional service offerings, and when appropriate, consider entry into new professional service offerings. Since our founding, we have diversified our professional service offerings from a primary focus on accounting and finance to other areas in which our clients have significant needs such as digital transformation, finance transformation, accounting regulations, internal audit and compliance, healthcare compliance, integration and divestitures, and supply chain management. We continuously identify project opportunities we can market at a broader level with our talent, tools and methodologies and commercialize into solution offerings. When evaluating new or existing solution offerings to invest in, we consider (among other things) profitability, cross-marketing opportunities, buyer personas, competition, growth potential and cultural fit. We offer valuable digital consulting services, particularly related to experience and automation. With our acquisition of Reference Point in July 2024, we expanded our tailored technology and data modernization offerings to our many financial services industry clients. Customer experience and employee and workspace experience continue to be growing themes in the marketplace and within our client portfolio. The need for automation and self-service has also been an increasing trend. We will continue to focus on expanding our technology and digital consulting capabilities and their geographic reach to drive growth in the business by capturing the market demand and opportunities.
•Further our strategic brand marketing. RGP has always focused our business on project execution, which is a distinct space on the continuum between strategy consulting and interim deployment. Our business model of utilizing experienced talent to flatten the traditional consulting delivery pyramid is highly sought after in today’s market. Most clients are capable of formulating business strategy organically or with the help of a strategy firm; where they need help is in the ownership of executing the strategy. Our co-delivery ethos is focused around partnering with clients on project execution.
8 — rgp. 2025 Annual Report
Our brand marketing will continue to emphasize and accentuate our unique qualifications in this arena. We believe clear articulation and successful marketing of our distinctive market position is key to attracting and retaining both clients and talent, enabling us to drive continued growth.
•Engage in strategic acquisitions. Our acquisition strategy is to engage in targeted M&A efforts that are designed to complement our core service offerings and enhance our consulting capabilities that are in line with market demands and trends. Our acquisition of CloudGo, now integrated into our Consulting practice, expanded our ServiceNow capabilities as well as our ServiceNow footprint in the Asia Pacific region. In addition, as noted above, our acquisition of Reference Point in July 2024 has allowed us to expand our offerings to clients within the financial services industry. We will continue to seek acquisition opportunities to augment and expand the breadth and depth of our digital and other core capabilities.
Our Service Offerings
•Project Consulting Services. We partner with our people and clients to deliver value and impact, bringing our depth of experience and “sleeves up” approach to project execution. While many companies find their internal employees lack the time, experience, or skills for project execution, we seek out talent who can bring fresh ideas to drive any project to a successful conclusion.
•On-demand Talent Services. Tapping into our agile talent pool, we mobilize the right resources to build delivery teams for our consulting offerings and directly support client talent needs in today’s rapidly changing business environment. Our workforce strategy provides flexible, collaborative resources to meet our clients’ needs.
•Outsourced Services. We offer outsourced finance, accounting and HR services to startups, spinouts and scale-up enterprises, utilizing a technology platform and fractional team.
•Crisis Communication Services. Through Sitrick, we provide corporate, financial, transactional and crisis communication and management services. .
Human Capital Management
Our internal employees and consultants represent our greatest asset and operate together to provide the highest quality of service to our clients. As of May 31, 2025, we had 3,055 employees, including 687 management and administrative employees and 2,368 consultants. Our employees are not covered by any collective bargaining agreements.
Our Culture and Values
Our culture is the cornerstone of all our human capital programs. Our senior management team, the majority of whom are Big Four, management consulting and/or Fortune 500 alumni, has created a culture that combines the commitment to quality and the client service focus of a Big Four firm with the entrepreneurial energy of an innovative, high-growth company. Our culture is built upon our shared, core values of Loyalty, Integrity, Focus, Enthusiasm, Accountability and Talent, and we believe this is a key reason for our success.
We strive to earn the trust of our clients, employees, and the communities we serve by operating a legal, ethical and trustworthy manner. Our corporate policies and structure allow our employees, executives and board to lead with integrity and transparency. Along with our core values, we act in accordance with our Code of Business Conduct and Ethics (“Code of Conduct”), which sets forth the standards our employees and board members must adhere to at all times in the execution of their duties. Our Code of Conduct covers topics such as honest and candid conduct, conflicts of interest, protecting confidential information, anti-corruption, compliance with laws, rules and regulations, fair dealing, equal opportunities and non-harassment, maintaining a safe workplace, and the reporting of violations. The Code of Conduct reflects our commitment to operating in a fair, honest, responsible and ethical manner and also provides direction for reporting complaints in the event of alleged violations of our policies (including through an anonymous hotline).
rgp. 2025 Annual Report — 9
Inclusion and Belonging
At RGP, we aim to create a workplace where people feel valued and supported. We believe our success comes from building teams with unique skills, perspectives and backgrounds. We offer three employee resource groups (“ERGs”) open to all employees — Women in Leadership, Multicultural, and Interfaith ERGs—which are voluntary, employee-led groups that are dedicated to fostering an inclusive work environment.
In fiscal 2025, we continued our charitable giving matching fund with company matching contributions upwards of $100,000. Since fiscal 2021, we have supported approximately 250 unique charitable organizations with over $500,000 in contributions. We also encourage our employees' community involvement through our Spirit of Volunteerism Initiative, which supports causes important to employees. We are committed to fostering growth, community and connections both inside and outside of RGP.
Employee Wellbeing and Resilience
Employee safety and wellbeing is of paramount importance to us. Our Global Business Continuity Team continued to improve our disaster preparedness plans and implement strategies to manage the health and security of our employees, business continuity, client confidence, and excellent customer service.
To promote employee wellbeing and collaboration, we continued to offer a hybrid work policy, where employees are invited to work collaboratively with colleagues in the office and are permitted to work remotely as desired. Our goal is to help every human in our workforce maintain a positive, productive and connected work experience. We provide productivity and collaboration tools and resources for employees working remotely. During fiscal 2025, we also enhanced and promoted programs to support our employees’ physical and mental wellbeing, including the launch of a wellness app, YuLife, to all U.S. employees. This gamified app is designed to promote healthy habits by rewarding employees for walking, cycling, meditating and brain training. We continue to support physical, mental and financial wellness through communications and webinars. Our You Matter recognition program is ongoing and allows employees to share gratitude and kudos for colleagues. We also offer an Employee Assistance Program for U.S. employees and a Global Workforce Support Program for our international employees. Both programs provide resources to support personal and family health and wellbeing.
Building Strong Leaders and Talent Management
Strong “human leadership” is critical to fostering employee engagement and positioning employees to perform at their best. We offer “Leadership U” to foster leadership development, peer mentorship opportunities and to support the building and maintenance of high-performing teams. In fiscal 2025, we saw a continued and strengthened desire from employees seeking authentic, empathetic and adaptive behaviors from their leaders. For these reasons, we invest in the ongoing professional development of our employees and leaders. We designed and delivered curated programs such as “Leadership U” to onboard and acclimate employees to the business and promote personal, professional and leadership growth.
Successful talent development starts with hiring the right people. We seek to recruit and hire candidates that demonstrate skills and competencies that align with our core values and that have an aptitude to further develop and expand those capabilities. After onboarding, our Life + Learning team remains committed to providing employees with training and development opportunities to allow our employees to progress in their careers. We offer newly hired employees the opportunity to participate in our “RGP U” program to accelerate and support their integration into our organization. This program gives our new hires a connected cohort to drive a sense of belonging early in their career at RGP and offers their leaders a more efficient use of individual coaching time with new employees. We also offer “RGP U Consultant” to ensure strong connectivity and supported success in a consultant’s first year with RGP. Additionally, we offer a Sales Effectiveness curriculum focused on deepening sales and client service acumen and effectiveness.
In addition, we continued to invest in the professional development and growth of our employees as we focused on employee experience, effectiveness, upskilling and reskilling in a changing work environment. This support was focused and delivered to all employees with emphasis in the areas of leadership development, on-boarding, functional/technical learning and digital fluency. We continued to actively engage with our internal leaders by integrating wellness and leadership development topics into our quarterly senior leadership meetings. We also conducted intentional leader listening forums and mentorship programs to help guide our leaders during fiscal 2025.
10 — rgp. 2025 Annual Report
Compensation and Benefits
We provide a competitive compensation and benefits program to attract and reward our employees. In addition to salaries or hourly rates, our eligible employees, including our consultants, are offered participation in a comprehensive benefits program (based on location) including: paid time off and holidays, group medical and dental programs, a basic term life insurance program, health savings accounts, flexible spending accounts, a 401(k) retirement plan, contributions to statutory retirement programs, the 2019 Employee Stock Purchase Plan, as amended (“ESPP”), which enables employees to purchase shares of our stock at a discount, and an employee assistance program. In addition, eligible management and administrative employees may participate in annual cash incentive programs or receive stock-based awards. We also allow eligible consultants in the U.S. to maintain continuation of benefits for 90 days following the completion of a consulting project.
We utilize a Pay for Success Total Rewards Philosophy that promotes consistent and transparent practices for rewarding and incentivizing our employees and the alignment of pay results with the Company’s success. The Total Rewards Philosophy is comprised of three main components: (i) base pay, designed to reflect an individual’s value, knowledge and skills that contribute to the organization through an individual’s day-to-day job performance; (ii) short-term incentives, awarded to employees based on results delivered during the applicable fiscal year and determined by quantitative metrics, qualitative contributions, individual goals, and demonstration of company values; and (iii) long-term incentives, granted to recognize and retain employees who have strategic influence on the long-term success of the Company. As a listening organization, we continue to communicate with our people to understand what components of Total Rewards are priority for them and leverage that feedback, along with quantitative benchmarking data and affordability considerations, to continually evolve our Total Rewards offerings in a way that positions us to attract and retain top talent.
During fiscal 2025, we also continued our “You Matter” digital global employee recognition and appreciation program. You Matter includes service awards to acknowledge key milestones, including employment anniversaries and hours of service. This program provides all employees with the ability to both give and receive recognition, contributing to our culture of gratitude and excellence.
Clients
We provide our services and solutions to a diverse client base in a broad range of industries. In fiscal 2025, we served more than 1,600 clients in 32 countries. Our revenues are not concentrated with any particular client. No single client accounted for more than 10% of revenue for the 2025, 2024 or 2023 fiscal years. In fiscal 2025, our 10 largest clients accounted for approximately 22% of our revenue.
Operations
We generally provide our professional services to clients at a local level, with the oversight of our revenue team (including market or account leaders) and engagement leaders when delivering solutions on consulting projects. The revenue team in each market, in collaboration with subject matter experts in the consulting business, are responsible for new client acquisition, expanding client relationships, ensuring client satisfaction throughout engagements, coordinating services for clients on a national and international level and maintaining client relationships post-engagement. Market or account revenue leadership and their teams identify, develop and close new and existing client opportunities, often working in a coordinated effort with other markets on multi-national/multi-location proposals. While the majority of our client relationships are driven at a local market level, our Strategic Client Accounts, which are comprised of approximately 20 accounts, are led by account leaders responsible for relationships across markets and who are specifically tasked with growing our global relationships in these key accounts.
Market or account level leadership works closely with our talent management team to identify, hire and cultivate a relationship with seasoned professionals that fit our clients' needs. Our consultant recruiting efforts are regionally and nationally based, depending upon the skill sets required and our clients' preference for local talent. Recognizing the complexity of multinational client relationships, we've also utilized a hybrid approach that leverages the strengths of both local relationships and global delivery. We utilize a Borderless Talent model and seek to provide borderless solutions, anytime, anywhere, bringing the best talent to meet our clients’ business needs, based on expected outcome, not zip code. In addition, in order to meet our clients where they need us and expand our reach for in-demand talent and skill sets, we operate global delivery centers in India and the Philippines. We often blend our delivery teams with talent across the globe to maximize the impact we deliver to our clients.
rgp. 2025 Annual Report — 11
Our consulting business is organized by practice areas. Each practice has team members with deep subject matter expertise who focus on a combination of sales pursuit (in collaboration with the revenue team), project delivery/oversight and solution development.
We believe our ability to deliver professional services successfully to clients is dependent on our leaders in the field working together as a collegial and collaborative team. To build a sense of team spirit and increase camaraderie among our leaders, we have a program for field personnel that awards annual incentives based on specific agreed-upon goals focused on the performance of the individual and performance of the Company. We also share across the Company and with new team members the best and most effective practices of our highest achieving offices, consulting practices and accounts. New leadership also spends time in other markets or otherwise partners with experienced personnel to understand how best to serve current clients, expand our presence with prospects and identify and recruit highly qualified consultants, among many other important skills. This allows the veteran leadership to share their success stories, foster our culture with new team members and review specific client and consultant development programs. We believe these team-based practices enable us to better serve clients who prefer a centrally organized service approach.
We provide administrative, marketing, finance, HR, information technology (“IT”), legal and real estate support throughout our U.S. offices. We also have a business support operations center in our Utrecht, Netherlands office to provide centralized finance, HR, IT, payroll and legal support to our European offices. These centralized functions minimize the administrative burdens on our front office market leaders and enable operational efficiency and scalability throughout the enterprise.
Business Development
Our business development initiatives are comprised of:
•local and global initiatives focused on existing clients and target companies;
•national and international targeting efforts focused on multinational companies;
•brand marketing activities; and
•national and local advertising and direct mail programs.
Our business development efforts are driven by the networking and sales efforts of our management, with our worldwide Salesforce software platform providing a common database of opportunities and clients and enhancing our local and global business development efforts. While local senior management focus on market-related activities, they are also part of the regional, national and international sales efforts, especially when the client is part of a multinational entity. In certain markets, sales efforts are also enhanced by management professionals focused solely on business development efforts on a market and national basis based on firm-wide and industry-focused initiatives. These business development professionals, in partnership with the vice-presidents and client service teams, are responsible for initiating and fostering relationships with the senior management and decision makers of our targeted client companies.
We believe our national marketing efforts have effectively generated incremental revenues from existing clients and developed new client relationships. Our brand marketing initiatives help bolster RGP’s reputation in the markets we serve. Our brand is reinforced by our professionally designed website, print, and online advertising, direct marketing, seminars, thought leadership whitepapers, initiative-oriented brochures, social media and public relations efforts. We believe our branding initiatives, coupled with our high-quality client service, help to differentiate us from our competitors and to establish RGP as a credible and reputable global professional services firm.
Competition
We operate in an extremely competitive, highly fragmented market and compete for clients and consultants with a variety of organizations that offer similar services. The competition for talent and clients is likely to increase in the future due to workforce gaps caused by the tightening labor market, a changing market for project- or initiative-based services and the relatively few barriers to entry. Our principal competitors include:
•business operations and financial consulting firms;
•local, regional, national and international accounting and other traditional professional services firms;
•independent contractors;
•traditional and internet-based staffing firms; and
•the in-house or former in-house resources of our clients.
12 — rgp. 2025 Annual Report
We compete for clients based on the quality of professionals we bring to our clients, the knowledge base they possess, our ability to mobilize the right talent quickly, the effectiveness of our solutions, the scope and price of services, and the geographic reach of services. We believe our attractive value proposition, consisting of our diversified and relevant solution offerings, highly qualified consultants, relationship-oriented approach, delivery model (agile, bench and offshore) and professional culture, enables us to compete effectively in the marketplace.
Regulatory Environment
Our operations are subject to regulations by federal, state, local and professional governing bodies and laws and regulations in various foreign countries, including, but not limited to: (a) licensing and registration requirements and (b) regulation of the employer/employee relationship, such as worker classification regulations, wage and hour regulations, tax withholding and reporting, immigration/H-1B visa regulations, social security and other retirement, anti-discrimination, and employee benefits and workers’ compensation regulations. Our operations could be impacted by legislative changes by these bodies, particularly with respect to provisions relating to payroll and benefits, tax and accounting, employment, worker classification and data privacy which could materially affect our capital expenditures, earnings and/or competitive position. Due to the complex regulatory environment that we operate in, we remain focused on compliance with governmental and professional organizations’ regulations. For more discussion of the potential impact that the regulatory environment could have on our financial results, refer to Item 1A “Risk Factors” of our Annual Report on Form 10-K filed with the SEC on July 28, 2025.
rgp. 2025 Annual Report — 13
Market Information and Holders
Our common stock is listed on The Nasdaq Stock Market LLC and trades on the Nasdaq Global Select Market under the symbol “RGP.” As of July 18, 2025, the approximate number of holders of record of our common stock was 39 (a holder of record is the name of an individual or entity that an issuer carries in its records as the registered holder (not necessarily the beneficial owner) of the issuer’s securities).
Dividend Policy
Our Board of Directors has established a quarterly dividend, subject to quarterly Board of Directors’ approval. Pursuant to declaration and approval by our Board of Directors, we declared a dividend of $0.14 per share of common stock during each quarter in fiscal 2024 and 2023, and the first three quarters of fiscal 2025. On April 29, 2025, our Board of Directors approved a regular quarterly dividend of $0.07 per share of our common stock, which was subsequently paid on July 21, 2025 to stockholders of record at the close of business on June 23, 2025. Continuation of the quarterly dividend will be at the discretion of our Board of Directors and will depend upon our financial condition, results of operations, capital requirements, general business condition, contractual restrictions contained in our current or future credit agreements and other agreements, and other factors deemed relevant by our Board of Directors.
Issuances of Unregistered Securities
None.
Issuer Purchases of Equity Securities
Our Board of Directors has previously approved two stock repurchase programs authorizing the repurchase, at the discretion of our senior executives, of our common stock for a designated aggregate dollar limit. In July 2015, the first program was authorized for an aggregate dollar limit not to exceed $150 million, and in October 2024, the second program was authorized for an additional dollar limit not to exceed $50 million (collectively, the “Stock Repurchase Programs”). Subject to the aggregate dollar limits, the currently authorized Stock Repurchase Programs do not have an expiration date. Repurchases under the programs may take place in the open market or in privately negotiated transactions and may be made pursuant to a Rule 10b5-1 plan. As of May 31, 2025, approximately $79.2 million remained available for future repurchases of the Company’s common stock under the Stock Repurchase Programs.
There were no repurchases of our common stock during the fourth quarter of fiscal 2025
Performance Graph
Set forth below is a line graph comparing the annual percentage change in the cumulative total return to the holders of our common stock against the cumulative total return of each of the Russell 3000 Index, a customized peer group consisting of eight companies listed below the following table and a combined classification of companies under Standard Industry Codes as 8742-Management Consulting Services, in each case for the five years ended May 31, 2025. The graph assumes $100 was invested at market close on May 29, 2020 in our common stock and in each index (based on prices from the close of trading on May 29, 2020), and that all dividends are reinvested. Stockholder returns over the indicated period may not be indicative of future stockholder returns.
The information contained in the performance graph shall not be deemed to be “soliciting material” or to be “filed” with the SEC, nor shall such information be incorporated by reference into any future filing under the Securities Act of 1933,
14 — rgp. 2025 Annual Report
as amended or the Securities Exchange Act of 1934, as amended except to the extent that we specifically incorporate it by reference into such filing.
COMPARISON OF 5 YEAR CUMULATIVE TOTAL RETURN*
*$100 invested on 5/29/2020 in stock or index, including reinvestment of dividends.
| | | | | | | | | | | | | | | | | | | | | | | | | | | | | | | | | | | |
| May 29, 2020 | | May 29, 2021 | | May 28, 2022 | | May 27, 2023 | | May 25, 2024 | | May 31, 2025 |
| Resources Connection, Inc. | $ | 100.00 | | $ | 138.57 | | $ | 178.65 | | $ | 157.85 | | $ | 117.94 | | $ | 57.82 |
| Russell 3000 | $ | 100.00 | | $ | 143.91 | | $ | 139.64 | | $ | 142.27 | | $ | 181.42 | | $ | 204.11 |
| SIC Code 8742 - Management Consulting | $ | 100.00 | | $ | 143.84 | | $ | 145.93 | | $ | 143.79 | | $ | 200.55 | | $ | 191.50 |
| Peer Group | $ | 100.00 | | $ | 149.01 | | $ | 161.97 | | $ | 172.04 | | $ | 224.03 | | $ | 204.25 |
Our customized peer group includes the following ten professional services companies that we believe reflect the competitive landscape in which we operate and acquire talent: Barrett Business Services, Inc.; CBIZ, Inc.; CRA International, Inc.; FTI Consulting, Inc.; Heidrick & Struggles International, Inc.; Huron Consulting Group Inc.; ICF International, Inc.; Kforce, Inc.; Korn Ferry; and MISTRAS Group, Inc.
rgp. 2025 Annual Report — 15
MANAGEMENT’S DISCUSSION AND ANALYSIS OF FINANCIAL CONDITION AND RESULTS OF OPERATIONS
The following discussion and analysis of our financial condition and results of operations should be read in conjunction with our financial statements and related notes. This discussion and analysis contains forward-looking statements that involve risks and uncertainties. Our actual results could differ materially from those anticipated in these forward-looking statements as a result of certain factors including, but not limited to, those discussed in Part I, Item 1A “Risk Factors” of our Annual Report on Form 10 K filed with the SEC on July 18, 2025. See “Forward Looking Statements” above for further explanation.
Overview
Resources Global Professionals (“RGP”) is a professional services firm based in Dallas, Texas (with offices worldwide) focused on delivering consulting execution services that power clients’ operational needs and change initiatives utilizing a combination of bench and on-demand, expert and diverse talent. As a next-generation human capital partner for our clients, we specialize in leadership and co-delivery of enterprise initiatives typically precipitated by business transformation, strategic transactions or regulatory change. Our engagements are designed to leverage human connection and collaboration to deliver practical solutions and more impactful results that power our clients’, employees’ and partners’ success.
We attract top-caliber professionals with in-demand skill sets who seek a workplace environment characterized by choice and control, collaboration and human connection. The trends in today’s marketplace favor flexibility and agility as businesses confront transformation pressures and skilled labor shortages even in the face of protracted economic uncertainty. Our client engagement and talent delivery model offers speed and agility, strongly positioning us to help clients transform their businesses and workforce. Our model is especially relevant at a time where cost reduction initiatives drive an enhanced reliance on a flexible workforce to execute transformational projects.
We are laser-focused on driving long-term growth in our business by seizing favorable macro shifts in workforce strategies and preferences, building an efficient and scalable operating model, and maintaining a distinctive culture and approach to professional services. Our enterprise initiatives in recent years include refining the operating model for sales, talent and delivery to be more client-centric, cultivating a more robust performance culture by aligning incentives to business performance, enhancing our consulting capabilities in digital transformation to align with market demand, improving operating leverage through pricing, operating efficiency and cost reduction, and driving growth through strategic acquisitions. We believe our focus and execution on these initiatives will serve as the foundation for growth ahead. See “Business” for further discussions about our business and operations.
Fiscal 2025 Strategic Focus Areas
In fiscal 2025, our strategic focus areas were:
•Evolve and execute under our new business segments;
•Launch and activate new brand identity; and
•Enhance digital and artificial intelligence (“AI”) capabilities
Evolve and execute under our new business segments – Our first area of focus for fiscal 2025 has been to evolve our business by focusing on three core engagement models: On-Demand Talent, Consulting, and Outsourced Services. This shift has enabled us to better serve our clients along their transformation journey by providing targeted skill sets, high value consulting services, and outsourced delivery under a single umbrella. Our approach combines flexibility, best of breed technology, and human-centered design with functional and subject matter expertise. This fiscal year, we have made tremendous progress in clarifying and operationalizing these models to unlock the cross selling of our diversified capabilities throughout our blue-chip, loyal and longstanding client base. Our growing consulting capability provides us with deeper visibility into our clients’ transformation agendas to drive greater opportunity for our on-demand execution capabilities, while our agile talent base within our on-demand business provides greater financial flexibility and better skill set alignment for our consulting business. In our outsourced services business, we have expanded Countsy’s total addressable market beyond the start-up ecosystem to serve the finance, accounting and human resources needs surrounding spin-outs and carve-outs. Europe and Asia has continued to operate in the geographic regions as one business segment, serving our clients with consulting capabilities and on-demand experts. Evolving our business through this reorganization ensures that we are well positioned to execute and succeed as the macro environment recovers.
16 — rgp. 2025 Annual Report
Launch and activate new brand – In connection with the evolution of our business segments, we also evolved and aligned our brand identity to clarify to our stakeholders what we do, who we serve, when to call us, and the impact we deliver. We believe the added brand clarity will strengthen our market position and is a critical part of our long-term value creation.
Enhance digital and AI capabilities – Our third focus area for fiscal 2025 has been continuing to expand and enhance our technology, digital and data capabilities across all business units. The increased adoption of digital tools, remote work styles, generative AI, and globalization is driving new areas of need within our client base. We are actively adding skilled on-demand and consulting professionals in areas such as technology migration, data modernization and data privacy, and user experience to proactively meet these evolving client needs. Our Digital/Technology and Data practices bring together the unique combination of technology transformation and the deep functional expertise within our consulting practice. We believe this combined offering will uniquely position us to offer our clients integrated end-to-end consulting solutions in the digital arena.
We have historically accelerated growth through strategic acquisitions that drive additional scale or expand and complement our existing core capabilities. In addition to enhancing our digital and AI capabilities organically, we acquired Reference Point LLC (“Reference Point”) in July 2024, a management consulting firm with deep technology and data capabilities. We believe the added capabilities from Reference Point has accelerated growth in the existing consulting business and contributed favorably to the execution of our cross selling strategy.
Critical Accounting Policies and Estimates
The discussion and analysis of our financial condition and results of operations included in this “Management’s Discussion and Analysis of Financial Condition and Results of Operations” are based upon our Consolidated Financial Statements, which have been prepared in accordance with accounting principles generally accepted in the U.S. (“GAAP”). The preparation of these financial statements requires us to make estimates and judgments that affect the reported amounts of assets and liabilities and disclosure of contingent assets and liabilities at the date of the financial statements and the reported amounts of revenues and expenses during the reporting period.
We base our estimates on historical experience and on various other assumptions that are believed to be reasonable under the circumstances, the results of which form the basis for making judgments about the carrying value of assets and liabilities. Actual results may differ from these estimates under different assumptions or conditions.
The following represents a summary of our accounting policies that involve critical accounting estimates, defined as those estimates made in accordance with GAAP that involve a significant level of estimation uncertainty and have had or are reasonably likely to have a material impact on our financial condition or results of operations.
Revenue recognition — Revenue is recognized when control of the promised service is transferred to our clients, in an amount that reflects the consideration expected in exchange for the services. Revenue is recorded net of sales or other transaction taxes collected from clients and remitted to taxing authorities. Revenues for the vast majority of our contracts are recognized over time, based on hours worked by our professionals. The performance of the agreed-upon service over time is the single performance obligation for revenues.
On a limited basis, the Company may have fixed-price contracts, for which revenue is recognized over time using the input method based on time incurred as a proportion of estimated total time. Time incurred represents work performed, which corresponds with, and therefore best depicts, the transfer of control to the client. Management uses significant judgments when estimating the total hours expected to complete the contract performance obligation. It is possible that updated estimates for consulting engagements may vary from initial estimates with such updates being recognized in the period of determination. Depending on the timing of billings and services rendered, the Company accrues or defers revenue as appropriate.
Certain clients may receive discounts (for example, volume discounts or rebates) to the amounts billed. These discounts or rebates are considered variable consideration. Management evaluates the facts and circumstances of each contract and client relationship to estimate the variable consideration, assessing the most likely amount to recognize and considering management’s expectation of the volume of services to be provided over the applicable period. Rebates are the largest component of variable consideration and are estimated using the most-likely-amount method prescribed by Accounting Standards Codification Topic 606, Revenue from Contracts with Customers, contracts terms and estimates of
rgp. 2025 Annual Report — 17
revenue. Revenues are recognized net of variable consideration to the extent that it is probable that a significant reversal of revenues will not occur in subsequent periods. Changes in estimates would result in cumulative catch-up adjustments and could materially impact our financial results. Rebates recognized as contra-revenue for the years ended May 31, 2025, May 25, 2024 and May 27, 2023 were $2.2 million, $2.5 million and $3.2 million, respectively.
Allowance for credit losses — We maintain an allowance for credit losses for estimated losses resulting from our clients failing to make required payments for services rendered. We estimate this allowance based upon our knowledge of the financial condition of our clients (which may not include knowledge of all significant events), review of historical receivable and reserve trends and other pertinent information. While such losses have historically been within our expectations and the provisions established, we cannot guarantee that we will continue to experience the same credit loss rates we have in the past. As of May 31, 2025 and May 25, 2024, we had an allowance for credit losses of $2.6 million and $2.8 million, respectively. A significant change in the liquidity or financial position of our clients could cause unfavorable trends in receivable collections and additional allowances may be required. These additional allowances could materially affect our future financial results.
Income taxes — In order to prepare our Consolidated Financial Statements, we are required to make estimates of income taxes, if applicable, in each jurisdiction in which we operate. The process incorporates an assessment of any income subject to taxation in each jurisdiction together with temporary differences resulting from different treatment of transactions for tax and financial statement purposes. These differences result in deferred tax assets and liabilities that are included in our Consolidated Balance Sheets. The recovery of deferred tax assets from future taxable income must be assessed and, to the extent recovery is not likely, we will establish a valuation allowance. An increase in the valuation allowance results in recording additional tax expense and any such adjustment may materially affect our future financial results. If the ultimate tax liability differs from the amount of tax expense we have reflected in the Consolidated Statements of Operations, an adjustment of tax expense may need to be recorded and this adjustment may materially affect our future financial results and financial condition.
We evaluate the realizability of our deferred tax assets based on all available evidence and establish a valuation allowance to reduce deferred tax assets when it is more likely than not that they will not be realized. When all available evidence indicates that the deferred tax assets are more likely than not to be realized, a valuation allowance is not required to be recorded or an existing valuation allowance is reversed. Management assesses all available positive and negative evidence, including (1) three-year cumulative pre-tax income or loss adjusted for permanent tax differences, (2) history of operating losses and of net operating loss carryforwards expiring unused, (3) evidence of future reversal of existing taxable temporary differences, (4) availability of sufficient taxable income in prior years, (5) tax planning strategies, and (6) projection of future taxable income, to determine the need to establish or release a valuation allowance on the deferred tax assets. An increase or decrease in valuation allowance will result in a corresponding increase or decrease in tax expense, and any such adjustment may materially affect our future financial results.
We also evaluate our uncertain tax positions and only recognize the tax benefit from an uncertain tax position if it is more likely than not that the tax position will be sustained on examination by the taxing authorities, based on the technical merits of the position. The tax benefits recognized in the financial statements from such positions are measured based on the largest benefit that has a greater than 50 percentage likelihood of being realized upon settlement. We record a liability for unrecognized tax benefits resulting from uncertain tax positions taken or expected to be taken in a tax return. Any change in judgment related to the expected ultimate resolution of uncertain tax positions is recognized in earnings in the period in which such change occurs.
As of May 31, 2025 and May 25, 2024, a valuation allowance of $29.4 million and $8.6 million was established on deferred tax assets totaling $44.4 million and $34.2 million, respectively. Our income tax for the years ended May 31, 2025, May 25, 2024 and May 27, 2023 was a benefit of $4.3 million, an expense of $8.8 million, and an expense of $18.3 million, respectively. As of May 31, 2025 and May 25, 2024, our total liability for unrecognized tax benefits was $1.1 million and $1.0 million, respectively.
Stock-based compensation — Under our 2020 Performance Incentive Plan, officers, employees, and outside directors have received or may receive grants of restricted stock awards, restricted stock units, performance stock units, options to purchase common stock or other stock or stock-based awards. Under our 2019 Employee Stock Purchase Plan, as amended (“ESPP”), eligible officers and employees may purchase our common stock at a discount in accordance with the terms of the plan. Performance stock unit awards granted under the 2020 Performance Incentive Plan vest upon the
18 — rgp. 2025 Annual Report
achievement of certain company-wide performance targets at the end of the defined three-year performance period. Vesting periods for restricted stock awards, restricted stock units and stock option awards range from three to four years.
We estimate the fair value of stock-based payment awards on the date of grant as described below. We determine the estimated value of restricted stock awards, restricted stock unit and performance stock unit awards using the closing price of our common stock on the date of grant. We have elected to use the Black-Scholes option-pricing model for our stock options and stock purchased under our ESPP which takes into account assumptions regarding a number of complex and subjective variables. These variables include the expected stock price volatility over the term of the awards and actual and projected employee stock option exercise behaviors. Additional variables to be considered are the expected term, expected dividends and the risk-free interest rate over the expected term of our employee stock options.
We use our historical volatility over the expected life of the stock option award and ESPP award to estimate the expected volatility of the price of our common stock. The risk-free interest rate assumption is based upon observed interest rates appropriate for the term of our employee stock options. The impact of expected dividends is also incorporated in determining the estimated value per share of employee stock option grants and purchases under our ESPP. Such dividends are subject to quarterly Board of Directors’ approval. Our expected life of stock option grants is 5.6 years for non-officers and 8.1 years for officers, and the expected life of grants under our ESPP is 6 months.
In addition, because stock-based compensation expense recognized in the Consolidated Statements of Operations is based on awards ultimately expected to vest, it is reduced for estimated forfeitures. Forfeitures are estimated at the time of grant and revised in subsequent periods if actual forfeitures differ from those estimates, and in the case of performance stock units, based on the actual performance. The number of performance stock units earned at the end of the performance period may equal, exceed or be less than the targeted number of shares depending on whether the performance criteria are met, surpassed or not met. During each reporting period, the Company uses the latest forecasted results to estimate the number of shares to be issued at the end of the performance period. Any resulting changes to stock compensation expense are adjusted in the period in which the change in estimates occur. Forfeitures are estimated based on historical experience.
We review the underlying assumptions related to stock-based compensation at least annually or more frequently if we believe triggering events exist. If facts and circumstances change and we employ different assumptions in future periods, the compensation expense recorded may differ materially from the amount recorded in the current period. Stock-based compensation expense for the years ended May 31, 2025, May 25, 2024 and May 27, 2023 was $6.8 million, $5.7 million and $9.5 million, respectively.
Valuation of long-lived assets — For long-lived tangible and intangible assets other than goodwill, including property and equipment, right-of-use (“ROU”) assets, and definite-lived intangible assets, we assess the potential impairment periodically or whenever events or changes in circumstances indicate the carrying value may not be recoverable from the estimated undiscounted expected future cash flows expected to result from their use and eventual disposition. In cases where the estimated undiscounted expected future cash flows are less than the net book value, an impairment loss is recognized equal to the amount by which the net book value exceeds the estimated fair value of assets. We performed our assessment of potential qualitative impairment indicators of long-lived assets, including property and equipment, ROU assets outside of exited under the real estate exit initiatives taken, and definite-lived intangible assets. We determined that for such long-lived assets, no impairment indicators were present as of May 31, 2025, and no impairment charge was recorded during fiscal 2025 for long-lived assets.
Estimating future cash flows requires significant judgment, and our projections may vary from the cash flows eventually realized. Future events and unanticipated changes to assumptions could result in an impairment in the future. Although any impairment is a non-cash expense, it could materially affect our future financial results and financial condition.
Goodwill — Goodwill represents the excess of the purchase price over the fair value of the net tangible and identifiable intangible assets acquired in each business combination. We evaluate goodwill for impairment annually, and whenever events indicate that it is more likely than not that the fair value of a reporting unit could be less than its carrying amount. In assessing the recoverability of goodwill, we make a series of assumptions including forecasted revenue and costs, estimates of future cash flows, discount rates and other factors, which require significant judgment. A potential impairment in the future, although a non-cash expense, could materially affect our financial results and financial condition.
In testing the goodwill of our reporting units for impairment, we have the option to first assess qualitative factors to determine whether it is more likely than not that the fair value of each of our reporting units is less than their respective carrying amounts. If it is deemed more likely than not that the fair value of a reporting unit is greater than its carrying value,
rgp. 2025 Annual Report — 19
no further testing is needed and goodwill is not impaired. Otherwise, we perform a quantitative comparison of the fair value of the reporting unit to its carrying amount. We have the option to bypass the qualitative assessment for any reporting unit and proceed directly to performing the quantitative goodwill impairment test. If a reporting unit’s estimated fair value is equal to or greater than that reporting unit’s carrying value, no impairment of goodwill exists and the testing is complete. If the reporting unit’s carrying amount is greater than the estimated fair value, then a non-cash impairment charge is recorded for the amount of the difference, not exceeding the total amount of goodwill allocated to the reporting unit.
Under the quantitative analysis, the estimated fair value of goodwill is determined by using a combination of a market approach and an income approach. The market approach estimates fair value by applying revenue and EBITDA multiples to each reporting unit’s operating performance. The multiples are derived from guideline public companies with similar operating and investment characteristics to our reporting units, and are evaluated and adjusted, if needed, based on specific characteristics of the reporting units relative to the selected guideline companies. The market approach requires us to make a series of assumptions that involve significant judgment, such as the selection of comparable companies and the evaluation of the multiples. The income approach estimates fair value based on our estimated future cash flows of each reporting unit, discounted by an estimated weighted-average cost of capital that reflects the relevant risks associated with each reporting unit and the time value of money. The income approach also requires us to make a series of assumptions that involve significant judgment, such as discount rates, revenue, earnings and free cash flow projections. We estimate our discount rates on a blended rate of return considering both debt and equity for comparable guideline public companies. We forecast our revenue, earnings and free cash flows based on historical experience and internal forecasts about future performance. While we believe that the assumptions underlying our quantitative assessment are reasonable, these assumptions could have a significant impact on whether a non-cash impairment charge is recognized and the magnitude of such charge. The results of an impairment analysis are as of a point in time. There is no assurance that the actual future earnings or cash flows of our reporting units will be consistent with the Company’s projections.
In fiscal 2024, we voluntarily changed the date of the annual impairment test from the last day of the fourth quarter to the first day of the fourth quarter to better align with our internal operations. In fiscal 2025, due to the presence of indicators of potential impairment, we performed quantitative goodwill impairment assessments in each of the fiscal quarters. See Note 5 – Goodwill and Intangible Assets in the Notes to Consolidated Financial Statements included in this Annual Report for further discussion.
Business combinations — We allocate the fair value of the purchase consideration of our acquisitions to the tangible assets, liabilities, and intangible assets acquired based on their estimated fair values. Purchase price allocations for business acquisitions require significant judgments, particularly with regard to the determination of the value of identifiable assets, liabilities, and goodwill. Often third-party specialists are used to assist in valuations requiring complex estimation. The excess of the fair value of purchase consideration over the fair values of these identifiable assets and liabilities is recorded as goodwill. Acquisition-related expenses are recognized separately from the business combination and are expensed as incurred.
Purchase agreements related to certain business acquisitions may include provisions for the payment of additional cash consideration if certain future performance conditions are met. These contingent consideration arrangements are recognized at their acquisition date fair value and included as part of the purchase price at the acquisition date. These contingent consideration arrangements are classified as contingent consideration liabilities or other long-term liabilities in our Consolidated Balance Sheets and are remeasured to fair value at each reporting period, with any change in fair value being recognized in the applicable period’s results of operations. Measuring the fair value of contingent consideration at the acquisition date, and for all subsequent remeasurement periods, requires a careful examination of the facts and circumstances to determine the probable resolution of the contingency(ies). We utilize the Monte Carlo simulation model and estimate fair value of the contingent consideration based on unobservable input variables related to meeting the applicable contingency conditions as per the applicable agreements. There were no contingent consideration liabilities as of May 31, 2025 and May 25, 2024. There was no contingent consideration adjustment for the year ended May 31, 2025. The contingent consideration adjustment was a benefit of $4.4 million for the year ended May 25, 2024.
Market Trends and Uncertainties
On a macro level, uncertain macroeconomic conditions including ambiguity around interest rates, softening labor markets, fluctuations in currency exchange rates, recent government and policy changes implemented in the United States, and tariff actions and uncertainties related to trade wars have created significant uncertainty in the global economy, volatility in the capital markets and recessionary pressures, which has adversely impacted our financial results. While we are not able
20 — rgp. 2025 Annual Report
to fully predict the potential impact, we continue to see caution in professional services spending within our client base. Additionally, in connection with recent actions we have taken to execute on our diversified services strategy for long term growth and stability, we have experienced both voluntary and involuntary attrition, including within our sales team, which have and may continue to affect our near-term revenue performance. If these conditions or impacts persist or if a prolonged economic downturn or recession develops, it could result in further decline in billable hours and negatively impact our bill rates which would adversely affect our financial results and operating cash flows.
rgp. 2025 Annual Report — 21
Non-GAAP Financial Measures
The Company uses certain non-GAAP financial measures to assess our financial and operating performance that are not defined by or calculated in accordance with GAAP. A non-GAAP financial measure is defined as a numerical measure of a company’s financial performance that (i) excludes amounts, or is subject to adjustments that have the effect of excluding amounts, that are included in the comparable measure calculated and presented in accordance with GAAP in the Consolidated Statements of Operations or (ii) includes amounts, or is subject to adjustments that have the effect of including amounts, that are excluded from the comparable GAAP measure so calculated and presented.
Our primary non-GAAP financial measures are listed below and reflect how we evaluate our operating results.
•Same-day constant currency revenue is adjusted for the following items:
◦Currency impact. In order to remove the impact of fluctuations in foreign currency exchange rates, we calculate same-day constant currency revenue, which represents the outcome that would have resulted had exchange rates in the current period been the same as those in effect in the comparable prior period.
◦Business days impact. In order to remove the fluctuations caused by comparable periods having a different number of business days, we calculate same-day revenue as current period revenue (adjusted for currency impact) divided by the number of business days in the current period, multiplied by the number of business days in the comparable prior period. The number of business days in each respective period is provided in the “Number of Business Days” section in the table below.
•EBITDA is calculated as net income (loss) before amortization expense, depreciation expense, interest and income taxes.
•Adjusted EBITDA is calculated as EBITDA excluding stock-based compensation expense, amortized Enterprise Resource Planning (“ERP”) system costs, technology transformation costs, goodwill impairment, acquisition costs, gain on sale of assets, restructuring costs, and contingent consideration adjustments. We also present herein Adjusted EBITDA at the segment level as a measure used to assess the performance of our segments. Segment Adjusted EBITDA excludes certain shared corporate administrative costs that are not practical to allocate. See Note 18 – Segment Information and Enterprise Reporting in the Notes to Consolidated Financial Statements included in this Annual Report for further information.
•Adjusted EBITDA Margin is calculated by dividing Adjusted EBITDA by revenue.
22 — rgp. 2025 Annual Report
Same-Day Constant Currency Revenue
Same-day constant currency revenue assists management in evaluating revenue trends on a more comparable and consistent basis. We believe this measure also provides more clarity to our investors in evaluating our core operating performance and facilitates a comparison of such performance from period to period.
The following table presents a reconciliation of same-day constant currency revenue, a non-GAAP financial measure, to revenue as reported in the Consolidated Statements of Operations, the most directly comparable GAAP financial measure, by segment (in thousands, except number of business days).
| | | | | | | | | | | | | | | | | | | | | | | | | | | | | |
| For the Years Ended |
| May 31,
2025 | | May 25,
2024 |
| (Unaudited) | | (Unaudited) |
| As reported (GAAP) | | Currency impact | | Business days impact | | Same-day constant currency revenue | | As reported (GAAP) |
| On-Demand Talent | $ | 205,976 | | | $ | 959 | | | $ | (3,231) | | | $ | 203,704 | | | $ | 272,600 | |
| Consulting | 219,215 | | | 922 | | | (3,492) | | | 216,645 | | | 227,967 | |
| Europe and Asia Pacific | 77,602 | | | 151 | | | (1,214) | | | 76,539 | | | 84,207 | |
| Outsourced Services | 39,618 | | | - | | | (621) | | | 38,997 | | | 38,122 | |
| All Other | 8,920 | | | - | | | (140) | | | 8,780 | | | 9,905 | |
| Total Consolidated | $ | 551,331 | | | $ | 2,032 | | | $ | (8,698) | | | $ | 544,665 | | | $ | 632,801 | |
| | | | | | | | | | | | | | |
| | For the Years Ended |
| Number of Business Days | | May 31,
2025 | | May 25,
2024 |
| | (Unaudited) | | (Unaudited) |
On-Demand Talent (1) | | 255 | | | 251 | |
Consulting (1) | | 255 | | | 251 | |
Europe & Asia (2) | | 254 | | | 250 | |
Outsourced Services (1) | | 255 | | | 251 | |
All Other (1) | | 255 | | | 251 | |
(1) This represents the number of business days in the United States.
(2) The business days in international regions represent the weighted average number of business days.
rgp. 2025 Annual Report — 23
EBITDA, Adjusted EBITDA and Adjusted EBITDA Margin
EBITDA, Adjusted EBITDA and Adjusted EBITDA Margin assist management in assessing our core operating performance. We also believe these measures provide investors with useful perspective on underlying business results and trends and facilitate a comparison of our performance from period to period. The following table presents EBITDA, Adjusted EBITDA and Adjusted EBITDA Margin for the periods indicated and includes a reconciliation of such measures to net income (loss) and net income (loss) margin, the most directly comparable GAAP financial measures (in thousands, except percentages).
| | | | | | | | | | | | | | | | | | | | | | | | | | | | | | | | | | | |
| For the Years Ended |
| May 31,
2025 | | % of Revenue (1) | | May 25,
2024 | | % of Revenue (1) | | May 27,
2023 | | % of Revenue (1) |
| | | | | | | | | | | |
Net income (loss) | $ | (191,780) | | | (34.8) | % | | $ | 21,034 | | | 3.3 | % | | $ | 54,359 | | | 7.0 | % |
| Adjustments: | | | | | | | | | | | |
| Amortization expense | 5,880 | | | 1.1 | | | 5,378 | | | 0.9 | | | 5,018 | | | 0.6 | |
| Depreciation expense | 1,868 | | | 0.3 | | | 3,050 | | | 0.5 | | | 3,539 | | | 0.4 | |
| Interest (income) expense, net | (544) | | | (0.1) | | | (1,064) | | | (0.2) | | | 552 | | | 0.1 | |
Income tax expense (benefit) | (4,295) | | | (0.8) | | | 8,795 | | | 1.4 | | | 18,259 | | | 2.4 | |
| EBITDA | (188,871) | | | (34.3) | | | 37,193 | | | 5.9 | | | 81,727 | | | 10.5 | |
| Stock-based compensation expense | 6,754 | | | 1.2 | | | 5,732 | | | 0.9 | | | 9,521 | | | 1.2 | |
Amortized ERP system costs (2) | 1,287 | | | 0.2 | | | - | | | - | | | - | | | - | |
Technology transformation costs (3) | 5,474 | | | 1.0 | | | 6,901 | | | 1.1 | | | 6,355 | | | 0.8 | |
Acquisition costs (4) | 2,763 | | | 0.5 | | | 1,970 | | | 0.3 | | | - | | | - | |
Goodwill Impairment (5) | 194,409 | | | 35.3 | | | - | | | - | | | 2,955 | | | 0.4 | |
Gain on sale of assets (6) | (3,420) | | | (0.6) | | | - | | | - | | | - | | | - | |
Restructuring costs (7) | 5,061 | | | 0.9 | | | 4,087 | | | 0.6 | | | (364) | | | - | |
Contingent consideration adjustment (8) | - | | | - | | | (4,400) | | | (0.7) | | | - | | | - | |
| Adjusted EBITDA | $ | 23,457 | | | 4.3 | % | | $ | 51,483 | | | 8.1 | % | | $ | 100,194 | | | 12.9 | % |
(1) The percentage of revenue may not foot due to rounding.
(2) Amortized ERP system costs represent the amortization of capitalized technology transformation costs related to newly implemented ERP system, which was recorded within Selling, General, and Administrative expenses on the Consolidated Statement of Operations.
(3) Technology transformation costs represent costs included in net income (loss) related to the Company’s initiative to upgrade its technology platform globally, including a cloud-based ERP system and talent acquisition and management systems. Such costs primarily include hosting and certain other software licensing costs, third-party consulting fees and costs associated with dedicated internal resources that are not capitalized.
(4) Acquisition costs primarily represent costs included in net income (loss) related to the Company’s business acquisition. These costs include transaction bonuses, cash retention bonus accruals, and fees paid to the Company's broker, legal counsel, and other professional services firms. See Note 3 – Acquisitions and Dispositions in the Notes to Consolidated Financial Statements included in this Annual Report for further discussion.
(5) The effect of the goodwill impairment charge recognized during the year ended May 31, 2025 was related to the On-Demand Talent, Consulting, Europe and Asia Pacific segments and during the year ended May 27, 2023 related to the Sitrick segment.
24 — rgp. 2025 Annual Report
(6) Gain on sale of assets was related to the Company’s sale of its Irvine office building, which was completed on August 15, 2024.
(7) Restructuring costs for the year ended May 31, 2025 related to the 2025 Restructuring Plan, which was authorized in December 2024 and May 2025. Restructuring costs for the year ended May 25, 2024 related to the Company's cost reduction plan, including a reduction in force, which was authorized in October 2024, and was substantially completed during fiscal 2024. The restructuring credits for the year ended May 27, 2023 related to the release of accrued restructuring liabilities upon completion of the global restructuring and business transformation plans from fiscal 2021.
(8) Contingent consideration adjustment related to the remeasurement of contingent liabilities related to the acquisition of CloudGo Pte Ltd. and its subsidiaries (collectively, “CloudGo”).
Our non-GAAP financial measures are not measurements of financial performance or liquidity under GAAP and should not be considered in isolation or construed as substitutes for revenue, net income or other measures of financial performance or financial condition prepared in accordance with GAAP for purposes of analyzing our revenue, profitability or liquidity. Further, a limitation of our non-GAAP financial measures is they exclude items detailed above that have an impact on our GAAP-reported results. Other companies in our industry may calculate these non-GAAP financial measures differently than we do, limiting their usefulness as a comparative measure. Because of these limitations, these non-GAAP financial measures should not be considered a substitute but rather considered in addition to performance measures calculated in accordance with GAAP.
Results of Operations
The following tables set forth, for the periods indicated, our Consolidated Statements of Operations data. These historical results are not necessarily indicative of future results. Our operating results for the periods indicated are expressed as a percentage of revenue below. The fiscal year ended May 31,2025 consisted of 53 weeks, and the fiscal years ended May 25, 2024 and May 27, 2023 consisted of 52 weeks (in thousands, except percentages).
| | | | | | | | | | | | | | | | | | | | | | | | | | | | | | | | | | | |
| For the Years Ended |
| May 31,
2025 | | % of Revenue (1) | | May 25,
2024 | | % of Revenue (1) | | May 27,
2023 | | % of Revenue (1) |
| Revenue | $ | 551,331 | | | 100.0 | % | | $ | 632,801 | | | 100.0 | % | | $ | 775,643 | | | 100.0 | % |
| Direct cost of services | 343,907 | | | 62.4 | | | 386,733 | | | 61.1 | | | 462,501 | | | 59.6 | |
| Gross profit | 207,424 | | | 37.6 | | | 246,068 | | | 38.9 | | | 313,142 | | | 40.4 | |
| Selling, general and administrative expenses | 202,024 | | | 36.6 | | | 208,864 | | | 33.0 | | | 228,842 | | | 29.5 | |
Goodwill impairment | 194,409 | | | 35.3 | | | - | | | - | | | 2,955 | | | 0.4 | |
Amortization | 5,880 | | | 1.1 | | | 5,378 | | | 0.9 | | | 5,018 | | | 0.6 | |
Depreciation expense | 1,868 | | | 0.3 | | | 3,050 | | | 0.5 | | | 3,539 | | | 0.4 | |
Income (loss) from operations | (196,757) | | | (35.7) | | | 28,776 | | | 4.5 | | | 72,788 | | | 9.5 | |
| Interest (income) expense, net | (544) | | | (0.1) | | | (1,064) | | | (0.2) | | | 552 | | | 0.1 | |
Other (income) expense | (138) | | | - | | | 11 | | | - | | | (382) | | | - | |
Income (loss) before income tax expense | (196,075) | | | (35.6) | | | 29,829 | | | 4.7 | | | 72,618 | | | 9.4 | |
Income tax (benefit) expense | (4,295) | | | (0.8) | | | 8,795 | | | 1.4 | | | 18,259 | | | 2.4 | |
Net income (loss) | $ | (191,780) | | | (34.8) | % | | $ | 21,034 | | | 3.3 | % | | $ | 54,359 | | | 7.0 | % |
(1) The percentage of revenue may not foot due to rounding.
Year Ended May 31, 2025 Compared to Year Ended May 25, 2024
Percentage change computations are based upon amounts in thousands.
Revenue. Revenue decreased $81.5 million, or 12.9%, to $551.3 million for the year ended May 31, 2025 from $632.8 million for the year ended May 25, 2024. On a same-day constant currency basis, revenue during fiscal 2025
rgp. 2025 Annual Report — 25
decreased $88.1 million, or 13.9%, compared to fiscal 2024. Billable hours decreased 13.5% while the average bill rate remained flat (or increased 0.8% on a constant currency basis) during fiscal 2025 compared to fiscal 2024. The decrease in billable hours is due to reduced client spending, in part due to uncertainty in the global macroeconomic environment, as a result of interest rate ambiguity and softening labor markets, as well as developments in U.S. trade policy and geo-political conflicts. To a lesser extent, in connection with recent actions we have taken to execute on our diversified services strategy for long term growth and stability, we have experienced both voluntary and involuntary attrition in the third quarter of fiscal 2025, including within our sales team, which affected our revenue performance and billable hours in the second half of fiscal 2025.
The following table represents our GAAP consolidated revenues by geography (in thousands, except percentages):
| | | | | | | | | | | | | | | | | | | | | | | |
| For the Years Ended |
| May 25,
2024 | | % of
Revenue | | May 27,
2023 | | % of
Revenue |
| North America | $ | 467,201 | | | 84.7 | % | | $ | 543,926 | | | 86.0 | % |
| Europe | 33,796 | | | 6.1 | | | 38,383 | | | 6.0 | |
| Asia Pacific | 50,334 | | | 9.1 | | | 50,492 | | | 8.0 | |
| Total | $ | 551,331 | | | 100.0 | % | | $ | 632,801 | | | 99.9 | % |
North America experienced a revenue decline of 14.1% during fiscal 2025 compared to the same period in fiscal 2024. This North America revenue decline reflected reduced client spending across a majority of these markets, client segments and solution offerings as a result of the continued uncertainty in the global macroeconomic environment. The time to close opportunities in the pipeline continued to be protracted, which is typical in a tougher macro environment when clients are more hesitant and slow down the pace of spend on professional services. To a lesser extent, North America revenue also declined due to the voluntary and involuntary attrition in the third quarter that primarily occurred in North America. This revenue decline was offset by Reference Point, our recent acquisition completed in the first fiscal quarter of 2025, which contributed $16.1 million of North America revenue during fiscal 2025. Europe revenue decreased 12.0%, during fiscal 2025 compared to fiscal 2024, primarily due to a decrease in billable hours. Revenue in the Asia Pacific region decreased 0.3% compared to fiscal 2024. Large multinational clients continue to shift work to lower cost markets in the Asia Pacific region, such as India and the Philippines, creating demand in those geographies, which partially mitigated the impact of softer markets in the rest of Asia Pacific. Our acquisition of CloudGo, which was completed during the second quarter of fiscal 2024, contributed $6.5 million to Asia Pacific revenue in fiscal 2025 compared to $4.2 million in fiscal 2024 due to the full year impact of the acquisition. We continued to focus on improving pricing during fiscal 2025.
Direct Cost of Services. Direct cost of services decreased $42.8 million, or 11.1%, to $343.9 million during fiscal 2025 from $386.7 million for fiscal 2024. The decrease in direct cost of services year over year was primarily attributable to a 13.5% decrease in billable hours as a result of reduced client spending as noted above, partially offset by a 1.7% increase in average pay rate during fiscal 2025 compared to the same period in fiscal 2024.
Direct cost of services as a percentage of revenue was 62.4% for fiscal 2025 compared to 61.1% for fiscal 2024. The increased percentage compared to the prior year period was primarily due to lower utilization of salaried consultants. We continue to seek improvement in the overall pay/bill ratio and indirect cost leverage through strategic pricing, while offering competitive compensation and benefits to our consultants to attract and retain the best talent in the marketplace.
The number of consultants on assignment at the end of fiscal 2025 was 2,368 compared to 2,585 at the end of fiscal 2024.
Selling, General and Administrative Expenses. Selling, general and administrative expenses (“SG&A”) was $202.0 million, or 36.6% of revenue, for the year ended May 31, 2025 compared to $208.9 million, or 33.0% of revenue, for the year ended May 25, 2024. The $6.8 million decrease in SG&A year-over-year was primarily attributed to lower net employee compensation expense of $9.2 million largely resulting from the restructuring plans and ongoing alignment of resource capacity to demand, a $3.4 million gain on the sale of the Irvine office building and a $1.4 million decrease in technology transformation costs. These reductions were partially offset by a $4.4 million favorable non-cash adjustment on contingent consideration related to the CloudGo acquisition recognized in fiscal 2024, a $1.0 million increase in restructuring costs, $1.0 million increase in stock compensation costs and $1.3 million of amortization related to the newly launched ERP systems in the third fiscal quarter.
26 — rgp. 2025 Annual Report
Management and administrative headcount was 687 at the end of fiscal 2025 and 791 at the end of fiscal 2024. Management and administrative headcount includes full-time equivalent headcount for our seller-doer group, which is determined by utilization levels achieved by the seller-doers. Any unutilized time is converted to full-time equivalent headcount.
Goodwill Impairment. During the year ended May 31, 2025, there were indicators of potential impairment in each of the fiscal quarters related to a combination of business performance and decline in share price. As a result, we performed four interim quantitative goodwill impairment assessments for our reporting units, each of which is also a reporting segment, during the year ended May 31, 2025, from which we recorded an aggregate impairment charge of $194.4 million. See Note 5 – Goodwill and Intangible Assets in the Notes to Consolidated Financial Statements included in this Annual Report for further discussion information.
Contingent Consideration Adjustment. In connection with our acquisitions, we may be required to pay future consideration that is contingent upon the achievement of specified performance targets, such as revenue and operating profit. As of the acquisition date, we record a contingent liability representing the estimated fair value of the contingent consideration we expect to pay. Increases in projected revenues and probabilities of payment may result in significantly higher fair value measurements; decreases in these items may have the opposite effect. Increases in discount rates in the periods prior to payment may result in significantly lower fair value measurements; decreases may have the opposite effect.
We remeasure our contingent consideration liabilities each reporting period and recognize the change in the liabilities' fair value within SG&A in our Consolidated Statements of Operations. During the year ended May 25, 2024, we recorded a $4.4 million reduction in contingent consideration related to our acquisition of CloudGo. See Note 3 – Acquisitions and Dispositions in the Notes to Consolidated Financial Statements included in this Annual Report for further information.
Income Taxes. Income tax benefit was $4.3 million (effective tax rate of 2.2%) for the year ended May 31, 2025 compared to income tax expense of $8.8 million (effective tax rate of 29.5%) for the year ended May 25, 2024.
The income tax benefit in fiscal 2025 was primarily attributed to the Company's pretax loss. The lower effective tax rate in fiscal 2025 was due to the non-deductible portion of the goodwill impairment, coupled with the establishment of valuation allowances on the Company’s domestic and United Kingdom net deferred tax assets. The effective tax rate in fiscal 2024 was attributed primarily to a non-recurring increase in forfeiture of stock options in connection with an employee termination during the fiscal year, which was partially offset by rate benefits from the nontaxable income on the reversal of CloudGo's contingent liability, a foreign exchange loss as a result of the repatriation of funds from our Japan subsidiary and a partial release of a valuation allowance on domestic capital loss carryforwards in relation to the then-pending sale of the Company's former Irvine building.
We recognized a tax benefit of approximately $1.5 million and $1.3 million for the years ended May 31, 2025 and May 25, 2024, respectively, associated with the exercise of stock options, vesting of restricted stock awards, restricted stock units, performance-based stock units, and disqualifying dispositions by employees of shares acquired under our ESPP.
We reviewed the components of both book and taxable income to prepare the tax provision. There can be no assurance that our effective tax rate will remain constant in the future because of the lower benefit from the U.S. statutory rate for losses in certain foreign jurisdictions, the limitation on the benefit for losses in jurisdictions in which a valuation allowance for operating loss carryforwards has previously been established, and the unpredictability of timing and the amount of disqualifying dispositions of certain stock options. Based upon ongoing economic circumstances and our business performance, along with the recent goodwill impairment charges, management has currently reserved against deferred tax assets in our domestic and certain foreign jurisdictions, and will continue to monitor the need to record additional or release existing valuation allowances in the future. Realization of the currently reserved deferred tax assets is dependent upon generating sufficient future taxable income of the appropriate character in the domestic and foreign territories.
We have maintained a position of being indefinitely reinvested in our foreign subsidiaries’ earnings by not expecting to remit foreign earnings in the foreseeable future. Being indefinitely reinvested does not require a deferred tax liability to be recognized on the foreign earnings. Management’s indefinite reinvestment position is supported by:
•RGP in the U.S. has generated more than enough cash to fund operations and expansion, including acquisitions. RGP uses its excess cash to, at its discretion, return cash to stockholders through dividend payments and stock repurchases.
rgp. 2025 Annual Report — 27
•RGP has sufficient cash flow from operations in the U.S. to service its debt and other current or known obligations without requiring cash to be remitted from foreign subsidiaries.
•Management’s growth objectives include allowing cash to accumulate in RGP’s profitable foreign subsidiaries with the expectation of finding strategic expansion plans to further penetrate RGP’s most successful locations.
•The consequences of distributing foreign earnings have historically been deemed to be tax-inefficient for RGP or not materially beneficial.
Although we repatriated $2.9 million from our Japan subsidiary during fiscal 2025, the remaining unremitted earnings as of May 31, 2025 in our Japan subsidiary are intended to be indefinitely reinvested in our Japan subsidiary's operations and growth, and no deferred tax liability has been established on the remaining unremitted earnings. Going forward, the indefinite reversal criteria will apply only to the portion of our Japan subsidiary’s unremitted earnings that are needed for its ongoing operations and growth.
Operating Results of Segments
During the first quarter of fiscal 2025, the Company completed its assessment of the Company's operating segments and identified the following newly defined operating segments:
•On-Demand Talent — this segment provides businesses with a go-to source for bringing in experts when they need them.
•Consulting — this segment drives transformation across people, processes and technology across domain areas including finance, technology and digital, risk and compliance and supply chain transformation.
•Europe & Asia Pacific — is a geographically defined segment that offers both on-demand and consulting services (excluding the digital consulting business, which is included in our Consulting segment) to clients throughout Europe and Asia Pacific.
•Outsourced Services — operating under the Countsy by RGPTM brand, this segment offers finance, accounting and human resource services provided to startups, spinouts and scale-up enterprises, utilizing a technology platform and fractional team.
•Sitrick — a crisis communications and public relations firm that provides corporate, financial, transactional and crisis communication and management services.
Each of these segments reports through a separate segment manager to the Company’s Chief Executive Officer and Chief Operating Officer, who are collectively designated as the CODMs for segment reporting purposes. The Company's reportable segments are comprised of On-Demand Talent, Consulting, Europe & Asia Pacific, and Outsourced Services. Sitrick does not individually meet the quantitative thresholds to qualify as a reportable segment. Therefore, Sitrick is disclosed under the “All Other” segment. Each of these segments represents a reporting unit for the purposes of assessing goodwill for impairment.
On November 15, 2023, the Company acquired CloudGo. On July 1, 2024, the Company acquired Reference Point. CloudGo and Reference Point are both reported as part of the Consulting reporting segment. See Note 3 – Acquisitions and Dispositions in the Notes to Consolidated Financial Statements in this Annual Report for further information.
The following table presents our operating results by segment for years ended May 31, 2025, May 25, 2024, and May 27, 2023 respectively (in thousands). Revenue information by segment, on a GAAP basis and on a same-day constant currency basis, is set forth above under “Non-GAAP Financial Measures – Same Day Constant Currency Revenue.”
28 — rgp. 2025 Annual Report
| | | | | | | | | | | | | | | | | |
| For the Years Ended |
| May 31,
2025 | | May 25,
2024 | | May 27,
2023 |
| | | | | |
| | | | | |
| | | | | |
| | | | | |
| | | | | |
| | | | | |
| | | | | |
| | | | | |
| Adjusted EBITDA: | | | | | |
| On-Demand Talent | $ | 17,116 | | | $ | 31,673 | | | $ | 60,484 | |
| Consulting | 31,718 | | | 38,420 | | | 53,477 | |
| Europe & Asia Pacific | 4,478 | | | 5,289 | | | 9,913 | |
| Outsourced Services | 7,581 | | | 7,641 | | | 7,408 | |
| All Other | (1,838) | | (675) | | 1,131 | |
Unallocated items (1) | (35,598) | | (30,865) | | (32,219) |
| Adjustments: | | | | | |
| Stock-based compensation expense | (6,754) | | (5,732) | | (9,521) |
Amortized ERP system costs (2) | (1,287) | | - | | | - | |
Technology transformation costs (3) | (5,474) | | (6,901) | | (6,355) |
Acquisition costs (4) | (2,763) | | (1,970) | | - | |
Goodwill impairment (5) | (194,409) | | - | | | (2,955) |
Gain on sale of assets (6) | 3,420 | | | - | | | - | |
Restructuring cost (7) | (5,061) | | (4,087) | | 364 | |
| Amortization expense | (5,880) | | (5,378) | | (5,018) |
| Depreciation expense | (1,868) | | (3,050) | | (3,539) |
Contingent consideration adjustment (8) | - | | | 4,400 | | | - | |
| Interest income, net | 544 | | | 1,064 | | | (552) |
| Income (loss) before income tax benefit (expense) | (196,075) | | 29,829 | | 72,618 |
| Income tax benefit (expense) | 4,295 | | (8,795) | | | (18,259) | |
| Net income (loss) | $ | (191,780) | | $ | 21,034 | | $ | 54,359 |
(1)Reconciling items are generally comprised of unallocated corporate administrative costs, including management and board compensation, corporate support function costs and other general corporate costs that are not allocated to segments.
(2)A reconciliation of the Company’s net income to Adjusted EBITDA on a consolidated basis is presented above under “Non-GAAP Financial Measures.”
(3) Technology transformation costs represent costs included in net income (loss) related to the Company’s initiative to upgrade its technology platform globally, including a cloud-based ERP system and talent acquisition and management systems. Such costs primarily include hosting and certain other software licensing costs, third-party consulting fees and costs associated with dedicated internal resources that are not capitalized.
(4) Acquisition costs primarily represent costs included in net income (loss) related to the Company’s business acquisition. These costs include transaction bonuses, cash retention bonus accruals, and fees paid to the Company's broker, legal counsel, and other professional services firms. See Note 3 – Acquisitions and Dispositions in the Notes to Consolidated Financial Statements included in this Annual Report for further discussion.
(5) The effect of the goodwill impairment charge recognized during the year ended May 31, 2025 was related to the On-Demand Talent, Consulting, Europe and Asia Pacific segments and during the year ended May 27, 2023 related to the Sitrick segment.
(6) Gain on sale of assets was related to the Company’s sale of its Irvine office building, which was completed on August 15, 2024.
rgp. 2025 Annual Report — 29
(7) Restructuring costs for the year ended May 31, 2025 related to the 2025 Restructuring Plan, which was authorized in December 2024 and May 2025. Restructuring costs for the year ended May 25, 2024 related to our cost reduction plan, including a reduction in force, which was authorized in October 2024, and was substantially completed during fiscal 2024. The restructuring credits for the year ended May 27, 2023 related to the release of accrued restructuring liabilities upon completion of the global restructuring and business transformation plans from fiscal 2021.
(8) Contingent consideration adjustment related to the remeasurement of contingent liabilities related to the CloudGo acquisition during the year ended May 25, 2024.
Revenue by Segment
On-Demand Talent – Revenue in the On-Demand Talent segment declined by $66.6 million or 24.4%, to $206.0 million in fiscal 2025 compared to $272.6 million in fiscal 2024. The decline was primarily due to lower demand across solution areas amongst economic uncertainty, with billable hours decreasing by 22.7% and a 1.4% (or 1.4% on a constant currency basis) decline in average bill rate. Demand for interim support remained challenged in the year due in part to the labor market trend with less talent movement across employers, which has historically been a generator for demand in this segment.
Consulting – Revenue in the Consulting segment declined by $8.8 million or 3.8%, to $219.2 million in fiscal 2025 compared to $228.0 million in fiscal 2024. The decline was primarily due to an 11.0% decrease in billable hours, partially offset by a 7.7% (or 8.5% on a constant currency basis) increase in the average bill rate largely as a result of the Company’s value-based pricing initiative as well as a change in both service and geographic revenue mix. Additionally, the current year results include the addition of Reference Point (acquired in the first fiscal quarter of 2025), which contributed $16.1 million of revenue during fiscal year 2025.
Europe and Asia Pacific – Revenue in the Europe and Asia Pacific segment declined by $6.6 million or 7.8%, to $77.6 million in fiscal 2025 compared to $84.2 million in fiscal 2024. The decline was primarily due to a 4.5% decrease in billable hours, as well as a 3.3% (also 3.3% on a constant currency basis) decrease in the average bill rate largely as a result of a shift in geographic revenue mix toward Asia Pacific where bill rates are lower than Europe. The regions continued to experience delays in decision making and project starts as clients sorted through their own organizational challenges amidst economic uncertainty.
Outsourced Services – Revenue in the Outsourced Services segment increased by $1.5 million or 3.9% to $39.6 million in fiscal 2025 compared to $38.1 million in fiscal 2024. The increase is primarily due to a 2.3% increase in billable hours, partially offset by a 0.7% decline (or 0.7% on a constant currency basis) decrease in the average bill rate.
All Other – Revenue in the All Other segment declined by $1.0 million or 9.9% to $8.9 million in fiscal 2025 compared to $9.9 million in the prior year. The billable hours decreased by 16.3%, partially offset by an increase in average bill rate by 8.4%, partially due to lower fee discounts.
Adjusted EBITDA by Segment
On-Demand Talent – The On-Demand Talent segment’s Adjusted EBITDA decreased by $14.6 million or 46.0%, to $17.1 million in fiscal 2025, compared to $31.7 million in fiscal 2024. The decrease is primarily attributed to the decrease in revenue of $66.6 million as a result of the factors discussed above, partially offset by a decrease in expenses of $11.5 million.
Consulting – The Consulting segment’s Adjusted EBITDA decreased by $6.7 million or 17.4%, to $31.7 million in fiscal 2025, compared to $38.4 million in fiscal 2024. The decrease is primarily attributed to a decrease in revenue of $8.8 million as a result of the factors discussed above, partially offset by a decrease in expenses of $1.6 million.
Europe and Asia Pacific – The Europe and Asia Pacific segment’s Adjusted EBITDA decreased by $0.8 million or 15.3%, to $4.5 million in fiscal 2025, compared to $5.3 million in fiscal 2024. The decrease is primarily attributed to a decrease in gross margin of 1.5%, offset by a decrease in expenses of $2.8 million.
Outsourced Services – The Outsourced Services segment’s Adjusted EBITDA of $7.6 million in fiscal 2025 remained relatively flat compared to fiscal 2024.
30 — rgp. 2025 Annual Report
All Other – The All Other segment's Adjusted EBITDA declined by $1.2 million or 172.3% to $(1.8) million in fiscal 2025 compared to $(0.7) million in fiscal 2024 due to lower revenue performance due to the decrease in billable hours
Year Ended May 25, 2024 Compared to Year Ended May 27, 2023
For a comparison of our results of operations at the consolidated and segment level for the fiscal years ended May 25, 2024 and May 27, 2023, see Part II, Item 7 “Management’s Discussion and Analysis of Financial Condition and Results of Operations” of our Annual Report on Form 10-K for the fiscal year ended May 25, 2024, filed with the SEC on July 22, 2024 (File No. 0-32113).
Due to the change in the Company’s operating segments during the first quarter of fiscal 2025 as described above, we have presented below a comparison of our results of operations at the segment level based on this new segment presentation for the fiscal years ended March 25, 2024 and March 27, 2023.
Revenue by Segment
On-Demand Talent – Revenue in the On-Demand Talent segment declined by $100.1 million or 26.9%, to $272.6 million in fiscal 2024 compared to $372.7 million in fiscal 2023. The decline was primarily due to lower demand across solution areas, with billable hours decreasing in fiscal 2024. Demand for interim support remained challenged in fiscal 2024 compared to fiscal 2023 due in part to continued uncertainty in the macroeconomic environment.
Consulting – Revenue in the Consulting segment declined by $32.0 million or 12.3%, to $228.0 million in fiscal 2024 compared to $259.9 million in fiscal 2023. The decline was primarily due to a decrease in billable hours, partially offset by the acquisition of CloudGo (acquired in the second fiscal quarter of 2024), which contributed $4.2 million of revenue during fiscal year 2024.
Europe and Asia Pacific – Revenue in the Europe and Asia Pacific segment declined by $9.0 million or 9.6%, to $84.2 million in fiscal 2024 compared to $93.2 million in fiscal 2023. The decline was primarily due to a decrease in the average bill rate as a result of as a result of a shift in revenue mix to regions which have lower average bill rates.
Outsourced Services – .Revenue in the Outsourced Services segment decreased by $0.8 million or 2.1% to $38.1 million in fiscal 2024 compared to $39.0 million in fiscal 2023. The decrease is primarily due to a 3.3% decrease in billable hours, partially offset by a 4.0% increase in the average bill rate.
All Other – Revenue in the All Other segment declined by $1.0 million or 9.1% to $9.9 million in fiscal 2024 compared to $10.9 million in fiscal 2023. The decrease is primarily due to a 7.8% decrease in billable hours and a 5.3% decrease in the average bill rate. Revenue was impacted by delays in court proceedings and more settlements, hindering leads for revenue generation in this segment.
Adjusted EBITDA by Segment
On-Demand Talent –The On-Demand Talent segment’s Adjusted EBITDA decreased by $28.8 million or 47.6%, to $31.7 million in fiscal 2024, compared to $60.5 million in fiscal 2023. The decrease is primarily attributed to a decrease in gross profit of $45.3 million, partially offset by a decrease in segment expenses of $16.5 million.
Consulting – The Consulting segment’s Adjusted EBITDA decreased by $15.1 million or 28.2%, to $38.4 million in fiscal 2024, compared to $53.5 million in fiscal 2023. The decrease is primarily attributed to a decrease in gross profit of $17.2 million.
Europe and Asia Pacific – The Europe and Asia Pacific segment’s Adjusted EBITDA decreased by $4.6 million or 46.6%, to $5.3 million in fiscal 2024, compared to $9.9 million in fiscal 2023. The decrease is primarily attributed to a decrease in gross profit of $3.6 million, as well as an increase in expenses of $1.1 million.
Outsourced Services – The Outsourced Services segment’s Adjusted EBITDA of $7.6 million in fiscal 2024 remained relatively flat compared to $7.4 million in fiscal 2023.
rgp. 2025 Annual Report — 31
All Other – The All Other segment's Adjusted EBITDA declined by $1.8 million to $(0.7) million in fiscal 2024 compared to $1.1 million in fiscal 2023, primarily due to lower revenue performance due to the decrease in billable hours and average bill rate described above.
Liquidity and Capital Resources
Our primary sources of liquidity are cash provided by operating activities, our senior secured revolving credit facility (as discussed further below) and historically, to a lesser extent, stock option exercises and ESPP purchases. During fiscal 2025, we generated positive cash flow from operations and have generated positive cash flows from operations on an annual basis since inception. Our ability to generate positive cash flows from operations in the future will depend, at least in part, on global economic conditions and our ability to remain resilient during periods of deteriorating macroeconomic conditions and any economic downturns. As of May 31, 2025, we had $86.1 million of cash and cash equivalents, including $39.4 million held in international operations.
Prior to July 2, 2025, the Company had a revolving credit facility with Bank of America, pursuant to the terms of the credit Agreement dated November 12, 2021 by the Company and Resources Connection LLC, as borrowers, and all of the Company’s domestic subsidiaries, as guarantors, with the lenders that are party thereto and Bank of America, N.A. as administrative agent for the lenders (the “2021 Credit Facility”). The 2021 Credit Facility provided for a $175.0 million senior secured revolving loan, including a $10.0 million sublimit for the issuance of standby letters of credit and a swingline sublimit of $20.0 million. The 2021 Credit Facility also included an option to increase the amount of the revolving loan up to an additional $75.0 million, subject to the terms of the 2021 Credit Facility. The 2021 Credit Facility was set to mature on November 12, 2026. The obligations under the 2021 Credit Facility were secured by substantially all assets of the Company, Resources Connection LLC and all of the Company’s domestic subsidiaries.
Borrowings under the 2021 Credit Facility bore interest at a rate per annum of either, at the Company’s election, (i) Term SOFR (as defined in the 2021 Credit Facility) plus a margin ranging from 1.25% to 2.00% or (ii) the Base Rate (as defined in the 2021 Credit Facility), plus a margin of 0.25% to 1.00% with the applicable margin depending on the Company’s consolidated leverage ratio. In addition, the Company paid an unused commitment fee on the average daily unused portion of the 2021 Credit Facility, which ranged from 0.20% to 0.30% depending upon the Company’s consolidated leverage ratio. As of May 31, 2025, we had no debt outstanding and $1.0 million of outstanding letters of credit issued under the 2021 Credit Facility. As of May 31, 2025, there was $174.0 million remaining capacity under the 2021 Credit Facility.
The 2021 Credit Facility was available for working capital and general corporate purposes, including potential acquisitions, dividend distribution and stock repurchases. Additional information regarding the 2021 Credit Facility is included in Note 8 – Long-Term Debt in the Notes to Consolidated Financial Statements included in this Annual Report.
On July 2, 2025, the Company, Resources Connection LLC, as borrowers, and all of the Company’s domestic subsidiaries, as guarantors, entered into a credit agreement with the lenders that are party thereto and Bank of America, N.A. as administrative agent, L/C issuer and swingline lender (the “New Credit Facility”), and concurrently terminated the 2021 Credit Facility. The New Credit Facility provides for a secured revolving loan, available in an amount up to the lesser of $50.0 million and a borrowing base formula tied to eligible receivables, which includes a $10.0 million sublimit for the issuance of standby letters of credit. The New Credit Facility also includes an option to increase the amount of the revolving loan up to an additional $15.0 million. The New Credit Facility will mature on November 30, 2029. The obligations under the New Credit Facility are secured by substantially all assets of the Company, Resources Connection LLC and all of the Company’s domestic subsidiaries.
Borrowings under the New Credit Facility bear interest at a rate per annum of either, at the Company's election (i) Term SOFR (as defined in the New Credit Facility) plus a margin ranging from 1.25% to 2.50% or (ii) the Base Rate (as defined in the New Credit Facility), plus a margin of 0.25% to 1.50%, in either case, with the applicable margin depending on the Company's Consolidated EBITDA (as defined in the New Credit Facility). The Company is also obligated to pay other customary facility fees for a credit facility of this size and type.
On November 2, 2022, Resources Global Enterprise Consulting (Beijing) Co., Ltd, (a wholly owned subsidiary of the Company), as borrower, and the Company, as guarantor, entered into a RMB 13.4 million (USD $1.8 million based on the prevailing exchange rate on November 2, 2022) revolving credit facility with Bank of America, N.A. (Beijing) as the lender (the “Beijing Revolver”). The Beijing Revolver bears interest at a loan prime rate plus 0.80%. Interest incurred on
32 — rgp. 2025 Annual Report
borrowings will be payable monthly in arrears. As of May 31, 2025, the Company had no debt outstanding under the Beijing Revolver.
In addition to cash needs for ongoing business operations, from time to time, we have strategic initiatives that could generate significant additional cash requirements. Our initiative to upgrade our technology platform, as described in “Fiscal 2025 Strategic Focus Areas” above, requires significant investments over multiple years. Such costs primarily include software licensing fees, third-party implementation and consulting fees, incremental costs associated with additional internal resources needed on the project and other costs in areas including change management and training. As of May 31, 2025, we capitalized $20.8 million related to the technology platform initiative; in addition, we recorded $5.5 million of expenses relating to these investments during fiscal 2025. We launched the new technology platform in most of North America in December 2024. We believe our current cash, ongoing cash flows from our operations and funding available under our Credit Facility will provide sufficient funds for these initiatives. As of May 31, 2025, we have non-cancellable purchase obligations totaling $8.7 million, which primarily consist of payments pursuant to the licensing arrangements that we have entered into in connection with this initiative: $4.4 million due during fiscal 2026; $2.9 million due during fiscal 2027; and $1.4 million due thereafter.
In addition, we pay a regular quarterly dividend to our stockholders, subject to approval each quarter by our Board of Directors. Most recently, on April 29, 2025, our Board of Directors approved a cash dividend of $0.07 per share of our common stock, payable on July 21, 2025 to stockholders of record at the close of business on June 23, 2025. Continuation of the quarterly dividend is at the discretion of the Board of Directors and depends upon our financial condition, results of operations, capital requirements, general business condition, contractual restrictions contained in the New Credit Facility and other agreements, and other factors deemed relevant by our Board of Directors.
On November 15, 2023, the Company acquired CloudGo pursuant to the terms of a Share Purchase Agreement entered into by and between the Company, CloudGo, and the shareholders of CloudGo (the “CloudGo SPA”). The Company paid initial cash consideration of $7.4 million (net of $0.3 million cash acquired). The CloudGo SPA also provides for contingent consideration of up to $12.0 million to be paid based on CloudGo’s revenue and operating profit margin performance during two one-year performance periods that begin after the acquisition date. See Note 3 – Acquisitions and Dispositions in the Notes to Consolidated Financial Statements included in this Annual Report for further discussion.
On July 1, 2024, the Company entered into an Amended and Restated Membership Interest Purchase Agreement (the “Reference Point MIPA”) with Reference Point and the holder of all the outstanding membership interests of Reference Point, in which the Company acquired 100% of the membership interests of Reference Point. The Company paid cash consideration of $23.2 million (net of $0.2 million cash acquired). See Note 3 – Acquisitions and Dispositions in the Notes to Consolidated Financial Statements included in this Annual Report for further discussion.
As described under "Market Trends and Uncertainties" above, uncertain macroeconomic conditions including ambiguity around interest rates, softening labor markets, fluctuations in currency exchange rates, recent government and policy changes implemented in the United States, and tariff actions and uncertainties related to trade wars have created significant uncertainty in the global economy, volatility in the capital markets and recessionary pressures, which have adversely impacted, and may continue to adversely impact, our financial results, operating cash flows and liquidity needs. If we are required to raise additional capital or incur additional indebtedness for our operations or to invest in our business, we can provide no assurances that we would be able to do so on acceptable terms or at all. Our ongoing operations and growth strategy may require us to continue to make investments in critical markets and further expand our internal technology and digital capabilities. In addition, we may consider making additional strategic acquisitions or initiating additional restructuring initiatives, which could require significant liquidity and adversely impact our financial results due to higher cost of borrowings. We believe that our current cash, ongoing cash flows from our operations and funding available under our New Credit Facility will be adequate to meet our working capital and capital expenditure needs for at least the next 12 months.
Beyond the next 12 months, if we require additional capital resources to grow our business, either organically or through acquisitions, we may seek to sell additional equity securities, increase the use of our New Credit Facility, expand the size of our New Credit Facility or raise additional debt. In addition, if we decide to make additional share repurchases, we may fund these through existing cash balances or the use of our New Credit Facility. The sale of additional equity securities or certain forms of debt financing could result in additional dilution to our stockholders. Our ability to secure additional financing in the future, if needed, will depend on several factors. These include our future profitability and the overall condition of the credit markets. Notwithstanding these considerations, we expect to meet our long-term liquidity needs with cash flows from operations and financing arrangements.
rgp. 2025 Annual Report — 33
Operating Activities, Fiscal 2025 and 2024
Operating activities provided cash of $18.9 million in fiscal 2025 compared to $21.9 million in fiscal 2024. The cash provided by operations during fiscal 2025 was primarily due to a net loss of $191.8 million, offset by non-cash adjustments of $200.8 million, which included a $194.4 million non-cash goodwill impairment charge. Additionally, during fiscal 2025, net favorable changes in operating assets and liabilities totaled $9.9 million, primarily consisting of a $10.4 million decrease in trade accounts receivable and a $3.1 million increase in accrued salaries and related obligations, mainly due to the timing of our pay cycle, and a $1.9 million change in other liabilities. This favorable change was partially offset by a $3.6 million increase in prepaid expenses and other assets and a $1.2 million decrease in accounts payable and accrued expenses.
During fiscal 2024, cash provided from operations resulted from net income of $21.0 million and non-cash adjustments of $11.2 million. Additionally, during fiscal 2024, net unfavorable changes in operating assets and liabilities totaled $10.4 million, primarily consisting of a $24.5 million decrease in accrued salaries and related obligations, mainly due to the timing of our pay cycle and the payout of the annual incentive compensation during fiscal 2024, a $9.9 million increase in other assets largely related to the investments in our technology implementation, a $3.3 million increase in prepaid income taxes, a $1.9 million decrease in other liabilities, and a $0.8 million increase in prepaids and other assets. These unfavorable changes are partially offset by a $29.6 million decrease in trade accounts receivable.
Investing Activities, Fiscal 2025 and 2024
Net cash used in investing activities was $13.6 million in fiscal 2025 compared to net cash used of $8.6 million in fiscal 2024. Net cash used in investing activities during fiscal 2025 was primarily related to the net $23.2 million of cash used for the acquisition of Reference Point and $2.7 million of cash used for the development of internal-use software and acquisition of property and equipment, partially offset by the $12.3 million in net proceeds from the sale of the Irvine office building. Net cash used in investing activities during fiscal 2024 was primarily related to the net $7.4 million acquisition of CloudGo and $1.1 million of costs incurred for the development of internal-use software and acquisition of property and equipment.
Financing Activities, Fiscal 2025 and 2024
For the past three fiscal years, the primary sources of cash in financing activities are borrowings under our 2021 Credit Facility, cash proceeds from the exercise of employee stock options and proceeds from the issuance of shares purchased under our ESPP. The primary uses of cash in financing activities are repayments under the 2021 Credit Facility, repurchases of our common stock and cash dividend payments to our stockholders.
Net cash used in financing activities totaled $27.7 million during fiscal 2025 compared to $20.7 million during fiscal 2024. Net cash used in financing activities during fiscal 2025 consisted of $13.0 million to purchase 1,382,820 shares of common stock on the open market and cash dividend payments of $18.6 million; these uses were partially offset by $3.9 million in proceeds received from ESPP share purchases and employee stock option exercises.
Net cash used in financing activities during fiscal 2024 consisted of $8.0 million to purchase 606,254 shares of common stock on the open market and cash dividend payments of $18.8 million; these uses were partially offset by $6.1 million in proceeds received from ESPP share purchases and employee stock option exercises.
For a comparison of our cash flow activities for the fiscal years ended May 25, 2024 and May 27, 2023, see Part II, Item 7 “Management’s Discussion and Analysis of Financial Condition and Results of Operations” of our Annual Report on Form 10-K for the fiscal year ended May 25, 2024, filed with the SEC on July 22, 2024 (File No. 0-32113).
Recent Accounting Pronouncements
Information regarding recent accounting pronouncements is contained in Note 2 — Summary of Significant Accounting Policies in the Notes to Consolidated Financial Statements included in this Annual Report.
34 — rgp. 2025 Annual Report
QUANTITATIVE AND QUALITATIVE DISCLOSURES ABOUT MARKET RISK.
Interest Rate Risk. We are primarily exposed to market risks from fluctuations in interest rates and the effects of those fluctuations on the market values of our cash and cash equivalents and our borrowings under the 2021 Credit Facility that bore interest at a variable market rate.
As of May 31, 2025, we had approximately $86.1 million of cash and cash equivalents and no borrowings under our 2021 Credit Facility. The earnings on cash and cash equivalents are subject to changes in interest rates; however, assuming a constant balance available for investment, a 10% decline in interest rates would reduce our interest income but would not have a material impact on our consolidated financial position or results of operations.
We may become exposed to interest rate risk related to fluctuations in the term SOFR rate used under our New Credit Facility. See “Liquidity and Capital Resources” above and Note 8 – Long-Term Debt in the Notes to Consolidated Financial Statements included in this Annual Report for further discussion about the interest rate on our 2021 Credit Facility and New Credit Facility. As of May 31, 2025, we had no borrowings outstanding and $1.0 million of outstanding letters of credit issued under our 2021 Credit Facility.
Foreign Currency Exchange Rate Risk. For the year ended May 31, 2025, approximately 18.2% of our revenues were generated outside of the U.S. compared to approximately 17.8% of our revenues for the year ended May 25, 2024. As a result, our operating results are subject to fluctuations in the exchange rates of foreign currencies in relation to the U.S. dollar. Revenues and expenses denominated in foreign currencies are translated into U.S. dollars at the monthly average exchange rates prevailing during the period. Thus, as the value of the U.S. dollar fluctuates relative to the currencies in our non-U.S.-based operations, our reported results may vary.
Assets and liabilities of our non-U.S.-based operations are translated into U.S. dollars at the exchange rate effective at the end of each monthly reporting period. Approximately 54.2% of our cash and cash equivalents balances as of May 31, 2025 were denominated in U.S. dollars. The remaining amount of approximately 45.8% was comprised primarily of cash balances translated from Euros, Mexican Pesos, Canadian Dollar, Chinese Yuan, Indian Rupee, Japanese Yen and British Pound Sterling. This compares to approximately 59.2% of our cash and cash equivalents balances as of May 25, 2024 that were denominated in U.S. dollars and approximately 40.8% that were comprised primarily of cash balances translated from Euros, Japanese Yen, Chinese Yuan and Canadian Dollars. The difference resulting from the translation in each period of assets and liabilities of our non-U.S.-based operations is recorded as a component of stockholders’ equity in accumulated other comprehensive income or loss.
Although we monitor our exposure to foreign currency fluctuations, we do not currently use financial hedges to mitigate risks associated with foreign currency fluctuations including in a limited number of circumstances when we may be asked to transact with our client in one currency but are obligated to pay our consultants in another currency. Our foreign entities typically transact with clients and consultants in their local currencies and generate enough operating cash flows to fund their own operations. We believe our economic exposure to exchange rate fluctuations has not been material. However, we cannot provide assurance that exchange rate fluctuations will not adversely affect our financial results in the future.
rgp. 2025 Annual Report — 35
CONSOLIDATED FINANCIAL STATEMENTS
Report of Independent Registered Public Accounting Firm
To the Stockholders and the Board of Directors of Resources Connection, Inc.
Opinions on the Financial Statements and Internal Control Over Financial Reporting
We have audited the accompanying consolidated balance sheets of Resources Connection, Inc. and its subsidiaries (the Company) as of May 31, 2025 and May 25, 2024, and the related consolidated statements of operations, comprehensive (loss) income, stockholders’ equity and cash flows for each of the three years in the period ended May 31, 2025, and the related notes (collectively, the financial statements). We also have audited the Company’s internal control over financial reporting as of May 31, 2025, based on criteria established in Internal Control—Integrated Framework issued by the Committee of Sponsoring Organizations of the Treadway Commission in 2013.
In our opinion, the financial statements referred to above present fairly, in all material respects, the financial position of the Company as of May 31, 2025 and May 25, 2024, and the results of its operations and its cash flows for each of the three years in the period ended May 31, 2025, in conformity with accounting principles generally accepted in the United States of America. Also in our opinion, the Company maintained, in all material respects, effective internal control over financial reporting as of May 31, 2025, based on criteria established in Internal Control—Integrated Framework issued by the Committee of Sponsoring Organizations of the Treadway Commission in 201
Basis for Opinions
The Company’s management is responsible for these financial statements, for maintaining effective internal control over financial reporting, and for its assessment of the effectiveness of internal control over financial reporting, included in the accompanying Management’s Report on Internal Control Over Financial Reporting. Our responsibility is to express an opinion on the Company’s financial statements and an opinion on the Company’s internal control over financial reporting based on our audits. We are a public accounting firm registered with the Public Company Accounting Oversight Board (United States) (PCAOB) and are required to be independent with respect to the Company in accordance with U.S. federal securities laws and the applicable rules and regulations of the Securities and Exchange Commission and the PCAOB.
We conducted our audits in accordance with the standards of the PCAOB. Those standards require that we plan and perform the audit to obtain reasonable assurance about whether the financial statements are free of material misstatement, whether due to error or fraud, and whether effective internal control over financial reporting was maintained in all material respects.
Our audits of the financial statements included performing procedures to assess the risks of material misstatement of the financial statements, whether due to error or fraud, and performing procedures that respond to those risks. Such procedures included examining, on a test basis, evidence regarding the amounts and disclosures in the financial statements. Our audits also included evaluating the accounting principles used and significant estimates made by management, as well as evaluating the overall presentation of the financial statements. Our audit of internal control over financial reporting included obtaining an understanding of internal control over financial reporting, assessing the risk that a material weakness exists, and testing and evaluating the design and operating effectiveness of internal control based on the assessed risk. Our audits also included performing such other procedures as we considered necessary in the circumstances. We believe that our audits provide a reasonable basis for our opinions.
Definition and Limitations of Internal Control Over Financial Reporting
A company’s internal control over financial reporting is a process designed to provide reasonable assurance regarding the reliability of financial reporting and the preparation of financial statements for external purposes in accordance with generally accepted accounting principles. A company’s internal control over financial reporting includes those policies and procedures that (1) pertain to the maintenance of records that, in reasonable detail, accurately and fairly reflect the transactions and dispositions of the assets of the company; (2) provide reasonable assurance that transactions are recorded as necessary to permit preparation of financial statements in accordance with generally accepted accounting principles, and that receipts and expenditures of the company are being made only in accordance with authorizations of management and directors of the company; and (3) provide reasonable assurance regarding prevention or timely detection of unauthorized acquisition, use or disposition of the company’s assets that could have a material effect on the financial statements.
Because of its inherent limitations, internal control over financial reporting may not prevent or detect misstatements. Also, projections of any evaluation of effectiveness to future periods are subject to the risk that controls may become inadequate because of changes in conditions, or that the degree of compliance with the policies or procedures may deteriorate.
36 — rgp. 2025 Annual Report
Critical Audit Matter
The critical audit matter communicated below is a matter arising from the current period audit of the financial statements that was communicated or required to be communicated to the audit committee of the board of directors and that: (1) relate to accounts or disclosures that are material to the financial statements and (2) involved our especially challenging, subjective or complex judgments. The communication of this critical audit matter does not alter in any way our opinion on the financial statements, taken as a whole, and we are not, by communicating the critical audit matter below, providing separate opinions on the critical audit matter or on the accounts or disclosures to which it relates.
Annual and Interim Goodwill Impairment Assessments
As described in Notes 2 and 5 to the financial statements, the Company’s consolidated net goodwill balance was $28.8 million as of May 31, 2025. The Company tests for goodwill impairment at the reporting unit level at least annually on the first day of the last quarter of the fiscal year or more frequently if facts, events or circumstances indicate that the carrying amount of goodwill may not be recoverable.
On May 26, 2024, management realigned its reporting units due to a change in organizational structure. Reporting units under the former structure were tested for impairment prior to the realignment, and no impairment was identified. As a result of the realignment, the Company reallocated its existing goodwill to its new reporting units which resulted from the change in its operating segments. Goodwill was reassigned to each of the new reporting units using a relative fair value approach and reconciled to its market capitalization. Management assessed the goodwill of the new reporting units for impairment as of May 26, 2024 and determined that there was $3.8 million of goodwill impairment in the Europe & Asia Pacific reporting unit.
During the second, third and fourth quarters of 2025, the Company experienced a sustained decline in its stock price resulting in the market capitalization being less than the carrying value of the combined reporting units. After considering all available evidence in the evaluation of goodwill impairment indicators, management determined it appropriate to perform interim quantitative assessments of the reporting units during those periods. As a result of these quantitative assessments performed, the Company incurred an aggregate impairment charge of $190.6 million for fiscal year 2025 in the On-Demand Talent, Consulting and Europe & Asia Pacific reporting units.
The Company’s determination of the estimated fair value for each reporting unit was based on a market-based approach, income-based approach or a combination of both approaches. The market-based approach was based on the guideline public company method, which uses market multiples of revenue and earnings before interest, taxes, depreciation and amortization (EBITDA) for a group of comparable public companies. The income-based approach was based on the present value of discounted cash flows of each reporting unit, using the Company’s assumptions regarding revenue growth rates, forecasted gross profit margins, forecasted earnings and free cash flows, terminal period growth rates, and other economic and market trends. Additionally, the present value was based on applying a weighted average cost of capital, which considered long-term interest rates and cost of equity based on the reporting segment’s risk profile.
We identified the valuation of goodwill as a critical audit matter given the significant estimates and assumptions the Company makes to determine the fair value of the reporting unit including revenue growth rates, adjusted EBITDA margin and discount rates. Auditing the reasonableness of the Company’s estimates and assumptions required a high degree of auditor judgment and an increased audit effort, including the involvement of our valuation specialists.
Our audit procedures related to the valuation of goodwill for each reporting unit included the following, among others:
•We obtained an understanding of the relevant controls related to the Company’s goodwill valuation and tested such controls for design and operating effectiveness, including management’s review of the significant assumptions used in the estimate of fair value.
•We evaluated the reasonableness of management’s forecasts of revenue growth rates by comparing the forecasts to (1) historical results, and (2) external market data.
•We evaluated the reasonableness of management’s forecasts of adjusted EBITDA margin as a percentage of revenue by comparing the forecasts to the historical results, and comparison to guideline public companies.
•With the assistance of our valuation specialists, we evaluated the reasonableness of the Company’s valuation methodologies and significant assumptions by:
•Evaluating the reasonableness of the discount rates by comparing the underlying source information to publicly available market data and verifying the accuracy of the calculations.
•Evaluating the appropriateness of the valuation methods used by management and testing the mathematical accuracy.
rgp. 2025 Annual Report — 37
/s/ RSM US LLP
We have served as the Company’s auditor since 2012.
Irvine, California
July 28, 2025
38 — rgp. 2025 Annual Report
RESOURCES CONNECTION, INC.
CONSOLIDATED BALANCE SHEETS
(In thousands, except par value per share)
| | | | | | | | | | | |
| May 31, 2025 | | May 25, 2024 |
| ASSETS | | | |
| Current assets: | | | |
| Cash and cash equivalents | $ | 86,147 | | | $ | 108,892 | |
Trade accounts receivable, net of allowances of $2,603 and $2,755 as of May 31, 2025 and May 25, 2024 , respectively | $ | 99,210 | | | 108,515 | |
| Prepaid expenses and other current assets | $ | 10,246 | | | 6,888 | |
| Assets held for sale | - | | | 8,909 | |
| Income taxes receivable | 8,083 | | | 7,551 | |
| Total current assets | 203,686 | | | 240,755 | |
| Goodwill | 28,757 | | | 216,579 | |
| Intangible assets, net | 18,978 | | | 9,573 | |
| Property and equipment, net | 4,423 | | | 3,763 | |
| Operating right-of-use assets | 22,551 | | | 11,899 | |
| Deferred tax assets | 9,280 | | | 11,312 | |
| Other non-current assets | 17,013 | | | 17,033 | |
| Total assets | $ | 304,688 | | | $ | 510,914 | |
| | | |
| LIABILITIES AND STOCKHOLDERS’ EQUITY | | | |
| Current liabilities: | | | |
| Accounts payable and other accrued expenses | $ | 13,902 | | | $ | 15,223 | |
| Accrued salaries and related obligations | 47,931 | | | 41,999 | |
| Operating lease liabilities, current | 5,149 | | | 4,735 | |
| Other liabilities | 8,420 | | | 10,476 | |
| Total current liabilities | 75,402 | | | 72,433 | |
| Long-term debt | - | | | - | |
| Operating lease liabilities, non-current | 20,156 | | | 8,586 | |
| Deferred tax liabilities | 92 | | | 8,680 | |
| Other non-current liabilities | 1,957 | | | 2,452 | |
| Total liabilities | 97,607 | | | 92,151 | |
| Commitments and contingencies (Note 17) | | | |
| Stockholders’ equity: | | | |
Preferred stock, $0.01 par value, 5,000 shares authorized; zero shares issued and outstanding | - | | | - | |
Common stock, $0.01 par value, 70,000 shares authorized; 37,027 and 36,194 shares issued, and 33,075 and 33,556 shares outstanding as of May 31, 2025 and May 25, 2024, respectively | 370 | | | 363 | |
| Additional paid-in capital | 400,180 | | | 389,720 | |
| Accumulated other comprehensive loss | (17,863) | | | (17,713) | |
| Retained earnings | (121,575) | | | 88,595 | |
Treasury stock at cost, 3,952 and 2,638 shares as of May 31, 2025 and May 25, 2024, respectively | (54,031) | | | (42,202) | |
| Total stockholders’ equity | 207,081 | | | 418,763 | |
| Total liabilities and stockholders’ equity | $ | 304,688 | | | $ | 510,914 | |
The accompanying notes are an integral part of these consolidated financial statements.
rgp. 2025 Annual Report — 39
RESOURCES CONNECTION, INC.
CONSOLIDATED STATEMENTS OF OPERATIONS
(In thousands, except per share amounts)
| | | | | | | | | | | | | | | | | |
| For the Years Ended |
| May 31, 2025 | | May 25, 2024 | | May 27, 2023 |
| Revenue | $ | 551,331 | | | $ | 632,801 | | | $ | 775,643 | |
| Direct cost of services | 343,907 | | | 386,733 | | | 462,501 | |
| Gross profit | 207,424 | | | 246,068 | | | 313,142 | |
| Selling, general and administrative expenses | 202,024 | | | 208,864 | | | 228,842 | |
Goodwill impairment | 194,409 | | | - | | | 2,955 | |
Amortization expense | 5,880 | | | 5,378 | | | 5,018 | |
Depreciation expense | 1,868 | | | 3,050 | | | 3,539 | |
| Income from operations | (196,757) | | | 28,776 | | | 72,788 | |
| Interest (income) expense, net | (544) | | | (1,064) | | | 552 | |
| Other expense (income) | (138) | | | 11 | | | (382) | |
| Income before income tax expense | (196,075) | | | 29,829 | | | 72,618 | |
| Income tax expense | (4,295) | | | 8,795 | | | 18,259 | |
| Net income | $ | (191,780) | | | $ | 21,034 | | | $ | 54,359 | |
| | | | | |
| Net income per common share: | | | | | |
| Basic | $ | (5.80) | $ | (5.80) | $ | 0.63 | | $ | 1.63 |
| Diluted | $ | (5.80) | | $ | 0.62 | | $ | 1.59 |
| | | | | |
| Weighted-average number of common and common equivalent shares outstanding: | | | | | |
| Basic | 33,063 | | 33,445 | | 33,407 |
| Diluted | 33,063 | | 33,895 | | 34,185 |
| | | | | |
| Cash dividends declared per common share | $ | 0.49 | | $ | 0.56 | | $ | 0.56 |
The accompanying notes are an integral part of these consolidated financial statements.
40 — rgp. 2025 Annual Report
RESOURCES CONNECTION, INC.
CONSOLIDATED STATEMENTS OF COMPREHENSIVE INCOME
(In thousands)
| | | | | | | | | | | | | | | | | |
| For the Years Ended |
| May 31, 2025 | | May 25, 2024 | | May 27, 2023 |
| | | | | |
| Net income | $ | (191,780) | | | $ | 21,034 | | | $ | 54,359 | |
| Foreign currency translation adjustment, net of tax | (150) | | | (423) | | | (806) | |
| Total comprehensive income | $ | (191,930) | | | $ | 20,611 | | | $ | 53,553 | |
The accompanying notes are an integral part of these consolidated financial statements.
rgp. 2025 Annual Report — 41
RESOURCES CONNECTION, INC.
CONSOLIDATED STATEMENTS OF STOCKHOLDERS’ EQUITY
(In thousands, except per share amounts)
| | | | | | | | | | | | | | | | | | | | | | | | | | | | | | | | | | | | | | | | | | | | | | | |
| Common Stock | | Additional
Paid-in
Capital | | Treasury Stock | | Other
Comprehensive
Loss | | Retained
Earnings | | Total
Stockholders'
Equity |
| Shares | | Amount | | | Shares | | Amount | | | |
Balances as of May 28,2022 | 34,352 | | $ | 344 | | | $ | 355,502 | | | 1,155 | | $ | (19,651) | | | $ | (16,484) | | | $ | 52,738 | | | $ | 372,449 | |
| Exercise of stock options | 624 | | 5 | | | 9,026 | | | - | | - | | | - | | | - | | | 9,031 | |
| Stock-based compensation expense | - | | - | | | 9,270 | | | - | | - | | | - | | | - | | | 9,270 | |
| Issuance of common stock purchased under Employee Stock Purchase Plan | 393 | | 4 | | | 5,995 | | | - | | - | | | - | | | - | | | 5,999 | |
| Issuance of restricted stock | 97 | | 1 | | | (1) | | | - | | - | | | - | | | - | | | - | |
| Issuance of common stock upon vesting of restricted stock units, net shares withheld to cover taxes | 79 | | 1 | | | (1,763) | | | - | | - | | | - | | | (5) | | | (1,767) | |
Cash dividends declared ($0.49 per share) | - | | - | | | - | | | - | | - | | | - | | | (18,816) | | | (18,816) | |
| Repurchase of common stock | - | | - | | | - | | | 915 | | (15,199) | | | - | | | - | | | (15,199) | |
| Dividend equivalents on equity awards | - | | - | | | 628 | | | - | | - | | | - | | | (628) | | | - | |
| Currency translation adjustment | - | | - | | | - | | | - | | - | | | (806) | | | - | | | (806) | |
Net income for the year ended May 27, 2023 | - | | - | | | - | | | - | | - | | | - | | | 54,359 | | | 54,359 | |
Balances as of May 27, 2023 | 35,545 | | $ | 355 | | | $ | 378,657 | | | 2,070 | | $ | (34,850) | | | $ | (17,290) | | | $ | 87,648 | | | $ | 414,520 | |
| Exercise of stock options | 32 | | 1 | | | 451 | | | - | | - | | | - | | | - | | | 452 | |
| Stock-based compensation expense | - | | - | | | 5,703 | | | - | | - | | | - | | | - | | | 5,703 | |
| Issuance of common stock purchased under Employee Stock Purchase Plan | 456 | | 5 | | | 5,646 | | | - | | - | | | - | | | - | | | 5,651 | |
| Issuance of restricted stock | 75 | | 1 | | | (1) | | | (38) | | 648 | | | - | | | (648) | | | - | |
| Issuance of common stock upon vesting of restricted stock units, net shares withheld to cover taxes | 86 | | 1 | | | (1,336) | | | - | | - | | | - | | | - | | | (1,335) | |
Cash dividends declared ($0.49 per share) | - | | - | | | - | | | - | | - | | | - | | | (18,839) | | | (18,839) | |
| Repurchase of common stock | - | | - | | | - | | | 606 | | (8,000) | | | - | | | - | | | (8,000) | |
| Dividend equivalents on equity awards | - | | - | | | 600 | | | - | | - | | | - | | | (600) | | | - | |
| Currency translation adjustment | - | | - | | | - | | | - | | - | | | (423) | | | - | | | (423) | |
Net income for the year ended May 25,2024 | - | | - | | | - | | | - | | - | | | - | | | 21,034 | | | 21,034 | |
Balances as of May 25, 2024 | 36,194 | | $ | 363 | | | $ | 389,720 | | | 2,638 | | $ | (42,202) | | | $ | (17,713) | | | $ | 88,595 | | | $ | 418,763 | |
| Stock-based compensation expense | - | | - | | | 7,249 | | | - | | - | | | - | | | - | | | 7,249 | |
| Issuance of common stock purchased under Employee Stock Purchase Plan | 493 | | 4 | | | 3,910 | | | - | | - | | | - | | | - | | | 3,914 | |
| Issuance of restricted stock | 80 | | 1 | | | (1) | | | (69) | | 1,170 | | | - | | | (1,170) | | | - | |
| Issuance of common stock upon vesting of restricted stock units, net shares withheld to cover taxes | 260 | | 2 | | | (1,639) | | | - | | - | | | - | | | - | | | (1,637) | |
Cash dividends declared ($0.49 per share) | - | | - | | | - | | | - | | - | | | - | | | (16,282) | | | (16,282) | |
| Repurchase of common stock | - | | - | | | - | | | 1,383 | | (12,999) | | | - | | | - | | | (12,999) | |
| Dividend equivalents on equity awards | - | | - | | | 938 | | | - | | - | | | - | | | (938) | | | - | |
| Currency translation adjustment | - | | - | | | 3 | | | - | | - | | | (150) | | | - | | | (147) | |
Net loss for the year ended May 31, 2025 | - | | - | | | - | | | - | | - | | | - | | | (191,780) | | | (191,780) | |
Balances as of May 31, 2025 | 37,027 | | $ | 370 | | | $ | 400,180 | | | 3,952 | | $ | (54,031) | | | $ | (17,863) | | | $ | (121,575) | | | $ | 207,081 | |
The accompanying notes are an integral part of these consolidated financial statements.
42 — rgp. 2025 Annual Report
RESOURCES CONNECTION, INC.
CONSOLIDATED STATEMENTS OF CASH FLOWS
(In thousands)
| | | | | | | | | | | | | | | | | |
| For the Years Ended |
| May 31, 2025 | | May 25, 2024 | | May 27, 2023 |
| Cash flows from operating activities: | | | | | |
Net income (loss) | $ | (191,780) | | | $ | 21,034 | | | $ | 54,359 | |
Adjustments to reconcile net income (loss) to net cash provided by operating activities: | | | | | |
| Depreciation and amortization expense | 7,748 | | | 8,428 | | | 8,557 | |
| Stock-based compensation expense | 6,754 | | | 5,732 | | | 9,521 | |
| Contingent consideration adjustment | - | | | (4,400) | | | - | |
Loss on dissolution of subsidiaries | - | | | - | | | 220 | |
(Gain) loss on sale of assets | (3,687) | | | 574 | | | 38 | |
Impairment of goodwill | 194,409 | | | - | | | 2,955 | |
| Adjustment to allowances | 1,239 | | | 137 | | | 1,440 | |
| Deferred income taxes | (6,305) | | | 440 | | | (9,701) | |
| Other, net | 612 | | | 336 | | | (268) | |
Changes in operating assets and liabilities, net of acquisitions and dispositions: | | | | | |
| Trade accounts receivable | 10,416 | | | 29,631 | | | 13,552 | |
| Prepaid expenses and other current assets | (3,604) | | | (766) | | | 294 | |
| Income taxes | (545) | | | (3,252) | | | 30,027 | |
| Other assets | (83) | | | (9,862) | | | (4,067) | |
| Accounts payable and other accrued expenses | (1,209) | | | 305 | | | 1,551 | |
| Accrued salaries and related obligations | 3,078 | | | (24,531) | | | (21,535) | |
| Other liabilities | 1,856 | | | (1,887) | | | (5,307) | |
| Net cash provided by operating activities | 18,899 | | | 21,919 | | | 81,636 | |
| | | | | |
| Cash flows from investing activities: | | | | | |
Proceeds from sale of taskforce | - | | | - | | | 5,953 | |
Net proceeds from the sale of assets | 12,309 | | | - | | | 2 | |
Acquisition of Reference Point, net of cash acquired | (23,169) | | | - | | | - | |
| Acquisition of CloudGo, net of cash acquired | - | | | (7,411) | | | - | |
| Investments in property and equipment and internal-use software | (2,711) | | | (1,143) | | | (2,012) | |
| Net cash (used in) provided by investing activities | (13,571) | | | (8,554) | | | 3,943 | |
| | | | | |
| Cash flows from financing activities: | | | | | |
| Proceeds from exercise of stock options | - | | | 465 | | | 10,070 | |
| Proceeds from issuance of common stock under Employee Stock Purchase Plan | 3,914 | | | 5,651 | | | 5,999 | |
| Repurchase of common stock | (12,999) | | | (8,000) | | | (15,199) | |
| Proceeds from Revolving Credit Facility | - | | | - | | | 15,000 | |
| Repayments on Revolving Credit Facility | - | | | - | | | (69,000) | |
| Payment of cash dividends | (18,646) | | | (18,825) | | | (18,784) | |
| Net cash used in financing activities | (27,731) | | | (20,709) | | | (71,914) | |
| | | | | |
| Effect of exchange rate changes on cash | (342) | | | (548) | | | (1,105) | |
| Net (decrease) increase in cash | (22,745) | | | (7,892) | | | 12,560 | |
| Cash and cash equivalents at beginning of period | 108,892 | | | 116,784 | | | 104,224 | |
Cash and cash equivalents at end of period | $ | 86,147 | | | $ | 108,892 | | | $ | 116,784 | |
| | | | | |
| Supplemental cash flow disclosures | | | | | |
| Income taxes paid (refund), net | $ | 2,353 | | | $ | 11,161 | | | $ | (2,913) | |
| Interest paid | $ | 354 | | | $ | 352 | | | $ | 962 | |
| Non-cash investing and financing activities | | | | | |
| Capitalized leasehold improvements paid directly by landlord | $ | 1,095 | | | $ | - | | | $ | - | |
| Dividends declared, not paid | $ | 2,317 | | | $ | 4,695 | | | $ | 4,681 | |
The accompanying notes are an integral part of these consolidated financial statements.
rgp. 2025 Annual Report — 43
RESOURCES CONNECTION, INC.
NOTES TO CONSOLIDATED FINANCIAL STATEMENTS
1. Description of the Company and its Business
Resources Connection, Inc. (the “Company”), a Delaware corporation, was incorporated on November 16, 1998. The Company’s operating entities provide services primarily under the name Resources Global Professionals (“RGP”). RGP is a professional services firm focused on delivering consulting execution services that power clients’ operational needs and change initiatives utilizing a combination of bench and on-demand, expert and diverse talent. As a next-generation human capital partner for its clients, the Company specializes in leadership and co-delivery of enterprise initiatives typically precipitated by business transformation, strategic transactions, or regulatory change. The Company’s principal markets of operations are North America, Europe, and Asia Pacific.
The Company’s fiscal year consists of 52 or 53 weeks, ending on the Saturday in May closest to May 31. Fiscal year 2025 consisted of three 13-week quarters and one 14-week fourth quarter for a total of 53 weeks. Fiscal years 2024 and 2023 consisted of four 13-week quarters and included a total of 52 weeks of activity in each fiscal year.
2. Summary of Significant Accounting Policies
Basis of Presentation and Principles of Consolidation
The Consolidated Financial Statements of the Company (“financial statements”) have been prepared in conformity with accounting principles generally accepted in the United States (“GAAP”) and the rules of the Securities and Exchange Commission (“SEC”). The financial statements include the accounts of the Company and its subsidiaries. All significant intercompany accounts and transactions have been eliminated in consolidation.
Reporting Segments
During the first quarter of fiscal 2025, the Chief Executive Officer announced a decision to reorganize the Company’s business by forming multiple discrete operational business units. To align the new operating model and financial reporting, the Company made management organizational changes and implemented new reporting modules and processes to provide discrete information to manage the business. During the first quarter of fiscal 2025, the Company completed its assessment of the Company's operating segments and identified the following newly defined operating segments:
•On-Demand Talent – this segment provides businesses with a go-to source for bringing in experts when they need them.
•Consulting – this segment drives transformation across people, processes and technology across domain areas including finance, technology and digital, risk and compliance and supply chain transformation.
•Europe & Asia Pacific – is a geographically defined segment that offers both on-demand and consulting services (excluding the digital consulting business, which is included in our Consulting segment) to clients throughout Europe and Asia Pacific.
•Outsourced Services – operating under the Countsy by RGPTM brand, this segment offers finance, accounting and HR services provided to startups, spinouts and scale-up enterprises, utilizing a technology platform and fractional team.
•Sitrick – a crisis communications and public relations firm that provides corporate, financial, transactional and crisis communication and management services.
Each of these segments reports through a separate segment manager to the Company’s Chief Executive Officer and Chief Operating Officer, who are collectively designated as the Chief Operating Decision Maker (“CODM”) for segment reporting purposes. The Company's reportable segments are comprised of On-Demand Talent, Consulting, Europe & Asia Pacific, and Outsourced Services. Sitrick does not individually meet the quantitative thresholds to qualify as a reportable segment. Therefore, Sitrick is disclosed under the “All Other” segment. Each of these segments represents a reporting unit for the purposes of assessing goodwill for impairment.
44 — rgp. 2025 Annual Report
On November 15, 2023, the Company acquired CloudGo Pte Ltd. and its subsidiaries (collectively, “CloudGo”). On July 1, 2024, the Company acquired Reference Point LLC (“Reference Point”). CloudGo and Reference Point are both reported as part of the Consulting operating segment. See Note 3 – Acquisitions and Dispositions in the Notes to Consolidated Financial Statements for further information.
Reclassifications
Certain prior period amounts have been reclassified to conform to current period presentation. These reclassifications had no effect on previously reported totals for assets, liabilities, stockholders’ equity, cash flows or net income.
Use of Estimates
The preparation of financial statements in conformity with GAAP requires management to make estimates and assumptions that affect the reported amounts of assets and liabilities and disclosure of contingent assets and liabilities at the date of the financial statements and the reported amounts of revenues and expenses during the reporting period. Although management believes these estimates and assumptions are adequate, actual results could differ from the estimates and assumptions used.
Revenue Recognition
The Company generates substantially all of its revenues from providing professional consulting services to its clients. Revenues are recognized when control of the promised service is transferred to the Company’s clients, in an amount that reflects the consideration expected in exchange for the services rendered. Revenue is recorded net of sales or other transaction taxes collected from clients and remitted to taxing authorities. Revenues for the vast majority of our contracts are recognized over time, based on hours worked by the Company’s professionals. The performance of the agreed-to service over time is the single performance obligation for revenues. Certain clients may receive discounts (for example, volume discounts or rebates) to the amounts billed. These discounts or rebates are considered variable consideration. Management evaluates the facts and circumstances of each contract and client relationship to estimate the variable consideration assessing the most likely amount to recognize and considering management’s expectation of the volume of services to be provided over the applicable period. Rebates are the largest component of variable consideration and are estimated using the most-likely-amount method, contracts terms and estimates of revenue. Revenues are recognized net of variable consideration to the extent that it is probable that a significant reversal of revenues will not occur in subsequent periods.
On a limited basis, the Company may have fixed-price contracts, for which revenues are recognized over time using the input method based on time incurred as a proportion of estimated total time. Time incurred represents work performed, which corresponds with, and therefore best depicts, the transfer of control to the client. Management uses significant judgments when estimating the total hours expected to complete the contract performance obligation. It is possible that updated estimates for consulting engagements may vary from initial estimates with such updates being recognized in the period of determination. Depending on the timing of billings and services rendered, the Company accrues or defers revenue as appropriate.
The Company recognizes revenues primarily on a gross basis as it acts as a principal for primarily all of its revenue transactions. The Company has concluded that gross reporting is appropriate because it controls the services before they are transferred to the customers. The Company a) has the risk of identifying and hiring qualified consultants; b) has the discretion to select the consultants and establish the price and responsibilities for services to be provided; c) is primarily responsible for fulfilling the promise to provide the service to the customer; and d) bears the risk for services provided that are not fully paid for by clients. The Company recognizes all reimbursements received from clients for “out-of-pocket” expenses as revenue and all such expenses as direct cost of services. Reimbursements received from clients were $4.4 million, $4.3 million and $4.7 million for the years ended May 31, 2025, May 25, 2024, and May 27, 2023, respectively.
Commissions earned by the Company’s sales professionals are considered incremental and recoverable costs of obtaining a contract with a customer. The Company elected to apply the practical expedient to expense sales commissions as incurred as the expected amortization period is one year or less. Sales commissions are recorded in selling, general and administrative expenses in the Company’s Consolidated Statements of Operations. During the years ended May 31, 2025, May 25, 2024 and May 27, 2023, sales commission expense was $3.1 million, $2.8 million, and $3.3 million, respectively.
rgp. 2025 Annual Report — 45
The Company’s clients are contractually obligated to pay the Company for all hours billed. The Company invoices most of its clients on a weekly basis or, in certain circumstances, on a bi-weekly or monthly basis, and its typical arrangement of payment is due within 30 days. To a much lesser extent, in certain circumstances, the Company also earns revenue if one of its consultants is hired by, or if the Company places an outside candidate with, its client. Conversion fees or permanent placement fees are recognized when one of the Company’s professionals, or a candidate identified by the Company, accepts an offer of permanent employment from a client and all requisite terms of the agreement have been met. Such conversion fees or permanent placement fees are recognized when the performance obligation is considered complete, which the Company considers a) when the consultant or candidate accepts the position; b) the consultant or candidate has notified either RGP or their current employer of their decision; and c) the start date is within the Company’s current quarter. Conversion fees were 0.2% of revenue for the year ended May 31, 2025, and 0.3% of revenue for each of the years ended May 25, 2024 and May 27, 2023. Permanent placement fees were 0.1%, 0.2% and 0.3% of revenue for the years ended May 31, 2025, May 25, 2024 and May 27, 2023, respectively.
The Company’s contracts generally have termination-for-convenience provisions and do not have termination penalties. While clients are contractually obligated to pay the Company for all hours billed, the Company does not have long-term agreements with its clients for the provision of services and the Company’s clients may terminate engagements at any time. All costs of compensating the Company’s professionals for services provided are the responsibility of the Company and are included in direct cost of services.
Foreign Currency Translation
The financial statements of subsidiaries outside the United States (“U.S.”) are measured using the local currency as the functional currency. Assets and liabilities of these subsidiaries are translated at current exchange rates, income and expense items are translated at average exchange rates prevailing during the period and the related translation adjustments are recorded as a component of comprehensive income or loss within stockholders’ equity. Gains and losses from foreign currency transactions are included in selling, general and administrative expenses in the Consolidated Statements of Operations.
Per Share Information
The Company presents both basic and diluted earnings (loss) per share (“EPS”). Basic EPS is calculated by dividing net income (loss) by the weighted-average number of common shares outstanding during the period. Diluted EPS is based upon the weighted-average number of common shares and potentially dilutive common shares outstanding during the period. Potentially dilutive shares of common stock include the assumed exercise of outstanding in-the-money stock options, assumed issuance of common stock under the Company's 2019 Employee Stock Purchase Plan, as amended (“ESPP”), assumed release of outstanding restricted stock awards (“RSAs”), restricted stock units (“RSUs”) and performance stock units (“PSUs”) using the treasury stock method. However, potentially dilutive shares of common stock are excluded from the computation in periods in which they have an anti-dilutive effect.
During the year ended May 31, 2025, the Company incurred a net loss, and as a result potentially dilutive common shares issuable from the assumed exercise of stock options and the assumed release of shares of common stock under the outstanding ESPP, RSAs, RSUs, and PSUs awards were not included in the diluted shares used to calculate net loss per share, as their inclusion would have been anti-dilutive.
46 — rgp. 2025 Annual Report
The following table summarizes the calculation of net income (loss) per share for the years ended May 31, 2025, May 25, 2024 and May 27, 2023 (in thousands, except per share amounts):
| | | | | | | | | | | | | | | | | |
| For the Years Ended |
| May 31,
2025 | | May 25,
2024 | | May 27,
2023 |
| | | | | |
| Net income (loss) | $ | (191,780) | | $ | 21,034 | | $ | 54,359 |
| Weighted-average shares outstanding: | | | | | |
| Basic weighted-average shares | 33,063 | | 33,445 | | 33,407 |
| Effect of dilutive shares: | | | | | |
| Weighted-average shares — Basic | 33,063 | | 33,445 | | 33,407 |
| Potentially dilutive stock options | - | | | 48 | | 359 |
| Potentially dilutive employee stock purchase plan | - | | | 14 | | 8 | |
| Potentially dilutive restricted stock awards | - | | | 56 | | 64 |
| Potentially dilutive restricted stock units | - | | | 179 | | 233 |
| Potentially dilutive performance stock units | - | | | 153 | | 114 |
| Diluted weighted-average shares outstanding | 33,063 | | 33,895 | | 34,185 |
| Net income (loss) per common share: | | | | | |
| Basic | $ | (5.80) | | $ | 0.63 | | $ | 1.63 |
| Dilutive | $ | (5.80) | | $ | 0.62 | | $ | 1.59 |
| Anti-dilutive shares not included above | 2,730 | | 2,152 | | 704 |
Cash and Cash Equivalents
The Company considers cash on hand, deposits in banks, and short-term investments purchased with an original maturity date of three months or less to be cash and cash equivalents. The carrying amounts reflected in the Consolidated Balance Sheets for cash and cash equivalents approximate the fair values due to the short maturities of these instruments.
Restricted Cash
Restricted cash consists of cash and claims to cash that are restricted as to withdrawal or usage. This includes cash designated for specific use in an acquisition or dissolution.
Financial Instruments
The fair value of the Company’s financial instruments reflects the amounts that the Company estimates it will receive in connection with the sale of an asset in an orderly transaction between market participants at the measurement date (exit price). The fair value hierarchy prioritizes the use of inputs used in valuation techniques into the following three levels:
Level 1 – Quoted prices in active markets for identical assets and liabilities.
Level 2 – Observable inputs other than quoted prices in active markets for identical assets and liabilities; quoted prices in markets that are not active; or other inputs that are observable or can be corroborated by observable market data for substantially the full term of the assets.
Level 3 – Unobservable inputs.
Contingent consideration liability is for estimated future contingent consideration payments related to the Company’s acquisitions. Total contingent consideration liabilities related to the acquisition of CloudGo were preliminarily valued at $4.4 million as of November 25, 2023 and zero as of May 31, 2025 and May 25, 2024, respectively. As a result, no further remeasurements or revisions are required. The fair value measurement of the liability was based on significant inputs not observed in the market and thus represents a Level 3 measurement. The significant unobservable inputs used in the fair value measurement of the contingent consideration liability at these dates were the Company’s measures of the estimated payouts based on internally generated financial projections and discount rates. The fair value of contingent consideration
rgp. 2025 Annual Report — 47
liability will be remeasured on a quarterly basis until settlement by the Company using additional information as it becomes available, and any change in the fair value estimates will be recorded in selling, general and administrative expenses in the Company’s Consolidated Statements of Operations. Future revisions to these significant unobservable inputs and the assumptions underlying them could materially change the estimate of the fair value of contingent consideration and therefore could materially affect the Company’s future operating results.
The Company’s remaining financial instruments, including cash and cash equivalents, trade accounts receivable, accounts payable and other accrued expenses, and long-term debt, are carried at cost, which approximates their fair value because of the short-term maturity of these instruments or because their stated interest rates are indicative of market interest rates.
Allowance for Credit Losses
The Company maintains an allowance for credit losses for estimated losses resulting from its clients’ failure to make required payments for services rendered. Management estimates this allowance based upon knowledge of the financial condition of the Company’s clients (which may not include knowledge of all significant events), review of historical receivable and reserve trends and other pertinent information. If the financial condition of the Company’s clients deteriorates or there is an unfavorable trend in aggregate receivable collections, additional allowances may be required.
The following table summarizes the activity in the allowance for credit losses (in thousands):
| | | | | | | | | | | | | | | | | | | | | | | | | | | | | | | | | | | |
| Beginning
Balance | | Charged to
Operations | | Currency Rate
Changes | | Other | | (Write-offs)/
Recoveries | | Ending
Balance |
| Years Ended: | | | | | | | | | | | |
| May 27, 2023 | $ | 2,121 | | | $ | 1,440 | | | $ | 1 | | | $ | - | | | $ | (279) | | | $ | 3,283 | |
| May 25, 2024 | $ | 3,283 | | | $ | 137 | | | $ | 5 | | | $ | 2 | | | $ | (672) | | | $ | 2,755 | |
| May 31, 2025 | $ | 2,755 | | | $ | 1,239 | | | $ | (15) | | | $ | - | | | $ | (1,376) | | | $ | 2,603 | |
Assets and Liabilities Held for Sale
Assets and liabilities held for sale primarily represent property and equipment, and other assets and liabilities that have met the criteria of “held for sale” accounting, as specified by Accounting Standards Codification (“ASC”) 360, Property, Plant, and Equipment. The effect of suspending amortization on noncurrent assets held for sale is immaterial to the results of operations.
The Company records assets and liabilities held for sale at the lower of carrying value or fair value less cost to sell. Any loss resulting from this measurement is recognized in the period in which the held for sale criteria are met. Conversely, gains are not recognized on the sale of a long-lived asset or disposal group until the date of sale.
On February 24, 2024, the Company determined the asset groups associated with the Company's former corporate office in Irvine, California met the criteria of held for sale, since the Company intended to complete the sale of these assets within the twelve months following the end of the third quarter of fiscal 2024. The Company concluded that the offering price of the disposal assets was an approximate fair value. The Company sold its Irvine, California corporate office in August 2024. See Note 4 – Assets and Liabilities Held for Sale for further information.
Property and Equipment
Property and equipment is stated at cost, less accumulated depreciation and amortization. Depreciation is computed using the straight-line method over the following estimated useful lives:
| | | | | |
| |
| Furniture and fixtures | 5 to 10 years |
| Leasehold improvements | Lesser of useful life of asset or term of lease |
| Computer, equipment and software | 3 to 5 years |
Costs for normal repairs and maintenance are expensed to operations as incurred, while renewals and major refurbishments are capitalized.
48 — rgp. 2025 Annual Report
Long-lived Assets
The Company evaluates the recoverability of long-lived assets for impairment whenever events or changes in circumstances indicate that the carrying amount of an asset may not be recoverable. The impairment test is comprised of two steps. The first step compares the carrying amount of the asset to the sum of expected undiscounted future cash flows. If the sum of expected undiscounted future cash flows exceeds the carrying amount of the asset, no impairment is taken. If the sum of expected undiscounted future cash flows is less than the carrying amount of the asset, a second step is warranted and an impairment loss is measured as the amount by which the carrying amount of the asset exceeds its fair value calculated using the present value of estimated net future cash flows. The Company recorded an impairment against its right of use (“ROU”) assets and leasehold improvements of zero, $0.2 million and zero for the years ended May 31, 2025, May 25, 2024 and May 27, 2023, respectively, primarily associated with exiting certain real estate leases as part of its restructuring initiatives. The impairment charges are included in selling, general and administrative expense in the Company’s Consolidated Statements of Operations.
Goodwill and Intangible Assets
Goodwill is recorded at the time of an acquisition and is calculated as the difference between the aggregate consideration paid for an acquisition and the fair value of the net tangible and intangible assets acquired. Goodwill is not subject to amortization but the carrying value is tested for impairment on an annual basis or more frequently if the Company believes indicators of impairment exist. During the fourth quarter of fiscal 2024, the Company voluntarily changed the date of the annual impairment test from the last day of the fourth quarter to the first day of the fourth quarter to better align with our internal operations. This change was applied prospectively and was not material to the Company’s consolidated financial statements as it did not delay, accelerate or avoid an impairment charge.
Impairment testing is conducted at the reporting unit level. Under ASC 350, Intangibles - Goodwill and Other, the qualitative assessment requires the consideration of factors such as recent market transactions, macroeconomic conditions, and changes in projected future cash flows or planned revenue or earnings of the reporting unit as potential indicators when determining the need for a quantitative assessment of impairment.
Under the quantitative analysis, the fair value of the reporting units is determined by using a market-based approach, an income-based approach or a combination thereof. The market-based approach estimates fair value by applying revenue and EBITDA multiples to each reporting unit’s operating performance. The multiples are derived from guideline public companies with similar operating and investment characteristics to the Company's reporting units, and are evaluated and adjusted, if needed, based on specific characteristics of the reporting units relative to the selected guideline companies. The market-based approach requires the Company to make a series of assumptions that involve significant judgment, such as the selection of comparable companies and the evaluation of the multiples. The income-based approach estimates fair value based on estimated future cash flows of each reporting unit, discounted by an estimated weighted-average cost of capital that reflects the relevant risks associated with each reporting unit and the time value of money. The income approach also requires a series of assumptions that involve significant judgment, such as revenue projections and Adjusted EBITDA margin projections, which are based on historical experience and internal forecasts about future performance.
While the Company believes that the assumptions underlying its quantitative assessment are reasonable, these assumptions could have a significant impact on whether a non-cash impairment charge is recognized and the magnitude of such charge. The results of an impairment analysis are as of a point in time. There is no assurance that the actual future earnings or cash flows of the reporting units will be consistent with the Company’s projections.
The Company’s identifiable intangible assets include customer contracts and relationships, and computer software, including internally-developed software. These assets are amortized on a straight-line basis over lives ranging from one to twelve years. For intangible assets subject to amortization, if the estimated undiscounted expected future cash flows are less than the net book value, an impairment loss is recognized equal to the amount by which the net book value exceeds the estimated fair value of assets. The Company reviewed its intangible assets and did not identify any impairment during the years ended May 31, 2025, May 25, 2024 and May 27, 2023.
See Note 5 —Goodwill and Intangible Assets for a further description of the Company’s goodwill and intangible assets, including information about the Company’s goodwill impairment assessment.
rgp. 2025 Annual Report — 49
Leases
The Company currently leases office space, vehicles and certain equipment under operating leases expiring through 2034. At May 31, 2025, the Company had no finance leases. The Company’s operating leases are primarily for real estate, which include fixed payments plus, in some cases, scheduled base rent increases over the term of the lease. Certain leases require variable payments of common area maintenance, operating expenses and real estate taxes applicable to the property. Variable payments are excluded from the measurements of lease liabilities and are expensed as incurred. Any tenant improvement allowances received from the lessor are recorded as a reduction to rent expense over the term of the lease. None of the Company’s lease agreements contained residual value guarantees or material restrictive covenants. The Company has not entered into any real estate lease arrangements where it occupies the entire building. As such, the Company does not have any separate land lease components embedded within any of its real estate leases.
The Company determines if an arrangement is a lease at the inception of the contract. Specifically, the Company considers whether it can control the underlying asset and have the right to obtain substantially all of the economic benefits or outputs from the assets. The ROU assets represent the right to use the underlying assets for the lease term and the lease liabilities represent the Company’s obligation to make lease payments arising from the leases. The Company’s lease liability is recognized as of the lease commencement date at the present value of the lease payments over the lease term. The Company’s ROU asset is recognized as of the lease commencement date at the amount of the corresponding lease liability, adjusted for prepaid lease payments, lease incentives received, and initial direct costs incurred. The Company evaluates its ROU assets for impairment consistent with its policy for evaluating long-lived assets for impairment. See “Long-lived Assets” above. ROU assets are presented as operating ROU assets in the Company’s Consolidated Balance Sheets. Operating lease liabilities are presented as operating lease liabilities, current or operating lease liabilities, noncurrent in the Company’s Consolidated Balance Sheets based on their contractual due dates. Operating lease expense is recognized on a straight-line basis over the lease term, and is recognized in selling, general and administrative expenses in the Company’s Consolidated Statements of Operations.
Most of the Company’s leases do not provide an implicit rate that can be readily determined. Therefore, the Company uses a discount rate based on its incremental borrowing rate and the information available at the commencement date. The incremental borrowing rate is the rate of interest that the Company would have to pay to borrow on a fully collateralized basis over a similar term in an amount equal to the total lease payments in a similar economic environment. The Company has a centrally managed treasury function; therefore, the portfolio approach is applied in determining the incremental borrowing rate. Application at the portfolio level is not materially different from applying guidance at the individual lease level.
Certain of the Company’s leases include one or more options to renew or terminate the lease at the Company’s discretion. Generally, the renewal and termination options are not included in the ROU assets and lease liabilities as they are not reasonably certain of exercise. The Company regularly evaluates lease renewal and termination options and, when they are reasonably certain of exercise, includes the renewal or termination option in the lease term.
In some instances, the Company subleases excess office space to third-party tenants. The Company, as sublessor, continues to account for the head lease. If the lease cost for the term of the sublease exceeds the Company’s anticipated sublease income for the same period, this indicates that the ROU asset associated with the head lease should be assessed for impairment under the long-lived asset impairment provisions. Sublease income is included in selling, general and administrative expenses in the Company’s Consolidated Statements of Operations.
The Company has elected the practical expedient that allows lessees to choose to not separate lease and non-lease components by class of underlying asset and is applying this expedient to all real estate asset classes. Additionally, the Company has also made an accounting policy election to recognize the lease payments under short-term leases as an expense on a straight-line basis over the lease term without recognizing the lease liability and the ROU asset.
See Note 7 — Leases for further information on the Company’s leases.
Capitalized Hosting Arrangements
The capitalized hosting arrangements costs are primarily related to the Company’s implementation of a cloud-based enterprise resource planning system and talent acquisition and management system. Such costs include third party implementation costs and costs associated with internal resources directly involved in the implementation. Capitalized hosting arrangements are stated at historical cost and amortized on a straight-line basis over an estimated useful life of the
50 — rgp. 2025 Annual Report
expected term of the hosting arrangement, taking into consideration several other factors such as, but not limited to, options to extend the hosting arrangement or options to terminate the hosting arrangement. The amortization of capitalized implementation costs for hosting arrangements will commence when the systems are ready for their intended use and will be presented as operating expenses on the Company’s Consolidated Statements of Operations consistent with the presentation for expensing the fees for the associated hosting arrangement.
As of May 31, 2025 and May 25, 2024, the capitalized costs related to hosting arrangements incurred during the application development stage were $20.8 million and $16.1 million, respectively. These capitalized hosting arrangements are included in current and other non-current assets on the Consolidated Balance Sheets. During the years ended May 31, 2025 and May 25, 2024, amortization was $1.8 million and less than $0.2 million, respectively. No costs were amortized during the year ended May 27, 2023.
Stock-Based Compensation
The Company recognizes compensation expense for all share-based payment awards made to employees and directors, including restricted stock awards, restricted stock units, employee stock options, performance stock units awarded under the Company’s 2020 Performance Incentive Plan (the “2020 Plan”) and the Company’s 2014 Performance Incentive Plan (the “2014 Plan”), stock units credited under the Directors Deferred Compensation Plan and employee stock purchases made via the Company’s 2019 Employee Stock Purchase Plan, as amended (the “ESPP”), based on estimated fair value at the date of grant.
The Company estimates the fair value of share-based payment awards on the date of grant using the Black-Scholes valuation model for stock options, including options under the ESPP, and the closing price of the Company’s common stock on the date of grant for restricted stock awards, restricted stock units and performance stock units. The value of the portion of the award that is ultimately expected to vest is recognized on a straight-line basis as an expense over the requisite service periods. If the actual number of forfeitures, and in the case of performance stock units, the actual performance, differs from that estimated by management, additional adjustments to compensation expense may be required in future periods. Excess income tax benefits and deficiencies from stock-based compensation are recognized as a discrete item within the provision for income taxes on the Company’s Consolidated Statements of Operations. Stock options and restricted stock units typically vest over three to four years and restricted stock award vesting is determined on an individual grant basis under the 2014 Plan or the 2020 Plan. Performance stock units vest on the last day of the three-year performance period, based on the actual performance for the performance period.
See Note 15 — Stock-Based Compensation Plans for further information on the 2020 Plan and stock-based compensation.
Income Taxes
The Company recognizes deferred income taxes for the estimated tax consequences in future years of differences between the tax basis of assets and liabilities and their financial reporting amounts at each year-end based on enacted tax laws and statutory rates applicable to the periods in which the differences are expected to affect taxable income. Valuation allowances are established to reduce deferred tax assets to the amount expected to be realized when, in management’s opinion, it is more likely than not that some portion of the deferred tax assets will not be realized. The provision for income taxes represents current taxes payable net of the change during the period in deferred tax assets and liabilities. The Company also evaluates its uncertain tax positions and only recognizes the tax benefit from an uncertain tax position if it is more likely than not that the tax position will be sustained on examination by the taxing authorities, based on the technical merits of the position. The tax benefits recognized in the financial statements from such positions are measured based on the largest benefit that has a greater than 50 percent likelihood of being realized upon settlement. The Company records a liability for unrecognized tax benefits resulting from uncertain tax positions taken or expected to be taken in a tax return. Any change in judgment related to the expected ultimate resolution of uncertain tax positions is recognized in earnings in the period in which such change occurs. The Company recognizes interest and penalties related to income tax matters, if applicable, in income tax expense.
Share Repurchases and Retirement of Treasury Shares
The Company’s stock repurchase programs authorize the Company to repurchase shares at the discretion of the Company’s senior executives based on numerous factors, including, without limitation, share price and other market conditions, the Company’s ongoing capital allocation planning, the levels of cash and debt balances, and other demands for
rgp. 2025 Annual Report — 51
cash. The Company records the shares repurchased as treasury stock based on the amount paid to repurchase its shares. Direct costs incurred to acquire treasury stock are treated like stock issue costs and added to the cost of the treasury stock.
The Company accounts for the retirement of treasury shares using the par-value method under which the cost of repurchased and retired treasury shares in excess of the par value is allocated between additional paid-in capital and retained earnings. When the repurchase price is greater than the original issue proceeds, the excess is charged to retained earnings. The Company uses the weighted-average cost flow assumption to identify and assign the original issue proceeds to the cost of the repurchased and retired treasury shares. The Company believes that this allocation method is preferable because it more accurately reflects its paid-in capital balances by allocating the cost of the repurchased and retired treasury shares to paid-in capital in proportion to paid-in capital associated with the original issuance of those shares.
See Note 12 — Stockholders’ Equity for further information on the repurchase of shares.
Recent Accounting Pronouncements
Recently Issued Accounting Guidance
In November 2024, the Financial Accounting Standards Board (“FASB”) issued Accounting Standards Update (“ASU”) 2024-03, Income Statement—Reporting Comprehensive Income—Expense Disaggregation Disclosures (Subtopic 220-40): Disaggregation of Income Statement Expenses requiring disaggregated disclosure of certain expense captions into specified categories in the notes to financial statements on an annual and interim basis. The ASU is effective for fiscal years beginning after December 15, 2026, and interim periods within annual reporting periods beginning after December 15, 2027, with updates to be applied on a prospective basis with the option to apply the standard retrospectively. Early adoption is permitted. The Company expects to adopt this guidance in its fiscal year beginning May 30, 2027. The Company is evaluating the potential impact of this guidance on its financial statement disclosures.
In December 2023, FASB issued ASU 2023-09, Income Taxes (Topic 740): Improvements to Income Tax Disclosures. The guidance is intended to expand the disclosure requirements for income taxes, specifically related to the rate reconciliation and income taxes paid. The guidance is effective for annual periods beginning after December 15, 2024, with early adoption permitted. The Company has adopted ASU 2023-09 for fiscal year 2026, which began on June 1, 2025, and is in the process of implementing the related disclosure requirements.
Recently Adopted Accounting Guidance
In November 2023, FASB issued ASU 2023-07, Segment Reporting (Topic 280): Improvements to Reportable Segment Disclosures. The guidance is intended to improve reportable segment disclosure requirements for public entities primarily through enhanced disclosures about significant segment expenses that are regularly provided to the CODM and included within each reported measure of segment profit. This guidance is effective for annual periods beginning after December 15, 2023, and for interim periods beginning after December 15, 2024. The Company adopted this guidance in the fiscal year ending May 31, 2025. For additional information, refer to Note 18 – Segment Information and Enterprise Reporting.
Other recent changes in authoritative accounting pronouncements did not, or are not expected to, have a materially significant effect on the Company’s consolidated financial statements.
3. Acquisitions and Dispositions
Acquisition of Reference Point
On July 1, 2024, the Company entered into an Amended and Restated Membership Interest Purchase Agreement (the “Reference Point MIPA”) with Reference Point LLC (“Reference Point”) and the holder of all the outstanding membership interests of Reference Point LLC, in which the Company acquired 100% of the membership interests of Reference Point. Reference Point is a strategy, management, and technology consulting firm serving the financial services sector across four areas of focus: Strategy & Management, Risk & Regulatory Compliance, Digital & Technology and Data & Analytics. The Company paid cash consideration of $23.2 million (net of $0.2 million cash acquired).
Results of operations of Reference Point are included within the Consulting Services operating segment in the Consolidated Statements of Operations from the date of acquisition. Reference Point contributed $16.1 million of revenue
52 — rgp. 2025 Annual Report
and $1.9 million of operating income to the Consolidated Statements of Operations during the year ended May 31, 2025. During the year ended May 31, 2025, the Company recognized approximately $2.8 million of acquisition-related costs in connection with the acquisition of Reference Point that were recorded in selling, general and administrative expenses in the Consolidated Statements of Operations.
In accordance with ASC 805 Business Combinations, the Company made an initial provisional allocation of the purchase price for Reference Point based on the fair value of the assets acquired and liabilities assumed, with the residual amount recorded as goodwill. The Company’s purchase price allocation considered a number of factors, including the valuation of identifiable intangible assets. In connection with this acquisition, the Company recorded total intangible assets consisting of $14.4 million for customer relationships (to be amortized over 12 years), $0.7 million related to a non-compete agreement (to be amortized over 5 years) and $0.6 million for trade name (to be amortized over 1 year). The Company also recorded $6.9 million of goodwill, which is expected to be deductible for tax purposes. The goodwill is attributable primarily to expected synergies and the assembled workforce of Reference Point.
The following table summarizes the consideration for the acquisition of Reference Point and the amounts of the identified assets acquired and liabilities assumed at the acquisition date:
Fair value of consideration transferred (in thousands):
Recognized provisional amounts of identifiable assets acquired and liabilities assumed (in thousands):
| | | | | |
| Cash and cash equivalents | $ | 248 | |
| Trade accounts receivable (1) | 2,013 | |
| Prepaid expenses and other current assets | 52 | |
| |
| Intangible assets | 15,720 | |
| Property and equipment | 28 | |
| Other non-current assets | 63 | |
| Total identifiable assets | 18,124 | |
| Accounts payable and other accrued expenses | 47 | |
| Accrued salaries and related obligations | 988 | |
| |
| Other liabilities | 527 | |
| Total liabilities assumed | 1,562 | |
| Net identifiable assets acquired | 16,562 | |
| Goodwill | 6,855 | |
| Net assets acquired | $ | 23,417 | |
(1)As of the acquisition date, the gross contractual amount of accounts receivable of $2.0 million was expected to be fully collected, and was fully collected during fiscal 2025.
The weighted-average useful life of all Reference Point's intangible assets is 11.3 years.
Acquisition of CloudGo
On November 15, 2023, the Company acquired 100% of the equity interests in CloudGo pursuant to the terms of a Share Purchase Agreement entered into by and between the Company, CloudGo, and the shareholders of CloudGo (the “CloudGo SPA”). Headquartered in Singapore, CloudGo is a digital transformation firm primarily focused on technology implementation through the ServiceNow platform. The Company paid cash consideration of $7.4 million (net of $0.3 million of cash acquired).
In addition, the CloudGo SPA provides for contingent consideration of up to $12.0 million to be paid based on CloudGo’s revenue and operating profit margin performance during two one-year performance periods that began after the acquisition date. The Company determined the fair value of the contingent consideration as of the acquisition date using the Monte Carlo simulation model and the application of an appropriate discount rate (Level 3 fair value). The preliminary fair
rgp. 2025 Annual Report — 53
value of the contractual obligation to pay the contingent consideration amounted to $4.4 million. Due to a revision in the Company's estimate in the fourth quarter of fiscal 2024, the Company decreased the fair value of the CloudGo contingent consideration liability to zero. The Company has concluded that a fair value of zero for the contingent consideration liability as of May 31, 2025 was appropriate. The estimate of fair value of contingent consideration liability requires assumptions to be made of various levels of potential revenue and operating profit performance as well as discount rates. Future revisions to these assumptions could materially change the estimate of the fair value of contingent consideration and therefore could materially affect the Company’s future operating results.
Results of operations of CloudGo are included within the Consulting Services operating segment in the Consolidated Statements of Operations from the date of acquisition. CloudGo contributed $6.5 million and $4.2 million of revenue to the consolidated results of operations during the years ended May 31, 2025 and May 25, 2024, respectively. During the year ended May 25, 2024, the Company recognized approximately $2.0 million of acquisition-related costs in connection with the acquisition of CloudGo. Such costs were recorded in selling, general and administrative expenses in the Consolidated Statements of Operations.
In accordance with ASC 805 Business Combinations, the Company made an allocation of the purchase price for CloudGo based on the fair value of the assets acquired and liabilities assumed, with the residual amount recorded as goodwill. The Company’s purchase price allocation considered a number of factors, including the valuation of identifiable intangible assets. In connection with this acquisition, the Company recorded total intangible assets consisting of $3.1 million for customer relationships (to be amortized over 9 to 12 years). The Company also recorded $9.6 million of goodwill. The goodwill is attributable primarily to expected synergies and the assembled workforce of CloudGo.
54 — rgp. 2025 Annual Report
The following table summarizes the consideration for the acquisition of CloudGo and the amounts of the identified assets acquired and liabilities assumed at the acquisition date:
Fair value of consideration transferred (in thousands):
| | | | | |
| Cash | $ | 7,753 | |
| Contingent consideration | 4,400 | |
| Total | $ | 12,153 | |
Recognized amounts of identifiable assets acquired and liabilities assumed (in thousands):
| | | | | |
| Cash and cash equivalents | $ | 342 | |
Trade accounts receivable (1) | 778 | |
| Prepaid expenses and other current assets | 78 | |
| Income taxes receivable | 2 | |
| Intangible assets | 3,100 | |
| Property and equipment | 36 | |
| Other non-current assets | 13 | |
| Total identifiable assets | 4,349 | |
| Accounts payable and other accrued expenses | 411 | |
| Accrued salaries and related obligations | 366 | |
| Deferred tax liabilities | 490 | |
| Other liabilities | 566 | |
| Total liabilities assumed | 1,833 | |
| Net identifiable assets acquired | 2,516 | |
| Goodwill | 9,637 | |
| Net assets acquired | $ | 12,153 | |
(1) As of the acquisition date, the gross contractual amount of accounts receivable of $0.8 million was expected to be fully collected, and was subsequently collected.
The weighted-average useful life of CloudGo’s customer relationships and intangible assets is approximately 10.9 years.
Dispositions
During fiscal 2023, the Company completed the dissolution of the following three foreign subsidiaries: Compliance.co.uk Ltd, Resources Compliance (UK) Ltd and RGP Poland spolka z ograniczona odpowiedzialnoscia. The Company recognized a total net loss on dissolutions of $0.5 million during fiscal 2023. This net loss was primarily related to the recognition of the accumulated translation adjustment associated with the foreign subsidiaries, which was reclassified from accumulated other comprehensive loss in the Company’s Consolidated Balance Sheet and included in selling, general and administrative expenses in the Company’s Consolidated Statement of Operations for the year ended May 27, 2023.
None of the markets sold or exited in fiscal 2023 were considered strategic components of the Company’s operations.
4. Assets and Liabilities Held for Sale
As of February 24, 2024, the Company determined the asset groups associated with its former corporate office in Irvine, California met the criteria of held for sale, since the Company intended to complete the sale of these assets within the twelve months following the end of the third quarter of fiscal 2024. Accordingly, the related assets classified as held for sale are separately presented in our Consolidated Balance Sheets as of May 25, 2024. In addition, such assets are presented at the lower of carrying value or fair value less any costs to sell. The Company concluded that the offering price of the disposal
rgp. 2025 Annual Report — 55
assets was an approximate fair value, which exceeded the carrying value of the related assets as of May 25, 2024. As such, the assets held for sale are reported at their carrying value.
The following table presents information related to the major classes of assets that were classified as held for sale in our Consolidated Balance Sheets (in thousands):
| | | | | |
| Assets Held for Sale | As of |
| Irvine Office Building | May 25, 2024 |
| Building and land | $ | 14,309 | |
| Leasehold improvements | 321 | |
| Furniture and fixtures | 1,565 | |
| Total assets held for sale, gross | 16,195 | |
| Less: accumulated depreciation and amortization | (7,286) | |
| Total assets held for sale, net | $ | 8,909 | |
The Company entered into a Purchase and Sale Agreement dated May 15, 2024, and as amended and restated as of May 20, 2024, with a third-party buyer for the sale of its Irvine building. In August 2024, the Company completed the sale for total consideration of $13.0 million, resulting in a net gain of $3.4 million. The sale does not constitute a discontinued operation. As such, the gain has been recorded as a reduction of selling, general, and administrative expenses in the Consolidated Statement of Operations for the year ended May 31, 2025.
5. Goodwill and Intangible Assets
As described in Note 2 – Summary of Significant Accounting Policies, the Company performs its annual impairment test for goodwill impairment in the fourth quarter, unless indicators of impairment exist, the Company will perform interim quantitative goodwill impairment analysis more frequently. As a result of impairment indicators related to business performance and decline in share price throughout the fiscal year, the Company performed four interim quantitative goodwill impairment assessments for its reporting units, each of which is also a reporting segment, and recorded an aggregate impairment charge of $194.4 million for fiscal 2025.
During the year ended May 25, 2024, the Company performed an annual goodwill impairment on its reporting units and elected to perform a quantitative goodwill impairment analysis. As a result of the quantitative impairment test performed on February 25, 2024, the Company concluded that there was no goodwill impairment. There were no changes in facts, circumstances or events from February 25, 2024 through May 25, 2024, the end of the fiscal year, that would give rise to modifying the conclusion regarding goodwill impairment assessment or require further testing,
During the year ended May 27, 2023, the Company completed an interim goodwill impairment analysis in the third fiscal quarter for Sitrick, which is included in Other Segments. Many of Sitrick’s target clients were impacted by the initial closures of U.S. courts during the COVID-19 pandemic and the continued lingering impact on the court system despite the reopening, resulting in less opportunities and a slower revenue conversion typically provided by Sitrick. The Company determined that the carrying value of Sitrick, also a reporting unit, was in excess of its fair value and recorded a non-cash impairment charge of $3.0 million. This impairment reduced the goodwill within the Other Segments to zero as of May 27, 2023.
The Company’s determination of the estimated fair value may be based on the market-based approach, the income-based approach or a combination of both approaches. The market-based approach was based on the guideline public company method, which uses market multiples of revenue and earnings before interest, taxes, depreciation and amortization for a group of comparable public companies. The income-based approach was based on the present value of discounted cash flows of each reporting unit, using the Company’s assumptions regarding revenue growth rates, forecasted gross profit margins, forecasted earnings and free cash flows, terminal period growth rates, and other economic and market trends. Additionally, the present value was based on applying a weighted average cost of capital, which considered long-term interest rates and cost of equity based on the reporting segment’s risk profile. As part of the goodwill impairment test, the Company reconciled the aggregated estimated fair value of the Company's operating segments to the Company’s market capitalization, including
56 — rgp. 2025 Annual Report
consideration of any asymmetry in information, and control premium representing the estimated amount a market participant would pay to obtain a controlling interest in the Company.
Fourth Quarter 2025 Interim Impairment Assessments
During the fourth quarter of fiscal 2025, and subsequent to the Company's annual impairment test date, a decrease in market capitalization and slow business recovery in the Consulting segment triggered a goodwill impairment assessment. Using a combination of income-based and market-based approaches to determine the fair value of its reporting units with associated goodwill, the Company determined that the carrying value of the Consulting segment exceeded its fair value by $58.8 million. In addition to recording this excess as a goodwill impairment charge, the Company also recorded a $10.2 million charge related to the deferred tax impacts from the excess carrying value. The Company therefore recorded an aggregate of $69.0 million in goodwill impairment charges for the Consulting segment.
Third Quarter 2025 Interim Impairment Assessments
During the third quarter of fiscal 2025, slow business recovery in the On-Demand Talent and Consulting segments triggered a goodwill impairment assessment. Using a combination of income-based and market-based approaches to determine the fair value of its reporting units with associated goodwill, the Company determined that the carrying values of On-Demand Talent and Consulting segments exceeded their fair values. As a result, a non-cash goodwill impairment charge of $42.0 million was recorded, comprised of excess in carrying value over fair value of $12.4 million for On-Demand Talent and $24.8 million for Consulting, as well as a $4.8 million related to deferred tax impacts from the charge recorded in the Consulting segment.
Second Quarter 2025 Interim Impairment Assessments
During the second quarter of fiscal 2025, a decrease in market capitalization and slower-than-expected recovery in the On-Demand Talent and Europe and Asia Pacific segments triggered a goodwill impairment assessment. Using a combination of income-based and market-based approaches to determine the fair value of its reporting units with goodwill, the Company determined that the carrying values of On-Demand Talent and Europe and Asia Pacific segments exceeded their fair values. As a result, a non-cash goodwill impairment charge of $79.5 million was recorded, comprised of the excess in carrying value over fair value of $48.4 million for On-Demand Talent and $21.7 million for Europe and Asia Pacific, as well as $9.3 million related to deferred tax impacts from the charges recorded in the On-Demand Talent segment.
First Quarter 2025 Interim Impairment Assessments
During the first quarter of fiscal 2025, concurrent with the change in the Company’s operating segments, which were aligned to the Company’s reporting units and reportable segments, the Company allocated goodwill to each of its reporting units under the new organizational structure on a relative fair value basis. The Company estimated the fair values of the reporting units based on the income-based approach. As a result, a non-cash goodwill impairment charge of $3.9 million was recorded for the excess in carrying value over fair value of the Europe and Asia Pacific segment.
In performing the goodwill impairment assessments, the Company considers the assumptions used in determining the estimated fair values of its reporting units to be reasonable and appropriate. However, the assumptions are complex and subjective, and additional adverse changes in a key assumption or a combination of key assumptions may significantly affect the Company’s assessment of the fair value and goodwill impairment. These assumptions include, among other things, a failure to meet expected earnings or other financial plans; changes in the discount rate, the terminal growth rate or tax rates; or significant changes in industry or economic trends. If the assumptions noted above adversely change, negative macroeconomic conditions worsen or the Company’s market capitalization decreases for a sustained period of time, the Company may be required to perform an additional impairment analysis that could result in additional impairment charges and materially adversely affect the Company’s financial condition and results of operations.
The following table summarizes the activity in the Company’s goodwill balance. The balance as of May 25, 2024 was recast to reflect the impact of the Company's change in segment reporting and the final fair value allocation of the reporting units that became effective during the first quarter of fiscal 2025 (in thousands):
rgp. 2025 Annual Report — 57
| | | | | | | | | | | | | | | | | | | | | | | | | | | | | | | | | | | |
| On-Demand Talent | | Consulting | | Europe & Asia Pacific | | Outsourced Services | | All Other | | Total |
| Balance as of May 27, 2023 | $ | 70,202 | | | $ | 82,115 | | | $ | 25,648 | | | $ | 28,757 | | | $ | - | | | $ | 206,722 | |
| Acquisition (see Note 3) | - | | | 9,637 | | | - | | | - | | | - | | | 9,637 | |
| Impact of foreign currency exchange rate changes | - | | | 18 | | | 202 | | | - | | | - | | | 220 | |
| Balance as of May 25, 2024 | $ | 70,202 | | | $ | 91,770 | | | $ | 25,850 | | | $ | 28,757 | | | $ | - | | | $ | 216,579 | |
| Acquisition (see Note 3) | - | | | 6,855 | | | - | | | - | | | - | | | 6,855 | |
| Goodwill Impairment | (70,202) | | | (98,625) | | | (25,582) | | | - | | | - | | | (194,409) | |
| Impact of foreign currency exchange rate changes | - | | | - | | | (268) | | | - | | | - | | | (268) | |
| Balance as of May 31, 2025 | $ | - | | | $ | - | | | $ | - | | | $ | 28,757 | | | $ | - | | | $ | 28,757 | |
The following table presents details of the Company’s intangible assets, estimated lives and related accumulated amortization (in thousands, except for estimated useful life):
| | | | | | | | | | | | | | | | | | | | | | | | | | | | | | | | | | | | | | | | | |
| | | As of May 31, 2025 | | As of May 25, 2024 |
| Estimated
Useful
Life | | Gross | | Accumulated
Amortization | | Net
Carrying
Amount | | Gross | | Accumulated
Amortization | | Net
Carrying
Amount |
| | | | | | | | | | | | | |
| Customer contracts and relationships | 7 - 12 years | | $ | 39,500 | | | $ | (21,160) | | | $ | 18,340 | | | $ | 25,100 | | | $ | (16,858) | | | $ | 8,242 | |
| Computer software | 3 - 3.5 years | | - | | | - | | | - | | | 7,870 | | | (6,539) | | | 1,331 | |
| Trade names | 1 year | | 600 | | | (550) | | | 50 | | | - | | | - | | | - | |
| Non-Compete Agreements | 5 years | | 720 | | | (132) | | | 588 | | | - | | | - | | | - | |
| Total | | | $ | 40,820 | | | $ | (21,842) | | | $ | 18,978 | | | $ | 32,970 | | | $ | (23,397) | | | $ | 9,573 | |
The remaining weighted-average useful life of all of the Company’s intangible assets is approximately 4.7 years.
For the year ended May 31, 2025, the Company determined that the computer software component of its intangible assets no longer provides future economic benefit and recorded a $0.4 million charge to write-off the unamortized asset.
The Company recorded amortization expense of $5.9 million, $5.4 million, and $5.0 million for the years ended May 31, 2025, May 25, 2024 and May 27, 2023, respectively. The following table presents future estimated amortization expense based on existing intangible assets held for use (in thousands):
| | | | | |
| Fiscal Years: | |
| 2026 | $ | 3,829 | |
| 2027 | 1,859 | |
| 2028 | 1,633 | |
| 2029 | 1,633 | |
| 2030 and thereafter | $ | 10,024 | |
| Total | $ | 18,978 | |
Actual future estimated amortization expense could differ from these estimated amounts as a result of future acquisitions, dispositions, impairments, and other factors or changes.
58 — rgp. 2025 Annual Report
6. Property and Equipment
Property and equipment consist of the following (in thousands):
| | | | | | | | | | | |
| As of
May 31, 2025 | | As of
May 25, 2024 |
| | | |
| Computers, equipment and software | 6,859 | | | 8,303 | |
| Leasehold improvements | 10,253 | | | 10,719 | |
| Furniture | 4,346 | | | 4,417 | |
| Property and equipment, gross | $ | 21,458 | | | $ | 23,439 | |
| Less: accumulated depreciation and amortization | (17,035) | | | (19,676) | |
| Property and equipment, net | $ | 4,423 | | | $ | 3,763 | |
On February 24, 2024, the Company determined the asset groups associated with its former corporate office in Irvine, California met the criteria of held for sale. As a result, the Company transferred such asset groups previously used in operations to assets held for sale in its Consolidated Balance Sheet as of May 25, 2024. The Company's corporate office in Irvine, California was subsequently sold in August 2024. See Note 4 - Assets and Liabilities Held for Sale for more information.
7. Leases
Lease cost components included within selling, general and administrative expenses in the Consolidated Statements of Operations were as follows (in thousands):
| | | | | | | | | | | | | | | | | |
| For the Years Ended |
| May 31, 2025 | | May 25, 2024 | | May 27, 2023 |
| Operating lease cost | $ | 7,096 | | | $ | 7,280 | | | $ | 7,242 | |
| Short-term lease cost | 297 | | | 192 | | | 118 | |
| Variable lease cost | 1,367 | | | 1,586 | | | 1,279 | |
Sublease income (1) | (702) | | | (740) | | | (516) | |
| Total lease cost | $ | 8,058 | | | $ | 8,318 | | | $ | 8,123 | |
(1)Sublease income represents rental income received by the Company as sublessor.
Following the sale of the building in Irvine, California, on August 1, 2024, the Company entered into a lease agreement for an office space in Irvine. The lease commenced on November 1, 2024 and has an expiration date of June 30, 2032. See Note 4 – Assets Held for Sale for further discussion. The average annual rent for the lease term will be $0.7 million.
On December 20, 2023, the Company entered into a lease agreement for an office space in New York that commenced on July 1, 2024 with an expiration date of July 31, 2034. The annual fixed rent for the first five years and the last five years are $1.2 million and $1.3 million respectively.
The weighted-average lease terms and discount rates for operating leases are presented in the following table:
| | | | | | | | | | | |
| As of
May 31, 2025 | | As of
May 25, 2024 |
| Weighted-average remaining lease term | 6.2 years | | 3.5 years |
| Weighted-average discount rate | 5.12% | | 4.37% |
rgp. 2025 Annual Report — 59
Cash flow and other information related to operating leases is included in the following table (in thousands):
| | | | | | | | | | | | | | | | | |
| For the Years Ended |
| May 31, 2025 | | May 25, 2024 | | May 27, 2023 |
| Cash paid for amounts included in the measurement of operating lease liabilities | $ | 7,005 | | | $ | 8,406 | | | $ | 9,258 | |
| Right-of-use assets obtained in exchange for new operating lease obligations | $ | 16,252 | | | $ | 3,707 | | | $ | 4,688 | |
Future maturities of operating lease liabilities at May 31, 2025 are presented in the following table (in thousands):
| | | | | |
| Fiscal Years | Operating Lease Maturity |
| 2026 | $ | 6,657 | |
| 2027 | 4,909 | |
| 2028 | 4,491 | |
| 2029 | 3,638 | |
| 2030 | 2,902 | |
| Thereafter | 7,713 | |
| Total future lease payments | 30,310 | |
| Less: interest | (5,005) | |
| Present value of operating lease liabilities | $ | 25,305 | |
The Company owned no assets that it leases to third-parties, as a lessor, at May 31, 2025. Prior to the sale of the company-owned building located in Irvine, California to independent third parties, as described in Note 4 – Assets Held for Sale, the Company, as lessor, had operating lease agreements for office space with independent third parties for which it received rental income during the years ended May 31, 2025, May 25, 2024 and May 27, 2023 totaling $8,000, $142,000 and $195,000, respectively. The terms of those operating lease agreements were terminated upon the sale of the building.
7. Leases
Lease cost components included within selling, general and administrative expenses in the Consolidated Statements of Operations were as follows (in thousands):
| | | | | | | | | | | | | | | | | |
| For the Years Ended |
| May 31, 2025 | | May 25, 2024 | | May 27, 2023 |
| Operating lease cost | $ | 7,096 | | | $ | 7,280 | | | $ | 7,242 | |
| Short-term lease cost | 297 | | | 192 | | | 118 | |
| Variable lease cost | 1,367 | | | 1,586 | | | 1,279 | |
Sublease income (1) | (702) | | | (740) | | | (516) | |
| Total lease cost | $ | 8,058 | | | $ | 8,318 | | | $ | 8,123 | |
(1)Sublease income represents rental income received by the Company as sublessor.
Following the sale of the building in Irvine, California, on August 1, 2024, the Company entered into a lease agreement for an office space in Irvine. The lease commenced on November 1, 2024 and has an expiration date of June 30, 2032. See Note 4 – Assets Held for Sale for further discussion. The average annual rent for the lease term will be $0.7 million.
60 — rgp. 2025 Annual Report
On December 20, 2023, the Company entered into a lease agreement for an office space in New York that commenced on July 1, 2024 with an expiration date of July 31, 2034. The annual fixed rent for the first five years and the last five years are $1.2 million and $1.3 million respectively.
The weighted-average lease terms and discount rates for operating leases are presented in the following table:
| | | | | | | | | | | |
| As of
May 31, 2025 | | As of
May 25, 2024 |
| Weighted-average remaining lease term | 6.2 years | | 3.5 years |
| Weighted-average discount rate | 5.12% | | 4.37% |
Cash flow and other information related to operating leases is included in the following table (in thousands):
| | | | | | | | | | | | | | | | | |
| For the Years Ended |
| May 31, 2025 | | May 25, 2024 | | May 27, 2023 |
| Cash paid for amounts included in the measurement of operating lease liabilities | $ | 7,005 | | | $ | 8,406 | | | $ | 9,258 | |
| Right-of-use assets obtained in exchange for new operating lease obligations | $ | 16,252 | | | $ | 3,707 | | | $ | 4,688 | |
Future maturities of operating lease liabilities at May 31, 2025 are presented in the following table (in thousands):
| | | | | |
| Fiscal Years | Operating Lease Maturity |
| 2026 | $ | 6,657 | |
| 2027 | 4,909 | |
| 2028 | 4,491 | |
| 2029 | 3,638 | |
| 2030 | 2,902 | |
| Thereafter | 7,713 | |
| Total future lease payments | 30,310 | |
| Less: interest | (5,005) | |
| Present value of operating lease liabilities | $ | 25,305 | |
The Company owned no assets that it leases to third-parties, as a lessor, at May 31, 2025. Prior to the sale of the company-owned building located in Irvine, California to independent third parties, as described in Note 4 – Assets Held for Sale, the Company, as lessor, had operating lease agreements for office space with independent third parties for which it received rental income during the years ended May 31, 2025, May 25, 2024 and May 27, 2023 totaling $8,000, $142,000 and $195,000, respectively. The terms of those operating lease agreements were terminated upon the sale of the building.
8. Long-Term Debt
Prior to July 2, 2025, the Company had a revolving credit facility with Bank of America, pursuant to the terms of the credit Agreement dated November 12, 2021 by the Company and Resources Connection LLC, as borrowers, and all of the Company’s domestic subsidiaries, as guarantors, with the lenders that are party thereto and Bank of America, N.A. as administrative agent for the lenders (the “2021 Credit Facility”). The 2021 Credit Facility provided for a $175.0 million senior secured revolving loan, which included a $10.0 million sublimit for the issuance of standby letters of credit and a swingline sublimit of $20.0 million. The 2021 Credit Facility also included an option to increase the amount of the revolving loan up to an additional $75.0 million, subject to the terms of the 2021 Credit Facility. The 2021 Credit Facility was originally set to mature on November 12, 2026; however it was terminated on July 2, 2025 in connection with a new credit agreement entered into between the Company, and Resources Connection LLC, as borrowers, and all of the Company’s domestic subsidiaries, as guarantors, with the lenders that are party thereto and Bank of America, N.A. as administrative agent for the lenders (the “New Credit Facility”). See Note 19 - Subsequent Events for further discussion.
The obligations under the 2021 Credit Facility were secured by substantially all assets of the Company, Resources Connection LLC and all of the Company’s domestic subsidiaries.
rgp. 2025 Annual Report — 61
On December 31, 2024 and March 28, 2025, the parties then entered into amendments to the 2021 Credit Agreement (collectively, the “Fiscal 2025 Amendments”) to waive the Company's non-compliance with a financial covenant related to the consolidated interest coverage ratio under the Credit Agreement due to the goodwill impairment recognized during the second and third quarters of fiscal 2025, respectively. The Fiscal 2025 Amendments also amended certain definitions under the Credit Agreement to exclude the impact of goodwill impairments recognized in the first, second, and third quarters of fiscal 2025.
As of May 31, 2025 and May 25, 2024, the Company had no debt outstanding under the 2021 Credit Facility. In addition, the Company had $1.0 million and $1.4 million of outstanding letters of credit issued under the 2021 Credit Facility as of May 31, 2025 and May 25, 2024, respectively. As of May 31, 2025, there was $174.0 million of remaining capacity under the 2021 Credit Facility.
On November 2, 2022, Resources Global Enterprise Consulting (Beijing) Co., Ltd. (a wholly-owned subsidiary of the Company), as borrower, and the Company, as guarantor, entered into a RMB 13.4 million (USD $1.8 million based on the prevailing exchange rate on November 2, 2022) revolving credit facility with Bank of America, N.A. (Beijing) as the lender (the “Beijing Revolver”). The Beijing Revolver bears interest at loan prime rate plus 0.80%. Interest incurred on borrowings will be payable monthly in arrears. As of May 31, 2025, the Company had no debt outstanding under the Beijing Revolver and RMB 13.4 million ($1.9 million based on the prevailing exchange rate on May 31, 2025) in available credit. The availability of proceeds under the Beijing Revolver is at the lender's absolute discretion and may be terminated at any time by the lender, with or without prior notice to the borrower.
9. Income Taxes
The following table represents the current and deferred income tax expense (benefit) for federal, state and foreign income taxes attributable to operations (in thousands):
| | | | | | | | | | | | | | | | | |
| For the Years Ended |
| May 31,
2025 | | May 25,
2024 | | May 27,
2023 |
| Current: | | | | | |
| Federal | $ | 51 | | | $ | 3,245 | | | $ | 19,317 | |
| State | (387) | | | 1,422 | | | 6,323 | |
| Foreign | 2,296 | | | 3,596 | | | 2,945 | |
| 1,960 | | | 8,263 | | | 28,585 | |
| Deferred: | | | | | |
| Federal | (6,540) | | | 935 | | | (6,613) | |
| State | (1,793) | | | 273 | | | (1,357) | |
| Foreign | 2,078 | | | (676) | | | (2,356) | |
| (6,255) | | | 532 | | | (10,326) | |
| Income tax expense (benefit) | $ | (4,295) | | | $ | 8,795 | | | $ | 18,259 | |
Income (loss) before income tax expense (benefit) is as follows (in thousands):
| | | | | | | | | | | | | | | | | |
| For the Years Ended |
| May 31,
2025 | | May 25,
2024 | | May 27,
2023 |
| Domestic | $ | (181,733) | | | $ | 23,084 | | | $ | 60,835 | |
| Foreign | (14,342) | | | 6,745 | | | 11,783 | |
| Income (loss) before income tax expense (benefit) | $ | (196,075) | | | $ | 29,829 | | | $ | 72,618 | |
62 — rgp. 2025 Annual Report
The income tax expense (benefit) differs from the amount that would result from applying the federal statutory rate as follows:
| | | | | | | | | | | | | | | | | |
| For the Years Ended |
| May 31,
2025 | | May 25,
2024 | | May 27,
2023 |
| Statutory tax rate | 21.0 | % | | 21.0 | % | | 21.0 | % |
| State taxes, net of federal benefit | 1.0 | | | 4.6 | | | 5.6 | |
| Non-U.S. rate adjustments | (0.3) | | | 2.8 | | | 1.4 | |
| Stock-based compensation | (0.6) | | | 2.2 | | | (0.1) | |
| Valuation allowance | (8.6) | | | 5.8 | | | (1.7) | |
| U.S. international tax impact, net of credits | (0.3) | | | 0.9 | | | 0.4 | |
| Contingent consideration | - | | | (3.1) | | | - | |
| Section 986(c) foreign exchange loss | - | | | (1.3) | | | - | |
Capital loss carryforward | - | | | (6.2) | | | - | |
| Goodwill impairment | (9.8) | | | - | | | - | |
| Permanent items | (0.2) | | | 2.5 | | | 0.3 | |
| Return-to-provision & other adjustments | 0.1 | | | (0.5) | | | (1.6) | |
| Other, net | (0.1) | | | 0.8 | | | (0.2) | |
| Effective tax rate | 2.2 | % | | 29.5 | % | | 25.1 | % |
The impact of state taxes, net of federal benefit, and foreign income taxed at other than U.S. rates fluctuates year over year due to the changes in the mix of operating income and losses amongst the various states and foreign jurisdictions in which we operate. Our accounting policy is to recognize the U.S. tax effects of global intangible low-taxed income as a component of income tax expense in the period it arises.
rgp. 2025 Annual Report — 63
The components of the net deferred tax asset (liability) consist of the following (in thousands):
| | | | | | | | | | | |
| As of
May 31,
2025 | | As of
May 25,
2024 |
| Deferred tax assets: | | | |
| Allowance for credit losses | $ | 369 | | | $ | 482 | |
| Accrued compensation | 3,583 | | | 4,089 | |
| Accrued expenses | 1,215 | | | 970 | |
| Lease liability | 6,684 | | | 3,345 | |
| Stock options and restricted stock | 2,770 | | | 3,870 | |
| Foreign tax credit | 345 | | | 477 | |
| Net operating losses | 19,632 | | | 17,714 | |
| Capital loss carryforwards | 1,606 | | | 2,343 | |
| State taxes | - | | | 113 | |
| Property and equipment | 520 | | | 782 | |
| Goodwill and intangibles | 7,700 | | | - | |
| Gross deferred tax asset | 44,424 | | | 34,185 | |
| Valuation allowance | (29,402) | | | (8,550) | |
| Gross deferred tax asset, net of valuation allowance | 15,022 | | | 25,635 | |
| Deferred tax liabilities: | | | |
| ROU asset | (5,834) | | | (2,911) | |
| Outside basis difference - Sweden investment | - | | | (262) | |
| | | |
| Goodwill and intangibles | - | | | (19,830) | |
| Net deferred tax asset | $ | 9,188 | | | $ | 2,632 | |
The Organisation for Economic Co-operation and Development (“OECD”) has released an Inclusive Framework on Base Erosion and Profit Shifting including Pillar Two Model Rules to reform international corporate taxation and introduce a new 15% global minimum tax applicable to large multinational corporations. Certain jurisdictions have enacted or substantively enacted the Pillar Two legislations. We have considered the applicability of such global implementations and determined that it does not have a material impact on our consolidated financial statements in fiscal 2025. We will continue to monitor and evaluate global implementation of Pillar Two legislations.
Additionally, we are continuing to monitor new guidance with regard to the new corporate alternative minimum tax (“CAMT”) and its applicability. We have considered the applicability of the CAMT and determined that it does not have a material impact on our consolidated financial statements in fiscal 2025.
The Company recognized a tax benefit of approximately $1.5 million, $1.3 million and $2.1 million for the years ended May 31, 2025, May 25, 2024 and May 27, 2023, respectively, associated with the exercise of nonqualified stock options, vesting of restricted stock awards, restricted stock units, performance-based stock units, and disqualifying dispositions by employees of shares acquired under the Company's Employee Stock Purchase Plan.
64 — rgp. 2025 Annual Report
The Company has tax-effected foreign net operating loss carryforwards of $18.9 million ($76.1 million on a gross basis), tax-effected federal net operating loss carryforwards of $0.1 million, tax-effected state net operating loss carryforwards of $0.7 million, capital loss carryforwards of $1.6 million, and foreign tax credit carryforwards of $0.3 million. The federal net operating loss is carried forward indefinitely, but it may only reduce 80% of taxable income in a carryforward tax year. The state net operating loss carryforwards will expire beginning in fiscal 2030, the capital loss carryforwards will expire in fiscal 2028, and the foreign tax credits will expire beginning in fiscal 2028. The following table summarizes the foreign net operating losses expiration periods (in thousands):
| | | | | |
| Expiration Periods | Amount of Net Operating Losses |
| Fiscal Years Ending: | |
| 2026 | $ | 1 | |
| 2027 and beyond | 2,113 | |
| Unlimited | 74,019 | |
| Total | $ | 76,133 | |
The following table summarizes the activity in the Company’s valuation allowance accounts (in thousands):
| | | | | | | | | | | | | | | | | | | | | | | |
| Beginning
Balance | | Charged to
Operations | | Currency
Rate
Changes | | Ending
Balance |
| Years Ended: | | | | | | | |
| May 27, 2023 | $ | 8,249 | | | $ | (1,343) | | | $ | (392) | | | $ | 6,514 | |
| May 25, 2024 | $ | 6,514 | | | $ | 1,964 | | | $ | 72 | | | $ | 8,550 | |
| May 31, 2025 | $ | 8,550 | | | $ | 20,450 | | | $ | 402 | | | $ | 29,402 | |
Realization of deferred tax assets is dependent upon generating sufficient future taxable income of the appropriate character. Management believes that it is more likely than not that all remaining deferred tax assets will be realized through future taxable earnings. Given the current economic outlook, management believes there is a reasonable possibility that within the next 12 months, sufficient evidence may become available to allow it to reach a conclusion to establish or release a valuation allowance on the deferred tax assets of certain foreign entities.
We repatriated $2.9 million from our Japan subsidiary during the year ended May 31, 2025. Remaining unremitted earnings as of May 31, 2025 in our Japan subsidiary are intended to be indefinitely reinvested in our Japan subsidiary's operations and growth. Going forward, the indefinite reversal criteria will apply only to the portion of our Japan subsidiary’s unremitted earnings that are needed for its ongoing operations and growth. Deferred income taxes have not been provided on the undistributed earnings of approximately $30.4 million from the Company's foreign subsidiaries as of May 31, 2025 since these amounts are intended to be indefinitely reinvested in foreign operations. If the earnings of the Company's foreign subsidiaries were to be distributed, management estimates that the income tax impact would be immaterial as a result of the transition tax and federal dividends received deduction for foreign source earnings provided under the US Tax Cuts and Jobs Act of 2017.
The following table summarizes the activity related to the gross unrecognized tax benefits (in thousands):
| | | | | | | | | | | | | | | | | |
| For the Years Ended |
| May 31,
2025 | | May 25,
2024 | | May 27,
2023 |
| Unrecognized tax benefits, beginning of year | $ | 1,033 | | | $ | 962 | | | $ | 908 | |
| Gross increases-tax positions in prior period | 82 | | | 71 | | | 54 | |
| Unrecognized tax benefits, end of year | $ | 1,115 | | | $ | 1,033 | | | $ | 962 | |
The Company’s total liability for unrecognized gross tax benefits was $1.1 million, $1.0 million and $1.0 million as of May 31, 2025, May 25, 2024 and May 27, 2023, respectively, which, if ultimately recognized, any differences in assessment or non-assessment would impact the effective tax rate in future periods. The unrecognized tax benefits are
rgp. 2025 Annual Report — 65
included in long-term liabilities in the Consolidated Balance Sheets. None of the unrecognized tax benefits are short-term liabilities as management does not anticipate any cash payments within 12 months to settle the liability.
The Company’s major income tax jurisdiction is the U.S., with federal statutes of limitations remaining open for fiscal 2020 and thereafter. For states within the U.S. in which the Company does significant business, the Company remains subject to examination for fiscal 2020 and thereafter. Most major foreign jurisdictions remain open for fiscal years ended 2020 and thereafter.
The Company recognizes interest and penalties related to unrecognized tax benefits as a part of its provision for income taxes. During the fiscal years ended May 31, 2025, May 25, 2024 and May 27, 2023, the Company accrued interest of $82,000, $71,000 and $54,000, respectively, as a component of the liability for unrecognized tax benefits. The Company's cumulative accrued interest was $267,000, $185,000 and $114,000 as of May 31, 2025, May 25, 2024 and May 27, 2023, respectively.
10. Accrued Salaries and Related Obligations
Accrued salaries and related obligations consist of the following (in thousands):
| | | | | | | | | | | |
| As of
May 31,
2025 | | As of
May 25,
2024 |
| Accrued salaries and related obligations | $ | 17,807 | | | $ | 14,450 | |
| Accrued bonuses | 14,911 | | | 9,039 | |
| Accrued vacation | 15,213 | | | 18,510 | |
| $ | 47,931 | | | $ | 41,999 | |
11. Concentrations of Credit RiskThe Company currently maintains cash and cash equivalents in commercial paper or money market accounts.
Financial instruments, which potentially subject the Company to concentration of credit risk, consist primarily of trade receivables. However, concentrations of credit risk are limited due to the large number of customers comprising the Company’s client base and their dispersion across different business and geographic areas. The Company monitors its exposure to credit losses and maintains an allowance for anticipated losses. A significant change in the liquidity or financial position of one or more of the Company’s clients could result in an increase in the allowance for anticipated losses. No single client accounted for more than 10% of revenue for the years ended May 31, 2025, May 25, 2024 and May 27, 2023. No single client accounted for more than 10% of trade accounts receivable as of May 31, 2025, or May 25, 2024.
12. Stockholders’ Equity
Stock Repurchase Program
The Company’s Board of Directors has previously approved two stock repurchase programs authorizing the repurchase, at the discretion of the Company’s senior executives, of the Company’s common stock for a designated aggregate dollar limit. In July 2015, the first program was authorized for an aggregate dollar limit not to exceed $150 million, and in October 2024, the second program was authorized for an additional dollar limit not to exceed $50 million (collectively, the “Stock Repurchase Programs”). Subject to the aggregate dollar limits, the currently authorized Stock Repurchase Programs do not have an expiration date. Repurchases under the programs may take place in the open market or in privately negotiated transactions and may be made pursuant to a Rule 10b5-1 plan. During the years ended May 31, 2025 and May 25, 2024, respectively, the Company purchased 1,382,820 and 606,254 shares of its common stock on the open market at an average price of $9.40 and $13.20 per share, for an aggregate total purchase price of approximately $13.0 million and $8.0 million. As of May 31, 2025, approximately $79.2 million remained available for future repurchases of the Company’s common stock under the Stock Repurchase Programs.
Quarterly Dividend
Subject to approval each quarter by its Board of Directors, the Company pays a regular dividend. On April 29, 2025, the Board of Directors approved a regular quarterly dividend of $0.07 per share of the Company’s common stock. The
66 — rgp. 2025 Annual Report
dividend was paid on July 21, 2025 to stockholders of record at the close of business on June 23, 2025. As of May 31, 2025 and May 25, 2024, approximately $2.3 million and $4.7 million was accrued and recorded in other current liabilities in each of the Company’s Consolidated Balance Sheets for dividends declared but not yet paid. Continuation of the quarterly dividend is at the discretion of the Board of Directors and depends upon the Company’s financial condition, results of operations, capital requirements, general business condition, contractual restrictions contained in the Company’s current credit agreements and other agreements, and other factors deemed relevant by the Board of Directors.
13. Revenue Recognition
The timing of revenue recognition, billings and cash collections affects the recognition of accounts receivable, contract assets and contract liabilities.
Contract assets represent the Company’s rights to consideration for completed performance under the contract (e.g., unbilled receivables), in which the Company has transferred control of the product or services before there is an unconditional right to payment. Contract assets were $30.7 million, $29.3 million, and $35.4 million as of May 31, 2025, May 25, 2024, and May 27, 2023, respectively, which were included in trade accounts receivable in the Consolidated Balance Sheets.
Contract liabilities represent deferred revenue when cash is received in advance of performance and are presented in other liabilities in the Consolidated Balance Sheets. Contract liabilities were $4.3 million, $3.5 million, and $3.1 million as of May 31, 2025, May 25, 2024, and May 27, 2023, respectively. Revenues recognized during the year ended May 31, 2025 that were included in deferred revenues as of May 25, 2024 were $1.9 million. Revenues recognized during the year ended May 25, 2024 that were included in deferred revenues as of May 27, 2023 were $2.5 million. Revenues recognized during the year ended May 27, 2023 that were included in deferred revenues as of May 28, 2022 were $3.0 million.
14. Restructuring Activities
During fiscal 2024, the Company initiated a cost reduction plan, including a reduction in force (the “U.S. Restructuring Plan”) intended to reduce costs and streamline operations, which resulted in a reduction of approximately 12% of the Company’s U.S. management and administrative workforce. The Company incurred employee termination costs of $4.1 million associated with the U.S. Restructuring Plan within its RGP segment during the year ended May 25, 2024, which were recorded in selling, general and administrative expenses in its Consolidated Statements of Operations. The U.S. Restructuring Plan was substantially completed during the year ended May 25, 2024. The Restructuring adjustments and costs of $(0.4) million for the year ended May 27, 2023 related to restructuring efforts in previous fiscal years.
In December, 2024, the Company authorized a global cost reduction plan, including a reduction in force (the “2025 Restructuring Plan”) intended to reduce costs and streamline operations. In May 2025, the Company authorized additional global cost reductions. The 2025 Restructuring Plan resulted in a reduction of force of the Company’s global management and administrative workforce. The Company incurred employee termination costs associated with the 2025 Restructuring Plan, which were recorded in selling, general and administrative expenses in its Consolidated Statements of Operations. Restructuring costs were $5.1 million for the year ended May 31, 2025.
The restructuring liability was nominal and $0.8 million as of May 31, 2025 and May 25, 2024, respectively.
15. Stock-Based Compensation Plans
General
The Company’s stockholders approved the 2020 Plan on October 22, 2020, which replaced and succeeded in its entirety the 2014 Plan. On October 17, 2024, the Company’s stockholders approved an amendment and restatement of the 2020 Plan, which increased the maximum number of shares of the Company’s common stock authorized for issuance under the 2020 Plan by 815,000 shares. Executive officers and certain employees, as well as non-employee directors of the Company and certain consultants and advisors are eligible to participate in the 2020 Plan. The maximum number of shares of the Company’s common stock that may be issued or transferred pursuant to awards under the 2020 Plan equals: (1) 815,000 shares, plus (2) 1,797,440 (which represents the number of shares that were available for additional award grant purposes under the 2014 Plan immediately prior to the termination of the authority to grant new awards under the 2014 Plan as of October 22, 2020), plus (3) the number of any shares subject to stock options granted under the 2014 Plan or the Resources Connection, Inc. 2004 Performance Incentive Plan (together with the 2014 Plan, the “Prior Plans”) and outstanding as of October 22, 2020 which expire, or for any reason are cancelled or terminated, after that date without being exercised, plus (4)
rgp. 2025 Annual Report — 67
the number of any shares subject to restricted stock and restricted stock unit awards granted under the Prior Plans that are outstanding and unvested as of October 22, 2020 which are forfeited, terminated, cancelled, or otherwise reacquired after that date without having become vested.
Awards under the 2020 Plan may include, but are not limited to, stock options, stock appreciation rights, restricted stock, performance stock, stock units, stock bonuses and other forms of awards granted or denominated in shares of common stock or units of common stock, as well as certain cash bonus awards. Historically, the Company has granted restricted stock, restricted stock units and stock option awards under the 2020 Plan that typically vest in equal annual installments, and performance stock unit awards under the 2020 Plan that vest upon the achievement of certain Company-wide performance targets at the end of the defined performance period. Stock option grants typically terminate ten years from the date of grant. Vesting periods for restricted stock, restricted stock units and stock option awards range from three years to four years. The performance period for the performance stock unit awards is three years. As of May 31, 2025, there were 1,308,213 shares available for further award grants under the 2020 Plan.
Stock-Based Compensation Expense
Stock-based compensation expense included in selling, general and administrative expenses was $6.8 million, $5.7 million and $9.5 million for the years ended May 31, 2025, May 25, 2024 and May 27, 2023, respectively. These amounts consisted of stock-based compensation expense related to employee stock options, restricted stock awards, restricted stock unit awards and performance stock unit awards under the 2020 Plan and Prior Plans, employee stock purchases made via the ESPP, and stock units credited under the Directors Deferred Compensation Plan. The Company recognized a tax benefit of approximately $1.6 million, $1.1 million, and $2.0 million, associated with such stock-based compensation expense for the years ended May 31, 2025, May 25, 2024, and May 27, 2023, respectively.
The Company recognizes stock-based compensation expense on time-vesting equity awards ratably over the applicable vesting period based on the grant date fair value, net of estimated forfeitures. Expense related to the liability-classified awards reflects the change in fair value during the reporting period. The number of performance stock units earned at the end of the performance period may equal, exceed or be less than the targeted number of shares depending on whether the performance criteria are met, surpassed or not met. During each reporting period, the Company uses the latest forecasted results to estimate the number of shares to be issued at the end of the performance period. Any resulting changes to stock compensation expense are adjusted in the period in which the change in estimates occur.
Stock Options
The following table summarizes the stock option activity for the year ended May 31, 2025 (in thousands, except weighted average exercise price):
| | | | | | | | | | | | | | | | | | | | | | | |
| Number of
Shares
Under
Option | | Weighted
Average
Exercise
Price | | Weighted Average
Remaining
Contractual Life
(in years) | | Aggregate
Intrinsic
Value |
Awards outstanding at May 25, 2024 | 2,185 | | $ | 16.36 | | 3.21 | | $ | - | |
| Exercised | - | | | - | | | | | |
| Forfeited | - | | | - | | | | | |
| Expired | (658) | | | 15.29 | | | | |
Awards outstanding at May 31, 2025 | 1,527 | | $ | 16.89 | | 2.62 | | $ | - | |
Exercisable at May 31, 2025 | 1,527 | | $ | 16.89 | | 2.62 | | $ | - | |
Vested and expected to vest as of May 31, 2025 (1) | 1,527 | | $ | 16.89 | | 2.62 | | $ | - | |
(1)The expected to vest options are the result of applying the pre-vesting forfeiture rate assumptions to options not yet vested. As of May 31, 2025, all outstanding options have met the vesting requirement.
The aggregate intrinsic value represents the total pre-tax intrinsic value, based on the Company’s closing stock price of $5.22 as of May 30, 2025 (the last trading day of fiscal 2025), which would have been received by the option holders had all option holders exercised their options as of that date.
68 — rgp. 2025 Annual Report
The total pre-tax intrinsic value related to stock options exercised during the years ended May 25, 2024 and May 27, 2023 was $0.5 million and $11.9 million, respectively. The total estimated fair value of stock options that vested during the years ended May 25, 2024 and May 27, 2023 was $0.3 million and $1.2 million, respectively. There were no stock options exercised during the year ended May 31, 2025.
As of May 31, 2025, there was no unrecognized compensation cost related to unvested and outstanding employee stock options.
Valuation and Expense Information for Stock Based Compensation Plans
There were no employee stock options granted during the years ended May 31, 2025 and May 25, 2024.
Employee Stock Purchase Plan
On October 20, 2022, the Company’s stockholders approved an amendment and restatement of the ESPP that increased the number of shares authorized for issuance under the ESPP by 1,500,000, resulting in a maximum number of shares of the Company’s common stock authorized for issuance under the ESPP of 3,325,000 shares.
The Company’s ESPP allows qualified employees (as defined in the ESPP) to purchase designated shares of the Company’s common stock at a price equal to 85% of the lesser of the fair market value of common stock at the beginning or end of each semi-annual stock purchase period. The Company issued 492,858, 455,678 and 393,060 shares of common stock pursuant to the ESPP for the years ended May 31, 2025, May 25, 2024 and May 27, 2023, respectively. There were 830,388 shares of common stock available for issuance under the ESPP as of May 31, 2025.
Restricted Stock Awards
The following table summarizes the activities for the unvested restricted stock awards for the year ended May 31, 2025 (in thousands, except weighted average grant-date fair value):
| | | | | | | | | | | |
| Shares | | Weighted-Average Grant-Date Fair Value |
| Unvested at May 25, 2024 | 223 | | $ | 15.84 | |
| Granted | 149 | | $ | 8.91 | |
| Vested | (103) | | | $ | 16.41 | |
| Forfeited | - | | $ | - | |
| Unvested as of May 31, 2025 | 269 | | $ | 11.80 | |
| Expected to vest as of May 31, 2025 | 262 | | $ | 11.71 | |
As of May 31, 2025, there was $2.3 million of total unrecognized compensation cost related to unvested restricted stock awards. The cost is expected to be recognized over a weighted-average period of 1.56 years. The weighted average estimated fair value per share of restricted stock awards granted during the years ended May 31, 2025, May 25, 2024 and May 27, 2023 was $8.91, $13.79 and $18.31, respectively.
Restricted Stock Units (“RSUs”)
In 2018, the Company adopted the amended and restated Directors Deferred Compensation Plan, which provides the non-employee members of the Company’s Board of Directors with the opportunity to defer certain cash compensation and equity awards earned or granted for their service in the form of stock units (“Stock Units”). The Stock Units are used solely as a device for determining the amount of cash eventually paid to the director. Each Stock Unit has the same value as one share of the Company’s common stock. Stock Units are not paid out until the director leaves the Board of Directors, at which time the cash value of the Stock Units is paid out in accordance with terms of the plan and the director’s election. Additional Stock Units are credited to reflect dividends paid on shares of the Company’s common stock. Stock Units credited to a director pursuant to an election to defer cash compensation (and any dividend equivalents credited thereon) are fully vested at all times. Stock Units credited to a director pursuant to an election to defer an equity award are subject to the vesting conditions applicable to the equity award, except that dividend equivalents credited to a director with respect to such Stock Units are vested at all times. These liability-classified awards are re-measured at each reporting date and on settlement using the closing price of the Company’s common stock on that date. Any change in fair value is recorded as stock-based
rgp. 2025 Annual Report — 69
compensation expense in the period. The Company recognizes stock-based compensation expense on these Stock Units using the straight-line method over the requisite service period.
The Company also grants RSUs to its employees under the 2020 Plan, which are classified as equity awards. The following table summarizes the activities for the unvested RSUs, including both equity- and liability-classified RSUs, for the year ended May 31, 2025 (in thousands, except weighted average grant-date fair value):
| | | | | | | | | | | | | | | | | | | | | | | | | | | | | | | | | | | |
| Equity-Classified RSUs | | Liability-Classified RSUs | | Total RSUs |
| Shares | | Weighted-Average Grant-Date Fair Value | | Shares | | Weighted-Average Grant-Date Fair Value | | Shares | | Weighted-Average Grant-Date Fair Value |
| Unvested at May 25, 2024 | 615 | | $ | 14.91 | | | 48 | | $ | 15.64 | | | 663 | | $ | 14.96 | |
Granted (1) | 1,081 | | 9.95 | | | 45 | | 8.68 | | | 1,126 | | 9.90 | |
| Vested | (263) | | | 14.45 | | | (30) | | | 12.93 | | | (293) | | | 14.29 | |
| Forfeited | (110) | | | 12.95 | | | - | | - | | | (110) | | | 12.95 | |
| Unvested as of May 31, 2025 | 1,323 | | $ | 11.16 | | | 63 | | $ | 11.95 | | | 1,386 | | $ | 11.20 | |
| Expected to vest as of May 31, 2025 | 1,120 | | $ | 11.17 | | | 63 | | $ | 11.95 | | | 1,183 | | $ | 11.21 | |
(1)The dividend equivalents are included in the granted shares.
As of May 31, 2025, there was $8.8 million of total unrecognized compensation cost related to unvested RSUs (which are the RSUs granted under the 2020 Plan that settle in shares of the Company’s common stock). The cost is expected to be recognized over a weighted-average period of 2.13 years.
As of May 31, 2025, there was $0.6 million of total unrecognized compensation cost related to unvested liability-classified RSUs (which are the stock units credited under the Directors Deferred Compensation Plan that settle in cash). That cost is expected to be recognized over a weighted average period of 1.78 years.
The weighted average estimated fair value per share of RSUs granted during the years ended May 31, 2025, May 25, 2024 and May 27, 2023 was $9.90, $13.54 and $18.27, respectively.
Performance Stock Units (“PSUs”)
The Company granted PSUs to certain members of management and other select employees. The total number of shares that will vest under the PSUs will be determined at the end of a three-year performance period based on the Company’s achievement of certain revenue and Adjusted EBITDA percentage targets over the performance period. The total number of shares that may be earned for these awards based on performance over the performance period ranges from zero to 150% of the target number of shares.
The following table summarizes the activities for the unvested PSUs for the year ended May 31, 2025 (in thousands, except weighted average grant-date fair value):
| | | | | | | | | | | |
| Shares (1) | | Weighted-Average Grant-Date Fair Value |
| Unvested at May 25, 2024 | 621 | | $ | 16.15 | |
Granted (2) | 366 | | 9.12 | |
| Vested | (164) | | | 18.41 | |
| Forfeited | (125) | | | 13.65 | |
| Unvested as of May 31, 2025 | 698 | | $ | 12.60 | |
| Expected to vest as of May 31, 2025 | 507 | | $ | 10.85 | |
(1)Shares are presented at the stated target, which represents the base number of shares that would vest. Actual shares that vest may be 0-150% of the target based on the achievement of the specific company-wide performance targets.
(2)The dividend equivalents are included in the granted shares.
70 — rgp. 2025 Annual Report
As of May 31, 2025, there was no unrecognized compensation cost related to unvested PSUs.
16. Benefit Plan
The Company maintains the Resources Global Professionals 401(k) Savings Plan, a defined contribution plan (the “401(k) Plan”) which generally covers all employees in the U.S. who have completed three months of service. Participants may contribute up to 75% of their annual salary, up to the maximum amount allowed by applicable law. Pursuant to the terms of the 401(k) Plan, the Company may make discretionary matching contributions. The Company, at its sole discretion, determines the matching contribution made at each pay period. For the years ended May 31, 2025, May 25, 2024 and May 27, 2023, the Company contributed $3.1 million, $7.9 million and $8.7 million, respectively, to the 401(k) Plan as Company matching contributions.
17. Commitments and Contingencies
Legal Proceedings
The Company is involved in certain legal matters in the ordinary course of business. In the opinion of management, all such matters, if disposed of unfavorably, would not have a material adverse effect on the Company’s financial position, cash flows or results of operations.
18. Segment Information and Enterprise Reporting
During the first quarter of fiscal 2025, the Company reorganized its business segments to better align with changes in its internal operating model and financial reporting, which is used for performance assessment and resource allocation by the CODMs. All prior year periods presented were recast to reflect the impact of the preceding segment changes. See Note 2 – Summary of Significant Accounting Policies for further discussion about the Company’s operating and reportable segments.
The tables below reflect the operating results of the Company’s segments consistent with the management and performance measurement system utilized by the Company. Performance measurement is based on segment Adjusted EBITDA, a non-GAAP measure. Adjusted EBITDA is defined as net income (loss) before amortization expense, depreciation expense, interest and income taxes excluding stock-based compensation expense, amortized Enterprise Resource Planning (“ERP”) system costs, technology transformation costs, goodwill impairment, acquisition costs, gain on sale of assets, and restructuring costs. Adjusted EBITDA at the segment level excludes certain shared corporate administrative costs that are not practical to allocate. The Company’s CODMs do not evaluate segments using asset information.
The table below represents a reconciliation of the Company’s net income (loss) to Adjusted EBITDA for all periods presented (in thousands):
rgp. 2025 Annual Report — 71
| | | | | | | | | | | | | | | | | |
| For the Years Ended |
| May 31,
2025 | | May 25,
2024 | | May 27,
2023 |
| Revenue: | | | | | |
| On-Demand Talent | $ | 205,976 | | | $ | 272,600 | | | $ | 372,679 | |
| Consulting | 219,215 | | | 227,967 | | | 259,946 | |
| Europe & Asia Pacific | 77,602 | | | 84,207 | | | 93,166 | |
| Outsourced Services | 39,618 | | | 38,122 | | | 38,950 | |
| All Other | 8,920 | | | 9,905 | | | 10,902 | |
| Total consolidated revenue | $ | 551,331 | | | $ | 632,801 | | | $ | 775,643 | |
| | | | | |
| Adjusted EBITDA: | | | | | |
| On-Demand Talent | $ | 17,116 | | | $ | 31,673 | | | $ | 60,484 | |
| Consulting | 31,718 | | | 38,420 | | | 53,477 | |
| Europe & Asia Pacific | 4,478 | | | 5,289 | | | 9,913 | |
| Outsourced Services | 7,581 | | | 7,641 | | | 7,408 | |
| All Other | (1,838) | | (675) | | 1,131 | |
Unallocated items (1) | (35,598) | | (30,865) | | (32,219) |
| | | | | |
| Adjustments: | | | | | |
| Stock-based compensation expense | (6,754) | | (5,732) | | (9,521) |
Amortized ERP system costs (2) | (1,287) | | - | | | - | |
Technology transformation costs (3) | (5,474) | | (6,901) | | (6,355) |
Acquisition costs (4) | (2,763) | | (1,970) | | - | |
Goodwill impairment (5) | (194,409) | | - | | | (2,955) |
Gain on sale of assets (6) | 3,420 | | | - | | | - | |
Restructuring cost (7) | (5,061) | | (4,087) | | 364 | |
| Amortization expense | (5,880) | | (5,378) | | (5,018) |
| Depreciation expense | (1,868) | | (3,050) | | (3,539) |
Contingent consideration adjustment (8) | - | | | 4,400 | | | - | |
| Interest income, net | 544 | | | 1,064 | | | (552) |
| Income (loss) before income tax benefit (expense) | (196,075) | | 29,829 | | | 72,618 | |
| Income tax benefit (expense) | 4,295 | | (8,795) | | | (18,259) | |
| Net income (loss) | $ | (191,780) | | $ | 21,034 | | | $ | 54,359 | |
(1)Unallocated items are generally comprised of unallocated corporate administrative costs, including management and board compensation, corporate support function costs and other general corporate costs that are not allocated to segments.
(2)Amortized ERP system costs represent the amortization of capitalized technology transformation costs related to newly implemented ERP system, which was recorded within selling, general, and administrative expenses on the Consolidated Statement of Operations.
(3)Technology transformation costs represent costs included in net income (loss) related to the Company’s initiative to upgrade its technology platform globally, including a cloud-based ERP system and talent acquisition and management systems. Such costs primarily include hosting and certain other software licensing costs, third-party consulting fees and costs associated with dedicated internal resources that are not capitalized.
72 — rgp. 2025 Annual Report
(4)Acquisition costs primarily represent costs included in net income (loss) related to the Company’s business acquisition. These costs include transaction bonuses, cash retention bonus accruals, and fees paid to the Company's broker, legal counsel, and other professional services firms. See Note 3 – Acquisitions and Dispositions for further discussion.
(5)The effect of the goodwill impairment charge recognized during the year ended May 31, 2025 was related to the On-Demand Talent, Consulting, and Europe and Asia Pacific segments and during the year ended May 27, 2023 related to the Sitrick segment.
(6)Gain on sale of assets was related to the Company’s sale of its Irvine office building, which was completed on August 15, 2024.
(7)Restructuring costs for the year ended May 31, 2025 related to the 2025 Restructuring Plan, which were authorized in December 2024 and May 2025. Restructuring costs for the year ended May 25, 2024 related to U.S. Restructuring Plan, which was authorized in October 2023, and was substantially completed during fiscal 2024. The restructuring credits for the year ended May 27, 2023 related to the release of accrued restructuring liabilities upon completion of the global restructuring and business transformation plans from fiscal 2021.
(8)Contingent consideration adjustment related to the remeasurement of contingent liabilities related to the CloudGo acquisition.
The tables below disclose the Company’s revenue, gross profit, significant expenses, Adjusted EBITDA, gross margin and Adjusted EBITDA margin by segment (amount in thousands): | | | | | | | | | | | | | | | | | | | | | | | | | | | | | | | | | | | | | | |
| | Year Ended May 31, 2025 |
| | On-Demand Talent | | Consulting | | Europe and Asia Pacific | | Outsourced Services | | All Other | | | | |
| Revenue | | $ | 205,976 | | $ | 219,215 | | $ | 77,602 | | $ | 39,618 | | $ | 8,920 | | | | |
| Cost of services | | 127,195 | | 137,619 | | 50,216 | | 23,646 | | 5,231 | | | | |
| Gross Profit | | 78,781 | | 81,596 | | 27,386 | | 15,972 | | 3,689 | | | | |
| | | | | | | | | | | | | | |
Compensation, bonus and commissions (1) | | 47,048 | | 38,313 | | 16,390 | | 5,977 | | 2,134 | | | | |
Other segment expenses (2) | | 14,617 | | 11,565 | | 6,518 | | 2,414 | | 3,393 | | | | |
| Adjusted EBITDA | | $ | 17,116 | | $ | 31,718 | | $ | 4,478 | | $ | 7,581 | | $ | (1,838) | | | | |
| | | | | | | | | | | | | | |
| Gross Margin | | 38.2 | % | | 37.2 | % | | 35.3 | % | | 40.3 | % | | 41.4 | % | | | | |
Adjusted EBITDA margin (3) | | 8.3 | % | | 14.5 | % | | 5.8 | % | | 19.1 | % | | (20.6) | % | | | | |
rgp. 2025 Annual Report — 73
| | | | | | | | | | | | | | | | | | | | | | | | | | | | | | | | | | | | | | |
| | Year Ended May 25, 2024 |
| | On-Demand Talent | | Consulting | | Europe and Asia Pacific | | Outsourced Services | | All Other | | | | |
| Revenue | | $ | 272,600 | | $ | 227,967 | | $ | 84,207 | | $ | 38,122 | | $ | 9,905 | | | | |
| Cost of services | | 167,796 | | 138,119 | | 53,231 | | 22,239 | | 5,348 | | | | |
| Gross Profit | | 104,804 | | 89,848 | | 30,976 | | 15,883 | | 4,557 | | | | |
| | | | | | | | | | | | | | |
Compensation, bonus and commissions (1) | | 53,910 | | 41,714 | | 17,804 | | 6,472 | | 2,098 | | | | |
Other segment expenses (2) | | 19,221 | | 9,714 | | 7,883 | | 1,770 | | 3,134 | | | | |
| Adjusted EBITDA | | $ | 31,673 | | $ | 38,420 | | $ | 5,289 | | $ | 7,641 | | $ | (675) | | | | |
| | | | | | | | | | | | | | |
| Gross Margin | | 38.4 | % | | 39.4 | % | | 36.8 | % | | 41.7 | % | | 46.0 | % | | | | |
Adjusted EBITDA margin (3) | | 11.6 | % | | 16.9 | % | | 6.3 | % | | 20.0 | % | | (6.8) | % | | | | |
| | | | | | | | | | | | | | | | | | | | | | | | | | | | | | | | | | | | | | |
| | Year Ended May 27, 2023 |
| | On-Demand Talent | | Consulting | | Europe and Asia Pacific | | Outsourced Services | | All Other | | | | |
| Revenue | | $ | 372,679 | | $ | 259,946 | | $ | 93,166 | | $ | 38,950 | | $ | 10,902 | | | | |
| Cost of services | | 222,595 | | 152,898 | | 58,624 | | 22,978 | | 5,406 | | | | |
| Gross Profit | | 150,084 | | 107,048 | | 34,542 | | 15,972 | | 5,496 | | | | |
| | | | | | | | | | | | | | |
Compensation, bonus and commissions (1) | | 67,835 | | 45,215 | | 17,640 | | 6,467 | | 2,481 | | | | |
Other segment expenses (2) | | 21,765 | | 8,356 | | 6,989 | | 2,097 | | 1,884 | | | | |
| Adjusted EBITDA | | $ | 60,484 | | $ | 53,477 | | $ | 9,913 | | $ | 7,408 | | $ | 1,131 | | | | |
| | | | | | | | | | | | | | |
| Gross Margin | | 40.3 | % | | 41.2 | % | | 37.1 | % | | 41.0 | % | | 50.4 | % | | | | |
Adjusted EBITDA margin (3) | | 16.2 | % | | 20.6 | % | | 10.6 | % | | 19.0 | % | | 10.4 | % | | | | |
(1)The significant expense category and amounts align with the segment-level information that is regularly provided to the CODMs.
(2)Other segment expenses include occupancy expenses, business expenses, marketing expenses, recruiting expenses and other operating expenses.
(3)Segment Adjusted EBITDA Margin is calculated by dividing segment Adjusted EBITDA by segment revenue.
The table below represents the Company’s revenue and long-lived assets by geographic location (in thousands):
| | | | | | | | | | | | | | | | | | | | | | | | | | | | | |
| Revenue for the Years Ended | | Long-Lived Assets (1) as of |
| May 31,
2025 | | May 25,
2024 | | May 27
2023 | | May 31,
2025 | | May 25,
2024 |
| United States | $ | 451,228 | | | $ | 519,869 | | | $ | 664,515 | | | $ | 25,297 | | | $ | 13,343 | |
| International | 100,103 | | | 112,932 | | | 111,128 | | | 1,677 | | | 2,319 | |
| Total | $ | 551,331 | | | $ | 632,801 | | | $ | 775,643 | | | $ | 26,974 | | | $ | 15,662 | |
(1)Long-lived assets are comprised of property and equipment and ROU assets.
19. Subsequent Events
On July 2, 2025, the Company, Resources Connection LLC, as borrowers, and all of the Company’s domestic subsidiaries, as guarantors, entered into the New Credit Facility, and concurrently terminated the 2021 Credit Facility. The New Credit Facility provides for a secured revolving loan, available in an amount up to the lesser of $50.0 million and a
74 — rgp. 2025 Annual Report
borrowing base formula tied to eligible receivables, which includes a $10.0 million sublimit for the issuance of standby letters of credit. The New Credit Facility also includes an option to increase the amount of the revolving loan up to an additional $15.0 million. The New Credit Facility will mature on November 30, 2029. The obligations under the New Credit Facility are secured by substantially all assets of the Company, Resources Connection LLC and all of the Company’s domestic subsidiaries.
Borrowings under the New Credit Facility bear interest at a rate per annum of either, at the Company's election (i) Term SOFR (as defined in the New Credit Facility) plus a margin ranging from 1.25% to 2.50% or (ii) the Base Rate (as defined in the New Credit Facility), plus a margin of 0.25% to 1.50%, in either case, with the applicable margin depending on the Company's Consolidated EBITDA (as defined in the New Credit Facility). The Company is also obligated to pay other customary facility fees for a credit facility of this size and type.
The New Credit Facility contains customary covenants, including covenants that limit or restrict the Company’s and its subsidiaries’ ability to incur liens, incur indebtedness, make certain restricted payments, merge or consolidate and make dispositions of assets and financial covenants to maintain a certain consolidated total net leverage ratio and a consolidated fixed charge coverage ratio. Upon the occurrence of an event of default under the New Credit Facility, the lender may cease making loans, terminate the New Credit Facility, and declare all amounts outstanding to be immediately due and payable. The New Credit Facility specifies a number of events of default (some of which are subject to applicable grace or cure periods), including, among other things, non-payment defaults, covenant defaults, cross-defaults to other material indebtedness, bankruptcy and insolvency defaults and material judgment defaults.
On July 4, 2025, One Big Beautiful Bill Act (“OBBBA”) was signed into law. Among other changes, OBBBA makes permanent several expiring provisions from the Tax Cuts and Jobs Act of 2017, restores favorable tax treatment of various business provisions, and modifies the international tax regime. These changes were not reflected in the income tax provision for fiscal 2025, as enactment occurred after the balance sheet date. We are currently evaluating the potential impact of OBBBA on our consolidated financial statements going forward.
Evaluation of Disclosure Controls and Procedures
As required by SEC Rule 13a-15(b) under the Securities Exchange Act of 1934, as amended (the “Exchange Act”), the Company carried out an evaluation, under the supervision and with the participation of the Company’s management, including the Company’s Chief Executive Officer and Chief Financial Officer, of the effectiveness of the design and operation of the Company’s disclosure controls and procedures (as such term is defined in Rule 13a-15(e) under the Exchange Act) as of May 31, 2025. Based on this evaluation, the Company’s Chief Executive Officer and Chief Financial Officer concluded that the Company’s disclosure controls and procedures were effective as of May 31, 2025
Management’s Report on Internal Control Over Financial Reporting
Management is responsible for establishing and maintaining adequate internal control over financial reporting, as such term is defined in Exchange Act Rule 13a-15(f). We maintain internal control over financial reporting designed to provide reasonable assurance regarding the reliability of financial reporting and the preparation of financial statements for external purposes in accordance with generally accepted accounting principles.
Because of its inherent limitations, internal control over financial reporting may not prevent or detect misstatements. Also, projections of any evaluation of effectiveness to future periods are subject to the risk that controls may become inadequate because of changes in conditions, or that the degree of compliance with the policies or procedures may deteriorate.
Under the supervision and with the participation of management, including the Company’s Chief Executive Officer and Chief Financial Officer, the Company conducted an evaluation of the effectiveness of its internal control over financial reporting based on the criteria established in the 2013 Internal Control – Integrated Framework issued by the Committee of Sponsoring Organizations of the Treadway Commission. This evaluation included an assessment of the design of the Company’s internal control over financial reporting and testing of the operational effectiveness of its internal control over financial reporting. Based on this evaluation, management has concluded that the Company’s internal control over financial reporting was effective as of May 31, 2025.
rgp. 2025 Annual Report — 75
The Company’s independent registered public accounting firm, RSM US LLP, which audited the financial statements included in the Annual Report on Form 10-K, has audited the effectiveness of the Company’s internal control over financial reporting as of May 31, 2025, as stated in their report which is included under the heading “Report of Independent Registered Public Accounting Firm.”
Changes in Internal Control Over Financial Reporting
There has been no change in the Company’s internal control over financial reporting during the fiscal quarter ended May 31, 2025 that has materially affected, or is reasonably likely to materially affect, the Company’s internal control over financial reporting.
76 — rgp. 2025 Annual Report
Locations
Domestic Locations
Scottsdale, Arizona
Irvine, California
Los Angeles, California (2)
Mountain View, California
Campbell, California
Sacramento, California
San Francisco, California
Denver, Colorado
Atlanta, Georgia
Chicago, Illinois
Troy, Michigan
Parsippany, New Jersey
New York, New York (3)
Cleveland, Ohio
Philadelphia, Pennsylvania
Dallas, Texas
Houston, Texas
Glen Allen, Virginia
Arlington, VA
Bellevue, Washington
Seattle, Washington
International Locations
Bangalore, India
Mumbai, India
Tokyo, Japan
Kuala Lumpur, Malaysia
Mexico City, Mexico
Amsterdam (Utrecht), Netherlands
Beijing, People’s Republic of China
Hong Kong, People’s Republic of China
Guangzhou, People’s Republic of China
Shanghai, People’s Republic of China
Manila, Philippines
Seoul, South Korea
Singapore
Zurich, Switzerland
Taipei, Taiwan
London, United Kingdom
Sydney, Australia
Shareholder Information
Corporate Publications
Copies of Resources Connection Inc.’s Annual Report on Form 10-K for the year ended May 31, 2025 (excluding exhibits thereto), as well as historical Resources Connection, Inc. quarterly reports on Form 10-Q and other Securities and Exchange Commission filings (excluding exhibits thereto) are available without charge upon request to the Investor Relations Department, Resources Connection Inc., 15950 North Dallas Parkway, Suite 330, Dallas, TX 75248, or from the Company’s Investor Relations website at http://ir.rgp/com.
Forward-Looking Statements
Please refer to the section entitled “Forward-Looking Statements” included in this Annual Report.
Transfer Agent
Equiniti Trust Company, LLC
800-937-5449
Address: 6201 15th Avenue
Brooklyn, NY 11219
Independent Registered Public Accounting Firm
Ernst & Young LLP
Irvine, CA
Resources Connection, Inc. Board of Directors
A. Robert Pisano
Interim Chairman, Resources Connection, Inc.
Business Consultant
Former President and Chief Operating Officer, Motion Picture Association of America
Roger Carlile
Founder, Former Chief Executive Officer and Chairman, Ankura Consulting Group, LLC
Independent Director
Anthony C. Cherbak
Former Chief Executive Officer, Resources Connection, Inc.
Susan M. Collyns
Chief Financial Officer, Fabletics
Independent Director
Neil F. Dimick
Former Executive Vice President and Chief Financial Officer, Amerisource Bergen Corporation
Kate W. Duchene
Chief Executive Officer, Resources Connection, Inc.
Filip J.L. Gydé
Former President and Chief Executive Officer, Computer Task Group (CTG)
Jeffrey H. Fox
Chief Executive Officer, Circumference Group
Independent Director
Robert F. Kistinger
Executive Advisor and former Chief Operating Officer, Bonita Banana Company
Marco von Maltzan
Former Chief Executive Officer, Profine Group
Independent Director
Lisa M. Pierozzi
Former Executive Vice President and Chief Financial Officer, Motion Picture Association of America
Independent Director
Executive Officers
Kate W. Duchene
President and Chief Executive Officer
Bhadresh Patel
Chief Operating Officer
Jennifer Ryu
Executive Vice President and Chief Financial Officer
Corporate Headquarters
214-777-0600
15950 North Dallas Parkway, Suite 330
Dallas, TX 75248
Investor Relations
214-777-0600
http://ir.rgp.com