
Second Quarter 2025 Investor Presentation Encore Capital Group, Inc. August 6, 2025
Encore Capital Group, Inc. 2 Legal Disclaimers The statements in this presentation that are not historical facts, including, most importantly, those statements preceded by, or that include, the words “will,” “may,” “believe,” “projects,” “expects,” “anticipates” or the negation thereof, or similar expressions, constitute “forward-looking statements” within the meaning of the Private Securities Litigation Reform Act of 1995 (the “Reform Act”). These statements may include, but are not limited to, statements regarding our future operating results (including portfolio purchase volumes, collections, cash generation and yields), performance, business plans or prospects, as well as statements regarding supply, portfolio pricing, returns, run rates, tax rates, interest expense, ability to access capital markets, the consumer credit cycle, interest rates and other macroeconomic factors. For all “forward-looking statements,” the Company claims the protection of the safe harbor for forward-looking statements contained in the Reform Act. Such forward-looking statements involve risks, uncertainties and other factors which may cause actual results, performance or achievements of the Company and its subsidiaries to be materially different from any future results, performance or achievements expressed or implied by such forward-looking statements. These risks, uncertainties and other factors are discussed in the reports filed by the Company with the Securities and Exchange Commission, including its most recent report on Form 10-K, as it may be amended from time to time. The Company disclaims any intent or obligation to update these forward-looking statements. Totals in this presentation may reflect slight differences due to rounding.
Encore Capital Group, Inc. 3 MCM drives Encore’s strong Q2 performance ▪ Strong Q2 results across the board o Portfolio purchases of $367M up 32% o Record collections of $655M up 20% o Record ERC of $9.4B up 12% o EPS of $2.49 in Q2 2025 compared to $1.34 in Q2 2024 o Leverage1 improved to 2.6x from 2.7x year/year and flat quarter/quarter despite record U.S. purchasing o Share repurchases of $15M in Q2 for a total of $25M in the first half of 2025 ▪ MCM (U.S.) continues to deliver very strong results o Portfolio supply in the U.S. remains robust o Record portfolio purchases of $317M at very attractive returns o Record collections of $490M up 24% ▪ Cabot (Europe) delivers solid Q2 o Portfolio purchases of $50M in line with historical trend o Collections of $164M up 10% 1) Leverage (or leverage ratio) utilizes non-GAAP metrics and is defined as Net Debt ÷ (LTM Adjusted EBITDA + LTM collections applied to principal balance). See appendix for calculation and a reconciliation to GAAP.
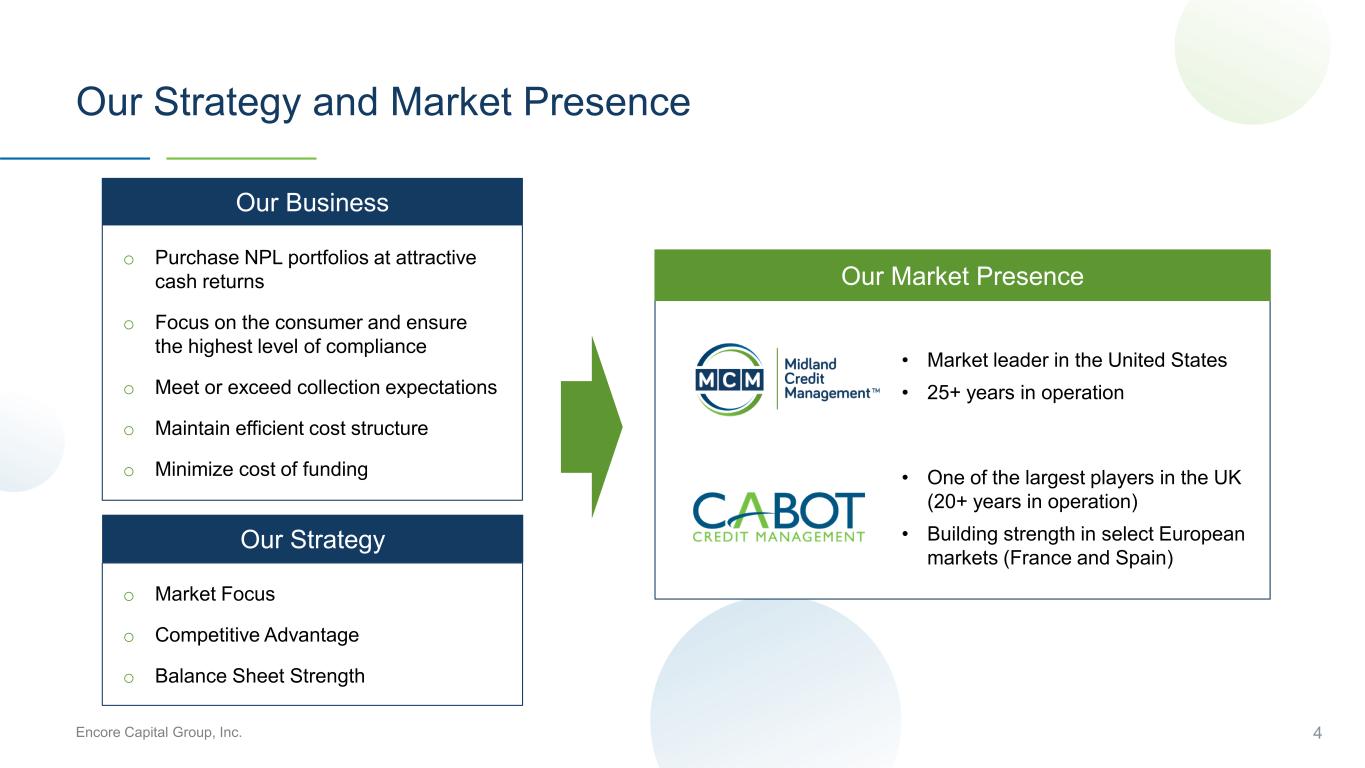
Encore Capital Group, Inc. 4 Our Strategy and Market Presence o Purchase NPL portfolios at attractive cash returns o Focus on the consumer and ensure the highest level of compliance o Meet or exceed collection expectations o Maintain efficient cost structure o Minimize cost of funding o Market Focus o Competitive Advantage o Balance Sheet Strength Our Business Our Strategy • Market leader in the United States • 25+ years in operation • One of the largest players in the UK (20+ years in operation) • Building strength in select European markets (France and Spain) Our Market Presence
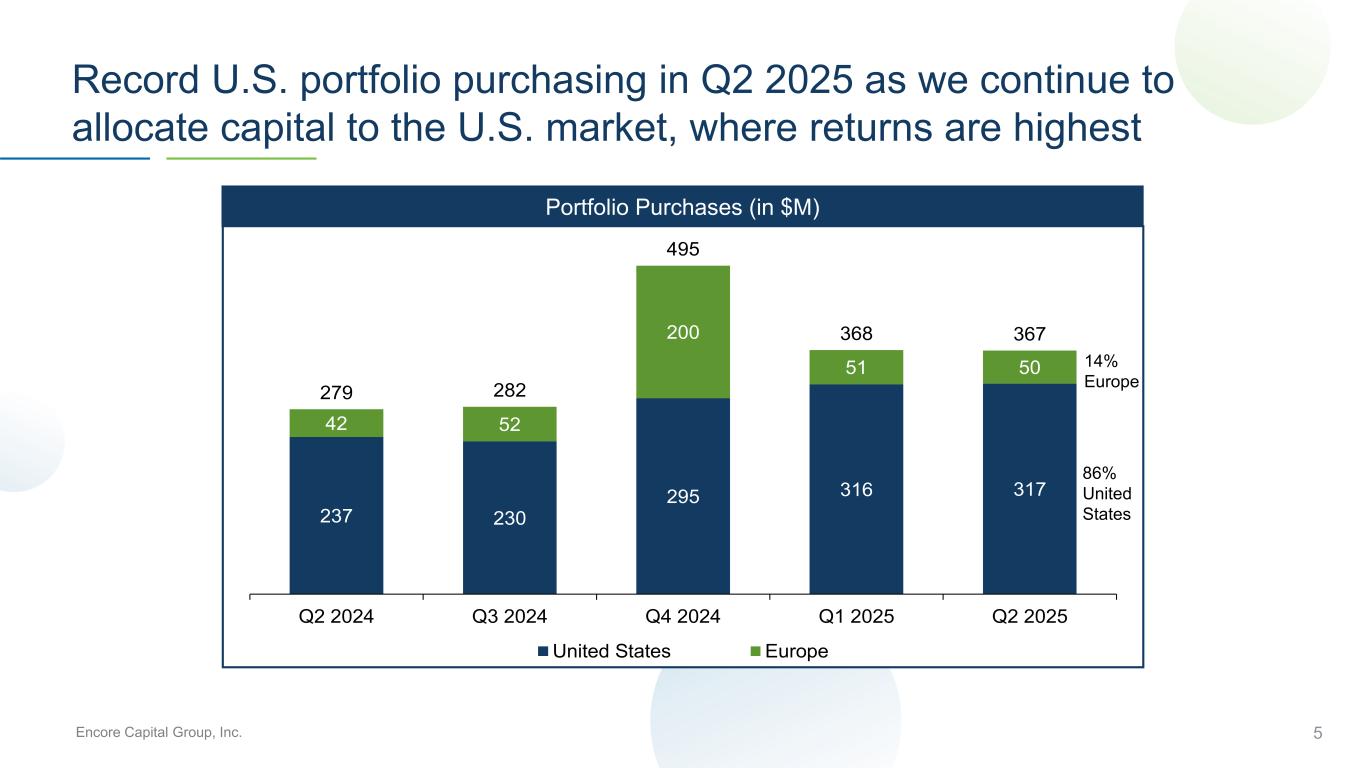
Encore Capital Group, Inc. 237 230 295 316 317 42 52 200 51 50 279 282 495 368 367 Q2 2024 Q3 2024 Q4 2024 Q1 2025 Q2 2025 United States Europe Portfolio Purchases (in $M) 5 Record U.S. portfolio purchasing in Q2 2025 as we continue to allocate capital to the U.S. market, where returns are highest 14% Europe 86% United States
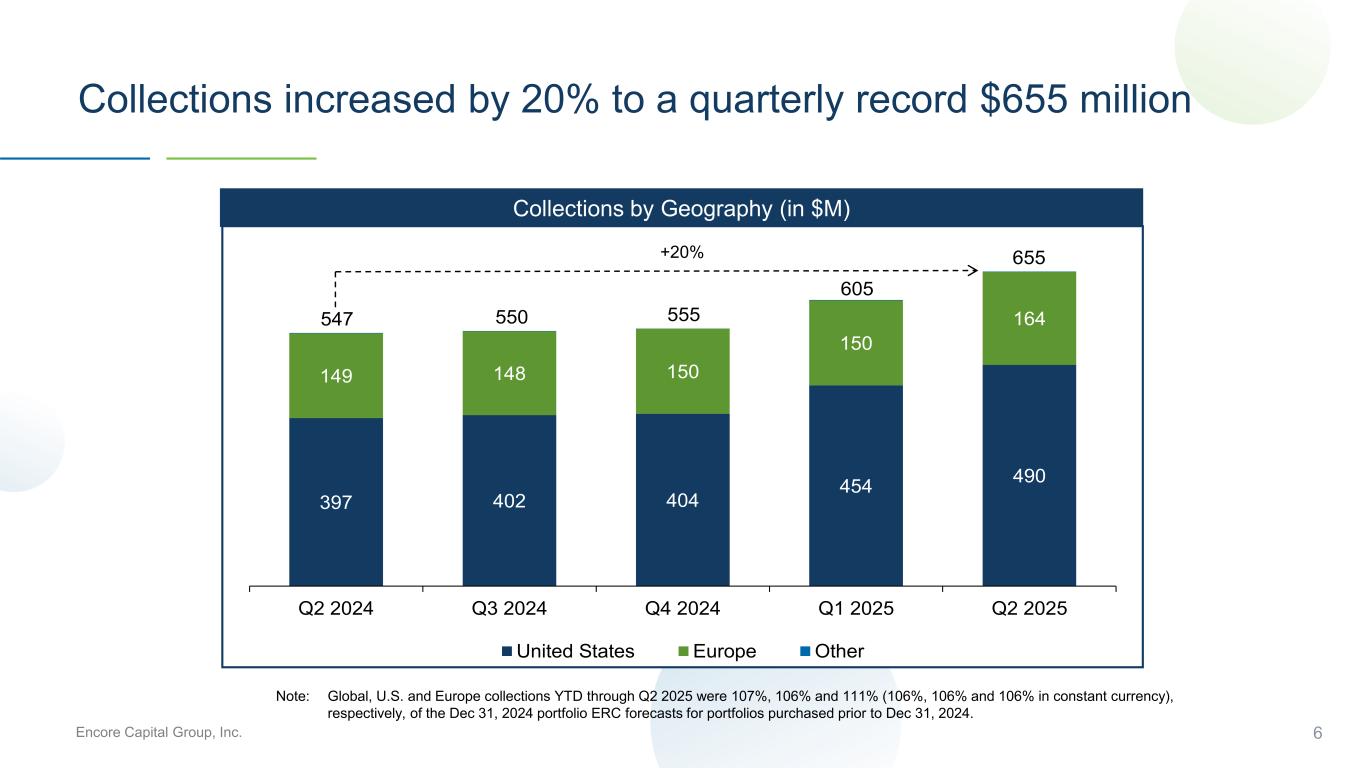
Encore Capital Group, Inc. Collections by Geography (in $M) 397 402 404 454 490 149 148 150 150 164547 550 555 605 655 Q2 2024 Q3 2024 Q4 2024 Q1 2025 Q2 2025 United States Europe Other 6 Collections increased by 20% to a quarterly record $655 million Note: Global, U.S. and Europe collections YTD through Q2 2025 were 107%, 106% and 111% (106%, 106% and 106% in constant currency), respectively, of the Dec 31, 2024 portfolio ERC forecasts for portfolios purchased prior to Dec 31, 2024. +20%
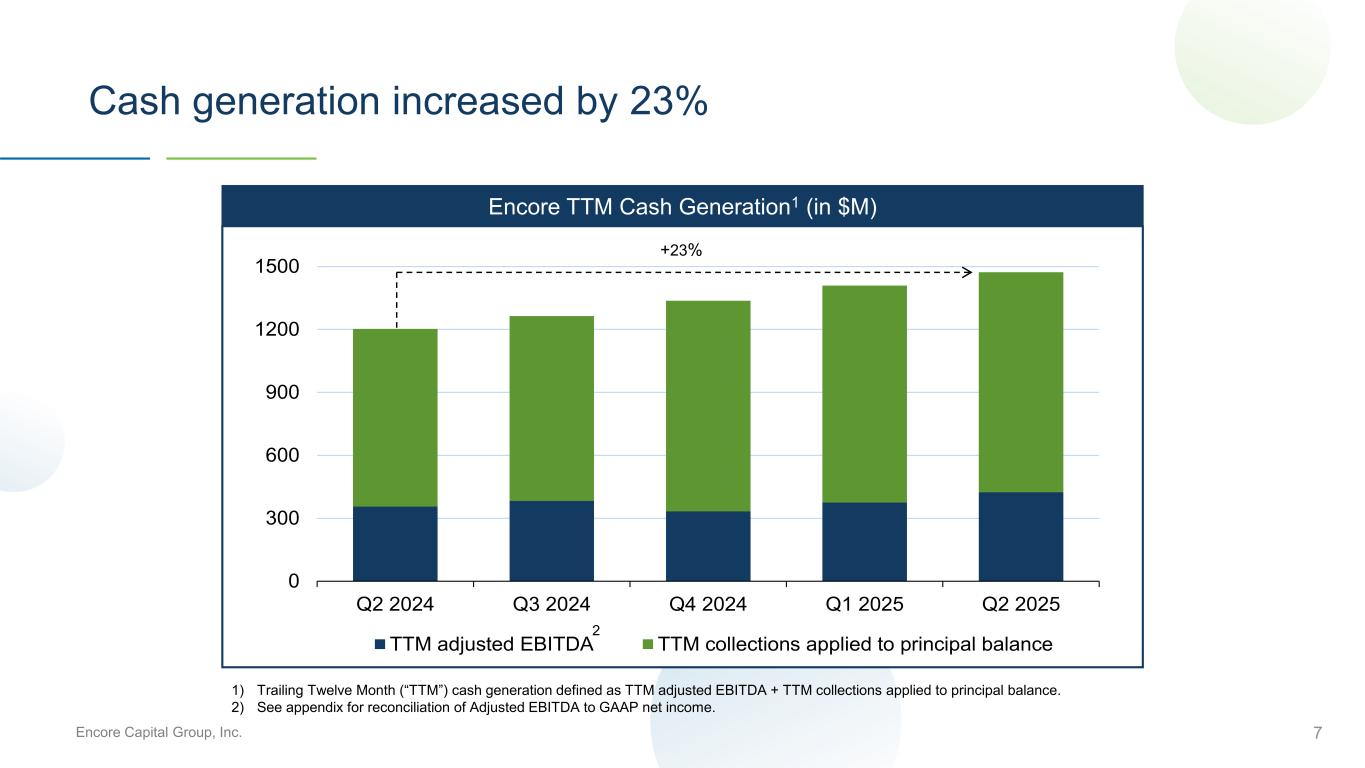
Encore Capital Group, Inc. Encore TTM Cash Generation1 (in $M) 0 300 600 900 1200 1500 Q2 2024 Q3 2024 Q4 2024 Q1 2025 Q2 2025 TTM adjusted EBITDA TTM collections applied to principal balance 7 Cash generation increased by 23% 1) Trailing Twelve Month (“TTM”) cash generation defined as TTM adjusted EBITDA + TTM collections applied to principal balance. 2) See appendix for reconciliation of Adjusted EBITDA to GAAP net income. 2 +23%
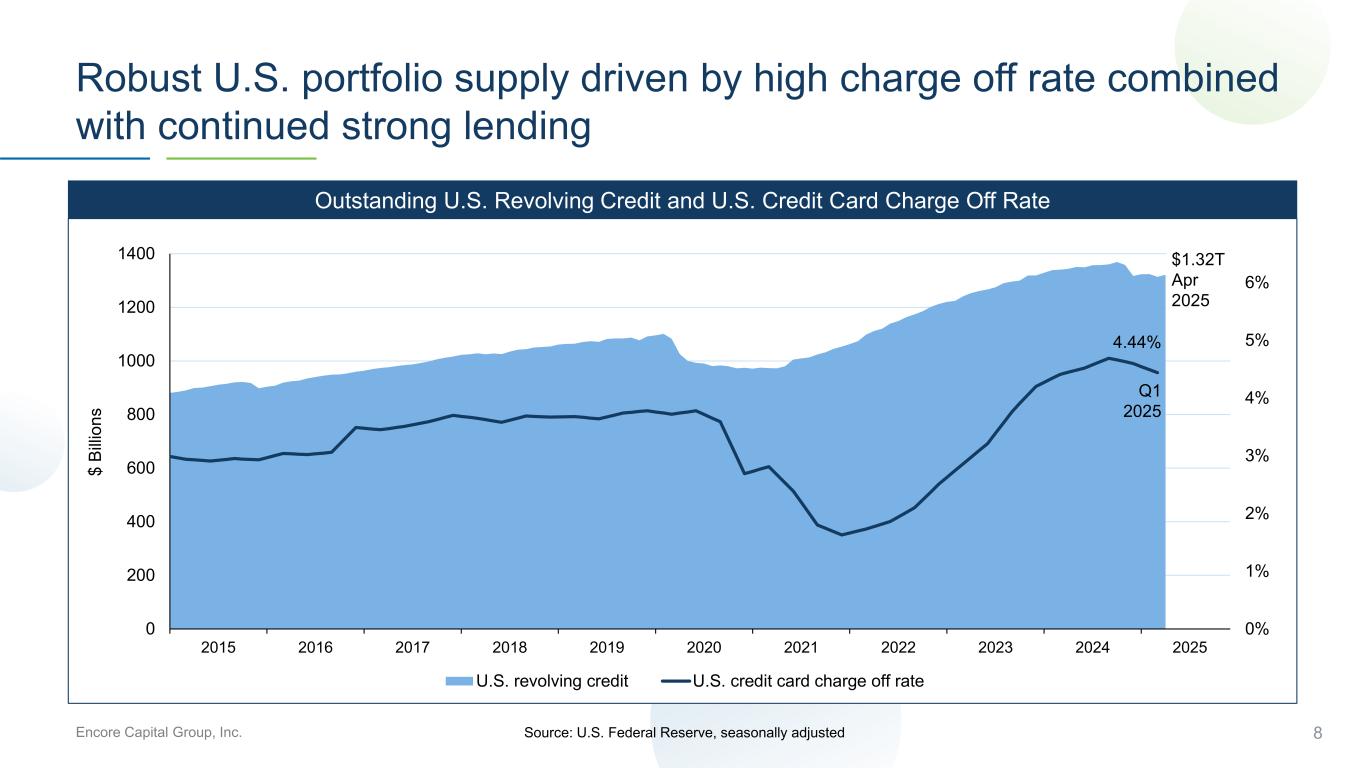
Encore Capital Group, Inc. 8 Robust U.S. portfolio supply driven by high charge off rate combined with continued strong lending Outstanding U.S. Revolving Credit and U.S. Credit Card Charge Off Rate Source: U.S. Federal Reserve, seasonally adjusted 0% 1% 2% 3% 4% 5% 6% 0 200 400 600 800 1000 1200 1400 2015 2016 2017 2018 2019 2020 2021 2022 2023 2024 2025 U.S. revolving credit U.S. credit card charge off rate $ B ill io n s $1.32T Apr 2025 4.44% Q1 2025
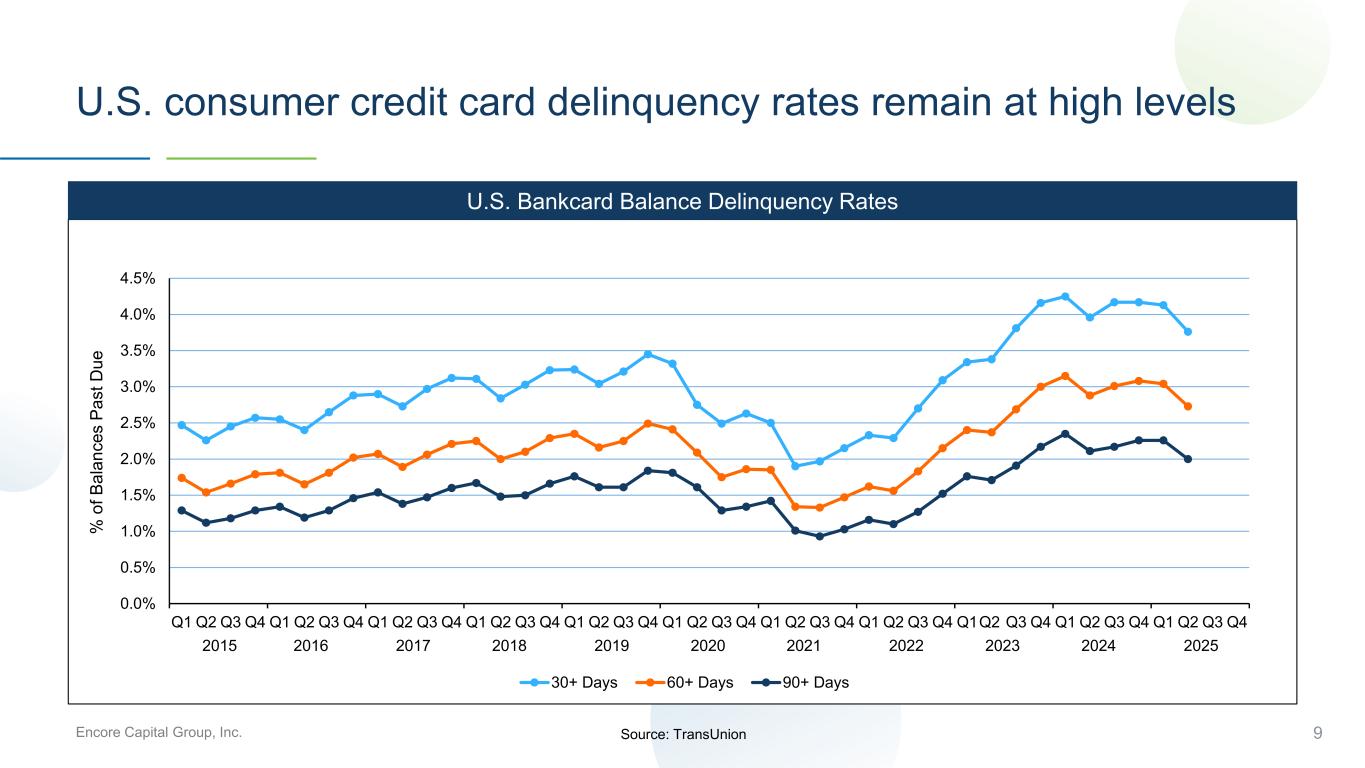
Encore Capital Group, Inc. 9 U.S. consumer credit card delinquency rates remain at high levels Source: TransUnion 0.0% 0.5% 1.0% 1.5% 2.0% 2.5% 3.0% 3.5% 4.0% 4.5% Q1 Q2 Q3 Q4 Q1 Q2 Q3 Q4 Q1 Q2 Q3 Q4 Q1 Q2 Q3 Q4 Q1 Q2 Q3 Q4 Q1 Q2 Q3 Q4 Q1 Q2 Q3 Q4 Q1 Q2 Q3 Q4 Q1Q2 Q3 Q4 Q1 Q2 Q3 Q4 Q1 Q2 Q3 Q4 30+ Days 60+ Days 90+ Days U.S. Bankcard Balance Delinquency Rates 2015 2016 2017 2018 2019 2020 2021 2022 2023 2024 2025 % o f B a la n c e s P a s t D u e
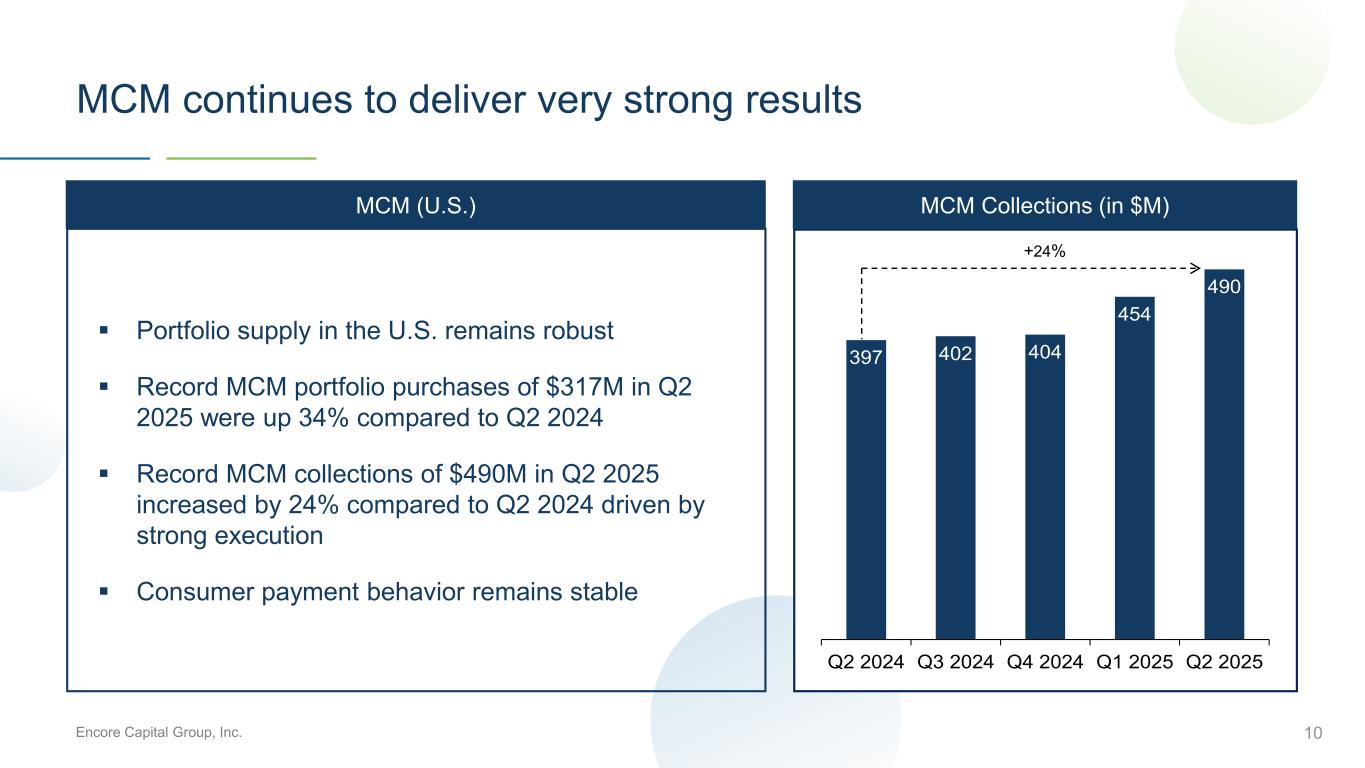
Encore Capital Group, Inc. 397 402 404 454 490 Q2 2024 Q3 2024 Q4 2024 Q1 2025 Q2 2025 10 MCM continues to deliver very strong results ▪ Portfolio supply in the U.S. remains robust ▪ Record MCM portfolio purchases of $317M in Q2 2025 were up 34% compared to Q2 2024 ▪ Record MCM collections of $490M in Q2 2025 increased by 24% compared to Q2 2024 driven by strong execution ▪ Consumer payment behavior remains stable MCM (U.S.) MCM Collections (in $M) +24%
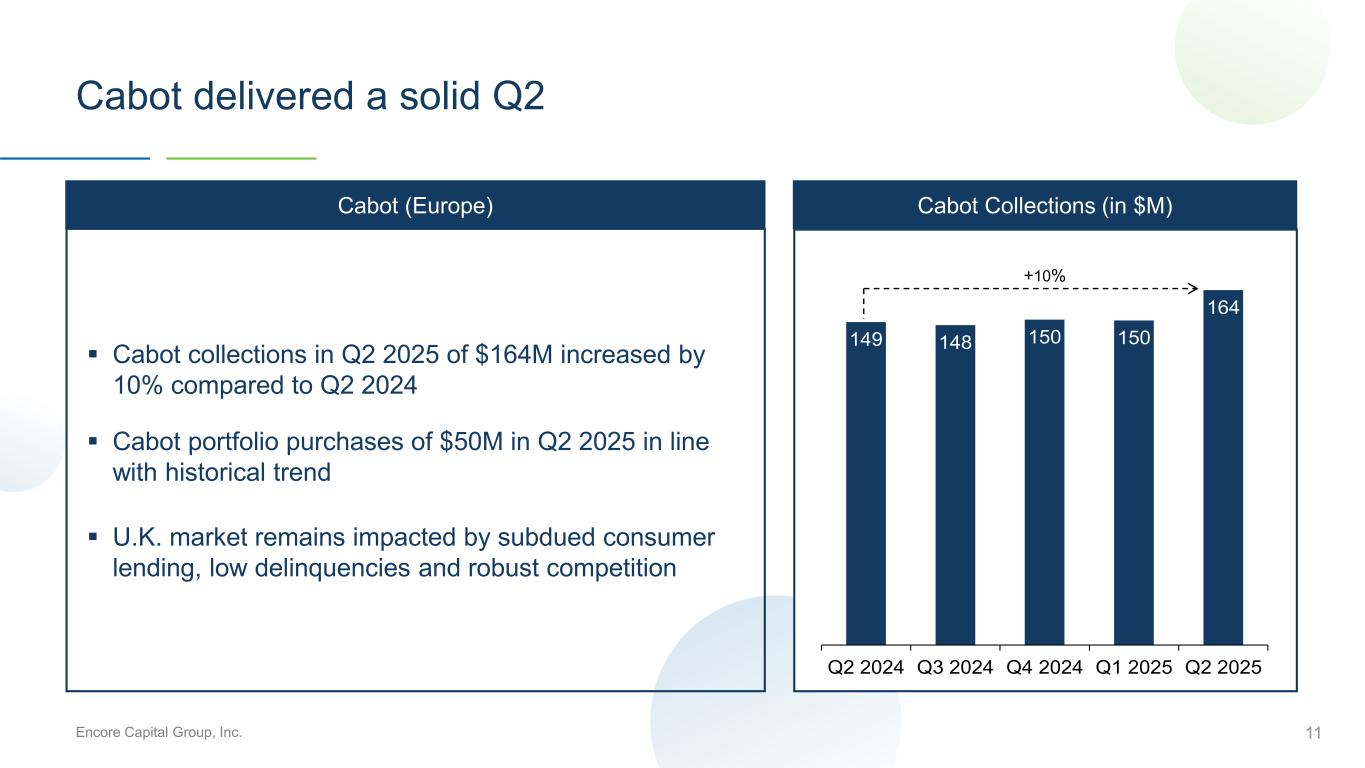
Encore Capital Group, Inc. 149 148 150 150 164 Q2 2024 Q3 2024 Q4 2024 Q1 2025 Q2 2025 11 Cabot delivered a solid Q2 ▪ Cabot collections in Q2 2025 of $164M increased by 10% compared to Q2 2024 ▪ Cabot portfolio purchases of $50M in Q2 2025 in line with historical trend ▪ U.K. market remains impacted by subdued consumer lending, low delinquencies and robust competition Cabot (Europe) Cabot Collections (in $M) +10%

Encore Capital Group, Inc. 12 Detailed Financial Discussion
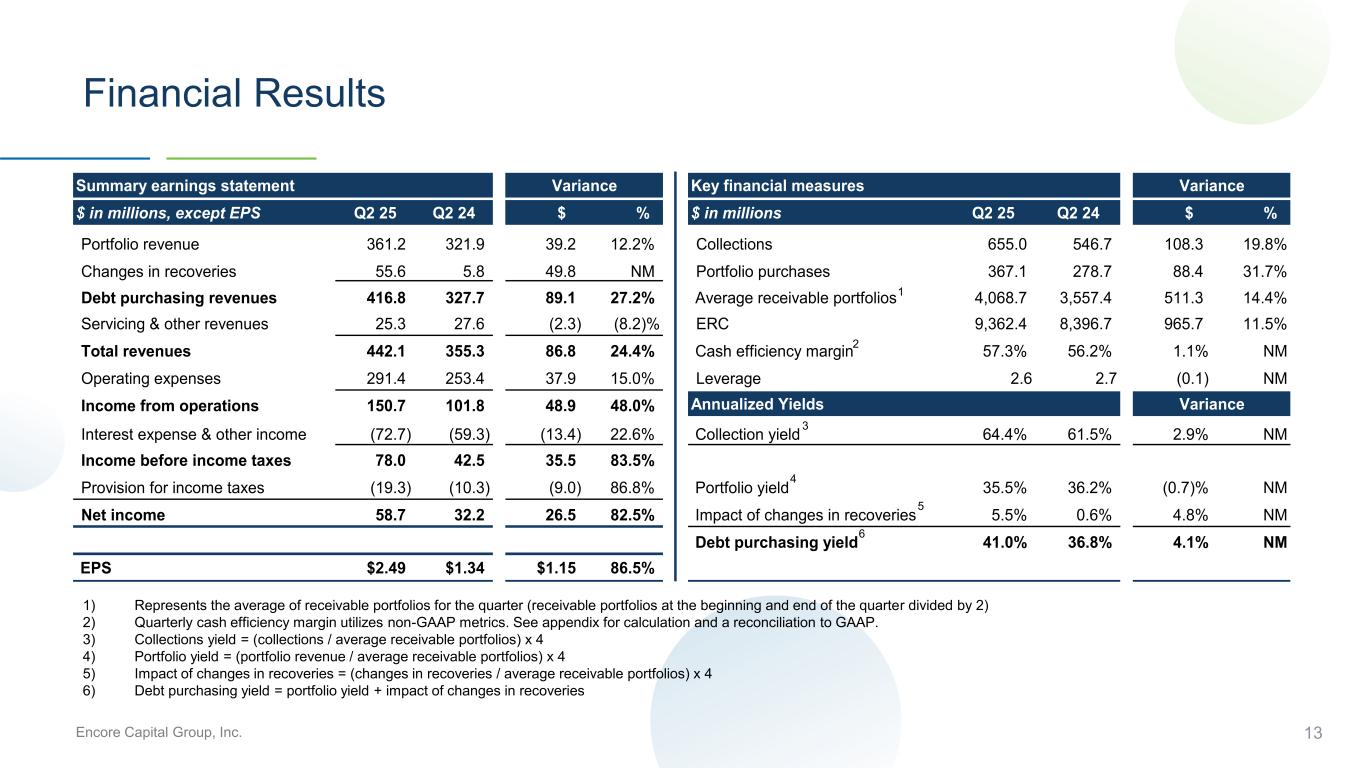
Encore Capital Group, Inc. Summary earnings statement Variance Key financial measures Variance $ in millions, except EPS Q2 25 Q2 24 $ % $ in millions Q2 25 Q2 24 $ % Portfolio revenue 361.2 321.9 39.2 12.2% Collections 655.0 546.7 108.3 19.8% Changes in recoveries 55.6 5.8 49.8 NM Portfolio purchases 367.1 278.7 88.4 31.7% Debt purchasing revenues 416.8 327.7 89.1 27.2% Average receivable portfolios 4,068.7 3,557.4 511.3 14.4% Servicing & other revenues 25.3 27.6 (2.3) (8.2)% ERC 9,362.4 8,396.7 965.7 11.5% Total revenues 442.1 355.3 86.8 24.4% Cash efficiency margin 57.3% 56.2% 1.1% NM Operating expenses 291.4 253.4 37.9 15.0% Leverage 2.6 2.7 (0.1) NM Income from operations 150.7 101.8 48.9 48.0% Annualized Yields 0.00 0.00 Variance Interest expense & other income (72.7) (59.3) (13.4) 22.6% Collection yield 64.4% 61.5% 2.9% NM Income before income taxes 78.0 42.5 35.5 83.5% - - Provision for income taxes (19.3) (10.3) (9.0) 86.8% Portfolio yield 35.5% 36.2% (0.7)% NM Net income 58.7 32.2 26.5 82.5% Impact of changes in recoveries 5.5% 0.6% 4.8% NM Debt purchasing yield 41.0% 36.8% 4.1% NM EPS $2.49 $1.34 $1.15 86.5% 2.49$ 1.34$ 1 13 Financial Results 1) Represents the average of receivable portfolios for the quarter (receivable portfolios at the beginning and end of the quarter divided by 2) 2) Quarterly cash efficiency margin utilizes non-GAAP metrics. See appendix for calculation and a reconciliation to GAAP. 3) Collections yield = (collections / average receivable portfolios) x 4 4) Portfolio yield = (portfolio revenue / average receivable portfolios) x 4 5) Impact of changes in recoveries = (changes in recoveries / average receivable portfolios) x 4 6) Debt purchasing yield = portfolio yield + impact of changes in recoveries 2 3 4 5 6
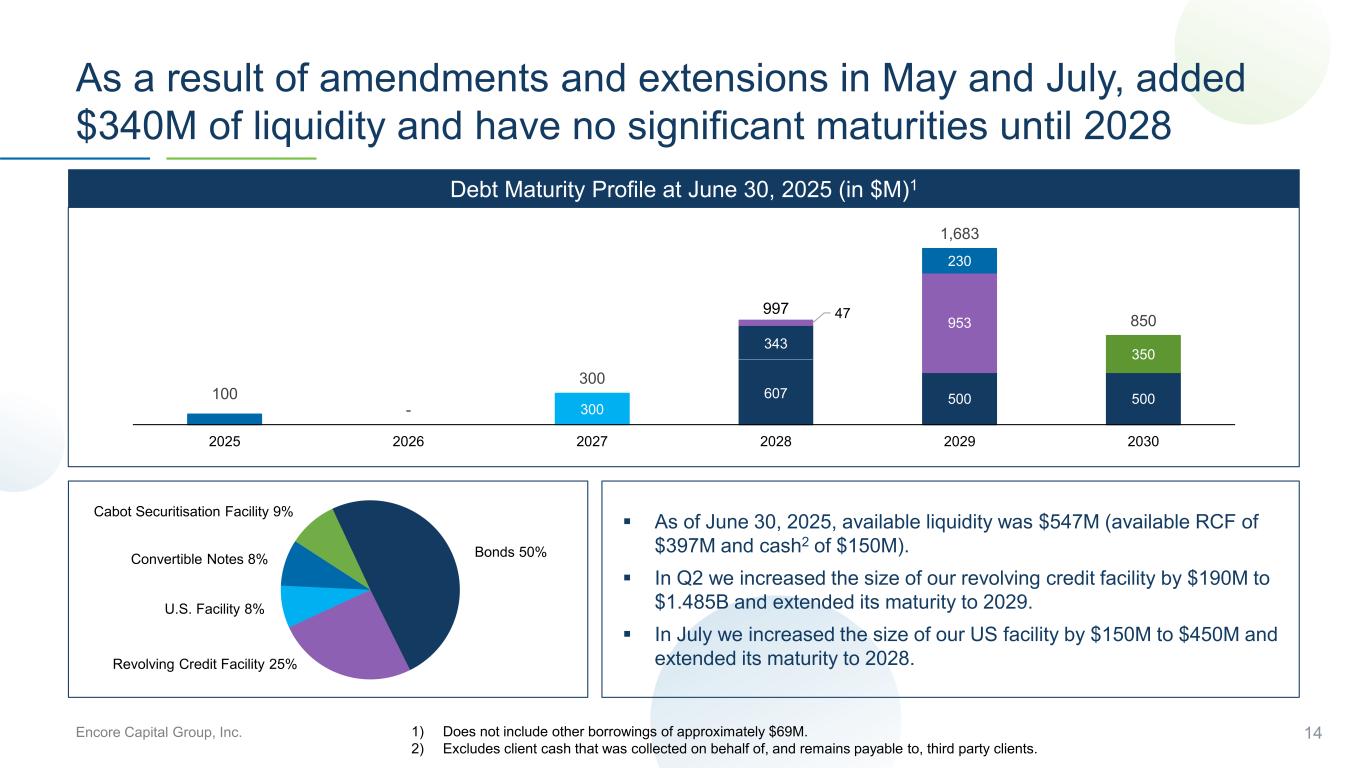
Encore Capital Group, Inc. 14 As a result of amendments and extensions in May and July, added $340M of liquidity and have no significant maturities until 2028 Debt Maturity Profile at June 30, 2025 (in $M)1 607 500 500 343 47 953 300 350 230 100 - 300 997 1,683 850 0 200000000 400000000 600000000 800000000 1E+09 1.2E+09 1.4E+09 1.6E+09 1.8E+09 2E+09 2025 2026 2027 2028 2029 2030 ▪ As of June 30, 2025, available liquidity was $547M (available RCF of $397M and cash2 of $150M). ▪ In Q2 we increased the size of our revolving credit facility by $190M to $1.485B and extended its maturity to 2029. ▪ In July we increased the size of our US facility by $150M to $450M and extended its maturity to 2028. Bonds 50% Revolving Credit Facility 25% U.S. Facility 8% Convertible Notes 8% Cabot Securitisation Facility 9% 1) Does not include other borrowings of approximately $69M. 2) Excludes client cash that was collected on behalf of, and remains payable to, third party clients.
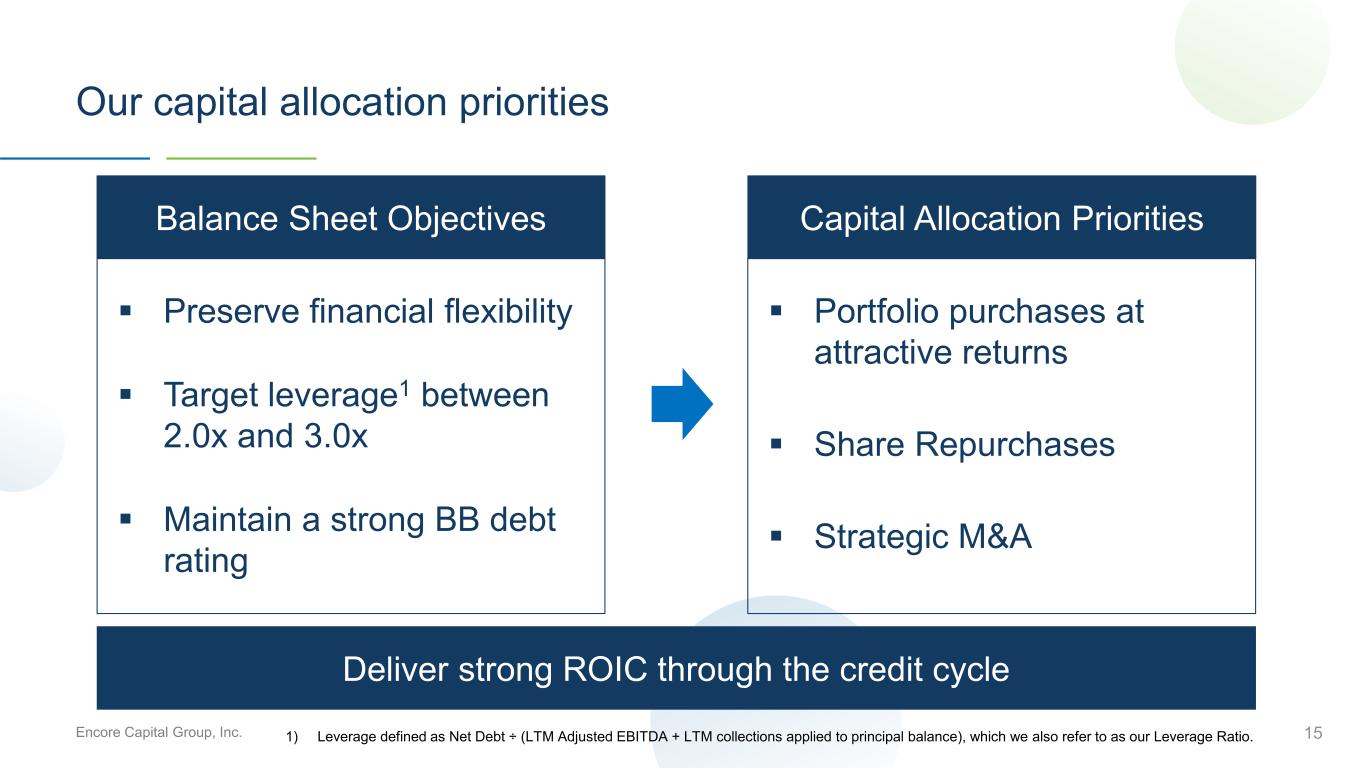
Encore Capital Group, Inc. 15 Our capital allocation priorities ▪ Preserve financial flexibility ▪ Target leverage1 between 2.0x and 3.0x ▪ Maintain a strong BB debt rating ▪ Portfolio purchases at attractive returns ▪ Share Repurchases ▪ Strategic M&A Deliver strong ROIC through the credit cycle Balance Sheet Objectives Capital Allocation Priorities 1) Leverage defined as Net Debt ÷ (LTM Adjusted EBITDA + LTM collections applied to principal balance), which we also refer to as our Leverage Ratio.
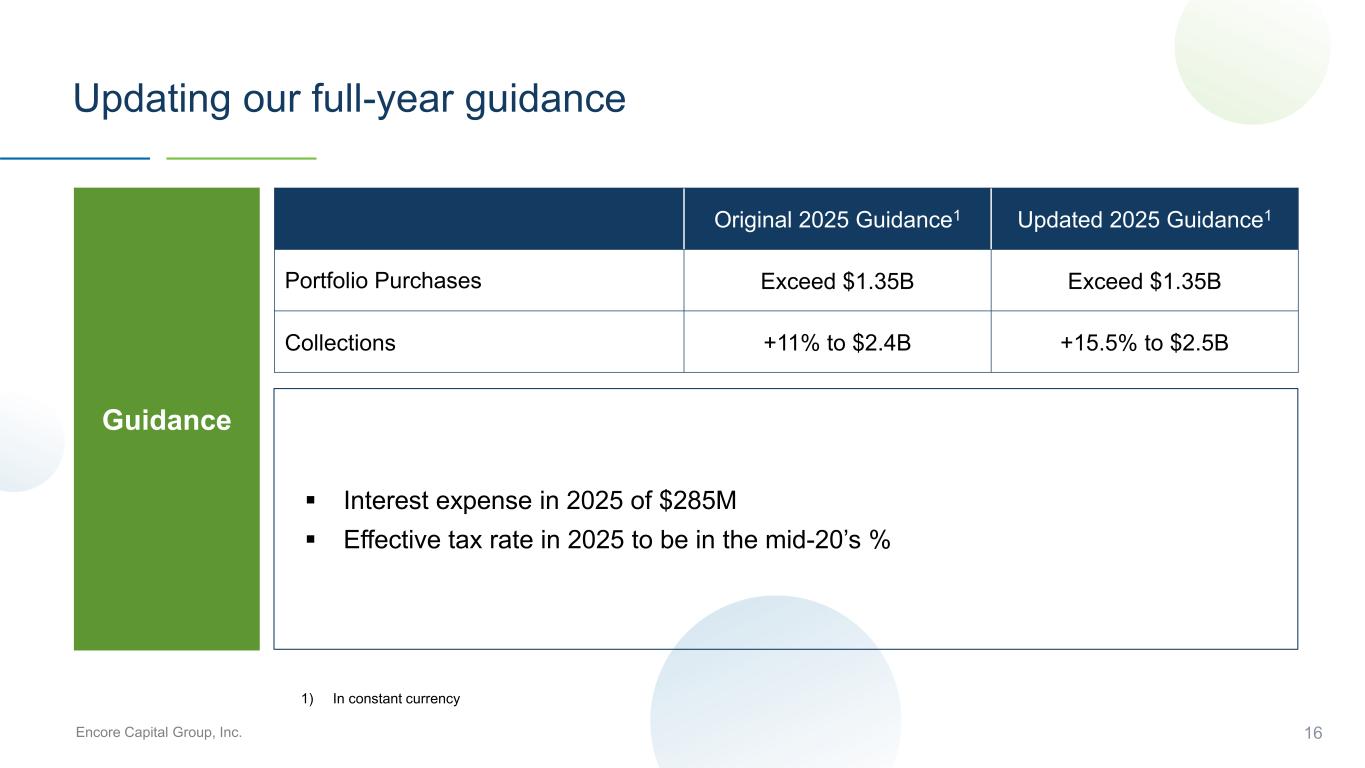
Encore Capital Group, Inc. 16 Updating our full-year guidance Guidance ▪ Interest expense in 2025 of $285M ▪ Effective tax rate in 2025 to be in the mid-20’s % Original 2025 Guidance1 Updated 2025 Guidance1 Portfolio Purchases Exceed $1.35B Exceed $1.35B Collections +11% to $2.4B +15.5% to $2.5B 1) In constant currency

Encore Capital Group, Inc. 17 Appendix
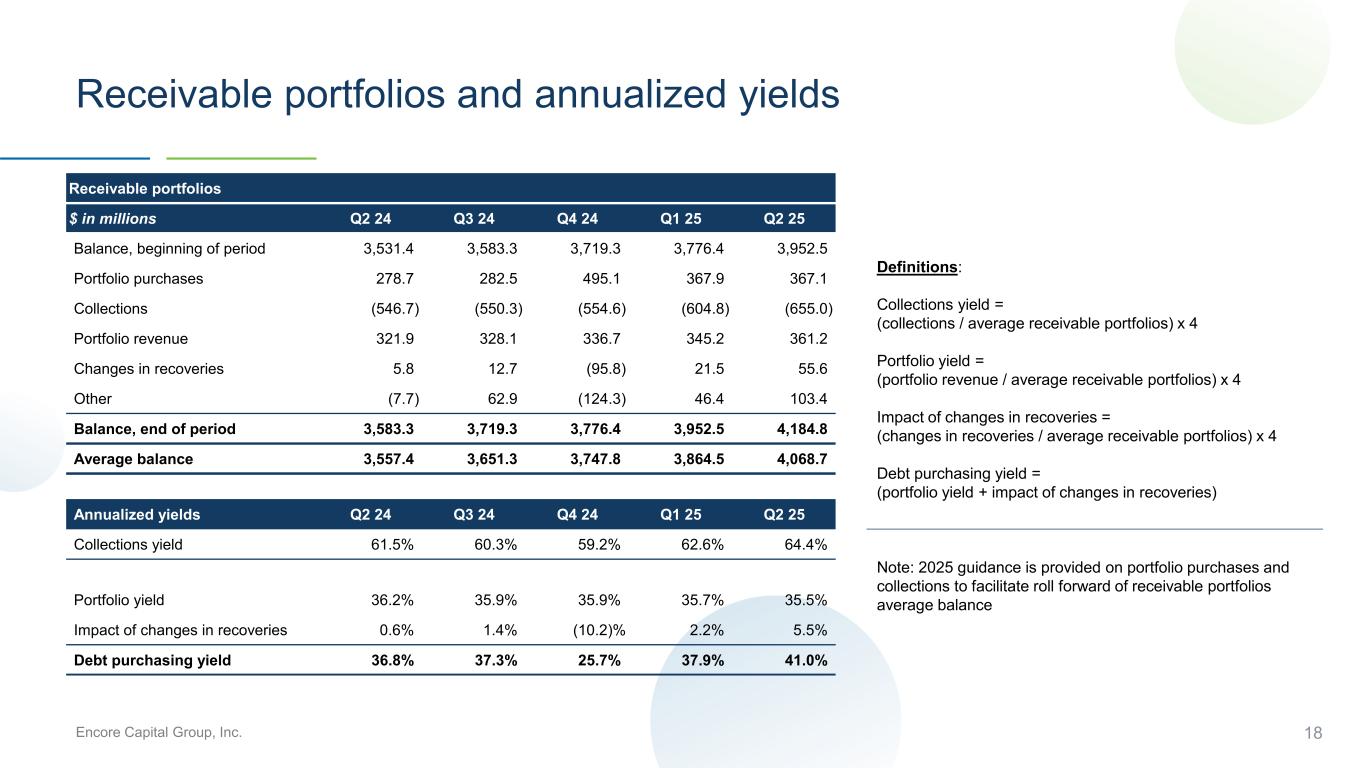
Encore Capital Group, Inc. 18 Receivable portfolios and annualized yields Definitions: Collections yield = (collections / average receivable portfolios) x 4 Portfolio yield = (portfolio revenue / average receivable portfolios) x 4 Impact of changes in recoveries = (changes in recoveries / average receivable portfolios) x 4 Debt purchasing yield = (portfolio yield + impact of changes in recoveries) Note: 2025 guidance is provided on portfolio purchases and collections to facilitate roll forward of receivable portfolios average balance Receivable portfolios $ in millions Q2 24 Q3 24 Q4 24 Q1 25 Q2 25 Balance, beginning of period 3,531.4 3,583.3 3,719.3 3,776.4 3,952.5 Portfolio purchases 278.7 282.5 495.1 367.9 367.1 Collections (546.7) (550.3) (554.6) (604.8) (655.0) Portfolio revenue 321.9 328.1 336.7 345.2 361.2 Changes in recoveries 5.8 12.7 (95.8) 21.5 55.6 Other (7.7) 62.9 (124.3) 46.4 103.4 Balance, end of period 3,583.3 3,719.3 3,776.4 3,952.5 4,184.8 Average balance 3,557.4 3,651.3 3,747.8 3,864.5 4,068.7 Annualized yields Q2 24 Q3 24 Q4 24 Q1 25 Q2 25 Collections yield 61.5% 60.3% 59.2% 62.6% 64.4% Portfolio yield 36.2% 35.9% 35.9% 35.7% 35.5% Impact of changes in recoveries 0.6% 1.4% (10.2)% 2.2% 5.5% Debt purchasing yield 36.8% 37.3% 25.7% 37.9% 41.0%
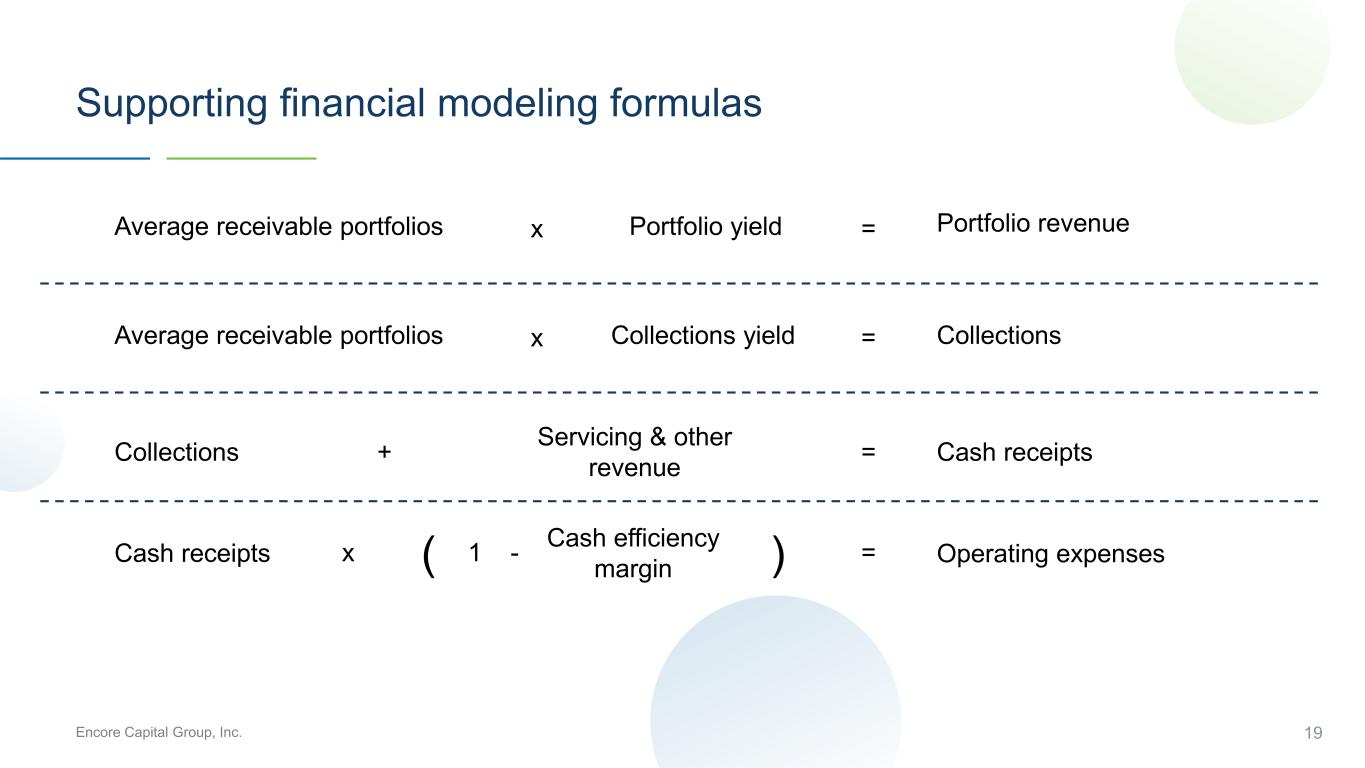
Encore Capital Group, Inc. 19 Supporting financial modeling formulas Average receivable portfolios Portfolio yield Portfolio revenue Collections yield Collections Collections Servicing & other revenue Average receivable portfolios Cash receipts x = x = Cash receipts+ = x ( Cash efficiency margin 1 - ) = Operating expenses
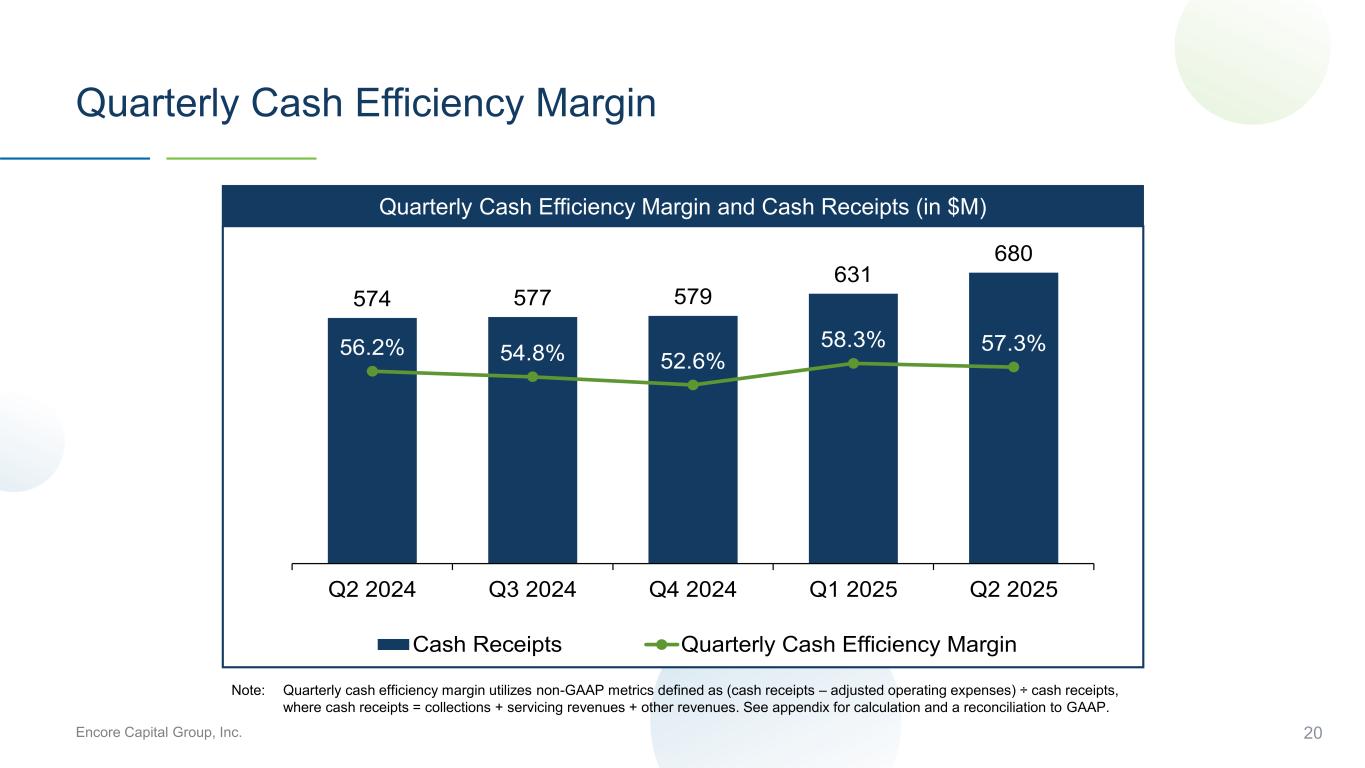
Encore Capital Group, Inc. 574 577 579 631 680 56.2% 54.8% 52.6% 58.3% 57.3% 0.0% 10.0% 20.0% 30.0% 40.0% 50.0% 60.0% 70.0% 80.0% 90.0% -50 50 150 250 350 450 550 650 750 Q2 2024 Q3 2024 Q4 2024 Q1 2025 Q2 2025 Cash Receipts Quarterly Cash Efficiency Margin 20 Quarterly Cash Efficiency Margin Quarterly Cash Efficiency Margin and Cash Receipts (in $M) Note: Quarterly cash efficiency margin utilizes non-GAAP metrics defined as (cash receipts – adjusted operating expenses) ÷ cash receipts, where cash receipts = collections + servicing revenues + other revenues. See appendix for calculation and a reconciliation to GAAP.
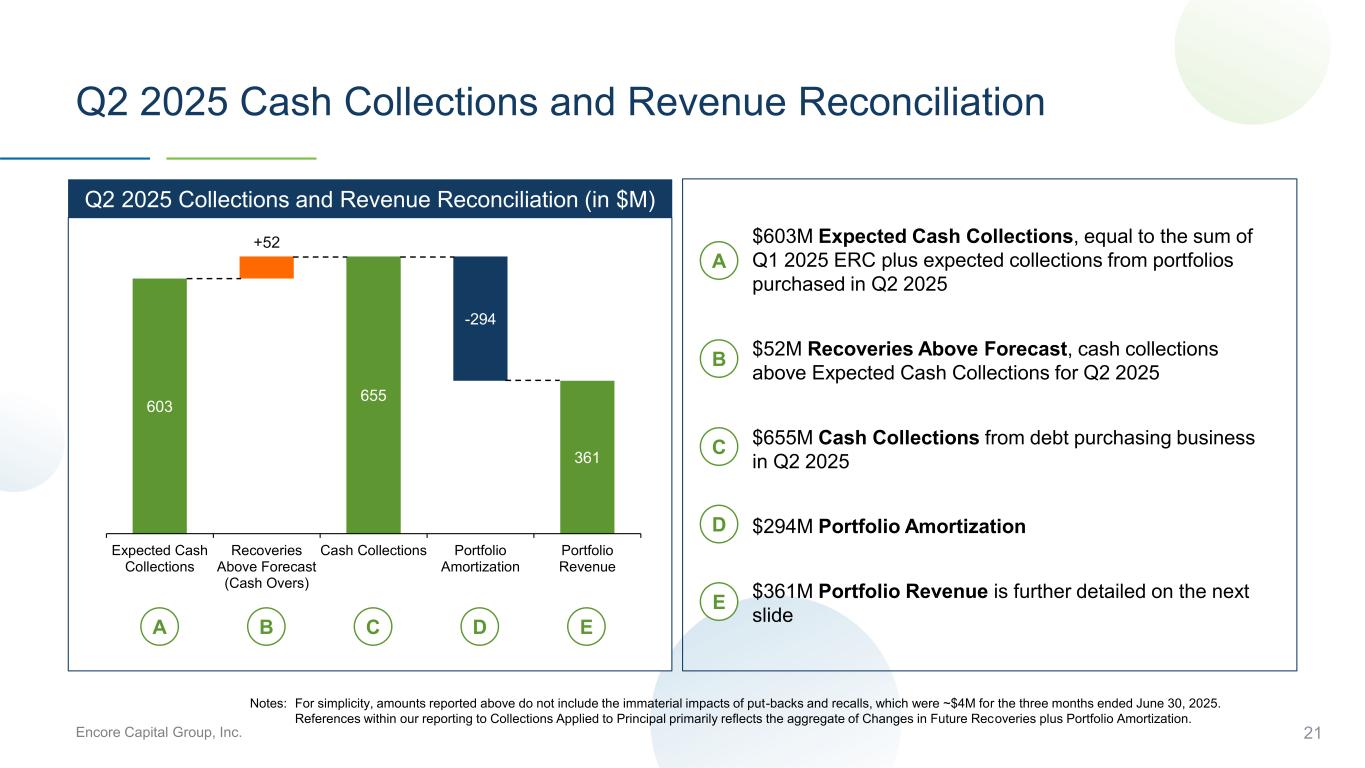
Encore Capital Group, Inc. 21 Q2 2025 Cash Collections and Revenue Reconciliation 603 655 361 +52 -294 0 100 200 300 400 500 600 700 Expected Cash Collections Recoveries Above Forecast (Cash Overs) Cash Collections Portfolio Amortization Portfolio Revenue Q2 2025 Collections and Revenue Reconciliation (in $M) $603M Expected Cash Collections, equal to the sum of Q1 2025 ERC plus expected collections from portfolios purchased in Q2 2025 $52M Recoveries Above Forecast, cash collections above Expected Cash Collections for Q2 2025 $655M Cash Collections from debt purchasing business in Q2 2025 $294M Portfolio Amortization $361M Portfolio Revenue is further detailed on the next slide A A C CB D E B D E Notes: For simplicity, amounts reported above do not include the immaterial impacts of put-backs and recalls, which were ~$4M for the three months ended June 30, 2025. References within our reporting to Collections Applied to Principal primarily reflects the aggregate of Changes in Future Recoveries plus Portfolio Amortization.
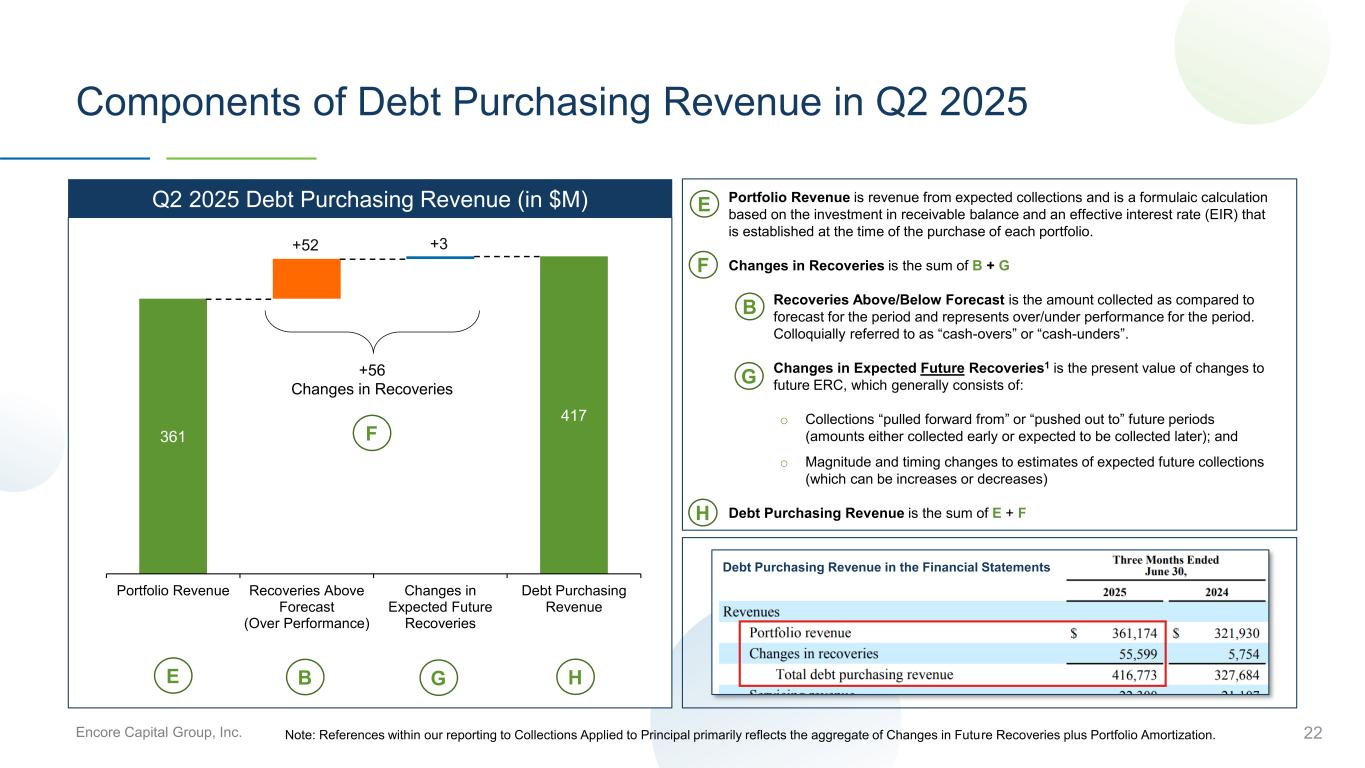
Encore Capital Group, Inc. 22 Components of Debt Purchasing Revenue in Q2 2025 361 417 +52 +3 0 50 100 150 200 250 300 350 400 450 Portfolio Revenue Recoveries Above Forecast (Over Performance) Changes in Expected Future Recoveries Debt Purchasing Revenue Q2 2025 Debt Purchasing Revenue (in $M) 1. Portfolio Revenue is revenue from expected collections and is a formulaic calculation based on the investment in receivable balance and an effective interest rate (EIR) that is established at the time of the purchase of each portfolio. 2. Changes in Recoveries is the sum of B + G 3. Recoveries Above/Below Forecast is the amount collected as compared to forecast for the period and represents over/under performance for the period. Colloquially referred to as “cash-overs” or “cash-unders”. 4. Changes in Expected Future Recoveries1 is the present value of changes to future ERC, which generally consists of: o Collections “pulled forward from” or “pushed out to” future periods (amounts either collected early or expected to be collected later); and o Magnitude and timing changes to estimates of expected future collections (which can be increases or decreases) 5. Debt Purchasing Revenue is the sum of E + F +56 Changes in Recoveries E B G H E B G H Note: References within our reporting to Collections Applied to Principal primarily reflects the aggregate of Changes in Future Recoveries plus Portfolio Amortization. F F To be updated Debt Purchasing Revenue in the Financial Statements
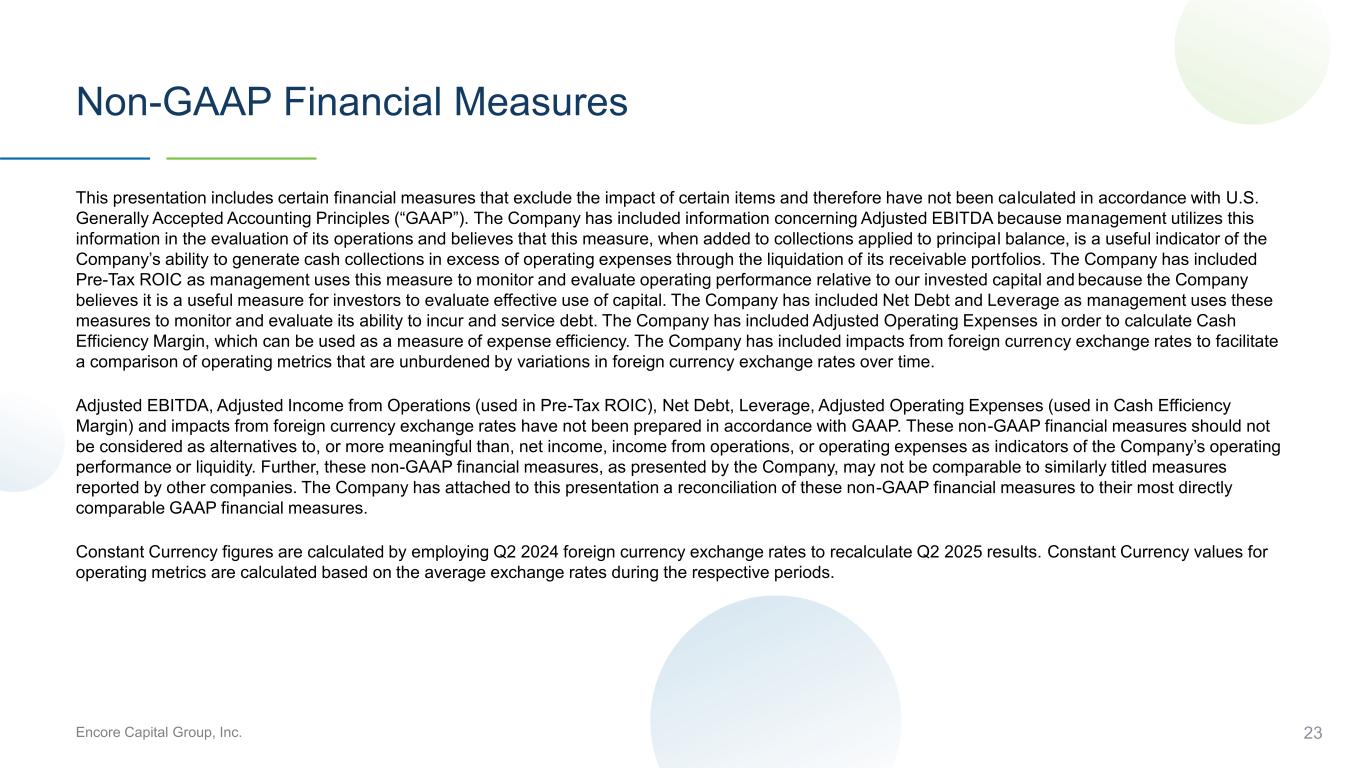
Encore Capital Group, Inc. 23 Non-GAAP Financial Measures This presentation includes certain financial measures that exclude the impact of certain items and therefore have not been calculated in accordance with U.S. Generally Accepted Accounting Principles (“GAAP”). The Company has included information concerning Adjusted EBITDA because management utilizes this information in the evaluation of its operations and believes that this measure, when added to collections applied to principal balance, is a useful indicator of the Company’s ability to generate cash collections in excess of operating expenses through the liquidation of its receivable portfolios. The Company has included Pre-Tax ROIC as management uses this measure to monitor and evaluate operating performance relative to our invested capital and because the Company believes it is a useful measure for investors to evaluate effective use of capital. The Company has included Net Debt and Leverage as management uses these measures to monitor and evaluate its ability to incur and service debt. The Company has included Adjusted Operating Expenses in order to calculate Cash Efficiency Margin, which can be used as a measure of expense efficiency. The Company has included impacts from foreign currency exchange rates to facilitate a comparison of operating metrics that are unburdened by variations in foreign currency exchange rates over time. Adjusted EBITDA, Adjusted Income from Operations (used in Pre-Tax ROIC), Net Debt, Leverage, Adjusted Operating Expenses (used in Cash Efficiency Margin) and impacts from foreign currency exchange rates have not been prepared in accordance with GAAP. These non-GAAP financial measures should not be considered as alternatives to, or more meaningful than, net income, income from operations, or operating expenses as indicators of the Company’s operating performance or liquidity. Further, these non-GAAP financial measures, as presented by the Company, may not be comparable to similarly titled measures reported by other companies. The Company has attached to this presentation a reconciliation of these non-GAAP financial measures to their most directly comparable GAAP financial measures. Constant Currency figures are calculated by employing Q2 2024 foreign currency exchange rates to recalculate Q2 2025 results. Constant Currency values for operating metrics are calculated based on the average exchange rates during the respective periods.
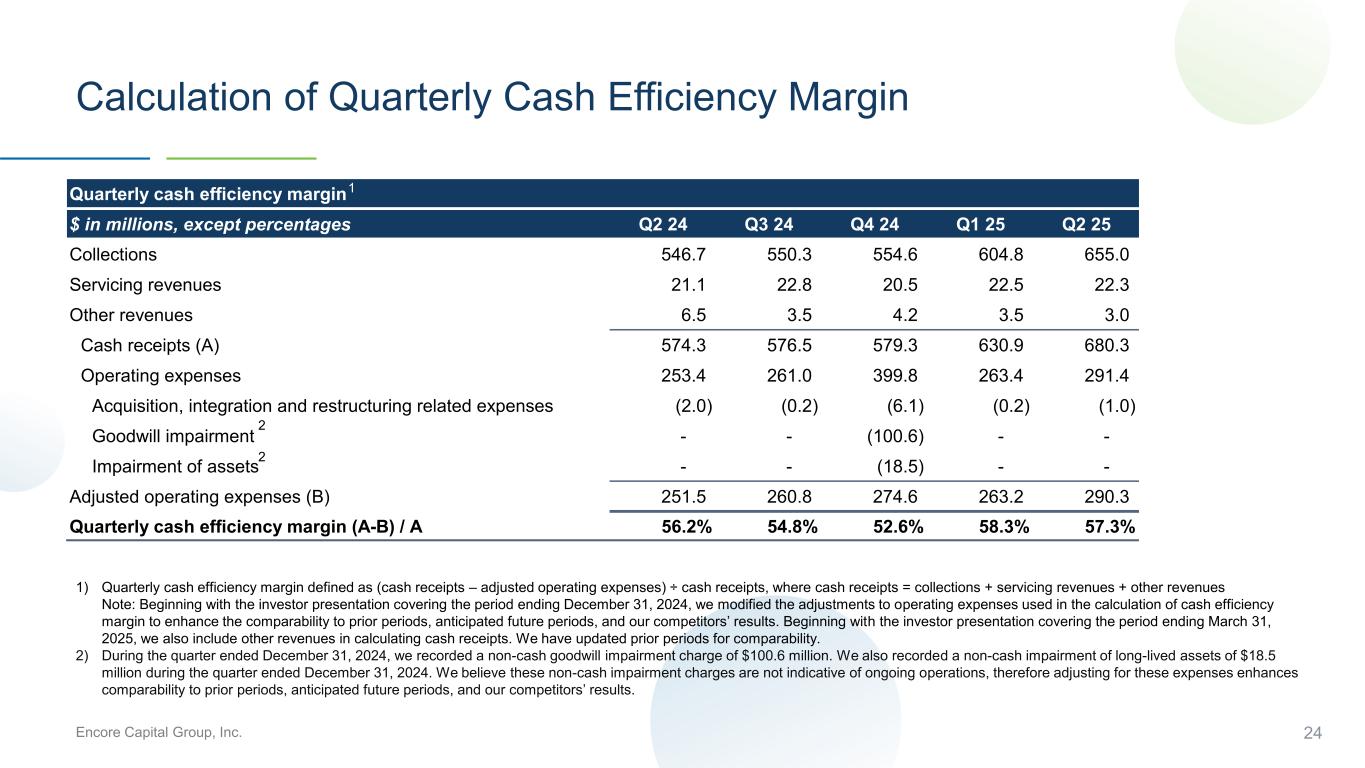
Encore Capital Group, Inc. Quarterly cash efficiency margin $ in millions, except percentages Q2 24 Q3 24 Q4 24 Q1 25 Q2 25 Collections 546.7 550.3 554.6 604.8 655.0 Servicing revenues 21.1 22.8 20.5 22.5 22.3 Other revenues 6.5 3.5 4.2 3.5 3.0 Cash receipts (A) 574.3 576.5 579.3 630.9 680.3 Operating expenses 253.4 261.0 399.8 263.4 291.4 Acquisition, integration and restructuring related expenses (2.0) (0.2) (6.1) (0.2) (1.0) Goodwill impairment - - (100.6) - - Impairment of assets - - (18.5) - - Adjusted operating expenses (B) 251.5 260.8 274.6 263.2 290.3 Quarterly cash efficiency margin (A-B) / A 56.2% 54.8% 52.6% 58.3% 57.3% 24 Calculation of Quarterly Cash Efficiency Margin 1) Quarterly cash efficiency margin defined as (cash receipts – adjusted operating expenses) ÷ cash receipts, where cash receipts = collections + servicing revenues + other revenues Note: Beginning with the investor presentation covering the period ending December 31, 2024, we modified the adjustments to operating expenses used in the calculation of cash efficiency margin to enhance the comparability to prior periods, anticipated future periods, and our competitors’ results. Beginning with the investor presentation covering the period ending March 31, 2025, we also include other revenues in calculating cash receipts. We have updated prior periods for comparability. 2) During the quarter ended December 31, 2024, we recorded a non-cash goodwill impairment charge of $100.6 million. We also recorded a non-cash impairment of long-lived assets of $18.5 million during the quarter ended December 31, 2024. We believe these non-cash impairment charges are not indicative of ongoing operations, therefore adjusting for these expenses enhances comparability to prior periods, anticipated future periods, and our competitors’ results. 1 2 2
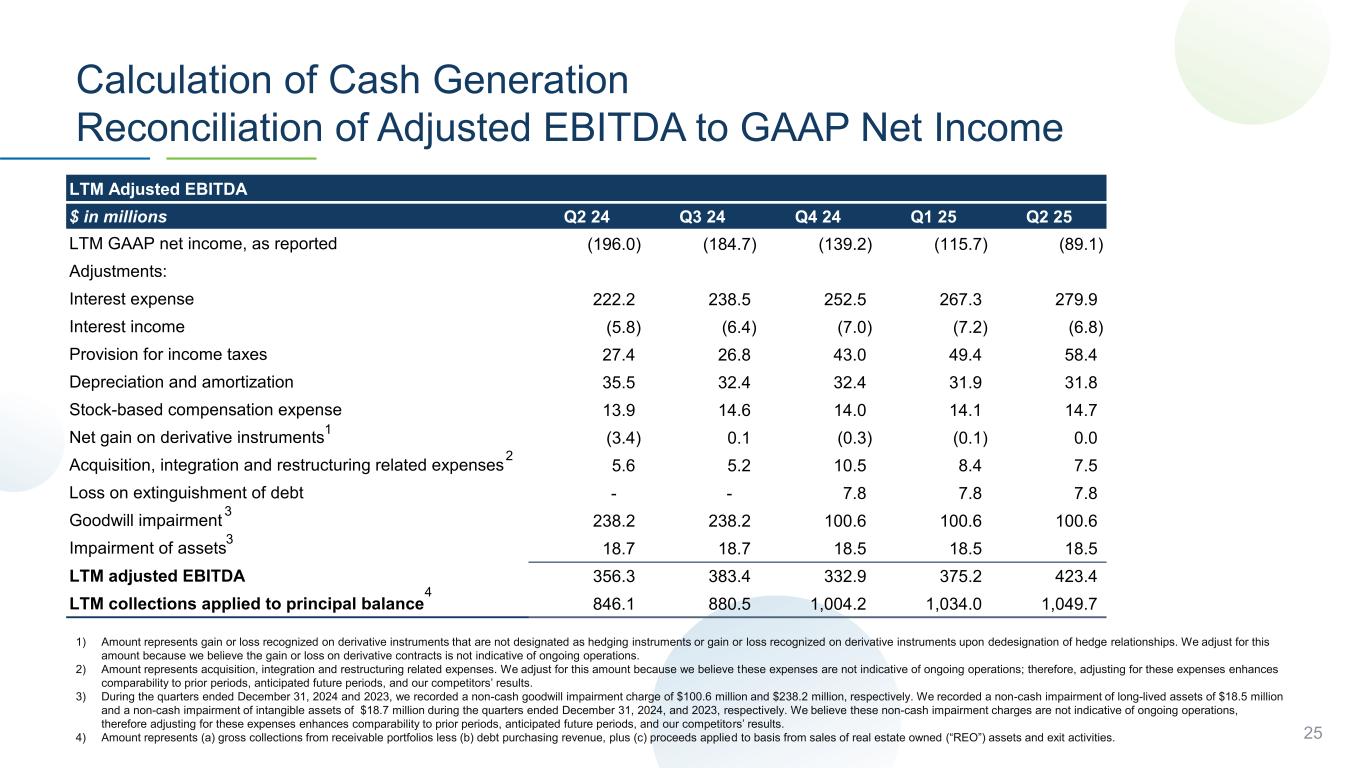
Encore Capital Group, Inc. LTM Adjusted EBITDA $ in millions Q2 24 Q3 24 Q4 24 Q1 25 Q2 25 (196.0) (184.7) (139.2) (115.7) (89.1) 222.2 238.5 252.5 267.3 279.9 (5.8) (6.4) (7.0) (7.2) (6.8) 27.4 26.8 43.0 49.4 58.4 35.5 32.4 32.4 31.9 31.8 13.9 14.6 14.0 14.1 14.7 (3.4) 0.1 (0.3) (0.1) 0.0 5.6 5.2 10.5 8.4 7.5 - - 7.8 7.8 7.8 238.2 238.2 100.6 100.6 100.6 18.7 18.7 18.5 18.5 18.5 356.3 383.4 332.9 375.2 423.4 846.1 880.5 1,004.2 1,034.0 1,049.7 LTM adjusted EBITDA LTM collections applied to principal balance Depreciation and amortization Stock-based compensation expense Net gain on derivative instruments Acquisition, integration and restructuring related expenses Loss on extinguishment of debt Goodwill impairment Impairment of assets LTM GAAP net income, as reported Adjustments: Interest expense Interest income Provision for income taxes Calculation of Cash Generation Reconciliation of Adjusted EBITDA to GAAP Net Income 25 1) Amount represents gain or loss recognized on derivative instruments that are not designated as hedging instruments or gain or loss recognized on derivative instruments upon dedesignation of hedge relationships. We adjust for this amount because we believe the gain or loss on derivative contracts is not indicative of ongoing operations. 2) Amount represents acquisition, integration and restructuring related expenses. We adjust for this amount because we believe these expenses are not indicative of ongoing operations; therefore, adjusting for these expenses enhances comparability to prior periods, anticipated future periods, and our competitors’ results. 3) During the quarters ended December 31, 2024 and 2023, we recorded a non-cash goodwill impairment charge of $100.6 million and $238.2 million, respectively. We recorded a non-cash impairment of long-lived assets of $18.5 million and a non-cash impairment of intangible assets of $18.7 million during the quarters ended December 31, 2024, and 2023, respectively. We believe these non-cash impairment charges are not indicative of ongoing operations, therefore adjusting for these expenses enhances comparability to prior periods, anticipated future periods, and our competitors’ results. 4) Amount represents (a) gross collections from receivable portfolios less (b) debt purchasing revenue, plus (c) proceeds applied to basis from sales of real estate owned (“REO”) assets and exit activities. 1 2 3 4 3
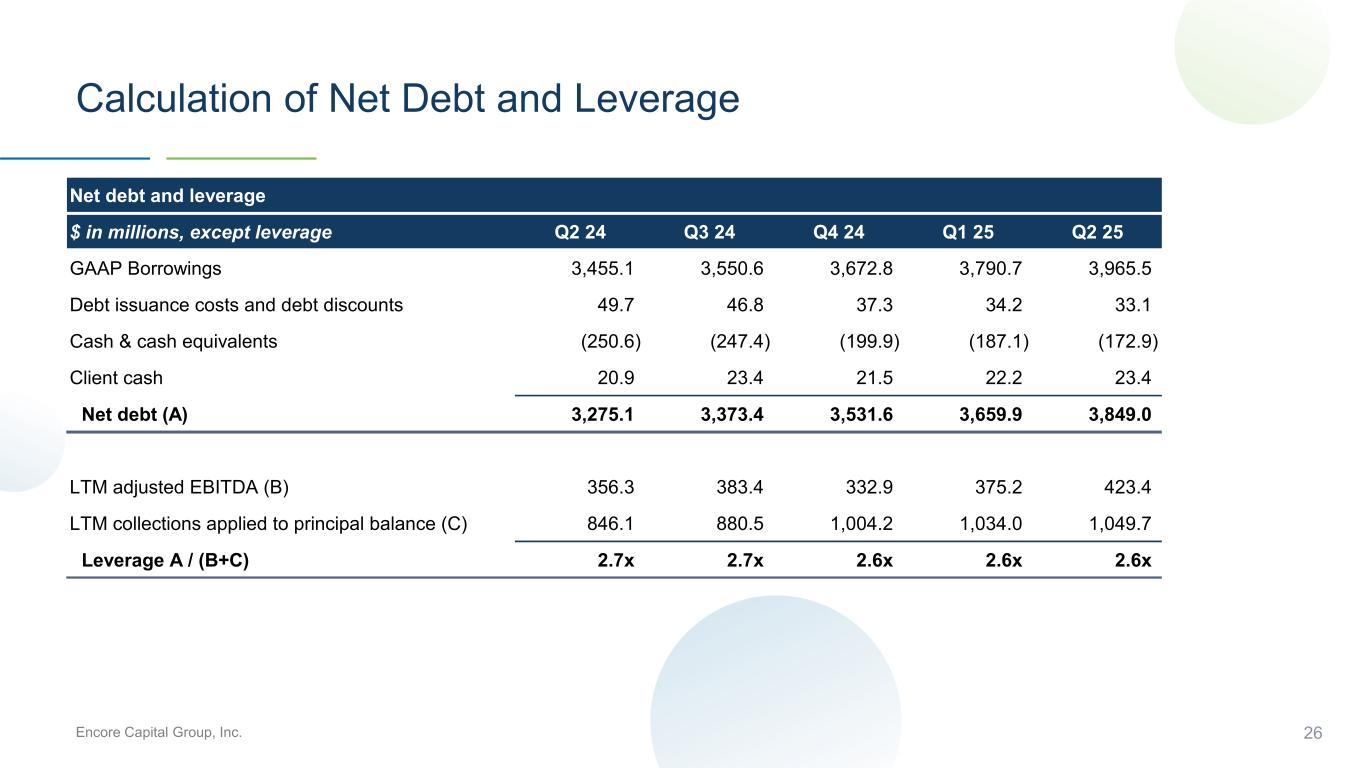
Encore Capital Group, Inc. 26 Calculation of Net Debt and Leverage Net debt and leverage $ in millions, except leverage Q2 24 Q3 24 Q4 24 Q1 25 Q2 25 GAAP Borrowings 3,455.1 3,550.6 3,672.8 3,790.7 3,965.5 Debt issuance costs and debt discounts 49.7 46.8 37.3 34.2 33.1 Cash & cash equivalents (250.6) (247.4) (199.9) (187.1) (172.9) Client cash 20.9 23.4 21.5 22.2 23.4 Net debt (A) 3,275.1 3,373.4 3,531.6 3,659.9 3,849.0 LTM adjusted EBITDA (B) 356.3 383.4 332.9 375.2 423.4 LTM collections applied to principal balance (C) 846.1 880.5 1,004.2 1,034.0 1,049.7 Leverage A / (B+C) 2.7x 2.7x 2.6x 2.6x 2.6x
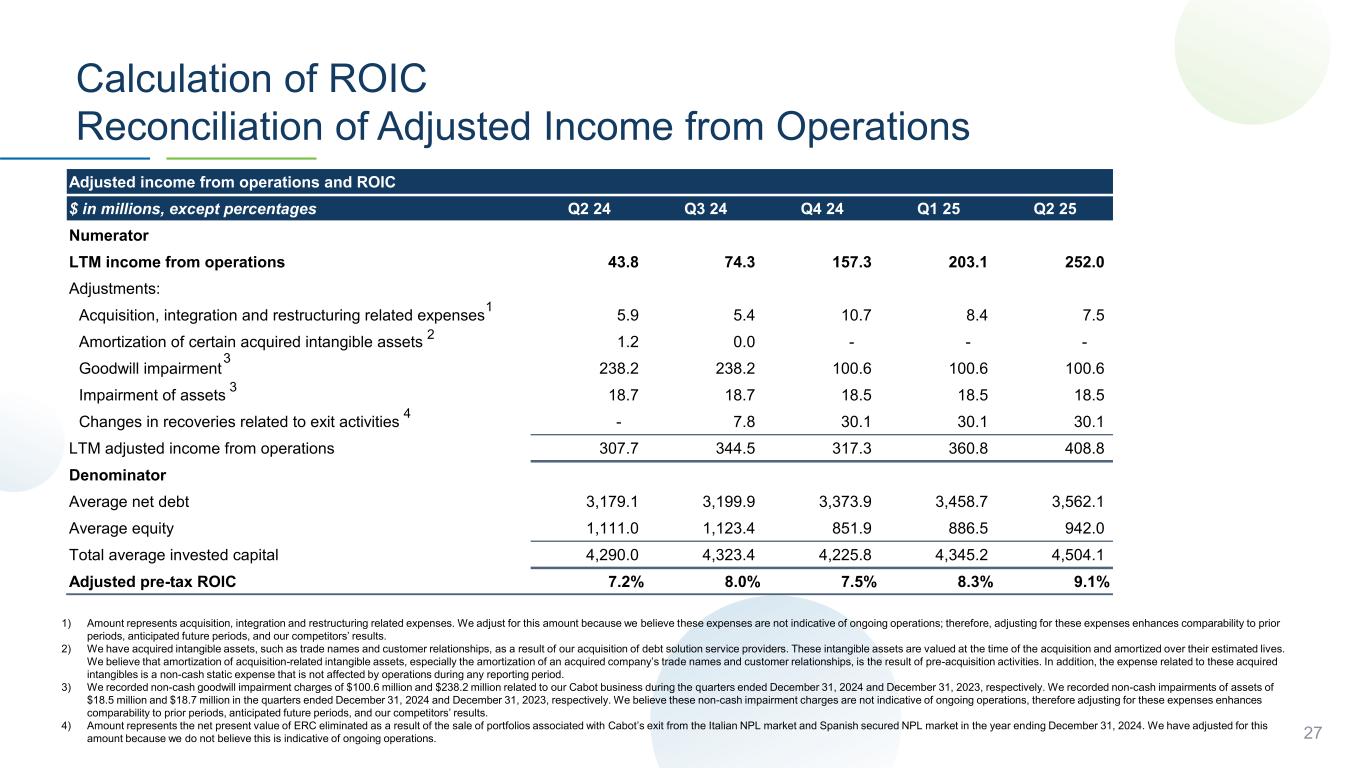
Encore Capital Group, Inc. Adjusted income from operations and ROIC $ in millions, except percentages Q2 24 Q3 24 Q4 24 Q1 25 Q2 25 Numerator LTM income from operations 43.8 74.3 157.3 203.1 252.0 Adjustments: Acquisition, integration and restructuring related expenses 5.9 5.4 10.7 8.4 7.5 Amortization of certain acquired intangible assets 1.2 0.0 - - - Goodwill impairment 238.2 238.2 100.6 100.6 100.6 Impairment of assets 18.7 18.7 18.5 18.5 18.5 Changes in recoveries related to exit activities - 7.8 30.1 30.1 30.1 LTM adjusted income from operations 307.7 344.5 317.3 360.8 408.8 Denominator Average net debt 3,179.1 3,199.9 3,373.9 3,458.7 3,562.1 Average equity 1,111.0 1,123.4 851.9 886.5 942.0 Total average invested capital 4,290.0 4,323.4 4,225.8 4,345.2 4,504.1 Adjusted pre-tax ROIC 7.2% 8.0% 7.5% 8.3% 9.1% 27 Calculation of ROIC Reconciliation of Adjusted Income from Operations 1) Amount represents acquisition, integration and restructuring related expenses. We adjust for this amount because we believe these expenses are not indicative of ongoing operations; therefore, adjusting for these expenses enhances comparability to prior periods, anticipated future periods, and our competitors’ results. 2) We have acquired intangible assets, such as trade names and customer relationships, as a result of our acquisition of debt solution service providers. These intangible assets are valued at the time of the acquisition and amortized over their estimated lives. We believe that amortization of acquisition-related intangible assets, especially the amortization of an acquired company’s trade names and customer relationships, is the result of pre-acquisition activities. In addition, the expense related to these acquired intangibles is a non-cash static expense that is not affected by operations during any reporting period. 3) We recorded non-cash goodwill impairment charges of $100.6 million and $238.2 million related to our Cabot business during the quarters ended December 31, 2024 and December 31, 2023, respectively. We recorded non-cash impairments of assets of $18.5 million and $18.7 million in the quarters ended December 31, 2024 and December 31, 2023, respectively. We believe these non-cash impairment charges are not indicative of ongoing operations, therefore adjusting for these expenses enhances comparability to prior periods, anticipated future periods, and our competitors’ results. 4) Amount represents the net present value of ERC eliminated as a result of the sale of portfolios associated with Cabot’s exit from the Italian NPL market and Spanish secured NPL market in the year ending December 31, 2024. We have adjusted for this amount because we do not believe this is indicative of ongoing operations. 1 2 3 3 4