
1 Collaborative Approach to Life Science Financing Shareholder Presentation 2Q25 | August 2025
2 Forward-looking and Cautionary Statements Statements in this presentation that are not strictly historical, and any statements regarding events or developments that we believe or anticipate will or may occur in the future are "forward- looking" statements within the meaning of the federal securities laws. There are a number of important factors that could cause actual results, developments and business decisions to differ materially from those suggested or indicated by such forward-looking statements and you should not place undue reliance on any such forward-looking statements. Additional information regarding the factors that may cause actual results to differ materially from these forward-looking statements is available in our SEC filings, including our Annual Report on Form 10-K for the most recent fiscal year and our Quarterly Reports on Form 10-Q for subsequent periods. The Company does not assume any obligation to update or revise any forward-looking statement, whether as a result of new information, future events and developments or otherwise. Our specialty finance and asset management businesses are conducted through separate subsidiaries and the Company conducts its operations in a manner that is excluded from the definition of an investment company and exempt from registration and regulation under the Investment Company Act of 1940. This presentation is neither an offer to sell nor a solicitation of any offer to buy any securities, investment product or investment advisory services, including such services offered by SWK Advisors LLC. This presentation does not contain all of the information necessary to make an investment decision, including, but not limited to, the risks, fees and investment strategies of investing in life science investments. Any offering is made only pursuant to the relevant information memorandum, a relevant subscription agreement or investment management agreement, and SWK Advisors LLC’s Form ADV, all of which must be read in their entirety. All investors must be “accredited investors” and/or “qualified purchasers” as defined in the securities laws before they can invest with SWK Advisors LLC. Life science securities may rely on milestone payments and/or a royalty stream from an underlying drug, device, or product which may or may not have received approval of the Food and Drug Administration (“FDA”). If the underlying drug, device, or product does not receive FDA approval, it could negatively impact the securities, including the payments of principal and/or interest. In addition, the introduction of new drugs, devices, or products onto the market could negatively impact the securities, since that may decrease sales and/or prices of the underlying drug, device, or product. Changes to Medicare reimbursement or third-party payor pricing could negatively impact the securities, since they could negatively impact the prices and/or sales of the underlying drug, device, or product. There is also risk that the licensing agreement that governs the payment of royalties may terminate, which could negatively impact the securities. There is also the risk that litigation involving the underlying drug, device, or product could negatively impact the securities, including payments of principal and/or interest on any securities.
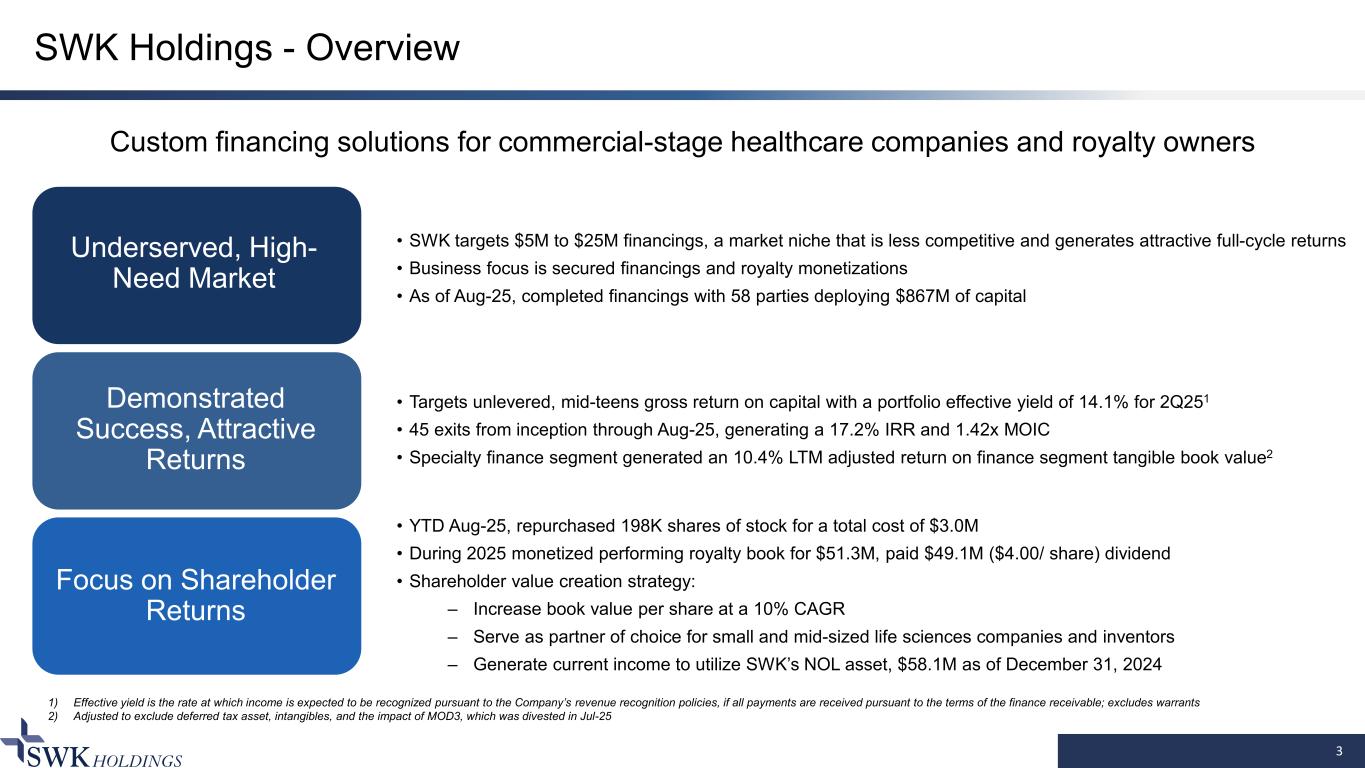
SWK Holdings - Overview 3 Underserved, High- Need Market Demonstrated Success, Attractive Returns Focus on Shareholder Returns Custom financing solutions for commercial-stage healthcare companies and royalty owners • SWK targets $5M to $25M financings, a market niche that is less competitive and generates attractive full-cycle returns • Business focus is secured financings and royalty monetizations • As of Aug-25, completed financings with 58 parties deploying $867M of capital • Targets unlevered, mid-teens gross return on capital with a portfolio effective yield of 14.1% for 2Q251 • 45 exits from inception through Aug-25, generating a 17.2% IRR and 1.42x MOIC • Specialty finance segment generated an 10.4% LTM adjusted return on finance segment tangible book value2 • YTD Aug-25, repurchased 198K shares of stock for a total cost of $3.0M • During 2025 monetized performing royalty book for $51.3M, paid $49.1M ($4.00/ share) dividend • Shareholder value creation strategy: – Increase book value per share at a 10% CAGR – Serve as partner of choice for small and mid-sized life sciences companies and inventors – Generate current income to utilize SWK’s NOL asset, $58.1M as of December 31, 2024 1) Effective yield is the rate at which income is expected to be recognized pursuant to the Company’s revenue recognition policies, if all payments are received pursuant to the terms of the finance receivable; excludes warrants 2) Adjusted to exclude deferred tax asset, intangibles, and the impact of MOD3, which was divested in Jul-25
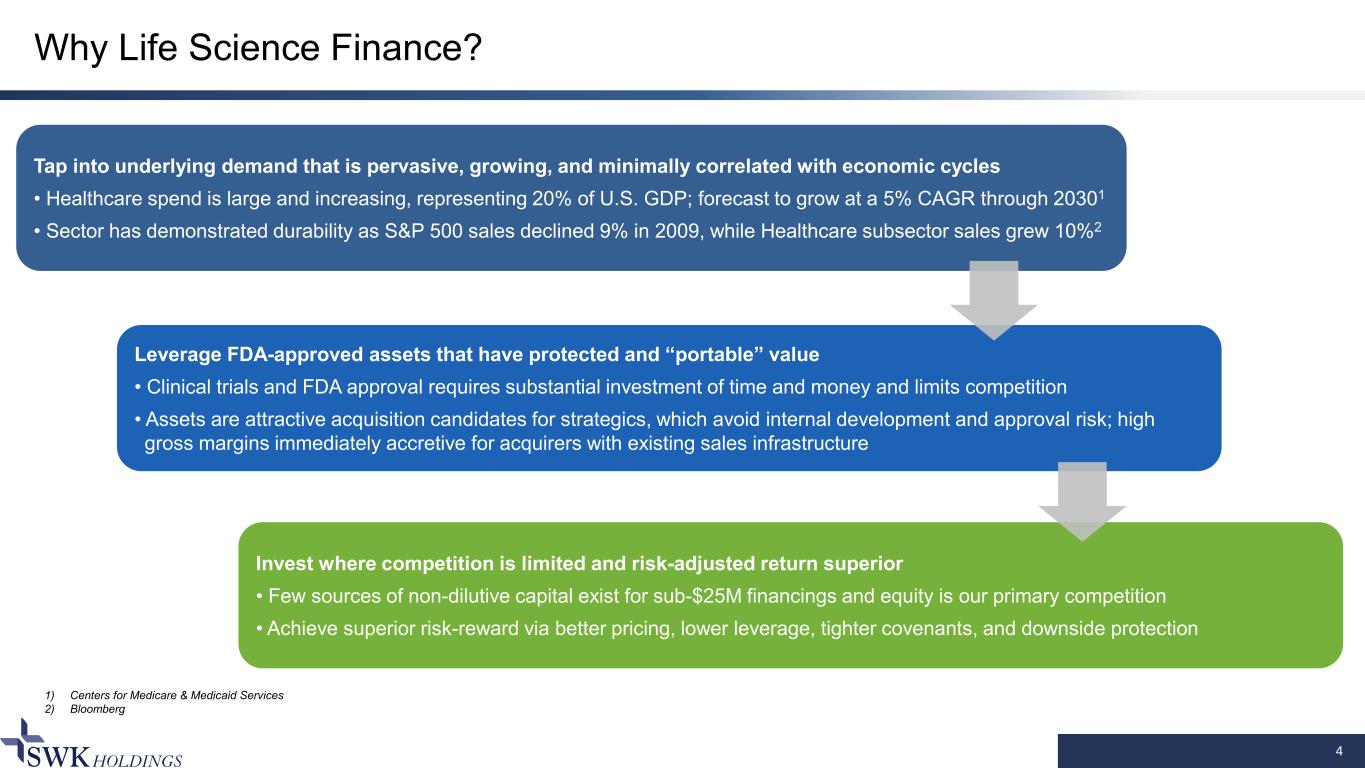
4 Why Life Science Finance? Tap into underlying demand that is pervasive, growing, and minimally correlated with economic cycles • Healthcare spend is large and increasing, representing 20% of U.S. GDP; forecast to grow at a 5% CAGR through 20301 • Sector has demonstrated durability as S&P 500 sales declined 9% in 2009, while Healthcare subsector sales grew 10%2 Leverage FDA-approved assets that have protected and “portable” value • Clinical trials and FDA approval requires substantial investment of time and money and limits competition • Assets are attractive acquisition candidates for strategics, which avoid internal development and approval risk; high gross margins immediately accretive for acquirers with existing sales infrastructure Invest where competition is limited and risk-adjusted return superior • Few sources of non-dilutive capital exist for sub-$25M financings and equity is our primary competition • Achieve superior risk-reward via better pricing, lower leverage, tighter covenants, and downside protection 1) Centers for Medicare & Medicaid Services 2) Bloomberg
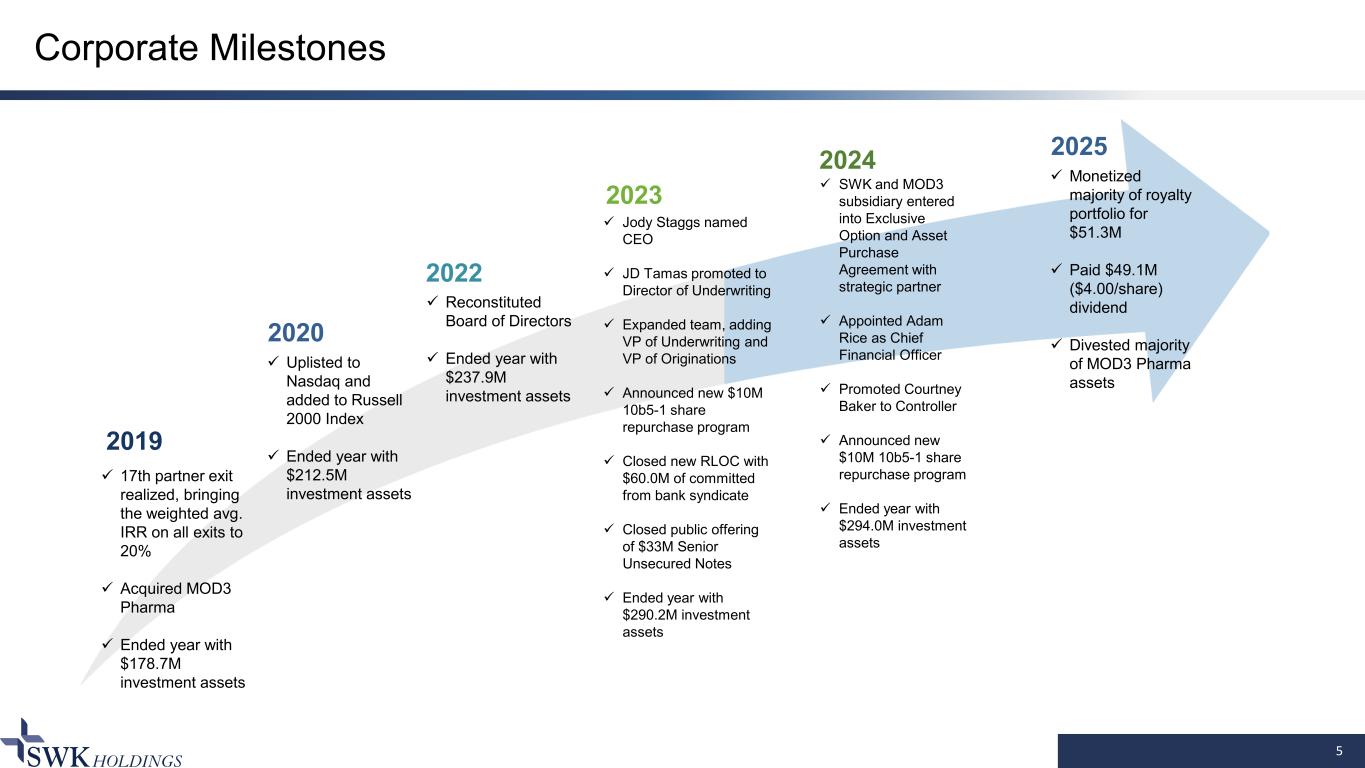
5 Corporate Milestones 2019 17th partner exit realized, bringing the weighted avg. IRR on all exits to 20% Acquired MOD3 Pharma Ended year with $178.7M investment assets 2020 Uplisted to Nasdaq and added to Russell 2000 Index Ended year with $212.5M investment assets 2022 Reconstituted Board of Directors Ended year with $237.9M investment assets 2023 Jody Staggs named CEO JD Tamas promoted to Director of Underwriting Expanded team, adding VP of Underwriting and VP of Originations Announced new $10M 10b5-1 share repurchase program Closed new RLOC with $60.0M of committed from bank syndicate Closed public offering of $33M Senior Unsecured Notes Ended year with $290.2M investment assets 2024 SWK and MOD3 subsidiary entered into Exclusive Option and Asset Purchase Agreement with strategic partner Appointed Adam Rice as Chief Financial Officer Promoted Courtney Baker to Controller Announced new $10M 10b5-1 share repurchase program Ended year with $294.0M investment assets 2025 Monetized majority of royalty portfolio for $51.3M Paid $49.1M ($4.00/share) dividend Divested majority of MOD3 Pharma assets
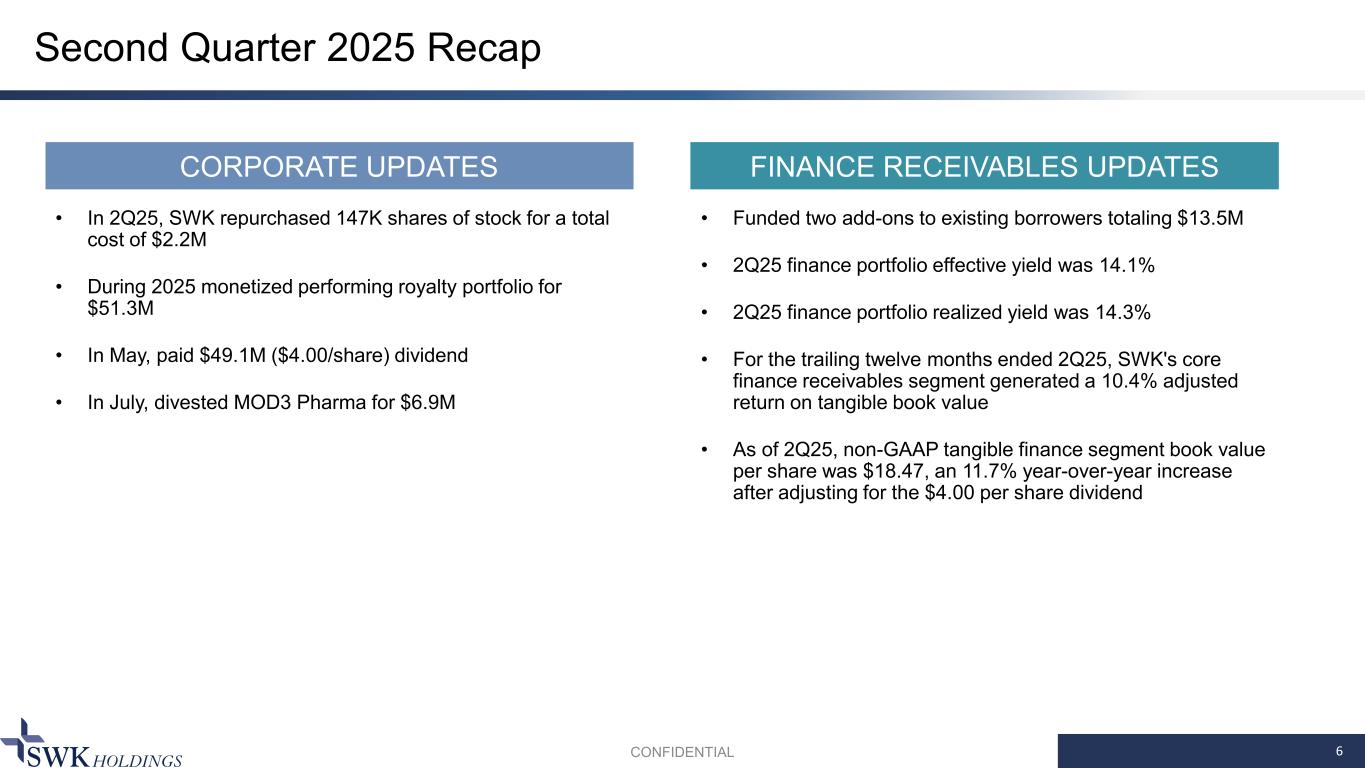
Second Quarter 2025 Recap 6CONFIDENTIAL CORPORATE UPDATES FINANCE RECEIVABLES UPDATES • In 2Q25, SWK repurchased 147K shares of stock for a total cost of $2.2M • During 2025 monetized performing royalty portfolio for $51.3M • In May, paid $49.1M ($4.00/share) dividend • In July, divested MOD3 Pharma for $6.9M • Funded two add-ons to existing borrowers totaling $13.5M • 2Q25 finance portfolio effective yield was 14.1% • 2Q25 finance portfolio realized yield was 14.3% • For the trailing twelve months ended 2Q25, SWK's core finance receivables segment generated a 10.4% adjusted return on tangible book value • As of 2Q25, non-GAAP tangible finance segment book value per share was $18.47, an 11.7% year-over-year increase after adjusting for the $4.00 per share dividend
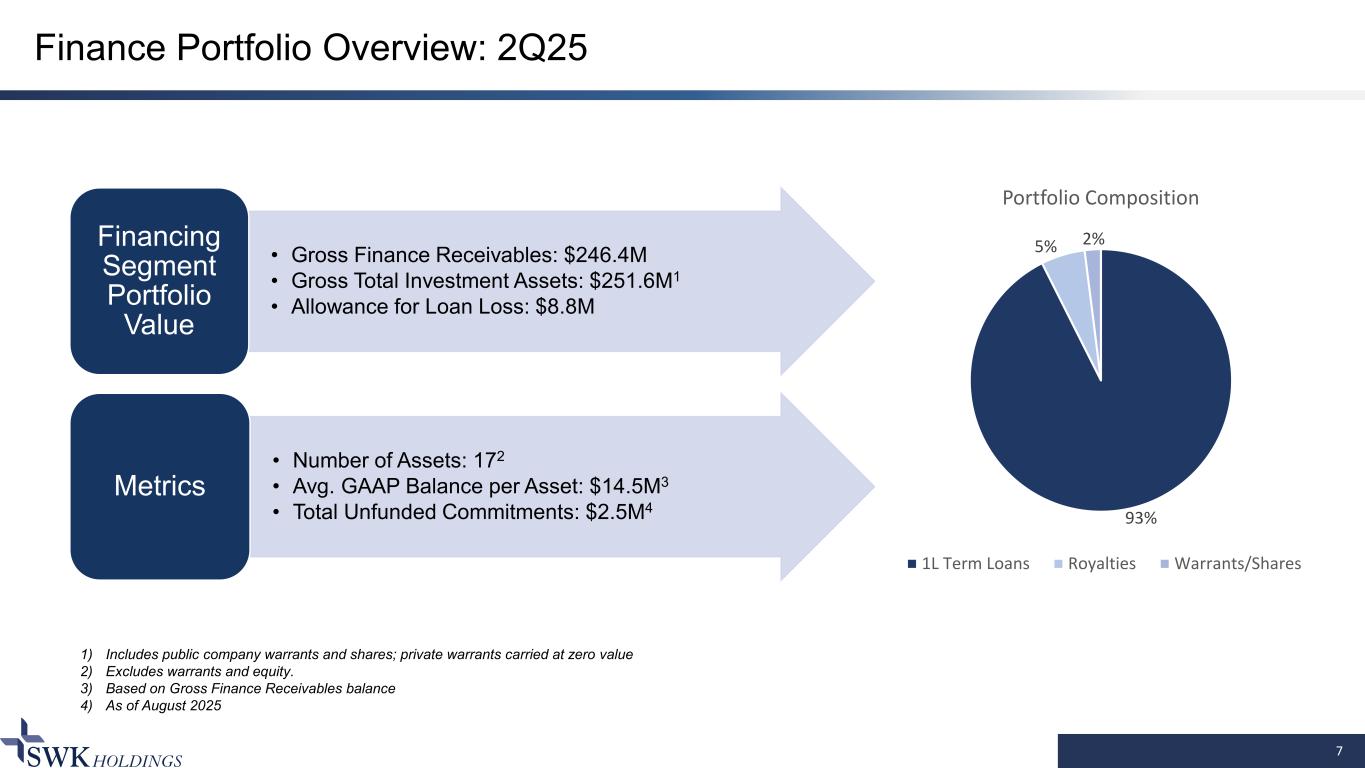
7 Finance Portfolio Overview: 2Q25 1) Includes public company warrants and shares; private warrants carried at zero value 2) Excludes warrants and equity. 3) Based on Gross Finance Receivables balance 4) As of August 2025 • Gross Finance Receivables: $246.4M • Gross Total Investment Assets: $251.6M1 • Allowance for Loan Loss: $8.8M Financing Segment Portfolio Value • Number of Assets: 172 • Avg. GAAP Balance per Asset: $14.5M3 • Total Unfunded Commitments: $2.5M4 Metrics 93% 5% 2% Portfolio Composition 1L Term Loans Royalties Warrants/Shares
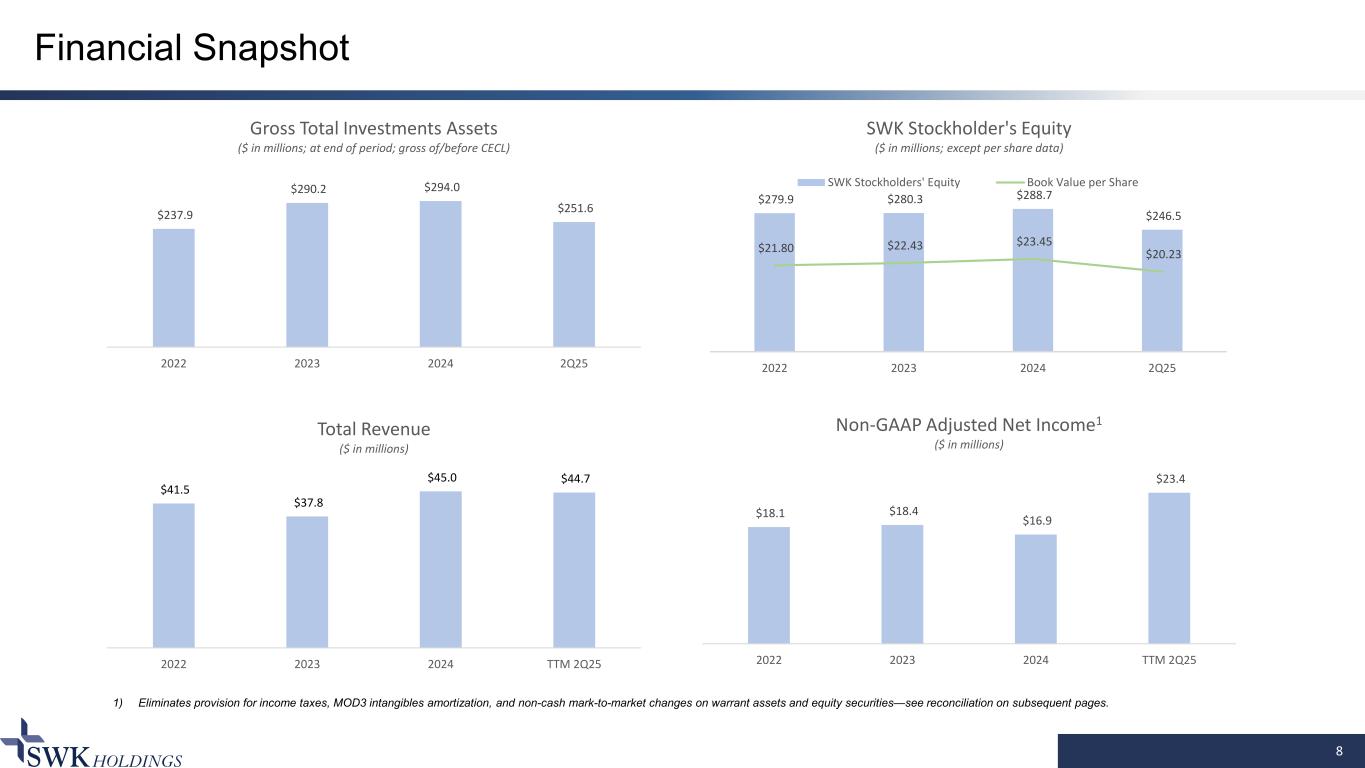
8 Financial Snapshot 1) Eliminates provision for income taxes, MOD3 intangibles amortization, and non-cash mark-to-market changes on warrant assets and equity securities—see reconciliation on subsequent pages. $279.9 $280.3 $288.7 $246.5 $21.80 $22.43 $23.45 $20.23 2022 2023 2024 2Q25 SWK Stockholder's Equity ($ in millions; except per share data) SWK Stockholders' Equity Book Value per Share $237.9 $290.2 $294.0 $251.6 2022 2023 2024 2Q25 Gross Total Investments Assets ($ in millions; at end of period; gross of/before CECL) $41.5 $37.8 $45.0 $44.7 2022 2023 2024 TTM 2Q25 Total Revenue ($ in millions) $18.1 $18.4 $16.9 $23.4 2022 2023 2024 TTM 2Q25 Non-GAAP Adjusted Net Income1 ($ in millions)
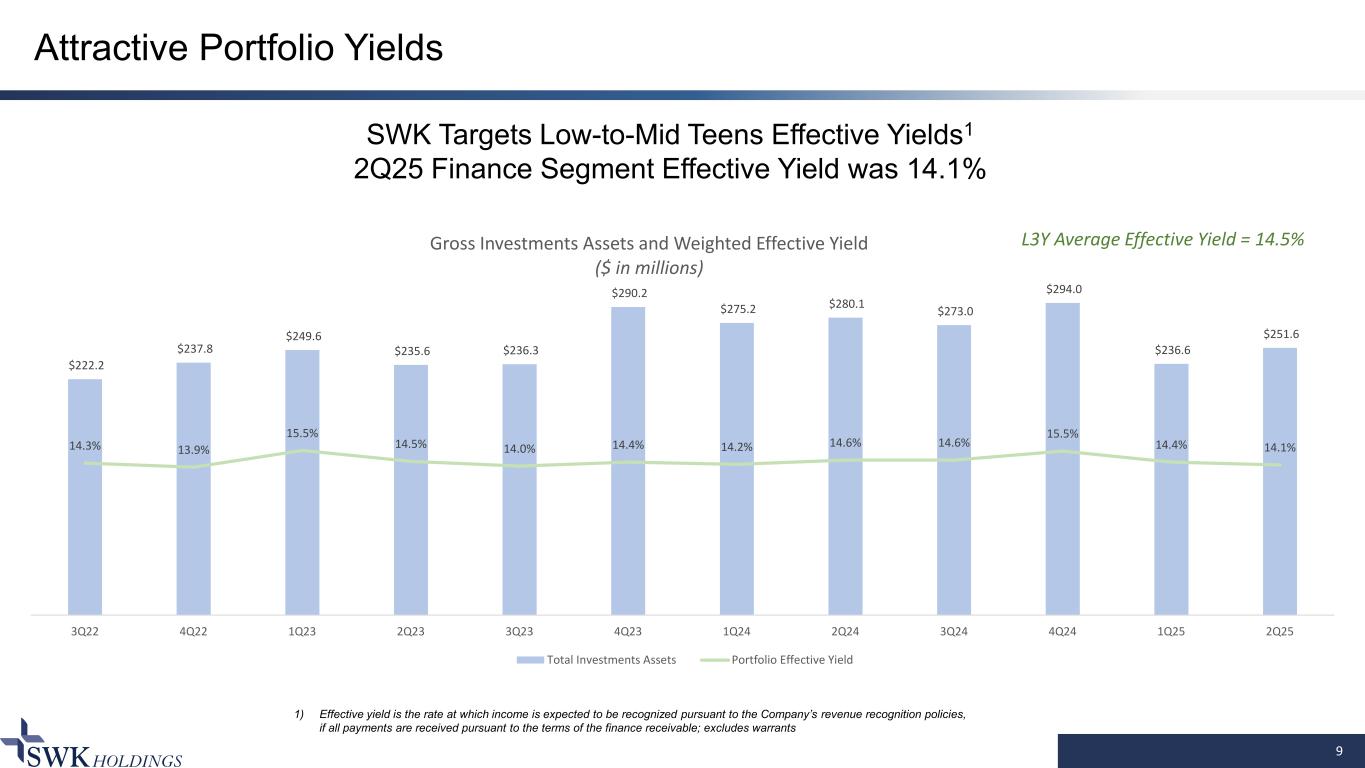
9 Attractive Portfolio Yields SWK Targets Low-to-Mid Teens Effective Yields1 2Q25 Finance Segment Effective Yield was 14.1% 1) Effective yield is the rate at which income is expected to be recognized pursuant to the Company’s revenue recognition policies, if all payments are received pursuant to the terms of the finance receivable; excludes warrants $222.2 $237.8 $249.6 $235.6 $236.3 $290.2 $275.2 $280.1 $273.0 $294.0 $236.6 $251.6 14.3% 13.9% 15.5% 14.5% 14.0% 14.4% 14.2% 14.6% 14.6% 15.5% 14.4% 14.1% 3Q22 4Q22 1Q23 2Q23 3Q23 4Q23 1Q24 2Q24 3Q24 4Q24 1Q25 2Q25 Gross Investments Assets and Weighted Effective Yield ($ in millions) Total Investments Assets Portfolio Effective Yield L3Y Average Effective Yield = 14.5%
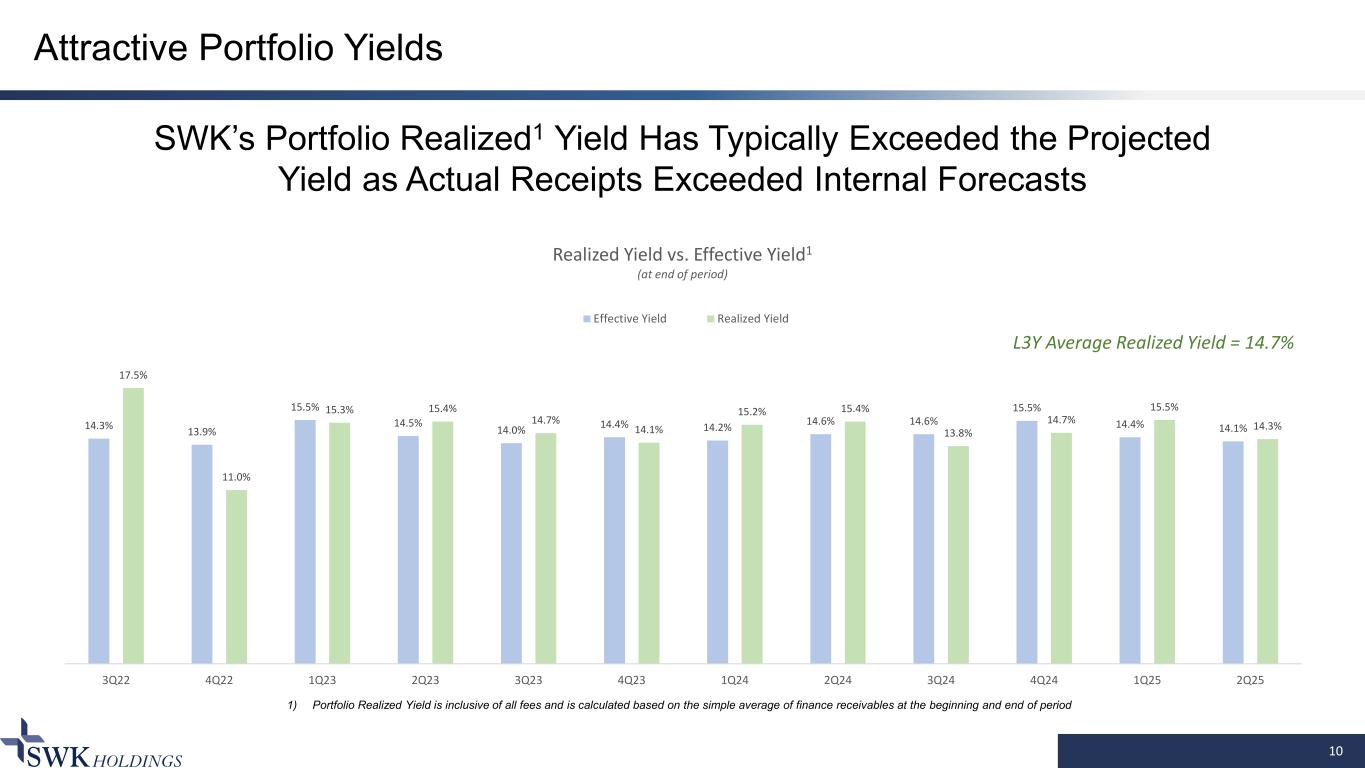
14.3% 13.9% 15.5% 14.5% 14.0% 14.4% 14.2% 14.6% 14.6% 15.5% 14.4% 14.1% 17.5% 11.0% 15.3% 15.4% 14.7% 14.1% 15.2% 15.4% 13.8% 14.7% 15.5% 14.3% 3Q22 4Q22 1Q23 2Q23 3Q23 4Q23 1Q24 2Q24 3Q24 4Q24 1Q25 2Q25 Realized Yield vs. Effective Yield1 (at end of period) Effective Yield Realized Yield 10 Attractive Portfolio Yields SWK’s Portfolio Realized1 Yield Has Typically Exceeded the Projected Yield as Actual Receipts Exceeded Internal Forecasts 1) Portfolio Realized Yield is inclusive of all fees and is calculated based on the simple average of finance receivables at the beginning and end of period L3Y Average Realized Yield = 14.7%
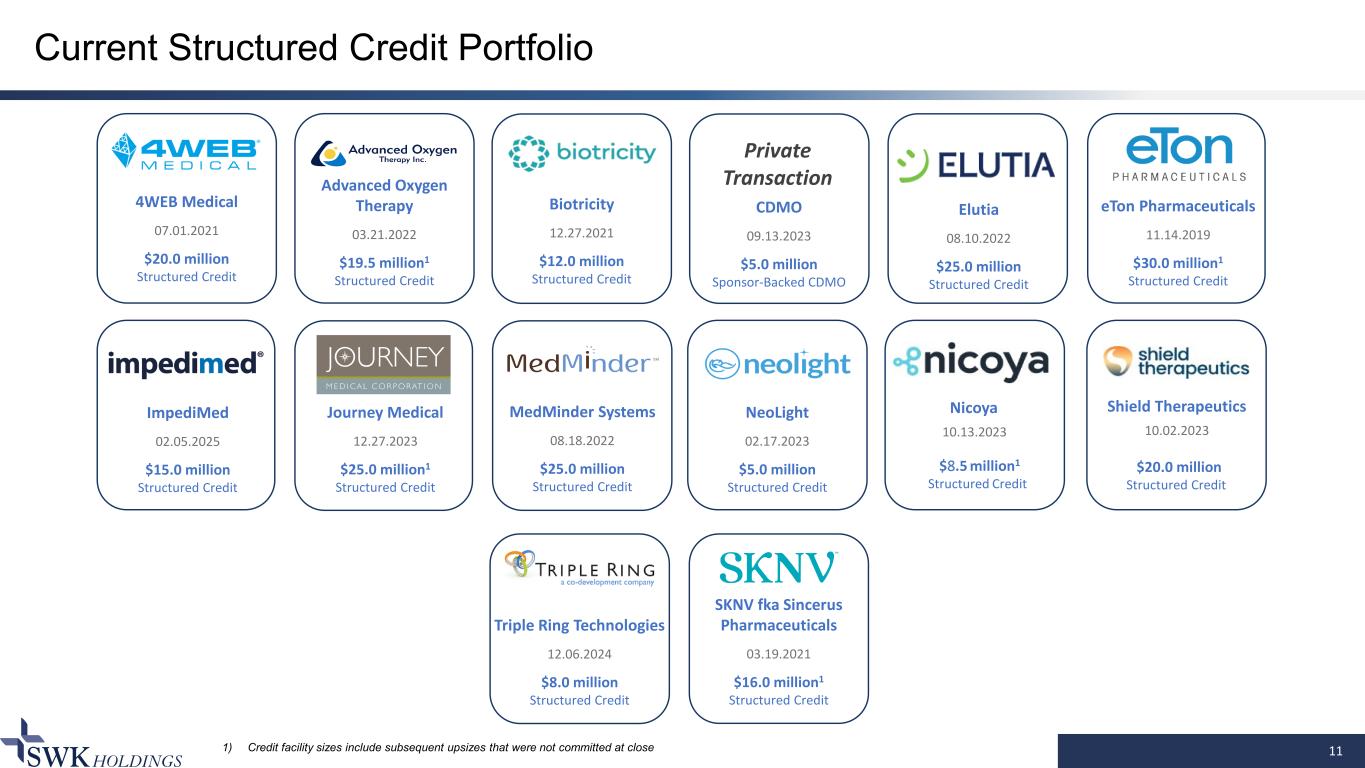
Current Structured Credit Portfolio Biotricity 12.27.2021 $12.0 million Structured Credit NeoLight 02.17.2023 $5.0 million Structured Credit 11 4WEB Medical 07.01.2021 $20.0 million Structured Credit eTon Pharmaceuticals 11.14.2019 $30.0 million1 Structured Credit Nicoya 10.13.2023 $8.5 million1 Structured Credit Advanced Oxygen Therapy 03.21.2022 $19.5 million1 Structured Credit Shield Therapeutics 10.02.2023 $20.0 million Structured Credit MedMinder Systems 08.18.2022 $25.0 million Structured Credit CDMO 09.13.2023 $5.0 million Sponsor-Backed CDMO Private Transaction SKNV fka Sincerus Pharmaceuticals 03.19.2021 $16.0 million1 Structured Credit Elutia 08.10.2022 $25.0 million Structured Credit Journey Medical 12.27.2023 $25.0 million1 Structured Credit ImpediMed 02.05.2025 $15.0 million Structured Credit Triple Ring Technologies 12.06.2024 $8.0 million Structured Credit 1) Credit facility sizes include subsequent upsizes that were not committed at close
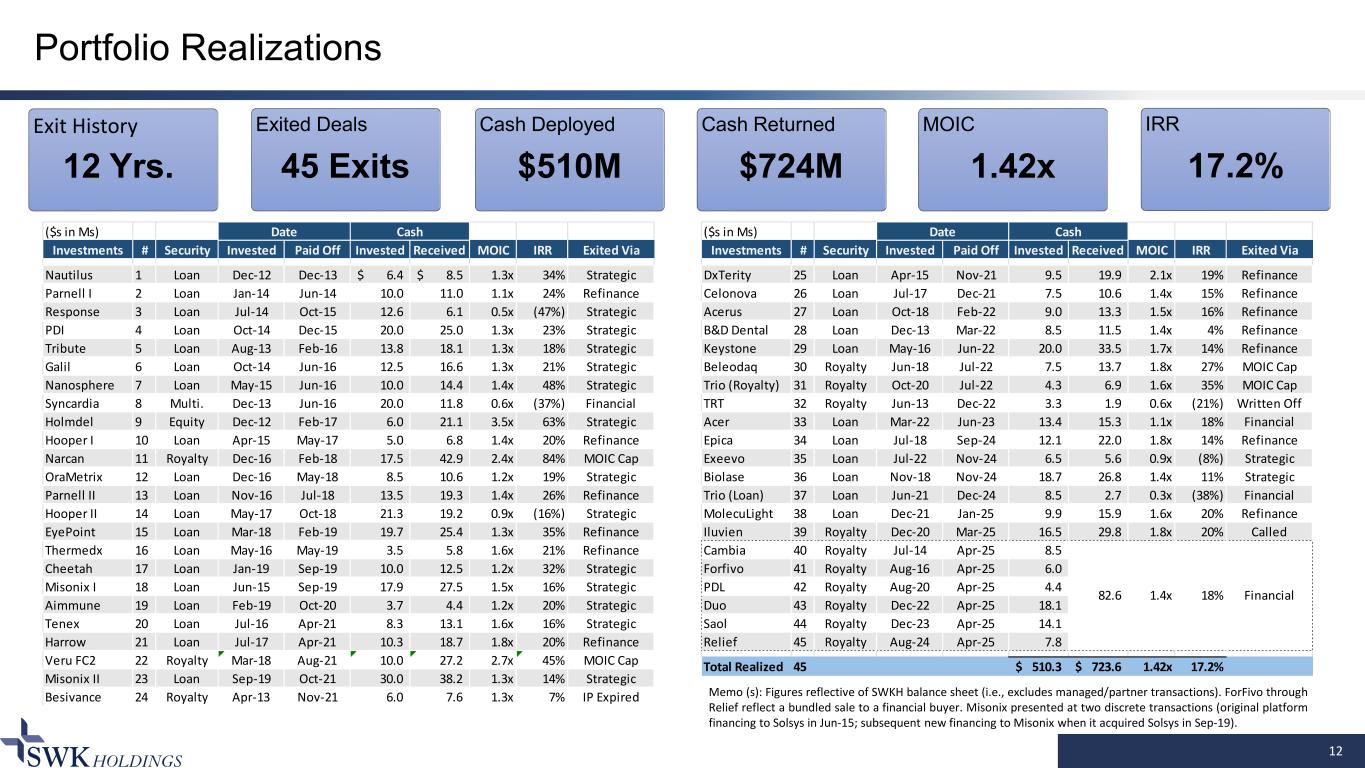
($s in Ms) Date Cash Investments # Security Invested Paid Off Invested Received MOIC IRR Exited Via Nautilus 1 Loan Dec-12 Dec-13 6.4$ 8.5$ 1.3x 34% Strategic Parnell I 2 Loan Jan-14 Jun-14 10.0 11.0 1.1x 24% Refinance Response 3 Loan Jul-14 Oct-15 12.6 6.1 0.5x (47%) Strategic PDI 4 Loan Oct-14 Dec-15 20.0 25.0 1.3x 23% Strategic Tribute 5 Loan Aug-13 Feb-16 13.8 18.1 1.3x 18% Strategic Galil 6 Loan Oct-14 Jun-16 12.5 16.6 1.3x 21% Strategic Nanosphere 7 Loan May-15 Jun-16 10.0 14.4 1.4x 48% Strategic Syncardia 8 Multi. Dec-13 Jun-16 20.0 11.8 0.6x (37%) Financial Holmdel 9 Equity Dec-12 Feb-17 6.0 21.1 3.5x 63% Strategic Hooper I 10 Loan Apr-15 May-17 5.0 6.8 1.4x 20% Refinance Narcan 11 Royalty Dec-16 Feb-18 17.5 42.9 2.4x 84% MOIC Cap OraMetrix 12 Loan Dec-16 May-18 8.5 10.6 1.2x 19% Strategic Parnell II 13 Loan Nov-16 Jul-18 13.5 19.3 1.4x 26% Refinance Hooper II 14 Loan May-17 Oct-18 21.3 19.2 0.9x (16%) Strategic EyePoint 15 Loan Mar-18 Feb-19 19.7 25.4 1.3x 35% Refinance Thermedx 16 Loan May-16 May-19 3.5 5.8 1.6x 21% Refinance Cheetah 17 Loan Jan-19 Sep-19 10.0 12.5 1.2x 32% Strategic Misonix I 18 Loan Jun-15 Sep-19 17.9 27.5 1.5x 16% Strategic Aimmune 19 Loan Feb-19 Oct-20 3.7 4.4 1.2x 20% Strategic Tenex 20 Loan Jul-16 Apr-21 8.3 13.1 1.6x 16% Strategic Harrow 21 Loan Jul-17 Apr-21 10.3 18.7 1.8x 20% Refinance Veru FC2 22 Royalty Mar-18 Aug-21 10.0 27.2 2.7x 45% MOIC Cap Misonix II 23 Loan Sep-19 Oct-21 30.0 38.2 1.3x 14% Strategic Besivance 24 Royalty Apr-13 Nov-21 6.0 7.6 1.3x 7% IP Expired 12 Portfolio Realizations Exit History 12 Yrs. Exited Deals 45 Exits Cash Deployed $510M Cash Returned $724M MOIC 1.42x ($s in Ms) Date Cash Investments # Security Invested Paid Off Invested Received MOIC IRR Exited Via DxTerity 25 Loan Apr-15 Nov-21 9.5 19.9 2.1x 19% Refinance Celonova 26 Loan Jul-17 Dec-21 7.5 10.6 1.4x 15% Refinance Acerus 27 Loan Oct-18 Feb-22 9.0 13.3 1.5x 16% Refinance B&D Dental 28 Loan Dec-13 Mar-22 8.5 11.5 1.4x 4% Refinance Keystone 29 Loan May-16 Jun-22 20.0 33.5 1.7x 14% Refinance Beleodaq 30 Royalty Jun-18 Jul-22 7.5 13.7 1.8x 27% MOIC Cap Trio (Royalty) 31 Royalty Oct-20 Jul-22 4.3 6.9 1.6x 35% MOIC Cap TRT 32 Royalty Jun-13 Dec-22 3.3 1.9 0.6x (21%) Written Off Acer 33 Loan Mar-22 Jun-23 13.4 15.3 1.1x 18% Financial Epica 34 Loan Jul-18 Sep-24 12.1 22.0 1.8x 14% Refinance Exeevo 35 Loan Jul-22 Nov-24 6.5 5.6 0.9x (8%) Strategic Biolase 36 Loan Nov-18 Nov-24 18.7 26.8 1.4x 11% Strategic Trio (Loan) 37 Loan Jun-21 Dec-24 8.5 2.7 0.3x (38%) Financial MolecuLight 38 Loan Dec-21 Jan-25 9.9 15.9 1.6x 20% Refinance Iluvien 39 Royalty Dec-20 Mar-25 16.5 29.8 1.8x 20% Called Cambia 40 Royalty Jul-14 Apr-25 8.5 Forfivo 41 Royalty Aug-16 Apr-25 6.0 PDL 42 Royalty Aug-20 Apr-25 4.4 Duo 43 Royalty Dec-22 Apr-25 18.1 Saol 44 Royalty Dec-23 Apr-25 14.1 Relief 45 Royalty Aug-24 Apr-25 7.8 Total Realized 45 510.3$ 723.6$ 1.42x 17.2% 82.6 1.4x 18% Financial IRR 17.2% Memo (s): Figures reflective of SWKH balance sheet (i.e., excludes managed/partner transactions). ForFivo through Relief reflect a bundled sale to a financial buyer. Misonix presented at two discrete transactions (original platform financing to Solsys in Jun-15; subsequent new financing to Misonix when it acquired Solsys in Sep-19).

13 Portfolio Realizations to Strategic Buyers Non-workout realizations to strategic buyers transacted at a 26% LTV of SWK’s original loan value 79% of businesses were not profitable at time of sale, validating SWK’s revenue and IP-based underwriting methodology Two of four workouts exited to strategics demonstrated ~100%+ total recovery (1) Attachment point measured as face value of loan and inclusive of all subsequent add-ons and any pari or senior debt outstanding at exit (2) Averages weighted to SWK attachment point (i.e., dollars invested) (3) For workouts, attachment point reflects sum of cash deployed into business, while TEV reflects sum of cash extracted from business/estate ($ in M) Target Buyer Exit Close Date Transaction TEV SWK Attachment Point1 LTV LTM Sales EV / LTM Sales Target Profitable Sale? Notes Nautilus Depomed Dec-13 48.7$ 22.5$ 46% 15.4$ 3.2x N Key asset was Cambia PDI Publicis Dec-15 25.0 20.0 80% 129.3 0.2x Y Tribute Aralez Feb-16 147.6 13.8 9% 26.5 5.6x N Galil BTG plc May-16 84.4 12.5 15% 22.7 3.7x N Transaction EV excludes $26M of milestones Nanosphere Luminex Jun-16 77.0 25.0 32% 23.1 3.3x N Orametrix Dentsply May-18 90.0 8.5 9% 20.0 4.5x Y Transaction EV excludes up to $60M in earn-outs Cheetah Medical Baxter Oct-19 190.0 20.0 11% 22.2 8.6x N Transaction EV excludes up to $40M in earn-outs Aimmune Nestle Oct-20 2,139.0 131.5 6% n.a. n.a. N SWK partnered w. KKR as a 4.5% participant Tenex Trice Apr-21 25.0 8.3 33% 12.3 2.0x Y Excludes earn-outs Misonix Bioventus Oct-21 518.0$ 27.6$ 5% 74.0$ 7.0x N Weighted Average2 246.1$ 26% 2.4x Workouts3 Buyer Exit Close Date Cash Into Business Cash Out of Business % Recovery Hooper I&II Quest Oct-18 26.3 25.9 98% N Response Cancer Dec-18 12.6$ 6.1$ 48% N Exeevo Valsoft Nov-24 6.5 5.6 87% N Biolase MegaGen Nov-24 18.7 26.8 143% N Total - Workouts2 37.7$ 38.5$ 98%
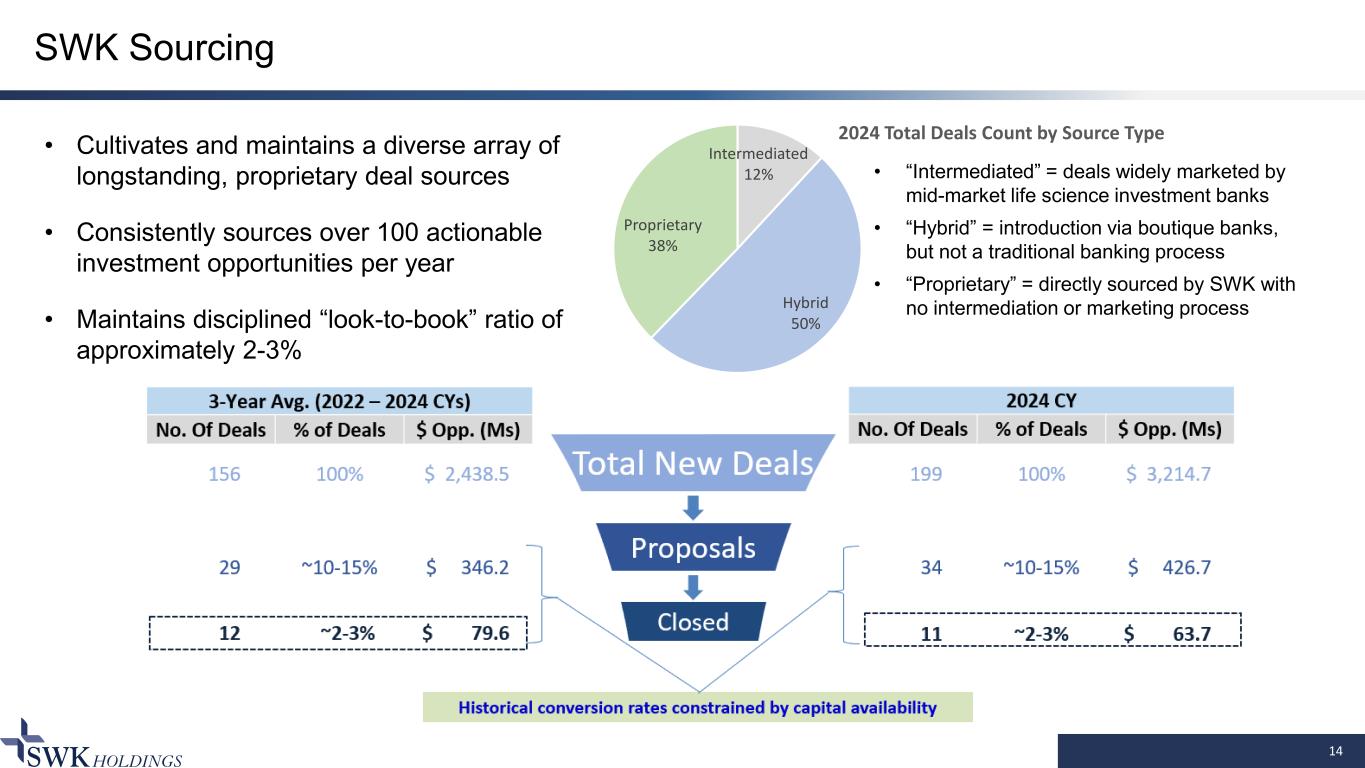
14 SWK Sourcing • Cultivates and maintains a diverse array of longstanding, proprietary deal sources • Consistently sources over 100 actionable investment opportunities per year • Maintains disciplined “look-to-book” ratio of approximately 2-3% Intermediated 12% Hybrid 50% Proprietary 38% 2024 Total Deals Count by Source Type • “Intermediated” = deals widely marketed by mid-market life science investment banks • “Hybrid” = introduction via boutique banks, but not a traditional banking process • “Proprietary” = directly sourced by SWK with no intermediation or marketing process
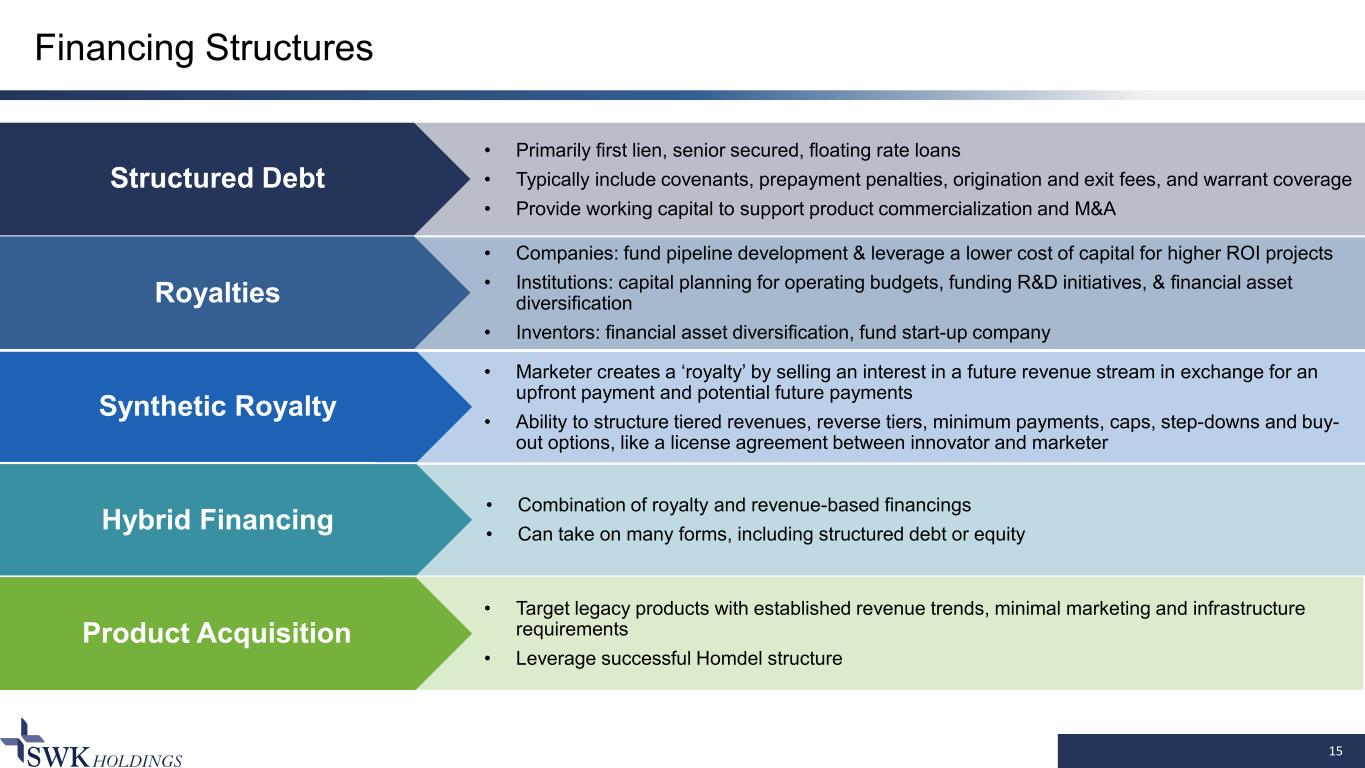
Financing Structures 15 Product Acquisition • Primarily first lien, senior secured, floating rate loans • Typically include covenants, prepayment penalties, origination and exit fees, and warrant coverage • Provide working capital to support product commercialization and M&A Hybrid Financing Synthetic Royalty Royalties Structured Debt • Companies: fund pipeline development & leverage a lower cost of capital for higher ROI projects • Institutions: capital planning for operating budgets, funding R&D initiatives, & financial asset diversification • Inventors: financial asset diversification, fund start-up company • Marketer creates a ‘royalty’ by selling an interest in a future revenue stream in exchange for an upfront payment and potential future payments • Ability to structure tiered revenues, reverse tiers, minimum payments, caps, step-downs and buy- out options, like a license agreement between innovator and marketer • Combination of royalty and revenue-based financings • Can take on many forms, including structured debt or equity • Target legacy products with established revenue trends, minimal marketing and infrastructure requirements • Leverage successful Homdel structure
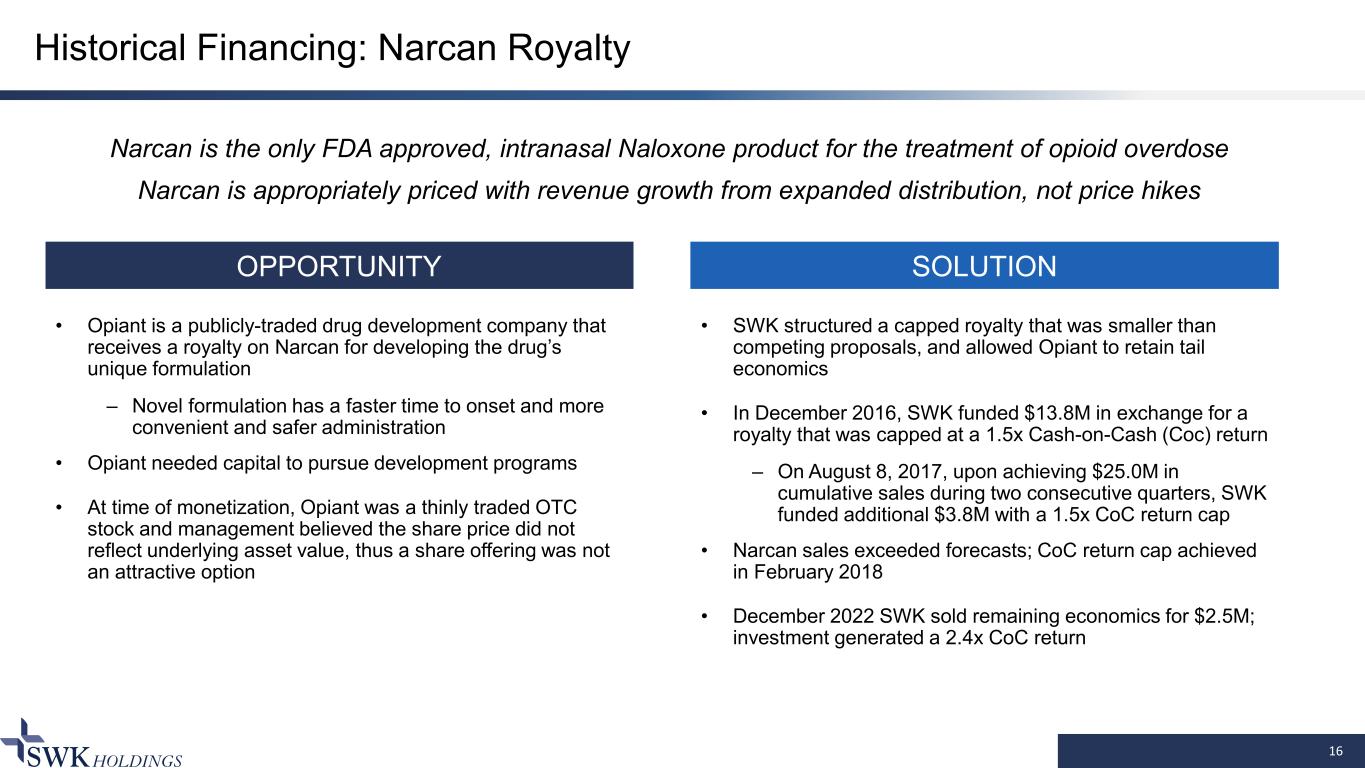
Historical Financing: Narcan Royalty 16 OPPORTUNITY SOLUTION • Opiant is a publicly-traded drug development company that receives a royalty on Narcan for developing the drug’s unique formulation – Novel formulation has a faster time to onset and more convenient and safer administration • Opiant needed capital to pursue development programs • At time of monetization, Opiant was a thinly traded OTC stock and management believed the share price did not reflect underlying asset value, thus a share offering was not an attractive option • SWK structured a capped royalty that was smaller than competing proposals, and allowed Opiant to retain tail economics • In December 2016, SWK funded $13.8M in exchange for a royalty that was capped at a 1.5x Cash-on-Cash (Coc) return – On August 8, 2017, upon achieving $25.0M in cumulative sales during two consecutive quarters, SWK funded additional $3.8M with a 1.5x CoC return cap • Narcan sales exceeded forecasts; CoC return cap achieved in February 2018 • December 2022 SWK sold remaining economics for $2.5M; investment generated a 2.4x CoC return Narcan is the only FDA approved, intranasal Naloxone product for the treatment of opioid overdose Narcan is appropriately priced with revenue growth from expanded distribution, not price hikes
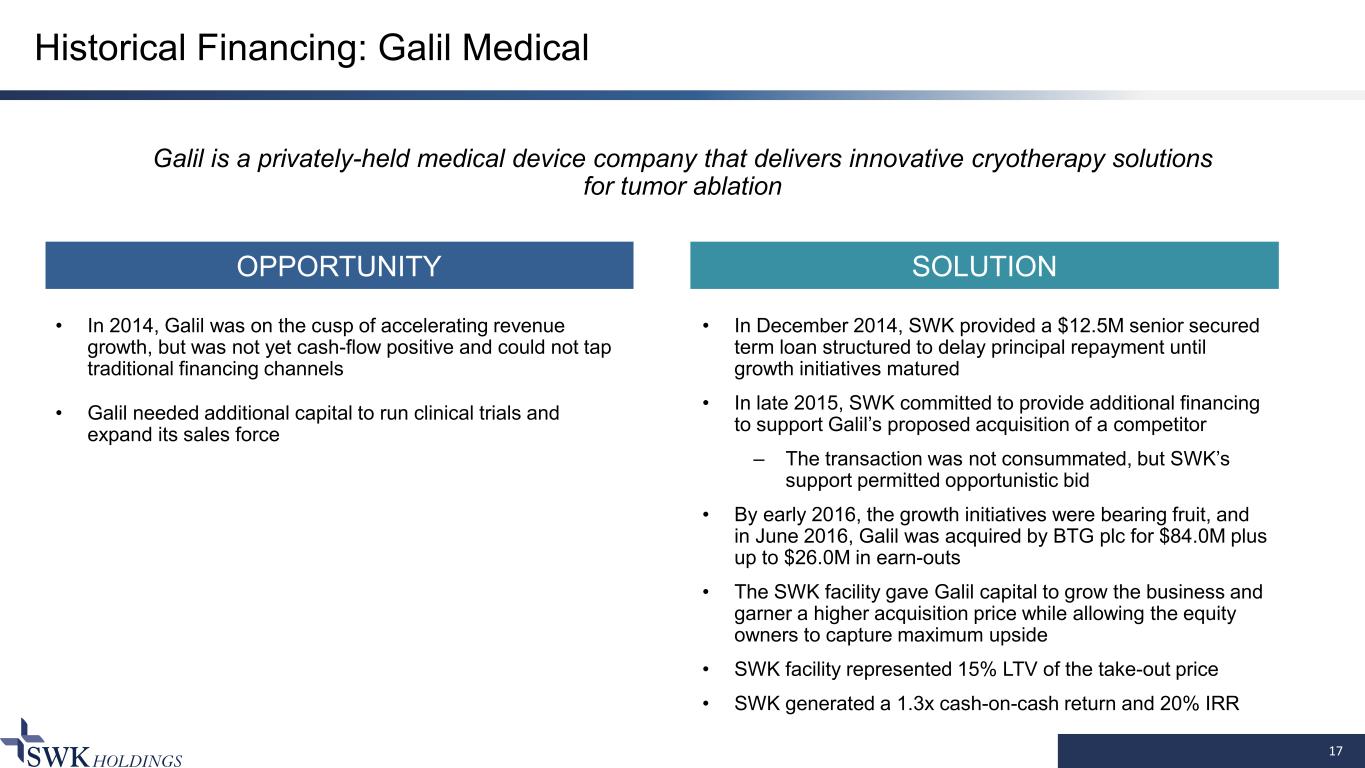
Historical Financing: Galil Medical 17 OPPORTUNITY SOLUTION • In 2014, Galil was on the cusp of accelerating revenue growth, but was not yet cash-flow positive and could not tap traditional financing channels • Galil needed additional capital to run clinical trials and expand its sales force • In December 2014, SWK provided a $12.5M senior secured term loan structured to delay principal repayment until growth initiatives matured • In late 2015, SWK committed to provide additional financing to support Galil’s proposed acquisition of a competitor – The transaction was not consummated, but SWK’s support permitted opportunistic bid • By early 2016, the growth initiatives were bearing fruit, and in June 2016, Galil was acquired by BTG plc for $84.0M plus up to $26.0M in earn-outs • The SWK facility gave Galil capital to grow the business and garner a higher acquisition price while allowing the equity owners to capture maximum upside • SWK facility represented 15% LTV of the take-out price • SWK generated a 1.3x cash-on-cash return and 20% IRR Galil is a privately-held medical device company that delivers innovative cryotherapy solutions for tumor ablation
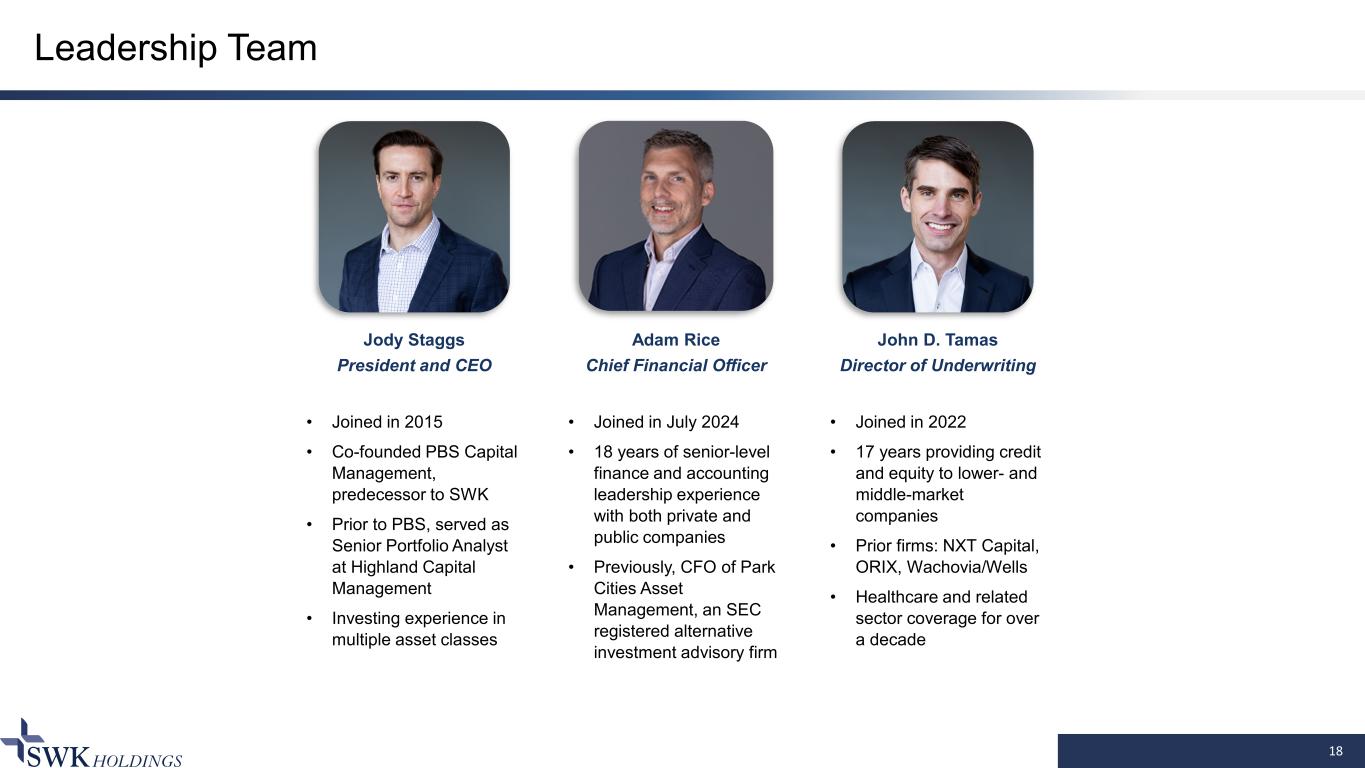
18 Leadership Team Jody Staggs President and CEO • Joined in 2015 • Co-founded PBS Capital Management, predecessor to SWK • Prior to PBS, served as Senior Portfolio Analyst at Highland Capital Management • Investing experience in multiple asset classes John D. Tamas Director of Underwriting • Joined in 2022 • 17 years providing credit and equity to lower- and middle-market companies • Prior firms: NXT Capital, ORIX, Wachovia/Wells • Healthcare and related sector coverage for over a decade Adam Rice Chief Financial Officer • Joined in July 2024 • 18 years of senior-level finance and accounting leadership experience with both private and public companies • Previously, CFO of Park Cities Asset Management, an SEC registered alternative investment advisory firm
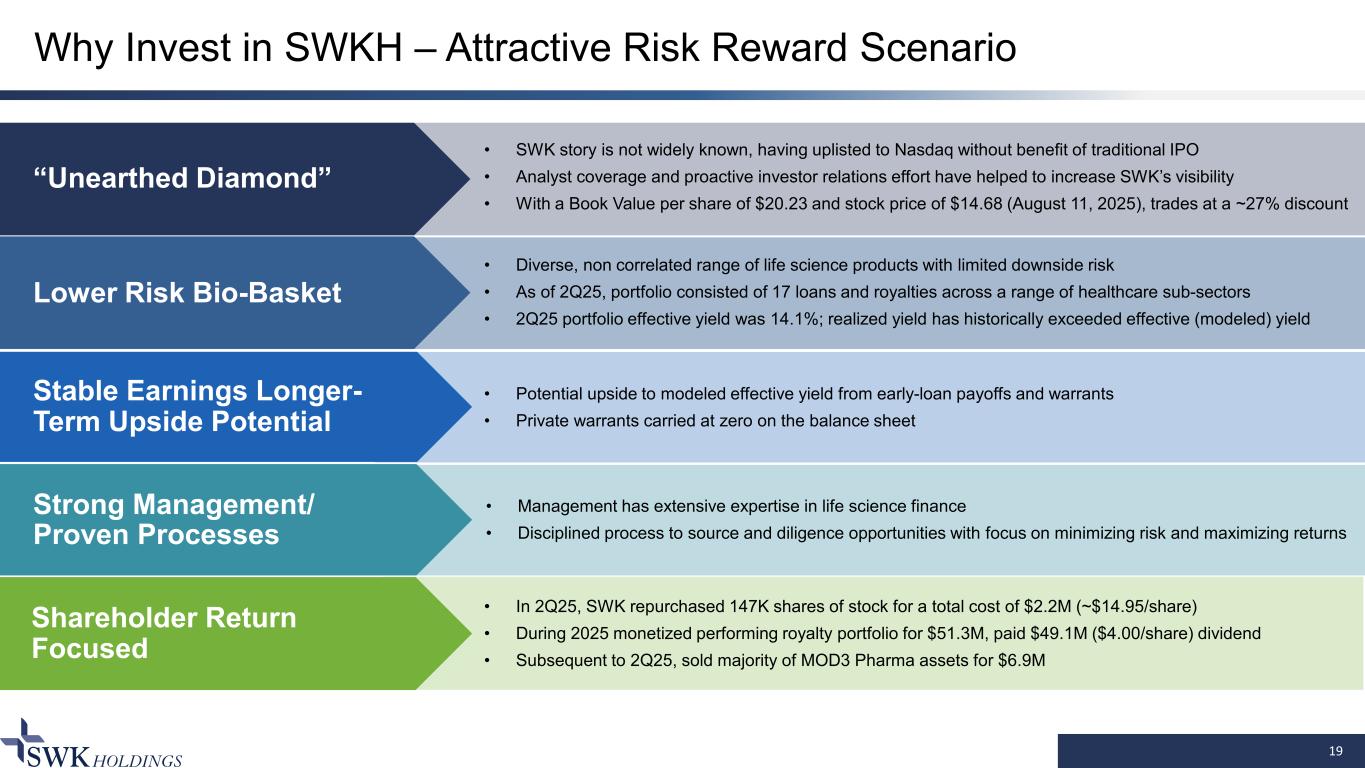
Why Invest in SWKH – Attractive Risk Reward Scenario 19 Shareholder Return Focused • SWK story is not widely known, having uplisted to Nasdaq without benefit of traditional IPO • Analyst coverage and proactive investor relations effort have helped to increase SWK’s visibility • With a Book Value per share of $20.23 and stock price of $14.68 (August 11, 2025), trades at a ~27% discount Strong Management/ Proven Processes Stable Earnings Longer- Term Upside Potential Lower Risk Bio-Basket “Unearthed Diamond” • Diverse, non correlated range of life science products with limited downside risk • As of 2Q25, portfolio consisted of 17 loans and royalties across a range of healthcare sub-sectors • 2Q25 portfolio effective yield was 14.1%; realized yield has historically exceeded effective (modeled) yield • Potential upside to modeled effective yield from early-loan payoffs and warrants • Private warrants carried at zero on the balance sheet • Management has extensive expertise in life science finance • Disciplined process to source and diligence opportunities with focus on minimizing risk and maximizing returns • In 2Q25, SWK repurchased 147K shares of stock for a total cost of $2.2M (~$14.95/share) • During 2025 monetized performing royalty portfolio for $51.3M, paid $49.1M ($4.00/share) dividend • Subsequent to 2Q25, sold majority of MOD3 Pharma assets for $6.9M
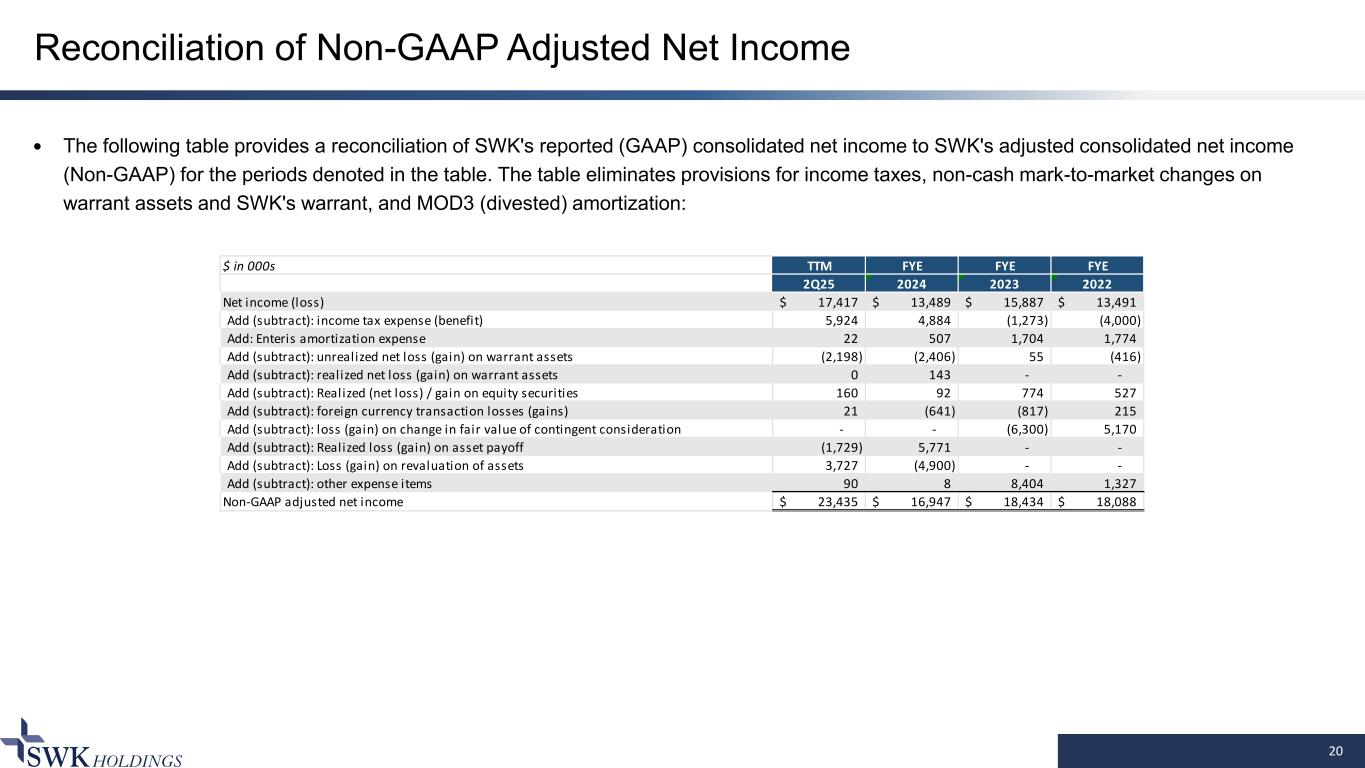
20 Reconciliation of Non-GAAP Adjusted Net Income The following table provides a reconciliation of SWK's reported (GAAP) consolidated net income to SWK's adjusted consolidated net income (Non-GAAP) for the periods denoted in the table. The table eliminates provisions for income taxes, non-cash mark-to-market changes on warrant assets and SWK's warrant, and MOD3 (divested) amortization: $ in 000s TTM FYE FYE FYE 2Q25 2024 2023 2022 Net income (loss) 17,417$ 13,489$ 15,887$ 13,491$ Add (subtract): income tax expense (benefit) 5,924 4,884 (1,273) (4,000) Add: Enteris amortization expense 22 507 1,704 1,774 Add (subtract): unrealized net loss (gain) on warrant assets (2,198) (2,406) 55 (416) Add (subtract): realized net loss (gain) on warrant assets 0 143 - - Add (subtract): Realized (net loss) / gain on equity securities 160 92 774 527 Add (subtract): foreign currency transaction losses (gains) 21 (641) (817) 215 Add (subtract): loss (gain) on change in fair value of contingent consideration - - (6,300) 5,170 Add (subtract): Realized loss (gain) on asset payoff (1,729) 5,771 - - Add (subtract): Loss (gain) on revaluation of assets 3,727 (4,900) - - Add (subtract): other expense items 90 8 8,404 1,327 Non-GAAP adjusted net income 23,435$ 16,947$ 18,434$ 18,088$
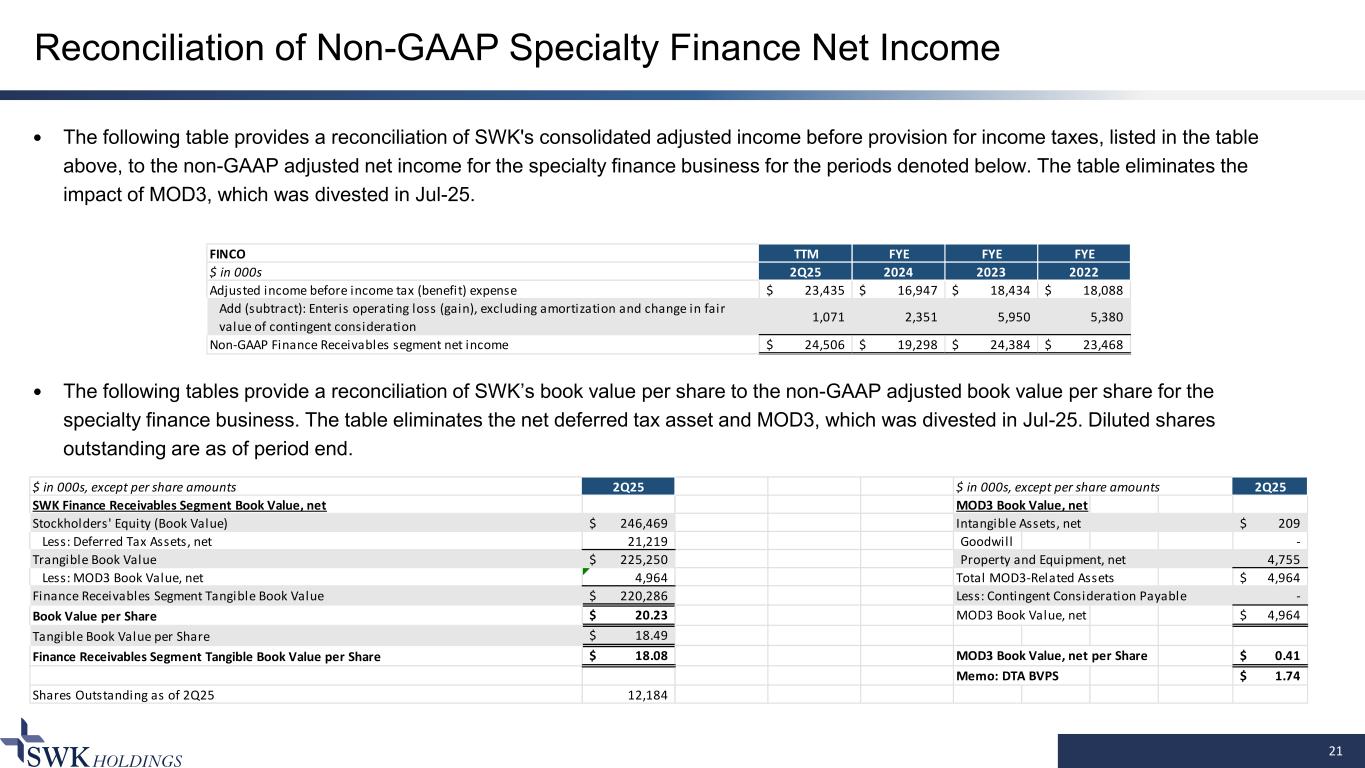
21 Reconciliation of Non-GAAP Specialty Finance Net Income The following table provides a reconciliation of SWK's consolidated adjusted income before provision for income taxes, listed in the table above, to the non-GAAP adjusted net income for the specialty finance business for the periods denoted below. The table eliminates the impact of MOD3, which was divested in Jul-25. The following tables provide a reconciliation of SWK’s book value per share to the non-GAAP adjusted book value per share for the specialty finance business. The table eliminates the net deferred tax asset and MOD3, which was divested in Jul-25. Diluted shares outstanding are as of period end. FINCO TTM FYE FYE FYE $ in 000s 2Q25 2024 2023 2022 Adjusted income before income tax (benefit) expense 23,435$ 16,947$ 18,434$ 18,088$ Add (subtract): Enteris operating loss (gain), excluding amortization and change in fair value of contingent consideration 1,071 2,351 5,950 5,380 Non-GAAP Finance Receivables segment net income 24,506$ 19,298$ 24,384$ 23,468$ $ in 000s, except per share amounts 2Q25 $ in 000s, except per share amounts 2Q25 SWK Finance Receivables Segment Book Value, net MOD3 Book Value, net Stockholders' Equity (Book Value) 246,469$ Intangible Assets, net 209$ Less: Deferred Tax Assets, net 21,219 Goodwill - Trangible Book Value 225,250$ Property and Equipment, net 4,755 Less: MOD3 Book Value, net 4,964 Total MOD3-Related Assets 4,964$ Finance Receivables Segment Tangible Book Value 220,286$ Less: Contingent Consideration Payable - Book Value per Share 20.23$ MOD3 Book Value, net 4,964$ Tangible Book Value per Share 18.49$ Finance Receivables Segment Tangible Book Value per Share 18.08$ MOD3 Book Value, net per Share 0.41$ Memo: DTA BVPS 1.74$ Shares Outstanding as of 2Q25 12,184
22 Contact Information CONFIDENTIAL SWK Senior Management Investor & Media Relations: Alliance Advisors IR • Jody Staggs: ̶ Phone: 972.687.7252 ̶ Email: jstaggs@swkhold.com • Office address: 5956 Sherry Lane, Unit 650 Dallas, TX 75225 • Website: www.swkhold.com • Susan Xu: ̶ Phone: 778.323.0959 ̶ Email: sxu@allianceadvisors.com

23 Collaborative Approach to Life Science Financing