Q1false--12-310001090012DEVON ENERGY CORP/DE0001090012dvn:GasMemberdvn:MarketingAndMidstreamRevenuesMember2026-01-012026-03-310001090012us-gaap:RetainedEarningsMember2025-12-310001090012dvn:FivePointZeroZeroPercentDueJuneFifteenTwoThousandAndFortyFiveMember2026-01-012026-03-310001090012dvn:SevenPointEightSevenFivePercentDueSeptemberThirtiethTwoThousandAndThirtyOneMember2025-12-310001090012us-gaap:FairValueInputsLevel1Member2025-12-310001090012dvn:MarketingAndMidstreamExpensesMember2025-01-012025-03-310001090012us-gaap:AdditionalPaidInCapitalMember2024-12-310001090012us-gaap:AdditionalPaidInCapitalMember2025-03-310001090012dvn:NYMEXWestTexasIntermediateThreeWayPriceCollarsOilQ2Q42026Member2026-03-310001090012dvn:ShareRepurchaseProgramMember2026-03-310001090012us-gaap:NoncontrollingInterestMember2026-03-310001090012us-gaap:GeneralAndAdministrativeExpenseMember2025-01-012025-03-310001090012us-gaap:NoncontrollingInterestMember2024-12-310001090012dvn:FourPointFiveZeroPercentDueJanuaryFifteenTwoThousandThirtyMember2026-01-012026-03-3100010900122025-03-310001090012dvn:FivePointTwoFivePercentDueOctoberFifteenTwoThousandTwentySevenMember2026-01-012026-03-310001090012us-gaap:FairValueInputsLevel2Memberus-gaap:CommodityContractMember2025-12-310001090012dvn:FivePointSevenFivePercentDueSeptemberFifteenthTwoThousandAndFiftyFourMember2026-03-310001090012dvn:TermLoanCreditAgreementMemberus-gaap:ShareBasedCompensationAwardTrancheTwoMember2024-08-312024-08-310001090012dvn:FerchenryHubPriceCollarsNaturalGasQ1Q42026Member2026-01-012026-03-310001090012dvn:FerchenryHubPriceSwapsNaturalGasQ1-Q42027Member2026-03-310001090012us-gaap:PerformanceSharesMembersrt:MaximumMember2026-01-012026-03-310001090012dvn:FourPointFiveZeroPercentDueJanuaryFifteenTwoThousandThirtyMember2026-03-310001090012us-gaap:EstimateOfFairValueFairValueDisclosureMember2026-03-310001090012us-gaap:GeneralAndAdministrativeExpenseMember2026-01-012026-03-310001090012dvn:OilGasAndNGLSalesMember2026-03-310001090012dvn:FivePointZeroZeroPercentDueJuneFifteenTwoThousandAndFortyFiveMember2025-12-310001090012us-gaap:TreasuryStockCommonMember2025-03-310001090012us-gaap:CarryingReportedAmountFairValueDisclosureMember2025-12-310001090012dvn:FivePointTwoZeroPercentDueSeptemberFifteenTwoThousandThirtyFourMember2026-03-310001090012us-gaap:CommodityContractMemberus-gaap:EstimateOfFairValueFairValueDisclosureMember2026-03-310001090012dvn:OilGasAndNGLSalesMember2026-01-012026-03-310001090012dvn:MarketingAndMidstreamRevenuesMember2025-01-012025-03-310001090012dvn:SevenPointFiveZeroPercentDueSeptemberFifteenthTwoThousandAndTwentySevenMember2025-12-310001090012us-gaap:PerformanceSharesMember2025-12-310001090012dvn:ShortTermDerivativeAssetMember2026-03-310001090012dvn:CatalystMember2025-12-310001090012dvn:DueSeptemberTwentyFiveTwoThousandAndTwentySixMember2026-03-310001090012dvn:FiveBillionDollarShareRepurchaseProgramClosedMember2021-01-012021-12-310001090012dvn:BarnettShaleMember2026-01-012026-03-310001090012dvn:BarnettShaleMember2025-01-012025-03-310001090012dvn:FiveBillionDollarShareRepurchaseProgramClosedMember2026-01-012026-03-310001090012us-gaap:RetainedEarningsMember2026-01-012026-03-310001090012us-gaap:RestrictedStockUnitsRSUMember2026-03-310001090012dvn:OtherMember2025-12-310001090012us-gaap:CommodityContractMemberus-gaap:EstimateOfFairValueFairValueDisclosureMember2025-12-310001090012us-gaap:AdditionalPaidInCapitalMember2026-03-310001090012dvn:FourPointSevenFivePercentDueMayFifteenthTwoThousandFortyTwoMember2026-03-310001090012dvn:FervoEnergyMember2025-12-310001090012dvn:MarketingAndMidstreamExpensesMember2026-01-012026-03-310001090012dvn:CottonDrawMidstreamMember2025-08-012025-08-010001090012dvn:OilGasAndNGLSalesMember2025-01-012025-03-310001090012dvn:SevenPointNineFivePercentDueAprilFifteenthTwoThousandAndThirtyTwoMember2026-01-012026-03-310001090012us-gaap:TreasuryStockCommonMember2026-03-310001090012us-gaap:CommonStockMember2024-12-310001090012dvn:SevenPointEightSevenFivePercentDueSeptemberThirtiethTwoThousandAndThirtyOneMember2026-01-012026-03-310001090012us-gaap:CommonStockMember2026-03-310001090012us-gaap:CarryingReportedAmountFairValueDisclosureMember2026-03-310001090012dvn:LongTermDerivativeLiabilityMember2026-03-310001090012dvn:FervoEnergyMember2026-03-310001090012us-gaap:FairValueInputsLevel1Member2026-03-310001090012us-gaap:CommonStockMember2025-03-310001090012us-gaap:NoncontrollingInterestMember2025-01-012025-03-310001090012dvn:FiveBillionDollarShareRepurchaseProgramClosedMember2022-01-012022-12-310001090012dvn:FivePointTwoZeroPercentDueSeptemberFifteenTwoThousandThirtyFourMember2026-01-012026-03-310001090012dvn:OilGasAndNGLSalesMember2025-01-012025-03-310001090012dvn:CatalystMember2026-03-310001090012dvn:WaterbridgeMember2026-03-310001090012dvn:O2026Q1FixedDividendsMember2026-01-012026-03-310001090012dvn:FerchenryHubPriceCollarsNaturalGasQ1-Q42027Member2026-03-310001090012dvn:MagellanEastHoustonQ1-Q42027Member2026-01-012026-03-310001090012us-gaap:CarryingReportedAmountFairValueDisclosureMemberus-gaap:CommodityContractMember2025-12-310001090012us-gaap:SeniorNotesMemberdvn:DevonMember2025-09-152025-09-150001090012dvn:WaterbridgeMember2025-12-310001090012dvn:NGLMemberdvn:OilGasAndNGLSalesMember2026-01-012026-03-310001090012us-gaap:AccumulatedOtherComprehensiveIncomeMember2026-03-310001090012us-gaap:AccumulatedOtherComprehensiveIncomeMember2026-01-012026-03-310001090012dvn:FourPointSevenFivePercentDueMayFifteenthTwoThousandFortyTwoMember2025-12-310001090012dvn:TermLoanCreditAgreementMember2024-09-270001090012dvn:OtherMember2026-03-3100010900122026-04-220001090012us-gaap:CommonStockMember2025-12-310001090012dvn:ShortTermDerivativeAssetMember2025-12-310001090012us-gaap:CarryingReportedAmountFairValueDisclosureMemberus-gaap:CommodityContractMember2026-03-310001090012dvn:MarketingAndMidstreamRevenuesMember2025-12-310001090012us-gaap:AdditionalPaidInCapitalMember2025-01-012025-03-310001090012dvn:MarketingAndMidstreamRevenuesMembersrt:OilReservesMember2025-01-012025-03-310001090012srt:MaximumMemberus-gaap:LineOfCreditMember2026-03-310001090012dvn:HoustonShipChannelNaturalGasBasisSwapQ2-Q42026Member2026-01-012026-03-310001090012dvn:DueSeptemberTwentyFiveTwoThousandAndTwentySixMember2026-01-012026-03-310001090012dvn:TermLoanCreditAgreementMember2024-08-312024-08-310001090012us-gaap:AdditionalPaidInCapitalMember2026-01-012026-03-310001090012dvn:FiveBillionDollarShareRepurchaseProgramOpenMember2026-03-310001090012dvn:SevenPointNineFivePercentDueAprilFifteenthTwoThousandAndThirtyTwoMember2025-12-310001090012dvn:ShortTermDerivativeLiabilityMember2025-12-310001090012dvn:MarketingAndMidstreamRevenuesMemberdvn:NGLMember2026-01-012026-03-310001090012us-gaap:TreasuryStockCommonMember2026-01-012026-03-310001090012dvn:OilGasAndNGLSalesMember2025-12-310001090012dvn:CottonDrawMidstreamMemberdvn:OwnershipInCottonDrawMidstreamMember2025-08-010001090012dvn:FiveBillionDollarShareRepurchaseProgramClosedMember2025-04-012025-06-300001090012dvn:FiveBillionDollarShareRepurchaseProgramClosedMember2025-07-012025-09-300001090012dvn:CottonDrawMidstreamMember2025-08-012025-08-010001090012us-gaap:PerformanceSharesMember2026-03-310001090012dvn:SevenPointNineFivePercentDueAprilFifteenthTwoThousandAndThirtyTwoMember2026-03-310001090012dvn:FivePointTwoFivePercentDueOctoberFifteenTwoThousandTwentySevenMember2025-12-310001090012dvn:FiveBillionDollarShareRepurchaseProgramClosedMember2025-01-012025-12-310001090012us-gaap:FairValueInputsLevel2Member2025-12-310001090012us-gaap:SeniorNotesMemberdvn:DevonMember2025-09-1500010900122025-01-012025-03-3100010900122025-12-310001090012us-gaap:FairValueInputsLevel2Member2026-03-310001090012dvn:LongTermDerivativeLiabilityMember2025-12-310001090012us-gaap:RetainedEarningsMember2024-12-310001090012dvn:TermLoanCreditAgreementMemberus-gaap:ShareBasedCompensationAwardTrancheOneMember2024-08-312024-08-310001090012dvn:FercHenryHubPriceSwapsNaturalGasQ1Q42026Member2026-01-012026-03-310001090012dvn:FivePointTwoFivePercentDueOctoberFifteenTwoThousandTwentySevenMember2026-03-310001090012dvn:GasMemberdvn:OilGasAndNGLSalesMember2026-01-012026-03-310001090012dvn:FercHenryHubPriceSwapsNaturalGasQ1Q42026Member2026-03-310001090012dvn:IncludingPerformanceFactorSharesGrantedMember2026-01-012026-03-310001090012dvn:MarketingAndMidstreamRevenuesMember2026-01-012026-03-310001090012dvn:O2025Q1FixedDividendsMember2025-01-012025-03-310001090012dvn:MarketingAndMidstreamRevenuesMember2026-03-310001090012dvn:FerchenryHubPriceCollarsNaturalGasQ1-Q42027Member2026-01-012026-03-310001090012dvn:LongTermDerivativeAssetMember2025-12-310001090012dvn:FivePointEightSevenFiveDueJuneFifteenTwoThousandTwentyEightMember2026-03-310001090012dvn:SevenPointEightSevenFivePercentDueSeptemberThirtiethTwoThousandAndThirtyOneMember2026-03-3100010900122026-03-310001090012dvn:DueSeptemberTwentyFiveTwoThousandAndTwentySixMember2025-12-310001090012us-gaap:CommonStockMember2026-01-012026-03-310001090012us-gaap:TreasuryStockCommonMember2025-12-310001090012srt:OilReservesMemberdvn:OilGasAndNGLSalesMember2026-01-012026-03-310001090012dvn:FivePointSevenFivePercentDueSeptemberFifteenthTwoThousandAndFiftyFourMember2026-01-012026-03-310001090012dvn:FivePointSevenFivePercentDueSeptemberFifteenthTwoThousandAndFiftyFourMember2025-12-310001090012us-gaap:EstimateOfFairValueFairValueDisclosureMember2025-12-310001090012us-gaap:AccumulatedOtherComprehensiveIncomeMember2025-03-310001090012dvn:FivePointTwoZeroPercentDueSeptemberFifteenTwoThousandThirtyFourMember2025-12-310001090012dvn:FiveBillionDollarShareRepurchaseProgramOpenMember2026-01-012026-03-310001090012us-gaap:AccumulatedOtherComprehensiveIncomeMember2025-12-310001090012dvn:DevonMember2025-01-012025-03-3100010900122026-01-012026-03-310001090012dvn:GasMemberdvn:MarketingAndMidstreamRevenuesMember2025-01-012025-03-310001090012us-gaap:RestructuringChargesMember2025-01-012025-03-310001090012dvn:FerchenryHubPriceCollarsNaturalGasQ1Q42026Member2026-03-310001090012dvn:ShortTermDerivativeLiabilityMember2026-03-310001090012dvn:MidlandSweetQ1-Q42027Member2026-01-012026-03-310001090012us-gaap:TreasuryStockCommonMember2025-01-012025-03-310001090012dvn:FivePointEightSevenFiveDueJuneFifteenTwoThousandTwentyEightMember2025-12-310001090012dvn:NYMEXWestTexasIntermediateThreeWayPriceCollarsOilQ1Q42027Member2026-01-012026-03-310001090012us-gaap:RetainedEarningsMember2026-03-310001090012dvn:WTIBrentQ2-Q42026Member2026-01-012026-03-310001090012dvn:GasMemberdvn:OilGasAndNGLSalesMember2025-01-012025-03-310001090012dvn:FiveBillionDollarShareRepurchaseProgramClosedMember2024-01-012024-12-310001090012dvn:NGLMemberdvn:MarketingAndMidstreamRevenuesMember2025-01-012025-03-310001090012dvn:Midlandsweetq1Q42026Member2026-01-012026-03-310001090012dvn:FivePointSixZeroPercentDueJulyFifteenthTwoThousandAndFortyOneMember2026-03-310001090012dvn:CottonDrawMidstreamMemberdvn:OwnershipInCottonDrawMidstreamMember2025-08-010001090012us-gaap:RestrictedStockUnitsRSUMember2026-01-012026-03-310001090012dvn:TermLoanCreditAgreementMember2026-03-310001090012us-gaap:AccumulatedOtherComprehensiveIncomeMember2025-01-012025-03-310001090012dvn:FerchenryHubPriceSwapsNaturalGasQ1-Q42027Member2026-01-012026-03-310001090012us-gaap:CommonStockMember2026-02-010001090012dvn:FiveBillionDollarShareRepurchaseProgramClosedMember2025-10-012025-12-310001090012us-gaap:PerformanceSharesMember2026-01-012026-03-310001090012us-gaap:RestructuringChargesMember2026-01-012026-03-310001090012dvn:WahaNaturalGasBasisSwapsQ2-Q42026Member2026-01-012026-03-3100010900122024-12-310001090012dvn:FiveBillionDollarShareRepurchaseProgramClosedMember2023-01-012023-12-310001090012dvn:NYMEXRollQ2-Q42026Member2026-01-012026-03-310001090012us-gaap:RetainedEarningsMember2025-01-012025-03-310001090012dvn:ShareRepurchaseProgramOpenMember2026-01-012026-03-310001090012us-gaap:NoncontrollingInterestMember2025-12-310001090012dvn:FourPointFiveZeroPercentDueJanuaryFifteenTwoThousandThirtyMember2025-12-310001090012dvn:FiveBillionDollarShareRepurchaseProgramClosedMember2025-01-012025-03-310001090012srt:OilReservesMemberdvn:OilGasAndNGLSalesMember2025-01-012025-03-310001090012dvn:FivePointSixZeroPercentDueJulyFifteenthTwoThousandAndFortyOneMember2026-01-012026-03-310001090012us-gaap:NoncontrollingInterestMember2025-03-310001090012us-gaap:RestrictedStockUnitsRSUMember2025-12-310001090012dvn:MarketingAndMidstreamRevenuesMembersrt:OilReservesMember2026-01-012026-03-310001090012dvn:NGLMemberdvn:OilGasAndNGLSalesMember2025-01-012025-03-310001090012dvn:MarketingAndMidstreamRevenuesMember2025-01-012025-03-310001090012dvn:FivePointZeroZeroPercentDueJuneFifteenTwoThousandAndFortyFiveMember2026-03-310001090012dvn:MarketingAndMidstreamRevenuesMember2026-01-012026-03-310001090012dvn:FivePointEightSevenFiveDueJuneFifteenTwoThousandTwentyEightMember2026-01-012026-03-310001090012dvn:NYMEXWestTexasIntermediateThreeWayPriceCollarsOilQ2Q42026Member2026-01-012026-03-310001090012us-gaap:FairValueInputsLevel2Memberus-gaap:CommodityContractMember2026-03-310001090012dvn:NYMEXWestTexasIntermediateThreeWayPriceCollarsOilQ1Q42027Member2026-03-310001090012us-gaap:CommonStockMember2025-01-012025-03-310001090012dvn:LongTermDerivativeAssetMember2026-03-310001090012us-gaap:RetainedEarningsMember2025-03-310001090012dvn:SevenPointFiveZeroPercentDueSeptemberFifteenthTwoThousandAndTwentySevenMember2026-01-012026-03-310001090012us-gaap:LineOfCreditMember2026-03-310001090012us-gaap:AdditionalPaidInCapitalMember2025-12-310001090012dvn:SevenPointFiveZeroPercentDueSeptemberFifteenthTwoThousandAndTwentySevenMember2026-03-310001090012dvn:OilGasAndNGLSalesMember2026-01-012026-03-310001090012dvn:FourPointSevenFivePercentDueMayFifteenthTwoThousandFortyTwoMember2026-01-012026-03-310001090012dvn:FivePointSixZeroPercentDueJulyFifteenthTwoThousandAndFortyOneMember2025-12-310001090012us-gaap:AccumulatedOtherComprehensiveIncomeMember2024-12-31xbrli:pureiso4217:USDutr:MMBTUutr:bblxbrli:sharesutr:MMBTUiso4217:USDxbrli:sharesiso4217:USDdvn:Customeriso4217:USDiso4217:USDutr:bbl
QUARTERLY REPORT PURSUANT TO SECTION 13 OR 15(d) OF THE SECURITIES EXCHANGE ACT OF 1934
For the quarterly period ended March 31, 2026
or
☐
TRANSITION REPORT PURSUANT TO SECTION 13 OR 15(d) OF THE SECURITIES EXCHANGE ACT OF 1934
Commission File Number 001-32318
DEVON ENERGY CORPORATION
(Exact name of registrant as specified in its charter)
Delaware
73-1567067
(State or other jurisdiction of
incorporation or organization)
(I.R.S. Employer
identification No.)
333 West Sheridan Avenue, Oklahoma City, Oklahoma
73102-5015
(Address of principal executive offices)
(Zip code)
Registrant’s telephone number, including area code: (405) 235-3611
Former name, address and former fiscal year, if changed from last report: Not applicable
Securities registered pursuant to Section 12(b) of the Act:
Title of each class
Trading Symbol
Name of each exchange on which registered
Common Stock, par value $0.10 per share
DVN
The New York Stock Exchange
Indicate by check mark whether the registrant (1) has filed all reports required to be filed by Section 13 or 15(d) of the Securities Exchange Act of 1934 during the preceding 12 months (or for such shorter period that the registrant was required to file such reports), and (2) has been subject to such filing requirements for the past 90 days. Yes ☑ No ☐
Indicate by check mark whether the registrant has submitted electronically every Interactive Data File required to be submitted pursuant to Rule 405 of Regulation S-T (§232.405 of this chapter) during the preceding 12 months (or for such shorter period that the registrant was required to submit such files). Yes ☑ No ☐
Indicate by check mark whether the registrant is a large accelerated filer, an accelerated filer, a non-accelerated filer, smaller reporting company or an emerging growth company. See the definitions of “large accelerated filer,” “accelerated filer,” “smaller reporting company,” and “emerging growth company” in Rule 12b-2 of the Exchange Act.
Large accelerated filer
☑
Accelerated filer
☐
Non-accelerated filer
☐
Smaller reporting company
☐
Emerging growth company
☐
If an emerging growth company, indicate by check mark if the registrant has elected not to use the extended transition period for complying with any new or revised financial accounting standards provided pursuant to Section 13(a) of the Exchange Act. ☐
Indicate by check mark whether the registrant is a shell company (as defined in Rule 12b-2 of the Act). Yes ☐ No ☑
On April 22, 2026, 621.4 million shares of common stock were outstanding.
Unless the context otherwise indicates, references to “us,” “we,” “our,” “ours,” “Devon,” the “Company” and “Registrant” refer to Devon Energy Corporation and its consolidated subsidiaries. All monetary values, other than per unit and per share amounts, are stated in millions of U.S. dollars unless otherwise specified. In addition, the following are other abbreviations and definitions of certain terms used within this Quarterly Report on Form 10-Q:
“ASU” means Accounting Standards Update.
“Bbl” or “Bbls” means barrel or barrels.
“Boe” means barrel of oil equivalent. Gas proved reserves and production are converted to Boe, at the pressure and temperature base standard of each respective state in which the gas is produced, at the rate of six Mcf of gas per Bbl of oil, based upon the approximate relative energy content of gas and oil. NGL proved reserves and production are converted to Boe on a one-to-one basis with oil.
“Btu” means British thermal units, a measure of heating value.
“CAMT” means Corporate Alternative Minimum Tax.
“Catalyst” means Catalyst Midstream Partners, LLC.
“CDM” means Cotton Draw Midstream, L.L.C.
“Coterra” means Coterra Energy Inc.
“DD&A” means depreciation, depletion and amortization expenses.
“EPA” means the United States Environmental Protection Agency.
“FASB” means Financial Accounting Standards Board.
“Fervo” means Fervo Energy Company.
“G&A” means general and administrative expenses.
“GAAP” means U.S. generally accepted accounting principles.
“Grayson Mill” means Grayson Mill Intermediate HoldCo II, LLC and Grayson Mill Intermediate HoldCo III, LLC.
“Inside FERC” refers to the publication Inside F.E.R.C.’s Gas Market Report.
“LOE” means lease operating expenses.
“MBbls” means thousand barrels.
“MBoe” means thousand Boe.
“Mcf” means thousand cubic feet.
“Merger” means the merger of Merger Sub with and into Coterra, Coterra continuing as the surviving corporation and a wholly-owned subsidiary of the Company, pursuant to the terms of the Merger Agreement.
“Merger Agreement” means that certain Agreement and Plan of Merger, dated February 1, 2026, by and among the Company, Merger Sub and Coterra.
“Merger Sub” means Cubs Merger Sub, Inc., a wholly-owned subsidiary of the Company.
“OPEC” means Organization of the Petroleum Exporting Countries.
“SEC” means United States Securities and Exchange Commission.
“Senior Credit Facility” means Devon’s syndicated unsecured revolving line of credit, effective as of March 24, 2023.
“SOFR” means secured overnight financing rate.
“Term Loan” means Term Loan Credit Agreement.
“TSR” means total shareholder return.
“U.S.” means United States of America.
“VIE” means variable interest entity.
“WaterBridge” means WaterBridge Infrastructure LLC and WBI Operating LLC. Any references to WaterBridge as a public company or its publicly-traded equity are to WaterBridge Infrastructure LLC individually.
This report includes “forward-looking statements” within the meaning of the federal securities laws. Such statements include those concerning strategic plans, our expectations and objectives for future operations, as well as other future events or conditions, and are often identified by use of the words and phrases “expects,” “believes,” “will,” “would,” “could,” “continue,” “may,” “aims,” “likely to be,” “intends,” “forecasts,” “projections,” “estimates,” “plans,” “expectations,” “targets,” “opportunities,” “potential,” “anticipates,” “outlook” and other similar terminology. All statements, other than statements of historical facts, included in this report that address activities, events or developments that Devon expects, believes or anticipates will or may occur in the future are forward-looking statements. Such statements are subject to a number of assumptions, risks and uncertainties, many of which are beyond our control. Consequently, actual future results could differ materially and adversely from our expectations due to a number of factors, including, but not limited to:
•
the volatility of oil, gas and NGL prices, including from changes in trade relations and policies, such as the imposition of new or increased tariffs or other trade protection measures by the U.S., China or other countries;
•
uncertainties inherent in estimating oil, gas and NGL reserves;
•
the extent to which we are successful in acquiring and discovering additional reserves;
•
the uncertainties, costs and risks involved in our operations;
•
risks related to our hedging activities;
•
our limited control over third parties who operate some of our oil and gas properties and investments;
•
midstream capacity constraints and potential interruptions in production, including from limits to the build out of midstream infrastructure;
•
competition for assets, materials, people and capital, which can be exacerbated by supply chain disruptions, including as a result of tariffs or other changes in trade policy;
•
regulatory restrictions, compliance costs and other risks relating to governmental regulation, including with respect to federal lands, environmental matters, water disposal and tax matters;
•
climate change and risks related to regulatory, social and market efforts to address climate change;
•
risks relating to our sustainability initiatives;
•
claims, audits and other proceedings impacting our business, including with respect to historic and legacy operations;
•
governmental interventions in energy markets;
•
counterparty credit risks;
•
risks relating to our indebtedness;
•
cybersecurity risks;
•
risks associated with artificial intelligence and other emerging technologies;
•
the extent to which insurance covers any losses we may experience;
•
risks related to shareholder activism;
•
our ability to successfully complete mergers, acquisitions and divestitures;
•
our ability to pay dividends and make share repurchases;
•
risks related to the Merger, including restrictions on our operations during the pendency of the Merger, litigation risk, the risk that the Merger Agreement may be terminated and the risk that we may not realize the anticipated benefits of the Merger or successfully integrate the two companies; and
•
any of the other risks and uncertainties discussed in this report, our 2025 Annual Report on Form 10-K and our other filings with the SEC.
The forward-looking statements included in this filing speak only as of the date of this report, represent management’s current reasonable expectations as of the date of this filing and are subject to the risks and uncertainties identified above as well as those described elsewhere in this report and in other documents we file from time to time with the SEC. We cannot guarantee the accuracy
of our forward-looking statements, and readers are urged to carefully review and consider the various disclosures made in this report and in other documents we file from time to time with the SEC. All subsequent written and oral forward-looking statements attributable to Devon, or persons acting on its behalf, are expressly qualified in their entirety by the cautionary statements above. We do not undertake, and expressly disclaim, any duty to update or revise our forward-looking statements based on new information, future events or otherwise.
The accompanying unaudited interim financial statements and notes of Devon have been prepared pursuant to the rules and regulations of the SEC. Pursuant to such rules and regulations, certain disclosures normally included in financial statements prepared in accordance with U.S. GAAP have been omitted. The accompanying unaudited interim financial statements and notes should be read in conjunction with the financial statements and notes included in Devon’s 2025 Annual Report on Form 10-K. The accompanying unaudited interim financial statements in this report reflect all adjustments that are, in the opinion of management, necessary for a fair statement of Devon’s results of operations and cash flows for the three-month periods ended March 31, 2026 and 2025 and Devon’s financial position as of March 31, 2026.
Variable Interest Entity
CDM was a joint venture entity formed by Devon and an affiliate of QL Capital Partners, LP (“QLCP”). Devon held a controlling interest in CDM and the portions of CDM’s net earnings and equity not attributable to Devon’s controlling interest were shown separately as noncontrolling interests in the accompanying consolidated statements of comprehensive earnings and consolidated balance sheets. CDM was considered a VIE to Devon. On August 1, 2025, Devon completed the acquisition of all outstanding noncontrolling interests in CDM for $260 million. As a result of this transaction, Devon owns 100% of the equity interests in CDM.
Disaggregation of Revenue
The following table presents revenue from contracts with customers that are disaggregated based on the type of good or service.
Three Months Ended March 31,
2026
2025
Oil
$
2,423
$
2,414
Gas
205
309
NGL
349
403
Oil, gas and NGL sales
2,977
3,126
Oil
1,001
918
Gas
254
272
NGL
276
234
Marketing and midstream revenues
1,531
1,424
Total revenues from contracts with customers
$
4,508
$
4,550
Recently Issued Accounting Standards Not Yet Adopted
In November 2024, the FASB issued ASU 2024-03, Disaggregation of Income Statement Expenses. ASU 2024-03 requires disclosures about specific types of expenses included in the expense captions presented on the face of the statement of operations as well as disclosures about selling expenses. This ASU will result in additional disclosures for Devon beginning with its 2027 annual reporting and interim periods beginning in 2028.
NOTES TO CONSOLIDATED FINANCIAL STATEMENTS – (Continued)
(Unaudited)
2.
Acquisitions and Divestitures
Pending Merger
On February 1, 2026, Devon, Coterra and Merger Sub entered into the Merger Agreement, providing for an all-stock merger of equals. Coterra is an oil and gas exploration and production company with assets in the Delaware Basin in Texas and New Mexico, Marcellus Shale in Pennsylvania and the Anadarko Basin in Oklahoma. On the closing date of the Merger, each share of Coterra common stock will be automatically converted into the right to receive 0.70 of a share of Devon common stock. No fractional shares of Devon’s common stock will be issued in the Merger, and holders of shares of Coterra common stock will instead receive cash in lieu of fractional shares of Devon common stock, if any. The Merger has been unanimously approved by the boards of directors of Devon and Coterra.
On May 4, 2026, the shareholders of Devon and Coterra each approved the Merger at their respective special meetings. The Merger is expected to close on May 7, 2026, subject to other customary closing conditions.
Asset Exchange
On April 1, 2025, Devon and BPX Energy dissolved their partnership and divided their acreage in the Eagle Ford Blackhawk field located in Texas' DeWitt County, resulting in increased operational flexibility for both parties. The assets exchanged were in close proximity and shared similar geological characteristics. The transaction was accounted for as an equal, non-monetary exchange, as it did not result in a significant change to the risks, expected future cash flows or the timing of those cash flows, and therefore was determined to lack commercial substance. As a result, the new acreage and underlying property costs were recorded at the historical cost of the assets exchanged.
Contingent Earnout Payments
Devon was entitled to contingent earnout payments associated with the sale of its Barnett Shale assets in 2020 with upside participation beginning at a $2.75 Henry Hub natural gas price or a $50 WTI oil price. The contingent payment period commenced on January 1, 2021, and had a term of four years. Devon received $20 million in contingent earnout payments related to this transaction in the first quarter of 2025.
3.
Derivative Financial Instruments
Objectives and Strategies
Devon enters into derivative financial instruments with respect to a portion of its oil, gas and NGL production to hedge future prices received. Additionally, Devon periodically enters into derivative financial instruments with respect to a portion of its oil, gas and NGL marketing activities. These commodity derivative financial instruments include financial price swaps, basis swaps and costless price collars.
Devon does not intend to hold or issue derivative financial instruments for speculative trading purposes and has elected not to designate any of its derivative instruments for hedge accounting treatment.
Counterparty Credit Risk
By using derivative financial instruments, Devon is exposed to credit risk. Credit risk is the failure of the counterparty to perform under the terms of the derivative contract. To mitigate this risk, the hedging instruments are placed with a number of counterparties whom Devon believes are acceptable credit risks. It is Devon’s policy to enter into derivative contracts only with investment-grade rated counterparties deemed by management to be competent and competitive market makers. Additionally, Devon’s derivative contracts generally contain provisions that provide for collateral payments if Devon’s or its counterparty’s credit rating falls below certain credit rating levels. As of March 31, 2026, Devon neither held cash collateral of its counterparties nor posted cash collateral to its counterparties. Given Devon's current credit ratings and the terms of the underlying contracts, Devon is not required to post collateral to its counterparties with respect to its open derivative positions, and we would not be required to post any such collateral as a result of any change to the amount of Devon's net liability for such positions.
NOTES TO CONSOLIDATED FINANCIAL STATEMENTS – (Continued)
(Unaudited)
Commodity Derivatives
As of March 31, 2026, Devon had the following open oil derivative positions. The first table presents Devon’s oil derivatives that settle against the average of the prompt month NYMEX WTI futures price. The second table presents Devon’s oil derivatives that settle against the respective indices noted within the table.
Three-Way Price Collars
Period
Volume (Bbls/d)
Weighted Average Floor Sold Price ($/Bbl)
Weighted Average Floor Purchased Price ($/Bbl)
Weighted Average Ceiling Price ($/Bbl)
Q2-Q4 2026
108,698
$
49.51
$
59.59
$
71.22
Q1-Q4 2027
37,397
$
45.78
$
55.78
$
71.89
Oil Basis Swaps
Period
Index
Volume (Bbls/d)
Weighted Average Differential to WTI ($/Bbl)
Q2-Q4 2026
Midland Sweet
46,000
$
1.10
Q2-Q4 2026
WTI/Brent
8,625
$
(5.61
)
Q2-Q4 2026
NYMEX Roll
86,051
$
1.24
Q1-Q4 2027
Magellan East Houston
20,000
$
1.77
Q1-Q4 2027
Midland Sweet
46,000
$
1.00
As of March 31, 2026, Devon had the following open natural gas derivative positions. The first table presents Devon’s natural gas derivatives that settle against the Inside FERC first of the month Henry Hub index. The second table presents Devon’s natural gas derivatives that settle against the respective indices noted within the table.
Price Swaps
Price Collars
Period
Volume (MMBtu/d)
Weighted Average Price ($/MMBtu)
Volume (MMBtu/d)
Weighted Average Floor Price ($/MMBtu)
Weighted Average Ceiling Price ($/MMBtu)
Q2-Q4 2026
247,500
$
3.80
230,000
$
3.26
$
4.90
Q1-Q4 2027
—
$
—
90,000
$
3.50
$
4.31
Natural Gas Basis Swaps
Period
Index
Volume (MMBtu/d)
Weighted Average Differential to Henry Hub ($/MMBtu)
NOTES TO CONSOLIDATED FINANCIAL STATEMENTS – (Continued)
(Unaudited)
Financial Statement Presentation
All derivative financial instruments are recognized at their current fair value as either assets or liabilities on the consolidated balance sheets. Amounts related to contracts allowed to be netted upon payment subject to a master netting arrangement with the same counterparty are reported on a net basis on the consolidated balance sheets. The table below presents a summary of these positions as of March 31, 2026 and December 31, 2025.
March 31, 2026
December 31, 2025
Gross Fair Value
Amounts Netted
Net Fair Value
Gross Fair Value
Amounts Netted
Net Fair Value
Balance Sheet Classification
Commodity derivatives:
Short-term derivative asset
$
126
$
(4
)
$
122
$
199
$
(7
)
$
192
Other current assets
Long-term derivative asset
4
—
4
2
—
2
Other long-term assets
Short-term derivative liability
(526
)
4
(522
)
(8
)
7
(1
)
Other current liabilities
Long-term derivative liability
(55
)
—
(55
)
—
—
—
Other long-term liabilities
Total derivative asset (liability)
$
(451
)
$
—
$
(451
)
$
193
$
—
$
193
4.
Share-Based Compensation
The table below presents the share-based compensation expense included in Devon’s accompanying consolidated statements of comprehensive earnings.
Three Months Ended March 31,
2026
2025
G&A
$
22
$
24
Restructuring and transaction costs
—
6
Total
$
22
$
30
Related income tax benefit
$
5
$
3
Under its approved long-term incentive plan, Devon grants share-based awards to its employees. The following table presents a summary of Devon’s unvested restricted stock awards and units and performance share units granted under the plan.
Restricted Stock Awards & Units
Performance Share Units
Awards/Units
Weighted Average Grant-Date Fair Value
Units
Weighted Average Grant-Date Fair Value
(Thousands, except fair value data)
Unvested at 12/31/25
4,653
$
40.79
1,293
$
58.82
Granted
1,931
$
43.48
439
$
61.73
Vested
(1,468
)
$
44.54
(200
)
$
81.70
Forfeited
(42
)
$
41.03
(117
)
$
81.70
Unvested at 3/31/26
5,074
$
40.73
1,415
(1)
$
54.59
(1)
A maximum of 2.8 million common shares could be awarded based upon Devon’s final TSR ranking.
NOTES TO CONSOLIDATED FINANCIAL STATEMENTS – (Continued)
(Unaudited)
The following table presents the assumptions related to the performance share units granted in 2026, as indicated in the previous summary table.
2026
Grant-date fair value
$
61.73
Risk-free interest rate
3.52
%
Volatility factor
33.80
%
Contractual term (years)
2.89
The following table presents a summary of the unrecognized compensation cost and the related weighted average recognition period associated with unvested awards and units as of March 31, 2026.
Restricted Stock
Performance
Awards/Units
Share Units
Unrecognized compensation cost
$
169
$
40
Weighted average period for recognition (years)
3.0
2.3
5.
Asset Impairments
In the first quarter of 2025, Devon rationalized two headquarters-related real estate assets, triggering assets held for sale and recording asset impairments of $254 million. Both transactions closed in the first quarter of 2025 and generated aggregate sales proceeds of $120 million.
6.
Income Taxes
The following table presents Devon’s total income tax expense and a reconciliation of its effective income tax rate to the U.S. statutory income tax rate.
Three Months Ended March 31,
2026
2025
Earnings before income taxes
$
166
$
646
Current income tax expense (benefit)
$
(188
)
$
96
Deferred income tax expense
234
41
Total income tax expense
$
46
$
137
U.S. statutory income tax rate
21
%
21
%
State income taxes
3
%
1
%
Other
4
%
(1
%)
Effective income tax rate
28
%
21
%
On February 18, 2026, the IRS issued additional interim CAMT guidance through Notice 2026-7 (“the Notice”). In addition to other provisions, the Notice includes a new Adjusted Financial Statement Income (“AFSI”) adjustment beginning in 2025 for amortization of domestic research costs, including accelerated amortization under the OBBB transition rule. Accordingly, Devon's first quarter 2026 income tax expense included a current tax benefit of approximately $218 million and a corresponding deferred tax expense associated with the deferral of income taxes resulting from the Notice.
NOTES TO CONSOLIDATED FINANCIAL STATEMENTS – (Continued)
(Unaudited)
7.
Net Earnings Per Share
The following table reconciles net earnings available to common shareholders and weighted-average common shares outstanding used in the calculations of basic and diluted net earnings per share.
Three Months Ended March 31,
2026
2025
Net earnings available to common shareholders - basic and diluted
$
120
$
494
Common shares:
Average common shares outstanding - basic
616
643
Dilutive effect of potential common shares issuable
2
2
Average common shares outstanding - diluted
618
645
Net earnings per share available to common shareholders:
Basic
$
0.19
$
0.77
Diluted
$
0.19
$
0.77
8.
Other Comprehensive Earnings (Loss)
Components of other comprehensive earnings (loss) consist of the following:
Three Months Ended March 31,
2026
2025
Pension and postretirement benefit plans:
Beginning accumulated pension and postretirement benefits
$
(122
)
$
(122
)
Recognition of net actuarial loss and prior service cost in earnings (1)
2
1
Income tax expense
(1
)
—
Accumulated other comprehensive loss, net of tax
$
(121
)
$
(121
)
(1)
Recognition of net actuarial loss and prior service cost are included in the computation of net periodic benefit cost, which is a component of other, net in the accompanying consolidated statements of comprehensive earnings.
9.
Supplemental Information to Statements of Cash Flows
Three Months Ended March 31,
2026
2025
Changes in assets and liabilities, net:
Accounts receivable
$
(462
)
$
(63
)
Other current assets
12
(35
)
Other long-term assets
(7
)
(85
)
Accounts payable and revenues and royalties payable
NOTES TO CONSOLIDATED FINANCIAL STATEMENTS – (Continued)
(Unaudited)
13.
Debt and Related Expenses
See below for a summary of debt instruments and balances. The notes, debentures and Term Loan reflected below are senior, unsecured obligations of Devon.
March 31, 2026
December 31, 2025
7.50% due September 15, 2027
$
73
$
73
5.25% due October 15, 2027
390
390
5.875% due June 15, 2028
325
325
4.50% due January 15, 2030
585
585
7.875% due September 30, 2031
675
675
7.95% due April 15, 2032
366
366
5.20% due September 15, 2034
1,250
1,250
5.60% due July 15, 2041
1,250
1,250
4.75% due May 15, 2042
750
750
5.00% due June 15, 2045
750
750
5.75% due September 15, 2054
1,000
1,000
Term Loan due September 25, 2026
1,000
1,000
Net premium on debentures and notes
21
23
Debt issuance costs
(49
)
(48
)
Total debt
$
8,386
$
8,389
Less amount classified as short-term debt
999
998
Total long-term debt
$
7,387
$
7,391
Credit Lines
Devon has a $3.0 billion revolving Senior Credit Facility. In the first quarter of 2026, Devon amended the credit agreement governing the Senior Credit Facility to, among other things, extend the maturity date from March 24, 2030 to March 24, 2031, with the option to extend the maturity date by three additional one-year periods, subject to lender consent. As of March 31, 2026, Devon had no outstanding borrowings under the Senior Credit Facility and had less than $1.0 million in outstanding letters of credit under this facility. The Senior Credit Facility contains only one material financial covenant. This covenant requires Devon's ratio of total funded debt to total capitalization, as defined in the credit agreement, to be no greater than 65%. Under the terms of the credit agreement, total capitalization is adjusted to add back non-cash financial write-downs such as impairments. As of March 31, 2026, Devon was in compliance with this covenant with a debt-to-capitalization ratio of 24.9%.
Term Loan Credit Agreement
In August 2024, Devon entered into a delayed draw term loan credit agreement (the “Term Loan Credit Agreement”), providing for delayed draw term loans in an aggregate principal amount not to exceed $2.0 billion, including a 364-day tranche of $500 million and a two-year tranche of $1.5 billion. On September 27, 2024, Devon borrowed $1.0 billion on the two-year tranche (the “Term Loan”) to partially fund the closing of the Grayson Mill acquisition. The Term Loan bears interest at a rate based on term SOFR plus a spread adjustment that varies based on Devon's credit ratings. The interest rate on the Term Loan was 5.2% as of March 31, 2026.
The Term Loan Credit Agreement contains substantially the same financial covenant as the Senior Credit Facility. As of March 31, 2026, Devon was in compliance with this covenant with a debt-to-capitalization ratio of 24.9%.
NOTES TO CONSOLIDATED FINANCIAL STATEMENTS – (Continued)
(Unaudited)
Retirement of Senior Notes
On September 15, 2025, Devon early redeemed the $485 million of 5.85% senior notes due in December 2025 pursuant to the “par-call” rights set forth in the indenture document.
Net Financing Costs
The following schedule includes the components of net financing costs.
Three Months Ended March 31,
2026
2025
Net financing costs:
Interest based on debt outstanding
$
118
$
127
Interest income
(14
)
(10
)
Other
5
6
Total net financing costs
$
109
$
123
14.
Leases
Devon’s operating lease right-of-use assets relate to real estate, drilling rigs and other equipment related to the exploration, development and production of oil and gas. As of March 31, 2026, Devon’s financing lease right-of-use assets primarily relate to equipment related to the exploration, development and production of oil and gas. During the first quarter of 2025, Devon extinguished an approximately $300 million real estate finance lease by making a cash payment of $274 million and recognized a gain on early lease extinguishment in other, net related to the difference on the accompanying consolidated statement of comprehensive earnings. For additional information, see Note 5.
The following table presents Devon’s right-of-use assets and lease liabilities as of March 31, 2026 and December 31, 2025.
March 31, 2026
December 31, 2025
Finance
Operating
Total
Finance
Operating
Total
Right-of-use assets
$
32
$
280
$
312
$
23
$
276
$
299
Lease liabilities:
Current lease liabilities (1)
$
8
$
95
$
103
$
7
$
95
$
102
Long-term lease liabilities
21
185
206
16
181
197
Total lease liabilities (2)
$
29
$
280
$
309
$
23
$
276
$
299
(1)
Current lease liabilities are included in other current liabilities on the consolidated balance sheets.
(2)
Devon has entered into certain leases of equipment related to the exploration, development and production of oil and gas that had terms not yet commenced as of March 31, 2026 and are therefore excluded from the amounts shown above.
NOTES TO CONSOLIDATED FINANCIAL STATEMENTS – (Continued)
(Unaudited)
15.
Asset Retirement Obligations
The following table presents the changes in Devon’s asset retirement obligations.
Three Months Ended March 31,
2026
2025
Asset retirement obligations as of beginning of period
$
906
$
807
Liabilities incurred
11
11
Liabilities settled and divested
(11
)
(8
)
Revision and reclassification of estimated obligation
107
55
Accretion expense on discounted obligation
14
12
Asset retirement obligations as of end of period
1,027
877
Less current portion
41
42
Asset retirement obligations, long-term
$
986
$
835
During the first quarters of 2026 and 2025, Devon increased its asset retirement obligations by approximately $107 million and $55 million, respectively, primarily due to changes in current cost estimates for its oil and gas assets.
16.
Stockholders’ Equity
Share Repurchases
Devon’s Board of Directors has authorized a $5.0 billion share repurchase program with a June 30, 2026 expiration date. Pursuant to the terms of the Merger Agreement, Devon’s share repurchase activity has been suspended and is expected to remain suspended through the completion of the Merger. The table below provides information regarding purchases of Devon’s common stock under the $5.0 billion share repurchase program (shares in thousands).
NOTES TO CONSOLIDATED FINANCIAL STATEMENTS – (Continued)
(Unaudited)
Dividends
Devon pays a quarterly dividend which can be comprised of a fixed dividend and a variable dividend. The variable dividend is dependent on quarterly cash flows, among other factors. The following table summarizes Devon’s dividends paid for the first quarter of 2026 and 2025, respectively.
Dividends
Rate Per Share
2026:
First quarter
$
155
$
0.24
2025:
First quarter
$
163
$
0.24
Noncontrolling Interests
On August 1, 2025, Devon completed the acquisition of all outstanding noncontrolling interests in CDM for $260 million. As a result of this transaction, Devon owns 100% of the equity interests in CDM. For additional information, see Note 1.
17.
Commitments and Contingencies
Devon is party to various legal actions arising in connection with its business. Matters that are probable of unfavorable outcome to Devon and which can be reasonably estimated are accrued. Such accruals are based on information known about the matters, Devon’s estimates of the outcomes of such matters and its experience in contesting, litigating and settling similar matters. None of the actions are believed by management to likely involve future amounts that would be material to Devon’s financial position or results of operations after consideration of recorded accruals. Actual amounts could differ materially from management’s estimates.
Royalty Matters
Numerous oil and natural gas producers and related parties, including Devon, have been named in various lawsuits alleging royalty underpayments. Devon is currently named as a defendant in a number of such lawsuits, including some lawsuits in which the plaintiffs seek to certify classes of similarly situated plaintiffs. Among the allegations typically asserted in these suits are claims that Devon used below-market prices, made improper deductions, paid royalty proceeds in an untimely manner without including required interest, used improper measurement techniques and entered into gas purchase and processing arrangements with affiliates that resulted in underpayment of royalties in connection with oil, natural gas and NGLs produced and sold. Devon is also involved in governmental agency proceedings and royalty audits and is subject to related contracts and regulatory controls in the ordinary course of business, some that may lead to additional royalty claims. As of March 31, 2026, Devon has accrued approximately $60 million in other current liabilities pertaining to such royalty matters.
Environmental and Climate Change Matters
Devon’s business is subject to numerous federal, state, tribal and local laws and regulations governing the discharge of materials into the environment or otherwise relating to environmental protection. Failure to comply with these laws and regulations may result in the assessment of administrative, civil and criminal fines and penalties, as well as remediation costs. Although Devon believes that it is in substantial compliance with applicable environmental laws and regulations and that continued compliance with existing requirements will not have a material adverse impact on its business, there can be no assurance that this will continue in the future.
The Company has previously received separate NOVs from the EPA alleging emissions and permitting violations relating to certain of our historic operations in North Dakota, western Texas and New Mexico, respectively. The Company has been engaging with the EPA to resolve each of these matters, and Devon is actively negotiating a draft consent decree with the EPA and the Department of Justice with respect to the North Dakota NOV matter. If finalized, the consent decree may include monetary sanctions and obligations to complete mitigation projects and implement specific injunctive relief. Given that negotiations of the draft consent decree are ongoing and the uncertainty as to the ultimate result of the North Dakota NOV matter, we are currently unable to provide an estimate of potential loss; however, the costs associated with the resolution of the North Dakota NOV matter or any of the other NOV matters could be significant in amount and may include monetary penalties.
Beginning in 2013, various parishes in Louisiana filed suit against numerous oil and gas companies, including Devon, alleging that the companies’ operations and activities in certain fields violated the State and Local Coastal Resource Management Act of 1978, as amended, and caused substantial environmental contamination, subsidence and other environmental damages to land and water bodies located in the coastal zone of Louisiana. The plaintiffs’ claims against Devon relate primarily to the operations of several of
NOTES TO CONSOLIDATED FINANCIAL STATEMENTS – (Continued)
(Unaudited)
Devon’s corporate predecessors. The plaintiffs seek, among other things, payment of the costs necessary to clear, re-vegetate and otherwise restore the allegedly impacted areas. Although Devon cannot predict the ultimate outcome of these matters, Devon denies the allegations in these lawsuits and intends to vigorously defend against these claims.
The State of Delaware has filed legal proceedings against numerous oil and gas companies, including Devon, seeking relief to abate alleged impacts of climate change. These proceedings include far-reaching claims for monetary damages and injunctive relief. Although Devon cannot predict the ultimate outcome of this matter, Devon denies the allegations asserted in this lawsuit and intends to vigorously defend against these claims.
Other Indemnifications and Legacy Matters
Pursuant to various sale agreements relating to divested businesses and assets, Devon has indemnified various purchasers against liabilities that they may incur with respect to the businesses and assets acquired from Devon. Additionally, federal, state and other laws in areas of former operations may require previous operators (including corporate successors of previous operators) to perform or make payments in certain circumstances where the current operator may no longer be able to satisfy the applicable obligation. Such obligations may include plugging and abandoning wells, removing production facilities, undertaking other restorative actions or performing requirements under surface agreements in existence at the time of disposition. For example, a predecessor entity of a Devon subsidiary previously sold certain private, state and federal oil and gas leases covering properties in shallow waters off the coast of Louisiana in the Gulf of America. These assets are generally referred to as the East Bay Field. The current operator of the East Bay Field filed for protection under Chapter 11 of the U.S. Bankruptcy Code and was unable to satisfy the eventual decommissioning obligations associated with the East Bay Field. Other companies in the chain of title of the East Bay Field have also sought bankruptcy protection and will also likely be unable to satisfy the eventual decommissioning obligations associated with the East Bay Field.
In March 2025, Devon received an order from the Department of the Interior, Bureau of Safety and Environmental Enforcement to decommission assets located on certain federal leases in the East Bay Field (the “Federal Assets”). As a result, during the first quarter of 2025, Devon recorded a contingent liability of $125 million within other liabilities in the consolidated balance sheet, reflecting the estimated costs of decommissioning the Federal Assets. The Company expects to be able to access funds available under certain bonds and a cash security account as and when Devon performs and pays these decommissioning obligations. Devon believes the funds will likely cover approximately $100 million of the estimated decommissioning costs for the Federal Assets. Accordingly, during the first quarter of 2025, Devon recorded an approximately $100 million receivable related to these sources of funds within other assets in the consolidated balance sheet. The remaining $25 million difference of the recorded decommissioning obligation and such sources of funds was recognized in the first quarter of 2025 in other, net on the consolidated statement of comprehensive earnings. Devon may also be required to perform or fund decommissioning obligations associated with the East Bay Field under state and federal regulations applicable to predecessor operators beyond amounts accrued. Factors impacting this contingency include, among others: (i) the ultimate outcome of the ongoing bankruptcy proceedings, including with respect to state lease assets included in the East Bay Field, (ii) the actual costs to decommission the Federal Assets relative to the estimates, which are subject to numerous assumptions and uncertainties, and (iii) Devon's ability to successfully access funds under decommissioning bonds and other sources.
As of March 31, 2026, Devon has accrued approximately $175 million of contingent liabilities related to such decommissioning legacy matters, including liabilities associated with the East Bay Field.
NOTES TO CONSOLIDATED FINANCIAL STATEMENTS – (Continued)
(Unaudited)
18.
Fair Value Measurements
The following table provides carrying value and fair value measurement information for certain of Devon’s financial assets and liabilities. The carrying values of cash, accounts receivable, other current receivables, accounts payable, other current payables, accrued expenses and lease liabilities included in the accompanying consolidated balance sheets approximated fair value at March 31, 2026 and December 31, 2025, as applicable. Therefore, such financial assets and liabilities are not presented in the following table.
Fair Value Measurements Using:
Carrying
Total Fair
Level 1
Level 2
Level 3
Amount
Value
Inputs
Inputs
Inputs
March 31, 2026 assets (liabilities):
Cash equivalents
$
1,021
$
1,021
$
1,021
$
—
$
—
Commodity derivatives
$
126
$
126
$
—
$
126
$
—
Commodity derivatives
$
(577
)
$
(577
)
$
—
$
(577
)
$
—
Debt
$
(8,386
)
$
(8,292
)
$
—
$
(8,292
)
$
—
December 31, 2025 assets (liabilities):
Cash equivalents
$
764
$
764
$
764
$
—
$
—
Commodity derivatives
$
194
$
194
$
—
$
194
$
—
Commodity derivatives
$
(1
)
$
(1
)
$
—
$
(1
)
$
—
Debt
$
(8,389
)
$
(8,290
)
$
—
$
(8,290
)
$
—
The following methods and assumptions were used to estimate the fair values in the table above.
Level 1 Fair Value Measurements
Cash equivalents – Amounts consist primarily of money market investments and the fair value approximates the carrying value.
Level 2 Fair Value Measurements
Commodity derivatives – The fair value of commodity derivatives is estimated using internal discounted cash flow calculations based upon forward curves and data obtained from independent third parties for contracts with similar terms or data obtained from counterparties to the agreements.
Debt – Devon’s debt instruments do not consistently trade actively in an established market. The fair values of our debt are estimated based on rates available for debt with similar terms and maturity when active trading is not available. Our variable rate debt is non-public and consists of our Term Loan. The fair value of our variable rate debt approximates the carrying value as the underlying SOFR resets every month based on the prevailing market rate.
Level 3 Fair Value Measurements
Devon had no fair value measurements using Level 3 inputs at March 31, 2026 or December 31, 2025.
NOTES TO CONSOLIDATED FINANCIAL STATEMENTS – (Continued)
(Unaudited)
19.
Reportable Segments
Devon is a leading independent energy company engaged primarily in the exploration, development and production of oil, natural gas and NGLs. Devon’s oil and gas exploration and production activities are solely focused in the U.S. For financial reporting purposes, Devon aggregates its U.S. operating segments into one reporting segment due to the similar nature of these operations.
Devon’s chief operating decision maker is the executive committee, which includes, among others, the chief executive officer, chief operating officers and chief financial officer. To assess the performance of its assets, Devon uses net earnings. Devon believes net earnings provides information useful in assessing its operating and financial performance across periods.
The following table reflects Devon’s net earnings, assets and capital expenditures for the time periods presented below.
Three Months Ended March 31,
2026
2025
Total revenues
$
3,807
$
4,452
LOE
486
479
Gathering, processing & transportation
191
204
Production and property taxes
217
229
Total significant expenses
894
912
Marketing and midstream expenses
1,547
1,436
DD&A
904
912
G&A
125
130
Financing costs, net
109
123
Income tax expense
46
137
Other segment items (1)
62
293
Total expenses
3,687
3,943
Net earnings
$
120
$
509
Total assets
$
32,543
$
30,928
Capital expenditures, including acquisitions
$
999
$
972
(1)
Other segment items included in segment net earnings are exploration expenses, asset impairments, asset dispositions, restructuring and transaction costs and other, net.
Item 2. Management’s Discussion and Analysis of Financial Condition and Results of Operations
The following discussion and analysis addresses material changes in our results of operations for the three-month period ended March 31, 2026 compared to previous periods, and in our financial condition and liquidity since December 31, 2025. For information regarding our critical accounting policies and estimates, see our 2025 Annual Report on Form 10-K under “Item 7. Management’s Discussion and Analysis of Financial Condition and Results of Operations.”
Executive Overview
We are a leading independent oil and natural gas exploration and production company whose operations are focused onshore in the United States. Our operations are currently focused in four core areas: the Delaware Basin, Rockies, Eagle Ford and Anadarko Basin. Our asset base is underpinned by premium acreage in the economic core of the Delaware Basin and our diverse, top-tier resource plays, providing a deep inventory of opportunities for years to come.
On February 1, 2026, we entered into the Merger Agreement, providing for an all-stock merger of equals with Coterra. The Merger will create a leading large-cap shale operator with an asset base anchored by a premier position in the economic core of the Delaware Basin. The Merger is expected to unlock substantial value for shareholders by leveraging enhanced scale to improve margins, increase free cash flow and accelerate cash returns through the capture of $1.0 billion in sustainable annual synergies. As a company, we remain focused on building economic value by executing on our strategic priorities of moderating production growth, emphasizing capital and operational efficiencies, optimizing reinvestment rates to maximize free cash flow, maintaining low leverage, delivering cash returns to our shareholders and pursuing operational excellence. Our recent performance highlights for these priorities include the following items for the first quarter of 2026:
•
Oil production totaled 387 MBbls/d, delivering at the top end of guidance.
•
As of March 31, 2026, completed approximately 89% of our authorized $5.0 billion share repurchase program with approximately 102 million of our common shares purchased for approximately $4.5 billion, or $43.90 per share since inception of the plan.
•
Exited with $4.8 billion of liquidity, including $1.8 billion of cash.
•
Generated $1.7 billion of operating cash flow and $6.4 billion for the trailing twelve months.
•
Paid dividends of $155 million.
•
On track to achieve 100% of our $1.0 billion optimization plan ahead of schedule.
•
Earnings attributable to Devon were $120 million, or $0.19 per diluted share.
•
Core earnings (Non-GAAP) were $641 million, or $1.04 per diluted share.
Our net earnings and operating cash flow are highly dependent upon oil, gas and NGL prices, which can be volatile due to several varying factors. As shown in the graph below, during the first quarter of 2026, commodity prices have experienced heightened volatility, driven primarily by significant geopolitical events, including conflict in the Middle East and disruptions to global oil supply, along with continued uncertainty in global trade policy and OPEC+ production decisions. As a result, our net earnings were reduced by a $0.6 billion non-cash valuation loss on our commodity derivatives.
Despite the potential negative impacts of higher inflation rates and supply chain disruptions created by these developments, we remain committed to capital discipline and delivering the objectives that underpin our current plan. Our disciplined, returns-driven strategy is designed to adapt to market fluctuations by reducing activity when necessary to maximize free cash flow generation. We will continue to prioritize value creation through moderated capital investment and production growth, particularly with a view of the volatility in commodity prices, supply chain constraints and the economic uncertainty arising from inflation and geopolitical events. Our cash-return objectives remain focused on opportunistic share repurchases, funding our dividends, repaying debt at upcoming maturities and building cash balances. To emphasize our commitment to maximizing free cash flow and creating value for shareholders, we implemented a business optimization plan early in 2025 targeting a $1.0 billion improvement in annual pre-tax cash flow. The plan included actions to achieve more efficient field-level operations and improvements in drilling and completion costs, along with enhanced operating margins and reduced corporate costs. We are on track to achieve the full $1.0 billion target ahead of our original year-end 2026 timeline.
The following graphs, discussion and analysis are intended to provide an understanding of our results of operations and current financial condition. To facilitate the review, these numbers are being presented before consideration of noncontrolling interests.
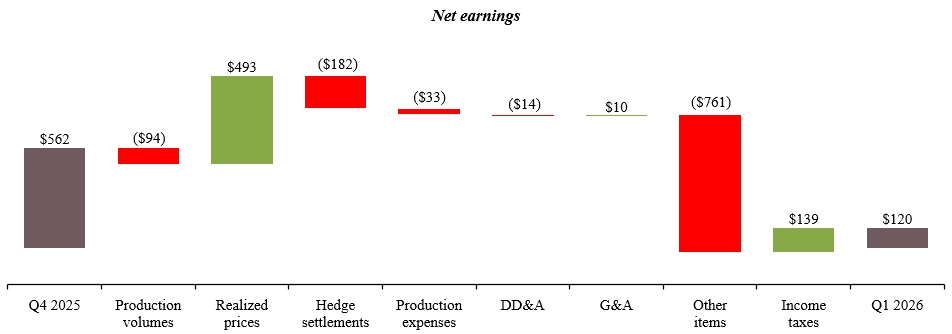
Q1 2026 vs. Q4 2025
Our first quarter 2026 and fourth quarter 2025 net earnings were $120 million and $562 million, respectively. The graph below shows the change in net earnings from the fourth quarter of 2025 to the first quarter of 2026. The material changes are further discussed by category on the following pages.
From the fourth quarter of 2025 to the first quarter of 2026, the change in volumes contributed to a $94 million decrease in earnings. The decrease in volumes was driven by natural declines and winter weather-related downtime, primarily in the Delaware Basin.
Realized Prices
Q1 2026
Realization
Q4 2025
Change
Oil (per Bbl)
WTI index
$
72.10
$
59.09
22
%
Realized price, unhedged
$
69.66
97%
$
57.19
22
%
Cash settlements
$
(1.72
)
$
2.47
Realized price, with hedges
$
67.94
94%
$
59.66
14
%
Q1 2026
Realization
Q4 2025
Change
Gas (per Mcf)
Henry Hub index
$
5.05
$
3.55
42
%
Realized price, unhedged
$
1.66
33%
$
1.33
25
%
Cash settlements
$
0.02
$
0.25
Realized price, with hedges
$
1.68
33%
$
1.58
6
%
Q1 2026
Realization
Q4 2025
Change
NGLs (per Bbl)
WTI index
$
72.10
$
59.09
22
%
Realized price, unhedged
$
17.80
25%
$
16.86
6
%
Cash settlements
$
—
$
0.23
Realized price, with hedges
$
17.80
25%
$
17.09
4
%
Q1 2026
Q4 2025
Change
Combined (per Boe)
Realized price, unhedged
$
39.70
$
32.92
21
%
Cash settlements
$
(0.76
)
$
1.60
Realized price, with hedges
$
38.94
$
34.52
13
%
From the fourth quarter of 2025 to the first quarter of 2026, realized prices contributed to a $493 million increase in earnings. Unhedged realized oil, gas and NGL prices increased primarily due to higher WTI, Henry Hub and Mont Belvieu index prices.
We currently have approximately 30% and 35% of our remaining anticipated 2026 oil and gas production hedged, respectively.
Included as a component of oil, gas and NGL derivatives on the consolidated statements of comprehensive earnings.
Cash settlements as presented in the tables above represent realized gains or losses related to the instruments described in Note 3 in “Part I. Financial Information – Item 1. Financial Statements” in this report.
Production Expenses
Q1 2026
Q4 2025
Change
LOE
$
486
$
479
1
%
Gathering, processing & transportation
191
195
-2
%
Production taxes
205
172
19
%
Property taxes
12
15
-20
%
Total
$
894
$
861
4
%
Per Boe:
LOE
$
6.48
$
6.11
6
%
Gathering, processing & transportation
$
2.54
$
2.49
2
%
Percent of oil, gas and NGL sales:
Production taxes
6.9
%
6.7
%
3
%
Production expenses increased during the first quarter of 2026 primarily due to higher production taxes resulting from an increase in WTI, Henry Hub and Mont Belvieu index prices.
Field-Level Cash Margin
The table below presents the field-level cash margin for each of our operating areas. Field-level cash margin is computed as oil, gas and NGL sales less production expenses and is not a measure defined by GAAP. A reconciliation to the comparable GAAP measures is found in “Non-GAAP Measures” in this Item 2. The changes in production volumes, realized prices and production expenses, shown above, had the following impact on our field-level cash margins by asset.
Q1 2026
$ per BOE
Q4 2025
$ per BOE
Field-level cash margin (Non-GAAP)
Delaware Basin
$
1,253
$
27.77
$
1,083
$
22.60
Rockies
451
$
26.80
341
$
19.32
Eagle Ford
238
$
40.18
177
$
33.51
Anadarko Basin
129
$
19.18
106
$
15.02
Other
12
N/M
10
N/M
Total
$
2,083
$
27.78
$
1,717
$
21.93
DD&A
Q1 2026
Q4 2025
Change
Oil and gas per Boe
$
11.71
$
10.85
8
%
Oil and gas
$
878
$
850
3
%
Other property and equipment
26
40
-35
%
Total DD&A
$
904
$
890
2
%
DD&A increased in the first quarter of 2026 primarily due to an increase in the oil and gas DD&A rate. The largest contributor to the higher rate was our 2025 drilling and development activity.
Included as a component of oil, gas and NGL derivatives on the consolidated statements of comprehensive earnings.
We recognize fair value changes on our oil, gas and NGL derivative instruments in each reporting period. The changes in fair value resulted from new positions and settlements that occurred during each period, as well as the relationship between contract prices and the associated forward curves. For additional information, see Note 3 in “Part I. Financial Information – Item 1. Financial Statements” in this report.
In the first quarter of 2026, we incurred transaction costs of approximately $19 million, which included various legal, advisory and other consulting costs associated with the Merger.
Income Taxes
Q1 2026
Q4 2025
Current expense (benefit)
$
(188
)
$
23
Deferred expense
234
162
Total expense
$
46
$
185
Current tax rate
-114
%
3
%
Deferred tax rate
142
%
22
%
Effective income tax rate
28
%
25
%
For discussion on income taxes, see Note 6 in “Part I. Financial Information – Item 1. Financial Statements” in this report.
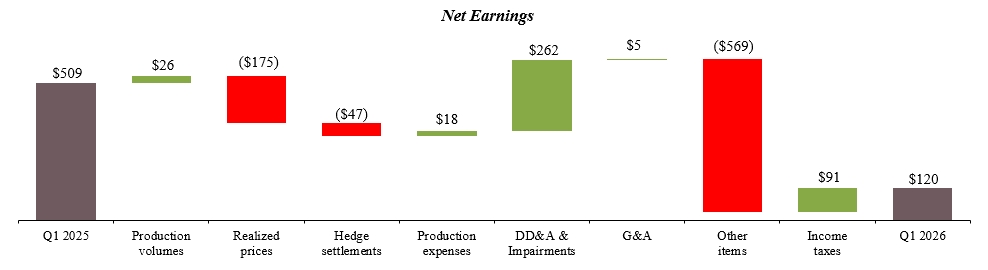
Our first quarter 2026 and first quarter 2025 net earnings were $120 million and $509 million, respectively. The graph below shows the change in net earnings from the first quarter of 2025 to the first quarter of 2026. The material changes are further discussed by category on the following pages.
Production Volumes
Q1 2026
% of Total
Q1 2025
Change
Oil (MBbls/d)
Delaware Basin
225
58
%
216
4
%
Rockies
103
27
%
112
-8
%
Eagle Ford
43
11
%
45
-5
%
Anadarko Basin
12
3
%
11
5
%
Other
4
1
%
4
N/M
Total
387
100
%
388
0
%
Q1 2026
% of Total
Q1 2025
Change
Gas (MMcf/d)
Delaware Basin
831
60
%
744
12
%
Rockies
230
17
%
233
-1
%
Eagle Ford
76
6
%
117
-35
%
Anadarko Basin
235
17
%
252
-6
%
Other
1
0
%
—
N/M
Total
1,373
100
%
1,346
2
%
Q1 2026
% of Total
Q1 2025
Change
NGLs (MBbls/d)
Delaware Basin
137
63
%
118
16
%
Rockies
46
21
%
44
3
%
Eagle Ford
11
5
%
15
-29
%
Anadarko Basin
24
11
%
26
-8
%
Other
—
0
%
—
N/M
Total
218
100
%
203
7
%
Q1 2026
% of Total
Q1 2025
Change
Combined (MBoe/d)
Delaware Basin
501
60
%
458
9
%
Rockies
187
23
%
195
-4
%
Eagle Ford
66
8
%
79
-17
%
Anadarko Basin
75
9
%
79
-5
%
Other
4
0
%
4
N/M
Total
833
100
%
815
2
%
From the first quarter of 2025 to the first quarter of 2026, the change in volumes contributed to a $26 million increase in earnings. Volumes increased primarily due to new well activity in the Delaware Basin.
From the first quarter of 2025 to the first quarter of 2026, realized prices contributed to a $175 million decrease in earnings. This decrease was primarily due to lower unhedged realized gas and NGL prices. This decrease was partially offset by an increase in unhedged realized oil prices. Realized prices were also negatively impacted by oil hedge cash settlements.
Hedge Settlements
Q1 2026
Q1 2025
Change
Oil
$
(60
)
$
—
N/M
Natural gas
3
(8
)
138
%
NGL
—
(2
)
N/M
Total cash settlements (1)
$
(57
)
$
(10
)
-470
%
(1)
Included as a component of oil, gas and NGL derivatives on the consolidated statements of comprehensive earnings.
Cash settlements as presented in the tables above represent realized gains or losses related to the instruments described in Note 3 in “Part I. Financial Information – Item 1. Financial Statements” in this report.
The table below presents the field-level cash margin for each of our operating areas. Field-level cash margin is computed as oil, gas and NGL sales less production expenses and is not a measure defined by GAAP. A reconciliation to the comparable GAAP measures is found in “Non-GAAP Measures” in this Item 2. The changes in production volumes, realized prices and production expenses, shown above, had the following impact on our field-level cash margins by asset.
Q1 2026
$ per BOE
Q1 2025
$ per BOE
Field-level cash margin (Non-GAAP)
Delaware Basin
$
1,253
$
27.77
$
1,283
$
31.13
Rockies
451
$
26.80
509
$
29.01
Eagle Ford
238
$
40.18
270
$
37.98
Anadarko Basin
129
$
19.18
136
$
19.13
Other
12
N/M
16
N/M
Total
$
2,083
$
27.78
$
2,214
$
30.16
DD&A and Asset Impairments
Q1 2026
Q1 2025
Change
Oil and gas per Boe
$
11.71
$
12.07
-3
%
Oil and gas
$
878
$
886
-1
%
Other property and equipment
26
26
0
%
Total DD&A
$
904
$
912
-1
%
Asset impairments
$
—
$
254
N/M
In the first quarter of 2025, Devon rationalized two headquarters-related real estate assets resulting in total asset impairments of $254 million. See Note 5 in "Part I. Financial Information – Item 1. Financial Statements" of this report for further discussion.
Included as a component of oil, gas and NGL derivatives on the consolidated statements of comprehensive earnings.
We recognize fair value changes on our oil, gas and NGL derivative instruments in each reporting period. The changes in fair value resulted from new positions and settlements that occurred during each period, as well as the relationship between contract prices and the associated forward curves. For additional information, see Note 3 in “Part I. Financial Information – Item 1. Financial Statements” in this report.
Income Taxes
Q1 2026
Q1 2025
Current expense
$
(188
)
$
96
Deferred expense
234
41
Total expense
$
46
$
137
Current tax rate
-114
%
15
%
Deferred tax rate
142
%
6
%
Effective income tax rate
28
%
21
%
For information on income taxes, see Note 6 in “Part I. Financial Information – Item 1. Financial Statements” in this report.
The following table presents the major changes in cash and cash equivalents for the three months ended March 31, 2026 and 2025.
Three Months Ended March 31,
2026
2025
Operating cash flow
$
1,655
$
1,942
Capital expenditures
(839
)
(934
)
Acquisitions of property and equipment
(190
)
(8
)
Divestitures of property, equipment and investments
2
133
Investment activity, net
7
7
Repurchases of common stock
(69
)
(301
)
Common stock dividends
(155
)
(163
)
Noncontrolling interest activity, net
—
5
Repayment of finance leases
(3
)
(274
)
Other
(27
)
(19
)
Net change in cash, cash equivalents and restricted cash
$
381
$
388
Cash, cash equivalents and restricted cash at end of period
$
1,815
$
1,234
Operating Cash Flow
As presented in the table above, net cash provided by operating activities continued to be a significant source of capital and liquidity. Operating cash flow funded our capital expenditures, and we continued to return value to our shareholders by utilizing cash flow and cash balances for share repurchases and dividends.
Capital Expenditures
The amounts in the table below reflect cash payments for capital expenditures, including cash paid for capital expenditures incurred in prior periods.
Three Months Ended March 31,
2026
2025
Delaware Basin
$
449
$
468
Rockies
223
222
Eagle Ford
116
151
Anadarko Basin
29
45
Other
1
1
Total oil and gas
818
887
Midstream
16
32
Other
5
15
Total capital expenditures
$
839
$
934
Capital expenditures consist primarily of amounts related to our oil and gas exploration and development operations, midstream operations and other corporate activities. Our capital investment program is driven by a disciplined allocation process focused on moderating our production growth and maximizing our returns. As such, our capital expenditures for the first three months of 2026 represented approximately 51% of our operating cash flow.
Acquisitions of Property and Equipment
During the first three months of 2026, we completed acquisitions of property primarily related to state and federal land sales in the Delaware Basin.
During the first three months of 2025, we generated $133 million in proceeds primarily from the sale of headquarters-related real estate assets as part of our real estate rationalization initiatives. For additional information, see Note 5 in “Part I. Financial Information – Item 1. Financial Statements” in this report.
Investment Activity
During the first three months of 2026 and 2025, we received distributions from our investments of $9 million and $9 million, respectively. We contributed $2 million and $2 million to our investments during the first three months of 2026 and 2025, respectively.
Shareholder Distributions and Stock Activity
We repurchased approximately 1.9 million shares of common stock for $69 million and approximately 8.5 million shares of common stock for $301 million under the share repurchase program authorized by our Board of Directors in the first three months of 2026 and 2025, respectively. For additional information, see Note 16 in “Part I. Financial Information – Item 1. Financial Statements” in this report.
The following table summarizes our common stock dividends during the first quarter of 2026 and 2025.
Dividends
Rate Per Share
2026:
First quarter
$
155
$
0.24
2025:
First quarter
$
163
$
0.24
Noncontrolling Interest Activity, net
On August 1, 2025, Devon completed the acquisition of all outstanding noncontrolling interests in CDM for $260 million. Accordingly, all future net income and cash flows from CDM are fully attributable to Devon and there will be no further distributions to or contributions from noncontrolling interest holders.
During the first three months of 2025, we distributed $9 million to our noncontrolling interests in CDM. During the first three months of 2025, we received $14 million in contributions from our noncontrolling interests.
Repayment of Finance Lease
During the first three months of 2025, we paid $274 million in cash to extinguish a finance lease related to a headquarters-related real estate asset as part of our real estate rationalization initiatives. For additional information, see Note 14 in “Part I. Financial Information – Item 1. Financial Statements” in this report.
The business of exploring for, developing and producing oil and natural gas is capital intensive. Because oil, natural gas and NGL reserves are a depleting resource, we, like all upstream operators, must continually make capital investments to grow and even sustain production. Generally, our capital investments are focused on drilling and completing new wells and maintaining production from existing wells. At opportunistic times, we also acquire operations and properties from other operators or landowners to enhance our existing portfolio of assets.
To emphasize our commitment to maximizing free cash flow and creating value for shareholders, we implemented a business optimization plan targeting a $1.0 billion improvement in annual pre-tax cash flow. The optimization initiatives were primarily focused on capital efficiencies, production optimization, commercial opportunities and corporate cost reductions. We are on track to achieve 100% of our $1.0 billion optimization plan ahead of our original year-end 2026 timeline.
Historically, our primary sources of capital funding and liquidity have been our operating cash flow and cash on hand. Additionally, we maintain a commercial paper program, supported by our revolving line of credit, which can be accessed as needed to supplement operating cash flow and cash balances. If needed, we can also issue debt and equity securities, including through transactions under our shelf registration statement filed with the SEC. We estimate the combination of our sources of capital will continue to be adequate to fund our planned capital requirements, as discussed in this section, as well as execute our cash-return business model.
Strategic Merger of Equals
On February 1, 2026, Devon and Coterra entered into the Merger Agreement to combine in an all-stock merger of equals transaction expected to close on May 7, 2026. The strategic combination is expected to unlock substantial value for shareholders by leveraging enhanced scale to improve margins, increase free cash flow and accelerate cash returns through the capture of $1.0 billion in sustainable annual synergies. Following the Merger and subject to the approval of the board of directors of the combined company, we expect to enhance cash returns to shareholders through a planned quarterly dividend of $0.315 per share and a new share repurchase authorization exceeding $5 billion.
Operating Cash Flow
Key inputs into determining our planned capital investment are the amount of cash we hold and operating cash flow we expect to generate over the next one to three or more years. At the end of the first quarter of 2026, we held approximately $1.8 billion of cash. Our operating cash flow forecasts are sensitive to many variables and include a measure of uncertainty as actual results may differ from our expectations.
Commodity Prices – The most uncertain and volatile variables for our operating cash flow are the prices of the oil, gas and NGLs we produce and sell. Prices are determined primarily by prevailing market conditions. Regional and worldwide economic uncertainty arising from geopolitical events, including conflict in the Middle East and related disruptions to global oil supply, weather, changes in public policy and other highly variable factors influence market conditions for these products. These factors, which are difficult to predict, create volatility in prices and are beyond our control.
To mitigate some of the risk inherent in prices, we utilize various derivative financial instruments to protect a portion of our production against downside price risk. The key terms to our oil, gas and NGL derivative financial instruments as of March 31, 2026 are presented in Note 3 in “Part I. Financial Information – Item 1. Financial Statements” of this report.
Further, when considering the current commodity price environment and our current hedge position, we expect to achieve our capital investment priorities. We remain committed to capital discipline and focused on delivering the objectives that underpin our capital plan for 2026.
Operating Expenses – Commodity prices can also affect our operating cash flow through an indirect effect on operating expenses. Significant commodity price decreases can lead to a decrease in drilling and development activities. As a result, the demand and cost for people, services, equipment and materials may also decrease, causing a positive impact on our cash flow as the prices paid for services and equipment decline. However, the inverse is also generally true during periods of rising commodity prices.
Additionally, the economic uncertainty arising from geopolitical events, including conflict in the Middle East and related disruptions to global oil supply, as well as evolving U.S. trade policies and tariff actions, may contribute to higher inflation rates and disrupt supply chains, negatively impacting our cash flow. While we actively work to mitigate the impact of these potential risks
through operational efficiencies gained from the scale of our operations, as well as by leveraging long-standing relationships with our suppliers, the ultimate impacts remain uncertain.
Credit Losses – Our operating cash flow is also exposed to credit risk in a variety of ways. This includes the credit risk related to customers who purchase our oil, gas and NGL production, the collection of receivables from our joint interest owners for their proportionate share of expenditures made on projects we operate and counterparties to our derivative financial contracts. We utilize a variety of mechanisms to limit our exposure to the credit risks of our customers, joint interest owners and counterparties. Such mechanisms include, under certain conditions, requiring letters of credit, prepayments or cash collateral postings.
Credit Availability
As of March 31, 2026, we had approximately $3.0 billion of available borrowing capacity under our Senior Credit Facility. This credit facility supports our $3.0 billion of short-term credit under our commercial paper program. At March 31, 2026, there were no borrowings under our commercial paper program, and we were in compliance with the Senior Credit Facility’s financial covenant.
Debt Ratings
We receive debt ratings from the major ratings agencies in the U.S. In determining our debt ratings, the agencies consider a number of qualitative and quantitative items including, but not limited to, commodity pricing levels, our liquidity, asset quality, reserve mix, debt levels, cost structure, planned asset sales and the size and scale of our production. Our credit rating from Standard and Poor’s Financial Services is BBB with a positive outlook. Our credit rating from Fitch is BBB+ with a positive outlook. Our credit rating from Moody’s Investor Service is Baa2 with a positive outlook. Any rating downgrades may result in additional letters of credit or cash collateral being posted under certain contractual arrangements.
There are no “rating triggers” in any of our contractual debt obligations that would accelerate scheduled maturities should our debt rating fall below a specified level. However, a downgrade could adversely impact our interest rate on our Term Loan or any credit facility borrowings and the ability to economically access debt markets in the future.
Cash Returns to Shareholders
We are committed to returning cash to shareholders through dividends and share repurchases. Our Board of Directors will consider a number of factors when setting the quarterly dividend, if any, including a general target of paying out approximately 10% of operating cash flow through the fixed dividend. In addition to the fixed quarterly dividend, we may pay a variable dividend or complete share repurchases. The declaration and payment of any future dividend, whether fixed or variable, will remain at the full discretion of our Board of Directors and will depend on our financial results, cash requirements, future prospects and other factors deemed relevant by the Board.
Our Board of Directors has authorized a $5.0 billion share repurchase program that expires on June 30, 2026. Through April 2026, we had executed $4.5 billion of the authorized program. Pursuant to the terms of the Merger Agreement, our share repurchase activity has been suspended and is expected to remain suspended through the completion of the Merger.
Capital Expenditures
Our capital expenditures budget for the remainder of 2026 is expected to be consistent with our current operating plans, exclusive of merger-related impacts. Our capital expenditures budget reflecting the combined company will be finalized and communicated following the close of the Merger.
Tax Contingencies
As we are regularly audited by tax authorities, we have and will continue to have our tax positions challenged. Certain tax authorities require material cash deposits be made to further dispute and respond to any of our challenged tax positions. The Canada Revenue Agency (“CRA”) proposed several material adjustments to prior tax years relating to our legacy Canadian business. We have been engaging with the CRA to resolve these matters, but, based on recent communications, we expect the CRA to make formal assessments for such adjustments. We disagree with the proposed adjustments and intend to vigorously contest any related assessments, which may require us to make material cash deposits while the matters are being resolved.
The amount of income taxes recorded requires interpretations of complex rules and regulations of federal, state, provincial and foreign tax jurisdictions. We recognize current tax expense based on estimated taxable income for the current period and the applicable statutory tax rates. We routinely assess potential uncertain tax positions and, if required, estimate and establish accruals for such amounts. We have recognized deferred tax assets and liabilities for temporary differences, operating losses and other tax carryforwards. We routinely assess our deferred tax assets and reduce such assets by a valuation allowance if we deem it is more likely than not that some portion or all of the deferred tax assets will not be realized.
On July 4, 2025, OBBB was signed into law. In addition to other provisions, OBBB includes permanent reinstatement of 100% bonus depreciation and the expensing of domestic research costs beginning in 2025 and allows for deduction of intangible drilling costs as part of the computation of the CAMT beginning in 2026. On February 18, 2026, the IRS issued additional interim CAMT guidance through Notice 2026-7. In addition to other provisions, the Notice includes a new AFSI adjustment beginning in 2025 for amortization of domestic research costs, including accelerated amortization under the OBBB transition rule, the impact of which was recorded in the first quarter of 2026. We continue to monitor for additional OBBB guidance.
Further, in the event we were to undergo an “ownership change” (as defined in Section 382 of the Internal Revenue Code of 1986, as amended), our ability to use net operating losses and tax credits generated prior to the ownership change may be limited. Generally, an “ownership change” occurs if one or more shareholders, each of whom owns five percent or more in value of a corporation’s stock, increase their aggregate percentage ownership by more than 50 percent over the lowest percentage of stock owned by those shareholders at any time during the preceding three-year period. Based on currently available information, we do not believe an ownership change has occurred during first quarter 2026 for Devon.
For additional information regarding our critical accounting policies and estimates, see our 2025 Annual Report on Form 10-K.
We utilize “core earnings attributable to Devon” and “core earnings per share attributable to Devon” that are not required by or presented in accordance with GAAP. These non-GAAP measures are not alternatives to GAAP measures and should not be considered in isolation or as a substitute for analysis of our results reported under GAAP. Core earnings attributable to Devon, as well as the per share amount, represent net earnings excluding certain non-cash and other items that are typically excluded by securities analysts in their published estimates of our financial results. Our non-GAAP measures are typically used as a quarterly performance measure. Amounts excluded relate to asset dispositions, non-cash asset impairments (including unproved asset impairments), fair value changes in derivative financial instruments and restructuring and transaction costs.
We believe these non-GAAP measures facilitate comparisons of our performance to earnings estimates published by securities analysts. We also believe these non-GAAP measures can facilitate comparisons of our performance between periods and to the performance of our peers.
Below are reconciliations of core earnings and core earnings per share attributable to Devon to comparable GAAP measures.
To assess the performance of our assets, we use EBITDAX and Field-Level Cash Margin. We compute EBITDAX as net earnings before income tax expense; financing costs, net; exploration expenses; DD&A; asset impairments; asset disposition gains and losses; non-cash share-based compensation; non-cash valuation changes for derivatives and financial instruments; restructuring and transaction costs; accretion on discounted liabilities; and other items not related to our normal operations. Field-Level Cash Margin is computed as oil, gas and NGL sales less production expenses. Production expenses consist of lease operating, gathering, processing and transportation expenses, as well as production and property taxes.
We exclude financing costs from EBITDAX to assess our operating results without regard to our financing methods or capital structure. Exploration expenses and asset disposition gains and losses are excluded from EBITDAX because they generally are not indicators of operating efficiency for a given reporting period. DD&A and impairments are excluded from EBITDAX because capital expenditures are evaluated at the time capital costs are incurred. We exclude share-based compensation, valuation changes, restructuring and transaction costs, accretion on discounted liabilities and other items from EBITDAX because they are not considered a measure of asset operating performance.
We believe EBITDAX and Field-Level Cash Margin provide information useful in assessing our operating and financial performance across periods. EBITDAX and Field-Level Cash Margin as defined by Devon may not be comparable to similarly titled measures used by other companies and should be considered in conjunction with net earnings from operations.
Below are reconciliations of net earnings to EBITDAX and a further reconciliation to Field-Level Cash Margin.
Three Months Ended March 31,
2026
2025
Net earnings (GAAP)
$
120
$
509
Financing costs, net
109
123
Income tax expense
46
137
Exploration expenses
25
10
Depreciation, depletion and amortization
904
912
Asset impairments
—
254
Asset dispositions
1
2
Share-based compensation
22
24
Derivative and financial instrument non-cash valuation changes
644
88
Restructuring and transaction costs
19
18
Accretion on discounted liabilities and other
17
9
EBITDAX (Non-GAAP)
1,907
2,086
Marketing and midstream revenues and expenses, net
Item 3. Quantitative and Qualitative Disclosures About Market Risk
Commodity Price Risk
As of March 31, 2026, we have commodity derivatives that pertain to a portion of our estimated production for the last nine months of 2026, as well as for 2027. The key terms to our open oil, gas and NGL derivative financial instruments are presented in Note 3 in “Part I. Financial Information – Item 1. Financial Statements” in this report.
The fair values of our commodity derivatives are largely determined by the forward curves of the relevant price indices. At March 31, 2026, a 10% change in the forward curves associated with our commodity derivative instruments would have changed our net positions by approximately $300 million.
Interest Rate Risk
At March 31, 2026, we had total debt of $8.4 billion. Of this debt, $7.4 billion was comprised of debentures and notes that have fixed interest rates which averaged 5.7%. We also have a $1.0 billion Term Loan which has a variable interest rate that is adjusted monthly. The interest rate on the Term Loan was 5.2% at March 31, 2026.
Item 4. Controls and Procedures
Disclosure Controls and Procedures
We have established disclosure controls and procedures to ensure that material information relating to Devon, including its consolidated subsidiaries, is made known to the officers who certify Devon’s financial reports and to other members of senior management and the Board of Directors.
Based on their evaluation, our principal executive and principal financial officers have concluded that our disclosure controls and procedures (as defined in Rules 13a-15(e) and 15d-15(e) under the Securities Exchange Act of 1934) were effective as of March 31, 2026 to ensure that the information required to be disclosed by Devon in the reports that it files or submits under the Securities Exchange Act of 1934 is recorded, processed, summarized and reported within the time periods specified in the SEC rules and forms.
Changes in Internal Control Over Financial Reporting
On January 1, 2026, Devon completed the implementation of an upgraded enterprise resource planning software. As a result of this implementation, corresponding changes to our business processes and information systems have been made, updating applicable internal controls over financial reporting where necessary.
Except as described above, there were no other changes in our internal control over financial reporting that occurred during our most recent fiscal quarter that have materially affected, or are reasonably likely to materially affect, our internal control over financial reporting.
We are involved in various legal proceedings incidental to our business. However, to our knowledge as of the date of this report and subject to the environmental matters noted in Part I, Item 3. Legal Proceedings of our 2025 Annual Report on Form 10-K, there were no material pending legal proceedings to which we are a party or to which any of our property is subject. For more information on our legal contingencies, see Note 17 in “Part I. Financial Information – Item 1. Financial Statements” of this report.
Devon has elected to use a $1 million threshold for disclosing certain proceedings arising under federal, state or local environmental laws when a governmental authority is a party. Devon believes proceedings under this threshold are not material to Devon’s business, financial condition and results of operations.
There have been no material changes to the information included in Item 1A. “Risk Factors” in our 2025 Annual Report on Form 10-K.
Item 2. Unregistered Sales of Equity Securities and Use of Proceeds
The following table provides information regarding purchases of our common stock that were made by us during the first quarter of 2026 (shares in thousands).
Period
Total Number of Shares Purchased (1)
Average Price Paid per Share
Total Number of Shares Purchased as Part of Publicly Announced Plans or Programs (2)
Maximum Dollar Value of Shares that May Yet Be Purchased Under the Plans or Programs (2)
January 1 - January 31
1,851
$
37.39
1,850
$
538
February 1 - February 28
577
$
43.48
—
$
538
March 1 - March 31
2
$
43.76
—
$
538
Total
2,430
$
38.84
1,850
(1)
In addition to shares purchased under the share repurchase program described below, these amounts include approximately 0.6 million shares received by us from employees for the payment of personal income tax withholdings on vesting transactions.
(2)
On November 2, 2021, we announced a $1.0 billion share repurchase program that would expire on December 31, 2022. Through subsequent approvals, including most recently in July 2024, Devon's Board of Directors expanded the share repurchase program authorization to $5.0 billion, with a June 30, 2026 expiration date. In the first quarter of 2026, we repurchased 1.9 million common shares for $69 million, or $37.39 per share, under this share repurchase program. For additional information, see Note 16 in “Part I. Financial Information – Item 1. Financial Statements” in this report.
Item 3. Defaults Upon Senior Securities
Not applicable.
Item 4. Mine Safety Disclosures
Not applicable.
Item 5. Other Information
During the three months ended March 31, 2026, none of the Company's directors or officers (as defined in Rule 16a-1(f) of the Securities Exchange Act of 1934) adopted, terminated or modified a Rule 10b5-1 trading arrangement or non-Rule 10b5-1 trading arrangement (as such terms are defined in Item 408 of Regulation S-K).
Inline XBRL Instance Document – the XBRL Instance Document does not appear in the Interactive Data File because its XBRL tags are embedded within the Inline XBRL document.
101.SCH
Inline XBRL Taxonomy Extension Schema with Embedded Linkbase Documents.
104
Cover Page Interactive Data File (formatted as Inline XBRL and contained in Exhibit 101).
SIGNATURES
Pursuant to the requirements of the Securities Exchange Act of 1934, the registrant has duly caused this report to be signed on its behalf by the undersigned thereunto duly authorized.