FY2026 Second Quarter Financial Results Toyota Motor Corporation CENTURY November 5, 2025
Cautionary Statement with Respect to Forward-Looking Statements and Caution Concerning Insider Trading This presentation contains forward-looking statements that reflect the plans and expectations of Toyota Motor Corporation and its consolidated subsidiaries (“Toyota”). These forward-looking statements are not guarantees of future performance and involve known and unknown risks, uncertainties and other factors that may cause Toyota’s actual results, performance, achievements or financial position to be materially different from any future results, performance, achievements or financial position expressed or implied by these forward-looking statements. These factors include, but are not limited to: (i) changes in economic conditions, market demand, and the competitive environment affecting the automotive markets in Japan, North America, Europe, Asia and other markets in which Toyota operates; (ii) fluctuations in currency exchange rates (particularly with respect to the value of the Japanese yen, the U.S. dollar, the euro, the Australian dollar, the Canadian dollar and the British pound), stock prices and interest rates; (iii) changes in funding environment in financial markets and increased competition in the financial services industry; (iv) Toyota’s ability to market and distribute effectively; (v) Toyota’s ability to realize production efficiencies and to implement capital expenditures at the levels and times planned by management;(vi) changes in the laws and regulations, as well as other government actions, in the markets in which Toyota operates that affect Toyota’s operations, particularly laws, regulations and government actions relating to vehicle safety including remedial measures such as recalls, environmental protection, vehicle emissions and vehicle fuel economy, and tariffs and other trade policies, as well as current and future litigation and other legal proceedings, government proceedings and investigations; (vii) political and economic instability in the markets in which Toyota operates; (viii) Toyota’s ability to timely develop and achieve market acceptance of new products that meet customer demand; (ix) any damage to Toyota’s brand image; (x) Toyota’s reliance on various suppliers for the provision of supplies; (xi) increases in prices of raw materials; (xii) Toyota’s reliance on various digital and information technologies, as well as information security; (xiii) fuel shortages or interruptions in electricity, transportation systems, labor strikes, work stoppages or other interruptions to, or difficulties in, the employment of labor in the major markets where Toyota purchases materials, components and supplies for the production of its products or where its products are produced, distributed or sold; (xiv) the impact of natural calamities, epidemics, political and economic instability, fuel shortages or interruptions in social infrastructure, wars, terrorism and labor strikes, including their negative effect on Toyota’s vehicle production and sales; (xv) the impact of climate change and the transition towards a low-carbon economy; and (xvi) the ability of Toyota to hire or retain sufficient human resources. A discussion of these and other factors which may affect Toyota’s actual results, performance, achievements or financial position is contained in Toyota Motor Corporation’s annual report on Form 20-F, which is on file with the United States Securities and Exchange Commission. Caution concerning Insider Trading Under Japanese securities laws and regulations (the Regulations ), subject to certain exceptions, any person who receives certain material information relating to the business, etc. of Toyota which may be contained in this document is prohibited from trading in Toyota's shares or certain other transactions related to such shares (as set forth in the Regulations) until such material information is deemed to be made public. Under the Regulations, material information is deemed to be made public when (i) such material information is notified to a stock exchange and is disclosed by ways of electromagnetic means as prescribed by the ordinance of the Cabinet Office (posting on the TDnet (Timely Disclosure Network) information service) or (ii) twelve (12) hours have elapsed since a listed company, such as Toyota, disclosed such material information to at least two (2) media sources as prescribed by the Regulations. 2
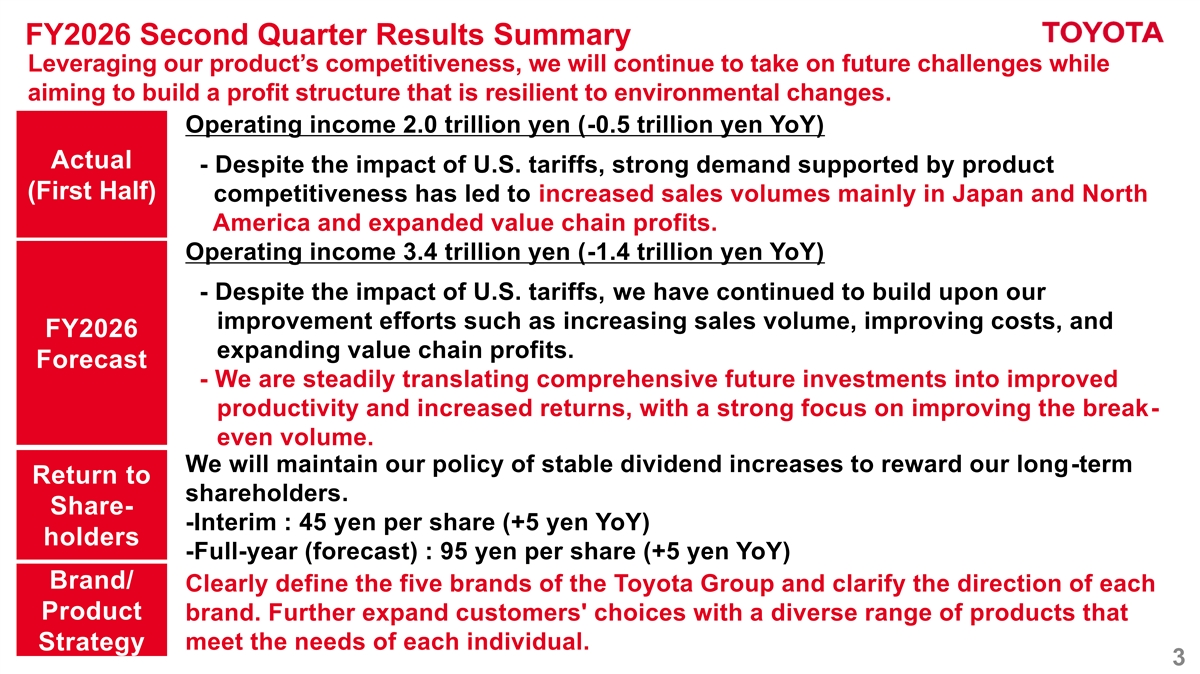
FY2026 Second Quarter Results Summary Leveraging our product’s competitiveness, we will continue to take on future challenges while aiming to build a profit structure that is resilient to environmental changes. Operating income 2.0 trillion yen (-0.5 trillion yen YoY) Actual - Despite the impact of U.S. tariffs, strong demand supported by product (First Half) competitiveness has led to increased sales volumes mainly in Japan and North America and expanded value chain profits. Operating income 3.4 trillion yen (-1.4 trillion yen YoY) - Despite the impact of U.S. tariffs, we have continued to build upon our improvement efforts such as increasing sales volume, improving costs, and FY2026 expanding value chain profits. Forecast - We are steadily translating comprehensive future investments into improved productivity and increased returns, with a strong focus on improving the break- even volume. We will maintain our policy of stable dividend increases to reward our long-term Return to shareholders. Share- -Interim : 45 yen per share (+5 yen YoY) holders -Full-year (forecast) : 95 yen per share (+5 yen YoY) Brand/ Clearly define the five brands of the Toyota Group and clarify the direction of each Product brand. Further expand customers' choices with a diverse range of products that meet the needs of each individual. Strategy 3
FY2026 Second Quarter Financial Performance 4
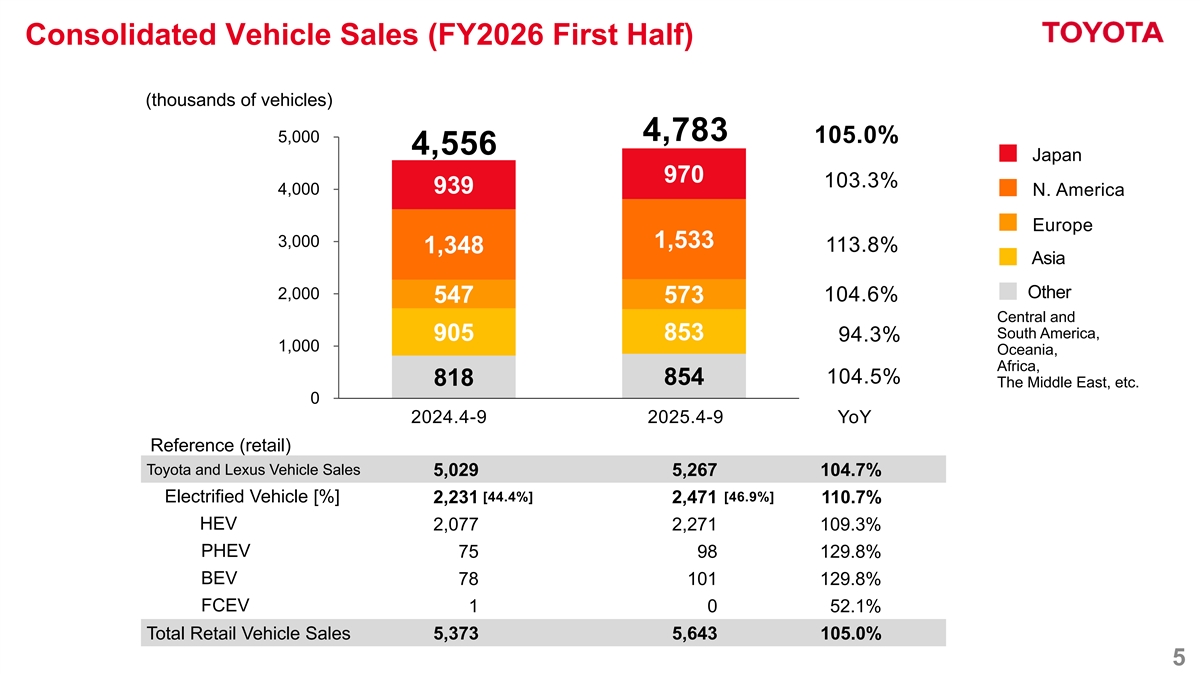
Consolidated Vehicle Sales (FY2026 First Half) (thousands of vehicles) 4,783 5,000 105.0% 4,556 Japan 970 103.3% 939 4,000 N. America Europe 3,000 1,533 113.8% 1,348 Asia Other 2,000 104.6% 547 573 Central and South America, 853 905 94.3% 1,000 Oceania, Africa, 104.5% 854 818 The Middle East, etc. 0 2024.4-9 2025.4-9 YoY Reference (retail) Toyota and Lexus Vehicle Sales 5,029 5,267 104.7% [44.4%] [46.9%] Electrified Vehicle [%] 2,231 2,471 110.7% HEV 2,077 2,271 109.3% PHEV 75 98 129.8% BEV 78 101 129.8% FCEV 1 0 52.1% Total Retail Vehicle Sales 5,373 5,643 105.0% 5
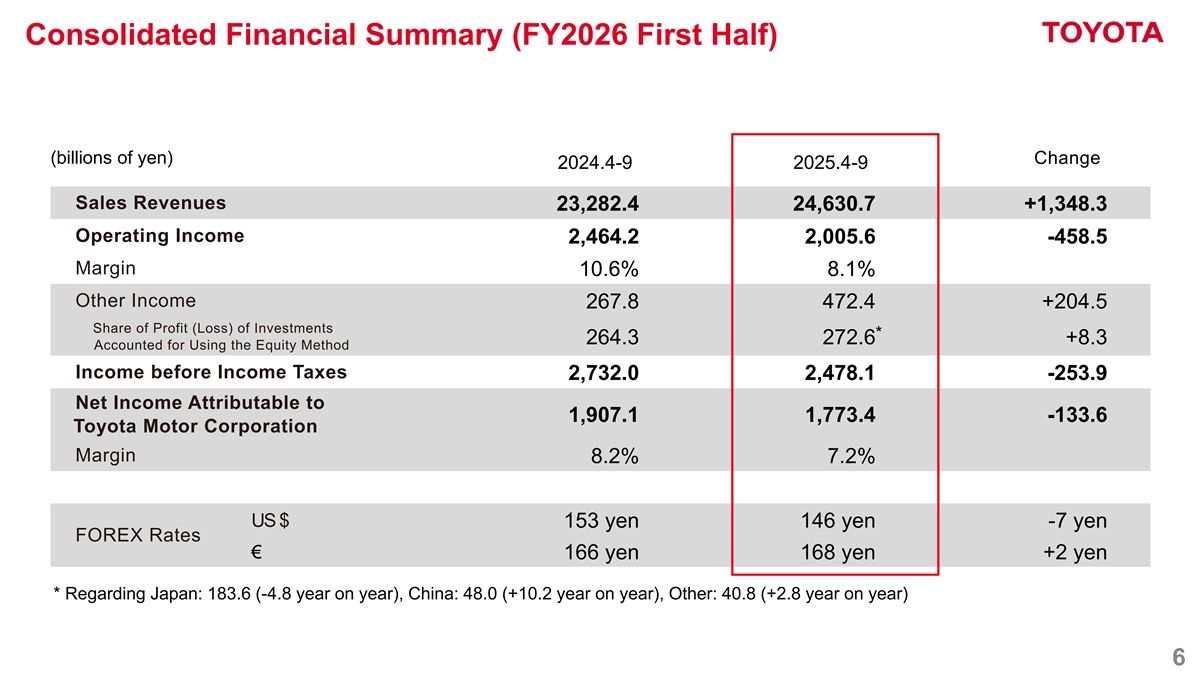
Consolidated Financial Summary (FY2026 First Half) (billions of yen) Change 2024.4-9 2025.4-9 Sales Revenues 23,282.4 24,630.7 +1,348.3 Operating Income 2,464.2 2,005.6 -458.5 Margin 10.6% 8.1% Other Income 267.8 472.4 +204.5 Share of Profit (Loss) of Investments * 264.3 272.6 +8.3 Accounted for Using the Equity Method Income before Income Taxes 2,732.0 2,478.1 -253.9 Net Income Attributable to 1,907.1 1,773.4 -133.6 Toyota Motor Corporation Margin 8.2% 7.2% US $ 153 yen 146 yen -7 yen FOREX Rates € 166 yen 168 yen +2 yen * Regarding Japan: 183.6 (-4.8 year on year), China: 48.0 (+10.2 year on year), Other: 40.8 (+2.8 year on year) 6
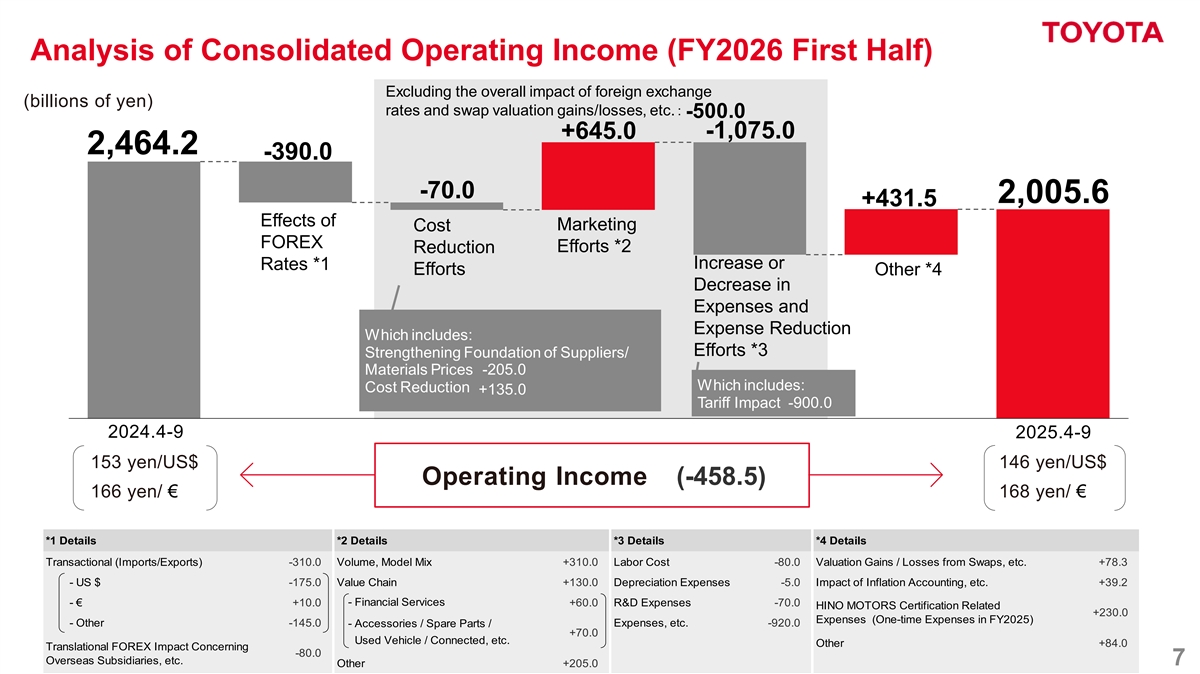
Analysis of Consolidated Operating Income (FY2026 First Half) Excluding the overall impact of foreign exchange (billions of yen) rates and swap valuation gains/losses, etc.: -500.0 -1,075.0 +645.0 2,464.2 -390.0 -70.0 2,005.6 +431.5 ・市況影響: Effects of Marketing Cost ・原価改善:△ FOREX ※ Efforts *2 Reduction Increase or Rates *1 Efforts Other *4 Decrease in Expenses and Expense Reduction Which includes: Efforts *3 Strengthening Foundation of Suppliers/ Materials Prices -205.0 Which includes: Cost Reduction +135.0 Tariff Impact -900.0 2024.4-9 2025.4-9 153 yen/US$ 146 yen/US$ Operating Income (-458.5) 166 yen/ € 168 yen/ € *1 Details *2 Details *3 Details *4 Details Transactional (Imports/Exports) -310.0 Volume, Model Mix +310.0 Labor Cost -80.0 Valuation Gains / Losses from Swaps, etc. +78.3 - US $ -175.0 Value Chain +130.0 Depreciation Expenses -5.0 Impact of Inflation Accounting, etc. +39.2 - Financial Services - € +10.0 +60.0 R&D Expenses -70.0 HINO MOTORS Certification Related +230.0 Expenses (One-time Expenses in FY2025) - Other -145.0 Expenses, etc. -920.0 - Accessories / Spare Parts / +70.0 Used Vehicle / Connected, etc. Other +84.0 Translational FOREX Impact Concerning -80.0 Overseas Subsidiaries, etc. 7 Other +205.0
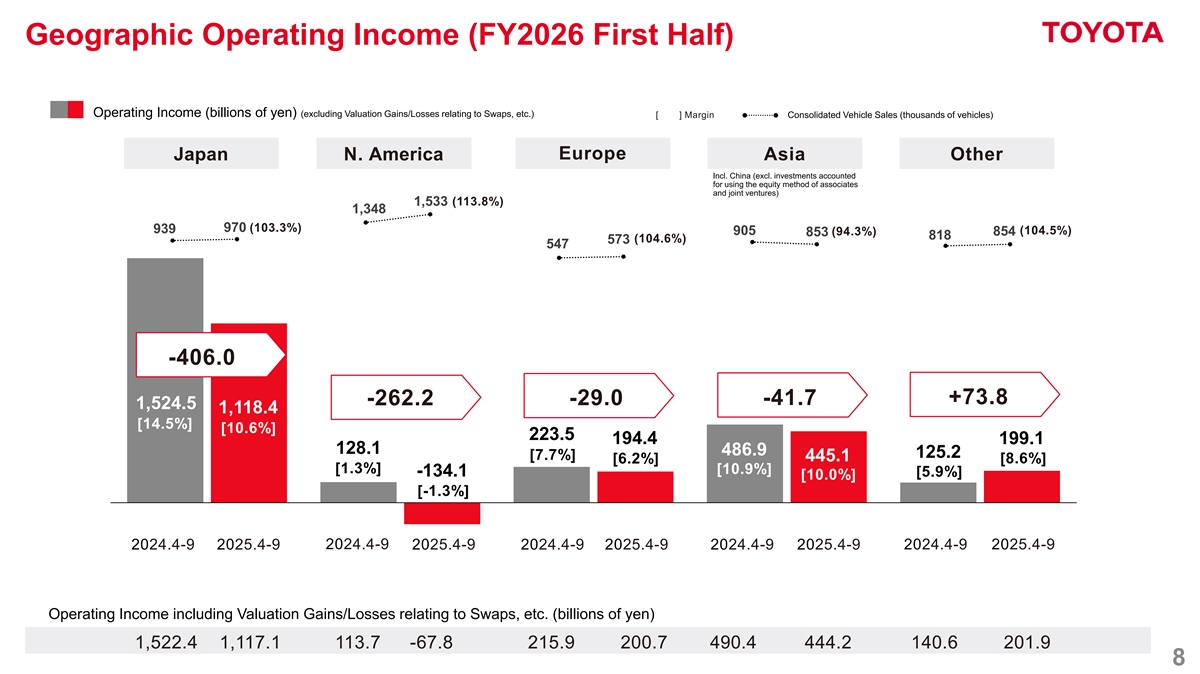
Geographic Operating Income (FY2026 First Half) Operating Income (billions of yen) (excluding Valuation Gains/Losses relating to Swaps, etc.) [ ] Margin Consolidated Vehicle Sales (thousands of vehicles) Europe Japan N. America Asia Other Incl. China (excl. investments accounted for using the equity method of associates and joint ventures) 1,533 (113.8%) 1,348 970 (103.3%) 939 (104.5%) 905 (94.3%) 854 853 818 (104.6%) 573 547 -406.0 +73.8 -262.2 -29.0 -41.7 1,524.5 1,118.4 [14.5%] [10.6%] 223.5 194.4 199.1 128.1 486.9 125.2 [7.7%] 445.1 [6.2%] [8.6%] [1.3%] [10.9%] -134.1 [5.9%] [10.0%] [-1.3%] 2024.4-9 2025.4-9 2024.4-9 2025.4-9 2025.4-9 2024.4-9 2025.4-9 2024.4-9 2025.4-9 2024.4-9 Operating Income including Valuation Gains/Losses relating to Swaps, etc. (billions of yen) 1,522.4 1,117.1 113.7 -67.8 215.9 200.7 490.4 444.2 140.6 201.9 8
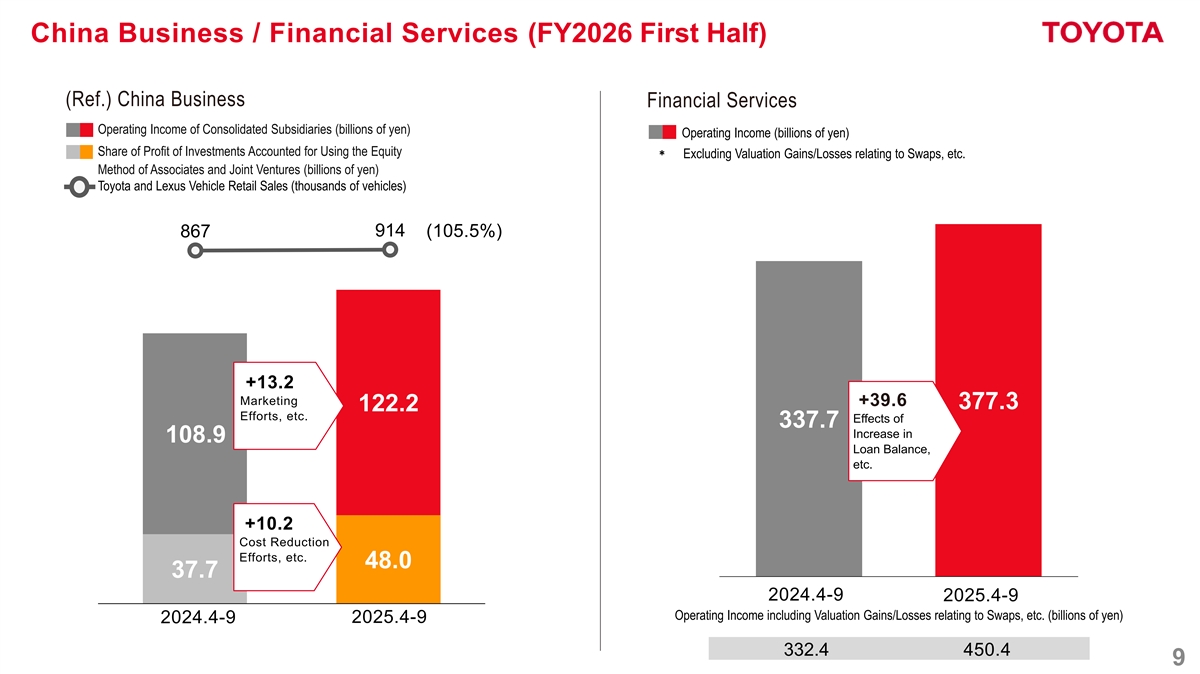
China Business / Financial Services (FY2026 First Half) (Ref.) China Business Financial Services Operating Income of Consolidated Subsidiaries (billions of yen) Operating Income (billions of yen) Share of Profit of Investments Accounted for Using the Equity* Excluding Valuation Gains/Losses relating to Swaps, etc. Method of Associates and Joint Ventures (billions of yen) Toyota and Lexus Vehicle Retail Sales (thousands of vehicles) 914 (105.5%) 867 +13.2 Marketing +39.6 377.3 122.2 Efforts, etc. Effects of 337.7 Increase in 108.9 Loan Balance, etc. +10.2 Cost Reduction Efforts, etc. 48.0 37.7 2024.4-9 2025.4-9 Operating Income including Valuation Gains/Losses relating to Swaps, etc. (billions of yen) 2025.4-9 2024.4-9 332.4 450.4 9

Shareholder Return 10
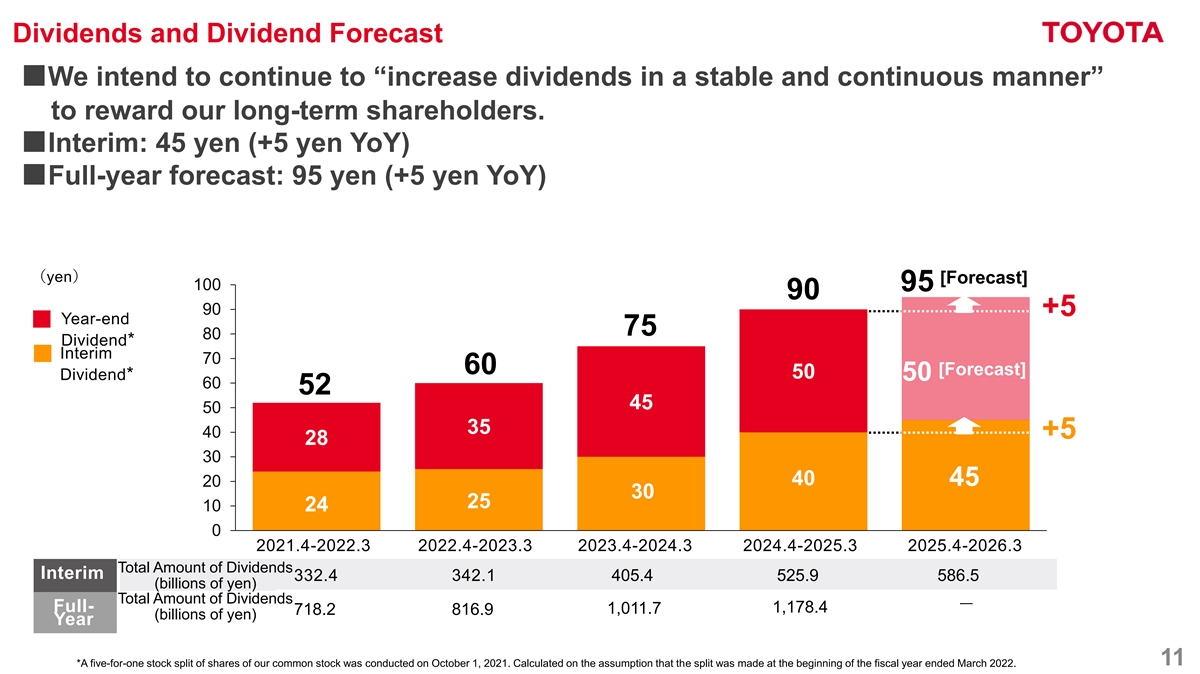
Dividends and Dividend Forecast ■We intend to continue to “increase dividends in a stable and continuous manner” to reward our long-term shareholders. ■Interim: 45 yen (+5 yen YoY) ■Full-year forecast: 95 yen (+5 yen YoY) (yen) [Forecast] 100 95 90 90 +5 Year-end 75 80 Dividend* Interim 70 60 [Forecast] 50 Dividend* 50 60 52 45 50 35 40 +5 28 30 40 45 20 30 25 10 24 0 2021.4-2022.3 2022.4-2023.3 2023.4-2024.3 2024.4-2025.3 2025.4-2026.3 Total Amount of Dividends Interim 332.4 342.1 405.4 525.9 586.5 (billions of yen) Total Amount of Dividends ー Full- 1,178.4 1,011.7 718.2 816.9 (billions of yen) Year 11 *A five-for-one stock split of shares of our common stock was conducted on October 1, 2021. Calculated on the assumption that the split was made at the beginning of the fiscal year ended March 2022.

FY2026 Financial Forecasts 12
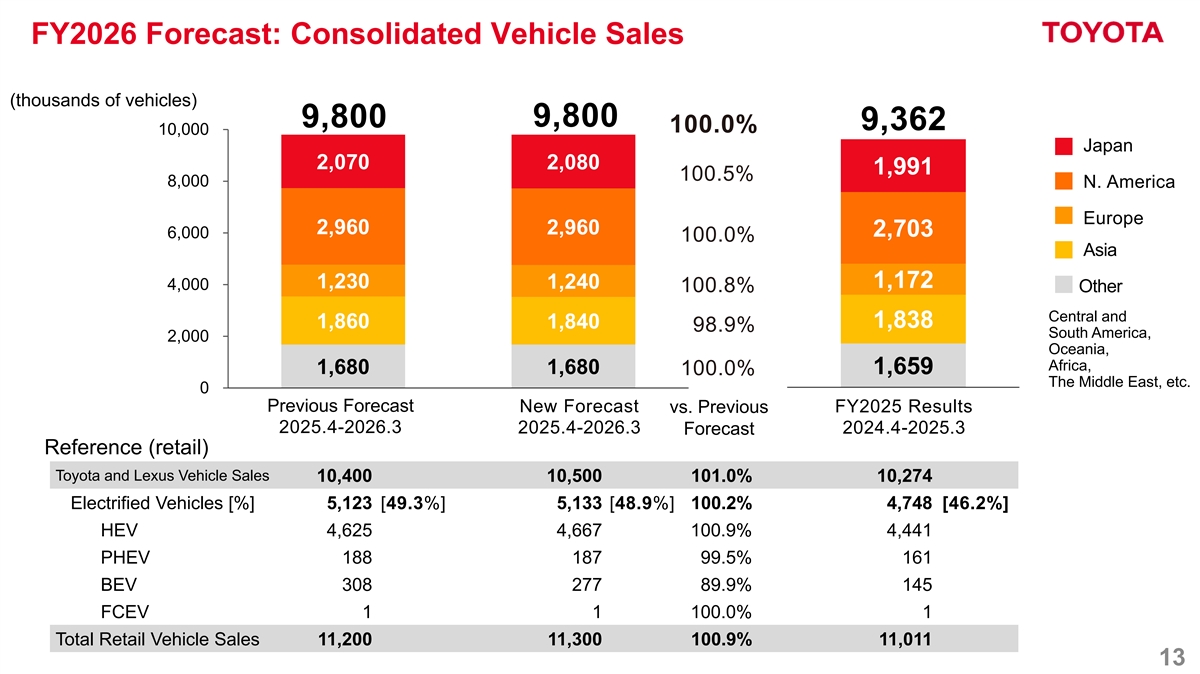
FY2026 Forecast: Consolidated Vehicle Sales (thousands of vehicles) 9,800 9,800 9,362 100.0% 10,000 Japan 2,070 2,080 1,991 100.5% 8,000 N. America Europe 2,960 2,960 2,703 6,000 100.0% Asia 1,230 1,172 1,240 4,000 100.8% Other Central and 1,860 1,840 1,838 98.9% South America, 2,000 Oceania, Africa, 1,680 1,680 1,659 100.0% The Middle East, etc. 0 Previous Forecast New Forecast FY2025 Results vs. Previous 2025.4-2026.3 2025.4-2026.3 2024.4-2025.3 Forecast Reference (retail) Toyota and Lexus Vehicle Sales 10,400 10,500 101.0% 10,274 Electrified Vehicles [%] 5,123 [49.3%] 5,133 [48.9%] 100.2% 4,748 [46.2%] HEV 4,625 4,667 100.9% 4,441 PHEV 188 187 99.5% 161 BEV 308 277 89.9% 145 FCEV 1 1 100.0% 1 Total Retail Vehicle Sales 11,200 11,300 100.9% 11,011 13
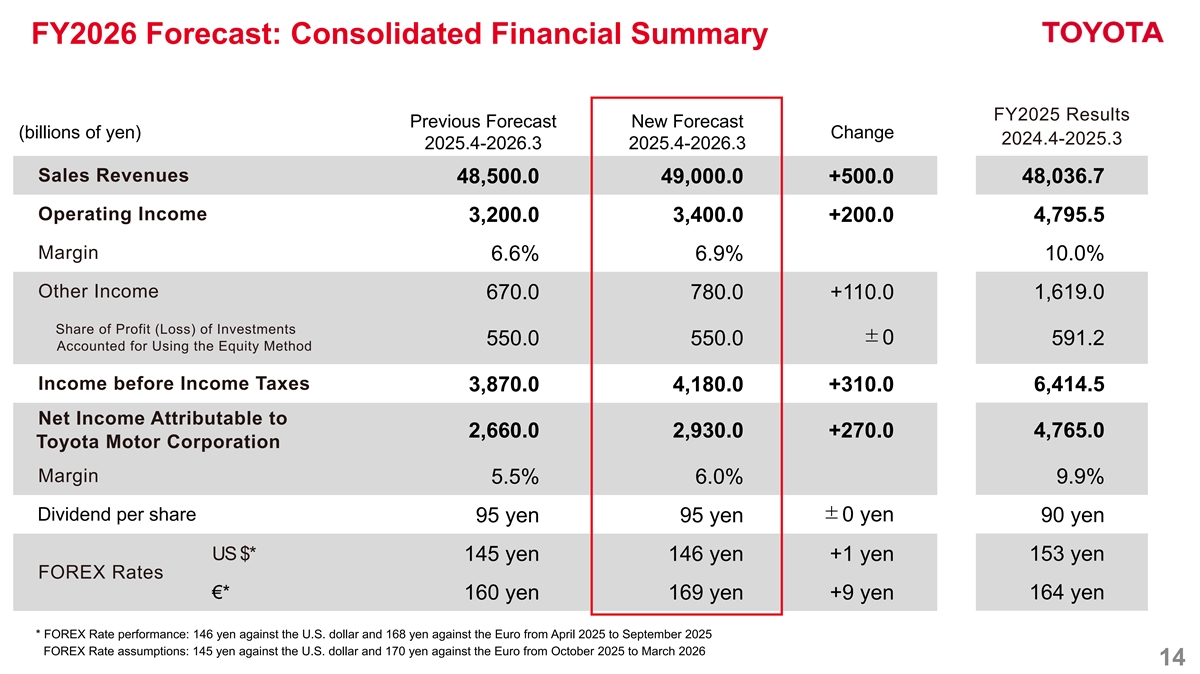
FY2026 Forecast: Consolidated Financial Summary FY2025 Results Previous Forecast New Forecast (billions of yen) Change 2024.4-2025.3 2025.4-2026.3 2025.4-2026.3 Sales Revenues 48,036.7 48,500.0 49,000.0 +500.0 Operating Income 4,795.5 3,200.0 3,400.0 +200.0 Margin 10.0% 6.6% 6.9% Other Income 1,619.0 670.0 780.0 +110.0 Share of Profit (Loss) of Investments ±0 591.2 550.0 550.0 Accounted for Using the Equity Method Income before Income Taxes 6,414.5 3,870.0 4,180.0 +310.0 Net Income Attributable to 4,765.0 2,660.0 2,930.0 +270.0 Toyota Motor Corporation Margin 5.5% 6.0% 9.9% Dividend per share ±0 yen 95 yen 95 yen 90 yen US $* 153 yen 145 yen 146 yen +1 yen FOREX Rates €* 164 yen 160 yen 169 yen +9 yen * FOREX Rate performance: 146 yen against the U.S. dollar and 168 yen against the Euro from April 2025 to September 2025 FOREX Rate assumptions: 145 yen against the U.S. dollar and 170 yen against the Euro from October 2025 to March 2026 14
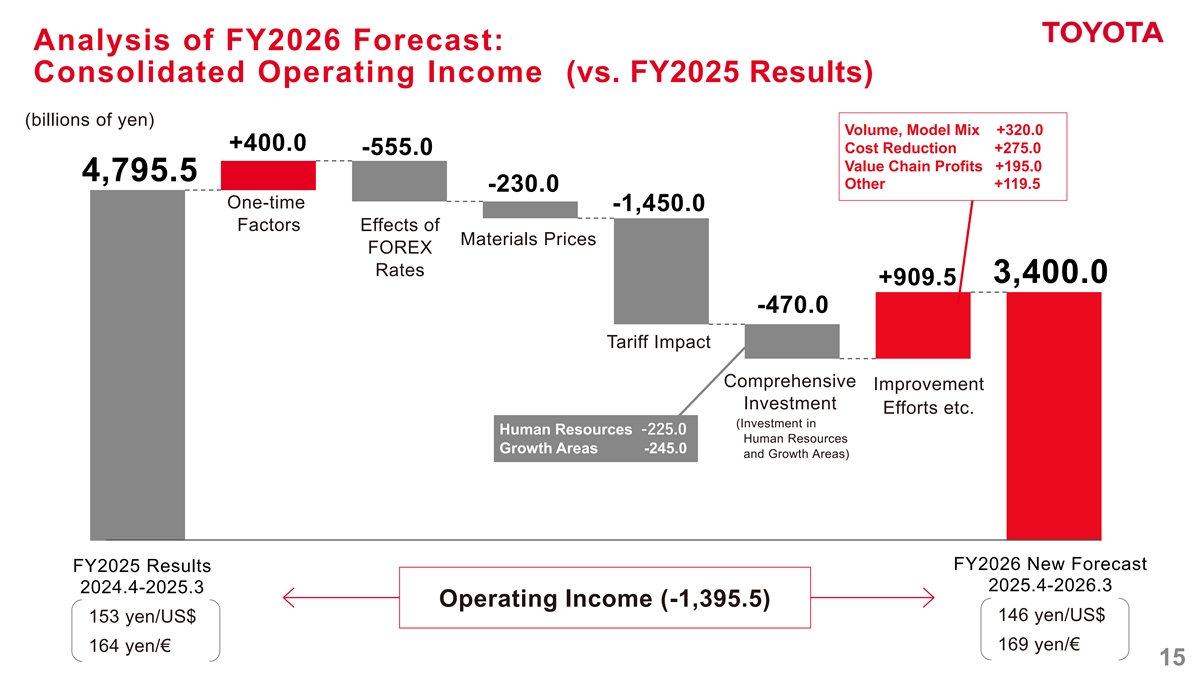
Analysis of FY2026 Forecast: Consolidated Operating Income (vs. FY2025 Results) (billions of yen) Volume, Model Mix +320.0 +400.0 Cost Reduction +275.0 -555.0 Value Chain Profits +195.0 4,795.5 Other +119.5 -230.0 One-time -1,450.0 Factors Effects of Materials Prices FOREX Rates 3,400.0 +909.5 -470.0 Tariff Impact Comprehensive Improvement Investment Efforts etc. (Investment in Human Resources -225.0 Human Resources Growth Areas -245.0 and Growth Areas) FY2026 New Forecast FY2025 Results 2025.4-2026.3 2024.4-2025.3 Operating Income (-1,395.5) 146 yen/US$ 153 yen/US$ 169 yen/€ 164 yen/€ 15
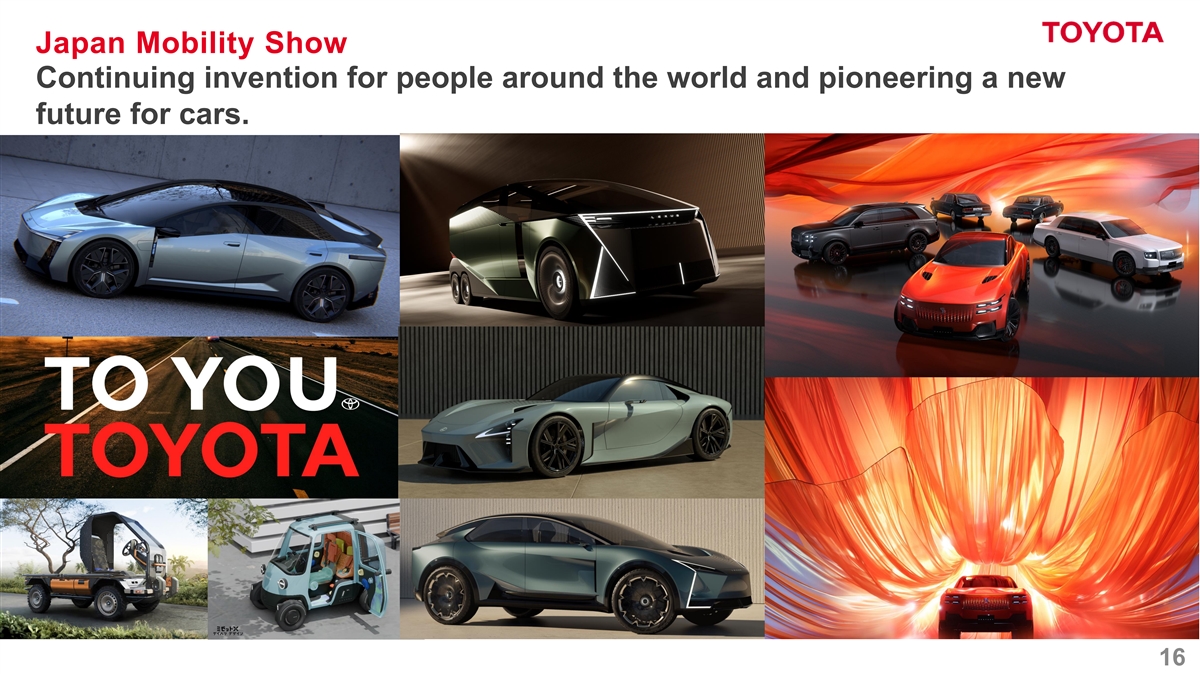
Japan Mobility Show Continuing invention for people around the world and pioneering a new future for cars. 16
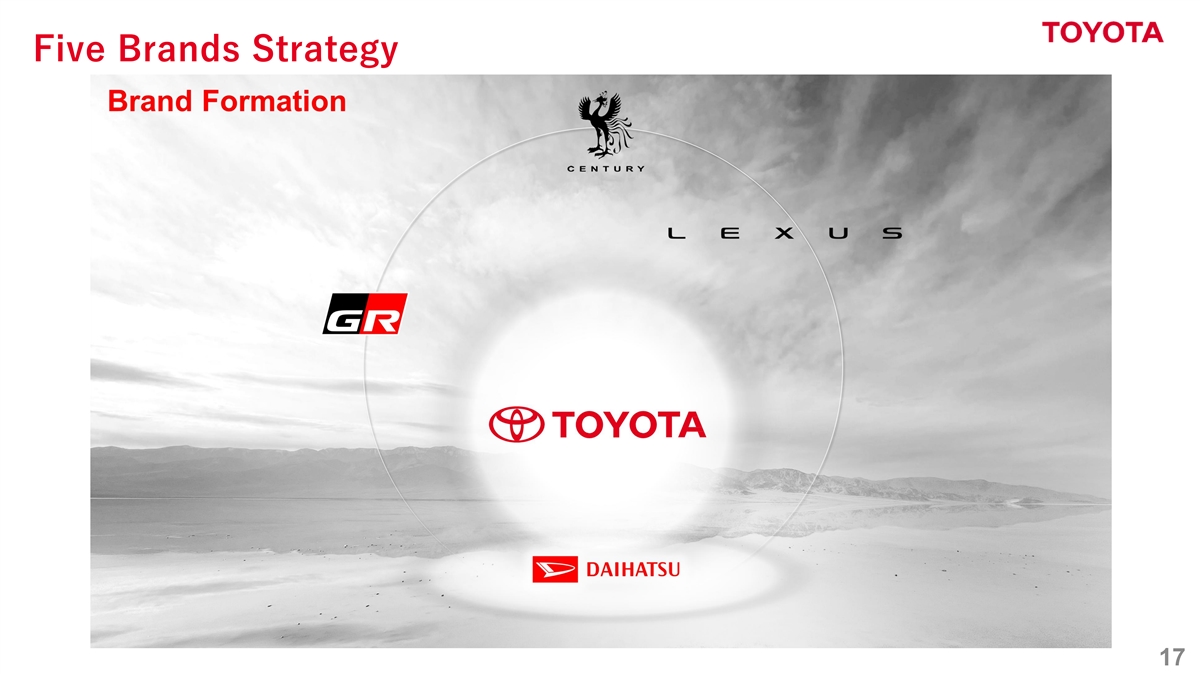
Five Brands Strategy TBD 17
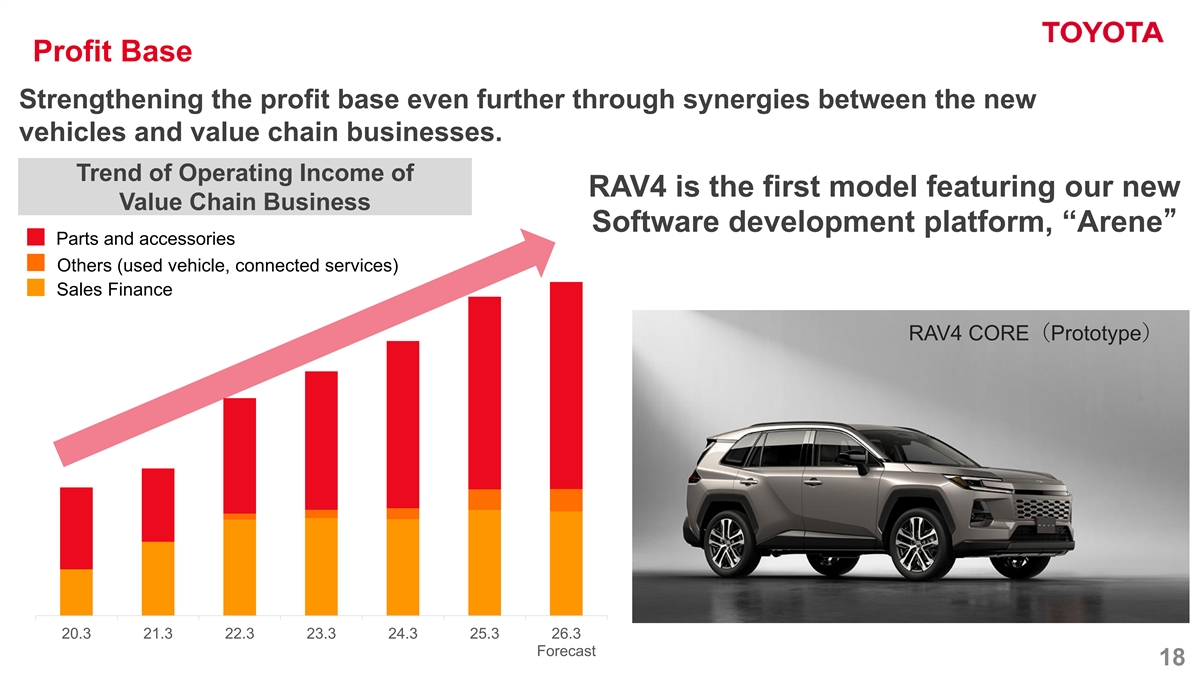
Profit Base Strengthening the profit base even further through synergies between the new vehicles and value chain businesses. Trend of Operating Income of RAV4 is the first model featuring our new Value Chain Business Software development platform, “Arene” Parts and accessories Others (used vehicle, connected services) Sales Finance RAV4 CORE(Prototype) 20.3 21.3 22.3 23.3 24.3 25.3 26.3 Forecast 18
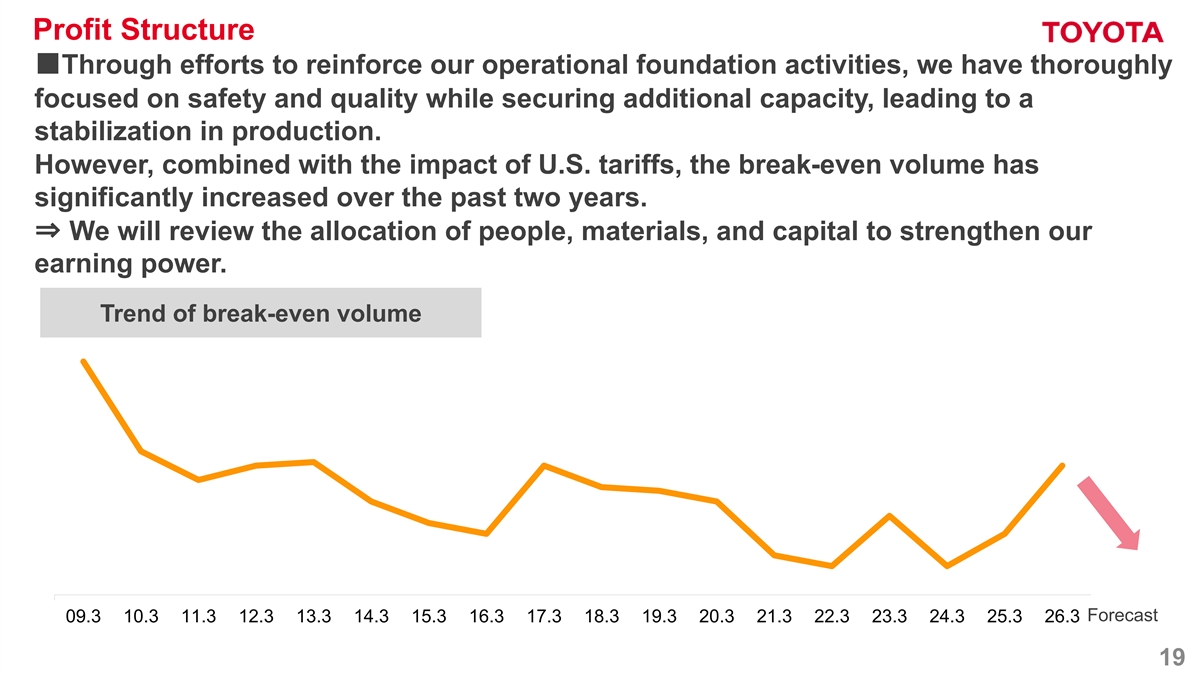
Profit Structure ■Through efforts to reinforce our operational foundation activities, we have thoroughly focused on safety and quality while securing additional capacity, leading to a stabilization in production. However, combined with the impact of U.S. tariffs, the break-even volume has significantly increased over the past two years. ⇒ We will review the allocation of people, materials, and capital to strengthen our earning power. Trend of break-even volume Forecast 09.3 10.3 11.3 12.3 13.3 14.3 15.3 16.3 17.3 18.3 19.3 20.3 21.3 22.3 23.3 24.3 25.3 26.3 19
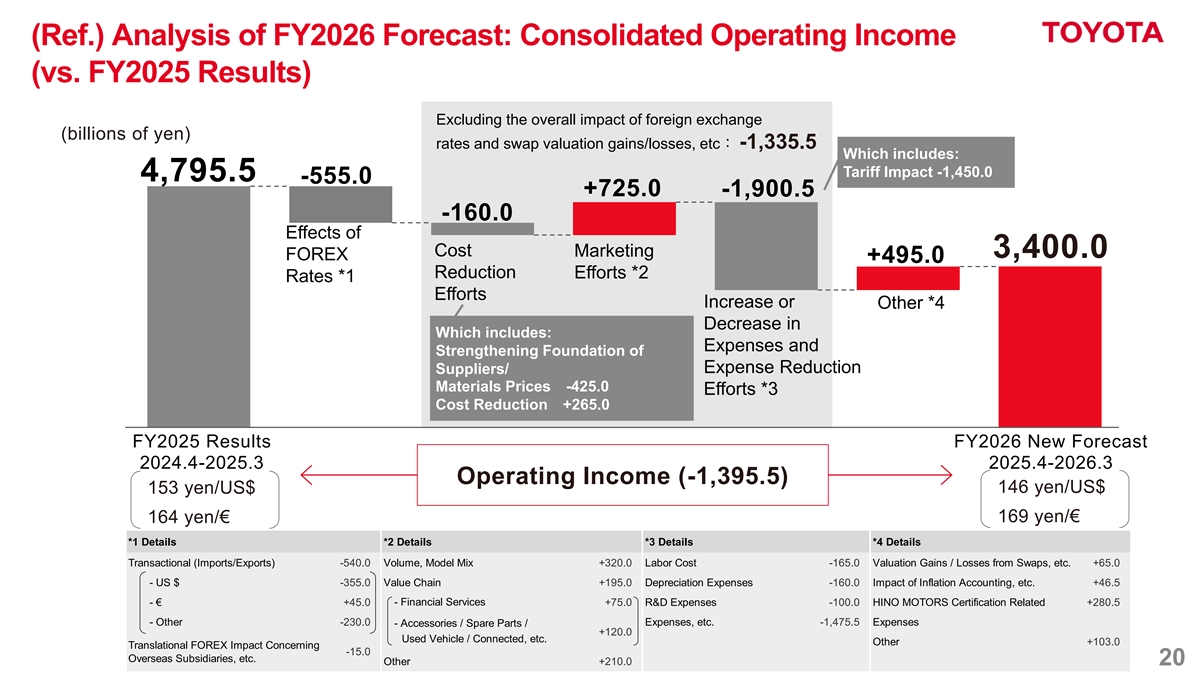
(Ref.) Analysis of FY2026 Forecast: Consolidated Operating Income (vs. FY2025 Results) Excluding the overall impact of foreign exchange (billions of yen) rates and swap valuation gains/losses, etc: -1,335.5 Which includes: Tariff Impact -1,450.0 4,795.5 -555.0 +725.0 -1,900.5 -160.0 Effects of Cost Marketing 3,400.0 FOREX +495.0 Reduction Efforts *2 Rates *1 Efforts Increase or Other *4 Decrease in Which includes: Expenses and Strengthening Foundation of Expense Reduction Suppliers/ Materials Prices -425.0 Efforts *3 Cost Reduction +265.0 FY2025 Results FY2026 New Forecast 2024.4-2025.3 2025.4-2026.3 Operating Income (-1,395.5) 146 yen/US$ 153 yen/US$ 169 yen/€ 164 yen/€ *1 Details *2 Details *3 Details *4 Details Transactional (Imports/Exports) -540.0 Volume, Model Mix +320.0 Labor Cost -165.0 Valuation Gains / Losses from Swaps, etc. +65.0 - US $ -355.0 Value Chain +195.0 Depreciation Expenses -160.0 Impact of Inflation Accounting, etc. +46.5 - Financial Services - € +45.0 +75.0 R&D Expenses -100.0 HINO MOTORS Certification Related +280.5 - Other -230.0 Expenses, etc. -1,475.5 Expenses - Accessories / Spare Parts / +120.0 Used Vehicle / Connected, etc. Other +103.0 Translational FOREX Impact Concerning -15.0 Overseas Subsidiaries, etc. Other +210.0 20
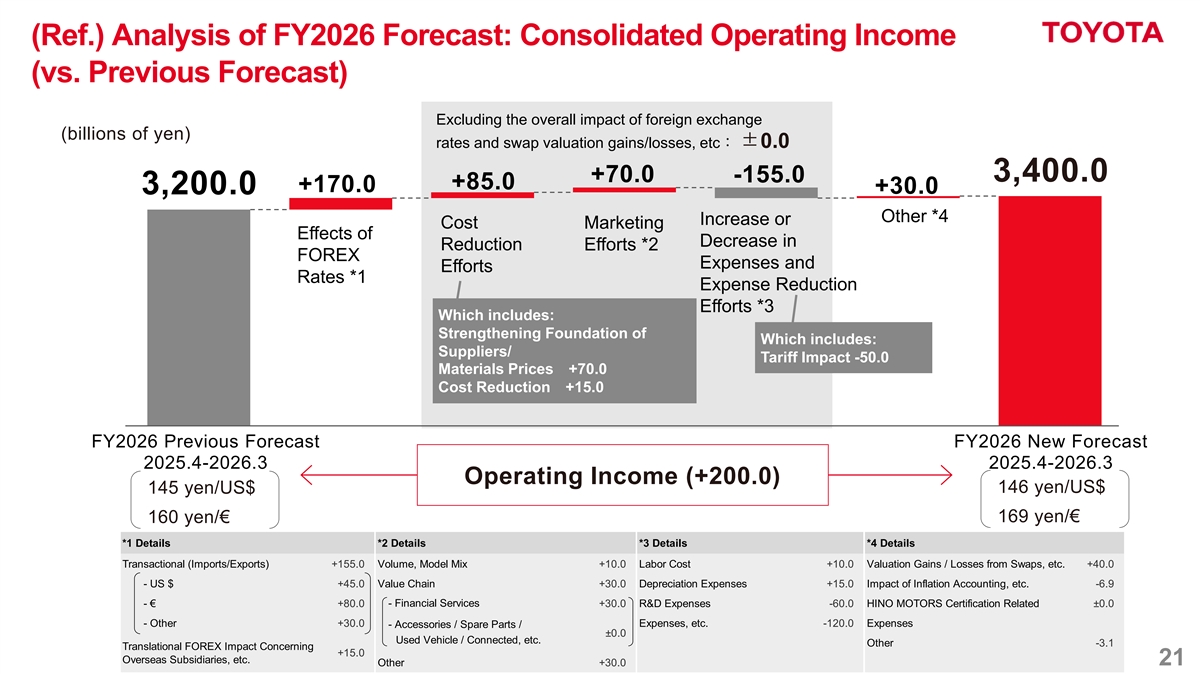
(Ref.) Analysis of FY2026 Forecast: Consolidated Operating Income (vs. Previous Forecast) Excluding the overall impact of foreign exchange (billions of yen) rates and swap valuation gains/losses, etc:±0.0 3,400.0 +70.0 -155.0 +85.0 +170.0 +30.0 3,200.0 Other *4 Increase or Cost Marketing Effects of Decrease in Reduction Efforts *2 FOREX Expenses and Efforts Rates *1 Expense Reduction Efforts *3 Which includes: Strengthening Foundation of Which includes: Suppliers/ Tariff Impact -50.0 Materials Prices +70.0 Cost Reduction +15.0 FY2026 Previous Forecast FY2026 New Forecast 2025.4-2026.3 2025.4-2026.3 Operating Income (+200.0) 146 yen/US$ 145 yen/US$ 169 yen/€ 160 yen/€ *1 Details *2 Details *3 Details *4 Details Transactional (Imports/Exports) +155.0 Volume, Model Mix +10.0 Labor Cost +10.0 Valuation Gains / Losses from Swaps, etc. +40.0 - US $ +45.0 Value Chain +30.0 Depreciation Expenses +15.0 Impact of Inflation Accounting, etc. -6.9 - Financial Services - € +80.0 +30.0 R&D Expenses -60.0 HINO MOTORS Certification Related ±0.0 - Other +30.0 Expenses, etc. -120.0 Expenses - Accessories / Spare Parts / ±0.0 Used Vehicle / Connected, etc. Other -3.1 Translational FOREX Impact Concerning +15.0 Overseas Subsidiaries, etc. 21 Other +30.0
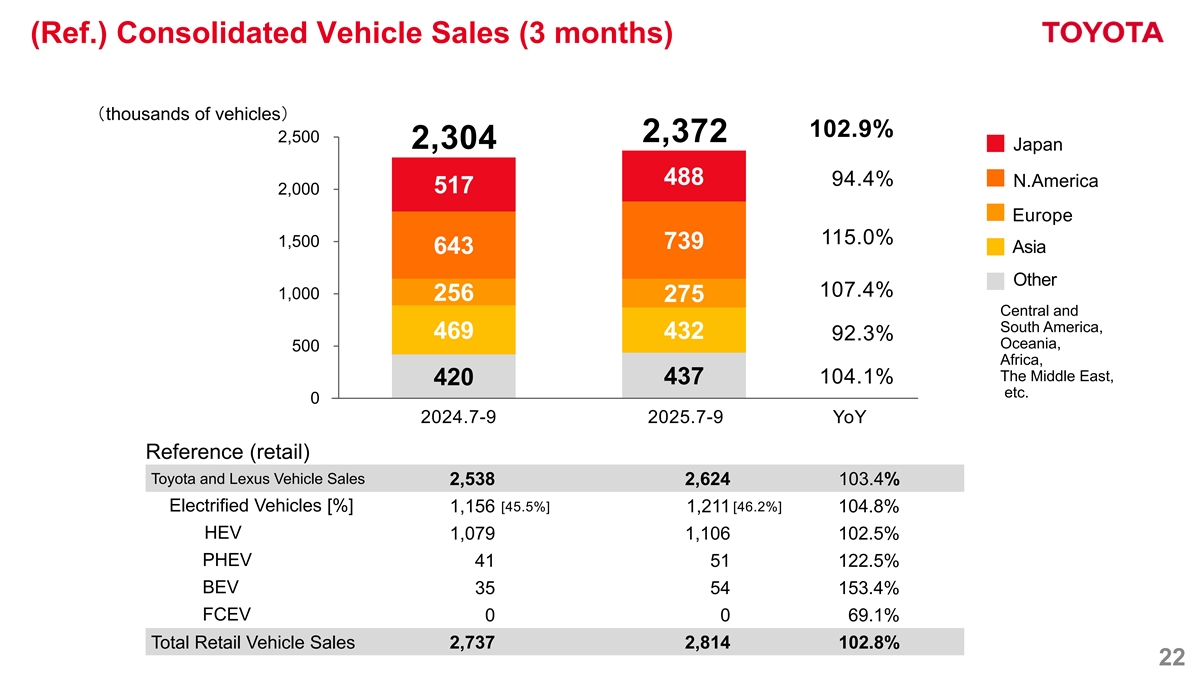
(Ref.) Consolidated Vehicle Sales (3 months) (thousands of vehicles) 102.9% 2,500 2,372 2,304 Japan 488 94.4% N.America 517 2,000 Europe 115.0% 1,500 739 Asia 643 Other 107.4% 1,000 256 275 Central and South America, 469 432 92.3% Oceania, 500 Africa, The Middle East, 104.1% 437 420 etc. 0 2024.7-9 2025.7-9 YoY Reference (retail) Toyota and Lexus Vehicle Sales 2,538 2,624 103.4% Electrified Vehicles [%] [45.5%] [46.2%] 1,156 1,211 104.8% HEV 1,079 1,106 102.5% PHEV 41 51 122.5% BEV 35 54 153.4% FCEV 0 0 69.1% Total Retail Vehicle Sales 2,737 2,814 102.8% 22
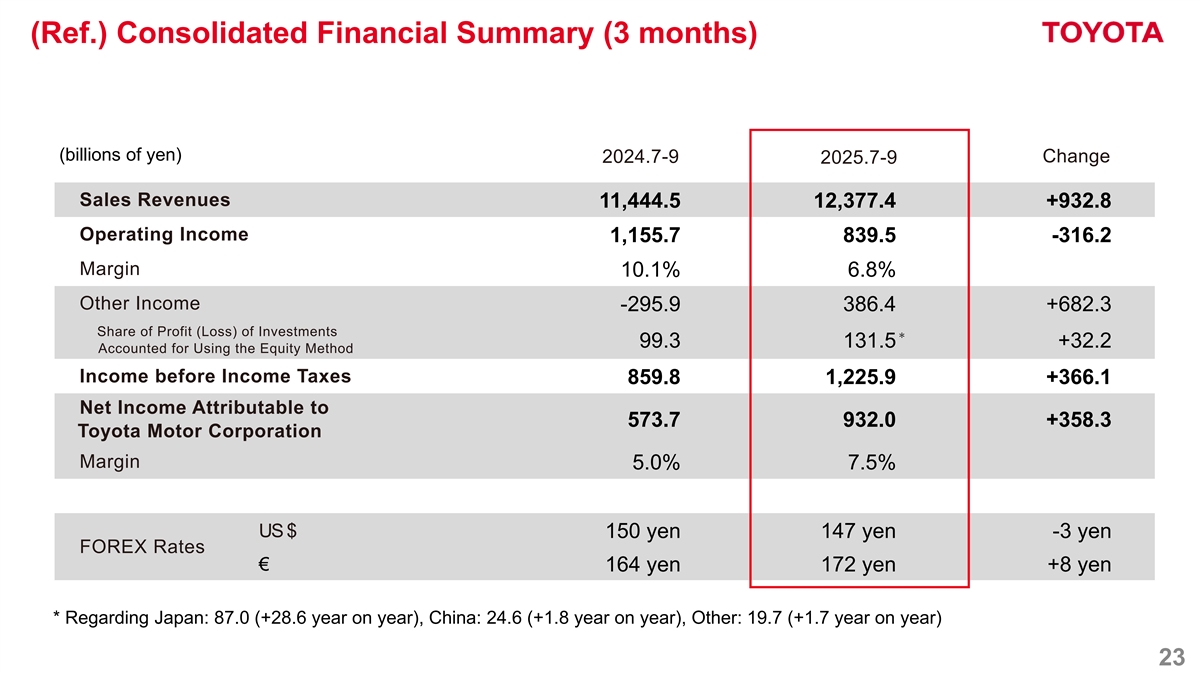
(Ref.) Consolidated Financial Summary (3 months) (billions of yen) Change 2024.7-9 2025.7-9 Sales Revenues 11,444.5 12,377.4 +932.8 Operating Income 1,155.7 839.5 -316.2 Margin 10.1% 6.8% Other Income -295.9 386.4 +682.3 Share of Profit (Loss) of Investments * 99.3 131.5 +32.2 Accounted for Using the Equity Method Income before Income Taxes 859.8 1,225.9 +366.1 Net Income Attributable to 573.7 932.0 +358.3 Toyota Motor Corporation Margin 5.0% 7.5% US $ 150 yen 147 yen -3 yen FOREX Rates € 164 yen 172 yen +8 yen * Regarding Japan: 87.0 (+28.6 year on year), China: 24.6 (+1.8 year on year), Other: 19.7 (+1.7 year on year) 23
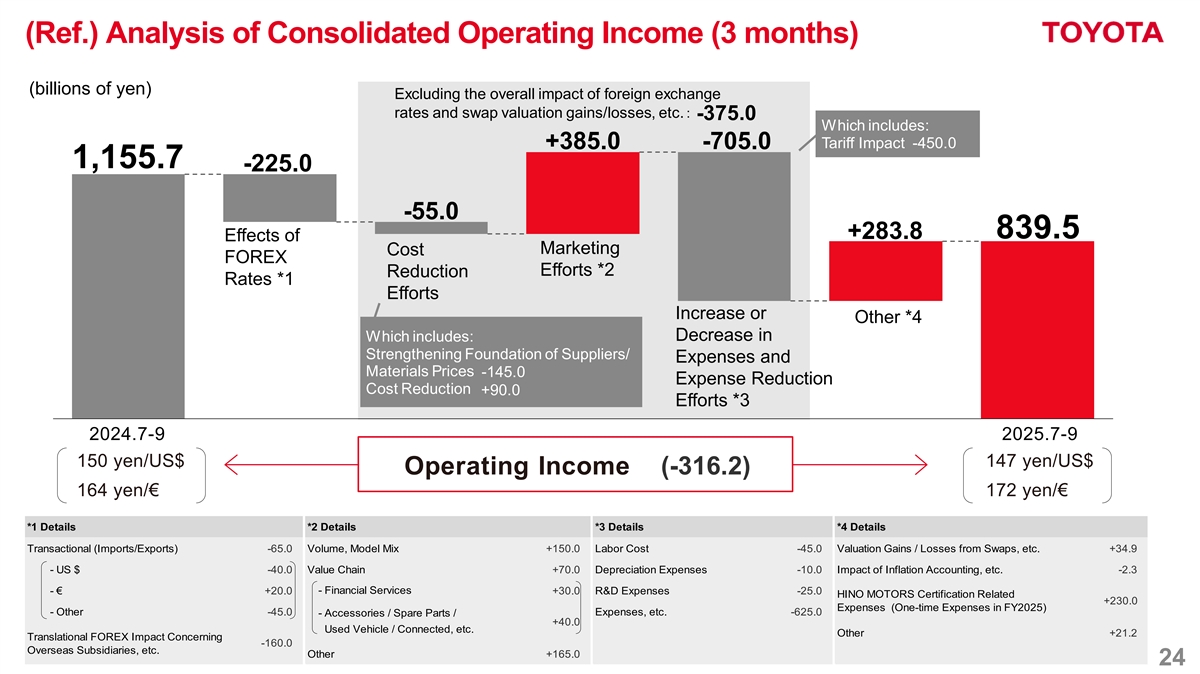
(Ref.) Analysis of Consolidated Operating Income (3 months) (billions of yen) Excluding the overall impact of foreign exchange rates and swap valuation gains/losses, etc.: -375.0 Which includes: Tariff Impact -450.0 +385.0 -705.0 1,155.7 -225.0 -55.0 839.5 +283.8 Effects of Marketing Cost FOREX Efforts *2 Reduction Rates *1 Efforts Increase or Other *4 Decrease in Which includes: Strengthening Foundation of Suppliers/ Expenses and Materials Prices -145.0 Expense Reduction Cost Reduction +90.0 Efforts *3 2024.7-9 2025.7-9 150 yen/US$ 147 yen/US$ Operating Income (-316.2) 164 yen/€ 172 yen/€ *1 Details *2 Details *3 Details *4 Details Transactional (Imports/Exports) -65.0 Volume, Model Mix +150.0 Labor Cost -45.0 Valuation Gains / Losses from Swaps, etc. +34.9 - US $ -40.0 Value Chain +70.0 Depreciation Expenses -10.0 Impact of Inflation Accounting, etc. -2.3 - Financial Services - € +20.0 +30.0 R&D Expenses -25.0 HINO MOTORS Certification Related +230.0 Expenses (One-time Expenses in FY2025) - Other -45.0 Expenses, etc. -625.0 - Accessories / Spare Parts / +40.0 Used Vehicle / Connected, etc. Other +21.2 Translational FOREX Impact Concerning -160.0 Overseas Subsidiaries, etc. Other +165.0 24
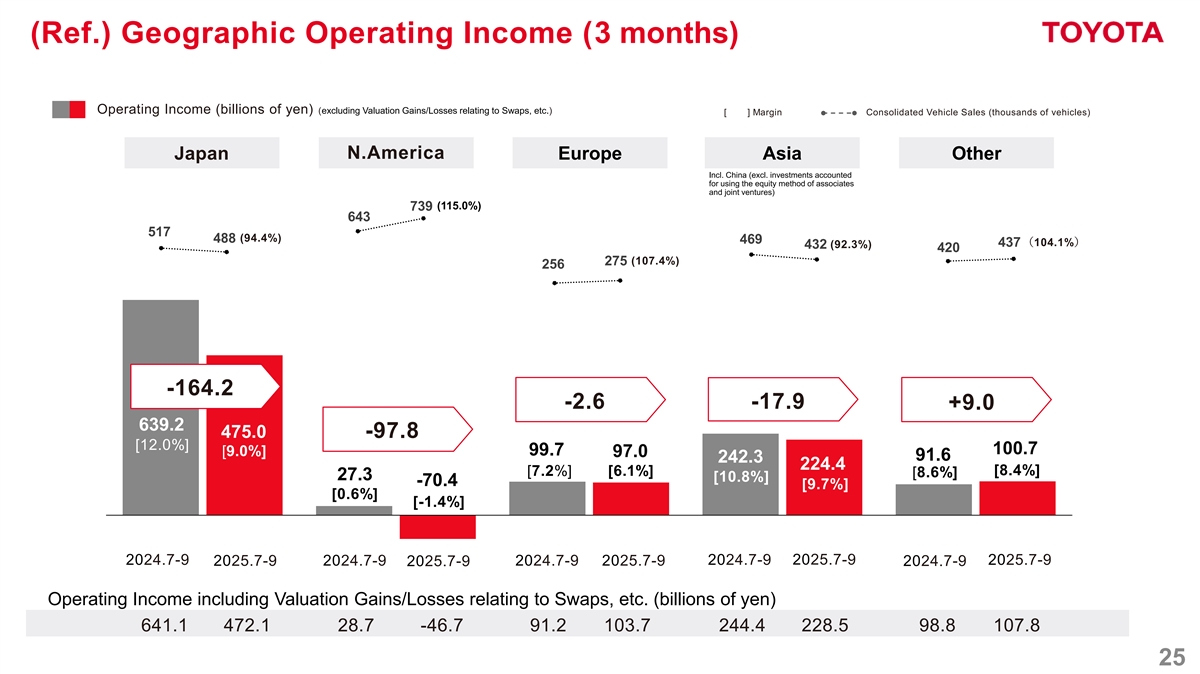
(Ref.) Geographic Operating Income (3 months) Operating Income (billions of yen) (excluding Valuation Gains/Losses relating to Swaps, etc.) [ ] Margin Consolidated Vehicle Sales (thousands of vehicles) N.America Japan Europe Asia Other Incl. China (excl. investments accounted for using the equity method of associates and joint ventures) (115.0%) 739 643 517 (94.4%) 488 469 437 (104.1%) (92.3%) 432 420 (107.4%) 275 256 -164.2 -2.6 -17.9 +9.0 639.2 475.0 -97.8 [12.0%] 100.7 99.7 [9.0%] 97.0 91.6 242.3 224.4 [8.4%] [7.2%] [6.1%] [8.6%] 27.3 [10.8%] -70.4 [9.7%] [0.6%] [-1.4%] 2025.7-9 2024.7-9 2024.7-9 2025.7-9 2025.7-9 2024.7-9 2025.7-9 2024.7-9 2025.7-9 2024.7-9 Operating Income including Valuation Gains/Losses relating to Swaps, etc. (billions of yen) 641.1 472.1 28.7 -46.7 91.2 103.7 244.4 228.5 98.8 107.8 25
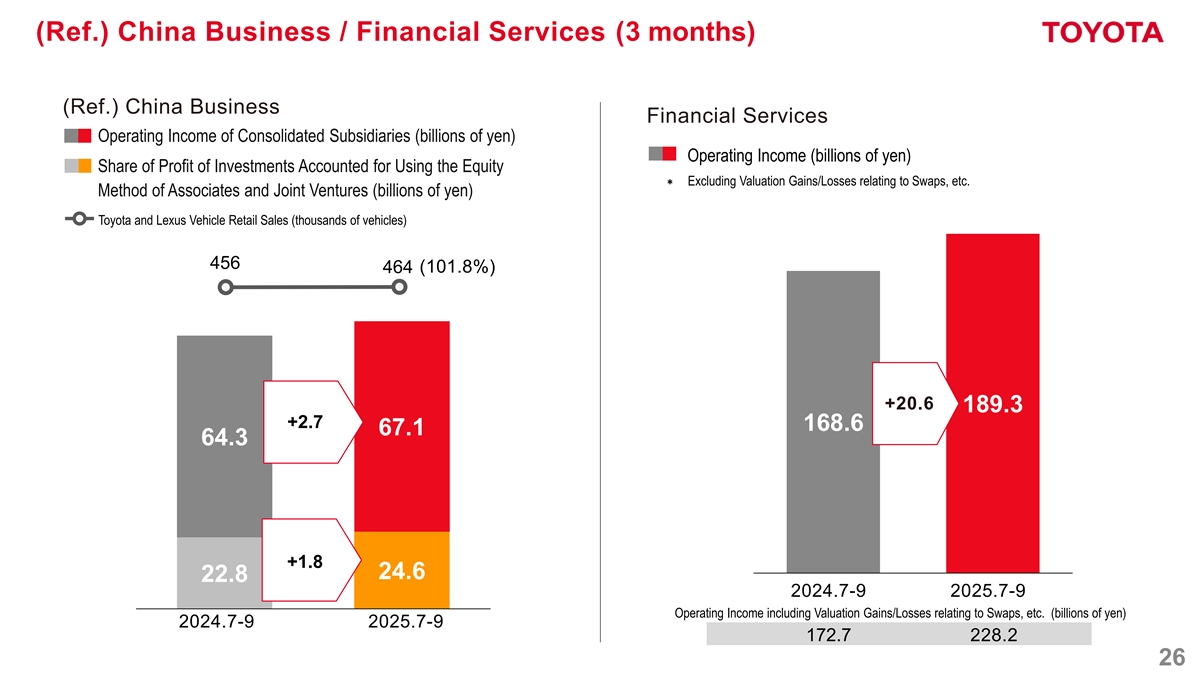
(Ref.) China Business / Financial Services (3 months) (Ref.) China Business Financial Services Operating Income of Consolidated Subsidiaries (billions of yen) Operating Income (billions of yen) Share of Profit of Investments Accounted for Using the Equity * Excluding Valuation Gains/Losses relating to Swaps, etc. Method of Associates and Joint Ventures (billions of yen) Toyota and Lexus Vehicle Retail Sales (thousands of vehicles) 456 464 (101.8%) +20.6 189.3 +2.7 168.6 67.1 64.3 +1.8 24.6 22.8 2024.7-9 2025.7-9 Operating Income including Valuation Gains/Losses relating to Swaps, etc. (billions of yen) 2024.7-9 2025.7-9 172.7 228.2 26
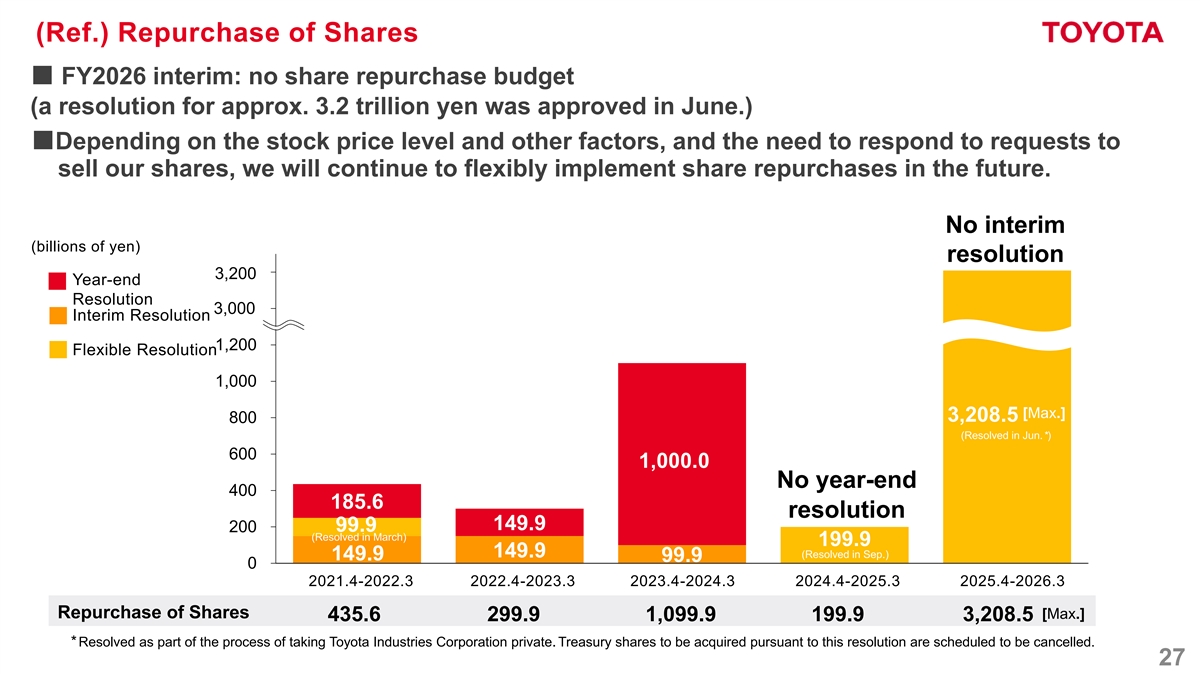
(Ref.) Repurchase of Shares ■ FY2026 interim: no share repurchase budget (a resolution for approx. 3.2 trillion yen was approved in June.) ■Depending on the stock price level and other factors, and the need to respond to requests to sell our shares, we will continue to flexibly implement share repurchases in the future. No interim (billions of yen) resolution 1,600 3,200 Year-end Resolution 3,0 1,400 00 Interim Resolution 1,200 Flexible Resolution 1,000 [Max.] 3,208.5 800 (Resolved in Jun. *) 600 1,000.0 No year-end 400 185.6 resolution 149.9 99.9 200 (Resolved in March) 199.9 149.9 (Resolved in Sep.) 149.9 99.9 0 2021.4-2022.3 2022.4-2023.3 2023.4-2024.3 2024.4-2025.3 2025.4-2026.3 Repurchase of Shares [Max.] 435.6 299.9 1,099.9 199.9 3,208.5 *Resolved as part of the process of taking Toyota Industries Corporation private. Treasury shares to be acquired pursuant to this resolution are scheduled to be cancelled. 27
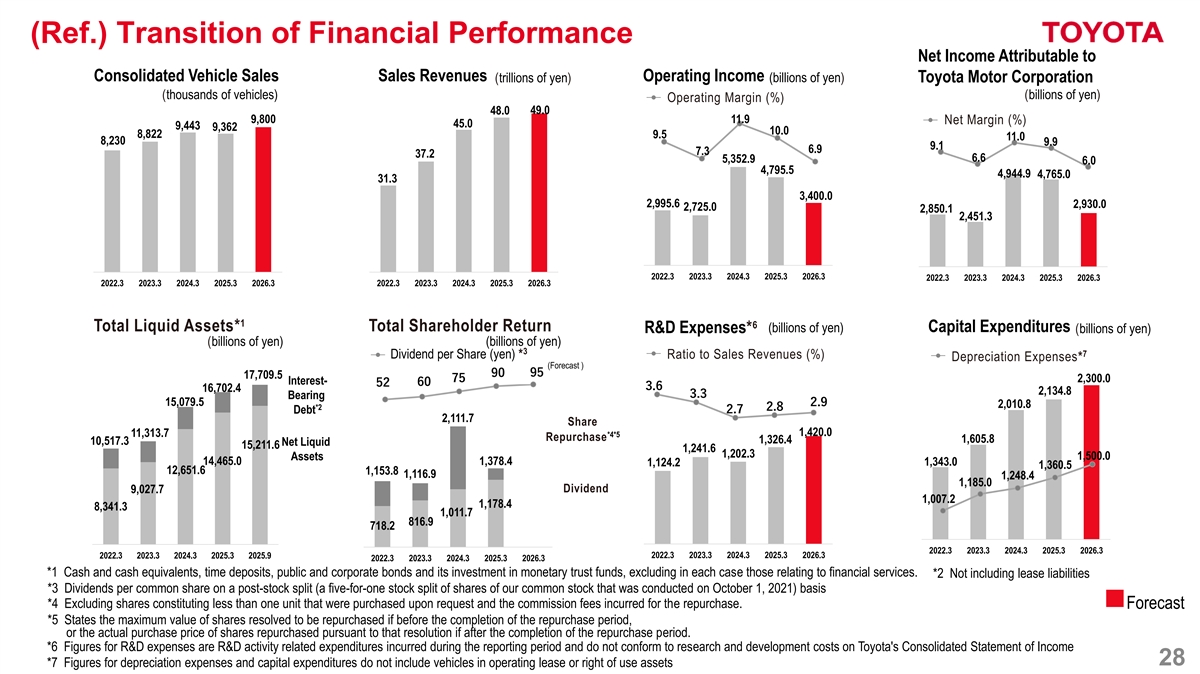
(Ref.) Transition of Financial Performance Net Income Attributable to Consolidated Vehicle Sales Sales Revenues Operating Income (trillions of yen) (billions of yen) Toyota Motor Corporation (thousands of vehicles) (billions of yen) Operating Margin (%) 49.0 48.0 9,800 11.9 Net Margin (%) 45.0 9,443 9,362 10.0 8,822 9.5 11.0 8,230 9.9 9.1 6.9 7.3 37.2 6.6 5,352.9 6.0 4,795.5 4,944.9 4,765.0 31.3 3,400.0 2,995.6 2,930.0 2,725.0 2,850.1 2,451.3 2022.3 2023.3 2024.3 2025.3 2026.3 2022.3 2023.3 2024.3 2025.3 2026.3 2022.3 2023.3 2024.3 2025.3 2026.3 2022.3 2023.3 2024.3 2025.3 2026.3 1 6 Total Liquid Assets* Total Shareholder Return (billions of yen) Capital Expenditures R&D Expenses* (billions of yen) (billions of yen) (billions of yen) 3 7 Dividend per Share (yen) * Ratio to Sales Revenues (%) Depreciation Expenses* (Forecast ) 90 95 17,709.5 75 2,300.0 Interest- 60 52 3.6 16,702.4 2,134.8 3.3 Bearing 15,079.5 2.9 2,010.8 *2 2.8 2.7 Debt 2,111.7 Share 1,420.0 11,313.7 *4*5 Repurchase 1,605.8 1,326.4 10,517.3 Net Liquid 15,211.6 1,241.6 1,202.3 1,500.0 Assets 14,465.0 1,378.4 1,343.0 1,124.2 1,360.5 12,651.6 1,153.8 1,116.9 1,248.4 1,185.0 Dividend 9,027.7 1,007.2 1,178.4 8,341.3 1,011.7 816.9 718.2 2022.3 2023.3 2024.3 2025.3 2026.3 2022.3 2023.3 2024.3 2025.3 2025.9 2022.3 2023.3 2024.3 2025.3 2026.3 2022.3 2023.3 2024.3 2025.3 2026.3 *1 Cash and cash equivalents, time deposits, public and corporate bonds and its investment in monetary trust funds, excluding in each case those relating to financial services. *2 Not including lease liabilities *3 Dividends per common share on a post-stock split (a five-for-one stock split of shares of our common stock that was conducted on October 1, 2021) basis *4 Excluding shares constituting less than one unit that were purchased upon request and the commission fees incurred for the repurchase. Forecast *5 States the maximum value of shares resolved to be repurchased if before the completion of the repurchase period, or the actual purchase price of shares repurchased pursuant to that resolution if after the completion of the repurchase period. *6 Figures for R&D expenses are R&D activity related expenditures incurred during the reporting period and do not conform to research and development costs on Toyota's Consolidated Statement of Income 28 *7 Figures for depreciation expenses and capital expenditures do not include vehicles in operating lease or right of use assets
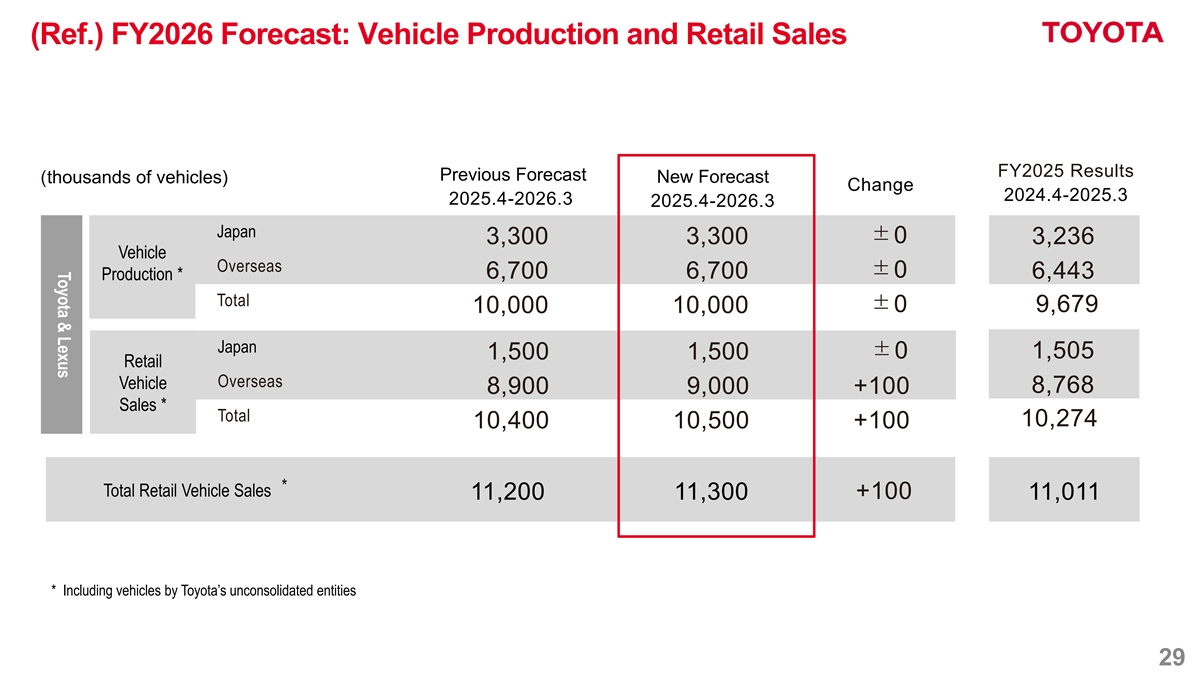
Toyota & Lexus (Ref.) FY2026 Forecast: Vehicle Production and Retail Sales FY2025 Results Previous Forecast New Forecast (thousands of vehicles) Change 2024.4-2025.3 2025.4-2026.3 2025.4-2026.3 Japan ±0 3,300 3,300 3,236 Vehicle 生産 Overseas ±0 6,700 6,700 6,443 Production * Total ±0 9,679 10,000 10,000 Japan ±0 1,505 1,500 1,500 Retail Overseas Vehicle 8,768 8,900 9,000 +100 Sales * Total 10,274 10,400 10,500 +100 * Total Retail Vehicle Sales +100 11,200 11,300 11,011 * Including vehicles by Toyota’s unconsolidated entities 29
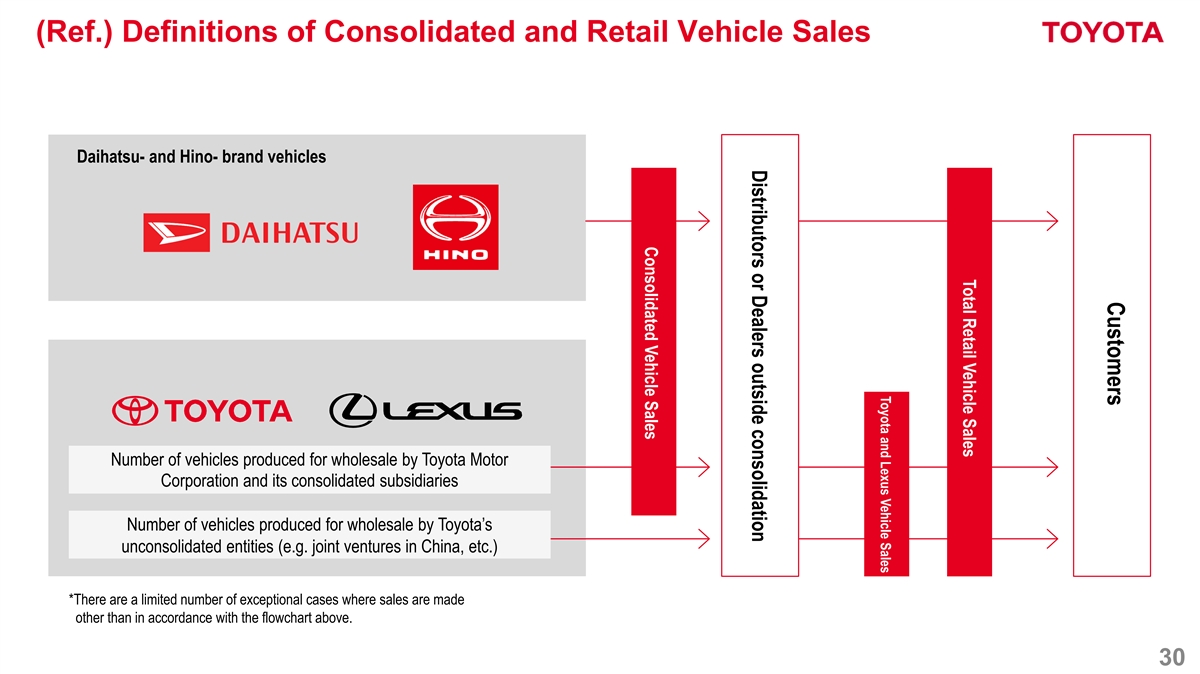
Customers Total Retail Vehicle Sales Toyota and Lexus Vehicle Sales Distributors or Dealers outside consolidation Consolidated Vehicle Sales (Ref.) Definitions of Consolidated and Retail Vehicle Sales Daihatsu- and Hino- brand vehicles Number of vehicles produced for wholesale by Toyota Motor Corporation and its consolidated subsidiaries Number of vehicles produced for wholesale by Toyota’s unconsolidated entities (e.g. joint ventures in China, etc.) *There are a limited number of exceptional cases where sales are made other than in accordance with the flowchart above. 30