FY2026 Third Quarter Financial Results Toyota Motor Corporation GR GT3 GR GT February 6, 2026
Cautionary Statement with Respect to Forward-Looking Statements and Caution Concerning Insider Trading This presentation contains forward-looking statements that reflect the plans and expectations of Toyota Motor Corporation and its consolidated subsidiaries (“Toyota”). These forward-looking statements are not guarantees of future performance and involve known and unknown risks, uncertainties and other factors that may cause Toyota’s actual results, performance, achievements or financial position to be materially different from any future results, performance, achievements or financial position expressed or implied by these forward-looking statements. These factors include, but are not limited to: (i) changes in economic conditions, market demand, and the competitive environment affecting the automotive markets in Japan, North America, Europe, Asia and other markets in which Toyota operates; (ii) fluctuations in currency exchange rates (particularly with respect to the value of the Japanese yen, the U.S. dollar, the euro, the Australian dollar, the Canadian dollar and the British pound), stock prices and interest rates; (iii) changes in funding environment in financial markets and increased competition in the financial services industry; (iv) Toyota’s ability to market and distribute effectively; (v) Toyota’s ability to realize production efficiencies and to implement capital expenditures at the levels and times planned by management;(vi) changes in the laws and regulations, as well as other government actions, in the markets in which Toyota operates that affect Toyota’s operations, particularly laws, regulations and government actions relating to vehicle safety including remedial measures such as recalls, environmental protection, vehicle emissions and vehicle fuel economy, and tariffs and other trade policies, as well as current and future litigation and other legal proceedings, government proceedings and investigations; (vii) political and economic instability in the markets in which Toyota operates; (viii) Toyota’s ability to timely develop and achieve market acceptance of new products that meet customer demand; (ix) any damage to Toyota’s brand image; (x) Toyota’s reliance on various suppliers for the provision of supplies; (xi) increases in prices of raw materials; (xii) Toyota’s reliance on various digital and information technologies, as well as information security; (xiii) fuel shortages or interruptions in electricity, transportation systems, labor strikes, work stoppages or other interruptions to, or difficulties in, the employment of labor in the major markets where Toyota purchases materials, components and supplies for the production of its products or where its products are produced, distributed or sold; (xiv) the impact of natural calamities, epidemics, political and economic instability, fuel shortages or interruptions in social infrastructure, wars, terrorism and labor strikes, including their negative effect on Toyota’s vehicle production and sales; (xv) the impact of climate change and the transition towards a low-carbon economy; and (xvi) the ability of Toyota to hire or retain sufficient human resources. A discussion of these and other factors which may affect Toyota’s actual results, performance, achievements or financial position is contained in Toyota Motor Corporation’s annual report on Form 20-F, which is on file with the United States Securities and Exchange Commission. Caution concerning Insider Trading Under Japanese securities laws and regulations (the Regulations ), subject to certain exceptions, any person who receives certain material information relating to the business, etc. of Toyota which may be contained in this document is prohibited from trading in Toyota's shares or certain other transactions related to such shares (as set forth in the Regulations) until such material information is deemed to be made public. Under the Regulations, material information is deemed to be made public when (i) such material information is notified to a stock exchange and is disclosed by ways of electromagnetic means as prescribed by the ordinance of the Cabinet Office (posting on the TDnet (Timely Disclosure Network) information service) or (ii) twelve (12) hours have elapsed since a listed company, such as Toyota, disclosed such material information to at least two (2) media sources as prescribed by the Regulations. 2
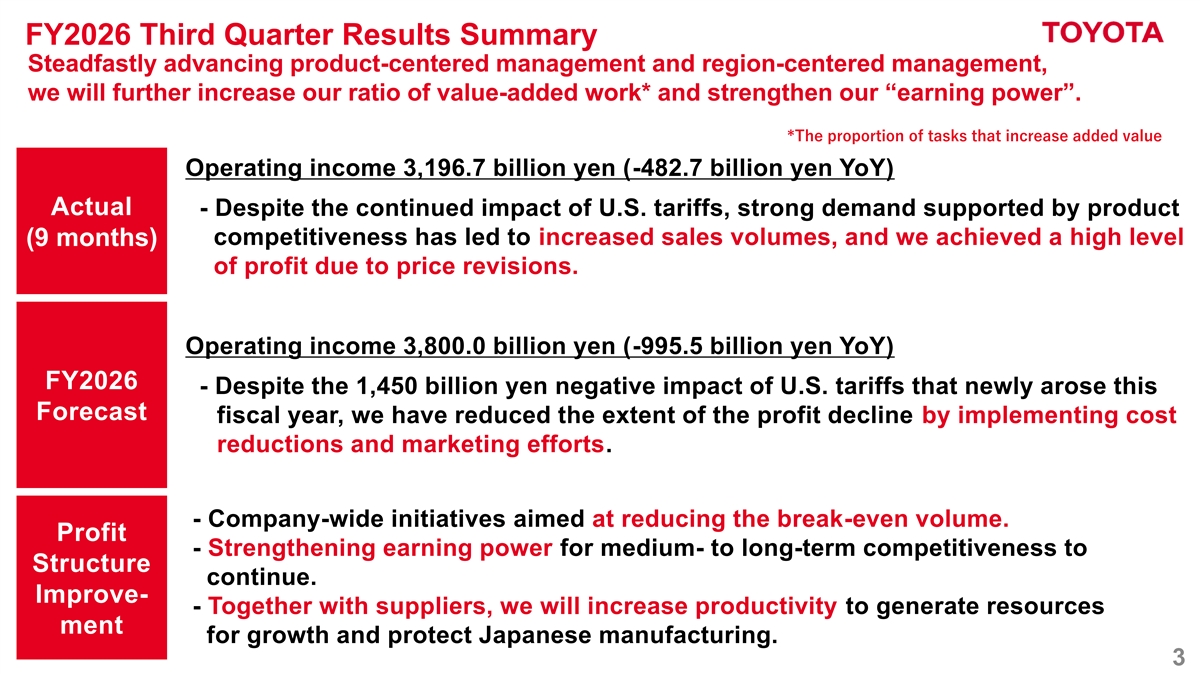
FY2026 Third Quarter Results Summary Steadfastly advancing product-centered management and region-centered management, we will further increase our ratio of value-added work* and strengthen our “earning power”. *The proportion of tasks that increase added value Operating income 3,196.7 billion yen (-482.7 billion yen YoY) Actual - Despite the continued impact of U.S. tariffs, strong demand supported by product competitiveness has led to increased sales volumes, and we achieved a high level (9 months) of profit due to price revisions. Operating income 3,800.0 billion yen (-995.5 billion yen YoY) FY2026 - Despite the 1,450 billion yen negative impact of U.S. tariffs that newly arose this Forecast fiscal year, we have reduced the extent of the profit decline by implementing cost reductions and marketing efforts. - Company-wide initiatives aimed at reducing the break-even volume. Profit - Strengthening earning power for medium- to long-term competitiveness to Structure continue. Improve- - Together with suppliers, we will increase productivity to generate resources ment for growth and protect Japanese manufacturing. 3
FY2026 Third Quarter Financial Performance 4
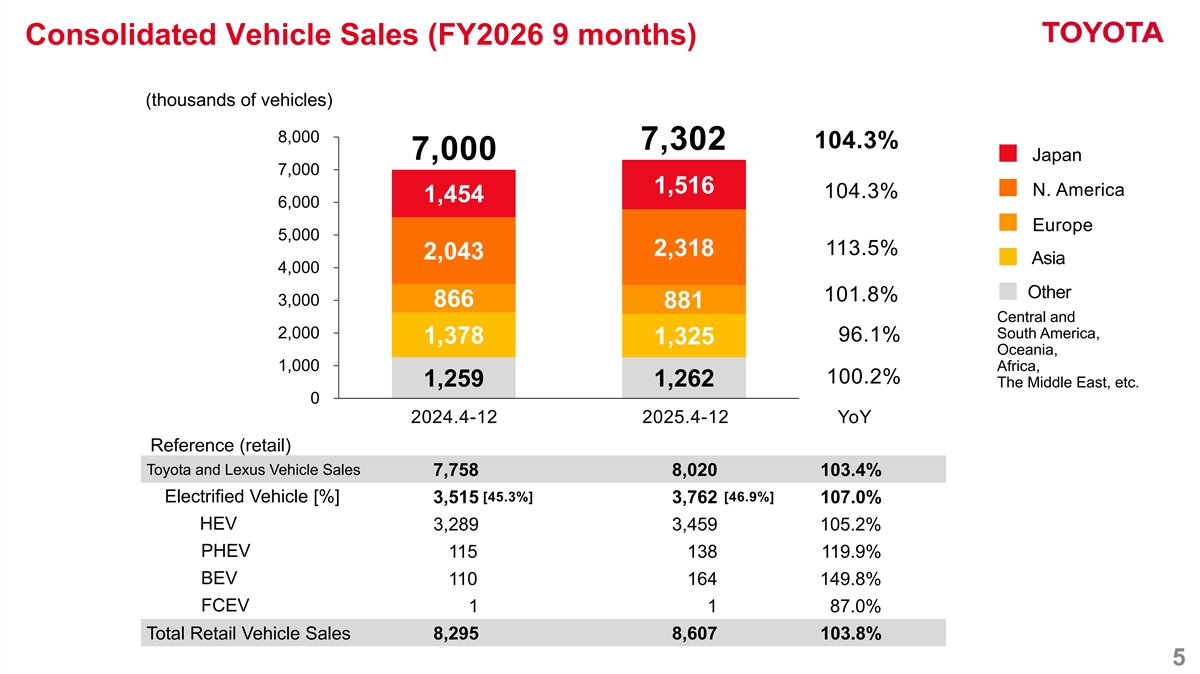
Consolidated Vehicle Sales (FY2026 9 months) (thousands of vehicles) 8,000 104.3% 7,302 7,000 Japan 7,000 1,516 N. America 104.3% 1,454 6,000 Europe 5,000 113.5% 2,318 2,043 Asia 4,000 Other 101.8% 3,000 866 881 Central and 2,000 South America, 96.1% 1,378 1,325 Oceania, 1,000 Africa, 100.2% 1,259 1,262 The Middle East, etc. 0 2024.4-12 2025.4-12 YoY Reference (retail) Toyota and Lexus Vehicle Sales 7,758 8,020 103.4% [45.3%] [46.9%] Electrified Vehicle [%] 3,515 3,762 107.0% HEV 3,289 3,459 105.2% PHEV 115 138 119.9% BEV 110 164 149.8% FCEV 1 1 87.0% Total Retail Vehicle Sales 8,295 8,607 103.8% 5
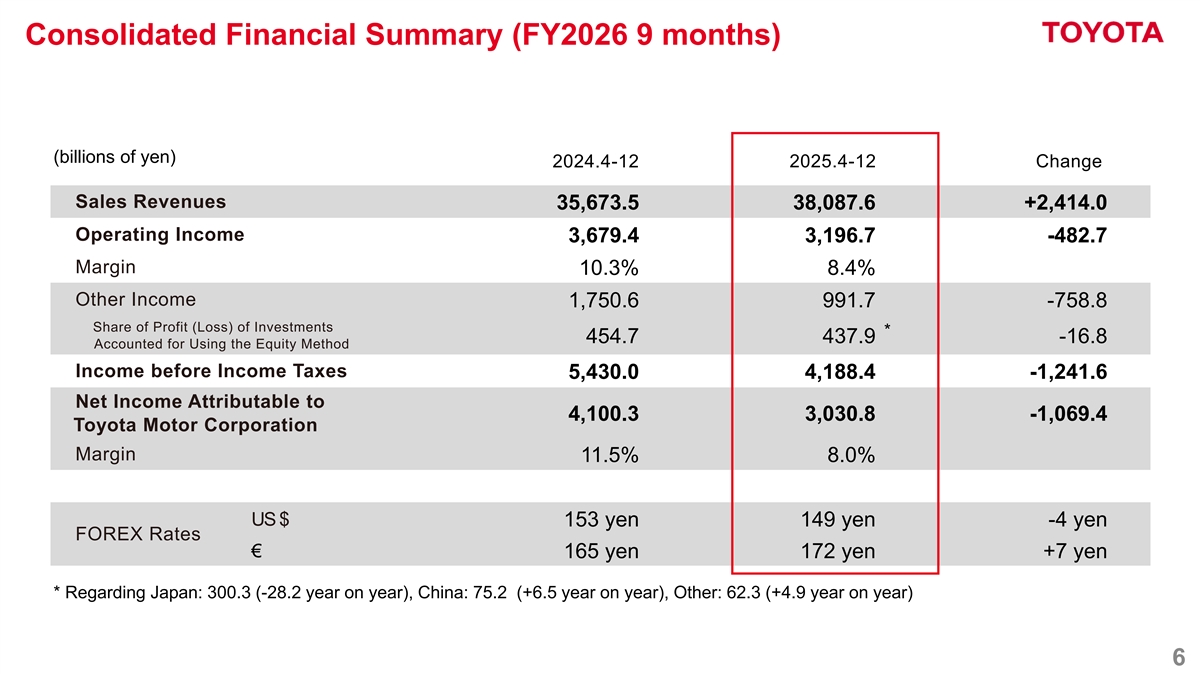
Consolidated Financial Summary (FY2026 9 months) (billions of yen) 2025.4-12 Change 2024.4-12 Sales Revenues 35,673.5 38,087.6 +2,414.0 Operating Income 3,679.4 3,196.7 -482.7 Margin 10.3% 8.4% Other Income 1,750.6 991.7 -758.8 Share of Profit (Loss) of Investments * 454.7 437.9 -16.8 Accounted for Using the Equity Method Income before Income Taxes 5,430.0 4,188.4 -1,241.6 Net Income Attributable to 4,100.3 3,030.8 -1,069.4 Toyota Motor Corporation Margin 11.5% 8.0% US $ 153 yen 149 yen -4 yen FOREX Rates € 165 yen 172 yen +7 yen * Regarding Japan: 300.3 (-28.2 year on year), China: 75.2 (+6.5 year on year), Other: 62.3 (+4.9 year on year) 6
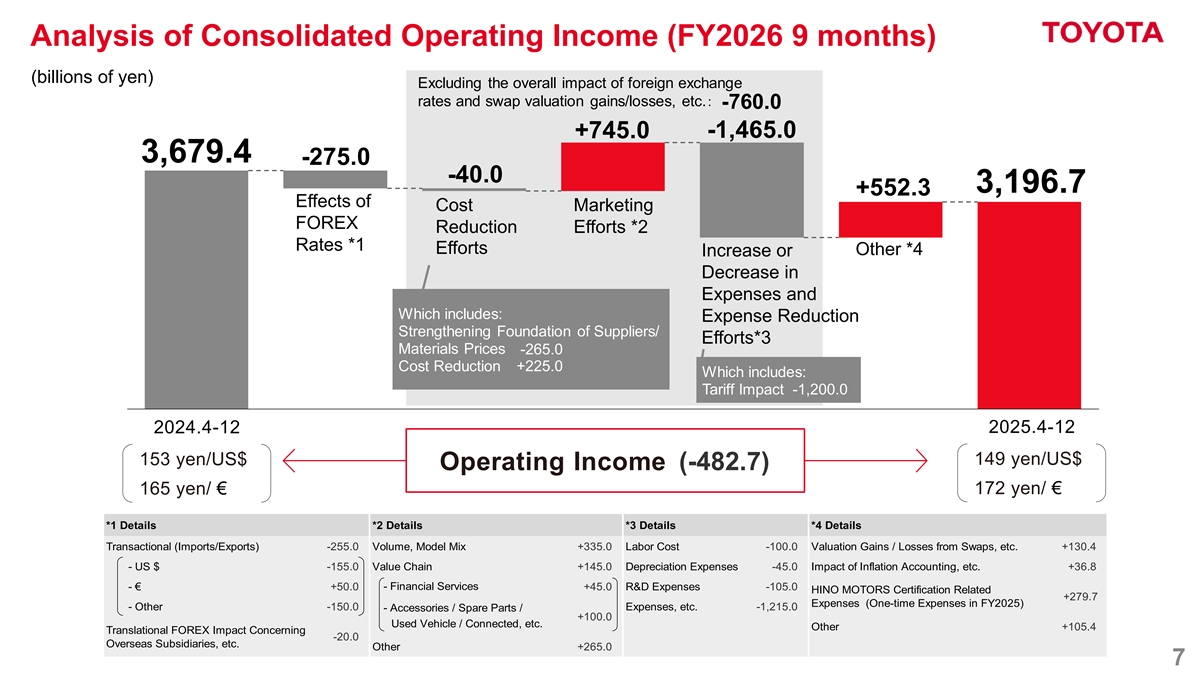
Analysis of Consolidated Operating Income (FY2026 9 months) (billions of yen) Excluding the overall impact of foreign exchange rates and swap valuation gains/losses, etc.: -760.0 -1,465.0 +745.0 3,679.4 -275.0 -40.0 3,196.7 +552.3 Effects of Cost Marketing ・市況影響: FOREX Reduction Efforts *2・原価改善:△ Rates *1※ Efforts Other *4 Increase or Decrease in Expenses and Which includes: Expense Reduction Strengthening Foundation of Suppliers/ Efforts*3 Materials Prices -265.0 Cost Reduction +225.0 Which includes: Tariff Impact -1,200.0 2025.4-12 2024.4-12 153 yen/US$ 149 yen/US$ Operating Income (-482.7) 172 yen/ € 165 yen/ € *1 Details *2 Details *3 Details *4 Details Transactional (Imports/Exports) -255.0 Volume, Model Mix +335.0 Labor Cost -100.0 Valuation Gains / Losses from Swaps, etc. +130.4 - US $ -155.0 Value Chain +145.0 Depreciation Expenses -45.0 Impact of Inflation Accounting, etc. +36.8 - € +50.0 - Financial Services +45.0 R&D Expenses -105.0 HINO MOTORS Certification Related +279.7 Expenses (One-time Expenses in FY2025) - Other -150.0 Expenses, etc. -1,215.0 - Accessories / Spare Parts / +100.0 Used Vehicle / Connected, etc. Other +105.4 Translational FOREX Impact Concerning -20.0 Overseas Subsidiaries, etc. Other +265.0 7
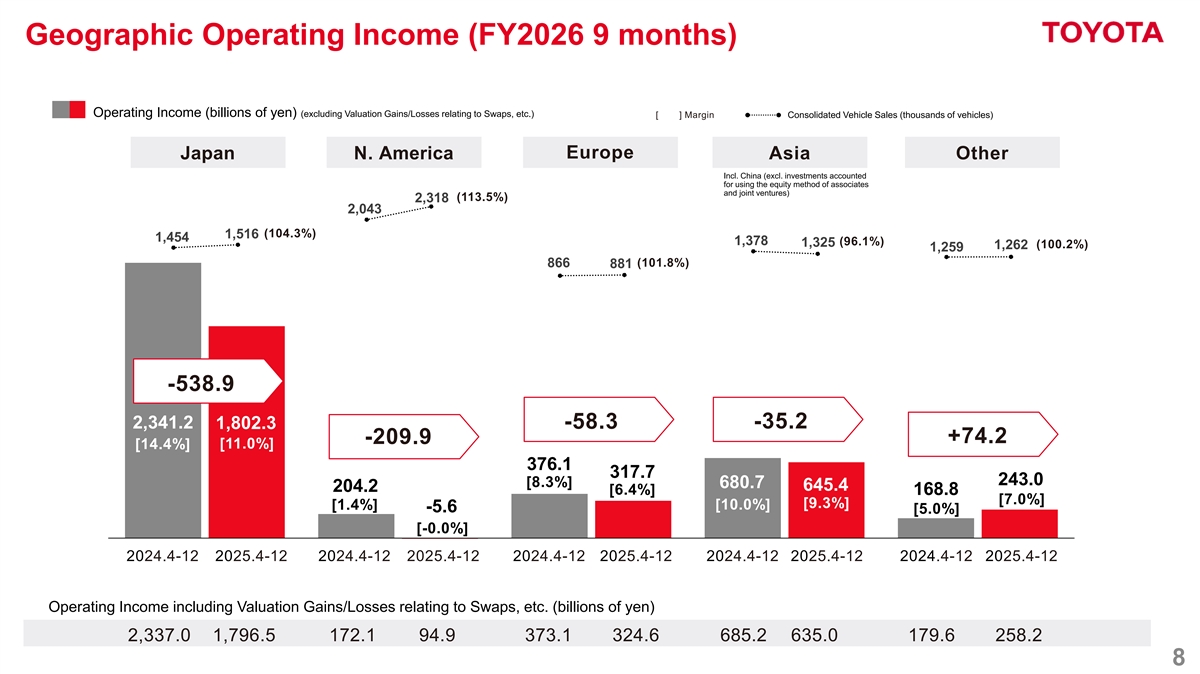
Geographic Operating Income (FY2026 9 months) Operating Income (billions of yen) (excluding Valuation Gains/Losses relating to Swaps, etc.) [ ] Margin Consolidated Vehicle Sales (thousands of vehicles) Europe Japan N. America Asia Other Incl. China (excl. investments accounted for using the equity method of associates and joint ventures) (113.5%) 2,318 2,043 (104.3%) 1,516 1,454 1,378 (96.1%) 1,325 (100.2%) 1,262 1,259 (101.8%) 866 881 -538.9 2,341.2 1,802.3 -58.3 -35.2 +74.2 -209.9 [11.0%] [14.4%] 376.1 317.7 243.0 [8.3%] 680.7 645.4 204.2 [6.4%] 168.8 [7.0%] [9.3%] [1.4%] [10.0%] -5.6 [5.0%] [-0.0%] 2024.4-12 2025.4-12 2024.4-12 2025.4-12 2024.4-12 2025.4-12 2024.4-12 2025.4-12 2024.4-12 2025.4-12 Operating Income including Valuation Gains/Losses relating to Swaps, etc. (billions of yen) 2,337.0 1,796.5 172.1 94.9 373.1 324.6 685.2 635.0 179.6 258.2 8
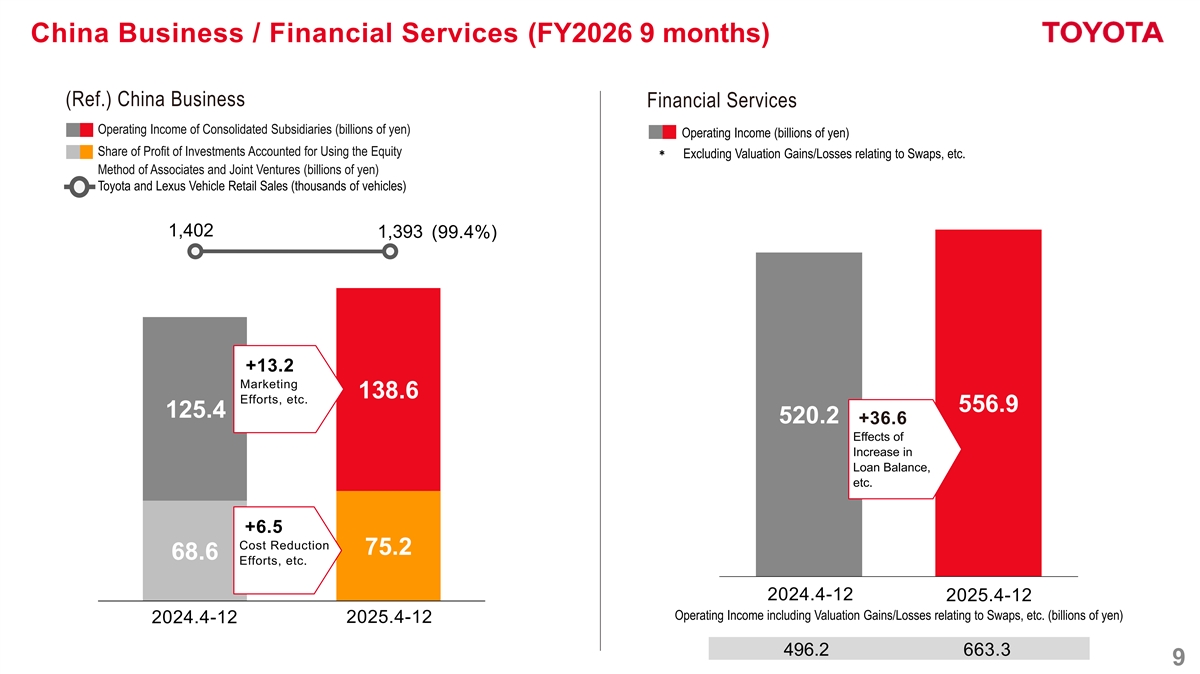
China Business / Financial Services (FY2026 9 months) (Ref.) China Business Financial Services Operating Income of Consolidated Subsidiaries (billions of yen) Operating Income (billions of yen) Share of Profit of Investments Accounted for Using the Equity* Excluding Valuation Gains/Losses relating to Swaps, etc. Method of Associates and Joint Ventures (billions of yen) Toyota and Lexus Vehicle Retail Sales (thousands of vehicles) 1,402 1,393 (99.4%) +13.2 Marketing 138.6 Efforts, etc. 556.9 125.4 520.2 +36.6 Effects of Increase in Loan Balance, etc. +6.5 Cost Reduction 75.2 68.6 Efforts, etc. 2024.4-12 2025.4-12 Operating Income including Valuation Gains/Losses relating to Swaps, etc. (billions of yen) 2025.4-12 2024.4-12 496.2 663.3 9

FY2026 Financial Forecasts 10
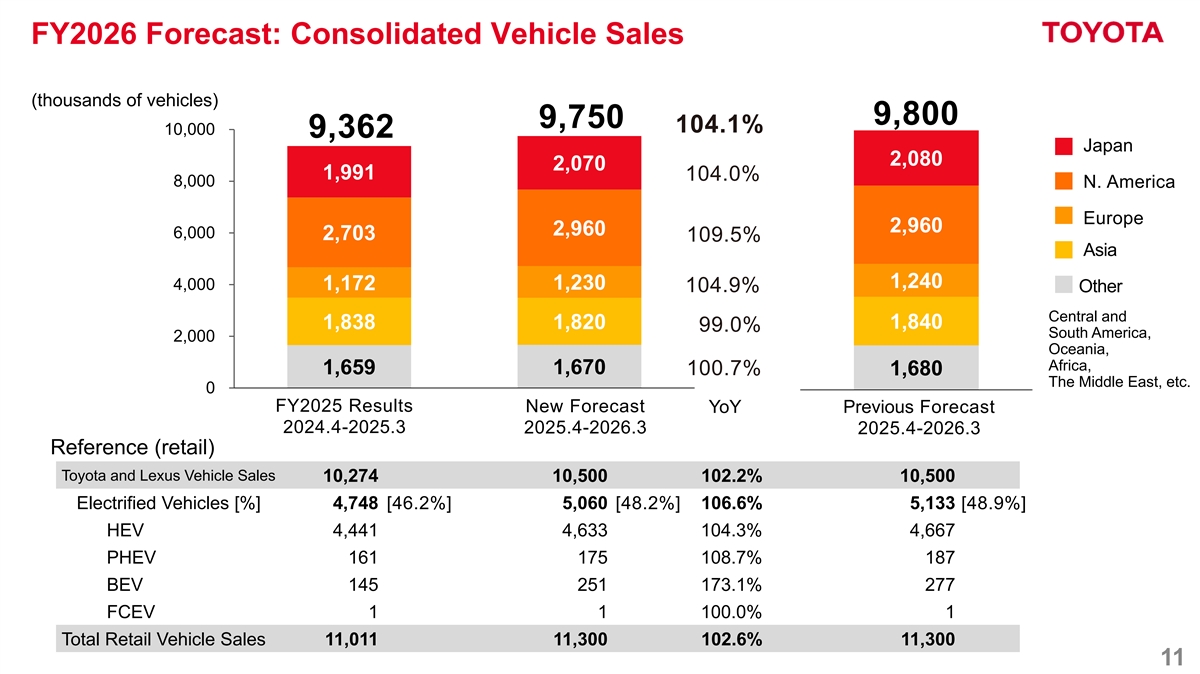
FY2026 Forecast: Consolidated Vehicle Sales (thousands of vehicles) 9,800 9,750 104.1% 10,000 9,362 Japan 2,080 2,070 1,991 104.0% 8,000 N. America Europe 2,960 2,960 6,000 2,703 109.5% Asia 1,240 4,000 1,230 1,172 104.9% Other Central and 1,838 1,820 1,840 99.0% South America, 2,000 Oceania, Africa, 1,659 1,670 100.7% 1,680 The Middle East, etc. 0 FY2025 Results New Forecast YoY Previous Forecast 2024.4-2025.3 2025.4-2026.3 2025.4-2026.3 Reference (retail) Toyota and Lexus Vehicle Sales 10,274 10,500 102.2% 10,500 Electrified Vehicles [%] 4,748 [46.2%] 5,060 [48.2%] 106.6% 5,133 [48.9%] HEV 4,441 4,633 104.3% 4,667 PHEV 161 175 108.7% 187 BEV 145 251 173.1% 277 FCEV 1 1 100.0% 1 Total Retail Vehicle Sales 11,011 11,300 102.6% 11,300 11
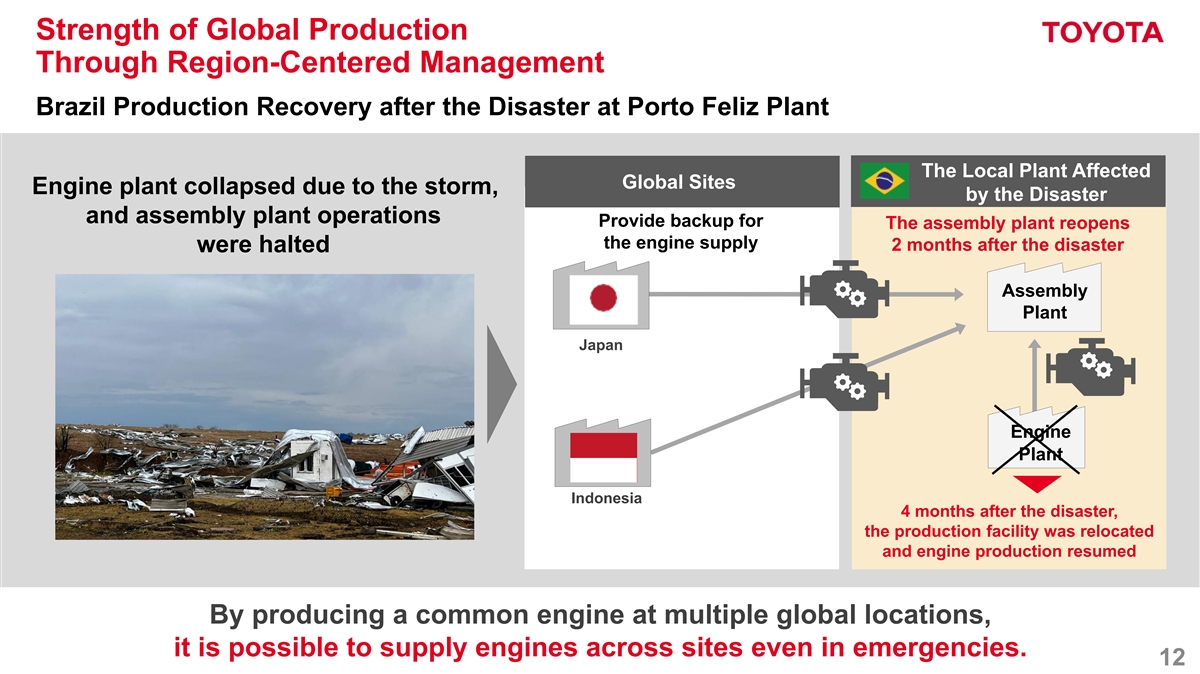
Strength of Global Production Through Region-Centered Management Brazil Production Recovery after the Disaster at Porto Feliz Plant The Local Plant Affected Global Sites Engine plant collapsed due to the storm, by the Disaster and assembly plant operations Provide backup for The assembly plant reopens the engine supply 2 months after the disaster were halted Assembly Plant Japan Engine Plant Indonesia 4 months after the disaster, the production facility was relocated and engine production resumed By producing a common engine at multiple global locations, it is possible to supply engines across sites even in emergencies. 12
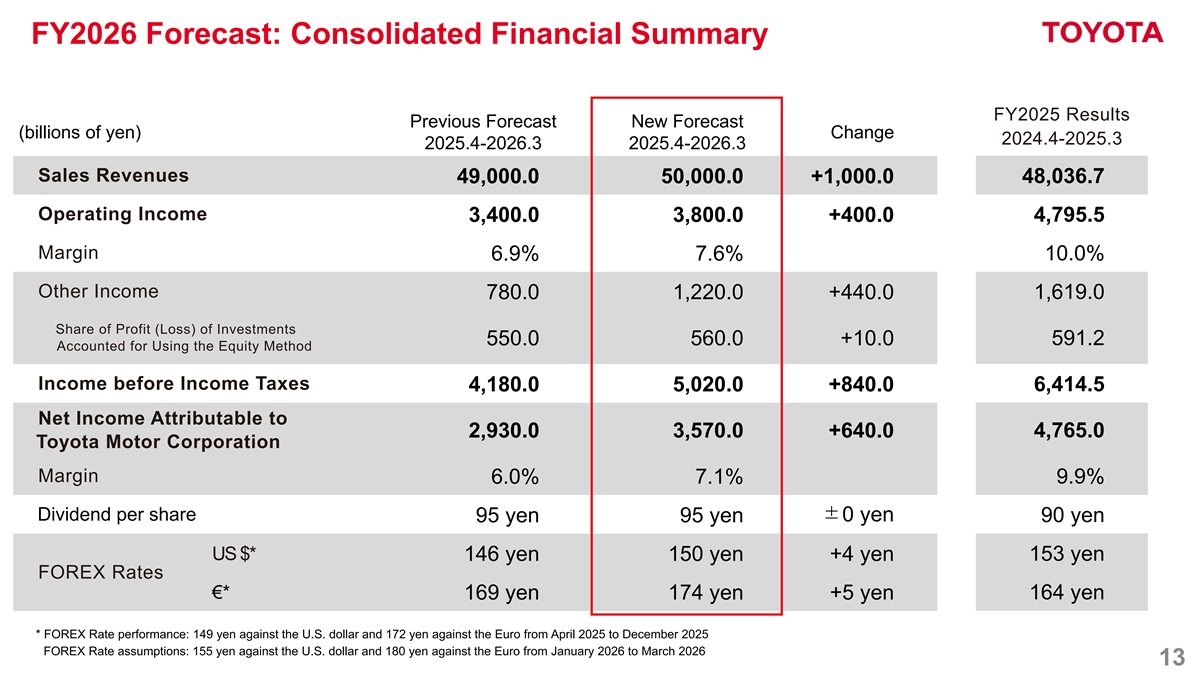
FY2026 Forecast: Consolidated Financial Summary FY2025 Results Previous Forecast New Forecast (billions of yen) Change 2024.4-2025.3 2025.4-2026.3 2025.4-2026.3 Sales Revenues 48,036.7 49,000.0 50,000.0 +1,000.0 Operating Income 4,795.5 3,400.0 3,800.0 +400.0 Margin 10.0% 6.9% 7.6% Other Income 1,619.0 780.0 1,220.0 +440.0 Share of Profit (Loss) of Investments 591.2 550.0 560.0 +10.0 Accounted for Using the Equity Method Income before Income Taxes 6,414.5 4,180.0 5,020.0 +840.0 Net Income Attributable to 4,765.0 2,930.0 3,570.0 +640.0 Toyota Motor Corporation Margin 6.0% 7.1% 9.9% Dividend per share ±0 yen 95 yen 95 yen 90 yen US $* 153 yen 146 yen 150 yen +4 yen FOREX Rates €* 164 yen 169 yen 174 yen +5 yen * FOREX Rate performance: 149 yen against the U.S. dollar and 172 yen against the Euro from April 2025 to December 2025 FOREX Rate assumptions: 155 yen against the U.S. dollar and 180 yen against the Euro from January 2026 to March 2026 13
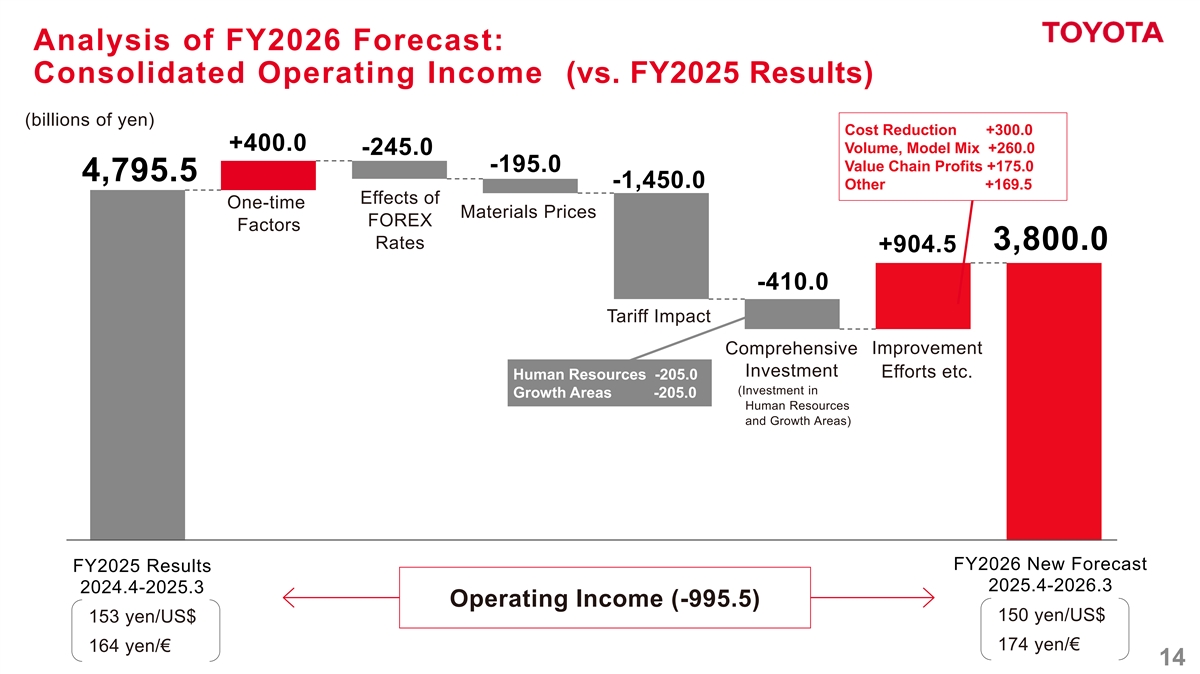
Analysis of FY2026 Forecast: Consolidated Operating Income (vs. FY2025 Results) (billions of yen) Cost Reduction +300.0 +400.0 Volume, Model Mix +260.0 -245.0 Value Chain Profits +175.0 -195.0 4,795.5 -1,450.0 Other +169.5 Effects of One-time Materials Prices FOREX Factors Rates 3,800.0 +904.5 -410.0 Tariff Impact Improvement Comprehensive Investment Efforts etc. Human Resources -205.0 (Investment in Growth Areas -205.0 Human Resources and Growth Areas) FY2026 New Forecast FY2025 Results 2025.4-2026.3 2024.4-2025.3 Operating Income (-995.5) 150 yen/US$ 153 yen/US$ 174 yen/€ 164 yen/€ 14
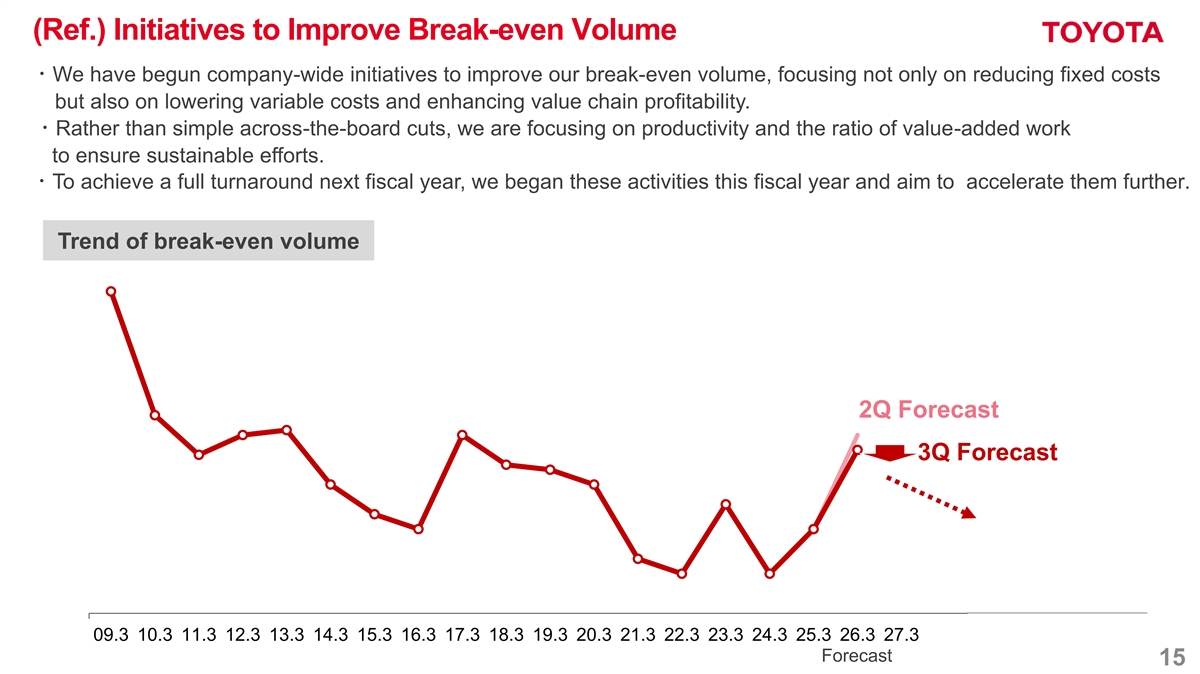
(Ref.) Initiatives to Improve Break-even Volume ・We have begun company-wide initiatives to improve our break-even volume, focusing not only on reducing fixed costs but also on lowering variable costs and enhancing value chain profitability. ・Rather than simple across-the-board cuts, we are focusing on productivity and the ratio of value-added work to ensure sustainable efforts. ・To achieve a full turnaround next fiscal year, we began these activities this fiscal year and aim to accelerate them further. Trend of break-even volume 2Q Forecast 3Q Forecast 09.3 10.3 11.3 12.3 13.3 14.3 15.3 16.3 17.3 18.3 19.3 20.3 21.3 22.3 23.3 24.3 25.3 26.3 27.3 Forecast 15
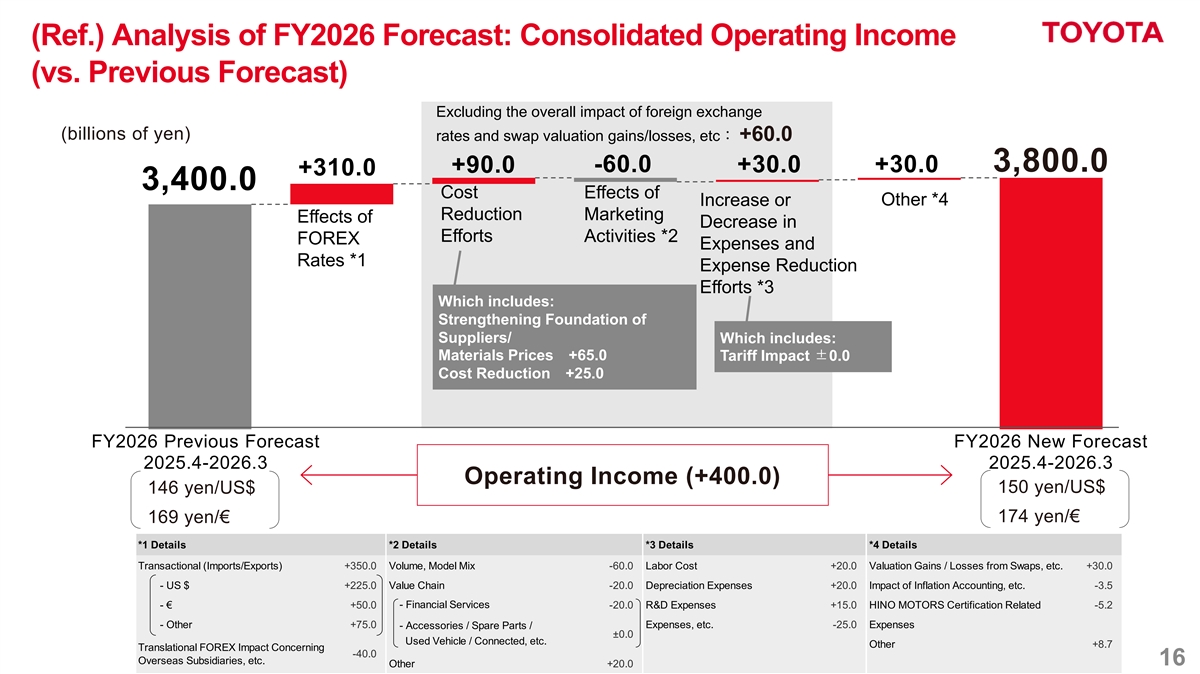
(Ref.) Analysis of FY2026 Forecast: Consolidated Operating Income (vs. Previous Forecast) Excluding the overall impact of foreign exchange (billions of yen) rates and swap valuation gains/losses, etc: +60.0 3,800.0 -60.0 +30.0 +30.0 +90.0 +310.0 3,400.0 Cost Effects of Other *4 Increase or Reduction Marketing Effects of Decrease in Efforts Activities *2 FOREX Expenses and Rates *1 Expense Reduction Efforts *3 Which includes: Strengthening Foundation of Suppliers/ Which includes: Materials Prices +65.0 Tariff Impact ±0.0 Cost Reduction +25.0 FY2026 Previous Forecast FY2026 New Forecast 2025.4-2026.3 2025.4-2026.3 Operating Income (+400.0) 150 yen/US$ 146 yen/US$ 174 yen/€ 169 yen/€ *1 Details *2 Details *3 Details *4 Details Transactional (Imports/Exports) +350.0 Volume, Model Mix -60.0 Labor Cost +20.0 Valuation Gains / Losses from Swaps, etc. +30.0 - US $ +225.0 Value Chain -20.0 Depreciation Expenses +20.0 Impact of Inflation Accounting, etc. -3.5 - € +50.0 - Financial Services -20.0 R&D Expenses +15.0 HINO MOTORS Certification Related -5.2 - Other +75.0 Expenses, etc. -25.0 Expenses - Accessories / Spare Parts / ±0.0 Used Vehicle / Connected, etc. Other +8.7 Translational FOREX Impact Concerning -40.0 Overseas Subsidiaries, etc. 16 Other +20.0
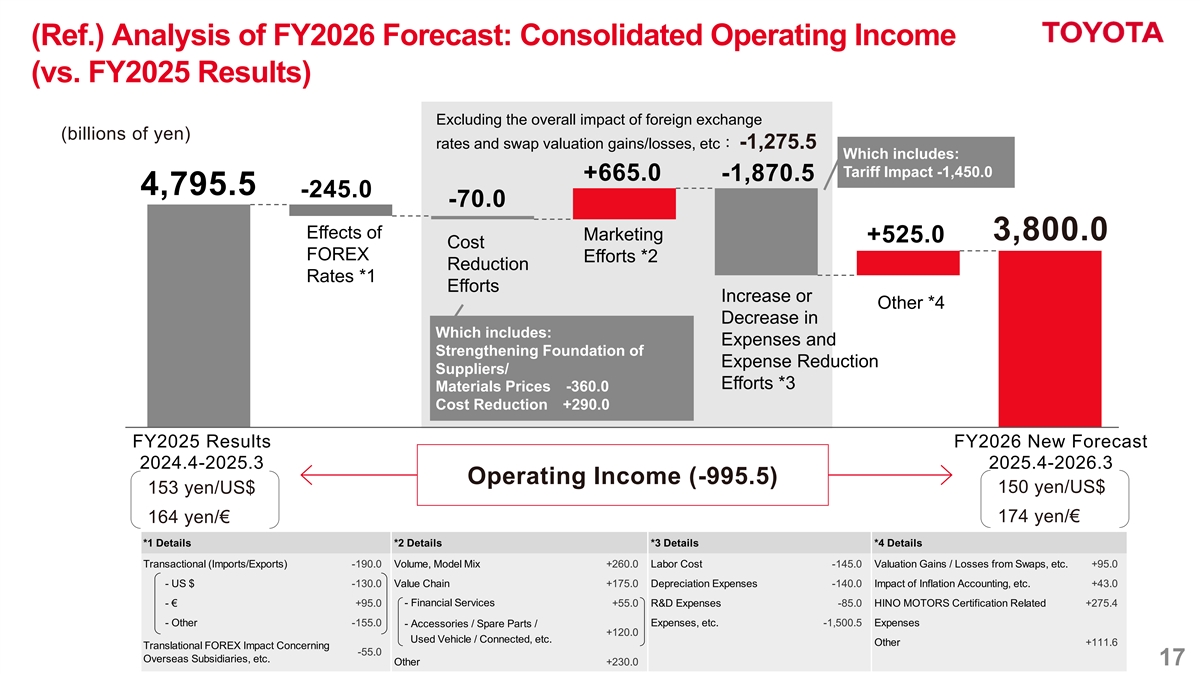
(Ref.) Analysis of FY2026 Forecast: Consolidated Operating Income (vs. FY2025 Results) Excluding the overall impact of foreign exchange (billions of yen) rates and swap valuation gains/losses, etc: -1,275.5 Which includes: Tariff Impact -1,450.0 +665.0 -1,870.5 4,795.5 -245.0 -70.0 Effects of Marketing 3,800.0 +525.0 Cost FOREX Efforts *2 Reduction Rates *1 Efforts Increase or Other *4 Decrease in Which includes: Expenses and Strengthening Foundation of Expense Reduction Suppliers/ Efforts *3 Materials Prices -360.0 Cost Reduction +290.0 FY2025 Results FY2026 New Forecast 2024.4-2025.3 2025.4-2026.3 Operating Income (-995.5) 150 yen/US$ 153 yen/US$ 174 yen/€ 164 yen/€ *1 Details *2 Details *3 Details *4 Details Transactional (Imports/Exports) -190.0 Volume, Model Mix +260.0 Labor Cost -145.0 Valuation Gains / Losses from Swaps, etc. +95.0 - US $ -130.0 Value Chain +175.0 Depreciation Expenses -140.0 Impact of Inflation Accounting, etc. +43.0 - Financial Services - € +95.0 +55.0 R&D Expenses -85.0 HINO MOTORS Certification Related +275.4 - Other -155.0 Expenses, etc. -1,500.5 Expenses - Accessories / Spare Parts / +120.0 Used Vehicle / Connected, etc. Other +111.6 Translational FOREX Impact Concerning -55.0 Overseas Subsidiaries, etc. Other +230.0 17
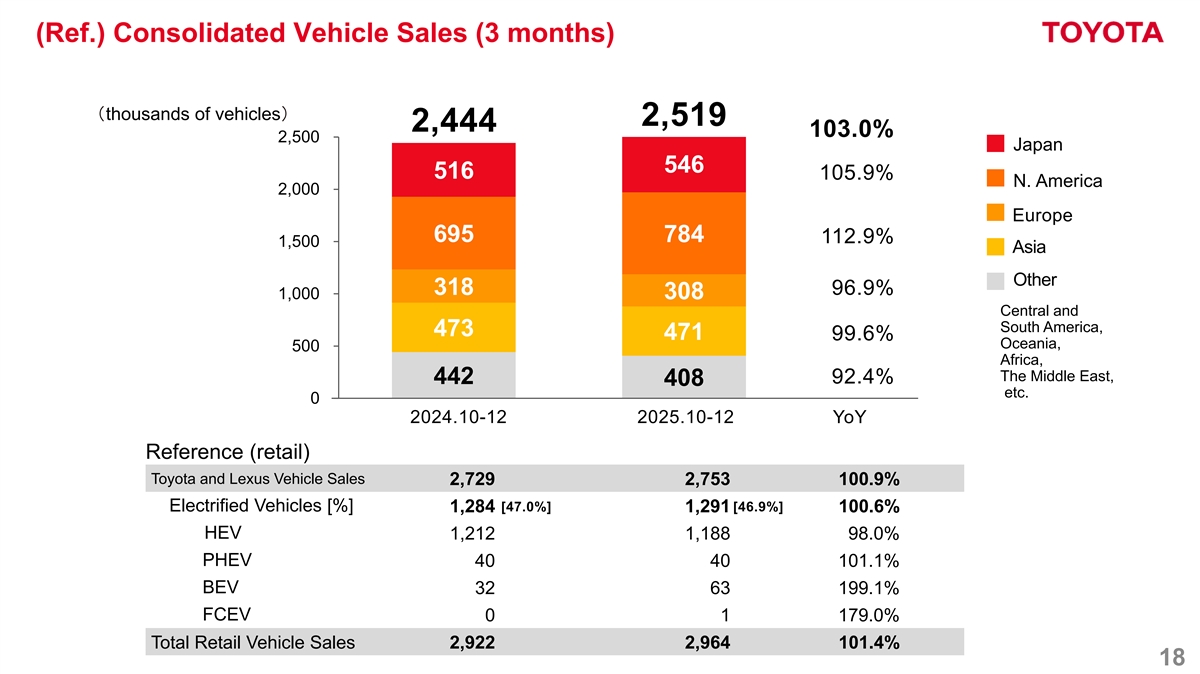
(Ref.) Consolidated Vehicle Sales (3 months) (thousands of vehicles) 2,519 2,444 103.0% 2,500 Japan 546 516 105.9% N. America 2,000 Europe 695 784 112.9% 1,500 Asia Other 318 96.9% 1,000 308 Central and South America, 473 471 99.6% Oceania, 500 Africa, The Middle East, 92.4% 442 408 etc. 0 2024.10-12 2025.10-12 YoY Reference (retail) Toyota and Lexus Vehicle Sales 2,729 2,753 100.9% Electrified Vehicles [%] [47.0%] [46.9%] 1,284 1,291 100.6% HEV 1,212 1,188 98.0% PHEV 40 40 101.1% BEV 32 63 199.1% FCEV 0 1 179.0% Total Retail Vehicle Sales 2,922 2,964 101.4% 18
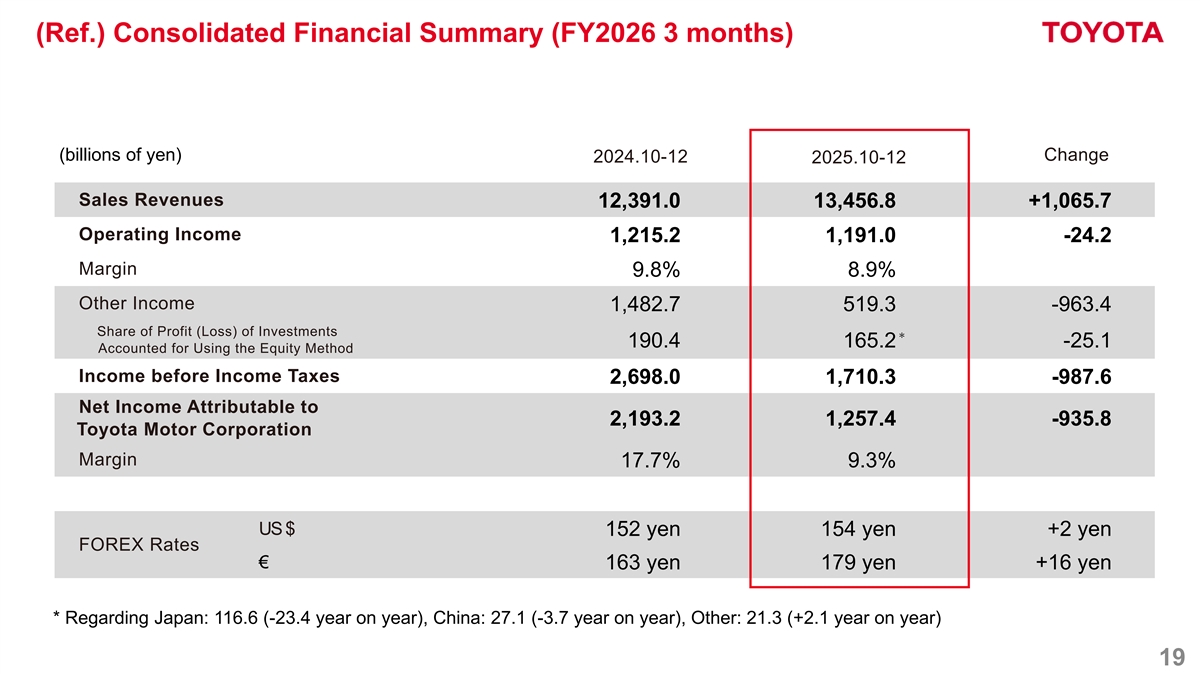
(Ref.) Consolidated Financial Summary (FY2026 3 months) (billions of yen) Change 2024.10-12 2025.10-12 Sales Revenues 12,391.0 13,456.8 +1,065.7 Operating Income 1,215.2 1,191.0 -24.2 Margin 9.8% 8.9% Other Income 1,482.7 519.3 -963.4 Share of Profit (Loss) of Investments * 190.4 165.2 -25.1 Accounted for Using the Equity Method Income before Income Taxes 2,698.0 1,710.3 -987.6 Net Income Attributable to 2,193.2 1,257.4 -935.8 Toyota Motor Corporation Margin 17.7% 9.3% US $ 152 yen 154 yen +2 yen FOREX Rates € 163 yen 179 yen +16 yen * Regarding Japan: 116.6 (-23.4 year on year), China: 27.1 (-3.7 year on year), Other: 21.3 (+2.1 year on year) 19
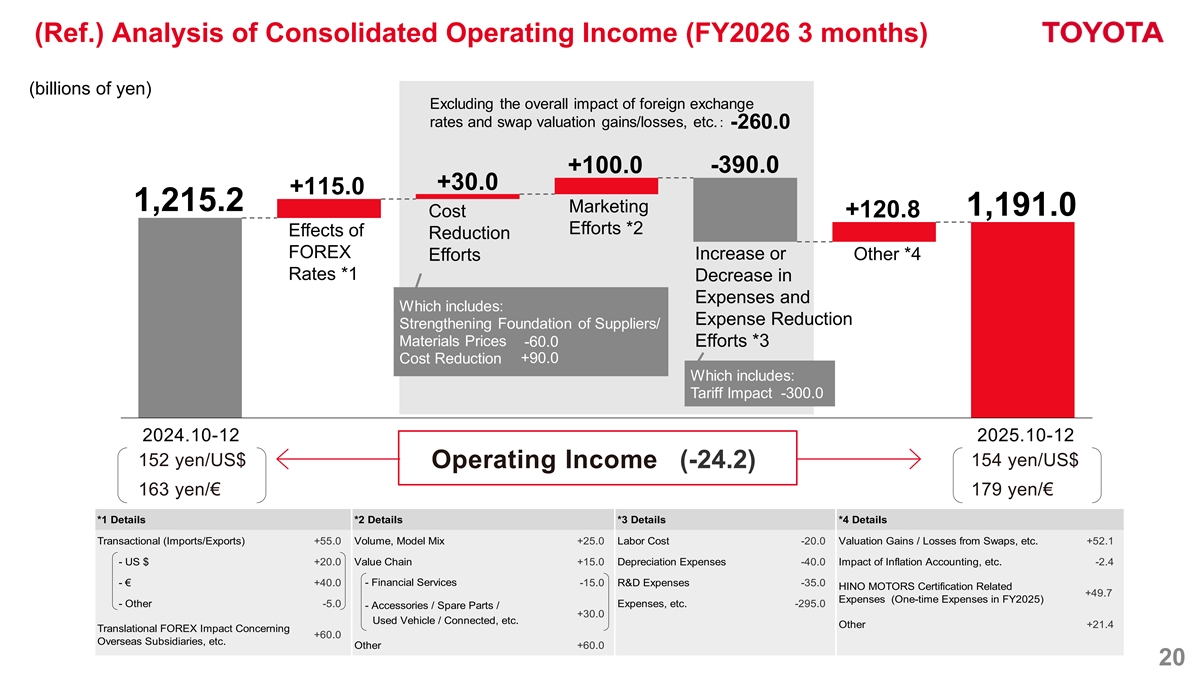
(Ref.) Analysis of Consolidated Operating Income (FY2026 3 months) (billions of yen) Excluding the overall impact of foreign exchange rates and swap valuation gains/losses, etc.: -260.0 +100.0 -390.0 +30.0 +115.0 1,215.2 Marketing 1,191.0 Cost +120.8 Efforts *2 Effects of Reduction FOREX Increase or Other *4 Efforts Rates *1 Decrease in Expenses and Which includes: Expense Reduction Strengthening Foundation of Suppliers/ Materials Prices -60.0 Efforts *3 +90.0 Cost Reduction Which includes: Tariff Impact -300.0 2024.10-12 2025.10-12 152 yen/US$ 154 yen/US$ Operating Income (-24.2) 163 yen/€ 179 yen/€ *1 Details *2 Details *3 Details *4 Details Transactional (Imports/Exports) +55.0 Volume, Model Mix +25.0 Labor Cost -20.0 Valuation Gains / Losses from Swaps, etc. +52.1 - US $ +20.0 Value Chain +15.0 Depreciation Expenses -40.0 Impact of Inflation Accounting, etc. -2.4 - Financial Services - € +40.0 -15.0 R&D Expenses -35.0 HINO MOTORS Certification Related +49.7 Expenses (One-time Expenses in FY2025) - Other -5.0 Expenses, etc. -295.0 - Accessories / Spare Parts / +30.0 Used Vehicle / Connected, etc. Other +21.4 Translational FOREX Impact Concerning +60.0 Overseas Subsidiaries, etc. Other +60.0 20
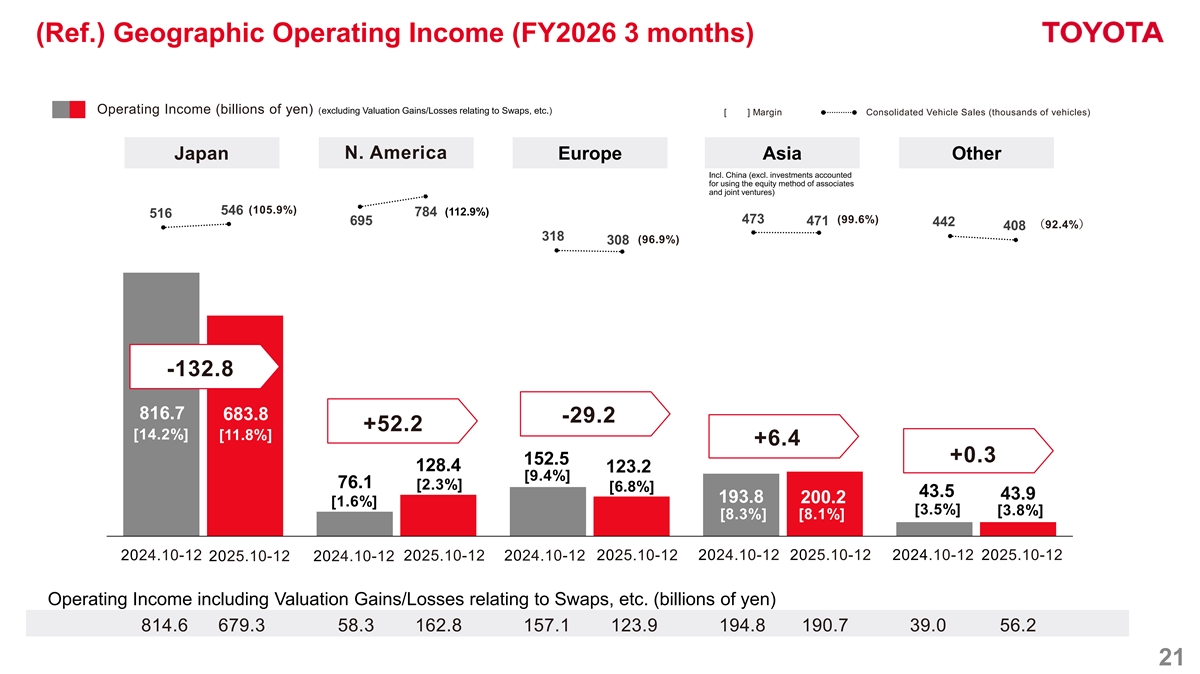
(Ref.) Geographic Operating Income (FY2026 3 months) Operating Income (billions of yen) (excluding Valuation Gains/Losses relating to Swaps, etc.) [ ] Margin Consolidated Vehicle Sales (thousands of vehicles) N. America Japan Europe Asia Other Incl. China (excl. investments accounted for using the equity method of associates and joint ventures) (105.9%) 546 (112.9%) 784 516 (99.6%) 473 695 471 442 (92.4%) 408 318 (96.9%) 308 -132.8 816.7 683.8 -29.2 +52.2 [14.2%] [11.8%] +6.4 +0.3 152.5 128.4 123.2 [9.4%] 76.1 [2.3%] [6.8%] 43.5 43.9 193.8 200.2 [1.6%] [3.5%] [3.8%] [8.3%] [8.1%] 2024.10-12 2025.10-12 2024.10-12 2025.10-12 2024.10-12 2025.10-12 2024.10-12 2025.10-12 2025.10-12 2024.10-12 Operating Income including Valuation Gains/Losses relating to Swaps, etc. (billions of yen) 814.6 679.3 58.3 162.8 157.1 123.9 194.8 190.7 39.0 56.2 21
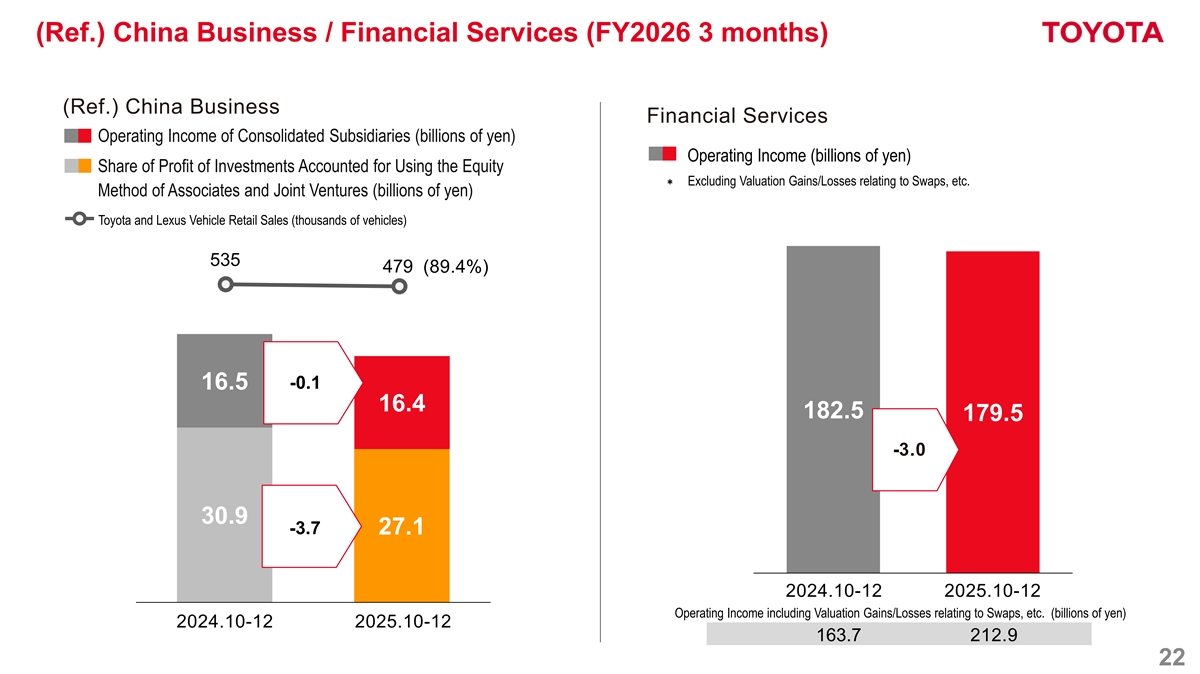
(Ref.) China Business / Financial Services (FY2026 3 months) (Ref.) China Business Financial Services Operating Income of Consolidated Subsidiaries (billions of yen) Operating Income (billions of yen) Share of Profit of Investments Accounted for Using the Equity * Excluding Valuation Gains/Losses relating to Swaps, etc. Method of Associates and Joint Ventures (billions of yen) Toyota and Lexus Vehicle Retail Sales (thousands of vehicles) 535 479 (89.4%) -0.1 16.5 16.4 182.5 179.5 -3.0 30.9 -3.7 27.1 2024.10-12 2025.10-12 Operating Income including Valuation Gains/Losses relating to Swaps, etc. (billions of yen) 2024.10-12 2025.10-12 163.7 212.9 22
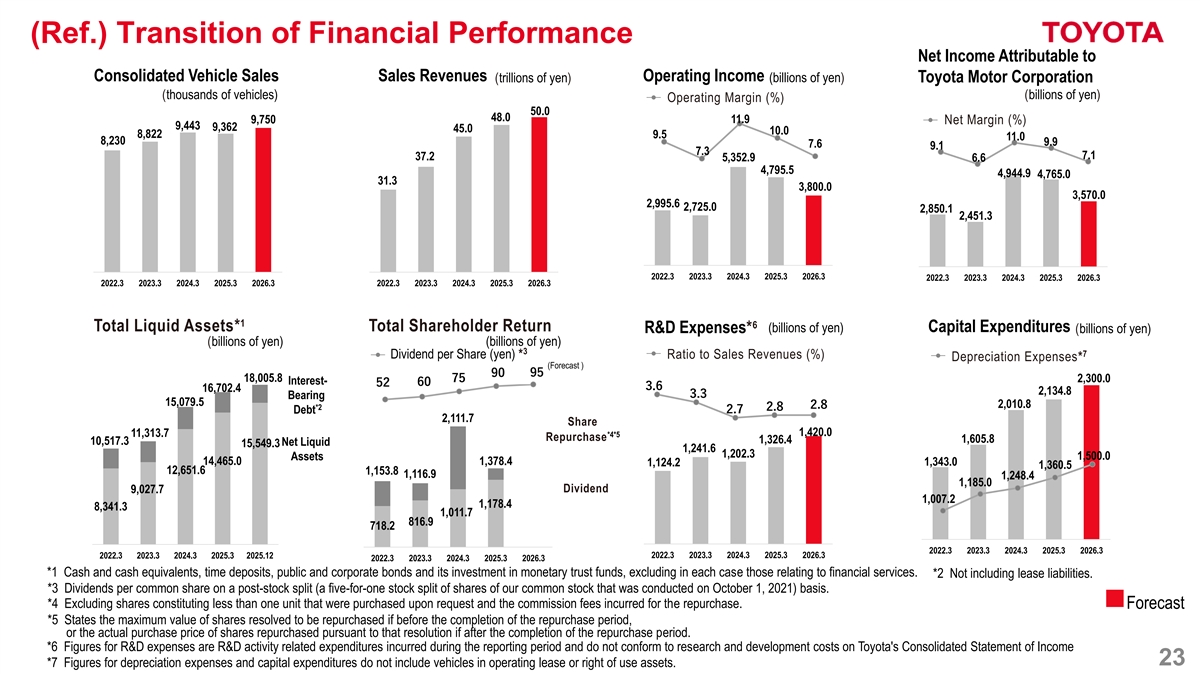
(Ref.) Transition of Financial Performance Net Income Attributable to Consolidated Vehicle Sales Sales Revenues Operating Income (trillions of yen) (billions of yen) Toyota Motor Corporation (thousands of vehicles) (billions of yen) Operating Margin (%) 50.0 48.0 11.9 9,750 Net Margin (%) 9,443 9,362 45.0 10.0 8,822 9.5 11.0 8,230 9.9 7.6 9.1 7.3 7.1 37.2 5,352.9 6.6 4,795.5 4,944.9 4,765.0 31.3 3,800.0 3,570.0 2,995.6 2,725.0 2,850.1 2,451.3 2022.3 2023.3 2024.3 2025.3 2026.3 2022.3 2023.3 2024.3 2025.3 2026.3 2022.3 2023.3 2024.3 2025.3 2026.3 2022.3 2023.3 2024.3 2025.3 2026.3 1 6 Total Liquid Assets* Total Shareholder Return (billions of yen) Capital Expenditures R&D Expenses* (billions of yen) (billions of yen) (billions of yen) 3 7 Dividend per Share (yen) * Ratio to Sales Revenues (%) Depreciation Expenses* (Forecast ) 90 95 18,005.8 75 2,300.0 Interest- 60 52 3.6 16,702.4 2,134.8 3.3 Bearing 15,079.5 2,010.8 2.8 *2 2.8 2.7 Debt 2,111.7 Share 1,420.0 11,313.7 *4*5 Repurchase 1,605.8 1,326.4 10,517.3 Net Liquid 15,549.3 1,241.6 1,202.3 1,500.0 Assets 14,465.0 1,378.4 1,343.0 1,124.2 1,360.5 12,651.6 1,153.8 1,116.9 1,248.4 1,185.0 Dividend 9,027.7 1,007.2 1,178.4 8,341.3 1,011.7 816.9 718.2 2022.3 2023.3 2024.3 2025.3 2026.3 2022.3 2023.3 2024.3 2025.3 2025.12 2022.3 2023.3 2024.3 2025.3 2026.3 2022.3 2023.3 2024.3 2025.3 2026.3 *1 Cash and cash equivalents, time deposits, public and corporate bonds and its investment in monetary trust funds, excluding in each case those relating to financial services. *2 Not including lease liabilities. *3 Dividends per common share on a post-stock split (a five-for-one stock split of shares of our common stock that was conducted on October 1, 2021) basis. *4 Excluding shares constituting less than one unit that were purchased upon request and the commission fees incurred for the repurchase. Forecast *5 States the maximum value of shares resolved to be repurchased if before the completion of the repurchase period, or the actual purchase price of shares repurchased pursuant to that resolution if after the completion of the repurchase period. *6 Figures for R&D expenses are R&D activity related expenditures incurred during the reporting period and do not conform to research and development costs on Toyota's Consolidated Statement of Income 23 *7 Figures for depreciation expenses and capital expenditures do not include vehicles in operating lease or right of use assets.
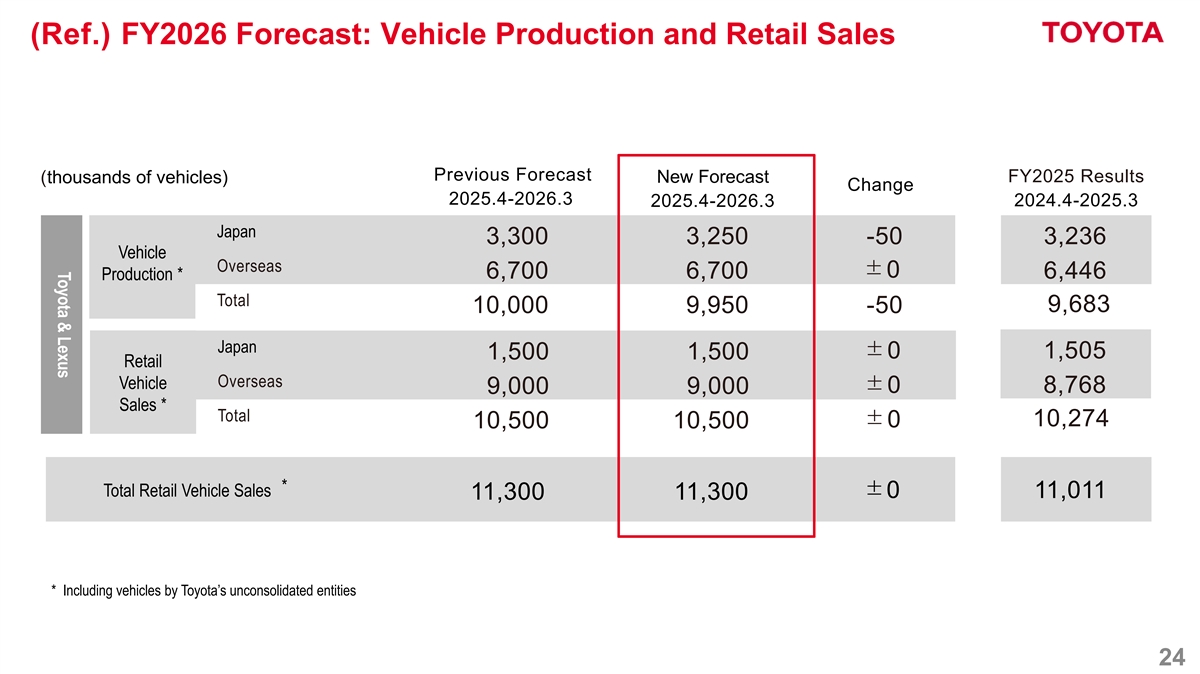
Toyota & Lexus (Ref.) FY2026 Forecast: Vehicle Production and Retail Sales Previous Forecast FY2025 Results New Forecast (thousands of vehicles) Change 2025.4-2026.3 2024.4-2025.3 2025.4-2026.3 Japan 3,300 3,250 -50 3,236 Vehicle 生産 Overseas ±0 6,700 6,700 6,446 Production * Total 9,683 10,000 9,950 -50 Japan ±0 1,505 1,500 1,500 Retail Overseas Vehicle 8,768 ±0 9,000 9,000 Sales * Total 10,274 ±0 10,500 10,500 * Total Retail Vehicle Sales ±0 11,011 11,300 11,300 * Including vehicles by Toyota’s unconsolidated entities 24
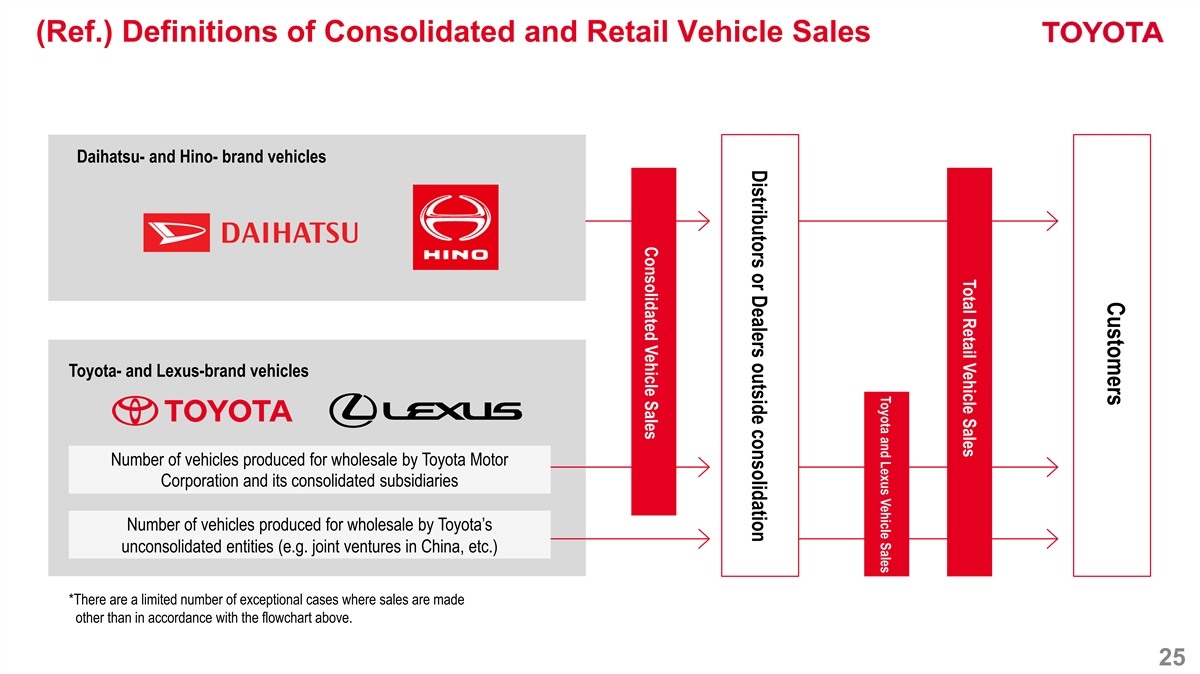
Customers Total Retail Vehicle Sales Toyota and Lexus Vehicle Sales Distributors or Dealers outside consolidation Consolidated Vehicle Sales (Ref.) Definitions of Consolidated and Retail Vehicle Sales Daihatsu- and Hino- brand vehicles Toyota- and Lexus-brand vehicles Number of vehicles produced for wholesale by Toyota Motor Corporation and its consolidated subsidiaries Number of vehicles produced for wholesale by Toyota’s unconsolidated entities (e.g. joint ventures in China, etc.) *There are a limited number of exceptional cases where sales are made other than in accordance with the flowchart above. 25