FY2026 Financial Results LEXUS ES Toyota Motor Corporation May 8, 2026
Cautionary Statement with Respect to Forward-Looking Statements and Caution Concerning Insider Trading This presentation contains forward-looking statements that reflect the plans and expectations of Toyota Motor Corporation and its consolidated subsidiaries (“Toyota”). These forward-looking statements are not guarantees of future performance and involve known and unknown risks, uncertainties and other factors that may cause Toyota’s actual results, performance, achievements or financial position to be materially different from any future results, performance, achievements or financial position expressed or implied by these forward-looking statements. These factors include, but are not limited to: (i) changes in economic conditions, market demand, and the competitive environment affecting the automotive markets in Japan, North America, Europe, Asia and other markets in which Toyota operates; (ii) fluctuations in currency exchange rates (particularly with respect to the value of the Japanese yen, the U.S. dollar, the euro, the Australian dollar, the Canadian dollar and the British pound), stock prices and interest rates; (iii) changes in funding environment in financial markets and increased competition in the financial services industry; (iv) Toyota’s ability to market and distribute effectively; (v) Toyota’s ability to realize production efficiencies and to implement capital expenditures at the levels and times planned by management;(vi) changes in the laws and regulations, as well as other government actions, in the markets in which Toyota operates that affect Toyota’s operations, particularly laws, regulations and government actions relating to vehicle safety including remedial measures such as recalls, environmental protection, vehicle emissions and vehicle fuel economy, and tariffs and other trade policies, as well as current and future litigation and other legal proceedings, government proceedings and investigations; (vii) political and economic instability in the markets in which Toyota operates; (viii) Toyota’s ability to timely develop and achieve market acceptance of new products that meet customer demand; (ix) any damage to Toyota’s brand image; (x) Toyota’s reliance on various suppliers for the provision of supplies; (xi) increases in prices of raw materials; (xii) Toyota’s reliance on various digital and information technologies, as well as information security; (xiii) fuel shortages or interruptions in electricity, transportation systems, labor strikes, work stoppages or other interruptions to, or difficulties in, the employment of labor in the major markets where Toyota purchases materials, components and supplies for the production of its products or where its products are produced, distributed or sold; (xiv) the impact of natural calamities, epidemics, political and economic instability, fuel shortages or interruptions in social infrastructure, wars, terrorism and labor strikes, including their negative effect on Toyota’s vehicle production and sales; (xv) the impact of climate change and the transition towards a low-carbon economy; and (xvi) the ability of Toyota to hire or retain sufficient human resources. A discussion of these and other factors which may affect Toyota’s actual results, performance, achievements or financial position is contained in Toyota Motor Corporation’s annual report on Form 20-F, which is on file with the United States Securities and Exchange Commission. Caution concerning Insider Trading Under Japanese securities laws and regulations (the Regulations ), subject to certain exceptions, any person who receives certain material information relating to the business, etc. of Toyota which may be contained in this document is prohibited from trading in Toyota's shares or certain other transactions related to such shares (as set forth in the Regulations) until such material information is deemed to be made public. Under the Regulations, material information is deemed to be made public when (i) such material information is notified to a stock exchange and is disclosed by ways of electromagnetic means as prescribed by the ordinance of the Cabinet Office (posting on the TDnet (Timely Disclosure Network) information service) or (ii) twelve (12) hours have elapsed since a listed company, such as Toyota, disclosed such material information to at least two (2) media sources as prescribed by the Regulations. 2
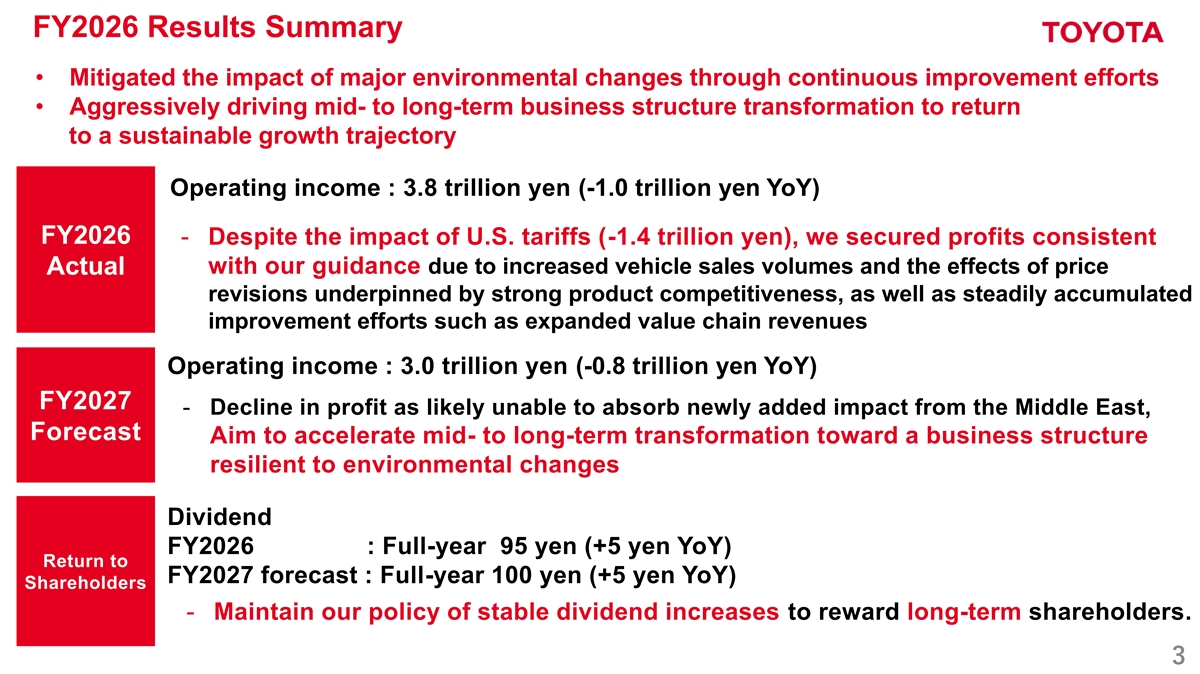
FY2026 Results Summary • Mitigated the impact of major environmental changes through continuous improvement efforts • Aggressively driving mid- to long-term business structure transformation to return to a sustainable growth trajectory Operating income : 3.8 trillion yen (-1.0 trillion yen YoY) FY2026 - Despite the impact of U.S. tariffs (-1.4 trillion yen), we secured profits consistent with our guidance due to increased vehicle sales volumes and the effects of price Actual revisions underpinned by strong product competitiveness, as well as steadily accumulated improvement efforts such as expanded value chain revenues Operating income : 3.0 trillion yen (-0.8 trillion yen YoY) FY2027 - Decline in profit as likely unable to absorb newly added impact from the Middle East, Forecast Aim to accelerate mid- to long-term transformation toward a business structure resilient to environmental changes Dividend FY2026 : Full-year 95 yen (+5 yen YoY) Return to FY2027 forecast : Full-year 100 yen (+5 yen YoY) Shareholders - Maintain our policy of stable dividend increases to reward long-term shareholders. 3
FY2026 Financial Performance 4
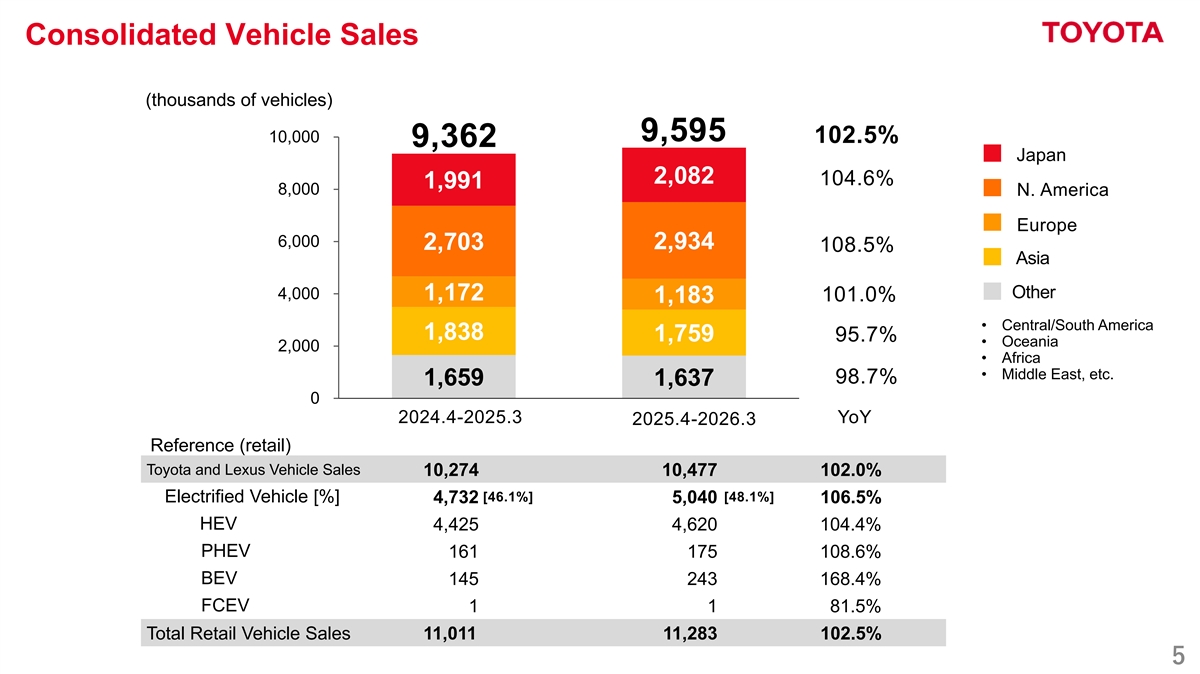
Consolidated Vehicle Sales (thousands of vehicles) 9,595 10,000 102.5% 9,362 Japan 2,082 104.6% 1,991 8,000 N. America Europe 6,000 2,934 2,703 108.5% Asia Other 4,000 1,172 101.0% 1,183 • Central/South America 1,838 1,759 95.7% • Oceania 2,000 • Africa • Middle East, etc. 98.7% 1,659 1,637 0 2024.4-2025.3 YoY 2025.4-2026.3 Reference (retail) Toyota and Lexus Vehicle Sales 10,274 10,477 102.0% [46.1%] [48.1%] Electrified Vehicle [%] 4,732 5,040 106.5% HEV 4,425 4,620 104.4% PHEV 161 175 108.6% BEV 145 243 168.4% FCEV 1 1 81.5% Total Retail Vehicle Sales 11,011 11,283 102.5% 5
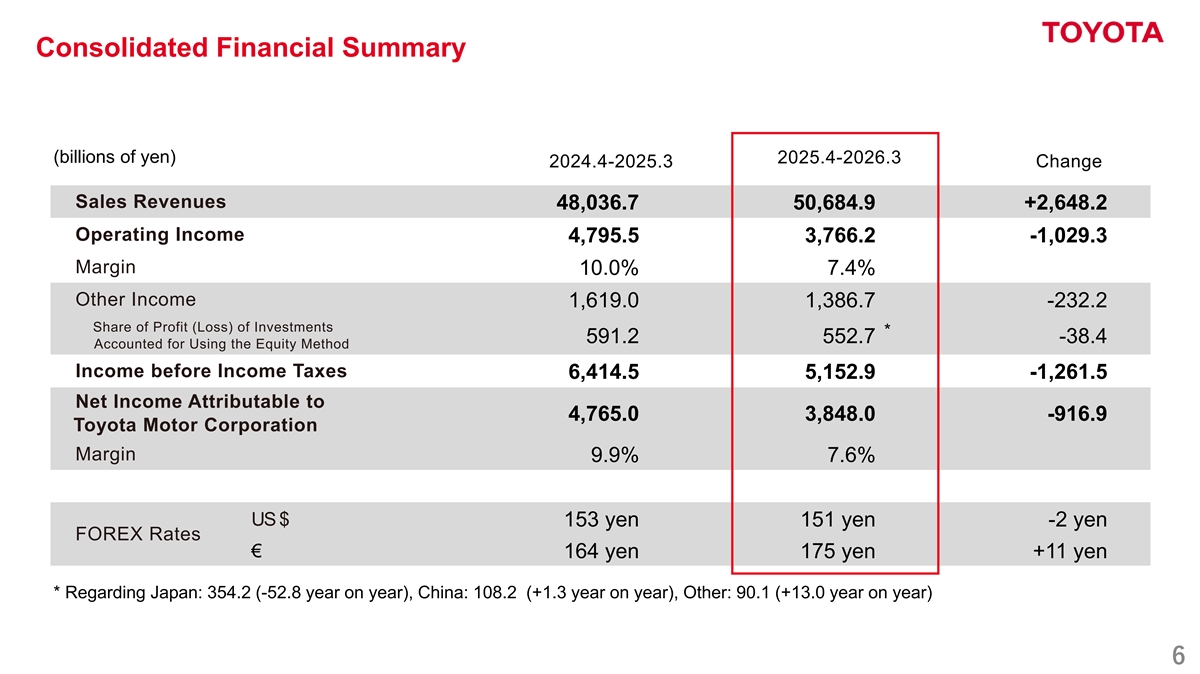
Consolidated Financial Summary (billions of yen) 2025.4-2026.3 Change 2024.4-2025.3 Sales Revenues 48,036.7 50,684.9 +2,648.2 Operating Income 4,795.5 3,766.2 -1,029.3 Margin 10.0% 7.4% Other Income 1,619.0 1,386.7 -232.2 Share of Profit (Loss) of Investments * 591.2 552.7 -38.4 Accounted for Using the Equity Method Income before Income Taxes 6,414.5 5,152.9 -1,261.5 Net Income Attributable to 4,765.0 3,848.0 -916.9 Toyota Motor Corporation Margin 9.9% 7.6% US $ 153 yen 151 yen -2 yen FOREX Rates € 164 yen 175 yen +11 yen * Regarding Japan: 354.2 (-52.8 year on year), China: 108.2 (+1.3 year on year), Other: 90.1 (+13.0 year on year) 6
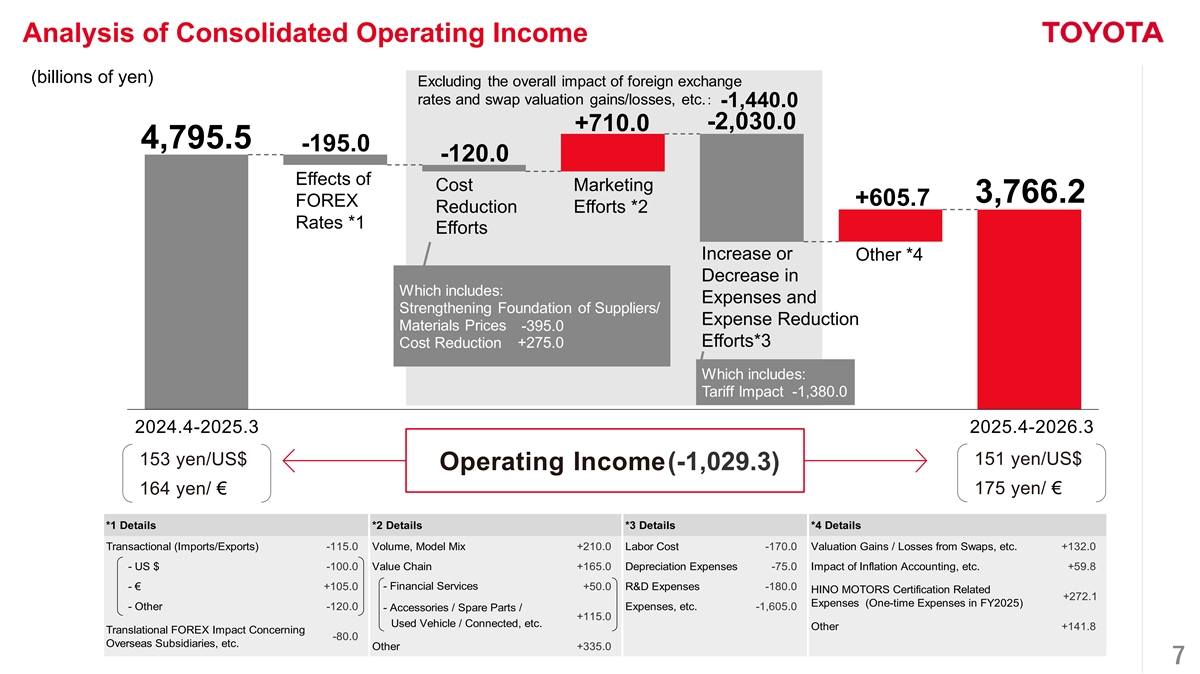
Analysis of Consolidated Operating Income (billions of yen) Excluding the overall impact of foreign exchange rates and swap valuation gains/losses, etc.: -1,440.0 -2,030.0 +710.0 4,795.5 -195.0 -120.0 Effects of Cost Marketing 3,766.2 +605.7 FOREX Reduction Efforts *2 Rates *1 Efforts Increase or Other *4 Decrease in Which includes: Expenses and Strengthening Foundation of Suppliers/ Expense Reduction Materials Prices -395.0 Efforts*3 Cost Reduction +275.0 Which includes: Tariff Impact -1,380.0 2024.4-2025.3 2025.4-2026.3 153 yen/US$ 151 yen/US$ Operating Income(-1,029.3) 175 yen/ € 164 yen/ € *1 Details *2 Details *3 Details *4 Details Transactional (Imports/Exports) -115.0 Volume, Model Mix +210.0 Labor Cost -170.0 Valuation Gains / Losses from Swaps, etc. +132.0 - US $ -100.0 Value Chain +165.0 Depreciation Expenses -75.0 Impact of Inflation Accounting, etc. +59.8 - € +105.0 - Financial Services +50.0 R&D Expenses -180.0 HINO MOTORS Certification Related +272.1 Expenses (One-time Expenses in FY2025) - Other -120.0 Expenses, etc. -1,605.0 - Accessories / Spare Parts / +115.0 Used Vehicle / Connected, etc. Other +141.8 Translational FOREX Impact Concerning -80.0 Overseas Subsidiaries, etc. Other +335.0 7
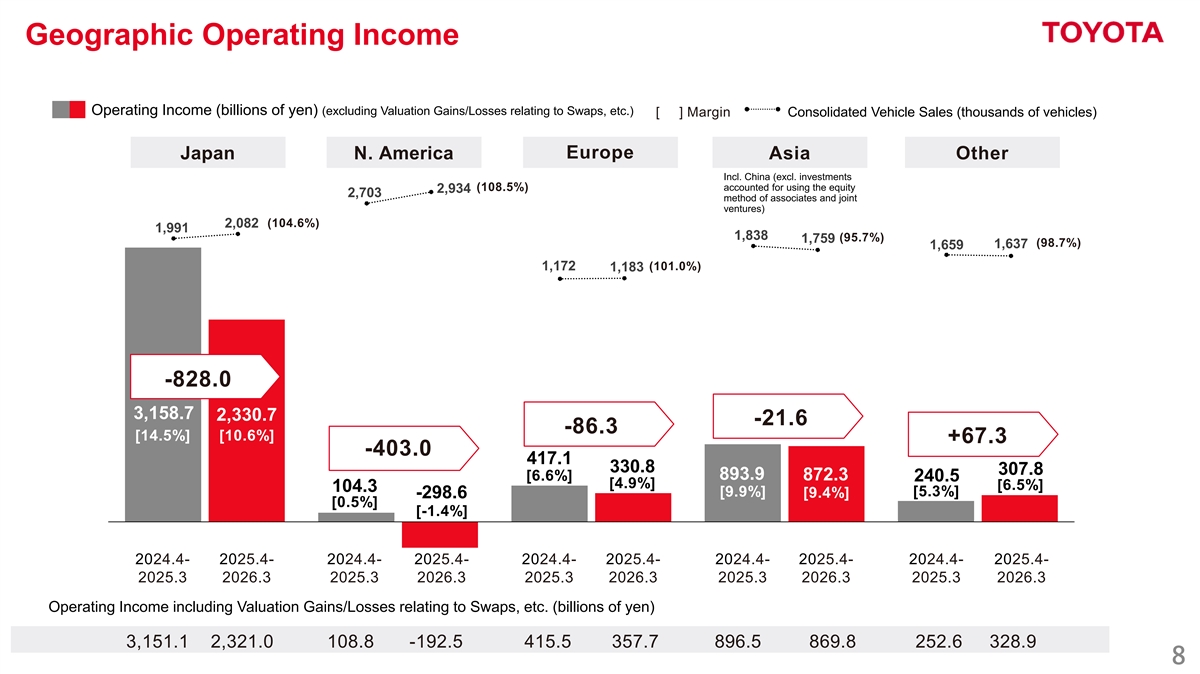
Geographic Operating Income Operating Income (billions of yen) (excluding Valuation Gains/Losses relating to Swaps, etc.) [ ] Margin Consolidated Vehicle Sales (thousands of vehicles) Europe Japan N. America Asia Other Incl. China (excl. investments accounted for using the equity (108.5%) 2,934 2,703 method of associates and joint ventures) (104.6%) 2,082 1,991 1,838 (95.7%) 1,759 (98.7%) 1,637 1,659 (101.0%) 1,172 1,183 -828.0 3,158.7 2,330.7 -21.6 -86.3 [14.5%] [10.6%] +67.3 -403.0 417.1 330.8 307.8 893.9 [6.6%] 872.3 240.5 [4.9%] [6.5%] 104.3 [5.3%] [9.9%] [9.4%] -298.6 [0.5%] [-1.4%] 2024.4- 2025.4- 2024.4- 2025.4- 2024.4- 2025.4- 2024.4- 2025.4- 2024.4- 2025.4- 2025.3 2026.3 2025.3 2026.3 2025.3 2026.3 2025.3 2026.3 2025.3 2026.3 Operating Income including Valuation Gains/Losses relating to Swaps, etc. (billions of yen) 3,151.1 2,321.0 108.8 -192.5 415.5 357.7 896.5 869.8 252.6 328.9 8
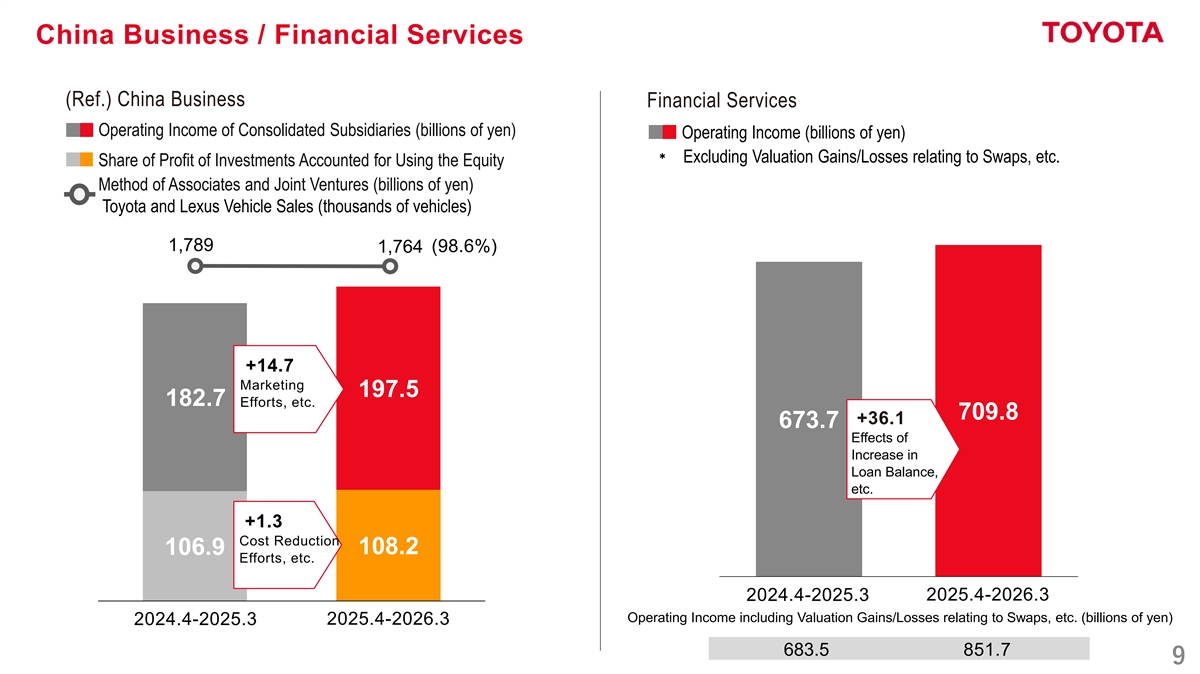
China Business / Financial Services (Ref.) China Business Financial Services Operating Income of Consolidated Subsidiaries (billions of yen) Operating Income (billions of yen) * Excluding Valuation Gains/Losses relating to Swaps, etc. Share of Profit of Investments Accounted for Using the Equity Method of Associates and Joint Ventures (billions of yen) Toyota and Lexus Vehicle Sales (thousands of vehicles) 1,789 (98.6%) 1,764 +14.7 Marketing 197.5 182.7 Efforts, etc. 709.8 +36.1 673.7 Effects of Increase in Loan Balance, etc. +1.3 Cost Reduction 108.2 106.9 Efforts, etc. 2024.4-2025.3 2025.4-2026.3 Operating Income including Valuation Gains/Losses relating to Swaps, etc. (billions of yen) 2024.4-2025.3 2025.4-2026.3 683.5 851.7 9

FY2027 Financial Forecasts 10
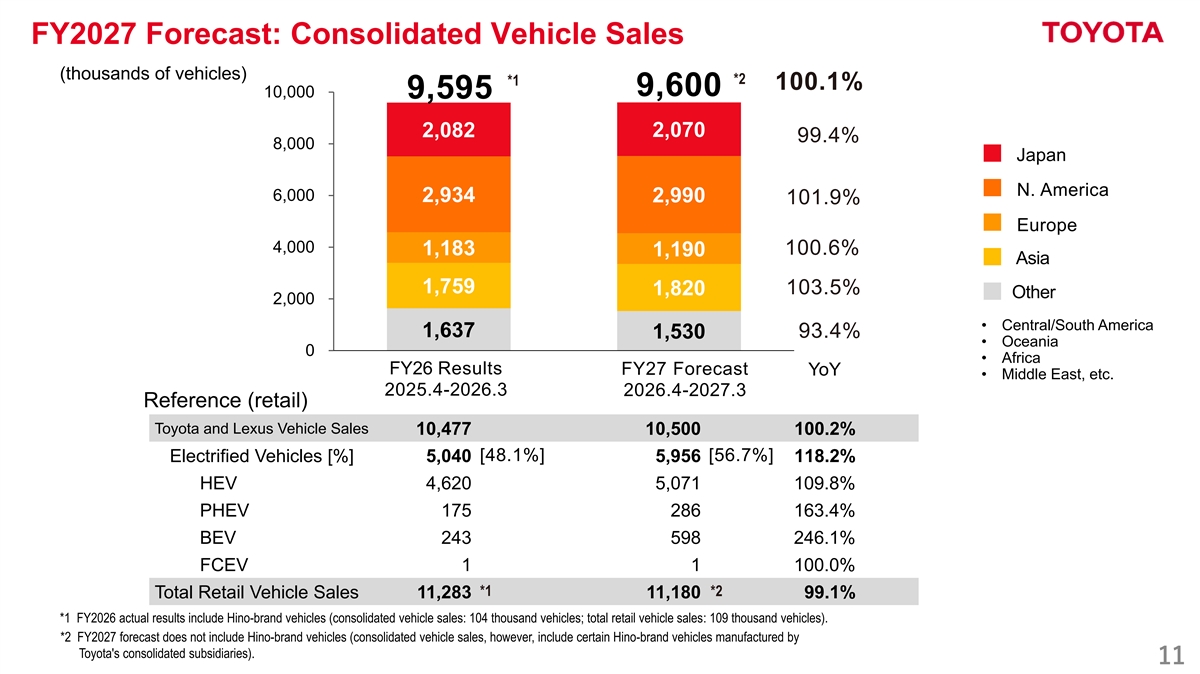
FY2027 Forecast: Consolidated Vehicle Sales (thousands of vehicles) *2 *1 100.1% 9,600 10,000 9,595 2,070 2,082 99.4% 8,000 Japan N. America 6,000 2,934 2,990 101.9% Europe 4,000 100.6% 1,183 1,190 Asia 1,759 103.5% 1,820 Other 2,000 • Central/South America 1,637 93.4% 1,530 • Oceania 0 • Africa FY26 Results FY27 Forecast YoY • Middle East, etc. 2025.4-2026.3 2026.4-2027.3 Reference (retail) Toyota and Lexus Vehicle Sales 10,477 10,500 100.2% [48.1%] [56.7%] Electrified Vehicles [%] 5,040 5,956 118.2% HEV 4,620 5,071 109.8% PHEV 175 286 163.4% BEV 243 598 246.1% FCEV 1 1 100.0% *1 *2 Total Retail Vehicle Sales 11,283 11,180 99.1% *1 FY2026 actual results include Hino-brand vehicles (consolidated vehicle sales: 104 thousand vehicles; total retail vehicle sales: 109 thousand vehicles). *2 FY2027 forecast does not include Hino-brand vehicles (consolidated vehicle sales, however, include certain Hino-brand vehicles manufactured by Toyota's consolidated subsidiaries). 11
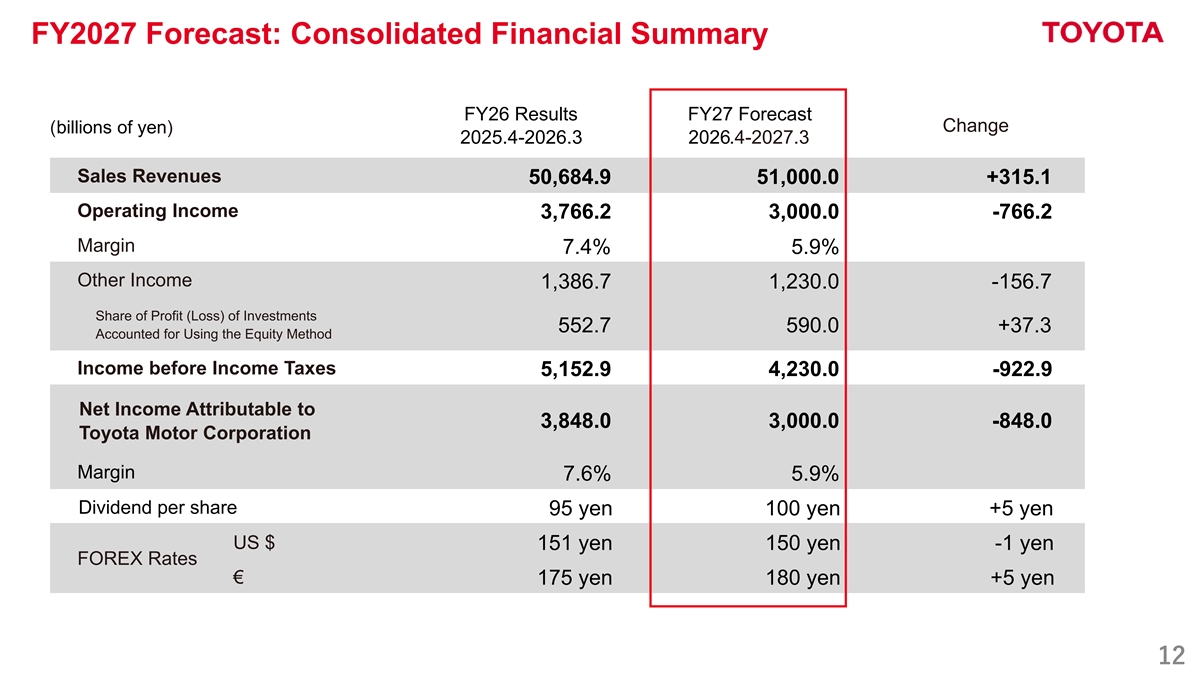
FY2027 Forecast: Consolidated Financial Summary FY26 Results FY27 Forecast Change (billions of yen) 2025.4-2026.3 2026.4-2027.3 Sales Revenues 50,684.9 51,000.0 +315.1 Operating Income 3,766.2 3,000.0 -766.2 Margin 7.4% 5.9% Other Income 1,386.7 1,230.0 -156.7 Share of Profit (Loss) of Investments 552.7 590.0 +37.3 Accounted for Using the Equity Method Income before Income Taxes 5,152.9 4,230.0 -922.9 Net Income Attributable to 3,848.0 3,000.0 -848.0 Toyota Motor Corporation Margin 7.6% 5.9% Dividend per share 95 yen 100 yen +5 yen US $ 151 yen 150 yen -1 yen FOREX Rates € 175 yen 180 yen +5 yen 12
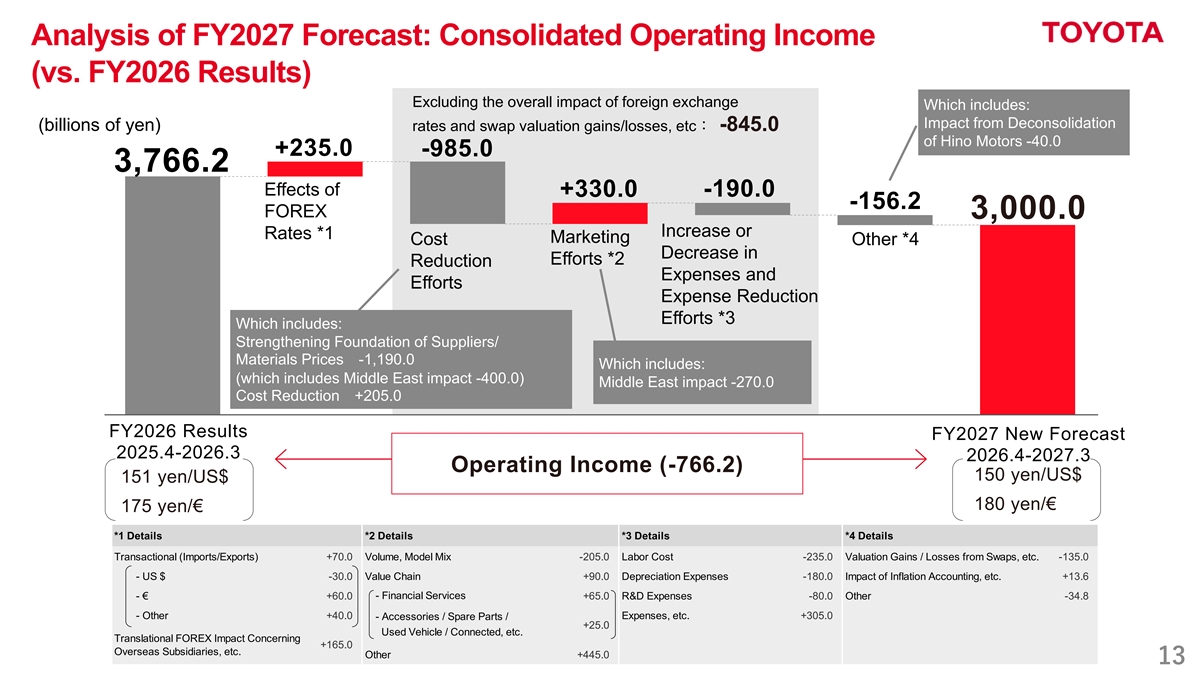
Analysis of FY2027 Forecast: Consolidated Operating Income (vs. FY2026 Results) Excluding the overall impact of foreign exchange Which includes: Impact from Deconsolidation (billions of yen) rates and swap valuation gains/losses, etc: -845.0 of Hino Motors -40.0 +235.0 -985.0 3,766.2 Effects of +330.0 -190.0 -156.2 FOREX 3,000.0 Increase or Rates *1 Marketing Cost Other *4 Decrease in Efforts *2 Reduction Expenses and Efforts Expense Reduction Efforts *3 Which includes: Strengthening Foundation of Suppliers/ Materials Prices -1,190.0 Which includes: (which includes Middle East impact -400.0) Middle East impact -270.0 Cost Reduction +205.0 FY2026 Results FY2027 New Forecast 2025.4-2026.3 2026.4-2027.3 Operating Income (-766.2) 150 yen/US$ 151 yen/US$ 180 yen/€ 175 yen/€ *1 Details *2 Details *3 Details *4 Details Transactional (Imports/Exports) +70.0 Volume, Model Mix -205.0 Labor Cost -235.0 Valuation Gains / Losses from Swaps, etc. -135.0 - US $ -30.0 Value Chain +90.0 Depreciation Expenses -180.0 Impact of Inflation Accounting, etc. +13.6 - Financial Services - € +60.0 +65.0 R&D Expenses -80.0 Other -34.8 - Other +40.0 Expenses, etc. +305.0 - Accessories / Spare Parts / +25.0 Used Vehicle / Connected, etc. Translational FOREX Impact Concerning +165.0 Overseas Subsidiaries, etc. Other +445.0 13

Shareholder Return 14
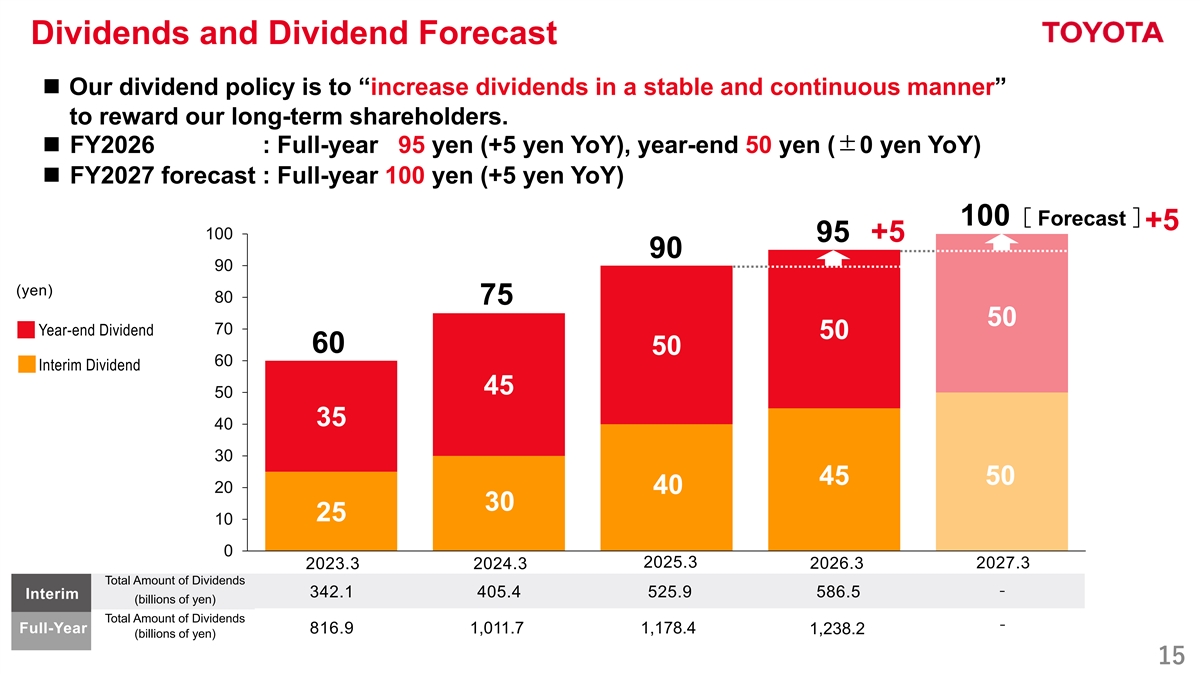
Dividends and Dividend Forecast ◼ Our dividend policy is to “increase dividends in a stable and continuous manner” to reward our long-term shareholders. ◼ FY2026 : Full-year 95 yen (+5 yen YoY), year-end 50 yen (±0 yen YoY) ◼ FY2027 forecast : Full-year 100 yen (+5 yen YoY) 100[ Forecast ] +5 100 95 +5 90 90 (yen) 80 75 50 70 Year-end Dividend 50 60 50 60 Interim Dividend 45 50 35 40 30 45 50 20 40 30 25 10 0 2025.3 2027.3 2023.3 2024.3 2026.3 Total Amount of Dividends - 342.1 405.4 525.9 586.5 Interim (billions of yen) Total Amount of Dividends - Full-Year 816.9 1,011.7 1,178.4 1,238.2 (billions of yen) 15
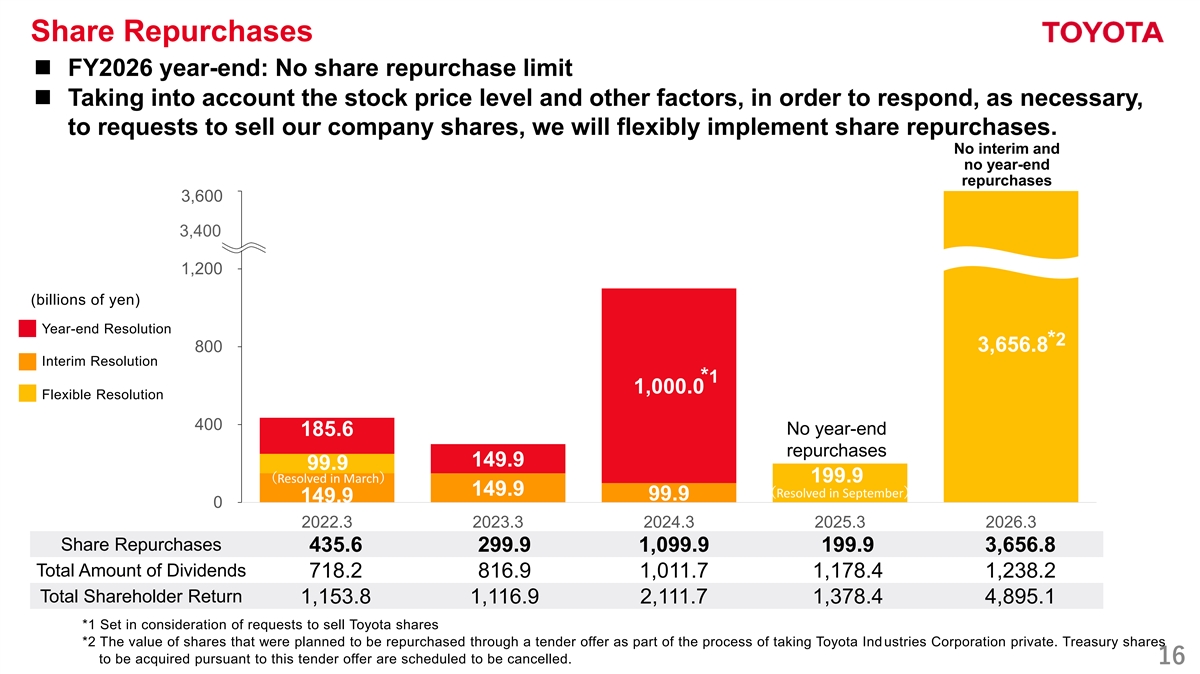
Share Repurchases ◼ FY2026 year-end: No share repurchase limit ◼ Taking into account the stock price level and other factors, in order to respond, as necessary, to requests to sell our company shares, we will flexibly implement share repurchases. No interim and no year-end repurchases 1,600 3,600 3,400 1,200 (billions of yen) Year-end Resolution *2 3,656.8 800 Interim Resolution (3月決議分) *1 1,000.0 Flexible Resolution 400 No year-end 185.6 repurchases 149.9 99.9 (Resolved in March) 199.9 (3月決議分) 149.9 (Resolved in September) 99.9 149.9 (9月決議分) 0 2022.3 2023.3 2024.3 2025.3 2026.3 Share Repurchases 435.6 299.9 1,099.9 199.9 3,656.8 Total Amount of Dividends 718.2 816.9 1,011.7 1,178.4 1,238.2 Total Shareholder Return 1,153.8 1,116.9 2,111.7 1,378.4 4,895.1 *1 Set in consideration of requests to sell Toyota shares *2 The value of shares that were planned to be repurchased through a tender offer as part of the process of taking Toyota Ind ustries Corporation private. Treasury shares to be acquired pursuant to this tender offer are scheduled to be cancelled. 16

Toward Business Structure Reform 17
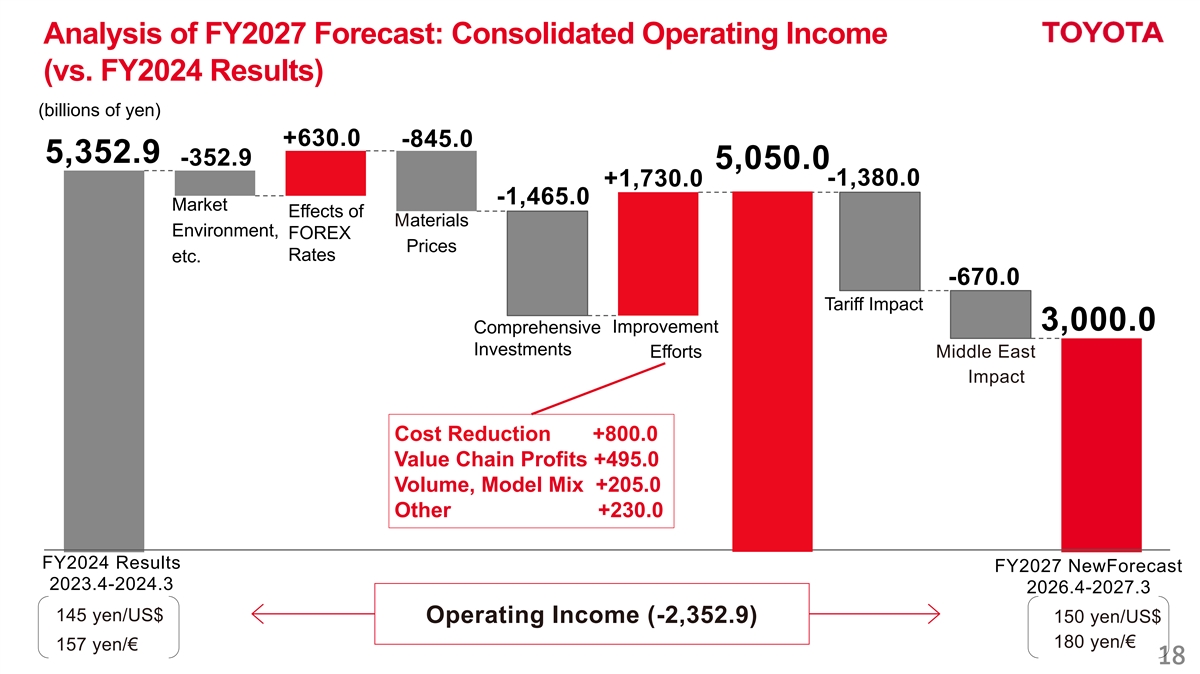
Analysis of FY2027 Forecast: Consolidated Operating Income (vs. FY2024 Results) (billions of yen) +630.0 -845.0 5,352.9 -352.9 5,050.0 -1,380.0 +1,730.0 -1,465.0 Market Effects of Materials Environment, FOREX Prices Rates etc. -670.0 Tariff Impact 3,000.0 Improvement Comprehensive Investments Efforts Middle East Impact Cost Reduction +800.0 Value Chain Profits +495.0 Volume, Model Mix +205.0 Other +230.0 FY2024 Results FY2027 NewForecast 2023.4-2024.3 2026.4-2027.3 145 yen/US$ Operating Income (-2,352.9) 150 yen/US$ 180 yen/€ 157 yen/€ 18
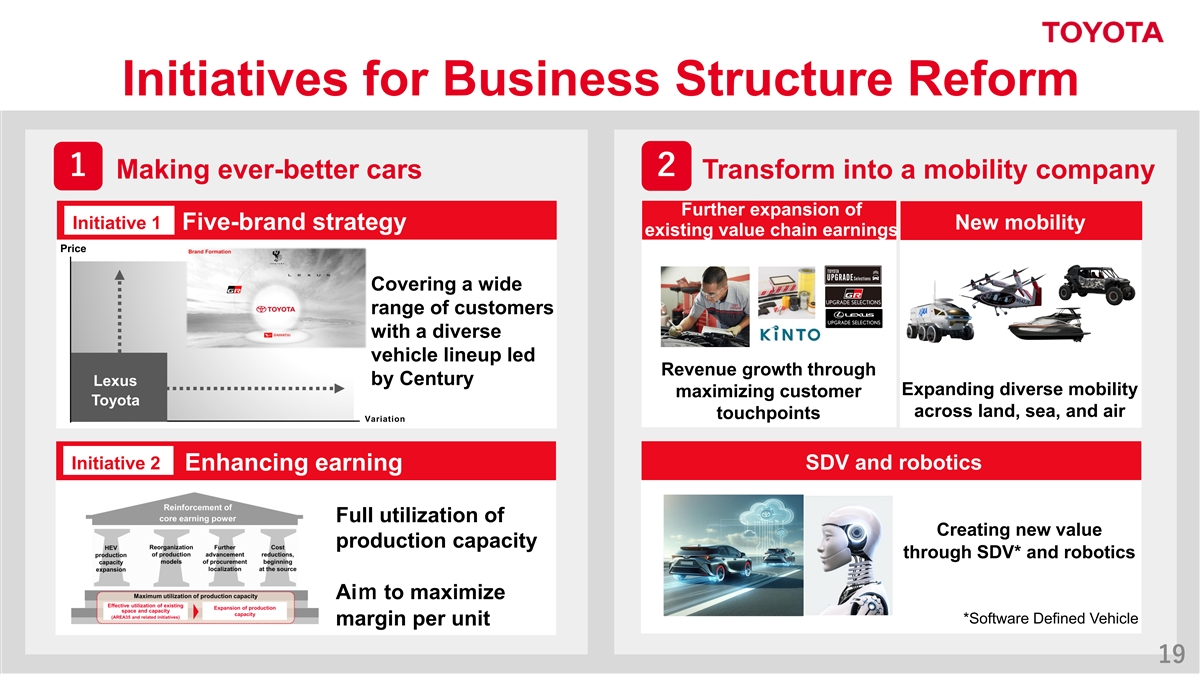
Initiatives for Business Structure Reform Making ever-better cars Transform into a mobility company Further expansion of Initiative 1 Five-brand strategy New mobility existing value chain earnings Price Covering a wide range of customers with a diverse vehicle lineup led Revenue growth through by Century Lexus Expanding diverse mobility maximizing customer Toyota across land, sea, and air touchpoints Variation Initiative 2 SDV and robotics Enhancing earning power Full utilization of Creating new value production capacity through SDV* and robotics Aim to maximize *Software Defined Vehicle margin per unit 19 19
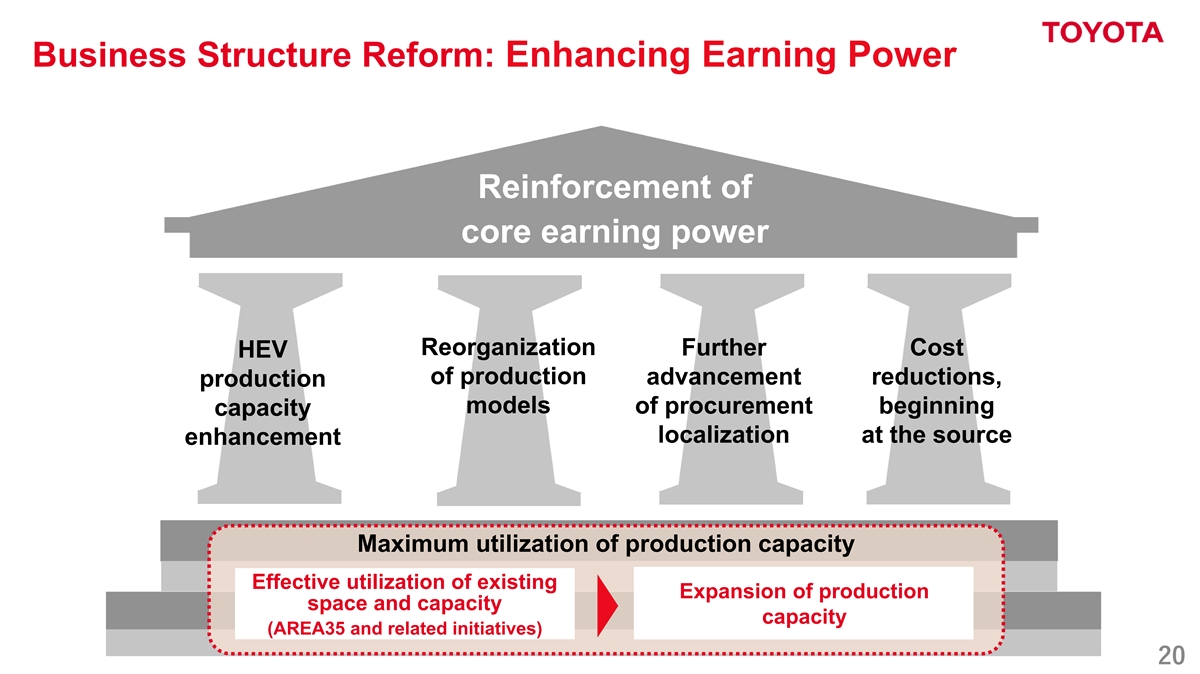
Business Structure Reform: Enhancing Earning Power Reinforcement of core earning power Reorganization Further Cost HEV of production advancement reductions, production models of procurement beginning capacity localization at the source enhancement Maximum utilization of production capacity Effective utilization of existing Expansion of production space and capacity capacity (AREA35 and related initiatives) 20
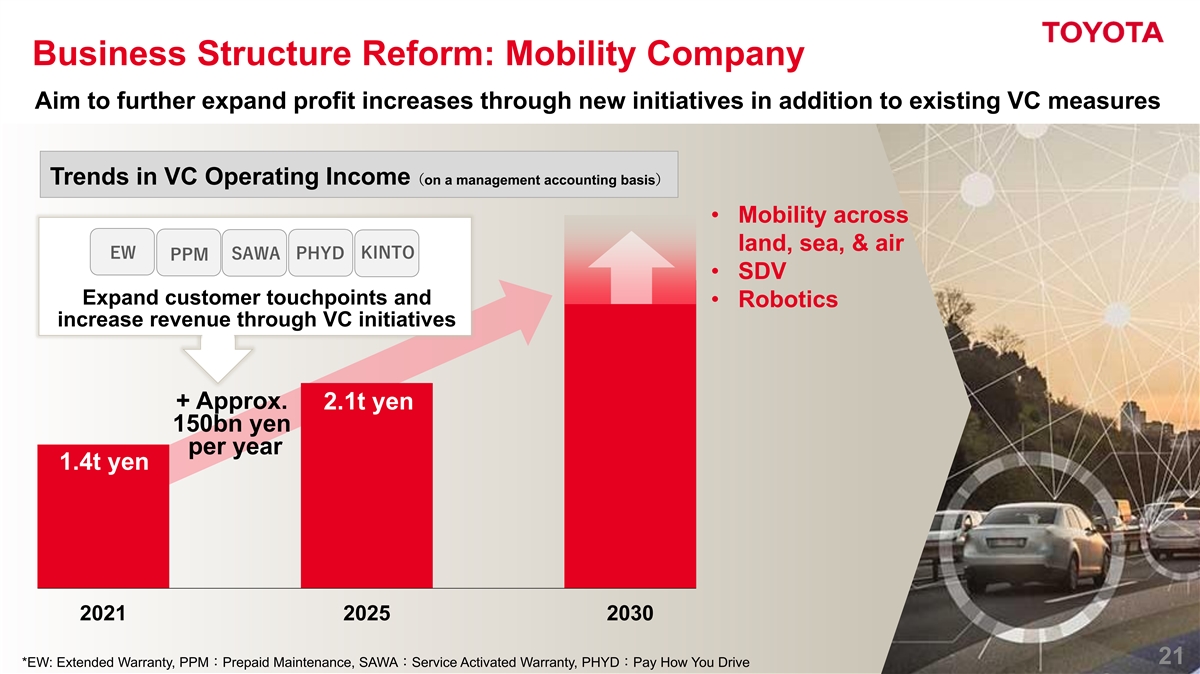
Business Structure Reform: Mobility Company Aim to further expand profit increases through new initiatives in addition to existing VC measures Trends in VC Operating Income(on a management accounting basis) • Mobility across land, sea, & air • SDV Expand customer touchpoints and • Robotics increase revenue through VC initiatives + Approx. 2.1t yen 150bn yen per year 1.4t yen 2021 2025 2030 21 21 *EW: Extended Warranty, PPM:Prepaid Maintenance, SAWA:Service Activated Warranty, PHYD:Pay How You Drive
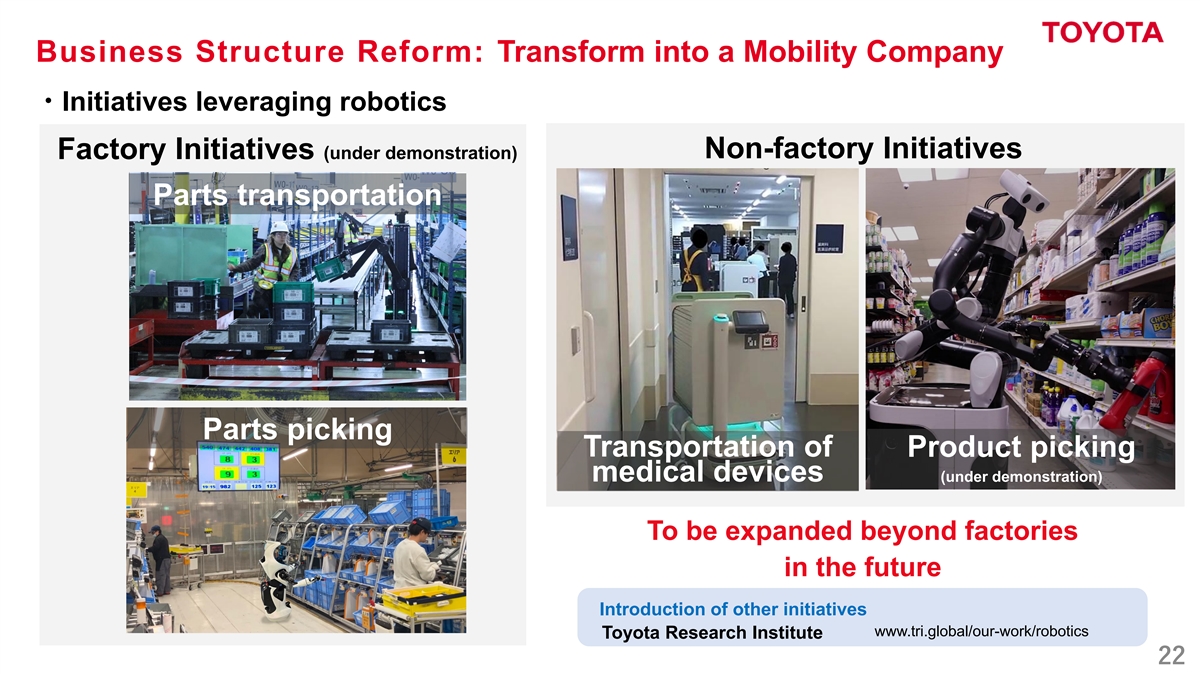
Business Structure Reform: Transform into a Mobility Company ・Initiatives leveraging robotics Non-factory Initiatives Factory Initiatives (under demonstration) Parts transportation Parts picking Transportation of Product picking medical devices (under demonstration) To be expanded beyond factories in the future Introduction of other initiatives www.tri.global/our-work/robotics Toyota Research Institute 22
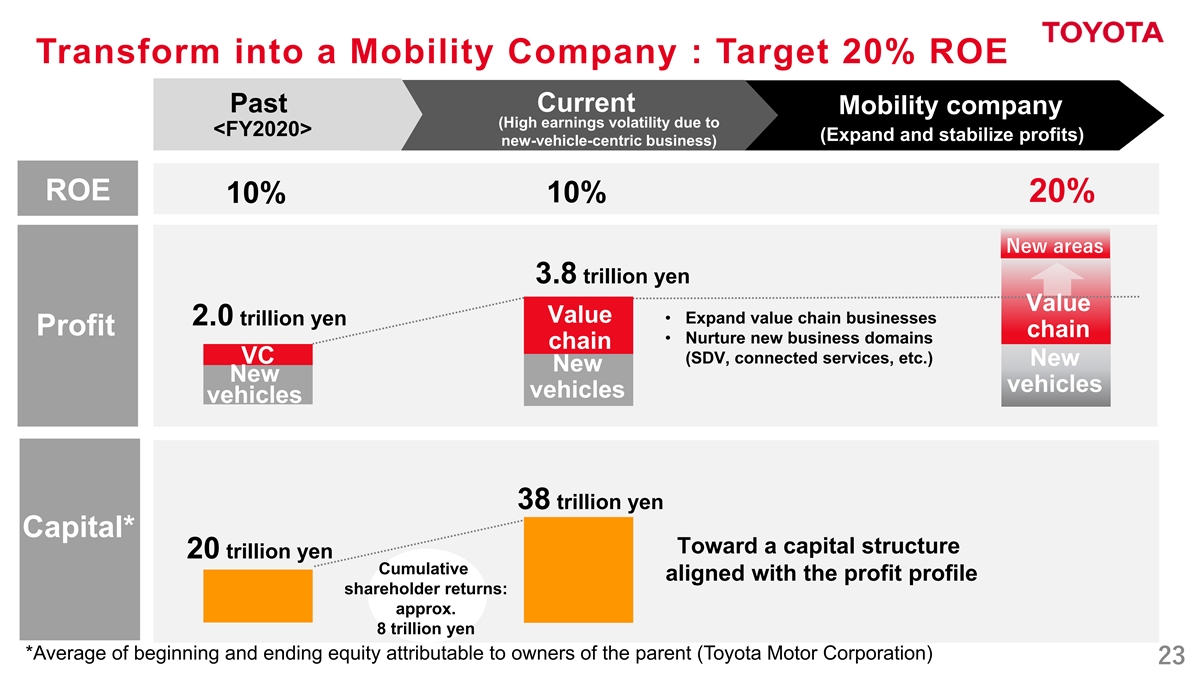
Transform into a Mobility Company : Target 20% ROE 現在 Current Past Mobility company (High earnings volatility due to <FY2020> (Expand and stabilize profits) new-vehicle-centric business) ROE 20% 10% 10% New areas 3.8 trillion yen Value Value • Expand value chain businesses 2.0 trillion yen Profit chain • Nurture new business domains chain VC (SDV, connected services, etc.) New New New vehicles vehicles vehicles 38 trillion yen Capital* Toward a capital structure 20 trillion yen Cumulative aligned with the profit profile shareholder returns: approx. 8 trillion yen *Average of beginning and ending equity attributable to owners of the parent (Toyota Motor Corporation) 23
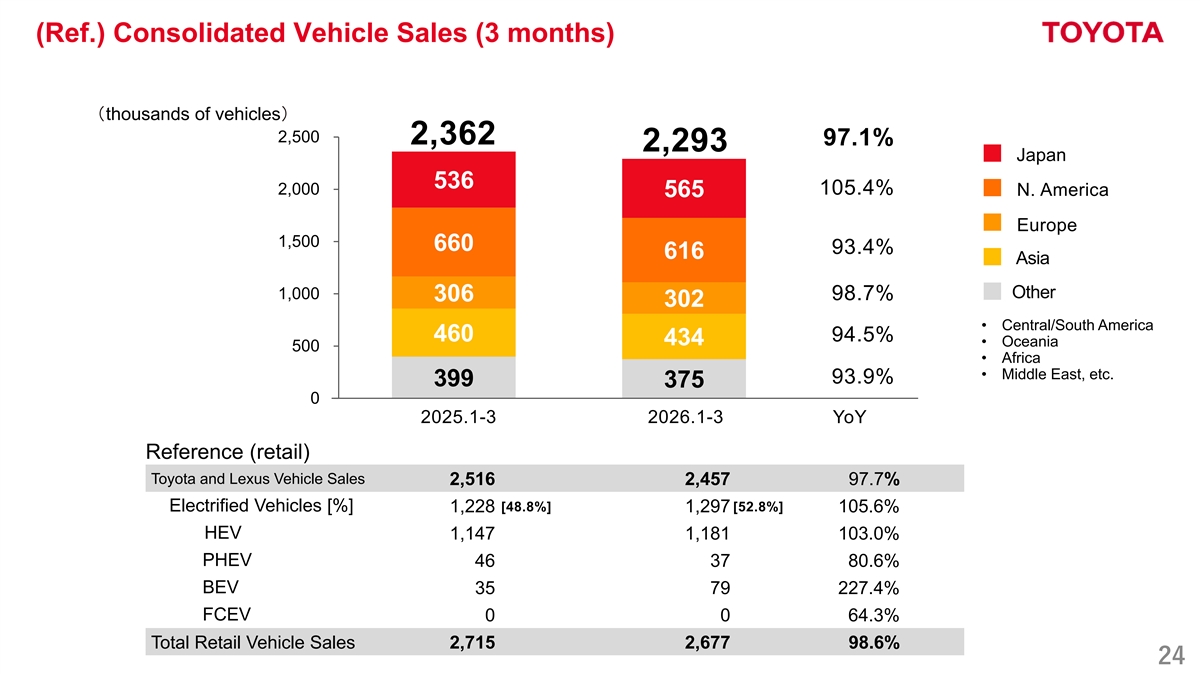
(Ref.) Consolidated Vehicle Sales (3 months) (thousands of vehicles) 2,500 2,362 97.1% 2,293 Japan 536 2,000 105.4% N. America 565 Europe 1,500 660 93.4% 616 Asia Other 1,000 98.7% 306 302 • Central/South America 460 94.5% 434 • Oceania 500 • Africa • Middle East, etc. 93.9% 399 375 0 2025.1-3 2026.1-3 YoY Reference (retail) Toyota and Lexus Vehicle Sales 2,516 2,457 97.7% Electrified Vehicles [%] [48.8%] [52.8%] 1,228 1,297 105.6% HEV 1,147 1,181 103.0% PHEV 46 37 80.6% BEV 35 79 227.4% FCEV 0 0 64.3% Total Retail Vehicle Sales 2,715 2,677 98.6% 24
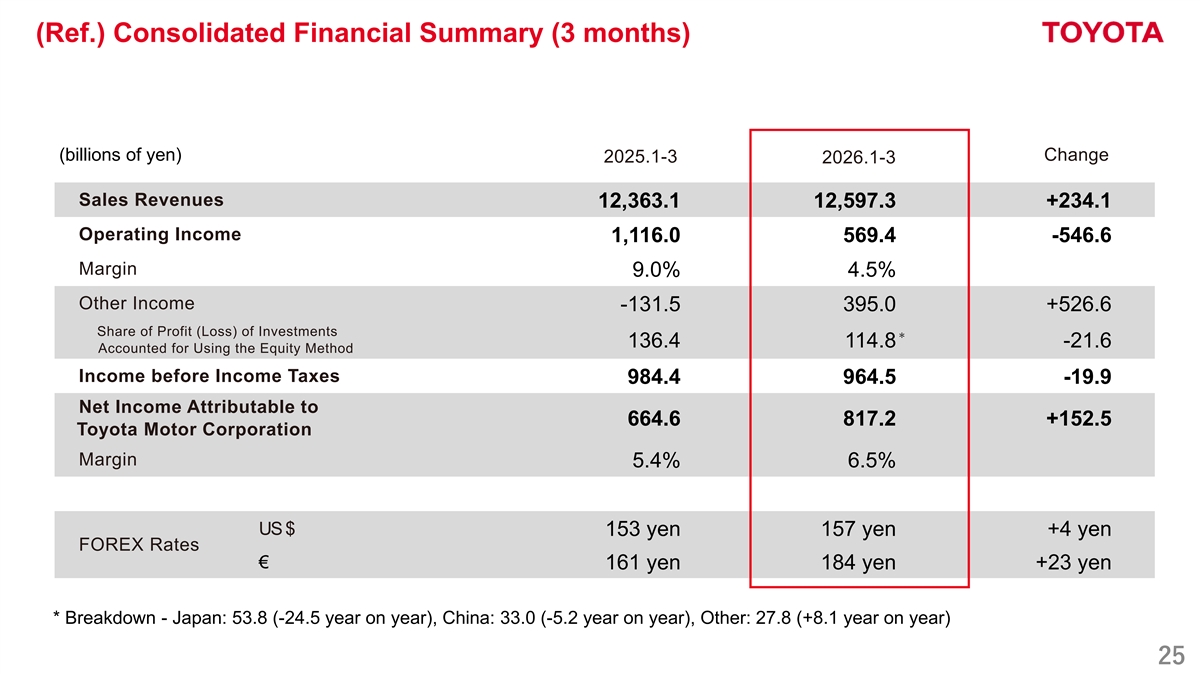
(Ref.) Consolidated Financial Summary (3 months) (billions of yen) Change 2025.1-3 2026.1-3 Sales Revenues 12,363.1 12,597.3 +234.1 Operating Income 1,116.0 569.4 -546.6 Margin 9.0% 4.5% Other Income -131.5 395.0 +526.6 Share of Profit (Loss) of Investments * 136.4 114.8 -21.6 Accounted for Using the Equity Method Income before Income Taxes 984.4 964.5 -19.9 Net Income Attributable to 664.6 817.2 +152.5 Toyota Motor Corporation Margin 5.4% 6.5% US $ 153 yen 157 yen +4 yen FOREX Rates € 161 yen 184 yen +23 yen * Breakdown - Japan: 53.8 (-24.5 year on year), China: 33.0 (-5.2 year on year), Other: 27.8 (+8.1 year on year) 25
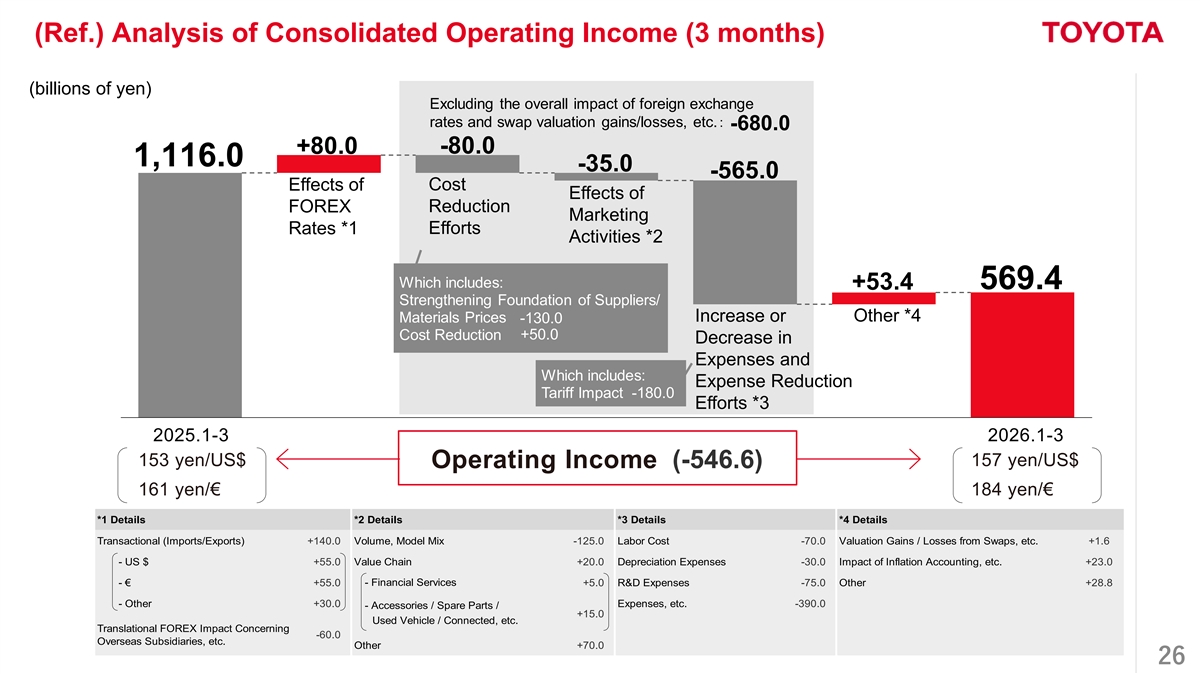
(Ref.) Analysis of Consolidated Operating Income (3 months) (billions of yen) Excluding the overall impact of foreign exchange rates and swap valuation gains/losses, etc.: -680.0 -80.0 +80.0 1,116.0 -35.0 -565.0 Effects of Cost Effects of FOREX Reduction Marketing Rates *1 Efforts Activities *2 Which includes: 569.4 +53.4 Strengthening Foundation of Suppliers/ Increase or Other *4 Materials Prices -130.0 +50.0 Cost Reduction Decrease in Expenses and Which includes: Expense Reduction Tariff Impact -180.0 Efforts *3 2025.1-3 2026.1-3 153 yen/US$ 157 yen/US$ Operating Income (-546.6) 161 yen/€ 184 yen/€ *1 Details *2 Details *3 Details *4 Details Transactional (Imports/Exports) +140.0 Volume, Model Mix -125.0 Labor Cost -70.0 Valuation Gains / Losses from Swaps, etc. +1.6 - US $ +55.0 Value Chain +20.0 Depreciation Expenses -30.0 Impact of Inflation Accounting, etc. +23.0 - Financial Services - € +55.0 +5.0 R&D Expenses -75.0 Other +28.8 - Other +30.0 Expenses, etc. -390.0 - Accessories / Spare Parts / +15.0 Used Vehicle / Connected, etc. Translational FOREX Impact Concerning -60.0 Overseas Subsidiaries, etc. Other +70.0 26
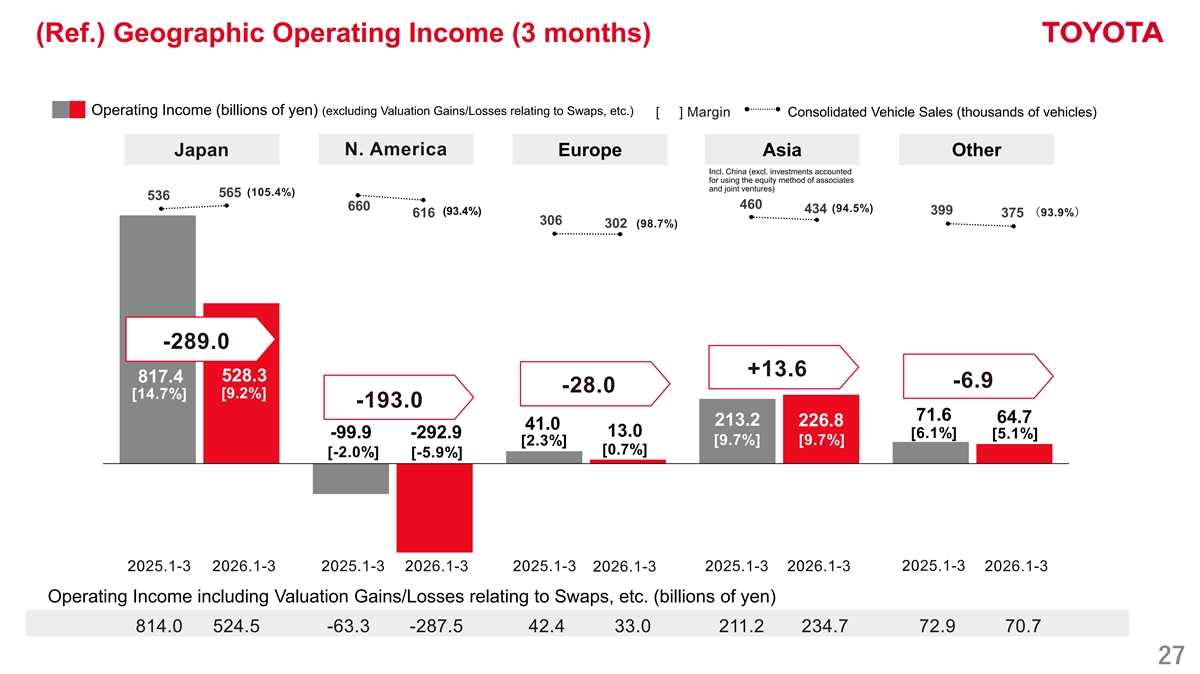
(Ref.) Geographic Operating Income (3 months) Operating Income (billions of yen) (excluding Valuation Gains/Losses relating to Swaps, etc.) [ ] Margin Consolidated Vehicle Sales (thousands of vehicles) N. America Japan Europe Asia Other Incl. China (excl. investments accounted for using the equity method of associates and joint ventures) (105.4%) 565 536 460 660 (94.5%) 434 (93.4%) 399 (93.9%) 616 375 306 302 (98.7%) -289.0 +13.6 528.3 817.4 -6.9 -28.0 [14.7%] [9.2%] -193.0 71.6 64.7 213.2 226.8 41.0 13.0 -99.9 [6.1%] -292.9 [5.1%] [9.7%] [9.7%] [2.3%] [0.7%] [-2.0%] [-5.9%] 2025.1-3 2026.1-3 2025.1-3 2026.1-3 2025.1-3 2025.1-3 2026.1-3 2025.1-3 2026.1-3 2026.1-3 Operating Income including Valuation Gains/Losses relating to Swaps, etc. (billions of yen) 814.0 524.5 -63.3 -287.5 42.4 33.0 211.2 234.7 72.9 70.7 27
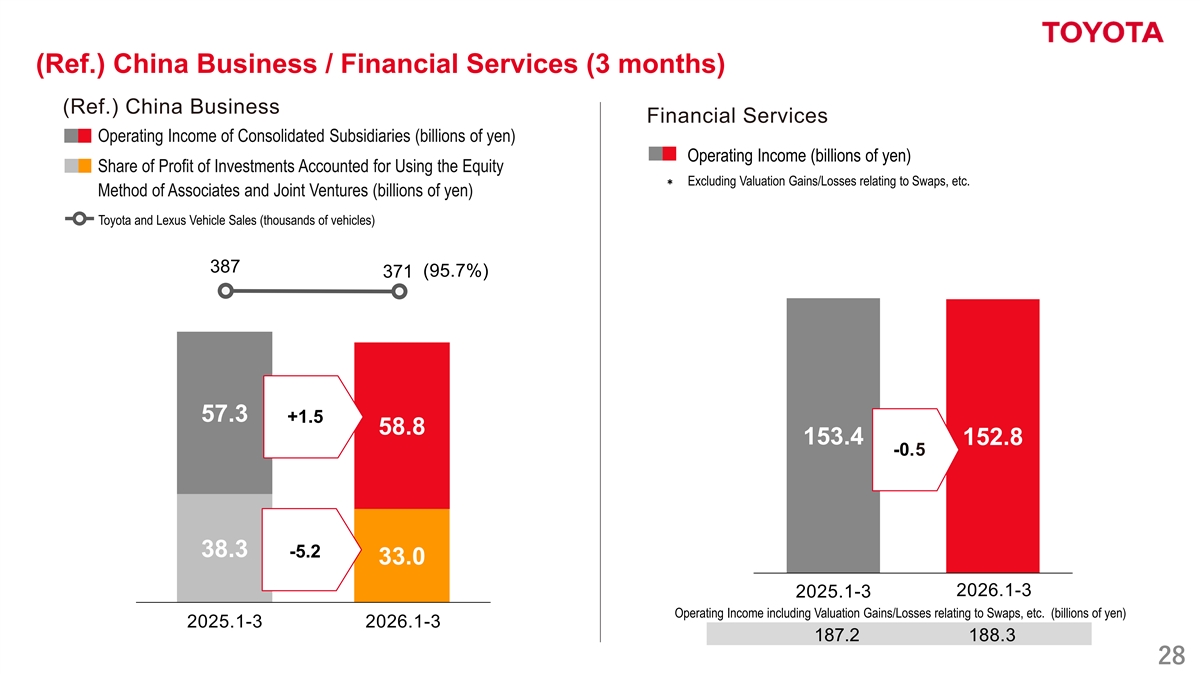
(Ref.) China Business / Financial Services (3 months) (Ref.) China Business Financial Services Operating Income of Consolidated Subsidiaries (billions of yen) Operating Income (billions of yen) Share of Profit of Investments Accounted for Using the Equity * Excluding Valuation Gains/Losses relating to Swaps, etc. Method of Associates and Joint Ventures (billions of yen) Toyota and Lexus Vehicle Sales (thousands of vehicles) 387 (95.7%) 371 57.3 +1.5 58.8 153.4 152.8 -0.5 38.3 -5.2 33.0 2026.1-3 2025.1-3 Operating Income including Valuation Gains/Losses relating to Swaps, etc. (billions of yen) 2025.1-3 2026.1-3 187.2 188.3 28
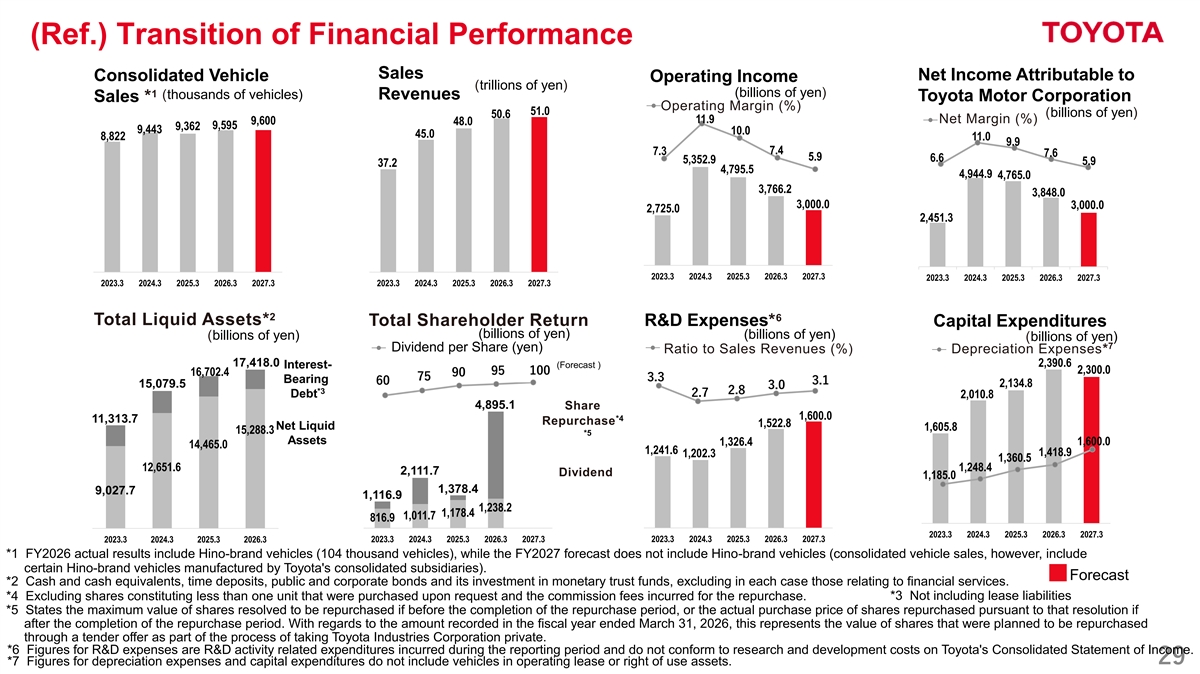
(Ref.) Transition of Financial Performance Sales Net Income Attributable to Consolidated Vehicle Operating Income (trillions of yen) (billions of yen) 1 (thousands of vehicles) Revenues Toyota Motor Corporation Sales * Operating Margin (%) 51.0 (billions of yen) 50.6 11.9 Net Margin (%) 9,600 48.0 9,595 9,362 9,443 10.0 45.0 8,822 11.0 9.9 7.4 7.3 7.6 5.9 6.6 5,352.9 5.9 37.2 4,795.5 4,944.9 4,765.0 3,766.2 3,848.0 3,000.0 3,000.0 2,725.0 2,451.3 2023.3 2024.3 2025.3 2026.3 2027.3 2023.3 2024.3 2025.3 2026.3 2027.3 2023.3 2024.3 2025.3 2026.3 2027.3 2023.3 2024.3 2025.3 2026.3 2027.3 2 6 Total Liquid Assets* Total Shareholder Return R&D Expenses* Capital Expenditures (billions of yen) (billions of yen) (billions of yen) (billions of yen) 7 Dividend per Share (yen) Ratio to Sales Revenues (%) Depreciation Expenses* 17,418.0 2,390.6 Interest- (Forecast ) 2,300.0 100 95 16,702.4 90 75 3.3 Bearing 3.1 60 2,134.8 15,079.5 3.0 *3 2.8 2.7 Debt 2,010.8 4,895.1 Share 1,600.0 *4 11,313.7 Repurchase 1,522.8 Net Liquid 1,605.8 15,288.3 *5 Assets 1,326.4 1,600.0 14,465.0 1,241.6 1,418.9 1,202.3 1,360.5 12,651.6 1,248.4 2,111.7 Dividend 1,185.0 1,378.4 9,027.7 1,116.9 1,238.2 1,178.4 1,011.7 816.9 2023.3 2024.3 2025.3 2026.3 2027.3 2023.3 2024.3 2025.3 2026.3 2023.3 2024.3 2025.3 2026.3 2027.3 2023.3 2024.3 2025.3 2026.3 2027.3 *1 FY2026 actual results include Hino-brand vehicles (104 thousand vehicles), while the FY2027 forecast does not include Hino-brand vehicles (consolidated vehicle sales, however, include certain Hino-brand vehicles manufactured by Toyota's consolidated subsidiaries). Forecast *2 Cash and cash equivalents, time deposits, public and corporate bonds and its investment in monetary trust funds, excluding in each case those relating to financial services. *3 Not including lease liabilities *4 Excluding shares constituting less than one unit that were purchased upon request and the commission fees incurred for the repurchase. *5 States the maximum value of shares resolved to be repurchased if before the completion of the repurchase period, or the actual purchase price of shares repurchased pursuant to that resolution if after the completion of the repurchase period. With regards to the amount recorded in the fiscal year ended March 31, 2026, this represents the value of shares that were planned to be repurchased through a tender offer as part of the process of taking Toyota Industries Corporation private. *6 Figures for R&D expenses are R&D activity related expenditures incurred during the reporting period and do not conform to research and development costs on Toyota's Consolidated Statement of Income. 29 *7 Figures for depreciation expenses and capital expenditures do not include vehicles in operating lease or right of use assets.
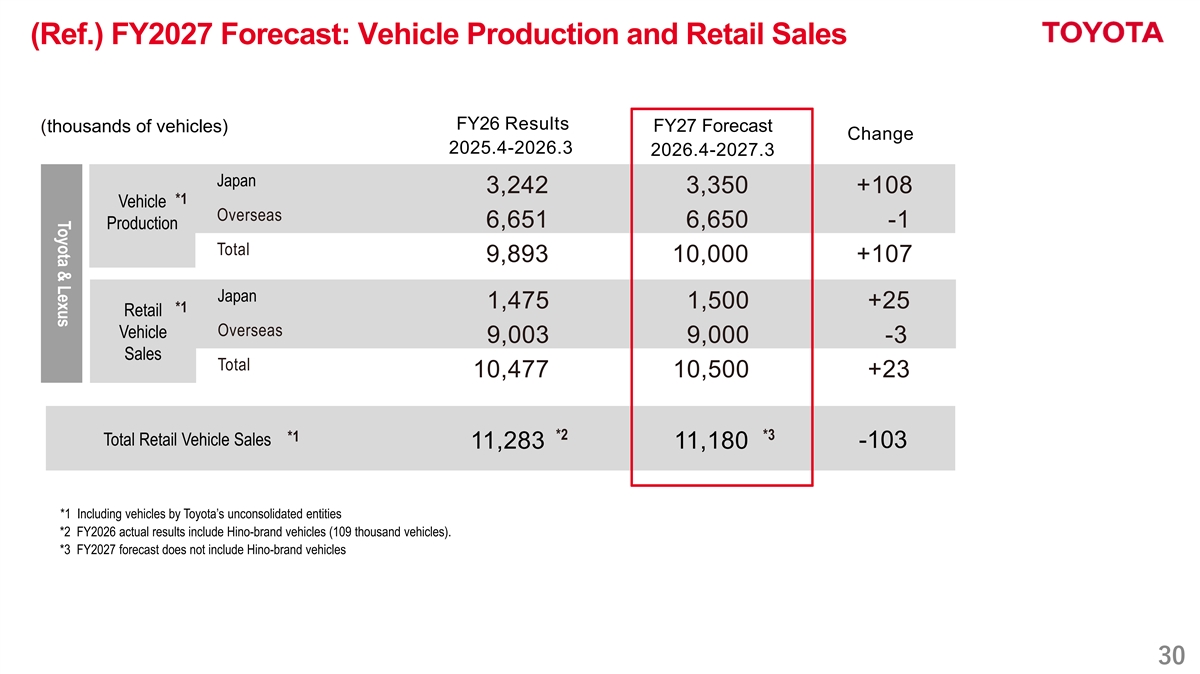
Toyota & Lexus (Ref.) FY2027 Forecast: Vehicle Production and Retail Sales FY26 Results (thousands of vehicles) FY27 Forecast Change 2025.4-2026.3 2026.4-2027.3 Japan 3,242 3,350 +108 *1 Vehicle 生産 Overseas 6,651 6,650 -1 Production Total 9,893 10,000 +107 Japan 1,475 1,500 +25 *1 Retail Overseas Vehicle 9,003 9,000 -3 Sales Total 10,477 10,500 +23 *2 *3 *1 Total Retail Vehicle Sales -103 11,283 11,180 *1 Including vehicles by Toyota’s unconsolidated entities *2 FY2026 actual results include Hino-brand vehicles (109 thousand vehicles). *3 FY2027 forecast does not include Hino-brand vehicles 30
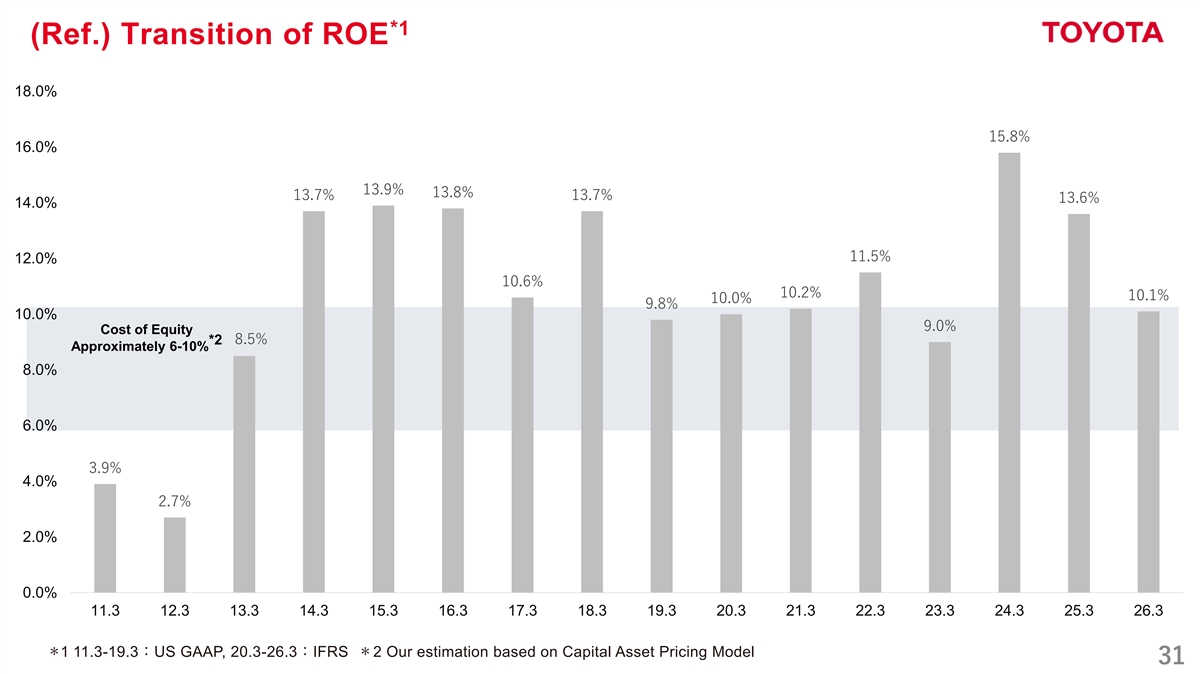
*1 (Ref.) Transition of ROE 18.0% 15.8% 16.0% 13.9% 13.8% 13.7% 13.7% 13.6% 14.0% 11.5% 12.0% 10.6% 10.2% 10.1% 10.0% 9.8% 10.0% 9.0% Cost of Equity 8.5% *2 Approximately 6-10% 8.0% 6.0% 3.9% 4.0% 2.7% 2.0% 0.0% 11.3 12.3 13.3 14.3 15.3 16.3 17.3 18.3 19.3 20.3 21.3 22.3 23.3 24.3 25.3 26.3 *1 11.3-19.3:US GAAP, 20.3-26.3:IFRS *2 Our estimation based on Capital Asset Pricing Model 31
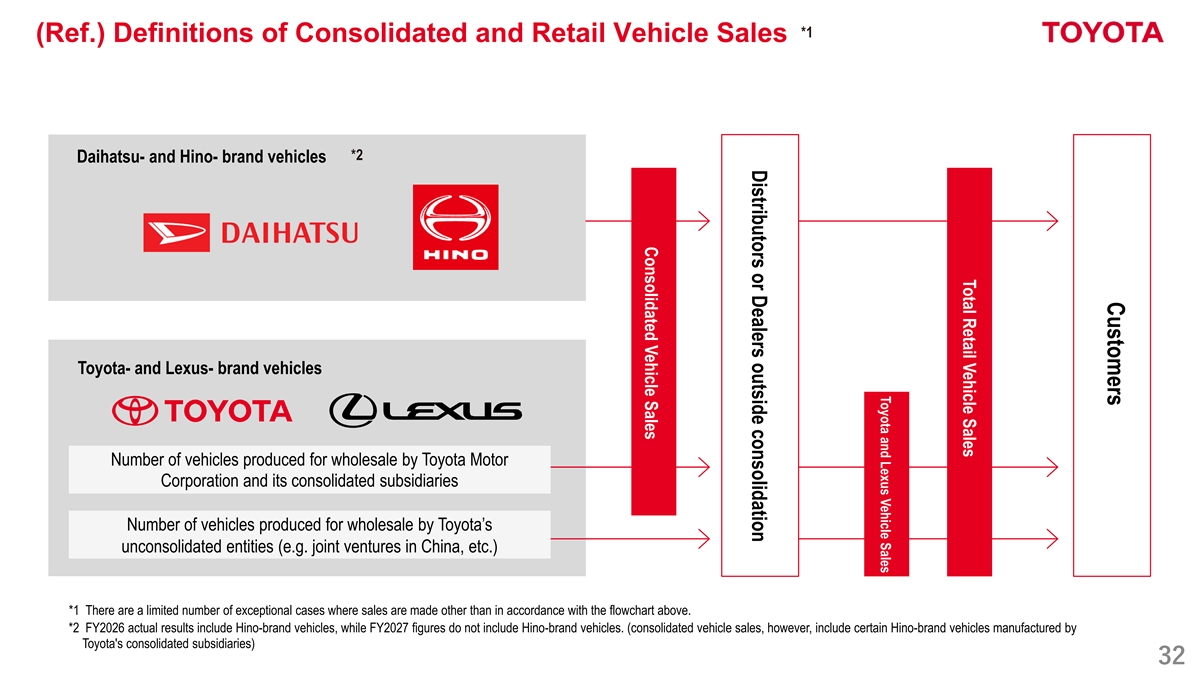
Customers Total Retail Vehicle Sales Toyota and Lexus Vehicle Sales Distributors or Dealers outside consolidation Consolidated Vehicle Sales *1 (Ref.) Definitions of Consolidated and Retail Vehicle Sales *2 Daihatsu- and Hino- brand vehicles Toyota- and Lexus- brand vehicles Number of vehicles produced for wholesale by Toyota Motor Corporation and its consolidated subsidiaries Number of vehicles produced for wholesale by Toyota’s unconsolidated entities (e.g. joint ventures in China, etc.) *1 There are a limited number of exceptional cases where sales are made other than in accordance with the flowchart above. *2 FY2026 actual results include Hino-brand vehicles, while FY2027 figures do not include Hino-brand vehicles. (consolidated vehicle sales, however, include certain Hino-brand vehicles manufactured by Toyota's consolidated subsidiaries) 32