| REGISTRATION STATEMENT PURSUANT TO SECTION 12(b) OR (g) OF THE SECURITIES EXCHANGE ACT OF 1934 |
| ANNUAL REPORT PURSUANT TO SECTION 13 OR 15(d) OF THE SECURITIES EXCHANGE ACT OF 1934 |
| TRANSITION REPORT PURSUANT TO SECTION 13 OR 15(d) OF THE SECURITIES EXCHANGE ACT OF 1934 |
| SHELL COMPANY REPORT PURSUANT TO SECTION 13 OR 15(d) OF THE SECURITIES EXCHANGE ACT OF 1934 |
| Title of each class |
Trading Symbol(s) |
Name of each exchange on which registered | ||
| * | Each American Depositary Share representing ten shares of the registrant’s Common Stock. |
| ** | No par value. , only in connection with the registration of American Depositary Shares, pursuant to the requirements of the U.S. Securities and Exchange Commission. |
| Accelerated filer ☐ | Non-accelerated filer ☐ | |||
| Emerging growth company | ||||
| † | The term “new or revised financial accounting standard” refers to any update issued by the Financial Accounting Standards Board to its Accounting Standards Codification after April 5, 2012. |
TABLE OF CONTENTS
| Page | ||||||
| 10.D |
EXCHANGE CONTROLS | 126 | ||||
| 10.E |
TAXATION | 131 | ||||
| 10.F |
DIVIDENDS AND PAYING AGENTS | 138 | ||||
| 10.G |
STATEMENT BY EXPERTS | 138 | ||||
| 10.H |
DOCUMENTS ON DISPLAY | 138 | ||||
| 10.I |
SUBSIDIARY INFORMATION | 138 | ||||
| 10.J |
ANNUAL REPORT TO SECURITY HOLDERS | 138 | ||||
| ITEM 11. |
138 | |||||
| ITEM 12. |
138 | |||||
| 12.A |
DEBT SECURITIES | 138 | ||||
| 12.B |
WARRANTS AND RIGHTS | 138 | ||||
| 12.C |
OTHER SECURITIES | 139 | ||||
| 12.D |
AMERICAN DEPOSITARY SHARES | 139 | ||||
| ITEM 13. |
141 | |||||
| ITEM 14. |
MATERIAL MODIFICATIONS TO THE RIGHTS OF SECURITY HOLDERS AND USE OF PROCEEDS | 141 | ||||
| ITEM 15. |
141 | |||||
| ITEM 16. |
142 | |||||
| ITEM 16A. |
142 | |||||
| ITEM 16B. |
143 | |||||
| ITEM 16C. |
143 | |||||
| ITEM 16D. |
144 | |||||
| ITEM 16E. |
PURCHASES OF EQUITY SECURITIES BY THE ISSUER AND AFFILIATED PURCHASERS | 144 | ||||
| ITEM 16F. |
145 | |||||
| ITEM 16G. |
145 | |||||
| ITEM 16H. |
149 | |||||
| ITEM 16I. |
DISCLOSURE REGARDING FOREIGN JURISDICTIONS THAT PREVENT INSPECTIONS | 149 | ||||
| ITEM 16J. |
150 | |||||
| ITEM 16K. |
150 | |||||
| ITEM 17. |
153 | |||||
| ITEM 18. |
153 | |||||
| ITEM 19. |
154 | |||||
As used in this annual report, the term “fiscal” preceding a year means the twelve-month period ended March 31 of the year referred to. All other references to years refer to the applicable calendar year unless the context otherwise requires. Unless the context otherwise requires or as otherwise expressly stated, references in this prospectus supplement to “TMC” refers to Toyota Motor Corporation, “Toyota,” “we,” “us,” “our” and similar terms refer to Toyota Motor Corporation and its consolidated subsidiaries, as a group, and as of March 31, 2026, “Toyota Group” refers to Toyota Motor Corporation, Toyota Industries Corporation (“Toyota Industries”), Aichi Steel Corporation, JTEKT CORPORATION, Toyota Auto Body Co., Ltd., Toyota Tsusho Corporation, AISIN CORPORATION, DENSO Corporation, TOYOTA BOSHOKU CORPORATION, TOYOTA FUDOSAN CO., LTD., TOYOTA CENTRAL R&D LABS., INC., Toyota Motor East Japan, Inc., Toyoda Gosei Co., Ltd., Hino Motors, Ltd. (“Hino”), Daihatsu Motor Co., Ltd. (“Daihatsu”), Toyota Housing Corporation, Toyota Motor Kyushu, Inc. and Woven by Toyota, Inc. (“Woven by Toyota”), collectively. However, effective April 1, 2026, Hino ceased to be a consolidated subsidiary of TMC, and references in this annual report to “Toyota,” “we,” “us,” “our,” the “Toyota Group” and similar terms, when used in respect of any date or period on or after April 1, 2026, exclude Hino. Notwithstanding the foregoing, certain Hino-brand vehicles continue to be manufactured by our consolidated subsidiaries on or after April 1, 2026, and consolidated vehicle sales for periods on or after such date include such Hino-brand vehicles manufactured by our consolidated subsidiaries.
Toyota’s consolidated financial statements in this annual report have been prepared in accordance with IFRS Accounting Standards, as issued by the International Accounting Standards Board (“IASB”). IFRS Accounting Standards also includes International Accounting Standards (“IASs”) and the related interpretations of the interpretations committees (SIC and IFRIC). As such, we make an explicit and unreserved statement of compliance with IFRS Accounting Standards with respect to our consolidated financial statements as of and for the fiscal years ended March 31, 2024, 2025, and 2026 included in this annual report.
CAUTIONARY STATEMENT WITH RESPECT TO FORWARD-LOOKING STATEMENTS
Written forward-looking statements may appear in documents filed with the SEC, including this annual report, documents incorporated by reference, reports to shareholders and other communications.
The U.S. Private Securities Litigation Reform Act of 1995 provides a “safe harbor” for forward-looking information to encourage companies to provide prospective information about themselves without fear of litigation so long as the information is identified as forward-looking and is accompanied by meaningful cautionary statements identifying important factors that could cause actual results to differ materially from those projected in the information. Toyota relies on this safe harbor in making forward-looking statements.
Forward-looking statements appear in a number of places in this annual report and include statements regarding Toyota’s current intent, belief, targets or expectations or those of its management. In many, but not all cases, words such as “aim,” “anticipate,” “believe,” “estimate,” “expect,” “hope,” “intend,” “may,” “plan,” “predict,” “probability,” “risk,” “should,” “will,” “would,” and similar expressions, are used as they relate to Toyota or its management, to identify forward-looking statements. These statements reflect Toyota’s current views with respect to future events and are subject to risks, uncertainties and assumptions. Should one or more of these risks or uncertainties materialize or should underlying assumptions prove incorrect, actual results may vary materially from those which are anticipated, aimed at, believed, estimated, expected, intended or planned.
Forward-looking statements are not guarantees of future performance and involve risks and uncertainties. Actual results may differ from those in forward-looking statements as a result of various factors. Important factors that could cause actual results to differ materially from estimates or forecasts contained in the forward- looking statements are identified in “Risk Factors” and elsewhere in this annual report, and include, among others:
(i) changes in economic conditions, market demand, and the competitive environment affecting the automotive markets in Japan, North America, Europe, Asia and other markets in which Toyota operates;
(ii) fluctuations in currency exchange rates (particularly with respect to the value of the Japanese yen, the U.S. dollar, the euro, the Australian dollar, the Canadian dollar and the British pound), stock prices and interest rates;
(iii) changes in funding environment in financial markets and increased competition in the financial services industry;
(iv) Toyota’s ability to market and distribute effectively;
(v) Toyota’s ability to realize production efficiencies and to implement capital expenditures at the levels and times planned by management;
(vi) changes in the laws and regulations, as well as other government actions, in the markets in which Toyota operates that affect Toyota’s operations, particularly laws, regulations and government actions relating to vehicle safety including remedial measures such as recalls, environmental protection, vehicle emissions and vehicle fuel economy, and tariffs and other trade policies, as well as current and future litigation and other legal proceedings, government proceedings and investigations;
(vii) political and economic instability in the markets in which Toyota operates;
(viii) Toyota’s ability to timely develop and achieve market acceptance of new products that meet customer demand;
(ix) any damage to Toyota’s brand image;
(x) Toyota’s reliance on various suppliers for the provision of supplies;
(xi) increases in prices of raw materials;
(xii) Toyota’s reliance on various digital and information technologies, as well as information security;
(xiii) fuel shortages or interruptions in electricity, transportation systems, labor strikes, work stoppages or other interruptions to, or difficulties in, the employment of labor in the major markets where Toyota purchases materials, components and supplies for the production of its products or where its products are produced, distributed or sold;
(xiv) the impact of natural calamities, epidemics, political and economic instability, fuel shortages or interruptions in social infrastructure, wars, terrorism and labor strikes, including their negative effect on Toyota’s vehicle production and sales;
(xv) the impact of climate change and the transition towards a low-carbon economy; and
(xvi) the ability of Toyota to hire or retain sufficient human resources.
PART I
ITEM 1. IDENTITY OF DIRECTORS, SENIOR MANAGEMENT AND ADVISERS
Not applicable.
ITEM 2. OFFER STATISTICS AND EXPECTED TIMETABLE
Not applicable.
ITEM 3. KEY INFORMATION
3.A [RESERVED]
3.B CAPITALIZATION AND INDEBTEDNESS
Not applicable.
3.C REASONS FOR THE OFFER AND USE OF PROCEEDS
Not applicable.
3.D RISK FACTORS
Industry and Business Risks
The worldwide automotive market is highly competitive.
The worldwide automotive market is highly competitive. Toyota faces intense competition from automotive manufacturers in the markets in which it operates. In recent years, competition in the automotive industry has further intensified amidst difficult overall market conditions. In addition, competition is likely to further intensify as technological advances in areas such as Connected, Autonomous / Automated, Shared, and Electric (“CASE”) technologies progress in the worldwide automotive industry, possibly resulting in industry reorganizations. Factors affecting competition include product quality and features, safety, reliability, fuel economy, the amount of time required for innovation and development, pricing, customer service, financing terms and tax credits or other government policies in various countries. Increased competition may lead to lower vehicle unit sales, which may result in a further downward price pressure and adversely affect Toyota’s financial condition, results of operations, cash flows and prospects. Toyota’s ability to adequately respond to the recent rapid changes in the automotive market, particularly shifts in consumer preferences to electrified vehicles, and to maintain its competitiveness will be fundamental to its future success in existing and new markets and to maintain its market share. There can be no assurances that Toyota will be able to compete successfully in the future.
The worldwide automotive industry is highly volatile.
Each of the markets in which Toyota competes has been subject to considerable volatility in demand. Demand for vehicles depends to a large extent on economic, social and political conditions in a given market and the introduction of new vehicles and technologies. As Toyota’s revenues are derived from sales in markets worldwide, economic conditions in such markets are particularly important to Toyota.
Changes in demand for automobiles are continuing, and it is unclear how this situation will transition in the future. Toyota’s financial condition, results of operations, cash flows and prospects may be adversely affected if the changes in demand for automobiles continue or progress further beyond Toyota’s expectations. In addition, demand has been affected, and may in the future be affected by, factors directly impacting vehicle price or the
1
cost of purchasing and operating vehicles such as sales and financing incentives, prices of raw materials and parts and components, cost of fuel and governmental regulations (including tariffs, import regulation and other taxes). Volatility in demand may lead to lower vehicle unit sales, which may result in downward price pressure and adversely affect Toyota’s financial condition, results of operations, cash flows and prospects.
Toyota’s future success depends on its ability to offer new, innovative and competitively priced products that meet customer demand on a timely basis.
Meeting customer demand by introducing attractive new vehicles and reducing the amount of time required for product development are critical to automotive manufacturers. In particular, it is critical to meet customer demand with respect to quality, safety, reliability and sustainability. The timely introduction of new vehicle models and vehicle features, at competitive prices, meeting rapidly changing customer preferences and demand is more fundamental to Toyota’s success than ever, as the automotive market is rapidly transforming in light of the changing global economy and technological advances. There is no assurance, however, that Toyota will adequately and appropriately respond to changing customer preferences and demand with respect to quality, safety, reliability, styling, sustainability and other features in a timely manner. Even if Toyota succeeds in perceiving customer preferences and demand, there is no assurance that Toyota will be capable of developing and manufacturing new, price competitive products in a timely manner with its available technology, intellectual property, sources of raw materials and parts and components, and production capacity, including cost reduction capacity. Further, there is no assurance that Toyota will be able to offer new products or implement capital expenditures at the level and times planned by management, including as described in targets or goals that we have disclosed publicly. Toyota’s inability to develop and offer products that meet customers’ preferences and demand with respect to quality, safety, reliability, styling, sustainability and other features in a timely manner could result in a lower market share and reduced sales volumes and margins, and may adversely affect Toyota’s financial condition, results of operations, cash flows and prospects.
Toyota’s ability to market and distribute effectively is an integral part of Toyota’s successful sales.
Toyota’s success in the sale of vehicles depends on its ability to market and distribute effectively based on distribution networks and sales techniques tailored to the needs of its customers. There is no assurance that Toyota will be able to develop sales techniques and distribution networks that effectively adapt to changing customer preferences or changes in the geopolitical and regulatory environment in the major markets in which it operates. Toyota’s inability to maintain well-developed sales techniques and distribution networks may result in decreased sales and market share and may adversely affect its financial condition, results of operations, cash flows and prospects.
Toyota’s success is significantly impacted by its ability to maintain and develop its brand image and reputation.
In the highly competitive automotive industry, it is critical to maintain and develop a brand image and reputation. In order to do so, it is necessary to further increase stakeholders’ confidence by ensuring that Toyota, the Toyota Group and their suppliers thoroughly comply with laws and regulations, provide safe, high-quality products that meet customer preferences and demand, as well as timely and appropriately disseminate information to stakeholders. It is also becoming increasingly important for companies to contribute to sustainability. However, the Toyota Group cannot ensure that it or its suppliers do so in all cases. For instance, at the consolidated subsidiary level, Hino and Daihatsu announced vehicle model certification issues in March 2022 and in April 2023, respectively. In addition, Toyota Motor Corporation investigated certain of its model certification applications as per instructions from the Ministry of Land, Infrastructure, Transport and Tourism of Japan (“MLIT”) on January 26, 2024. Toyota Motor Corporation has confirmed that since 2014 seven models, including some that have already been discontinued, were tested as part of such applications using methods that differed from government standards, and it reported this to the MLIT on May 31, 2024. In July 2024, Toyota Motor Corporation received a correction order from the MLIT regarding its model certification applications.
2
Following on-site investigations, the MLIT indicated eight new cases involving seven vehicles that did not comply with the standards. In August 2024, Toyota Motor Corporation submitted a report on measures to prevent recurrence of such conduct to the MLIT. See “Item 4. Information on the Company — 4.B Business Overview — Legal Proceedings” for further discussion of these and related matters.
In addition, actual or perceived failures on the part of Toyota or its suppliers to contribute to sustainability or to meet certain sustainability-related goals or objectives, including those relating to climate change or the protection of human rights in Toyota’s supply chain, may also harm Toyota’s reputation. Any insufficient measures taken by Toyota, the Toyota Group or their suppliers to maintain and develop Toyota’s brand image and reputation may have an adverse effect on Toyota’s financial condition, results of operations, cash flows and prospects.
Toyota relies on suppliers for the provision of certain supplies including parts, components and raw materials.
Toyota purchases supplies including parts, components and raw materials from a number of external suppliers located around the world. For some supplies, Toyota relies on a single supplier or a limited number of suppliers, whose replacement with another supplier may be difficult. Inability to obtain supplies from a single or limited source supplier may result in difficulty obtaining supplies and may restrict Toyota’s ability to produce vehicles. Furthermore, even if Toyota were to rely on a large number of suppliers, first-tier suppliers with whom Toyota directly transacts may in turn rely on a single second-tier supplier or limited second-tier suppliers.
Irrespective of the number of suppliers, Toyota’s ability to continue to obtain supplies from its suppliers in a timely and cost-effective manner is subject to a number of factors, some of which are not within Toyota’s control. These factors include the ability of Toyota’s suppliers to provide a continued source of supply, and Toyota’s ability to effectively compete and obtain competitive prices from suppliers. Circumstances that may adversely affect such abilities include geopolitical tensions as well as related governmental actions such as economic sanctions and export controls that may be relevant to certain suppliers.
A loss of any single or limited source supplier, or inability to obtain supplies from suppliers in a timely and cost-effective manner, could lead to increased costs or delays or suspensions in Toyota’s production and deliveries, which could have an adverse effect on Toyota’s financial condition, results of operations, cash flows and prospects.
The worldwide financial services industry is highly competitive.
The worldwide financial services industry is highly competitive. Increased competition in automobile financing may lead to decreased margins. A decline in Toyota’s vehicle unit sales, an increase in residual value risk due to lower used vehicle prices, an increase in the ratio of credit losses and increased funding costs are additional factors which may impact Toyota’s financial services operations. If Toyota is unable to adequately respond to the changes and competition in automobile financing, Toyota’s financial services operations may adversely affect its financial condition, results of operations, cash flows and prospects.
Toyota’s operations and vehicles rely on various digital and information technologies, as well as information security, which are subject to frequent attack.
Toyota depends on various information technology networks and systems, some of which are managed by third parties, to process, transmit and store electronic information, including sensitive data, and to manage or support a variety of business processes and activities, including manufacturing, research and development, supply chain management, sales and accounting. In addition, Toyota vehicles may rely on various digital and information technologies, including information service and driving assistance functions.
Despite security measures, Toyota’s digital and information technology networks and systems may be vulnerable to damage, disruptions, shutdowns due to unauthorized access or attacks by hackers, computer
3
viruses, breaches due to unauthorized use, errors or malfeasance by employees and others who have or gain access to the networks and systems Toyota depends on or otherwise uses, service failures or bankruptcy of third parties such as software development or cloud computing vendors, power shortages and outages, and utility failures or other catastrophic events like natural disasters. In particular, cyberattacks or other intentional malfeasance are increasing in terms of intensity, sophistication and frequency, and Toyota has been and expects to continue to be the subject of such attacks. Such attacks have, in some cases, and could again disrupt critical operations, disclose sensitive data, interfere with information services and driving assistance functions in Toyota’s vehicles, and/or give rise to legal claims or proceedings, liability or regulatory penalties under applicable laws, which could have an adverse effect on Toyota’s brand image and its financial condition, results of operations, cash flows and prospects. Moreover, similar attacks on Toyota’s suppliers and business partners have had, and may in the future have, a similar negative impact on Toyota.
Toyota is exposed to risks associated with climate change, including the physical risks of climate change and risks from the transition to a lower-carbon economy.
Risks associated with climate change are subject to increasing societal and political, including regulatory, focus in Japan and globally. These risks include the physical risks of climate change and risks from the transition to a lower-carbon economy.
The physical risks of climate change include both acute, event-driven risks such as those relating to hurricanes, floods, tornadoes, drought, and wildfires as well as longer-term weather patterns and related effects, such as sustained higher temperatures and sea level rise. While Toyota has a Business Continuity Plan (“BCP”), in addition to large-scale disasters due to extreme weather conditions, the increase and intensification of severe weather events such as heat waves is expected to increase the risk of heat stroke and water shortages due to drought. Such severe weather events and other natural conditions have in the past harmed, and may in the future again harm, Toyota’s employees or its facilities and other assets, as well as those of Toyota’s suppliers and other business partners, thereby adversely affecting Toyota’s production, sales or other operational capacities. Large-scale disasters and other events may also adversely affect the financial condition of Toyota’s customers, and thereby demand for its products and services.
Transition risks are those attributable to regulatory, technological and market changes to address the mitigation of, or adaptation to, climate-related risks. For example, Toyota is subject to the risk of changes in customer demand for vehicles due to such factors as changes in laws, regulations and government policies relating to climate change, technological innovation to address climate change, and new entrants into the automobile industry that seek to capitalize on changing market dynamics. Changes in customer demand may pose ancillary risks and challenges, such as Toyota’s having to establish new, or enhance existing, supply networks in order to source the raw materials, parts and components necessary for it to manufacture the products then in demand at desired volumes and at competitive costs. Toyota may incur significant costs and expenses as a result of the materialization of such risks, or in its efforts to mitigate or adapt to such risks. Toyota’s inability to develop and offer products that meet customers’ preferences and demand in a timely manner could result in a lower market share and reduced sales revenues and margins, and may adversely affect Toyota’s financial condition, results of operations cash flows and prospects.
Furthermore, Toyota has published disclosures on climate-change related matters relating to its business and its partners. Such disclosures include forward-looking statements based on Toyota’s expectations and assumptions, involving substantial discretion and forecasts about costs and future circumstances, which may prove to be incorrect. In addition, Toyota’s initiatives relating to climate change may not have the intended results, and estimates concerning the timing and cost of implementing, and ability to meet, stated goals are subject to risks and uncertainties. As a result, Toyota may not be able to meet its goals, including those set forth in this report, on expected timing or within expected costs.
In particular, progress toward achieving Toyota’s climate-related targets requires significant investment of resources and management time, as well as further improvement of compliance and risk management systems,
4
internal controls and other internal procedures. Toyota’s ability to achieve its climate-related goals, which are to be pursued over the long-term and are inherently aspirational, is subject to numerous risks and uncertainties, many of which are outside of Toyota’s control, such as changes in environmental and energy regulation and policy, the pace of technological change and innovation, and the actions of Toyota’s customers and competitors. Any failure, or perceived failure, by Toyota to achieve its climate-change related goals, including those set forth in this report, could adversely impact its reputation, financial condition, results of operations, cash flows and prospects. For a further discussion of risks associated with climate change, see “Item 4. Information on the Company — 4.B Business Overview — Climate Change-related Disclosures.”
Toyota’s operations are dependent on securing, retaining and developing talented, diverse employees.
Given in particular the rapid changes in its business environment and its efforts to transform into a mobility company, Toyota’s success depends on its ability to continue to recruit, retain and develop talented and diverse employees. However, competition for such employees is intense and if Toyota cannot recruit and retain diverse employees with a high level of expertise and extensive experience as planned, or it is unable to provide its employees with the opportunities, training and resources they need to develop themselves further, it may reduce Toyota’s competitiveness, and its financial condition, results of operations, cash flows and prospects could be adversely affected.
Financial Market and Economic Risks
Toyota’s operations are subject to currency and interest rate fluctuations.
Toyota is sensitive to fluctuations in foreign currency exchange rates and is principally exposed to fluctuations in the value of the Japanese yen, the U.S. dollar and the euro and, to a lesser extent, the Australian dollar, the Canadian dollar and the British pound. Toyota’s consolidated financial statements, which are presented in Japanese yen, are affected by foreign currency exchange fluctuations through translation risk, and changes in foreign currency exchange rates may also affect the price of products sold and materials purchased by Toyota in foreign currencies through transaction risk. In particular, strengthening of the Japanese yen against the U.S. dollar can have an adverse effect on Toyota’s operating results.
Toyota believes that its use of certain derivative financial instruments including foreign exchange forward contracts and interest rate swaps and increased localized production of its products have reduced, but not eliminated, the effects of interest rate and foreign currency exchange rate fluctuations. Nonetheless, a negative impact resulting from fluctuations in foreign currency exchange rates and changes in interest rates may adversely affect Toyota’s financial condition, results of operations, cash flows and prospects. For a further discussion of currency and interest rate fluctuations and the use of derivative financial instruments, see “Item 5. Operating and Financial Review and Prospects — 5.A Operating Results — Overview — Currency Fluctuations,” “Item 11. Quantitative and Qualitative Disclosures About Market Risk,” and notes 9 and 20 to Toyota’s consolidated financial statements.
High prices of raw materials and strong pressure on Toyota’s suppliers has and could continue to negatively impact Toyota’s profitability.
Increases in raw materials prices that Toyota and Toyota’s suppliers use in manufacturing their products or parts and components such as steel, precious metals, non-ferrous alloys including aluminum, and plastic parts, may lead to higher production costs for parts and components. This could, in turn, negatively impact Toyota’s profitability if Toyota is not able to pass all those costs on to its customers.
A downturn in the financial markets could adversely affect Toyota’s ability to raise capital.
Should the world economy suddenly deteriorate, a number of financial institutions and investors will face difficulties in providing capital to the financial markets at levels corresponding to their own financial capacity,
5
and, as a result, there is a risk that companies may not be able to raise capital under terms that they would expect to receive with their creditworthiness. If Toyota is unable to raise the necessary capital under appropriate conditions on a timely basis, Toyota’s financial condition, results of operations, cash flows and prospects may be adversely affected.
Regulatory, Legal, Political and Other Risks
The automotive industry is subject to various laws, regulations and governmental actions.
The worldwide automotive industry is subject to various laws and regulations. Toyota has incurred significant costs as a result of laws, regulations and governmental actions or in response thereto, and expects to incur such costs in the future. Furthermore, new legislation or regulations or changes in existing legislation or regulations may also subject Toyota to additional costs in the future. If Toyota incurs significant costs related to laws, regulations and governmental actions, Toyota’s financial condition, results of operations, cash flows and prospects may be materially and adversely affected. Such laws, regulations and governmental actions may also limit or restrict Toyota’s businesses or operations, which may also materially and adversely affect its financial condition, results of operations, cash flows and prospects.
For example, Toyota is subject to various laws and regulations related to vehicle safety and environmental matters such as emission levels, fuel economy, noise and pollution. In particular, automotive manufacturers such as Toyota are required to implement safety measures such as recalls for vehicles that do not or may not comply with the safety standards prescribed in laws and regulations. In addition, Toyota may, in order to reassure its customers of the safety of Toyota’s vehicles, decide to voluntarily implement sales suspensions, recalls or other safety measures even if the vehicle complies with the safety standards of relevant laws and regulations. If Toyota launches products that result in safety measures such as recalls (including where parts related to recalls or other measures were procured by Toyota from a third party), Toyota may incur various costs including significant costs for free repairs. The failure to comply with such regulations could result in legal proceedings, recalls, negotiated remedial actions, fines, corrective orders, revocations of government approvals and the imposition of other government sanctions, restricted product offerings, compensatory payments or adverse consequences.
Similarly, many governments also impose tariffs and other trade barriers, taxes and levies, or enact export, price or exchange controls. For example, in 2025, a significant increase in tariffs on exports to the United States, including tariffs specifically related to the automotive industry, were announced. Such elevated tariff rates remain in effect as of the date of this report. We cannot predict the timing, duration, scope or extent of any future changes to such tariffs and trade policies, or of other tariffs or trade-related actions. In addition, export controls governing components incorporated into certain vehicles also have been enacted. The recently announced tariffs and trade actions have increased the cost of our products and may cause stagnation in demand for them in the future. They have also adversely affected our supply chains and distribution networks, which negatively impacts our production and sales. The effects described above are primarily focused in the United States, but they are not limited to the United States, given our cross-border operations. Should the current situation continue for an extended period, it could potentially negatively impact not only us but other participants in the entire automotive industry as well as related industries, which could in turn further adversely affect our financial condition, results of operations, cash flows and prospects. Furthermore, our efforts to mitigate the impact of such tariffs or trade-related actions may themselves require us to incur costs and dedicate management attention.
Toyota may become subject to various legal proceedings.
Toyota may become subject to legal proceedings in respect of various issues, including issues relating to the topics discussed in “— The automotive industry is subject to various laws, regulations and governmental actions,” as well as product liability and infringement of intellectual property. Toyota may also be subject to legal proceedings brought by its shareholders and governmental proceedings and investigations. Toyota is in fact currently subject to a number of pending legal proceedings and government investigations. A negative outcome
6
in one or more of these pending legal proceedings could adversely affect Toyota’s reputation, brand image, financial condition, results of operations, cash flows and prospects. For a further discussion of governmental regulations, see “Item 4. Information on the Company — 4.B Business Overview — Governmental Regulation, Environmental and Safety Standards” and for legal proceedings, please see “Item 4. Information on the Company — 4.B Business Overview — Legal Proceedings.”
Toyota may be adversely affected by natural calamities, epidemics, political and economic instability, fuel shortages or interruptions in social infrastructure, wars, terrorism and labor strikes.
Toyota is subject to various risks associated with conducting business worldwide. These risks include natural calamities; epidemics; political and economic instability; fuel shortages; interruption in social infrastructure including energy supply, transportation systems, gas, water, or communication systems resulting from natural hazards or technological hazards; wars; terrorism; labor strikes and work stoppages. Disruptions, delays and other adverse changes in the operations of Toyota’s business have ensued from such risks materializing in the past. Should the major markets in which Toyota purchases materials, parts and components and supplies for the manufacture of Toyota products or in which Toyota’s products are produced, distributed or sold be affected by any of these events, it may result in future disruptions, delays and other adverse changes in the operations of Toyota’s business.
ITEM 4. INFORMATION ON THE COMPANY
4.A HISTORY AND DEVELOPMENT OF THE COMPANY
Toyota Motor Corporation is a joint-stock company with limited liability incorporated under the Commercial Code of Japan and continues to exist under the Companies Act of Japan (the “Companies Act”). Toyota commenced operations in 1933 as the automobile division of Toyota Industries (formerly Toyoda Automatic Loom Works, Ltd.). Toyota was incorporated as a separate company in August 1937. In 1982, the Toyota Motor Company and Toyota Motor Sales merged to form the present Toyota Motor Corporation. As of March 31, 2026, Toyota operates through 602 consolidated subsidiaries (including structured entities) and 159 associates and joint ventures accounted for by the equity method.
See “Item 4. Information on the Company — 4.B Business Overview — Capital Expenditures and Divestitures” for a description of Toyota’s principal capital expenditures and divestitures between April 1, 2023 and March 31, 2026 and information on Toyota’s principal capital expenditures and divestitures currently in progress.
Toyota’s principal executive offices are located at 1 Toyota-cho, Toyota City, Aichi Prefecture 471-8571, Japan. Toyota’s telephone number in Japan is +81-565-28-2121.
The SEC maintains a website (https://www.sec.gov/) that contains reports, proxy and information statements, and other information regarding issuers that file electronically with the SEC. Toyota also maintains a website (https://global.toyota/en/) through which its annual reports on Form 20-F and certain of its other SEC filings may be accessed. Information contained on or accessible through Toyota’s website is not part of this annual report on Form 20-F.
4.B BUSINESS OVERVIEW
Toyota primarily conducts business in the automotive industry. Toyota also conducts business in the financial services and other industries. Toyota sold 9,595 thousand vehicles in fiscal 2026 on a consolidated basis. Toyota had sales revenues of ¥50,684.9 billion and net income attributable to Toyota Motor Corporation of ¥3,848.0 billion in fiscal 2026.
7
Toyota’s business segments are automotive operations, financial services operations and all other operations. The following table sets forth Toyota’s sales to external customers in each of its business segments for each of the past three fiscal years.
| Yen in millions | ||||||||||||
| Year Ended March 31, | ||||||||||||
| 2024 | 2025 | 2026 | ||||||||||
| Automotive |
41,080,731 | 42,996,299 | 45,201,924 | |||||||||
| Financial Services |
3,447,195 | 4,437,827 | 4,819,003 | |||||||||
| All Other |
567,399 | 602,578 | 664,026 | |||||||||
Toyota’s automotive operations include the design, manufacture, assembly and sale of passenger vehicles, minivans and commercial vehicles such as trucks and related parts and accessories. Toyota’s financial services business consists primarily of providing financing to dealers and their customers for the purchase or lease of Toyota vehicles. Toyota’s financial services business also provides mainly retail installment credit and leasing through the purchase of installment and lease contracts originated by Toyota dealers. Related to Toyota’s automotive operations, Toyota is working towards having all of its vehicles become connected vehicles, creating new value and reforming businesses by utilizing big data obtained from those connected vehicles, and establishing new mobility services. Toyota’s all other operations business segment includes the information technology related businesses including a web portal for automobile information called GAZOO.com.
Toyota sells its vehicles in approximately 200 countries and regions. Toyota’s primary markets for its automobiles are Japan, North America, Europe and Asia. The following table sets forth Toyota’s sales to external customers in each of its geographical markets for each of the past three fiscal years.
| Yen in millions | ||||||||||||
| Year Ended March 31, | ||||||||||||
| 2024 | 2025 | 2026 | ||||||||||
| Japan |
10,193,556 | 10,719,120 | 10,985,614 | |||||||||
| North America |
17,624,268 | 18,930,253 | 20,661,490 | |||||||||
| Europe |
5,503,738 | 6,110,052 | 6,464,911 | |||||||||
| Asia |
7,604,269 | 7,903,360 | 7,966,455 | |||||||||
| Other* |
4,169,494 | 4,373,919 | 4,606,482 | |||||||||
| * | “Other” consists of Central and South America, Oceania, Africa and the Middle East. |
During fiscal 2026, 21.7% of Toyota’s automobile unit sales on a consolidated basis were in Japan, 30.6% were in North America, 12.3% were in Europe and 18.3% were in Asia. The remaining 17.1% of consolidated unit sales were in other markets.
The Worldwide Automotive Market
Toyota estimates that annual worldwide vehicle sales totaled approximately 92 million units in 2025.
Automobile sales are affected by a number of factors including:
| • | social, political and economic conditions; |
| • | introduction of new vehicles and technologies; |
| • | vehicle prices, costs incurred by customers to purchase and operate automobiles; and |
| • | Supply chain disruptions arising from geopolitical risks |
8
These factors can cause consumer demand to vary substantially from year to year in different geographic markets and in individual categories of automobiles. Looking at the global economy in fiscal 2026, the U.S. economy remained resilient, supported principally by stable personal consumption. In China, fiscal policy measures, including economic stimulus packages, provided underlying support. As a result, according to our research, the global economy maintained a growth rate of around 3%.
Meanwhile, in the automotive market, government policies and consumer stimulus measures across various countries bolstered demand, and the market continued to expand at a steady pace.
Looking at the economies of major countries, in the United States, despite adverse conditions such as shifts in trade policy, the economy maintained solid performance, supported by resilient personal consumption. The Chinese economy maintained year-over-year growth, supported by resilient exports and fiscal policy measures; however, underlying domestic demand lacked momentum. In Europe, the economy accelerated from the previous year. Against a backdrop of moderated inflation and a stable employment environment, personal consumption served as the primary driver of growth. In Japan, the economy shifted from negative growth in the previous year to positive growth in 2025.
Amid this environment, the global automotive market maintained a pace of expansion in 2025, with a year-on-year increase of 3%.
In North America, new vehicle sales were approximately 19.90 million units, an increase from the previous year. In Europe, new vehicle sales increased from the previous year to approximately 18.60 million units. New vehicle sales in the Chinese market totaled approximately 26.60 million units, remaining largely flat compared to the previous year. Emerging markets also continued on an upward trend. In India, in addition to underlying market strength, the revised Goods and Services Tax enacted in the second half of 2025 boosted automobile demand.
The share of each market across the globe, which Toyota estimates based on the available automobile sales data in each country and region information, was 29% for China, 22% for North America (including Mexico and Puerto Rico), 20% for Europe, 4% for Asia (excluding Japan, South Korea and China), and 10% for India and the Middle East.
In the medium- to long-term, Toyota expects the automotive market to continue growing driven principally by growth in China and other emerging countries. However, global competition is expected to be severe, as various regulations aimed at carbon neutrality have been strengthened and the pace of technological advancement and development of new products, particularly related to electrification, quickens further.
The worldwide automotive industry is affected significantly by government regulations aimed at reducing harmful effects on the environment, enhancing vehicle safety and improving fuel economy. These regulations have added to the cost of manufacturing vehicles. Many governments also mandate local procurement of parts and components and impose tariffs and other trade barriers, as well as price or exchange controls as a means of creating jobs, protecting domestic producers or influencing their balance of payments. Changes in regulatory requirements and other government-imposed restrictions can limit or otherwise burden an automaker’s operations. Government laws and regulations can also make it difficult to repatriate profits to an automaker’s home country.
The development of the worldwide automotive market includes the continuing globalization of automotive operations. Manufacturers seek to achieve globalization by localizing the design and manufacture of automobiles and their parts and components in the markets in which they are sold. By expanding production capabilities beyond their home markets, automotive manufacturers are able to reduce their exposure to fluctuations in foreign exchange rates, as well as to trade restrictions and tariffs.
9
Over the years, there have been many global business alliances and investments entered into between manufacturers in the global automotive industry. There are various reasons behind these transactions including the need to address excessive global capacity in the production of automobiles, and the need to reduce costs and improve efficiency by increasing the number of automobiles produced using common vehicle platforms and by sharing research and development expenses for environmental and other technology, the desire to expand a company’s global presence through increased size; and the desire to expand into particular segments or geographic markets.
Toyota believes that its research and development initiatives, particularly the development of environmentally friendly new vehicle technologies, vehicle safety and information technology, provide it with a strategic advantage.
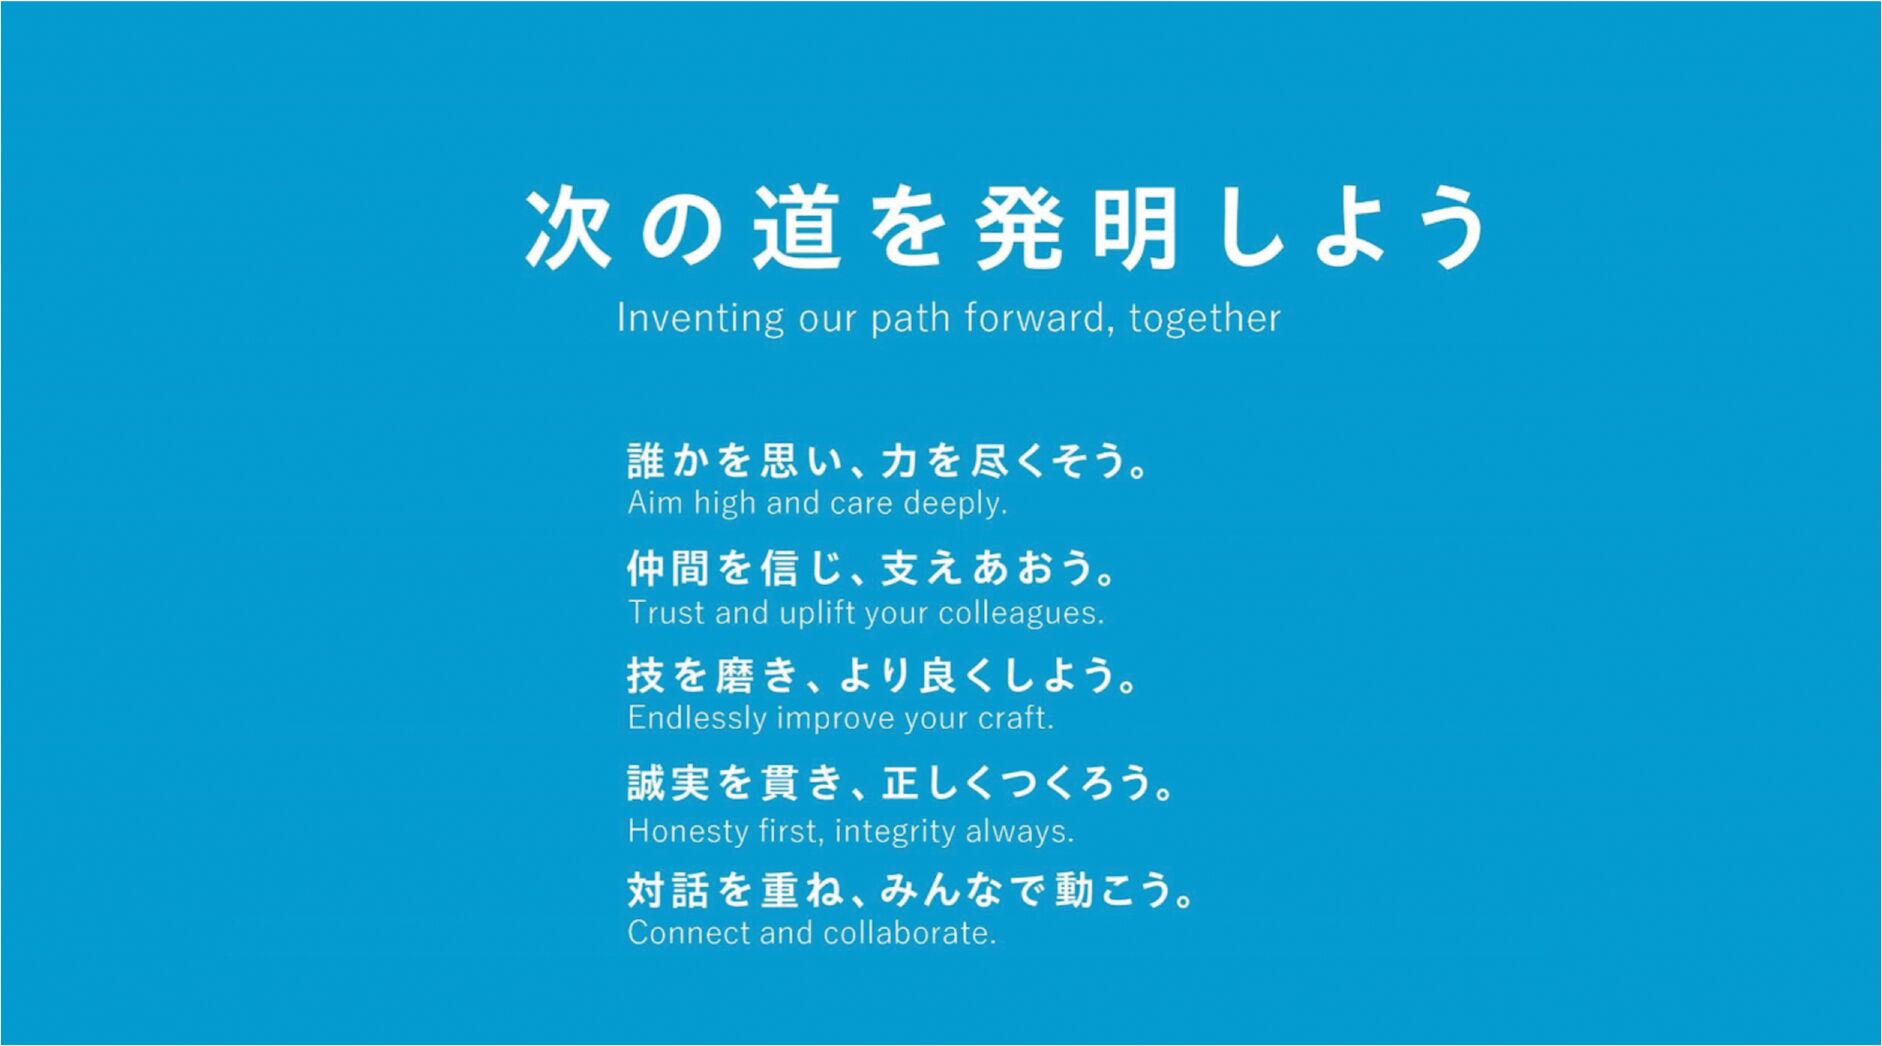
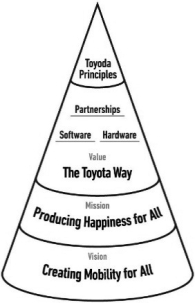
Toyota Philosophy
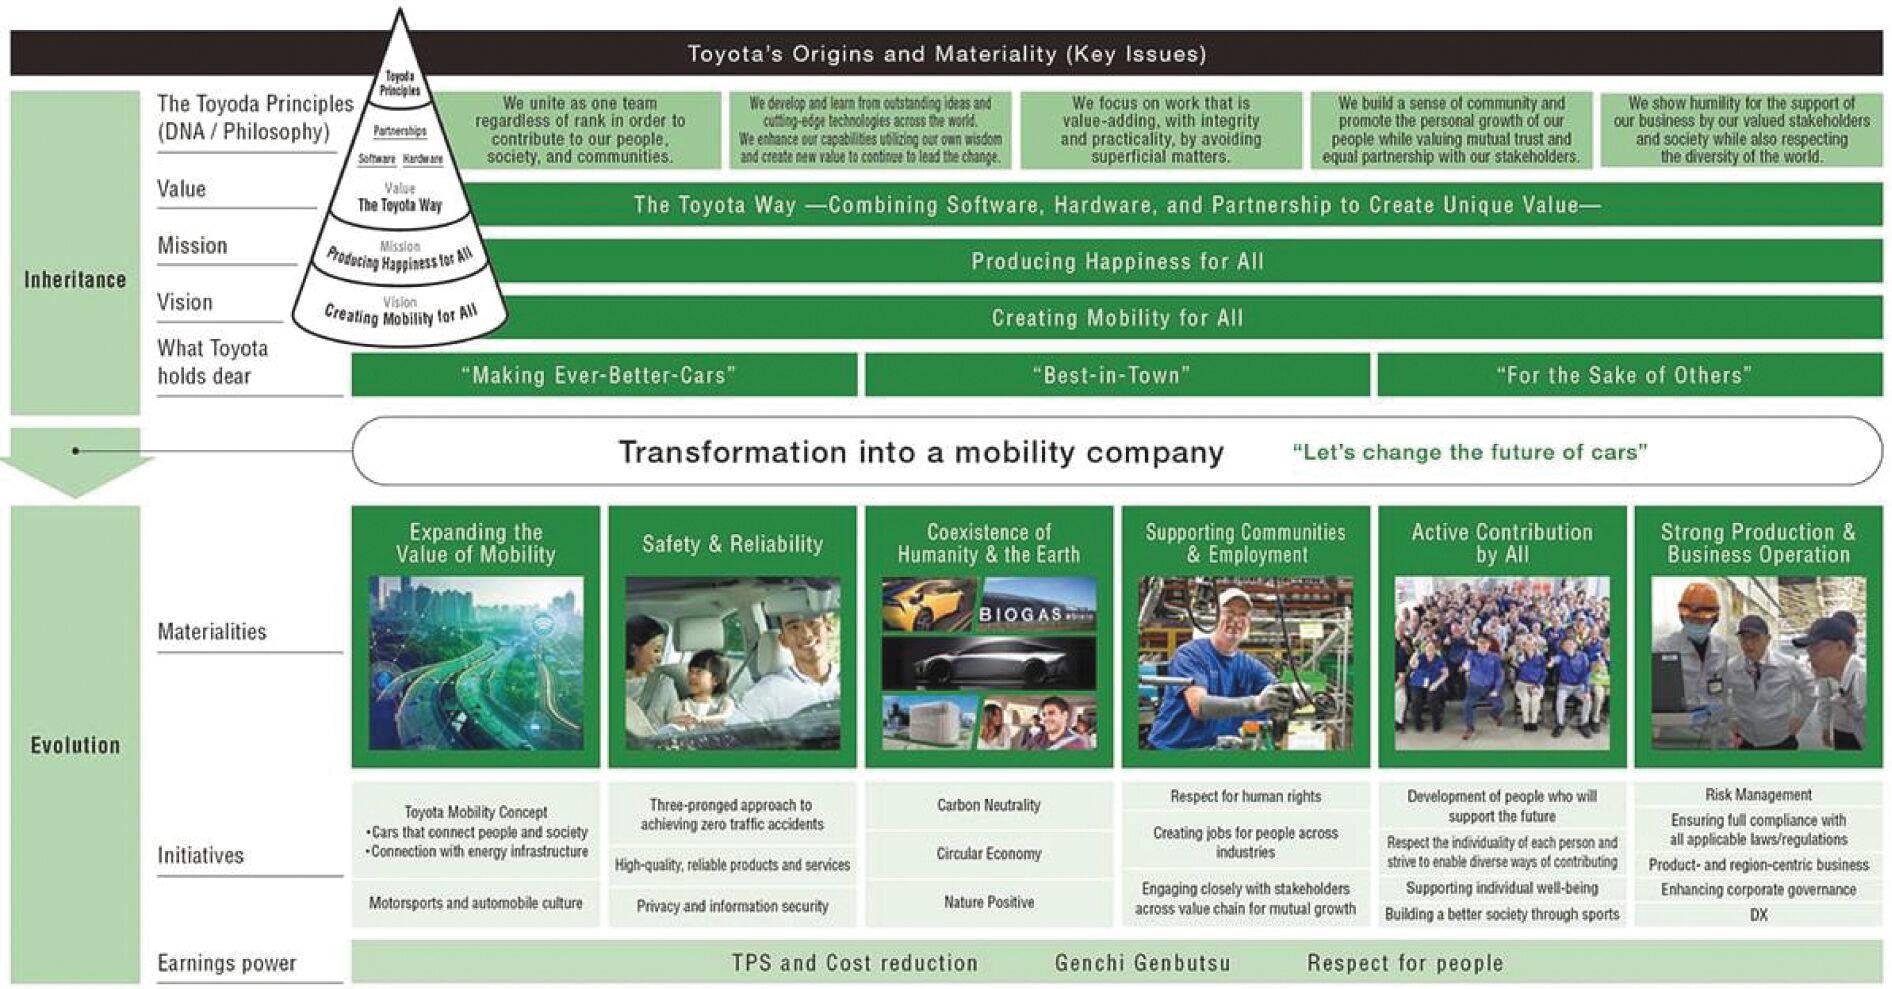
The automotive industry is experiencing a once-in-a-century transformation. We are now striving to transform ourselves into a mobility company. In an era which it is hard to predict the future, Toyota has reflected on the path it has taken thus far and has formulated the “Toyota Philosophy” as a roadmap for the future.
Toyota’s mission is “Producing Happiness for All” by expanding the possibilities of people, companies and communities through addressing the challenges of mobility as a mobility company. In order to do so, Toyota will continue to create new and unique value with various partners by relentlessly committing towards monozukuri (manufacturing), and by fostering imagination for people and society.
|
MISSION |
Producing Happiness for All
| ||||
| VISION |
Creating Mobility for All
| |||||
| VALUE |
We unite our three strengths (Software, Hardware and Partnerships) to create new and unique value that comes from the Toyota Way
| |||||
Toyota Production System (“TPS”)
TPS is imbued with the desire of Sakichi Toyoda, the founder of the Toyota Group, and Kiichiro Toyoda, the founder, “to make someone’s work easier.”
TPS was established based on two concepts: Jidoka, which can be loosely translated as “automation with a human touch,” — an idea of stopping equipment immediately when a problem occurs, in order to prevent defective products from being produced — and “Just in Time” (“JIT”), a concept based on the idea that “each
10
process produces only what is needed for the next process in a continuous flow.” Based on the basic philosophies of jidoka and JIT, through TPS, Toyota aims to efficiently and quickly produce vehicles of sound quality, one at a time, to fully satisfy customer requirements.
Toyota believes that improving upon TPS is essential to its future survival. Toyota has introduced TPS into development departments and administrative departments. Toyota applies TPS to its development departments not only to shorten development times and reduce costs, but also to develop our human resources, thus leading to the manufacturing of ever-better cars that customers will love.
Toyota Group Vision
Chairman Akio Toyoda unveiled the Toyota Group Vision in January 2024. By outlining the direction the Toyota Group should take and putting forth a vision and set of values to which all Toyota Group members can refer, we aim to empower everyone at the genba (front lines) to engage in autonomous action that is consistent with the common vector defined for the Group. Since announcing the vision, we have been advancing numerous initiatives to entrench this vision and the associated values throughout the organization. At the Groupwide level, Chairman Toyoda met with frontline leaders at Group companies to take part in frank discussions and provide advice. He also attended meetings of Daihatsu dealer representatives to gather input from dealers and customers so as to better understand actual conditions and issues on a genchi genbutsu (on-site, hands-on experience) basis. At Toyota Motor Corporation, meanwhile, steps have been taken to share our vision and values among members of management and frontline staff through the ongoing issuance of messages from then-President Koji Sato to employees, labor-management discussions, and regular visits to frontline organizations by management. Through these concerted efforts, we seek to foster an appropriate workplace environment. The Group Vision represents the direction the Toyota Group should take and the vision and values to which all Toyota Group members can return.
“Inventing our path forward, together.”
Sakichi Toyoda, the founder of the Toyota Group, invented the Toyoda wooden hand loom with the desire to make life a little easier for his struggling mother. Kiichiro Toyoda invented the domestically produced passenger car with the idea that the automobile industry must be developed by the knowledge and skills of Japanese people. Thinking of others, learning, honing skills, making things, and bringing smiles to people’s faces — that passion and attitude toward invention are truly the starting point of the Toyota Group.
11
In a time when there is no right answer, we will build a corporate culture in which we can say “thank you” to each other and aim to be a Toyota Group that is needed in the future, where diverse human resources can play an active role.
Product-centered Management
The challenges our industry faces — carbon neutrality, connected mobility, and AI — cannot be solved by a single company acting alone. True breakthroughs emerge from synergies created when diverse people with varying perspectives collaborate and engage in lively discussion. We believe that co-creating in this manner is key to shaping the future.
A good example is our recent collaboration on battery technology. Through continued development efforts, Toyota has successfully reduced the size of its all-solid-state batteries by one-third compared with conventional batteries while maintaining performance. These batteries are compact and lightweight, offering both short charging times and exceptional durability, and are targeted for commercialization between 2027 and 2028. This battery technology will enhance the flexibility of battery electric vehicles (“BEV”) proportions and packaging, enabling designs that strike a better balance between aesthetics and performance.
BEVs are just one pillar of Toyota’s multi-pathway strategy for becoming carbon neutral. We are working with our partners on the development of carbon-neutral fuels such as biofuels and synthetic fuels, striving to lower the CO2 emissions of our existing vehicles. We also see great potential in hydrogen. For commercial vehicles, we are collaborating with Daimler Truck Holding AG, and for passenger vehicles, we are working with BMW, as well as the governments in Fukushima and Tokyo, to expand the use of hydrogen in both markets. In Japan, with the support of the government, we have begun introducing light-duty fuel-cell trucks for logistics in regions such as Fukushima and Tokyo. By promoting the wider adoption of hydrogen in commercial vehicles, which consume large amounts of fuel, we aim to accelerate infrastructure development to help contribute to the realization of a hydrogen society wherein hydrogen fuel can be stable and reliable.
Furthermore, we are expanding the possibilities of mobility across land, sea, air, and space. Our collaboration with Joby Aviation, Inc. (“Joby”) on Joby’s electric vertical take-off and landing aircraft (eVTOL)
12
has the potential to transform people’s sense of distance and time, and we are working with them to steadily progress to open up a new dimension of mobility. Furthermore, we are venturing into the satellite and rocket fields with Interstellar Technologies Inc. and are also working to provide solutions to terrestrial issues through satellite communication.
The ultimate goal of automated driving and Software Defined Vehicles (“SDV”) is to realize a world with zero traffic accidents. Driving assist technologies and automated driving are expected to further reduce the number of accidents, but responding to unpredictable situations such as sudden obstacles emerging from blind spots requires information from the infrastructure side. We are building a system that integrates vehicles, people, and infrastructure, enabling the prediction and prevention of accidents before they occur. Demonstrations are already underway in Japan and China, and we are working steadily toward realizing a safe and secure mobility society in collaboration with many partners.
In addition, Toyota Research Institute, Inc. (“TRI”) is taking on the challenge of developing AI robots that work and grow together with humans as partners, rather than simply replacing them. To accelerate demonstrations and the advancement of these technologies, we are leveraging Woven City, a mobility test course. Woven City, which held its grand opening in 2025, brings together partners, universities, start-ups, research institutions, and other diverse partners to turn innovative ideas into reality. From here, Woven City will pave the way toward the next generation of mobility.
Today, Toyota has outstanding partners who share our vision and are committed to creating the future together. They are likeminded allies who share a long-term perspective and the belief that collaboration accelerates progress. Together with these partners, we will realize the future of mobility and the sustainable growth of society.
Region-centered Management
The foundation of Toyota’s region-centered management is the concept of “best in town.” This concept does not aim to maximize global sales volume or market share. Instead, it reflects our commitment to remain the company that stays closest to customers’ daily lives and earns their trust in each community. Mobility is an integral part of everyday life. By continuing to address the unique challenges and expectations of each region, we believe we can achieve sustainable, long-term growth. Being recognized globally and being needed locally are not always the same. Toyota has achieved the former by steadily accumulating the latter. “Best in town” expresses this management approach. “Best in town” does not simply mean providing high-quality products. It means understanding customers’ lifestyles, culture, road conditions, climate, and values and providing mobility that best fits each region. Even the same vehicle may be used differently depending on the environment. Cold climates, deserts, urban areas, and rural communities require different performance and value. For this reason, rather than applying uniform global strategies, we emphasize systems that allow decisions and actions to be made locally.
This philosophy extends beyond product planning and design to sales and after-sales services. Dealers around the world serve not only as sales locations but also as our closest points of contact with customers. Feedback gathered through daily dialogue serves as the starting point for product improvements and new initiatives. For Toyota, volume and share ultimately represent the trust we build with customers. The accumulation of this trust has supported our business over the long term.
Toyota operates by dividing the world into eight major regions and managing each business based on the characteristics of those regions. Economic conditions, social issues, and levels of market maturity vary significantly from one region to another. For this reason, we have established a structure that enables each region to assess its own circumstances and customer needs and to make decisions and execute initiatives locally.
The cornerstone of this approach is our commitment to stay close to people’s lives and contribute to local communities through mobility. While the best solutions may differ by region, our overall direction remains the
13
same. This approach remains consistent across both emerging and developed markets. Guided by our belief that “no one should be left behind,” Toyota has continued to offer a full global lineup. Leaders in each of the eight regions work closely with customers and local communities to deliver vehicles that best meet the needs of their respective markets.
As a result, we deliver vehicles to customers globally on the basis of a well-balanced business foundation, without depending too heavily on any particular region or market. Energy conditions differ by region, and the pace of electrification and vehicle usage also varies widely. The powertrains required in each market therefore differ as well. To ensure that customer choice is never limited, Toyota continues to enhance the appeal and competitiveness of all powertrains, including BEVs. In an uncertain environment, rather than trying to predict the future, we prepare a range of options to respond quickly to change.
Initiatives that begin in a single town and with a single customer are carried out by thousands of dealers around the world. By working together, Toyota has become a company chosen by customers globally. In addition to delivering high-quality products, Toyota is supported by the people who bring those products to customers in each region and build lasting relationships. Partnerships grounded in trust, credibility, and mutual understanding create value rooted in local communities and foster loyalty across generations.
Guided by our aim to be “best in town” and the mantra of “making ever-better cars,” we continue to evolve our vehicles by responding to the unique characteristics of each market and the needs of customers in every region. By maintaining a full global lineup and continuously evolving our vehicles to meet the needs of different eras and regions, we have produced many long-selling models, such as the Corolla and the Land Cruiser, that are loved by customers worldwide. Going forward, under its “best in town” philosophy, Toyota will remain deeply rooted in local communities, stay close to customers’ lives, and continue delivering products that are loved for generations as a mobility company.
Five-brands Strategy
At the Japan Mobility Show held in October 2025, we announced the launch of Century as a new brand alongside our Toyota, Lexus, Daihatsu, and GR brands. In particular, the “Century” brand’s goal is to share the pride of Japan with the world. Its name reflects the aspiration to shape the next 100 years, and through the creation of new value originating in Japan, Toyota aims to contribute to the realization of a sustainable and peaceful society.
We also introduced “TO YOU” as a brand concept in 2025 to represent the Toyota brand. Additionally, the IMV Origin, which we unveiled at Japan Mobility Show 2025, is deliberately shipped from the factory in an unfinished state, with final assembly carried out locally. This approach creates new jobs in vehicle assembly within the community and contributes to the development of employment opportunities and skills. In addition, by allowing flexible customization to suit a wide range of lifestyles and work needs, the IMV Origin aims to deliver mobility that best fits the unique conditions of each region.
By assuming roles that are both more clearly defined and complementary to one another, the Toyota Group’s brands will comprise a product lineup suitably diverse to meet the needs of each customer and offer them a wider range of options.
Continuous Improvement in Break-even Volume
In 2024 and 2025, we faced certification issues and a lack of capacity head-on and reinforced our operational foundations. As a result, we have rigorously enhanced safety standards and quality requirements and secured additional capacity, which has stabilized production. On the other hand, we have recently seen a significant rise in our break-even volume due to a combination of increases in investments in human resources and future-oriented investments and the impact of U.S. tariffs.
14
Therefore, we have initiated undertaking company-wide measures. First, we will increase earnings by reviewing fixed costs, achieving cost improvements, and initiating sales initiatives in all regions, groups, and in-house companies. Additionally, to boost productivity even further, we will encourage employees to reexamine their ways of working and pursue efficient, value-added work. For instance, we will step up our utilization of AI for routine tasks and low-value-added work so that personnel can focus on tasks only humans can perform, thereby heightening the “rate of value-added work.” In advancing the aforementioned measures, we will focus on improving our break-even volume by ensuring that the benefits of reinforcing our operational foundations are steadily reflected in our earnings power. Toyota needs a management structure that reliably generates earnings in both favorable and challenging operating conditions and thereby enables Toyota to continue pursuing joint growth initiatives with its stakeholders.
In our transformation into a mobility company, value chain businesses will play a crucial role. Providing continuous value to customers throughout the long ownership period after the sale of a new car, these businesses have steadily grown. This growth is thanks to the many different products we offer. Supported by strong brands forged through product- and region-centered management, our diverse product lineup has enabled us to have 150 million units in operation worldwide. The growth of our value chain businesses is also attributable to the strength of our products, including their ease of repair and our ability to supply parts for them, as well as to the efforts of frontline personnel engaged in services, sales finance, used car sales, and insurance to fully utilize the high residual value of each product. Going forward, in addition to the virtuous cycle of new cars and value chain businesses, we will further strengthen our earnings base by promoting the creation of new forms of value through software and diverse mobility services.
Across Toyota’s workplaces, starting with production sites, employees continue to tackle numerous challenges while striving every day to make “ever-better cars.” To translate these efforts into tangible results, management and the front lines (genba) will work together to create an environment that enables workplaces across Toyota, starting with production sites, to fully demonstrate their capabilities.
Automotive Operations
Toyota’s sales revenues from its automotive operations were ¥45,417.7 billion in fiscal 2026, ¥43,199.8 billion in fiscal 2025, and ¥41,266.2 billion in fiscal 2024.
Toyota produces and sells passenger vehicles, minivans and commercial vehicles such as trucks. Toyota Motor Corporation’s subsidiary, Daihatsu, produces and sells mini-vehicles and compact cars. Hino, which ceased to be a consolidated subsidiary of TMC effective April 1, 2026, produces and sells commercial vehicles such as trucks and buses. Toyota also manufactures automotive parts, components and accessories for its own use and for sale to others.
Vehicle Models and Product Development
Toyota’s vehicles (produced by Toyota, Daihatsu and Hino) can be classified largely into electrified vehicles and conventional engine vehicles. Toyota’s product line-up includes subcompact and compact cars, mini-vehicles, mid-size, luxury, sports and specialty cars, recreational and sport-utility vehicles, pickup trucks, minivans, trucks and buses. Toyota’s luxury cars are sold in North America, Europe, Japan and other regions, primarily under the Lexus brand name.
In fiscal 2024, Toyota launched the all-new Alphard and Vellfire, which were developed from a concept of “the joy of comfortable mobility” to create a space where everyone can share consideration and appreciation in all kinds of situations. To further contribute toward carbon neutrality, Toyota plans to introduce new plug-in hybrid electric vehicles (“PHEV”) in the future. Moreover, a new model has been added to the Century series, which has been sold for more than half a century as one of Japan’s representative chauffeur-driven vehicles. The new model is a next-generation chauffeur-driven vehicle that inherits Japanese aesthetics, quietness and
15
hospitality, combines a human-centered approach, and dramatically evolves the rear-seat space to allow true comfort and elegant entry and exit. In Thailand, Toyota launched the Hilux Champ IMV 0, a new model of the IMV series. The pickup truck is regarded as a local favorite and integral to daily life in Thailand. Toyota decided to return to its origins and create an IMV pickup truck that meets the needs of customers. In addition, Toyota launched the all-new Lexus LBX. Redefining luxury with a stylishly compact size, it provides an engaging driving experience that instills a lasting desire to continue exploring the road ahead.
In fiscal 2025, Toyota launched the new Land Cruiser 250 Series. The 250 Series is a core Land Cruiser model that returns to the car’s origin, a vehicle that is simple and sturdy, and helps fulfill both customers’ lifestyle choices and practical needs. By pursuing dynamic styling and functionality so drivers can enjoy an active lifestyle, Toyota also created Crown Estate as a vehicle that embodies both the dignity and functionality of the Crown, what we call a mature active cabin. The Camry, with its distinctive exterior, quality, and reliability, has remained a leading sedan in the U.S. for over 20 years according to our estimates. For the Lexus brand, alongside master driver Akio Toyoda, Toyota developed the LBX MORIZO PR as a high-performance model that delivers the refined signature LEXUS driving quality and sophisticated design, enhancing the dialogue between driver and car, evokes spontaneous smiles, and provides an exhilarating out-of-the-ordinary experience.
In fiscal 2026, Toyota launched the all-new 6th generation RAV4, which is an SUV built on the idea that “Life is an Adventure,” embodying a go-anywhere, do-anything spirit. While maintaining the RAV4’s signature solid and powerful design and packaging, it has been developed around the keywords Diversification, Electrification, and Intelligence. Arene, the software development platform, was leveraged for crucial UI (user interface) software, such as the cockpit. The Lexus brand unveiled the all-new 8th-generation ES as a forerunner in LEXUS’s next-generation electrification lineup. This model aspires to deliver a refined driving experience across every scene — further enhancing quietness and ride comfort while staying in tune with customer needs. In pursuit of carbon neutrality through a multi-pathway approach, both hybrid electric vehicles (“HEV”) and BEV powertrains are offered to meet a diverse range of mobility demands.
Markets, Sales and Competition
Toyota’s primary markets are Japan, North America, Europe and Asia. The following table sets forth Toyota’s consolidated vehicle unit sales by geographic market for the periods shown. The vehicle unit sales below reflect vehicle sales made by Toyota to unconsolidated entities (recognized as sales under Toyota’s revenue recognition policy), including sales to unconsolidated distributors and dealers. Vehicles sold by Daihatsu and Hino are included in the vehicle unit sales figures set forth below.
| Thousands of Units | ||||||||||||||||||||||||
| Year Ended March 31, | ||||||||||||||||||||||||
| 2024 | 2025 | 2026 | ||||||||||||||||||||||
| Units | % | Units | % | Units | % | |||||||||||||||||||
| Japan |
1,993 | 21.1 | % | 1,991 | 21.3 | % | 2,082 | 21.7 | % | |||||||||||||||
| North America |
2,816 | 29.8 | 2,703 | 28.9 | 2,934 | 30.6 | ||||||||||||||||||
| Europe |
1,192 | 12.6 | 1,172 | 12.5 | 1,183 | 12.3 | ||||||||||||||||||
| Asia |
1,804 | 19.1 | 1,838 | 19.6 | 1,759 | 18.3 | ||||||||||||||||||
| Other* |
1,638 | 17.4 | 1,659 | 17.7 | 1,637 | 17.1 | ||||||||||||||||||
|
|
|
|
|
|
|
|
|
|
|
|
|
|||||||||||||
| Total |
9,443 | 100.0 | % | 9,362 | 100.0 | % | 9,595 | 100.0 | % | |||||||||||||||
|
|
|
|
|
|
|
|
|
|
|
|
|
|||||||||||||
| * | “Other” consists of Central and South America, Oceania, Africa and the Middle East, etc. |
The following table sets forth Toyota’s vehicle unit sales and market share in Japan, North America, Europe and Asia on a retail basis for the periods shown. Each market’s total sales and Toyota’s sales represent new vehicle registrations in the relevant year (except for the Asia market where vehicle registration does not
16
necessarily apply). All information on Japan excludes mini-vehicles. The sales information contained below excludes unit sales by Daihatsu and Hino, each a consolidated subsidiary of Toyota as of March 31, 2026. Vehicle unit sales in North America represents the combined total for the United States and Canada. Vehicle unit sales in Asia do not include sales in China.
| Thousands of Units | ||||||||||||
| Year Ended March 31, | ||||||||||||
| 2024 | 2025 | 2026 | ||||||||||
| Japan: |
||||||||||||
| Total market sales (excluding mini-vehicles) |
2,906 | 2,951 | 2,848 | |||||||||
| Toyota sales (retail basis, excluding mini-vehicles) |
1,506 | 1,487 | 1,450 | |||||||||
| Toyota market share |
51.8 | % | 50.4 | % | 50.9 | % | ||||||
| Thousands of Units | ||||||||||||
| Year Ended December 31, | ||||||||||||
| 2023 | 2024 | 2025 | ||||||||||
| North America: |
||||||||||||
| Total market sales |
17,306 | 17,827 | 18,273 | |||||||||
| Toyota sales (retail basis) |
2,475 | 2,572 | 2,767 | |||||||||
| Toyota market share |
14.3 | % | 14.4 | % | 15.1 | % | ||||||
| Europe: |
||||||||||||
| Total market sales |
17,439 | 17,807 | 18,552 | |||||||||
| Toyota sales (retail basis) |
1,174 | 1,217 | 1,229 | |||||||||
| Toyota market share |
6.7 | % | 6.8 | % | 6.6 | % | ||||||
| Asia (excluding China): |
||||||||||||
| Total market sales |
11,024 | 10,928 | 11,556 | |||||||||
| Toyota sales (retail basis) |
1,407 | 1,434 | 1,500 | |||||||||
| Toyota market share |
12.8 | % | 13.1 | % | 13.0 | % | ||||||
Japan
Japan is one of the leading countries with respect to technological innovation and improvements in the automotive industry and will continue to demonstrate such strength. Toyota strives to earn customer satisfaction by introducing products distinctive of Japan’s manufacturing ability, through the full lineup of Toyota brand vehicles, including not only passenger cars but also commercial and mini vehicles, as well as the advanced, premium Lexus brand. Furthermore, by advancing electrification centered on a multi-pathway strategy encompassing BEVs, PHEVs, fuel cell electric vehicles (“FCEV”), and HEVs, dealers and manufacturers will work together to realize a carbon-neutral society. Toyota endeavors to secure and maintain its significant share of and position atop the Japanese market. Toyota held a domestic market share (excluding mini-vehicles) on a retail basis of 51.8% in fiscal 2024, 50.4% in fiscal 2025, and 50.9% in fiscal 2026.
Although Toyota’s principle is to conduct production in regions where it enjoys true competitiveness, it considers Japan to be the source of its good manufacturing practices. Having 16 production sites in Japan, Toyota supports its operations worldwide through measures such as the development of new technologies and products, low-volume vehicles to complement local production, production of global vehicle models which straddle multiple regions and supporting overseas factories.
North America
The North American region is one of Toyota’s most significant markets. The United States, in particular, is the largest market in the North American region, accounting for 86% of Toyota’s retail sales in the region. In the region, Toyota has in recent years reorganized its production structure and made improvements to its product lineup. In addition, Toyota has a wide product lineup in every segment (excluding large trucks and buses).
17
Toyota’s North American production capacities include the production of vehicle models such as the RAV4, Camry, Tacoma and Highlander through 14 manufacturing entities.
In 2025, Toyota Battery Manufacturing, North Carolina (“TBMNC”) began supplying batteries. TBMNC is Toyota’s eleventh U.S. plant and the company’s first and only battery plant outside of Japan. Batteries assembled at TBMNC are set to power the Camry HEV, Corolla Cross HEV, RAV4 HEV, and a yet-to-be-announced all-electric 3-row BEV. When the facility reaches full production, it will have 14 production lines supporting battery production for HEV, BEV and PHEV.
Toyota has five research and development centers in North America. As for vehicle development, the Toyota Technical Center spearheads the design, planning, and evaluation of vehicles and parts as to their ability to meet customer needs.
Europe
Toyota’s principal European markets are Germany, France, the United Kingdom, Italy and Spain. In the European markets, as a full-lineup car manufacturer, Toyota aims to increase its global vehicle sales with a focus on electrified vehicles (HEVs, PHEVs, FCEVs and BEVs) that suit the needs of customers and the circumstances of each region.
In terms of production, to strengthen its business setup so that it is less likely to be affected by exchange rates, Toyota produces models such as the Corolla, Yaris and C-HR locally through six entities in Europe. In addition, Toyota is actively promoting production and sales measures that meet local demand by strengthening its value chain including used car dealerships, after-sales services and finance and insurance services.
Asia
Toyota’s principal Asian markets are Thailand, India, Indonesia and Taiwan.
In light of the importance of the Asian market that is further expected to grow in the long term, Toyota aims to build an operational framework that is efficient and self-reliant, as well as a predominant position in the automotive market in Asia. Toyota has responded to increasing competition in Asia by making strategic investments in the market and developing relationships with local suppliers. Toyota believes that its existing local presence in the market provides it with an advantage over new entrants to the market and expects to be able to promptly respond to demand for vehicles in the region.
In terms of production, Toyota manufactures models such as the Hilux, Hiace, Corolla, Camry and Vios through 15 entities. Toyota’s plants in Thailand not only meet domestic demand, but also serve as a production base for locations inside and outside of the ASEAN region.
China
Toyota has been conducting operations in China in large part through joint ventures, and its success in producing products that meet local demands and in establishing its sales and service network has significantly contributed to Toyota’s profits. Based on the firm business foundation that it has established, Toyota is conducting its operations with the aim of promoting further growth and increasing profitability through further development of its sales and service network and expansion of its product lineup.
In terms of production, Toyota has been conducting a significant portion of its China business, including in relation to the production and sales of vehicles, through joint ventures. Toyota has two major joint venture partners in China, namely, China FAW Group Corporation and Guangzhou Automobile Group Co., Ltd. The joint venture with China FAW Group manufactures models such as the Avalon, Corolla, RAV4 and bZ3 and the joint venture with Guangzhou Automobile Group Co., Ltd. manufactures models such as the Camry, Frontlander, Highlander, Wildlander, and bZ3X.
18
Total vehicle unit sales in the Chinese market reached 27.73 million vehicles in 2025, representing 105.5% of that of 2024, and 26.28 million vehicles in 2024, representing 101.1% of that of 2023. In this market, Toyota’s new vehicle sales were 1.78 million vehicles in 2025, accounting for 100.4% of that of 2024, and 1.77 million vehicles in 2024, accounting for 93.1% of that of 2023. In 2025, the domestically produced passenger vehicle market in mainland China (24.02 million vehicles), Toyota had a 7.4% market share. Toyota has been expanding the distribution network for locally produced vehicles in cooperation with China FAW Group and Guangzhou Automobile Group under the names Tianjin FAW Toyota Motor Co., Ltd. and Guanqi Toyota Motor Co., Ltd., respectively, and for imported vehicles, Toyota has also been expanding primarily the Lexus brand sales network. Toyota seeks to increase sales by expanding the number of dealers and its product lineup. In addition, as the market in China develops and becomes more sophisticated, Toyota plans to promote so-called “Value Chain” businesses, such as used car sales, services, financing and insurance, so as to contribute to the development of a mobility society.
South and Central America, Oceania, Africa and the Middle East
Toyota’s principal markets in South and Central America, Oceania, Africa and the Middle East (collectively, the “Four Regions”) are Brazil and Argentina in South and Central America, Australia in Oceania, South Africa in Africa and Saudi Arabia in the Middle East. The core models in the Four Regions are global models such as the Corolla, IMV (the Hilux) and Camry.
Toyota has seven production bases in the Four Regions. In these regions, which are expected to become increasingly important to Toyota’s business strategy, Toyota aims to continue developing new products which meet the specific demands of each region, increasing production and promoting sales.
Production
As of March 31, 2026, Toyota and its affiliated companies produce automobiles and related components through more than 50 overseas manufacturing organizations in 27 countries and regions aside from Japan. Facilities are located principally in Japan, the United States, Canada, the United Kingdom, France, Turkey, Czech Republic, Poland, Thailand, China, Taiwan, India, Indonesia, South Africa, Argentina and Brazil. See “Item 4. Information on the Company — 4.D Property, Plants and Equipment” for a description of Toyota’s principal production facilities.
In promoting a sustainable growth strategy, establishing a system capable of providing optimal supply of products in the global market is integral to Toyota’s strategy.
In line with its basic policy of manufacturing in countries or regions where there is demand and where Toyota is truly competitive, Toyota will make efficient use of and maximize capacity utilization at its existing plants to respond to the expanding market and will continue to focus on making efficient capital investments as necessary.
Furthermore, Toyota will continue to place top priority on safety and quality in strengthening true competitiveness with the aim of achieving sustainable growth.
19
The following table shows Toyota’s worldwide vehicle unit production by geographic market for the periods shown. These production figures do not include vehicles produced by Toyota’s unconsolidated affiliated companies. The sales unit information elsewhere in this annual report includes sales of vehicle units produced by these affiliated companies. Vehicle units produced by Daihatsu and Hino are included in the vehicle unit production figures set forth below.
| Thousands of Units | ||||||||||||
| Year Ended March 31, | ||||||||||||
| 2024 | 2025 | 2026 | ||||||||||
| Japan |
4,042 | 4,000 | 4,149 | |||||||||
| North America |
1,976 | 1,958 | 2,050 | |||||||||
| Europe |
846 | 811 | 815 | |||||||||
| Asia. |
1,876 | 1,790 | 1,802 | |||||||||
| Other* |
523 | 491 | 477 | |||||||||
|
|
|
|
|
|
|
|||||||
| Total |
9,263 | 9,049 | 9,293 | |||||||||
|
|
|
|
|
|
|
|||||||
| * | “Other” consists of Central and South America and Africa. |
Toyota closely monitors its actual units of sale, market share and units of production data and uses this information to allocate resources to existing manufacturing facilities and to plan for future expansions.
See “Item 4. Information on the Company — 4.B Business Overview — Capital Expenditures and Divestitures” for a description of Toyota’s recent investments in completed plant constructions and for a description of Toyota’s current investments in ongoing plant constructions.
Distribution
Toyota’s automotive sales distribution network is the largest in Japan. As of March 31, 2026, this network consisted of 226 dealers employing approximately 100 thousand personnel and operating approximately 4.2 thousand sales and service outlets. TOYOTA Mobility Tokyo Inc. is the only dealer owned by Toyota and the rest are independent.
Toyota believes that this extensive sales network of independent local interests has been an important factor in its success in the Japanese market. A large number of the cars sold in Japan are purchased from salespersons who visit customers in their homes or offices. In recent years, however, the traditional method of sales through home visits is being replaced by showroom sales, and the percentage of automobile purchases through showrooms has been gradually increasing. Toyota expects this trend to continue, and accordingly is working to improve its sales activities such as customer reception and meticulous service at showrooms, as well as online sales, to increase customer satisfaction.
Sales of Toyota vehicles in Japan had been conducted through four sales channels until April 2020, but from May 2020 shifted to a framework where all of its Japanese-market vehicle models are made available through all sales outlets in Japan. In addition, Toyota introduced the Lexus brand to the Japanese market in August 2005, and currently distributes the Lexus brand vehicles through a network of 191 new-vehicle sales outlets dedicated to the Lexus brand in order to enhance its competitiveness in the domestic luxury automotive market. The following table provides information on the dealer network as of March 31, 2026.
| Dealers | ||||||
| Channel |
Toyota Owned |
Independent |
Outlets | |||
| Toyota brand |
1 company | 225 companies | 4,245 outlets | |||
| Lexus brand |
23 outlets | 168 outlets | 191 outlets | |||
20
Outside Japan, Toyota vehicles are sold through approximately 168 distributors in approximately 204 countries and regions. Through these distributors, Toyota maintains networks of dealers. The chart below shows the number of Toyota distributors as of March 31, 2026 by country and region:
| Country/Region |
Number of Countries | Number of Distributors | ||||||
| North America |
4 | 5 | ||||||
| Europe |
55 | 29 | ||||||
| China |
1 | 4 | ||||||
| Asia (excluding China) |
20 | 20 | ||||||
| Oceania |
15 | 15 | ||||||
| Middle East |
16 | 14 | ||||||
| Africa |
54 | 48 | ||||||
| Central and South America |
39 | 40 | ||||||
Multi-pathway Strategy — Overview
The push for carbon neutrality is a matter of urgency if cars are to remain a necessary part of society. Providing our customers around the world with options for mobility under our multi-pathway strategy while also promoting the decarbonization of our monozukuri (manufacturing) and supply chains serves as the core of our activities.
Considering ways in which mobility takes into account the future of energy is important. The strategy’s basic premise is that we need to move away from fossil fuels from the perspective of the global environment and sustainability. Furthermore, over the medium- to long- term, renewable energy sources will continue to proliferate, with electricity and hydrogen emerging as the primary energy sources sustaining society. In the short term, however, it is critical to acknowledge global realities and implement changes in practical ways that maintain energy security.
This is precisely why we are committed to providing mobility options that are in tune with a diverse range of energy situations and customer needs, while also keeping an eye on the future of electricity and hydrogen. In short, the underlying concept of our multi-pathway strategy is to focus on promoting practical transition even as we pursue carbon neutrality.
BEV Strategies
Next-generation BEVs
Through our next-generation BEVs, we seek to change the future of cars. This will entail evolving the products we provide to customers. Through the integration of next-generation batteries and sonic technology, we aim to achieve a game-changing BEV driving range of 1,000 km.
Our next step will be to capture customers’ hearts with stylish designs. AI will be used to help ensure excellent aerodynamic performance, doubling the time that designers can devote to creating attractive cars.
Our BEVs will also offer a customizable ride feel. The Arene software platform and a full over-the-air system, which provides vehicle software updates via wireless transmission, will greatly expand the possibilities for enjoying cars. Moreover, Toyota will deliver exciting surprises and fun, like the manual electric vehicle, to its customers with technologies that only an automobile manufacturer can create.
Automobile bodies will be constructed in a new modular structure consisting of three main components. The finished automobiles are then assembled after each of the three modules is completed. This structure allows each module to be evolved separately, expediting action, particularly important in the race to develop better batteries. Furthermore, the use of giga casting will allow significant component integration, contributing to the reduction of vehicle development costs and plant investment.
21
The new modular structure and self-propelling production and other automation technologies will halve the number of processes required. Self-propelling production will be key to building next-generation BEVs. By greatly reducing the time and cost, as well as efforts on the part of production and technical staff required to modify plants and expand buildings whenever a new model is introduced, this technology will accelerate the launch of new products to market. Such new approaches to manufacturing, combined with the use of digital twin technology, are expected to halve production lead times.
We are advancing the integrated planning of our full global lineup of next-generation BEVs. In addition to efforts to increase product appeal, we will transform our manufacturing approaches to eliminate processes as well as reduce investment and lead times while securing earnings and increasing sales volume.
Toyota is targeting global BEV sales of 3.5 million units by 2030. This figure is shaped by customer demand and represents the base unit amount based on which supply systems will be prepared together with suppliers and dealers. However, we will adopt a flexible approach toward sales in recognition of the fact that it is customers who will ultimately decide what they purchase.
BEV Battery Development
The battery is the heart of the BEV. Just as the heart pumps blood through the body, the battery transfers electricity to the vehicle. As Toyota advances its efforts toward introducing next-generation BEVs, it is also evolving batteries with new technologies to meet customer expectations. The earnings of Toyota’s next-generation BEVs will be driven by our next-generation batteries, which will be developed with a focus on achieving world-leading levels of efficiency. Our development approach entails viewing batteries and vehicles as a set, and this approach is the starting point for the development of BEVs. Toyota’s development of both batteries and vehicles in-house provides an advantage in this area. The resources afforded by this advantage will be used to improve our product appeal to exceed customer expectations and secure earnings.
Liquid lithium-ion batteries, which are currently the mainstream, will gain enhanced performance through improvement to the energy density of prismatic batteries, an area in which Toyota has longstanding expertise. In addition, by using the bipolar battery structure developed for HEVs in BEVs, we will expand our lineup to provide customers with a variety of options, from low-cost batteries for popularization to batteries optimized for maximum performance.
Furthermore, all-solid-state batteries, which are highly anticipated as game-changers, are finally approaching the phase of practical application for use in BEVs. Our full lineup of competitive batteries will support the evolution of Toyota’s BEVs in the future.
Notes:
| 1. | The performance version of next-generation batteries are being developed with Prime Planet Energy & Solutions Inc., while the popularization and high-performance versions of next-generation batteries and the all-solid-state battery for BEVs are being developed with Toyota Industries, combining the knowledge of the Toyota Group. |
| 2. | The bZ4X referenced in this report refers to the 2022 model. The bZ4X underwent a partial update in October 2025. |
Liquid Lithium-ion Battery Development
1. Next-generation Batteries: Performance Version
The next-generation BEVs will have a cruising range of 1,000 km.* For such cars, we are developing a performance-oriented rectangular battery to expand the degree of freedom in vehicle design. While increasing the
22
energy density of the battery, we also aim to extend cruising range by improving vehicle efficiencies, such as aerodynamics and weight reduction, while at the same time reducing costs by 20% compared with the earlier bZ4X and achieving a quick charge time of 20 minutes or less (state-of-charge (“SOC”) =10–80%).
2. Next-generation Batteries: Popularization Version
Toyota is also developing good, low-cost liquid lithium batteries that will contribute to the widespread use of BEVs to provide customers with a variety of battery options. Bipolar structure batteries, which have been used in the Aqua and Crown hybrid vehicles, are now being applied to BEVs. These batteries use inexpensive lithium iron phosphate (LFP) and are expected to be commercialized. We are aiming for a 20% increase in cruising range* and 40% reduction in cost compared with the earlier bZ4X, as well as quick recharging in 30 minutes or less (SOC=10–80%). We are also considering installing these batteries in BEVs in the popularization price range.
In a regular battery, individual current collectors are coated on both sides with either an anode or cathode, then paired to make a set. In contrast, every current collector in a bipolar configuration is coated with an anode on one side and a cathode on the other, making for a simpler structure that requires only one-third as many components. At the same time, material costs can be reduced by using LFP for the cathode in place of rare metals, such as nickel and cobalt. However, to make these batteries a reality, Toyota must overcome three difficulties: applying the material evenly, doing so at high speeds, and simultaneously sealing all the cells. Furthermore, all this needs to be achieved in batteries large enough to power a car.
In tackling these challenges, Toyota is drawing on approximately 30 years of battery production technologies honed through its HEVs along with bipolar nickel-metal hydride battery technology and expertise, precision coating used for FCEVs, and various digital technologies. Using all of these together, we are advancing development toward mass production.
3. Bipolar Lithium-ion Battery: High-performance Version
The high-performance version of the battery combines the best aspects of both the performance and popularization versions. This battery combines a bipolar structure with a high-nickel cathode to achieve further advances. We expect an even greater performance than the performance version of the prismatic battery will be achieved along with a 10% increase in cruising range* and a 10% reduction in cost, as well as a quick charge time of 20 minutes or less (SOC=10–80%). We aim to commercialize this battery in 2027-2028.
(*Including vehicle efficiency improvements such as aerodynamics and weight reduction.)
Development of All-solid-state Batteries
All-solid-state batteries have a solid electrolyte, allowing faster movement of ions and greater tolerance of high voltages and temperatures. It is hoped that this technology will result in increased power output, longer cruising range, and shorter charging times.
The tradeoff, meanwhile, is thought to be a shorter battery life. Solid electrolytes repeatedly expand and contract as the battery charges and discharges, which can create cracks in the electrodes that inhibit the
23
movement of ions between the cathode and anode. Toyota has discovered a new technology that overcomes this issue. Aiming for commercialization in 2027–2028, Toyota continues to advance product development and the development of mass production methods.
In October 2023, Toyota announced a partnership with Idemitsu Kosan Co., Ltd. (“Idemitsu”) to work toward the mass production of all-solid-state batteries for BEVs. Through the integration of materials development technologies of both companies, including Idemitsu’s materials manufacturing technologies and Toyota’s battery processing and assembly technologies honed in on electrified vehicle development, we both aim to realize the mass production of solid electrolytes and all-solid-state batteries that will be widely used by consumers.
In October 2025, we announced a collaboration with Sumitomo Metal Mining Co., Ltd. (“Sumitomo Metal Mining”) aimed at mass production of cathode materials. Leveraging the company’s proprietary powder synthesis technology, we jointly developed a new cathode material with superior durability suited for all-solid-state batteries. Going forward, we will continue to draw on Sumitomo Metal Mining’s expertise accumulated over two decades of supplying cathode materials, as we work toward the supply and subsequent mass production of this newly developed material.
Establishment of a New Company
On February 5, 2025, Toyota announced that it will sign a comprehensive partnership agreement with the Shanghai municipal government in China regarding carbon neutrality. In addition, Toyota established Lexus (Shanghai) New Energy Co., Ltd., a new wholly owned company in Jinshan District in southwest Shanghai, to develop and produce BEVs and batteries.
Under this partnership with the Shanghai municipal government, Toyota hopes to contribute to the Chinese government’s goal of achieving carbon neutrality by 2060 in fields such as hydrogen energy, automated driving technology, and battery recycling and reuse. To drive the initiative forward, Toyota will establish a new company based on the belief that quicker supply of products that meet customers’ needs is important in China, where there is a high demand for new energy vehicles.
The newly formed company will develop a new BEV under the Lexus brand, with production scheduled to begin from 2027 onward. The initial production capacity will be around 100,000 units per year, and 1,000 new jobs are planned for the start-up phase.
Toyota has been working with partners such as China FAW Group Co., Ltd. and Guangzhou Automobile Group Co., Ltd. to bring smiles to customers in China. Going forward, Toyota will continue working together with all its partners to be a “best-in-town” company to achieve its goal of “producing happiness for all.” In doing so, we will forge ahead with our mission of transforming cars, monozukuri (manufacturing), and work to change the future with BEVs.
Hydrogen Business Strategies
We have seen significant global developments in the area of hydrogen business in recent years, with countries introducing policies and taking active steps with an eye toward 2030. To anticipate these rapid changes and respond to customer needs, we established in July 2023 a new business unit called Hydrogen Factory, which is able to make rapid decisions under one leader, from sales to development and production, all at once. The Hydrogen Factory is advancing business activities based on three key axes.
The first is localizing R&D and production in countries within the major markets. We are working to accelerate our efforts by establishing local bases, mainly in Europe and China. In Europe, Toyota Motor Europe NV/SA is engaged in the development of hydrogen fuel-cell systems and carries out production and external
24
sales. In China, we have already established a development and production base in collaboration with Beijing SinoHytec Co., Ltd. This base began production of fuel cells in August 2024. Toyota began offering the fuel-cell unit installed in the Mirai passenger vehicle as a modular product to partners aiming to realize a hydrogen society. In recent years, as demand for commercial applications has expanded across various countries, sales of fuel-cell units have continued to grow year by year, reaching a global cumulative total of more than 3,000 units as of December 2025.
The second is strengthening alliances with leading partners. Hydrogen has been positioned as an important energy source in Toyota’s CO2 emissions reduction efforts in its quest to achieve carbon neutrality. To create a hydrogen-powered society, we are promoting the widespread adoption of fuel-cell products, including passenger and commercial fuel-cell electric vehicles as well as fuel-cell stationary generators. Through such initiatives, we are working with various industry partners in the areas of producing, transporting, and using hydrogen.
In Europe, Toyota announced a partnership with Daimler Truck Holding AG in May 2023. The scope of this partnership includes collaboration on hydrogen-related development. Furthermore, in September 2024, we unveiled plans to bolster coordination with BMW in the field of hydrogen, pursuing joint development and standardization of components to drive cost reductions. These components are also being considered for use in Toyota models going forward. In China, we entered into a partnership in November 2024 with GLP Investment (Shanghai) Co., Ltd. (GLP China) in the field of high-value-added green trunk-line logistics. In collaboration with leading domestic logistics companies For-U Smart Freight and Shenzhen Dekun Logistics Co., Ltd., we began operating 50 heavy-duty fuel-cell trucks in 2025. In Japan, in February 2024, we agreed with Chiyoda Corporation to jointly develop a large-scale water electrolysis system that produces hydrogen from water and electricity by applying the fuel-cell technology used in the Mirai. Preparations are underway for demonstrations to begin in 2026.
The third is enhancement of competitiveness and technologies. The next-generation (third-generation) fuel-cell unit currently under development aims to offer durability equivalent to twice that of the current generation and is designed to be virtually maintenance-free even under commercial vehicle operating conditions. Fuel efficiency and driving range have been improved by 20%, enabling travel between Tokyo and Osaka without refueling. We are developing dedicated units for both passenger and commercial applications, while standardizing cells to achieve lower costs. Our plan is to roll out this next-generation fuel-cell unit, capable of meeting a wide range of use cases, from passenger cars to commercial vehicles, starting in fiscal 2027.
At the same time, hydrogen remains a costly energy source. To expand its utilization, reducing its price is essential. To this end, Toyota is working with partners on technology for hydrogen production.
In 2023, DENSO Fukushima Co., Ltd. introduced an electrolysis system at its production plant. The system leverages fuel-cell technology from the Mirai and has a capacity of approximately 0.4 megawatts. Since April 2024, it has been supplying hydrogen to combustion furnaces within the plant and continues to be used.
The hydrogen production market is expected to grow rapidly both in Japan and overseas. To enhance scalability of hydrogen production equipment, Toyota is combining Chiyoda Corporation’s processing plant design expertise and large-scale plant construction technologies to develop large-scale electrolysis systems in the 5 megawatt to 20 megawatt range. In 2026, Toyota plans to build a facility called Hydrogen Park at its Honsha Plant and begin large-scale demonstration testing. Going forward, we will continue accelerating efforts toward commercialization.
Commercial Sector Initiatives
In Japan, Toyota established Commercial Japan Partnership Technologies Corporation (“CJPT”) in 2021 together with Isuzu Motors Limited, Hino, Suzuki Motor Corporation, and Daihatsu with the aim of contributing to the resolution of issues in the transportation industry and helping realize a carbon-neutral society.
25
We are working with shippers and logistics companies in Fukushima and Tokyo on the social implementation of electrification that utilizes heavy- and light-duty fuel-cell electric trucks and light-duty BEV trucks. As of the end of December 2025, approximately 200 fuel-cell electric trucks have hit the roads, supporting the daily lives of local people not only as general delivery vehicles but also as waste collection vehicles and school lunch delivery vehicles. In addition, around 180 fuel-cell electric buses are operating across Japan and are beginning to take root as part of local transportation infrastructure. From fiscal 2027, we will begin production of a new model, further promoting the utilization of hydrogen.
At the same time, the widespread adoption of fuel-cell commercial vehicles faces challenges, including reductions in vehicle costs, the expansion of hydrogen refueling infrastructure, and the lowering of hydrogen costs. To address these challenges, efforts are being undertaken through close collaboration between the public and private sectors.
In May 2025, the Ministry of Economy, Trade and Industry of Japan selected Fukushima, Tokyo, Kanagawa, Aichi, and Hyogo as priority regions for promoting the deployment of fuel-cell commercial vehicles. In response, Toyota and CJPT have started work on the following initiatives, aiming to ultimately roll them out nationwide.
| • | Creation of massive hydrogen demand and new hydrogen utilization models through the deployment of heavy-duty fuel-cell electric trucks |
| • | Establishment of sales and operating environments in newly designated priority regions |
| • | Expansion of the lineup of fuel-cell commercial vehicles |
| • | Support for businesses working to reduce hydrogen costs |
Development of Hydrogen Internal Combustion Engines
In 2025, Toyota’s efforts to race a Corolla equipped with one of its hydrogen engines currently in development entered their fifth year. Hydrogen engines work like modified versions of conventional gasoline engines powered by burning hydrogen directly as fuel. The fuel is 100% pure hydrogen, unmixed with gasoline. As no fossil fuels are burned, hydrogen-engine vehicles emit almost no CO2 when in operation — only that from the combustion of minute amounts of engine oil. The hydrogen engine is thus one option that offers great potential to contribute to carbon neutrality while making use of technologies for internal combustion engines built up over the decades and protecting engine-related jobs in the automotive industry.
In 2024, we took another step forward in the evolution of our hydrogen engines by increasing the durability of pumps, which had needed to be replaced numerous times in prior races; extending driving ranges by modifying tank shapes; automating the processes of switching CO2 collection units; and implementing other substantial improvements. This cemented the achievement of our target driving range of 30 consecutive laps.
In 2025, we conducted test drives of vehicles with small, highly efficient superconducting motors within their fuel tanks, improving tank capacity over 1.3 times. Going forward, this will lead to further improvements in cruising range and driving performance and a reduction in the volume of boil-off gas.
We are striving to practically implement superconductivity technology with the aim of further developing liquid hydrogen technology.
Toyota could not have taken on this initiative with liquid hydrogen alone. A portion of the liquid hydrogen used in the hydrogen engine-equipped Corolla in the 2023 Fuji 24 Hours Race was lignite-derived hydrogen produced and transported from Australia in the Suiso Frontier liquid hydrogen carrier built by Kawasaki Heavy Industries, Ltd. as part of the HySTRA project. In addition, the mobile liquid hydrogen station used at the circuit was jointly developed by Iwatani Corporation and Toyota. Moreover, the switch to liquid hydrogen fuel required
26
the modification of many parts. In 2024, Toyota partnered with Japan Metals & Chemicals Co., Ltd. to develop an electricity supply system that used hydrogen storage alloy in order to address the boil-off gas* issues faced with prior liquid hydrogen fueling systems. A concept model of an engine that reused boil-off gas produced during driving as fuel or for generating electricity was displayed at the final race of the Super Taikyu Fuji Final 4 Hour Race, attracting individuals with similar ambitions to join us in the development process. Through cooperation with our numerous partners, the liquid hydrogen-fueled Corolla successfully completed the race, and, as a result of such efforts, our number of partners has grown from eight companies in May 2021 to 60 companies by the end of the 2025 season.
| * | Vaporized hydrogen produced due to the evaporation of liquid hydrogen fuel contained within tanks as a result of natural influx of outside heat |
The scope of hydrogen engine development is expanding beyond motorsports. For example, a verification test of a hydrogen-powered Hiace was conducted on public roads in Australia from the end of 2023. In addition, Japan’s first verification test of a mobile liquid hydrogen fueling system was carried out at the Iwatani Hydrogen Station in Kariya City, Aichi Prefecture, in 2024.
Toyota will continue in its efforts to expand the possibilities of hydrogen engines. Aiming to contribute to the realization of a carbon-neutral society, we will continue to evolve alongside our partners in line with the principle of “making ever-better cars from a starting point in motorsports” and our multi-pathway strategy.
Efforts in Realizing a Safe Mobility Society
Toyota’s ultimate goal is to achieve zero casualties from traffic accidents, and ultimately, a society with zero traffic accidents. Additionally, to achieve a safe mobility society, we believe it will be important to adopt an integrated three-pronged approach involving people, vehicles, and the traffic environment.
It will also be vital for us to pursue real-world safety by learning from actual accidents and incorporating that knowledge into vehicle development. Toyota has defined its “Integrated Safety Management Concept” as the basic philosophy behind its technologies for eliminating traffic accident casualties and is moving forward with the development of technologies based on this concept.
Toyota provides optimized driver support for safety at every stage of driving, from parking to normal operation, the moment before a collision, during a collision, and post-collision emergency response. We also aim to enhance safety by reinforcing links between vehicle safety systems, rather than thinking about each system as a separate component. These are the approaches behind our Integrated Safety Management Concept.
We introduced the Toyota Safety Sense system, which packages multiple preventive safety functions that help reduce serious traffic accidents with the potential to cause death or injury, to the market in 2015. These functions include avoiding and mitigating damage from collisions with cars in front of a vehicle or with pedestrians, preventing accidents caused by a vehicle leaving its current lane, and ensuring optimal forward visibility during nighttime driving. Toyota Safety Sense has now been installed in more than 61 million vehicles globally (as of March 2026). Toyota Safety Sense is now available on nearly all passenger car models (as standard or option) in the Japanese, U.S., and European markets. It has also been introduced in a total of 144 countries and regions, including such key markets as China, other select Asian countries, the Middle East, and Australia.
Software Defined Vehicles (SDVs)
SDVs are playing a leading role in the transformation of mobility. Toyota’s main aspiration in working with SDVs is a society with zero traffic accidents. Through SDVs, we aim to realize safer, more reliable, and more fun mobility. However, realizing such a society is difficult with just the technological innovation of cars. It requires
27
an integrated three-pronged approach involving cars, people, and infrastructure. For example, this includes coordination with road infrastructure that utilizes data from built-in sensors to address blind spots — an issue that evolution of vehicles cannot overcome alone — and AI agents that autonomously support drivers (people). An environment with uninterrupted communication and the development of infrastructure such as data centers are key to linking cars with society. Accordingly, we worked together with NTT, Inc. (formerly Nippon Telegraph and Telephone Corporation) in 2024 to begin creating appropriate infrastructure.
Toyota places strong emphasis and priority on safety and security. At the same time, we have an opportunity to leverage the strength of having 150 million private vehicles in operation to help identify the diverse values of SDVs, including the use of things such as AI agents that grow alongside customers and cars that may one day be capable of reproducing more professional or proficient driving styles. We aim to continue to provide customers with safe, reliable, high-quality software through innovative digital platforms that are the foundation of software development and our Arene software creation platform. We will accelerate the development of an SDV infrastructure unique to Toyota through cooperation with our partners across industries.
Arene
The structural components supporting SDVs include applications, software, and electronic platforms. To enhance the scalability as it relates to cars, we have encouraged co-creation with partner companies and have renewed our electronic platforms, including improving chip performance.
Furthermore, supporting the software development is Arene, introduced with the new RAV4. Arene is a software development platform through which we will mass-produce safe, reliable, and high-quality software, which will help accelerate the development of SDVs by applying the knowledge and technologies from the monozukuri that Toyota has cultivated to date. There are three components of the Arene platform.
| 1. | Arene SDK |
Arene SDK is a modular development kit for developers, enabling the rapid development of high-quality software and easy deployment of developed software across multiple vehicles.
| 2. | Arene Tools |
Arene Tools are tools for verifying and evaluating software in a virtual environment, reducing physical inspections of actual cars and enabling the creation of functions at an even earlier stage. The Arene SDK and Arene Tools shorten the development period for software, contributing to the quick provision of better software to customers.
| 3. | Arene Data |
Arene Data is the component referring to the collection and analysis of data that will contribute to providing a personalized driving experience tailored to each customer by continuously improving the car’s functions as the owner drives it. By adopting Arene in the RAV4, a popular Toyota model loved by countless customers across regions, we can collect various data from customers around the world and continue evolving cars. Looking ahead, we expect this approach to expand and will consider cross-domain development. As the first step in mass production of Toyota RAV4 SDVs, we will make ever-better cars in line with regional needs through Arene, contributing to the future realization of a society with zero traffic accidents.
Toyota Woven City
Toyota aspires to transform into a mobility company. On our road toward accomplishing this goal, Toyota Woven City will function as a “mobility test course” for creating new products and services. Toyota and its group
28
company Woven by Toyota are advancing the Woven City project. Woven City saw its official launch on September 25, 2025, with companies and individuals commencing demonstrations of various products and services, and some residents have begun moving in. Access to this facility will not be limited to the Toyota Group. Rather, we hope to make Woven City a place where external stakeholders who share our desire to act “for others” can also use the environment, in which people actually live, to create new values to help shape a better future and enhance well-being for all. The companies and individuals who utilize Woven City to develop and demonstrate new products and services are called “Inventors.”
By combining Toyota’s manufacturing expertise, Woven by Toyota’s advanced software capabilities, and the unique strengths of each Inventor, Woven City seeks to foster kakezan, a Japanese concept of “multiplication,” where new innovation and societal value emerge from the convergence of different ideas and capabilities. The people who live in and visit Woven City, called “Weavers,” also participate in inventions through kakezan.
Weavers test the products and services developed by Inventors, sharing their comments on usability and opinions as feedback that Inventors will incorporate into their inventions. The Weavers and Inventors who gather at Woven City aim to work together to produce well-being for all under Toyota’s goal of working for others. Inventors are Toyota Group companies as well as like-minded outside companies and other organizations who have joined this quest for expanding mobility. Toyota and Woven by Toyota will also take advantage of Woven City to conduct tests as Inventors. Additionally, Toyota hosted an accelerator program attended by start-up companies, entrepreneurs, universities, and research institutions. The selected winners are expected to join the Inventors. The addition of start-up companies to the Inventors, which have primarily consisted of large corporations, is expected to further accelerate innovation through kakezan.
Co-creation Themes by Investors
| Inventor | Theme | |
| Daikin Industries, Ltd. |
Testing “pollen-less spaces” and “personalized functional environments” | |
| DyDo DRINCO, INC. |
Creating new value through innovative vending machine concepts | |
| NISSIN FOOD PRODUCTS CO., LTD. |
Creating and evaluating food environments to inspire new “food cultures” | |
| UCC Japan Co., Ltd. |
Conducting a proof-of-concept study to demonstrate the effect of coffee on creativity and productivity | |
| Zoshinkai Holdings Inc. |
Leveraging data to realize innovative educational methods and new learning environments | |
| Interstellar Technologies Inc. |
Developing a robust rocket production system* | |
| Kyoritsu Seiyaku Corporation |
Finding new ways to enhance human-pet coexistence | |
| Naoto Inti Raymi |
Developing future-oriented soundscapes | |
| AI Robot Association (AIRoA) |
Exploring the practical deployment of robots through real-world challenge identification and feedback cycles | |
| DAIICHIKOSHO CO., LTD. |
Creating more flexible karaoke experiences through real-world demonstration experiments | |
| Joby Aviation, Inc. |
Exploration of an air mobility ecosystem | |
29
| Toyota Financial Services Corporation |
Developing new sales and financing models based on verified, real-world mobility usage data | |
| * | Interstellar Technologies Inc. will conduct its work outside Woven City, with development support provided by Toyota and Woven by Toyota in the form of engineering know-how and technical staff. |
The products and services developed by Inventors will be tested by Weavers (residents and visitors). These individuals are indispensable to the testing processes or co-creation activities and will serve a similar function to the test drivers who take part in the automobile development process. Their contributions to tests will come in the form of the feedback they provide with regard to the products and services being tested.
Following the official launch of Woven City, in September 2025, residents — primarily Toyota and Woven by Toyota staff and their families — have resided in Woven City as Weavers. The community will then gradually expand to include external Inventors and their families. Under Phase 1, the total population of Woven City is expected to reach approximately 300 in the future. Initially, visitors will be limited to related parties, with plans to welcome the general public to participate as Weavers in co-creation activities starting in fiscal 2026 and beyond. Woven City is a test course for mobility that demonstrates mobility infrastructure via a three-pronged approach of people, mobility, and infrastructure. The goal of this approach is to help realize the safe and secure mobility society that Toyota envisions. Up until now, Toyota has pursued this vision by focusing on the development of automobiles and working to make ever-better cars on dedicated automobile test courses. However, realizing a truly safe and secure mobility society requires that we expand our focus beyond automobiles and other forms of mobility to also consider the people who use these mobility options and the infrastructure that supports mobility. Woven City functions as a test course for implementing such demonstration testing. Under Phase 1, which has been officially launched, we have included the following features.
In April 2026, the Woven City Inventor Garage (the “Inventor Garage”) began operations as a facility designed to further accelerate kakezan of Inventors. The Inventor Garage is located in the former stamping facility of Toyota Motor East Japan, Inc.’s Higashi-Fuji plant, which supported passenger vehicle production for more than 50 years, and was renovated to serve as a co-creation hub.
As a real-world test course, Woven City supports agile development and validation through three environments: the Inventor Garage, which serves as a hub for development of products and services, the “Woven City Inventor Field,” in which performance and safety tests are conducted in an environment without residents, and the “Phase 1 Residential Area,” which enables testing in a living environment currently home to approximately 100 Weavers. Woven City is intended to continue expanding as an “ever-evolving city,” and by providing a test course where safety and security are maintained at every stage, it aims to further support kakezan.
Woven City has officially launched, but this is just the starting point. We will work through trial and error together with Inventors and Weavers, while improving Woven City’s performance as a test course, to create products and services that will become the future fabric of life.
30
Mobility is not just the physical movement from point A to point B. It is also about being able to “move” people’s hearts and creating excitement. Moving toward inventions that will become the future fabric of life and expanding people’s potential: this is our vision for expanding mobility and for Woven City itself. Together with allies who share our vision, we will leverage Woven City to further our transformation into a mobility company that will help weave the future.
Financial Services
Toyota’s financial services include loan programs and leasing programs for customers and dealers. Toyota believes that its ability to provide financing to its customers is an important value-added service. In July 2000, Toyota established a wholly-owned subsidiary, Toyota Financial Services Corporation, to oversee the management of Toyota’s finance companies worldwide, through which Toyota aims to strengthen the overall competitiveness of its financial business, improve risk management and streamline decision-making processes. Toyota has expanded its network of financial services, in accordance with its strategy of developing auto-related financing businesses in significant markets. Accordingly, Toyota currently operates financial services companies in 42 countries and regions, which support its automotive operations globally.
Toyota’s sales revenues from its financial services operations were ¥4,857.1 billion in fiscal 2026, ¥4,481.1 billion in fiscal 2025, and ¥3,484.1 billion in fiscal 2024. In fiscal 2026, Toyota’s business saw solid growth mainly due to an accumulated balance of earning assets resulting from new car sales support for Toyota and Lexus vehicles. Under such circumstances, as a result of Toyota’s continued collaboration with dealers in various countries and regions and efforts to expand products and services that meet customer needs, Toyota’s share of financing provided for new car sales of Toyota and Lexus vehicles in regions where Toyota Financial Services Corporation operates reached approximately 30%, and the balance of earning assets continued to steadily increase. In addition, to fund the growing asset base, Toyota is making efforts to provide both its customers and dealers with stable financial services by diversifying its funding methods by deposit-based funding in addition to using already existing means as commercial paper, corporate bonds, bank borrowings, and asset securitization. As a result of ongoing monitoring of bad debt and diligent, detailed collection efforts, the percentage of credit losses remained at stable levels of 0.43% in fiscal 2026 and 0.46% in fiscal 2025. Toyota continues to work towards improving its management measures in connection with residual value risks in leasing.
Toyota Motor Credit Corporation is Toyota’s principal financial services subsidiary in the United States and provides financial services, including retail financing, retail leasing, wholesale financing, and insurance services. Toyota also provides financial services in 42 other countries and regions through various financial services subsidiaries, including:
| • | Toyota Finance Corporation in Japan; |
| • | Toyota Credit Canada Inc. in Canada; |
| • | Toyota Finance Australia Ltd. in Australia; |
| • | Toyota Kreditbank GmbH in Germany; |
| • | Toyota Financial Services (UK) PLC in the United Kingdom; |
| • | Toyota Leasing (Thailand) Co., Ltd. in Thailand; and |
| • | Toyota Motor Finance (China) Co., Ltd. in China. |
KINTO, which started in Japan in 2019 in response to the shift from “owning” cars to “using” cars, has been steadily enhancing its service lineup and gaining brand awareness. This service is also being made available in Europe and other regions. Furthermore, Toyota developed and provides customers with the payment application “TOYOTA Wallet” as a platform that contributes to improving the convenience of customers’ daily payments and creating a foundation for a mobility society.
31
A large portion of Toyota’s financial services is related to the sale of Toyota vehicles. Finance receivables for all of Toyota’s dealer and customer financing operations were ¥38,966.6 billion as of March 31, 2026, representing an increase of 15.9% compared to the previous year. As of March 31, 2026, 52.2% of Toyota’s finance receivables were attributable to North America, 15.4% from Europe, 11.4% from Asia, 10.0% from Japan and 11.0% from other areas.
Approximately 40% of Toyota’s unit sales in the United States during fiscal 2026 included a finance or lease arrangement with Toyota.
The worldwide financial services market is highly competitive. Toyota’s competitors in retail financing and retail leasing include commercial banks, credit unions and other finance companies. Commercial banks and other automobile finance subsidiary companies serving their parent automobile companies are competitors of Toyota’s wholesale financing activities. Competitors in Toyota’s insurance operations are primarily national and regional insurance companies.
For information on Toyota’s finance receivables and operating leases, please see “Item 5. Operating and Financial Review and Prospects — 5.A Operating Results — Financial Services Operations.”
Retail Financing
Toyota’s finance subsidiaries acquire new and used vehicle installment contracts primarily from Toyota dealers. Installment contracts acquired must first meet specified credit standards. Thereafter, the finance company retains responsibility for installment payment collections and administration. Toyota’s finance subsidiaries acquire security interests in the vehicles financed and can generally repossess vehicles if customers fail to meet their contractual obligations. Almost all retail financings are non-recourse, which relieves the dealers from financial responsibility in the event of repossession. In most cases, Toyota’s finance subsidiaries require their retail financing customers to carry automobile insurance on financed vehicles covering the interests of both the finance company and the customer.
Toyota has historically sponsored, and continues to sponsor, special lease and retail programs by subsidizing below market lease and retail contract rates.
Retail Leasing
In the area of retail leasing, Toyota’s finance subsidiaries acquire new vehicle lease contracts originated primarily through Toyota dealers. Lease contracts acquired must first meet specified credit standards after which the finance company assumes ownership of the leased vehicle. The finance company is generally permitted to take possession of the vehicle upon a default by the lessee. Toyota’s finance subsidiaries are responsible for contract collection and administration during the lease period. The residual value is normally estimated at the time the vehicle is first leased. Vehicles returned to the finance subsidiaries at the end of their leases are sold by auction. For example, in the United States, vehicles are sold through a network of auction sites, as well as through the Internet. In most cases, Toyota’s finance subsidiaries require lessees to carry automobile insurance on leased vehicles covering the interests of both the finance company and the lessee.
Wholesale Financing
Toyota’s finance subsidiaries also provide wholesale financing primarily to qualified Toyota dealers to finance inventories of new Toyota vehicles and used vehicles of Toyota and others. The finance companies acquire security interests in vehicles financed at wholesale. In cases where additional security interests would be required, the finance companies take dealership assets or personal assets, or both, as additional security. If a dealer defaults, the finance companies have the right to liquidate any assets acquired and seek legal remedies.
32
Toyota’s finance subsidiaries also make term loans to dealers for facilities refurbishment, real estate purchases and working capital requirements. These loans are typically secured with liens on real estate, other dealership assets and/or personal assets of the dealers.
Insurance
Toyota provides insurance services in the United States through Toyota Motor Credit Corporation’s wholly owned subsidiary, Toyota Motor Insurance Services, Inc. (“TMIS”) and its wholly owned insurance company subsidiaries. Their principal activities include marketing, underwriting and claims administration. TMIS also provides coverage related to vehicle service agreements through Toyota dealers to customers. In addition, TMIS also provides coverage and related administrative services to affiliated companies of Toyota Motor Credit Corporation. Toyota dealers in Japan and in other countries and regions also engage in vehicle insurance sales.
Other Financial Services
Toyota Finance Corporation launched its credit card business in April 2001 and began issuing Lexus credit cards in 2005 when the Lexus brand was introduced in Japan. As of March 31, 2026, Toyota Finance Corporation has 15.7 million card holders (including Lexus credit card holders).
All Other Operations
In addition to its automotive operations and financial services operations, Toyota is involved in a number of other non-automotive business activities. Sales revenues for these activities totaled ¥1,651.4 billion in fiscal 2026, ¥1,447.1 billion in fiscal 2025, and ¥1,368.1 billion in fiscal 2024.
Governmental Regulation, Environmental and Safety Standards
Toyota’s products must comply with government regulations governing, among many other things, their emissions, fuel economy, noise and safety. In addition, Toyota is subject to laws regulating pollutants generated by its manufacturing operations. Toyota has incurred significant costs in complying with these laws and regulations and expects to incur significant compliance costs in the future. Toyota’s management views leadership in environmental protection as an important competitive factor in the marketplace.
The following is a summary of the more significant existing environmental and safety standards that apply to our products.
International Harmonization of Vehicle Regulations
The World Forum for Harmonization of Vehicle Regulations (“WP.29”) of the United Nations Economic Commission for Europe has been working to promote international harmonization of the technical prescriptions for the construction and approval of wheeled vehicles. Towards that end, it has developed certain international rules and regulations such as the UN Regulations (“UNR”) under the 1958 Agreement and the Global Technical Regulations (“GTR”) under the 1998 Agreement. The UNR has been adopted in jurisdictions such as Japan, EU and Russia, and each participating party’s type approvals are mutually recognized under the 1958 Agreement. The parties to the 1998 Agreement include the U.S., China and India in addition to Japan, the EU and Russia, and 25 Global Technical Regulations have been established to date. Progress in international harmonization of technical prescriptions is expected to reduce country to country variations in product specifications and to lead to greater efficiency in Toyota’s product development.
33
Vehicle Emissions
Japanese Standards
The Air Pollution Control Act of Japan and the Road Transport Vehicle Act and the Act Concerning Special Measures for Total Emission Reduction of Nitrogen Oxides and Particulate Matter from Automobiles in Specified Areas regulate vehicle emissions in Japan. In recent years, more stringent regulations have been introduced to match the European Union Standards, as can be seen from, among other things, the strengthened regulations on particulate matters emitted from gasoline-fueled vehicles, the adoption of the Worldwide Harmonized Light Vehicles Test Cycle (“WLTC”) driving cycles and the introduction of the Real Driving Emission (“RDE”). UN-R154 has also been adopted. The Noise Regulation Act and the Road Transport Vehicle Act provide for noise reduction standards on automobiles in Japan.
U.S. Federal Standards
The federal Clean Air Act directs the Environmental Protection Agency (“EPA”) to establish and enforce air quality standards, including emission control standards on passenger vehicles, light-duty trucks and heavy-duty vehicles (with such classifications based on gross vehicle weight ratings). Manufacturers are not permitted to sell vehicles in the United States that do not meet the standards. In 2014, EPA finalized new “Tier 3” tailpipe emission and evaporative emission standards for passenger vehicles, light-duty trucks, medium-duty passenger vehicles and some heavy-duty vehicles. Under that rule, tailpipe emission standards for non-methane organic gases, nitrogen oxides, and particulate matter, as well as standards for evaporative emissions and guaranteed useful life (which relates to a vehicle’s ability to meet emission limits over time), became increasingly stringent in phases from model years 2017 to 2025. It also required reductions in gasoline’s sulfur content beginning in model year 2017, which was expected to improve the performance of emission control systems. With the Tier 3 rule, EPA brought federal requirements in line with California’s more stringent emission standards (discussed below).
In March 2024, the EPA announced a final rule for Tier 4 emission standards for passenger vehicles, light-duty trucks, medium-duty passenger vehicles and some heavy-duty vehicles from model year 2027 through 2032. The rule tightened criteria pollutant limits, requiring reductions in non-methane organic gases and nitrogen oxides emissions and a particulate matter cap, fully phased in by model year 2031. Under the current Trump administration, however, the EPA has initiated steps to roll back these standards, framing them as an overreach that effectively mandates electric vehicle adoption. This deregulation effort is expected to face legal challenges from environmental groups and states, potentially delaying or altering the implementation of the original rules.
California Standards
The federal Clean Air Act generally prohibits states from enacting their own emission standards for new motor vehicles and engines. However, California is allowed to establish its own more stringent vehicle emission control standards if it receives a waiver of preemption from EPA. Other states then may decide to adopt the California standards that are allowed under the waiver.
Over the years, EPA has granted many such preemption waivers to California. Among those was a January 2013 waiver in support of California’s Advanced Clean Cars (“ACC”) program.
The California Air Resources Board (“CARB”) had adopted the ACC program in coordination with the EPA and the federal National Highway Traffic Safety Administration (“NHTSA”). It included the Low-Emission Vehicle III (“LEV III”) regulations, which set progressively stringent standards to reduce emissions of volatile organic compounds, carbon monoxide, nitrogen oxides, particulate matter and greenhouse gases (“GHG”). The regulations also addressed standards for evaporative emissions and extended vehicle useful life requirements.
Another part of the ACC program was a “zero-emission vehicles” (“ZEV”) mandate requiring manufacturers to sell a specified percentage of ZEVs—including BEVs, FCEVs and certain advanced technology
34
vehicles such as PHEVs that meet “partial zero-emission vehicles requirements”. Toyota’s MIRAI, an FCEV, is one example of a vehicle that qualifies as a zero-emission vehicle. Toyota intends to continue to develop additional advanced technologies and alternative fuel technologies that will allow other vehicles to qualify as zero-emission vehicles or partial zero-emission vehicles.
In 2022, CARB finalized the Advanced Clean Cars II (“ACC II”) regulations, which include updated LEV IV exhaust emissions standards and an expanded ZEV sales mandate applicable to model years 2026 through 2035. LEV IV standards further tighten criteria pollutant limits for light- and medium-duty vehicles, while the ZEV mandate requires 100% of new passenger vehicles sold in California to be ZEVs by 2035, consistent with California Governor Newsom’s Order of 2020 (N 79 20).
Legal challenges to the ACC II program have been filed, including suits over CARB’s authority and the waiver granted by the EPA under the Clean Air Act, particularly as federal policy on vehicle electrification has shifted under the second Trump administration. For example, the US Congress passed joint resolutions in May 2025 under the Congressional Review Act that disapproved EPA waivers for several California vehicle emission programs, including the ACC II rules; President Trump signed these resolutions into law on June 12, 2025. Developments such as these with their associated legal battles create significant uncertainty around future emissions standards under the Clean Air Act.
Aside from its emission standards, California has adopted regulations that require On-Board Diagnostics (“OBD”) systems to be incorporated into the computers of vehicles sold in California. OBD systems monitor components that can affect the emission performance of a vehicle and, if a problem with a component is detected, illuminates a warning light on the vehicle’s instrument panel. The systems also store the malfunction information in the computer to facilitate repairs. California’s OBD regulations are the most stringent in the world.
Other States’ Standards
Under Section 177 of the Clean Air Act, states can adopt California’s vehicle emissions standards and opt-in to that more stringent program. Approximately seventeen other states, for example, have adopted regulations substantially similar to California’s LEV standards. At least fifteen of those (Colorado, Connecticut, Maine, Maryland, Massachusetts, Minnesota, Nevada, New Jersey, New Mexico, New York, Oregon, Rhode Island, Vermont, Virginia and Washington) have adopted California’s ZEV program. Delaware and Pennsylvania have implemented the LEV standards but not the ZEV standards. Approximately eleven states (in addition to California) and the District of Columbia have adopted California’s ACC II regulations, mandating that 100% of new light-duty vehicle sales be ZEVs by 2035. Some of these state measures have faced reversal due to such concerns as the effect and cost of the mandates on consumers.
Canadian Standards
Canada finalized vehicle emission standards equivalent to federal standards in the United States in October 2014, responding to the strengthening of U.S. standards for model years 2017 to 2025; however, while the U.S. EPA published even stronger standards in March 2024 to drive significant ZEV penetration through 2032, it officially rescinded its Greenhouse Gas Endangerment Finding and repealed all federal GHG standards on February 12, 2026, leaving Tier 4 regulations on hold.
Although Canada typically aligns with the most stringent North American performance standards via “incorporation by reference,” U.S. regulatory reversals and legal threats have created uncertainty for Canada’s post-2026 emissions framework.
Further, in February 2026 the federal government announced a significant policy redirection by announcing it will repeal its ZEV Mandate (Electric Vehicle Availability Standard) and replace it with more stringent, Canada-unique fleet-average GHG emission standards for model years 2027–2032, with an eventual goal of 75% EV sales by 2035 and 90% by 2040 to be achieved via GHG emissions standards.
35
Despite this federal uncertainty, provinces of British Columbia and Quebec maintain their own ZEV mandates. In March 2026, British Columbia announced that it will modify its ZEV mandate to require manufacturers to reach 75% ZEV sales in model year 2035 (down from 100%). Quebec announced in 2025 that it would lift its 2035 ban on new gasoline-powered vehicles, set a new 2035 target of 90% ZEV sales — combining both BEVs and PHEVs, and provide some credit for hybrid vehicles within its ZEV mandate, with draft regulation reflecting these changes expected by the end of 2026.
To support these transitions, Canada provides a federal incentive through the Electric Vehicle Affordability Program (EVAP), which can often be combined with active provincial programs, though availability varies as several other regional programs have recently closed or paused. Furthermore, Canada remains committed to its 2017 fuel regulations, which limit sulfur concentration to 10mg/kg.
European Union Standards
In 2007, the European Parliament and the Council of the EU adopted the Vehicles Emissions Regulation (Regulation (EC) No 715/2007), which introduced more stringent emission standards for passenger vehicles and light commercial vehicles. The effective date for phasing in these stricter standards for passenger vehicles was September 2014 for Euro 6. For light commercial vehicles, the effective date was September 2015.
The primary focus of Euro 6 is to limit further emissions of diesel-powered vehicles and bring them down to a level equivalent to gasoline-powered vehicles. The EU implements RDE regulations, which require manufacturers to conduct on-road emissions tests using portable emissions testers to demonstrate compliance. Since September 2017, manufacturers have been required to reduce the divergence between the regulatory limit tested in laboratory conditions and the values of RDE tests, and this divergence factor was made more stringent for all new vehicles effective January 2021. The EU also implements the Worldwide harmonized Light vehicles Test Procedure (“WLTP”), which was introduced on September 1, 2017. The OBD regulations have also been tightened in terms of both subject parts and regulatory values. On January 1, 2019, an improved WLTP that purports to eliminate test flexibilities and introduces on-board fuel and energy consumption monitoring devices took effect. In March 2023, further regulations came into effect to harmonize requirements with UNR, tighten the divergence factor on RDE, and tighten the method for calculating CO2 emissions for PHEVs.
On May 28, 2024, Euro 7 (Regulation (EU) 2024/1257), which further strengthens Euro 6, came into effect. The dates of application of the Euro 7 regulation depend on vehicle type. They will apply to new types of passenger vehicles and light commercial vehicles from November 29, 2026, to new passenger vehicles and light commercial vehicles from November 29, 2027, to new types of buses and lorries from May 29, 2028, and to new buses and lorries from May 29, 2029. The Euro 7 regulation maintains the Euro 6 exhaust emission limits for passenger vehicles and light commercial vehicles (except the particle number limit), tightens exhaust emission limits for buses and lorries (e.g., introducing new in-scope pollutants such as N2O), establishes rules for other types of emissions such as brake particle emissions and tire abrasion, and introduces minimum performance requirements for battery durability in electric and plug-in hybrid vehicles (BEVs/PHEVs). Euro 7 also introduces on-board monitoring (OBM) systems, which monitor real-time exhaust emissions using on-board sensors and transmits the monitored data over the air from vehicles to manufacturers’ servers.
Chinese Standards
The next-generation emissions regulations for passenger vehicles, or Level 6 Emissions Regulations (China 6), were issued as GB18352.6-2016 at the end of 2016, pursuant to which tighter requirements will be implemented in two steps, depending on the regulated subjects and the implementation timing. Specifically, China 6a will apply to all models to be sold or registered in July 2020 and beyond, and China 6b will apply to all models to be sold or registered in July 2023 and beyond. China 6b will also introduce the RDE Regulations adopted under Euro 6. The OBD regulations have also been tightened in terms of both subject parts and regulatory values. With respect to fuels in the market, the quality standards and the implementation from
36
January 2019 for China 6 gasoline fuel and China 6 diesel fuel have been provided in GB17930-2016 and GB19147-2016 so as to keep up with the implementation timing of China 6 emissions regulations. Discussions are currently underway for Level 7 Emissions Regulations (“China 7”), which will be more stringent than the China 6 Emissions Regulations. Potential regulations for particulate matter emitted from brake pads and tire wear and the expansion of regulations to make BEVs/FCEVs subject to the OBD regulations are being considered.
For heavy-duty diesel-powered commercial vehicles, pursuant to GB17691-2005, the China V Emissions Regulations are being implemented from July 2017. With the establishment of GB17691-2018, which provides next-level China VI Emissions Regulations (“China VI”), it has been decided that China VIa will be implemented from July 2021 and China VIb from July 2023 (these regulations will apply to gas-fueled vehicles and public vehicles for urban areas earlier than those dates). For heavy-duty gasoline-powered commercial vehicles, pursuant to GB14762-2008, Level IV Emissions Regulations (“China IV”) apply to new models after July 2012. In parallel with China VII for passenger vehicles, tightening of the next-generation emissions regulations (China VII) is currently considered for heavy-duty gasoline-powered commercial vehicles.
Standards of Other Countries or Regions
At present, certain countries such as India, Thailand, Taiwan, Australia, New Zealand, Chile and Peru have also decided to introduce regulations equivalent to Euro 6.
Vehicle Fuel Economy
Japanese Standards
The Act on Rationalizing Energy Use and Shifting to Non-fossil Energy requires automobile manufacturers to improve their vehicles to meet specified fuel economy standards. Fuel economy standards are established according to the types of vehicles, and are required to be met by either fiscal 2011 (April 2010-March 2011), fiscal 2016 (April 2015-March 2016), fiscal 2021 (April 2020-March 2021), fiscal 2023 (April 2022-March 2023), fiscal 2026 (April 2025-March 2026) or fiscal 2031 (April 2030-March 2031). From 2020, if the WLTC mode is applied as a vehicle emissions test cycle, fuel economy test must be also conducted based on the WLTC mode.
U.S. Standards
Since 1975 when Congress passed the Energy Policy and Conservation Act, each automobile manufacturer must comply with corporate average fuel economy (“CAFE”) standards across its fleet of new cars and trucks. A manufacturer is subject to substantial civil penalties if, in any model year, its vehicles do not meet the CAFE standards. Manufacturers that exceed the CAFE standards earn credits determined by the difference between the average fuel economy performance of their vehicles and the CAFE standards. Credits may be used for the three years preceding the model year in which they were earned and the five years after.
An original goal of the CAFE Program was fuel efficiency. But the program also provided the means for EPA to address GHG emissions from vehicles. The two are linked since carbon dioxide emissions are directly proportional to fuel consumed. In 2012, for example, NHTSA and EPA issued a joint rule for passenger cars, light-duty trucks and medium-duty passenger vehicles for model years 2017 through 2025. NHTSA focused on fuel efficiency. It required passenger vehicles and light-duty trucks to meet an industry average fuel economy level of 49.7 miles per gallon in model year 2025. EPA, on the other hand, required an estimated combined average emission level of 163 grams of carbon dioxide per mile in model year 2025, which would be equivalent to 54.5 miles per gallon if met solely through improvements in fuel economy (without using any available credits for reducing air conditioning leakage).
37
Under the first Trump administration, in 2018, EPA and NHTSA proposed more relaxed GHG emission standards and CAFE standards. EPA also withdrew the preemption waiver allowing California to issue its own more stringent GHG emission standards under the ACC program. The Biden administration, however, moved to tighten the fuel economy program. EPA and NHTSA withdrew the prior Trump administration’s proposed GHG emission standards and CAFE standards.
In 2021 the Biden EPA issued a final rule revising passenger car and light-duty truck GHG emissions standards for model years 2023 through 2026. That rule projected reductions in GHG emissions, year-over-year, by 9.8% for model year 2023, 5.1% for 2024, 6.6% for 2025, and 10.3% for 2026. Based on these reductions, the industry-wide average emission targets for passenger cars and light-duty trucks were projected by the EPA to be 161 grams of carbon dioxide per mile in model year 2026.
In 2022, NHTSA followed with a final rule revising passenger car and light-duty truck fuel economy standards for model years 2024 through 2026. That rule set a fleet-wide standard of approximately 49 mpg for passenger cars and light duty trucks in model year 2026. This was to be achieved by increasing fuel efficiency, year-over-year, by 8% for model year 2024, 8% for 2025, and 10% for 2026.
Also in 2022, EPA reinstated California’s authority to enforce its own GHG emissions standards for vehicles.
In March 2024, EPA issued a final rule setting GHG emissions standards for light-duty and medium-duty vehicles from model years 2027 to 2032, projecting an industry-wide average target of 85 grams of carbon dioxide per mile by model year 2032. This represented an almost 50% reduction and was expected to accelerate the market shift towards electrification.
However, with the second Trump administration, NHTSA decided to review and reconsider fuel economy standards applicable to vehicles from model year 2022. In support of that effort, NHTSA issued an interpretive rule addressing the extent of its legal authority for the CAFE program. It was followed by a December 2025 proposed rule to amend the fuel economy standards for light duty vehicles for model years 2022 to 2026 and 2027 to 2031. In 2026, moreover, the Trump EPA rescinded the 2009 endangerment finding that provided the basis for its regulation of GHG emissions from new motor vehicles and new motor vehicle engines. Environmental stakeholders filed to start litigation on this decision, leading to uncertainty regarding such regulation.
Both the CAFE and GHG emissions standards are expected to remain dynamic in response to shifting federal policy priorities, technological developments, and market trends. A return of a Democratic administration, for example, could result in a tightening of such standards beyond model year 2032. Whatever the standards, legal and political challenges are likely. As such, the regulatory landscape is likely to evolve, with periodic rulemakings, midterm reviews and potential litigation shaping the trajectory of U.S. vehicle GHG emissions and fuel economy standards in the coming years.
European Union Standards
In April 2019, the European Parliament and the Council of the EU adopted the EU Emissions Performance Regulation (Regulation (EU) 2019/631), which introduced new carbon dioxide standards for vehicles and light commercial vehicles. Under these standards, average emissions of the EU fleet of new vehicles and light commercial vehicles were set to be reduced by 15% lower than 2021 levels by 2025 and, by 2030, emissions were set to a further 37.5% and 31% reduction of 2021 levels for vehicles and light commercial vehicles, respectively. As such, the 2020 to 2024 EU-fleet wide average carbon dioxide emissions target for light commercial vehicles was 147 grams per kilometer, and for passenger vehicles, 95 grams per kilometer. Since 2021, these emissions targets have been tested using the WLTP.
38
As part of its “Fit for 55” package, on April 19, 2023, the European Parliament and the Council of the EU adopted an amendment to the EU Emissions Performance Regulation (Regulation (EU) 2023/851), which introduced more stringent carbon dioxide emission standards for vehicles and light commercial vehicles. The new standards strengthen the 2030 targets from 37.5% to a 55% reduction for new passenger cars and from 31% to a 50% reduction for new light commercial vehicles, both relative to the 2021 baseline discussed above. In addition, the new standards introduce a new 2035 carbon dioxide target set at a 100% reduction for new vehicles and light commercial vehicles, again relative to the 2021 baseline. Since 2019, manufacturers failing to meet their targets have incurred penalties, which are currently set at €95 per vehicle from the first gram of target exceedance onwards.
On July 9, 2025, the European Parliament and the Council of the EU adopted an amendment to the EU Emissions Performance Regulation (Regulation (EU) 2025/1214), which introduced a one-time flexibility measure allowing manufacturers to meet 2025–2027 carbon dioxide targets over a three-year average rather than annually. This exemption was implemented as part of the Industrial Action Plan for the automotive sector, which aims to support investment in the clean transition while preserving overall climate ambition. Furthermore, since 2025, a zero- and low-emission vehicles (“ZLEV”) crediting system has been introduced to relax a manufacturer’s specific carbon dioxide emissions targets where the manufacturer produces numbers of ZLEV above specified benchmarks.
In December 2025, the European Commission published an “Automotive Package” comprising proposed amendments to Regulation (EU) 2023/851 (the amended CO2 fleet-wide performance standards for cars and vans), a proposed Directive on clean corporate vehicle fleets, a proposed Automotive Omnibus Regulation on the simplification of type-approval and market surveillance requirements, and a Battery Booster investment program. The proposed amendments to Regulation (EU) 2023/851 would replace the 100% tailpipe emissions reduction target for new cars and vans by 2035 with a 90% target, with the remaining 10% to be compensated through the use of low-carbon steel produced in the EU, e-fuels or biofuels. The proposals also introduce additional compliance flexibilities, including “super credits” for small affordable electric vehicles manufactured in the EU, a “banking and borrowing” mechanism for the 2030–2032 period, and a reduction of the 2030 CO2 target for vans from 50% to 40%. The proposed Directive on clean corporate vehicle fleets would require Member States to set mandatory targets for the uptake of zero- and low-emission vehicles by large companies and to make zero- or low-emission status and EU origin prerequisites for vehicles benefiting from public financial support. The proposed Automotive Omnibus Regulation is expected to streamline type-approval testing procedures, reduce the volume of delegated and implementing acts to be adopted under the General Safety Regulation (Regulation (EU) 2019/2144) and Euro 7 (Regulation (EU) 2024/1257), and introduce a new vehicle category for small affordable electric cars of up to 4.2 meters in length. The Battery Booster investment program allocates €1.8 billion, including €1.5 billion in interest-free loans for European battery cell producers, to support the development of a fully EU-based battery value chain. These proposals remain subject to adoption by the European Parliament and the Council of the EU, and their final form may differ from the European Commission’s proposals.
Also adopted as part of the “Fit for 55” package, the recast Renewable Energy Directive (Directive (EU) 2023/2413) enables Member States to require that renewable energy accounts for at least 29% of final energy consumption in transport by 2030, including a combined sub-target of 5.5% for advanced biofuels and renewable fuels of non-biological origin (“RFNBOs”) such as green hydrogen and e-fuels, of which at least 1% must come from RFNBOs.
The Alternative Fuels Infrastructure Regulation (Regulation (EU) 2023/1804), also part of the “Fit for 55” package, mandates the deployment of publicly accessible electric vehicle charging infrastructure along TEN-T (Trans-European Transport Network) core and comprehensive network corridors and hydrogen refueling stations along TEN-T core corridors.
39
Chinese Standards
Fuel consumption regulations are being implemented pursuant to the Chinese National Standards (“GB”), and the manufacture and sale of vehicle models not meeting these regulations are prohibited. For light-duty passenger vehicles, GB27999-2011 was issued. In these Level 3 Fuel Consumption Regulations for passenger vehicles, the regulation framework was substantially revised, such as the introduction of new regulations requiring automobile manufacturers to meet standards of corporate average fuel consumption across models in addition to existing regulations requiring each model to meet consumption standards. Furthermore, in order to achieve the national target for average fuel efficiency for 2020, the following more stringent fuel consumption regulations have been enforced. First, GB19578-2014, which has been enacted to strengthen regulations for each model, is being applied to new models after January 2016. Second, GB27999-2014, which has been enacted as Level 4 Fuel Consumption Regulations for passenger vehicles to strengthen corporate average regulations, has been in effect since 2016. In 2021, the fuel economy test mode was changed from NEDC to WLTC, and the Level 5 Fuel Consumption Regulations for passenger vehicles to achieve the average fuel efficiency target by 2025, GB19578-2021 and GB27999-2019, have been in effect since 2021. As a further enhancement of fuel consumption regulations, GB19578-2024 and GB27999-2025, which are the Level 6 Fuel Consumption Regulations for passenger vehicles, have been enacted and took effect in 2026. In addition, GB36980.1-2025, which regulates smaller electric vehicles (BEVs) by model, was enacted and has been applied to all new vehicles from January 2026. For light commercial vehicles, GB20997-2015 was enacted, based on which Level 3 Fuel Consumption Regulations have been applied to all new vehicles from January 2018. As a further enhancement of fuel consumption regulations, GB20997-2024, which are the Level 4 Fuel Consumption Regulations for light commercial vehicles, were enacted and applied to new vehicles from January 2026. Moreover, the implementation of the Life Cycle Assessment, which comprehensively regulates the amount of carbon dioxide emitted during the vehicle manufacturing, use, and disposal processes, among others, is being considered earlier than in the rest of the world.
With respect to large commercial vehicles, pursuant to GB30510-2018, Level 3 Fuel Consumption Regulations apply to new vehicles from July 2019 and are currently being enforced. In addition, in an effort to further strengthen fuel consumption regulations for the next generation, GB30510-2024, which is the Level 4 Fuel Consumption Regulations, have been enacted and applied to new vehicles from July 2025.
Standards of Other Countries or Regions
India, Saudi Arabia, Brazil, Chile, Mexico, Australia, New Zealand, South Korea and Taiwan have imposed regulations that require automobile manufacturers and dealers to reduce fuel consumption and carbon dioxide emissions.
Vehicle Safety
Japanese Standards
Japan has been participating in the 1958 Agreement of the UN and has a number of technical standards that are harmonized with the UNRs described below.
OBD testing to verify compliance with safety standards during vehicle inspections became mandatory for domestic vehicles starting October 2024 for imported vehicles starting October 2025.
From 2025 onwards, new UNRs have been adopted, including the pedal misapplication acceleration control system (UN-R175) and the emergency lane keeping system (UN-R178), among others.
Based on the outcomes of deliberations by the public–private council, Japan has implemented a harmonization of domestic effective dates. For standards for which application dates have already been determined, effective dates will be consolidated on an annual basis in September. For standards to be newly introduced going forward, effective dates will be unified to either September or March each year.
40
In addition, pursuant to the agreement between Japan and the United States concerning tariffs, a new certification scheme for U.S.-manufactured passenger vehicles has been established. By utilizing this scheme, passenger vehicles manufactured in the United States and compliant with U.S. regulatory standards may be accepted for sale in Japan without the need for additional testing within Japan.
U.S. Standards
In November 2021, the Bipartisan Infrastructure Bill was signed into law by President Biden. It requires the NHTSA to create regulations that cover a wide range of vehicle safety matters, including advanced driver assistance technologies, driver monitoring systems, headlamps, connected vehicles technologies, event data recording, and impaired driving prevention technologies. In response to these mandates, the NHTSA has so far completed several key rulemakings. A final rule permitting Adaptive Driving Beam headlamps was issued in 2022, a final rule mandating Automatic Emergency Braking Systems (“AEBS”) was issued in 2024, and a notice of proposed rulemaking for enhanced seatback strength was issued in 2025.
In the area of automated vehicles (“AV”), while the federal government has not issued binding AV regulations beyond the policy-level AV 4.0 guidance released in 2020, recent federal actions indicate a possible shift. In April 2025, the Trump administration proposed easing AV deployment restrictions while maintaining incident reporting for higher-level automated systems. Meanwhile, California and other states continue to advance AV oversight in the absence of comprehensive federal standards, with California recently proposing to lift its ban on autonomous heavy-duty truck testing.
European Union Standards
In December 2019, the EU issued the revised General Safety Regulation (Regulation (EU) 2019/2144) to tighten the requirements concerning safety and the protection of vehicle occupants and vulnerable road users. This revised General Safety Regulation (which came into effect in July 2022) made certain vehicle safety equipment mandatory in a phased approach, including: automated emergency braking, emergency lane keeping systems, driver drowsiness and attention warning, intelligent speed assistance, reversing detection systems, tire pressure monitoring systems, and data recorders in case of an accident (“event data recorders”). In October 2024, Regulation (EU) 2024/2220 was published specifying the specific test procedures and technical requirements for event data recorders for heavy vehicles.
In relation to this, various UNRs were developed (as detailed further below). The General Safety Regulation has been updated regularly to reflect new UNRs. For the equipment for which UNRs have not been developed, such as automated driving systems for automated vehicles, the EU has established its own technical standards.
In order to adapt to new telecommunication technologies in the EU, Regulation (EU) 2024/1180 was adopted in April 2024, amending Regulation (EU) 2015/758 which governs a 112-based eCall in-vehicle system. Detailed requirements and test procedures for the approval of eCall systems are currently being revised to align with the new regulations, and are expected to be issued shortly.
United Nations Standards
The United Nations Economic Commission for Europe Working Party on Automated/Autonomous and Connected Vehicles (“GRVA”) has been continuing to advance global regulatory frameworks on automated driving systems (“ADS”).
Amendments to UNR No. 157 on Automated Lane Keeping Systems (“ALKS”) have increased the permissible operating speed for ALKS from 60 km/h to 130 km/h and introduced provisions for automated lane change functions.
41
GRVA has been actively developing a new UNR/GTR on ADSs, with contributions from Canada, China, the EU, Japan, the UK and the US. Those new regulations aim to establish harmonized international technical requirements for ADS, encompassing functional safety, cybersecurity, software updates, and DSSAD (Data Storage System for Automated Driving) requirements. In parallel, amendments of all relevant UN GTRs and UNs for considering ADS fitness are being coordinated toward voting at WP.29 in June 2026.
WP.29 has endorsed “Considerations on Artificial Intelligence in the context of road vehicles” in June 2024. GRVA is exploring regulatory measures addressing artificial intelligence (“AI”). Now WP.29 will be exploring some instruments addressing AI used in vehicles.
In addition to automated driving, WP.29 is also engaged in the development of other new regulations. In March 2026, it adopted regulations requiring the issuance of warnings to drivers in cases of driver distraction or reduced alertness. Furthermore, other subsidiary working parties under WP.29 are progressing the development of regulations concerning, among other matters, the safety of children left in vehicles, awareness of vulnerable road users proximity, and ensuring ease of door opening in emergency situations such as vehicle fires or vehicle submersion.
Chinese Standards
Vehicle safety regulations in China were in general established having regard to the UNRs. However, China is adding its own requirements in consideration of the Chinese market and traffic environment, and establishing its own standards to improve the technological capabilities of its industries and to ensure international competitiveness. This is especially true in the area of “electrification,” or new energy vehicles (“NEVs”), which China is strongly promoting, and China’s own national technical standards on functions such as batteries, motors, and the charging and remote surveillance of NEVs have been made mandatory. Fuel-cell vehicles are subject to the supervising regulations on the safety of high-pressure gas in addition to the vehicle type approval requirement. Moreover, in accordance with the Made in China 2025 policy, the country considers “intelligentization” to be the next core technological area, and more than 100 standards for intelligent connected vehicles are being developed (including automation, telecommunication and security). As is the case in the field of electrification, it is anticipated that more of China’s own standards will become mandatory in a short period in the future. In particular, in recent years, from the perspective of ensuring data security against the backdrop of the U.S.-China trade friction and other factors, China has been vigorously and rapidly promoting legislation to strictly control the extraterrestrial transfer of data acquired within China, and the automotive sector is no exception to this. Although the authorities have already mandated to obtain clearance for personal information and important data to be transferred outside of China through security review, there is a risk that Toyota will need a major review of the necessity for further development of new technologies or of the technology development system, including technology transfer to China, depending on the terms of future laws and regulations. Furthermore, with the rapid expansion of the commercialization of advanced driver assistance technologies by local IT companies and OEMs, the development of related standards is also progressing at a fast pace. Accidents occurring during the use of these functions have become a social issue, and there is a shift toward only permitting technologies that provide support even in complex driving scenarios, by establishing performance requirements that significantly exceed those of UNRs. In addition, with a growing movement to prohibit features that have become widespread in NEVs, such as retractable door handles and one-pedal driving modes, regulatory developments specific to China are accelerating.
Environmental Matters
Japanese Standards
Automotive operations in Japan are subject to substantial environmental regulation under laws such as the Air Pollution Control Act, the Water Pollution Prevention Act, the Noise Regulation Act and the Vibration Control Act. Under these laws, if a business entity establishes or alters any facility that is regulated by these laws,
42
the business entity is required to give prior notice to regulators, and if a business entity uses, discharges, or stores substances that are environmental burdens or causes noise or vibration from such facility, the business entity is also required to comply with the applicable standards. Toyota has established and complies with environmental standards that exceed applicable statutory and regulatory requirements, based on agreements reached with relevant local administrative authorities. Under the Waste Management and Public Cleansing Act, producers of industrial waste must dispose of industrial waste in the manner prescribed in the same act.
The Soil Contamination Countermeasures Act of Japan requires that landowners conduct contamination testing and submit a report at the time they cease to use hazardous substances, such as in connection with the sale of a former factory, or if there is a possibility of health hazards due to land contamination. If it is found that land contamination exceeds a certain level, the relevant prefectural authority designates the area as considered to be contaminated, orders the landowner to submit a plan for decontamination (such plan must describe the measures to be taken in the area, the reasons therefor, and the deadline for implementing such measures, etc.), and has the landowner take such measures in accordance with such plan. In addition, under the Act on Recycling, etc. of End-of-Life Vehicles, vehicle manufacturers are required to take back and recycle specified materials (automotive shredder residues, air bags and fluorocarbons) of end-of-life vehicles and the provisions concerning such obligations of vehicle manufacturers became effective in January 2005. Toyota has coordinated with relevant parties to establish a vehicle take-back and recycle system throughout Japan. As a result, in fiscal 2025, Toyota achieved a recycling/recovery rate of 97% for automobile shredder residue (the legal requirement being 70% or higher) and 97% for air bags (the legal requirement being 85% or higher) and reached the targets set forth in this law.
U.S. Standards
The federal environmental statutes applicable in the United States include, among others, the Clean Air Act, the Clean Water Act, the Resource Conservation and Recovery Act (which governs wastes), and the Toxic Substances Control Act. Toyota also is subject to a variety of state laws that parallel, and in some cases are more stringent than, federal requirements.
Pursuant to the Clean Air Act, the EPA has promulgated National Ambient Air Quality Standards (“NAAQS”) for six “criteria” pollutants (carbon monoxide, lead, nitrogen dioxide, ozone, sulfur dioxide and particulate matter). Every five years EPA must review and possibly revise these NAAQS. In March 2024, the EPA announced a final rule, effective May 2024, lowering the primary (health-based) annual standard for particulate matter with diameters less than 2.5 micrometers (“PM2.5”) (the fine inhalable particles) from 12.0 to 9.0 micrograms per cubic meter (“µg/m3”). This revised standard, as well as any future NAAQS revisions for other criteria pollutants, could lead to additional pollution control requirements for stationary sources of air emissions, including Toyota’s U.S. manufacturing facilities.
The rule has faced legal challenges from several states, including Louisiana and Texas, as well as industry groups. Arguing that EPA’s action was procedurally improper and failed to adequately consider economic impacts, they filed petitions for judicial review in the D.C. Circuit Court of Appeals. In March 2025, EPA Administrator Lee Zeldin announced a formal reconsideration of the PM2.5 NAAQS, citing concerns about the previous administration’s standards and their potential impact on permitting processes. The legal challenges remain pending.
European Union Standards
In the EU, the Ambient Air Quality and Clearer Air for Europe Directive (Directive 2008/50/EC) sets the environmental standards for air quality. A revised Ambient Air Quality and Clearer Air for Europe Directive (Directive (EU) 2024/2881) entered into force on December 10, 2024, aligning 2030 EU air quality standards more closely with the World Health Organization recommendations. In particular, the new Directive cuts the allowed annual limit value for the main air pollutant, fine particulate matter (PM2.5), by more than half. It also
43
updates the air quality standards by lowering the permissible levels for twelve air pollutants. In relation to these Directives, environmental regulations, such as the National Emissions Ceilings Directive, or NEC Directive (2016/2284/EU), the Industrial Emissions Directive, or IED Directive (2010/75/EU) (as amended by Directive (EU) 2024/1785), and the Motor Vehicle Regulation (Regulation (EU) 2018/858), which is intended to control on-road emission sources, have been established, and emissions are managed under these directives based on their source.
A review of the EU Directive on End-of-Life Vehicles (Directive 2000/53/EC) was launched in 2021, resulting in a proposal for a new regulation in July 2023. The new proposed regulation would improve the quality of end-of-life treatment, incentivize reuse of recycled materials to enable more resource-efficient use of materials, recover more and better-quality raw materials (e.g., CRMs, plastics, steel and aluminum), and strengthen responsibility and cooperation between producers.
Toyota strives to ensure that its operations comply with environmental regulatory requirements concerning its facilities and products in each of the markets in which it operates. Toyota continuously monitors these requirements and takes necessary operational measures in an effort to remain in material compliance with all of these requirements. However, in light of the net zero transition, compliance with environmental regulations and standards has increased costs and is expected to lead to higher costs in the future. Therefore, Toyota recognizes that effective environmental cost management will become increasingly important. Moreover, innovation and leadership in the area of environmental protection are becoming increasingly important to remain competitive in the market. As a result, Toyota has proceeded with the development and production of environmentally friendly technologies, such as HEVs, PHEVs, FCEVs, BEVs and high fuel efficiency, low emission engines.
Beyond the product and facility-level environmental regulations described above, the European operations of automotive manufacturers are also potentially subject to a growing body of EU corporate sustainability and supply chain legislation. For instance, the Corporate Sustainability Reporting Directive (Directive (EU) 2022/2464) requires large undertakings operating in the EU to report detailed sustainability information in accordance with European Sustainability Reporting Standards. In addition, the Corporate Sustainability Due Diligence Directive (Directive (EU) 2024/1760) requires in-scope companies to conduct environmental and human rights due diligence. These Directives may apply to the EU subsidiaries of automotive manufacturers that meet the applicable size thresholds, and may also apply at group level under the Directives’ relevant third-country parent provisions, depending on the consolidated EU net turnover of such manufacturers.
Finally, the EU Deforestation Regulation (Regulation (EU) 2023/1115), which prohibits the placing on the EU market of specified commodities, including natural rubber, unless they are verified as deforestation-free and legally produced, has applied to large operators from December 30, 2025. This may be relevant to Toyota’s tire and rubber supply chain.
In addressing environmental issues, based on an assessment of the environmental impact of its products through their entire life cycles, from production through sales, disposal and recycling, Toyota, as a manufacturer, strives to take all possible measures from development stage and continues to work towards technological innovations to make efficient use of resources and to reduce the burden on the environment.
Toyota’s Approach to and Initiatives Towards Sustainability
The following is a discussion of Toyota’s approach to and initiatives towards sustainability. It contains forward-looking statements that are based upon the current judgment, assumptions and beliefs of Toyota’s management. See “Cautionary Statement With Respect To Forward-Looking Statements.” Actual business, financial and operational results may vary significantly from those described below as a result of unanticipated changes in various factors, including those described in “Risk Factors.”
44
Approach Towards Sustainability
We believe that Toyota should conduct business for the public good and serve people’s happiness and social development. This strong conviction is inherited from the belief, “always be faithful to your duties, thereby contributing to the company and to the overall good,” which is part of the Toyoda Principles, the roots of the Toyota Group.
In 2020, we revisited our roots and developed the Toyota Philosophy, which established “Producing Happiness for All” as our corporate mission. This mission expresses our commitment to sustainable development for society and business to bring more happiness to our customers and other stakeholders around the world. This is our commitment to sustainable business.
Through business based on the Toyoda Principles and Toyota Philosophy, Toyota established a product/business-driven operational base, with a company-wide emphasis on three values that make us Toyota: “making ever-better cars,” “best-in-town carmaker,” and “for someone other than oneself.”
We are now building on this legacy. Our next step is to evolve our growth strategy and business vision with a greater commitment to sustainability and to formulate concrete action plans to fulfill the mission of “Producing Happiness for All.”
To fulfill this mission, Toyota aims to transform into a mobility company that provides freedom of mobility for all without leaving anyone behind. To put our mission into action, we assessed the materiality of our impacts as well as risks and opportunities, which incorporated a comprehensive range of stakeholder perspectives — customers, community/business partners, and employees. The materiality assessment resulted in the identification of six key themes with the greatest priority: “expanding the value of mobility,” “safety & reliability,” “co-existence of humanity and the earth,” “supporting the community and employment,” “Active Contribution by All” and “strong production and business operation.”
At the heart of our key themes is our aspiration for making cars, which is expressed through our motto, “Let’s change the future of cars.”
We will continue to evolve our business from auto manufacturing to mobility, so that cars will be useful to society and bring smiles to customers for years to come. In pursuit of this goal, we must maximize cars’ positive impacts, focusing on enhancing user-friendliness, comfort, and emotional value and making them fun to drive. Simultaneously, we are dedicated to minimizing negative impacts such as traffic accidents, congestion, and environmental burdens.
For Toyota, transformation into a mobility company means creating a new industrial structure that benefits the development of a mobility society through the evolution of the automobile. We will lead the transformative journey to shape the future with a sense of mission, working together with business partners who share the purpose.
We are now in an era in which it is hard to predict the future. That is why we believe that persistent and purposeful action makes a difference. In the spirit of hyaku-setsu futo (indefatigability), one of the cherished phrases of our founder Sakichi Toyoda, we will live up to our convictions and challenge ourselves to change the future of cars. Toyota’s Origins and Materiality (Key Issues)
45
Governance
In order to grasp changes in the external environment and societal demands, and to prioritize issues of greater importance and urgency, we continuously strive to promote and improve environmental, social, and governance sustainability activities while working closely with the relevant groups under the promotion system illustrated below and under the supervision and decision-making of the Board of Directors.
To deliberate on key, multidisciplinary sustainability issues related to management, we have established the Sustainability Meeting chaired by the CEO, which mainly deals with themes associated with Environment and Social, and the Governance Risk Compliance Meeting chaired by the Chief Risk Officer (“CRO”), which deals with themes associated with Governance. In addition, we have established a framework in which meetings attended by the heads of the relevant divisions and the Carbon Neutral (CN) Strategy Subcommittee deliberate on individual issues and themes that are closer to actual practice.
<Sustainability Governance Structure>
46
| Sustainability Meeting | Governance Risk Meeting |
CN Strategy Subcommittee | ||||
| Chairperson | President | CRO/CCO* | President, Carbon-Neutral Engineering Development Center | |||
| Members | Vice Chairman of the Board of Directors (1); Executive vice presidents (2); outside member of the Board of Directors (1); outside Audit and Supervisory Committee members (2); CRO/CCO (1), others (3) | Executive vice presidents (2); outside member of the Board of Directors (1); outside Audit and Supervisory Committee members (3); Audit and Supervisory Committee member (1); others (4) | Executive vice presidents (2); operating officers (4), others (10) | |||
| Number of times held in fiscal year 2026 | 4 | 4 | 3 | |||
| Timing of reports to the Board of Directors | When an important matter arises | When an important matter arises | When an important matter arises | |||
| Duties | Contribution to increases in corporate value by deliberating, making decisions, and promoting activities for important sustainability-related issues | Making proposals and deliberation on important matters relating to governance, risk, and compliance, in particular matters requiring strategic direction at the management level | Cultivation of shared understanding regarding important global trends pertaining to carbon neutrality and environmental issues Reporting and deliberation on targets, key performance indicators, and other important management provisions related to above duties |
| * | CRO: Chief Risk Officer |
| CCO: Chief Compliance Officer |
Risk Management
Toyota will further strengthen risk management in response to uncertainties amid our constantly needing to rise to new challenges in the era of major changes in the circumstances surrounding, and in the values of, the automobile industry, such as carbon neutrality, expanding value of mobility (electrification, intelligent technologies, diversification), and other factors.
In order for each region, function, and in-house company to cooperate and support each other and prevent, mitigate, reduce, and appropriately control risks arising in business activities from a global perspective, Toyota has appointed a CRO and Deputy CRO in charge of risk management, as well as the head of risk management in each region. Toyota has also established the Governance Risk Compliance Meeting under the CRO’s supervision to identify, take action against, and monitor material risks from a company-wide perspective.
In addition, as a risk management system framework, we regularly identify, evaluate, consolidate, implement measures against, and monitor risks based on the Toyota Global Risk Management Standard (“TGRS”), a company-wide risk management framework established by referencing frameworks such as the ISO (International Organization for Standardization) and COSO (Committee for Sponsoring Organizations of the Treadway Commission).
The identified risks that are deemed significant to Toyota are deliberated by the Governance Risk Compliance Meeting, chaired by the CRO, and are referred to the Board of Directors and other relevant governing bodies, as appropriate, to promote the execution of business operations.
47
Approach to and Initiatives Towards Human Resources
Based on the philosophy that “monozukuri (manufacturing) depends on human resource development,” Toyota believes that its greatest asset is its people, and Toyota has been focusing on human resource development since its foundation. The common foundation of our human resource development consists of three pillars: Toyota’s “philosophy” (Toyota Philosophy), “skills” (Toyota Production System, or TPS), and “behavior” (Toyota Way 2020). We cultivate talent whom, under our “philosophy” of “working for the sake of others,” acquire the “skills” of TPS—which seeks to thoroughly eliminate waste and shorten lead times—and put our “philosophy” into practice through their own actions, that is, their “behavior.” We believe that the ability of such individuals to think and act autonomously in their fields strengthens our capacity to respond to changes in the operating environment.
1. Governance
Toyota places importance on dialogue with employees in order to accurately identify issues related to human capital. In particular, the president, executive vice presidents, and other members who also serve on the Sustainability Meeting participate in the Labor-Management Council and the Joint Labor-Management Round Table Conference, which serve as opportunities to understand the voices of employees and to identify the direction for addressing human capital-related issues.
Among the issues identified, those that are deemed particularly material or that require cross-functional responses are referred to the Sustainability Meeting described in “Item 4. Information on the Company — 4.B Business Overview — Toyota’s Approach to and Initiatives Towards Sustainability — Governance” where such matters are deliberated and determined to promote “priority sustainability initiatives” relating to human capital.
Reference: Number of times held in fiscal 2026
Sustainability Meeting: 4
Labor-Management Council: 4
Joint Labor-Management Round Table Conference: 2
48
2. Strategy
In advancing our transformation into a mobility company, we have identified six materiality topics (key issues) based on the perspectives of our stakeholders, including customers, local communities, business partners, and employees. Among these, under “Active Contribution by All” and “Supporting the Community & Employment,” we have identified six priority action items related to human capital.
| Materiality | Aim | |||
| Active Contribution by All | Human Resource Development | Acquire and develop human resources who “continuously think and act for the benefit of others” based on the Toyota Philosophy | ||
| Dialogue with employees | Translate dialogue between the company and employees of mutual trust/responsibility into action | |||
| DE&I | Create corporate culture where all people working for Toyota feel respected, and can demonstrate their uniqueness, strength, and abilities, while embracing their diverse talents and values | |||
| Labor Practices | Contribute to the peace of mind of employees and the sustainable growth of local communities through stable employment and maintaining/improving labor conditions | |||
| Health and Safety | Eliminate all kinds of unsafety by fostering company-wide safety culture, while protecting the good health and well-being of employees and their families | |||
| Supporting the Community & Employment | Respect for Human Rights | Respect the human rights of all people involved in our business activities | ||
We believe that advancing initiatives in these priority action items is essential to developing the talent that will drive our future.
3. Risk Management
We identify risks related to human capital through ongoing monitoring of workplace conditions via multiple communication channels—including dialogue with employees, engagement surveys, and consultation services—as well as through information gathering and benchmarking that take into account revisions to applicable laws and regulations and changes in the external environment.
Among the risks identified through these efforts, those deemed material from a company-wide perspective are escalated to management for decision-making and the consideration of responsive measures, in accordance with the process described in “Toyota’s Approach to and Initiatives Towards Sustainability—Risk Management.”
4. Metrics and Targets
In connection with the priority initiative of “Promoting Active Participation of Diverse Talent,” the table below sets forth representative metrics for TMC on an unconsolidated basis, together with the corresponding targets and results for fiscal 2026.
49
| Metrics | Target | Result (Fiscal 2026) | ||||
| Number of women in managerial positions (unconsolidated) | By 2030, increase to five times the target set in 2014 | 455 (4.5 times the target set in 2014) |
(Note 1) | |||
| Ratio of eligible male employees taking childcare leave (unconsolidated) |
Achieve an average ratio of employees taking childcare leave of 85% or above during the period from April 1, 2025 through March 31, 2030 | 79.0% | (Note 2) | |||
| Note 1 | As of March 31, 2026 | |
| Note 2 | The ratio of eligible employees taking childcare leave is calculated based on the ratio of employees taking childcare leave under Article 71-6, Item 1 of the Ordinance for Enforcement of the Act on Childcare Leave, Caregiver Leave, and Other Measures for the Welfare of Workers Caring for Children or Other Family Members (Ministry of Labour Ordinance No. 25 of 1991), in accordance with the provisions of the Act on Childcare Leave, Caregiver Leave, and Other Measures for the Welfare of Workers Caring for Children or Other Family Members (Act No. 76 of 1991). | |
Climate Change-related Disclosures
Toyota aims to establish a sustainable society in harmony with nature through contributions to the goal of carbon neutrality. Toyota addresses climate change-related impacts, risks, and opportunities guided by the principles of the “Toyota Earth Charter” and “Toyota Environmental Challenge 2050,” intending to fully concentrate on achieving carbon neutrality by 2050 across the entire vehicle life cycle. Toyota intends to reduce GHG emissions through multiple approaches, including the multi-pathway strategy, driven by the principles of “leaving no one behind” and “delivering freedom of movement to all.”
1. Governance
The Oversight of Climate change-related Issues by the Board of Directors
Toyota positions the Board of Directors as its ultimate supervisory, decision-making authority for climate change-related issues, including risks and opportunities. In order to effectively plan and execute strategies in response to social trends, we bring important climate change-related issues before the Board of Directors as they arise.
Responses to climate change-related issues (including risk and opportunity assessments and management implemented more than once a year) are addressed primarily by the CN Strategy Subcommittee, with oversight by the Board of Directors. The Board of Directors makes decisions based on the deliberations of each committee, including trade-offs between sustainability and climate change-related issues. The CN Strategy Subcommittee approves the formulation, review and monitoring of progress of climate change-related targets under the oversight of the Board of Directors, following deliberation by the Environmental Product Design Assessment Committee and the Consolidated Environment Committee. For details of the overall process, see “Item 4. Information on the Company — 4.B Business Overview — Toyota’s Approach to and Initiatives Towards Sustainability — Governance”.
Examples of decisions made by the Board of Directors in 2025 include the approval to execute a comprehensive partnership agreement with the municipal government of Shanghai and the establishment of Lexus (Shanghai) New Energy Co., Ltd., which develops and manufactures BEVs and batteries, aimed at contributing to the realization of carbon neutrality in China. The new company will develop Lexus-branded BEVs, with mass production to launch in 2027 or later.
50
2. Strategy
(a) Toyota’s Strategies (Fundamental approach of Toyota’s multi-pathway strategy)
Carbon neutrality is an urgent issue for cars to remain an essential part of society. Toyota is making efforts to provide our customers around the world with options for mobility under our multi-pathway strategy, while promoting the decarbonization of manufacturing and supply chains. It is important to consider the ways in which mobility takes into account the future of energy. The strategy’s basic premise is that we need to reduce dependence on fossil fuels from the perspective of the global environment and sustainability. Furthermore, over the medium- to long-term, renewable energy sources will continue to proliferate, with electricity and hydrogen emerging as the primary energy sources sustaining society. In the short term, however, it is critical to acknowledge global realities and implement changes in practical ways that maintain energy security. This is precisely why we are committed to providing mobility options that are aligned with a diverse range of energy situations and customer needs, while also keeping an eye on the future of electricity and hydrogen.
The underlying concept of our multi-pathway strategy is to achieve carbon neutrality through practical transition.
(b) Identification and Assessment of Climate Change-Related Impacts, Risks, and Opportunities
Overview of Impacts, Risks, and Opportunities
Toyota identifies factors that may impact the future based on the identified Impacts, Risks, and Opportunities (“IROs”). Toyota responds appropriately under Toyota’s strategies and transition plans. The overview of climate change-related IROs are as follows.
| • | Impacts: Effects that a company has on the environment and society as a result of its activities or business transactions. |
| • | Risks |
| • | Transition risk: Negative impact on the company arising from the transition to a low-carbon society, such as the introduction or strengthening of climate change-related policies and the advancement of low-carbon technologies. |
| • | Physical risk: Negative impact on the company arising from physical climate events caused by climate change. |
| • | Opportunities: Positive impact for the company arising from responses to market changes and technological innovation, driven by the transition to a low-carbon society and the progression of climate change. |
We established a process to identify and assess climate change-related risks and opportunities using scenario analysis. We also incorporated financial impact assessments into the process to enhance the accuracy of IRO materiality.
Time horizon for IRO assessment
51
Process of Identifying and Assessing Climate Change-Related Impacts
We analyze activities across Toyota and our value chain to identify potential environmental and social impacts. We conduct assessments on identified impacts based on severity (scale and scope of impact) and likelihood of occurrence. Scope 3 emissions account for a significant portion of Toyota’s total emissions, with category 11 representing a substantial share thereof. As they contribute significantly to climate change, reduction efforts across the entire value chain are essential. However, Scopes 1 and 2 emissions, while accounting for a small percentage, fall within the company’s direct control. This makes them important for Toyota, which has set a target under the Life Cycle Zero CO2 Emissions Challenge. For details of the Life Cycle Zero CO2 Emissions Challenge, see “Item 4. Information on the Company — 4B. Business Overview — Toyota’s Approach to and Initiatives Towards Sustainability — Climate Change-related Disclosures — 2. Strategy — (c) Resilience Analysis.”
Processes for Identifying and Assessing Climate Change-related Risks and Opportunities
Toyota identifies and assesses climate change-related risks and opportunities and evaluates the resilience of its strategies by having an internal team of climate change experts and external specialists conduct scenario analysis based on various future society projections.
Identification and Assessment of Risks and Opportunities
Toyota identifies primary factors (risk drivers) for climate change-related risks and opportunities based on anticipated future social conditions from the perspectives of transition risks (policy/legislation, markets, technology, reputation) and physical risks (acute, chronic). Toyota identifies risks and opportunities by analyzing driving factors and incorporates disclosure topics defined in ISSB* industry-based guidance, as well as climate change-related risks identified through TGRS, Toyota’s cross-functional risk management system, and climate change-related risks and opportunities specified by referencing external information into risks and opportunities identified through driver analysis. Toyota examines how the likelihood and impact of risks and opportunities differ in each scenario based on the identified risk drivers. The overall materiality of each risk and opportunity is
52
determined based on a quantitative assessment of likelihood and impact as well as a qualitative assessment that takes into account factors such as corporate social responsibility and Toyota’s key issues.
| * | International Sustainability Standards Board |
Scenario Analysis Overview
Scenario analysis is conducted in accordance with the processes outlined in guidance provided by the Financial Stability Board’s Task Force on Climate-related Financial Disclosures (“TCFD”) and the Ministry of the Environment, Japan. Toyota conducts 1.5°C scenario analysis to assess transition risks and opportunities as well as a 4°C scenario analysis to assess physical risks based on climate hazards.
| • | Scope |
Transition risks and opportunities: Automotive business and value chains in Toyota Motor Corporation and its consolidated subsidiaries
Physical risks: Toyota Motor Corporation, consolidated subsidiaries, and unconsolidated vehicle manufacturing subsidiaries
| • | Impact assessment period |
Transition risks and opportunities: Up to 2035
Physical risks: Up to the late 21st century
1.5°C Scenario Analysis
Selection of 1.5°C Scenarios
Toyota uses multiple published scenarios as reference for analysis, such as the scenarios from IEA*1 and IPCC*2 AR6*3 WG3 report. Toyota envisions society’s future energy landscape as converging on electricity and hydrogen with the widespread introduction of renewable energy, and recognizes that the transition speed varies by region depending on energy conditions.
Against the backdrop of recent global developments, discussions have begun on balancing environmental issues with economic security. There are also observable phenomena such as a slowdown in renewable energy investments due to international inflation and a stagnation in the growth trend of BEV sales in Europe and the U.S. At international forums such as the Conference of the Parties (“COP”) to the United Nations Framework Convention on Climate Change, discussions are progressing on transitional measures extending into the future. There is a growing recognition of the importance of introducing diverse decarbonization methods tailored to conditions in each country and region.
In recognition of these backgrounds, our multi-pathway strategy offers mobility options tailored to energy situations in each country/region and the diverse needs of customers through a practical transition in the short term with a view toward a future in which electricity and hydrogen serve as primary energy sources underpinning society in the long term.
The 1.5°C scenario analysis for passenger vehicles considers both the IEA NZE scenario,*4 which highlights the introduction of BEVs and PHEVs as key decarbonization measures, and other 1.5°C scenarios that incorporate regional characteristics and an increased range of mitigation measures (such as CO2 removal (CDR*5), carbon capture and storage (CCS), and carbon-neutral fuels) to assess corporate strategic resilience.
The assumptions and global circumstances of each scenario are organized as follows:
According to the IEA NZE Scenario (IEA World Energy Outlook 2025), reducing GHG emissions from the power generation sector may decrease emissions from other sectors. GHG emissions may be reduced by the
53
widespread adoption of BEVs in the road transport field of the transportation sector, where electrification is relatively easier. In reality, the speed of progress and timeframe of these initiatives may be delayed depending on energy conditions and policy developments in each country and region. In such cases, CDR technologies will become essential.
In other 1.5°C scenarios, concerns over energy and economic security and a decline in industrial competitiveness will cause delays in the progress of mitigation measures driven by energy conditions and policy developments in each country and region to spread globally. Furthermore, the introduction of decarbonization technologies to the market requires substantial investment in the initial stages, and differences in investment levels may lead to disparities in progress.
While decarbonization technologies beyond electrification may be utilized with low-emission power, the expansion of biofuel usage in road transport could be limited by the food-versus-fuel dilemma and variations in supply volume caused by land-use restrictions to protect the environment. A slower pace of reduction for GHG emissions will inevitably lead to an overshoot in temperature rise, making it necessary to assume the later large-scale and extensive deployment of CDR technologies compared to the NZE scenario.
| *1 | International Energy Agency |
| *2 | Intergovernmental Panel on Climate Change |
| *3 | Sixth Assessment Report |
| *4 | Net Zero Emissions by 2050 Scenario |
| *5 | Carbon Dioxide Removal |
Study on the IEA NZE Scenario
The IEA reports that the following is required to accomplish the NZE scenario. The shift of passenger vehicles to BEVs will progress as electricity is decarbonized with the active introduction of renewable energy, leading to a sharp reduction in GHG emissions after 2030 and the achievement of net zero emissions, including emissions from owned vehicles by 2050. To achieve this goal, it is assumed that governments around the world will introduce ambitious climate policies such as carbon pricing, tighter fuel efficiency standards, and bans on the sale of vehicles with internal combustion engines, along with expanded incentives to support the growth of BEVs. BEVs will become more widely accepted in the market as consumer awareness of the environment grows and stronger policies are put in place, along with technological advancements in vehicle electrification, development of innovative batteries, and energy management systems powered by renewable power. The societal shift towards electrification and renewable energy will suppress energy consumption with improvements in efficiency. For fossil fuels in hard-to-electrify sectors and delays in transitioning to electrification and renewable energy, carbon removal from the atmosphere via CDR technology is necessary. In the IEA World Energy Outlook prior to 2023, the use of CDR technology was not assumed in the NZE scenario. However, the 2024 edition reports that it will be necessary, and the 2025 edition indicates even greater use is required. The transition risks and societal challenges associated with the achievement of this scenario are as set forth below.
Transition risks associated with this scenario:
| • | Fines or other penalties imposed for non-compliance with fuel efficiency, GHG, or ZEV regulations. |
| • | Ramp-down of production and decrease in units sold caused by sudden product changes to comply with regulations. |
| • | Increase in R&D costs in response to developments in powertrain technology. |
| • | Supply shortages and rising procurement costs due to increased demand for feedstocks related to BEVs. |
| • | Increase in manufacturing costs due to the surge in renewable electricity prices. |
54
The following challenges must be addressed to accomplish this scenario:
| • | Formulation of government policies and active investment to promote the introduction of renewable energy. |
| • | Creation of social systems to secure the supply of battery feedstocks and development of recycling technologies. |
| • | Innovating and reducing the costs of decarbonization technologies that use electricity and hydrogen. |
| • | Development of charging infrastructure accompanying the widespread adoption of electric vehicles. |
| • | An increase of cost burdens associated with the introduction of decarbonization and CDR technologies |
Studies on Other 1.5°C Scenarios
In addition to the IEA NZE scenario, multiple 1.5ºC scenarios published by the IPCC and various research institutions are compared and examined in detail to analyze differences in energy conditions and policy developments across countries and regions. The pathway toward achieving the 1.5°C target set out in the Paris Agreement is as follows.
| • | Energy sector: |
Introduction of various technologies, such as CCS, in addition to the use of renewable energy and the adoption of low-carbon and carbon-neutral fuels, such as biofuels and synthetic fuels.
| • | Transportation sector: |
In addition to vehicle electrification, efforts also include the use of fuel-efficient vehicles and the adoption of low-carbon and carbon-neutral fuels such as biofuels and synthetic fuels.
| • | Differences between countries and regions: |
Renewable energy sources, such as biomass, are utilized to their fullest extent depending on conditions in each country and region. During the transition period, the aim is to balance economic development and carbon-neutral by also using fossil fuel combined with CCUS* technologies. With the advancement of diverse energy infrastructure such as low-carbon fuels and carbon-neutral fuels, various energy sources and powertrains are selected based on their respective convenience.
* Carbon Capture, Utilization and Storage
Transition Risks Associated with the Aforementioned Scenarios:
| • | Transition risks associated with the enhancement of BEVs are similar to those stated in the IEA NZE scenario; however, their impact on Toyota’s strategy and finances will be relatively small, considering the current track record of BEV adoption in each country and region and reviews of their policies. |
| • | Delays in the adoption of low-carbon fuels and carbon-neutral fuels such as biofuels and synthetic fuels. |
| • | Increase in R&D costs associated with the diversification of automotive fuels. |
| • | Increase in energy procurement costs due to the decarbonization of energy sources such as gas and liquid fuels, in addition to electricity. |
Social Challenges Toward Achieving Scenarios are More Diverse Compared to the IEA NZE Scenario:
| • | Developing technologies for low-carbon and carbon-neutral fuels, such as hydrogen, biofuels, and synthetic fuels, adapted to each country and region, and support in the early stage of introduction |
55
| • | Solving issues such as the food versus fuel dilemma related to biofuels and curbing the rise in fuel prices |
| • | Ensuring the supply of low-carbon fuels and carbon-neutral fuels through collaboration with other sectors |
| • | Development of infrastructure and aid policies to ensure a stable supply of energy |
Risks and Opportunity Trade-Offs in the 1.5°C Scenario
While electrification presents opportunities in relation to sales, it also brings risks such as increased R&D expenses and higher raw material procurement costs.
4°C Scenario Analysis
Selection of 4°C Scenarios
We selected IPCC AR6 WG1 SSP5-8.5 as the reference scenario for the 4°C scenario analysis. The IPCC SSP5-8.5 is the highest emission scenario that represents a fossil fuel-dependent economic development path without the implementation of climate policies, resulting in the occurrence of extremely frequent and severe physical climate events. We assessed the resilience of our business activities by conducting analyses under this scenario.
Studies on the 4°C Scenario
We consider that major physical risks under this scenario include the following:
| • | Suspended production and sales resulting from supply chain disruptions caused by more frequent and severe natural disasters. |
| • | Impacts on production caused by water shortage and higher water costs. |
We conducted the below screenings of high-risk sites:
| • | Screened high-risk sites for flooding hazards, such as river flooding, inland flooding, and storm surges, using geographical coordinates for 137 business locations in Japan and 73 locations overseas. |
| • | Identified sites in and outside of Japan where future hazard grades have been changed as a result of climate change and are evaluated as hazard grade B or higher, requiring attention to risks. |
As a result of our risk analysis, we confirmed that some business sites are at risk for river flooding, inland flooding, and storm surges, but the impact is slight.
Definition of Hazard Grade
56
Results of Physical Risk Screening
Efforts to Minimize Risk
To minimize physical risks, Toyota is undertaking various initiatives, including selection of locations for new plants, taking water risk into account, taking measures based on the results of water risk assessments, continuous revisions of BCP*1 based on experience from past disasters as well as the initiatives related to BCM*2, including the supply chain.
| *1 | Business Continuity Plan. A plan for companies to minimize damage and ensure business continuity and recovery when emergencies such as disasters occur |
| *2 | Business Continuity Management. A framework for operational management that ensures each countermeasure plan defined in the BCP functions can be executed |
Financial Impact Assessments
Toyota analyzes causal links between identified risks and opportunities and their financial impacts. Toyota assesses relationships with management themes, such as mobility concepts related to identified risks and opportunities and priority sustainability initiatives, to confirm the materiality of these risks and opportunities. In addition, Toyota assesses the financial impacts of identified high-priority risks and opportunities in light of the assumptions of each scenario.
57
58
| (c) | Resilience Analysis |
Strategies and Business Models for Addressing Material IROs
We recognized that the material IROs specified through the aforementioned process assessment have a significant impact on Toyota. Under the multi-pathway strategy, we incorporate measures to address these IROs into the transition plan and others, and secure resources to address these responses.
Transition Plan
We announced the “Toyota Environmental Challenge 2050” in October 2015, prior to the Paris Agreement. We established the “Life Cycle Zero CO2 Emissions Challenge,” “New Vehicle Zero CO2 Emissions Challenge,” and “Plant Zero CO2 Emissions Challenge” to clarify our long-term climate change objectives. The “8th Toyota Environmental Action Plan” sets specific reduction targets for each emission scope in the medium term. We have set our reduction targets for Scope 1, Scope 2, and Scope 3 category 11 with reference to and in line with criteria established by SBTi*1; however, such targets are not set forth in this annual report based upon the authority of or in reliance upon SBTi as experts with respect to such targets.
We support the Paris Agreement and under these GHG reduction targets, we intend to fully concentrate on achieving the 2050 Carbon Neutrality by advancing a multi-pathway strategy. We formulated a transition plan that organizes reduction initiatives and other measures aimed at achieving targets. This plan is recognized as crucial for Toyota to address climate change-related risks and opportunities, and is integrated into management plans such as sales plans and the midterm business plan.
The transition plan is developed around key emission scopes and includes initiatives Toyota considers important for contributing to carbon neutrality. We set primary reduction initiatives as reduction levers for each emissions scope. Under these levers, we implement specific emission reduction measures and manage the progress of our efforts. The transition plan considers the assumptions of the 1.5°C scenario referenced in the scenario analysis.
| *1 | Science Based Targets initiative. An initiative established by the CDP, the United Nations Global Compact, World Resources Institute (WRI) and the World Wide Fund for Nature (WWF) |
59
Resilience Analysis
The strategic resilience of the multi-pathway strategy is verified through scenario analysis.
1.5°C Scenario Analysis Results
The scenario analysis has revealed a variety of pathways to achieve the 1.5°C target aligned with the Paris Agreement, each accompanied by specific conditions and social challenges. With our global reach, we have reaffirmed the validity of focusing on our multi-pathway strategy, which includes various measures and technologies capable of addressing uncertainties to respond to global market and stakeholder demands, rather than specializing in or adhering to a single policy or technology.
4°C Scenario Analysis Results
Through the scenario analysis, some domestic and overseas sites are facing risks for river flooding, inland flooding, and storm surges, but the impact is estimated to be slight. Disaster drills and other means for improvements through PDCA cycles have proven to enhance the effectiveness of BCP and accelerate the speed of recovery after a disaster. We have positioned these activities as BCM and are promoting it as a collaborative framework between employees and their families, the Toyota Group and suppliers, and Toyota Motor Corporation.
Results from Resilience Analysis
Guided by the philosophy of being the “best-in-town,” we will continue to provide a lineup of vehicles that are well-received by customers and adaptable to different economic and energy situations in order to contribute to the development of each country and region. We will strive to reduce GHG emissions by utilizing existing infrastructure and assets. Toyota’s multi-pathway strategy has proven to be highly resilient in all of the scenarios presented.
As indicated in the IPCC assessment reports and other publications, there are multiple paths available to achieve the 1.5°C target as set out in the Paris Agreement. These paths can vary depending on local energy conditions and government policy, requiring the involvement of various industries and making collaboration with partners, including encouraging the use of carbon-neutral fuels, crucial. We stand with the Paris Agreement and take action to achieve its goals. We prioritize alignment with the Paris Agreement and work with our partners to promote the development of vehicles and social infrastructure based on our mobility concept, intending to fully concentrate on achieving carbon neutrality by 2050.
As the landscape changes, we will continue to conduct scenario analyses to reassess risks and opportunities, and reflect the responses to them into our strategies to further strengthen our resilience.
3. Risk Management
Links Between Company-Wide Risk Management and Climate Change-Related Risk Management Processes
Recognizing that the risks and opportunities present in climate change are key management concerns, we conduct scenario analyses based on the TCFD recommendations to identify risks and opportunities and assess the resilience of our business activities. Utilizing tools such as the TGRS, a company-wide risk management system designed by Toyota based on ISO standards and the COSO framework, we identify a broad range of risks related to our global business activities. When necessary, we establish cross-company task forces to promote risk management while monitoring the progress of countermeasures.
Risks are assessed based on the magnitude of impact and vulnerabilities. By setting a specific time horizon, we can clarify actual and strategic impacts on our businesses.
The magnitude of impact is rated on a five-grade scale for each of the following factors: finance, reputation, violation of laws and regulations, and business continuity. Vulnerability is assessed based on the current status of
60
countermeasures and probability of occurrence. Risk owners are assigned for the key risks assessed by region, function (such as production and sales) and product based on the above perspectives. Chief Officers of divisions and in-house company presidents oversee initiatives, while at the working level, relevant measures are implemented and monitored under the instructions of divisional General Managers.
In addition to the aforementioned TGRS, climate change-related risks and opportunities are reviewed by relevant executives and divisions in charge, and the status of the response is monitored and reviewed. Toyota actively works to identify a wide range of risks and opportunities stemming from environmental issues, regularly reviews the validity of strategies such as the “Toyota Environmental Challenge 2050” and promotes activities to boost competitiveness.
Current and future GHG emissions from vehicles, production and sales operations, and supply chains are calculated and assessed in line with relevant science-based emission reduction pathways. Important risks and opportunities that require prompt responses are deliberated at the Governance Risk Compliance Meeting and reported to the Board of Directors to determine the course of action.
4. Metrics and Targets
Medium- and Long-Term Target Structure
Toyota has systematically formulated its vision and targets for the environmental issues in order to realize its mission of coexistence of humanity and the earth as well as the mass production of happiness. We share and collaboratively promote “Toyota Environmental Challenge 2050” as our long-term vision, and the “8th Toyota Environmental Action Plan” as our medium-term target, with Carbon Neutrality (CN), Circular Economy (CE), and Nature Positive (NP) prioritized as our major pillars. For details on the transition plan, including medium- and long-term targets, please refer to “Item 4. Information on the Company — 4B. Business Overview — Toyota’s Approach to and Initiatives Towards Sustainability — Climate Change-related Disclosures — 2. Strategy — (c) Resilience Analysis”
Review of the “7th Toyota Environmental Action Plan (2025 Target)”
Toyota promoted the “7th Toyota Environmental Action Plan (2025 Target)”, a five-year action plan to achieve the “Toyota Environmental Challenge 2050.”
61
62
The “8th Toyota Environmental Action Plan (2030 Target)”
Toward the realization of “Toyota Environmental Challenge 2050,” we have formulated the “8th Toyota Environmental Action Plan (2030 target),” a new five-year action plan, and begun its implementation in April 2026. Based on the three pillars that Toyota has long prioritized—Carbon Neutrality (CN), Circular Economy (CE), and Nature Positive (NP)—we have developed specific targets for 17 categories. In 10 overseas countries and regions (North America, Europe, China, Asia, India, South America, South Africa, Australia, New Zealand, and South Korea), regional 2030 targets have been formulated in line with this.
Disclosure of Iranian Activities under Section 13(r) of the Securities Exchange Act of 1934
None.
Research and Development
The overriding goals of Toyota’s technology and product development activities are to minimize the negative aspects of vehicles, such as traffic accidents and impact on the environment, and maximize the positive aspects, such as driving pleasure, comfort and convenience. By achieving these sometimes-conflicting goals to a high degree, Toyota seeks to open the door to the automobile society of the future. To ensure efficient progress in research and development activities, Toyota coordinates and integrates all research and development phases, from basic research and advanced research to forward-looking technology and product development. With respect to long-term basic research in areas such as energy, the environment, information technology, telecommunications and materials, projects are regularly reviewed and evaluated in consultation with outside experts to achieve research and development cost control. With respect to forward-looking, leading-edge technology and product development, Toyota establishes cost-performance benchmarks on a project-by-project basis to ensure efficient development investment.
63
The chart below provides an overview of Toyota’s R&D at each phase.
| Basic research |
Phase to discover development theme Research on basic vehicle-related technology | |
| Forward-looking and leading-edge technology development |
Phase requiring technological breakthroughs such as components and systems Development of leading-edge components and systems that are more advanced than those of competitors | |
| Product development |
Phase mainly for development of new models Development of all-new models and existing-model upgrades |
With a focus on environmentally friendly, carbon-neutral and safe-vehicle technology, Toyota is promoting research and development into the early commercialization of next generation environmentally friendly, energy- efficient and safe-vehicle technology. Toyota is also moving forward with the development of innovative technologies such as electrification, connected vehicles and automated driving so as to realize a mobility society of the future that enables everyone to enjoy freedom of movement beyond the conventional concept of vehicles. To this end, Toyota is focusing on the following areas:
| • | further improvements in hybrid technologies, including in functions and cost, and contributions to the environment through advancements; |
| • | improvement in internal combustion engine fuel economy technology as well as improvement in technology in connection with more stringent emission standards; |
| • | development of BEVs, FCEVs and other alternative fuel vehicles; |
| • | development of advanced safety technology designed to promote driving and vehicle safety; |
| • | development of automated driving technologies; |
| • | connected car technologies; and |
| • | development of technology to bring about more comfortable movement. |
For a detailed discussion of our research and development infrastructure, see “Item 5. Operating and Financial Review and Prospects — 5.C Research and Development, Patents and Licenses.”
Components and Parts, Raw Materials and Sources of Supply
Toyota purchases parts, components, raw materials, equipment and other supplies from multiple competing suppliers located around the world. Toyota works closely with its suppliers to pursue optimal procurement. Toyota believes that this policy encourages technological innovation, cost reduction and other measures to strengthen its vehicle competitiveness. Although there are supply restrictions with respect to the procurement of certain parts and components, Toyota plans to continue purchases based on the same principle.
Because Toyota had more than 50 overseas operations in 27 countries and regions as of March 31, 2026, procurement of parts and components is being carried out not only locally in the country of the production site but also from third countries. As a result, the distribution network has become increasingly complex. In order to realize timely and efficient distribution while minimizing costs, Toyota is promoting efforts to optimize each stage of the supply chain. To this end, Toyota has developed a standardized system of global distribution and is supporting the operation of the system at each production base. The use of the global distribution system aims at implementing parts procurement that meets changes in vehicle production in a timely manner. These varying efforts, combined together, have led to maximized customer satisfaction, as well as to building a good working relationship with Toyota’s suppliers.
Toyota aims to share information and collaborate among the procurement divisions in each of the regions throughout the world in order to procure parts and materials from the most competitive suppliers among Toyota
64
factories located in various areas worldwide. At the same time, Toyota carries out streamlining efforts together with suppliers in each country in order to achieve sustainable growth. Toyota has been working on cost reduction measures, referred to as RR-CI (ryohin-renka, or cost innovation) and VA (value analysis) activities, which aims to eliminate waste in all processes from design to production while ensuring the reliability and safety of each part. Through these activities, Toyota focuses on “developing a real cost-competitive structure” by working together with suppliers.
In response to a significant upward trend in materials costs, including related logistics and other costs, since fiscal 2022, Toyota is accelerating initiatives such as the replacement of raw materials with those that are less subject to price pressure and reduction of raw material usage.
Intellectual Property
Through its ongoing challenge to be one step ahead in conducting new research and development, Toyota has enhanced its product appeal and technological prowess, which have been serving as the source of the company’s competitiveness. At the core of Toyota’s products created through this research and development always lies intellectual property, including invention, know-how and brands. This intellectual property functions as Toyota’s important management resources. By protecting and utilizing our intellectual property in an appropriate manner, we will continue to contribute to society.
Toward the realization of a future mobility society, Toyota is carrying out intellectual property activities in line with management priorities.
For example, we are focusing resources on such areas as carbon neutrality, including the development of electrified vehicles and batteries, and on software and connected initiatives, including connected and automated driving technologies. We are also reinforcing efforts to obtain and utilize intellectual property licenses in such areas to strengthen our future competitiveness.
As for the intellectual property activities framework, having established intellectual property functions at the R&D centers in Japan, the United States, Europe and China, Toyota supports technology development globally by securing organic, systematic coordination between R&D activities and intellectual property activities. Working in concert with approximately 110 law firms around the world, we also collect intellectual property information and take measures suitable for any intellectual property disputes that may arise in specific countries or regions. To enhance activities that incorporate management, R&D and intellectual property in one, Toyota has an Intellectual Property Management Committee. The members of the Committee discuss and make decisions concerning obtaining and utilizing important intellectual property conducive to management and for responding to management risks related to intellectual property.
In 2025, Toyota filed approximately 19,000 patent applications domestically and internationally. In Japan, based on the ranking published by IP Force, Toyota was ranked 1st among companies and 1st among automobile manufacturers that year in terms of the number of patent registrations as of December 31, 2025. In the United States, based on the ranking published by IFI CLAIMS, Toyota was ranked 8th among companies and 1st among automobile manufacturers that year in terms of the number of patent registrations as of December 31, 2025.
65
Capital Expenditures and Divestitures
Set forth below is a chart of Toyota’s principal capital expenditures between April 1, 2023 and March 31, 2026, the approximate total costs of such activity, as well as the location and method of financing of such activity, presented on a “by subsidiary” basis and as reported in Toyota’s annual Japanese securities report filed with the director of the Kanto Local Finance Bureau.
| Description of Activity |
Total Cost (Yen in billions) |
Location | Primary | |||||||
| Japan |
||||||||||
| Investment primarily in technology and products by |
|
1,915.2 |
|
|
Japan |
|
Internal funds, financing from issuance of bonds, etc. | |||
| Investment primarily in technology and products by |
168.5 | Japan | Borrowing | |||||||
| Investment primarily in technology and products by |
102.8 | Japan | Internal funds | |||||||
| Investment primarily in technology and products by |
86.5 | Japan | Internal funds | |||||||
| Outside of Japan |
||||||||||
| Investment primarily to promote localization by |
730.6 | United States | Internal funds | |||||||
| Investment primarily to promote localization by |
290.1 | Thailand | Internal funds | |||||||
| Investment primarily to promote localization by |
221.4 | United States | Internal funds | |||||||
| Investment primarily to promote localization by |
184.0 | United States | Internal funds | |||||||
| Investment primarily to promote localization by |
170.9 | Canada | Internal funds | |||||||
| Investment primarily to promote localization by |
152.6 | Mexico | Internal funds | |||||||
| Investment primarily to promote localization by |
130.6 | Brazil | Internal funds | |||||||
| Investment primarily to promote localization by Toyota Motor Technical Center (China) Co., Ltd. |
113.0 | China | Internal funds | |||||||
| Investment primarily to promote localization by Toyota Motor Manufacturing, Texas, Inc. |
102.9 | United States | Internal funds | |||||||
| Investment primarily to promote localization by Toyota Motor Europe NV/SA. |
96.4 | Belgium | Internal funds | |||||||
| Investment primarily in leased automobiles by Toyota Motor Credit Corporation |
|
7,032.5 |
|
|
United States |
|
Internal funds, financing from issuance of bonds, etc. | |||
66
Set forth below is information with respect to Toyota’s material plans to construct, expand or improve its facilities between April 2026 and March 2027, presented on a “by subsidiary” basis and as reported in Toyota’s annual Japanese securities report filed with the director of the Kanto Local Finance Bureau.
| Description of Activity |
Total Cost (Yen in billions) |
Location | Primary | |||||||
| Japan |
||||||||||
| Investment primarily in manufacturing facilities by |
850.0 | Japan | Internal funds | |||||||
| Outside of Japan |
||||||||||
| Investment primarily in manufacturing facilities by |
260.9 | United States | Internal funds | |||||||
| Investment primarily in manufacturing facilities by |
128.9 | India | Internal funds | |||||||
| Investment primarily in manufacturing facilities by |
119.1 | United States | Internal funds | |||||||
| Investment primarily in manufacturing facilities by |
107.5 | Belgium | Internal funds | |||||||
| Investment primarily in manufacturing facilities by |
70.8 | Canada | Internal funds | |||||||
Toyota does not collect information on the amount of expenditures already paid for each plant under construction because Toyota believes that it is difficult and it would require unreasonable effort or expense to identify and categorize each expenditure item with reasonable accuracy as past and future expenditures. Toyota’s construction projects consist of numerous expenditures, each of which is continually being adjusted and incurred in variable and constantly changing amounts as part of the overall work-in-progress.
Seasonality
Toyota does not consider its seasonality material in the sense of significantly higher sales during any certain period of the year as compared to other periods of the year.
Legal Proceedings
Toyota and other automakers are subject to certain class actions relating to Takata airbag issues. The actions against Toyota are being litigated in Brazil and Argentina.
Toyota is named as a defendant in an economic loss class action lawsuit in Australia in which damages are claimed on the basis that diesel particulate filters in certain vehicle models are defective. On April 7, 2022, March 27, 2023, and November 6, 2024, Toyota received unfavorable judgments in the court of first instance, the Federal Court of Australia, and the High Court of Australia, respectively. The judgments included a finding that there was a perceived reduction in vehicle value of certain vehicle models. However, the High Court remanded the case to the court of first instance for further proceedings to determine the specific calculation of the reduction in vehicle value. Other claims of economic loss in this class action lawsuit continue to be litigated at the court of first instance. In calculating the provision we should record in the consolidated financial statements as a result of the aforementioned judgments, Toyota has considered various factors including the legal and factual circumstances of the case, the contents of the judgment of the court of first instance and the Federal Court of Australia, and the views of legal counsel. The currently estimated probable economic outflow related to the class action is immaterial to Toyota’s consolidated financial position, results of operations and cash flows. At this stage, however, the final outcome and therefore ultimate financial liability for Toyota on account of this matter cannot be predicted with certainty.
67
In April 2020, Toyota reported possible anti-bribery violations related to a Thai subsidiary to the SEC and the U.S. Department of Justice (“DOJ”) and cooperated with these investigations. In June 2025, the DOJ and SEC informed Toyota that they had closed their investigations into the matter.
On March 4, 2022, Hino, a Japanese company that produces and sells commercial trucks and buses, and of which Toyota owns 66.16% of the voting interests as of March 31, 2026, disclosed that it had voluntarily commenced an investigation into potential issues regarding emissions performance and certification in the North American and Japanese markets, and that it has reported such issues to and is cooperating with the relevant authorities. Hino announced that, through such investigation, it identified past misconduct in relation to its applications for certification concerning the emissions and the fuel economy performance of certain of its engines for the Japanese market. In Japan, Hino was subject to an on-site inspection from the MLIT, and received a corrective action order from it. From October 7, 2022 to May 22, 2024, Hino submitted recurrence prevention reports to the MLIT. The MLIT has also revoked certain of the “type approvals” (that is, approvals that exempt new vehicles or vehicles with certain equipment from individual testing by government inspectors prior to sale) and the fuel consumption ratings relating to certain engine models. Hino has also further agreed to compensate certain of its customers in Japan for certain additional motor vehicle taxes that have become payable on account of the misconduct, as well as in connection with vehicles with engines with respect to which there were fuel efficiency problems. The investigation by Hino’s special investigation committee for engines for the Japanese market has been completed; however, some verification, investigations and communications with related parties are still ongoing.
In Canada, Hino and certain of its subsidiaries were sued in a putative class action in the Supreme Court of British Columbia, Canada, on October 19, 2023, and a similar lawsuit was filed in the Superior Court of Quebec, Canada. Hino entered into a settlement agreement with the plaintiffs on November 13, 2024, and received final approval of the Supreme Court of British Columbia on May 6, 2025 (local time), as well as final approval of the Superior Court of Quebec on June 2, 2025 (local time).
With respect to the United States, a lawsuit naming Hino and certain of its subsidiaries as defendants in a putative class action lawsuit was filed at the U.S. District Court for the Southern District of Florida claiming damages related to Hino’s vehicles sold in the U.S. from 2004 to 2021, was filed at the U.S. District Court for the Southern District of Florida on August 5, 2022 (local time). Hino entered into a settlement agreement with the plaintiff on October 25, 2023 and received final approval of the court on April 1, 2024 (local time). In addition, the DOJ and other U.S. agencies commenced an investigation with respect to potential violations of relevant laws and regulations regarding the certification of certain of Hino’s engines for the U.S. market. On January 16, 2025, Hino reached an agreement with the DOJ to resolve its criminal investigation into engine emissions certification testing and performance issues in the U.S. market, which became effective on March 19, 2025. Hino and its U.S. subsidiaries also reached a consolidated civil resolution with U.S. federal and California government authorities to resolve their civil investigations into the issues, which became effective on May 21, 2025.
In these resolutions, Hino agreed to the payment of criminal and civil penalties. In addition, Hino has started the implementation of measures for the engines in the market and a project for reducing environmental burdens. Furthermore, Hino has extended warranties for vehicles in the wake of the settlement in the class action lawsuit filed in the U.S., the civil settlement with the U.S. authorities, and the settlement in the class action lawsuit filed in Canada.
In addition, on April 17, 2023, a lawsuit against Hino and its subsidiaries as defendants in a representative action lawsuit has also been filed in Australia as a class action lawsuit. In the lawsuit, the plaintiffs claimed that they had suffered loss and damage resulting from alleged misleading or deceptive conduct in relation to non-compliance of the affected vehicles with emissions standards and fuel efficiency standards. Hino entered into a settlement agreement with the plaintiff on February 14, 2025, and received final approval of the court on July 18, 2025.
68
In New Zealand, Hino and local distributors which have no capital ties with Hino were sued in a class action in the High Court of New Zealand on March 3, 2025 (local time). Hino entered into a settlement agreement with the plaintiffs on February 9, 2026.
For the year ended March 31, 2025, Toyota recorded ¥281,140 million in costs and expenses related to the Hino certification issues described above. This amount covers costs associated with the aforementioned resolutions with the U.S. authorities, the settlement of the class action litigation in Canada, and the legal settlement in Australia, to the extent that Toyota can reasonably estimate them based on available information.
Hino ceased to be a consolidated subsidiary of Toyota as a result of its business integration with Mitsubishi Fuso Truck and Bus Corporation (“MFTBC”) effective April 1, 2026.
Similar lawsuits have been filed, and may be filed in the future. Investigations by governmental authorities, as well as civil litigation, related to these matters could result in the imposition of further civil or criminal penalties, fines or other sanctions, damages awards, or other consequences. Except as stated above, Toyota cannot predict the scope, duration, or outcome of these matters described above at this time.
Toyota also has various other pending legal actions and claims, including without limitation personal injury and wrongful death lawsuits and claims in the United States, as well as intellectual property litigation, and is subject to government investigations from time to time.
Beyond the amounts accrued with respect to all aforementioned matters, Toyota is unable to estimate a range of reasonably possible loss, if any, for the pending legal matters because (i) many of the proceedings are in evidence gathering stages, (ii) significant factual issues need to be resolved, (iii) the legal theory or nature of the claims is unclear, (iv) the outcome of future motions or appeals is unknown and/or (v) the outcomes of other matters of these types vary widely and do not appear sufficiently similar to offer meaningful guidance. Therefore, for all of the aforementioned matters, which Toyota is in discussions to resolve, any losses that are beyond the amounts accrued could have an adverse effect on Toyota’s financial position, results of operations or cash flows.
4.C ORGANIZATIONAL STRUCTURE
As of March 31, 2026, Toyota Motor Corporation had 216 domestic subsidiaries and 386 foreign subsidiaries. The following table sets forth for each of Toyota Motor Corporation’s principal subsidiaries, the country of incorporation and the percentage ownership interest and the voting interest held by Toyota Motor Corporation.
| Name of Subsidiary |
Country of Incorporation |
Percentage Ownership Interest |
Percentage Voting Interest |
|||||||
| % | % | |||||||||
| Hino Motors, Ltd.*1 |
Japan | 71.92 | 66.16 | |||||||
| Prime Planet Energy & Solutions, Inc. |
Japan | 51.00 | 51.00 | |||||||
| Toyota Financial Services Corporation |
Japan | 100.00 | 100.00 | |||||||
| Daihatsu Motor Co., Ltd. |
Japan | 100.00 | 100.00 | |||||||
| Toyota Finance Corporation |
Japan | 100.00 | 100.00 | |||||||
| Toyota Auto Body Co., Ltd. |
Japan | 100.00 | 100.00 | |||||||
| Toyota Motor Kyushu, Inc. |
Japan | 100.00 | 100.00 | |||||||
| Toyota Motor East Japan, Inc. |
Japan | 100.00 | 100.00 | |||||||
| Woven by Toyota, Inc. |
Japan | 100.00 | 100.00 | |||||||
| Toyota Motor Engineering & Manufacturing North America, Inc. |
United States | 100.00 | 100.00 | |||||||
| Toyota Motor Manufacturing, Kentucky, Inc. |
United States | 100.00 | 100.00 | |||||||
| Toyota Motor North America, Inc. |
United States | 100.00 | 100.00 | |||||||
| Toyota Motor Credit Corporation |
United States | 100.00 | 100.00 | |||||||
| Toyota Motor Manufacturing, Indiana, Inc. |
United States | 100.00 | 100.00 | |||||||
69
| Name of Subsidiary |
Country of Incorporation |
Percentage Ownership Interest |
Percentage Voting Interest |
|||||||
| % | % | |||||||||
| Woven Capital, L.P. |
United States | 100.00 | 100.00 | |||||||
| Toyota Motor Manufacturing, Texas, Inc. |
United States | 100.00 | 100.00 | |||||||
| Toyota Motor Sales, U.S.A., Inc. |
United States | 100.00 | 100.00 | |||||||
| Toyota Battery Manufacturing, Inc. |
United States | 90.00 | 90.00 | |||||||
| Toyota Motor Manufacturing Canada Inc. |
Canada | 100.00 | 100.00 | |||||||
| Toyota Motor Europe NV/SA |
Belgium | 100.00 | 100.00 | |||||||
| Toyota Motor Finance (Netherlands) B.V. |
Netherlands | 100.00 | 100.00 | |||||||
| Toyota Motor Manufacturing (UK) Ltd. |
United Kingdom | 100.00 | 100.00 | |||||||
| Toyota Motor Manufacturing Turkey Inc. |
Turkey | 90.00 | 90.00 | |||||||
| Guangqi Toyota Engine Co., Ltd. |
China | 70.00 | 70.00 | |||||||
| Toyota Motor (China) Investment Co., Ltd. |
China | 100.00 | 100.00 | |||||||
| Toyota Motor Finance (China) Co., Ltd. |
China | 100.00 | 100.00 | |||||||
| Lexus Electrified Shanghai Co., Ltd. |
China | 100.00 | 100.00 | |||||||
| Toyota Motor Asia (Singapore) Pte. Ltd. |
Singapore | 100.00 | 100.00 | |||||||
| Toyota Leasing (Thailand) Co., Ltd. |
Thailand | 90.00 | 90.00 | |||||||
| Toyota Motor Thailand Co., Ltd. |
Thailand | 86.43 | 86.43 | |||||||
| Toyota Motor Asia (Thailand) Co., Ltd. |
Thailand | 100.00 | 100.00 | |||||||
| Toyota Motor Corporation Australia Ltd. |
Australia | 100.00 | 100.00 | |||||||
| Toyota Finance Australia Ltd. |
Australia | 100.00 | 100.00 | |||||||
| Toyota do Brasil Ltda. |
Brazil | 100.00 | 100.00 | |||||||
| *1 | Hino ceased to be a consolidated subsidiary of Toyota as a result of its business integration with MFTBC effective April 1, 2026. |
4.D PROPERTY, PLANTS AND EQUIPMENT
As of March 31, 2026, Toyota and its affiliated companies produced automobiles and related components through more than 50 overseas manufacturing organizations in 27 countries and regions besides Japan. The facilities are located principally in Japan, the United States, Canada, the United Kingdom, France, Turkey, Czech Republic, Poland, Thailand, China, Taiwan, India, Indonesia, South Africa, Argentina and Brazil.
In addition to its manufacturing facilities, Toyota’s properties include sales offices and other sales facilities in major cities, repair service facilities and research and development facilities.
The following table sets forth information, as of March 31, 2026, with respect to Toyota’s principal properties and facilities that are owned by Toyota Motor Corporation or its subsidiaries. However, small portions, all under approximately 20%, of some facilities are on leased premises.
| Facility or Subsidiary Name |
Location |
Land Area (thousands of square meters) |
Number of Employees |
Principal | ||||||||
| Japan (Toyota Motor Corporation) |
||||||||||||
| Toyota Technical Center |
Toyota City, Aichi Pref. | 5,947 | 1,941 | Research and Development | ||||||||
| Tahara Plant |
Tahara City, Aichi Pref. | 4,029 | 6,564 | Automobiles | ||||||||
| Toyota Head Office and Technical |
Toyota City, Aichi Pref. | 2,725 | 23,479 | Research and Development | ||||||||
| Higashi-Fuji Technical Center |
Susono City, Shizuoka Pref | 2,719 | 2,516 | Research and Development | ||||||||
| Motomachi Plant |
Toyota City, Aichi Pref. | 1,575 | 8,035 | Automobiles | ||||||||
| Takaoka Plant |
Toyota City, Aichi Pref. | 1,305 | 4,337 | Automobiles | ||||||||
70
| Facility or Subsidiary Name |
Location |
Land Area (thousands of square meters) |
Number of Employees |
Principal | ||||||||
| Honsha Plant |
Toyota City, Aichi Pref. | 623 | 1,893 | Automobile parts | ||||||||
| Myochi Plant |
Miyoshi City, Aichi Pref. | 555 | 1,443 | Automobile parts | ||||||||
| Shimoyama Plant |
Miyoshi City, Aichi Pref. | 474 | 814 | Automobile parts | ||||||||
| Toyota Woven City |
Susono City, Shizuoka | 263 | 8 | Research and Development | ||||||||
| Japan (Subsidiaries) |
||||||||||||
| Daihatsu Motor Co., Ltd. |
Ikeda City, Osaka, etc. | 7,721 | 11,143 | Automobiles | ||||||||
| Hino Motors, Ltd.*1 |
Hino City, Tokyo, etc. | 5,795 | 11,622 | Automobiles | ||||||||
| Toyota Auto Body Co., Ltd. |
Kariya City, Aichi Pref., etc. | 2,118 | 11,915 | Automobiles | ||||||||
| TOYOTA Mobility Tokyo Inc. |
Minato-ku, Tokyo, etc. | 403 | 6,391 | Sales facilities | ||||||||
| Prime Planet Energy & Solutions, Inc. |
Chuo-ku, Tokyo, etc. | 300 | 4,299 | Automobiles | ||||||||
| Outside Japan (Subsidiaries) |
||||||||||||
| Toyota Battery Manufacturing, Inc. |
North Carolina, U.S.A. | 7,400 | 2,675 | Automobiles | ||||||||
| Toyota Motor Manufacturing, De Guanajuato, S.A. de C.V. |
Guanajuato, Mexico | 6,091 | 2,823 | Automobiles | ||||||||
| Toyota Motor Manufacturing, Kentucky, Inc. |
Kentucky, U.S.A. | 5,161 | 9,636 | Automobiles | ||||||||
| Toyota Motor Manufacturing Canada, Inc. |
Ontario, Canada | 4,752 | 8,298 | Automobiles | ||||||||
| Toyota Motor Thailand Co., Ltd. |
Samutprakarn, Thailand | 4,414 | 7,463 | Automobiles | ||||||||
| *1 | Hino ceased to be a consolidated subsidiary of Toyota as a result of the business integration with MFTBC effective April 1, 2026. |
Toyota is constantly engaged in upgrading, modernizing and revamping the operations of its manufacturing facilities based on its assessment of market needs and prospects. To respond flexibly to fluctuations in demand in each of its production operations throughout the world, Toyota continually reviews and implements appropriate production measures such as revising take time and adjusting days of operation. As a result, Toyota believes it would require unreasonable effort to track the exact productive capacity and the extent of utilization of each of its manufacturing facilities with a reasonable degree of accuracy.
As of March 31, 2026, property, plant and equipment having a net book value of approximately ¥1,926.7 billion was pledged as collateral securing indebtedness incurred by Toyota Motor Corporation’s consolidated subsidiaries. Toyota believes that there does not exist any material environmental issues that may affect the company’s utilization of its assets.
Toyota considers all its principal manufacturing facilities and other significant properties to be in good condition and adequate to meet the needs of its operations.
See “Item 4. Information on the Company — 4.B Business Overview — Capital Expenditures and Divestitures” for a description of Toyota’s material plans to construct, expand or improve facilities.
ITEM 4A. UNRESOLVED STAFF COMMENTS
None.
71
ITEM 5. OPERATING AND FINANCIAL REVIEW AND PROSPECTS
5.A OPERATING RESULTS
Financial information discussed in this section is derived from Toyota’s consolidated financial statements that appear elsewhere in this annual report. The financial statements have been prepared in accordance with IFRS Accounting Standards, as issued by the IASB.
The following discussion covers the fiscal years ended March 31, 2025 and 2026. For the discussion covering the fiscal year ended March 31, 2024, refer to “ITEM 5. OPERATING AND FINANCIAL REVIEW AND PROSPECTS” of Toyota’s Form 20-F for the fiscal year ended March 31, 2025 filed with the SEC on June 18, 2025.
Overview
The business segments of Toyota include automotive operations, financial services operations and all other operations. Automotive operations are Toyota’s most significant business segment, accounting for 87% of Toyota’s total revenues before the elimination of intersegment revenues for fiscal 2026. Toyota’s primary markets based on vehicle unit sales for fiscal 2026 were: Japan (21.7%), North America (30.6%), Europe (12.3%) and Asia (18.3%).
Automotive Market Environment
The worldwide automotive market is highly competitive and volatile. The demand for automobiles is affected by a number of factors including social, political and general economic conditions; introduction of new vehicles and technologies; and costs incurred by customers to purchase or operate vehicles. These factors can cause consumer demand to vary substantially in different geographic markets and for different types of automobiles.
During fiscal 2026, the global economy showed differing trends by region. In the United States, consumption remained resilient even after tariff increases. In China, however, consumer sentiment stayed weak amid a slowdown in the real estate market and employment concerns, and consumption growth remained sluggish due to continued price stagnation and intense price competition.
The following table sets forth Toyota’s consolidated vehicle unit sales by geographic market based on location of customers for the past two fiscal years.
| Thousands of units | ||||||||
| Year ended March 31, | ||||||||
| 2025 | 2026 | |||||||
| Japan |
1,991 | 2,082 | ||||||
| North America |
2,703 | 2,934 | ||||||
| Europe |
1,172 | 1,183 | ||||||
| Asia |
1,838 | 1,759 | ||||||
| Other* |
1,659 | 1,637 | ||||||
| Overseas total |
7,372 | 7,513 | ||||||
|
|
|
|
|
|||||
| Total |
9,362 | 9,595 | ||||||
|
|
|
|
|
|||||
| * | “Other” consists of Central and South America, Oceania, Africa and the Middle East, etc. |
During fiscal 2026, Toyota’s consolidated vehicle unit sales in Japan increased. Overseas consolidated vehicle unit sales increased overall during fiscal 2026 due mainly to increases in North America and Europe, despite decreases in Asia and the Middle East.
72
Toyota’s share of total vehicle unit sales in each market is influenced by the quality, safety, reliability, price, design, performance, economy and utility of Toyota’s vehicles compared with those offered by other manufacturers. The timely introduction of new or redesigned vehicles is also an important factor in satisfying customer needs. Toyota’s ability to satisfy changing customer preferences can affect its revenues and earnings significantly.
The profitability of Toyota’s automotive operations is affected by many factors. These factors include:
| • | vehicle unit sales volumes, |
| • | the mix of vehicle models and options sold, |
| • | the level of parts and service sales, |
| • | the levels of price discounts and other sales incentives and marketing costs, |
| • | the cost of customer warranty claims and other customer satisfaction actions, |
| • | the cost of research and development and other fixed costs, |
| • | the prices of raw materials, |
| • | the ability to control costs, |
| • | the efficient use of production capacity, |
| • | the adverse effect on production due to such factors as the reliance on various suppliers for the provision of supplies, or the general scarcity of certain supplies, |
| • | climate change risk, including both physical risks as well as transition risks, |
| • | the adverse effect on market, sales and productions of natural calamities as well as the outbreak and spread of epidemics and interruptions of social infrastructure, and |
| • | changes in the value of the Japanese yen and other currencies in which Toyota conducts business. |
Changes in laws, regulations, policies and other governmental actions can also materially impact the profitability of Toyota’s automotive operations. These laws, regulations and policies include those attributed to environmental matters, vehicle safety, fuel economy and emissions that can add significantly to the cost of the vehicles.
Many governments also impose local content requirements, impose tariffs and other trade barriers, and enact price or exchange controls that can limit an automaker’s operations and can make the repatriation of profits unpredictable. Changes in these laws, regulations, policies and other governmental actions may affect the production, licensing, distribution or sale of Toyota’s products, cost of products or applicable tax rates. From time-to-time when potential safety problems arise, Toyota issues vehicle recalls and takes other safety measures including safety campaigns relating to its vehicles. The recalls and other safety measures described above have led to a number of claims and legal proceedings against Toyota. For a more detailed description of these claims and legal proceedings, see “Item 4. Information on the Company — 4.B Business Overview — Legal Proceedings” and notes 24 and 32 to the consolidated financial statements.
The worldwide automotive industry is in a period of global competition which may continue for the foreseeable future, and in general the competitive environment in which Toyota operates is likely to intensify. Toyota believes it has the resources, strategies and technologies in place to compete effectively in the industry as an independent company for the foreseeable future.
73
Financial Services Operations Segment
Competition in the worldwide automobile financial services industry is intensifying. As competition increases, margins on financing transactions may decrease and market share may also decline as customers obtain financing for Toyota vehicles from alternative sources.
Toyota’s financial services operations mainly include loans and leasing programs for customers and dealers. Toyota believes that its ability to provide financing to its customers is an important value added service. Therefore, Toyota has expanded its network of finance subsidiaries in order to offer financial services in many countries.
Toyota’s competitors for retail financing and retail leasing include commercial banks, credit unions and other finance companies. Meanwhile, commercial banks and other captive automobile finance companies also compete against Toyota’s wholesale financing activities.
Toyota’s total receivables related to financial services increased during fiscal 2026 mainly due to an increase in loan balance. Also, vehicles and equipment on operating leases increased during fiscal 2026 mainly due to the impact of changes in exchange rates.
For details on receivables related to financial services and vehicles and equipment on operating leases, see notes 8 and 13 to the consolidated financial statements.
Toyota’s receivables related to financial services are subject to collectability risks. These risks include consumer and dealer insolvencies and insufficient collateral values (less costs to sell) to realize the full carrying values of these receivables. See notes 3 and 20 to the consolidated financial statements for additional information.
Toyota continues to originate leases to finance new Toyota vehicles. These leasing activities are subject to residual value risk. Residual value losses could be incurred when the lessee of a vehicle does not exercise the option to purchase the vehicle at the end of the lease term. See note 3 to the consolidated financial statements for additional information.
Toyota enters into interest rate swap agreements and cross currency interest rate swap agreements to convert its fixed-rate debt to variable-rate functional currency debt. A portion of the derivative instruments are entered into to manage interest rate risk from an economic perspective and are not designated as a hedge of specific assets or liabilities on Toyota’s consolidated statements of financial position and accordingly, unrealized gains or losses related to derivatives that are not designated as a hedge are recognized currently in operations. See the discussion in “Item 11. Quantitative and Qualitative Disclosures about Market Risk” and note 21 to the consolidated financial statements.
The fluctuations in funding costs can affect the profitability of Toyota’s financial services operations. Funding costs are affected by a number of factors, some of which are not in Toyota’s control. These factors include general economic conditions, prevailing interest rates and Toyota’s financial strength. Funding costs increased during fiscal 2025 and 2026 mainly as a result of an increase in the balance of financial liabilities.
Toyota launched its credit card business in Japan in April 2001. As of March 31, 2025, Toyota had 16.0 million cardholders, a decrease of 0.12 million cardholders compared with March 31, 2024. As of March 31, 2026, Toyota had 16.9 million cardholders, an increase of 0.85 million cardholders compared with March 31, 2025. Credit card receivables as of March 31, 2025 increased by ¥15.7 billion from March 31, 2024 to ¥574.5 billion, and that as of March 31, 2026 decreased by ¥23.0 billion from March 31, 2025 to ¥551.4 billion.
74
Currency Fluctuations
Toyota is affected by fluctuations in foreign currency exchange rates. Toyota is exposed to fluctuations in the value of the Japanese yen against the U.S. dollar and the euro as well as the Australian dollar, the Canadian dollar, the British pound and others. Toyota’s consolidated financial statements, which are presented in Japanese yen, are affected by foreign currency exchange fluctuations through both translation risk and transaction risk.
Translation risk is the risk that Toyota’s consolidated financial statements for a particular period or for a particular date will be affected by changes in the prevailing exchange rates of the currencies in those countries in which Toyota does business compared with the Japanese yen. Even though the fluctuations of currency exchange rates to the Japanese yen can be substantial, and therefore significantly impact comparisons with prior periods and among the various geographic markets, the translation risk is a reporting consideration and does not reflect Toyota’s underlying results of operations. Toyota does not hedge against translation risk.
Transaction risk is the risk that the currency structure of Toyota’s costs and liabilities will deviate from the currency structure of sales proceeds and assets. Transaction risk relates primarily to sales proceeds from Toyota’s non-domestic operations from vehicles produced in Japan.
Toyota believes that the location of its production facilities in different parts of the world has significantly reduced the level of transaction risk. As part of its globalization strategy, Toyota has continued to localize production by constructing production facilities in the major markets in which it sells its vehicles. In fiscal 2025 and 2026, Toyota produced 73.5% and 73.9%, respectively, of its non-domestic sales outside Japan. In North America, 76.0% and 74.6% of vehicles sold in fiscal 2025 and 2026, respectively, were produced locally. In Europe, 69.6% and 69.0% of vehicles sold in fiscal 2025 and 2026, respectively, were produced locally. In Asia, 94.6% and 96.4% of vehicles sold in fiscal 2025 and 2026, respectively, were produced locally. Localizing production enables Toyota to locally purchase many of the supplies and resources used in the production process, which allows for a better match of local currency revenues with local currency expenses.
Toyota also enters into foreign currency transactions and other hedging instruments to address a portion of its transaction risk. This has reduced, but not eliminated, the effects of foreign currency exchange rate fluctuations, which in some years can be significant. See notes 3 (“Material accounting policies — Financial instruments — (3) Derivative financial instruments”) and 21 to the consolidated financial statements for additional information.
Generally, a weakening of the Japanese yen against other currencies has a positive effect on Toyota’s consolidated revenues, operating income and net income attributable to Toyota Motor Corporation. In fiscal 2026, the Japanese yen was on average stronger against the U.S. dollar but weaker against the euro in comparison to fiscal 2025. At the end of fiscal 2026, the Japanese yen was weaker against the U.S. dollar and the euro in comparison to the end of fiscal 2025. See note 20 to the consolidated financial statements for additional information.
75
Operating Performance
Sales Revenues
Toyota’s sales revenues include sales revenues from sales of products, consisting of sales revenues from automotive operations and all other operations, excluding sales revenues from financial services operations, which increased by 5.2% during fiscal 2026 compared with the prior fiscal year to ¥45,865.9 billion, and sales revenues from financial services operations, which increased by 8.6% during fiscal 2026 compared with the prior fiscal year to ¥4,819.0 billion.
See “ — Sales Revenues and Operating Income by Business Segment” and “ — Sales Revenues and Operating Income by Geography” for additional information for the factors affecting changes in sales revenues.
Cost of Products Sold
Cost of products sold increased by ¥3,631.2 billion, or 10.2%, to ¥39,141.4 billion during fiscal 2026 compared with the prior fiscal year.
This increase includes a ¥395.0 billion increase in operating expenses attributable to our efforts to strengthen the foundation of our suppliers and the impact of soaring materials prices. Through continued cost reduction efforts together with our suppliers, this increase was partially offset by a ¥215.0 billion reduction primarily attributable to value engineering activities and other cost reduction efforts concerning design-related costs and a ¥60.0 billion reduction attributable to cost reduction efforts at plants and logistics departments.
The cost reduction efforts described above related to ongoing value engineering and value analysis activities, the use of common parts resulting in a reduction of part types and other manufacturing initiatives designed to reduce the costs of vehicle production. The impact of soaring materials prices includes the impact of fluctuation in the price of steel, precious metals, non-ferrous alloys including aluminum, plastic parts and other production materials and parts.
Cost of Financial Services
Cost of financial services increased by ¥131.2 billion, or 4.5%, to ¥3,079.7 billion during fiscal 2026 compared with the prior fiscal year. This increase was due mainly to the increase in funding costs resulting from an increase in the balance of financial liabilities.
Selling, General and Administrative Expenses
Selling, general and administrative expenses decreased by ¥84.9 billion, or 1.8%, to ¥4,697.5 billion during fiscal 2026 compared with the prior fiscal year. This decrease was due mainly to the effect of expenses related to Hino’s certification issues recorded in fiscal 2025.
76
Operating Income
| Yen in millions | ||||
| Year ended March 31, | ||||
| 2026 v. 2025 Change | ||||
| Changes in operating income and loss: |
||||
| Effect of marketing efforts |
710,000 | |||
| Effect of cost reduction efforts |
(120,000 | ) | ||
| Effect of changes in exchange rates |
(195,000 | ) | ||
| Increase or decrease in expenses and expense reduction efforts |
(2,030,000 | ) | ||
| Other |
605,700 | |||
|
|
|
|||
| Total |
(1,029,300 | ) | ||
|
|
|
|||
Toyota’s operating income decreased by ¥1,029.3 billion, or 21.5%, to ¥3,766.2 billion during fiscal 2026 compared with the prior fiscal year. This decrease was due to the ¥2,030.0 billion aggregate unfavorable impact of changes in expenses and expense reduction efforts, partially offset by the ¥710.0 billion favorable impact of marketing efforts.
The aggregate unfavorable impact of changes in expenses and expense reduction efforts includes the ¥1,380.0 billion impact of U.S. tariffs.
The favorable impact of marketing efforts includes the ¥210.0 billion impact of changes in vehicle unit sales and sales mix, as well as the ¥335.0 billion impact of other marketing efforts such as price revisions.
Other Income and Expenses
Share of profit (loss) of investments accounted for using the equity method during fiscal 2026 decreased by ¥38.4 billion, or 6.5%, to ¥552.7 billion compared with the prior fiscal year. This decrease was due mainly to a decrease during fiscal 2026 in net income attributable to the shareholders of companies accounted for by the equity method. The following table shows the share of profit (loss) of investments accounted for using the equity method by country.
| Yen in millions | ||||||||||||||||
| Year ended March 31, | 2026 v. 2025 Change | |||||||||||||||
| 2025 | 2026 | Amount | Percentage | |||||||||||||
| Japan |
407,085 | 354,234 | (52,851 | ) | (13.0 | )% | ||||||||||
| China |
106,992 | 108,299 | 1,307 | 1.2 | ||||||||||||
| Other |
77,143 | 90,209 | 13,066 | 16.9 | ||||||||||||
|
|
|
|
|
|
|
|
|
|||||||||
| Total |
591,219 | 552,742 | (38,478 | ) | (6.5 | )% | ||||||||||
Other finance income increased by ¥37.5 billion, or 6.7%, to ¥594.2 billion during fiscal 2026 compared with the prior fiscal year. This increase was due mainly to an increase in gains on sales of securities.
Other finance costs decreased by ¥103.9 billion, or 54.5%, to ¥86.7 billion during fiscal 2026 compared with the prior fiscal year. This decrease was due mainly to a decrease in losses on securities revaluation.
77
Foreign exchange gain (loss), net decreased by ¥304.5 billion to ¥400.7 billion during fiscal 2026 compared with the prior fiscal year. Foreign exchange gains and losses include the differences between the value of foreign currency denominated assets and liabilities recognized through transactions in foreign currencies translated at prevailing exchange rates and the value at the date the transaction settled during the fiscal year, including those settled using forward foreign currency exchange contracts, or the value translated by appropriate year-end exchange rates. The ¥304.5 billion decrease in foreign exchange gain (loss), net was due mainly to the reclassification of foreign currency translation adjustments related to foreign operations, which had been recognized in “Other components of equity” in the consolidated statement of financial position, to “Foreign exchange gain (loss), net” in the consolidated statement of income during fiscal 2025 due mainly to the loss of control of certain consolidated subsidiaries.
Other income (loss), net decreased by ¥30.7 billion, to ¥74.2 billion in losses during fiscal 2026 compared with the prior fiscal year.
Income Taxes
The provision for income taxes decreased by ¥457.6 billion, or 28.2%, to ¥1,167.2 billion during fiscal 2026 compared with the prior fiscal year. This decrease was due mainly to the decrease in income before income taxes. The average effective tax rate for fiscal 2026 was 22.7%.
See note 16 to the consolidated financial statements for further discussion.
Net Income Attributable to Non-controlling Interests
Net income attributable to non-controlling interests increased by ¥112.9 billion, or 458.0%, to ¥137.6 billion during fiscal 2026 compared with the prior fiscal year. This increase was due mainly to an increase during fiscal 2026 in net income of consolidated subsidiaries.
Net Income Attributable to Toyota Motor Corporation
Net income attributable to Toyota Motor Corporation decreased by ¥916.9 billion, or 19.2%, to ¥3,848.0 billion during fiscal 2026 compared with the prior fiscal year.
Other Comprehensive Income, Net of Tax
Other comprehensive income, net of tax increased by ¥2,275.9 billion to ¥1,529.9 billion for fiscal 2026 compared with the prior fiscal year. This increase resulted mainly from exchange differences on translating foreign operations gains of ¥946.3 billion in fiscal 2026 compared with losses of ¥827.8 billion in the prior fiscal year, due mainly to the weakening of the yen against the U.S. dollar and the euro, and remeasurements of defined benefit plans gains of ¥101.3 billion in fiscal 2026 compared with losses of ¥109.5 billion in the prior fiscal year, due mainly to changes in fair value of plan assets.
Operating Performance by Business Segment
Segmentation
Toyota’s most significant business segment is its automotive operations. Toyota carries out its automotive operations as a global competitor in the worldwide automotive market. Management allocates resources to, and assesses the performance of, its automotive operations as a single business segment on a worldwide basis and assesses financial and non-financial data such as vehicle unit sales, production volume, market share information, vehicle model plans and plant location costs to allocate resources within the automotive operations. Toyota does not manage any subset of its automotive operations, such as domestic or overseas operations or parts, as separate management units.
78
Sales Revenues and Operating Income by Business Segment
The tables below show Toyota’s sales revenues and operating income from external customers by business and by product category.
For the year ended March 31, 2025
| Yen in millions | ||||||||||||||||||||
| Automotive | Financial services |
All other | Inter-segment Elimination/ Unallocated Amount |
Consolidated | ||||||||||||||||
| Sales revenues |
||||||||||||||||||||
| Revenues from external customers Vehicles |
36,892,232 | — | — | — | ||||||||||||||||
| Parts and components for production |
1,606,173 | — | — | — | ||||||||||||||||
| Parts and components for after service |
3,423,389 | — | — | — | ||||||||||||||||
| Other |
1,074,505 | — | — | — | ||||||||||||||||
| Total revenues from external customers |
42,996,299 | 4,437,827 | 602,578 | — | 48,036,704 | |||||||||||||||
| Inter-segment revenues and transfers |
203,566 | 43,353 | 844,536 | (1,091,455 | ) | — | ||||||||||||||
|
|
|
|
|
|
|
|
|
|
|
|||||||||||
| Total |
43,199,865 | 4,481,180 | 1,447,114 | (1,091,455 | ) | 48,036,704 | ||||||||||||||
|
|
|
|
|
|
|
|
|
|
|
|||||||||||
| Operating expenses |
39,259,587 | 3,797,661 | 1,265,920 | (1,082,050 | ) | 43,241,118 | ||||||||||||||
|
|
|
|
|
|
|
|
|
|
|
|||||||||||
| Operating income |
3,940,278 | 683,519 | 181,194 | (9,405 | ) | 4,795,586 | ||||||||||||||
|
|
|
|
|
|
|
|
|
|
|
|||||||||||
For the year ended March 31, 2026
| Yen in millions | ||||||||||||||||||||
| Automotive | Financial services |
All other | Inter-segment Elimination/ Unallocated Amount |
Consolidated | ||||||||||||||||
| Sales revenues |
||||||||||||||||||||
| Revenues from external customers Vehicles |
38,847,899 | — | — | — | ||||||||||||||||
| Parts and components for |
1,509,449 | — | — | — | ||||||||||||||||
| Parts and components for after service |
3,608,666 | — | — | — | ||||||||||||||||
| Other |
1,235,909 | — | — | — | ||||||||||||||||
| Total revenues from external customers |
45,201,924 | 4,819,003 | 664,026 | — | 50,684,952 | |||||||||||||||
| Inter-segment revenues and transfers |
215,779 | 38,112 | 987,387 | (1,241,278 | ) | — | ||||||||||||||
|
|
|
|
|
|
|
|
|
|
|
|||||||||||
| Total |
45,417,703 | 4,857,115 | 1,651,412 | (1,241,278 | ) | 50,684,952 | ||||||||||||||
| Operating expenses |
42,640,654 | 4,005,394 | 1,519,333 | (1,246,644 | ) | 46,918,736 | ||||||||||||||
|
|
|
|
|
|
|
|
|
|
|
|||||||||||
| Operating income |
2,777,049 | 851,722 | 132,079 | 5,366 | 3,766,216 | |||||||||||||||
|
|
|
|
|
|
|
|
|
|
|
|||||||||||
79
Automotive Operations Segment
The automotive operations segment is Toyota’s largest operating segment by sales revenues. Sales revenues for the automotive segment increased during fiscal 2026 by ¥2,217.8 billion, or 5.1%, to ¥45,417.7 billion compared with the prior fiscal year. The increase mainly reflects the ¥1,900.0 billion favorable impact of changes in vehicle unit sales and sales mix.
Operating income from the automotive operations decreased by ¥1,163.2 billion, or 29.5%, to ¥2,777.0 billion during fiscal 2026 compared with the prior fiscal year. This decrease in operating income was due mainly to the ¥2,030.0 billion aggregate unfavorable impact of changes in expenses and expense reduction efforts, partially offset by the ¥710.0 billion favorable impact of marketing efforts.
Financial Services Operations Segment
Sales revenues for the financial services operations increased during fiscal 2026 by ¥375.9 billion, or 8.4%, to ¥4,857.1 billion compared with the prior fiscal year. This increase was due mainly to the increase in loan balance.
Operating income from financial services operations increased by ¥168.2 billion, or 24.6%, to ¥851.7 billion during fiscal 2026 compared with the prior fiscal year. This increase was due mainly to the recording of valuation gains on interest rate swaps in sales finance subsidiaries in the United States.
The following table shows the number of financing contracts by geographic region at the end of fiscal 2026 and 2025, respectively.
| Number of financing contracts in thousands | ||||||||||||||||
| As of March 31, | 2026 v. 2025 Change | |||||||||||||||
| 2025 | 2026 | Amount | Percentage | |||||||||||||
| Japan |
2,740 | 2,652 | (88 | ) | (3.2 | )% | ||||||||||
| North America |
5,647 | 5,659 | 12 | 0.2 | ||||||||||||
| Europe |
1,944 | 2,076 | 132 | 6.8 | ||||||||||||
| Asia |
2,245 | 2,307 | 62 | 2.8 | ||||||||||||
| Other* |
1,054 | 1,108 | 54 | 5.1 | ||||||||||||
|
|
|
|
|
|
|
|
|
|||||||||
| Total |
13,630 | 13,802 | 172 | 1.3 | % | |||||||||||
|
|
|
|
|
|
|
|
|
|||||||||
| * | “Other” consists of Central and South America, Oceania and Africa. |
All Other Operations Segment
Toyota’s other business operations consist of its information technology business and others.
Sales revenues for Toyota’s other operations segments increased by ¥204.2 billion, or 14.1%, to ¥1,651.4 billion during fiscal 2026 compared with the prior fiscal year.
Operating income from Toyota’s other operations segments decreased by ¥49.1 billion, or 27.1%, to ¥132.0 billion during fiscal 2026 compared with the prior fiscal year.
80
Consolidated Statement of Income on Non-Financial Services Businesses and Financial Services Business
| Yen in millions | ||||||||
| Year ended March 31, 2025 |
Year ended March 31, 2026 |
|||||||
| (Non-Financial Services Businesses) |
||||||||
| Sales revenues |
43,787,709 | 46,079,610 | ||||||
| Cost of revenues |
35,684,332 | 39,325,176 | ||||||
| Selling, general and administrative |
3,984,469 | 3,830,878 | ||||||
|
|
|
|
|
|||||
| Operating income |
4,118,908 | 2,923,556 | ||||||
|
|
|
|
|
|||||
| Other income (loss), net |
1,622,539 | 1,387,992 | ||||||
|
|
|
|
|
|||||
| Income before income taxes |
5,741,447 | 4,311,548 | ||||||
|
|
|
|
|
|||||
| Income tax expense |
1,446,627 | 935,124 | ||||||
|
|
|
|
|
|||||
| Net income |
4,294,820 | 3,376,424 | ||||||
|
|
|
|
|
|||||
| Net income attributable to |
||||||||
| Toyota Motor Corporation |
4,281,231 | 3,245,638 | ||||||
| Non-controlling interests |
13,589 | 130,786 | ||||||
|
|
|
|
|
|||||
| (Financial Services Business) |
||||||||
| Sales revenues |
4,481,180 | 4,857,115 | ||||||
| Cost of revenues |
2,960,227 | 3,101,062 | ||||||
| Selling, general and administrative |
837,435 | 904,331 | ||||||
|
|
|
|
|
|||||
| Operating income |
683,519 | 851,722 | ||||||
|
|
|
|
|
|||||
| Other income (loss), net |
(10,309 | ) | 5,672 | |||||
|
|
|
|
|
|||||
| Income before income taxes |
673,210 | 857,393 | ||||||
|
|
|
|
|
|||||
| Income tax expense |
178,000 | 232,086 | ||||||
|
|
|
|
|
|||||
| Net income |
495,210 | 625,307 | ||||||
|
|
|
|
|
|||||
| Net income attributable to |
||||||||
| Toyota Motor Corporation |
484,129 | 618,430 | ||||||
| Non-controlling interests |
11,081 | 6,878 | ||||||
|
|
|
|
|
|||||
| (Elimination) |
||||||||
| Elimination of net income |
(274 | ) | (15,970 | ) | ||||
| (Consolidated) |
||||||||
|
|
|
|
|
|||||
| Net income |
4,789,755 | 3,985,761 | ||||||
|
|
|
|
|
|||||
| Net income attributable to |
||||||||
| Toyota Motor Corporation |
4,765,086 | 3,848,098 | ||||||
| Non-controlling interests |
24,670 | 137,664 | ||||||
|
|
|
|
|
|||||
81
Operating Performance by Geography
The tables below show Toyota’s sales revenues and operating income from external customers by geography.
For the year ended March 31, 2025
| Yen in millions | ||||||||||||||||||||||||||||
| Japan | North America |
Europe | Asia | Other* | Inter-segment Elimination/ Unallocated Amount |
Consolidated | ||||||||||||||||||||||
| Sales revenues |
||||||||||||||||||||||||||||
| Revenues from external customers |
10,719,120 | 18,930,253 | 6,110,052 | 7,903,360 | 4,373,919 | — | 48,036,704 | |||||||||||||||||||||
| Inter-segment revenues |
11,139,974 | 370,074 | 203,437 | 1,084,702 | 147,338 | (12,945,525 | ) | — | ||||||||||||||||||||
|
|
|
|
|
|
|
|
|
|
|
|
|
|
|
|||||||||||||||
| Total |
21,859,094 | 19,300,327 | 6,313,489 | 8,988,062 | 4,521,257 | (12,945,525 | ) | 48,036,704 | ||||||||||||||||||||
| Operating expenses |
18,707,971 | 19,191,519 | 5,897,936 | 8,091,552 | 4,268,632 | (12,916,492 | ) | 43,241,118 | ||||||||||||||||||||
|
|
|
|
|
|
|
|
|
|
|
|
|
|
|
|||||||||||||||
| Operating income |
3,151,123 | 108,808 | 415,553 | 896,510 | 252,626 | (29,033 | ) | 4,795,586 | ||||||||||||||||||||
|
|
|
|
|
|
|
|
|
|
|
|
|
|
|
|||||||||||||||
For the year ended March 31, 2026
| Yen in millions | ||||||||||||||||||||||||||||
| Japan | North America |
Europe | Asia | Other* | Inter-segment Elimination/ Unallocated Amount |
Consolidated | ||||||||||||||||||||||
| Sales revenues |
||||||||||||||||||||||||||||
| Revenues from external customers |
10,985,614 | 20,661,490 | 6,464,911 | 7,966,455 | 4,606,482 | — | 50,684,952 | |||||||||||||||||||||
| Inter-segment revenues and transfers |
11,088,528 | 418,175 | 236,280 | 1,304,921 | 152,511 | (13,200,415 | ) | — | ||||||||||||||||||||
|
|
|
|
|
|
|
|
|
|
|
|
|
|
|
|||||||||||||||
| Total |
22,074,141 | 21,079,665 | 6,701,191 | 9,271,377 | 4,758,993 | (13,200,415 | ) | 50,684,952 | ||||||||||||||||||||
| Operating expenses |
19,753,103 | 21,272,219 | 6,343,449 | 8,401,551 | 4,430,028 | (13,281,613 | ) | 46,918,736 | ||||||||||||||||||||
|
|
|
|
|
|
|
|
|
|
|
|
|
|
|
|||||||||||||||
| Operating income (loss) |
2,321,038 | (192,554 | ) | 357,743 | 869,826 | 328,966 | 81,198 | 3,766,216 | ||||||||||||||||||||
|
|
|
|
|
|
|
|
|
|
|
|
|
|
|
|||||||||||||||
| * | “Other” consists of Central and South America, Oceania, Africa and the Middle East. |
82
Sales Revenues and Operating Income by Geography
Japan
| Thousands of units | ||||||||||||||||
| Year ended March 31, | 2026 v. 2025 Change | |||||||||||||||
| 2025 | 2026 | Amount | Percentage | |||||||||||||
| Toyota’s consolidated vehicle unit sales* |
3,932 | 4,083 | 151 | 3.8 | % | |||||||||||
* including number of exported vehicle unit sales |
||||||||||||||||
| Yen in millions | ||||||||||||||||
| Year ended March 31, | 2026 v. 2025 Change | |||||||||||||||
| 2025 | 2026 | Amount | Percentage | |||||||||||||
| Sales revenues: |
||||||||||||||||
| Sales of products |
21,468,488 | 21,651,881 | 183,393 | 0.9 | % | |||||||||||
| Financial services |
390,606 | 422,260 | 31,654 | 8.1 | ||||||||||||
|
|
|
|
|
|
|
|
|
|||||||||
| Total |
21,859,094 | 22,074,141 | 215,047 | 1.0 | % | |||||||||||
|
|
|
|
|
|
|
|
|
|||||||||
| Operating costs and expenses |
18,707,971 | 19,753,103 | 1,045,132 | 5.6 | % | |||||||||||
|
|
|
|
|
|
|
|
|
|||||||||
| Operating income |
3,151,123 | 2,321,038 | (830,085 | ) | (26.3 | )% | ||||||||||
|
|
|
|
|
|
|
|
|
|||||||||
Sales revenues in Japan increased due mainly to an increase in vehicle sales of 151 thousand units and the favorable impact of price revisions compared with the prior fiscal year. For fiscal 2025 and 2026, exported vehicle unit sales were 1,941 thousand units and 2,001 thousand units, respectively.
Operating income in Japan decreased due mainly to the expenses and others, and the effects of changes in exchange rates compared with the prior fiscal year.
North America
| Thousands of units | ||||||||||||||||
| Year ended March 31, | 2026 v. 2025 Change | |||||||||||||||
| 2025 | 2026 | Amount | Percentage | |||||||||||||
| Toyota’s consolidated vehicle unit sales |
2,703 | 2,934 | 231 | 8.5 | % | |||||||||||
| Yen in millions | ||||||||||||||||
| Year ended March 31, | 2026 v. 2025 Change | |||||||||||||||
| 2025 | 2026 | Amount | Percentage | |||||||||||||
| Sales revenues: |
||||||||||||||||
| Sales of products |
16,606,446 | 18,241,546 | 1,635,100 | 9.8 | % | |||||||||||
| Financial services |
2,693,881 | 2,838,119 | 144,238 | 5.4 | ||||||||||||
|
|
|
|
|
|
|
|
|
|||||||||
| Total |
19,300,327 | 21,079,665 | 1,779,338 | 9.2 | % | |||||||||||
|
|
|
|
|
|
|
|
|
|||||||||
| Operating costs and expenses |
19,191,519 | 21,272,219 | 2,080,700 | 10.8 | % | |||||||||||
|
|
|
|
|
|
|
|
|
|||||||||
| Operating income (loss) |
108,808 | (192,554 | ) | (301,362 | ) | — | ||||||||||
|
|
|
|
|
|
|
|
|
|||||||||
Sales revenues in North America increased due mainly to an increase in vehicle sales of 231 thousand units and the favorable impact of price revisions compared with the prior fiscal year.
Operating income in North America decreased due mainly to the expenses and others, and the impact of U.S. tariffs compared with the prior fiscal year.
83
Europe
| Thousands of units | ||||||||||||||||
| Year ended March 31, | 2026 v. 2025 Change | |||||||||||||||
| 2025 | 2026 | Amount | Percentage | |||||||||||||
| Toyota’s consolidated vehicle unit sales |
1,172 | 1,183 | 11 | 1.0 | % | |||||||||||
| Yen in millions | ||||||||||||||||
| Year ended March 31, | 2026 v. 2025 Change | |||||||||||||||
| 2025 | 2026 | Amount | Percentage | |||||||||||||
| Sales revenues: |
||||||||||||||||
| Sales of products |
5,577,646 | 5,808,718 | 231,071 | 4.1 | % | |||||||||||
| Financial services |
735,843 | 892,474 | 156,631 | 21.3 | ||||||||||||
|
|
|
|
|
|
|
|
|
|||||||||
| Total |
6,313,489 | 6,701,191 | 387,702 | 6.1 | % | |||||||||||
|
|
|
|
|
|
|
|
|
|||||||||
| Operating costs and expenses |
5,897,936 | 6,343,449 | 445,512 | 7.6 | % | |||||||||||
|
|
|
|
|
|
|
|
|
|||||||||
| Operating income |
415,553 | 357,743 | (57,810 | ) | (13.9 | )% | ||||||||||
|
|
|
|
|
|
|
|
|
|||||||||
Sales revenues in Europe increased due mainly to an increase in vehicle sales of 11 thousand units, and the favorable impacts of changes in exchange rates and price revisions compared with the prior fiscal year.
Operating income in Europe decreased due mainly to the effects of changes in exchange rates compared with the prior fiscal year.
Asia
| Thousands of units | ||||||||||||||||
| Year ended March 31, | 2026 v. 2025 Change | |||||||||||||||
| 2025 | 2026 | Amount | Percentage | |||||||||||||
| Toyota’s consolidated vehicle unit sales |
1,838 | 1,759 | (79 | ) | (4.3 | )% | ||||||||||
| Yen in millions | ||||||||||||||||
| Year ended March 31, | 2026 v. 2025 Change | |||||||||||||||
| 2025 | 2026 | Amount | Percentage | |||||||||||||
| Sales revenues: |
||||||||||||||||
| Sales of products |
8,701,501 | 8,963,111 | 261,609 | 3.0 | % | |||||||||||
| Financial services |
286,561 | 308,266 | 21,705 | 7.6 | ||||||||||||
|
|
|
|
|
|
|
|
|
|||||||||
| Total |
8,988,062 | 9,271,377 | 283,315 | 3.2 | % | |||||||||||
|
|
|
|
|
|
|
|
|
|||||||||
| Operating costs and expenses |
8,091,552 | 8,401,551 | 309,999 | 3.8 | % | |||||||||||
|
|
|
|
|
|
|
|
|
|||||||||
| Operating income |
896,510 | 869,826 | (26,684 | ) | (3.0 | )% | ||||||||||
|
|
|
|
|
|
|
|
|
|||||||||
Sales revenues in Asia increased due mainly to the favorable impact of price revisions compared with the prior fiscal year, despite a decrease in vehicle sales of 79 thousand units.
Operating income in Asia decreased due mainly to the effects of changes in exchange rates compared with the prior fiscal year.
84
Other
| Thousands of units | ||||||||||||||||
| Year ended March 31, | 2026 v. 2025 Change | |||||||||||||||
| 2025 | 2026 | Amount | Percentage | |||||||||||||
| Toyota’s consolidated vehicle unit sales |
1,659 | 1,637 | (22 | ) | (1.3 | )% | ||||||||||
| Yen in millions | ||||||||||||||||
| Year ended March 31, | 2026 v. 2025 Change | |||||||||||||||
| 2025 | 2026 | Amount | Percentage | |||||||||||||
| Sales revenues: |
||||||||||||||||
| Sales of products |
4,023,077 | 4,215,127 | 192,050 | 4.8 | % | |||||||||||
| Financial services |
498,180 | 543,866 | 45,686 | 9.2 | ||||||||||||
|
|
|
|
|
|
|
|
|
|||||||||
| Total |
4,521,257 | 4,758,993 | 237,736 | 5.3 | % | |||||||||||
|
|
|
|
|
|
|
|
|
|||||||||
| Operating costs and expenses |
4,268,632 | 4,430,028 | 161,396 | 3.8 | % | |||||||||||
|
|
|
|
|
|
|
|
|
|||||||||
| Operating income |
252,626 | 328,966 | 76,340 | 30.2 | % | |||||||||||
|
|
|
|
|
|
|
|
|
|||||||||
Sales revenues in Other increased due mainly to the favorable impact of changes in exchange rates compared with the prior fiscal year, despite a decrease in vehicle sales of 22 thousand units.
Operating income in Other increased due mainly to marketing efforts compared with the prior fiscal year.
The following is a description of changes in operating income by geographic location.
| Yen in millions | ||||||||||||||||||||
| 2026 v. 2025 Change | ||||||||||||||||||||
| Japan | North America |
Europe | Asia | Other | ||||||||||||||||
| Changes in operating income and loss: |
||||||||||||||||||||
| Effect of marketing efforts |
265,000 | 415,000 | (30,000 | ) | 65,000 | 45,000 | ||||||||||||||
| Effect of cost reduction efforts |
(145,000 | ) | 25,000 | 15,000 | 15,000 | (30,000 | ) | |||||||||||||
| Effect of changes in exchange rates |
(105,000 | ) | 25,000 | (45,000 | ) | (75,000 | ) | 5,000 | ||||||||||||
| Increase or decrease in expenses and expense reduction efforts |
(1,250,000 | ) | (865,000 | ) | (30,000 | ) | (15,000 | ) | (30,000 | ) | ||||||||||
| Other |
404,915 | 98,638 | 32,190 | (16,684 | ) | 86,340 | ||||||||||||||
|
|
|
|
|
|
|
|
|
|
|
|||||||||||
| Total |
(830,085 | ) | (301,362 | ) | (57,810 | ) | (26,684 | ) | 76,340 | |||||||||||
|
|
|
|
|
|
|
|
|
|
|
|||||||||||
Sales Revenues by Location of External Customers
| Yen in millions | ||||||||
| Year ended March 31, | ||||||||
| 2025 | 2026 | |||||||
| Japan |
7,723,171 | 7,942,616 | ||||||
| North America |
18,985,399 | 20,783,571 | ||||||
| Europe |
5,979,720 | 6,396,867 | ||||||
| Asia |
7,944,206 | 7,894,843 | ||||||
| Other* |
7,404,208 | 7,667,056 | ||||||
|
|
|
|
|
|||||
| Total |
48,036,704 | 50,684,952 | ||||||
|
|
|
|
|
|||||
| * | “Other” consists of Central and South America, Oceania, Africa and the Middle East, etc. |
85
5.B LIQUIDITY AND CAPITAL RESOURCES
Cash Flows
Based on its experiences with financial crises and the Great East Japan Earthquake, Toyota seeks to secure a sufficient level of on-hand funds, which has been defined as an amount able to cover both six months of fixed costs in the automotive business and six months of refinancing requirements in the financial services business. With this level of liquidity, we aim to ensure business continuity under any operating conditions.
Toyota has funded its cash requirements, including those relating to capital expenditures as well as its research and development activities through cash generated by operations.
In fiscal 2027, Toyota expects to sufficiently fund its cash requirements, including those relating to capital expenditures as well as its research and development activities, through cash and cash equivalents on hand, cash generated by operations and debt financing, such as the issuance of corporate bonds and borrowing. Toyota will use its funds to efficiently invest in maintenance and replacement of conventional manufacturing facilities and the introduction of new products and will focus on investment in areas contributing to strengthening competitiveness and future growth for transformation into a mobility company. See “Item 4. Information on the Company — 4.B Business Overview — Capital Expenditures and Divestitures” for information regarding Toyota’s material capital expenditures and divestitures for fiscal 2024, 2025 and 2026, and information concerning Toyota’s principal capital expenditures and divestitures currently in progress.
Toyota funds its financing programs for customers and dealers, including loans and leasing programs, through cash generated by operations and debt financing, such as the issuance of corporate bonds and borrowing, all by its sales finance subsidiaries. Toyota seeks to expand its ability to raise funds locally in markets around the world through its network of finance subsidiaries.
Net cash provided by operating activities increased by ¥1,775.9 billion to ¥5,472.9 billion for fiscal 2026, compared with ¥3,696.9 billion for fiscal 2025. The increase was primarily attributable to the ¥1,260.7 billion decrease in income taxes paid, net of refunds.
Net cash used in investing activities decreased by ¥2,669.4 billion to ¥1,520.3 billion for fiscal 2026, compared with ¥4,189.7 billion for fiscal 2025. The decrease was primarily attributable to the ¥2,064.4 billion increase in proceeds from upon maturity of public and corporate bonds compared to the prior fiscal year.
Net cash used in financing activities was ¥536.6 billion for fiscal 2026, compared with net cash provided by financing activities of ¥197.2 billion for fiscal 2025, a ¥733.8 billion change. The change was primarily attributable to the ¥1,084.3 billion increase in payments of long-term debt compared to the prior fiscal year.
For a discussion of cash flows for fiscal 2025 as compared to those for fiscal 2024, see “Item 5. Operating and Financial Review and Prospects – 5.B. Liquidity and Capital Resources” of Toyota’s Annual Report on Form 20-F for the fiscal year ended March 31, 2025.
Total capital expenditures for property, plant and equipment, including vehicles and equipment on operating leases, were ¥6,059.7 billion in fiscal 2026, remaining largely unchanged from the ¥5,991.2 billion in total capital expenditures in fiscal 2025.
Toyota expects investments in property, plant and equipment, excluding vehicles and equipment on operating leases, to be approximately ¥2,300.0 billion during fiscal 2027.
86
Consolidated Statement of Cash Flows on Non-Financial Services Businesses and Financial Services Business
| Yen in millions | ||||||||
| Year ended March 31, 2025 |
Year ended March 31, 2026 |
|||||||
| (Non-Financial Services Businesses) |
||||||||
| Cash flows from operating activities |
||||||||
| Net income |
4,294,820 | 3,376,424 | ||||||
| Depreciation and amortization |
1,413,066 | 1,472,087 | ||||||
| Share of profit (loss) of investments accounted for using the equity method |
(579,619 | ) | (542,072 | ) | ||||
| Income tax expense |
1,446,627 | 935,124 | ||||||
| Changes in operating assets and liabilities, and other |
(370,839 | ) | 744,179 | |||||
| Interest received |
363,304 | 318,422 | ||||||
| Dividends received |
617,644 | 424,816 | ||||||
| Interest paid |
(100,770 | ) | (90,538 | ) | ||||
| Income taxes paid, net of refunds |
(2,347,622 | ) | (1,159,061 | ) | ||||
|
|
|
|
|
|||||
| Net cash provided by (used in) operating activities |
4,736,610 | 5,479,380 | ||||||
|
|
|
|
|
|||||
| Cash flows from investing activities |
||||||||
| Additions to fixed assets excluding equipment leased to others |
(1,878,342 | ) | (2,119,162 | ) | ||||
| Additions to equipment leased to others |
(24,855 | ) | (33,176 | ) | ||||
| Proceeds from sales of fixed assets excluding equipment leased to others |
68,266 | 28,647 | ||||||
| Proceeds from sales of equipment leased to others |
6,035 | 7,997 | ||||||
| Additions to intangible assets |
(341,131 | ) | (365,834 | ) | ||||
| Additions to public and corporate bonds and stocks |
(3,446,017 | ) | (3,816,713 | ) | ||||
| Proceeds from sales of public and corporate bonds and stocks and upon maturity of public and corporate bonds |
3,423,102 | 5,140,628 | ||||||
| Other, net |
(618,309 | ) | 1,172,580 | |||||
|
|
|
|
|
|||||
| Net cash provided by (used in) investing activities |
(2,811,251 | ) | 14,967 | |||||
|
|
|
|
|
|||||
| Cash flows from financing activities |
||||||||
| Increase (decrease) in short-term debt |
(116,549 | ) | 3,307 | |||||
| Proceeds from long-term debt |
162,735 | 540,117 | ||||||
| Payments of long-term debt |
(306,768 | ) | (939,292 | ) | ||||
| Dividends paid to Toyota Motor Corporation common shareholders |
(1,132,329 | ) | (1,238,974 | ) | ||||
| Dividends paid to non-controlling interests |
(122,565 | ) | (120,431 | ) | ||||
| Reissuance (repurchase) of treasury stock |
(1,179,043 | ) | (39,975 | ) | ||||
| Other, net |
55,560 | 34,712 | ||||||
|
|
|
|
|
|||||
| Net cash provided by (used in) financing activities |
(2,638,959 | ) | (1,760,535 | ) | ||||
|
|
|
|
|
|||||
| Effect of exchange rate changes on cash and cash equivalents |
(88,260 | ) | 176,261 | |||||
|
|
|
|
|
|||||
| Net increase (decrease) in cash and cash equivalents |
(801,860 | ) | 3,910,073 | |||||
|
|
|
|
|
|||||
| Cash and cash equivalents at beginning of year |
6,892,817 | 6,090,957 | ||||||
|
|
|
|
|
|||||
| Net increase (decrease) in cash and cash equivalents resulting from transfer to assets held for sale |
— | (115,932 | ) | |||||
|
|
|
|
|
|||||
| Cash and cash equivalents at end of year |
6,090,957 | 9,885,097 | ||||||
|
|
|
|
|
|||||
87
| Yen in millions | ||||||||
| Year ended March 31, 2025 |
Year ended March 31, 2026 |
|||||||
| (Financial Services Business) |
||||||||
| Cash flows from operating activities |
||||||||
| Net income |
495,210 | 625,307 | ||||||
| Depreciation and amortization |
838,167 | 920,432 | ||||||
| Interest income and interest costs related to financial services, net |
(769,800 | ) | (833,480 | ) | ||||
| Share of profit (loss) of investments accounted for using the equity method |
(11,600 | ) | (10,669 | ) | ||||
| Income tax expense |
178,000 | 232,086 | ||||||
| Changes in operating assets and liabilities, and other |
(2,405,422 | ) | (1,739,575 | ) | ||||
| Interest received |
2,332,296 | 2,468,460 | ||||||
| Dividends received |
5,651 | 5,958 | ||||||
| Interest paid |
(1,531,190 | ) | (1,620,645 | ) | ||||
| Income taxes paid, net of refunds |
(153,692 | ) | (81,619 | ) | ||||
|
|
|
|
|
|||||
| Net cash provided by (used in) operating activities |
(1,022,379 | ) | (33,745 | ) | ||||
|
|
|
|
|
|||||
| Cash flows from investing activities |
||||||||
| Additions to fixed assets excluding equipment leased to others |
(28,469 | ) | (29,030 | ) | ||||
| Additions to equipment leased to others |
(2,972,065 | ) | (2,733,176 | ) | ||||
| Proceeds from sales of fixed assets excluding equipment leased to others |
2,555 | 2,595 | ||||||
| Proceeds from sales of equipment leased to others |
1,701,864 | 1,347,608 | ||||||
| Additions to intangible assets |
(13,064 | ) | (12,970 | ) | ||||
| Additions to public and corporate bonds and stocks |
(519,533 | ) | (473,958 | ) | ||||
| Proceeds from sales of public and corporate bonds and stocks and upon maturity of public and corporate bonds |
326,469 | 376,933 | ||||||
| Other, net |
89,633 | 43,662 | ||||||
|
|
|
|
|
|||||
| Net cash provided by (used in) investing activities |
(1,412,610 | ) | (1,478,336 | ) | ||||
|
|
|
|
|
|||||
| Cash flows from financing activities |
||||||||
| Increase (decrease) in short-term debt |
229,903 | (121,594 | ) | |||||
| Proceeds from long-term debt |
13,251,352 | 12,408,438 | ||||||
| Payments of long-term debt |
(10,618,851 | ) | (11,087,637 | ) | ||||
| Dividends paid to non-controlling interests |
(4,667 | ) | (4,985 | ) | ||||
| Other, net |
(4,716 | ) | (0 | ) | ||||
|
|
|
|
|
|||||
| Net cash provided by (used in) financing activities |
2,853,022 | 1,194,223 | ||||||
|
|
|
|
|
|||||
| Effect of exchange rate changes on cash and cash equivalents |
(45,829 | ) | 200,936 | |||||
|
|
|
|
|
|||||
| Net increase (decrease) in cash and cash equivalents |
372,203 | (116,923 | ) | |||||
|
|
|
|
|
|||||
| Cash and cash equivalents at beginning of year |
2,519,244 | 2,891,447 | ||||||
|
|
|
|
|
|||||
| Net increase (decrease) in cash and cash equivalents resulting from transfer to assets held for sale |
— | — | ||||||
|
|
|
|
|
|||||
| Cash and cash equivalents at end of year |
2,891,447 | 2,774,524 | ||||||
|
|
|
|
|
|||||
| (Consolidated) |
||||||||
| Effect of exchange rate changes on cash and cash equivalents |
(134,089 | ) | 377,197 | |||||
|
|
|
|
|
|||||
| Net increase (decrease) in cash and cash equivalents |
(429,656 | ) | 3,793,150 | |||||
|
|
|
|
|
|||||
| Cash and cash equivalents at beginning of year |
9,412,060 | 8,982,404 | ||||||
|
|
|
|
|
|||||
| Net increase (decrease) in cash and cash equivalents resulting from transfer to assets held for sale |
— | (115,932 | ) | |||||
|
|
|
|
|
|||||
| Cash and cash equivalents at end of year |
8,982,404 | 12,659,622 | ||||||
|
|
|
|
|
|||||
88
Financial Position
Cash and cash equivalents were ¥12,659.6 billion as of March 31, 2026. Most of Toyota’s cash and cash equivalents are held in Japanese yen or in U.S. dollars.
Liquid assets, which Toyota defines as cash and cash equivalents, time deposits, public and corporate bonds and its investment in monetary trust funds were ¥22,117.9 billion as of March 31, 2026.
Trade accounts and notes receivable, less allowance for doubtful accounts increased during fiscal 2026 by ¥116.2 billion, or 3.2%, to ¥3,795.9 billion. This increase was due mainly to an increase in the impact of changes in exchange rates.
Inventories increased during fiscal 2026 by ¥536.7 billion, or 11.7%, to ¥5,134.9 billion. This increase was due mainly to an increase in the impact of changes in exchange rates.
Total finance receivables, net increased during fiscal 2026 by ¥5,341.6 billion, or 15.9%, to ¥38,966.6 billion. This increase was due mainly to an increase in loan balance to customers and dealers. Finance receivables were geographically distributed as follows: in North America 52.2%, in Europe 15.4%, in Asia 11.4%, in Japan 10.0% and in Other 11.0%.
Other financial assets decreased during fiscal 2026 by ¥1,700.3 billion, or 10.1%. This decrease was due mainly to a decrease in public and corporate bonds.
Property, plant and equipment increased during fiscal 2026 by ¥1,733.6 billion, or 11.3%. This increase was due mainly to capital expenditures.
Accounts and notes payable increased during fiscal 2026 by ¥329.5 billion, or 6.0%. This increase was due mainly to an increase in accounts payable associated with parts procurement.
Income taxes payable increased during fiscal 2026 by ¥206.1 billion, or 40.8%. This increase was mainly due to a decrease in interim payments of income taxes.
Toyota’s total borrowings increased during fiscal 2026 by ¥4,412.5 billion, or 11.4%. Toyota’s short-term borrowings consist of loans with a weighted-average interest rate of 2.51% and commercial paper with a weighted-average interest rate of 3.15%. Short-term borrowings increased during fiscal 2026 by ¥234.6 billion, or 4.3%, to ¥5,699.0 billion. Toyota’s long-term debt mainly consists of unsecured and secured loans, unsecured notes and medium-term notes, and secured notes with weighted-average interest rates ranging from 2.91% to 7.86%, and maturity dates ranging from 2026 to 2048. The current portion of long-term debt increased during fiscal 2026 by ¥1,445.6 billion, or 14.1%, to ¥11,718.5 billion and the non-current portion increased by ¥2,554.6 billion, or 11.3%, to ¥25,076.7 billion. The increase in total borrowings resulted mainly from the increasing demand for financing associated with the increase in the loan balance at financial subsidiaries. As of March 31, 2026, approximately 47% of long-term debt was denominated in U.S. dollars, 14% in euros, 12% in Japanese yen, 5% in Australian dollars, 4% in Canadian dollars, and 18% in other currencies. Toyota hedges interest rate risk exposure of fixed-rate borrowings by entering into interest rate swaps. There are no material seasonal variations in Toyota’s borrowings requirements.
As of March 31, 2026, Toyota’s total interest-bearing debt was 108.2% of Toyota Motor Corporation shareholders’ equity, compared with 108.0% as of March 31, 2025.
89
The following table provides information on credit ratings of Toyota’s short-term borrowing and long-term debt from Standard & Poor’s Ratings Group (S&P), Moody’s Ratings (Moody’s), and Rating and Investment Information, Inc. (R&I), as of May 31, 2026. A credit rating is not a recommendation to buy, sell or hold securities. A credit rating may be subject to withdrawal or revision at any time. Each rating should be evaluated separately of any other rating.
| S&P |
Moody’s |
R&I | ||||
| Short-term borrowing |
A-1+ | P-1 | — | |||
| Long-term debt |
A+ | A1 | AAA |
Toyota’s net defined benefit liability (asset) of Japanese plans increased during fiscal 2026 by ¥23.1 billion, or 10.5%, to ¥243.7 billion. The net defined benefit liability (asset) of foreign plans increased during fiscal 2026 by ¥40.2 billion, or 11.5%, to ¥391.0 billion. The amounts of net defined benefit liability (asset) will be funded through future cash contributions by Toyota or in some cases will be settled on the retirement date of each covered employee. The increase in net defined benefit liability (asset) of the Japanese plans reflects mainly a decrease in plan assets that resulted from a partial return from retirement benefit trusts, despite a decrease in defined benefit obligations due to an increased discount rate. See note 23 to the consolidated financial statements for further discussion.
Toyota’s treasury policy is to maintain controls on all exposures, to adhere to stringent counterparty credit standards, and to actively monitor marketplace exposures. Toyota remains centralized and is pursuing global efficiency of its financial services operations through Toyota Financial Services Corporation.
The key element of Toyota’s financial strategy is maintaining a strong financial position that will allow Toyota to continue its business and fund its research and development initiatives, capital expenditures and financial services operations strategically even if earnings are subject to short-term fluctuations. Toyota believes that it maintains sufficient liquidity for its present cash requirements and that, by maintaining its high credit ratings, it will continue to be able to access funds from external sources in large amounts and at relatively low costs. In order for Toyota to maintain its high credit ratings, a number of conditions must be met, some of which are not within Toyota’s control. Such conditions include the general economic condition in Japan and the other major markets in which Toyota does business.
Toyota uses its securitization program as part of its funding through special purpose entities for its financial services operations. Toyota is considered as the primary beneficiary of these special purpose entities and therefore consolidates them. Toyota has not entered into any off-balance sheet securitization transactions during fiscal 2026.
For information regarding the amounts of non-derivative financial liabilities and derivative financial liabilities by a remaining contract maturity period, see note 20 to the consolidated financial statements. In addition, as part of Toyota’s normal business practices, Toyota enters into long-term arrangements with suppliers for purchases of certain raw materials, components and services. These arrangements may contain fixed/minimum quantity purchase requirements. Toyota enters into such arrangements to facilitate an adequate supply of these materials and services.
90
The following tables summarize Toyota’s contractual obligations and commercial commitments as of March 31, 2026.
| Yen in millions | ||||||||||||||||||||
| Payments Due by Period | ||||||||||||||||||||
Total |
Less than 1 year |
1 to 3 years |
3 to 5 years |
5 years and after |
||||||||||||||||
| Contractual Obligations: |
||||||||||||||||||||
| Short-term debt |
5,699,083 | 5,699,083 | — | — | — | |||||||||||||||
| Long-term debt* |
37,506,386 | 11,882,021 | 14,999,702 | 8,093,928 | 2,530,735 | |||||||||||||||
| Commitments for the purchase of property, plant, other assets and services (note 32) |
2,570,912 | 443,289 | 518,144 | 565,469 | 1,044,010 | |||||||||||||||
|
|
|
|
|
|
|
|
|
|
|
|||||||||||
| Total |
45,776,381 | 18,024,393 | 15,517,846 | 8,659,397 | 3,574,745 | |||||||||||||||
|
|
|
|
|
|
|
|
|
|
|
|||||||||||
| Commercial Commitments (note 32): |
||||||||||||||||||||
| Maximum potential exposure to guarantees given in the ordinary course of business |
1,553,327 | 546,125 | 791,437 | 135,278 | 80,487 | |||||||||||||||
|
|
|
|
|
|
|
|
|
|
|
|||||||||||
| Total |
1,553,327 | 546,125 | 791,437 | 135,278 | 80,487 | |||||||||||||||
|
|
|
|
|
|
|
|
|
|
|
|||||||||||
| * | “Long-term debt” represents future principal payments. |
Toyota expects to contribute ¥34,336 million domestically and ¥18,488 million overseas to its pension plans in fiscal 2027.
91
Consolidated Statement of Financial Position on Non-Financial Services Businesses and Financial Services Business
| Yen in millions | ||||||||
| March 31, 2025 | March 31, 2026 | |||||||
| Assets |
||||||||
| (Non-Financial Services Businesses) |
||||||||
| Current assets |
||||||||
| Cash and cash equivalents |
6,090,957 | 9,885,097 | ||||||
| Trade accounts and other receivable |
3,689,021 | 3,835,922 | ||||||
| Other financial assets |
6,198,376 | 3,211,041 | ||||||
| Inventories |
4,588,755 | 5,120,950 | ||||||
| Other current assets |
1,034,507 | 1,288,955 | ||||||
| Assets held for sale |
— | 2,016,804 | ||||||
|
|
|
|
|
|||||
| Total current assets |
21,601,616 | 25,358,768 | ||||||
|
|
|
|
|
|||||
| Non-current assets |
||||||||
| Property, plant and equipment, net |
9,134,857 | 9,584,748 | ||||||
| Other |
17,556,285 | 18,451,708 | ||||||
|
|
|
|
|
|||||
| Total non-current assets |
26,691,142 | 28,036,455 | ||||||
|
|
|
|
|
|||||
| Total assets |
48,292,758 | 53,395,223 | ||||||
|
|
|
|
|
|||||
| (Financial Services Business) |
||||||||
| Current assets |
||||||||
| Cash and cash equivalents |
2,891,447 | 2,774,524 | ||||||
| Trade accounts and other receivable |
410,958 | 454,168 | ||||||
| Receivables related to financial services |
11,453,249 | 13,483,501 | ||||||
| Other financial assets |
1,443,042 | 1,544,390 | ||||||
| Other current assets |
414,216 | 489,695 | ||||||
|
|
|
|
|
|||||
| Total current assets |
16,612,912 | 18,746,278 | ||||||
|
|
|
|
|
|||||
| Non-current assets |
||||||||
| Receivables related to financial services |
22,171,786 | 25,494,405 | ||||||
| Property, plant and equipment, net |
6,198,838 | 7,482,619 | ||||||
| Other |
1,787,250 | 2,018,407 | ||||||
|
|
|
|
|
|||||
| Total non-current assets |
30,157,874 | 34,995,431 | ||||||
|
|
|
|
|
|||||
| Total assets |
46,770,786 | 53,741,709 | ||||||
|
|
|
|
|
|||||
| (Elimination) |
||||||||
| Elimination of assets |
(1,462,194 | ) | (1,614,601 | ) | ||||
| (Consolidated) |
||||||||
|
|
|
|
|
|||||
| Total assets |
93,601,350 | 105,522,331 | ||||||
|
|
|
|
|
|||||
Note: Assets in non-financial services include unallocated corporate assets.
92
| Yen in millions | ||||||||
| March 31, 2025 | March 31, 2026 | |||||||
| Liabilities |
||||||||
| (Non-Financial Services Businesses) |
||||||||
| Current liabilities |
||||||||
| Trade accounts and other payables |
5,195,204 | 5,492,355 | ||||||
| Short-term and current portion of long-term debt |
1,188,430 | 976,235 | ||||||
| Accrued expenses |
1,729,279 | 2,014,207 | ||||||
| Income taxes payable |
454,252 | 654,751 | ||||||
| Other current liabilities |
3,495,075 | 3,844,179 | ||||||
| Liabilities directly associated with assets held for sale |
— | 694,547 | ||||||
|
|
|
|
|
|||||
| Total current liabilities |
12,062,240 | 13,676,274 | ||||||
|
|
|
|
|
|||||
| Non-current liabilities |
||||||||
| Long-term debt |
1,547,461 | 1,823,843 | ||||||
| Retirement benefit liabilities |
1,001,227 | 1,002,213 | ||||||
| Other non-current liabilities |
2,442,382 | 2,520,522 | ||||||
|
|
|
|
|
|||||
| Total non-current liabilities |
4,991,070 | 5,346,578 | ||||||
|
|
|
|
|
|||||
| Total liabilities |
17,053,309 | 19,022,852 | ||||||
|
|
|
|
|
|||||
| (Financial Services Business) |
||||||||
| Current liabilities |
||||||||
| Trade accounts and other payables |
674,347 | 777,916 | ||||||
| Short-term and current portion of long-term debt |
15,111,977 | 17,042,885 | ||||||
| Accrued expenses |
137,836 | 142,451 | ||||||
| Income taxes payable |
51,248 | 56,924 | ||||||
| Other current liabilities |
2,535,501 | 3,193,333 | ||||||
|
|
|
|
|
|||||
| Total current liabilities |
18,510,910 | 21,213,511 | ||||||
|
|
|
|
|
|||||
| Non-current liabilities |
||||||||
| Long-term debt |
21,515,873 | 23,904,821 | ||||||
| Retirement benefit liabilities |
18,341 | 20,271 | ||||||
| Other non-current liabilities |
1,089,654 | 1,958,944 | ||||||
|
|
|
|
|
|||||
| Total non-current liabilities |
22,623,868 | 25,884,036 | ||||||
|
|
|
|
|
|||||
| Total liabilities |
41,134,778 | 47,097,547 | ||||||
|
|
|
|
|
|||||
| (Elimination) |
||||||||
| Elimination of liabilities |
(1,465,650 | ) | (1,618,136 | ) | ||||
| (Consolidated) |
||||||||
|
|
|
|
|
|||||
| Total liabilities |
56,722,437 | 64,502,263 | ||||||
|
|
|
|
|
|||||
| Shareholders’ equity |
||||||||
|
|
|
|
|
|||||
| (Consolidated) Total Toyota Motor Corporation shareholders’ equity |
35,924,826 | 39,918,854 | ||||||
|
|
|
|
|
|||||
| (Consolidated) Non-controlling interests |
954,088 | 1,101,214 | ||||||
|
|
|
|
|
|||||
| (Consolidated) Total shareholders’ equity |
36,878,913 | 41,020,068 | ||||||
|
|
|
|
|
|||||
| (Consolidated) Total liabilities and shareholders’ equity |
93,601,350 | 105,522,331 | ||||||
|
|
|
|
|
|||||
93
Lending Commitments
Credit Facilities with Credit Card Holders
Toyota’s financial services operations issue credit cards to customers. As customary for credit card businesses, Toyota maintains credit facilities with holders of credit cards issued by Toyota. These facilities are used upon each holder’s requests up to the limits established on an individual holder’s basis. Although loans made to customers through these facilities are not secured, for the purposes of minimizing credit risks and of appropriately establishing credit limits for each individual credit card holder, Toyota employs its own risk management policy which includes an analysis of information provided by financial institutions in alliance with Toyota. Toyota periodically reviews and revises, as appropriate, these credit limits. Outstanding credit facilities with credit card holders were ¥151.6 billion as of March 31, 2026.
Credit Facilities with Dealers
Toyota’s financial services operations maintain credit facilities with dealers. These credit facilities may be used for business acquisitions, facilities refurbishment, real estate purchases and working capital requirements. These loans are typically collateralized with liens on real estate, vehicle inventory, and/or other dealership assets, as appropriate. Toyota obtains a personal guarantee from the dealer or corporate guarantee from the dealership when deemed prudent. Although the loans are typically collateralized or guaranteed, the value of the underlying collateral or guarantees may not be sufficient to cover Toyota’s exposure under such agreements. Toyota evaluates the credit facilities according to the risks assumed in entering into the credit facility. Toyota’s financial services operations also provide financing to various multi-franchise dealer organizations, referred to as dealer groups, often as part of a lending consortium, for wholesale inventory financing, business acquisitions, facilities refurbishment, real estate purchases and working capital requirements. Toyota’s outstanding credit facilities with dealers totaled ¥2,512.7 billion as of March 31, 2026.
Guarantees
See note 32 to the consolidated financial statements for further discussion.
Related Party Transactions
See note 34 to the consolidated financial statements for further discussion.
94
5.C RESEARCH AND DEVELOPMENT, PATENTS AND LICENSES
Toyota’s research and development is dedicated to capturing the increasingly diverse and sophisticated market through the development of attractive, affordable, high-quality products for customers worldwide. The intellectual property that R&D generates is a vital management resource that Toyota utilizes and protects to maximize its corporate value.
For a more detailed discussion of our research and development objectives and policies, see “Item 4. Information on the Company — 4.B Business Overview — Research and Development.”
Toyota’s research and development expenditures were approximately ¥1,522.8 billion in fiscal 2026, ¥1,326.4 billion in fiscal 2025, and ¥1,202.3 billion in fiscal 2024.
Toyota presents research and development expenditures as a supplemental measure that demonstrates the amount of research and development expenditures undertaken during the relevant reporting period. Toyota defines research and development expenditures as research and development cost, plus research and development-related expenditures that were recognized as intangible assets, less amortization expenses for such assets. This measure has limitations as an analytical tool, and you should not consider it in isolation, or as a substitute for an analysis of Toyota’s research and development cost as reported under IFRS Accounting Standards.
For details of the research and development cost recorded in the consolidated statement of income, see note 28 to the consolidated financial statements.
Toyota operates a global research and development organization with the primary goal of building automobiles that meet the needs of customers in every region of the world. In Japan, research and development operations are led by Toyota and Toyota Central Research & Development Laboratories, Inc., which works closely with Daihatsu, Hino, Toyota Auto Body Co., Ltd., Toyota Motor East Japan, Inc., and many other group companies. Overseas, Toyota has a worldwide network of technical centers as well as design and motorsports research and development centers.
Toyota established TRI in January 2016 to accelerate research and development of artificial intelligence technology, which has significant potential to support future industrial technologies. In July 2017, TRI invested $100 million to launch a venture capital fund designed to provide financing to startup companies, and is making investments in newly established promising startup companies in the four areas of artificial intelligence, robotics, autonomous mobility, and data and cloud technology. TRI successively invested another $100 million in May 2019, $150 million in June 2021 and $150 million in April 2024. In addition, in an aim to achieve carbon neutrality, TRI established a $150 million fund in June 2021 and additionally invested $150 million in April 2024.
In Japan, Toyota established a new company, Toyota Research Institute — Advanced Development (“TRI-AD”), in March 2018 to further accelerate its efforts in advanced development for automated driving technology and related technologies. Its key objectives include creating a smooth software pipeline from research to commercialization, leveraging data-handling capabilities, strengthening collaboration in development within the Toyota Group, including TRI, to accelerate development, and recruiting and employing top-level engineers globally, while cultivating and coordinating strong talent within the Toyota Group. In January 2021, TRI-AD was reorganized into Woven Planet Group comprising four companies — Woven Planet Holdings, Inc., which is responsible for decision-making for the entire group and creates new business opportunities; Woven Core, Inc., which assumed the business of TRI-AD and is responsible for the development of automated driving technologies; Woven Alpha, Inc., which is responsible for the development of new projects such as Woven City and Arene, a software platform; and Woven Capital, L.P. with a total investment value of $800 million, which invests in growth-stage companies in areas such as autonomous driving mobility, artificial intelligence, and smart city. Moreover, to bolster overseas research and development initiatives related to automated driving technology and software platforms, Toyota established Woven Planet North America (“WPNA”) in the United States and
95
Woven Planet United Kingdom in the United Kingdom, and transferred TRI’s automated driving division to WPNA in May 2022. On April 1, 2023, Woven Planet Holdings, Inc., Woven Core, Inc. and Woven Alpha, Inc. were merged and changed their name to Woven by Toyota, Inc.
Toyota also established a technical development center in Otemachi, Tokyo, Japan in October 2018 as a site for development of key IT technologies that collaborates with Woven by Toyota, as well as promotes collaboration with venture companies and creation of new value by utilizing big data.
Furthermore, Toyota Technical Center Shimoyama was established in Aichi Prefecture as a new R&D base, with partial operation in April 2019 and full operation in March 2024. Together with Toyota Technical Center, Toyota Technical Center Shimoyama develops vehicles aimed at “making ever-better cars” by bringing together members of all kinds of functions, such as vehicle planning, style, design, and evaluation, and by finding problems in vehicles while running a test course that reproduces a wide variety of severe usage environments around the world, and by repeating improvements.
The following table provides information on Toyota’s principal research and development facilities.
| Facility |
Principal Activity | |
| Japan |
||
| Toyota Technical Center |
Product planning, style, design, prototype production and vehicle evaluation | |
| Toyota Technical Center Shimoyama |
Product planning, style, design and vehicle evaluation | |
| Higashi-Fuji Technical Center |
Advanced development and advanced research | |
| Tokyo Design Research & Laboratory |
Advanced styling designs | |
| Otemachi Office |
Development of key IT technologies, creation of new values by utilizing big data and collaboration with venture companies | |
| Shibetsu Proving Ground |
Evaluation | |
| Toyota Central R&D Labs., Inc. |
Basic research | |
| Woven by Toyota, Inc. |
Development of artificial intelligence technology with a focus on automated driving technology
Development of Woven City and software platform technologies | |
| United States |
||
| Toyota Motor Engineering and Manufacturing North America, Inc. |
Product planning, design and evaluation of vehicles manufactured in North America | |
| Calty Design Research, Inc. |
Design | |
| Toyota Research Institute of North America (TRI-NA) |
Advanced research relating to “energy and environment,” “safety” and “mobility infrastructure” | |
| Toyota Research Institute, Inc. |
Research and development of artificial intelligence technology | |
| Europe |
||
| Toyota Motor Europe NV/SA |
Planning and evaluation of vehicles manufactured in Europe | |
| Toyota Europe Design Development S.A.R.L. |
Design | |
| TOYOTA RACING GmbH |
Development of motor sports vehicles | |
| * TOYOTA RACING GmbH renamed from TOYOTA GAZOO Racing Europe GmbH, effective January 7, 2026. |
||
96
| Facility |
Principal Activity | |
| TOYOTA GAZOO Racing World Rally Team Oy |
Development of motor sports vehicles | |
| Asia Pacific |
||
| Toyota Motor Asia (Thailand) Co., Ltd. |
Planning and evaluation of vehicles manufactured in Australia and Asia | |
| China |
||
| Intelligent Electro Mobility R&D Center by TOYOTA (China) Co., Ltd. |
Environmental technology design and evaluation in China | |
| FAW Toyota Motor Co., Ltd. Research & Development Branch |
Design, evaluation and certification of vehicles manufactured in China | |
| GAC Toyota Motor Co., Ltd. |
Design, evaluation and certification of vehicles manufactured in China | |
| BYD Toyota EV Technology Co., Ltd. |
Design and evaluation of BEVs | |
| Toyota Motor Technical Research and Service (Shanghai) Co., Ltd. |
Research of new technology, construction and system of automobiles | |
| United Fuel Cell System R&D (Beijing) Co., Ltd. |
Development of FC system for commercial vehicles in China | |
| Lexus Electrified Shanghai Co., Ltd. |
Design and development of Lexus BEVs | |
Toyota carefully analyzes patents and the need for patents in each area of research to formulate more effective research and development strategies. Toyota identifies research and development projects in which it should build a strong global patent portfolio.
For a further discussion of Toyota’s intellectual property, see “Item 4. Information on the Company — 4.B Business Overview — Intellectual Property.”
5.D TREND INFORMATION
For a discussion of the trends that affect Toyota’s business and operating results, see “Item 5. Operating and Financial Review and Prospects — 5.A Operating Results” and “Item 5. Operating and Financial Review and Prospects — 5.B Liquidity and Capital Resources.”
5.E CRITICAL ACCOUNTING ESTIMATES
Not applicable.
| ITEM 6. | DIRECTORS, SENIOR MANAGEMENT AND EMPLOYEES |
6.A DIRECTORS AND SENIOR MANAGEMENT
In order to advance its transition to a mobility company, Toyota has reflected on the path it has taken thus far and has formulated the “Toyota Philosophy” as a roadmap for the future. Toyota’s mission is “Producing Happiness for All” by expanding the possibilities of people, companies and communities through addressing the challenges of mobility as a mobility company. In order to do so, Toyota will continue to create new and unique value with various partners by relentlessly committing towards monozukuri (manufacturing), and by fostering imagination for people and society.
Toyota strives to provide a full lineup of products with “good quality yet affordable prices” globally at the right place at the right time, and offer products and services that are sympathetic towards customers in each country and region, through the initiative of “making even better cars” that we have been engaged in since the
97
2008 financial crisis. In order to meet these objectives, following the introduction of “region-based operations,” the “business unit system” and the “in-house company system” in 2011, 2013 and 2016, respectively, in April 2017 Toyota further clarified that, for the purpose of further accelerating decision-making and operational execution, members of the Board of Directors are responsible for decision-making and management oversight and that operating officers are responsible for operational execution. Furthermore, in 2018, Toyota changed the commencement of operating officers’ terms of office from April to January, reduced corporate strategy functions and restructured the Japan Sales Business Group based on regions rather than sales channels in an effort to enable decision-making closer to customers and the field, in order to further accelerate execution in full coordination with each site. In 2019, in order to further advance Toyota’s “acceleration of management” and the development of a diverse and talented workforce, the executive structure was changed to be composed only of senior managing officers and people of higher rank, and a new classification called “senior professional/senior management” (kanbushoku) grouped and replaced the following titles or ranks: managing officers, executive general managers, (sub-executive managerial level) senior grade 1 and senior grade 2 managers, and grand masters. From the perspective of appointing the right people to the right positions, senior professionals/senior management were positioned in a wide range of posts, from those of chief officer, deputy chief officer, plant general manager, and senior general manager to group manager, to deal with management issues as they arise and to strengthen their development as part of a diverse and talented workforce through on-site learning and problem-solving (genchi genbutsu). In April 2020, Toyota consolidated the posts of executive vice president and operating officer into the post of operating officer. In July 2020, Toyota further clarified the roles of operating officers. Members of management who, together with the president, have cross-functional oversight of the entire company, were redefined as “operating officers.” In-house company presidents, regional CEOs, and chief officers, as on-site leaders of business implementation elements, were given authority while being consolidated into the classification of “senior professional/senior management.” The roles of operating officers and senior professionals/senior management are to be determined where and as needed, and persons appointed as operating officers and senior professionals/senior management will change in accordance with the challenges faced and the path that should be taken, as Toyota exercises greater flexibility in making appointments. However, because of the rapidly changing business environment, Toyota now recognizes that there is an increasing need for such executives to fulfill management roles (related to people, goods, and money) together with our President. Therefore, in April 2022, Toyota reorganized the roles of operating officers and reestablished the position of “executive vice president,” defining it as an operating officer who is focused on the business from a management perspective. In April 2023, the role of operating officers was revised to a management team that implements “product-centered (manufacturing ever-better cars) and region-centered (best-in-town) management” under the theme of “inheritance and evolution,” and the executive vice presidents were selected upon their extensive knowledge and experience from the two pillars of products and regions. Based on its basic policy of appointing the right people to the right positions, Toyota has been swiftly and continuously innovating. Toyota will further press forward the tide of such innovations, aiming for a corporate structure capable of carrying out management from a viewpoint that is optimal for a global company.
In order to convey top management’s aspirations and Toyota’s direction to all stakeholders, Toyota communicates what Toyota is really like through “Toyota Times.”
Toyota believes that it is critical to appoint individuals who practice “product-centered and region-centered management” and contribute to decision-making aimed at sustainable growth into the future based on the “Toyota Philosophy.” Moreover, these individuals should be able to play a significant role in transforming Toyota into a “mobility company” through responding to electrification, intelligence, and diversification and external partnerships based on trust and friendship and internal two-way interactive teamwork, while working towards solutions for social challenges such as the climate change issue. Toyota maintains its Board of Directors and senior management at an adequate size, and ensures they are overall balanced and diverse, including from the perspective of gender and nationality. Five outside members of the Board of Directors have been appointed in order to further reflect the opinions of those from outside the company in management’s decision-making process. Toyota transitioned from a company with Audit & Supervisory Board to a company with Audit &
98
Supervisory Committee in June 2025. Toyota has four members of the Board of Directors who are Audit & Supervisory Committee members, three of whom are outside Audit & Supervisory Committee members.
Set forth below are brief summaries of Toyota’s members of the Board of Directors.
| Name (Date of Birth) |
Position |
Brief Career Summary and Important Concurrent Duties |
Number of Common Shares (in thousands) |
|||||
| Akio Toyoda (May 3, 1956) |
Chairman of the Board of Directors (Representative Director) |
1984 Joined TMC 2000 Member of the Board of Directors of TMC 2002 Managing Director of TMC 2003 Senior Managing Director of TMC 2005 Executive Vice President of TMC 2009 President of TMC 2023 Chairman of the Board of Directors of TMC (to present)
(important concurrent duties) Chairman of TOYOTA FUDOSAN CO., LTD. Director of DENSO Corporation (Scheduled to retire in June 2026) Representative Director of ROOKIE Racing, Inc. Chairman of TOYOTA GAZOO Racing World Rally Team |
24,099 | |||||
| Koji Sato (October 19, 1969) |
Vice Chairman of the Board of Directors (Representative Director)*1 |
1992 Joined TMC 2017 Executive General Manager of TMC 2020 Operating Officer of TMC 2021 Operating Officer of TMC (current system) 2023 Operating Officer and President of TMC President, Member of the Board of Directors and Operating Officer of TMC 2026 Vice Chairman of the Board of Directors of TMC (to present)
(important concurrent duties) Chairman of Japan Automobile Manufacturers Association, Inc. |
667 | |||||
| Hiroki Nakajima (April 10, 1962) |
Executive Vice President, Member of the Board of Directors (Representative Director), Operating Officer |
1987 Joined TMC 2014 Executive General Manager of TMC 2015 Managing Officer of TMC 2020 Operating Officer of TMC 2023 Operating Officer and Executive Vice President of TMC (current system) Member of the Board of Directors, Operating Officer, Vice President of TMC 2025 Executive Vice President, Member of the Board of Directors, Operating Officer of TMC (to present)
(important concurrent duties) President and Representative Director of Commercial Japan Partnership Technologies Corporation |
333 | |||||
99
| Name (Date of Birth) |
Position |
Brief Career Summary and Important Concurrent Duties |
Number of Common Shares (in thousands) |
|||||
| President and Representative Director of Commercial Japan Partnership Technologies Asia Co., Ltd. Chairman of TOYOTA GAZOO Racing Europe GmbH Managing Director of TOYOTA RACING GmbH |
||||||||
| Yoichi Miyazaki (October 19, 1963) |
Executive Vice President, Member of the Board of Directors (Representative Director), Operating Officer |
1986 Joined TMC 2015 Managing Officer of TMC 2019 Operating Officer of TMC 2022 Operating Officer of TMC (current system) 2023 Operating Officer and Executive Vice President of TMC Member of the Board of Directors, Operating Officer, Vice President of TMC 2025 Executive Vice President, Member of the Board of Directors, Operating Officer of TMC (to present) |
328 | |||||
| Shigeaki Okamoto (February 20, 1961) |
Outside Member of the Board of Directors |
1983 Joined the Ministry of Finance 2006 Director for the Budget Bureau, Planning and Administration Division of Budget Bureau, Ministry of Finance 2009 Head of Secretariat Division, Minister’s Secretariat, Ministry of Finance 2012 Deputy Director-General of the Budget Bureau, Ministry of Finance 2015 Deputy Vice Minister, Ministry of Finance 2017 Director-General of the Budget Bureau, Ministry of Finance 2018 Administrative Vice Minister, Ministry of Finance 2020 Retired as Administrative Vice-Minister of Finance, Ministry of Finance 2022 Deputy Chairperson of the Board of Japan Tobacco Inc. 2025 Outside Member of the Board of Directors of TMC (to present) 2026 Chairman of the Board of Japan Tobacco Inc. (to present)
(important concurrent duties) Chairman of the Board of Japan Tobacco Inc. |
2 | |||||
| Kumi Fujisawa (March 15, 1967) |
Outside Member of the Board of Directors |
1995 Founder and President of IFIS Limited Ltd. 2000 Director of Think Tank SophiaBank 2011 Public Governor of the Japan Securities Dealers Association (to present) 2012 Director of Organization for Supporting the Turnaround of Businesses Damaged by the Great East Japan Earthquake 2013 President of Think Tank SophiaBank |
0 | |||||
100
| Name (Date of Birth) |
Position |
Brief Career Summary and Important Concurrent Duties |
Number of Common Shares (in thousands) |
|||||
| 2014 Outside Director of Toyota Tsusho Corporation 2018 Outside Director of Net Protections Holdings, Inc. 2022 Chairperson of Institute for International Socio-Economic Studies (to present) 2022 Outside Director of Shizuoka Financial Group, Inc. (to present) 2024 Substitute Audit & Supervisory Board Member of TMC 2024 Outside Director of Mercari, Inc. (to present) 2025 Outside Member of the Board of Directors of TMC (to present)
(important concurrent duties) Chairperson of Institute for International Socio-Economic Studies Outside Director of Shizuoka Financial Group, Inc. Outside Director of Mercari, Inc. |
||||||||
| George Olcott (May 7, 1955) |
Outside Member of the Board of Directors who is a member of the Audit & Supervisory Committee |
1986 Joined S.G.Warburg & Co., Ltd 1999 President of UBS Asset Management (Japan) 2000 Managing Director, Equity Capital Markets, UBS Warburg Tokyo 2001 Judge Business School, University of Cambridge 2005 FME Teaching Fellow, Judge Business School, University of Cambridge 2008 Senior Fellow, Judge Business School, University of Cambridge 2022 Outside Audit & Supervisory Board Member of TMC 2025 Member of the Board of Directors who is a member of the Audit & Supervisory Committee of TMC (to present) |
5 | |||||
| Christopher P. Reynolds (January 11, 1963) |
Member of the Board of Directors who is a member of the Audit & Supervisory Committee |
1986 Law clerk for Judge Damon J. Keith, U.S. Court of Appeals for the Sixth Circuit 1987 Joined Hughes Hubbard & Reed 1989 Joined U.S. Attorney’s Office, Southern District of New York 1994 Joined Morgan, Lewis & Bockius 2007 Joined Toyota Motor Sales, U.S.A., Inc. (TMS) 2008 Group Vice President & General Counsel of TMS 2012 General Counsel of Toyota Motor North America, Inc. (TMNA) |
— | |||||
101
| Name (Date of Birth) |
Position |
Brief Career Summary and Important Concurrent Duties |
Number of Common Shares (in thousands) |
|||||
| 2015 Managing Officer of TMC (Chief Officer of General Planning Division, Deputy Chief Officer of General Administration & Human Resources Group, General Counsel and Chief Legal Officer) 2017 Executive Vice President (EVP) of TMNA 2020 Deputy Chief Risk Officer of TMC 2022 Deputy Chief Compliance Officer of TMC 2022 Independent Director of Southwest Airlines Co. (to present) 2025 Retired from TMNA 2025 Member of the Board of Directors who is a member of the Audit & Supervisory Committee of TMC (to present)
(important concurrent duties) Independent Director of Southwest Airlines Co. |
||||||||
| Masahiko Oshima (September 13, 1960) |
Outside Member of the Board of Directors who is a Member of the Audit & Supervisory Committee |
1984 Joined The Mitsui Bank Limited 2012 Executive Officer of Sumitomo Mitsui Banking Corporation (SMBC) 2014 Managing Executive Officer of SMBC 2017 Director and Managing Executive Officer of SMBC Director and Senior Managing Executive Officer of SMBC 2018 Senior Managing Corporate Executive Officer of Sumitomo Mitsui Financial Group, Inc. (SMFG) Senior Managing Executive Officer of SMBC 2019 Deputy President and Executive Officer of SMFG Director and Deputy President of SMBC 2023 Deputy Chairman of SMBC 2023 Outside Member of the Board of Directors of TMC 2024 Advisor of SMBC 2024 Outside Audit and Supervisory Board Member, TBS HOLDINGS, INC. (to present) 2024 Chairman and Representative Director, Ares Management Asia Japan KK. (to present) 2025 Member of the Board of Directors who is a member of the Audit & Supervisory Committee of TMC (to present)
(important concurrent duties) Chairman and Representative Director of Ares Management Asia Japan KK. Outside Audit and Supervisory Board Member of TBS HOLDINGS, INC. |
3 | |||||
| Hiromi Osada (June 11, 1973) |
Outside Member of the Board of Directors who is a |
1999 Joined Chunichi Shimbun Co., Ltd. |
1 | |||||
102
| Name (Date of Birth) |
Position |
Brief Career Summary and Important Concurrent Duties |
Number of Common Shares (in thousands) |
|||||
| Member of the Audit & Supervisory Committee |
2021 Editorial writer and Leader for reserve reporters in the Business News Department of Chunichi Shimbun Co., Ltd. 2023 Editorial Committee Member and International General Desk of Chunichi Shimbun Co., Ltd. 2024 Retired from Chunichi Shimbun Co., Ltd. 2024 Outside Audit & Supervisory Board Member of TMC 2025 Member of the Board of Directors who is a member of the Audit & Supervisory Committee of TMC (to present) |
|||||||
| *1 | Mr. Koji Sato, who is Vice Chairman of the Board of Directors, will retire as a member of the Board of Directors effective upon the conclusion of the Ordinary General Meeting of Shareholders scheduled to be held on June 17, 2026. |
TMC has proposed, as an agenda item for resolution at the Ordinary General Meeting of Shareholders scheduled to be held on June 17, 2026, the “Election of 6 Members of the Board of Directors (Excluding Directors who are Audit & Supervisory Committee Members).” If this proposal is approved, the following individual is expected to be appointed as a director of TMC.
| Name (Date of Birth) |
Position |
Brief Career Summary and Important Concurrent Duties |
Number of Common Shares (in thousands) |
|||||
| Kenta Kon (August 2, 1968) |
President, Member of the Board of Directors*1 |
1991 Joined TMC 2017 General Manager, Accounting Division of TMC 2018 Managing Officer of TMC Deputy Chief Officer, General Administration & Human Resources Group of TMC Deputy Chief Officer, Accounting Group of TMC 2019 Executive Vice President of Advanced R&D and Engineering Company of TMC Operating Officer of TMC Chief Officer of Accounting Group of TMC 2020 Fellow, Advanced R&D and Engineering Company of TMC Chief Financial Officer of TMC 2021 Member of the Board of Directors and Operating Officer of TMC 2022 Member of the Board of Directors, Operating Officer and Executive Vice President of TMC 2023 Member of the Board of Directors of TMC Representative Director and Chief Financial Officer of Woven by Toyota, Inc. Director and Chief Financial Officer of Woven by Toyota, Inc. |
74 | |||||
103
| Name (Date of Birth) |
Position |
Brief Career Summary and Important Concurrent Duties |
Number of Common Shares (in thousands) |
|||||
| 2025 Operating Officer of TMC In charge of Mobility 3.0 Office at TMC (to present) Chief Financial Officer of TMC 2026 Operating Officer and President of TMC Chief Executive Officer of TMC (to present) |
||||||||
| *1 | As of the date of this report, Mr. Kon is the Operating Officer and President of TMC and will remain so following the approval of the proposal at the Ordinary General Meeting of Shareholders mentioned above. Mr. Kon will also become a Representative Director following such approval. |
None of the persons listed above was selected as a member of Board of Directors, Audit & Supervisory Board Member, Audit & Supervisory Committee member or member of senior management pursuant to an arrangement or understanding with Toyota’s major shareholders, customers, suppliers or others.
6.B COMPENSATION
Decision Making Policy and Process
Toyota believes that it is critical to appoint individuals who practice “product-centered and region-centered management” and contribute to decision-making aimed at sustainable growth into the future based on the “Toyota Philosophy.” Moreover, these individuals should be able to play a significant role in transforming Toyota into a mobility company based on trust and friendship and internal two-way interactive teamwork, while working towards the solution of environmental issues, including climate change, as well as social challenges related to Toyota Motor Corporation and its value chain. Toyota’s director compensation system is an important means through which to promote various initiatives and is determined based on the following policy.
| • | It should be a system that encourages members of the Board of Directors to work to improve the medium- to long-term corporate value of Toyota. |
| • | It should be a system that can maintain compensation levels that will allow Toyota to secure and retain talented personnel. |
| • | It should be a system that motivates members of the Board of Directors to promote management from the same viewpoint as our shareholders with a stronger sense of responsibility as corporate managers. |
Toyota became a company with an Audit & Supervisory Committee based on a resolution adopted at the 121st Ordinary General Meeting of Shareholders held on June 12, 2025. By resolution of the Board of Directors held on the same day, changes were made to the policy regarding the determination of remuneration for each member of the Board of Directors prior to the transition to a company with an Audit & Supervisory Committee, including specifying that the policy applies to Board of Directors (excluding those who are Audit & Supervisory Committee members) and other modifications. However, there were no substantive changes to the policy before and after the transition to a company with an Audit & Supervisory Committee.
The Board of Directors decides by resolution the policy for determining remuneration for and other payments to each member of the Board of Directors (excluding those who are Audit & Supervisory Committee members). Remuneration is effectively linked to corporate performance while reflecting individual job responsibilities and performance. Remuneration for outside members of the Board of Directors and members of the Board of Directors who are Audit & Supervisory Committee members consists only of fixed payments. As a result, this remuneration is not readily impacted by business performance, helping to ensure independence from management.
Based on the resolution of the 121st Ordinary General Shareholders’ Meeting held on June 12, 2025 concerning remuneration for the members of the Board of Directors (excluding those who are Audit & Supervisory Committee
104
members) of Toyota, the maximum cash compensation was set at 3.0 billion yen per year (of which, the maximum amount payable to outside members of the Board of Directors is 0.3 billion yen per year). Additionally, it was further resolved that the maximum share compensation for members of the Board of Directors (excluding outside members of the Board of Directors and members of the Board of Directors who are Audit & Supervisory Committee members) was set at 4.0 billion yen per year. The number of members of the Board of Directors (excluding those who are Audit & Supervisory Committee members) upon conclusion of the 121st Ordinary General Shareholders’ Meeting was six (including two outside members of the Board of Directors).
The amount of remuneration for each member of the Board of Directors (excluding those who are Audit & Supervisory Committee members) of Toyota and the remuneration system are decided by the Board of Directors and the “Executive Compensation Meeting,” a majority of the members of which are outside members of the Board of Directors, to ensure the independence of the decision. See “Item 6. Directors, Senior Management and Employees — 6.C Board Practices” for the members of the Executive Compensation Meeting. The members of the meeting are Yoichi Miyazaki (Chairperson), Executive Vice President and a member of the Board of Directors, and Shigeaki Okamoto and Kumi Fujisawa, each an outside member of the Board of Directors.
The Board of Directors resolves the policy for determining remuneration for and other payments to each member of the Board of Directors (excluding those who are Audit & Supervisory Committee members) and the executive remuneration system. The Board of Directors also resolves to delegate the determination of the amount of remuneration for each member of the Board of Directors (excluding those who are Audit & Supervisory Committee members) for a given fiscal year to the Executive Compensation Meeting.
The Executive Compensation Meeting reviews the remuneration system for members of Board of Directors (excluding those who are Audit & Supervisory Committee members) and senior management on which it will consult with the Board of Directors and determines the amount of remuneration for each member of the Board of Directors (excluding those who are Audit & Supervisory Committee members), taking into account factors such as corporate performance as well as individual job responsibilities and performance, in accordance with the policy for determining remuneration for and other payments to each member of the Board of Directors (excluding those who are Audit & Supervisory Committee members) established by the Board of Directors. The Board of Directors considers that such decisions made by the Executive Compensation Meeting are in line with the policy for determining remuneration for and other payments to each member of the Board of Directors (excluding those who are Audit & Supervisory Committee members).
The total amount of remuneration for members of the Board of Directors who are Audit & Supervisory Committee members is set at no more than 360 million yen per year based on a resolution at the 121st Ordinary General Shareholders’ Meeting held on June 12, 2025. The number of members of the Board of Directors who are Audit & Supervisory Committee members as resolved at the Ordinary General Shareholders’ Meeting is four (including three outside members of the Board of Directors).
Remuneration for members of the Board of Directors who are Audit & Supervisory Committee members is discussed and determined by members of the Board of Directors who are Audit & Supervisory Committee members within the scope determined by resolution of the shareholders’ meeting.
Executive Compensation Meetings were held in May, July, October, November and December 2025 and January, February, March and April 2026 to discuss and determine the amount of remuneration for fiscal 2026 and other relevant matters.
Remuneration for the members of the Board of Directors (excluding those who are Audit & Supervisory Committee members) was determined with the unanimous consent of the Executive Compensation Meeting.
The principal topics discussed at Executive Compensation Meetings included:
| • | Remuneration level for each position and job responsibility |
105
| • | Evaluation of actual results of fiscal 2026 |
| • | Determination of the amount of remuneration for each member of the Board of Directors |
| * | The amount of remuneration for each outside member of the Board of Directors (excluding those who are Audit & Supervisory Committee members) and the amount of remuneration for each internal member of the Board of Directors (excluding those who are Audit & Supervisory Committee members) were determined at the Executive Compensation Meeting held in May 2025 and April 2026, respectively. |
Method of Determining Performance-based Remuneration (Bonus and Share Compensation)
Directors with Japanese Citizenship (Excluding Outside Members of the Board of Directors and Members of the Board of Directors who are Audit & Supervisory Committee Members)
Toyota sets the total amount of compensation that each member of the Board of Directors receives annually (“Annual Total Remuneration”) at an appropriate level based on position and duties by referencing compensation levels benchmarked against global companies selected based on the size of each person’s role and other factors.
Toyota makes sure that STI (short term incentive) and LTI (long term incentive) account for around 20% and 50% of the Annual Total Remuneration, respectively, and performance-based remuneration, which is STI and LTI combined, account for around 70%. STI is provided in the form of cash compensation based on “consolidated operating income,” “fluctuation of Toyota’s market capitalization*,” and “individual performance evaluation.” LTI is provided in the form of share compensation based on “multiple financial indicators,” “non-financial indicator,” and “individual performance evaluation.” In addition, there are cases where LTI may be paid in cash to retiring members of the Board of Directors (excluding outside members of the Board of Directors and members of the Board of Directors who are Audit & Supervisory Committee members) and members of the Board of Directors who do not reside in Japan (excluding outside members of the Board of Directors and members of the Board of Directors who are Audit & Supervisory Committee members).
| * | Calculated by multiplying the closing price of Toyota’s common stock on the Tokyo Stock Exchange by the number of shares issued after deducting the number of shares of treasury stock |
Composition of Compensation
| Type of Remuneration | % of Total Remuneration |
Remuneration Method |
Concept | |||
| Base compensation* | Around 30% | Cash compensation |
The percentage of total remuneration represented by LTI is designed to increase as an individual’s roles and duties become greater. | |||
| STI (Short Term Incentive) | Around 20% | Cash compensation | ||||
| LTI (Long Term Incentive) | Around 50% | Share compensation | ||||
| * | Other types of compensation such as fringe benefits and various allowances (e.g., a certain monetary payment that may be made following the retirement of a member of the Board of Directors who retires due to death, determined by taking into comprehensive consideration the role, duties, and other relevant factors of such director) may be provided to members of the Board of Directors within an appropriate range. |
106
Concept of Performance Evaluating Indicators
| STI |
Financial indicators |
(1) Consolidated operating income (single year) |
Indicator for evaluating Toyota’s efforts based on short-term business performance | |||
| (2) Fluctuation of Toyota’s market capitalization |
Corporate value indicator for shareholders and investors to evaluate Toyota’s efforts | |||||
| Individual performance evaluation | Qualitative evaluation of performance of each member of the Board of Directors | |||||
| LTI |
Financial indicators |
(3) Consolidated operating income (multiple years) | Indicator for evaluating Toyota’s medium- to long-term efforts based on business performance | |||
| (4) Total shareholder return | Corporate value indicator for shareholders and investors to evaluate Toyota’s medium- to long-term efforts | |||||
| (5) Return on equity | ||||||
| Non-financial indicator |
(6) Progress of efforts to resolve sustainability issues | Indicator for evaluating Toyota’s medium- to long-term efforts based on the degree of corporate value enhancement | ||||
| Individual performance evaluation | Qualitative evaluation of performance of each member of the Board of Directors | |||||
Method and Reference Value for Each Performance Evaluating Indicator and Evaluation Result
| STI | Evaluation Weight |
Evaluation Method | Reference Value | Evaluation Result | ||||
| (1) Consolidated operating income (single year) |
70% | Evaluate the degree of attainment of consolidated operating income of the fiscal year, using the average consolidated operating income of Toyota over the last 10 fiscal years as a reference value (set in 2023) |
2.5 trillion yen |
134% | ||||
| (2) Fluctuation of Toyota’s market capitalization |
30% | Comparatively evaluate the fluctuation of TMC’s market capitalization for the fiscal year (average from January through March), using the market capitalization of Toyota and TOPIX for the previous fiscal year (average from January through March) as reference values |
Toyota: 36.1 trillion yen
TOPIX: 2,709.83 | |||||
107
| LTI | Evaluation Weight |
Evaluation Method | Reference Value | Evaluation Result | ||||
| (3) Consolidated operating income (multiple years) |
35% | Evaluate the degree of attainment of consolidated operating income for the last three fiscal years, including the fiscal year in question, using the average consolidated operating income of Toyota over the last 10 fiscal years as a reference value (set in 2023) |
2.5 trillion yen |
130% | ||||
| (4) Total shareholder return |
17.5% | Comparatively evaluate Toyota’s total shareholder return, using the rate of change calculated by dividing the sum of the stock price of Toyota on the last day of the fiscal year and the cumulative amount of dividend per share during the period from the fiscal year that is four years before the fiscal year in question through the fiscal year in question by the stock price on the last day of the fiscal year that is five years before the fiscal year in question and the rate of change in TOPIX Net Total Return calculated in the same manner as reference values |
TOPIX: 202.2% | |||||
| (5) Return on equity |
17.5% | Comparatively evaluate Toyota’s return on equity for the fiscal year using the levels recommended by the Ito Review as reference values |
8% | |||||
| (6) Progress of efforts to resolve sustainability issues |
30% | Comprehensively evaluate quantitative and qualitative KPIs (amount of reduction in GHG emissions, indices in employee engagement, and governance, etc.) that are linked to business activities and established based on six materiality themes* |
For each KPI, principally assessed based on the average over the preceding five-year period | |||||
| * | The six key issues identified by Toyota are: (1) Expanding the Value of Mobility; (2) Safety & Reliability; (3) Coexistence of Humanity & the Earth (including carbon neutrality); (4) Supporting the Community and Employment; (5) Active Participation for All; and (6) Strong Production and Business Operation |
Concept of Individual Performance Evaluation
For the determination of Annual Total Remuneration, adjustments to individual performance evaluations are made to the amounts of the STI base amount and the LTI base amount that reflect the evaluation results of financial and non-financial indicators. The evaluation takes into account various factors, such as initiatives
108
(including the ESG perspective) based on the Toyota Philosophy and initiatives toward medium- to long-term corporate value enhancement, as well as trust from his or her peers and contribution to the promotion of human resources development. The range of adjustments based on individual performance evaluations is set within the range of 50% above or below of the STI base amount and the LTI base amount, which reflect the performance evaluation results of financial and non-financial indicators, commensurate with position and job responsibilities. The amount of performance-based remuneration for each member of the Board of Directors is calculated based on evaluation results. Given the magnitude of roles and responsibilities of the Chairman of the Board of Directors, the Vice Chairman of the Board of Directors, and the President and member of the Board of Directors, we have determined that individual remuneration is to be adjusted solely based on company-wide performance evaluations, not reflecting an individual performance evaluation.
Directors with Foreign Citizenship (Excluding Outside Members of the Board of Directors and Members of the Board of Directors who are Audit & Supervisory Committee Members)
Fixed remuneration and performance-based remuneration are set based on the remuneration levels and structures that allow Toyota to secure and retain talented personnel. Annual Total Remuneration levels as well as the percentages of fixed remuneration and performance-based remuneration in total remuneration are set, taking into account each member’s job responsibilities and the remuneration standards of the entity for which such member previously worked (application determined individually). Performance-based remuneration consists of STI and LTI as is the case with directors with Japanese citizenship (excluding outside members of the Board of Directors and members of the Board of Directors who are Audit & Supervisory Committee members). The amounts of STI and LTI change in the same manner by reflecting STI and LTI performance evaluating indicators set for directors with Japanese citizenship (excluding outside members of the Board of Directors and members of the Board of Directors who are Audit & Supervisory Committee members) and individual performance evaluation results. In addition, there are cases where Toyota provide income tax compensation for certain members of the Board of Directors in light of the difference in income tax rates with that applied to them when they were at their former affiliation.
Additional Information Regarding Share Compensation
For additional details regarding share compensation provided to Members of the Board of Directors of Toyota, see “Item 6. Directors, Senior Management and Employees — 6.E Share Ownership.”
Compensation
The aggregate amount of remuneration, including bonuses, accrued for all members of the Board of Directors (and Audit & Supervisory Board members before the transition to a company with an Audit & Supervisory Committee in June 2025) as a group by Toyota for services in all capacities was ¥4,405 million during fiscal 2026.
Toyota Motor Corporation and its subsidiaries have not set aside or accrued any amounts to provide pension, retirement or similar benefits to members of the Board of Directors (and Audit & Supervisory Board members before the transition to a company with an Audit & Supervisory Committee in June 2025) of Toyota Motor Corporation.
109
Toyota’s Annual Securities Report filed with the Kanto Local Bureau of Finance on June 10, 2026, contained the following information concerning compensation in fiscal 2026 on a consolidated basis for members of the Board of Directors and Audit & Supervisory Board members whose total compensation exceeded ¥100 million during such period:
| Compensation per Type (millions of yen) | ||||||||||||||||||||||
| Performance-based Compensation |
||||||||||||||||||||||
| Name, Position |
Classification of Company | Fixed Compensation |
Bonus | Share Compensation*1 |
Retirement Benefits |
Total Compensation |
||||||||||||||||
| Akio Toyoda, Member of the Board of Directors |
Toyota Motor Corporation | 396 | 620 | |
1,097 (368 |
) |
— | 2,113 | ||||||||||||||
| Koji Sato, Member of the Board of Directors |
Toyota Motor Corporation | 197 | 200 | |
406 |
*2 |
— | 803 | ||||||||||||||
| Hiroki Nakajima, Member of the Board of Directors |
Toyota Motor Corporation | 95 | 168 | |
213 (72 |
) |
— | 476 | ||||||||||||||
| Yoichi Miyazaki, Member of the Board of Directors |
Toyota Motor Corporation | 100 | 168 | |
213 (72 |
) |
— | 481 | ||||||||||||||
| *1 | Numbers in parentheses are the number of shares, provided in thousands of shares, rounded to the nearest 1,000 shares. |
| *2 | Share compensation will be paid in cash to Koji Sato, who will retire as the Vice Chairman of the Board of Directors upon the conclusion of the 122nd Ordinary General Shareholders’ Meeting to be held on June 17, 2026. |
The amounts above were recorded as expenses in fiscal 2026.
6.C BOARD PRACTICES
Toyota’s articles of incorporation provide that the number of members of the Board of Directors is no more than 20, and the number of members of the Board of Directors who are Audit & Supervisory Committee members is no more than seven. Shareholders elect the members of the Board of Directors at the general shareholders’ meeting. The normal term of office of members of the Board of Directors (excluding members of the Board of Directors who are Audit & Supervisory Committee members) is one year, and that of members of the Board of Directors who are Audit & Supervisory Committee members is two years. Members of the Board of Directors may serve any number of consecutive terms.
The Board of Directors may appoint one Chairman of the Board of Directors and one President, as well as one or more Vice Chairmen of the Board and Executive Vice Presidents. The Board of Directors elects, pursuant to its resolutions, one or more Representative Directors. Each Representative Director represents Toyota generally in the conduct of its affairs. The Board of Directors has the ultimate responsibility for the administration of Toyota’s affairs. None of Toyota’s members of the Board of Directors is party to a service contract with Toyota or any of its subsidiaries that provides for benefits upon termination of employment.
Under the provisions of the Companies Act, if Toyota decides the terms of an agreement promising that Toyota will compensate a member of the Board of Directors for all or part of certain expenses incurred by the member of the Board of Directors, such a decision must be made by a resolution of the Board of Directors. Under the provisions of the Companies Act, if Toyota decides the terms of an insurance agreement to be executed with an insurer, under which a member of the Board of Directors is the insured, and which promises that the insurer will compensate for damage arising from the member of the Board of Directors being held liable in relation to the execution of his or her duties or from a liability claim filed against the member of the Board of Directors, such decision must be made by a resolution of the Board of Directors.
Under the Companies Act and Toyota’s articles of incorporation, Toyota may, by a resolution of its Board of Directors, exempt members of the Board of Directors (including former members of the Board of Directors)
110
from their liabilities to Toyota arising in connection with their failure to execute their duties within the limits stipulated by laws and regulations. In addition, Toyota may enter into a liability limitation agreement with each member of the Board of Directors (excluding executive members of the Board of Directors, among others) which limits the maximum amount of their liabilities owed to Toyota arising in connection with their failure to execute their duties to an amount equal to the minimum liability limit amount prescribed in the laws and regulations.
Under the Companies Act, Toyota must have at least three members of the Board of Directors who are Audit & Supervisory Committee members. A majority of the members of the Board of Directors who are Audit & Supervisory Committee members are required to be “outside” members of the Board of Directors, which is any person who satisfies all of the following requirements:
| (a) | A person who is not, and has never been during the ten year period before becoming an outside member of the Board of Directors, an executive director (a member of the Board of Directors who engages in the execution of business), executive officer, manager or employee (collectively, “Executive Director, etc.”) of Toyota or its subsidiaries; |
| (b) | if a person was a member of the Board of Directors, accounting advisor (in the case that an accounting advisor is a legal entity, a member of such entity who is in charge of its affairs) or Audit & Supervisory Board member (excluding those who have ever been Executive Directors, etc.) of Toyota or any of its subsidiaries at any time during the ten year period before becoming an outside member of the Board of Directors, such person who has not been an Executive Director, etc. of Toyota or any of its subsidiaries during the ten year period before becoming a member of the Board of Directors, accounting counselor or Audit & Supervisory Board member; and |
| (c) | a person who is not a spouse or relative within the second degree of kinship of a member of the Board of Directors, manager, or other key employee of Toyota. |
A member of the Board of Directors who is an Audit & Supervisory Committee member may not concurrently act as an executive member of the Board of Directors, manager, or other employees of Toyota or its subsidiary, or accounting advisor (if the accounting advisor is a corporation, the member who is in charge of its affairs) or an executive officer of Toyota or any of its subsidiaries. Audit & Supervisory Committee members have the duty to examine the financial statements and business reports which are submitted by the Board of Directors to the general shareholders’ meeting. The Audit & Supervisory Committee members also audit the execution of duties of Toyota’s members of the Board of Directors. Audit & Supervisory Committee members are not required to be, and Toyota’s Audit & Supervisory Committee members are not, certified public accountants.
Toyota does not have a remuneration committee. However, members of Toyota’s Executive Compensation Meeting discuss remuneration for members of the Board of Directors.
The Executive Compensation Meeting reviews the remuneration system for members of the Board of Directors and senior management and determines the amount of remuneration for each member of the Board of Directors, taking into account factors such as corporate performance as well as individual job responsibilities and performance. The members of the meeting are Yoichi Miyazaki (Chairperson), a member of the Board of Directors, and Shigeaki Okamoto and Kumi Fujisawa, each an outside member of the Board of Directors.
111
6.D EMPLOYEES
The total number of Toyota employees, on a consolidated basis, was 390,927 as of March 31, 2026, 383,853 as of March 31, 2025, and 380,793 as of March 31, 2024. The following tables set forth a breakdown of persons employed by business segment and by geographic location as of March 31, 2026.
| Segment |
Number of |
Location |
Number of | |||
| Automotive |
343,952 | Japan | 207,137 | |||
| Financial services |
16,222 | North America | 65,411 | |||
| All other |
23,934 | Europe | 24,741 | |||
| Unallocated |
6,819 | Asia | 66,331 | |||
| Other* | 27,307 | |||||
|
|
| |||||
| Total |
390,927 | Total |
390,927 | |||
|
|
| |||||
* “Other” consists of Central and South America, Oceania, Africa and the Middle East. | ||||||
Most regular employees of Toyota Motor Corporation and its consolidated subsidiaries in Japan, other than management, are required to become members of the labor unions that compose the Federation of All Toyota Workers’ Unions. Approximately 87% of Toyota Motor Corporation’s regular employees in Japan are members of this union.
In Japan, basic wages and other working conditions are negotiated annually. In addition, in accordance with Japanese national custom, each employee is also paid a semi-annual bonus. Bonuses are negotiated at the time of wage negotiations and are based on Toyota’s financial results, prospects and other factors. In fiscal 2026, the wage raises and bonuses were at the level demanded by the labor union.
In general, Toyota considers its labor relations with all of its workers to be good. However, Toyota is currently a party to, and otherwise from time to time experiences, labor disputes in some of the countries in which it operates. Toyota does not expect any disputes to which it is currently a party to materially affect Toyota’s consolidated financial position.
Toyota’s average number of temporary employees on a consolidated basis was 99,032 during fiscal 2026.
6.E SHARE OWNERSHIP
For information on the number of shares of Toyota’s common stock held by each member of the Board of Directors as of June 2026, see “Item 6. Directors, Senior Management and Employees — 6.A Directors and Senior Management.”
None of Toyota’s shares of common stock entitles the holder to any preferential voting rights. As of March 31, 2026, Toyota does not have any stock option plan for which stock options or stock acquisition rights are exercisable or will become exercisable in the future.
112
Toyota’s Board of Directors resolves the restricted share compensation within the maximum restricted share compensation amount of 4.0 billion yen per year (also, the total number of Toyota’s shares of common stock to be allotted shall not exceed a maximum of 4 million shares per year in total for members of the Board of Directors (excluding outside members of the Board of Directors and members of the Board of Directors who are Audit & Supervisory Committee members; “Eligible Members”)) established at the 121st Ordinary General Shareholders’ Meeting held on June 12, 2025. The overview of the share compensation is as follows.
| Eligible Persons |
Members of the Board of Directors of TMC (excluding Outside Members of the Board of Directors and Audit & Supervisory Committee Members) and Operating Officers of TMC who do not also serve as a member of the Board of Directors
and
Members of the board of directors of certain subsidiaries of TMC (excluding outside members of the board of directors and audit & supervisory committee members) and operating officers of certain subsidiaries of TMC who do not also serve as a member of the board of directors | |
| Total amount of the share compensation |
Maximum of 4.0 billion yen per year (the Eligible Members of the Board of Directors will make an in-kind contribution of all monetary claims granted within the said amount to receive delivery of the common stock to be issued or disposed of for the allotment) | |
| Amount of the share compensation payable to each member of the Board of Directors |
Set each year considering factors such as corporate results, duties, and performance | |
| Type of shares to be allotted and method of allotment |
Issue or disposal of common stock (with transfer restrictions under an allotment agreement) | |
| Total number of shares to be allotted |
Maximum of 4,000,000 shares per year in total to the Eligible Members of the Board of Directors (Provided, however, that if a stock split, including a gratis allotment, or a reverse stock split of Toyota’s common stock is carried out after June 12, 2025, or in case of events that otherwise require an adjustment to the total number of Toyota’s shares of common stock to be issued or disposed of as restricted share compensation, such total number of shares will be adjusted to a reasonable extent.) | |
| Amount to be paid |
Determined by the Board of Directors of TMC based on the closing price of TMC’s common stock on the Tokyo Stock Exchange on the business day prior to each resolution of the Board of Directors, within a range that is not particularly advantageous to the Eligible Members of the Board of Directors | |
| Transfer restriction period |
A period of three to fifty years from the allotment date, which is determined by the Board of Directors of TMC in advance |
113
| Conditions for removal of transfer restrictions |
Members of the Board of Directors of TMC (excluding Outside Members of the Board of Directors and Audit & Supervisory Committee Members) and Operating Officers of TMC who do not also serve as a member of the Board of Directors:
Restrictions will be removed upon the expiration of the transfer restriction period.
However, restrictions on all of the allotted shares which the Eligible Person has will also be removed in the case of resignation from the position of member of the Board of Directors or an operating officer who does not also serve as a member of the Board of Directors of TMC due to expiration of the term of office, death, or other legitimate reasons. | |
| Members of the board of directors of certain subsidiaries of TMC (excluding outside members of the board of directors and audit & supervisory committee members) and operating officers of certain subsidiaries of TMC who do not also serve as a member of the board of directors:
Restrictions will be removed upon the expiration of the transfer restriction period.
However, restrictions on all of the allotted shares which the Eligible Person has will also be removed in the case of resignation from all of the following positions due to expiration of the term of office or other legitimate reasons: member of the board of directors of a subsidiary of TMC, operating officer of a subsidiary of TMC who does not also serve as a director, or member of the Board of Directors of TMC or Operating Officer of TMC who does not also serve as a member of the Board of Directors. | ||
| Gratis acquisition by Toyota |
TMC will naturally acquire at no cost all of the allotted shares for which the transfer restrictions have not been lifted at the time of the expiration of the transfer restriction period, or at the time of the lifting of the transfer restrictions stipulated. Other grounds for gratis acquisition shall be stipulated by the allocation contract of the restricted stock based on a resolution of the Board of Directors of TMC. |
If an Eligible Member of the Board of Directors does not reside in Japan at the time of receiving an allotment of restricted shares, Toyota may grant restricted share units instead of the restricted shares above to relieve the recipients from the burden of compliance with laws and regulations in their country of residence and tax disadvantages. The only conditions different from Toyota’s restricted share compensation plan are that the delivery of common shares will be upon the expiration of a period equivalent to the transfer restriction period and that in the event of the death of an Eligible Member of the Board of Directors, it will be a payment of money to the successors of members of the Board of Directors of Toyota in lieu of an issuance of common shares. Both the restricted share compensation plan and the restricted share unit plan shall be managed together within the total amount of share compensation applicable.
In some cases, share compensation for a retiring Eligible Member of the Board of Directors may be allotted to them without any transfer restrictions. In addition, share compensation may be paid in cash to a retiring Eligible Member of the Board of Directors or an Eligible Member of the Board of Directors who does not reside in Japan.
Toyota also has an employee stock ownership association in Japan for employees and full time and part time company advisors. Members of the employee stock ownership association set aside certain amounts from their monthly salary and bonuses to purchase Toyota’s common stock through the employee stock ownership
114
association. As of March 31, 2026, the employee stock ownership association held 68,566,067 shares of Toyota’s common stock.
On March 24, 2025, the Board of Directors resolved to introduce a share-based compensation plan using an employee stock ownership plan trust structure (the “ESOP Trust”) for employees in “Senior Professional / Senior Management (Kanbushoku)” positions who satisfy certain requirements (the “Eligible Employees”). The following table provides a summary of the ESOP Trust.
| Category |
Details | |
| Trust type |
A money trust other than an individually-operated designated money trust (third party benefit trust) | |
| Trust purpose |
To provide incentives to Eligible Employees | |
| Settlor |
TMC | |
| Trustees |
Mitsubishi UFJ Trust and Banking Corporation (Co-trustee: The Master Trust Bank of Japan, Ltd.) | |
| Beneficiaries |
Eligible Employees satisfying the beneficiary requirements | |
| Trust administrator |
A third party that does not have any interest in TMC (certified public accountant) | |
| Trust agreement date |
August 25, 2025 | |
| Trust period |
From August 25, 2025 to August 31, 2026 | |
| Exercise of voting rights |
The trustee will exercise the voting rights of TMC shares by following the instructions of the trust administrator that reflect the exercise of voting rights by the beneficiary candidates. | |
| Type of acquired shares |
Common stock of TMC | |
| Amount of trust money |
1.5 billion yen (includes trust fees and trust expenses) | |
| Method of acquisition of shares |
Acquisition from TMC (disposition of treasury stock) | |
| Timing of acquisition of shares |
August 28, 2025 | |
| Holders of vested rights |
TMC | |
| Residual assets |
Residual assets that can be received by TMC, as the beneficiary, shall be limited to the trust expense reserve, calculated by deducting the cost for acquiring shares from trust money. | |
No shares have been granted under the ESOP Trust.
6.F DISCLOSURE OF A REGISTRANT’S ACTION TO RECOVER ERRONEOUSLY AWARDED COMPENSATION
None.
ITEM 7. MAJOR SHAREHOLDERS AND RELATED PARTY TRANSACTIONS
7.A MAJOR SHAREHOLDERS
As of March 31, 2026, 15,794,987,460 shares of Toyota’s common stock (of which 2,761,055,486 shares were treasury stock and 13,033,931,974 shares were outstanding) were issued.
Subsequent to March 31, 2026, pursuant to the written resolution in lieu of a resolution of the Board of Directors dated June 3, 2025, the resolution of the Board of Directors dated January 14, 2026, and the written
115
resolution in lieu of a resolution of the Board of Directors dated March 30, 2026, Toyota conducted a tender offer to repurchase shares of its common stock from existing shareholders, pursuant to which Toyota repurchased 1,192,330,962 shares of its common stock at 3,067 yen per share, for an aggregate purchase price of approximately 3.65 trillion yen, during the period from March 31, 2026 to April 27, 2026. The repurchased shares became treasury shares upon repurchase. Toyota has announced that, pursuant to a written resolution dated June 3, 2025 in lieu of a resolution of the Board of Directors, it will retire 1,200,000,000 shares of its common stock held as treasury shares on June 30, 2026, representing approximately 7.6% of the total number of shares issued as of March 31, 2026. Under the Financial Instruments and Exchange Law, any person who becomes, beneficially and solely or jointly, a holder, including, but not limited to, a deemed holder who manages shares for another holder pursuant to a discretionary investment agreement, of more than 5% of the total issued shares of a company listed on a Japanese stock exchange (including American Depositary Shares, or ADSs, representing such shares) must file a report concerning the shareholding with the director of the relevant local finance bureau. A similar report must be filed, with certain exceptions, if the percentage of shares held by a holder, solely or jointly, of more than 5% of the total issued shares of a company increases or decreases by 1% or more, or if any change to a material matter set forth in any previously filed reports occurs.
Based on information known to Toyota or that can be ascertained from public filings, the following table sets forth the beneficial ownership of holders of 5% or more of Toyota’s common stock as of March 31, 2026. Information concerning beneficial ownership of Toyota’s common stock in the table below was prepared from information known to Toyota or that could be ascertained from public filings, including filings made by Toyota’s shareholders regarding their ownership of Toyota’s common stock under the Financial Instruments and Exchange Law of Japan.
| Name of Beneficial Owner |
Number of Shares of Common Stock (in thousands) |
Percentage of Outstanding Voting Shares of Common Stock |
||||||
| Toyota Industries Corporation* |
1,192,331 | 9.17 | ||||||
| * | Subsequently, pursuant to the written resolution in lieu of a resolution of the Board of Directors dated June 3, 2025, the resolution of the Board of Directors dated January 14, 2026, and the written resolution in lieu of a resolution of the Board of Directors dated March 30, 2026, Toyota conducted a tender offer to repurchase shares of its common stock from existing shareholders, pursuant to which Toyota repurchased 1,192,330,962 shares of its common stock at 3,067 yen per share, for an aggregate purchase price of approximately 3.65 trillion yen, during the period from March 31, 2026 to April 27, 2026. As a result of Toyota Industries Corporation having tendered its Toyota shares of common stock in Toyota’s tender offer, on May 25, 2026, the commencement date of the settlement of such tender offer, the number of Toyota shares of common stock held by Toyota Industries Corporation decreased to 1,242,720 (representing 0.1% of the outstanding shares of Toyota common stock as of March 31, 2026). |
According to The Bank of New York Mellon, depositary for Toyota’s ADSs (the “Depositary”), as of March 31, 2026, 355,369,125 shares of Toyota’s common stock were held in the form of ADSs and there were 1,679 ADS holders of record and 915,350 beneficial owners in the United States. According to Toyota’s register of shareholders, as of March 31, 2026, there were 1,272,096 holders of common stock of record worldwide. As of March 31, 2026, there were 723 record holders of Toyota’s common stock with addresses in the United States, whose shareholdings represented approximately 12.1% of the issued common stock on that date. Because some of these shares were held by brokers or other nominees, the number of record holders with addresses in the United States might not fully show the number of beneficial owners in the United States.
None of Toyota’s shares of common stock entitles the holder to any preferential voting rights.
To the extent known to Toyota, Toyota is not owned or controlled, directly or indirectly, by another corporation, any foreign government or any natural or legal person.
116
Toyota knows of no arrangements the operation of which may at a later time result in a change of control.
7.B RELATED PARTY TRANSACTIONS
Business Relationships
Toyota purchases materials, supplies and services, among others, from numerous suppliers throughout the world in the ordinary course of business, including Toyota’s associates and joint ventures accounted for by the equity method and those firms with which certain members of Toyota’s Board of Directors are affiliated. Toyota purchased materials, supplies and services, among others, from these associates and joint ventures in the amount of ¥14,239.5 billion in fiscal 2026. Toyota also sells its products and services, among others, to Toyota’s associates and joint ventures accounted for by the equity method and firms with which certain members of Toyota’s Board of Directors are affiliated. Toyota sold products and services, among others, to these associates and joint ventures in the amount of ¥4,095.3 billion in fiscal 2026. See note 34 of Toyota’s consolidated financial statements for additional information regarding Toyota’s investments in and transactions with associates and joint ventures.
Loans
Toyota regularly has trade accounts and other receivables by, and accounts payable to, Toyota’s associates and joint ventures accounted for by the equity method and firms with which certain members of Toyota’s Board of Directors are affiliated. Toyota had outstanding trade accounts and other receivables by these associates and joint ventures in the amount of ¥706.3 billion as of March 31, 2026. Toyota had outstanding trade accounts and other payables to these associates and joint ventures in the amount of ¥1,865.0 billion as of March 31, 2026.
Toyota, from time to time, provides short- to medium-term loans to its associates and joint ventures, as well as loans under a loan program established by certain subsidiaries to assist their executives and members of the Board of Directors with the purchase of homes. As of March 31, 2026, an aggregate amount of ¥57.8 billion in loans was outstanding to its associates and joint ventures accounted for by the equity method. Toyota believes that each of these loans was entered into in the ordinary course of business.
7.C INTERESTS OF EXPERTS AND COUNSEL
Not applicable.
ITEM 8. FINANCIAL INFORMATION
8.A CONSOLIDATED STATEMENTS AND OTHER FINANCIAL INFORMATION
| 1-3. | Consolidated Financial Statements. Toyota’s audited consolidated financial statements are included under “Item 18 — Financial Statements.” Except for Toyota’s consolidated financial statements included under Item 18, no other information in this annual report has been audited by Toyota’s auditors. |
| 4. | Not applicable. |
| 5. | Not applicable. |
| 6. | Export Sales. See “Item 5. Operating and Financial Review and Prospects — 5.A Operating Results — Overview — Geographic Breakdown.” |
| 7. | Legal and Arbitration Proceedings. See “Item 4. Information on the Company — 4.B Business Overview — Legal Proceedings.” |
| 8. | Dividend Information. |
117
Toyota normally pays dividends twice per year, including an interim dividend and a year-end dividend. Toyota’s articles of incorporation provide that retained earnings can be distributed as dividends pursuant to a resolution of its Board of Directors. Toyota’s Board of Directors resolves to pay year-end dividends to holders of common stock and registered pledgees of common stock of record as of March 31, the record date, in each year.
In addition to these year-end dividends, Toyota may pay an interim dividend in the form of cash distributions from its distributable surplus to holders of common stock and pledgees of common stock of record as of September 30, the record date, in each year by a resolution of its Board of Directors.
In addition, under the Companies Act, dividends may be paid to holders of common stock and pledgees of record of common stock as of any record date, other than those specified above, as set forth in Toyota’s articles of incorporation or as determined by its Board of Directors from time to time. Under the Companies Act, dividends may be distributed in cash or (except in the case of interim dividends mentioned in the third preceding paragraph) in kind, subject to limitations on distributable surplus and to certain other conditions.
The following table sets forth the dividends declared per share of common stock by Toyota for each of the periods shown. The periods shown are the six months ended on that date. The U.S. dollar equivalents for the cash dividends shown are based on the noon buying rate for Japanese yen on the last date of each period set forth below.
| Cash Dividends per Common Share |
||||||||
| Period Ended |
Yen | U.S. dollars | ||||||
| September 30, 2023 |
30.0 | 0.20 | ||||||
| March 31, 2024 |
45.0 | 0.30 | ||||||
| September 30, 2024 |
40.0 | 0.28 | ||||||
| March 31, 2025 |
50.0 | 0.33 | ||||||
| September 30, 2025 |
45.0 | 0.30 | ||||||
| March 31, 2026 |
50.0 | 0.31 | ||||||
Toyota deems improving shareholder returns as one of its priority management policies, and it will continue to work to improve its corporate culture to realize sustainable growth in order to enhance its corporate value. Toyota will strive for the stable and continuous increase of dividends.
With a view to surviving tough competition and transitioning to a mobility company, Toyota will aim to utilize its internal funds mainly for investment in growth for the next generation, such as environmental technologies to achieve a carbon-neutral society and safety technologies for the safety and security of its customers, and also for the stakeholders such as employees, business partners and local communities.
Considering these factors, with respect to the dividends for fiscal 2026, Toyota determined to pay a year-end dividend of 50 yen per share of common stock by a resolution of the Board of Directors pursuant to Toyota’s articles of incorporation. As a result, combined with the interim dividend of 45 yen per share of common stock, the annual dividend was 95 yen per share of common stock, and the total amount of the dividends on common stock for the year was 1,238.2 billion yen.
Furthermore, pursuant to the written resolution in lieu of a resolution of the Board of Directors dated June 3, 2025, the resolution of the Board of Directors dated January 14, 2026, and the written resolution in lieu of a resolution of the Board of Directors dated March 30, 2026, Toyota conducted a tender offer to repurchase shares of its common stock from existing shareholders, pursuant to which Toyota repurchased 1,192,330,962 shares of its common stock at 3,067 yen per share, for an aggregate purchase price of approximately 3.65 trillion yen, during the period from March 31, 2026 to April 27, 2026. The repurchased shares became treasury shares upon repurchase. Toyota has announced that, pursuant to a written resolution dated June 3, 2025 in lieu of a resolution
118
of the Board of Directors, it will retire 1,200,000,000 shares of its common stock held as treasury shares on June 30, 2026, representing approximately 7.6% of the total number of shares issued as of March 31, 2026.
Toyota intends to repurchase shares flexibly by taking into consideration the price level of its common stock and other factors and to utilize share repurchases to respond to requests for the sale of Toyota’s shares as needed.
8.B SIGNIFICANT CHANGES
Except as disclosed in this annual report, there have been no significant changes since the date of Toyota’s latest annual financial statements.
ITEM 9. THE OFFER AND LISTING
9.A LISTING DETAILS
Shares of Toyota common stock are traded on the Prime Market of the Tokyo Stock Exchange and the Nagoya Stock Exchange under the ticker symbol “7203” in Japan, and on the London Stock Exchange under the ticker symbol “TYT.” Toyota’s ADSs, each representing ten shares of Toyota common stock, are listed on the New York Stock Exchange, or NYSE, under the ticker symbol “TM.”
9.B PLAN OF DISTRIBUTION
Not applicable.
9.C MARKETS
The primary trading market for Toyota’s common stock is the Prime Market of the Tokyo Stock Exchange. The common stock is also listed on the Nagoya Stock Exchange and on the London Stock Exchange.
Since September 29, 1999, American Depositary Shares, each equal to ten shares of Toyota’s common stock, have been traded and listed on the New York Stock Exchange through a sponsored ADS facility operated by The Bank of New York Mellon, as Depositary. Prior to that time, Toyota’s ADSs were listed on the Nasdaq SmallCap Market through five unsponsored ADS facilities.
9.D SELLING SHAREHOLDERS
Not applicable.
9.E DILUTION
Not applicable.
9.F EXPENSES OF THE ISSUE
Not applicable.
ITEM 10. ADDITIONAL INFORMATION
10.A SHARE CAPITAL
Toyota’s authorized number of shares as of March 31, 2026 was 50,000,000,000 shares, of which 15,794,987,460 shares of common stock have been issued. Subsequent to March 31, 2026, pursuant to a written resolution dated June 3, 2025 in lieu of a resolution of the board of directors, Toyota has announced that it will retire 1,200,000,000 shares of its common stock held as treasury shares on June 30, 2026, representing approximately 7.6% of the total number of shares as of March 31, 2026.
119
10.B MEMORANDUM AND ARTICLES OF ASSOCIATION
Except as otherwise stated, set forth below is information relating to Toyota’s common stock, including brief summaries of the relevant provisions of Toyota’s articles of incorporation and share handling regulations, as currently in effect, and of the Companies Act, Act Concerning Book-Entry Transfer of Corporate Bonds, Shares and Other Securities and related legislation.
General
Toyota does not issue share certificates for its shares. In accordance with the Companies Act, the Book- Entry Transfer Act and Toyota’s articles of incorporation, Toyota’s common stock are recorded or registered on (i) Toyota’s register of shareholders and (ii) transfer account books of the Japan Securities Depository Center, Inc. (“JASDEC”) which is a book-entry transfer institution, and securities firms, banks or other account management institutions. The transfer of common stock will generally become effective once the transfer is recorded in the transferee’s account. There are no restrictions imposed by Toyota’s articles of incorporation or share handling regulations on the transfer of common stock. In order to assert shareholders’ rights against Toyota, a shareholder must generally have his or her name and address recorded or registered on Toyota’s register of shareholders. A holder of common stock can assert minority shareholders’ rights (shareholders’ rights for which Toyota has not set a record date) against Toyota if JASDEC provides an individual shareholder notice to Toyota upon the shareholder’s request. The shareholder of deposited shares underlying the ADSs is the Depositary for the ADSs. Accordingly, holders of ADSs will not be able directly to assert shareholders’ rights.
A holder of common stock must have a transfer account to transfer shares. Holders of common stock who do not have a transfer account with JASDEC must have an account with an account management institution that directly or indirectly has a transfer account with JASDEC. Once Toyota decides on the record date for its shareholders’ meeting or makes a request to JASDEC based on justifiable grounds, JASDEC will promptly provide to Toyota names, addresses and other information with respect to the holders of Toyota’s common stock who are recorded on the transfer account books of JASDEC or account management institutions. Upon receiving such information, Toyota will record or register such information received from JASDEC on its register of shareholders. Accordingly, holders of common stock recorded or registered on Toyota’s register of shareholders will be treated as holders of common stock of Toyota and may exercise rights, such as voting rights, and will receive dividends (if any) and notices to holders of common stock directly from Toyota. Holders of common stock wishing to assert minority shareholders’ rights against Toyota must request an individual shareholder notice to JASDEC or the account management institution at which the shareholder has opened a transfer account. In response to such request, JASDEC will provide the individual shareholders notice to Toyota. A holder of common stock may assert his or her minority shareholders’ rights against Toyota for a period of four weeks after the date the individual shareholder notice is provided to Toyota. The shares held by a person who is deemed to hold additional shares according to the transfer account books are aggregated for these purposes.
Corporate Purpose
Article 2 of Toyota’s articles of incorporation states that its purpose is to engage in the following businesses:
| • | the manufacture, sale, leasing and repair of: |
| • | motor vehicles, industrial vehicles, ships, aircraft, other transportation machinery and apparatus, spacecraft and space machinery and apparatus, and parts thereof; |
| • | industrial machinery and apparatus, other general machinery and apparatus, and parts thereof; |
| • | electrical machinery and apparatus, and parts thereof; and |
| • | measuring machinery and apparatus, medical machinery and apparatus, and parts thereof; |
| • | the manufacture and sale of ceramics and products of synthetic resins, and materials thereof; |
120
| • | the manufacture, sale and repair of construction materials and equipment, furnishings and fixtures for residential buildings; |
| • | the planning, designing, supervision, execution and undertaking of construction works, civil engineering works, land development, urban development and regional development; |
| • | the sale, purchase, leasing, brokerage and management of real estate; |
| • | the service of information processing, information communications and information supply and the development, sale and leasing of software; |
| • | the design and development of product sales systems that utilize networks such as the Internet, sale, leasing and maintenance of computers included within such systems, and sale of products by utilizing such systems; |
| • | the inland transportation, marine transportation, air transportation, stevedoring, warehousing and tourism businesses; |
| • | the printing, publishing, advertising and publicity, general leasing, security and workers dispatch businesses; |
| • | the credit card operations, purchase and sale of securities, investment consulting, investment trust operation, and other financial services; |
| • | the operation and management of such facilities as parking lots, showrooms, educational facilities, medical care facilities, sports facilities, marinas, airfields, food and drink stands and restaurants, lodging facilities, retail stores and others; |
| • | the non-life insurance agency business and the life insurance agency business; |
| • | the production and processing by using biotechnology of agricultural products including trees, and the sale of such products; the power generation and the supply and sale of electric power; |
| • | the sale of goods related to each of the preceding items and mineral oil; |
| • | the conducting of engineering, consulting, invention and research relating to each of the preceding items and the utilization of such invention and research; and |
| • | any businesses incidental to or related to any of the preceding items. |
Dividends
Dividends — General
Toyota normally pays dividends twice per year, including an interim dividend and a year-end dividend. Toyota’s articles of incorporation provide that retained earnings can be distributed as dividends pursuant to a resolution of its Board of Directors. Toyota’s Board of Directors resolves to pay year-end dividends to shareholders and registered pledgees of record as of March 31, the record date, in each year.
In addition to these year-end dividends, Toyota may pay an interim dividend in the form of cash distributions from its distributable surplus to holders of stock and pledgees of stock of record as of September 30, the record date, in each year by a resolution of its Board of Directors.
In addition, under the Companies Act, dividends may be paid to shareholders and pledgees of record as of any record date, other than those specified above, as set forth by Toyota’s articles of incorporation or as determined by its Board of Directors from time to time. Under the Companies Act, dividends may be distributed in cash or (except in the case of interim dividends mentioned in the second preceding paragraph) in kind, subject to limitations on distributable surplus and to certain other conditions.
121
Dividends — Distributable Amount
Under the Companies Act, Toyota is permitted to make distributions of surplus to the extent that the aggregate book value of the assets to be distributed to shareholders does not exceed the distributable amount provided for by the Companies Act and the ordinance of the Ministry of Justice as at the effective date of such distribution of surplus.
The amount of surplus at any given time shall be the amount of Toyota’s assets and the book value of Toyota’s treasury stock after subtracting and adding the amounts of items provided for by the Companies Act and the ordinance of the Ministry of Justice, and the amount of surplus distributable for dividends is calculated by adding to and subtracting from this amount the amounts of items provided for by the Companies Act and the ordinance of the Ministry of Justice.
Dividends — Prescription
Under its articles of incorporation, Toyota is not obligated to pay any dividends in cash which are left unclaimed for a period of three years after the date on which they first became payable.
Capital Accounts
The amount of the cash or assets paid or contributed by subscribers for new shares (with certain exceptions) is required to be accounted for as stated capital, although Toyota may account for an amount not exceeding one-half of such cash or assets as additional paid-in capital.
Under the Companies Act, Toyota may reduce its additional paid-in capital and legal reserve without limitation on the amount to be reduced, generally, by a resolution of a general shareholders’ meeting and if so decided by the same resolution, may account for the whole or any part of the amount of the reduction of additional paid-in capital as stated capital. The whole or any part of surplus which may be distributed as dividends may also be transferred to stated capital by a resolution of a general shareholders’ meeting.
Stock Splits
Toyota may at any time split the outstanding shares into a greater number of shares by a resolution of the Board of Directors. Toyota must give public notice of the stock split, specifying a record date for the stock split, not less than two weeks prior to the record date.
Consolidation of Shares
Toyota may at any time consolidate shares in issue into a smaller number of shares by a special shareholders resolution (as defined in “Voting Rights”). When a consolidation of shares is to be made, Toyota must give public notice of certain matters two weeks prior to the effective date of the consolidation.
Japanese Unit Share System
General. Consistent with the requirements of the Companies Act, Toyota’s articles of incorporation provide that 100 shares constitute one “unit.” Although the number of shares constituting a unit is included in the articles of incorporation, any amendment to the articles of incorporation reducing (but not increasing) the number of shares constituting a unit or eliminating the provisions for the unit of shares may be made by a resolution of the Board of Directors rather than by a special shareholders resolution, which is otherwise required for amending the articles of incorporation.
Voting Rights under the Unit Share System. Under the unit share system, shareholders have one voting right for each unit of shares that they hold. Any number of shares less than a full unit will carry no voting rights.
122
Purchase by Toyota of Shares Constituting Less Than a Unit. A holder of shares constituting less than a full unit may require Toyota to purchase those shares at their market value in accordance with the provisions of Toyota’s share handling regulations and the Companies Act.
Voting Rights
Toyota holds its ordinary general shareholders’ meeting each year. In addition, Toyota may hold an extraordinary general shareholders’ meeting whenever necessary by giving at least two weeks’ advance notice. Under the Companies Act, notice of any shareholders’ meeting must be given to each shareholder having voting rights or, in the case of a non-resident shareholder, to his or her resident proxy or mailing address in Japan in accordance with Toyota’s share handling regulations, at least two weeks prior to the date of the meeting.
Under the Companies Act, Toyota shall implement the electronic provision measures (“Electronic Provision”) for the information contained in the reference materials, etc. for general shareholders’ meetings.
The convocation notice of shareholders’ meeting must set forth the information contained in the reference materials, etc. for general shareholders’ meetings being provided through the Electronic Provision and the URL of the website used for the Electronic Provision, in addition to the place, the time and the purpose of the meeting. The information contained in the reference materials, etc. for general shareholders’ meetings must be posted on a website from the earlier of the date three weeks prior to the date set for the meeting or the date on which the convocation notice of shareholders’ meeting is dispatched until the date on which three months have elapsed from the meeting. In general, any shareholder is entitled to request printed paper copies of the information contained in the reference materials, etc. for general shareholders’ meetings by the record date for voting rights at the relevant general shareholders’ meeting.
Holders of common stock shall have voting rights exercisable at a general shareholders’ meeting. A holder of shares constituting one or more whole units is entitled to one vote per unit of shares subject to the limitations on voting rights set forth in this paragraph. In general, under the Companies Act, a resolution can be adopted at a general shareholders’ meeting by a majority of the shares having voting rights represented at the meeting. The Companies Act and Toyota’s articles of incorporation require a quorum for the election of members of the Board of Directors of not less than one-third of the total number of outstanding shares having voting rights. Toyota’s shareholders are not entitled to cumulative voting in the election of members of the Board of Directors. A corporate shareholder, the management of which is substantially under Toyota’s control as provided by an ordinance of the Ministry of Justice, either through the holding of voting rights or for any other reason, does not have voting rights.
Shareholders may exercise their voting rights by attending the general shareholders’ meeting or in writing by mail or through the internet. Shareholders who choose to exercise their voting rights by mail must fill out and return to Toyota the voting right exercise form enclosed with the convocation notice of the general shareholders’ meeting by the date specified in such convocation notice. Shareholders electing to exercise their voting rights through the internet must log on to the “Website to Exercise Voting Rights” using the login ID and temporary password provided in the voting right exercise form enclosed with the convocation notice and submit their votes by a date specified in the convocation notice, following instructions appearing on the website. Institutional investors may also use the Electronic Proxy Voting Platform operated by Investor Communications Japan to exercise their voting rights through the use of the Internet, if such institutional investor applies to use the platform in advance. Shareholders may also exercise their voting rights through proxies, provided that those proxies are also shareholders who have voting rights. Toyota may refuse a shareholder having two or more proxies attend a general shareholders’ meeting.
123
The Companies Act and Toyota’s articles of incorporation provide that a quorum of at least one-third of outstanding shares with voting rights must be present at a shareholders’ meeting to approve any material corporate actions such as:
| (1) | any amendment of the articles of incorporation with certain exceptions in which a shareholders’ resolution is not required; |
| (2) | acquisition of its own shares from a specific party; |
| (3) | consolidation of shares; |
| (4) | any issue or transfer of its shares at a “specially favorable” price (or any issue of stock acquisition rights or bonds with stock acquisition rights at “specially favorable” conditions by Toyota) to any persons other than shareholders; |
| (5) | the removal of an Audit & Supervisory Committee member; |
| (6) | the exemption of liability of a member of the Board of Directors with certain exceptions; |
| (7) | a reduction of stated capital which meets certain requirements with certain exceptions; |
| (8) | a distribution of in-kind dividends which meets certain requirements; |
| (9) | dissolution, merger, or consolidation with certain exceptions in which a shareholders’ resolution is not required; |
| (10) | the transfer of the whole or a material part of the business; |
| (11) | the transfer in entirety or in part of shares or equity interest of a subsidiary under certain conditions; |
| (12) | the taking over of the entire business of any other corporation with certain exceptions in which a shareholders’ resolution is not required; |
| (13) | share exchange or share transfer for the purpose of establishing 100% parent-subsidiary relationships with certain exceptions in which a shareholders’ resolution is not required; |
| (14) | company split with certain exceptions in which a shareholders’ resolution is not required; or |
| (15) | share delivery with certain exceptions in which a shareholders’ resolution is not required. |
At least two-thirds of the shares having voting rights represented at the meeting must approve these actions.
The voting rights of holders of ADSs are exercised by the Depositary based on instructions from those holders.
Rights to be Allotted Shares
Shareholders have no preemptive rights under Toyota’s articles of incorporation. Under the Companies Act, the Board of Directors may, however, determine that shareholders shall be given rights to be allotted shares or stock acquisition rights on request in connection with a particular issue or transfer of shares, or issue of stock acquisition rights, respectively. In this case, such rights must be given on uniform terms to all shareholders as of a specified record date by at least two weeks’ prior public notice to shareholders of the record date.
Rights to be allotted shares are nontransferable. However, a shareholder may be allotted stock acquisition rights without consideration thereto, and may transfer such rights.
124
Liquidation Rights
In the event of a liquidation of Toyota, the assets remaining after payment of all debts, liquidation expenses and taxes will be distributed among the shareholders or registered pledgees in proportion to the respective number of shares they own.
Liability to Further Calls or Assessments
All of Toyota’s currently outstanding shares, including shares represented by the ADSs, are fully paid and nonassessable.
Transfer Agent
Mitsubishi UFJ Trust and Banking Corporation is the transfer agent for all shares. Mitsubishi UFJ Trust and Banking Corporation’s office is located at 4-5, Marunouchi 1-chome, Chiyoda-ku, Tokyo, 100-8212 Japan. Mitsubishi UFJ Trust and Banking Corporation maintains Toyota’s register of shareholders and records transfers of record ownership (in the case of common stock, upon receiving notification from JASDEC).
Record Date
The close of business on March 31 is the record date for Toyota’s year-end dividends, if paid. A holder of shares constituting one or more whole units who is recorded or registered as a holder on Toyota’s register at the close of business as of March 31 is also entitled to exercise shareholders’ voting rights at the ordinary general shareholders’ meeting with respect to the business year ending on March 31. The close of business on September 30 of each year is the record date for interim dividends, if paid. In addition, Toyota may set a record date for determining the shareholders entitled to other rights and for other purposes by giving at least two weeks’ prior public notice.
The shares generally trade ex-dividend or ex-rights on the Japanese stock exchanges on the business day preceding a record date (or if the record date is not a business day, one business day prior thereto), for the purpose of dividends or rights offerings.
Acquisition by Toyota of Shares
Toyota may acquire its own shares (i) through a stock exchange on which such shares are listed or by way of tender offer (pursuant to an ordinary resolution of a general shareholders’ meeting or a resolution of the Board of Directors), (ii) by purchase from a specific party (pursuant to a special resolution of a general shareholders’ meeting) or (iii) from a subsidiary of Toyota (pursuant to a resolution of the Board of Directors). When such acquisition of shares is made by Toyota from a specific party other than a subsidiary of Toyota, any other shareholder may make a demand to a representative director, more than five calendar days prior to the relevant shareholders’ meeting, that Toyota also purchase the shares held by such holder. However, the acquisition of its own shares at a price not exceeding the market price to be provided under an ordinance of the Ministry of Justice will not trigger the right of any shareholder to include him/her as the seller of his/her shares in such proposed purchase.
Any acquisition of shares must satisfy certain requirements that the total amount of the acquisition price may not exceed the amount of the distributable dividends. See “Item 10. Additional Information — 10.B Memorandum and Articles of Association — Dividends.”
125
Shares acquired by Toyota may be held by it for any period or may be cancelled by resolution of the Board of Directors. Toyota may also transfer to any person the shares held by it, subject to a resolution of the Board of Directors, and subject also to other requirements applicable to the issuance of new shares. Toyota may also utilize its treasury stock for the purpose of transfer to any person upon exercise of stock acquisition rights or for the purpose of acquiring another company by way of merger, share exchange or corporate split through exchange of treasury stock for shares or assets of the acquired company.
The Companies Act generally prohibits any subsidiary of Toyota from acquiring shares of Toyota.
Report of Substantial Shareholdings
The Financial Instruments and Exchange Law of Japan and regulations under the Law require any person who has become a holder (together with its related persons) of more than 5% of the total issued shares of a company listed on any Japanese stock exchange (including ADSs representing such shares) to file with the Director of a competent Local Finance Bureau, within five business days, a report concerning those shareholdings. A similar report must also be filed to reflect any change of 1% or more in any shareholding or any change in material matters set out in reports previously filed. Any such report shall be filed with the Director of a competent Local Finance Bureau through the Electronic Disclosure for Investor’s Network (“EDINET”) system. For this purpose, shares issuable to a shareholder upon exercise of stock acquisition rights are taken into account in determining both the number of shares held by that stock acquisition rights holder and the company’s total issued shares.
10.C MATERIAL CONTRACTS
All material contracts concluded by Toyota during the two years preceding this filing were entered into in the ordinary course of business.
10.D EXCHANGE CONTROLS
The following is a general summary of major Japanese foreign exchange control regulations applicable to holders of shares of capital stock or voting rights (including ADSs) of Toyota, and to others intending to consummate other actions such as obtaining consent from other investors holding voting rights and consenting to certain proposals at a general shareholders meeting, who are “exchange non-residents” or “foreign investors,” as described below. The statements regarding Japanese foreign exchange control regulations set forth below are based on the laws and regulations in force and as interpreted by the Japanese authorities as of the date of this annual report and are subject to subsequent changes in the applicable Japanese laws or interpretations thereof. This summary is not exhaustive of all possible foreign exchange control considerations that may apply to a particular investor, and potential investors are advised to satisfy themselves as to the overall foreign exchange control consequences of the acquisition, ownership and disposition of shares of capital stock or voting rights of Toyota by consulting their own advisors.
The Foreign Exchange and Foreign Trade Act of Japan (Act No. 228 of 1949, as amended, the “FEFTA”) and the cabinet orders and ministerial ordinances thereunder (collectively, the “Foreign Exchange Regulations”) govern the acquisition and holding of shares of capital stock and voting rights of Toyota by “exchange non-residents” and by “foreign investors.” The Foreign Exchange Regulations currently in effect do not, however, affect transactions between exchange non-residents to purchase or sell shares outside Japan using currencies other than Japanese yen.
Exchange non-residents are:
| (i) | individuals who do not reside in Japan; and |
| (ii) | corporations whose principal offices are located outside Japan. |
126
Generally, branches and other offices of non-resident corporations that are located within Japan are regarded as residents of Japan. Conversely, branches and other offices of Japanese corporations located outside Japan are regarded as exchange non-residents.
Foreign investors are:
| (i) | individuals who are exchange non-residents; |
| (ii) | corporations or other organizations that are organized under the laws of foreign countries or whose principal offices are located outside of Japan; |
| (iii) | Japanese corporations of which 50% or more of their total voting rights are held directly or indirectly by individuals who are exchange non-residents and/or corporations or other organizations falling within (i) and/or (ii) above; |
| (iv) | partnerships under the Civil Code of Japan (Act No. 89 of 1896, as amended) established to invest in corporations, limited partnerships for investment under the Limited Partnership Act for Investment of Japan (Act No. 90 of 1998, as amended), or any other similar partnerships under foreign law, of which (a) 50% or more of the total contributions are made by individuals and/or corporations falling within (i), (ii), (iii) above and/or (v) below or any other persons prescribed under the Foreign Exchange Regulations or (b) a majority of the general partners are individuals and/or corporations falling within (i), (ii), (iii) above and/or (v) below or any other persons prescribed under the Foreign Exchange Regulations; and |
| (v) | corporations or other organizations, a majority of whose officers, or officers having the power of representation, are individuals who are exchange non-residents. |
Acquisition of Shares
In general, the acquisition of shares of a Japanese company (such as the shares of capital stock of Toyota) by an exchange non-resident from a resident of Japan is not subject to any prior filing requirements (other than those relating to an “inward direct investment” set out below). In certain limited circumstances, however, the Minister of Finance may require prior approval of an acquisition of this type. While prior approval, as described above, is not required in general, in the case where a resident of Japan transfers shares of a Japanese company (such as the shares of capital stock of Toyota) for consideration exceeding ¥100 million to an exchange non-resident, the resident of Japan who transfers the shares is required to report the transfer to the Minister of Finance within 20 days from the date of the transfer or the date of receipt of payment, whichever comes later, unless (i) the transfer was made through a bank or financial instruments business operator licensed or registered under Japanese law or other entity prescribed by the Foreign Exchange Regulations acting as an agent or intermediary or (ii) the acquisition constitutes an “inward direct investment” described below.
Inward Direct Investment in Shares of Listed Companies
On May 8, 2020, an amendment to the Foreign Exchange Regulations came into effect. Upon the full implementation of the Amendment as of June 7, 2020, the requirements and procedures regarding the prior notifications of inward direct investments to the Minister of Finance and any other competent Ministers under the FEFTA, were amended. Additionally, a partial amendment to the Foreign Exchange Regulations was promulgated on April 4, 2025, and the amendments became effective and applicable on May 19, 2025. As a result, Japanese listed companies are classified into the following categories:
| (i) | companies engaged in businesses excluding certain businesses designated by the Foreign Exchange Regulations as designated businesses (the “Designated Businesses”); |
| (ii) | companies engaged in Designated Businesses other than the Designated Business designated by the Foreign Exchange Regulations as core sector businesses (the “Non-Core Sector Designated Businesses”); |
127
| (iii) | companies engaged in Designated Businesses designated by the Foreign Exchange Regulations as core sector businesses (the “Core Sector Designated Businesses”) (excluding companies in (iv) below); and |
| (iv) | companies that are “Specified Essential Infrastructure Service Provider” under the Economic Security Promotion Act (Act on the Promotion of Ensuring National Security through Integrated Implementation of Economic Measures) and engage in businesses that fall within the core business (the “Specified Core Business Operators”). |
For reference purposes only, the Minister of Finance publishes, and may update from time to time, a list that classifies Japanese listed companies into the above categories. According to the list published by the Minister of Finance as of July 15, 2025, the businesses which are currently engaged in by Toyota are classified as category (iii) i.e., the Core Sector Designated Businesses above.
Definition of Inward Direct Investment
If a foreign investor acquires shares or voting rights of a Japanese company that is listed on a Japanese stock exchange (such as the shares of capital stock of Toyota) and, as a result of the acquisition, the foreign investor, in combination with any existing holdings, directly or indirectly holds 1% or more of the issued shares or the total number of voting rights of the relevant company, such acquisition constitutes an “inward direct investment.” In addition, an acquisition of the authority to exercise, or instruct to exercise, voting rights held by other shareholders that results in the foreign investor, in combination with any existing shareholding, directly or indirectly holding 1% or more of the total number of voting rights of the relevant company constitutes an “inward direct investment.” Furthermore, if a foreign investor manages, on a discretionary basis, shares or voting rights of a Japanese company that is listed on a Japanese stock exchange and in combination with any existing management, directly or indirectly manages 1% or more of the issued shares or the total number of voting rights of the relevant company, such discretionary investment management generally constitutes an “inward direct investment.”
In addition to the acquisitions of shares or voting rights described above, if a foreign investor (i) is granted the authority to exercise proxy voting rights on behalf of other shareholders of the relevant company regarding certain matters which may control substantially or have a material influence on the management of such company, such as the election or removal of directors, or (ii) obtains consent from another foreign investor holding the voting rights of the relevant company to exercise the voting rights of such company jointly, and, in each case, as a result of these arrangements, the number of the voting rights directly or indirectly held by the foreign investor, including the total number of the voting rights subject to such proxy, or the sum of the number of the voting rights directly or indirectly held by the foreign investor and such other foreign investors subject to such joint voting agreement, as the case may be, is 10% or more of the total number of voting rights of the relevant company, each such arrangement regarding voting rights (hereinafter referred to as a “voting arrangement”) also constitutes an “inward direct investment.” Additionally, if a foreign investor who directly or indirectly holds 1% or more of the total voting rights of a Japanese listed company consents, at a general meeting of shareholders, to certain proposals having a material influence on the management of such company such as (i) election of such foreign investor or its related persons (as defined in the Foreign Exchange Regulations) as directors or Audit & Supervisory Board members of the relevant company or (ii) transfer or discontinuation of its business, such consent will also constitute an “inward direct investment.”
Prior Notification Requirements
If a foreign investor intends to consummate an “inward direct investment” as described above, in certain circumstances, such as where the foreign investor is in a country that is not listed on an exemption schedule in the Foreign Exchange Regulations or where that Japanese company is engaged (as Toyota is currently) in one or more Designated Businesses, prior notification of the relevant inward direct investment must be filed with the Minister of Finance and any other competent Ministers.
128
However, a foreign investor seeking to consummate an “inward direct investment” may be eligible for the exemptions, if certain conditions are met.
In the case of an acquisition (including discretionary investment management) of shares or voting rights or the authority to exercise, directly or through instructions, voting rights of a Japanese listed company that is engaged (as Toyota is currently) in one or more Core Sector Designated Businesses, the foreign investor may be exempted from the prior notification requirement, if, as a result of such acquisition, the foreign investor directly or indirectly holds less than 10% of the total number of issued shares or voting rights of the relevant company, and such foreign investor complies with the following conditions:
| (i) | the foreign investor or its closely-related persons (as defined in the Foreign Exchange Regulations) will not become directors or Audit & Supervisory Board members of the relevant company; |
| (ii) | the foreign investor will not make certain proposals (as prescribed in the Foreign Exchange Regulations) at a general meeting of shareholders, including transfer or discontinuation of the Designated Businesses of the relevant company; |
| (iii) | the foreign investor will not access non-public technical information in relation to the Designated Businesses of the relevant company, or take certain other actions that may lead to the leak of such non-public technical information (as prescribed in the Foreign Exchange Regulations); |
| (iv) | the foreign investor will not attend, and will not cause any persons designated by it to attend, meetings of the relevant company’s Board of Directors, or meetings of committees having authority to make important decisions, in respect of the Core Sector Designated Businesses of the relevant company; |
| (v) | the foreign investor will not make, and will not cause any persons designated by it to make, proposals to such board or committees or their members in writing or electronic form requesting any response or actions by certain deadlines in respect of the Core Sector Designated Businesses of the relevant company; |
If a foreign investor who is not themselves a “Specified Foreign Investor” (as defined below) under the Foreign Exchange Regulations is deemed to be an equivalent entity to a Specified Foreign Investor (an entity obligated to cooperate in information gathering activities of a foreign government pursuant to a contract with a foreign government or pursuant to laws and regulations of a foreign country (“Specified Foreign Investor”)), then such foreign investor may be exempted from the prior notification requirement if they meet conditions (vi) and (vii) below in addition to conditions (i) through (v) above:
| (vi) | the foreign investor will not knowingly obtain non-public information regarding the relevant company’s Core Sector Designated Businesses nor otherwise engage in certain acts (as prescribed in the Foreign Exchange Regulations) that may result in leakage of other non-public information. |
| (vii) | the foreign investor will not serve as an employee or other personnel of the relevant company in relation to its Core Sector Designated Business, nor cause any of its closely related parties (as defined under the Foreign Exchange Regulations) to serve as an employee or other personnel of the relevant company at the foreign investor’s direction. Furthermore, the foreign investor will not solicit any officer, employee or other personnel of the relevant company to work for itself or for any third party. |
However, if a person equivalent to a Specified Foreign Investor acquires (including in cases of discretionary investment management) shares or voting rights or the authority to exercise, directly or through directions, voting rights of a Japanese listed company engaged in one or more Core Sector Designated Businesses which qualifies as a Specified Core Business Operator, such person equivalent to a Specified Foreign Investor is not permitted to use the exemption described above under any circumstances.
In addition, in the case of an acquisition (including investment discretionary management) of shares or voting rights or the authority to exercise, either directly or through instructions, voting rights of a Japanese listed company that is engaged in one or more Non-Core Sector Designated Businesses, the foreign investor may be
129
exempted from the prior notification requirement, including in the case where, as a result of such acquisition, the foreign investor holds 10% or more of the total number of issued shares or the total number of voting rights of the relevant company, which would have required prior notification, if such foreign investor complies with the conditions (i) through (iii) above (the “Exemption Conditions”).
Notwithstanding the above, if a foreign investor falls under a category of disqualified investors designated by the Foreign Exchange Regulations (including (a) investors who have records of certain sanctions due to violations of the FEFTA, (b) certain investors who are state-owned enterprises or other related entities excluding those who are accredited by the Minister of Finance, and (c) above-mentioned Specified Foreign Investors prescribed in the Foreign Exchange Regulations), in no event may such foreign investor be eligible for the exemptions described above. On the other hand, if a foreign investor, excluding the disqualified investors described in the foregoing sentence, falls under a category of certain foreign financial institutions (as prescribed in the Foreign Exchange Regulations) and complies with the Exemption Conditions, such foreign investor may be eligible for the exemptions, even if the acquisition results in such foreign investor’s directly or indirectly holding 10% or more of the total number of issued shares or voting rights of a corporation engaged in one or more Core Sector Designated Businesses.
In addition, if a foreign investor intends to make a voting arrangement with respect to a Japanese listed company engaged one or more Designated Businesses or consents to a proposal at a general meeting of shareholders of such company, in each case, that constitutes an “inward direct investment” as described above, in certain circumstances, prior notification of the relevant inward direct investment must be filed with the Minister of Finance and any other competent Ministers. However, the exemptions from the prior notification requirements may be available in the cases where the relevant voting arrangement is regarding matters other than certain matters which may control substantially or have a material influence on the management of the relevant company, such as the election or removal of directors, which would have required prior notification.
Acquisitions of shares by foreign investors by way of stock split are not subject to the foregoing notification requirements.
Procedures for Prior Notification
If such prior notification is filed, the proposed inward direct investment may not be consummated until after 30 days have passed from the date of filing, although this screening period may be shortened to two weeks unless such Ministers deem it necessary to review the proposed inward direct investment. The Ministers may extend the screening period up to five months if they deem it necessary to review the proposed inward direct investment and may recommend any modification or abandonment of the proposed inward direct investment and, if the foreign investor does not accept such recommendation, the Ministers may order the modification or abandonment of such inward direct investment. In addition, if the Ministers consider the proposed inward direct investment to be an inward direct investment that is likely to cause damage to the national security of Japan and, if a foreign investor (i) consummates such inward direct investment without filing the prior notification described above; consummates such inward direct investment before the expiration of the screening period described above; in connection with such inward direct investment, makes false statements in the prior notification described above; or (ii) does not follow the recommendation or order issued by the Ministers to modify or abandon such inward direct investment, the Ministers may order such foreign investor to dispose of all or part of the shares acquired or take other measures.
Post Facto Reporting Requirements
A foreign investor who consummates an inward direct investment as described above relating to a Japanese listed company that is engaged in one or more Designated Businesses, but is not subject to the prior notification requirements described above due to the exemptions from such prior notification requirements, in general, must file a report of the relevant inward direct investment with the Minister of Finance and any other competent Ministers having jurisdiction over such Japanese company within 45 days of such inward direct investment
130
when, as a result of such acquisition, the foreign investor (excluding, in the cases of (i) and (ii) below, a foreign investor who falls under a category of certain foreign financial institutions (as prescribed in the Foreign Exchange Regulations)) directly or indirectly holds (i) 1% or more but less than 3% of the total number of issued shares or voting rights, for the first time, (ii) 3% or more but less than 10% of the total number of issued shares or voting rights, for the first time, or (iii) 10% or more of the total number of issued shares or voting rights.
In addition, if a foreign investor consummates the inward direct investment described above through the acquisition (including investment discretionary management) of shares or voting rights or the authority to exercise, directly or through instructions, voting rights of a Japanese listed company that is not engaged in the Designated Businesses (which is not subject to the prior notification requirements described above) and, as a result of such acquisition, such foreign investor holds 10% or more of shares or voting rights of the total number of issued shares or voting rights of the relevant company, such foreign investor must file a report of the relevant inward direct investment with the Minister of Finance and any other competent Ministers having jurisdiction over such Japanese company within 45 days of such inward direct investment.
Additionally, if a foreign investor consummates the inward direct investment described above through a voting arrangement with respect to a Japanese listed company that is not engaged in the Designated Businesses (which is not subject to the prior notification requirements described above), such foreign investor must file a report of the relevant inward direct investment with the Minister of Finance and any other competent Ministers having jurisdiction over such Japanese company within 45 days of such inward direct investment.
Acquisitions of shares by foreign investors by way of stock split are not subject to the foregoing notification requirements.
Dividends and Proceeds of Sale
Under the Foreign Exchange Regulations, dividends paid on, and the proceeds of sales in Japan of, shares held by non-residents of Japan may in general be converted into any foreign currency and repatriated abroad. Under the terms of the deposit agreement pursuant to which Toyota’s ADSs are issued, the Depositary is required, to the extent that in its judgment it can convert yen on a reasonable basis into dollars and transfer the resulting dollars to the United States, to convert all cash dividends that it receives in respect of deposited shares into dollars and to distribute the amount received (after deduction of applicable withholding taxes) to the holders of ADSs.
10.E TAXATION
The following discussion is a general summary of the material U.S. federal income and Japanese national tax consequences of the acquisition, ownership and disposition of shares of common stock or ADSs. This summary does not purport to address all material tax consequences that may be relevant to holders of shares of common stock or ADSs, and does not take into account the specific circumstances of any particular investors, some of which (such as tax-exempt entities, banks, insurance companies, broker-dealers, traders in securities that elect to use a mark-to-market method of accounting for their securities holdings, regulated investment companies, real estate investment trusts, partnerships and other pass-through entities, investors liable for U.S. alternative minimum taxes, investors that own or are treated as owning 10% or more of Toyota’s stock (by vote or value), investors that hold shares of common stock or ADSs as part of a straddle, hedge, conversion transaction or other integrated transaction and U.S. Holders (as defined below) whose functional currency is not the U.S. dollar) may be subject to special tax rules. This summary is based on the tax laws and regulations of the United States and Japan, judicial decisions, published rulings and administrative pronouncements all as in effect on the date hereof, as well as on the current income tax convention between the United States and Japan (the “Treaty”), as described below, all of which are subject to change (possibly with retroactive effect), and to differing interpretations.
131
For purposes of this discussion, a “U.S. Holder” is any beneficial owner of shares of common stock or ADSs that, for U.S. federal income tax purposes, is:
| 1. | an individual who is a citizen or resident of the United States; |
| 2. | a corporation (or other entity taxable as a corporation for U.S. federal income tax purposes) organized in or under the laws of the United States, any state thereof, or the District of Columbia; |
| 3. | an estate the income of which is subject to U.S. federal income tax without regard to its source; or |
| 4. | a trust that is subject to the primary supervision of a U.S. court and the control of one or more U.S. persons (as defined in Section 7701(a)(30) of the Internal Revenue Code of 1986, as amended (the “Code”)), or that has a valid election in effect under applicable Treasury regulations to be treated as a U.S. person. |
An “Eligible U.S. Holder” is a U.S. Holder that:
| 1. | is a resident of the United States for purposes of the Treaty; |
| 2. | does not maintain a permanent establishment in Japan (a) with which the shares of common stock or ADSs are effectively connected and through which the U.S. Holder carries on or has carried on business, or (b) of which the shares of common stock or ADSs form part of the business property; and |
| 3. | is eligible for benefits under the Treaty with respect to income and gain derived in connection with the shares of common stock or ADSs. |
This summary does not address any aspects of U.S. federal tax law other than U.S. federal income taxation (such as the estate and gift tax or the Medicare tax on net investment income) and does not discuss any aspects of Japanese taxation other than income taxation, as limited to national taxes, inheritance and gift taxation. This summary also does not cover any U.S. state or local, or non-U.S., non-Japanese tax considerations. Investors are urged to consult their tax advisors regarding the U.S. federal, state and local and Japanese and other tax consequences of acquiring, owning and disposing of shares of common stock or ADSs. In particular, where relevant, investors are urged to confirm their status as Eligible U.S. Holders with their tax advisors and to discuss with their tax advisors any possible consequences of their failure to qualify as Eligible U.S. Holders. In addition, this summary is based in part upon the representations of the Depositary and the assumption that each obligation in the deposit agreement, and in any related agreement, will be performed in accordance with its terms.
In general, for purposes of the Treaty and for U.S. federal income and Japanese income tax purposes, owners of American Depositary Receipts evidencing ADSs will be treated as the owners of the shares of common stock represented by those ADSs, and exchanges of shares of common stock for ADSs, and exchanges of ADSs for shares of common stock, will not be subject to U.S. federal income or Japanese income tax.
The discussion below is intended for general information only and does not constitute a complete analysis of all tax consequences relating to ownership of shares of common stock or ADSs. Prospective purchasers of shares of common stock or ADSs should consult their own tax advisors concerning the tax consequences of their particular situations.
Japanese Taxation
The following is a summary of the principal Japanese tax consequences (limited to national taxes) to non-residents of Japan or non-Japanese corporations without permanent establishments in Japan (“non-resident Holders”) who are holders of shares of common stock or of ADSs of Toyota. The following information regarding taxation in Japan is based on the tax treaties and tax laws in force and their interpretation by Japan’s tax authorities as of the date of this annual report. Tax laws and treaties and their interpretations may change (including with retroactive effect). Toyota will not revise this summary on the basis of any such change occurring after the date of this annual report.
132
Generally, non-resident Holders are subject to Japanese withholding tax on dividends paid by Japanese corporations. Stock splits are, in general, not taxable events.
In the absence of an applicable income tax treaty, convention or agreement reducing the maximum rate of Japanese withholding tax or allowing an exemption from Japanese withholding tax, the rate of Japanese withholding tax applicable to dividends paid by Japanese corporations to non-resident Holders is generally 20.42 percent, provided that, with respect to dividends paid on listed shares issued by a Japanese corporation (such as the shares of common stock or ADSs of Toyota) to non-resident Holders, other than any non-resident Holder who is an individual holding three percent or more of the total issued shares of the relevant Japanese corporation, the aforementioned 20.42 percent withholding tax rate is reduced to 15.315 percent for dividends due and payable on or before December 31, 2047. These rates include a special additional withholding tax (2.1 percent of the original withholding tax amount) to secure funds for reconstruction from the Great East Japan Earthquake (the “reconstruction surtax”). This overall 15.315% and 20.42% withholding tax rate continues to apply until December 31, 2047, while the breakdown of the 0.315% and 0.42% surtax portion is (i) the reconstruction surtax of 0.315% (or 2.1% of 15%) and 0.42% (or 2.1% of 20%) until December 31, 2026, and (ii) during the period beginning on January 1, 2027 and ending on December 31, 2047, the reconstruction surtax of 0.165% (or 1.1% of 15%) and 0.22% (or 1.1% of 20%) and another special additional withholding tax of 0.15% (or 1.0% of 15%) and 0.2% (or 1.0% of 20%) to fund strengthening Japan’s national defense capabilities (the “defense surtax”). The 2026 tax reform, which was promulgated on March 31, 2026, has introduced the defense surtax while accordingly reducing the reconstruction surtax, to maintain the overall 15.315% and 20.42% withholding tax rate.
At the date of this annual report, Japan has income tax treaties, conventions or agreements whereby the above-mentioned withholding tax rate is reduced, in most cases to 15 percent, ten percent or five percent for portfolio investors (15 percent under the income tax treaties in force with, among other countries, Canada, Denmark, Finland, Germany, Iceland, Ireland, Italy, Luxembourg, New Zealand, Norway and Singapore, ten percent under the income tax treaties with, among other countries, Australia, Austria, Belgium, France, Hong Kong, the Netherlands, Portugal, Sweden, Switzerland, the U.K. and the United States, and five percent under the income tax treaties with, among other countries, Spain).
Under the Treaty, the maximum rate of Japanese withholding tax which may be imposed on dividends paid by a Japanese corporation to an Eligible U.S. Holder that is a portfolio investor is generally reduced to ten percent of the gross amount actually distributed, and dividends paid by a Japanese corporation to an Eligible U.S. Holder that is a pension fund (as defined in the Treaty) are exempt from Japanese income tax by way of withholding or otherwise, provided that such dividends are not derived from the carrying on of a business, directly or indirectly, by such pension fund.
If the maximum tax rate provided for in the income tax treaty applicable to dividends paid by Toyota to any particular non-resident Holder is lower than the withholding tax rate otherwise applicable under Japanese tax law or if any particular non-resident Holder is exempt from Japanese income tax with respect to such dividends under the income tax treaty applicable to such particular non-resident Holder, such non-resident Holder who is entitled to a reduced rate of or exemption from Japanese withholding tax on the payment of dividends on shares of common stock by Toyota is required to submit an Application Form for Income Tax Convention Regarding Relief from Japanese Income Tax and Special Income Tax for Reconstruction on Dividends (together with any other required forms and documents) in advance through the withholding agent to the relevant tax authority before the payment of dividends. A standing proxy for non-resident Holders of a Japanese corporation may provide this application service. In addition, a simplified special filing procedure is available for non-resident Holders to claim treaty benefits of exemption from or reduction of Japanese withholding tax by submitting a Special Application Form for Income Tax Convention Regarding Relief from Japanese Income Tax and Special Income Tax for Reconstruction on Dividends of Listed Stock (together with any other required forms and documents). With respect to ADSs, this reduced rate or exemption is applicable if the Depositary or its agent submits, together with other documents, two Special Application Forms (one before payment of dividends, the other within eight months after the recording date
133
concerning such payment of dividends) to the Japanese tax authority. To claim this reduced rate or exemption, any relevant non-resident Holder of ADSs will be required to file proof of taxpayer status, residence and beneficial ownership (as applicable) and to provide other information or documents as may be required by the Depositary. A non-resident Holder who is entitled, under an applicable income tax treaty, to a reduced treaty rate lower than the withholding tax rate otherwise applicable under Japanese tax law or an exemption from the withholding tax, but fails to submit the required application in advance, will be entitled to claim the refund of Japanese taxes withheld in excess of the rate under an applicable tax treaty (if such non-resident Holder is entitled to a reduced treaty rate under the applicable income tax treaty) or the entire amount of Japanese tax withheld (if such non-resident Holder is entitled to an exemption under the applicable income tax treaty) by complying with a certain subsequent filing procedure. Toyota does not assume any responsibility to ensure withholding at the reduced rate, or exemption therefrom, for non-resident Holders who would be so eligible under an applicable tax treaty, but where the required procedures as stated above are not followed.
Gains derived from the sale of shares of common stock or ADSs outside Japan by a non-resident Holder holding such shares of common stock or ADSs as portfolio investors are, in general, not subject to Japanese income tax or corporation tax under Japanese law. In addition, Eligible U.S. Holders are exempt from Japanese income or corporation tax with respect to such gains under the Treaty so long as filings required under Japanese law are made.
Japanese inheritance and gift taxes at progressive rates may be payable by an individual who has acquired from another individual shares of common stock or ADSs as a legatee, heir or done, even though neither the individual, nor the deceased, nor donor is a Japanese resident.
Holders of shares of common stock or ADSs should consult their tax advisors regarding the effect of these taxes and, in the case of U.S. Holders, the possible application of the Estate and Gift Tax Treaty between the United States and Japan.
U.S. Federal Income Taxation
U.S. Holders
The following discussion is a summary of the material U.S. federal income tax consequences to U.S. Holders that hold shares of common stock or ADSs as capital assets (generally, for investment purposes).
Taxation of Dividends
Subject to the passive foreign investment company (“PFIC”) rules discussed below, the gross amount of any distribution made by Toyota in respect of shares of common stock or ADSs (without reduction for Japanese withholding taxes) will constitute a taxable dividend to the extent paid out of current or accumulated earnings and profits, as determined under U.S. federal income tax principles. The U.S. dollar amount of such a dividend generally will be included in the gross income of a U.S. Holder, as ordinary income, when actually or constructively received by the U.S. Holder, in the case of shares of common stock, or by the Depositary, in the case of ADSs. Dividends paid by Toyota will not be eligible for the dividends-received deduction generally allowed to U.S. corporations in respect of dividends received from other U.S. corporations.
Dividends received on shares and ADSs of certain non-U.S. corporations by non-corporate U.S. investors may be subject to U.S. federal income tax at lower rates than other types of ordinary income if certain conditions are met. Dividends received by non-corporate U.S. Holders with respect to shares of common stock or ADSs of Toyota are expected to be eligible for these reduced rates of tax. U.S. Holders should consult their own tax advisors regarding the eligibility of such dividends for a reduced rate of tax.
The U.S. dollar amount of a dividend paid in Japanese yen will be determined based on the Japanese yen/U.S. dollar exchange rate in effect on the date that the dividend is included in the gross income of the U.S. Holder,
134
regardless of whether the payment is converted into U.S. dollars on that date. Generally, any gain or loss resulting from currency exchange fluctuations during the period from the date the dividend payment is included in the gross income of a U.S. Holder through the date that payment is converted into U.S. dollars (or otherwise disposed of) will be treated as U.S.-source ordinary income or loss. U.S. Holders should consult their own tax advisors regarding the calculation and U.S. federal income tax treatment of foreign currency gain or loss.
To the extent, if any, that the amount of any distribution received by a U.S. Holder in respect of shares of common stock or ADSs exceeds Toyota’s current and accumulated earnings and profits, as determined under U.S. federal income tax principles, the distribution will be applied first to reduce such holder’s tax basis in its shares of common stock or ADSs, thereby increasing the amount of gain or decreasing the amount of loss recognized on a subsequent disposition of the shares of common stock or ADSs. Then, to the extent such distribution exceeds such U.S. Holder’s adjusted tax basis in those shares of common stock and ADSs, such excess will be treated as U.S.-source capital gain.
Distributions of additional shares of common stock that are made to U.S. Holders with respect to their shares of common stock or ADSs, and that are part of a pro rata distribution to all of Toyota’s shareholders, generally will not be subject to U.S. federal income tax.
For U.S. foreign tax credit purposes, dividends included in gross income by a U.S. Holder in respect of shares of common stock or ADSs will constitute income from sources outside the United States. The limitation on foreign taxes eligible for credit is calculated separately with respect to specific classes of income. For this purpose, dividends paid by Toyota will generally be “passive category income” or, in the case of certain U.S. Holders, “general category income.” Any Japanese withholding tax imposed in respect of a Toyota dividend may be claimed as a credit against the U.S. federal income tax liability of a U.S. Holder, subject to a number of complex limitations and conditions, including those introduced by recently issued U.S. Treasury regulations that apply to foreign income taxes paid or accrued in taxable years beginning on or after December 28, 2021. A U.S. Holder’s use of a foreign tax credit with respect to any such Japanese income or withholding taxes would generally not be allowed unless such U.S. Holder elects benefits under an applicable income tax treaty with respect to such tax. A U.S. Holder who does not elect to claim a credit for any creditable foreign income taxes paid during the taxable year may instead claim a deduction in the computation of such U.S. Holder’s taxable income, subject to generally applicable limitations. An election to deduct foreign taxes instead of claiming foreign tax credits must apply to all creditable foreign taxes paid or accrued in the taxable year. Special rules generally will apply to the calculation of foreign tax credits in respect of dividend income that qualifies for preferential U.S. federal income tax rates. Additionally, special rules apply to individuals whose foreign source income during the taxable year consists entirely of “qualified passive income” and whose creditable foreign taxes paid or accrued during the taxable year do not exceed $300 ($600 in the case of a joint return). Further, under some circumstances, a U.S. Holder that:
| (i) | has held shares of common stock or ADSs for less than a specified minimum period during which such U.S. holder is not protected from the risk of loss; or |
| (ii) | is obligated to make payments related to Toyota dividends, will not be allowed a foreign tax credit for Japanese taxes imposed on Toyota dividends. |
U.S. Holders are urged to consult their tax advisors regarding the availability of the foreign tax credit under their particular circumstances.
Taxation of Capital Gains and Losses
In general, upon a sale or other taxable disposition of shares of common stock or ADSs, a U.S. Holder will recognize gain or loss for U.S. federal income tax purposes in an amount equal to the difference between the amount realized on the sale or other taxable disposition and the U.S. Holder’s adjusted tax basis in those shares of common stock or ADSs. A U.S. Holder generally will have an adjusted tax basis in a share of common stock or an ADS equal to
135
its U.S. dollar cost. Subject to the PFIC rules discussed below, gain or loss recognized on the sale or other taxable disposition of shares of common stock or ADSs generally will be capital gain or loss and, if the U.S. Holder’s holding period for those shares or ADSs exceeds one year, will be long-term capital gain or loss. Non-corporate U.S. Holders, including individuals, currently are eligible for preferential rates of U.S. federal income tax in respect of long-term capital gains. Under U.S. federal income tax law, the deduction of capital losses is subject to limitations. Any gain or loss recognized by a U.S. Holder in respect of the sale or other disposition of shares of common stock or ADSs generally will be treated as U.S.-source income or loss for U.S. foreign tax credit purposes.
Deposits and withdrawals of common stock in exchange for ADSs will not result in the realization of gain or loss for U.S. federal income tax purposes.
Passive Foreign Investment Companies
A non-U.S. corporation generally will be classified as a PFIC for U.S. federal income tax purposes in any taxable year in which, after applying look-through rules, either (1) at least 75% of its gross income is passive income or (2) on average at least 50% of the gross value of its assets is attributable to assets that produce passive income or are held for the production of passive income. Passive income for this purpose generally includes dividends, interest, royalties, rents and gains from commodities and securities transactions. The PFIC determination is made annually and generally is based on the value of a non-U.S. corporation’s assets (including goodwill) and composition of its income.
Toyota does not believe that it was a PFIC for U.S. federal income tax purposes for its taxable year ended March 31, 2026, and currently intends to continue its operations in such a manner that it will not become a PFIC in the future. Because the PFIC determination is made annually and the application of the PFIC rules to a corporation such as Toyota (which among other things is engaged in leasing and financing through several subsidiaries) is not entirely clear, no assurances can be made regarding determination of its PFIC status in the current or any future taxable year. If Toyota is determined to be a PFIC, U.S. Holders could be subject to additional U.S. federal income taxes on gain recognized with respect to the shares of common stock or ADSs and on certain distributions. In addition, an interest charge may apply to the portion of the U.S. federal income tax liability on such gains or distributions treated under the PFIC rules as having been deferred by the U.S. Holder. Moreover, dividends that a non-corporate U.S. Holder receives from Toyota will not be eligible for the reduced U.S. federal income tax rates on dividends described above if Toyota is a PFIC either in the taxable year of the dividend or the preceding taxable year. If a U.S. Holder owns shares of common stock or ADSs in any taxable year in which Toyota is a PFIC, such U.S. Holder generally would be required to file Internal Revenue Service (“IRS”) Form 8621 (or other form specified by the U.S. Department of the Treasury) on an annual basis, subject to certain exceptions based on the value of PFIC stock held. Toyota will inform U.S. Holders if it believes that it will be classified as a PFIC in any taxable year.
Prospective investors should consult their own tax advisors regarding the potential application of the PFIC rules to shares of common stock or ADSs.
Non-U.S. Holders
The following discussion is a summary of the principal U.S. federal income tax consequences to beneficial owners of shares of common stock or ADSs that are neither U.S. Holders, nor partnerships, nor entities taxable as partnerships for U.S. federal income tax purposes (“Non-U.S. Holders”).
A Non-U.S. Holder generally will not be subject to any U.S. federal income or withholding tax on distributions received in respect of shares of common stock or ADSs unless the distributions are effectively connected with the conduct by the Non-U.S. Holder of a trade or business within the United States (and, if an applicable tax treaty requires, are attributable to a U.S. permanent establishment or fixed base of such Non-U.S. Holder).
136
A Non-U.S. Holder generally will not be subject to U.S. federal income tax in respect of gain recognized on a sale or other disposition of shares of common stock or ADSs, unless:
| (i) | the gain is effectively connected with a trade or business conducted by the Non-U.S. Holder within the United States (and, if an applicable tax treaty requires, is attributable to a U.S. permanent establishment or fixed base of such Non-U.S. Holder); or |
| (ii) | the Non-U.S. Holder is an individual who was present in the United States for 183 or more days in the taxable year of the disposition and other conditions are met. |
Income that is effectively connected with a U.S. trade or business of a Non-U.S. Holder, and, if an income tax treaty applies and so requires, is attributable to a U.S. permanent establishment or fixed base of the Non-U.S. Holder, generally will be taxed in the same manner as the income of a U.S. Holder. In addition, under certain circumstances, any effectively connected earnings and profits realized by a corporate Non-U.S. Holder may be subject to an additional “branch profits tax” at the rate of 30% or at a lower rate that may be prescribed by an applicable income tax treaty.
Backup Withholding and Information Reporting
In general, information reporting requirements will apply to dividends paid to a U.S. Holder in respect of shares of common stock or ADSs, and to the proceeds received upon the sale, exchange or redemption of the shares of common stock or ADSs within the United States by U.S. Holders. Furthermore, backup withholding may apply to those amounts (currently at a 24% rate) if a U.S. Holder fails to provide an accurate taxpayer identification number to certify that such U.S. Holder is not subject to backup withholding or to otherwise comply with the applicable requirements of the backup withholding requirements.
Dividends paid to a Non-U.S. Holder in respect of shares of common stock or ADSs, and proceeds received upon the sale, exchange or redemption of shares of common stock or ADSs by a Non-U.S. Holder, generally are exempt from information reporting and backup withholding under current U.S. federal income tax law. However, a Non-U.S. Holder may be required to provide certification of non-U.S. status in order to obtain that exemption.
Persons required to establish their exempt status generally must provide such certification under penalty of perjury on IRS Form W-9, entitled “Request for Taxpayer Identification Number and Certification”, in the case of U.S. persons, and on IRS Form W-8BEN, entitled “Certificate of Foreign Status of Beneficial Owner for United States Tax Withholding and Reporting (Individuals)”, or IRS Form W-8BEN-E, entitled “Certificate of Status of Beneficial Owner for United States Tax Withholding and Reporting (Entities)” (or other appropriate IRS Form W-8), in the case of non-U.S. persons. Backup withholding is not an additional tax. The amount of backup withholding imposed on a payment generally may be claimed as a credit against the holder’s U.S. federal income tax liability, provided that the required information is properly furnished to the IRS in a timely manner.
In addition, certain U.S. Holders who are individuals that hold certain foreign financial assets (which may include shares of common stock or ADSs) are required to report information relating to such assets, subject to certain exceptions. U.S. Holders should consult their tax advisors regarding the effect, if any, of this legislation on their ownership and disposition of shares of common stock or ADSs.
THE SUMMARY OF U.S. FEDERAL INCOME AND JAPANESE NATIONAL TAX CONSEQUENCES SET OUT ABOVE IS INTENDED FOR GENERAL INFORMATION PURPOSES ONLY. PROSPECTIVE PURCHASERS OF COMMON STOCK OR ADSs ARE URGED TO CONSULT WITH THEIR OWN TAX ADVISORS WITH RESPECT TO THE PARTICULAR TAX CONSEQUENCES TO THEM OF OWNING OR DISPOSING OF COMMON STOCK OR ADSs, BASED ON THEIR PARTICULAR CIRCUMSTANCES.
137
10.F DIVIDENDS AND PAYING AGENTS
Not applicable.
10.G STATEMENT BY EXPERTS
Not applicable.
10.H DOCUMENTS ON DISPLAY
Toyota files annual reports on Form 20-F and reports on Form 6-K with the SEC. You may access this information through the SEC’s website (https://www.sec.gov). In addition, Toyota’s reports, proxy statements and other information may be inspected at the offices of the New York Stock Exchange, 20 Broad Street, New York, New York 10005. Copies of the documents referred to herein may also be inspected at Toyota’s offices by contacting Toyota at 1 Toyota-cho, Toyota City, Aichi Prefecture 471-8571, Japan, attention: Capital Strategy & Affiliated Companies, Finance Division, telephone number: +81-565-28-2121.
10.I SUBSIDIARY INFORMATION
Not applicable.
10.J ANNUAL REPORT TO SECURITY HOLDERS
Not applicable.
ITEM 11. QUANTITATIVE AND QUALITATIVE DISCLOSURES ABOUT MARKET RISK
Quantitative and Qualitative Disclosures about Market Risk
Toyota is exposed to market risk from changes in foreign currency exchange rates, interest rates, certain commodity and equity security prices. In order to manage the risk arising from changes in foreign currency exchange rates and interest rates, Toyota enters into a variety of derivative financial instruments.
A description of Toyota’s accounting policies for derivative instruments is included in note 3 to the consolidated financial statements and further disclosure is provided in notes 20 and 21 to the consolidated financial statements.
Toyota monitors and manages these financial exposures as an integral part of its overall risk management program, which recognizes the unpredictability of financial markets, and seeks to reduce the potentially adverse effects on Toyota’s operating results.
Market risk analyses of risks such as foreign exchange risk, interest rate risk, commodity price fluctuation risk and stock price fluctuation risk are provided in note 20 to the consolidated financial statements.
ITEM 12. DESCRIPTION OF SECURITIES OTHER THAN EQUITY SECURITIES
12.A DEBT SECURITIES
Not applicable.
12.B WARRANTS AND RIGHTS
Not applicable.
138
12.C OTHER SECURITIES
Not applicable.
12.D AMERICAN DEPOSITARY SHARES
Fees and Charges for Holders of American Depositary Shares
The Bank of New York Mellon, as Depositary for the ADSs, collects its fees for delivery and surrender of ADSs directly from investors depositing shares or surrendering ADSs for the purpose of withdrawal or from intermediaries acting for them. The Depositary collects fees for making distributions to investors by deducting those fees from the amounts distributed or by selling a portion of distributable property to pay the fees. The Depositary may generally refuse to provide fee-attracting services until its fees for those services are paid. The Depositary’s principal executive office is located at 240 Greenwich Street, 8th Floor West, New York, NY 10286, United States of America.
| Persons depositing or withdrawing shares must pay: |
For: | |
| $5.00 (or less) per 100 ADSs (or portion of 100 ADSs) | • Delivery of ADSs, including those resulting from a distribution, sale or exercise of shares or rights or other property | |
• Surrender of ADSs for the purpose of withdrawal including if the deposit agreement terminates | ||
| $0.05 (or less) per ADS | • Any cash distribution to ADS registered holders | |
| A fee equivalent to the fee that would be payable if securities distributed to you had been shares and the shares had been deposited for delivery of ADSs | • Distribution of securities or rights distributed to holders of deposited securities that are distributed by the Depositary to ADS registered holders | |
| $0.05 (or less) per ADS per year | • General depositary services | |
| Registration fees | • Registration of transfer of shares on Toyota’s share register to or from the name of the Depositary or its nominee or the custodian or its nominee when shares are deposited or withdrawn | |
| Fees and expenses of the Depositary | • Cable (including SWIFT) and facsimile transmissions (when expressly provided in the deposit agreement) | |
• Converting foreign currency to U.S. dollars | ||
| Taxes and other governmental charges the Depositary or the custodian have to pay on any ADS or share underlying an ADS | • As necessary | |
| Any other charges payable by the Depositary, the custodian or their respective agents in connection with the servicing of the deposited securities | • As necessary | |
Fees Incurred in Fiscal 2026
For fiscal 2026, the Depositary paid to Toyota, or paid to a third party at Toyota’s instruction, an aggregate of $980,058.75 for standard out-of-pocket maintenance costs for the ADSs (consisting of the expenses of postage
139
and envelopes for mailing annual reports, printing and distributing dividend checks, stationery, postage, facsimile, and telephone calls), Toyota’s continuing annual stock exchange listing fees with respect to the ADSs, expenses relating to Toyota’s annual general shareholders’ meeting that are incurred with respect to Toyota’s ADS holders and 50% of the net dividend fees collected by the Depositary.
Fees to be Paid in the Future
With regards to the ADS program, the Depositary has agreed to pay the standard out-of-pocket maintenance costs for the ADSs, which includes the expenses of postage and envelopes for mailing annual reports, printing and distributing dividend checks, stationery, postage, facsimile and telephone calls. It has also agreed to pay for investor relations expenses, the continuing annual stock exchange listing fees with respect to the ADSs, and any other program related expenses. The limit on the amount of expenses for which the Depositary will pay is the sum of $300,000 annually. In addition, the Depositary has agreed to pay Toyota 50% of the net dividend fees collected by the Depositary during each annual period towards the aforementioned expenses.
140
PART II
ITEM 13. DEFAULTS, DIVIDEND ARREARAGES AND DELINQUENCIES
None.
ITEM 14. MATERIAL MODIFICATIONS TO THE RIGHTS OF SECURITY HOLDERS AND USE OF PROCEEDS
None.
ITEM 15. CONTROLS AND PROCEDURES
(a) DISCLOSURE CONTROLS AND PROCEDURES
Toyota performed an evaluation of the effectiveness of the design and operation of its disclosure controls and procedures as of the end of fiscal 2026. Disclosure controls and procedures are designed to ensure that information required to be disclosed in the Form 20-F that Toyota files under the Securities Exchange Act of 1934, as amended (the “Exchange Act”) is accumulated and communicated to its management, including the chief executive officer and the principal accounting and financial officer, to allow timely decisions regarding required disclosure. The disclosure controls and procedures also ensure that the Form 20-F that it files under the Exchange Act is recorded, processed, summarized and reported within the time periods specified in the Commission’s rules and forms. The evaluation was performed under the supervision of Toyota’s principal executive officer, and the principal financial officer. Toyota’s disclosure controls and procedures are designed to provide reasonable assurance of achieving its objectives. Managerial judgment was necessary to evaluate the cost-benefit relationship of possible controls and procedures. The President and Representative Director as well as the member of the Board of Directors have concluded that Toyota’s disclosure controls and procedures are effective at the reasonable assurance level.
(b) MANAGEMENT’S ANNUAL REPORT ON INTERNAL CONTROL OVER FINANCIAL REPORTING
Toyota’s management is responsible for establishing and maintaining effective internal control over financial reporting. Internal control over financial reporting is a process designed to provide reasonable assurance regarding the reliability of financial reporting and the preparation of financial statements for external purposes in accordance with IFRS Accounting Standards. Toyota’s internal control over financial reporting includes those policies and procedures that:
| (i) | pertain to the maintenance of records that in reasonable detail, accurately and fairly reflect the transactions and dispositions of Toyota’s assets; |
| (ii) | provide reasonable assurance that transactions are recorded as necessary to permit preparation of financial statements in accordance with IFRS Accounting Standards, and that Toyota’s receipts and expenditures are being made only in accordance with authorizations of Toyota’s management and members of the Board of Directors; and |
| (iii) | provide reasonable assurance regarding prevention or timely detection of unauthorized acquisition, use, or disposition of Toyota’s assets that could have a material effect on the financial statements. |
Because of its inherent limitations, internal control over financial reporting may not prevent or detect misstatements. Also, projections of any evaluation of effectiveness to future periods are subject to the risk that controls may become inadequate because of changes in conditions, or that the degree of compliance with the policies or procedures may deteriorate.
141
Toyota’s management conducted an evaluation of the effectiveness of internal control over financial reporting based on the framework in “Internal Control — Integrated Framework (2013)” issued by the Committee of Sponsoring Organizations of the Treadway Commission.
Based on this evaluation, management concluded that Toyota’s internal control over financial reporting was effective as of March 31, 2026.
PricewaterhouseCoopers Japan LLC, an independent registered public accounting firm that audited the consolidated financial statements included in this report, has also audited the effectiveness of Toyota’s internal control over financial reporting as of March 31, 2026, as stated in its report included herein.
(c) ATTESTATION REPORT OF THE REGISTERED PUBLIC ACCOUNTING FIRM
Toyota’s independent registered public accounting firm, PricewaterhouseCoopers Japan LLC, has issued an audit report on the effectiveness of Toyota’s internal control over financial reporting. This report appears in Item 18.
(d) CHANGES IN INTERNAL CONTROL OVER FINANCIAL REPORTING
There have been no changes in Toyota’s internal control over financial reporting during fiscal 2026 that have materially affected, or are reasonably likely to materially affect, Toyota’s internal control over financial reporting.
ITEM 16. [RESERVED]
ITEM 16A. AUDIT COMMITTEE FINANCIAL EXPERT
Toyota maintains an Audit & Supervisory Committee, in accordance with the Companies Act. Toyota’s Audit & Supervisory Committee is comprised of four members of the Board of Directors who are Audit & Supervisory Committee members, three of whom are outside and independent directors. Each member of the Board of Directors who is an Audit & Supervisory Committee member has been appointed at Toyota’s meetings of shareholders, and the Audit & Supervisory Committee has certain statutory powers independently, including auditing the business affairs and accounts of Toyota.
Toyota’s Audit & Supervisory Committee has determined that it does not have an “audit committee financial expert” serving on the Audit & Supervisory Committee. The qualifications for, and powers of, the Audit & Supervisory Committee member delineated in the Companies Act are different from those anticipated for any audit committee financial expert. Audit & Supervisory Committee members have the authority to be given reports from a certified public accountant or an accounting firm concerning audits, including technical accounting matters. At the same time, each Audit & Supervisory Committee member has the authority to consult internal and external experts on accounting matters. Each Audit & Supervisory Committee member must fulfill the requirements under Japanese laws and regulations and otherwise follow Japanese corporate governance practices and, accordingly, Toyota’s Audit & Supervisory Committee has confirmed that it is not necessarily in Toyota’s best interest to nominate as Audit & Supervisory Committee member a person who meets the definition of audit committee financial expert. Although Toyota does not have an audit committee financial expert on its Audit & Supervisory Committee, Toyota believes that Toyota’s current corporate governance structure, taken as a whole, including the Audit & Supervisory Committee members’ ability to consult internal and external experts, is fully equivalent to a structure having an audit committee financial expert on its Audit & Supervisory Committee.
142
ITEM 16B. CODE OF ETHICS
Toyota has adopted a code of ethics that applies to its members of the Board of Directors and operating officers, including its principal executive officer, principal financial officer, principal accounting officer or controller, or persons performing similar functions. A copy of Toyota’s code of ethics is included as an exhibit to this annual report on Form 20-F.
ITEM 16C. PRINCIPAL ACCOUNTANT FEES AND SERVICES
PricewaterhouseCoopers Japan LLC has audited the financial statements of Toyota included in this annual report on Form 20-F.
The following table presents the aggregate fees for professional services and other services rendered by PricewaterhouseCoopers Japan LLC and the various network and member firms of PricewaterhouseCoopers to Toyota in fiscal 2025 and fiscal 2026.
| Yen in millions | ||||||||
| 2025 | 2026 | |||||||
| Audit Fees(1) |
8,779 | 8,780 | ||||||
| Audit-related Fees(2) |
134 | 231 | ||||||
| Tax Fees(3) |
453 | 378 | ||||||
| All Other Fees(4) |
60 | 46 | ||||||
|
|
|
|
|
|||||
| Total |
9,426 | 9,435 | ||||||
|
|
|
|
|
|||||
| (1) | Audit Fees consist of fees billed for the annual audit services engagement and other audit services, which are those services that only the external auditor reasonably can provide, and include the services of annual audit, quarterly reviews and assessment and reviews of the effectiveness of internal controls over financial reporting of Toyota and its subsidiaries and affiliated companies; the services associated with SEC registration statements or other documents issued in connection with securities offerings such as comfort letters and consents. |
| (2) | Audit-related Fees consist of fees billed for assurance and related services that are reasonably related to the performance of the audit or review of its financial statements or that are traditionally performed by the external auditor, and mainly include services such as agreed-upon or expanded audit procedures; and financial statement audits of employee benefit plans. |
| (3) | Tax Fees include fees billed for tax compliance services, including services such as tax planning, advice and compliance of federal, state, local and international tax; the review of tax returns; assistance with tax audits and appeals; tax-only valuation services including transfer pricing; expatriate tax assistance and compliance. |
| (4) | All Other Fees primarily include fees billed for risk management advisory services; services providing information related to automotive market conditions; and other advisory services. |
Policies and Procedures of the Audit & Supervisory Committee
Below is a summary of the current policies and procedures of the Audit & Supervisory Committee for the pre-approval of audit and permissible non-audit services performed by Toyota’s independent public accountants.
Under the policy, specified operating officers or managers submit a request for general pre-approval of audit and permissible non-audit services for the following fiscal year, which shall include details of the specific services and estimated fees for the services, to the Audit & Supervisory Committee, which reviews and determines whether or not to grant the request in advance. Upon the general pre-approval of the Audit & Supervisory Committee, the specified operating officers or managers are not required to obtain any specific pre-approval for audit and permissible non-audit services so long as those services fall within the scope of the general pre-approval provided.
143
The Audit & Supervisory Committee makes a further determination of whether or not to grant a request to revise the general pre-approval for the applicable fiscal year if such request is submitted by specified operating officers or managers. Such request may include (i) adding any audit or permissible non-audit services other than the ones listed in the general pre-approval and (ii) obtaining services that are listed in the general pre-approval but of which the total fee amount exceeds the amount affirmed by the general pre-approval. The determination of whether or not to grant a request to revise the general pre-approval noted in the foregoing may alternatively be made by an Audit & Supervisory Committee member, who is designated in advance by a resolution of the Audit & Supervisory Committee, in which case such Audit & Supervisory Committee member shall report such decision at the next meeting of the Audit & Supervisory Committee. The performance of audit and permissible non-audit services and the payment of fees are subject to review by the Audit & Supervisory Committee at least once every fiscal year.
With respect to fiscal 2026, none of the audit related fees, tax fees or all other fees described in the table above were approved by the Audit & Supervisory Committee pursuant to the de minimis exception provided by paragraph (c)(7)(i)(C) of Rule 2-01 of Regulation S-X. With respect to fiscal 2025, none of the audit related fees, tax fees or all other fees described in the table above were approved by the Audit & Supervisory Board, which used to approve such transactions prior to TMC becoming a company with an Audit & Supervisory Committee, pursuant to the de minimis exception provided by paragraph (c)(7)(i)(C) of Rule 2-01 of Regulation S-X.
ITEM 16D. EXEMPTIONS FROM THE LISTING STANDARDS FOR AUDIT COMMITTEES
As of the date of this annual report on Form 20-F, we do not rely on any of the exemptions contained in paragraph (b)(1)(iv), the general exemption contained in paragraph (c)(3) or the last sentence of paragraph (a)(3) of Rule 10A-3 under the Exchange Act.
ITEM 16E.PURCHASES OF EQUITY SECURITIES BY THE ISSUER AND AFFILIATED PURCHASERS
The following table sets forth purchases of Toyota’s common stock by Toyota and its affiliated purchasers during fiscal 2026:
| Period |
(a)Total Number of Shares Purchased(1) |
(b)Average Price Paid per Share (Yen)(1) |
(c)Total Number of Shares Purchased as Part of Publicly Announced Plans or Programs(2) |
(d)Maximum Number of Shares that May Yet Be Purchased Under the Plans or Programs(2) |
||||||||||||
| April 1, 2025 – April 30, 2025 |
16,226,828 | 2,462 | 16,226,100 | — | ||||||||||||
| May 1, 2025 – May 31, 2025 |
387 | 2,700 | — | — | ||||||||||||
| June 1, 2025 – June 30, 2025 |
715 | 2,627 | — | — | ||||||||||||
| July 1, 2025 – July 31, 2025 |
550 | 2,523 | — | — | ||||||||||||
| August 1, 2025 – August 31, 2025 |
697 | 2,836 | — | — | ||||||||||||
| September 1, 2025 – September 30, 2025 |
778 | 2,916 | — | — | ||||||||||||
| October 1, 2025 – October 31, 2025 |
926 | 2,941 | — | — | ||||||||||||
| November 1, 2025 – November 30, 2025 |
521 | 3,166 | — | — | ||||||||||||
| December 1, 2025 – December 31, 2025 |
1,045 | 3,244 | — | — | ||||||||||||
| January 1, 2026 – January 31, 2026 |
819 | 3,504 | — | — | ||||||||||||
| February 1, 2026 – February 28, 2026 |
760 | 3,663 | — | — | ||||||||||||
| March 1, 2026 – March 31, 2026 |
674 | 3,566 | — | — | ||||||||||||
|
|
|
|
|
|
|
|
|
|||||||||
| Total |
16,234,700 | — | 16,226,100 | — | ||||||||||||
|
|
|
|
|
|
|
|
|
|||||||||
| (1) | A portion of the above purchases were made as a result of holders of shares constituting less than one unit, which is 100 shares of common stock, requesting Toyota to purchase shares that are a fraction of a unit, in |
144
| accordance with Toyota’s share handling regulations. Toyota is required to comply with such requests pursuant to the Companies Act. See “Item 10. Additional Information — 10.B Memorandum and Articles of Association — Japanese Unit Share System.” The number of shares purchased not pursuant to publicly announced plans or programs conducted in fiscal 2026 is 8,600. |
| (2) | Subsequent to March 31, 2026, pursuant to the written resolution in lieu of a resolution of the Board of Directors dated June 3, 2025, the resolution of the Board of Directors dated January 14, 2026, and the written resolution in lieu of a resolution of the Board of Directors dated March 30, 2026, Toyota conducted a tender offer to repurchase shares of its common stock from existing shareholders, pursuant to which Toyota repurchased 1,192,330,962 shares of its common stock at 3,067 yen per share, for an aggregate purchase price of approximately 3.65 trillion yen, during the period from March 31, 2026 to April 27, 2026. The repurchased shares became treasury shares upon repurchase. |
ITEM 16F. CHANGE IN REGISTRANT’S CERTIFYING ACCOUNTANT
Not applicable.
ITEM 16G. CORPORATE GOVERNANCE
Significant Differences in Corporate Governance Practices between Toyota and U.S. Companies Listed on the NYSE
Pursuant to home country practices exemptions granted by the NYSE, Toyota is permitted to follow certain corporate governance practices complying with Japanese laws, regulations and stock exchange rules in lieu of the corporate governance standards under Section 303A of the NYSE Listed Company Manual (the “NYSE Corporate Governance Rules”). More specifically, Toyota is exempt from the NYSE Corporate Governance Rules, except for requirements that (a) Toyota’s Audit & Supervisory Committee satisfies the requirements of Rule 10A-3 under the Exchange Act, (b) Toyota must disclose significant differences in its corporate governance practices as compared to those followed by domestic companies under the NYSE listing standards, (c) Toyota’s principal executive officer must notify the NYSE in writing after any executive officer of Toyota becomes aware of any non-compliance with (a), (b) and (e), (d) Toyota must submit annual and interim written affirmations to the NYSE, and (e) Toyota must adopt and comply with a written policy providing that it will recover erroneously awarded incentive-based compensation from its executive officers in the event that it is required to prepare an accounting restatement due to the material noncompliance by Toyota with any financial reporting requirement under the securities laws. Toyota’s corporate governance practices and those followed by domestic companies under the NYSE Corporate Governance Rules have the following significant differences:
1. Members of the Board of Directors. The NYSE Corporate Governance Rules require U.S. listed companies generally to have a majority of the board be “independent directors,” as defined under the NYSE Corporate Governance Rules. The NYSE Corporate Governance Rules also require that the non-management directors of each U.S. listed company meet at regularly scheduled executive sessions without management. As a foreign private issuer, neither rule applies to Toyota. Unlike the NYSE Corporate Governance Rules, neither the Companies Act nor the regulations of the Japanese stock exchanges require, and accordingly Toyota does not have, an internal corporate organ or committee comprised solely of “independent directors” as defined under the regulations of the Japanese stock exchanges.
The Companies Act requires Toyota to have “outside” members of the Board of Directors, as defined under the Companies Act. Toyota currently has five outside members of the Board of Directors. An “outside” member of the Board of Directors refers to:
| (a) | a person who is not, and has never been during the ten year period before becoming an outside member of the Board of Directors, an Executive Director of Toyota or its subsidiaries; |
| (b) | if a person was a member of the Board of Directors, accounting counselor (in the case that an accounting counselor is a legal entity, a member of such entity who is in charge of its affairs) or Audit and Supervisory Board member (excluding those who have ever been Executive Directors, etc.) of |
145
| Toyota or any of its subsidiaries at any time during the ten year period before becoming an outside member of the Board of Directors, such person who has not been an Executive Director, etc. of Toyota or any of its subsidiaries during the ten year period before becoming a member of the Board of Directors, accounting counselor or Audit and Supervisory Board member; and |
| (c) | a person who is not a spouse or relative within the second degree of kinship of any member of the Board of Directors, manager or other key employee of Toyota. |
Such qualifications for an “outside” member of the Board of Directors are different from the director independence requirements under the NYSE Corporate Governance Rules.
In addition, pursuant to the regulations of the Japanese stock exchanges, Toyota is required to have one or more “independent director(s),” defined under the relevant regulations of the Japanese stock exchanges as “outside directors” (as defined under the Companies Act), who are unlikely to have any conflicts of interests with Toyota’s general shareholders. Each of the outside members of the Board of Directors of Toyota satisfies the “independent director” requirements under the regulations of the Japanese stock exchanges. The Japanese Corporate Governance Code provides that certain listed companies, including Toyota, should appoint at least one-third of their directors as “independent outside directors” as defined based on the criteria for assessing director independence established by Toyota in line with the independence standards of the Japanese stock exchanges. Each of the outside members of the Board of Directors of Toyota satisfies the “independent outside director” requirements under the independence standards of the Japanese stock exchanges. To ensure our outside members of the Board of Directors participate in decision-making from an independent standpoint and reflect the opinions of more diverse stakeholders in management, Toyota has clarified the unique roles of and expectations for Toyota’s outside members of the Board of Directors and revised the independence assessment criteria. The definition of “independent director” and “outside director” reflecting such criteria is different from that of the definition of independent director under the NYSE Corporate Governance Rules.
The roles of and expectations for outside members of the Board of Directors are as follows.
To believe in and uphold the Toyota Philosophy, have a high interest in our company’s business and people, and understand our company and its surrounding environment by having close dialogues with top management
To contribute to decision-making for our company’s sustainable growth and medium- to long-term enhancement in our corporate value as well as to solutions to social issues
To contribute to greater added value of the Board of Directors’ decision-making while supervising business execution, utilizing their abundant experience and advanced expertise based on their recognition of diverse stakeholders’ opinions
To provide advice and support on key issues and business strategies, etc., in addition to matters presented to the Board of Directors
(For outside members of the Board of Directors who are Audit & Supervisory Committee members)
In addition to the above, to conduct audits from a fair and neutral standpoint, utilizing their abundant experience and advanced expertise
The independence assessment criteria of Toyota are as follows.
Outside members of the Board of Directors who satisfy the requirements stipulated by the Companies Act and do not fall into any of the following categories are deemed to be independent.
| 1. | History of belonging to affiliated companies: Persons who are currently functioning as executive directors, members of the Audit & Supervisory Committee (excluding outside members of the Board of |
146
| Directors) or Audit and Supervisory Board, operating officers, or employees of our company and its consolidated subsidiaries. Or those who functioned as executive directors, members of the Audit & Supervisory Committee (excluding outside members of the Board of Directors) or the Audit and Supervisory Board, operating officers, or employees at any time during the last ten years. |
| 2. | Major business partners: Persons who are executing business in companies, etc. (executive directors, executive officers, operating officers, employees, or any equivalents; the same shall apply hereunder) where the amount of the transaction with our company and its consolidated subsidiaries is more than 2% of the consolidated net sales of their company or our company and its consolidated subsidiaries in any of the last three fiscal years. |
| 3. | Major lenders: Persons who are executing business in companies from which our company and its consolidated subsidiaries borrowed funds amounting to more than 2% of the consolidated total assets of our company and its consolidated subsidiaries in any of the last three fiscal years. |
| 4. | Highly paid experts: Consultants, accountants, or jurists who earned more than US$120,000 a year directly from our company and its consolidated subsidiaries as remuneration (excluding that for the function of outside executives) in any of the last three fiscal years. |
| 5. | Large contribution: Persons who (or persons belonging to organizations that) received contributions amounting to more than US$120,000 a year from our company and its consolidated subsidiaries in any of the last three fiscal years. |
| 6. | Major shareholders: Persons who are executing business in companies, etc., that are ranked tenth or higher in terms of the ownership ratio of our company’s shares or for which our company is ranked tenth or higher in terms of the ownership ratio of their shares. |
| 7. | Affiliated audit firms: Persons who currently belong to or belonged to, at any time during the last ten years, the audit firms serving as accounting auditors of our company and its consolidated subsidiaries. |
| 8. | Close relatives: Spouses, or relatives within the second degree of kinship, of members of the Board of Directors, the Audit & Supervisory Committee or Audit and Supervisory Board, operating officers, key employees of our company and its consolidated subsidiaries, or persons falling into the above 1 to 6 (excluding non-key persons). |
| 9. | Mutual executive dispatch: Persons who are executing business in companies that are accepting one or more member(s) of the Board of Directors or the Audit and Supervisory Board from our company and its consolidated subsidiaries. |
| 10. | Term of office: Persons whose term of office as an outside executive is longer than 12 years. |
Persons who fall within any of the above-listed categories may be determined as independent, under the condition that our company discloses the reason for the determination when such persons satisfy the requirements for outside executives stipulated in the Companies Act and are substantially independent, and thus, a conflict of interest against general shareholders is deemed not to emerge.
2. Nominating / Corporate Governance and Compensation Committees. Under the Companies Act, Toyota has elected to structure its corporate governance system as a company with an audit & supervisory committee. Toyota, as a Japanese company with an audit & supervisory committee, is not required to have certain committees that are required of U.S. listed companies subject to the NYSE Corporate Governance Rules, including those that are responsible for director nomination, corporate governance and executive compensation. However, members of Toyota’s Executive Appointment Meeting, a majority of whom are outside directors, discuss recommendations to the Board of Directors concerning the appointment and dismissal of members of the Board of Directors. Members of the Executive Compensation Meeting, a majority of whom are outside directors, review the remuneration system for members of Board of Directors (excluding for Audit & Supervisory Committee members) and senior management as well as determine the amount of remuneration for each member
147
of the Board of Directors (excluding for Audit & Supervisory Committee members). The Japanese Corporate Governance Code provides that certain listed companies, including Toyota, generally should have the majority of the members of each of certain committees be independent directors, and those committees of Toyota satisfy that principle.
Pursuant to the Companies Act, Toyota’s Board of Directors nominates and submits a proposal for the appointment of members of the Board of Directors for shareholder approval. The shareholders vote on such nomination at the general shareholders’ meeting. The Companies Act requires that the limits or calculation formula of the remuneration, bonus and any other benefits in compensation for the execution of duties (“remuneration, etc.”) of directors, the kind of remuneration, etc. (in case that the remuneration, etc. are other than cash (excluding shares and stock acquisition rights)) to be received by directors, and the limits of remuneration, etc. that are shares and stock acquisition rights to be granted to directors must be determined by a resolution of the general shareholders’ meeting, unless their remuneration, etc. is provided for in the articles of incorporation. The distribution of remuneration, etc., among each member of the Board of Directors (excluding Audit & Supervisory Committee members) is broadly delegated to the Board of Directors and the distribution of remuneration among each Audit & Supervisory Committee member is determined by consultation among the Audit & Supervisory Committee members.
3. Audit Committee. In addition to satisfying the requirements of Rule 10A-3 under the Exchange Act (including that each member meet the independence requirements of Rule 10A-3(b)(1) ), audit committees of companies listed on the NYSE generally are supposed to satisfy additional requirements, such as each member needing to be also an “independent director” as defined under the NYSE Corporate Governance Rules, and having specified purposes, duties and responsibilities. Toyota is not subject to the aforementioned additional requirements.
Pursuant to the requirements of the Companies Act, Toyota elects its Audit & Supervisory Committee members and the other members of the Board of Directors separately through a resolution adopted at a general shareholders’ meeting. The Companies Act of Japan stipulates that the Audit & Supervisory Committee must consist of at least three members of the Board of Directors. Toyota currently has four Audit & Supervisory Committee members.
Under the Companies Act, a majority of the Audit & Supervisory Committee members must be “outside” members of the Board of Directors. An “outside” member of the Board of Directors is any person who satisfies all of the requirements as described above in “1. Members of the Board of Directors.”:
Three of the Audit & Supervisory Committee members of Toyota are “outside” members of the Board of Directors and satisfy the “independent director” requirements under the regulations of the Japanese stock exchanges, as described above in “1. Members of the Board of Directors.”
Unlike the NYSE Corporate Governance Rules, the Companies Act, among other matters, does not require Audit & Supervisory Committee members to establish an “expertise in accounting or financial management” nor are they required to present other special knowledge and experience. Toyota’s Board of Directors has not determined that any of its Audit & Supervisory Committee members has “expertise in accounting or financial management,” as set forth in the NYSE Corporate Governance Rules. However, the Japanese Corporate Governance Code indicates that persons with appropriate experience and skills as well as necessary knowledge of finance, accounting, and laws should be appointed as Audit & Supervisory Committee members, and in particular, one or more Audit & Supervisory Committee members who have sufficient knowledge of finance and accounting matters should be appointed. Toyota has appointed persons who are able to provide opinions and advice regarding management based on their broader experience and discretion beyond finance and accounting. Under the Companies Act, the Audit & Supervisory Committee may determine the auditing policies and methods of investigating the conditions of Toyota’s business and assets and prepares auditors’ reports. Further, the Audit & Supervisory Committee makes decisions concerning proposals relating to the appointment and dismissal
148
of accounting auditors; it also has the authority to dismiss the accounting auditor when certain matters specified under the Companies Act occur.
U.S. domestic issuers listed on NYSE are required to disclose the charter of their audit committees. Japanese law and the regulations of the Japanese stock exchanges do not require such disclosure, and accordingly, we do not disclose our Audit & Supervisory Committee charter.
4. Corporate Governance Guidelines. Unlike the NYSE Corporate Governance Rules, Toyota is not required to comply with the Japanese Corporate Governance Code under Japanese laws and regulations, including the Companies Act, the Financial Instruments and Exchange Law of Japan and the regulations of the Japanese stock exchanges. However, if Toyota does not comply with the Japanese Corporate Governance Code, it is required to explain the reasons why it does not do so in accordance with the regulations of the Japanese stock exchanges. In addition, Toyota is required to resolve at the Board of Directors matters relating to a system, which is required under the ordinance of the Ministry of Justice (“internal control system” or “naibu-tosei”), to ensure the execution of duties of the members of the Board of Directors to comply with laws, regulations and articles of incorporation, and any other systems to ensure the adequacy of the business, and to disclose such matters resolved, policies and the present status of its corporate governance in its business reports, annual securities report and certain other disclosure documents in accordance with the regulations under the Financial Instruments and Exchange Law and the regulations of the Japanese stock exchanges in respect of timely disclosure.
5. Code of Business Conduct and Ethics. Similar to the NYSE Corporate Governance Rules, under the Japanese Corporate Governance Code, Toyota is encouraged to adopt a code of conduct regarding ethical business activities for members of the Board of Directors, officers and employees. Toyota has resolved matters relating to maintenance of an “internal control system,” or “naibu-tosei,” in order to ensure its employees comply with laws, regulations and the articles of incorporation, etc., pursuant to the Companies Act, and Toyota maintains guidelines and internal regulations such as “Guiding Principles at Toyota,” “Toyota Code of Conduct” and a code of ethics pursuant to Section 406 of the Sarbanes-Oxley Act. Please see “Item 16B. Code of Ethics” for additional information.
ITEM 16H. MINE SAFETY DISCLOSURE
Not applicable.
ITEM 16I. DISCLOSURE REGARDING FOREIGN JURISDICTIONS THAT PREVENT INSPECTIONS
Not applicable.
149
| *1 | Regulations concerning cybersecurity, which were adopted at the World Forum for the Harmonization of Vehicle Regulations (WP.29) in June 2020 |
| *2 | International standards concerning cyber security of electrical/electronic systems of automobiles |
PART III
ITEM 17. FINANCIAL STATEMENTS
Not applicable.
ITEM 18. FINANCIAL STATEMENTS
The following financial statements are filed as part of this annual report on Form 20-F.
153
Page |
||||
F - 2 |
||||
F - 4 |
||||
F - 6 |
||||
F - 7 |
||||
F - 8 |
||||
F - 10 |
||||
F - 11 |
||||
Yen in millions |
||||||||||
Notes |
March 31, 2025 |
March 31, 2026 |
||||||||
| Assets |
||||||||||
| Current assets |
||||||||||
| Cash and cash equivalents |
6 | |||||||||
| Trade accounts and other receivables |
7 | |||||||||
| Receivables related to financial services |
8 | |||||||||
| Other financial assets |
9 | |||||||||
| Inventories |
10 | |||||||||
| Income tax receivable |
||||||||||
| Other current assets |
||||||||||
| Subtotal |
||||||||||
| Assets held for sale |
11 | |||||||||
| |
|
|
|
|||||||
| Total current assets |
||||||||||
| |
|
|
|
|||||||
| Non-current assets |
||||||||||
| Investments accounted for using the equity method |
12 | |||||||||
| Receivables related to financial services |
8 | |||||||||
| Other financial assets |
9 | |||||||||
| Property, plant and equipment |
||||||||||
| Land |
13 | |||||||||
| Buildings |
13 | |||||||||
| Machinery and equipment |
13 | |||||||||
| Vehicles and equipment on operating leases |
13 | |||||||||
| Construction in progress |
13 | |||||||||
| |
|
|
|
|||||||
| Total property, plant and equipment, at cost |
13 | |||||||||
| |
|
|
|
|||||||
| Less - Accumulated depreciation and impairment losses |
13 | ( |
) | ( |
) | |||||
| |
|
|
|
|||||||
| Total property, plant and equipment, net |
13 | |||||||||
| |
|
|
|
|||||||
| Right of use assets |
14 | |||||||||
| Intangible assets |
15 | |||||||||
| Deferred tax assets |
16 | |||||||||
| Other non-current assets |
23 | |||||||||
| |
|
|
|
|||||||
| Total non-current assets |
||||||||||
| |
|
|
|
|||||||
| Total assets |
||||||||||
| |
|
|
|
|||||||
Yen in millions |
||||||||||||
Notes |
March 31, 2025 |
March 31, 2026 |
||||||||||
Liabilities |
||||||||||||
Current liabilities |
||||||||||||
Trade accounts and other payables |
17 | |||||||||||
Short-term and current portion of long-term debt |
18 | |||||||||||
Accrued expenses |
||||||||||||
Other financial liabilities |
19 | |||||||||||
Income taxes payable |
||||||||||||
Liabilities for quality assurance |
24 | |||||||||||
Provisions |
25 | |||||||||||
Other current liabilities |
||||||||||||
Subtotal |
||||||||||||
Liabilities directly associated with assets held for sale |
11 | — | ||||||||||
Total current liabilities |
||||||||||||
Non-current liabilities |
||||||||||||
Long-term debt |
18 | |||||||||||
Other financial liabilities |
19 | |||||||||||
Retirement benefit liabilities |
23 | |||||||||||
Deferred tax liabilities |
16 | |||||||||||
Provisions |
25 | |||||||||||
Other non-current liabilities |
||||||||||||
Total non-current liabilities |
||||||||||||
Total liabilities |
||||||||||||
Shareholders’ equity |
||||||||||||
Common stock |
26 | |||||||||||
Additional paid-in capital |
26 | |||||||||||
Retained earnings |
26 | |||||||||||
Other components of equity |
26 | |||||||||||
Other comprehensive income associated with assets held for sale |
11,26 | — | ||||||||||
Treasury stock |
26 | ( |
) | ( |
) | |||||||
Total Toyota Motor Corporation shareholders’ equity |
26 | |||||||||||
Non-controlling interests |
||||||||||||
Total shareholders’ equity |
||||||||||||
Total liabilities and shareholders’ equity |
||||||||||||
Yen in millions |
||||||||||||||||
Notes |
For the year ended March 31, 2024 |
For the year ended March 31, 2025 |
For the year ended March 31, 2026 |
|||||||||||||
| Sales revenues |
||||||||||||||||
| Sales of products |
27 | |||||||||||||||
| Financial services |
27 | |||||||||||||||
| |
|
|
|
|
|
|||||||||||
| Total sales revenues |
27 | |||||||||||||||
| |
|
|
|
|
|
|||||||||||
| Costs and expenses |
||||||||||||||||
| Cost of products sold |
||||||||||||||||
| Cost of financial services |
||||||||||||||||
| Selling, general and administrative |
||||||||||||||||
| |
|
|
|
|
|
|||||||||||
| Total costs and expenses |
||||||||||||||||
| |
|
|
|
|
|
|||||||||||
| Operating income |
||||||||||||||||
| |
|
|
|
|
|
|||||||||||
| Share of profit (loss) of investments accounted for using the equity method |
12 | |||||||||||||||
| Other finance income |
29 | |||||||||||||||
| Other finance costs |
29 | ( |
) | ( |
) | ( |
) | |||||||||
| Foreign exchange gain (loss), net |
||||||||||||||||
| Other income (loss), net |
( |
) | ( |
) | ||||||||||||
| |
|
|
|
|
|
|||||||||||
| Income before income taxes |
||||||||||||||||
| |
|
|
|
|
|
|||||||||||
| Income tax expense |
16 | |||||||||||||||
| |
|
|
|
|
|
|||||||||||
| Net income |
||||||||||||||||
| |
|
|
|
|
|
|||||||||||
| Net income attributable to |
||||||||||||||||
| Toyota Motor Corporation |
||||||||||||||||
| Non-controlling interests |
||||||||||||||||
| |
|
|
|
|
|
|||||||||||
| Net income |
||||||||||||||||
| |
|
|
|
|
|
|||||||||||
Yen |
||||||||||||||||
| Earnings per share attributable to Toyota Motor Corporation |
||||||||||||||||
| Basic and Diluted |
30 | |||||||||||||||
| |
|
|
|
|
|
|||||||||||
Yen in millions |
||||||||||||||||
Notes |
For the year ended March 31, 2024 |
For the year ended March 31, 2025 |
For the year ended March 31, 2026 |
|||||||||||||
| Net income |
|
|
|
|||||||||||||
| Other comprehensive income, net of tax |
||||||||||||||||
| Items that will not be reclassified to profit (loss) |
||||||||||||||||
| Net changes in revaluation of financial assets measured at fair value through other comprehensive income |
26 | |||||||||||||||
| Remeasurements of defined benefit plans |
26 | ( |
) | |||||||||||||
| Share of other comprehensive income of equity method investees |
12,26 | ( |
) | |||||||||||||
| |
|
|
|
|
|
|||||||||||
| Total of items that will not be reclassified to profit (loss) |
( |
) | ||||||||||||||
| |
|
|
|
|
|
|||||||||||
| Items that may be reclassified subsequently to profit (loss) |
||||||||||||||||
| Exchange differences on translating foreign operations |
26 | ( |
) | |||||||||||||
| Net changes in revaluation of financial assets measured at fair value through other comprehensive income |
26 | ( |
) | |||||||||||||
| Share of other comprehensive income of equity method investees |
12,26 | |||||||||||||||
| |
|
|
|
|
|
|||||||||||
| Total of items that may be reclassified subsequently to profit (loss) |
( |
) | ||||||||||||||
| |
|
|
|
|
|
|||||||||||
| Total other comprehensive income, net of tax |
26 | ( |
) | |||||||||||||
| |
|
|
|
|
|
|||||||||||
| Comprehensive income |
||||||||||||||||
| |
|
|
|
|
|
|||||||||||
| Comprehensive income for the period attributable to |
||||||||||||||||
| Toyota Motor Corporation |
||||||||||||||||
| Non-controlling interests |
||||||||||||||||
| |
|
|
|
|
|
|||||||||||
| Comprehensive income |
||||||||||||||||
| |
|
|
|
|
|
|||||||||||
Yen in millions |
||||||||||||||||||||||||||||||||||||
Notes |
Common stock |
Additional paid-in capital |
Retained earnings |
Other components of equity |
Treasury stock |
Toyota Motor Corporation shareholders’ equity |
Non- controlling interests |
Total shareholders’ equity |
||||||||||||||||||||||||||||
Balances at April 1, 2023 |
( |
) |
||||||||||||||||||||||||||||||||||
Comprehensive income |
||||||||||||||||||||||||||||||||||||
Net income |
— | — | — | — | ||||||||||||||||||||||||||||||||
Other comprehensive income, net of tax |
26 | — | — | — | — | |||||||||||||||||||||||||||||||
Total comprehensive income |
— | — | — | |||||||||||||||||||||||||||||||||
Transactions with owners and other |
||||||||||||||||||||||||||||||||||||
Dividends paid |
26 | — | — | ( |
) | — | — | ( |
) | ( |
) | ( |
) | |||||||||||||||||||||||
Repurchase of treasury stock |
26 | — | — | — | — | ( |
) | ( |
) | — | ( |
) | ||||||||||||||||||||||||
Reissuance of treasury stock |
26 | — | — | — | — | |||||||||||||||||||||||||||||||
Equity transactions and other |
— | ( |
) | — | — | — | ( |
) | ( |
) | ( |
) | ||||||||||||||||||||||||
Total transactions with owners and other |
— | ( |
) | ( |
) | — | ( |
) | ( |
) | ( |
) | ( |
) | ||||||||||||||||||||||
Reclassification to retained earnings |
26 | — | — | ( |
) | — | — | — | — | |||||||||||||||||||||||||||
Balances at March 31, 2024 |
( |
) | ||||||||||||||||||||||||||||||||||
Yen in millions |
||||||||||||||||||||||||||||||||||||
Notes |
Common stock |
Additional paid-in capital |
Retained earnings |
Other components of equity |
Treasury stock |
Toyota Motor Corporation shareholders’ equity |
Non- controlling interests |
Total shareholders’ equity |
||||||||||||||||||||||||||||
Balances at April 1, 2024 |
( |
) | ||||||||||||||||||||||||||||||||||
Comprehensive income |
||||||||||||||||||||||||||||||||||||
Net income |
— | — | — | — | ||||||||||||||||||||||||||||||||
Other comprehensive income, net of tax |
26 | — | — | — | ( |
) | — | ( |
) | ( |
) | |||||||||||||||||||||||||
Total comprehensive income |
— | — | ( |
) | — | |||||||||||||||||||||||||||||||
Transactions with owners and other |
||||||||||||||||||||||||||||||||||||
Dividends paid |
26 | — | — | ( |
) | — | — | ( |
) | ( |
) | ( |
) | |||||||||||||||||||||||
Repurchase of treasury stock |
26 | — | — | — | — | ( |
) | ( |
) | — | ( |
) | ||||||||||||||||||||||||
Reissuance of treasury stock |
26 | — | — | — | — | |||||||||||||||||||||||||||||||
Retirement of treasury stock |
26 | — | ( |
) | ( |
) | — | — | — | — | ||||||||||||||||||||||||||
Equity transactions and other |
— | — | — | — | ||||||||||||||||||||||||||||||||
Total transactions with owners and other |
— | ( |
) | — | ( |
) | ( |
) | ( |
) | ( |
) | ||||||||||||||||||||||||
Reclassification to retained earnings |
26 | — | — | ( |
) | — | — | — | — | |||||||||||||||||||||||||||
Balances at March 31, 2025 |
( |
) | ||||||||||||||||||||||||||||||||||
Yen in millions |
||||||||||||||||||||||||||||||||||||||||
Notes |
Common stock |
Additional paid-in capital |
Retained earnings |
Other components of equity |
Other comprehensive income associated with assets held for sale |
Treasury stock |
Toyota Motor Corporation shareholders’ equity |
Non- controlling interests |
Total shareholders’ equity |
|||||||||||||||||||||||||||||||
Balances at April 1, 2025 |
— |
( |
) |
|||||||||||||||||||||||||||||||||||||
Comprehensive income |
||||||||||||||||||||||||||||||||||||||||
Net income |
— |
— |
— |
— |
— |
|||||||||||||||||||||||||||||||||||
Other comprehensive income, net of tax |
26 |
— |
— |
— |
— |
— |
||||||||||||||||||||||||||||||||||
Total comprehensive income |
— |
— |
— |
— |
||||||||||||||||||||||||||||||||||||
Transactions with owners and other |
||||||||||||||||||||||||||||||||||||||||
Dividends paid |
26 |
— |
— |
( |
) |
— |
— |
— |
( |
) |
( |
) |
( |
) | ||||||||||||||||||||||||||
Repurchase of treasury stock |
26 |
— |
— |
— |
— |
— |
( |
) |
( |
) |
— |
( |
) | |||||||||||||||||||||||||||
Reissuance of treasury stock |
26 |
— |
— |
— |
— |
— |
||||||||||||||||||||||||||||||||||
Retirement of treasury stock |
26 |
— |
— |
— |
— |
— |
— |
— |
— |
— |
||||||||||||||||||||||||||||||
Equity transactions and other |
— |
( |
) |
— |
— |
— |
— |
( |
) |
|||||||||||||||||||||||||||||||
Total transactions with owners and other |
— |
( |
) |
( |
) |
— |
— |
( |
) |
( |
) |
( |
) |
( |
) | |||||||||||||||||||||||||
Reclassification to retained earnings |
26 |
— |
— |
( |
) |
— |
— |
— |
— |
— |
||||||||||||||||||||||||||||||
Transfer to other comprehensive income associated with assets held for sale |
|
11 26 |
|
— |
— |
— |
( |
) |
— |
— |
— |
— |
||||||||||||||||||||||||||||
Balances at March 31, 2026 |
( |
) |
||||||||||||||||||||||||||||||||||||||
Yen in millions |
||||||||||||||||
Notes |
For the year ended March 31, 2024 |
For the year ended March 31, 2025 |
For the year ended March 31, 2026 |
|||||||||||||
Cash flows from operating activities |
||||||||||||||||
Net income |
||||||||||||||||
Depreciation and amortization |
||||||||||||||||
Interest income and interest costs related to financial services, net |
( |
) | ( |
) | ( |
) | ||||||||||
Share of profit (loss) of investments accounted for using the equity method |
( |
) | ( |
) | ( |
) | ||||||||||
Income tax expense |
||||||||||||||||
Changes in operating assets and liabilities, and other |
( |
) | ( |
) | ( |
) | ||||||||||
(Increase) decrease in trade accounts and other receivables |
( |
) | ( |
) | ||||||||||||
(Increase) decrease in receivables related to financial services |
( |
) | ( |
) | ( |
) | ||||||||||
(Increase) decrease in inventories |
( |
) | ( |
) | ( |
) | ||||||||||
(Increase) decrease in other current assets |
( |
) | ( |
) | ( |
) | ||||||||||
Increase (decrease) in trade accounts and other payables |
||||||||||||||||
Increase (decrease) in other current liabilities |
||||||||||||||||
Increase (decrease) in retirement benefit liabilities |
( |
) | ||||||||||||||
Other, net |
( |
) | ( |
) | ||||||||||||
Interest received |
||||||||||||||||
Dividends received |
||||||||||||||||
Interest paid |
( |
) | ( |
) | ( |
) | ||||||||||
Income taxes paid, net of refunds |
( |
) | ( |
) | ( |
) | ||||||||||
Net cash provided by (used in) operating activities |
||||||||||||||||
Cash flows from investing activities |
||||||||||||||||
Additions to fixed assets excluding equipment leased to others |
( |
) | ( |
) | ( |
) | ||||||||||
Additions to equipment leased to others |
( |
) | ( |
) | ( |
) | ||||||||||
Proceeds from sales of fixed assets excluding equipment leased to others |
||||||||||||||||
Proceeds from sales of equipment leased to others |
||||||||||||||||
Additions to intangible assets |
( |
) | ( |
) | ( |
) | ||||||||||
Additions to public and corporate bonds and stocks |
( |
) | ( |
) | ( |
) | ||||||||||
Proceeds from sales of public and corporate bonds and stocks |
||||||||||||||||
Proceeds upon maturity of public and corporate bonds |
||||||||||||||||
Other, net |
35 | ( |
) | ( |
) | |||||||||||
Net cash provided by (used in) investing activities |
( |
) | ( |
) | ( |
) | ||||||||||
Cash flows from financing activities |
||||||||||||||||
Increase (decrease) in short-term debt |
18 | ( |
) | |||||||||||||
Proceeds from long-term debt |
18 | |||||||||||||||
Payments of long-term debt |
18 | ( |
) | ( |
) | ( |
) | |||||||||
Dividends paid to Toyota Motor Corporation common shareholders |
26 | ( |
) | ( |
) | ( |
) | |||||||||
Dividends paid to non-controlling interests |
( |
) | ( |
) | ( |
) | ||||||||||
Reissuance (repurchase) of treasury stock |
( |
) | ( |
) | ( |
) | ||||||||||
Other, net |
( |
) | ||||||||||||||
Net cash provided by (used in) financing activities |
( |
) | ||||||||||||||
Effect of exchange rate changes on cash and cash equivalents |
( |
) | ||||||||||||||
Net increase (decrease) in cash and cash equivalents |
( |
) | ||||||||||||||
Cash and cash equivalents at beginning of year |
6 | |||||||||||||||
Net increase (decrease) in cash and cash equivalents resulting from transfer to assets held for sale |
11 | ( |
) | |||||||||||||
Cash and cash equivalents at end of year |
6 | |||||||||||||||
Standards |
Standards names |
Mandatory adoption (from fiscal years beginning on or after) |
Reporting periods in which Toyota is scheduled to adopt the standards |
Overview of new or amended standards and interpretations | ||||
| Presentation and disclosure in financial statements |
Fiscal year ending |
Improved comparability in the statement of profit or loss (income statement) Enhanced transparency of management-defined performance measures More useful grouping of information in the financial statements |
Yen in millions |
||||||||||||||||||||
Automotive |
Financial services |
All other |
Inter-segment Elimination/ Unallocated Amount |
Consolidated |
||||||||||||||||
| Sales revenues |
||||||||||||||||||||
| Revenues from external customers |
— |
|||||||||||||||||||
| Inter-segment revenues and transfers |
( |
) |
— |
|||||||||||||||||
| Total |
( |
) |
||||||||||||||||||
| Operating expenses |
( |
) |
||||||||||||||||||
| |
|
|
|
|
|
|
|
|
|
|||||||||||
| Operating income |
( |
) | ||||||||||||||||||
| |
|
|
|
|
|
|
|
|
|
|||||||||||
| Total assets |
||||||||||||||||||||
| Investments accounted for using the equity method |
||||||||||||||||||||
| Depreciation and amortization |
— |
|||||||||||||||||||
| Capital expenditures |
( |
) |
||||||||||||||||||
Yen in millions |
||||||||||||||||||||
Automotive |
Financial services |
All other |
Inter-segment Elimination/ Unallocated Amount |
Consolidated |
||||||||||||||||
| Sales revenues |
||||||||||||||||||||
| Revenues from external customers |
— |
|||||||||||||||||||
| Inter-segment revenues and transfers |
( |
) |
— |
|||||||||||||||||
| |
|
|
|
|
|
|
|
|
|
|||||||||||
| Total |
( |
) |
||||||||||||||||||
| Operating expenses |
( |
) |
||||||||||||||||||
| |
|
|
|
|
|
|
|
|
|
|||||||||||
| Operating income |
( |
) | ||||||||||||||||||
| |
|
|
|
|
|
|
|
|
|
|||||||||||
| Total assets |
||||||||||||||||||||
| Investments accounted for using the equity method |
||||||||||||||||||||
| Depreciation and amortization |
— |
|||||||||||||||||||
| Capital expenditures |
||||||||||||||||||||
Yen in millions |
||||||||||||||||||||
Automotive |
Financial services |
All other |
Inter-segment Elimination/ Unallocated Amount |
Consolidated |
||||||||||||||||
| Sales revenues |
||||||||||||||||||||
| Revenues from external customers |
— |
|||||||||||||||||||
| Inter-segment revenues and transfers |
( |
) | — |
|||||||||||||||||
| |
|
|
|
|
|
|
|
|
|
|||||||||||
| Total |
( |
) |
||||||||||||||||||
| Operating expenses |
( |
) |
||||||||||||||||||
| |
|
|
|
|
|
|
|
|
|
|||||||||||
| Operating income |
||||||||||||||||||||
| |
|
|
|
|
|
|
|
|
|
|||||||||||
| Total assets |
||||||||||||||||||||
| Investments accounted for using the equity method |
||||||||||||||||||||
| Depreciation and amortization |
— |
|||||||||||||||||||
| Capital expenditures |
||||||||||||||||||||
Yen in millions |
||||||||||||
For the years ended March 31, |
||||||||||||
2024 |
2025 |
2026 |
||||||||||
| Japan |
||||||||||||
| United States |
||||||||||||
| Other |
||||||||||||
| |
|
|
|
|
|
|||||||
| Total |
||||||||||||
| |
|
|
|
|
|
|||||||
Yen in millions |
||||||||||||
March 31, |
||||||||||||
2024 |
2025 |
2026 |
||||||||||
| Japan |
||||||||||||
| United States |
||||||||||||
| Other |
||||||||||||
| |
|
|
|
|
|
|||||||
| Total |
||||||||||||
| |
|
|
|
|
|
|||||||
Yen in millions |
||||||||
March 31, |
||||||||
2025 |
2026 |
|||||||
| Cash and deposits |
||||||||
| Negotiable certificate of deposit and other |
||||||||
| |
|
|
|
|||||
| Total |
|
|
||||||
| |
|
|
|
|||||
Yen in millions |
||||||||
March 31, |
||||||||
2025 |
2026 |
|||||||
| Accounts and notes receivables |
||||||||
| Other receivables |
||||||||
| Allowance for doubtful accounts |
( |
) | ( |
) | ||||
| |
|
|
|
|||||
| Total |
|
|
||||||
| |
|
|
|
|||||
Yen in millions |
||||||||
For the years ended March 31, |
||||||||
2025 |
2026 |
|||||||
| Allowance for doubtful accounts at beginning of year |
||||||||
| Provision for doubtful accounts, net of reversal |
||||||||
| Write-offs |
( |
) | ( |
) | ||||
| Other |
( |
) | ( |
) | ||||
| |
|
|
|
|||||
| Allowance for doubtful accounts at end of year |
|
|
||||||
| |
|
|
|
|||||
Yen in millions |
||||||||
March 31, |
||||||||
2025 |
2026 |
|||||||
| Retail |
||||||||
| Finance leases |
||||||||
| Wholesale and other dealer loans |
||||||||
| |
|
|
|
|||||
| Total |
||||||||
| |
|
|
|
|||||
| Deferred origination costs |
||||||||
| Less - Unearned income |
( |
) | ( |
) | ||||
| Less - Allowance for credit losses |
||||||||
| Retail |
( |
) | ( |
) | ||||
| Finance leases |
( |
) | ( |
) | ||||
| Wholesale and other dealer loans |
( |
) | ( |
) | ||||
| |
|
|
|
|||||
| Total finance receivables, net |
||||||||
| |
|
|
|
|||||
| Current assets |
||||||||
| Non-current assets |
||||||||
| |
|
|
|
|||||
| Total finance receivables, net |
||||||||
| |
|
|
|
|||||
March 31, |
||||||||
2025 |
2026 |
|||||||
| North America |
% | % | ||||||
| Europe |
||||||||
| Asia |
||||||||
| Japan |
||||||||
| Other |
|
|||||||
Yen in millions |
||||||||||||
March 31, 2025 |
||||||||||||
Retail |
Finance leases |
Wholesale and other dealer loans |
||||||||||
| Within 1 year |
||||||||||||
| Between 1 and 2 years |
||||||||||||
| Between 2 and 3 years |
||||||||||||
| Between 3 and 4 years |
||||||||||||
| Between 4 and 5 years |
||||||||||||
| Later than 5 years |
||||||||||||
| |
|
|
|
|
|
|||||||
| Total |
||||||||||||
| |
|
|
|
|
|
|||||||
Yen in millions |
||||||||||||
March 31, 2026 |
||||||||||||
Retail |
Finance leases |
Wholesale and other dealer loans |
||||||||||
| Within 1 year |
||||||||||||
| Between 1 and 2 years |
||||||||||||
| Between 2 and 3 years |
||||||||||||
| Between 3 and 4 years |
||||||||||||
| Between 4 and 5 years |
||||||||||||
| Later than 5 years |
||||||||||||
| |
|
|
|
|
|
|||||||
| Total |
||||||||||||
| |
|
|
|
|
|
|||||||
Yen in millions |
||||||||
March 31, |
||||||||
2025 |
2026 |
|||||||
| Lease payments |
||||||||
| Estimated unguaranteed residual values |
||||||||
| |
|
|
|
|||||
| Total |
||||||||
| |
|
|
|
|||||
| Deferred origination costs |
||||||||
| Less - Unearned income |
( |
) | ( |
) | ||||
| Less - Allowance for credit losses |
( |
) | ( |
) | ||||
| |
|
|
|
|||||
| Finance leases receivables, net |
||||||||
| |
|
|
|
|||||
Yen in millions |
||||||||
March 31, |
||||||||
2025 |
2026 |
|||||||
| Financial assets measured at amortized cost |
||||||||
| Time deposits |
||||||||
| Other |
||||||||
| Financial assets measured at fair value through profit or loss |
||||||||
| Public and corporate bonds |
||||||||
| Stocks |
||||||||
| Investment trusts |
||||||||
| Derivatives |
||||||||
| Financial assets measured at fair value through other comprehensive income |
||||||||
| Public and corporate bonds |
||||||||
| Stocks |
||||||||
| Other |
||||||||
| |
|
|
|
|||||
| Total |
||||||||
| |
|
|
|
|||||
| Current assets |
||||||||
| Non-current assets |
||||||||
| |
|
|
|
|||||
| Total |
||||||||
| |
|
|
|
|||||
Yen in millions |
||||||||
March 31, |
||||||||
| Issue |
2025 |
2026 |
||||||
| KDDI CORPORATION |
|
|
||||||
| NTT, Inc. |
||||||||
| MS&AD Insurance Group Holdings, Inc. |
||||||||
| Mitsubishi UFJ Financial Group, Inc. |
||||||||
| SUZUKI MOTOR CORPORATION |
||||||||
Yen in millions |
||||||||
For the years ended March 31, |
||||||||
2025 |
2026 |
|||||||
| Total fair value |
|
|
||||||
| Accumulated other comprehensive income, net |
||||||||
Yen in millions |
||||||||
March 31, |
||||||||
2025 |
2026 |
|||||||
| Products |
||||||||
| Work in process |
||||||||
| Raw materials |
||||||||
| Supplies and other |
||||||||
| |
|
|
|
|||||
| Total |
||||||||
| |
|
|
|
|||||
Yen in millions |
||||||||
March 31, |
||||||||
2025 |
2026 |
|||||||
| Assets held for sale |
||||||||
| Cash and cash equivalents |
||||||||
| Trade accounts and other receivables |
||||||||
| Inventories |
||||||||
| Investments accounted for using the equity method |
— | |||||||
| Property, plant and equipment |
||||||||
| Land |
||||||||
| Buildings |
||||||||
| Machinery and equipment |
||||||||
| Other property, plant and equipment |
||||||||
| |
|
|
|
|||||
| Total property, plant and equipment, at cost |
||||||||
| |
|
|
|
|||||
| Less - Accumulated depreciation and impairment losses |
( |
) | ||||||
| |
|
|
|
|||||
| Total property, plant and equipment, net |
||||||||
| |
|
|
|
|||||
| Other assets |
||||||||
| |
|
|
|
|||||
| Total |
||||||||
| |
|
|
|
|||||
| Liabilities directly associated with assets held for sale |
||||||||
| Trade accounts and other payables |
||||||||
| Short-term and current portion of long-term debt |
||||||||
| Accrued expenses |
||||||||
| Liabilities for quality assurance |
||||||||
| Long-term debt |
||||||||
| Other liabilities |
||||||||
| |
|
|
|
|||||
| Total |
||||||||
| |
|
|
|
|||||
| Other comprehensive income associated with assets held for sale |
||||||||
| Other components of equity |
||||||||
| Net changes in revaluation of financial assets measured at fair value through other comprehensive income |
||||||||
| Exchange differences on translating foreign operations |
||||||||
| |
|
|
|
|||||
| Total |
||||||||
| |
|
|
|
|||||
Yen in millions |
||||||||
March 31, |
||||||||
2025 |
2026 |
|||||||
| Associates |
||||||||
| Joint ventures |
||||||||
| |
|
|
|
|||||
| Total |
||||||||
| |
|
|
|
|||||
Yen in millions |
||||||||||||
For the years ended March 31, |
||||||||||||
2024 |
2025 |
2026 |
||||||||||
| Net income |
||||||||||||
| Associates |
||||||||||||
| Joint ventures |
||||||||||||
| Total |
||||||||||||
| Other comprehensive income, net of tax |
||||||||||||
| Associates |
||||||||||||
| Joint ventures |
||||||||||||
| Total |
||||||||||||
| Comprehensive income |
||||||||||||
| Associates |
||||||||||||
| Joint ventures |
||||||||||||
| Total |
||||||||||||
Yen in millions |
||||||||||||||||||||||||
Land |
Buildings |
Machinery and equipment |
Vehicles and equipment on operating leases |
Construction in progress |
Total |
|||||||||||||||||||
| Balance as of April 1, 2024 |
|
|
|
|||||||||||||||||||||
| |
|
|
|
|
|
|
|
|
|
|
|
|||||||||||||
| Additions |
||||||||||||||||||||||||
| Sales or disposal |
( |
) | ( |
) | ( |
) | ( |
) | ( |
) | ( |
) | ||||||||||||
| Reclassification from construction in progress |
( |
) | — | |||||||||||||||||||||
| Foreign currency translation adjustments |
( |
) | ( |
) | ( |
) | ( |
) | ( |
) | ||||||||||||||
| Other |
( |
) | ( |
) | ( |
) | ( |
) | ( |
) | ||||||||||||||
| |
|
|
|
|
|
|
|
|
|
|
|
|||||||||||||
| Balance as of March 31, 2025 |
||||||||||||||||||||||||
| |
|
|
|
|
|
|
|
|
|
|
|
|||||||||||||
| Additions |
||||||||||||||||||||||||
| Sales or disposal |
( |
) | ( |
) | ( |
) | ( |
) | ( |
) | ( |
) | ||||||||||||
| Reclassification from construction in progress |
( |
) | — | |||||||||||||||||||||
| Foreign currency translation adjustments |
||||||||||||||||||||||||
| Transfer to assets held for sale |
( |
) | ( |
) | ( |
) | ( |
) | ( |
) | ( |
) | ||||||||||||
| Other |
( |
) | ( |
) | ( |
) | ( |
) | ( |
) | ||||||||||||||
| |
|
|
|
|
|
|
|
|
|
|
|
|||||||||||||
| Balance as of March 31, 2026 |
||||||||||||||||||||||||
| |
|
|
|
|
|
|
|
|
|
|
|
|||||||||||||
Yen in millions |
||||||||||||||||||||||||
Land |
Buildings |
Machinery and equipment |
Vehicles and equipment on operating leases |
Construction in progress |
Total |
|||||||||||||||||||
| Balance as of April 1, 2024 |
( |
) | ( |
) | ( |
) | ( |
) | ( |
) | ( |
) | ||||||||||||
| |
|
|
|
|
|
|
|
|
|
|
|
|||||||||||||
| Depreciation |
— | ( |
) | ( |
) | ( |
) | — | ( |
) | ||||||||||||||
| Impairment losses |
— | — | — | — | — | — | ||||||||||||||||||
| Sales or disposal |
— | |||||||||||||||||||||||
| Foreign currency translation adjustments |
( |
) | ||||||||||||||||||||||
| Other |
( |
) | ( |
) | ( |
) | ( |
) | ( |
) | ||||||||||||||
| |
|
|
|
|
|
|
|
|
|
|
|
|||||||||||||
| Balance as of March 31, 2025 |
( |
) | ( |
) | ( |
) | ( |
) | ( |
) | ( |
) | ||||||||||||
| |
|
|
|
|
|
|
|
|
|
|
|
|||||||||||||
| Depreciation |
— | ( |
) | ( |
) | ( |
) | — | ( |
) | ||||||||||||||
| Impairment losses |
— | ( |
) |
( |
) |
— | — | ( |
) | |||||||||||||||
| Sales or disposal |
— | |||||||||||||||||||||||
| Foreign currency translation adjustments |
( |
) | ( |
) | ( |
) | ( |
) | ( |
) | ( |
) | ||||||||||||
| Transfer to assets held for sale |
||||||||||||||||||||||||
| Other |
( |
) | ( |
) | ( |
) | ( |
) | ||||||||||||||||
| |
|
|
|
|
|
|
|
|
|
|
|
|||||||||||||
| Balance as of March 31, 2026 . . |
( |
) | ( |
) | ( |
) | ( |
) | ( |
) | ( |
) | ||||||||||||
| |
|
|
|
|
|
|
|
|
|
|
|
|||||||||||||
Yen in millions |
||||||||
March 31, |
||||||||
2025 |
2026 |
|||||||
| Vehicles |
||||||||
| Equipment |
||||||||
| |
|
|
|
|||||
| Less - Accumulated depreciation |
( |
) | ( |
) | ||||
| |
|
|
|
|||||
| Vehicles and equipment on operating leases, net |
||||||||
| |
|
|
|
|||||
Yen in millions |
||||||||
March 31, |
||||||||
2025 |
2026 |
|||||||
| Within 1 year |
||||||||
| Between 1 and 2 years |
||||||||
| Between 2 and 3 years |
||||||||
| Between 3 and 4 years |
||||||||
| Between 4 and 5 years |
||||||||
| Later than 5 years |
||||||||
| |
|
|
|
|||||
| Total future rentals |
|
|
||||||
| |
|
|
|
|||||
Yen in millions |
||||||||
March 31, |
||||||||
2025 |
2026 |
|||||||
| Types of original assets |
||||||||
| Land |
||||||||
| Buildings |
||||||||
| Other |
||||||||
| |
|
|
|
|||||
| Total |
583,068 | 901,232 | ||||||
| |
|
|
|
|||||
Yen in millions |
||||||||||||
March 31, |
||||||||||||
2024 |
2025 |
2026 |
||||||||||
| Depreciation of right of use assets |
||||||||||||
| Land |
||||||||||||
| Buildings |
||||||||||||
| Other |
||||||||||||
| |
|
|
|
|
|
|||||||
| Total |
||||||||||||
| |
|
|
|
|
|
|||||||
| Interest expense on lease liabilities |
||||||||||||
| Short-term leases |
||||||||||||
| |
|
|
|
|
|
|||||||
| |
|
|
||||||||||
| |
|
|
|
|
|
|||||||
Yen in millions |
||||||||
March 31, |
||||||||
2025 |
2026 |
|||||||
| Within 1 year |
||||||||
| Between 1 and 5 years |
||||||||
| Later than 5 years |
||||||||
| |
|
|
|
|||||
| Future lease payment, total |
|
|
||||||
| Less - Interest expense |
( |
) | ( |
) | ||||
| |
|
|
|
|||||
| Present value of lease payment, total |
||||||||
| |
|
|
|
|||||
| Current liabilities |
||||||||
| Non-current liabilities |
||||||||
| |
|
|
|
|||||
| Present value of lease payment, total |
||||||||
| |
|
|
|
|||||
Yen in millions |
||||||||
March 31, |
||||||||
2025 |
2026 |
|||||||
| Capitalized development costs |
||||||||
| Software and other |
||||||||
| |
|
|
|
|||||
| Total |
|
|
||||||
| |
|
|
|
|||||
Yen in millions |
||||||||||||
Capitalized development costs |
Software and other |
Total |
||||||||||
| Balance as of April 1, 2024 |
||||||||||||
| |
|
|
|
|
|
|||||||
| Additions |
||||||||||||
| Internally developed |
||||||||||||
| Sales or disposal |
( |
) | ( |
) | ( |
) | ||||||
| Foreign currency translation adjustments |
( |
) | ( |
) | ( |
) | ||||||
| Other |
( |
) | ( |
) | ( |
) | ||||||
| |
|
|
|
|
|
|||||||
| Balance as of March 31, 2025 |
||||||||||||
| |
|
|
|
|
|
|||||||
| Additions |
||||||||||||
| Internally developed |
||||||||||||
| Sales or disposal |
( |
) | ( |
) | ( |
) | ||||||
| Foreign currency translation adjustments |
||||||||||||
| Other |
( |
) | ( |
) | ( |
) | ||||||
| |
|
|
|
|
|
|||||||
| Balance as of March 31, 2026 |
||||||||||||
| |
|
|
|
|
|
|||||||
| (Accumulated amortization) |
| |||||||||||
Yen in millions |
||||||||||||
Capitalized development costs |
Software and other |
Total |
||||||||||
| Balance as of April 1, 2024 |
( |
) | ( |
) | ( |
) | ||||||
| |
|
|
|
|
|
|||||||
| Amortization |
( |
) | ( |
) | ( |
) | ||||||
| Sales or disposal |
|
|||||||||||
| Foreign currency translation adjustments |
||||||||||||
| Other |
( |
) | ( |
) | ||||||||
| |
|
|
|
|
|
|||||||
| Balance as of March 31, 2025 |
( |
) | ( |
) | ( |
) | ||||||
| |
|
|
|
|
|
|||||||
| Amortization |
( |
) | ( |
) | ( |
) | ||||||
| Sales or disposal |
||||||||||||
| Foreign currency translation adjustments |
( |
) | ( |
) | ||||||||
| Other |
||||||||||||
| |
|
|
|
|
|
|||||||
| Balance as of March 31, 2026 |
( |
) | ( |
) | ( |
) | ||||||
| |
|
|
|
|
|
|||||||
Yen in millions |
||||||||
March 31, |
||||||||
2025 |
2026 |
|||||||
| Deferred tax assets |
||||||||
| Defined benefit plan liabilities |
||||||||
| Accrued expenses and liabilities for quality assurance |
||||||||
| Other accrued employees’ compensation |
||||||||
| Operating loss carryforwards for tax purposes |
||||||||
| Allowance for doubtful accounts and credit losses |
||||||||
| Property, plant and equipment and other assets |
||||||||
| Other |
||||||||
| |
|
|
|
|||||
| Total deferred tax assets |
||||||||
| |
|
|
|
|||||
| Deferred tax liabilities |
||||||||
| Changes in fair value of financial instruments measured in other comprehensive income |
( |
) | ( |
) | ||||
| Undistributed earnings of foreign subsidiaries |
( |
) | ( |
) | ||||
| Undistributed earnings of associates and joint ventures |
( |
) | ( |
) | ||||
| Basis difference of acquired assets |
( |
) | ( |
) | ||||
| Capitalized development costs |
( |
) | ( |
) | ||||
| Lease transactions |
( |
) | ( |
) | ||||
| Other |
( |
) | ( |
) | ||||
| |
|
|
|
|||||
| Total deferred tax liabilities |
( |
) | ( |
) | ||||
| |
|
|
|
|||||
| Net deferred tax assets and liabilities |
( |
) | ( |
) | ||||
| |
|
|
|
|||||
Yen in millions |
||||||||||||
For the years ended March 31, |
||||||||||||
2024 |
2025 |
2026 |
||||||||||
| Defined benefit plan liabilities |
( |
) | ||||||||||
| Accrued expenses and liabilities for quality assurance |
||||||||||||
| Other accrued employees’ compensation |
||||||||||||
| Operating loss carryforwards for tax purposes |
( |
) | ( |
) | ||||||||
| Allowance for doubtful accounts and credit losses |
( |
) | ||||||||||
| Property, plant and equipment and other assets |
||||||||||||
| Undistributed earnings of foreign subsidiaries |
( |
) | ( |
) | ||||||||
| Undistributed earnings of associates and joint ventures |
( |
) | ( |
) | ( |
) | ||||||
| Basis difference of acquired assets |
( |
) | ||||||||||
| Capitalized development costs |
|
|||||||||||
| Lease transactions |
( |
) | ||||||||||
| Other |
( |
) | ||||||||||
| |
|
|
|
|
|
|||||||
| Total |
||||||||||||
| |
|
|
|
|
|
|||||||
Yen in millions |
||||||||
March 31, |
||||||||
2025 |
2026 |
|||||||
| Deductible temporary difference |
||||||||
| Carryforwards of tax losses |
||||||||
| Carryforwards of tax credit |
||||||||
| |
|
|
|
|||||
| Total |
||||||||
| |
|
|
|
|||||
Yen in millions |
||||||||
March 31, |
||||||||
2025 |
2026 |
|||||||
| Within 5 years |
||||||||
| Between 5 and 10 years |
| |||||||
| Later than 10 years |
||||||||
| |
|
|
|
|||||
| Total |
||||||||
| |
|
|
|
|||||
Yen in millions |
||||||||
March 31, |
||||||||
2025 |
2026 |
|||||||
Within 5 years |
||||||||
Between 5 and 10 years |
||||||||
Later than 10 years |
||||||||
Total |
||||||||
Yen in millions |
||||||||||||
For the years ended March 31, |
||||||||||||
2024 |
2025 |
2026 |
||||||||||
Current income tax expense: |
||||||||||||
TMC and domestic subsidiaries |
||||||||||||
Foreign subsidiaries |
||||||||||||
Total current |
||||||||||||
Deferred income tax expense (benefit): |
||||||||||||
TMC and domestic subsidiaries |
( |
) | ( |
) | ( |
) | ||||||
Foreign subsidiaries |
( |
) | ||||||||||
Total deferred |
( |
) | ( |
) | ( |
) | ||||||
Total income tax expense |
||||||||||||
For the years ended March 31, |
||||||||||||
2024 |
2025 |
2026 |
||||||||||
Statutory tax rate |
% | % | % | |||||||||
Increase (reduction) in taxes resulting from: |
||||||||||||
Non-deductible expenses |
||||||||||||
Tax-exempt income |
( |
) | ( |
) | ( |
) | ||||||
Deferred tax liabilities on undistributed earnings of foreign subsidiaries |
||||||||||||
Effects of investments accounted for using the equity method |
( |
) | ( |
) | ( |
) | ||||||
Deferred tax liabilities on undistributed earnings of associates and joint ventures |
||||||||||||
Change in unrecognized deferred tax assets |
||||||||||||
Tax credits |
( |
) | ( |
) | ( |
) | ||||||
The difference between the statutory tax rate in Japan and that of foreign subsidiaries |
( |
) | ( |
) | ( |
) | ||||||
Unrecognized tax benefits adjustments |
( |
) | ( |
) | ||||||||
Revision to deferred tax assets and liabilities at the fiscal year-end due to changes in tax rates |
||||||||||||
Other |
||||||||||||
Average effective tax rate |
% | % | % | |||||||||
Yen in millions |
||||||||
March 31, |
||||||||
2025 |
2026 |
|||||||
| Accounts and notes payables |
||||||||
| Other payables |
||||||||
| |
|
|
|
|||||
| Total |
||||||||
| |
|
|
|
|||||
Yen in millions |
||||||||||||||||||||||||||||||||
Non-cash changes |
||||||||||||||||||||||||||||||||
As of April 1, 2024 |
Cash flow |
Acquisitions |
Reclassification |
Changes in foreign currency exchange rates |
Changes in fair value |
Other |
As of March 31, 2025 |
|||||||||||||||||||||||||
| Current liabilities |
||||||||||||||||||||||||||||||||
| Short-term debt |
— | — | ( |
) | — | |||||||||||||||||||||||||||
| Current portion of long-term debt |
( |
) | — | ( |
) | — | ||||||||||||||||||||||||||
| Current portion of long-term lease liabilities |
( |
) | — | ( |
) | — | ||||||||||||||||||||||||||
| |
|
|
|
|
|
|
|
|
|
|
|
|
|
|
|
|||||||||||||||||
| Current liabilities |
( |
) | — | ( |
) | — | |
|||||||||||||||||||||||||
| |
|
|
|
|
|
|
|
|
|
|
|
|
|
|
|
|||||||||||||||||
| Non-current liabilities |
||||||||||||||||||||||||||||||||
| Long-term debt |
— | ( |
) | ( |
) | — | ||||||||||||||||||||||||||
| Long-term lease liabilities |
— | ( |
) | ( |
) | — | ( |
) | ||||||||||||||||||||||||
| |
|
|
|
|
|
|
|
|
|
|
|
|
|
|
|
|||||||||||||||||
| Non-current liabilities |
( |
) | ( |
) | — | ( |
) | |||||||||||||||||||||||||
| |
|
|
|
|
|
|
|
|
|
|
|
|
|
|
|
|||||||||||||||||
| Total |
— | ( |
) | — | ||||||||||||||||||||||||||||
| |
|
|
|
|
|
|
|
|
|
|
|
|
|
|
|
|||||||||||||||||
| Derivatives |
( |
) | ( |
) | — | — | ( |
) | — | |||||||||||||||||||||||
Yen in millions |
||||||||||||||||||||||||||||||||
Non-cash changes |
||||||||||||||||||||||||||||||||
As of April 1, 2025 |
Cash flow |
Acquisitions |
Reclassification |
Changes in foreign currency exchange rates |
Changes in fair value |
Other |
As of March 31, 2026 |
|||||||||||||||||||||||||
Current liabilities |
||||||||||||||||||||||||||||||||
Short-term debt |
( |
) | — | — | — | ( |
) | |||||||||||||||||||||||||
Current portion of long-term debt |
( |
) | — | — | ||||||||||||||||||||||||||||
Current portion of long-term lease liabilities |
( |
) | — | — | ( |
) | ||||||||||||||||||||||||||
Current liabilities |
( |
) | — | — | ( |
) | ||||||||||||||||||||||||||
Non-current liabilities |
||||||||||||||||||||||||||||||||
Long-term debt |
— | ( |
) | — | ( |
) | ||||||||||||||||||||||||||
Long-term lease liabilities |
— | ( |
) | — | ( |
) | ||||||||||||||||||||||||||
Non-current liabilities |
( |
) | — | ( |
) | |||||||||||||||||||||||||||
Total |
— | — | ( |
) | ||||||||||||||||||||||||||||
| ) | ||||||||||||||||||||||||||||||||
Derivatives |
( |
) | — | — | ( |
) |
( |
) | — | ( |
) | |||||||||||||||||||||
Yen in millions |
||||||||
March 31, |
||||||||
2025 |
2026 |
|||||||
Short-term debt |
||||||||
(Principally from bank) |
||||||||
[Weighted average interest rate |
||||||||
2025 |
||||||||
2026 |
||||||||
Commercial paper |
||||||||
[Weighted average interest rate |
||||||||
2025 |
||||||||
2026 |
||||||||
Yen in millions |
||||||||
March 31, |
||||||||
2025 |
2026 |
|||||||
Unsecured loans |
||||||||
(Principally from bank) |
||||||||
[2025 |
||||||||
Weighted average interest |
||||||||
Due |
||||||||
2026 |
||||||||
Weighted average interest |
||||||||
Due |
||||||||
Secured loans |
||||||||
(Principally financial receivables securitization) |
||||||||
[2025 |
||||||||
Weighted average interest |
||||||||
Due |
||||||||
2026 |
||||||||
Weighted average interest |
||||||||
Due |
||||||||
Unsecured bonds of the parent |
||||||||
[2025 |
||||||||
Weighted average interest |
||||||||
Due |
||||||||
2026 |
||||||||
Weighted average interest |
||||||||
Due |
||||||||
Unsecured bonds and medium-term notes of consolidated subsidiaries |
||||||||
[2025 |
||||||||
Weighted average interest |
||||||||
Due |
||||||||
2026 |
||||||||
Weighted average interest |
||||||||
Due |
||||||||
Secured bonds of consolidated subsidiaries |
||||||||
[2025 |
||||||||
Weighted average interest |
||||||||
Due |
||||||||
2026 |
||||||||
Weighted average interest |
||||||||
Due |
||||||||
Less - Current portion due within one year |
( |
) | ( |
) | ||||
| |
|
|||||||
Yen in millions |
||||||||
March 31, |
||||||||
2025 |
2026 |
|||||||
| Property, plant and equipment |
||||||||
| Other assets |
||||||||
| |
|
|
|
|||||
| Total |
|
|
||||||
| |
|
|
|
|||||
Yen in millions |
||||||||
March 31, |
||||||||
2025 |
2026 |
|||||||
| Financial liabilities measured at amortized cost |
||||||||
| Deposits received |
||||||||
| Other |
||||||||
| Financial liabilities measured at fair value through profit or loss |
||||||||
| Derivatives |
||||||||
| |
|
|
|
|||||
| Total |
||||||||
| |
|
|
|
|||||
| Current liabilities |
||||||||
| Non-current liabilities |
||||||||
| |
|
|
|
|||||
| Total |
||||||||
| |
|
|
|
|||||
Yen in millions |
||||||||||||||||
For the year ended March 31, 2025 |
||||||||||||||||
Expected credit loss for 12 months |
Lifetime expected credit loss |
Total |
||||||||||||||
Financial receivable not credit-impaired |
Credit-impaired financial receivable |
|||||||||||||||
Allowance for credit loss at beginning of year |
||||||||||||||||
Provision for credit loss, net of reversal |
||||||||||||||||
Charge-offs |
— | — | ( |
) |
( |
) | ||||||||||
Other |
( |
) | ||||||||||||||
Allowance for credit loss at end of year |
||||||||||||||||
Yen in millions |
||||||||||||||||
For the year ended March 31, 2026 |
||||||||||||||||
Expected credit loss for 12 months |
Lifetime expected credit loss |
Total |
||||||||||||||
Financial receivable not credit-impaired |
Credit-impaired financial receivable |
|||||||||||||||
Allowance for credit loss at beginning of year |
||||||||||||||||
Provision for credit loss, net of reversal |
( |
) |
||||||||||||||
Charge-offs |
— | — | ( |
) |
( |
) | ||||||||||
Other |
||||||||||||||||
Allowance for credit loss at end of year |
||||||||||||||||
Yen in millions |
||||||||||||||||
March 31, 2025 |
||||||||||||||||
Expected credit loss for 12 months |
Lifetime expected credit loss |
Total |
||||||||||||||
Financial receivable not credit-impaired |
Credit-impaired financial receivable |
|||||||||||||||
Current |
|
|||||||||||||||
Past due less than 90 days |
| |||||||||||||||
Past due 90 days or more |
— | |||||||||||||||
Total |
|
|
||||||||||||||
Yen in millions |
||||||||||||||||
March 31, 2026 |
||||||||||||||||
Expected credit loss for 12 months |
Lifetime expected credit loss |
Total |
||||||||||||||
Financial receivable not credit-impaired |
Credit-impaired financial receivable |
|||||||||||||||
Current |
||||||||||||||||
Past due less than 90 days |
||||||||||||||||
Past due 90 days or more |
— | |||||||||||||||
Total |
|
|
||||||||||||||
Yen in millions |
||||||||
For the years ended March 31, |
||||||||
2025 |
2026 |
|||||||
Allowance for credit loss at beginning of year |
||||||||
Provision for credit loss, net of reversal |
||||||||
Charge-offs |
( |
) | ( |
) | ||||
Other |
( |
) | ||||||
Allowance for credit loss at end of year |
||||||||
Yen in millions |
||||||||
March 31, |
||||||||
| 2025 | 2026 | |||||||
Current |
||||||||
Past due less than 90 days |
||||||||
Past due 90 days or more |
||||||||
Total |
4,154,650 | |||||||
Yen in millions |
||||||||||||||||
For the year ended March 31, 2025 |
||||||||||||||||
Expected credit loss for 12 months |
Lifetime expected credit loss |
Total |
||||||||||||||
Financial receivable not credit-impaired |
Credit-impaired financial receivable |
|||||||||||||||
| Allowance for credit loss at beginning of year |
17,481 | |||||||||||||||
| Provision for credit loss, net of reversal |
( |
) | ||||||||||||||
| Charge-offs |
— | — | ( |
) | ( |
) | ||||||||||
| Other |
( |
) | ( |
) | ||||||||||||
| |
|
|
|
|
|
|
|
|||||||||
| Allowance for credit loss at end of year |
37,791 | |||||||||||||||
| |
|
|
|
|
|
|
|
|||||||||
Yen in millions |
||||||||||||||||
For the year ended March 31, 2026 |
||||||||||||||||
Expected credit loss for 12 months |
Lifetime expected credit loss |
Total |
||||||||||||||
Financial receivable not credit-impaired |
Credit-impaired financial receivable |
|||||||||||||||
| Allowance for credit loss at beginning of year |
24,697 | 37,791 | ||||||||||||||
| Provision for credit loss, net of reversal |
||||||||||||||||
| Charge-offs |
— | — | ( |
) | ( |
) | ||||||||||
| Other |
||||||||||||||||
| |
|
|
|
|
|
|
|
|||||||||
| Allowance for credit loss at end of year |
||||||||||||||||
| |
|
|
|
|
|
|
|
|||||||||
Yen in millions |
||||||||||||||||
March 31, 2025 |
||||||||||||||||
Expected credit loss for 12 months |
Lifetime expected credit loss |
|||||||||||||||
Financial receivable not credit-impaired |
Credit-impaired financial receivable |
Total |
||||||||||||||
| Wholesale and other dealer loans |
||||||||||||||||
| Performing |
— | — | ||||||||||||||
| Credit Watch |
— | |||||||||||||||
| At Risk |
— | |||||||||||||||
| Default |
— | — | ||||||||||||||
| Loan commitments |
||||||||||||||||
| Financial guarantee contracts |
— | |||||||||||||||
| |
|
|
|
|
|
|
|
|||||||||
| Total |
||||||||||||||||
| |
|
|
|
|
|
|
|
|||||||||
Yen in millions |
||||||||||||||||
March 31, 2026 |
||||||||||||||||
Expected credit loss for 12 months |
Lifetime expected credit loss |
|||||||||||||||
Financial receivable not credit-impaired |
Credit-impaired financial receivable |
Total |
||||||||||||||
| Wholesale and other dealer loan s |
||||||||||||||||
| Performing |
— | — | ||||||||||||||
| Credit Watch |
— | |||||||||||||||
| At Risk |
— | |||||||||||||||
| Default |
— | — | ||||||||||||||
| Loan commitments |
||||||||||||||||
| Financial guarantee contracts |
— | |||||||||||||||
| |
|
|
|
|
|
|
|
|||||||||
| Total |
||||||||||||||||
| |
|
|
|
|
|
|
|
|||||||||
Yen in millions |
||||||||||||||||||||||||
Maturities |
||||||||||||||||||||||||
Book value |
Contractual cash flows |
Within 1 year |
Between 1 and 3 years |
Between 3 and 5 years |
Later than 5 years |
|||||||||||||||||||
| Non-derivative financial liabilities |
||||||||||||||||||||||||
| Short-term debt |
( |
) | ( |
) | — | — | — | |||||||||||||||||
| Commercial paper |
( |
) | ( |
) | — | — | — | |||||||||||||||||
| Long-term debt |
( |
) | ( |
) | ( |
) | ( |
) | ( |
) | ||||||||||||||
| Lease liabilities |
( |
) | ( |
) | ( |
) | ( |
) | ( |
) | ||||||||||||||
| |
|
|
|
|
|
|
|
|
|
|
|
|||||||||||||
| Total |
( |
) | ( |
) | ( |
) | ( |
) | ( |
) | ||||||||||||||
| |
|
|
|
|
|
|
|
|
|
|
|
|||||||||||||
| Derivative financial liabilities |
||||||||||||||||||||||||
| Interest derivatives |
( |
) | ( |
) | ( |
) | ( |
) | ( |
) | ||||||||||||||
| Currency derivatives |
||||||||||||||||||||||||
| In |
— | |||||||||||||||||||||||
| Out |
( |
) | ( |
) | ( |
) | ( |
) | ( |
) | ||||||||||||||
| |
|
|
|
|
|
|
|
|
|
|
|
|||||||||||||
| Total |
( |
) | ( |
) | ( |
) | ( |
) | ( |
) | ||||||||||||||
| |
|
|
|
|
|
|
|
|
|
|
|
|||||||||||||
| Total |
( |
) | ( |
) | ( |
) | ( |
) | ( |
) | ||||||||||||||
| |
|
|
|
|
|
|
|
|
|
|
|
|||||||||||||
| As of March 31, 2026 |
| |||||||||||||||||||||||
Yen in millions |
||||||||||||||||||||||||
Maturities |
||||||||||||||||||||||||
Book value |
Contractual cash flows |
Within 1 year |
Between 1 and 3 years |
Between 3 and 5 years |
Later than 5 years |
|||||||||||||||||||
| Non-derivative financial liabilities |
||||||||||||||||||||||||
| Short-term debt |
( |
) | ( |
) | — | — | — | |||||||||||||||||
| Commercial paper |
( |
) | ( |
) | — | — | — | |||||||||||||||||
| Long-term debt |
( |
) | ( |
) | ( |
) | ( |
) | ( |
) | ||||||||||||||
| Lease liabilities |
( |
) | ( |
) | ( |
) | ( |
) | ( |
) | ||||||||||||||
| |
|
|
|
|
|
|
|
|
|
|
|
|||||||||||||
| Total |
( |
) | ( |
) | ( |
) | ( |
) | ( |
) | ||||||||||||||
| |
|
|
|
|
|
|
|
|
|
|
|
|||||||||||||
| Derivative financial liabilities |
||||||||||||||||||||||||
| Interest derivatives |
( |
) | ( |
) | ( |
) | ( |
) | ( |
) | ||||||||||||||
| Currency derivatives |
||||||||||||||||||||||||
| In |
— | |||||||||||||||||||||||
| Out |
( |
) | ( |
) | ( |
) | ( |
) | ( |
) | ||||||||||||||
| |
|
|
|
|
|
|
|
|
|
|
|
|||||||||||||
| Total |
( |
) | ( |
) | ( |
) | ( |
) | ( |
) | ||||||||||||||
| |
|
|
|
|
|
|
|
|
|
|
|
|||||||||||||
| Total |
( |
) | ( |
) | ( |
) | ( |
) | ( |
) | ||||||||||||||
| |
|
|
|
|
|
|
|
|
|
|
|
|||||||||||||
Yen in millions |
||||||||
March 31, |
||||||||
2025 |
2026 |
|||||||
| Corporate bonds and medium-term notes |
||||||||
| Commercial paper |
||||||||
| |
|
|
|
|||||
| Total |
|
|
||||||
| |
|
|
|
|||||
Yen in millions |
||||||||||||||||
VaR |
||||||||||||||||
Year-end |
Average |
Maximum |
Minimum |
|||||||||||||
| For the year ended March 31, 2025 |
||||||||||||||||
| For the year ended March 31, 2026 |
||||||||||||||||
Yen in millions |
||||||||
For the years ended March 31, |
||||||||
2025 |
2026 |
|||||||
Impact on income before income taxes |
( |
) | ( |
) | ||||
Impact on other comprehensive income, before tax effect |
( |
) | ( |
) | ||||
Level 1: |
Quoted prices in active markets for identical assets or liabilities | |
Level 2: |
Fair value measurement based on inputs other than quoted prices included within Level 1 that are observable for the assets or liabilities, either directly or indirectly | |
Level 3: |
Fair value measurement based on models using significant unobservable inputs for the assets or liabilities | |
Yen in millions |
||||||||||||||||
March 31, 2025 |
||||||||||||||||
Level 1 |
Level 2 |
Level 3 |
Total |
|||||||||||||
Other financial assets: |
||||||||||||||||
Financial assets measured at fair value through profit or loss |
||||||||||||||||
Public and corporate bonds |
||||||||||||||||
Stocks |
— | — | ||||||||||||||
Investment trusts |
— | |||||||||||||||
Interest rate and currency swap |
— | — | ||||||||||||||
Foreign exchange forward, option and other contracts |
— | |||||||||||||||
Total |
|
|
|
|||||||||||||
Financial assets measured at fair value through other comprehensive income |
||||||||||||||||
Public and corporate bonds |
||||||||||||||||
Stocks |
— | |||||||||||||||
Other |
— | — | ||||||||||||||
Total |
||||||||||||||||
Other financial liabilities: |
||||||||||||||||
Financial liabilities measured at fair value through profit or loss |
||||||||||||||||
Interest rate and currency swap |
— | ( |
) | — | ( |
) | ||||||||||
Foreign exchange forward, option and other contracts |
— | ( |
) | — | ( |
) | ||||||||||
Total |
— | ( |
) | — | ( |
) | ||||||||||
| ● | ||||||||||||||||
Yen in millions |
||||||||||||||||
March 31, 2026 |
||||||||||||||||
Level 1 |
Level 2 |
Level 3 |
Total |
|||||||||||||
| Other financial assets: |
||||||||||||||||
| Financial assets measured at fair value through profit or loss |
||||||||||||||||
| Public and corporate bonds |
||||||||||||||||
| Stocks |
— |
— |
||||||||||||||
| Investment trusts |
— |
|||||||||||||||
| Interest rate and currency swap |
— |
— |
||||||||||||||
| Foreign exchange forward, option and other contracts |
— |
|||||||||||||||
| |
|
|
|
|
|
|
|
|||||||||
| Total |
||||||||||||||||
| |
|
|
|
|
|
|
|
|||||||||
| Financial assets measured at fair value through other comprehensive income |
||||||||||||||||
| Public and corporate bonds (Note 1) |
||||||||||||||||
| Stocks (Note 2) |
— |
|||||||||||||||
| Other |
— |
— |
||||||||||||||
| |
|
|
|
|
|
|
|
|||||||||
| Total |
||||||||||||||||
| |
|
|
|
|
|
|
|
|||||||||
| Other financial liabilities: |
||||||||||||||||
| Financial liabilities measured at fair value through profit or loss |
||||||||||||||||
| Interest rate and currency swap |
— |
( |
) |
— |
( |
) | ||||||||||
| Foreign exchange forward, option and other contracts |
— |
( |
) |
— |
( |
) | ||||||||||
| |
|
|
|
|
|
|
|
|||||||||
| Total |
— |
( |
) |
— |
( |
) | ||||||||||
| |
|
|
|
|
|
|
|
|||||||||
Yen in millions |
||||||||||||||||
For the year ended March 31, 202 5 |
||||||||||||||||
Public and corporate bonds |
Stocks |
Foreign exchange forward, option and other contracts |
Total |
|||||||||||||
| Balance at beginning of year |
— | |||||||||||||||
| Total gains (losses) |
||||||||||||||||
| Net income (loss) |
( |
) | ( |
) | ( |
) | ||||||||||
| Other comprehensive income (loss) |
— | ( |
) | — | ( |
) | ||||||||||
| Purchases and issuances |
— | |||||||||||||||
| Sales and settlements |
( |
) | ( |
) | — | ( |
) | |||||||||
| Transfer to (from) Level 3 |
( |
) | ( |
) | — | ( |
) | |||||||||
| Others |
— | |||||||||||||||
| |
|
|
|
|
|
|
|
|||||||||
| Balance at end of year |
|
|
||||||||||||||
| |
|
|
|
|
|
|
|
|||||||||
| Unrealized gains or losses included in profit or loss on assets |
( |
) | ( |
) | — | ( |
) | |||||||||
| |
|
|
|
|
|
|
|
|||||||||
| Total |
( |
) | ( |
) | — | ( |
) | |||||||||
| |
|
|
|
|
|
|
|
|||||||||
Yen in millions |
||||||||||||||||
For the year ended March 31, 2026 |
||||||||||||||||
Public and corporate bonds |
Stocks |
Foreign exchange forward, option and other contracts |
Total |
|||||||||||||
| Balance at beginning of year |
||||||||||||||||
| Total gains (losses) |
||||||||||||||||
| Net income (loss) |
||||||||||||||||
| Other comprehensive income (loss) |
— |
— |
||||||||||||||
| Purchases and issuances |
— |
|||||||||||||||
| Sales and settlements |
( |
) |
( |
) |
— |
( |
) | |||||||||
| Transfer to (from) Level 3 |
( |
) |
— |
— |
( |
) | ||||||||||
| Others |
||||||||||||||||
| |
|
|
|
|
|
|
|
|||||||||
| Balance at end of year (Note) |
||||||||||||||||
| |
|
|
|
|
|
|
|
|||||||||
| Unrealized gains or losses included in profit or loss on assets held at March 31 |
|
|
|
|
|
|
|
|
|
|
|
| ||||
| |
|
|
|
|
|
|
|
|||||||||
| Total |
||||||||||||||||
| |
|
|
|
|
|
|
|
|||||||||
Yen in millions |
||||||||||||||||||||
March 31, 2025 |
||||||||||||||||||||
Carrying amount |
Fair value |
|||||||||||||||||||
Level 1 |
Level 2 |
Level 3 |
Total |
|||||||||||||||||
| Receivables related to financial services |
— | — | ||||||||||||||||||
| Interest-bearing liabilities |
||||||||||||||||||||
| Long-term debt (Including current portion) |
— | |||||||||||||||||||
Yen in millions |
||||||||||||||||||||
March 31, 2026 |
||||||||||||||||||||
Carrying amount |
Fair value |
|||||||||||||||||||
Level 1 |
Level 2 |
Level 3 |
Total |
|||||||||||||||||
| Receivables related to financial services |
— |
— |
||||||||||||||||||
| Interest-bearing liabilities |
||||||||||||||||||||
| Long-term debt (Including current portion) |
|
|
|
— |
|
|
|
|
|
| ||||||||||
Yen in millions |
||||||||||||||||
March 31, 2025 |
||||||||||||||||
Gross amounts of recognized financial assets and financial liabilities |
Amounts not offset |
Net amount |
||||||||||||||
Financial instruments |
Collateral of financial instruments |
|||||||||||||||
| Other financial assets Derivatives |
( |
( |
||||||||||||||
| Other financial liabilities Derivatives |
( |
( |
||||||||||||||
Yen in millions |
||||||||||||||||
March 31, 2026 |
||||||||||||||||
Gross amounts of recognized financial assets and financial liabilities |
Amounts not offset |
Net amount |
||||||||||||||
Financial instruments |
Collateral of financial instruments |
|||||||||||||||
| Other financial assets Derivatives |
|
( |
|
( |
|
|
| |||||||||
| Other financial liabilities Derivatives |
|
( |
|
( |
|
|
| |||||||||
Yen in millions |
||||||||||||||||
For the years ended March 31, |
||||||||||||||||
2025 |
2026 |
|||||||||||||||
Japanese plans |
Foreign plans |
Japanese plans |
Foreign plans |
|||||||||||||
Present value of defined benefit obligations: |
||||||||||||||||
Benefit obligations at beginning of year |
||||||||||||||||
Current service cost |
||||||||||||||||
Interest cost |
||||||||||||||||
Remeasurements: |
||||||||||||||||
Changes in demographic assumptions |
( |
) | ( |
) | ||||||||||||
Changes in financial assumptions |
( |
) | ( |
) | ( |
) | ( |
) | ||||||||
Other |
( |
) | ( |
) | ||||||||||||
Past service cost |
( |
) | ( |
) | ( |
) | ( |
) | ||||||||
Plan participants’ contributions |
||||||||||||||||
Benefits paid |
( |
) | ( |
) | ( |
) | ( |
) | ||||||||
Effect of changes in exchange rates and other |
( |
) | ( |
) | ( |
) | ||||||||||
Benefit obligations at end of year |
||||||||||||||||
Fair value of plan assets: |
||||||||||||||||
Plan assets at beginning of year |
||||||||||||||||
Interest income |
||||||||||||||||
Remeasurement |
||||||||||||||||
Actual return on plan assets, excluding interest income |
( |
) | ( |
) | ||||||||||||
Employer contributions |
||||||||||||||||
Plan participants’ contributions |
||||||||||||||||
Benefits paid |
( |
) | ( |
) | ( |
) | ( |
) | ||||||||
Effect of changes in exchange rates and other |
( |
) | ( |
) | ||||||||||||
Plan assets at end of year |
||||||||||||||||
The impact of minimum funding requirement and asset ceiling |
— | — | ||||||||||||||
Net defined benefit liability (asset) |
||||||||||||||||
Yen in millions |
||||||||||||||||
March 31, |
||||||||||||||||
2025 |
2026 |
|||||||||||||||
Japanese plans |
Foreign plans |
Japanese plans |
Foreign plans |
|||||||||||||
| Funded defined benefit obligations |
||||||||||||||||
| Plan assets |
( |
) | ( |
) | ( |
) | ( |
) | ||||||||
| The impact of minimum funding requirement and asset ceiling |
||||||||||||||||
| |
|
|
|
|
|
|
|
|||||||||
| Subtotal |
( |
) | ( |
) | ( |
) |
( |
) | ||||||||
| |
|
|
|
|
|
|
|
|||||||||
| Unfunded defined benefit obligations |
||||||||||||||||
| |
|
|
|
|
|
|
|
|||||||||
| Total |
||||||||||||||||
| |
|
|
|
|
|
|
|
|||||||||
Yen in millions |
||||||||||||||||
March 31, |
||||||||||||||||
2025 |
2026 |
|||||||||||||||
Japanese plans |
Foreign plans |
Japanese plans |
Foreign plans |
|||||||||||||
| Retirement benefit liabilities |
||||||||||||||||
| Other non-current assets (Retirement benefit assets) |
( |
) | ( |
) | ( |
) | ( |
) | ||||||||
| |
|
|
|
|
|
|
|
|||||||||
| Net amount recognized |
||||||||||||||||
| |
|
|
|
|
|
|
|
|||||||||
March 31, |
||||||||||||||||
2025 |
2026 |
|||||||||||||||
Japanese plans |
Foreign plans |
Japanese plans |
Foreign plans |
|||||||||||||
| Weighted average duration of defined benefit obligations |
||||||||||||||||
March 31, |
||||||||||||||||
2025 |
2026 |
|||||||||||||||
Japanese plans |
Foreign plans |
Japanese plans |
Foreign plans |
|||||||||||||
| Discount rate |
% | % | % | % | ||||||||||||
Yen in millions |
||||||||||||||||||||||||
March 31, 2025 |
||||||||||||||||||||||||
Japanese plans |
Foreign plans |
|||||||||||||||||||||||
Quoted prices in active markets |
Total |
Quoted prices in active markets |
Total |
|||||||||||||||||||||
Available |
Not available |
Available |
Not available |
|||||||||||||||||||||
| Stocks |
— | — | ||||||||||||||||||||||
| Government bonds |
— | |||||||||||||||||||||||
| Bonds (other) |
— | |||||||||||||||||||||||
| Commingled funds |
— | — | ||||||||||||||||||||||
| Insurance contracts |
— | — | — | — | ||||||||||||||||||||
| Other |
||||||||||||||||||||||||
| |
|
|
|
|
|
|
|
|
|
|
|
|||||||||||||
| Total |
||||||||||||||||||||||||
| |
|
|
|
|
|
|
|
|
|
|
|
|||||||||||||
Yen in millions |
||||||||||||||||||||||||
March 31, 2026 |
||||||||||||||||||||||||
Japanese plans |
Foreign plans |
|||||||||||||||||||||||
Quoted prices in active markets |
Total |
Quoted prices in active markets |
Total |
|||||||||||||||||||||
Available |
Not available |
Available |
Not available |
|||||||||||||||||||||
| Stocks |
— | — | ||||||||||||||||||||||
| Government bonds |
— | |||||||||||||||||||||||
| Bonds (other) |
— | |||||||||||||||||||||||
| Commingled funds |
— | — | ||||||||||||||||||||||
| Insurance contracts |
— | — | — | — | ||||||||||||||||||||
| Other |
||||||||||||||||||||||||
| |
|
|
|
|
|
|
|
|
|
|
|
|||||||||||||
| Total |
||||||||||||||||||||||||
| |
|
|
|
|
|
|
|
|
|
|
|
|||||||||||||
Yen in millions |
||||||||||||||||
For the years ended March 31, |
||||||||||||||||
2025 |
2026 |
|||||||||||||||
Japanese plans |
Foreign plans |
Japanese plans |
Foreign plans |
|||||||||||||
| Beginning balance of the fiscal year |
— | — | ||||||||||||||
| Interest income |
— | — | ||||||||||||||
| Remeasurements: |
||||||||||||||||
| Change in asset ceiling excluding interest income |
— | — | ||||||||||||||
| Translation adjustments |
— | — | — | — | ||||||||||||
| |
|
|
|
|
|
|
|
|||||||||
| Ending balance of the fiscal year |
|
|
— | |||||||||||||
| |
|
|
|
|
|
|
|
|||||||||
Yen in millions |
||||||||||||||||
March 31, |
||||||||||||||||
2025 |
2026 |
|||||||||||||||
Japanese plans |
Foreign plans |
Japanese plans |
Foreign plans |
|||||||||||||
| 0.5% decrease |
||||||||||||||||
| 0.5% increase |
( |
) | ( |
) | ( |
) | ( |
) | ||||||||
Yen in millions |
||||
For the year ended March 31, |
||||
2026 |
||||
| Liabilities for quality assurance at beginning of year |
||||
| Additional provisions |
||||
| Utilization |
( |
) | ||
| Reversals |
( |
) | ||
| Unwinding of discount and effect of change in discount rate |
||||
| Other |
( |
) | ||
| |
|
|||
| Liabilities for quality assurance at end of year |
||||
| |
|
|||
Yen in millions |
||||
For the year ended March 31, |
||||
2026 |
||||
| Liabilities for recalls and other safety measures at beginning of year |
||||
| Additional provisions |
||||
| Utilization |
( |
) | ||
| Reversals |
( |
) | ||
| Unwinding of discount and effect of change in discount rate |
||||
| Other |
( |
) | ||
| |
|
|||
| Liabilities for recalls and other safety measures at end of year |
||||
| |
|
|||
Yen in millions |
||||
For the year ended March 31, |
||||
2026 |
||||
| Provisions at beginning of year |
||||
| Additional provisions |
||||
| Utilization |
( |
) | ||
| Reversals |
( |
) | ||
| Other |
||||
| |
|
|||
| Provisions at end of year |
||||
| |
|
|||
Yen in millions |
||||||||
For the years ended March 31, |
||||||||
2025 |
2026 |
|||||||
| Current liabilities |
||||||||
| Non-current liabilities |
||||||||
| |
|
|
|
|||||
| Total |
||||||||
| |
|
|
|
|||||
Yen in millions |
||||||||
March 31, |
||||||||
2025 |
2026 |
|||||||
Toyota Motor Corporation Shareholders’ equity |
||||||||
Short-term and long-term debt |
||||||||
For the years ended March 31, |
||||||||||||
2024 |
2025 |
2026 |
||||||||||
Common stock issued: |
||||||||||||
Balance at beginning of year |
||||||||||||
Changes during the year |
( |
) | ||||||||||
Balance at end of year |
||||||||||||
Number of common shares repurchased |
||
Total purchase price for repurchase of shares |
¥ |
Number of common shares repurchased |
shares | |
Total purchase price for repurchase of shares |
¥ |
Number of common shares repurchased |
||
Total purchase price for repurchase of shares |
¥ |
Number of common shares repurchased |
||
Total purchase price for repurchase of shares |
¥ |
Number of common shares retired |
Number of common shares repurchased |
| |
Total purchase price for repurchase of shares |
¥ |
Yen in millions |
||||||||||||||||
Net changes in revaluation of financial assets measured at fair value through other comprehensive income |
Remeasurements of defined benefit plans |
Exchange differences on translating foreign operations |
Total |
|||||||||||||
Balance at April 1, 2023 |
— | |||||||||||||||
Other comprehensive income, net of tax |
||||||||||||||||
Reclassification to retained earnings |
( |
) | ( |
) | — | ( |
) | |||||||||
Other comprehensive income for the period attributable to non-controlling interests |
( |
) | ( |
) | ( |
) | ( |
) | ||||||||
Balance at March 31, 2024 |
— | |||||||||||||||
Other comprehensive income, net of tax |
( |
) | ( |
) | ( |
) | ||||||||||
Reclassification to retained earnings |
( |
) | — | ( |
) | |||||||||||
Other comprehensive income for the period attributable to non-controlling interests |
( |
) | ( |
) | ( |
) | ||||||||||
Balance at March 31, 2025 |
— | |||||||||||||||
Other comprehensive income, net of tax |
||||||||||||||||
Reclassification to retained earnings |
( |
) | ( |
) | — | ( |
) | |||||||||
Other comprehensive income for the period attributable to non-controlling interests |
( |
) | ( |
) | ( |
) | ( |
) | ||||||||
Transfer to other comprehensive income associated with assets held for sale |
( |
) | — | ( |
) |
( |
) | |||||||||
Balance at March 31, 2026 |
— | |||||||||||||||
Yen in millions |
||||||||||||
For the year ended March 31, 2024 |
||||||||||||
Before tax |
Tax effect |
After tax |
||||||||||
Items that will not be reclassified to profit (loss) |
||||||||||||
Net changes in revaluation of financial assets measured at fair value through other comprehensive income |
||||||||||||
Amount incurred during the year |
( |
) | ||||||||||
Net changes |
( |
) | ||||||||||
Remeasurements of defined benefit plans |
||||||||||||
Amount incurred during the year |
( |
) | ||||||||||
Net changes |
( |
) | ||||||||||
Shares of other comprehensive income of equity method investees |
||||||||||||
Amount incurred during the year |
— | |||||||||||
Net changes |
— | |||||||||||
Items that may be reclassified subsequently to profit (loss) |
||||||||||||
Exchange differences on translating foreign operations |
||||||||||||
Amount incurred during the year |
— | |||||||||||
Reclassification to profit (loss) |
— | — | — | |||||||||
Net changes |
— | |||||||||||
Net changes in revaluation of financial assets measured at fair value through other comprehensive income |
||||||||||||
Amount incurred during the year |
( |
) | ||||||||||
Reclassification to profit (loss) |
( |
) | ( |
) | ||||||||
Net changes |
( |
) | ||||||||||
Shares of other comprehensive income of equity method investees |
||||||||||||
Amount incurred during the year |
— | |||||||||||
Reclassification to profit (loss) |
( |
) | — | ( |
) | |||||||
Net changes |
— | |||||||||||
Total other comprehensive income |
|
( |
) | |
||||||||
Yen in millions |
||||||||||||
For the year ended March 31, 2025 |
||||||||||||
Before tax |
Tax effect |
After tax |
||||||||||
| Items that will not be reclassified to profit (loss) |
||||||||||||
| Net changes in revaluation of financial assets measured at fair value through other comprehensive income |
||||||||||||
| Amount incurred during the year |
( |
) | ||||||||||
| |
|
|
|
|
|
|||||||
| Net changes |
( |
) | ||||||||||
| |
|
|
|
|
|
|||||||
| Remeasurements of defined benefit plans |
||||||||||||
| Amount incurred during the year |
( |
) | ( |
) | ||||||||
| |
|
|
|
|
|
|||||||
| Net changes |
( |
) | ( |
) | ||||||||
| |
|
|
|
|
|
|||||||
| Shares of other comprehensive income of equity method investees |
||||||||||||
| Amount incurred during the year |
( |
) | — | ( |
) | |||||||
| |
|
|
|
|
|
|||||||
| Net changes |
( |
) | — | ( |
) | |||||||
| |
|
|
|
|
|
|||||||
| Items that may be reclassified subsequently to profit (loss) |
||||||||||||
| Exchange differences on translating foreign operations |
||||||||||||
| Amount incurred during the year |
( |
) | — | ( |
) | |||||||
| Reclassification to profit (loss) |
( |
) | — | ( |
) | |||||||
| |
|
|
|
|
|
|||||||
| Net changes |
( |
) | — | ( |
) | |||||||
| |
|
|
|
|
|
|||||||
| Net changes in revaluation of financial assets measured at fair value through other comprehensive income |
||||||||||||
| Amount incurred during the year |
( |
) | ||||||||||
| Reclassification to profit (loss) |
( |
) | ||||||||||
| |
|
|
|
|
|
|||||||
| Net changes |
( |
) | ||||||||||
| |
|
|
|
|
|
|||||||
| Shares of other comprehensive income of equity method investees |
||||||||||||
| Amount incurred during the year |
— | |||||||||||
| Reclassification to profit (loss) |
( |
) | — | ( |
) | |||||||
| |
|
|
|
|
|
|||||||
| Net changes |
— | |||||||||||
| |
|
|
|
|
|
|||||||
| Total other comprehensive income |
( |
) | ( |
) | ( |
) | ||||||
| |
|
|
|
|
|
|||||||
Yen in millions |
||||||||||||
For the year ended March 31, 2026 |
||||||||||||
Before tax |
Tax effect |
After tax |
||||||||||
| Items that will not be reclassified to profit (loss) |
||||||||||||
| Net changes in revaluation of financial assets measured at fair value through other comprehensive income |
||||||||||||
| Amount incurred during the year |
( |
) | ||||||||||
| |
|
|
|
|
|
|||||||
| Net changes |
( |
) | ||||||||||
| |
|
|
|
|
|
|||||||
| Remeasurements of defined benefit plans |
||||||||||||
| Amount incurred during the year |
( |
) | ||||||||||
| |
|
|
|
|
|
|||||||
| Net changes |
( |
) | ||||||||||
| |
|
|
|
|
|
|||||||
| Shares of other comprehensive income of equity method investees |
||||||||||||
| Amount incurred during the year |
— | |||||||||||
| |
|
|
|
|
|
|||||||
| Net changes |
— | |||||||||||
| |
|
|
|
|
|
|||||||
| Items that may be reclassified subsequently to profit (loss) |
||||||||||||
| Exchange differences on translating foreign operations |
||||||||||||
| Amount incurred during the year |
— | |||||||||||
| Reclassification to profit (loss) |
— | — | — | |||||||||
| |
|
|
|
|
|
|||||||
| Net changes |
— | |||||||||||
| |
|
|
|
|
|
|||||||
| Net changes in revaluation of financial assets measured at fair value through other comprehensive income |
||||||||||||
| Amount incurred during the year |
( |
) | ( |
) | ||||||||
| Reclassification to profit (loss) |
( |
) | ||||||||||
| |
|
|
|
|
|
|||||||
| Net changes |
( |
) | ( |
) | ||||||||
| |
|
|
|
|
|
|||||||
| Shares of other comprehensive income of equity method investees |
||||||||||||
| Amount incurred during the year |
— | |||||||||||
| Reclassification to profit (loss) |
( |
) | — | ( |
) | |||||||
| |
|
|
|
|
|
|||||||
| Net changes |
— | |||||||||||
| |
|
|
|
|
|
|||||||
| Total other comprehensive income |
|
( |
) | |
||||||||
| |
|
|
|
|
|
|||||||
Resolution |
Type of shares |
Total amount of dividends (yen in millions) |
Dividend per share (yen) |
Record date |
Effective date | |||||||||||
The Board of Directors Meeting on May 10, 2023 |
Common shares | |||||||||||||||
The Board of Directors Meeting on November 1, 2023 |
Common shares | |||||||||||||||
Resolution |
Type of shares |
Total amount of dividends (yen in millions) |
Dividend per share (yen) |
Record date |
Effective date | |||||||||||
The Board of Directors Meeting on May 8, 2024 |
Common shares | |||||||||||||||
The Board of Directors Meeting on November 6, 2024 |
Common shares | |||||||||||||||
Resolution |
Type of shares |
Total amount of dividends (yen in millions) |
Dividend per share (yen) |
Record date |
Effective date | |||||||||||
The Board of Directors Meeting on May 8, 2025 |
Common shares | |||||||||||||||
The Board of Directors Meeting on November 5, 2025 |
Common shares | |||||||||||||||
| Resolution |
Type of shares |
Total amount of dividends (yen in millions) |
Dividend per share (yen) |
Record date |
Effective date | |||||||||||
| The Board of Directors Meeting on May 8, 2026 |
Common shares | |||||||||||||||
Yen in millions |
||||||||||||
For the years ended March 31, |
||||||||||||
2024 |
2025 |
2026 |
||||||||||
| Sales of products |
||||||||||||
| Automotive |
||||||||||||
| Vehicles |
||||||||||||
| Parts and components for production |
||||||||||||
| Parts and components for after service |
||||||||||||
| Other |
||||||||||||
| |
|
|
|
|
|
|||||||
| Total automotive |
||||||||||||
| All other |
||||||||||||
| |
|
|
|
|
|
|||||||
| Total sales of products |
|
|
|
|
|
|
|
|
| |||
| Financial services |
|
|
|
|
|
|
|
|
| |||
| |
|
|
|
|
|
|||||||
| Total sales revenues |
||||||||||||
| |
|
|
|
|
|
|||||||
Yen in millions |
||||||||||||
For the years ended March 31, |
||||||||||||
2024 |
2025 |
2026 |
||||||||||
| Finance leases |
||||||||||||
| Financial income related to net lease investment |
||||||||||||
| Operating leases |
||||||||||||
| |
|
|
|
|
|
|||||||
| Total |
|
|
|
|||||||||
| |
|
|
|
|
|
|||||||
Yen in millions |
||||||||||||
April 1, 2024 |
March 31, |
|||||||||||
2025 |
2026 |
|||||||||||
Contract liabilities |
|
|
||||||||||
Yen in millions |
||||||||||||
For the years ended March 31, |
||||||||||||
2024 |
2025 |
2026 |
||||||||||
Research and development expenditures incurred during the year |
||||||||||||
Amount capitalized |
( |
) | ( |
) | ( |
) | ||||||
Amortization of capitalized development costs |
||||||||||||
Total |
|
|
|
|||||||||
Yen in millions |
||||||||||||
For the years ended March 31, |
||||||||||||
2024 |
2025 |
2026 |
||||||||||
Other finance income |
||||||||||||
Interest income |
||||||||||||
Financial assets measured at amortized cost |
||||||||||||
Financial assets measured at fair value through other comprehensive income |
||||||||||||
Dividend income |
||||||||||||
Financial assets measured at fair value through other comprehensive income |
||||||||||||
Other |
||||||||||||
Total |
|
|
|
|||||||||
Other finance costs |
||||||||||||
Interest expense |
||||||||||||
Financial liabilities measured at amortized cost |
( |
) | ( |
) | ( |
) | ||||||
Other |
( |
) | ( |
) | ( |
) | ||||||
Total |
( |
) | ( |
) | ( |
) | ||||||
Yen in millions |
Thousands of shares |
Yen |
||||||||||
Net income attributable to Toyota Motor Corporation |
Weighted-average common shares |
Earnings per share attributable to Toyota Motor Corporation |
||||||||||
| For the year ended March 31, 2024 |
||||||||||||
| Net income attributable to Toyota Motor Corporation |
||||||||||||
| |
|
|
|
|
|
|||||||
| Basic and Diluted earnings per share attributable to Toyota Motor Corporation |
||||||||||||
| 3,848,098 | |
|
|
|
|
|
||||||
| For the year ended March 31, 202 5 |
||||||||||||
| Net income attributable to Toyota Motor Corporation |
||||||||||||
| |
|
|
|
|
|
|||||||
| Basic and Diluted earnings per share attributable to Toyota Motor Corporation |
||||||||||||
| |
|
|
|
|
|
|||||||
| For the year ended March 31, 2026 |
|
|
|
|
|
|
|
|
|
|
|
|
| Net income attributable to Toyota Motor Corporation |
||||||||||||
| |
|
|
|
|
|
|||||||
| Basic and Diluted earnings per share attributable to Toyota Motor Corporation |
|
|||||||||||
| |
|
|
|
|
|
|||||||
Yen in millions |
Thousands of shares |
Yen |
||||||||||
Toyota Motor Corporation shareholders’ equity |
Common shares issued and outstanding at the end of the year (excluding treasury stock) |
Toyota Motor Corporation shareholders’ equity per share |
||||||||||
| As of March 31, 2025 |
||||||||||||
| As of March 31, 2026 |
||||||||||||
(i) |
Overview of the system |
(ii) |
Number of shares granted during the period and their fair value |
For the years ended March 31, |
||||||||||||
2024 |
2025 |
2026 |
||||||||||
| Grant date |
June 30, 2023 |
June 28, 2024 |
June 30, 2025 |
|||||||||
| Number of shares granted (shares) |
||||||||||||
| Fair value per share on the grant date (Yen) |
||||||||||||
(Note 1) |
The fair value on the grant date is calculated based on the market price of TMC’s shares. | |
(Note 2) |
Expected dividends are not incorporated into the measurement of fair value. | |
(i) |
Overview of the system |
(ii) |
Number of shares granted during the period and fair value |
(Note 1) |
The fair value on the grant date is calculated based on the market price of TMC’s shares. |
(Note 2) |
Expected dividends are not incorporated into the measurement of fair value. |
(i) |
Overview of the system |
(ii) |
Number of points granted during the period and the fair value per point |
For the years ended March 31, |
||||||||||||
2024 |
2025 |
2026 |
||||||||||
| Number of points granted during the period |
||||||||||||
| Fair value per share on the grant date (Yen) (Note 1) |
||||||||||||
| Vesting conditions |
— |
— |
(Note 2 |
) | ||||||||
(Note 1) |
With respect to the granting of points, their fair value is measured based on observable market prices. Expected dividends are not incorporated into the fair value measurement. | |
(Note 2) |
As a rule, continuous employment through the vesting date is a vesting condition. | |
| (i) | Consolidated structured entities |
| (ii) | Unconsolidated structured entities |
Yen in millions |
||||||||
March 31, |
||||||||
2025 |
||||||||
Trade accounts and other receivables |
||||||||
Associates |
||||||||
Joint ventures |
||||||||
Total |
||||||||
Trade accounts and other payables |
||||||||
Associates |
||||||||
Joint ventures |
||||||||
Total |
|
|
||||||
Yen in millions |
||||||||||||
For the years ended March 31, |
||||||||||||
2024 |
2025 |
2026 |
||||||||||
| Sales revenues |
||||||||||||
| Associates |
||||||||||||
| Joint ventures |
||||||||||||
| |
|
|
|
|
|
|||||||
| Total |
||||||||||||
| |
|
|
|
|
|
|||||||
| Cost of products sold (purchases) |
||||||||||||
| Associates |
||||||||||||
| Joint ventures |
||||||||||||
| |
|
|
|
|
|
|||||||
| Total |
|
|
|
|||||||||
| |
|
|
|
|
|
|||||||
Yen in millions |
||||||||||||
For the years ended March 31, |
||||||||||||
2024 |
2025 |
2026 |
||||||||||
| Base compensation |
||||||||||||
| Bonus |
||||||||||||
| Share compensation |
||||||||||||
| |
|
|
|
|
|
|||||||
| Total |
|
|
|
|||||||||
| |
|
|
|
|
|
|||||||
ITEM 19. EXHIBITS
Index to Exhibit
154
SIGNATURES
The registrant hereby certifies that it meets all of the requirements for filing on Form 20-F and that it has duly caused and authorized the undersigned to sign this annual report on its behalf.
| TOYOTA MOTOR CORPORATION | ||
| By: |
/s/ Takanori Azuma | |
| Name: |
Takanori Azuma | |
| Title: |
Chief Officer, Accounting Group | |
Date: June 10, 2026