UNITED STATES
SECURITIES AND EXCHANGE COMMISSION
Washington, D.C. 20549
|
Form 6-K |
Report of Foreign Private Issuer
Pursuant to Rule 13a-16 Or 15d-16 Of
The Securities Exchange Act Of 1934
For the month of May 2026
Commission File Number: 001-14950
ULTRAPAR HOLDINGS INC.
(Translation of Registrant’s Name into English)
Brigadeiro Luis Antonio Avenue, 1343, 9th Floor
São Paulo, SP, Brazil 01317-910
(Address of Principal Executive Offices)
Indicate by check mark whether the registrant files or will file annual reports under cover of Form 20-F or Form 40-F:
Form 20-F ____X____ Form 40-F ________
Indicate by check mark if the registrant is submitting the Form 6-K in paper as permitted by Regulation S-T Rule 101(b)(1):
Yes ________ No ____X____
Indicate by check mark if the registrant is submitting the Form 6-K in paper as permitted by Regulation S-T Rule 101(b)(7):
Yes ________ No ____X____
ULTRAPAR HOLDINGS INC.
| TABLE OF CONTENTS |
|
| ITEM | |
|
Ultrapar Participações S.A. and Subsidiaries |
 |
|
Ultrapar Participações S.A. and Subsidiaries |
|
| (In thousands of Brazilian Reais) |
|
|
|
Parent |
|
Consolidated |
||||||
|
|
Note |
03/31/2026 |
12/31/2025 |
|
03/31/2026 |
12/31/2025 |
||||
|
Assets |
|
|
|
|
|
|
||||
|
Current assets |
|
|
|
|
|
|
||||
|
Cash and cash equivalents |
4.1 |
145,622 |
42,145 |
|
3,860,512 |
3,175,125 |
||||
|
Financial investments |
4.2 |
50,023 |
6,515 |
|
3,298,014 |
3,851,758 |
||||
|
Derivative financial instruments |
26.6 |
‐ |
‐ |
|
474,865 |
127,254 |
||||
|
Trade receivables |
5.1 |
‐ |
‐ |
|
4,171,331 |
3,703,954 |
||||
|
Reseller financing |
5.1 |
‐ |
‐ |
|
586,639 |
573,093 |
||||
|
Inventories |
6 |
‐ |
‐ |
|
4,545,786 |
4,244,164 |
||||
|
Recoverable taxes |
7.1 |
50,567 |
27,079 |
|
2,182,455 |
2,003,389 |
||||
|
Energy trading futures contracts |
26.8 |
‐ |
‐ |
|
331,994 |
371,241 |
||||
|
Dividends receivable |
|
49,971 |
‐ |
|
1,402 |
923 |
||||
|
Other receivables and other assets |
|
112,907 |
107,552 |
|
453,001 |
294,068 |
||||
|
Prepaid expenses |
|
13,081 |
7,519 |
|
233,198 |
165,392 |
||||
|
Contractual assets with customers - exclusivity rights |
10 |
‐ |
‐ |
|
656,364 |
666,109 |
||||
|
Total current assets |
|
422,171 |
190,810 |
|
20,795,561 |
19,176,470 |
||||
|
Financial investments |
4.2 |
1,428,922 |
1,411,213 |
|
1,894,078 |
2,381,597 |
||||
|
Derivative financial instruments |
26.6 |
‐ |
‐ |
|
567,067 |
773,063 |
||||
|
Trade receivables |
5.1 |
‐ |
‐ |
|
30,674 |
33,282 |
||||
|
Reseller financing |
5.1 |
‐ |
‐ |
|
748,280 |
800,927 |
||||
|
Related parties |
8 |
7,524 |
7,524 |
|
54,829 |
105,196 |
||||
|
Deferred income and social contribution taxes |
9.1 |
134,034 |
164,441 |
|
1,039,040 |
1,007,291 |
||||
|
Recoverable taxes |
7.1 |
10,988 |
10,988 |
|
3,872,712 |
4,063,908 |
||||
|
Energy trading futures contracts |
26.8 |
‐ |
‐ |
|
800,397 |
724,121 |
||||
|
Escrow deposits |
18.1 |
14,797 |
14,375 |
|
490,988 |
471,609 |
||||
|
Indemnification asset - business combination |
18.3 |
‐ |
‐ |
|
92,464 |
92,524 |
||||
|
Other receivables and other assets |
|
2,671 |
1,743 |
|
182,251 |
185,726 |
||||
|
Prepaid expenses |
|
26,775 |
21,459 |
|
83,205 |
80,643 |
||||
|
Contractual assets with customers - exclusivity rights |
10 |
‐ |
‐ |
|
1,503,410 |
1,518,987 |
||||
|
Investments in subsidiaries, joint ventures and associates |
11 |
14,507,364 |
13,987,459 |
|
654,365 |
521,381 |
||||
|
Right-of-use assets |
12.1 |
4,929 |
5,619 |
|
1,901,577 |
1,928,694 |
||||
|
Fixed assets |
13 |
62,137 |
63,323 |
|
12,084,803 |
12,167,097 |
||||
|
Intangible assets |
14 |
274,375 |
276,157 |
|
3,421,413 |
3,316,478 |
||||
|
Total non-current assets |
|
16,474,516 |
15,964,301 |
|
29,421,553 |
30,172,524 |
||||
|
Total assets |
|
16,896,687 |
16,155,111 |
|
50,217,114 |
49,348,994 |
||||
|
Ultrapar Participações S.A. and Subsidiaries |
|
| Statements of financial position as of March 31, 2026 and December 31, 2025 |
|
| (In thousands of Brazilian Reais) |
| Parent | Consolidated | ||||||||
| Note | 3/31/2026 | 12/31/2025 | 3/31/2026 | 12/31/2025 | |||||
| Liabilities | |||||||||
| Current liabilities | |||||||||
| Trade payables | 16.1 | 23,318 | 27,779 | 3,313,056 | 4,643,344 | ||||
| Trade payables - reverse factoring | 16.2 | ‐ | ‐ | 1,149,655 | 3,785 | ||||
| Loans, financing and debentures | 15 | ‐ | ‐ | 4,359,732 | 4,251,131 | ||||
| Derivative financial instruments | 26.6 | ‐ | ‐ | 819,314 | 246,064 | ||||
| Salaries and related charges | 38,525 | 47,379 | 462,480 | 576,674 | |||||
| Taxes payable | 295 | 379 | 246,323 | 236,928 | |||||
| Energy trading futures contracts | 26.8 | ‐ | ‐ | 255,050 | 303,455 | ||||
| Dividends payable | 18,630 | 21,738 | 25,952 | 23,073 | |||||
| Income and social contribution taxes payable | 3,349 | 6,508 | 503,142 | 358,685 | |||||
| Post-employment benefits | 17.1 | 73 | ‐ | 23,297 | 19,067 | ||||
| Provision for decarbonization credit | ‐ | ‐ | 56,443 | ‐ | |||||
| Provision for contingencies | 18.1 | 126 | 220 | 51,060 | 49,175 | ||||
| Leases payable | 12.2 | 2,579 | 2,921 | 308,111 | 343,725 | ||||
| Financial liabilities of customers | ‐ | ‐ | 47,145 | 63,445 | |||||
| Other payables | 691 | 1,044 | 858,694 | 728,793 | |||||
| Total current liabilities | 87,586 | 107,968 | 12,479,454 | 11,847,344 | |||||
| Non-current liabilities | |||||||||
| Loans, financing and debentures | 15 | ‐ | ‐ | 15,067,921 | 15,842,130 | ||||
| Derivative financial instruments | 26.6 | ‐ | ‐ | 591,090 | 334,851 | ||||
| Energy trading futures contracts | 26.8 | ‐ | ‐ | 448,542 | 431,418 | ||||
| Related parties | 8 | 2,875 | 2,875 | 2,875 | 2,875 | ||||
| Deferred income and social contribution taxes | 9.1 | ‐ | ‐ | 664,588 | 637,897 | ||||
| Post-employment benefits | 17.1 | 1,757 | 1,776 | 196,835 | 196,549 | ||||
| Provision for contingencies | 18.1 | 138,320 | 131,923 | 475,209 | 485,439 | ||||
| Leases payable | 12.2 | 3,300 | 3,706 | 1,386,280 | 1,395,908 | ||||
| Financial liabilities of customers | ‐ | ‐ | 8,087 | 10,881 | |||||
| Subscription warrants - indemnification | 19 | 74,083 | 53,911 | 74,083 | 53,911 | ||||
| Provision for loss on investment | 11 | 55,625 | 130,897 | 2,586 | 76,059 | ||||
| Other payables | 62,785 | 55,783 | 309,744 | 303,115 | |||||
| Total non-current liabilities | 338,745 | 380,871 | 19,227,840 | 19,771,033 | |||||
| Equity | |||||||||
| Share capital | 20.1 | 7,987,100 | 7,987,100 | 7,987,100 | 7,987,100 | ||||
| Equity instrument granted | 20.2 | 163,193 | 144,694 | 163,193 | 144,694 | ||||
| Capital reserve | 20.4 | 617,078 | 617,009 | 617,078 | 617,009 | ||||
| Treasury shares | 20.3 | (821,488) | (822,526) | (821,488) | (822,526) | ||||
| Revaluation reserve | 3,476 | 3,476 | 3,476 | 3,476 | |||||
| Profit reserves | 7,662,403 | 7,662,403 | 7,662,403 | 7,662,403 | |||||
| Retained earnings | 879,502 | ‐ | 879,502 | ‐ | |||||
| Accumulated other comprehensive income | 150,394 | 223,355 | 150,394 | 223,355 | |||||
| Acquisition of shares from shareholders | 27.2 | (171,302) | (149,239) | (171,302) | (149,239) | ||||
| Equity attributable to: | |||||||||
| Ultrapar shareholders’ equity | 16,470,356 | 15,666,272 | 16,470,356 | 15,666,272 | |||||
| Non-controlling interests | 11 | ‐ | ‐ | 2,039,464 | 2,064,345 | ||||
| Total equity | 16,470,356 | 15,666,272 | 18,509,820 | 17,730,617 | |||||
| Total liabilities and equity | 16,896,687 | 16,155,111 | 50,217,114 | 49,348,994 | |||||
The accompanying notes are an integral part of the interim financial information.
|
Ultrapar Participações S.A. and Subsidiaries |
|
| Statements of income | |
| For the periods ended March 31, 2026 and 2025 | |
| (In thousands of Brazilian Reais) |
|
|
|
Parent |
|
Consolidated |
|||||
|
|
Note |
01/01/2026 to 03/31/2026 |
01/01/2025 to 03/31/2025 |
|
01/01/2026 to 03/31/2026 |
01/01/2025 to 03/31/2025 |
|||
|
Continuing operations |
|
|
|
|
|
|
|||
|
Net revenue from sales and services |
21 |
‐ |
‐ |
|
36,751,570 |
33,329,262 |
|||
|
Cost of products and services sold |
22 |
‐ |
‐ |
|
(33,577,632) |
(31,187,631) |
|||
|
|
|
|
|
|
|
|
|||
|
Gross profit |
|
‐ |
‐ |
|
3,173,938 |
2,141,631 |
|||
|
|
|
|
|
|
|
|
|||
|
Operating income (expenses) |
|
|
|
|
|
|
|||
|
Selling and marketing |
22 |
‐ |
‐ |
|
(663,990) |
(601,565) |
|||
|
General and administrative |
22 |
(11,948) |
(12,635) |
|
(655,701) |
(518,362) |
|||
|
Results from disposal of property, plant and equipment and intangible assets |
|
20 |
31 |
|
497 |
5,307 |
|||
|
Other operating income (expenses), net |
22 |
(802) |
(450) |
|
(23,143) |
(86,503) |
|||
|
|
|
|
|
|
|
|
|||
|
Operating result before share of profit (loss) of subsidiaries, joint ventures and associates, financial result and income and social contribution taxes |
|
(12,730) |
(13,054) |
|
1,831,601 |
940,508 |
|||
|
Share of profit (loss) of subsidiaries, joint ventures and associates |
11 |
821,211 |
333,764 |
|
(20,313) |
(149,083) |
|||
|
Amortization of fair value adjustments on associates acquisition |
11 |
‐ |
‐ |
|
(403) |
(403) |
|||
|
Total share of profit (loss) of subsidiaries, joint ventures and associates |
|
821,211 |
333,764 |
|
(20,716) |
(149,486) |
|||
|
Operating income before financial result and income and social contribution taxes |
|
808,481 |
320,710 |
|
1,810,885 |
791,022 |
|||
|
|
|
|
|
|
|
|
|||
|
Financial income |
23 |
136,301 |
17,281 |
|
978,615 |
745,214 |
|||
|
Financial expenses |
23 |
(26,635) |
(4,587) |
|
(1,377,078) |
(925,183) |
|||
|
Financial result, net |
23 |
109,666 |
12,694 |
|
(398,463) |
(179,969) |
|||
|
Income before income and social contribution taxes |
|
918,147 |
333,404 |
|
1,412,422 |
611,053 |
|||
|
|
|
|
|
|
|
|
|||
|
Income and social contribution taxes |
|
|
|
|
|
|
|||
|
Current |
9.2 |
(12,166) |
‐ |
|
(492,187) |
(164,439) |
|||
|
Deferred |
9.2 |
(30,407) |
(558) |
|
(6,077) |
(83,430) |
|||
|
|
|
(42,573) |
(558) |
|
(498,264) |
(247,869) |
|||
|
|
|
|
|
|
|
|
|||
|
Net income for the period |
|
875,574 |
332,846 |
|
914,158 |
363,184 |
|||
|
Income attributable to: |
|
|
|
|
|
|
|||
|
Shareholders of Ultrapar |
|
875,574 |
332,846 |
|
875,574 |
332,846 |
|||
|
Non-controlling interests in subsidiaries |
11 |
‐ |
‐ |
|
38,584 |
30,338 |
|||
|
|
|
|
|
|
|
|
|||
|
Total earnings per share (based on the weighted average number of shares outstanding) – R$ |
|
|
|
|
|
|
|||
|
Basic |
24 |
0.8192 |
0.3043 |
|
0.8192 |
0.3043 |
|||
|
Diluted |
24 |
0.8011 |
0.2996 |
|
0.8011 |
0.2996 |
|||
The accompanying notes are an integral part of the interim financial information.
|
Ultrapar Participações S.A. and Subsidiaries |
|
| For the periods ended March 31, 2026 and 2025 | |
| (In thousands of Brazilian Reais) |
|
|
|
|
Parent |
|
Consolidated |
||||
|
|
Note |
|
01/01/2026 to 03/31/2026 |
01/01/2025 to 03/31/2025 |
|
01/01/2026 to 03/31/2026 |
01/01/2025 to 03/31/2025 |
||
|
Net income for the period, attributable to shareholders of Ultrapar |
|
|
875,574 |
332,846 |
|
875,574 |
332,846 |
||
|
Net income for the period, attributable to non-controlling interests in subsidiaries |
|
|
‐ |
‐ |
|
38,584 |
30,338 |
||
|
Net income for the period |
|
|
875,574 |
332,846 |
|
914,158 |
363,184 |
||
|
|
|
|
|
|
|
|
|
||
|
Items that will be subsequently reclassified to profit or loss: |
|
|
|
|
|
|
|
||
|
Fair value adjustments of financial instruments of subsidiaries, joint ventures and associates, net of income and social contribution taxes |
|
|
351 |
6,747 |
|
671 |
6,747 |
||
|
Translation adjustments of subsidiaries |
|
|
(73,163) |
3,414 |
|
(123,377) |
3,414 |
||
|
|
|
|
|
|
|
|
|
||
|
Items that will not be subsequently reclassified to profit or loss: |
|
|
|
‐ |
|
|
|
||
|
Actuarial gains of post-employment benefits, net of income and social contribution taxes |
|
|
(149) |
‐ |
|
(149) |
‐ |
||
|
|
|
|
|
|
|
|
|
||
|
Total comprehensive income for the period |
|
|
802,613 |
343,007 |
|
791,303 |
373,345 |
||
|
|
|
|
|
|
|
|
|
||
|
Total comprehensive income for the period attributable to shareholders of Ultrapar |
|
|
802,613 |
343,007 |
|
802,613 |
343,007 |
||
|
Total comprehensive income for the period attributable to non-controlling interests in subsidiaries |
|
|
‐ |
‐ |
|
(11,310) |
30,338 |
||
The accompanying notes are an integral part of the interim financial information.
|
Ultrapar Participações S.A. and Subsidiaries |
|
| For the periods ended March 31, 2026 and 2025 | |
| (In thousands of Brazilian Reais) |
|
|
|
|
|
|
|
|
|
|
|
|
Equity attributable to: |
|
|
||||||||||||
|
|
Note |
Share capital |
Equity instrument granted |
Capital reserve |
Treasury shares |
Revaluation reserve |
Profit reserves |
Accumulated other comprehensive income |
Acquisition of shares from shareholders |
Retained earnings |
Shareholders of Ultrapar |
|
Non-controlling interest in subsidiaries |
|
Total equity |
||||||||||
|
Balance as of December 31, 2024 |
|
6,621,752 |
108,253 |
612,048 |
(596,400) |
3,632 |
8,195,221 |
214,212 |
- |
- |
15,158,718 |
|
664,726 |
|
15,823,444 |
||||||||||
|
|
|
|
|
|
|
|
|
|
|
|
|
|
|
|
|
||||||||||
|
Net income for the period |
- |
- |
- |
- |
- |
- |
- |
- |
- |
332,846 |
332,846 |
|
30,338 |
|
363,184 |
||||||||||
|
Other comprehensive income |
- |
- |
- |
- |
- |
- |
- |
10,161 |
- |
- |
10,161 |
|
- |
|
10,161 |
||||||||||
|
Total comprehensive income for the period |
|
- |
- |
- |
- |
- |
- |
10,161 |
- |
332,846 |
343,007 |
|
30,338 |
|
373,345 |
||||||||||
|
|
|
|
|
|
|
|
|
|
|
|
|
|
|
|
|
||||||||||
|
Issuance of shares related to the subscription warrants - indemnification |
- |
- |
- |
1,126 |
- |
- |
- |
- |
- |
- |
1,126 |
|
- |
|
1,126 |
||||||||||
|
Equity instrument granted |
8.4; 20.2 |
- |
15,111 |
41 |
- |
- |
- |
- |
- |
- |
15,152 |
|
- |
|
15,152 |
||||||||||
|
Purchase of treasury shares |
- |
- |
- |
- |
(114,299) |
- |
- |
- |
- |
- |
(114,299) |
|
- |
|
(114,299) |
||||||||||
|
Realization of revaluation reserve of subsidiaries |
- |
- |
- |
- |
- |
(46) |
- |
- |
- |
- |
(46) |
|
- |
|
(46) |
||||||||||
|
Shareholder transaction - changes of ownership interest |
- |
- |
- |
- |
- |
- |
- |
- |
- |
- |
- |
|
(142) |
|
(142) |
||||||||||
|
Dividends attributable to non-controlling interests |
- |
- |
- |
- |
- |
- |
- |
- |
- |
- |
- |
|
(53) |
|
(53) |
||||||||||
|
Approval of additional dividends by the Ordinary General Shareholders’ Meeting |
20.8 |
- |
- |
- |
- |
- |
(208,121) |
- |
- |
- |
(208,121) |
|
- |
|
(208,121) |
||||||||||
|
Balance as of March 31, 2025 |
|
6,621,752 |
123,364 |
613,215 |
(710,699) |
3,586 |
7,987,100 |
224,373 |
- |
332,846 |
15,195,537 |
|
694,869 |
|
15,890,406 |
||||||||||
|
Ultrapar Participações S.A. and Subsidiaries |
|
|
Statements of changes in equity
|
|
| For the periods ended March 31, 2026 and 2025 | |
| (In thousands of Brazilian Reais) |
|
|
|
|
|
|
|
|
|
|
|
|
Equity attributable to: |
|
|
||||||||||||
|
|
Note |
Share capital |
Equity instrument granted |
Capital reserve |
Treasury shares |
Revaluation reserve |
Profit reserves |
Accumulated other comprehensive income |
Acquisition of shares from shareholders |
Retained earnings |
Shareholders of Ultrapar |
|
Non-controlling interest in subsidiaries |
|
Total equity |
||||||||||
|
Balance as of December 31, 2025 |
|
7,987,100 |
144,694 |
617,009 |
(822,526) |
3,476 |
7,662,403 |
223,355 |
(149,239) |
- |
15,666,272 |
|
2,064,345 |
|
17,730,617 |
||||||||||
|
|
|
|
|
|
|
|
|
|
|
|
|
|
|
|
|
||||||||||
|
Net income for the period |
|
- |
- |
- |
- |
- |
- |
- |
- |
875,574 |
875,574 |
|
38,584 |
|
914,158 |
||||||||||
|
Other comprehensive income |
|
- |
- |
- |
- |
- |
- |
(72,961) |
- |
- |
(72,961) |
|
(49,894) |
|
(122,855) |
||||||||||
|
Total comprehensive income for the period |
|
- |
- |
- |
- |
- |
- |
(72,961) |
- |
875,574 |
802,613 |
|
(11,310) |
|
791,303 |
||||||||||
|
|
|
|
|
|
|
|
|
|
|
|
|
|
|
|
|
||||||||||
|
Equity instrument granted |
8.4; 20.2 |
- |
18,499 |
69 |
1,038 |
- |
- |
- |
- |
- |
19,606 |
|
- |
|
19,606 |
||||||||||
|
Capital increase of non-controlling shareholders |
- |
- |
- |
- |
- |
- |
- |
- |
- |
- |
- |
|
16,146 |
|
16,146 |
||||||||||
|
Shareholder transaction |
27.2 |
- |
- |
- |
- |
- |
- |
- |
(22,063) |
- |
(22,063) |
|
- |
|
(22,063) |
||||||||||
|
Variation in change of ownership interest of non-controlling shareholders |
- |
- |
- |
- |
- |
- |
- |
- |
- |
- |
- |
|
(21,322) |
|
(21,322) |
||||||||||
|
Interest on equity attributable to non-controlling interests |
- |
- |
- |
- |
- |
- |
- |
- |
- |
- |
- |
|
(8,395) |
|
(8,395) |
||||||||||
|
Dividends prescribed |
- |
- |
- |
- |
- |
- |
- |
- |
- |
3,928 |
3,928 |
|
- |
|
3,928 |
||||||||||
|
Balance as of March 31, 2026 |
|
7,987,100 |
163,193 |
617,078 |
(821,488) |
3,476 |
7,662,403 |
150,394 |
(171,302) |
879,502 |
16,470,356 |
|
2,039,464 |
|
18,509,820 |
||||||||||
The accompanying notes are an integral part of the interim financial information.
|
Ultrapar Participações S.A. and Subsidiaries |
|
| For the periods ended March 31, 2026 and 2025 | |
| (In thousands of Brazilian Reais) |
|
|
|
Parent |
|
Consolidated |
|||||
|
|
Note |
03/31/2026 |
03/31/2025 |
|
03/31/2026 |
03/31/2025 |
|||
|
CASH FLOWS FROM CONTINUING OPERATING ACTIVITIES |
|
|
|
|
|
|
|||
|
Net income from continuing operations |
|
875,574 |
332,846 |
|
914,158 |
363,184 |
|||
|
Adjustments to reconcile net income to cash provided (consumed) by operating activities |
|
|
|
|
|
|
|||
|
Share of profit (loss) of subsidiaries, joint ventures and associates and amortization of fair value adjustments on associates acquisition |
11 |
(821,211) |
(333,764) |
|
20,716 |
149,486 |
|||
|
Amortization of contractual assets with customers - exclusivity rights |
10 |
‐ |
‐ |
|
146,550 |
105,489 |
|||
|
Amortization of right-of-use assets |
12 |
736 |
750 |
|
88,273 |
78,387 |
|||
|
Depreciation and amortization |
13; 14 |
3,241 |
4,087 |
|
349,607 |
225,684 |
|||
|
Interest, monetary variations and foreign exchange variations |
|
(131,459) |
(9,584) |
|
675,081 |
231,068 |
|||
|
Current and deferred income and social contribution taxes |
9.2 |
42,573 |
558 |
|
498,264 |
247,869 |
|||
|
Gain (loss) on disposal or write-off of assets |
|
(20) |
(31) |
|
(497) |
(15,996) |
|||
|
Equity instrument granted |
|
11,352 |
15,111 |
|
19,922 |
15,111 |
|||
|
Gain (loss) on the fair value of energy contracts |
|
‐ |
‐ |
|
(69,030) |
(8,518) |
|||
|
Provision for decarbonization - CBIO |
|
‐ |
‐ |
|
56,896 |
116,422 |
|||
|
Provisions for tax, civil and labor risks |
|
6,208 |
(4,790) |
|
2,508 |
4,268 |
|||
|
Other provisions and adjustments |
|
(17) |
(7,393) |
|
22,599 |
(1,515) |
|||
|
|
|
(13,023) |
(2,210) |
|
2,725,047 |
1,510,939 |
|||
|
(Increase) decrease in assets |
|
|
|
|
|
|
|||
|
Trade receivables and reseller financing |
5 |
‐ |
‐ |
|
(454,775) |
20,842 |
|||
|
Inventories |
6 |
‐ |
‐ |
|
(297,139) |
(216,476) |
|||
|
Recoverable taxes |
|
7,693 |
(3,185) |
|
47,100 |
294,764 |
|||
|
Dividends received from subsidiaries, associates and joint ventures |
|
150,000 |
607,549 |
|
47 |
1,112 |
|||
|
Other assets |
|
(17,126) |
(11,025) |
|
(239,156) |
(16,641) |
|||
|
|
|
|
|
|
|
|
|||
|
Increase (decrease) in liabilities |
|
|
|
|
|
|
|||
|
Trade payables |
16 |
(4,461) |
(5,962) |
|
(187,697) |
(998,121) |
|||
|
Salaries and related charges |
|
(8,854) |
(13,923) |
|
(114,660) |
(109,684) |
|||
|
Taxes payable |
|
(84) |
(494) |
|
9,753 |
16,937 |
|||
|
Income and social contribution taxes payable |
|
(8,907) |
(84) |
|
(216,643) |
(304,654) |
|||
|
Other liabilities |
|
28,094 |
9,268 |
|
177,374 |
49,614 |
|||
|
|
|
|
|
|
|
|
|||
|
Acquisition of CBIO and carbon credits |
14 |
‐ |
‐ |
|
(80,969) |
(153,096) |
|||
|
Payments of contractual assets with customers - exclusivity rights |
10 |
‐ |
‐ |
|
(115,584) |
(58,113) |
|||
|
Payment of contingencies |
|
(1,512) |
‐ |
|
(19,021) |
(8,906) |
|||
|
Income and social contribution taxes paid |
|
(6,418) |
‐ |
|
(131,085) |
(25,498) |
|||
|
Net cash provided by operating activities |
|
125,402 |
579,934 |
|
1,102,592 |
3,019 |
|||
|
|
|
|
|
|
|
|
|||
|
CASH FLOWS FROM INVESTING ACTIVITIES |
|
|
|
|
|
|
|||
|
Financial investments, net of redemptions |
4.2 |
40,386 |
14,871 |
|
1,093,018 |
1,244,432 |
|||
|
Acquisition of property, plant and equipment and intangible assets |
13; 14 |
(273) |
(1,069) |
|
(368,293) |
(381,891) |
|||
|
Sale of investments and other assets |
|
‐ |
‐ |
|
3,519 |
14,467 |
|||
|
Capital increase and decrease in subsidiaries, associates and joint ventures |
11 |
(61,013) |
(3,000) |
|
(150,253) |
‐ |
|||
|
Acquisition of investments and other assets |
11 |
- |
‐ |
|
(151,575) |
(49,736) |
|||
|
Cash acquired in business combination |
|
‐ |
‐ |
|
8 |
- |
|||
| Related parties | - | - | 31,190 | (3,381) | |||||
|
Net cash consumed by investing activities |
|
(20,900) |
10,802 |
|
457,614 |
823,891 |
|||
|
|
|
|
|
|
|
|
|||
|
CASH FLOWS FROM FINANCING ACTIVITIES |
|
|
|
|
|
|
|||
|
Loans, financing and debentures |
|
|
|
|
|
|
|||
|
Proceeds |
15 |
‐ |
‐ |
|
1,107,983 |
1,682,044 |
|||
|
Repayments |
15 |
‐ |
‐ |
|
(1,193,745) |
(2,077,454) |
|||
|
Interest and derivatives (paid) or received |
|
‐ |
‐ |
|
(556,799) |
(336,895) |
|||
|
Payments of lease |
|
|
|
|
|
|
|||
|
Principal and interest paid |
12.2 |
(911) |
(943) |
|
(145,288) |
(87,264) |
|||
|
Dividends paid |
|
(114) |
(487,165) |
|
(1,583) |
(487,502) |
|||
|
Payments of financial liabilities of customers |
|
‐ |
‐ |
|
(21,349) |
(35,216) |
|||
|
Capital increase made by non-controlling shareholders and redemption of shares |
|
‐ |
‐ |
|
13,000 |
‐ |
|||
|
Repurchase of treasury shares |
|
‐ |
(96,774) |
|
‐ |
(96,774) |
|||
|
Net cash consumed by financing activities |
|
(1,025) |
(584,882) |
|
(797,781) |
(1,439,061) |
|||
|
|
|
|
|
|
|
|
|||
|
Effect of exchange rate changes on cash and cash equivalents in foreign currency - continuing operations |
|
‐ |
‐ |
|
(77,038) |
(23,354) |
|||
|
|
|
|
|
|
|
|
|||
|
Increase (decrease) in cash and cash equivalents - continuing operations |
|
103,477 |
5,854 |
|
685,387 |
(635,505) |
|||
|
Cash and cash equivalents at the beginning of the period - continuing operations |
4.1 |
42,145 |
4,186 |
|
3,175,125 |
2,071,593 |
|||
|
Cash and cash equivalents at the end of the period - continuing operations |
4.1 |
145,622 |
10,040 |
|
3,860,512 |
1,436,088 |
|||
|
|
|
|
|
|
|
|
|||
|
Non-cash transactions: |
|
|
|
|
|
|
|||
|
Addition and remeasurement on right-of-use assets and leases payable |
12 |
‐ |
‐ |
|
72,253 |
77,230 |
|||
|
Capital increase in associates through loan |
|
- |
- |
|
27,514 |
- |
|||
|
Addition on contractual assets with customers - exclusivity rights |
10 |
‐ |
‐ |
|
5,640 |
17,426 |
|||
|
Acquisition of property, plant and equipment and intangible assets without cash effect |
|
‐ |
‐ |
|
2,513 |
‐ |
|||
|
Share buyback |
|
‐ |
17,525 |
|
‐ |
17,525 |
|||
The accompanying notes are an integral part of the interim financial information.
|
Ultrapar Participações S.A. and Subsidiaries |
|
| For the periods ended March 31, 2026 and 2025 | |
| (In thousands of Brazilian Reais) |
|
|
|
Parent |
|
Consolidated |
|||||
|
|
Note |
03/31/2026 |
|
03/31/2025 |
|
03/31/2026 |
|
03/31/2025 |
|
|
Revenues |
|
|
|
|
|
|
|
|
|
|
Gross revenue from sales and services, except rents and royalties |
21 |
‐ |
|
‐ |
|
38,053,914 |
|
34,638,544 |
|
|
Rebates, discounts and returns |
21 |
‐ |
|
‐ |
|
(321,473) |
|
(224,040) |
|
|
Allowance for expected credit losses |
5 |
‐ |
|
‐ |
|
(23,974) |
|
(496) |
|
|
Amortization of contractual assets with customers - exclusivity rights |
10; 21 |
‐ |
|
‐ |
|
(146,550) |
|
(105,489) |
|
|
Gain (loss) on disposal of assets and other operating income (expenses), net |
|
(782) |
|
(419) |
|
(22,646) |
|
(81,196) |
|
|
|
|
(782) |
|
(419) |
|
37,539,271 |
|
34,227,323 |
|
|
|
|
|
|
|
|
|
|
|
|
|
Materials purchased from third parties |
|
|
|
|
|
|
|
|
|
|
Cost of products and services sold |
|
‐ |
|
‐ |
|
(33,459,115) |
|
(31,327,877) |
|
|
Materials, energy, third-party services and others |
|
64,279 |
|
57,700 |
|
(514,392) |
|
(443,967) |
|
|
Provision for assets losses |
|
‐ |
|
‐ |
|
2,148 |
|
‐ |
|
|
|
|
64,279 |
|
57,700 |
|
(33,971,359) |
|
(31,771,844) |
|
|
|
|
|
|
|
|
|
|
|
|
|
Gross value added |
|
63,497 |
|
57,281 |
|
3,567,912 |
|
2,455,479 |
|
|
|
|
|
|
|
|
|
|
|
|
|
Retentions |
|
|
|
|
|
|
|
|
|
|
Depreciation and amortization of intangible assets and right-of-use assets |
12.a; 13; 14 |
(3,977) |
|
(4,837) |
|
(437,880) |
|
(304,071) |
|
|
|
|
(3,977) |
|
(4,837) |
|
(437,880) |
|
(304,071) |
|
|
|
|
|
|
|
|
|
|
|
|
|
Net value added produced by the Company |
|
59,520 |
|
52,444 |
|
3,130,032 |
|
2,151,408 |
|
|
|
|
|
|
|
|
|
|
|
|
|
Value added received in transfer |
|
|
|
|
|
|
|
|
|
|
Total share of profit (loss) of subsidiaries, joint ventures and associates |
|
821,211 |
|
333,764 |
|
(20,716) |
|
(149,486) |
|
|
Rents and royalties |
21 |
‐ |
|
‐ |
|
37,020 |
|
79,494 |
|
|
Financial income |
23 |
136,301 |
|
17,281 |
|
978,615 |
|
176,890 |
|
|
|
|
957,512 |
|
351,045 |
|
994,919 |
|
106,898 |
|
|
Total value added available for distribution |
|
1,017,032 |
|
403,489 |
|
4,124,951 |
|
2,258,306 |
|
|
|
|
|
|
|
|
|
|
|
|
|
Distribution of value added |
|
|
|
|
|
|
|
|
|
|
Personnel and related charges |
|
|
|
|
|
|
|
|
|
|
Salaries and wages |
|
53,089 |
|
49,017 |
|
488,143 |
|
400,276 |
|
|
Benefits |
|
9,117 |
|
6,914 |
|
128,261 |
|
113,763 |
|
|
Government Severance Indemnity Fund for Employees (FGTS) |
|
1,670 |
|
1,657 |
|
29,777 |
|
26,102 |
|
|
Others |
|
1,196 |
|
917 |
|
40,741 |
|
25,489 |
|
|
|
|
65,072 |
|
58,505 |
|
686,922 |
|
565,630 |
|
|
|
|
|
|
|
|
|
|
|
|
|
Taxes, fees and contributions |
|
|
|
|
|
|
|
|
|
|
Federal |
|
48,455 |
|
6,084 |
|
911,162 |
|
804,723 |
|
|
State |
|
309 |
|
‐ |
|
148,421 |
|
113,301 |
|
|
Municipal |
|
‐ |
|
25 |
|
63,239 |
|
39,650 |
|
|
|
|
48,764 |
|
6,109 |
|
1,122,822 |
|
957,674 |
|
|
Financial expenses and rents |
|
|
|
|
|
|
|
|
|
|
Interest, foreign exchange variations and financial instruments |
|
139 |
|
875 |
|
1,314,443 |
|
307,020 |
|
|
Rents |
|
1,211 |
|
1,097 |
|
44,080 |
|
32,921 |
|
|
Others |
|
26,272 |
|
4,057 |
|
42,526 |
|
31,877 |
|
|
|
|
27,622 |
|
6,029 |
|
1,401,049 |
|
371,818 |
|
|
Remuneration of own capital |
|
|
|
|
|
|
|
|
|
|
Retained earnings |
|
875,574 |
|
332,846 |
|
914,158 |
|
363,184 |
|
|
|
|
875,574 |
|
332,846 |
|
914,158 |
|
363,184 |
|
|
Value added distributed |
|
1,017,032 |
|
403,489 |
|
4,124,951 |
|
2,258,306 |
|
The accompanying notes are an integral part of the interim financial information.
|
Ultrapar Participações S.A. and Subsidiaries |
|
| Notes to the interim financial information | |
| For the period ended March 31, 2026 |
Ultrapar Participações S.A. (“Ultrapar” or “Company”) is a publicly-traded company headquartered at the Brigadeiro Luís Antônio Avenue, 1343 in the city of São Paulo – SP, Brazil, listed on B3 S.A. – Brasil, Bolsa, Balcão (“B3”), in the Novo Mercado listing segment under the ticker “UGPA3” and on the New York Stock Exchange (“NYSE”) in the form of level III American Depositary Receipts (“ADRs”) under the ticker “UGP”.
The Company engages in the investment of its own capital in services, commercial and industrial activities, through the subscription or acquisition of shares of other companies. Through its subsidiaries, it operates on liquefied petroleum gas distribution and other energies (“Ultragaz”), fuel distribution and related businesses (“Ipiranga” or “IPP”), storage services for liquid bulk (“Ultracargo”) and logistics and waterway and multimodal infrastructure (“Hidrovias”). The information on segments is disclosed in Note 25.
This interim financial information was authorized for issuance by the Board of Directors on May 6, 2026.
1.1.1 Principles of consolidation
In the preparation of the consolidated interim financial information the investments of one company in another, balances of asset and liability accounts, revenue transactions, costs and expenses were eliminated, as well as the effects of transactions conducted between the companies. Non-controlling interests in subsidiaries are presented within consolidated equity and net income.
Consolidation of a subsidiary begins when the Company obtains direct or indirect control over an entity and ceases when the company loses control. Income and expenses of a subsidiary acquired are included in the consolidated statements of income and of comprehensive income from the date the Company gains control. Income and expenses of a subsidiary, in which the Company loses control, are included in the consolidated statements of income and of comprehensive income until the date the Company loses control.
When necessary, adjustments are made to the financial information of subsidiaries to bring their accounting policies into line with the Company’s accounting policies.
|
Ultrapar Participações S.A. and Subsidiaries |
|
| Notes to the interim financial information | |
| For the period ended March 31, 2026 |
1.1.2 Interest in subsidiarie
The consolidated interim financial information includes the following direct and indirect subsidiaries:
|
|
|
|
|
Interest % rounded |
||||||
|
|
|
|
|
03/31/2026 |
|
12/31/2025 |
||||
|
|
|
|
|
Control |
|
Control |
||||
|
|
Location |
Segment |
|
Direct |
|
Indirect |
|
Direct |
|
Indirect |
|
Ultra Mobilidade S.A |
Brazil |
Ipiranga |
|
100 |
|
- |
|
100 |
|
- |
|
am/pm Comestíveis Ltda. |
Brazil |
Ipiranga |
|
- |
|
100 |
|
- |
|
100 |
|
Glazed Brasil S.A. (“Krispy Kreme”) |
Brazil |
Ipiranga |
|
- |
|
55 |
|
- |
|
55 |
|
Centro de Conveniências Millennium Ltda. and subsidiaries |
Brazil |
Ipiranga |
|
- |
|
100 |
|
- |
|
100 |
|
Neodiesel Ltda. |
Brazil |
Ipiranga |
|
- |
|
100 |
|
- |
|
100 |
|
Serra Diesel Transportador Revendedor Retalhista Ltda. |
Brazil |
Ipiranga |
|
- |
|
60 |
|
- |
|
60 |
|
Neoagro Diesel S.A. |
Brazil |
Ipiranga |
|
- |
|
60 |
|
- |
|
60 |
|
Mi TRR Transportadora Retalhista e Revendedora de Combustíveis S.A. |
Brazil |
Ipiranga |
|
- |
|
51 |
|
- |
|
51 |
|
Petrovila Combustíveis S.A. |
Brazil |
Ipiranga |
|
- |
|
60 |
|
- |
|
60 |
|
Ipiranga Produtos de Petróleo S.A. |
Brazil |
Ipiranga |
|
- |
|
100 |
|
- |
|
100 |
|
Ipiranga Trading Limited |
British Virgin Islands |
Ipiranga |
|
- |
|
100 |
|
- |
|
100 |
|
Ipiranga Imobiliária Ltda. |
Brazil |
Ipiranga |
|
- |
|
100 |
|
- |
|
100 |
|
Ipiranga Logística Ltda. |
Brazil |
Ipiranga |
|
- |
|
100 |
|
- |
|
100 |
|
Oil Trading Importadora e Exportadora Ltda. |
Brazil |
Ipiranga |
|
- |
|
100 |
|
- |
|
100 |
|
Iconic Lubrificantes S.A. |
Brazil |
Ipiranga |
|
- |
|
56 |
|
- |
|
56 |
|
Integra Frotas Ltda. |
Brazil |
Ipiranga |
|
- |
|
100 |
|
- |
|
100 |
|
Irupé Biocombustíveis Ltda. |
Brazil |
Ipiranga |
|
- |
|
100 |
|
- |
|
100 |
|
Ipiranga Trading North America LLC. |
United States |
Ipiranga |
|
- |
|
100 |
|
- |
|
100 |
|
Ipiranga Trading Middle East DMCC |
Dubai |
Ipiranga |
|
- |
|
100 |
|
- |
|
100 |
|
Ipiranga Trading Europe S.A. |
Switzerland |
Ipiranga |
|
- |
|
100 |
|
- |
|
100 |
|
Abastece Aí Participações S.A. |
Brazil |
Ipiranga |
|
- |
|
100 |
|
- |
|
100 |
|
Companhia Ultragaz S.A. |
Brazil |
Ultragaz |
|
99 |
|
- |
|
99 |
|
- |
|
Ultragaz Energia Ltda. and subsidiaries |
Brazil |
Ultragaz |
|
- |
|
100 |
|
- |
|
100 |
|
Nova Paraná Distribuidora de Gás Ltda. (1) |
Brazil |
Ultragaz |
|
- |
|
100 |
|
- |
|
100 |
|
Utingás Armazenadora S.A. |
Brazil |
Ultragaz |
|
- |
|
57 |
|
- |
|
57 |
|
Bahiana Distribuidora de Gás Ltda. |
Brazil |
Ultragaz |
|
- |
|
100 |
|
- |
|
100 |
|
NEOgás do Brasil Gás Natural Comprimido S.A. |
Brazil |
Ultragaz |
|
- |
|
100 |
|
- |
|
100 |
|
Ultragaz Comercializadora de Energia Ltda. |
Brazil |
Ultragaz |
|
- |
|
52 |
|
- |
|
52 |
|
Ultragaz Energia e Corretagem de Seguros Ltda. |
Brazil |
Ultragaz |
|
- |
|
100 |
|
- |
|
100 |
|
UVC Investimentos Ltda. |
Brazil |
Others |
|
100 |
|
- |
|
100 |
|
- |
|
Ultra Logística Ltda. |
Brazil |
Hidrovias |
|
100 |
|
- |
|
100 |
|
- |
|
Hidrovias do Brasil S.A. |
Brazil |
Hidrovias |
|
- |
|
60 |
|
- |
|
59 |
|
Hidrovias do Brasil – Vila do Conde S.A. |
Brazil |
Hidrovias |
|
- |
|
100 |
|
- |
|
100 |
|
Hidrovias do Brasil – Administração Portuária de Santos S.A. |
Brazil |
Hidrovias |
|
- |
|
100 |
|
- |
|
100 |
|
Hidrovias del Sur S.A. |
Uruguay |
Hidrovias |
|
- |
|
100 |
|
- |
|
100 |
|
Baloto S.A. |
Uruguay |
Hidrovias |
|
- |
|
100 |
|
- |
|
100 |
|
Girocantex S.A. |
Uruguay |
Hidrovias |
|
- |
|
100 |
|
- |
|
100 |
|
Cikelsol S.A. |
Uruguay |
Hidrovias |
|
- |
|
100 |
|
- |
|
100 |
|
Resflir S.A. |
Uruguay |
Hidrovias |
|
- |
|
100 |
|
- |
|
100 |
|
Hidrovias del Paraguay S.A. |
Paraguay |
Hidrovias |
|
- |
|
100 |
|
- |
|
100 |
|
Pricolpar S.A. |
Paraguay |
Hidrovias |
|
- |
|
100 |
|
- |
|
100 |
|
Hidrovias Navegación Fluvial S.A. |
Paraguay |
Hidrovias |
|
- |
|
100 |
|
- |
|
100 |
|
Hidrovias South America BV |
Netherlands |
Hidrovias |
|
- |
|
100 |
|
- |
|
100 |
|
Hidrovias International Finance S.à.r.l. |
Luxembourg |
Hidrovias |
|
- |
|
100 |
|
- |
|
100 |
|
Ultracargo Logística S.A. |
Brazil |
Ultracargo |
|
99 |
|
- |
|
99 |
|
- |
|
Ultracargo Soluções Logísticas S.A. |
Brazil |
Ultracargo |
|
- |
|
100 |
|
- |
|
100 |
|
Ultrapar International S.A. |
Luxembourg |
Others |
|
100 |
|
- |
|
100 |
|
- |
|
Imaven Imóveis Ltda. |
Brazil |
Others |
|
100 |
|
- |
|
100 |
|
- |
|
Eaí Clube Automobilista S.A. |
Brazil |
Others |
|
100 |
|
- |
|
100 |
|
- |
| (1) | Non-operating company in closing phase. |
|
Ultrapar Participações S.A. and Subsidiaries |
|
| Notes to the interim financial information | |
| For the period ended March 31, 2026 |
1.2.1 Acquisition of interest in Virtu GNL
In January 2026, the Company completed the acquisition of a 43.75% interest in Virtu GNL Participações S.A. (“Virtu”), for the amount of R$ 104 million. Virtu operates in two business segments: (i) logistics of liquefied natural gas (LNG) for own use, and (ii) provision of LNG-powered logistics services.
With the completion of the transaction, the Company began to share control of the investee and to be classified as a joint controlling shareholder of the investee, accounted for using the equity method, in accordance with the applicable accounting policy.
Under these conditions, the investment was initially recognized at fair value on the acquisition date and subsequently adjusted for the Company's share of the investee's profit (loss) and other comprehensive income, when applicable.
The individual and consolidated interim financial information ("interim financial information"), identified as Parent and Consolidated, was prepared in accordance with the International Accounting Standard ("IAS") 34 – Interim Financial Reporting issued by the International Accounting Standards Board ("IASB"), and in accordance with the pronouncement CPC 21 (R1) – Interim Financial Reporting, issued by the Brazilian Accounting Pronouncements Committee (“CPC”), approved by the Brazilian Federal Accounting Council (“CFC”) and presented in accordance with the rules issued by the Securities and Exchange Commission of Brazil (“CVM”).
The interim financial information were prepared and are presented:
- using consistent accounting policies and practices for Ultrapar and in its subsidiaries in all the years presented in these financial statements.
- in thousands of Brazilian Reais (“R$”), which is the Company’s functional currency, unless otherwise stated. The functional currency of Hidrovias’ subsidiaries in Uruguay, Paraguay, the Netherlands and Luxembourg is the U.S. dollar. The effects of translating the functional currency of foreign subsidiaries to Real are accounted for in equity as “Other comprehensive income”.
The financial information of foreign subsidiaries (Paraguay, Uruguay, Luxembourg and the Netherlands) is presented in Reais, translating the functional currency to the presentation currency, according to the following procedures:
• Assets and liabilities were translated using the closing rate at the reporting date;
• Equity was translated at historical cost; and
• Income and expenses were translated using the average monthly rate.
c. considering all relevant proprietary information, which has been disclosed and corresponds to that used by the Company’s and its subsidiaries’ Management.
|
Ultrapar Participações S.A. and Subsidiaries |
|
| Notes to the interim financial information | |
| For the period ended March 31, 2026 |
d. according to Management’s judgments, estimates, and assumptions in the application of accounting policies that affect the reported amounts of income, expenses, assets, and liabilities, including contingent liabilities. The uncertainty related to these judgments, assumptions and estimates could lead to results that require a significant adjustment to the carrying amount of certain assets and liabilities in future years.
e. based on the historical cost, except for the following material items recognized in the statements of financial position:
(i) Financial investments measured at fair value;
(ii) derivative and non-derivative financial instruments measured at fair value;
(iii) loans and financing measured at fair value;
(iv) future energy contracts measured at fair value;
(v) share-based payments and employee benefits measured at fair value; and
(vi) deemed cost of property, plant and equipment.
The Company evaluated and, when necessary, applied for the first time the new standards and interpretations issued by the International Accounting Standards Board (IASB) and the Brazilian Accounting Pronouncements Committee (“CPC”).
3.1. New accounting policies and changes in accounting policies
3.1.1 Current accounting policies
The following amendments to standards and guidance issued by the IASB and CPC effective on or after January 1, 2026 were evaluated and do not change the accounting practice adopted by the Company:
• IFRS 9 – Financial Instruments and IFRS 7 – Financial Instruments Disclosures
3.1.2 Accounting policies applicable to future events
The following new standards, amendments to standards and interpretations of IFRS Accounting Standards issued by the International Accounting Standards Board - IASB were not adopted since they are not effective or not applicable to the Company’s context in the period ended March 31, 2026. The Company and its subsidiaries plan to adopt these new standards, amendments, and interpretations, subject to their applicability.
• IFRS 18/ CPC 51 – Presentation and Disclosure in Financial Statements
• IFRS 19 – Subsidiaries without Public Accountability
• Amendments to IAS 21 - Translation to a Hyperinflationary Presentation Currency
|
Ultrapar Participações S.A. and Subsidiaries |
|
| Notes to the interim financial information | |
| For the period ended March 31, 2026 |
Cash equivalents and financial investments, excluding cash and bank deposits, are substantially represented by investments: (i) in Brazil, in certificates of deposit of financial institutions linked to interest rate of the Interbank Deposits (“DI”), in repurchase agreement, financial bills, private securities and in short-term investment funds, whose portfolio is comprised of Brazilian Federal Government bonds and certificates of deposit of financial institutions and financial investments composed of a fixed-income component indexed to the DI rate and a variable component represented by financial instruments whose characteristics meet the criteria for compensation set forth in CPC 39 / IAS 32, resulting in the presentation of a net financial asset, and; (ii) outside Brazil, in certificates of deposit of financial institutions and in short-term investment funds, whose portfolio is comprised of Federal Government bonds.
4.1. Cash and cash equivalents
|
|
Parent |
|
Consolidated |
||||
|
|
03/31/2026 |
|
12/31/2025 |
|
03/31/2026 |
|
12/31/2025 |
|
Cash and banks |
|
|
|
|
|
|
|
|
In local currency |
4,734 |
|
289 |
|
578,454 |
|
432,604 |
|
In foreign currency |
‐ |
|
‐ |
|
172,593 |
|
409,691 |
|
Financial investments considered cash equivalents |
|
|
|
|
|
|
|
|
Securities and funds |
|
|
|
|
|
|
|
|
In local currency |
140,888 |
|
41,856 |
|
2,782,259 |
|
1,622,908 |
|
In foreign currency |
‐ |
|
‐ |
|
327,206 |
|
709,922 |
|
Total cash and cash equivalents |
145,622 |
|
42,145 |
|
3,860,512 |
|
3,175,125 |
4.2. Financial investments
|
|
Parent |
|
Consolidated |
||||
|
|
03/31/2026 |
|
12/31/2025 |
|
03/31/2026 |
|
12/31/2025 |
|
Financial investments |
|
|
|
|
|
|
|
|
Securities and funds |
|
|
|
|
|
|
|
|
In local currency (a) |
1,478,945 |
|
1,417,728 |
|
2,047,788 |
|
3,311,585 |
|
In foreign currency (b) |
‐ |
|
‐ |
|
3,144,304 |
|
2,921,770 |
|
Total financial investments |
1,478,945 |
|
1,417,728 |
|
5,192,092 |
|
6,233,355 |
|
Current |
50,023 |
|
6,515 |
|
3,298,014 |
|
3,851,758 |
|
Non-current |
1,428,922 |
|
1,411,213 |
|
1,894,078 |
|
2,381,597 |
| (a) | As of March 31, 2025, the Parent Company balance comprises (i) commercial notes in the amount of R$ 319,142 and (ii) financial instruments offset with the same counterparty, presented net of financial liabilities measured at fair value in the amount of R$ 4,474. The Consolidated Company balance comprises (i) financial bills and indexed-rate Brazilian Federal Government bonds totaling R$ 865,475 and (ii) the remaining amount, which substantially corresponds to financial instruments offset with the same counterparty, presented net of financial liabilities measured at fair value in the amount of R$ 4,474. |
| (b) | Refers substantially to financial investments made by subsidiary Ultrapar International in Time Deposits. |
|
Ultrapar Participações S.A. and Subsidiaries |
|
| Notes to the interim financial information | |
| For the period ended March 31, 2026 |
5.1. Trade receivables and reseller financing
|
Trade receivables |
03/31/2026 |
|
12/31/2025 |
|
Domestic customers |
4,393,217 |
|
3,946,459 |
|
Domestic customers - related parties (see Note 8) |
2,692 |
|
6,449 |
|
Foreign customers |
167,453 |
|
133,961 |
|
Foreign customers - related parties (see Note 8) |
2,516 |
|
2,839 |
|
|
4,565,878 |
|
4,089,708 |
|
(-) Allowance for expected credit losses |
(363,873) |
|
(352,472) |
|
|
|
|
|
|
Total - trade receivables of customers |
4,202,005 |
|
3,737,236 |
|
|
|
|
|
|
Current |
4,171,331 |
|
3,703,954 |
|
Non-current |
30,674 |
|
33,282 |
|
|
|
|
|
|
Reseller financing |
03/31/2026 |
|
12/31/2025 |
|
Reseller financing |
1,481,845 |
|
1,508,373 |
|
(-) Allowance for expected credit losses |
(146,926) |
|
(134,353) |
|
Total – reseller financing |
1,334,919 |
|
1,374,020 |
|
Current |
586,639 |
|
573,093 |
|
Non-current |
748,280 |
|
800,927 |
5.2. Allowance for expected credit losses – trade receivables and reseller financing
Movements in the allowance for expected credit losses of trade receivables and reseller financing are as follows:
|
|
Trade receivables |
|
Reseller financing |
|
Total |
|
Balance as of December 31, 2025 |
352,472 |
|
134,353 |
|
486,825 |
|
Additions |
135,728 |
|
17,954 |
|
153,682 |
|
Reversals |
(122,331) |
|
(2,920) |
|
(125,251) |
|
Write-offs |
(1,996) |
|
(2,461) |
|
(4,457) |
|
Balance as of March 31, 2026 |
363,873 |
|
146,926 |
|
510,799 |
|
Ultrapar Participações S.A. and Subsidiaries |
|
| Notes to the interim financial information | |
| For the period ended March 31, 2026 |
The table below presents information on credit risk exposure, resulting from balances of trade receivables and reseller financing.
|
|
03/31/2026 |
|
12/31/2025 |
||||||||
|
|
Weighted average rate of expected losses |
|
Gross accounting balance |
|
Allowance for expected credit losses |
|
Weighted average rate of expected losses |
|
Gross accounting balance |
|
Allowance for expected credit losses |
|
Current |
0.51% |
|
4,758,645 |
|
24,363 |
|
0.51% |
|
4,492,797 |
|
23,081 |
|
Less than 30 days |
1.37% |
|
253,232 |
|
3,480 |
|
1.57% |
|
132,614 |
|
2,082 |
|
31-60 days |
10.78% |
|
87,366 |
|
9,422 |
|
8.06% |
|
33,539 |
|
2,702 |
|
61-90 days |
13.07% |
|
23,665 |
|
3,093 |
|
13.17% |
|
25,671 |
|
3,380 |
|
91-180 days |
19.91% |
|
69,284 |
|
13,794 |
|
21.73% |
|
71,225 |
|
15,480 |
|
More than 180 days |
53.38% |
|
855,531 |
|
456,647 |
|
52.25% |
|
842,235 |
|
440,100 |
|
|
|
|
6,047,723 |
|
510,799 |
|
|
|
5,598,081 |
|
486,825 |
|
|
03/31/2026 |
|
12/31/2025 |
|
Fuels, lubricants and greases |
3,691,451 |
|
3,395,951 |
|
Raw materials |
329,838 |
|
313,445 |
|
Purchase for future delivery (1) |
111,583 |
|
102,985 |
|
Consumable materials and other items for resale |
295,649 |
|
292,054 |
|
Liquefied petroleum gas - LPG |
98,073 |
|
120,537 |
|
Properties for resale |
19,192 |
|
19,192 |
|
|
4,545,786 |
|
4,244,164 |
| (1) | Refers substantially to ethanol, biodiesel and advances for fuel acquisition. |
Movements in the provision for inventory losses are as follows:
|
|
03/31/2026 |
|
Opening balance |
12,401 |
|
Reversal of provision for obsolescence and other losses |
(768) |
|
Addition to provision for adjustment to realizable value |
394 |
|
Reversal of provision for adjustment to realizable value |
(1,774) |
|
Closing balance |
10,253 |
|
Ultrapar Participações S.A. and Subsidiaries |
|
| Notes to the interim financial information | |
| For the period ended March 31, 2026 |
7.1. Recoverable taxes
Recoverable taxes are substantially represented by credits of Tax on Goods and Services (“ICMS”, the Brazilian VAT), Contribution for Social Security Financing (“COFINS”), Social Integration Program (“PIS”) and Income Tax (IR) and the Social Contribution on Net Income (CSLL).
|
|
03/31/2026 |
|
12/31/2025 |
|
ICMS (7.1.1) |
1,448,075 |
|
1,394,916 |
|
PIS and COFINS (7.1.2) |
3,747,716 |
|
3,863,682 |
|
IRPJ and CSLL (7.1.3) |
714,203 |
|
664,056 |
|
Others |
145,173 |
|
144,643 |
|
Total |
6,055,167 |
|
6,067,297 |
|
Current |
2,182,455 |
|
2,003,389 |
|
Non-current |
3,872,712 |
|
4,063,908 |
7.1.1 The recoverable ICMS net of provision for losses is substantially related to the following operations:
Tax credits are recognized mainly of the following nature: a) transactions of inputs and outputs of products subject to taxation of the own ICMS; b) interstate outflows of oil-related products, whose ICMS was prepaid by the supplier (Petrobras); c) credits for refunds of the ICMS-ST (tax substitution) overpaid when the estimated calculation base used is higher than that of the actual operation performed.
The amounts of recoverable ICMS are realized through the Company’s own operations subject to taxes, being a revolving credit, which means that the credits are monthly offset against the tax payable on sales and new credits are generated by the acquisition of inputs, as well as by the State's refund on tax substitution operations. Management estimates the realization of the credits classified in non-current assets within a term of up to 5 years.
7.1.2 The recoverable PIS and COFINS are substantially related to:
ICMS in the PIS and COFINS calculation basis - The balance of PIS and COFINS includes credits recorded under Laws 10,637/02 and 10,833/03, as well as amounts arising from a STF’s favorable decision (Theme 69) regarding the exclusion of ICMS from the PIS and COFINS calculation basis. The Company, through its subsidiaries, has credits in the amount of R$ 2,039,356 (R$ 2,039,260 as of December 31, 2025).
Supplementary Law 192 - On March 11, 2022 Supplementary Law (“LC” 192/22”) was published to reduce the tax burden of the fuel supply chain. Art. 9 of said law established the reduction of the PIS and COFINS tax rates levied on diesel, biodiesel and LPG to zero through December 31, 2022, ensuring at the same time the maintenance of credits taken across the whole supply chain up to September 21, 2022 (90 days after the publication of LC 194/22 that restricted the right to take credits on taxpayers), when it became effective.
The Company, through its subsidiaries, has credits in the amount of R$ 803,133 (R$ 814,319 as of December 31, 2025) from the LC 192/22. These credits were recorded considering the expectation of realization by the Company within a 5-year period from the date of generation, period in which the Company has the ability to use these credits. The estimated realization is updated annually considering the estimated future results.
7.1.3. Recoverable income and social contribution taxes - Relates to IRPJ and CSLL to be recovered by the Company and its subsidiaries, arising from the tax advances of previous years, as well as referring to lawsuits on the non-levy of IRPJ and CSLL on the monetary variation (SELIC) in the repetition of undue payments. Management estimates the realization of these credits within up to 5 years.
|
Ultrapar Participações S.A. and Subsidiaries |
|
| Notes to the interim financial information | |
| For the period ended March 31, 2026 |
8.1. Parent
|
|
Assets |
|
Liabilities |
||||
|
|
03/31/2026 |
|
12/31/2025 |
|
03/31/2026 |
|
12/31/2025 |
|
Transactions with joint ventures |
|
|
|
|
|
|
|
|
Química da Bahia Indústria e Comércio S.A. |
‐ |
|
‐ |
|
2,875 |
|
2,875 |
|
|
|
|
|
|
|
|
|
|
Transactions with subsidiaries |
|
|
|
|
|
|
|
|
Ipiranga Produtos de Petróleo S.A. |
60,918 |
|
55,930 |
|
389 |
|
408 |
|
Cia Ultragaz S.A. |
29,267 |
|
30,399 |
|
‐ |
|
‐ |
|
Ultracargo Logística S.A. |
326,297 |
|
315,348 |
|
‐ |
|
240 |
|
Eaí Clube Automobilista S.A. |
‐ |
|
912 |
|
‐ |
|
87 |
|
Hidrovias do Brasil S.A. |
5,553 |
|
5,118 |
|
388 |
|
388 |
|
am/pm Comestíveis Ltda. |
2,868 |
|
3,901 |
|
84 |
|
421 |
|
Imaven Imóveis Ltda. |
‐ |
|
‐ |
|
604 |
|
‐ |
|
Others |
4,560 |
|
1,822 |
|
‐ |
|
‐ |
|
Total |
429,463 |
|
413,430 |
|
4,340 |
|
4,419 |
|
|
|
|
|
|
|
|
|
|
Other receivables/payables |
102,797 |
|
97,914 |
|
852 |
|
1,433 |
|
Trade payables |
‐ |
|
‐ |
|
613 |
|
111 |
|
Related parties |
7,524 |
|
7,524 |
|
2,875 |
|
2,875 |
|
Financial investments (1) |
319,142 |
|
307,992 |
|
‐ |
|
‐ |
| (1) | Refers to funds invested in subsidiary Ultracargo Logística S.A., remunerated at a rate of 106% of the CDI. The investment provides for the amortization of interest on a semiannual basis, with full repayment of the principal at maturity on October 25, 2027. |
|
Ultrapar Participações S.A. and Subsidiaries |
|
| Notes to the interim financial information | |
| For the period ended March 31, 2026 |
8.2. Consolidated
Balances and transactions between the Company and its subsidiaries have been eliminated in consolidation and are not disclosed in this Note. The balances and transactions between the Company and its subsidiaries with other related parties are highlighted below:
|
|
Assets |
|
Liabilities |
|
Operating result - Sales/(Purchases) |
||||||
|
|
03/31/2026 |
|
12/31/2025 |
|
03/31/2026 |
|
12/31/2025 |
|
03/31/2026 |
|
03/31/2025 |
|
Transactions with subsidiaries and joint ventures |
|
|
|
|
|
|
|
|
|
|
|
|
|
|
|
|
|
|
|
|
|
|
|
|
|
Transactions with joint ventures |
|
|
|
|
|
|
|
|
|
|
|
|
Refinaria de Petróleo Riograndense S.A. |
2 |
|
2 |
|
187 |
|
11,156 |
|
(12,133) |
|
(126,019) |
|
Latitude Logística Portuária S.A. |
5,003 |
|
4,620 |
|
49 |
|
49 |
|
‐ |
|
‐ |
|
Navegantes Logística Portuária S.A. |
38,738 |
|
90,850 |
|
‐ |
|
‐ |
|
‐ |
|
105 |
|
Nordeste Logistica II S.A. |
9,292 |
|
8,686 |
|
26 |
|
44 |
|
- |
|
- |
|
Others |
1,828 |
|
4,281 |
|
2,893 |
|
3,924 |
|
103 |
|
‐ |
|
|
|
|
|
|
|
|
|
|
|
|
|
|
Transactions with other related parties |
|
|
|
|
|
|
|
|
|
|
|
|
Chevron Oronite Brasil Ltda. (1) |
2,399 |
|
2,847 |
|
41,191 |
|
34,460 |
|
(72,464) |
|
(50,677) |
|
Chevron Products Company (1) |
‐ |
|
‐ |
|
229,335 |
|
188,578 |
|
(204,285) |
|
(130,962) |
|
Others |
2,786 |
|
3,218 |
|
319 |
|
1,726 |
|
(6,905) |
|
(103) |
|
|
|
|
|
|
|
|
|
|
|
|
|
|
Total |
60,048 |
|
114,504 |
|
274,000 |
|
239,937 |
|
(295,684) |
|
(307,656) |
|
|
|
|
|
|
|
|
|
|
|
|
|
|
Trade receivables (Note 5) |
5,208 |
|
9,288 |
|
‐ |
|
‐ |
|
‐ |
|
‐ |
|
Other receivables |
11 |
|
20 |
|
‐ |
|
‐ |
|
‐ |
|
‐ |
|
Trade payables (Note 16) |
‐ |
|
‐ |
|
271,125 |
|
237,062 |
|
‐ |
|
‐ |
|
Related parties |
54,829 |
|
105,196 |
|
2,875 |
|
2,875 |
|
‐ |
|
‐ |
|
Sales and services provided |
‐ |
|
‐ |
|
‐ |
|
‐ |
|
10,521 |
|
7,304 |
|
Purchases |
‐ |
|
‐ |
|
‐ |
|
‐ |
|
(306,205) |
|
(314,960) |
| (1) | Non-controlling shareholders and other related parties of Iconic. |
Purchase and sale transactions relate substantially to the purchase of raw materials, feedstock, transportation, and storage services based on prices and terms negotiated between the parties, with customers and suppliers with comparable operational performance.
|
Ultrapar Participações S.A. and Subsidiaries |
|
| Notes to the interim financial information | |
| For the period ended March 31, 2026 |
8.3. Key executives
The Ultrapar’s compensation policy and practices are designed to align short and long-term interests with shareholders and the Company’s sustainability. The short and long-term variable compensation is linked to growth goals in results and generated economic value, aligned with shareholders’ interests. Variable compensation also directs the professionals’ focus to the strategic plan approved by the Board of Directors, and is linked to annual growth goals in financial results and priority matters for the Company.
The expenses for compensation of its key executives (Company’s directors and executive officers) are shown below:
|
|
03/31/2026 |
|
03/31/2025 |
|
Short-term compensation |
8,509 |
|
11,219 |
|
Stock compensation |
20,664 |
|
17,781 |
|
Post-employment benefit |
318 |
|
765 |
|
Total |
29,491 |
|
29,765 |
8.4. Stock plan (Consolidated)
The financial statements for the year ended December 31, 2025 (Note 8), disclose the features and measurement criteria of each plan (2017 Plan and 2023 Plan) offered by the Company, which remained unchanged during the quarter ended March 31, 2026. In the interim financial information for the period ended March 31, 2026 of subsidiary Hidrovias, Note 20.2 discloses the features and measurement criteria of the 1st long-term share-based incentive plan (“2025 Plan”), approved by Hidrovias’ Board of Directors on June 23, 2025, with the first grant awarded on July 1, 2025.
The table below summarizes the restricted and performance stock programs under the 2017 Plan and the 2023 Plan (Ultrapar), and the 2025 Plan (Hidrovias):
|
Ultrapar Participações S.A. and Subsidiaries |
|
| Notes to the interim financial information | |
| For the period ended March 31, 2026 |
|
|
Program |
Grant date |
Number of shares granted (Quantity) |
Vesting period |
Fair value of shares on the grant date (in R$) |
Total exercisable grant costs, including taxes |
Accumulated recognized exercisable grant costs (in R$ thousands) |
Unrecognized exercisable grant costs (in R$ thousands) |
||
|
Ultrapar |
Restricted |
September 16, 2020 |
140,000 |
2026 |
23.03 |
5,464 |
(5,085) |
379 |
||
|
Ultrapar |
Restricted |
September 22, 2021 |
1,000,000 |
2027 |
14.17 |
24,093 |
(19,624) |
4,469 |
||
|
Ultrapar |
Restricted |
September 21, 2022 |
2,640,000 |
2032 |
12.98 |
64,048 |
(22,372) |
41,676 |
||
|
Ultrapar |
Restricted |
December 07, 2022 |
1,500,000 |
2032 |
13.47 |
37,711 |
(12,574) |
25,137 |
||
|
Ultrapar |
Restricted |
April 20, 2023 |
1,078,359 |
2026 |
14.50 |
29,507 |
(29,297) |
210 |
||
|
Ultrapar |
Performance |
April 20, 2023 |
1,146,186 |
2026 |
14.50 |
31,466 |
(31,255) |
211 |
||
|
Ultrapar |
Restricted |
September 20, 2023 |
3,700,000 |
2033 |
18.75 |
129,322 |
(33,452) |
95,870 |
||
|
Ultrapar |
Restricted |
April 17, 2024 |
3,406,820 |
2027 to 2029 |
26.94 |
174,321 |
(81,924) |
92,397 |
||
|
Ultrapar |
Restricted |
June 19, 2024 |
60,683 |
2027 |
21.47 |
2,468 |
(1,440) |
1,028 |
||
|
Ultrapar |
Restricted |
October 01, 2024 |
1,295,000 |
2034 |
23.10 |
55,785 |
(8,368) |
47,417 |
||
|
Ultrapar |
Restricted |
April 03, 2025 |
4,513,232 |
2027 to 2028 |
17.78 |
151,261 |
(40,972) |
110,289 |
||
|
Ultrapar |
Restricted |
November 13, 2025 |
750,000 |
2035 |
22.84 |
32,430 |
(1,351) |
31,079 |
||
|
Ultrapar |
Restricted |
March 27, 2026 |
1,064,639 |
2035 |
27.90 |
55,014 |
(1,406) |
53,608 |
||
|
|
22,294,919 |
|
|
792,890 |
(289,120) |
503,770 |
||||
|
|
|
|
|
|
|
|
|
|
||
|
Hidrovias |
Restricted |
July 01, 2025 |
1,244,523 |
2028 |
3.55 |
4,961 |
(1,358) |
3,603 |
||
|
|
|
|
23,539,442 |
|
|
797,851 |
(290,478) |
507,373 |
||
|
|
|
03/31/2026 |
|
|
|
Ultrapar |
|
Number of shares as of December 31, 2025 |
|
21,352,545 |
|
Ultrapar shares granted during the period |
|
1,064,639 |
|
Cancellation of Ultrapar shares due to termination of executive |
|
(61,768) |
|
Ultrapar shares transferred (vesting) |
|
(60,497) |
|
Number of shares as of March 31, 2026 |
|
22,294,919 |
|
|
|
03/31/2026 |
|
|
|
Hidrovias |
|
Number of shares as of December 31, 2025 |
|
1,244,523 |
|
Number of shares as of March 31, 2026 |
|
1,244,523 |
The Company does not have shares that were not transferred after the period for transfer of the ownership of the shares. For the three-month period ended March 31, 2026, an expense in the amount of R$ 38,510 was recognized in relation to the Plans (R$ 29,806 for the period ended March 31, 2025).
For all Ultrapar’s plans, settlements are made only with the delivery of treasury shares.
|
Ultrapar Participações S.A. and Subsidiaries |
|
| Notes to the interim financial information | |
| For the period ended March 31, 2026 |
9.1. Deferred income and social contribution taxes
|
|
Parent |
|
Consolidated |
||||
|
|
03/31/2026 |
|
12/31/2025 |
|
03/31/2026 |
|
12/31/2025 |
|
Assets - Deferred income and social contribution taxes on: |
|
|
|
|
|
|
|
|
Provision for losses with assets |
‐ |
|
‐ |
|
55,090 |
|
43,763 |
|
Provisions for tax, civil and labor risks |
47,071 |
|
44,928 |
|
146,903 |
|
149,635 |
|
Provision for post-employment benefits |
622 |
|
604 |
|
75,233 |
|
73,698 |
|
Provision for differences between cash and accrual basis (i) |
‐ |
|
32,910 |
|
60,718 |
|
89,166 |
|
Goodwill on investments |
‐ |
|
‐ |
|
34,348 |
|
32,747 |
|
Provision for asset retirement obligation |
‐ |
|
‐ |
|
12,771 |
|
12,593 |
|
Operating provisions |
5,310 |
|
4,841 |
|
85,964 |
|
61,311 |
|
Provision for profit sharing and bonus |
2,902 |
|
9,002 |
|
38,557 |
|
97,240 |
|
Leases payable |
1,999 |
|
2,253 |
|
561,814 |
|
583,232 |
|
Acquisition of shares from shareholders |
‐ |
|
‐ |
|
93,497 |
|
82,128 |
|
Other temporary differences |
48,129 |
|
36,358 |
|
181,319 |
|
194,698 |
|
Tax losses and negative basis for social contribution carryforwards |
36,367 |
|
43,188 |
|
553,747 |
|
529,868 |
|
Total |
142,400 |
|
174,084 |
|
1,899,961 |
|
1,950,079 |
|
Offsetting liability balance |
(8,366) |
|
(9,643) |
|
(860,921) |
|
(942,788) |
|
Net balances presented in assets |
134,034 |
|
164,441 |
|
1,039,040 |
|
1,007,291 |
|
|
|
|
|
|
|
|
|
|
Liabilities - Deferred income and social contribution taxes on: |
|
|
|
|
|
|
|
|
Leases payable |
1,656 |
|
1,891 |
|
461,141 |
|
484,879 |
|
Provision for differences between cash and accrual basis (i) |
1,085 |
|
‐ |
|
249,243 |
|
268,466 |
|
Goodwill on investments |
‐ |
|
‐ |
|
28,825 |
|
28,480 |
|
Business combination - fair value of assets |
‐ |
|
‐ |
|
559,428 |
|
573,793 |
|
Provision for indemnification |
‐ |
|
‐ |
|
88,584 |
|
88,854 |
|
Other temporary differences |
5,625 |
|
7,752 |
|
138,288 |
|
136,213 |
|
Total |
8,366 |
|
9,643 |
|
1,525,509 |
|
1,580,685 |
|
Offsetting asset balance |
(8,366) |
|
(9,643) |
|
(860,921) |
|
(942,788) |
|
Net balances presented in liabilities |
‐ |
|
‐ |
|
664,588 |
|
637,897 |
| (i) | In the consolidated refers mainly to the income and social contribution taxes on foreign exchange variation of the derivative instruments. |
Changes in the net balance of deferred IRPJ and CSLL are as follows:
|
|
Parent |
|
Consolidated |
|
Balance as of December 31, 2025 |
164,441 |
|
369,394 |
|
Deferred IRPJ and CSLL recognized in profit (loss) for the period |
(30,407) |
|
(6,077) |
|
Deferred IRPJ and CSLL recognized in equity |
- |
|
11,369 |
|
Others |
- |
|
(234) |
|
Balance as of March 31, 2026 |
134,034 |
|
374,452 |
|
Ultrapar Participações S.A. and Subsidiaries |
|
| Notes to the interim financial information | |
| For the period ended March 31, 2026 |
9.2. Reconciliation of income and social contribution taxes on profit or loss
IRPJ and CSLL are reconciled to the statutory tax rates as follows:
|
|
Parent |
|
Consolidated |
||||
|
|
03/31/2026 |
|
03/31/2025 |
|
03/31/2026 |
|
03/31/2025 |
|
Income before taxes |
918,147 |
|
333,404 |
|
1,412,422 |
|
611,053 |
|
Statutory tax rates - % |
34 |
|
34 |
|
34 |
|
34 |
|
Income and social contribution taxes at the statutory tax rates |
(312,170) |
|
(113,357) |
|
(480,223) |
|
(207,758) |
|
Adjustment to the statutory income and social contribution taxes: |
|
|
|
|
|
|
|
|
Nondeductible expenses |
(1,124) |
|
(854) |
|
(6,958) |
|
(3,841) |
|
Nontaxable revenues (i) |
263 |
|
175 |
|
15,788 |
|
5,615 |
|
Adjustment to estimated income |
‐ |
|
‐ |
|
1,466 |
|
422 |
|
Unrecorded deferred income and social contribution tax loss carryforwards |
‐ |
|
‐ |
|
(41,853) |
|
(20,137) |
|
Share of profit (loss) of subsidiaries, joint ventures and associates |
279,212 |
|
113,480 |
|
(7,043) |
|
(50,825) |
|
Interest on equity between subsidiaries |
‐ |
|
‐ |
|
2,842 |
|
‐ |
|
Difference of rate in the measurement of taxes (ii) |
- |
|
- |
|
15,183 |
|
- |
|
Other adjustments |
(8,754) |
|
(2) |
|
(26,962) |
|
12,894 |
|
Income and social contribution taxes before tax incentives |
(42,573) |
|
(558) |
|
(527,760) |
|
(263,630) |
|
Tax incentives – SUDENE (iii) |
‐ |
|
‐ |
|
29,496 |
|
15,761 |
|
Income and social contribution taxes in the statement of income |
(42,573) |
|
(558) |
|
(498,264) |
|
(247,869) |
|
Current |
(12,166) |
|
‐ |
|
(492,187) |
|
(164,439) |
|
Deferred |
(30,407) |
|
(558) |
|
(6,077) |
|
(83,430) |
|
Effective IRPJ and CSLL rates - % |
4.6 |
|
0.2 |
|
35.3 |
|
40.6 |
| (i) | Consist of gains and income not taxable under the applicable tax legislation and amounts related to non-taxation of the income and social contribution taxes on the monetary variation (SELIC). |
| (ii) | Refers to differences in applicable tax rates in the countries where the Company’s subsidiaries operate. |
| (iii) | Certain subsidiaries have the benefit of income tax reduction for belonging to the sectors of the economy considered priority for the subsidized areas, with a 75% decrease in the income tax basis. |
9.3. Tax losses and negative basis for social contribution carryforwards
As of March 31, 2026, the Company and certain subsidiaries had tax loss carryforwards related to income tax (IRPJ) and social contribution (CSLL), whose annual offsets are limited to 30% of taxable income in a given tax period, and do not expire.
|
Ultrapar Participações S.A. and Subsidiaries |
|
| Notes to the interim financial information | |
| For the period ended March 31, 2026 |
The balances comprising deferred taxes related to income tax loss carryforwards and negative basis of social contribution are as follows:
|
|
03/31/2026 |
|
12/31/2025 |
|
Oil Trading |
68,070 |
|
68,920 |
|
Ultrapar |
36,367 |
|
43,188 |
|
Ipiranga |
300,409 |
|
300,409 |
|
Ultracargo Soluções Logística |
47,145 |
|
42,808 |
|
Hidrovias do Brasil S.A. |
29,149 |
|
29,149 |
|
Hidrovias do Brasil – Vila do Conde |
44,208 |
|
16,970 |
|
Others |
28,399 |
|
28,424 |
|
|
553,747 |
|
529,868 |
The balances which are not constituted of deferred taxes related to income tax loss carryforwards and negative basis of social contribution are as follows:
|
|
03/31/2026 |
|
12/31/2025 |
|
Neogás |
46,308 |
|
45,143 |
|
Integra Frotas |
33,893 |
|
33,730 |
|
Stella |
38,478 |
|
33,073 |
|
Millennium |
14,551 |
|
14,440 |
|
Abastece aí |
156,610 |
|
156,570 |
|
Hidrovias do Brasil S.A. |
169,602 |
|
139,914 |
|
Hidrovias do Brasil – Administração Portuária de Santos |
44,551 |
|
40,005 |
|
Others |
7,760 |
|
9,897 |
|
|
511,753 |
|
472,772 |
Refers to exclusivity rights reimbursements of Ipiranga’s agreements with reseller service stations that are recognized at the time of their occurrence and amortized according to the conditions established in the agreement. Amortizations are recognized in profit or loss as reductions of sales revenue.
Changes are shown below:
|
|
03/31/2026 |
|
Opening balance |
2,185,096 |
|
Additions |
121,228 |
|
Amortization |
(146,550) |
|
Closing balance |
2,159,774 |
|
|
|
|
Current |
656,364 |
|
Non-current |
1,503,410 |
|
Ultrapar Participações S.A. and Subsidiaries |
|
| Notes to the interim financial information | |
| For the period ended March 31, 2026 |
The table below presents the positions of equity and income (loss) for the period by company:
|
|
|
|
|
|
Parent |
||||
|
|
Equity |
Income (loss) for the year |
Interest in share capital - % |
|
Investment (Provision for loss on investment) |
|
Share of profit (loss) of subsidiaries, joint ventures and associates |
||
|
|
|
03/31/2026 |
12/31/2025 |
|
03/31/2026 |
03/31/2025 |
|||
|
Subsidiaries |
|
|
|
|
|
|
|
|
|
|
Ultra Logística Ltda. |
2,090,594 |
(33,028) |
100.00 |
|
2,090,594 |
2,166,745 |
|
(33,028) |
(138,525) |
|
Ultrapar International S.A. |
(55,625) |
2,470 |
100.00 |
|
(55,625) |
(58,094) |
|
2,470 |
9,410 |
|
Ultracargo Logística Ltda |
1,259,853 |
33,155 |
99.92 |
|
1,258,832 |
1,224,232 |
|
33,128 |
74,581 |
|
Companhia Ultragaz S.A. |
1,107,567 |
173,961 |
99.99 |
|
1,107,404 |
1,130,862 |
|
173,935 |
127,907 |
|
UVC Investimentos Ltda. |
159,548 |
(5,818) |
100.00 |
|
159,548 |
90,366 |
|
(5,818) |
(3,646) |
|
Imaven Imóveis Ltda. |
100,807 |
63 |
100.00 |
|
100,807 |
89,645 |
|
63 |
506 |
|
Ultra Mobilidade S.A. (*) |
9,718,114 |
664,119 |
100.00 |
|
9,718,114 |
9,276,372 |
|
664,119 |
273,495 |
|
EAI Clube Automobilista S/A |
5,088 |
(150) |
100.00 |
|
5,088 |
5,238 |
|
(150) |
‐ |
|
Joint ventures |
|
|
|
|
|
|
|
|
|
|
Química da Bahia Indústria e Comércio S.A. |
8,089 |
91 |
50.00 |
|
4,045 |
3,999 |
|
46 |
‐ |
|
Refinaria de Petróleo Riograndense S.A. (i) |
189,908 |
(40,901) |
33.14 |
|
62,932 |
(72,803) |
|
(13,554) |
(9,964) |
|
|
|
|
|
|
|
|
|
|
|
|
Total (A) |
|
|
|
|
14,451,739 |
13,856,562 |
|
821,211 |
333,764 |
|
Total provision for loss on investment (B) |
|
|
|
|
(55,625) |
(130,897) |
|
|
|
|
Total investments (A-B) |
|
|
|
|
14,507,364 |
13,987,459 |
|
|
|
| (*) | Amounts adjusted for unrealized profits in equity and income for the period. |
| (i) | Investment considers capital loss balances of R$ 1,061 as of March 31, 2026 (R$ 6,126 as of December 31, 2025). |
|
Ultrapar Participações S.A. and Subsidiaries |
|
| Notes to the interim financial information | |
| For the period ended March 31, 2026 |
|
|
|
|
|
|
Consolidated |
||||
|
|
Equity |
Income (loss) for the year |
Interest in share capital - % |
|
Investment (Provision for loss on investment) |
|
Share of profit (loss) of subsidiaries, joint ventures and associates |
||
|
|
|
03/31/2026 |
12/31/2025 |
|
03/31/2026 |
03/31/2025 |
|||
|
Joint ventures |
|
|
|
|
|
|
|
|
|
|
União Vopak – Armazéns Gerais Ltda. |
(1,193) |
(344) |
50.00 |
|
(597) |
(425) |
|
(172) |
(251) |
|
Refinaria de Petróleo Riograndense S.A. |
189,908 |
(40,901) |
33.14 |
|
62,932 |
(72,803) |
|
(13,553) |
(9,963) |
|
Latitude Logística Portuária S.A. |
5,917 |
(1,707) |
50.00 |
|
2,959 |
3,813 |
|
(854) |
(344) |
|
Navegantes Logística Portuária S.A. |
(4,532) |
(10,153) |
33.33 |
|
(1,511) |
(2,381) |
|
(3,384) |
(2,604) |
|
Nordeste Logística I S.A. |
10,133 |
1,195 |
33.33 |
|
3,378 |
3,151 |
|
398 |
466 |
|
Nordeste Logística II S.A. |
53,734 |
209 |
33.33 |
|
17,911 |
17,842 |
|
70 |
181 |
|
Nordeste Logística III S.A |
124,702 |
876 |
33.33 |
|
41,567 |
18,184 |
|
292 |
(40) |
|
Química da Bahia Indústria e Comércio S.A. |
8,089 |
91 |
50.00 |
|
4,045 |
3,999 |
|
46 |
‐ |
|
Terminal de Combustíveis Paulínia S.A. ("Opla") |
168,729 |
634 |
50.00 |
|
84,365 |
84,047 |
|
317 |
1,639 |
|
Limday S.A. |
34,796 |
5,702 |
44.55 |
|
15,502 |
13,662 |
|
2,540 |
‐ |
|
Obrinel S.A. |
196,430 |
1,193 |
49.00 |
|
96,251 |
100,847 |
|
584 |
‐ |
|
Baden S.A. |
17,955 |
(854) |
50.00 |
|
8,978 |
9,912 |
|
(427) |
‐ |
|
Other investments |
‐ |
‐ |
‐ |
|
138 |
436 |
|
‐ |
‐ |
|
Associates |
|
|
|
|
|
|
|
|
|
|
Hidrovias do Brasil S.A. |
- |
- |
44.51 |
|
‐ |
‐ |
|
- |
(138,667) |
|
Transportadora Sulbrasileira de Gás S.A. |
13,915 |
89 |
25.00 |
|
3,479 |
3,640 |
|
22 |
494 |
|
Metalúrgica Plus S.A. |
(1,433) |
(82) |
33.33 |
|
(478) |
(450) |
|
(27) |
(25) |
|
Plenogás Distribuidora de Gás S.A. |
1,420 |
64 |
33.33 |
|
473 |
452 |
|
21 |
31 |
|
Virtu GNL Participações S.A. |
119,277 |
(14,139) |
43.75 |
|
52,184 |
‐ |
|
(6,186) |
‐ |
|
Other investments |
- |
- |
- |
|
29 |
37 |
|
- |
- |
|
|
|
|
|
|
|
|
|
|
|
|
Goodwill on investments |
|
|
|
|
|
|
|
|
|
|
Terminal de Combustíveis Paulínia S.A. ("Opla") |
‐ |
‐ |
‐ |
|
117,306 |
117,306 |
|
‐ |
‐ |
|
Limday S.A. |
‐ |
‐ |
‐ |
|
7,010 |
7,390 |
|
‐ |
‐ |
|
Virtu GNL Participações S.A. |
‐ |
‐ |
‐ |
|
45,785 |
‐ |
|
‐ |
‐ |
|
|
|
|
|
|
|
|
|
|
|
|
Fair value adjustment on investments |
|
|
|
|
|
|
|
|
|
|
Terminal de Combustíveis Paulínia S.A. ("Opla") |
‐ |
‐ |
‐ |
|
36,822 |
37,225 |
|
(403) |
(403) |
|
Concession Agreement - Baloto |
‐ |
‐ |
‐ |
|
4,062 |
4,163 |
|
‐ |
‐ |
|
|
|
|
|
|
|
|
|
|
|
|
Advances for investments |
|
|
|
|
|
|
|
|
|
|
Advances for investments - Pão de Açúcar Group stations (i) |
‐ |
‐ |
‐ |
|
49,189 |
59,403 |
|
‐ |
‐ |
|
Advances for investments - Virtu GNL (ii) |
‐ |
‐ |
‐ |
|
‐ |
30,000 |
|
‐ |
‐ |
|
Advances for investments - Blustone |
‐ |
‐ |
‐ |
|
‐ |
5,872 |
|
‐ |
‐ |
|
|
|
|
|
|
|
|
|
|
|
|
Total (A) |
|
|
|
|
651,779 |
445,322 |
|
(20,716) |
(149,486) |
|
Total provision for loss on investment (B) |
|
|
|
|
(2,586) |
(76,059) |
|
|
|
|
Total investments (A-B) |
|
|
|
|
654,365 |
521,381 |
|
|
|
|
Ultrapar Participações S.A. and Subsidiaries |
|
| Notes to the interim financial information | |
| For the period ended March 31, 2026 |
| (i) | The amount refers to the advance for the acquisition of Pão de Açúcar Group service stations by subsidiary Centro de Conveniências Millenium Ltda. |
| (ii) | The amount refers to the advance for the acquisition of a 43.75% interest in Virtu GNL Participações S.A by subsidiary UVC Investimentos Ltda. |
The financial position and income of subsidiaries which have relevant non-controlling interests is shown below:
|
|
Consolidated |
|||||||
|
|
Proportion of interest in share capital and voting rights held by non-controlling interests |
|
Equity attributable to non-controlling interests |
|
Income allocated to non-controlling interests for the period |
|||
|
|
03/31/2026 |
12/31/2025 |
|
03/31/2026 |
12/31/2025 |
|
03/31/2026 |
03/31/2025 |
|
Subsidiaries |
% |
% |
|
|
|
|
|
|
|
Hidrovias do Brasil S.A. (i) |
40% |
41% |
|
1,291,951 |
1,390,560 |
|
(27,532) |
‐ |
|
Iconic Lubrificantes S.A. (i) |
44% |
44% |
|
430,726 |
407,379 |
|
32,012 |
19,134 |
|
Ultragaz Comercializadora de Energia Ltda. (i) |
48% |
48% |
|
177,577 |
148,927 |
|
28,997 |
9,985 |
|
Other investments |
- |
- |
|
139,210 |
117,479 |
|
5,107 |
1,219 |
|
|
|
|
|
2,039,464 |
2,064,345 |
|
38,584 |
30,338 |
| (i) | Considers the effects of allocation of fair value adjustments related to non-controlling interests. |
|
Ultrapar Participações S.A. and Subsidiaries |
|
| Notes to the interim financial information | |
| For the period ended March 31, 2026 |
Balances and changes in investments in subsidiaries, joint ventures and associates are as follows:
|
|
Parent |
|
Consolidated |
||||||||||||
|
|
Subsidiaries |
Joint ventures |
Total |
|
Joint ventures |
Associates |
Advances |
Other investments |
Total |
||||||
|
Balance as of December 31, 2025 (i) |
13,925,366 |
(68,804) |
13,856,562 |
|
342,205 |
3,679 |
95,275 |
4,163 |
445,322 |
||||||
|
Share of profit (loss) of subsidiaries, joint ventures and associates (*) |
834,719 |
(13,508) |
821,211 |
|
(14,143) |
(6,170) |
‐ |
‐ |
(20,313) |
||||||
|
Amortization of fair value adjustments |
‐ |
‐ |
‐ |
|
(403) |
‐ |
‐ |
‐ |
(403) |
||||||
|
Dividends |
(199,971) |
‐ |
(199,971) |
|
(342) |
(183) |
‐ |
‐ |
(525) |
||||||
|
Equity instrument granted (ii) |
8,250 |
‐ |
8,250 |
|
‐ |
‐ |
‐ |
‐ |
‐ |
||||||
|
Accumulated other comprehensive income |
(73,230) |
269 |
(72,961) |
|
269 |
‐ |
‐ |
‐ |
269 |
||||||
|
Translation adjustments of foreign subsidiaries |
‐ |
‐ |
‐ |
|
(6,769) |
‐ |
‐ |
(101) |
(6,870) |
||||||
|
Capital increase/decrease |
(89,240) |
150,253 |
61,013 |
|
177,768 |
‐ |
- |
‐ |
177,768 |
||||||
|
Acquisition of shares from shareholders |
(22,063) |
‐ |
(22,063) |
|
‐ |
‐ |
‐ |
‐ |
‐ |
||||||
|
Acquisition of shares |
- |
- |
- |
|
- |
104,155 |
- |
- |
104,155 |
||||||
|
Advances for investments - GPA stations |
‐ |
‐ |
‐ |
|
‐ |
‐ |
(10,214) |
‐ |
(10,214) |
||||||
|
Advances for investments - Virtu GNL |
- |
- |
- |
|
- |
- |
(30,000) |
- |
(30,000) |
||||||
|
Advances for investments - Blustone |
‐ |
‐ |
‐ |
|
‐ |
‐ |
(5,872) |
‐ |
(5,872) |
||||||
|
Other movements |
931 |
(1,233) |
(302) |
|
(1,529) |
(9) |
‐ |
- |
(1,538) |
||||||
|
Balance as of March 31, 2026 (i) |
14,384,762 |
66,977 |
14,451,739 |
|
497,056 |
101,472 |
49,189 |
4,062 |
651,779 |
||||||
| (*) | Adjusted for unrealized profits between subsidiaries. |
| (i) | Investments in subsidiaries, joint ventures and associates net of provision for loss on investment. |
| (ii) | Amounts refer to grants of long-term incentives in subsidiaries Ultra Mobilidade, Companhia Ultragaz, Ultracargo Logística and Ultra Logística. |
|
Ultrapar Participações S.A. and Subsidiaries |
|
| Notes to the interim financial information | |
| For the period ended March 31, 2026 |
The Company and certain subsidiaries have leases, substantially related to: (i) Ipiranga: fuel stations and distribution bases; (ii) Ultragaz: points of sale and bottling bases; (iii) Ultracargo: port areas; (iv) Hidrovias: port areas and vessels and (v) Company: offices.
12.1. Right-of-use assets
|
|
Residual average useful life (years) |
Balance as of 12/31/2025 |
Additions and remeasurement |
Write-offs |
Transfers (i) |
Translation adjustment |
Amortization |
Balance as of 03/31/2026 |
||||||
|
Cost: |
|
|
|
|
|
|
|
|
||||||
|
Real estate |
7 |
1,507,508 |
35,736 |
(59,731) |
‐ |
(482) |
‐ |
1,483,031 |
||||||
|
Port areas |
18 |
1,124,903 |
9,677 |
‐ |
‐ |
‐ |
‐ |
1,134,580 |
||||||
|
Vehicles |
2 |
419,483 |
24,867 |
(39,790) |
(498) |
(106) |
‐ |
403,956 |
||||||
|
Equipment |
2 |
57,476 |
1,973 |
(1,554) |
498 |
‐ |
‐ |
58,393 |
||||||
|
Vessels |
9 |
81,803 |
‐ |
‐ |
‐ |
(1,915) |
‐ |
79,888 |
||||||
|
Others |
5 |
53,259 |
‐ |
‐ |
‐ |
‐ |
‐ |
53,259 |
||||||
|
|
|
3,244,432 |
72,253 |
(101,075) |
‐ |
(2,503) |
‐ |
3,213,107 |
||||||
|
Accumulated amortization: |
|
|
|
|
|
|
|
|
||||||
|
Real estate |
‐ |
(726,187) |
‐ |
57,524 |
‐ |
181 |
(41,881) |
(710,363) |
||||||
|
Port areas |
‐ |
(267,656) |
‐ |
‐ |
‐ |
‐ |
(13,965) |
(281,621) |
||||||
|
Vehicles |
‐ |
(208,558) |
‐ |
33,049 |
478 |
38 |
(23,452) |
(198,445) |
||||||
|
Equipment |
‐ |
(33,275) |
‐ |
1,554 |
(478) |
‐ |
(4,396) |
(36,595) |
||||||
|
Vessels |
‐ |
(49,551) |
‐ |
‐ |
‐ |
1,450 |
(3,594) |
(51,695) |
||||||
|
Others |
‐ |
(30,511) |
‐ |
‐ |
(1,315) |
‐ |
(985) |
(32,811) |
||||||
|
|
|
(1,315,738) |
‐ |
92,127 |
(1,315) |
1,669 |
(88,273) |
(1,311,530) |
||||||
|
Right-of-use assets |
|
1,928,694 |
72,253 |
(8,948) |
(1,315) |
(834) |
(88,273) |
1,901,577 |
| (i) | Refers to the transfer carried out from property, plant and equipment, in the amount of R$ 1,315. |
12.2. Leases payable
The changes in leases payable are shown below:
|
|
03/31/2026 |
|
Opening balance |
1,739,633 |
|
Interest accrued |
40,475 |
|
Payments of leases and interest |
(145,288) |
|
Additions and remeasurement |
72,253 |
|
Write-offs |
(12,281) |
|
Monetary variations and foreign exchange variations |
(401) |
|
Closing balance |
1,694,391 |
|
|
|
|
Current |
308,111 |
|
Non-current |
1,386,280 |
|
Ultrapar Participações S.A. and Subsidiaries |
|
| Notes to the interim financial information | |
| For the period ended March 31, 2026 |
The undiscounted future cash outflows are presented below:
|
|
03/31/2026 |
|
12/31/2025 |
|
Up to 1 year |
439,644 |
|
483,696 |
|
1 to 2 years |
338,456 |
|
339,415 |
|
2 to 3 years |
262,129 |
|
265,036 |
|
3 to 4 years |
222,680 |
|
220,813 |
|
4 to 5 years |
170,416 |
|
172,465 |
|
More than 5 years |
1,225,691 |
|
1,246,359 |
|
Total |
2,659,016 |
|
2,727,784 |
The contracts of leases payable are substantially indexed by the IGP-M.
In compliance with the CVM’s requirement under Official Letter SNC/SEP 02/2019, the potential right to PIS/COFINS recoverable embedded in the lease consideration, calculated based on the 9.25% rate in accordance with Brazilian tax legislation, amounted to R$ 245,959 in nominal cash flow, and R$ 156,731 in present value cash flow for the period ended March 31, 2026.
12.2.1. Discount rates
The weighted nominal average discount rates for the lease contracts of the Company are:
|
Contracts by maturity date and discount rate |
|
|
Maturity dates of the contracts |
Rate (% p.a.) |
|
From 1 to 5 years |
12.05% |
|
From 6 to 10 years |
11.24% |
|
From 11 to 15 years |
10.61% |
|
More than 15 years |
10.05% |
|
Ultrapar Participações S.A. and Subsidiaries |
|
| Notes to the interim financial information | |
| For the period ended March 31, 2026 |
|
|
Residual average useful life (years) |
Balance as of 12/31/2025 |
Additions |
Depreciation |
Transfers (i) |
Write-offs |
Translation adjustment |
Opening balance – acquisition of subsidiaries (ii) |
Balance as of 03/31/2026 |
|||||||
|
Cost: |
|
|
|
|
|
|
|
|
|
|||||||
|
Land |
- |
801,434 |
11 |
‐ |
‐ |
(55) |
‐ |
979 |
802,369 |
|||||||
|
Buildings |
19 |
2,600,830 |
3,944 |
‐ |
33,171 |
(1,166) |
- |
2,057 |
2,638,836 |
|||||||
|
Leasehold improvements |
11 |
1,719,673 |
8,781 |
‐ |
27,886 |
(1,968) |
(4,414) |
3,975 |
1,753,933 |
|||||||
|
Machinery and equipment |
8 |
4,992,933 |
40,887 |
‐ |
52,096 |
(8,616) |
(3,068) |
4,352 |
5,078,584 |
|||||||
|
Automotive fuel/lubricant distribution equipment and facilities |
8 |
3,332,723 |
8,458 |
‐ |
44,863 |
(6,809) |
‐ |
637 |
3,972,480 |
|||||||
|
Push boats, barges, ships |
13 |
4,115,886 |
8,941 |
‐ |
(11,679) |
(745) |
(139,923) |
‐ |
3,969,317 |
|||||||
|
LPG tanks and bottles |
3 |
1,165,746 |
23,433 |
‐ |
36 |
(7,524) |
‐ |
‐ |
1,181,691 |
|||||||
|
Vehicles |
7 |
416,337 |
4,050 |
‐ |
(620) |
(2,078) |
(33) |
‐ |
417,656 |
|||||||
|
Furniture and fixtures |
5 |
228,287 |
1,336 |
‐ |
(703) |
(1,034) |
(53) |
174 |
228,007 |
|||||||
|
IT equipment |
2 |
376,199 |
1,942 |
‐ |
418 |
(1,335) |
(370) |
907 |
377,761 |
|||||||
|
Construction in progress |
- |
1,496,336 |
136,953 |
‐ |
(167,826) |
(93) |
(1,083) |
64 |
1,464,351 |
|||||||
|
Advances to suppliers |
- |
21,339 |
16,354 |
‐ |
(433) |
‐ |
‐ |
‐ |
37,260 |
|||||||
|
Imports in progress |
- |
4,565 |
4,746 |
‐ |
‐ |
‐ |
‐ |
‐ |
9,311 |
|||||||
|
|
|
21,272,288 |
259,836 |
‐ |
(22,791) |
(31,423) |
(148,944) |
13,145 |
21,342,111 |
|||||||
|
Accumulated depreciation: |
|
|
|
|
|
|
|
|
|
|||||||
|
Buildings |
‐ |
(872,720) |
‐ |
(22,362) |
55 |
723 |
‐ |
‐ |
(894,304) |
|||||||
|
Leasehold improvements |
‐ |
(788,665) |
‐ |
(23,058) |
964 |
877 |
1,292 |
‐ |
(808,590) |
|||||||
|
Machinery and equipment |
‐ |
(2,725,860) |
‐ |
(81,916) |
(826) |
6,801 |
1,434 |
‐ |
(2,800,367) |
|||||||
|
Automotive fuel/lubricant distribution equipment and facilities |
‐ |
(2,107,612) |
‐ |
(35,235) |
(423) |
6,499 |
‐ |
‐ |
(2,136,771) |
|||||||
|
Push boats, barges, ships |
‐ |
(1,224,815) |
‐ |
(44,222) |
19,843 |
478 |
50,814 |
‐ |
(1,197,902) |
|||||||
|
LPG tanks and bottles |
‐ |
(738,429) |
‐ |
(24,151) |
353 |
6,530 |
‐ |
‐ |
(755,697) |
|||||||
|
Vehicles |
‐ |
(203,725) |
‐ |
(9,808) |
705 |
464 |
33 |
‐ |
(212,331) |
|||||||
|
Furniture and fixtures |
‐ |
(151,731) |
‐ |
(3,838) |
(118) |
1,033 |
27 |
‐ |
(154,627) |
|||||||
|
IT equipment |
‐ |
(291,451) |
‐ |
(8,090) |
1,686 |
1,137 |
182 |
‐ |
(296,536) |
|||||||
|
|
|
(9,105,008) |
‐ |
(252,680) |
22,239 |
24,542 |
53,782 |
‐ |
(9,257,125) |
|||||||
|
Provision for impairment losses |
|
(183) |
‐ |
‐ |
‐ |
‐ |
‐ |
‐ |
(183) |
|||||||
|
Fixed assets |
|
12,167,097 |
259,836 |
(252,680) |
(552) |
(6,881) |
(95,162) |
13,145 |
12,084,803 |
| (i) | Refers to transfers of R$ 1,867 from intangible assets and R$ 1,315 to right-of-use assets. |
| (ii) | The total amounts of acquisitions made by the Company are substantially related to the acquisition of service stations from Grupo Pão e Açucar by its subsidiary Millenium. |
|
Ultrapar Participações S.A. and Subsidiaries |
|
| Notes to the interim financial information | |
| For the period ended March 31, 2026 |
Construction in progress relates substantially to expansions, renovations, constructions and upgrade of the terminals’ assets, service stations, tanks, barges and distribution bases.
Advances to suppliers are basically related to manufacturing of assets for expansion of terminals, distribution bases and acquisition of real estate.
|
|
Residual average useful life (years) |
Balance as of 12/31/2025 |
Additions |
Amortization |
Transfers (i) |
Write-offs |
Translation adjustment |
Acquisition of subsidiaries (ii) |
Balance as of 03/31/2026 |
|||||||
|
Cost: |
|
|
|
|
|
|
|
|
|
|||||||
|
Goodwill |
- |
1,367,446 |
‐ |
‐ |
‐ |
‐ |
‐ |
‐ |
1,367,446 |
|||||||
|
Software |
3 |
2,162,461 |
110,592 |
‐ |
(141,608) |
(155) |
(578) |
‐ |
2,130,712 |
|||||||
|
Customer contracts |
11 |
838,149 |
‐ |
‐ |
82 |
‐ |
(378) |
‐ |
837,853 |
|||||||
|
Distribution rights |
11 |
255,629 |
‐ |
‐ |
‐ |
‐ |
‐ |
8,252 |
263,881 |
|||||||
|
Brands |
- |
61,355 |
‐ |
‐ |
440 |
‐ |
‐ |
‐ |
61,795 |
|||||||
|
Trademark rights |
3 |
130,897 |
- |
‐ |
‐ |
‐ |
‐ |
‐ |
130,897 |
|||||||
|
Intangible assets in progress |
‐ |
39,420 |
378 |
‐ |
(997) |
- |
48 |
‐ |
38,849 |
|||||||
|
Decarbonization credits (CBIO) |
- |
‐ |
80,969 |
‐ |
‐ |
‐ |
‐ |
‐ |
80,969 |
|||||||
|
Others |
- |
16,470 |
‐ |
‐ |
(387) |
‐ |
‐ |
‐ |
16,083 |
|||||||
|
|
|
4,871,827 |
191,939 |
‐ |
(142,470) |
(155) |
(908) |
8,252 |
4,928,485 |
|||||||
|
Accumulated amortization: |
|
|
|
|
|
|
|
|
|
|||||||
|
Software |
‐ |
(1,337,814) |
‐ |
(55,146) |
144,646 |
(73) |
620 |
‐ |
(1,247,767) |
|||||||
|
Customer contracts |
‐ |
(52,941) |
‐ |
(36,147) |
(82) |
‐ |
320 |
‐ |
(88,850) |
|||||||
|
Distribution rights |
‐ |
(121,530) |
‐ |
(2,769) |
(467) |
- |
‐ |
‐ |
(124,766) |
|||||||
|
Trademark rights |
‐ |
(37,435) |
‐ |
(2,122) |
201 |
‐ |
‐ |
‐ |
(39,356) |
|||||||
|
Others |
‐ |
(5,629) |
‐ |
(743) |
39 |
- |
‐ |
‐ |
(6,333) |
|||||||
|
|
|
(1,555,349) |
‐ |
(96,927) |
144,337 |
(73) |
940 |
‐ |
(1,507,072) |
|||||||
|
Intangible assets |
|
3,316,478 |
191,939 |
(96,927) |
1,867 |
(228) |
32 |
8,252 |
3,421,413 |
| (i) | Refers to R$ 1,867 transferred to property, plant and equipment. |
| (ii) | The total amounts of acquisitions made by the Company are substantially related to the acquisition of service stations from Grupo Pão e Açucar by its subsidiary Millenium. |
|
Ultrapar Participações S.A. and Subsidiaries |
|
| Notes to the interim financial information | |
| For the period ended March 31, 2026 |
14.1. Goodwill
The remaining net balance of goodwill on the following acquisitions is assessed for impairment annually or more frequently when there is indication that the goodwill might be impaired. The amount is made up of the following acquisitions.
|
|
Segment |
03/31/2026 |
12/31/2025 |
||
|
Goodwill on the acquisition of: |
|
|
|
||
|
Hidrovias (27.2) |
Hidrovias |
341,084 |
341,084 |
||
|
Ipiranga (i) |
Ipiranga |
276,724 |
276,724 |
||
|
União Terminais |
Ultracargo |
211,089 |
211,089 |
||
|
Texaco |
Ipiranga |
177,759 |
177,759 |
||
|
Iconic (CBLSA) |
Ipiranga |
69,807 |
69,807 |
||
|
Neoagro Diesel |
Ipiranga |
62,833 |
62,833 |
||
|
Stella |
Ultragaz |
51,951 |
51,951 |
||
|
Temmar |
Ultracargo |
43,781 |
43,781 |
||
|
Ultragaz Comercializadora de Energia |
Ultragaz |
42,260 |
42,260 |
||
|
Petrovila |
Ipiranga |
34,934 |
34,934 |
||
|
DNP |
Ipiranga |
24,736 |
24,736 |
||
|
Repsol |
Ultragaz |
13,403 |
13,403 |
||
|
Neogás |
Ultragaz |
7,761 |
7,761 |
||
|
Mi TRR |
Ipiranga |
5,383 |
5,383 |
||
|
Baden |
Hidrovias |
1,731 |
1,731 |
||
|
Serra Diesel |
Ultrapar |
1,413 |
1,413 |
||
|
TEAS |
Ultracargo |
797 |
797 |
||
|
|
|
1,367,446 |
1,367,446 |
| (i) | Including R$ 246,163 presented as goodwill in the Parent. |
The goodwill presented above is based on the expectation of future profitability, supported by appraisal reports, after allocation of the identified assets. In the three-month period ended March 31, 2026, the Company did not identify any event that indicated the need to carry out an impairment test.
Goodwill from investments in joint ventures and associates is presented under investments, for further information see Note 11.
|
Ultrapar Participações S.A. and Subsidiaries |
|
| Notes to the interim financial information | |
| For the period ended March 31, 2026 |
15.1. Composition
|
|
|
|
|
|
|
Consolidated |
|||||
|
Description |
Index/Currency |
Weighted average financial charges 2026 (p.a.) |
Weighted average hedging instruments |
Maturity |
|
03/31/2026 |
12/31/2025 |
||||
|
Foreign currency-denominated: |
|
|
|
|
|
|
|
||||
|
Notes in the foreign market |
USD |
5.3% |
142.6% of DI (*) |
2026 to 2029 |
|
4,276,458 |
4,158,025 |
||||
|
Foreign financing |
USD |
4.3% |
103.9% of DI |
2026 to 2029 |
|
3,157,982 |
2,554,217 |
||||
|
Notes in the foreign market |
USD |
5.0% |
106.7% of DI (**) |
2031 |
|
934,037 |
984,400 |
||||
|
Foreign financing |
SOFR + USD |
0.7% |
103.8% of DI |
2026 to 2029 |
|
705,668 |
1,295,481 |
||||
|
Foreign exchange debentures |
EUR |
3.0% |
104.4% of DI |
2027 |
|
477,044 |
515,654 |
||||
|
Foreign exchange debentures |
USD |
5.3% |
101.7% of DI |
2026 |
|
‐ |
339,836 |
||||
|
Total in foreign currency |
|
|
|
|
|
9,551,189 |
9,847,613 |
||||
|
|
|
|
|
|
|
|
|
||||
|
Brazilian Reais: |
|
|
|
|
|
|
|
||||
|
Debentures |
CDI + R$ |
0.9% |
n/a |
2027 to 2031 |
|
3,485,094 |
3,455,058 |
||||
|
Debentures – CRA |
IPCA |
5.4% |
104.0% of DI |
2028 to 2032 |
|
2,240,145 |
2,339,526 |
||||
|
Debentures |
IPCA |
5.0% |
103.0% of DI |
2028 to 2031 |
|
1,053,963 |
1,063,019 |
||||
|
CDCA |
CDI + R$ |
0.9% |
n/a |
2027 |
|
567,569 |
547,587 |
||||
|
Financing |
R$ |
14.6% |
106.6% of DI |
2027 |
|
566,066 |
552,666 |
||||
|
Debentures – CRA |
R$ |
11.2% |
104.4% of DI |
2027 |
|
512,880 |
513,103 |
||||
|
Debentures – CRA |
CDI + R$ |
0.7% |
n/a |
2027 |
|
496,167 |
495,731 |
||||
|
Debentures |
IPCA |
6.7% |
CDI -1.4% |
2032 to 2035 |
|
231,192 |
240,744 |
||||
|
CDCA |
CDI |
109.0% |
n/a |
2026 to 2027 |
|
206,579 |
206,594 |
||||
|
Commercial Paper |
CDI + R$ |
0.2% |
n/a |
2027 |
|
88,928 |
89,083 |
||||
|
Constitutional Fund (FNE) |
TFC PÓS |
2.9% |
69.5% of DI |
2028 to 2041 |
|
193,974 |
192,054 |
||||
|
Constitutional Fund (FNE) |
TFC PÓS |
4.5% |
CDI -2.4% |
2030 to 2041 |
|
90,699 |
‐ |
||||
|
Constitutional Fund (FNO) |
TFC PÓS |
3.1% |
70.8% of DI |
2028 to 2037 |
|
85,482 |
84,462 |
||||
|
FINEP |
TJLP |
1.0% |
n/a |
2026 to 2032 |
|
26,232 |
27,249 |
||||
|
Climate Fund |
R$ |
9.4% |
72.9% of DI |
2026 to 2040 |
|
18,689 |
22,451 |
||||
|
CCB |
R$ |
17.5% |
n/a |
2026 to 2028 |
|
12,805 |
416,321 |
||||
|
Total in Brazilian Reais |
|
|
|
|
|
9,876,464 |
10,245,648 |
||||
|
Total in foreign currency and Brazilian Reais |
|
|
|
|
|
19,427,653 |
20,093,261 |
||||
|
Current |
|
|
|
|
|
4,359,732 |
4,251,131 |
||||
|
1 to 2 years |
|
|
|
|
|
3,756,354 |
3,923,059 |
||||
|
2 to 3 years |
|
|
|
|
|
4,106,396 |
4,227,274 |
||||
|
3 to 4 years |
|
|
|
|
|
3,035,709 |
3,525,329 |
||||
|
4 to 5 years |
|
|
|
|
|
1,996,085 |
1,038,873 |
||||
|
More than 5 years |
|
|
|
|
|
2,173,377 |
3,127,595 |
||||
|
Non-current |
|
|
|
|
|
15,067,921 |
15,842,130 |
||||
| (*) | Considers a protection instrument for the principal of 52.5% of the DI and for interest DI minus 1.4% for a notional amount of US$ 300 million. Does not include the positive result of the natural hedge strategy through financial investments in US$. |
| (**) | Considers a protection instrument for principal and interest at DI + 1.5% for a notional amount of US$ 107.5 million. |
|
Ultrapar Participações S.A. and Subsidiaries |
|
| Notes to the interim financial information | |
| For the period ended March 31, 2026 |
The changes in loans, financing and debentures are shown below:
|
|
03/31/2026 |
|
Opening balance |
20,093,261 |
|
Proceeds |
1,107,983 |
|
Interest accrued |
407,459 |
|
Principal payment |
(1,193,745) |
|
Interest payment |
(306,923) |
|
Monetary variations and foreign exchange variations |
(470,385) |
|
Change in fair value |
(209,997) |
|
Closing balance |
19,427,653 |
The transaction costs associated with debt issuance were deducted from the balance of the related liability and recognized in profit or loss according to the effective interest rate method. As of March 31, 2026, the amount recognized in profit or loss was R$ 7,907 (R$ 4,542 as of March 31, 2025). The balance to be recognized in the next periods is R$ 84,173 (R$ 92,080 as of December 31, 2025).
15.2. Guarantees
As of March 31, 2026, there was R$ 85,482 (R$ 84,462 as of December 31, 2025) in financing that had real guarantees. There was also R$ 18,076,147 (R$ 18,684,982 as of December 31, 2025) in financing without real guarantees, with sureties or promissory notes.
The Company and its subsidiaries offer collateral in the form of letters of guarantee for commercial and legal proceedings in the amount of R$ 100,822 as of March 31, 2026 (R$ 100,200 as of December 31, 2025).
Subsidiary Ipiranga issues collateral to financial institutions in connection with the amounts payable by some of its customers to such institutions, with maximum future settlements related to these guarantees in the amount of R$ 63,406 (R$ 87,160 as of December 31, 2025). If subsidiary Ipiranga is required to make any payment under these collateral arrangements, this subsidiary may recover the amount paid directly from its customers through commercial collection. Until March 31, 2026, subsidiary Ipiranga did not have losses in connection with these collateral arrangements.
15.3. Relevant operations contracted in the period
The main operations contracted in the period are shown below:
|
Description |
Index/ Currency |
Financial charges |
Hedging instruments |
Issuance date |
Maturity |
Principal |
Principal in R$ |
Remuneration payment |
Nominal amount payment |
Company |
|
Constitutional Fund (FNE) |
IPCA |
4.5% |
CDI - 2.4% |
Jan-26 |
Jan-41 |
R$106,871 |
106,871 |
Monthly with grace period |
2030 to 2041 |
Ultracargo Logística |
|
Foreign financing |
USD |
4.2% |
n/a |
Feb/26 |
Jun/29 |
USD 53,200 |
277,172 |
Semiannually |
At final maturity |
Ipiranga |
|
Foreign financing |
USD |
4.5% |
103.9% CDI |
Mar/26 |
Oct/27 |
USD 68,571 |
360,000 |
Semiannually |
At final maturity |
Ultracargo Logística |
|
Foreign financing |
USD |
4.9% |
103.9% CDI |
Mar/26 |
Mar/27 |
USD 68,641 |
360,000 |
At final maturity |
At final maturity |
Cia Ultragaz |
|
Ultrapar Participações S.A. and Subsidiaries |
|
| Notes to the interim financial information | |
| For the period ended March 31, 2026 |
15.4. Covenants – Subsidiary Hidrovias
Financial Covenant linked to Debenture contracts
Hidrovias, through the 1st and 2nd Debenture Issuances, has a financial covenant of leverage (“net debt to EBITDA”), calculated on a consolidated basis and which must be equal to or less than 4.5x in 2022, (b) 4.0x between January 1, 2023 and December 2023 and (c) 3.5x from January 1, 2024 until the maturity date of the respective issues.
Failure to comply with the covenant does not accelerate the debt repayment and is not considered default. However, Hidrovias now has restrictions on raising new debts beyond those permitted by the covenants of the indenture of issuance and is restricted from paying the minimum mandatory dividends set forth by its Bylaws. Hidrovias does not expect any short- or medium-term impacts on its operations and believes it will not need additional loans or working capital beyond those already permitted by the covenants of the Indentures of Debenture Issuances to comply with its obligations.
As of March 31, 2026, Hidrovias did not comply with the aforementioned covenants, whereas as of December 31, 2025, the Company was in compliance with the applicable covenant limits.
16.1. Trade payables
|
|
03/31/2026 |
|
12/31/2025 |
|
|
|
|
|
|
Domestic suppliers |
2,013,994 |
|
2,542,447 |
|
Trade payables - domestic related parties (see Note 8.2) |
41,622 |
|
46,758 |
|
Foreign suppliers |
1,027,937 |
|
1,863,835 |
|
Trade payables - foreign related parties (see Note 8.2) |
229,503 |
|
190,304 |
|
|
3,313,056 |
|
4,643,344 |
16.2. Trade payables - reverse factoring
The assignment of receivables does not result in any costs or fees with the financial institutions for the Company's subsidiaries, nor in the granting of guarantees of any type to these financial institutions. The decision to join this type of transaction is solely and exclusively of the supplier. The reverse factoring agreement does not substantially change the main characteristics of the commercial conditions previously established with the supplier. Therefore, the amounts payable to financial institutions for these transactions are presented in the trade payables line item.
As of March 31, 2026, to accurately reflect the essence of commercial transactions, the balance of reverse factoring transactions for which suppliers have already received payments was R$ 1,149,655 (R$ 3,785 as of December 31, 2025). The average payment term, in days, of suppliers that have joined the reverse factoring transactions and comparable suppliers is presented below:
|
|
Consolidated |
||
|
|
Reverse factoring |
Comparable suppliers1 |
|
|
Average payment term |
15 |
7 |
|
| 1 | Comparable suppliers are those that have not adhered to reverse factoring agreements, considering specific characteristics of payment conditions. |
|
Ultrapar Participações S.A. and Subsidiaries |
|
| Notes to the interim financial information | |
| For the period ended March 31, 2026 |
17.1. Post-employment benefits (Consolidated)
Some subsidiaries recognized a provision for post-employment benefits mainly related to seniority bonus, payment of FGTS, and health, dental care, and life insurance plans for eligible retirees.
The amounts related to such benefits are based on an annual valuation conducted by an independent actuary and reviewed by Management.
|
|
03/31/2026 |
|
12/31/2025 |
|
Health and dental care plan (1) |
187,564 |
|
184,105 |
|
Indemnification of FGTS |
21,051 |
|
20,303 |
|
Seniority bonus |
1,984 |
|
1,916 |
|
Life insurance (2) |
9,533 |
|
9,292 |
|
Total |
220,132 |
|
215,616 |
|
Current |
23,297 |
|
19,067 |
|
Non-current |
196,835 |
|
196,549 |
| (1) | Applicable to Ipiranga and Iconic. |
| (2) | Applicable to Ipiranga, Ultragaz and Ultrapar. |
18.1. Provisions for tax, civil and labor risks
The Company and its subsidiaries are parties to tax, civil and labor disputes at the administrative and judicial levels. The table below presents the breakdown of provisions by nature and their changes:
|
Provisions |
Balance as of 12/31/2025 |
Additions |
Reversals |
Payments |
Interest |
Balance as of 03/31/2026 |
|||||
|
IRPJ and CSLL |
19,868 |
754 |
(82) |
(162) |
4 |
20,382 |
|||||
|
Tax |
146,414 |
5,996 |
(194) |
‐ |
10,759 |
162,975 |
|||||
|
Civil |
161,695 |
8,287 |
(25,197) |
(408) |
236 |
144,613 |
|||||
|
Provision for indemnities (18.1.1) |
145,633 |
956 |
(680) |
(14,143) |
1,850 |
133,616 |
|||||
|
Labor |
61,004 |
7,987 |
(335) |
(4,308) |
335 |
64,683 |
|||||
|
Total |
534,614 |
23,980 |
(26,488) |
(19,021) |
13,184 |
526,269 |
|||||
|
Current |
49,175 |
|
|
|
|
51,060 |
|||||
|
Non-current |
485,439 |
|
|
|
|
475,209 |
|
Ultrapar Participações S.A. and Subsidiaries |
|
| Notes to the interim financial information | |
| For the period ended March 31, 2026 |
Balances of escrow deposits by nature are as follows:
|
|
03/31/2026 |
12/31/2025 |
|
|
Tax |
437,153 |
420,906 |
|
|
Labor |
15,964 |
15,897 |
|
|
Civil |
37,871 |
34,806 |
|
|
|
490,988 |
471,609 |
In the period ended March 31, 2026, the monetary variation on escrow deposits amounted to R$ 11,690 (R$ 9,039 as of March 31, 2025). recorded as financial income in the statement of income for the period.
18.1.1 Provision for indemnities
As a result of the sale of Oxiteno, completed on April 1, 2022, Ultrapar assumed contractual liability for losses related to acts prior to the closing of the transaction. The provision for potential reimbursement to Indorama, in the event the losses materialize, amounts to R$ 109,333 as of March 31, 2026 (R$109,333 as of December 31, 2025), related to R$ 31,888 (R$ 32,384 as of December 31, 2025) for labor claims, R$ 28,605 (R$ 28,605 as of December 31, 2025) for civil claims and R$ 49,240 (R$ 48,344 as of December 31, 2025) for tax claims.
Regarding the sale of Extrafarma, completed on August 1, 2022, whose liability for losses prior to the transaction was assumed by subsidiary Ipiranga, the provision for potential reimbursement to Pague Menos, in the event the losses materialize, is R$ 23,883 as of March 31, 2026 (R$ 36,297 as of December 31, 2025), of which R$ 10,016 (R$ 14,153 as of December 31, 2025) for labor claims, R$ 5,611 (R$ 7,798 as of December 31, 2025) for civil claims and R$ 8,254 (R$ 14,346 as of December 31, 2025) for tax claims.
18.2. Possible contingent liabilities
The Company and its subsidiaries are parties to administrative and legal proceedings for tax, civil and labor claims which, based on the assessment of the legal departments and the advice of external legal advisors, were classified as a possible loss. In accordance with the accounting practices adopted and the internal contingency guideline, these obligations do not meet the criteria for provision recognition and are therefore only disclosed in notes to the financial statements.
The contingent liabilities, classified as possible loss, by nature are as follows:
|
Contingent liabilities (possible) |
03/31/2026 |
12/31/2025 |
|
|
Taxes (2.1) |
7,822,811 |
6,027,879 |
|
|
Civil (2.2) |
881,162 |
867,293 |
|
|
Labor |
400,252 |
376,406 |
|
|
|
9,104,225 |
7,271,578 |
18.2.1 Contingent tax liabilities
The Company and its subsidiaries are parties to administrative and judicial proceedings involving IRPJ and CSLL, mainly arising from denials of offset claims, which total R$ 554,376 as of March 31, 2026 (R$ 577,253 as of December 31, 2025). Regarding PIS and COFINS, tax credit disallowances from the non-cumulative regime are recorded, which total R$ 4,460,448 as of March 31, 2026 (R$ 3,136,458 as of December 31, 2025).
Additionally, subsidiary Ipiranga and its subsidiaries have legal proceedings related to discussions of ICMS, in the consolidated amount of R$ 2,159,628 as of March 31, 2026 (R$ 1,662,515 as of December 31, 2025). The main discussions involve assessments relating to: (i) the alleged non-payment of R$ 459,361 (R$ 444,766 as of December 31, 2025); (ii) the surcharge on products considered non-essential in the amount of R$ 251,903 (R$ 246,060 as of December 31, 2025); (iii) the reversal and disallowance of credits, in the amount of R$ 236,710 (R$ 236,808 as of December 31, 2025); (iv) the discussion regarding the collection of the State Fiscal Equilibrium Fund – FEEF, in the amount of R$ 228,350 (R$ 158,704 as of December 31, 2025); (v) inventory differences in the amount of R$ 212,710 (R$ 236,568 as of December 31, 2025); (vi) the conditioned fruition of tax incentive and other ICMS matters, in the amount of R$ 731,126 (R$ 314,309 as of December 31, 2025); and (vii) discussions related to non-compliance with ancillary obligations, in the amount of R$ 38,463 (R$ 25,299 as of December 31, 2025).
|
Ultrapar Participações S.A. and Subsidiaries |
|
| Notes to the interim financial information | |
| For the period ended March 31, 2026 |
In addition, subsidiary Ipiranga and its subsidiaries are discussing the offset of excise tax (“IPI”) credits related to raw materials used in the manufacturing of products subject to taxation, which were subsequently sold and were not subject to IPI under the tax immunity, in the amount of R$ 203,677 as of March 31, 2026 (R$ 209,444 as of December 31, 2025). In April 2025, the Superior Court of Justice, under the repetitive appeals regime (Tema 1.247), ruled on the discussion in favor of the taxpayers.
Of the remaining amount of tax contingencies classified as potential losses, R$ 444,682 as of March 31, 2026 (R$ 442,210 as of December 31, 2025) relates to other proceedings involving the Company and its subsidiaries.
18.2.2 Contingent civil liabilities
The Company and its subsidiaries have contingent liabilities for civil claims in the amount of R$ 881,162 as of March 31, 2026 (R$ 867,293 as of December 31, 2025). Among these proceedings, the following claims involving subsidiary Cia. Ultragaz are highlighted: i) administrative proceedings filed by CADE, referring to alleged anti-competitive practices in municipalities in the Triângulo Mineiro region in 2001, and at the administrative level, Cia. Ultragaz was ordered to pay a fine, in the updated amount of R$ 39,808 as of March 31, 2026 (R$ 39,447 as of December 31, 2025); and ii) lawsuits filed by resellers, who are seeking indemnity, in addition to the nullity and termination of distribution contracts, totaling R$ 92,468 as of March 31, 2026 (R$ 95,971 as of December 31, 2025).
18.3. Lubricants operation between Ipiranga and Chevron
The provisions of shareholder Chevron’s liability amount to R$ 3,944 (R$ 4,020 as of December 31, 2025), for which a corresponding indemnification asset was recorded. This asset comprises R$ 197 related to tax claims (R$ 204 as of December 31, 2025), R$ 210 to civil claims (R$ 210 as of December 31, 2025), and R$ 3,537 to labor claims (R$ 3,606 as of December 31, 2025).
Additionally, due to a business combination, on December 1, 2017, a provision of R$ 198,900 was recorded relating to contingent liabilities and an indemnification asset in the same amount was recognized. The balance of this asset totaled R$ 88,520 as of March 31, 2026 (R$ 88,503 as of December 31, 2025). The amounts of provisions and contingent liabilities related to the business combination and the liability of the shareholder Chevron will be fully reimbursed to subsidiary Iconic in the event of losses without the need to recognize an allowance for expected credit losses.
18.4. Matters reported by the press
On March 26, 2026, the Company became aware of an investigation conducted by the Federal Public Prosecutor’s Office of the State of São Paulo (Ministério Público Federal do Estado de São Paulo), referred to as “Fisco Paralelo”, relating to an alleged scheme involving the early release of ICMS tax credits by public officials of the São Paulo State Department of Finance (Secretaria da Fazenda de São Paulo) through the engagement of certain law firms. According to media reports disclosed, the investigation contains references, to the Company’s subsidiary Ipiranga. As of the date of these financial statements, neither the Company nor Ipiranga has been formally notified by the competent authorities about the investigation.
Notwithstanding the foregoing the Company has engaged independent external advisors to conduct an independent review of the facts referenced in the media reports, and such review is ongoing.
Based on information available as of the date of these financial statements, the Company is unable to predict the duration, scope or ultimate outcome of this investigation, or any actions or proceedings that may be commenced or brought in connection therewith.
Management understands that, as of this date, the facts mentioned do not result in material impacts on the financial statements or operations of the controlled subsidiary Ipiranga or of the Group.
|
Ultrapar Participações S.A. and Subsidiaries |
|
| Notes to the interim financial information | |
| For the period ended March 31, 2026 |
Because of the association between the Company and Extrafarma on January 31, 2014, 7 subscription warrants – indemnification were issued, corresponding to up to 6,411,244 shares of the Company.
On February 26, 2025 and August 13, 2025, the Board of Directors confirmed the issuance of 67,679 and 342,691, respectively, common shares within the authorized capital limit provided by article 6 of the Company’s Bylaws, due to the partial exercise of the rights conferred by the subscription warrants.
As set out in the association agreement between the Company and Extrafarma of January 31, 2014 and due to the unfavorable decisions on some lawsuits with triggering events prior to January 31, 2014, 792,065 shares linked to the subscription warrants – indemnification were canceled and not issued. As of March 31, 2026, R$ 20,172 was recorded as financial expense (R$ 3,666 as of March 31, 2025) due to the update of subscription warrants, and 2,579,497 shares linked to subscription warrants – indemnification remain retained, which may be issued or canceled depending on whether the final decisions on the lawsuits will be favorable or unfavorable, being the maximum number of shares that can be issued in the future, totaling R$ 74,083 (R$ 53,911 as of December 31, 2025).
20.1. Share capital
As of March 31, 2026, the subscribed and paid-up capital consists of 1,115,849,873 common shares with no par value (1,115,849,873 as of December 31, 2025), and the issuance of preferred shares and participation certificates is prohibited. Each common share entitles its holder to one vote at Shareholders’ Meetings. The total amount of the capital as of March 31, 2026 is R$ 7,987,100 (R$ 7,987,100 as of December 31, 2025).
The price of the Company-issued shares on B3 as of March 31, 2026 was R$ 28.72 (R$ 20.90 as of December 31, 2025).
As of March 31, 2026, there were 70,252,889 common shares outstanding abroad in the form of ADRs (70,252,989 shares as of December 31, 2025).
20.2. Equity instrument granted
The Company has a share-based incentive plan, which establishes the general terms and conditions for the concession of common shares issued by the Company and held in treasury (see Note 8.4). As of March 31, 2026, the balance of treasury shares granted with right of use was 19,587,216 common shares (18,601,046 as of December 31, 2025).
20.3. Treasury shares
The Company acquired its own shares at market prices, without capital reduction, to be held in treasury and to be subsequently disposed of or cancelled, in accordance with CVM Resolutions 2/20 and 77/22.
As of March 31, 2026, the balance was R$ 821,488 (R$ 822,526 as of December 31, 2025) and 27,495,338 common shares (28,542,005 as of December 31, 2025) were held unrestricted in the Company's treasury, acquired at an average cost of R$ 17.45 per share.
|
|
|
03/31/2026 |
|
Balance of unrestricted shares held in treasury |
|
27,495,338 |
|
Balance of treasury shares granted with right of use |
|
19,587,216 |
|
Total balance of treasury shares |
|
47,082,554 |
|
Ultrapar Participações S.A. and Subsidiaries |
|
| Notes to the interim financial information | |
| For the period ended March 31, 2026 |
20.4. Capital reserve
The capital reserve reflects the gain or loss on the disposal of shares for concession of usufruct to executives of the Company's subsidiaries, when the plan is finalized, as mentioned in Note 8.4.
Because of the association with Extrafarma in 2014, the Company recognized an increase in the capital reserve in the amount of R$ 498,812, due to the difference between the value attributed to share capital and the market value of the Ultrapar shares on the date of issuance, less R$ 2,260 related to the costs for the issuance of these shares.
Additionally, on February 26, 2025 and August 13, 2025, there was an increase in the reserve in the amounts of R$ 1,126 and R$ 6,737, respectively, due to the partial exercise of the subscription warrants – indemnification (see Note 19).
20.5. Approval of dividends
On March 4, 2026, the Board of Directors approved the distribution of dividends for the fiscal year 2025 in the amount of R$ 1,413,313 (R$ 1.27 per share). Of this amount, R$ 326,005 (R$0.30 per share) refer to interim dividends paid as resolved by the Board of Directors on August 13, 2025 and R$ 1,087,308 (R$ 1.00 per share) to interim dividends paid as resolved by the Board of Directors on December 1, 2025.
|
|
03/31/2026 |
|
03/31/2025 |
|
Sales revenue: |
|
|
|
|
Merchandise |
36,843,843 |
|
34,054,088 |
|
Services rendered and others |
986,971 |
|
457,288 |
|
Electricity (1) |
260,120 |
|
160,741 |
|
Sales returns, rebates and discounts |
(321,473) |
|
(224,040) |
|
Amortization of contract assets |
(146,550) |
|
(105,489) |
|
|
37,622,911 |
|
34,342,588 |
|
|
|
|
|
|
Taxes on sales |
(871,341) |
|
(1,013,326) |
|
|
|
|
|
|
Net revenue |
36,751,570 |
|
33,329,262 |
| (1) | Refers to revenue from the sale of electricity of subsidiary Ultragaz Comercializadora. |
|
Ultrapar Participações S.A. and Subsidiaries |
|
| Notes to the interim financial information | |
| For the period ended March 31, 2026 |
The Company presents its results by nature in the consolidated statement of income and details below its costs, expenses and other operating results by nature:
|
|
Parent |
|
Consolidated |
||||
|
|
03/31/2026 |
|
03/31/2025 |
|
03/31/2026 |
|
03/31/2025 |
|
Raw materials and materials for use and consumption |
‐ |
|
‐ |
|
(32,731,207) |
|
(30,636,655) |
|
Personnel expenses |
(75,740) |
|
(68,756) |
|
(759,019) |
|
(638,651) |
|
Freight and storage |
‐ |
|
‐ |
|
(289,926) |
|
(277,248) |
|
Depreciation and amortization |
(3,241) |
|
(4,087) |
|
(349,607) |
|
(225,684) |
|
Services provided by third parties |
(17,783) |
|
(21,319) |
|
(168,529) |
|
(169,545) |
|
Purchase of electricity (a) |
‐ |
|
‐ |
|
(205,394) |
|
(128,842) |
|
Decarbonization obligation (b) |
‐ |
|
‐ |
|
(56,896) |
|
(116,422) |
|
Amortization of right-of-use assets |
(736) |
|
(750) |
|
(88,273) |
|
(78,387) |
|
Advertising and marketing |
(368) |
|
(302) |
|
(47,953) |
|
(29,687) |
|
Bonuses and commissions |
‐ |
|
‐ |
|
(32,310) |
|
(29,585) |
|
Taxes and fees |
(305) |
|
(57) |
|
(46,842) |
|
(6,139) |
|
Other expenses and income, net |
(9,241) |
|
(7,110) |
|
(144,510) |
|
(57,216) |
|
Shared Services Center/Holding expenses |
94,664 |
|
89,296 |
|
‐ |
|
‐ |
|
|
|
|
|
|
|
|
|
|
Total |
(12,750) |
|
(13,085) |
|
(34,920,466) |
|
(32,394,061) |
|
|
|
|
|
|
|
|
|
|
Classified as: |
|
|
|
|
|
|
|
|
Cost of products and services sold |
‐ |
|
‐ |
|
(33,577,632) |
|
(31,187,631) |
|
Selling and marketing |
‐ |
|
‐ |
|
(663,990) |
|
(601,565) |
|
General and administrative |
(11,948) |
|
(12,635) |
|
(655,701) |
|
(518,362) |
|
Other operating income (expenses), net |
(802) |
|
(450) |
|
(23,143) |
|
(86,503) |
|
|
|
|
|
|
|
|
|
|
Total |
(12,750) |
|
(13,085) |
|
(34,920,466) |
|
(32,394,061) |
| (a) | Refers to the purchase of electricity of subsidiary Ultragaz Comercializadora. |
| (b) | Refers to the obligation established by the RenovaBio program to meet decarbonization targets for the gas and oil sector. The amounts are presented in Other operating income (expenses), net. |
|
Ultrapar Participações S.A. and Subsidiaries |
|
| Notes to the interim financial information | |
| For the period ended March 31, 2026 |
|
|
Parent |
|
Consolidated |
||||
|
|
03/31/2026 |
|
03/31/2025 |
|
03/31/2026 |
|
03/31/2025 |
|
Financial income: |
|
|
|
|
|
|
|
|
Interest and other income from financial investments |
133,820 |
|
11,606 |
|
353,163 |
|
114,825 |
|
Interest from customers |
‐ |
|
‐ |
|
46,035 |
|
43,550 |
|
Selic interest on PIS/COFINS credits |
‐ |
|
‐ |
|
40,753 |
|
10,222 |
|
Other finance income |
2,481 |
|
5,675 |
|
12,386 |
|
8,293 |
|
|
136,301 |
|
17,281 |
|
452,337 |
|
176,890 |
|
Financial expenses: |
|
|
|
|
|
|
|
|
Interest on loans, financing and financial instruments |
‐ |
|
(428) |
|
(751,775) |
|
(338,581) |
|
Interest on leases payable |
(139) |
|
(180) |
|
(40,475) |
|
(32,878) |
|
Update of subscription warrants (see Note 19) |
(20,172) |
|
(3,666) |
|
(20,172) |
|
(3,666) |
|
Bank charges, financial transactions tax, and other taxes |
(285) |
|
(267) |
|
(33,862) |
|
(21,019) |
|
Update of provisions and other expenses |
(6,039) |
|
(46) |
|
(8,598) |
|
(26,092) |
|
|
(26,635) |
|
(4,587) |
|
(854,882) |
|
(422,236) |
|
Monetary variations and foreign exchange variations, net |
|
|
|
|
|
|
|
|
Revenues |
‐ |
|
‐ |
|
526,278 |
|
568,324 |
|
Expenses |
‐ |
|
‐ |
|
(522,196) |
|
(502,947) |
|
|
‐ |
|
‐ |
|
4,082 |
|
65,377 |
|
Financial result, net |
109,666 |
|
12,694 |
|
(398,463) |
|
(179,969) |
|
Ultrapar Participações S.A. and Subsidiaries |
|
| Notes to the interim financial information | |
| For the period ended March 31, 2026 |
The table below presents a reconciliation of numerators and denominators used in computing earnings per share. The Company has a stock plan and subscription warrants, as mentioned in Notes 8.4 and 19, respectively.
|
|
01/01/2026 to 03/31/2026 |
|
01/01/2025 to 03/31/2025 |
|
Basic earnings per share |
|
|
|
|
|
|
|
|
|
Net income for the year of the Company |
875,574 |
|
332,846 |
|
Weighted average number of shares outstanding (in thousands) |
1,068,765 |
|
1,093,932 |
|
Basic earnings per share - R$ |
0.8192 |
|
0.3043 |
|
|
|
|
|
|
Diluted earnings per share |
|
|
|
|
|
|
|
|
|
Net income for the year of the Company |
875,574 |
|
332,846 |
|
Weighted average number of outstanding shares (in thousands), including dilution effects |
1,092,953 |
|
1,110,955 |
|
Diluted earnings per share - R$ |
0.8011 |
|
0.2996 |
|
|
|
|
|
|
Weighted average number of shares (in thousands) |
|
|
|
|
|
|
|
|
|
Weighted average number of shares for basic earnings per share |
1,068,765 |
|
1,093,932 |
|
Dilution effect |
|
|
|
|
Subscription warrants |
2,579 |
|
2,939 |
|
Stock plan |
21,609 |
|
14,084 |
|
|
|
|
|
|
Weighted average number of shares for diluted earnings per share |
1,092,953 |
|
1,110,955 |
Earnings per share were adjusted retrospectively by the issuance of 3,266,694 common shares due to the partial exercise of the rights conferred by the subscription warrants disclosed in Note 19.
|
Ultrapar Participações S.A. and Subsidiaries |
|
| Notes to the interim financial information | |
| For the period ended March 31, 2026 |
The segments shown in these financial statements are strategic business units supplying different products and services. Intersegment sales are made considering the conditions negotiated between the parties.
The main segments are presented in the table below:
|
Segment |
Main activities |
|
Ultragaz |
Distribution of liquefied petroleum gas (LPG) in the segments: bulk, comprising condominiums, trade, services, industries and agribusiness; and bottled, mainly comprising residential consumers. To expand the offer of energy solutions to its customers, the company also operates in the segments of renewable energy solutions and compressed natural gas. |
|
Ipiranga |
Distribution and sale of oil-related products, biofuels and similar products (gasoline, ethanol, diesel, fuel oil, kerosene, natural gas for vehicles, and lubricants) to service stations that operate under the Ipiranga brand throughout Brazil and to major consumers and carrier-reseller-retailer (TRRs), as well as in the convenience stores and automotive services segments. |
|
Ultracargo |
Operates in specialized liquid bulk storage solutions in the main logistics centers of Brazil. |
|
Hidrovias (1) |
Operations in logistics solutions and waterway and multimodal infrastructure, in Brazil and abroad. |
| (1) | As of May 2025, through the acquisition of control according to Note 27.2, the Company began to report Hidrovias as a new operating segment. |
25.1. Geographic area information
The subsidiaries generate revenue from operations in Brazil, as well as from exports of products and services to foreign customers, as disclosed below:
|
|
03/31/2026 |
|
03/31/2025 |
|
Net revenue from sales and services: |
|
|
|
|
Brazil |
36,474,542 |
|
33,169,116 |
|
Europe |
22,906 |
|
3,205 |
|
United States of America and Canada |
11,637 |
|
89,156 |
|
Other Latin American countries |
193,532 |
|
37,264 |
|
Others |
48,953 |
|
30,521 |
|
Total |
36,751,570 |
|
33,329,262 |
|
Ultrapar Participações S.A. and Subsidiaries |
|
| Notes to the interim financial information | |
| For the period ended March 31, 2026 |
25.2. Financial information related to segments
The main financial information of each of the continuing operations of the Company’s segments is as follows.
|
03/31/2026 |
||||||||
|
Profit or loss |
Ipiranga |
Ultragaz |
Ultracargo |
Hidrovias (3) |
Others (1) (2) |
Subtotal Segments |
Eliminations |
Total |
|
Net revenue from sales and services |
33,110,304 |
2,964,662 |
276,467 |
444,811 |
2,286 |
36,798,530 |
(46,960) |
36,751,570 |
|
Transactions with third parties |
33,110,019 |
2,963,823 |
233,016 |
444,811 |
(99) |
36,751,570 |
- |
36,751,570 |
|
Intersegment transactions |
285 |
839 |
43,451 |
‐ |
2,385 |
46,960 |
(46,960) |
‐ |
|
Cost of products and services sold |
(30,812,307) |
(2,357,528) |
(118,495) |
(326,967) |
9 |
(33,615,288) |
37,656 |
(33,577,632) |
|
Gross profit |
2,297,997 |
607,134 |
157,972 |
117,844 |
2,295 |
3,183,242 |
(9,304) |
3,173,938 |
|
Operating income (expenses) |
|
|
|
|
|
|
|
|
|
Selling and marketing |
(517,574) |
(148,184) |
(2,188) |
(996) |
‐ |
(668,942) |
4,952 |
(663,990) |
|
General and administrative |
(367,345) |
(111,625) |
(40,110) |
(80,149) |
(62,312) |
(661,541) |
5,840 |
(655,701) |
|
Results from disposal of property, plant and equipment and intangible assets |
(7,961) |
(452) |
135 |
8,755 |
20 |
497 |
‐ |
497 |
|
Other operating income (expenses), net |
(43,446) |
2,439 |
1,823 |
17,790 |
(1,737) |
(23,131) |
(12) |
(23,143) |
|
Operating income (loss) |
1,361,671 |
349,312 |
117,632 |
63,244 |
(61,734) |
1,830,125 |
1,476 |
1,831,601 |
|
Share of profit (loss) of subsidiaries, joint ventures and associates |
(3,478) |
16 |
145 |
2,698 |
(19,694) |
(20,313) |
‐ |
(20,313) |
|
Amortization of fair value adjustments on associates acquisition |
‐ |
‐ |
(403) |
‐ |
‐ |
(403) |
‐ |
(403) |
|
Gain on acquisition of control of associate |
‐ |
‐ |
‐ |
‐ |
‐ |
‐ |
‐ |
‐ |
|
Total share of profit (loss) of subsidiaries, joint ventures and associates |
(3,478) |
16 |
(258) |
2,698 |
(19,694) |
(20,716) |
‐ |
(20,716) |
|
Income (loss) before financial result and income and social contribution taxes |
1,358,193 |
349,328 |
117,374 |
65,942 |
(81,428) |
1,809,409 |
1,476 |
1,810,885 |
|
Depreciation and amortization (a) |
102,037 |
85,730 |
37,156 |
119,167 |
4,361 |
348,451 |
(1,476) |
346,975 |
|
Amortization of contractual assets with customers - exclusivity rights |
146,550 |
‐ |
‐ |
‐ |
‐ |
146,550 |
‐ |
146,550 |
|
Amortization of right-of-use assets |
49,799 |
18,673 |
10,561 |
8,505 |
735 |
88,273 |
‐ |
88,273 |
|
Amortization of fair value adjustments on associates acquisition |
‐ |
‐ |
403 |
‐ |
‐ |
403 |
‐ |
403 |
|
Total depreciation and amortization |
298,386 |
104,403 |
48,120 |
127,672 |
5,096 |
583,677 |
(1,476) |
582,201 |
| (a) | The amount is net of PIS and COFINS on depreciation in the amount of R$ 2,632. |
|
Ultrapar Participações S.A. and Subsidiaries |
|
| Notes to the interim financial information | |
| For the period ended March 31, 2026 |
|
03/31/2025 |
|||||||
|
Profit or loss |
Ipiranga |
Ultragaz |
Ultracargo |
Others (1) (2) |
Subtotal Segments |
Eliminations |
Total |
|
Net revenue from sales and services |
30,234,384 |
2,863,393 |
270,631 |
2,056 |
33,370,464 |
(41,202) |
33,329,262 |
|
Transactions with third parties |
30,234,356 |
2,863,102 |
231,649 |
155 |
33,329,262 |
‐ |
33,329,262 |
|
Intersegment transactions |
28 |
291 |
38,982 |
1,901 |
41,202 |
(41,202) |
‐ |
|
|
|
|
|
|
|
|
|
|
Cost of products and services sold |
(28,805,594) |
(2,327,868) |
(103,456) |
‐ |
(31,236,918) |
49,287 |
(31,187,631) |
|
|
|
|
|
|
|
|
|
|
Gross profit |
1,428,790 |
535,525 |
167,175 |
2,056 |
2,133,546 |
8,085 |
2,141,631 |
|
|
|
|
|
|
|
|
|
|
Operating income (expenses) |
|
|
|
|
|
|
|
|
Selling and marketing |
(451,816) |
(149,264) |
(2,239) |
‐ |
(603,319) |
1,754 |
(601,565) |
|
General and administrative |
(309,999) |
(98,547) |
(39,746) |
(61,711) |
(510,003) |
(8,359) |
(518,362) |
|
Results from disposal of property, plant and equipment and intangible assets |
5,452 |
(228) |
51 |
32 |
5,307 |
‐ |
5,307 |
|
Other operating income (expenses), net |
(104,824) |
15,560 |
2,378 |
383 |
(86,503) |
‐ |
(86,503) |
|
|
|
|
|
|
|
|
|
|
Operating income (loss) |
567,603 |
303,046 |
127,619 |
(59,240) |
939,028 |
1,480 |
940,508 |
|
|
|
|
|
|
|
|
|
|
Share of profit (loss) of subsidiaries, joint ventures and associates |
(2,000) |
158 |
1,388 |
(148,629) |
(149,083) |
‐ |
(149,083) |
|
Amortization of fair value adjustments on associates acquisition |
‐ |
‐ |
(403) |
‐ |
(403) |
‐ |
(403) |
|
Total share of profit (loss) of subsidiaries, joint ventures and associates |
(2,000) |
158 |
985 |
(148,629) |
(149,486) |
‐ |
(149,486) |
|
|
|
|
|
|
|
|
|
|
Income (loss) before financial result and income and social contribution taxes |
565,603 |
303,204 |
128,604 |
(207,869) |
789,542 |
1,480 |
791,022 |
|
|
|
|
|
|
|
|
|
|
Depreciation and amortization (a) |
(107,228) |
(81,813) |
(29,299) |
(4,834) |
(223,174) |
1,476 |
(221,698) |
|
Amortization of contractual assets with customers - exclusivity rights |
(105,488) |
(1) |
‐ |
‐ |
(105,489) |
‐ |
(105,489) |
|
Amortization of right-of-use assets |
(53,450) |
(16,369) |
(7,818) |
(750) |
(78,387) |
‐ |
(78,387) |
|
Amortization of fair value adjustments on associates acquisition |
‐ |
‐ |
(403) |
‐ |
(403) |
‐ |
(403) |
|
Total depreciation and amortization |
(266,166) |
(98,183) |
(37,520) |
(5,584) |
(407,453) |
1,476 |
(405,977) |
| (a) | The amount is net of PIS and COFINS on depreciation in the amount of R$ 3,986. |
| (1) | Includes in the line “General and administrative and Revenue from sale of goods” the amount of R$ 47,840 in 2026 (R$ 47,889 in 2025) of expenses related to Ultrapar's holding structure. |
| (2) | The “Others” column refers to the parent Ultrapar and subsidiaries Imaven, Ultrapar International, UVC Investimentos, Eaí Clube Automobilista and share of profit (loss) of joint venture RPR and of Hidrovias while associate. |
| (3) | The “Hidrovias” segment is composed of Hidrovias (HBSA3), which became consolidated in May 2025, and its parent company Ultra Logística, direct subsidiary of Ultrapar, and therefore, the reported numbers may contain differences with the numbers reported by Hidrovias (HBSA3). |
|
Ultrapar Participações S.A. and Subsidiaries |
|
| Notes to the interim financial information | |
| For the period ended March 31, 2026 |
25.3. Assets by segment
|
03/31/2026 |
||||||
|
Assets |
Ipiranga |
Ultragaz |
Ultracargo |
Hidrovias (1) |
Others (2) |
Total |
|
Investments |
115,438 |
3,952 |
238,521 |
131,800 |
164,654 |
654,365 |
|
Fixed assets |
3,427,233 |
1,712,566 |
2,605,708 |
4,202,529 |
136,767 |
12,084,803 |
|
Intangible assets |
1,409,455 |
291,745 |
286,349 |
1,159,426 |
274,438 |
3,421,413 |
|
Right-of-use assets |
806,608 |
179,435 |
620,937 |
289,668 |
4,929 |
1,901,577 |
|
Other current and non-current assets |
22,346,826 |
2,864,092 |
522,028 |
2,208,776 |
4,213,234 |
32,154,956 |
|
Total assets (excluding intersegment transactions) |
28,105,560 |
5,051,790 |
4,273,543 |
7,992,199 |
4,794,022 |
50,217,114 |
|
December 31, 2025 |
||||||
|
Assets |
Ipiranga |
Ultragaz |
Ultracargo |
Hidrovias (1) |
Others (2) |
Total |
|
Investments |
102,837 |
4,092 |
238,607 |
135,973 |
39,872 |
521,381 |
|
Fixed assets |
3,428,819 |
1,667,025 |
2,596,271 |
4,340,526 |
134,456 |
12,167,097 |
|
Intangible assets |
1,277,871 |
274,971 |
286,219 |
1,201,198 |
276,219 |
3,316,478 |
|
Right-of-use assets |
826,598 |
187,116 |
620,628 |
288,733 |
5,619 |
1,928,694 |
|
Other current and non-current assets |
21,191,237 |
3,563,356 |
447,929 |
2,351,670 |
3,861,152 |
31,415,344 |
|
Total assets (excluding intersegment transactions) |
26,827,362 |
5,696,560 |
4,189,654 |
8,318,100 |
4,317,318 |
49,348,994 |
| (1) | The “Hidrovias” column is composed of Hidrovias and its parent company Ultra Logística, a direct subsidiary of Ultrapar, which is not part of Hidrovias segment, and therefore, the reported numbers may contain differences with the numbers reported by Hidrovias. |
| (2) | The “Others” column refers to the parent Ultrapar and subsidiaries Imaven, Ultrapar International, UVC Investimentos, Eaí Clube Automobilista and share of profit (loss) of joint venture RPR. |
|
Ultrapar Participações S.A. and Subsidiaries |
|
| Notes to the interim financial information | |
| For the period ended March 31, 2026 |
Classes and categories of financial instruments and their fair values
The balances of financial instrument assets and liabilities and the measurement criteria are presented in accordance with the following categories:
| (a) | Level 1 – prices negotiated (without adjustment) in active markets for identical assets or liabilities; | |
| (b) | Level 2 – inputs other than prices negotiated in active markets included in Level 1 and observable for the asset or liability, either directly (as prices) or indirectly (derived from prices); and | |
| (c) | Level 3 - inputs for assets or liabilities that are not based on observable market variables (unobservable inputs). |
|
|
|
Level |
|
Carrying value |
Carrying value |
|
Fair value |
|||
|
March 31, 2026 |
Note |
|
|
Measured at fair value through profit or loss |
|
Measured at amortized cost |
Total |
|
|
|
|
Financial assets: |
|
|
|
|
|
|
|
|
|
|
|
Cash and cash equivalents |
|
|
|
|
|
|
|
|
|
|
|
Cash and banks |
4.1 |
|
|
‐ |
|
751,047 |
751,047 |
|
751,047 |
|
|
Securities and funds in local currency |
4.1 |
Level 2 |
|
1,165,747 |
|
1,616,512 |
2,782,259 |
|
2,782,259 |
|
|
Securities and funds in foreign currency |
4.1 |
|
|
‐ |
|
327,206 |
327,206 |
|
327,206 |
|
|
Financial investments |
|
|
|
|
|
|
|
|
|
|
|
Securities and funds in local currency |
4.2 |
Level 2 |
|
1,951,253 |
|
96,535 |
2,047,788 |
|
2,047,788 |
|
|
Securities and funds in foreign currency |
4.2 |
|
|
‐ |
|
3,144,304 |
3,144,304 |
|
3,144,304 |
|
|
Derivative financial instruments |
|
|
|
|
|
|
|
|
|
|
|
Financial |
26.6 |
Level 2 |
|
567,785 |
|
‐ |
567,785 |
|
567,785 |
|
|
Operational |
26.6 |
Level 2 |
|
474,147 |
|
‐ |
474,147 |
|
474,147 |
|
|
Energy trading futures contracts |
26.8 |
Level 2 |
|
1,132,391 |
|
‐ |
1,132,391 |
|
1,132,391 |
|
|
Trade receivables |
5.1 |
|
|
‐ |
|
4,565,878 |
4,565,878 |
|
4,565,878 |
|
|
Reseller financing |
5.1 |
|
|
‐ |
|
1,481,845 |
1,481,845 |
|
1,481,845 |
|
|
Related parties |
8 |
|
|
‐ |
|
54,829 |
54,829 |
|
54,829 |
|
|
Other receivables and other assets |
|
|
|
‐ |
|
624,567 |
624,567 |
|
624,567 |
|
|
|
|
|
|
|
|
|
|
|
|
|
|
Total |
|
|
|
5,291,323 |
|
12,662,723 |
17,954,046 |
|
17,954,046 |
|
|
|
|
|
|
|
|
|
|
|
|
|
|
Financial liabilities: |
|
|
|
|
|
|
|
|
|
|
|
Financing and debentures |
15.1 |
Level 2 |
|
9,333,784 |
|
10,093,869 |
19,427,653 |
|
19,376,084 |
|
|
Derivative financial instruments |
|
|
|
‐ |
|
‐ |
‐ |
|
‐ |
|
|
Financial |
26.6 |
Level 2 |
|
772,908 |
|
‐ |
772,908 |
|
772,908 |
|
|
Operational |
26.6 |
Level 2 |
|
637,496 |
|
‐ |
637,496 |
|
637,496 |
|
|
Energy trading futures contracts |
26.8 |
Level 2 |
|
703,592 |
|
‐ |
703,592 |
|
703,592 |
|
|
Trade payables |
16.1 |
|
|
‐ |
|
3,313,056 |
3,313,056 |
|
3,313,056 |
|
|
Trade payables - reverse factoring |
16.2 |
|
|
‐ |
|
1,149,655 |
1,149,655 |
|
1,149,655 |
|
|
Subscription warrants – indemnification |
19 |
Level 1 |
|
74,083 |
|
‐ |
74,083 |
|
74,083 |
|
|
Financial liabilities of customers |
|
|
|
‐ |
|
55,232 |
55,232 |
|
55,232 |
|
|
Contingent consideration |
|
|
|
‐ |
|
36,412 |
36,412 |
|
36,412 |
|
|
Related parties |
8 |
|
|
‐ |
|
2,875 |
2,875 |
|
2,875 |
|
|
Other payables |
|
|
|
‐ |
|
1,132,026 |
1,132,026 |
|
1,132,026 |
|
|
Total |
|
|
|
11,521,863 |
|
15,783,125 |
27,304,988 |
|
27,253,419 |
|
|
Ultrapar Participações S.A. and Subsidiaries |
|
| Notes to the interim financial information | |
| For the period ended March 31, 2026 |
|
|
|
Level |
|
Carrying value |
Carrying value |
|
Fair value |
|||
|
December 31, 2025 |
Note |
|
|
Measured at fair value through profit or loss |
|
Measured at amortized cost |
Total |
|
|
|
|
Financial assets: |
|
|
|
|
|
|
|
|
|
|
|
Cash and cash equivalents |
|
|
|
|
|
|
|
|
|
|
|
Cash and banks |
4.1 |
|
|
‐ |
|
842,295 |
842,295 |
|
842,295 |
|
|
Securities and funds in local currency |
4.1 |
Level 2 |
|
515,456 |
|
1,107,452 |
1,622,908 |
|
1,622,908 |
|
|
Securities and funds in foreign currency |
4.1 |
|
|
‐ |
|
709,922 |
709,922 |
|
709,922 |
|
|
Financial investments |
|
|
|
‐ |
|
‐ |
‐ |
|
‐ |
|
|
Securities and funds in local currency |
4.2 |
Level 2 |
|
3,188,963 |
|
122,622 |
3,311,585 |
|
3,311,585 |
|
|
Securities and funds in foreign currency |
4.2 |
|
|
‐ |
|
2,921,770 |
2,921,770 |
|
2,921,770 |
|
|
Derivative financial instruments |
|
|
|
‐ |
|
‐ |
‐ |
|
‐ |
|
|
Financial |
26.6 |
Level 2 |
|
777,064 |
|
‐ |
777,064 |
|
777,064 |
|
|
Operational |
26.6 |
Level 2 |
|
123,253 |
|
‐ |
123,253 |
|
123,253 |
|
|
Energy trading futures contracts |
26.8 |
Level 2 |
|
1,095,362 |
|
‐ |
1,095,362 |
|
1,095,362 |
|
|
Trade receivables |
5.1 |
|
|
‐ |
|
4,089,708 |
4,089,708 |
|
4,089,708 |
|
|
Reseller financing |
5.1 |
|
|
‐ |
|
1,508,373 |
1,508,373 |
|
1,508,373 |
|
|
Related parties |
8 |
|
|
‐ |
|
105,196 |
105,196 |
|
105,196 |
|
|
Other receivables and other assets |
|
|
|
‐ |
|
469,109 |
469,109 |
|
469,109 |
|
|
Total |
|
|
|
5,700,098 |
|
11,876,447 |
17,576,545 |
|
17,576,545 |
|
|
|
|
|
|
|
|
|
|
|
|
|
|
Financial liabilities: |
|
|
|
|
|
|
|
|
|
|
|
Financing and debentures |
15.1 |
Level 2 |
|
9,713,213 |
|
10,380,048 |
20,093,261 |
|
20,020,048 |
|
|
Derivative financial instruments |
|
|
|
‐ |
|
‐ |
‐ |
|
‐ |
|
|
Financial |
26.6 |
Level 2 |
|
501,148 |
|
‐ |
501,148 |
|
501,148 |
|
|
Operational |
26.6 |
Level 2 |
|
79,767 |
|
‐ |
79,767 |
|
79,767 |
|
|
Energy trading futures contracts |
26.8 |
Level 2 |
|
734,873 |
|
‐ |
734,873 |
|
734,873 |
|
|
Trade payables |
16.1 |
|
|
‐ |
|
4,643,344 |
4,643,344 |
|
4,643,344 |
|
|
Trade payables - reverse factoring |
16.2 |
|
|
‐ |
|
3,785 |
3,785 |
|
3,785 |
|
|
Subscription warrants – indemnification |
19 |
Level 1 |
|
53,911 |
|
‐ |
53,911 |
|
53,911 |
|
|
Financial liabilities of customers |
|
|
|
‐ |
|
74,326 |
74,326 |
|
74,326 |
|
|
Contingent consideration |
|
|
|
‐ |
|
74,760 |
74,760 |
|
74,760 |
|
|
Related parties |
8 |
|
|
‐ |
|
2,875 |
2,875 |
|
2,875 |
|
|
Other payables |
|
|
|
‐ |
|
957,148 |
957,148 |
|
957,148 |
|
|
Total |
|
|
|
11,082,912 |
|
16,136,286 |
27,219,198 |
|
27,145,985 |
|
The fair value of financial instruments measured at Level 2 is described below:
Securities and funds in local currency: Estimated at the fund unit value as of the date of the financial statements, which corresponds to their fair value.
Derivative instruments: Estimated based on the US dollar futures contracts and the future curves of the DI x fixed rate and DI x IPCA contracts, quoted on B3 on the closing date.
|
Ultrapar Participações S.A. and Subsidiaries |
|
| Notes to the interim financial information | |
| For the period ended March 31, 2026 |
Energy trading futures contracts: The fair value considers: (i) the prices established in recent purchases and sales; and (ii) the market price projected in the availability period. Whenever the fair value at initial recognition differs from the transaction price for these contracts, a gain or loss is recognized.
Financing and debentures: Estimated based on the US dollar futures contracts and the future curves of the DI x fixed rate and DI x IPCA contracts, quoted on B3 on the closing date. The fair value calculation of notes in the foreign market used the quoted price in the market.
Financial risk management
The Company and its subsidiaries are exposed to strategic/operational risks and economic/financial risks. Operational/strategic risks (including demand behavior, competition, technological innovation, and material changes in the industry) are addressed by the Company’s management model.
Economic/financial risks primarily reflect default of customers, behavior of macroeconomic variables, such as commodities prices, exchange and interest rates, as well as the characteristics of the financial instruments used and their counterparties. These risks are managed through specific strategies and control policies.
The Company has a financial risk policy approved by its Board of Directors (“Policy”). In accordance with the Policy, the main objectives of financial management are to preserve the value and liquidity of financial assets and ensure financial resources for the development of the business, including expansions. The main financial risks considered in the Policy are market risks (currencies, interest rates and commodities), liquidity and credit.
The Financial Risk Committee is responsible for monitoring the compliance with the Policy and deciding on any cases of non-compliance. The Audit and Risk Committee (“CAR”) advises the Board of Directors in the efficiency of controls and in the review of the Risk Management Policy. The Risk, Integrity and Audit Director monitors the compliance with the Policy and reports to CAR and the Board of Directors the exposure to the risks and any cases of non-compliance with the Policy.
The Company and its subsidiaries are exposed to the following risks, which are mitigated and managed using specific financial instruments:
|
Risks |
|
Exposure origin |
|
Management |
|
Market risk - exchange rate |
|
Possibility of losses resulting from exposures to exchange rates other than the functional presentation currency, which may be of a financial or operational origin. |
Seek exchange rate neutrality, using hedging instruments if applicable. |
|
|
Market risk - interest rate |
|
Possibility of losses resulting from the contracting of fixed-rate financial assets or liabilities. |
Maintain most of the net financial exposure indexed to floating rates, linked to the basic interest rate. |
|
|
Market risk - commodity prices |
|
Possibility of losses resulting from changes in the prices of the main raw materials or products sold by the Company and their effects on profit or loss, statement of financial position and cash flow. |
Hedging instruments, if applicable. |
|
|
Credit risk |
|
Possibility of losses associated with the counterparty's failure to comply with financial obligations due to insolvency issues or deterioration in risk classification. |
Diversification and monitoring of counterparty’s solvency and liquidity indicators. |
|
|
Liquidity risk |
|
Possibility of inability to honor obligations, including guarantees, and incurring losses. |
For cash management: financial investments liquidity. For debt management: seek the combination of better terms and costs, by monitoring the ratio of average debt term to financial leverage. |
|
Ultrapar Participações S.A. and Subsidiaries |
|
| Notes to the interim financial information | |
| For the period ended March 31, 2026 |
26.1. Market risk - exchange and interest rates
Currency risk management is guided by neutrality of currency exposures and considers the risks associated to changes in exchange rates. The Company considers as its main exposure the assets and liabilities in foreign currency.
The Company and its subsidiaries use foreign exchange hedging instruments to protect their assets, liabilities, receipts, disbursements and investments in foreign currencies. These instruments aim to reduce the effects of foreign exchange variations, within the exposure limits of its Policy.
As to the interest rate risk, the Company and its subsidiaries raise and invest funds mainly linked to the DI. The Company seeks to maintain most of its financial assets and liabilities with floating interest rates, adopting instruments that hedge against the risk of changes in interest rates.
The assets and liabilities exposed to foreign currency, translated to Reais, and/or exposed to floating interest rates are shown below:
|
|
|
|
Exchange rate |
|
Interest rate |
||||
|
|
Note |
Currency |
03/31/2026 |
|
12/31/2025 |
Index |
03/31/2026 |
|
12/31/2025 |
|
Assets |
|
|
|
|
|
|
|
|
|
|
Cash, cash equivalents, and financial investments |
4 |
USD |
3,644,103 |
|
4,041,383 |
DI |
3,701,533 |
|
3,149,064 |
|
Trade receivables, net of allowance for expected credit losses |
5.1 |
USD |
169,989 |
|
136,800 |
- |
‐ |
|
‐ |
|
Other assets in foreign currency |
- |
USD |
17,719 |
|
35,366 |
- |
‐ |
|
‐ |
|
|
|
|
3,831,811 |
|
4,213,549 |
|
3,701,533 |
|
3,149,064 |
|
Liabilities |
|
|
|
|
|
|
|
|
|
|
Loans, financing and debentures (1) |
15.1 |
USD/ EUR/ JPY |
(9,647,829) |
|
(9,953,946) |
DI |
(4,844,336) |
|
(5,210,374) |
|
Loans – FINEP |
15.1 |
|
‐ |
|
‐ |
TJLP |
(26,232) |
|
(27,249) |
|
Foreign suppliers (2) |
16.1 |
USD |
(1,075,774) |
|
(1,882,109) |
- |
‐ |
|
‐ |
|
Other liabilities in foreign currency |
- |
USD |
(112,579) |
|
(3,049) |
‐ |
‐ |
|
‐ |
|
|
|
|
|
|
|
|
|
|
|
|
|
|
|
(10,836,182) |
|
(11,839,104) |
|
(4,870,568) |
|
(5,237,623) |
|
Derivative instruments |
26.6 |
USD / EUR / JPY |
6,804,297 |
|
7,827,902 |
DI |
(11,600,216) |
|
(11,211,803) |
|
|
|
|
(200,074) |
|
202,347 |
|
(12,769,251) |
|
(13,300,362) |
|
Net liability position - equity |
|
|
377,045 |
|
318,867 |
|
‐ |
|
‐ |
|
Net liability position - profit or loss |
|
|
(577,119) |
|
(116,520) |
|
(12,769,251) |
|
(13,300,362) |
| (1) | Gross transaction costs of R$ 21,875 (R$ 24,546 as of December 31, 2025), discount on notes in the foreign market of R$ 2,575 (R$ 3,355 as of December 31, 2025), and amortization of fair value adjustment of R$ 72,190. |
| (2) | Net balance of imports in progress in the amount of R$ 181,666 as of March 31, 2026. |
|
Ultrapar Participações S.A. and Subsidiaries |
|
| Notes to the interim financial information | |
| For the period ended March 31, 2026 |
Sensitivity analysis with devaluation of the Real and interest rate increase
|
|
Exchange rate - Real devaluation (i) |
|
Interest rate increase (ii) |
|
Effect on profit or loss |
(18,496) |
|
85,554 |
|
Effect on equity |
12,084 |
|
‐ |
|
Total |
(6,412) |
|
85,554 |
| (i) | The average U.S. dollar rate of R$ 5.3867 was used for the sensitivity analysis, based on future market curves as of March 31, 2026 on the net position of the Company exposed to the currency risk, simulating the effects of devaluation of the Real on profit or loss. The closing rate considered was R$ 5.2194. The table above shows the effects of the exchange rate changes on the net asset position of R$ 193,439 (or US$ 37,062 using the closing rate) in foreign currency as of March 31, 2026. |
| (ii) | For the probable scenario presented, the Company used as a base scenario the market curves affected by the Interbank Deposit (DI) rate and the Long-Term Interest Rate (TJLP). The sensitivity analysis shows the incremental expenses and income that would be recognized in financial result, if the market curves of floating interest at the base date were applied to the average balances of the current year. The annual base rate used was 14.65% and the sensitivity rate was 13.98% according to reference rates made available by B3. |
26.2. Market risk - commodity prices
The Company and its subsidiaries are exposed to commodity price risk, mainly in relation to diesel and gasoline, affected by macroeconomic and geopolitical factors. Furthermore, in the first quarter of 2026, the external environment was marked by greater volatility in international oil and derivatives markets, influenced by geopolitical tensions in regions that are strategic for production and transportation. This scenario resulted in higher and more unstable international fuel prices and logistics costs, affecting the global dynamics of supply and demand.
In the Brazilian market, the combination of higher international prices and uncertainties in the external scenario has, at certain times, widened the gap between domestic and international prices, influencing import dynamics and margin formation throughout the supply chain.
The foreign exchange derivative instruments and commodities designated as fair value hedge are concentrated in subsidiary IPP. The objective is to convert the cost of the imported product from fixed to variable until fuel blending, aligning it to the sales price. IPP uses over-the-counter derivatives for this hedge operation, aligning them with the value of the inventories of imported product.
To mitigate this risk, the Company continuously monitors the market and uses hedge operations with derivative contracts, traded on the stock exchange and the over-the-counter market.
|
Derivative |
|
Fair value (R$ thousand) |
|
Possible scenario (∆ of 10% - R$ thousand) |
||||
|
|
|
03/31/2026 |
|
12/31/2025 |
|
03/31/2026 |
|
12/31/2025 |
|
Commodity forward |
|
(169,121) |
|
51,189 |
|
(64,234) |
|
(1,811) |
| (1) | The table above shows the positions of derivative financial instruments to hedge commodity price risk as of March 31, 2026 and December 31, 2025, in addition to a sensitivity analysis considering a valuation of 10% of the closing price for each year. For further information, see Note 26.6. |
|
Ultrapar Participações S.A. and Subsidiaries |
|
| Notes to the interim financial information | |
| For the period ended March 31, 2026 |
26.3. Credit risk
Credit risk is related to the possibility of non-compliance with a commitment by a counterparty in a transaction. Credit risk is managed strategically and arises from cash equivalents, financial investments, derivative financial instruments and trade receivables, among others.
26.3.1 Financial institutions and government
The credit risk of financial institutions and governments related to cash and cash equivalents, financial investments and derivative financial instruments as of March 31, 2026, by counterparty rating, is summarized below:
|
|
|
Fair value |
||
|
Counterparty credit rating |
|
03/31/2026 |
|
12/31/2025 |
|
AAA |
|
9,986,920 |
|
9,893,391 |
|
AA |
|
35,305 |
|
353,060 |
|
A |
|
11,048 |
|
7,855 |
|
Others |
|
61,263 |
|
54,491 |
|
Total |
|
10,094,536 |
|
10,308,797 |
26.3.2 Trade receivables
Credit granting is managed in subsidiaries based on policies and criteria specific to each business segment. The process includes credit analysis, the establishment of limits and required guarantees, with approval at predefined approval levels.
The subsidiaries manage credit throughout the customer’s life cycle, with specific processes for monitoring credit risk and renegotiating or executing credit, as applicable.
For further information on the allowance for expected credit losses, see Note 5.2.
26.4. Liquidity risk
Liquidity risk is the possibility of the Company facing difficulties to comply with its financial obligations, which must be settled with payments or other financial assets.
The main sources of liquidity of the Company and its subsidiaries arise from:
| (i) | cash and financial investments; | |
| (ii) | cash flow generated by its operations; and | |
| (iii) | loans. |
|
Ultrapar Participações S.A. and Subsidiaries |
|
| Notes to the interim financial information | |
| For the period ended March 31, 2026 |
The Company and its subsidiaries have sufficient working capital and sources of financing to meet their current needs. As of March 31, 2026, the Company and its subsidiaries had R$ 7,158,526 in cash, cash equivalents, and short-term financial investments (for quantitative information, see Note 4).
The table below presents a summary of financial liabilities and leases payable as of March 31, 2026 by the Company and its subsidiaries, listed by maturity. The amounts presented are the contractual undiscounted cash flows, and may differ from the amounts disclosed in the statement of financial position:
|
|
Less than 1 year |
Between 1 and 3 years |
Between 3 and 5 years |
More than 5 years |
Total |
|
|
|
|
|
|
|
|
Loans, including future contractual interest (1) (2) |
5,521,532 |
11,460,945 |
6,816,335 |
3,245,301 |
27,044,113 |
|
Derivative instruments (3) |
1,148,307 |
1,275,260 |
300,989 |
29,418 |
2,753,974 |
|
Trade payables |
3,313,056 |
‐ |
‐ |
‐ |
3,313,056 |
|
Trade payables - reverse factoring |
1,149,655 |
‐ |
‐ |
‐ |
1,149,655 |
|
Leases payable |
439,644 |
600,585 |
393,096 |
1,225,691 |
2,659,016 |
|
Financial liabilities of customers |
49,634 |
9,321 |
‐ |
‐ |
58,955 |
|
Other payables |
193,559 |
1,018 |
‐ |
‐ |
194,577 |
|
|
11,815,387 |
13,347,129 |
7,510,420 |
4,500,410 |
37,173,346 |
| (1) | The interest on loans was estimated based on the US dollar, Euro at closing and on the future yield curves of the DI x fixed rate and DI x IPCA contracts, quoted on B3 and BACEN as of March 31, 2026. |
| (2) | Includes estimated interest on short-term and long-term loans until the contractually foreseen payment date. |
| (3) | The derivative instruments were estimated based on the US dollar futures contracts and the future curves of the DI x fixed rate and DI x IPCA contracts, quoted on B3 as of March 31, 2026. In the table above, only the derivative instruments with negative results at the time of settlement were considered. |
26.5. Capital management
The Company manages and optimizes its capital structure based on indicators to ensure business continuity while maximizing return to its shareholders.
Capital structure is comprised of net debt (loans, financing and debentures according to Note 15 and leases payable according to Note 12.2 after deduction of cash, cash equivalents and financial investments according to Note 4), and the “financial” derivative financial instruments, assets and liabilities, according to Note 26 Classes and categories of financial instruments and their fair values, and equity.
The Company may change its capital structure according to economic and financial conditions. Moreover, the Company also seeks to improve its return on invested capital by implementing efficient working capital management and a selective investment program.
|
Ultrapar Participações S.A. and Subsidiaries |
|
| Notes to the interim financial information | |
| For the period ended March 31, 2026 |
Annually, the Company and its subsidiaries revise their capital structure, evaluating the cost of capital and the risks associated with each class of capital including the leverage ratio analysis, which is determined as the ratio between net debt and equity.
The leverage ratio at the end of the period/year is as follows:
|
|
|
Consolidated |
||
|
|
|
03/31/2026 |
|
12/31/2025 |
|
Gross debt and lease payable (a) |
|
21,122,044 |
|
21,832,894 |
|
Cash, cash equivalents, and short-term investments (b) |
|
9,052,604 |
|
9,408,480 |
|
Financial instruments (c) |
|
(205,123) |
|
275,916 |
|
Net debt = (a) - (b) - (c) |
|
12,274,563 |
|
12,148,498 |
|
Equity |
|
18,509,820 |
|
17,730,617 |
|
Net debt-to-equity ratio |
|
66.31% |
|
68.52% |
26.6. Selection and use of derivative financial instruments
In selecting derivative instruments, the Company considers the estimated rates of return, risks, liquidity, calculation methodology for the carrying and fair values, and the applicable documentation.
Derivative financial instruments are used to hedge identified risks, at amounts that do not exceed 100% of the identified risk. Derivatives are referred to as "derivative instruments" to reflect their restricted function of hedging identified risks.
The table below summarizes the gross balance of the position of derivative instruments contracted as well as of the gains (losses) that affect the equity and the statement of income of the Company and its subsidiaries:
|
Ultrapar Participações S.A. and Subsidiaries |
|
| Notes to the interim financial information | |
| For the period ended March 31, 2026 |
|
Derivatives designated as hedge accounting |
|
|
|
|
|
|
|
|
|
|
|
|
|||
|
Product |
|
Contracted rates |
|
Maturity |
|
Notional amount (2) |
|
Fair value as of 03/31/2026 |
|
Gains (losses) as of 03/31/2026 |
|||||
|
|
|
Assets |
Liabilities |
|
|
|
03/31/2026 |
|
Assets |
|
Liabilities |
|
Profit or loss |
|
Fair value adjustment of the hedged item |
|
Foreign exchange swap (1) |
|
USD + 4.8% |
103.7% DI |
|
Feb/29 |
|
USD 536,806 |
|
‐ |
|
(234,875) |
|
(201,998) |
|
(5,995) |
|
Foreign exchange swap (1) |
|
EUR + 3.0% |
104.4% DI |
|
Feb/37 |
|
EUR 77,535 |
|
‐ |
|
(85,284) |
|
(56,783) |
|
908 |
|
Foreign exchange swap (1) |
|
SOFR + 0.9% |
103.8% DI |
|
Feb/29 |
|
USD 202,627 |
|
‐ |
|
(104,768) |
|
(147,433) |
|
3,819 |
|
Interest rate swap (1) |
|
IPCA + 5.2% |
105.2% DI |
|
Jun/32 |
|
BRL 2,420,000 |
|
245,590 |
|
‐ |
|
(171,018) |
|
169,792 |
|
Interest rate swap (1) |
|
IPCA + 6.7% |
CDI -1.4% |
|
Oct/35 |
|
BRL 235,355 |
|
7,625 |
|
‐ |
|
(17,115) |
|
17,368 |
|
Interest rate swap (1) |
|
TFC Pós + 3.0% |
69.9% DI |
|
Nov/41 |
|
BRL 358,871 |
|
‐ |
|
(13,382) |
|
(3,595) |
|
(2,972) |
|
Interest rate swap (1) |
|
TFC Pós + 4.5% |
CDI - 2.4% |
|
Jan-41 |
|
BRL 106,871 |
|
‐ |
|
(4,417) |
|
(4,417) |
|
17,602 |
|
Interest rate swap (1) |
|
12.8% |
104.7% DI |
|
Apr/40 |
|
BRL 1,048,881 |
|
‐ |
|
(24,646) |
|
(10,787) |
|
9,475 |
|
Commodity forward (1) |
|
BRL |
Heating Oil/ RBOB |
|
Feb/37 |
|
USD 1,212 |
|
64,900 |
|
(61,126) |
|
(8,154) |
|
‐ |
|
NDF (1) |
|
BRL |
USD |
|
Apr/26 |
|
USD 363,608 |
|
15,677 |
|
(9,906) |
|
(2,060) |
|
|
|
|
|
|
|
|
|
|
Total - designated |
|
333,792 |
|
(538,404) |
|
(623,360) |
|
209,997 |
|
Derivatives not designated as hedge accounting |
|
|
|
|
|
|
|
|
|
|
|
‐ |
|||
|
|
|
|
|
|
|
|
|
|
|
|
|
|
|
|
|
|
Foreign exchange swap |
|
USD |
52.5% CDI |
|
Jun/29 |
|
USD 300,000 |
|
310,641 |
|
‐ |
|
(83,595) |
|
‐ |
|
Foreign exchange swap |
|
USD + 5.0% |
106.7% CDI |
|
Feb/31 |
|
USD 107,500 |
|
‐ |
|
(30,587) |
|
(33,646) |
|
‐ |
|
Interest rate swap |
|
IPCA + 6.0% |
91.6% CDI |
|
Oct/31 |
|
USD 449,700 |
|
3,210 |
|
(420) |
|
63 |
|
‐ |
|
NDF |
|
USD |
BRL |
|
Dec-26 |
|
USD 1,640 |
|
719 |
|
(1,704) |
|
(29,880) |
|
‐ |
|
Commodity forward |
|
BRL |
Heating Oil/ RBOB |
|
Dec-26 |
|
USD 57,462 |
|
393,570 |
|
(566,465) |
|
(211,345) |
|
‐ |
|
Interest rate swap |
|
USD + 5.3% |
CDI - 1.4% |
|
Jun/29 |
|
USD 300,000 |
|
‐ |
|
(272,824) |
|
(46,109) |
|
‐ |
|
|
|
|
|
|
|
|
Total - not designated |
|
708,140 |
|
(872,000) |
|
(404,512) |
|
‐ |
|
|
|
|
|
|
|
|
|
|
|
|
|
|
|
|
|
|
|
|
|
|
|
|
|
Total |
|
1,041,932 |
|
(1,410,404) |
|
(1,027,872) |
|
209,997 |
|
|
|
|
|
|
|
|
Current |
|
474,865 |
|
(819,314) |
|
|
|
|
|
|
|
|
|
|
|
|
Non-current |
|
567,067 |
|
(591,090) |
|
|
|
|
| (1) | Derivative financial instruments designated for fair value hedge accounting (see Note 26.7.1). |
| (2) | Currency as indicated. |
|
Ultrapar Participações S.A. and Subsidiaries |
|
| Notes to the interim financial information | |
| For the period ended March 31, 2026 |
| Derivatives designated as hedge accounting |
||||||||||||||||||||||||
|
Product |
|
Contracted rates |
|
Maturity |
|
Notional amount (3) |
|
Fair value as of 12/31/2025 |
|
Gains (losses) as of 03/31/2025 |
||||||||||||||
|
|
|
Assets |
Liabilities |
|
|
|
12/31/2025 |
|
Assets |
|
Liabilities |
|
Profit or loss |
|
Fair value adjustment of the hedged item |
|||||||||
|
Foreign exchange swap (1) |
|
USD + 4.9% |
103.5% DI |
|
Feb/29 |
|
USD 459,863 |
|
759 |
|
(113,093) |
|
(65,976) |
|
(15,904) |
|||||||||
|
Foreign exchange swap (1) |
|
EUR + 3.0% |
104.4% DI |
|
Feb/37 |
|
EUR 77,535 |
|
15,833 |
|
(27,803) |
|
(31,009) |
|
(1,520) |
|||||||||
|
Foreign exchange swap (1) |
|
JPY + 1.5% |
109.4% DI |
|
Mar/25 |
|
JPY 12,564,393 |
|
‐ |
|
‐ |
|
(30,283) |
|
323 |
|||||||||
|
Foreign exchange swap (1) |
|
SOFR + 0.9% |
103.5% DI |
|
Feb/29 |
|
USD 302,627 |
|
2,953 |
|
(54,511) |
|
(26,678) |
|
- |
|||||||||
|
Interest rate swap (1) |
|
TFC Pós + 5.3% |
103.8% DI |
|
Oct/35 |
|
BRL 2,655,355 |
|
367,790 |
|
‐ |
|
94,295 |
|
70,780 |
|||||||||
|
Interest rate swap (1) |
|
TFC Pós + 3.0% |
69.9% DI |
|
Nov/41 |
|
BRL 358,871 |
|
3,765 |
|
(15,143) |
|
(2,765) |
|
(24,102) |
|||||||||
|
Interest rate swap (1) |
|
12.8% |
104.7% DI |
|
Apr/40 |
|
BRL 1,048,881 |
|
1,572 |
|
(20,605) |
|
10,913 |
|
- |
|||||||||
|
Commodity forward (1) |
|
BRL |
Heating Oil/ RBOB |
|
Mar/26 |
|
USD 548,628 |
|
63,293 |
|
(52,819) |
|
(14,753) |
|
‐ |
|||||||||
|
NDF (1) |
|
BRL |
USD |
|
Mar/26 |
|
USD 206,491 |
|
6,986 |
|
(14,690) |
|
3,226 |
|
‐ |
|||||||||
|
|
|
|
|
|
|
|
Total - designated |
|
462,951 |
|
(298,664) |
|
(63,030) |
|
29,577 |
|||||||||
| Derivatives not designated as hedge accounting |
||||||||||||||||||||||||
|
Foreign exchange swap |
|
USD |
52.5% CDI |
|
Jun/29 |
|
USD 300,000 |
|
378,422 |
|
‐ |
|
(73,842) |
|
‐ |
|||||||||
|
Foreign exchange swap |
|
USD + 5.0% |
1.6% CDI |
|
Feb/31 |
|
USD 50,000 |
|
‐ |
|
(11,798) |
|
(22,021) |
|
‐ |
|||||||||
|
Interest rate swap |
|
IPCA + 6.0% |
92.4% CDI |
|
Oct-28 |
|
USD 380,000 |
|
2,728 |
|
‐ |
|
- |
|
‐ |
|||||||||
|
NDF |
|
USD |
BRL |
|
Mar/26 |
|
USD 244,037 |
|
3,242 |
|
(31,480) |
|
- |
|
‐ |
|||||||||
|
Commodity forward |
|
BRL |
Heating Oil/ RBOB |
|
Nov/26 |
|
USD 98,504 |
|
52,974 |
|
(12,259) |
|
18,759 |
|
‐ |
|||||||||
|
Interest rate swap |
|
USD + 5.3% |
1.4% CDI |
|
Jun/29 |
|
USD 300,000 |
|
‐ |
|
(226,714) |
|
(2,809) |
|
‐ |
|||||||||
|
|
|
|
|
|
|
|
Total - not designated |
|
437,366 |
|
(282,251) |
|
(79,913) |
|
‐ |
|||||||||
|
|
|
|
|
|
|
|
|
|
|
|
|
|
|
|
|
|||||||||
|
|
|
|
|
|
|
|
Total |
|
900,317 |
|
(580,915) |
|
(142,943) |
|
29,577 |
|||||||||
|
|
|
|
|
|
|
|
Current |
|
127,254 |
|
(246,064) |
|
|
|
|
|||||||||
|
|
|
|
|
|
|
|
Non-current |
|
773,063 |
|
(334,851) |
|
|
|
|
|||||||||
| (1) | Derivative financial instruments designated for fair value hedge accounting (see Note 26.7.1). |
| (2) | Currency as indicated. |
|
Ultrapar Participações S.A. and Subsidiaries |
|
| Notes to the interim financial information | |
| For the period ended March 31, 2026 |
26.7. Hedge accounting
The Company and its subsidiaries use derivative and non-derivative financial instruments for hedging purposes and test, throughout the duration of the hedge, their effectiveness, as well as the changes in their fair value.
The hedged items and the hedging instruments have a high correspondence, since the contracted instruments have characteristics equivalent to the transactions considered as the hedged item. The Company and its subsidiaries designated a hedge ratio for transactions designated as hedge accounting, since the underlying risks of the hedging instruments correspond to the risks of the hedged items.
The Company and its subsidiaries discontinue the hedge accounting when the hedging instrument is settled, the hedged item ceases to exist or the hedge no longer meets the requirements for hedge accounting due to the absence of an economic relationship between the hedged item and the hedging instrument.
26.7.1 Fair value hedge
The Company and its subsidiaries use derivative financial instruments such as fair value hedge to mitigate the risk of variations in interest, exchange rates and commodities, which affect the amount of contracted debts. As of March 31, 2026, no material ineffectiveness was identified in fair value hedge operations.
26.7.2 Cash flow hedge
As of March 31, 2026, the Company and its subsidiaries do not have cash flow hedges.
26.8. Financial instruments (energy trading futures contracts)
The Company’s subsidiaries operate in the Free Contracting Environment (ACL) and have entered into bilateral energy purchase and sale contracts with different market players. Accordingly, they assume short and long-term commitments. As a result of mismatched operations, they assume energy surplus or deficit positions, which are measured at a future market price curve (forward curve). Therefore, the Company designates these contracts as financial instruments, according to IFRS 9/CPC 48, at the beginning of the contract, to include the recording of the correct exposure to the risk of future purchase and sale transactions of bilateral contracts.
Sensitivity analysis – level 2 hierarchy
|
|
Valuation technique |
|
Fair value of energy contracts |
|
Sensitivity of inputs to fair value (a) |
|
|
Financial assets |
Discounted cash flow method |
|
1,132,391 |
|
+10% |
1,355,394 |
|
|
|
|
-10% |
878,692 |
||
|
|
|
|
|
|
|
|
|
Financial liabilities |
|
703,592 |
|
+10% |
963,434 |
|
|
|
|
|
-10% |
444,052 |
||
| (a) | This 10% variation scenario represents a fluctuation considered reasonable by the Company, based on the history of negotiations concluded under similar market conditions. |
|
Ultrapar Participações S.A. and Subsidiaries |
|
| Notes to the interim financial information | |
| For the period ended March 31, 2026 |
27.1. Acquisition of service stations from Pão de Açúcar Group by subsidiary Millennium
On June 10, 2024, through its subsidiary Centro de Conveniências Millenium Ltda., the Company signed a contract for the acquisition of 49 service stations from Pão de Açúcar Group, located in the state of São Paulo, for R$ 130,000 plus working capital adjustments. CADE approved the transaction on July 22, 2024. On August 13, 2024, R$ 90,000 was paid as an advance.
Until the period ended March 31, 2026, the acquisition of 26 out of 49 service stations was completed for a total amount of R$ 60,937, of which R$ 40,811 had previously been paid as an advance.
27.2. Hidrovias do Brasil S.A.
In the period from 2023 to 2025, the Company, through its subsidiary Ultra Logística Ltda., made successive acquisitions of shares of Hidrovias do Brasil S.A., initially classified as a financial asset and subsequently as an investment in an associate, until the effective obtainment of corporate control in May 2025, then holding 50.15% of Hidrovias' share capital. The key terms, relevant events, applicable accounting criteria, and purchase price allocation (PPA) were disclosed in the corresponding Note to the annual Financial Statements for the year ended December 31, 2025.
After obtaining control, the Company, through its subsidiary, made additional acquisitions of interests that do not qualify as a business combination. Thus, the differences between the price paid and the equity value of the interests acquired were recorded directly in equity, under acquisition of shares from shareholders. As of March 31, 2026, the Company's interest in Hidrovias was 59.75% (58.72% as of December 31, 2025), with no other relevant changes related to the business combination during the quarter.
27.3. Petrovila Combustíveis S.A
On December 1, 2025, Neodiesel Ltda., indirect subsidiary of Ultrapar Participações S.A., completed the acquisition of 60% of the capital of Petrovila Combustíveis S.A., qualifying the transaction as a business combination as defined in IFRS 3 / CPC 15 (R1). The main terms and conditions of the acquisition were disclosed in the corresponding Note to the annual Financial Statements for the year ended December 31, 2025.
The total value of the consideration was R$ 72,199, with R$ 50,000 paid through a capital contribution and R$ 22,012 recorded as contingent consideration to be settled after the contractual clauses have been fulfilled.
As of December 31, 2025, the Company determined provisional goodwill in the amount of R$ 34,934, with the purchase price allocation (PPA) remaining in process, with completion expected in 2026. For the period ended March 31, 2026, there were no material changes to the terms of the business combination or the provisional values determined.
|
Ultrapar Participações S.A. and Subsidiaries |
|
| Notes to the interim financial information | |
| For the period ended March 31, 2026 |
27.4. Neoagro Diesel S.A
On November 17, 2025, Neodiesel Ltda., indirect subsidiary of Ultrapar Participações S.A., completed the acquisition of 60% of the capital of Neoagro Diesel S.A. (“Neoagro”), qualifying the transaction as a business combination as defined in IFRS 3 (CPC 15 (R1)) – Business Combinations.
Neoagro is headquartered in Uruçuí, in the state of Piauí, and operates predominantly in that state in the Transporter-Reseller-Retailer (TRR) segment, carrying out the commercialization and transportation of bulk fuels to end consumers.
The initial payment totaled R$ 60,800, including a contribution of R$ 18,024. In the first quarter of 2026, a payment of R$ 20,884 was made. The remaining amount of R$ 14,400 was recorded under “Other payables” and will be paid after the contractual clauses have been fulfilled.
The Company, based on applicable accounting standards and supported by an independent appraisal firm, is determining the statement of financial position as at the acquisition date, the fair value of assets and liabilities and, consequently, goodwill. The provisional goodwill determined is R$ 62,833. The purchase price allocation (PPA) will be completed in 2026.
The following table summarizes the consolidated balances of assets acquired and liabilities at the acquisition date, subject to adjustment for purchase price allocation and goodwill determination:
| Assets | |
| Cash and cash equivalents | 3,000 |
|
Fixed
assets, net
|
17,611 |
| Liabilities |
- |
| Goodwill based on expected future profitability | 62,833 |
| Non-controlling interests | 8,244 |
| Assets and liabilities consolidated in the opening balance |
75,200
|
| Assets acquired | 12,367 |
| Goodwill based on expected future profitability | 62,833 |
| Acquisition value | 75,200 |
| Comprised by | |
| Cash | 42,776 |
| Acquisition of ownership interest via capital contribution (as non-controlling interests) | 18,024 |
|
Contingent
consideration to be settled
|
14,400 |
|
Total consideration
|
75,200 |
|
Net
cash outflow resulting from acquisition
|
|
|
Initial
consideration in cash
|
(60,800) |
|
Cash
and cash equivalents acquired
|
3,000 |
| Acquisition value | (57,800) |
 |
São Paulo, May 6, 2026 – Ultrapar Participações S.A. (B3: UGPA3 / NYSE: (UGP, “Company” or “Ultrapar”), operating in energy, mobility, and logistics infrastructure through Ultragaz, Ipiranga, Ultracargo and Hidrovias do Brasil (B3: HBSA3), today announces its results for the first quarter of 2026.
|
Net revenue |
Adjusted EBITDA1 |
Recurring Adjusted EBITDA1 |
|
R$ 36.8 billion |
R$ 2.3 billion |
R$ 2.3 billion |
|
Net income |
Cash generation from operations |
Investments |
|
R$ 914 million |
R$ 1.1 billion |
R$ 558 million |
¹ Accounting adjustments and non-recurring items described in the EBITDA calculation table – page 2
Highlights
- Continuity of Ultrapar’s good operating results
| - | Strong recurring adjusted EBITDA results, driven by Ipiranga and consolidation of Hidrovias | |
| - |
Operating cash generation of R$ 1.1 billion, reflecting solid business results and higher draft discount for suppliers transactions, despite the higher working capital investments | |
| - |
Financial strength, with leverage reduction for 1.5x, reflecting the strong cash generation and higher draft discount for suppliers. Including the effect of draft discount for suppliers, leverage would have been 1.7x, same level as December 2025 |
- Fuel market supply
| - | Investment of R$ 2.0 billion in working capital at Ipiranga due to higher import volumes in a scenario of elevated volatility and higher international prices, ensuring the supply of its service station network and consumers |
- Advances in the growth, productivity and value creation agenda
| - | Completion of the expansion in Rondonópolis, adding 15 thousand m³ of capacity at Ultracargo from January 2026 | |
| - |
Completion of the expansion in Opla, adding 10 thousand m³ of capacity at Ultracargo from February 2026 |
- Advances in the institutional agenda
| - | Publication of the persistent debtor regulation by the Federal Revenue Service | |
| - |
Conversion of the “Gás do Povo” into law, strengthening the sector’s safety and regulatory framework |
- Publication of the 2025 Sustainability Report in March, with the disclosure of the new 2030 sustainability plan, more aligned with the most relevant issues for the growth and longevity of our businesses and the strategy of long-term value generation of Ultrapar
|
Considerations on the financial and operational information
The financial information presented on this document was extracted from the interim financial information (“Quarterly Information”) for the period ended on March 31, 2026, and prepared in accordance with the pronouncement CPC 21 (R1) - Interim Financial Reporting and the International Accounting Standard IAS 34, issued by the IASB, and presented in accordance with the applicable rules for Quarterly Information, issued by the Brazilian Securities and Exchange Commission (“CVM”).
Information on Ipiranga, Ultragaz, Ultracargo, and Hidrovias is presented without the elimination of intersegment transactions. Therefore, the sum of such information may not correspond to Ultrapar’s consolidated information. Additionally, the financial and operational information is subject to rounding and, consequently, the total amounts presented in the tables and charts may differ from the direct numerical sum of the amounts that preceded them.
Information denominated EBIT (Earnings Before Interest and Taxes on Income and Social Contribution on Net Income), EBITDA (Earnings Before Interest, Taxes on Income and Social Contribution on Net Income, Depreciation and Amortization); Adjusted EBITDA and Recurring Adjusted EBITDA are presented in accordance with Resolution 156, issued by the CVM in June 2022.
Adjusted EBITDA considers adjustments from usual business transactions that impact the results but do not have potential cash generation, such as the amortization of contractual assets with customers, amortization of fair value adjustments and capital loss of associates, and the mark-to-market of energy future contracts. Regarding recurring Adjusted EBITDA, the Company excludes exceptional or non-recurring items, providing a more accurate and consistent view of its operational performance, avoiding distortions caused by exceptional events, whether positive or negative. The calculation of EBITDA from net income is detailed in the table below.
In May 2025, the Company became the controlling shareholder of Hidrovias, as per the Material Fact disclosed to the market, consolidating its results as of that date. From that moment, Hidrovias’ results began to be incorporated into Ultrapar’s EBITDA, while the period prior to the acquisition of control remained recorded using the equity method. As announced, Hidrovias completed the sale of its coastal navigation operation in November 2025; therefore, the 4Q25 results only reflect one month of this operation, as the balances had been presented as a discontinued operation since 1Q25.
|
1Q26 |
 |
R$ million
|
ULTRAPAR |
|
Quarter |
|
|
1Q26 |
1Q25 |
4Q25 |
|
|
Net Income |
914 |
363 |
256 |
|
(+) Income and social contribution taxes |
498 |
248 |
232 |
|
(+) Net financial (income) expenses |
398 |
180 |
556 |
|
(+) Depreciation and amortization¹ |
435 |
300 |
432 |
|
EBITDA |
2,246 |
1,091 |
1,476 |
|
Accounting adjustment |
|
|
|
|
(+) Amortization of contractual assets with customers – exclusive and amortization of fair value adjustments on associates’ acquisition |
147 |
106 |
131 |
|
(+) MTM of energy futures contracts |
(69) |
(9) |
(46) |
|
(+/-) Hedge accounting |
- |
- |
2 |
|
Adjusted EBITDA |
2,324 |
1,188 |
1,562 |
|
Ipiranga |
1,657 |
832 |
1,161 |
|
Ultragaz |
385 |
393 |
423 |
|
Ultracargo |
165 |
166 |
144 |
|
Hidrovias² |
194 |
(139) |
(66) |
|
Holding and other companies |
|
|
|
|
Holding |
(56) |
(54) |
(58) |
|
Other companies |
(21) |
(10) |
(42) |
|
Non-recurring items that affected EBITDA |
|
|
|
|
(-) Results from disposal of assets (Ipiranga) |
8 |
(5) |
(95) |
|
(-) Earn-out Stella/ impairment (Ultragaz) |
- |
- |
51 |
|
(-) Assets write-off and customer indemnifications (Hidrovias) |
(12) |
- |
226 |
|
Recurring adjusted EBITDA |
2,320 |
1,183 |
1,745 |
|
Ipiranga |
1,665 |
826 |
1,066 |
|
Ultragaz |
385 |
393 |
474 |
|
Ultracargo |
165 |
166 |
144 |
|
Hidrovias² |
182 |
(139) |
160 |
|
Holding and other companies |
|
|
|
|
Holding |
(56) |
(54) |
(58) |
|
Other companies |
(21) |
(10) |
(42) |
1 Does not include amortization of contractual assets with customers – exclusive rights
21Q25 figures refer to the share of profit (loss) of subsidiaries, joint ventures and associates in Hidrovias
|
1Q26 |
|
|
ULTRAPAR |
Quarter |
||||
|
1Q26 |
1Q25 |
4Q25 |
1Q26 x 1Q25 |
1Q26 x 4Q25 |
|
|
Net revenue |
36,752 |
33,329 |
37,973 |
10% |
-3% |
|
Cost of products sold |
(33,578) |
(31,188) |
(35,372) |
8% |
-5% |
|
Gross profit |
3,174 |
2,142 |
2,600 |
48% |
22% |
|
Selling, general and administrative |
(1,320) |
(1,120) |
(1,286) |
18% |
3% |
|
Results from disposal of assets |
0 |
5 |
(100) |
-91% |
-100% |
|
Other operating income (expenses), net |
(23) |
(87) |
(131) |
-73% |
-82% |
|
Adjusted EBITDA |
2,324 |
1,188 |
1,562 |
96% |
49% |
|
Recurring Adjusted EBITDA¹ |
2,320 |
1,183 |
1,745 |
96% |
33% |
|
Depreciation and amortization² |
(582) |
(406) |
(563) |
43% |
3% |
|
Financial Results |
(398) |
(180) |
(556) |
121% |
-28% |
|
Net income |
914 |
363 |
256 |
152% |
n/a |
|
Investments |
558 |
416 |
826 |
34% |
-38% |
|
Cash flow from operating activities |
1,103 |
3 |
2,382 |
n/a |
-54% |
¹ Non-recurring items described in the EBITDA calculation table – page 2
² Includes amortization of contractual assets with customers – exclusive rights and amortization of fair value adjustments on associates acquisition
Net revenues – Total of R$ 36,752 million (+10% vs 1Q25), mainly reflecting higher revenues of Ipiranga and the effect of the consolidation of Hidrovias, which accounted as share of equity income in 1Q25. Compared to 4Q25, there was a 3% decrease, mainly due to the lower revenues of Ipiranga.
Recurring adjusted EBITDA – Total of R$ 2,320 million (+96% vs 1Q25), highlighting Ipiranga’s better results and the effect of the consolidation of Hidrovias’ result. Compared to 4Q25, recurring Adjusted EBITDA increased by 33%, mainly due to Ipiranga's better results.
Results from the Holding and other companies – Negative result of R$ 77 million, comprising: (i) R$ 56 million in Holding expenses, R$ 2 million higher than in 1Q25, and (ii) R$ 21 million in expenses from the other companies, mainly due to the negative result of R$ 14 million from Refinaria Riograndense.
Depreciation and amortization – Total of R$ 582 million (+43% vs 1Q25), mainly reflecting the effect of the consolidation of Hidrovias and higher amortization expenses of contractual assets at Ipiranga, driven by the increase in sales volumes. Compared to 4Q25, depreciation and amortization expenses increased by 3%.
Financial result – Expenses of R$ 398 million (worsening of R$ 218 million vs 1Q25), mainly resulting from: (i) higher net debt due to the consolidation of Hidrovias, (ii) lower positive mark-to-market impact (R$ 76 million in 1Q26 vs R$ 118 million in 1Q25) and (iii) higher CDI rates. Compared to 4Q25, there was an improvement of R$ 158 million, mainly reflecting the negative one-off mark-to-market effect of R$ 164 million in 4Q25.
Net income – Total of R$ 914 million (vs R$ 363 million in 1Q25), reflecting better operating results, partially offset by higher depreciation and amortization and financial expenses, mainly due to the effect of the consolidation of Hidrovias. Compared to 4Q25, net income increased by R$ 658 million, due to higher operating results and lower financial expenses.
Cash flow from operating activities – Operating cash flow of R$ 1,103 million in 1Q26, compared to R$ 3 million in 1Q25, mainly reflecting better operating results in the period, partially offset by higher working capital needs, particularly at Ipiranga and Hidrovias. At Ipiranga, working capital investments in 1Q26 resulted from a significant increase in fuel imports, with shorter-than-usual payment terms, as well as higher receivables and inventory levels, amid a significant increase in imports to ensure the supply of the Brazilian market. These impacts were partially offset by the contracting of R$ 1,146 million in draft discount for suppliers’ transactions. Excluding this effect, there would have been a cash consumption of R$ 43 million in 1Q26.
|
1Q26 |
|
R$ million
|
IPIRANGA |
Quarter |
||||||||||||
|
1Q26 |
1Q25 |
4Q25 |
1Q26 x 1Q25 |
1Q26 x 4Q25 |
|||||||||
|
Total volume (‘000 m³) |
6,021 |
5,578 |
6,443 |
8% |
-7% |
||||||||
|
Diesel |
3,026 |
2,775 |
3,162 |
9% |
-4% |
||||||||
|
Otto cycle |
2,890 |
2,699 |
3,171 |
7% |
-9% |
||||||||
|
Others¹ |
105 |
104 |
109 |
2% |
-4% |
||||||||
|
Net revenues |
33,110 |
30,234 |
34,128 |
10% |
-3% |
||||||||
|
Cost of products sold and service provided |
(30,812) |
(28,806) |
(32,489) |
7% |
-5% |
||||||||
|
Gross profit |
2,298 |
1,429 |
1,639 |
61% |
40% |
||||||||
|
Gross margin (R$/m³) |
382 |
256 |
254 |
49% |
50% |
||||||||
|
Selling, general and administrative |
(885) |
(762) |
(799) |
16% |
11% |
||||||||
|
Results from disposal of assets |
(8) |
5 |
95 |
n/a |
-108% |
||||||||
|
Other operating income (expenses), net |
(43) |
(105) |
(65) |
-59% |
-33% |
||||||||
|
Adjusted EBITDA |
1,657 |
832 |
1,161 |
99% |
43% |
||||||||
|
Adjusted EBITDA margin (R$/m³) |
275 |
149 |
180 |
84% |
53% |
||||||||
|
Non-recurring² |
8 |
(5) |
(95) |
n/a |
-108% |
||||||||
|
Recurring Adjusted EBITDA |
1,665 |
826 |
1,066 |
101% |
56% |
||||||||
|
Recurring Adjusted EBITDA margin (R$/m³) |
276 |
148 |
165 |
87% |
67% |
||||||||
|
Depreciation and amortization³ |
298 |
266 |
287 |
12% |
4% |
||||||||
|
|
|
|
|
|
|
||||||||
|
Recurring Adjusted LTM EBITDA |
4,300 |
3,387 |
3,462 |
27% |
24% |
||||||||
|
Recurring Adjusted LTM EBITDA margin (R$/m³) |
176 |
144 |
145 |
23% |
22% |
||||||||
1 Fuel oils, arla 32, kerosene, lubricants and greases; 2 Non-recurring items described in the EBITDA calculation table – page 2
3 Includes amortization with contractual assets with customers – exclusive rights
Operational performance – The total volume sold increased by 8% compared to 1Q25, with an increase of 9% in diesel and 7% in the Otto cycle, reflecting the continued gradual market recovery following the reduction of irregularities in the sector, as well as higher import volumes in order to maintain market supply. Compared to 4Q25, sales volume decreased by 7%, in line with the typical seasonality between the periods.
Net revenue – Total of R$ 33,110 million (+10% vs 1Q25), mainly reflecting higher sales volume and the pass-through of a significant increase in fuel acquisition costs, particularly diesel, in a context of a higher share of imported products to meet domestic demand. Compared to 4Q25, net revenue decreased by 3%, due to lower sales volume, partially offset by the pass-through of fuel cost increases.
Cost of goods sold – Total of R$ 30,812 million (+7% vs 1Q25), due to higher sales volume and higher fuel costs, partially offset by lower growth in convenience store operating costs. Compared to 4Q25, there was a 5% decrease, mainly due to lower sales volume, partially offset by higher fuel costs.
Selling, general and administrative expenses – Total of R$ 885 million (+16 % vs 1Q25), mainly due to higher allowance for expected credit losses and higher legal and marketing expenses, in addition to higher personnel expenses (collective bargaining agreement and variable compensation, in line with the progression of results). Compared to 4Q25, there was a 11 % increase, reflecting mainly the higher allowance for expected credit losses and higher personnel expenses – higher provision for variable compensation in line with the progression of results.
Result from disposal of assets – Negative result totaling R$ 8 million (vs R$ 5 million in 1Q25 and R$ 95 million in 4Q25), reflecting lower sale of real estate and one-off effect of R$ 9 million asset write-offs.
Other operating results – Expenses of R$ 43 million (vs R$ 105 million in 1Q25 and R$ 65 million in 4Q25), mainly due to lower expenses with decarbonization credits, given the lower price level in the period.
|
1Q26 |
|
Recurring Adjusted EBITDA – Total of R$ 1,665 million (+101 % vs 1Q25), reflecting (i) the gradual improvement in a fairer competitive environment with advances in combating irregularities, (ii) higher sales volume and (iii) inventory gains from imported fuels, given the significant increases in prices during the period. This performance was supported by efficient supply management and strong working capital investments, which enabled the import of fuels even amid volatility and elevated international prices, ensuring market supply. Compared to 4Q25, there was a 56% increase, driven by the continued progress in combating irregularities, partially offset by lower volumes and higher expenses.
Investments – R$ 282 million was invested (+33 % vs 1Q25), allocated to the expansion and maintenance of its service stations and franchises network, in addition to investments towards enhancing the technology platform, focusing on the replacement of the ERP system, scheduled to be concluded in 2027. Of the total invested, R$ 140 million refers to additions to fixed and intangible assets and R$ 143 million to contractual assets with customers (exclusive rights).
R$ million
|
ULTRAGAZ |
Quarter |
||||
|
1Q26 |
1Q25 |
4Q25 |
1Q26 x 1Q25 |
1Q26 x 4Q25 |
|
|
Total volume (‘000 ton) |
405 |
406 |
426 |
0% |
-5% |
|
Bottled |
259 |
257 |
280 |
1% |
-8% |
|
Bulk |
146 |
149 |
146 |
-2% |
0% |
|
Net revenues |
2,965 |
2,863 |
3,115 |
4% |
-5% |
|
Cost of products sold |
(2,358) |
(2,328) |
(2,432) |
1% |
-3% |
|
Gross profit |
607 |
536 |
683 |
13% |
-11% |
|
Selling, general and administrative |
(260) |
(248) |
(274) |
5% |
-5% |
|
Results from disposal of assets |
(0) |
(0) |
(46) |
98% |
-99% |
|
Other operating income (expenses), net |
2 |
16 |
(6) |
-84% |
-142% |
|
Operating income |
349 |
303 |
357 |
15% |
-2% |
|
MTM of energy futures contracts |
(69) |
(9) |
(46) |
n/a |
49% |
|
Adjusted EBITDA¹ |
385 |
393 |
423 |
-2% |
-9% |
|
Adjusted EBITDA margin (R$/ton) |
950 |
967 |
992 |
-2% |
-4% |
|
Non-recurring² |
- |
- |
51 |
n/a |
n/a |
|
Recurring Adjusted EBITDA |
385 |
393 |
474 |
-2% |
-19% |
|
Recurring Adjusted EBITDA margin (R$/ton) |
950 |
967 |
1,112 |
-2% |
-15% |
|
Depreciation and amortization |
104 |
98 |
113 |
6% |
-8% |
|
|
|
|
|
|
|
|
Recurring Adjusted LTM EBITDA |
1,764 |
1,679 |
1,772 |
5% |
0% |
|
Recurring Adjusted LTM EBITDA margin (R$/ton) |
1,032 |
959 |
1,036 |
8% |
0% |
Operational performance – The volume of LPG sold totaled 405 thousand tons in 1Q26, stable compared to 1Q25, with a 1 % increase in the bottled segment and a 2 % decrease in the bulk segment, reflecting lower demand in the industry segment. Compared to 4Q25, the volume was 5% lower, in line with the typical seasonality between the periods.
Net revenues – Total of R$ 2,965 million (+4% vs 1Q25), reflecting the pass-through of inflation and the increased costs of LPG, in addition to higher contribution of the new energy segment, partially offset by the lower volume in the bulk segment. Compared to 4Q25, revenues decreased by 5%, mainly due to lower sales volume.
Cost of goods sold – Total of R$ 2,358 million (+1 % vs 1Q25), mainly due to LPG higher cost resulting from the auctions held during the period, increase in ICMS, and higher costs related to the new energies segment, which were partially offset by the mark-to-market effect of energy futures contracts. Compared to 4Q25, COGS decreased by 3%, due to lower sales volume and the mark-to-market effect of energy futures contracts, partially offset by higher LPG costs and increase in ICMS rate.
Selling, general and administrative expenses – Total of R$ 260 million (+5% vs 1Q25), due to higher spending on services related to new energies and freight expenses. Compared to 4Q25, expenses decreased by 5%, reflecting lower spending on services and marketing campaigns.
|
1Q26 |
|
Result from disposal of assets – No relevant effects in 1Q26 and 1Q25. In 4Q25, there was a negative result of R$ 46 million, due to the write-off of the investment goodwill (impairment) of Stella, reflecting the expected results.
Other operating results – Total of R$ 2 million (vs R$ 16 million in 1Q25), mainly due to the reversal of the earn-out from the acquisition of Stella in 1Q25. Compared to 4Q25, there was an increase of R$ 8 million due to contractual adjustments carried out in 4Q25.
Recurring Adjusted EBITDA – Total of R$ 385 million (-2 % vs 1Q25), mainly reflecting higher LPG costs and reduction of R$ 14 million in the other operating results. Compared to 4Q25, recurring Adjusted EBITDA decreased by 19%, reflecting the typical seasonality between the periods, with lower volumes, in addition to higher LPG costs.
Investments – R$ 149 million was invested in 1Q26 (+73% vs 1Q25), mainly directed towards the expansion of bulk segment and biomethane, acquisition and replacement of bottles, evolution of the technology platform (focusing on the ERP replacement), and improvements related to infrastructure and safety.
R$ million
|
ULTRACARGO |
Quarter |
||||
|
1Q26 |
1Q25 |
4Q25 |
1Q26 x 1Q25 |
1Q26 x 4Q25 |
|
|
Installed capacity¹ (‘000 m³) |
1,152 |
1,067 |
1,131 |
8% |
2% |
|
m³ sold (‘000 m³) |
4,459 |
4,024 |
4,074 |
11% |
9% |
|
Net revenues |
276 |
271 |
261 |
2% |
6% |
|
Cost of service provided |
(118) |
(103) |
(120) |
15% |
-1% |
|
Gross profit |
158 |
167 |
141 |
-6% |
12% |
|
Gross margin (%) |
57% |
62% |
54% |
-4.6 p.p. |
3.1 p.p. |
|
Selling, general and administrative |
(42) |
(42) |
(38) |
1% |
11% |
|
Results from disposal of assets |
0 |
0 |
(1) |
165% |
-127% |
|
Other operating income (expenses), net |
2 |
2 |
(3) |
-23% |
-159% |
|
Adjusted EBITDA |
165 |
166 |
144 |
0% |
15% |
|
Adjusted EBITDA margin (%) |
60% |
61% |
55% |
-1.5 p.p. |
4.7 p.p. |
|
Adjusted EBITDA margin (R$/m³ capacity) |
48 |
52 |
42 |
-8% |
13% |
|
Depreciation and amortization² |
48 |
38 |
45 |
28% |
8% |
|
|
|
|
|
|
|
|
Adjusted LTM EBITDA |
584 |
669 |
585 |
-13% |
0% |
|
Adjusted LTM EBITDA margin (%) |
57% |
62% |
57% |
-4.8 p.p. |
-0.4 p.p. |
¹ Monthly average
² Includes amortization of fair value adjustments on associates acquisition
Operational performance – The average installed capacity increased by 8% compared to 1Q25, with the addition of 23 thousand m³ in Palmeirante, 22 thousand m³ in Rondonópolis, 34 thousand m³ in Santos, and 10 thousand m³ in Opla. The m3 sold increased by 11% in the period, reflecting a scenario of gradual recovery in demand for storage in fuel imports, supported by the reduction of market irregularities, particularly in Santos, as well as the ramp-up effect of newly installed capacities. The import parity environment with open windows in January and February favored volume throughput, while March was marked by higher volatility in the international market, impacting the pace of operations. Compared to 4Q25, installed capacity increased by 2%, reflecting the addition of 15 thousand m³ in Rondonópolis and 10 thousand m³ in Opla. The m3 sold increased by 9%, reflecting the same factors.
Net revenues – Total of R$ 276 million (+2% vs 1Q25), driven by higher m3 sold, highlighting Santos, Opla and Rondonópolis operations, partially offset by a less favorable sales mix in the period. Compared to 4Q25, net revenues increased by 6%, mainly due to the higher m3 sold.
Cost of services provided – Total of R$ 118 million (+15% vs 1Q25), reflecting higher m3 sold and higher personnel and depreciation costs following the completion of expansions projects. Compared to 4Q25, there was a 1% decrease.
|
1Q26 |
|
Selling, general and administrative expenses – Total of R$ 42 million, practically stable compared to 1Q25 (+1% vs 1Q25). Compared to 4Q25, expenses increased by 11%, mainly reflecting higher personnel expenses due to a higher variable compensation provisions – in line with the recovery in results.
Adjusted EBITDA – Total of R$ 165 million, stable compared to 1Q25, mainly due to the higher volume handled, partially offset by higher costs and expenses associated with the expansions currently in ramp-up. Compared to 4Q25, there was a 15% increase, mainly reflecting the higher volume handled and the ramp-up of the expansions.
Investments – R$ 86 million was invested in 1Q26 (-24% vs 1Q25), mainly allocated to capacity expansion projects, especially Itaqui and Suape.
|
HIDROVIAS DO BRASIL |
Quarter |
||||
|
1Q26 |
1Q25 |
4Q25 |
1Q26 x 1Q25 |
1Q26 x 4Q25 |
|
|
Total volume (thousand ton) |
3,202 |
4,161 |
3,593 |
-23% |
-11% |
|
Net Revenue |
445 |
541 |
507 |
-18% |
-12% |
|
Net operating revenue |
445 |
555 |
509 |
-20% |
-13% |
|
Hedge accounting |
- |
(14) |
(2) |
-100% |
-100% |
|
Operating costs |
(243) |
(251) |
(278) |
-3% |
-13% |
|
Depreciation and amortization (costs) |
(85) |
(89) |
(85) |
-4% |
0% |
|
Gross profit |
117 |
202 |
144 |
-42% |
-19% |
|
Gross margin (%) |
26% |
37% |
28% |
-11 p.p. |
-2 p.p. |
|
General and administrative |
(38) |
(54) |
(89) |
-30% |
-57% |
|
Depreciation and amortization (expenses) |
(7) |
(9) |
(7) |
-27% |
-4% |
|
Results from disposal of assets |
9 |
(34) |
(148) |
-126% |
-106% |
|
Other operating income (expenses), net |
18 |
7 |
(58) |
149% |
-131% |
|
Adjusted EBITDA |
194 |
221 |
(66) |
-12% |
n/a |
|
Adjusted EBITDA margin (%) |
44% |
40% |
-13% |
4 p.p. |
57 p.p. |
|
Non-recurring¹ |
(12) |
36 |
226 |
-132% |
-105% |
|
Recurring Adjusted EBITDA |
182 |
256 |
160 |
-29% |
14% |
|
Continuing operations |
182 |
235 |
147 |
-23% |
24% |
|
Discontinued operations |
- |
21 |
13 |
n/a |
n/a |
|
Recurring adjusted EBITDA margin (%) |
41% |
47% |
32% |
-6 p.p. |
9 p.p. |
|
Depreciation and amortization |
92 |
98 |
92 |
-6% |
0% |
|
|
|
|
|
|
|
|
Recurring Adjusted LTM EBITDA |
1,050 |
668 |
1,125 |
57% |
-7% |
|
Recurring Adjusted LTM EBITDA margin (%) |
45% |
38% |
46% |
7 p.p. |
-1 p.p. |
¹ Non-recurring items for 4Q25 are described in the EBITDA calculation table – page 2. Regarding the comparative periods, non-recurring items can be consulted directly in the Earnings Release, on the company’s website. Results Center - Hidrovias IR
The table above presents Hidrovias’ full results since January 2025, as disclosed by the company on its Investor Relations website. The figures were maintained as originally published, reflecting the complete quarterly results.
Operational performance – Total volume handled in 1Q26 was 3,202 thousand tons, (-23% vs 1Q25), mainly reflecting one-off loading challenges in the Northern Corridor due to challenges on the transport route, as well as the sale of the Coastal Navigation operation in November 2025. Despite the worse hydrological conditions in the South, volumes remained stable supported by the dredging and rock removal works carried out throughout last year, which enabled a higher number of trips. Considering continuing operations, volume handled decreased by 6% compared to 1Q25. Compared to 4Q25, volume decreased by 11%, reflecting the sale of the Coastal Navigation operation, the one-off challenges in the North Corridor, and the lower demand in Santos due to the usual seasonality of the business, partially offset by higher volumes handled in the Southern Corridor, also in line with the seasonality.
Net revenue (ex-hedge accounting) – Total of R$ 445 million, (-20% vs 1Q25), mainly reflecting lower volumes handled in operations in Brazil, especially in the Northern Corridor, as well as the effect of the completion of the sale of the Coastal Navigation operation. Considering continuing operations, net revenue decreased by 8% in the period. Compared to 4Q25, there was a 13% decrease, reflecting the same effects mentioned above.
Cost of services provided – Total of R$ 243 million (-3% vs 1Q25 and -13% vs 4Q25), mainly reflecting the lower cost base resulting from the sale of the Coastal Navigation operation, partially offset by higher costs associated with initiatives to mitigate the operational challenges observed during the period, in addition to the effects related to the higher number of trips in the Southern Corridor.
|
1Q26 |
|
General and administrative expenses – Total of R$ 38 million (-30% vs 1Q25 and -57% vs 4Q25), due to the effects of the sale of the Coastal Navigation operation and lower contingency provisions.
Recurring Adjusted EBITDA – Total of R$ 182 million (-29% vs 1Q25) reflecting one-off cargo intake challenges in the North Corridor and navigability issues in the South Corridor, as well as the sale of the Coastal Navigation operation, effects partially offset by a lower general and administrative expenses. Considering continuing operations, recurring Adjusted EBITDA decreased by 23% during the period. Compared to 4Q25, there was a 14% increase, primarily reflecting lower expenses.
Investments – R$ 37 million was invested in 1Q26, of which R$ 18 million was allocated to sustaining and R$ 19 million to expansion, mainly to the floating tipper station and floating crane, which will contribute to increased modular capacity in the North Corridor.
|
ULTRAPAR – Indebtedness |
Quarter |
||
|
1Q26 |
1Q25 |
4Q25 |
|
|
Cash and cash equivalents¹ |
9,053 |
5,994 |
9,408 |
|
Gross debt¹ |
(19,428) |
(13,556) |
(20,093) |
|
Leases payable |
(1,694) |
(1,482) |
(1,740) |
|
Derivative financial instruments¹ |
(205) |
- |
276 |
|
Net debt |
(12,275) |
(9,044) |
(12,148) |
|
Adjusted LTM EBITDA² |
8,029 |
5,370 |
7,267 |
|
Net debt/Adjusted LTM EBITDA² |
1.5x |
1.7x |
1.7x |
|
Draft discount for suppliers |
(1,150) |
(1,167) |
(4) |
|
Financial liabilities of customers (vendor) |
(55) |
(151) |
(74) |
|
Net debt + draft discount + vendor+ receivables |
(13,479) |
(10,362) |
(12,227) |
|
Average gross debt duration (years) |
3.1 |
3.3 |
3.2 |
|
Average cost of gross debt |
108% DI |
110% DI |
107% DI |
|
DI +1.1% |
DI +1.3% |
DI +0.9% |
|
|
Average cash yield (% DI)³ |
97% |
100% |
97% |
¹ Since 2Q25, the “Cash and cash equivalents” and “Gross debt” lines no longer present the balance of “Derivative financial instruments”. For further information, please see note 26 of Ultrapar’s financial statements
² Adjusted LTM EBITDA does not include extraordinary tax credits. With the consolidation of Hidrovias, Adjusted LTM EBITDA for 1Q26 and 4Q25 includes the effect of Hidrovias’ Adjusted EBITDA for the last 12 months (excluding the effects of impairment and result of coastal navigation) and excludes the effects of share of profit (loss) of subsidiaries, joint ventures and associates recorded at Ultrapar
³ Disregards funds invested abroad for debt protection
Ultrapar ended 1Q26 with net debt of R$ 12,275 million (1.5x Adjusted LTM EBITDA), compared to R$ 12,148 million (1.7x Adjusted LTM EBITDA) recorded in 4Q25. The increase in net indebtedness mainly reflected the higher working capital investment at Ipiranga, partially offset by the contracting of draft discount for suppliers transactions. The reduction in leverage, in turn, resulted from the growth in Adjusted LTM EBITDA during the period.
Considering the effects of draft discount for suppliers and vendor transactions, adjusted net debt totaled R$ 13,479 million in 1Q26, with leverage remaining stable compared to 4Q25 at 1.7x. The contracting of these transactions in the quarter was mainly associated with the significant increase in fuel prices following the outbreak of the Iran War as well as a higher level of imports to ensure market supply amid increased instability and volatility in the international market.
|
1Q26 |
|
Cash and maturity profile and breakdown of the gross debt (R$ million):
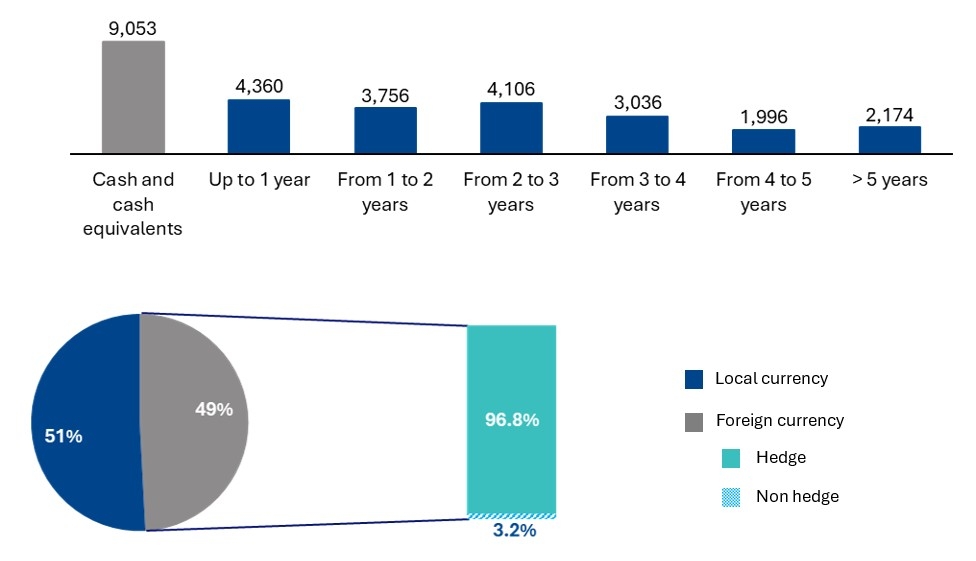
|
1Q26 |
|
Updates on sustainability themes
The Ultra Group and its companies continued to make consistent progress on their sustainability agenda, reinforcing the integration between strategy, governance, and long-term value creation. In March, we published the 2025 Sustainability Report, which presents the updated 2030 Sustainability Plan, the results of the double materiality assessment, and main advances across the economic, environmental, social, and governance pillars. The report highlights the evolution of corporate governance and the consolidation of the Ultra Management Model, reinforcing the holding company’s long-term vision and value creation for customers, shareholders, employees and other stakeholders.
Ipiranga advanced in strengthening its culture of integrity, with the launch of a structured training program for more than 53,000 VIPs (Vendedores Ipiranga de Pista), providing practical guidelines applicable to daily routine of service stations and aligned with the Group's values. The company also completed another cycle of its Safety Culture Diagnosis, based on the Hearts & Minds methodology, achieving the Proactive Level, reflecting risk anticipation and the consolidation of safety as a value integrated into the business strategy.
Iconic implemented a sustainable innovation solution in the lubricants sector, using polypropylene packaging containing 40% resin derived from used cooking oil through chemical recycling certified by ISCC Plus. The initiative combines technological innovation, industrial scale, and measurable environmental impact.
Ultragaz, in partnership with Natura, launched a pioneering biomethane solution that integrates industry and logistics, supplying 45% of the energy demand of the Cajamar plant and 100% of the dedicated fleet. The project embodies circular economy principles, contributes to emissions reduction, and reinforces the company's leading role in decarbonizing its operations.
Ultracargo earned, for the second consecutive year, a distinction placing it among the top 5% of companies globally rated by EcoVadis, improving by four points its score in comparison to the previous cycle. This result reflects significant progress, especially in the Sustainable Procurement pillar, which focuses on strengthening relationships with suppliers and partners.
Hidrovias do Brasil strengthened its governance agenda by deepening its ethical culture, through the update of its Code of Ethics, the review of corporate policies, and the expansion of integrity training for all employees, reinforcing standards of conduct and alignment with the Ultra Group guidelines.
R$ million
|
ULTRAPAR – Capital markets |
Quarter |
||
|
1Q26 |
1Q25 |
4Q25 |
|
|
Final number of shares (‘000 shares) |
1,115,850 |
1,115,507 |
1,115,850 |
|
Market cap¹ (R$ million) |
32,047 |
19,086 |
23,321 |
|
B3 |
|
|
|
|
Average daily trading volume (‘000 shares) |
6,504 |
6,688 |
7,412 |
|
Average daily financial volume (R$ thousand) |
166,217 |
111,021 |
159,386 |
|
Average share price (R$/share) |
25.56 |
16.60 |
21.50 |
|
NYSE |
|
|
|
|
Quantity of ADRs² (‘000 ADRs) |
70,253 |
66,273 |
70,253 |
|
Average daily trading volume (‘000 ADRs) |
2,399 |
1,694 |
1,989 |
|
Average daily financial volume (US$ thousand) |
11,872 |
4,961 |
7,885 |
|
Average share (US$/ADRs) |
4.95 |
2.93 |
3.97 |
|
Total |
|
|
|
|
Average daily trading volume (‘000 shares) |
8,903 |
8,382 |
9,401 |
|
Average daily financial volume (R$ thousand) |
228,416 |
139,841 |
201,847 |
1 Calculated on the closing share price for the period
2 1 ADR = 1 common share
|
1Q26 |
|
The average daily trading volume of Ultrapar’s shares, considering B3 and NYSE, was R$ 228 million/day in 1Q26 (+63% vs 1Q25). Ultrapar’s shares closed 1Q26 at R$ 28.72 on B3, up 37% in the quarter, while Ibovespa index appreciated by 16% in the same period. On the NYSE, Ultrapar’s shares rose 46%, while the Dow Jones index decreased by 4% in the quarter. At the end of 1Q26, Ultrapar reached a market cap of approximately R$ 32 billion.
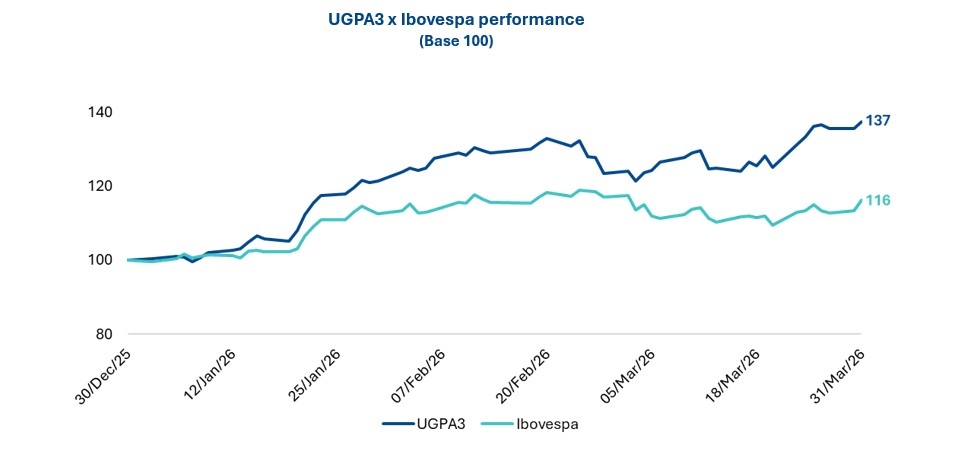
Source: Broadcast
1Q26 Conference call
Ultrapar will host a conference call with analysts and investors on May 7, 2026 to comment on the Company’s performance in the first quarter of 2026. The presentation will be available for download on the Company’s website 30 minutes prior to the start.
The conference call will be broadcast via zoom and conducted in Portuguese with simultaneous translation into English. Please connect 10 minutes in advance.
Conference call in Portuguese with simultaneous translation into English
Time: 11:00 (BRT) / 10:00 (EDT)
Access link via Zoom
Participants in Brazil and international: click here
|
1Q26 |
|
R$ million
|
ULTRAPAR – Balance sheet |
Mar 26 |
|
Mar 25 |
|
Dec 25 |
|
|
|
||||
|
ASSETS |
|
|
|
|
|
|
Cash and cash equivalents |
3,861 |
|
1,436 |
|
3,175 |
|
Financial investments and other financial assets |
3,298 |
|
1,301 |
|
3,852 |
|
Derivative instruments1 |
475 |
|
- |
|
127 |
|
Trade receivables and reseller financing |
4,758 |
|
4,065 |
|
4,277 |
|
Trade receivables - sale of subsidiaries |
- |
|
- |
|
- |
|
Inventories |
4,546 |
|
4,135 |
|
4,244 |
|
Recoverable taxes |
2,182 |
|
2,130 |
|
2,003 |
|
Energy trading futures contracts |
332 |
|
349 |
|
371 |
|
Prepaid expenses |
233 |
|
202 |
|
165 |
|
Contractual assets with customers – exclusive rights |
656 |
|
646 |
|
666 |
|
Others |
454 |
|
309 |
|
295 |
|
Assets held for sale |
- |
|
- |
|
- |
|
Total current assets |
20,796 |
|
14,574 |
|
19,176 |
|
Financial investments and other financial assets |
1,894 |
|
3,256 |
|
2,382 |
|
Derivative instruments¹ |
567 |
|
- |
|
773 |
|
Trade receivables and reseller financing |
779 |
|
741 |
|
834 |
|
Deferred income and social contribution taxes |
1,039 |
|
869 |
|
1,007 |
|
Recoverable taxes |
3,873 |
|
2,763 |
|
4,064 |
|
Energy trading futures contracts |
800 |
|
382 |
|
724 |
|
Escrow deposits |
491 |
|
402 |
|
472 |
|
Prepaid expenses |
83 |
|
43 |
|
81 |
|
Contractual assets with customers - exclusive rights |
1,503 |
|
1,456 |
|
1,519 |
|
Related parties |
55 |
|
52 |
|
105 |
|
Other receivables |
275 |
|
224 |
|
278 |
|
Investments in subsidiaries, joint ventures and associates |
654 |
|
2,025 |
|
521 |
|
Right-of-use assets |
1,902 |
|
1,644 |
|
1,929 |
|
Property, plant and equipment |
12,085 |
|
7,251 |
|
12,167 |
|
Intangible assets |
3,421 |
|
2,074 |
|
3,316 |
|
Total non-current assets |
29,422 |
|
23,180 |
|
30,173 |
|
Total assets |
50,217 |
|
37,755 |
|
49,349 |
|
LIABILITIES |
|
|
|
|
|
|
Trade payables |
3,313 |
|
2,367 |
|
4,643 |
|
Trade payables - draft discount for suppliers |
1,150 |
|
1,167 |
|
4 |
|
Loans, financing and debentures |
4,360 |
|
2,582 |
|
4,251 |
|
Derivative instruments¹ |
819 |
|
- |
|
246 |
|
Salaries and related charges |
462 |
|
371 |
|
577 |
|
Taxes payable |
749 |
|
329 |
|
596 |
|
Leases payable |
308 |
|
319 |
|
344 |
|
Energy trading futures contracts |
255 |
|
285 |
|
303 |
|
Financial liabilities of customers (vendor) |
47 |
|
102 |
|
63 |
|
Dividends payable |
26 |
|
48 |
|
23 |
|
Others |
989 |
|
729 |
|
797 |
|
Liabilities held for sale |
- |
|
- |
|
- |
|
Total current liabilities |
12,479 |
|
8,299 |
|
11,847 |
|
Loans, financing and debentures |
15,068 |
|
10,973 |
|
15,842 |
|
Derivative instruments¹ |
591 |
|
- |
|
335 |
|
Energy trading futures contracts |
449 |
|
147 |
|
431 |
|
Provision for tax, civil and labor risks |
475 |
|
602 |
|
485 |
|
Post-employment benefits |
197 |
|
203 |
|
197 |
|
Leases payable |
1,386 |
|
1,163 |
|
1,396 |
|
Financial liabilities of customers (vendor) |
8 |
|
49 |
|
11 |
|
Others |
1,054 |
|
427 |
|
1,074 |
|
Total non-current liabilities |
19,228 |
|
13,565 |
|
19,771 |
|
Total liabilities |
31,707 |
|
21,864 |
|
31,618 |
|
EQUITY |
|
|
|
|
|
|
Share capital |
7,987 |
|
6,622 |
|
7,987 |
|
Reserves |
8,283 |
|
8,604 |
|
8,283 |
|
Treasury shares |
(821) |
|
(711) |
|
(823) |
|
Others |
1,022 |
|
681 |
|
219 |
|
Non-controlling interests |
2,039 |
|
695 |
|
2,064 |
|
Total equity |
18,510 |
|
15,890 |
|
17,731 |
|
Total liabilities and equity |
50,217 |
|
37,755 |
|
49,349 |
|
|
|
|
|
|
|
|
Cash and cash equivalents¹ |
9,053 |
|
5,994 |
|
9,408 |
|
Gross debt¹ |
(19,428) |
|
(13,556) |
|
(20,093) |
|
Derivative financial instruments¹ |
(205) |
|
- |
|
276 |
|
Leases Payable |
(1,694) |
|
(1,482) |
|
(1,740) |
|
Net debt |
(12,275) |
|
(9,044) |
|
(12,148) |
1 In 2Q25, the “cash and cash equivalent” and “gross debt” lines no longer included the balance of derivate instruments
|
1Q26 |
|
|
ULTRAPAR - Income statement |
1Q26 |
|
1Q25 |
|
4Q25 |
Continued Op. |
Discontinued Op. |
|
|
|
||||||
|
Net revenues from sales and services |
36,752 |
|
33,329 |
|
37,973 |
37,951 |
21 |
|
Cost of products sold and services provided |
(33,578) |
|
(31,188) |
|
(35,372) |
(35,359) |
(13) |
|
Gross profit |
3,174 |
|
2,142 |
|
2,600 |
2,592 |
8 |
|
Operating revenues (expenses) |
|
|
|
|
|
|
|
|
Selling and marketing |
(664) |
|
(602) |
|
(664) |
(664) |
- |
|
General and administrative |
(656) |
|
(518) |
|
(622) |
(622) |
1 |
|
Results from disposal of assets |
0 |
|
5 |
|
(100) |
66 |
(165) |
|
Other operating income (expenses), net |
(23) |
|
(87) |
|
(131) |
(132) |
2 |
|
Operating income |
1,832 |
|
941 |
|
1,084 |
1,239 |
(154) |
|
Financial results |
|
|
|
|
|
|
|
|
Financial income |
979 |
|
177 |
|
387 |
386 |
1 |
|
Financial expenses |
(1,377) |
|
(357) |
|
(943) |
(941) |
(1) |
|
Total share of profit (loss) of subsidiaries, joint ventures and associates |
|
|
|
|
|
|
|
|
Share of profit (loss) of subsidiaries, joint ventures and associates |
(20) |
|
(149) |
|
(40) |
(40) |
- |
|
Amortization of fair value adjustments on associates acquisition |
(0) |
|
(0) |
|
(0) |
(0) |
- |
|
Gain (loss) on obtaining control of an affiliate |
- |
|
- |
|
- |
- |
- |
|
Income before taxes and social contribution taxes |
1,412 |
|
611 |
|
488 |
643 |
(155) |
|
Income and social contribution taxes |
|
|
|
|
|
|
|
|
Current |
(492) |
|
(164) |
|
(329) |
(331) |
2 |
|
Deferred |
(6) |
|
(83) |
|
96 |
127 |
(30) |
|
Net income |
914 |
|
363 |
|
256 |
439 |
(183) |
|
Net income attributable to: |
|
|
|
|
|
|
|
|
Shareholders of Ultrapar |
876 |
|
333 |
|
323 |
323 |
- |
|
Non-controlling interests in subsidiaries |
39 |
|
30 |
|
(68) |
(68) |
- |
|
|
|
|
|
|
|
|
|
|
Adjusted EBITDA |
2,324 |
|
1,188 |
|
1,562 |
1,715 |
(152) |
|
Non-recurring¹ |
(4) |
|
(5) |
|
182 |
(44) |
226 |
|
Recurring Adjusted EBITDA |
2,320 |
|
1,183 |
|
1,745 |
1,671 |
74 |
|
Depreciation and amortization² |
582 |
|
406 |
|
563 |
563 |
- |
|
Total invesments³ |
558 |
|
416 |
|
826 |
826 |
- |
|
MTM of energy futures contracts |
(69) |
|
(9) |
|
(46) |
(46) |
- |
|
Cash flow hedge |
- |
|
- |
|
2 |
- |
2 |
|
|
|
|
|
|
|
|
|
|
Ratios |
|
|
|
|
|
|
|
|
Earnings per share (R$) |
0.82 |
|
0.30 |
|
0.30 |
|
|
|
Net debt / Adjusted LTM EBITDA4 |
1.5x |
|
1.7x |
|
1.7x |
|
|
|
Gross margin (%) |
8.6% |
|
6.4% |
|
6.8% |
|
|
|
Operating margin (%) |
5.0% |
|
2.8% |
|
2.9% |
|
|
|
Adjusted EBITDA margin (%) |
6.3% |
|
3.6% |
|
4.1% |
|
|
|
Recurring Adjusted EBITDA margin (%) |
6.3% |
|
3.5% |
|
4.6% |
|
|
|
Number of employees |
11,481 |
|
9,209 |
|
11,302 |
|
|
1Non-recurring items described in the EBITDA calculation table – page 2
2Includes amortization of contractual assets with customers – exclusive rights and amortization of fair value adjustments on associates acquisition
3Includes property, plant and equipment and additions to intangible assets (net of divestitures), contractual assets with customers (exclusive rights), initial direct costs of assets with right of use, contributions made to SPEs (Specific Purpose Companies), payment of grants, financing of clients, rental advances (net of receipts), acquisition of shareholdings and payments of leases
4 Adjusted LTM EBITDA does not include closing adjustments from the sale of Extrafarma and extraordinary tax credits
|
1Q26 |
|
R$ million
|
ULTRAPAR – Cash flows |
Quarter |
|
|
1Q26 |
1Q25 |
|
|
Cash flows from operating activities |
|
|
|
Net income |
914 |
363 |
|
Adjustments to reconcile net income to cash provided (consumed) by operating activities |
|
|
|
Share of profit (loss) of subsidiaries, joint ventures and associates and amortization of fair value adjustments on associates acquisition |
21 |
149 |
|
Amortization of contractual assets with customers - exclusive rights |
147 |
105 |
|
Amortization of right-of-use assets |
88 |
78 |
|
Depreciation and amortization |
350 |
226 |
|
Interest and foreign exchange rate variations |
675 |
231 |
|
Current and deferred income and social contribution taxes |
498 |
248 |
|
Gain (loss) on disposal or write-off of property, plant and equipment, intangible assets and other assets |
(0) |
(16) |
|
Equity instrument granted |
20 |
15 |
|
Fair value result of energy contracts |
(69) |
(9) |
|
Provision for decarbonization - CBios |
57 |
116 |
|
Provisions for tax, civil and labor risks |
3 |
4 |
|
Other provisions and adjustments |
23 |
(2) |
|
Cash flow from operating activities before changes in working capital |
2,725 |
1,511 |
|
(Increase) decrease in assets |
|
|
|
Trade receivables and reseller financing |
(455) |
21 |
|
Inventories |
(297) |
(216) |
|
Recoverable taxes |
47 |
295 |
|
Dividends received from subsidiaries, associates and joint ventures |
0 |
1 |
|
Other assets |
(239) |
(17) |
|
Increase (decrease) in liabilities |
|
|
|
Trade payables and trade payables - draft discount for suppliers |
(188) |
(998) |
|
Salaries and related charges |
(115) |
(110) |
|
Taxes payable |
10 |
17 |
|
Income and social contribution taxes payable |
(217) |
(305) |
|
Other liabilities |
177 |
50 |
|
|
|
|
|
Acquisition of CBios and carbon credits |
(81) |
(153) |
|
Payments of contractual assets with customers - exclusive rights |
(116) |
(58) |
|
Payment of contingencies |
(19) |
(9) |
|
Income and social contribution taxes paid |
(131) |
(25) |
|
Net cash generated (consumed) by operating activities |
1,103 |
3 |
|
Cash flows from investing activities |
|
|
|
Financial investments, net of redemptions |
1,093 |
1,244 |
|
Acquisition of property, plant and equipment and intangible assets |
(368) |
(382) |
|
Sale of investments and other assets |
4 |
14 |
|
Capital increase and decrease in subsidiaries, associates and joint ventures |
(150) |
- |
|
Acquisition of investments and other assets |
(152) |
(50) |
|
Cash acquired in business combination |
0 |
- |
| Related parties | 31 | (3) |
|
Net cash provided (consumed) by investing activities |
458 |
824 |
|
Cash flows from financing activities |
|
|
|
Loans, financing and debentures |
|
|
|
Proceeds |
1,108 |
1,682 |
|
Repayments |
(1,194) |
(2,077) |
|
Interest and derivatives (paid) or received |
(557) |
(337) |
|
Payments of leases |
(145) |
(87) |
|
Dividends paid |
(2) |
(488) |
|
Payments of financial liabilities of customers |
(21) |
(35) |
|
Capital increase made by non-controlling shareholders and redemption of shares |
13 |
- |
|
Share buyback for treasury |
- |
(97) |
|
Net cash provided (consumed) by financing activities |
(798) |
(1,439) |
|
Effect of exchange rate changes on cash and cash equivalents in foreign currency |
(77) |
(23) |
|
Increase (decrease) in cash and cash equivalents |
685 |
(636) |
|
|
|
|
|
Cash and cash equivalents at the beginning of the period |
3,175 |
2,072 |
|
|
|
|
|
Cash and cash equivalents at the end of the period |
3,861 |
1,436 |
|
|
|
|
|
|
|
|
|
Non-cash transactions |
|
|
|
Addition and remeasurement on right-of-use assets and leases payable |
72 |
77 |
|
Capital increase in associates through loan |
28 |
- |
|
Addition on contractual assets with customers - exclusivity rights |
6 |
17 |
|
Acquisition of property, plant and equipment and intangible assets without cash effect |
2 |
- |
|
Share buyback |
- |
17 |
|
1Q26 |
|
Starting from 1Q25, the concept of operating capital has been adjusted to reflect all balances of operational assets and liabilities from management's perspective, including primarily the balances of current and deferred income tax.
R$ million
|
IPIRANGA - Employed capital |
Mar 26 |
Mar 25 |
Dec 25 |
|
Operating assets |
|
|
|
|
Trade receivables and reseller financing |
4,603 |
4,087 |
4,290 |
|
Inventories |
4,188 |
3,926 |
3,883 |
| Taxes |
5,195 |
4,192 |
5,261 |
|
Recoverable income and social contribution taxes |
379 |
369 |
379 |
|
Judicial deposits |
343 |
329 |
327 |
|
Deferred income and social contribution taxes |
688 |
593 |
591 |
|
Others |
610 |
537 |
441 |
|
Contractual assets with customers - exclusive rights |
2,160 |
2,102 |
2,185 |
|
Right-of-use assets (leases) |
807 |
884 |
827 |
|
Investments |
115 |
141 |
103 |
|
Property, plant and equipment |
3,427 |
3,302 |
3,429 |
|
Intangible |
1,409 |
1,191 |
1,278 |
|
Total operating assets |
23,924 |
21,653 |
22,993 |
|
Operating liabilities |
|
|
|
|
Trade payables and draft discount for suppliers |
3,916 |
3,198 |
4,069 |
|
Salaries and related charges |
223 |
195 |
286 |
|
Post-employment benefits |
215 |
221 |
211 |
|
Taxes |
147 |
126 |
135 |
|
Income and social contribution taxes payable |
431 |
93 |
212 |
|
Deferred income and social contribution taxes |
5 |
2 |
4 |
|
Provisions for tax, civil, and labor risks |
350 |
416 |
341 |
|
Leases payable |
682 |
730 |
692 |
|
Financial liabilities of customers (vendor) |
55 |
151 |
74 |
|
Provision for decarbonization credit |
56 |
96 |
(0) |
|
Others |
841 |
605 |
682 |
|
Total operating liabilities |
6,922 |
5,833 |
6,706 |
|
|
|
|
|
|
|
|
|
|
|
Number of service stations |
5,826 |
5,847 |
5,805 |
|
Number of employees |
4,653 |
4,130 |
4,499 |
|
1Q26 |
|
Starting from 1Q25, the concept of operating capital has been adjusted to reflect all balances of operational assets and liabilities from management's perspective, including primarily the balances of current and deferred income tax.
R$ million
|
ULTRAGAZ - Employed capital |
Mar 26 |
Mar 25 |
Dec 25 |
|
Operating Assets |
|
|
|
|
Trade receivables |
723 |
678 |
673 |
|
Inventories |
207 |
195 |
204 |
|
Taxes |
131 |
220 |
126 |
| Recoverable income and social contribution taxes |
26 |
32 |
27 |
|
Judicial deposits |
47 |
48 |
47 |
|
Deferred income and social contribution taxes |
100 |
80 |
128 |
|
Others |
121 |
157 |
91 |
|
Right-of-use assets (leases) |
179 |
147 |
187 |
|
Investments |
4 |
5 |
4 |
|
Property, plant and equipment, net |
1,713 |
1,575 |
1,667 |
|
Intangible assets, net |
292 |
327 |
275 |
|
Total Operating Assets |
3,543 |
3,464 |
3,428 |
|
Operating Liabilities |
|
|
|
|
Trade payables |
306 |
245 |
280 |
|
Salaries and related charges |
118 |
111 |
126 |
|
Taxes |
31 |
24 |
21 |
|
Income and social contribution taxes payable |
35 |
35 |
95 |
|
Deferred income and social contribution taxes |
143 |
117 |
119 |
|
Provisions for tax, civil, and labor risks |
16 |
16 |
16 |
|
Leases payable |
216 |
184 |
223 |
|
Others |
125 |
199 |
130 |
|
Total Operating Liabilities |
990 |
932 |
1,011 |
|
|
|
|
|
|
|
|
|
|
|
Number of employees |
3,692 |
3,736 |
3,694 |
|
1Q26 |
|
R$ million
|
ULTRACARGO - Employed capital |
Mar 26 |
Mar 25 |
Dec 25 |
|
Operating Assets |
|
|
|
|
Trade receivables |
62 |
44 |
49 |
|
Inventories |
14 |
14 |
13 |
|
Taxes |
0 |
2 |
2 |
|
Recoverable income and social contribution taxes |
35 |
49 |
34 |
|
Judicial deposits |
10 |
9 |
9 |
|
Deferred income and social contribution taxes |
25 |
36 |
34 |
|
Others |
26 |
38 |
25 |
|
Right-of-use assets (leases) |
621 |
606 |
621 |
|
Investments |
239 |
217 |
239 |
|
Property, plant and equipment, net |
2,606 |
2,296 |
2,596 |
|
Intangible assets, net |
286 |
283 |
286 |
|
Total Operating Assets |
3,924 |
3,592 |
3,907 |
|
Operating Liabilities |
|
|
|
|
Trade payables |
59 |
71 |
104 |
|
Salaries and related charges |
32 |
34 |
42 |
|
Taxes |
16 |
15 |
16 |
|
Income and social contribution taxes payable |
10 |
33 |
14 |
|
Deferred income and social contribution taxes |
2 |
(0) |
(0) |
|
Provisions for tax, civil, and labor risks |
11 |
28 |
12 |
|
Leases payable |
540 |
560 |
571 |
|
Others |
93 |
23 |
24 |
|
Total Operating Liabilities |
763 |
765 |
782 |
|
|
|
|
|
|
|
|
|
|
|
Number of employees |
874 |
846 |
859 |
|
1Q26 |
|
The balances of Hidrovias consider the effects of the business combination, including the fair value adjustments and capital loss of assets and liabilities, and thus differ from the information disclosed by Hidrovias to the market.
R$ million
|
HIDROVIAS - Employed capital |
Mar 26 |
Dec 25 |
|
Operating Assets |
|
|
|
Trade receivables |
149 |
101 |
|
Inventories |
137 |
144 |
|
Taxes |
10 |
10 |
|
Recoverable income and social contribution taxes |
212 |
187 |
|
Judicial deposits |
76 |
73 |
|
Deferred income and social contribution taxes |
77 |
74 |
|
Others |
224 |
217 |
|
Right-of-use assets (leases) |
290 |
289 |
|
Investments |
132 |
136 |
|
Property, plant and equipment, net |
4,203 |
4,341 |
|
Intangible assets, net |
1,159 |
1,201 |
|
Total Operating Assets |
6,667 |
6,772 |
|
Operating Liabilities |
|
|
|
Trade payables |
140 |
140 |
|
Salaries and related charges |
51 |
75 |
|
Taxes |
50 |
64 |
|
Income and social contribution taxes payable |
23 |
31 |
|
Deferred income and social contribution taxes |
515 |
515 |
|
Provisions for tax, civil, and labor risks |
9 |
33 |
|
Leases payable |
250 |
247 |
|
Others |
146 |
243 |
|
Total Operating Liabilities |
1,185 |
1,347 |
|
|
|
|
|
|
|
|
|
Number of employees |
1,711 |
1,732 |
(Minutes of the Meeting of the Board of Directors of Ultrapar Participações S.A., held on May 6th, 2026)
ULTRAPAR PARTICIPAÇÕES S.A.
Publicly Traded Company
|
CNPJ nº 33.256.439/0001-39 |
NIRE 35.300.109.724 |
Date, Hour and Place:
May 6th, 2026, at 10:00 a.m., at ULTRAPAR PARTICIPAÇÕES S.A. (“Company”) headquarters, located at Brigadeiro Luís Antônio Avenue, Nr. 1.343, 9th floor, in the City and State of São Paulo, also contemplating participation through Microsoft Teams.
Members in attendance:
(i) Members of the Board of Directors undersigned; (ii) the Secretary of the Board of Directors, Ms. Denize Sampaio Bicudo; (iii) Chief Executive Officer, Mr. Rodrigo de Almeida Pizzinatto; (iv) Chief Financial and Investor Relations Officer, Mr. Alexandre Mendes Palhares; and (v) the Executive Officers of the Company Businesses, Mrs. Décio de Sampaio Amaral, Fulvius Tomelin, Leonardo Remião Linden and Tabajara Bertelli Costa.
Matter discussed and resolution:
- After having analyzed and discussed the performance of the Company in the first quarter of the current fiscal year, the respective financial statements were approved.
Notes:
The resolutions were approved, with no amendments or qualifications, by all Board members.
There being no further matters to discuss, the meeting was concluded, and these minutes were written, read, passed, and signed by all the Board members present.
MARCOS MARINHO LUTZ – Chairman
JORGE MARQUES DE TOLEDO CAMARGO – Vice-Chairman
FABIO VENTURELLI
FRANCISCO DE SÁ NETO
FLÁVIA BUARQUE DE ALMEIDA
JOSÉ MAURICIO PEREIRA COELHO
MARCELO FARIA DE LIMA
PETER PAUL LORENÇO ESTERMANN
VÂNIA MARIA LIMA NEVES
DENIZE SAMPAIO BICUDO – Secretary of the Meeting
SIGNATURES
Pursuant to the requirements of the Securities Exchange Act of 1934, the registrant has duly caused this report to be signed on its behalf by the undersigned, thereunto duly authorized.
Date: May 6, 2026
| ULTRAPAR HOLDINGS INC. |
||
| By: | /s/ Alexandre Mendes Palhares | |
| Name: | Alexandre Mendes Palhares | |
| Title: | Chief Financial and Investor Relations Officer | |