Please wait
MANAGEMENT'S
DISCUSSION
AND ANALYSIS
| | | | | | | | | | | |
| | | |
| A. HOW WE REPORT OUR RESULTS | | J. CAPITAL AND LIQUIDITY MANAGEMENT |
| | | 1. Capital |
| B. OVERVIEW | | 2. Capital Adequacy |
| 1. Strategy | | 3. Shareholder Dividends |
| 2. Financial Objectives | | 4. Principal Sources and Uses of Funds |
| 3. Acquisitions and Other | | 5. Liquidity |
| | | |
| C. FINANCIAL SUMMARY | | K. RISK MANAGEMENT |
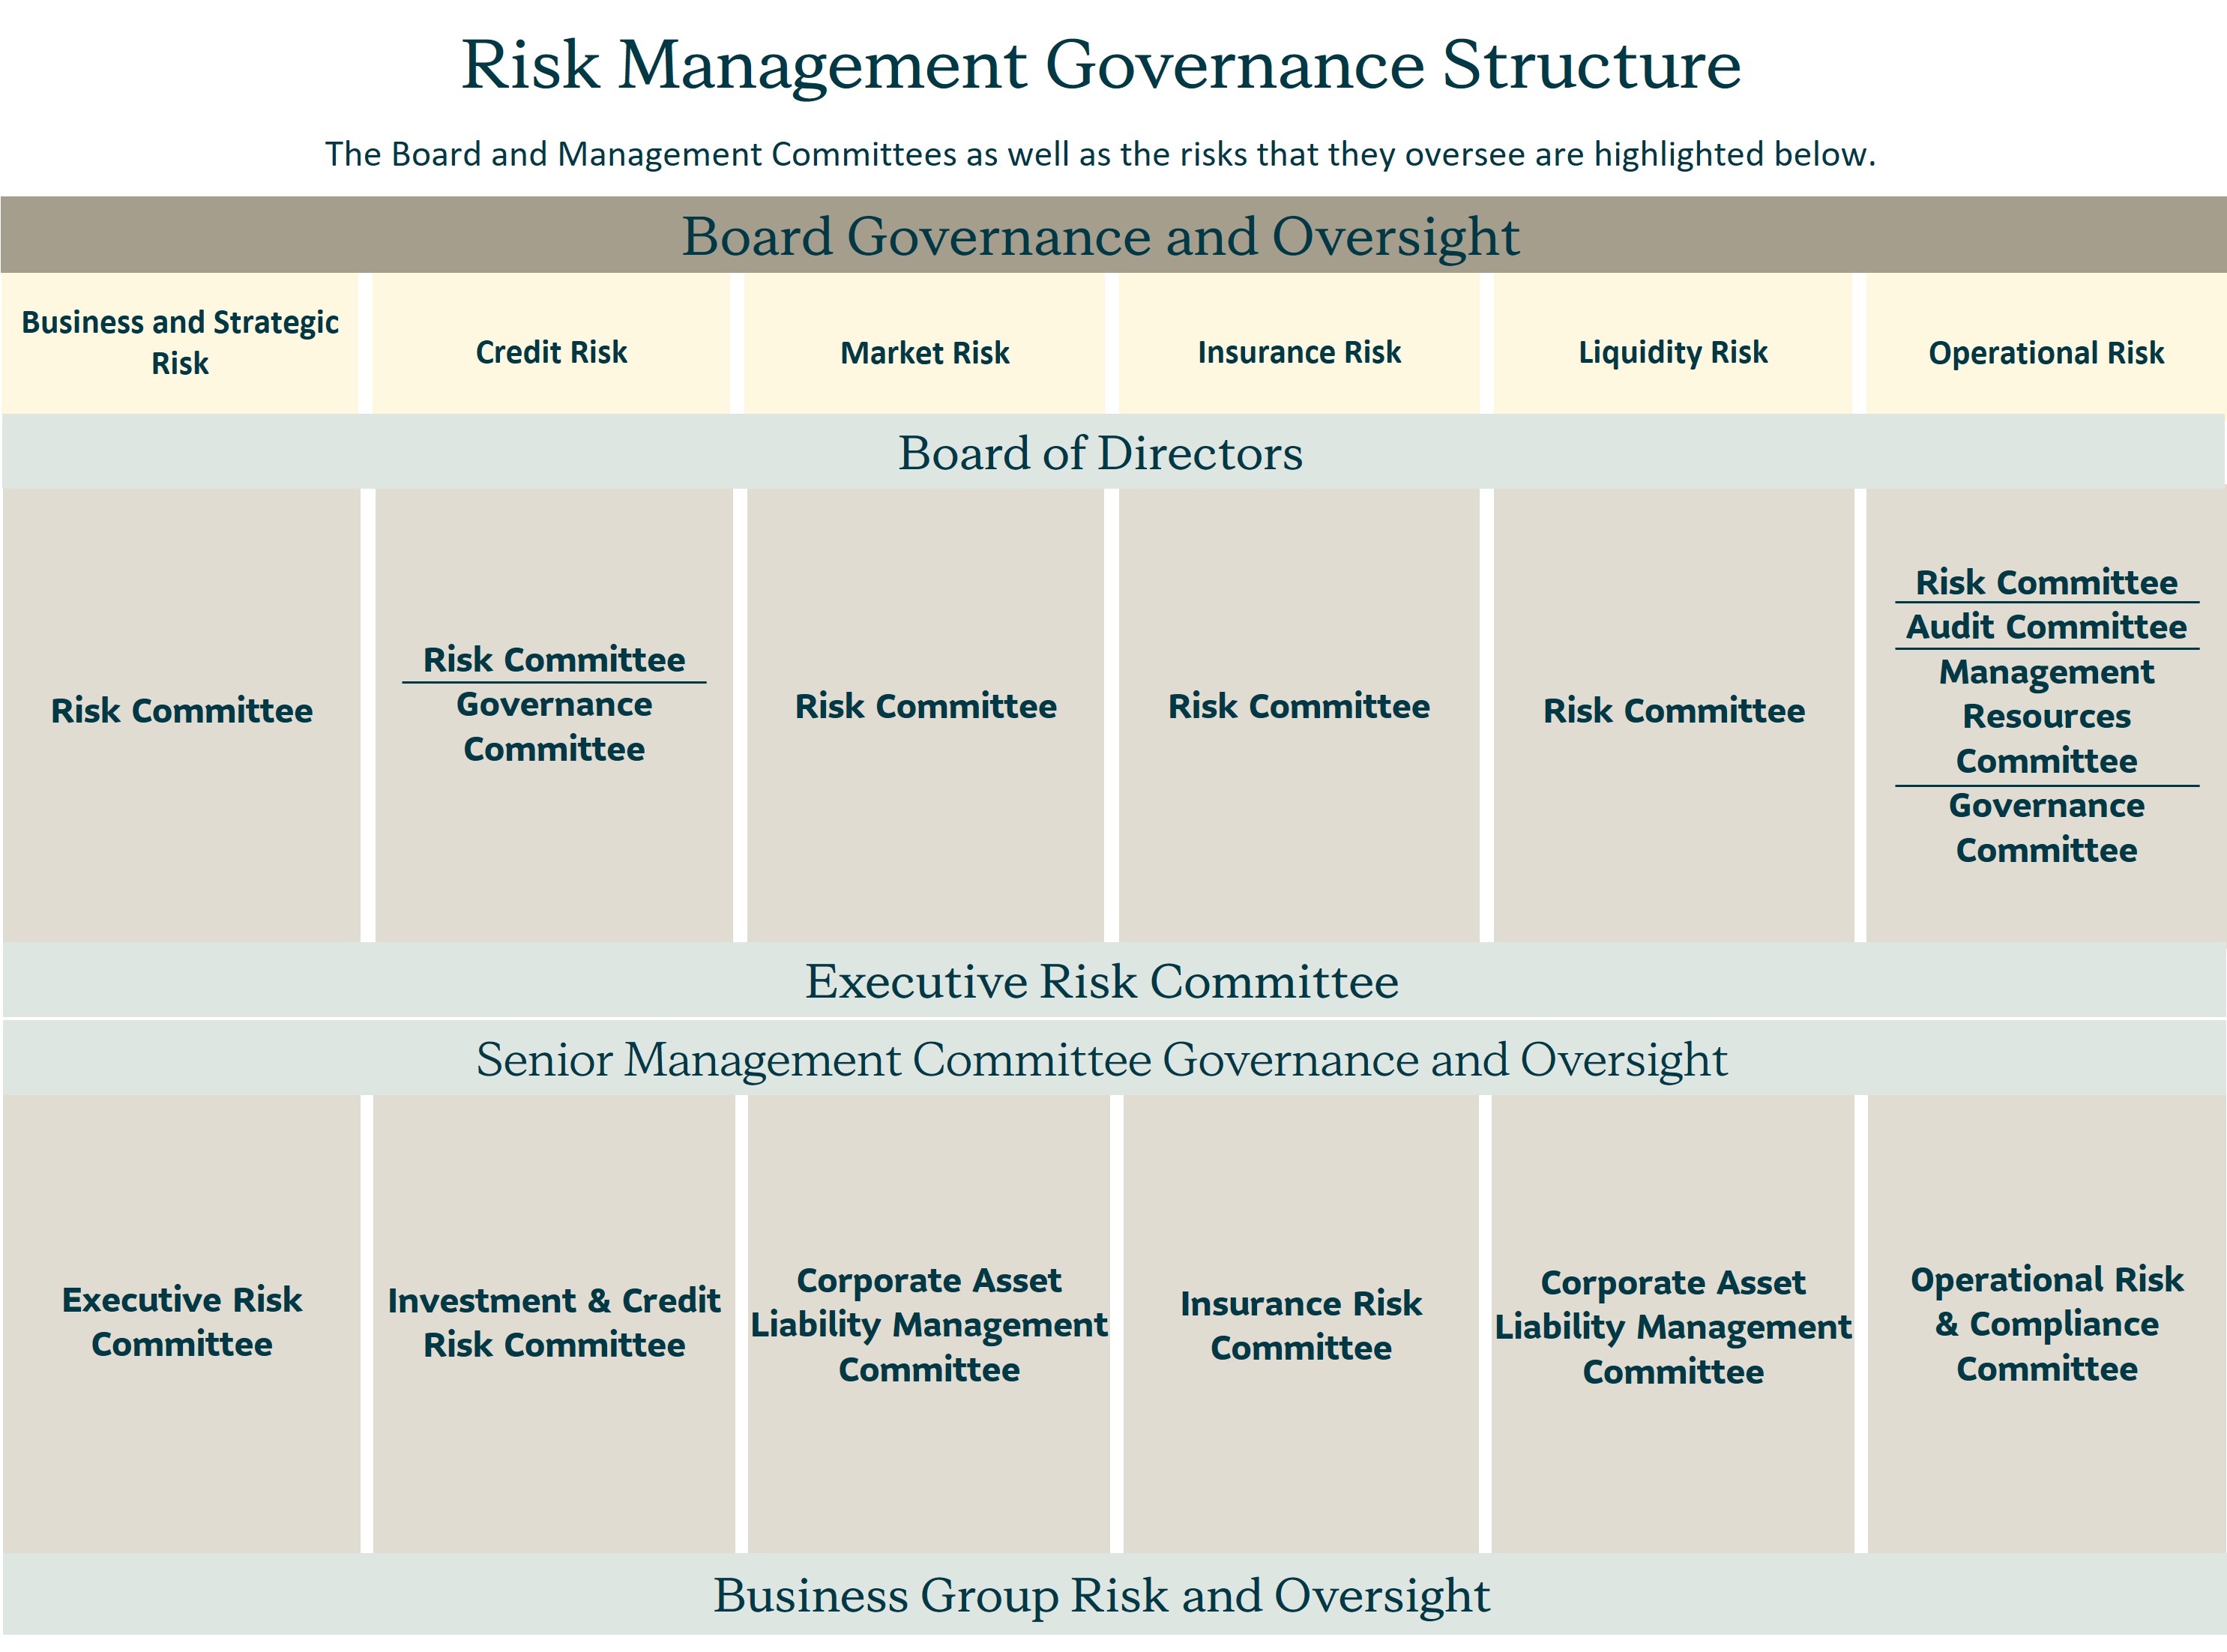
| | | 1. Risk Management Framework |
| D. PROFITABILITY | | 2. Risk Governance |
| | | 3. Risk Universe |
| E. GROWTH | | 4. Risk Appetite |
| 1. Sales, Gross Flows and Value of New Business | | 5. Risk Management Policies |
| 2. Assets Under Management | | 6. Risk Management Process |
| | | 7. Three Lines of Defence |
| F. CONTRACTUAL SERVICE MARGIN | | 8. Culture and Managing Risk |
| | | 9. Risk Categories |
| G. FINANCIAL STRENGTH | | |
| | | L. ADDITIONAL FINANCIAL DISCLOSURE |
| H. PERFORMANCE BY BUSINESS GROUP | | 1. Selected Annual Information |
| 1. Asset Management | | 2. Items related to Statement of Operations |
| 2. Canada | | 3. Items related to Statement of Financial Position |
| 3. U.S. | | 4. Fourth Quarter 2025 Profitability |
| 4. Asia | | 5. Fourth Quarter 2025 Growth |
| 5. Corporate | | 6. Previous Quarters |
| | | |
| I. INVESTMENTS | | M. NON-IFRS FINANCIAL MEASURES |
| 1. Investment Profile | | |
| 2. Debt Securities | | N. ACCOUNTING AND CONTROL MATTERS |
| 3. Equities | | 1. Critical Accounting Policies and Estimates |
| 4. Mortgages and Loans | | 2. Changes in Accounting Policies |
| 5. Derivatives | | 3. Disclosure Controls and Procedures |
| 6. Investment Properties | | |
| 7. Loss Allowance and Provision for Credit Loss | | O. LEGAL AND REGULATORY PROCEEDINGS |
| | | |
| | | P. FORWARD-LOOKING STATEMENTS |
| | | |
| | | |
| | | |
| | | | | | | | | | | | | | | | | | | | |
| MANAGEMENT'S DISCUSSION & ANALYSIS | | Sun Life Financial Inc. | December 31, 2025 | 1 |
| | |
Management's Discussion and Analysis |
February 11, 2026
| | | | | |
| A. How We Report Our Results | |
Sun Life is a leading international financial services organization providing asset management, wealth, insurance and health solutions to individual and institutional Clients. Sun Life has operations in a number of markets worldwide including Canada, the United States, the United Kingdom, Ireland, Hong Kong, the Philippines, Japan, Indonesia, India, China, Australia, Singapore, Vietnam, Malaysia, and Bermuda. As of December 31, 2025, Sun Life had total assets under management ("AUM") of $1.60 trillion. For more information, please visit www.sunlife.com.
Sun Life Financial Inc. trades on the Toronto (TSX), New York (NYSE) and Philippine (PSE) stock exchanges under the ticker symbol SLF.
Sun Life Financial Inc. ("SLF Inc.") is a publicly traded company domiciled in Canada and is the holding company of Sun Life Assurance Company of Canada ("Sun Life Assurance"). In this management's discussion and analysis ("MD&A"), SLF Inc., its subsidiaries and, where applicable, its joint ventures and associates are collectively referred to as "the Company", "Sun Life", "we", "our", and "us". Unless otherwise indicated, all information in this MD&A is presented as at and for the year ended December 31, 2025 and the information contained in this document is in Canadian dollars. Amounts in this document may be impacted by rounding.
Where information at and for the year ended December 31, 2025 is not available, information available for the latest period before December 31, 2025 is used. Except where otherwise noted, financial information is presented in accordance with International Financial Reporting Standards ("IFRS") and the accounting requirements of the Office of the Superintendent of Financial Institutions ("OSFI"). Reported net income (loss) refers to Common shareholders' net income (loss) determined in accordance with IFRS.
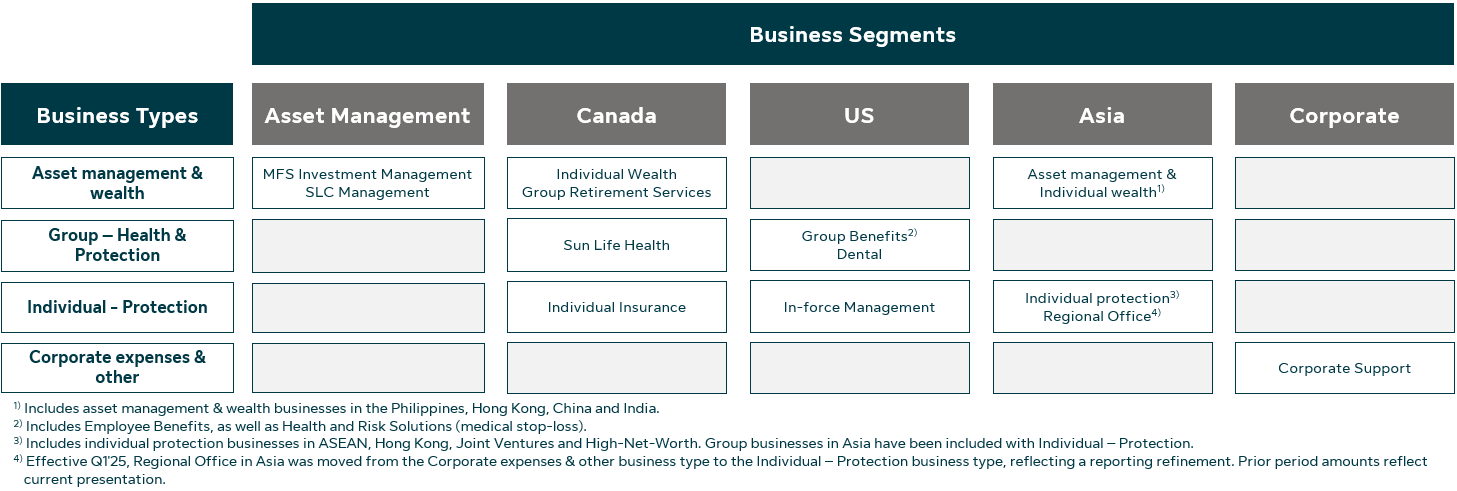
We manage our operations and report our financial results in five business segments: Asset Management, Canada, United States ("U.S."), Asia, and Corporate. Information concerning these segments is included in our annual and interim consolidated financial statements and accompanying notes ("Annual Consolidated Financial Statements" and "Interim Consolidated Financial Statements", respectively, and "Consolidated Financial Statements" collectively), and this MD&A document.
Underlying net income by Business Types
Sun Life has a diversified mix of businesses and our earnings by business type supports the analysis of our results:
•Asset management & wealth(1): Sun Life’s asset management & wealth businesses generate fee income and/or spread on investment products.
•Group - Health & Protection: Group businesses provide health and protection benefits to employer and government plan members. The products generally have shorter-term coverage periods, and more frequent repricing. The revenues are driven by premiums for coverage provided as well as fee-based earnings (i.e., Administrative Services Only plans, and dental fees).
•Individual - Protection: Generally, individual protection businesses have a longer-term profitability profile and are more sensitive to experience trends. The premiums include a margin for providing protection and are invested to earn a return over the expected amounts required to fulfill insurance liabilities.
The following provides an overview of the business types in Sun Life's business segments/business groups:
(1)Effective Q1'25, the Wealth & asset management business type was renamed to Asset management & wealth.
| | | | | | | | | | | | | | | | | | | | |
2 | December 31, 2025 | Sun Life Financial Inc. | | MANAGEMENT'S DISCUSSION & ANALYSIS | |
1. Use of Non-IFRS Financial Measures
We report certain financial information using non-IFRS financial measures, as we believe that these measures provide information that is useful to investors in understanding our performance and facilitate a comparison of our quarterly and full year results from period to period. These non-IFRS financial measures do not have any standardized meaning and may not be comparable with similar measures used by other companies. For certain non-IFRS financial measures, there are no directly comparable amounts under IFRS. These non-IFRS financial measures should not be viewed in isolation from or as alternatives to measures of financial performance determined in accordance with IFRS. Additional information concerning non-IFRS financial measures and, if applicable, reconciliations to the closest IFRS measures are available in section M - Non-IFRS Financial Measures in this document and the Supplementary Financial Information package on www.sunlife.com under Investors - Financial results and reports.
2. Forward-looking Statements
Certain statements in this document are forward-looking statements within the meaning of certain securities laws, including the "safe harbour" provisions of the United States Private Securities Litigation Reform Act of 1995 and applicable Canadian securities legislation. Additional information concerning forward-looking statements and important risk factors that could cause our assumptions, estimates, expectations and projections to be inaccurate and our actual results or events to differ materially from those expressed in or implied by such forward-looking statements can be found in section P - Forward-looking Statements in this document.
3. Additional Information
Additional information about SLF Inc. can be found in the Consolidated Financial Statements, the annual and interim MD&A, and SLF Inc.'s Annual Information Form ("AIF") for the year ended December 31, 2025. These documents are filed with securities regulators in Canada and are available at www.sedarplus.ca. SLF Inc.'s Annual Consolidated Financial Statements, annual MD&A and AIF are filed with the United States Securities and Exchange Commission ("SEC") in SLF Inc.'s annual report on Form 40-F and SLF Inc.'s interim MD&A and Interim Consolidated Financial Statements are furnished to the SEC on Form 6-Ks and are available at www.sec.gov.
| | | | | | | | | | | | | | | | | | | | |
| MANAGEMENT'S DISCUSSION & ANALYSIS | | Sun Life Financial Inc. | December 31, 2025 | 3 |
Sun Life is a leading international financial services organization providing a diverse range of asset management, wealth, insurance, and health solutions to individual and institutional Clients. We have four business pillars: Asset Management, Canada, U.S. and Asia.
1. Strategy
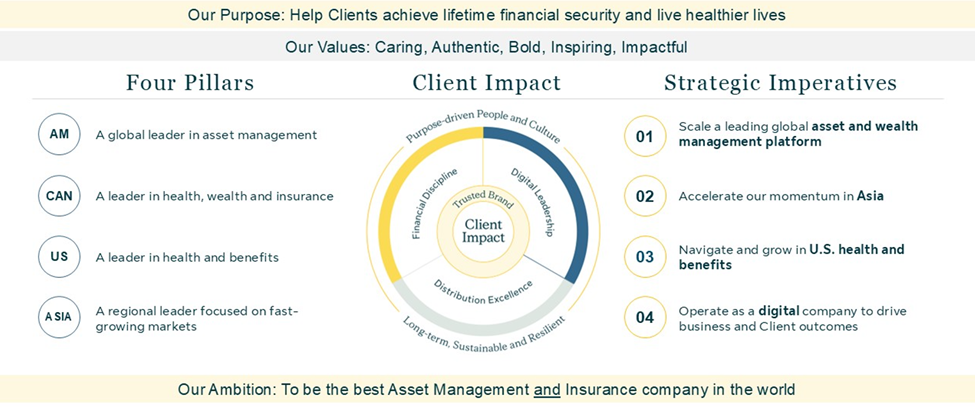
Our strategy places the Client at the centre of everything we do. Our enterprise strategy, as described below, reflects our priorities and our diversified business mix. We believe by effectively executing on our strategy, we can fulfill our Purpose, create a positive impact for our Clients, and achieve our goal to be a leader in each of our four pillars.
Purpose and Ambition
Our Purpose is to help our Clients achieve lifetime financial security and live healthier lives. Our Purpose shapes our strategy, structure, and people and culture.
We seek to provide outstanding value and impact for our Clients in three ways:
Driving positive financial actions by:
•Helping Clients build wealth and provide lifetime financial security.
•Providing quality products and solutions that meet the needs of our Clients.
•Delivering timely and expert advice through consistently superior Client experiences.
Delivering solid long-term Client investment returns by:
•Leveraging our collective expertise to make better investment decisions.
•Sourcing broad investment capabilities to serve global Client needs.
•Delivering on investment objectives of Clients.
Driving positive health actions by:
•Being a trusted provider of a broad range of health and wellness coverages.
•Helping Clients access, navigate, and afford the care they need.
•Improving health outcomes, including physical and mental well-being, by providing health solutions and empowering Clients to manage their health.
While our Purpose guides us, our values; caring, authentic, bold, inspiring, and impactful, align how we deliver every day to create impact.
Our Ambition is "to be the best asset management and insurance company in the world". We define this as delivering strong return on equity ("ROE") for shareholders, while creating exceptional Client Impact and digital experience, deriving value from integrating insurance and asset management businesses, and being Purpose-driven for Clients, while also focusing on strong execution to meet our medium-term financial objectives(1):
•Underlying Earnings Per Share ("EPS") growth: 10%.
•Underlying ROE: 20%.
•Underlying Dividend Payout Ratio: 40%-50%.
(1)For more information about our medium-term financial objectives, see section B - Overview - 2 - Financial Objectives in this document. Underlying EPS, underlying ROE and underlying dividend payout ratio are Non-IFRS financial measures. See section M - Non-IFRS Financial Measures in this document.
| | | | | | | | | | | | | | | | | | | | |
4 | December 31, 2025 | Sun Life Financial Inc. | | MANAGEMENT'S DISCUSSION & ANALYSIS | |
Our Four Pillars
Our four pillars define the businesses and markets in which we operate. In each of these pillars, we focus on creating value and positively impacting our Clients through businesses that meet Client needs and have strong growth prospects, favourable ROE and strong capital generation in attractive global markets. We are well-positioned across each of our pillars.
Asset Management: A global leader in asset management
We deliver value and drive positive Client impact through our offering of quality investment products:
•MFS Investment Management ("MFS") is a long-standing premier active investment manager offering a comprehensive set of asset management products and services to retail and institutional investors around the world.
•SLC Management is a global investment manager delivering alternative fixed income, private credit, infrastructure, and real estate solutions to institutional investors and High-Net-Worth ("HNW") and retail Clients.
Canada: A leader in health, wealth, and insurance
We deliver value and impact to approximately 1 in 3 Canadians via our group and individual businesses by:
•Providing a wide range of asset management, wealth, health and protection solutions to retail Clients.
•Helping Canadians live healthy lives, both as a major provider of group benefits and through a growing focus on innovative products and services that lead to better health outcomes.
•Remaining a market leader in group retirement services in the workplace, including defined contribution pensions, and defined benefit pension de-risking.
U.S.: A leader in health and benefits
We have deep expertise in the health and benefits market, and help our Clients access the care and coverage they need while improving health outcomes. We are:
•The largest independent medical stop-loss provider in the U.S., offering protection against large medical claims for employers who self-insure their employee health plans, as well as programs for complex conditions and health care navigation services to help members improve outcomes.
•One of the largest dental benefits provider in the U.S. based on membership(1) with some of the largest nationwide networks of dentists. The U.S. Dental business serves approximately 32 million members(2) through government programs and commercial group dental and vision solutions for employers of all sizes.
•A top ten group life and disability provider in the U.S., offering a broad portfolio of group insurance products and services, as well as turnkey risk management solutions for health plans and other insurance carriers.
Asia: A regional leader focused on fast-growing markets
We are well-positioned in Asia to achieve our growth aspirations, through our portfolio of distinct businesses in the Philippines, Indonesia, Vietnam, Hong Kong, China, India, Malaysia, and High Net Worth including Singapore, Bermuda, and Dubai. These markets account for approximately 72% of Asia’s Gross domestic product ("GDP") with high potential for future growth(3). We are:
•A provider of individual life and health insurance that delivers Client value across all of our markets.
•A provider, in select markets, of asset management and group retirement products and services.
•Among the global leaders in providing life insurance solutions to HNW Clients.
Our Client Impact Strategy
Our Client Impact strategy has seven areas of focus that we are pursuing across our four pillars. These areas of focus define how we compete in our markets, extend our competitive advantages, fulfill our Purpose and support our Ambition to be the best asset management and insurance company in the world. We are committed to advancing our leadership position through a relentless focus on execution excellence, digital leadership, and cultivating strong talent and a culture that enables high performance.
Client Impact: Our Clients are at the centre of everything we do. Whether it is helping to navigate health concerns, save and plan for retirement or provide financial security for their families, our focus is on the positive impact we have on our Clients' lives. We believe this allows us to develop and offer the right solutions and experiences, build lasting and trusted Client relationships, and create value for Clients that also deliver better business outcomes for Sun Life. We are committed to helping Clients by driving positive health and financial actions, and delivering solid long-term investment returns.
Trusted Brand: Preserving our long standing reputation of being a trusted brand is paramount in an increasingly complex and digitized world. For more than 160 years, we have built and enjoyed strong, trusted relationships with our Clients in all Sun Life markets and through our distribution partnerships. Our brand reflects the differentiated Sun Life experiences we create, the products and service experiences we deliver, and the culture we live by, to achieve our Purpose. Our forward-looking brand strategy remains focused on delivering Client Impact and we will work to build our future competitive advantage and brand appeal with both new and existing Clients.
Execution Excellence: We have a refreshed focus to deepen financial discipline and execution excellence through clear prioritization and alignment across the business, transparent metrics and milestones, effectively resourced programs with clear ownership, and adaptability in response to changing conditions. Our approach aims to fully realize the value of our investments, unlock new opportunities, and strengthen organizational adaptability.
(1)Based on membership as of December 31, 2025, for plans provided or administered by a Sun Life company. Ranking compiled by Sun Life and based on data disclosed by competitors.
(2)Includes members who also have a Sun Life Group coverage.
(3)World Bank, 2024.
| | | | | | | | | | | | | | | | | | | | |
| MANAGEMENT'S DISCUSSION & ANALYSIS | | Sun Life Financial Inc. | December 31, 2025 | 5 |
Distribution Excellence: We have established an omni-channel approach to distribution that makes it easier for Clients to do business with us across all markets. To excel at distribution, we prioritize exceptional service, connecting with our Clients when and how they want to engage, and providing personalized and holistic solutions. We are focused on meeting our Clients' needs by being an exceptional distribution partner that empowers our advisors and partners to provide seamless Client experiences.
Digital Leadership: We are focused on enabling our businesses to create meaningful, digitally-enabled connections with Clients to generate the greatest Client and Business impact:
•Delivering exceptional and personalized digital experiences for Clients, employees, advisors and partners.
•Leveraging digital capabilities and ways of working to drive speed and cost-effectiveness in everything we do.
•Unlocking the potential of new technologies such as generative artificial intelligence ("GenAI") while continuing to invest in a modern technology stack that powers the best Client experiences and overall business productivity.
•Maintaining brand trust by keeping Sun Life resilient and secure.
Financial Discipline: Our strategy is underpinned by a continued commitment to strong financial performance and risk management, coupled with a focus on capital management. Sustained focus across these areas supports our medium-term financial objectives through:
•Delivering strong, stable earnings growth and disciplined expense management.
•Managing our capital to protect our policyholders and to maintain financial flexibility, to generate shareholder value.
•Disciplined organic investments and a programmatic M&A(1) approach.
Long-Term, Sustainable and Resilient: We embed long-term, sustainable and resilient thinking into our strategy, culture, and operations, to drive meaningful social and economic outcomes for our Clients, employees, advisors, investors and communities. We aspire to be a responsibly-managed business that is Client-focused, Purpose-driven, competitive, forward-thinking, sustainable and resilient for the long-term.
Purpose-Driven People and Culture: Delivering on our strategy is supported by our ability to attract, retain, and develop the best talent, and to empower our people to drive results. We are focused on preserving and strengthening our Client focus, integrity, collaboration and inclusivity. Specifically, our focus is to:
•Be the employer of choice for top talent.
•Develop talent that combines strong leadership skills with technological savvy, to support our transformation to a leading digital organization.
•Empower all employees and advisors to take action, make decisions, and be accountable.
•Continue to build a high-performing, inclusive environment that demonstrates diversity of thought and attracts top talent.
•Offer employees flexibility in how and where we work.
Key Strategic Priorities
Together with the strong foundation of our four pillars and key medium-term strategic areas of focus, our strategy emphasizes four key strategic priorities:
1.Scale a leading global asset and wealth management platform: We aim to establish ourselves as a global leader in asset management by growing SLC Management, upholding our leadership in MFS, and unlocking further growth opportunities between our asset management, insurance and wealth businesses.
2.Accelerate our momentum in Asia: Our objective is to become a regional leader in fast-growing markets by strengthening distribution channels, accelerating our speed-to-value through digital advancements, broadening our wealth management services, and emphasizing execution excellence.
3.Navigate and grow in U.S. health and benefits: We strive to be a trusted health partner, enhancing access to care, improving affordability, and empowering members. We're committed to supporting the care needs of our most complex members, leveraging digital capabilities to make health and benefits easier, and strengthening our position in dental care while navigating market dynamics.
4.Operate as a digital company to drive business and Client outcomes: We are dedicated to being a digital leader by integrating digital capabilities throughout the organization, embedding a digital mindset, modernizing our technology infrastructure, leveraging Client insights, and leading the charge in GenAI to drive measurable business and Client outcomes while managing risk, supported by solid and secure foundations.
We believe we are well-positioned to execute on each of these strategic priorities and that by doing so we will accelerate growth, improve competitive positioning, and create positive Client Impact.
Looking ahead, we are confident that our strategy will allow us to deliver on our Purpose, drive positive Client outcomes, create meaningful value for our shareholders, and support our Ambition to be the best asset management and insurance company in the world.
(1)Mergers & Acquisitions ("M&A").
| | | | | | | | | | | | | | | | | | | | |
6 | December 31, 2025 | Sun Life Financial Inc. | | MANAGEMENT'S DISCUSSION & ANALYSIS | |
2. Financial Objectives
Following the adoption of IFRS 17 and IFRS 9, progress against our medium-term financial objectives are measured on a four-year basis. Our medium-term financial objectives are outlined as follows:
| | | | | | | | | | | | |
| IFRS 17 and IFRS 9 | |
Measure(1) | Medium-term financial objectives(2) | 4-Year(3)(4) | 2025 Results | |
Underlying EPS growth Growth in EPS reflects the Company's focus on generating sustainable earnings for shareholders. | 10% | 9% | 12% | |
Underlying ROE ROE is a significant driver of shareholder value and is a major focus for management across all businesses. | 20% | 17.6% | 18.2% | |
Underlying dividend payout ratio Payout of capital versus shareholder value, based on underlying net income. | 40%-50% | 48% | 47% | |
(1)Underlying EPS, underlying ROE and underlying dividend payout ratio are non-IFRS financial measures. See section M - Non-IFRS Financial Measures in this document. Underlying dividend payout ratio represents the ratio of common shareholders' dividends to diluted underlying EPS. See
section J - Capital and Liquidity Management - 3 - Shareholder Dividends in this document for further information regarding dividends.
(2)Our medium-term financial objectives are forward-looking non-IFRS financial measures and do not constitute guidance. Additional information is provided in this MD&A in section P - Forward-looking Statements - Medium-Term Financial Objectives.
(3)2022 results have been restated for the adoption of IFRS 17 and the related IFRS 9 classification overlay (“the new standards”). The restated results may not be fully representative of our future earnings profile, as we were not managing our asset and liability portfolios under the new standards. The majority of the actions taken to re-balance asset portfolios and transition asset-liability management execution to an IFRS 17 basis occurred in Q1'23. Accordingly, analysis based on 2022 comparative results may not necessarily be indicative of future trends, and should be interpreted with this context.
(4)Underlying EPS growth is calculated using a three-year compound annual growth rate. Underlying ROE and dividend payout ratio are calculated using a four-year average of 2022-2025. These calculations reflect data available under the new standards. As we continue to report under the new standards in future periods, an additional year will be added until we reach a five-year period, consistent with disclosures in 2022 and prior.
In the year and over the medium-term, we have solid performance against our medium-term financial objectives.
3. Acquisitions and Other
The following developments occurred since January 1, 2025. Additional information concerning acquisitions and dispositions is provided in Note 3 in our 2025 Annual Consolidated Financial Statements.
On July 15, 2025, we invested $55 million cash in Bowtie Life Insurance Company Limited ("Bowtie"), which increased our ownership interest, excluding dilution, by approximately 11% and resulted in a total ownership interest of 55.8%. Our previously held interest in Bowtie was remeasured to its fair value, which resulted in a gain of $176 million recognized in reported net income in Q3'25. The investment reinforces Sun Life's long-term partnership with Bowtie, and our shared goal to make health insurance simple, accessible and affordable. Bowtie is Hong Kong's first virtual insurer and the market leader in the direct sales channel(1).
On December 17, 2025, we signed an implementation agreement to increase our existing ownership interest in our Malaysia joint ventures to a majority stake for approximately $240 million. The transaction requires regulatory approval and is expected to close in late 2026.
(1)According to Insurance Authority's Provisional Statistics for Long Term Business 2024, in the fourth quarter of 2024, Bowtie Life ranked first in number of new individual non-single premium policies sold through Direct channel in Hong Kong.
| | | | | | | | | | | | | | | | | | | | |
| MANAGEMENT'S DISCUSSION & ANALYSIS | | Sun Life Financial Inc. | December 31, 2025 | 7 |
| | | | | | | | | | | | | | | | |
| ($ millions, unless otherwise noted) | | | | |
| | | | | | | |
| Profitability | | | | | | 2025 | 2024 |
| Net income (loss) | | | | | | | |
| Underlying net income (loss)(1) | | | | | | 4,201 | 3,856 |
| Reported net income (loss) - Common shareholders | | | | | | 3,472 | 3,049 |
| Diluted earnings per share ("EPS") ($) | | | | | | | |
| Underlying EPS (diluted)(1) | | | | | | 7.45 | 6.66 |
| Reported EPS (diluted) | | | | | | 6.15 | 5.26 |
| Return on equity ("ROE") (%) | | | | | | | |
| Underlying ROE(1) | | | | | | 18.2% | 17.2% |
| Reported ROE(1) | | | | | | 15.1% | 13.6% |
| | | | | | | | |
| Growth | | | | | | 2025 | 2024 |
| Sales | | | | | | | |
| Asset management gross flows & wealth sales(1) | | | | | | 236,911 | 196,074 |
| Group - Health & Protection sales(1) | | | | | | 3,416 | 2,737 |
| Individual - Protection sales(1) | | | | | | 3,751 | 2,983 |
| Total assets under management ($ billions)(1)(2) | | | | | | 1,604.9 | 1,542.6 |
| New business Contractual Service Margin ("CSM")(1) | | | | | | 1,727 | 1,473 |
| | | | | | | | |
| Financial Strength | | | | | | 2025 | 2024 |
| LICAT ratios(3) | | | | | | | |
| Sun Life Financial Inc. | | | | | | 157% | 152% |
| Sun Life Assurance(4) | | | | | | 140% | 146% |
| Financial leverage ratio(1)(5) | | | | | | 23.5% | 20.1% |
| Book value per common share ($) | | | | | | 40.25 | 40.63 |
| Weighted average common shares outstanding for basic EPS (millions) | | | | | | 563 | 579 |
| Closing common shares outstanding (millions) | | | | | | 554 | 574 |
(1)Represents a non-IFRS financial measure. For more details, see section M - Non-IFRS Financial Measures in this document.
(2)Prior period amounts have been updated.
(3)Life Insurance Capital Adequacy Test ("LICAT") ratio. Our LICAT ratios are calculated in accordance with the OSFI-mandated guideline, Life Insurance Capital Adequacy Test.
(4)Sun Life Assurance is SLF Inc.’s principal operating life insurance subsidiary.
(5)The calculation for the financial leverage ratio includes the CSM balance (net of taxes) in the denominator. The CSM (net of taxes) was $11.3 billion as at December 31, 2025 (December 31, 2024 - $10.3 billion).
| | | | | | | | | | | | | | | | | | | | |
8 | December 31, 2025 | Sun Life Financial Inc. | | MANAGEMENT'S DISCUSSION & ANALYSIS | |
The following table reconciles our Common shareholders' net income ("reported net income") and underlying net income. All factors discussed in this document that impact underlying net income are also applicable to reported net income. Certain adjustments and notable items also impact the CSM, such as mortality experience and assumption changes; see section F - Contractual Service Margin in this document for more information.
| | | | | | | | | | | |
| | |
| ($ millions, after-tax) | | | | 2025 | 2024 |
Underlying net income (loss) by business type(1): | | | | | |
Asset management & wealth | | | | 1,976 | 1,823 |
| Group - Health & Protection | | | | 1,248 | 1,196 |
Individual - Protection(2) | | | | 1,347 | 1,201 |
Corporate expenses & other(2) | | | | (370) | (364) |
Underlying net income(1) | | | | 4,201 | 3,856 |
Add: Market-related impacts | | | | (381) | (373) |
Assumption changes and management actions ("ACMA") | | | | (45) | 56 |
Other adjustments | | | | (303) | (490) |
| Reported net income - Common shareholders | | | | 3,472 | 3,049 |
Underlying ROE(1) | | | | 18.2% | 17.2% |
Reported ROE(1) | | | | 15.1% | 13.6% |
Notable items attributable to reported and underlying net income(1): | | | | | |
| Mortality | | | | 119 | 43 |
| Morbidity | | | | (14) | 30 |
| Lapse and other policyholder behaviour ("policyholder behaviour") | | | | (12) | (25) |
| Expenses | | | | (114) | (70) |
Net credit(3) | | | | 12 | (15) |
Other(4) | | | | 126 | 91 |
(1)Represents a non-IFRS financial measure. For more details, see section M - Non-IFRS Financial Measures in this document. For more information about business types in Sun Life's business groups, see section A - How We Report Our Results in this document.
(2)Effective Q1'25, Regional Office in Asia was moved from the Corporate expenses & other business type to the Individual - Protection business type, reflecting a reporting refinement. Prior period amounts reflect current presentation.
(3)Credit includes rating changes on assets measured at Fair value through profit or loss ("FVTPL"), and the Expected credit loss ("ECL") impact for assets measured at Fair value through other comprehensive income ("FVOCI"). Effective Q1'25, the release of credit risk adjustments, which are reported in Expected Investment Earnings in the Driver of Earnings analysis, are included in this balance. Prior period amounts reflect current presentation.
(4)Other notable items are recorded in Net Insurance Service Result and Net Investment Result in the Drivers of Earnings analysis. For more details, see section M - Non-IFRS Financial Measures in this document.
2025 vs. 2024
Underlying net income(1) of $4,201 million increased $345 million or 9%, driven by:
•Asset management & wealth(1) up $153 million: Higher fee-related earnings and strong performance of net seed investment income in SLC Management, higher fee income in Canada, MFS, and Asia, and improved credit experience in Canada wealth, partially offset by a decease in net investment income in MFS.
•Group - Health & Protection(1) up $52 million: Business growth and favourable mortality experience in Canada, and higher U.S. Dental results, partially offset by lower U.S. Group Benefits results.
•Individual - Protection(1)(2) up $146 million: Business growth and higher contributions from joint ventures in Asia, and higher investment earnings in Asia and Canada, partially offset by unfavourable credit experience in Asia.
•Corporate expenses & other(1)(2) $(6) million increase in net loss primarily reflecting higher financing costs supporting the acquisition of our remaining interests in SLC Management affiliates.
(1)Refer to section M - Non-IFRS Financial Measures in this document for a reconciliation between reported net income and underlying net income.
(2)Effective Q1'25, Regional Office in Asia was moved from the Corporate expenses & other business type to the Individual - Protection business type, reflecting a reporting refinement. Prior period amounts reflect current presentation.
| | | | | | | | | | | | | | | | | | | | |
| MANAGEMENT'S DISCUSSION & ANALYSIS | | Sun Life Financial Inc. | December 31, 2025 | 9 |
Reported net income of $3,472 million increased $423 million or 14%, driven by:
•The increase in underlying net income;
•Changes in tax-exempt investment income primarily in Corporate(1) reflecting higher losses in the prior year;
•A gain from increased ownership interest in Bowtie(2); and
•The prior year impacts from an impairment charge of $186 million on an intangible asset related to bancassurance in Vietnam, restructuring charge of $108 million in Corporate(3), and a provision in U.S. Dental; partially offset by
•Unfavourable ACMA(4) impacts;
•An impairment charge of $61 million on a customer relationship intangible asset from the early termination of a U.S. group dental contract; and
•The prior year decrease in SLC Management's acquisition-related liabilities(5) and gains on partial sale of ABSLAMC(6) and the early termination of a distribution agreement in Asset Management.
•Market-related impacts were in line with the prior year as favourable interest rate impacts and improved real estate experience(7) were offset by unfavourable other market-related impacts driven primarily across Asia and Canada, and unfavourable equity market impacts.
Underlying ROE was 18.2% and reported ROE was 15.1% (2024 - 17.2% and 13.6%, respectively).
1.Market-related impacts
Market-related impacts represent the difference between actual versus expected market movements(8). Market-related impacts resulted in a decrease of $381 million to reported net income, reflecting unfavourable real estate experience and unfavourable other market-related impacts primarily from Asia and Canada, partially offset by favourable interest rate impacts.
2.Assumption changes and management actions
The net impact of assumption changes and management actions was a decrease of $45 million to reported net income and includes methods and assumptions changes on insurance contracts as well as related impacts. These included unfavourable impacts from model refinements across all business groups, expense updates mainly in Asia, and policyholder behaviour updates in Canada, partially offset by favourable financial updates in Canada and Asia, and mortality updates in Canada. For additional details refer to "Assumption Changes and Management Actions by Type" in section F - Contractual Service Margin in this document.
3.Other adjustments
Other adjustments decreased reported net income by $303 million, driven by:
•DentaQuest acquisition, integration and restructuring costs and amortization of acquired intangible assets;
•Changes in SLC Management's acquisition-related liabilities(9);
•An impairment charge of $61 million on a customer relationship intangible asset from the early termination of a U.S. group dental contract; and
•Lower than expected tax-exempt investment income primarily in Corporate(1); partially offset by
•A gain from increased ownership interest in Bowtie.
4. Experience-related items
Notable experience items in the current year included:
•Favourable mortality experience primarily in Canada, Asia and the U.S.;
•Unfavourable morbidity experience in the U.S. largely offset by favourable morbidity experience in Canada;
•Unfavourable expense experience largely in the U.S., Canada and Asia; and
•Other experience was favourable primarily from the U.S., Canada, and Asia.
(1)Q4'25 results reflect lower than expected tax-exempt investment income of $49 million (Q4'24 - lower than expected tax-exempt investment income of $234 million).
(2)On July 15, 2025, we acquired an additional interest in Bowtie Life Insurance Company Limited ("Bowtie"), which increased our ownership interest, excluding dilution, by approximately 11% and resulted in a total ownership interest of 55.8%. Total consideration was cash of $55 million. Our previously held interest in Bowtie was remeasured to its fair value, which resulted in a gain of $176 million recognized in reported net income in Q3'25 ("gain from increased ownership interest in Bowtie"). For additional information, refer to Note 3 of our 2025 Annual Consolidated Financial Statements.
(3)A restructuring charge of $108 million (pre-tax $138 million) recorded in Q2'24 reflecting actions taken to improve financial discipline and productivity, consistent with our Client Impact Strategy, supporting our Medium-Term Financial Objective for underlying EPS growth ("prior year restructuring charge in Corporate"). We expect these actions to result in annual savings of approximately $200 million (pre-tax) by 2026.
(4)Assumption Changes and Management Actions ("ACMA").
(5)An increase of $4 million in estimated future payments for options to purchase the remaining ownership interests of SLC Management affiliates in 2025 (2024 - a decrease of $344 million). For additional information, refer to Note 5 and Note 11 of our 2025 Annual Consolidated Financial Statements.
(6)To meet regulatory obligations, on March 21, 2024, we sold 6.3% of our ownership interest in Aditya Birla Sun Life AMC Limited (“partial sale of ABSLAMC”), generating a gain of $84 million. As a result of this transaction, our ownership interest in ABSLAMC was reduced from 36.5% to 30.2% for gross proceeds of $136 million. Subsequently, on May 31, 2024, we sold an additional 0.2% of our ownership interest.
(7)Real estate experience reflects the difference between the actual value of real estate investments compared to management's longer-term expected returns supporting insurance contract liabilities ("real estate experience").
(8)Except for risk free rates which are based on current rates, expected market movements are based on our medium-term outlook which is reviewed annually.
(9)Amounts primarily relate to acquisition costs for our SLC Management affiliates, BentallGreenOak, Crescent Capital Group LP and Advisors Asset Management, Inc, which include the unwinding of the discount for Other financial liabilities.
| | | | | | | | | | | | | | | | | | | | |
10 | December 31, 2025 | Sun Life Financial Inc. | | MANAGEMENT'S DISCUSSION & ANALYSIS | |
5.Income taxes
The statutory tax rate is impacted by various items, such as lower taxes on income subject to tax in foreign jurisdictions, tax-exempt or low-taxed investment income, and other sustainable tax benefits.
Global Minimum Tax ("GMT") rules applied to Sun Life effective January 1, 2024:
•Canadian GMT legislation requires the ultimate parent entity of a group to pay top-up tax, on a jurisdiction-by-jurisdiction basis, on profits of its subsidiaries that are taxed below 15%. Some jurisdictions have enacted a Qualifying Domestic Minimum Top-Up Tax ("QDMTT") which requires the GMT top-up tax to be paid locally rather than to the ultimate parent entity's jurisdiction.
•In response to the GMT rules, Bermuda enacted a Corporate Income Tax ("CIT") regime, including a corporate income tax rate of 15%, which applies to Sun Life effective January 1, 2025. The Bermuda CIT is not a QDMTT for the purposes of GMT. Top-up tax may still be payable by the ultimate parent entity under the Income Inclusion Rule ("IIR"), depending on the effective tax rate in Bermuda.
•Other Sun Life subsidiaries that are currently subject to a statutory tax rate or to a tax regime that could result in taxing profits at a rate below 15% include those in Hong Kong and Ireland, which have both enacted a QDMTT.
•For additional information, refer to Note 19 in our 2025 Annual Consolidated Financial Statements.
The 2025 Canadian Federal Budget, which was announced on November 4, 2025, proposed changes clarifying that investment income supporting Canadian insurance risks is taxable in Canada, even when derived from assets held by a foreign affiliate of a Canadian insurance company. This proposed legislation would apply to Sun Life effective January 1, 2026 and is not expected to have a material impact on our consolidated financial statements when it becomes enacted.
On July 4, 2025, the United States Congress enacted the 2025 Budget Reconciliation Act, which introduced several tax provisions, including amendments to the Internal Revenue Code section governing the deductibility of executive compensation. Certain provisions apply to Sun Life, however they are not expected to have a material impact on our consolidated financial statements.
The effective income tax rate(1) for the current year on underlying net income and reported net income was 19.5% and 21.2%, respectively.
6. Impacts of foreign exchange translation
We operate in many markets worldwide, including Canada, the United States, the United Kingdom, Ireland, Hong Kong, the Philippines, Japan, Indonesia, India, China, Australia, Singapore, Vietnam, Malaysia and Bermuda, and generate revenues and incur expenses in local currencies in these jurisdictions, which are translated to Canadian dollars.
Items impacting a reporting period, such as Revenue, Expenses, and Reported net income (loss) in our Consolidated Statements of Operations, as well as underlying net income (loss), and sales, are translated into Canadian dollars using average exchange rates for the appropriate daily, monthly, or quarterly period. For Assets and Liabilities in our Consolidated Statements of Financial Position, as well as the AUM and certain components of the Drivers of Earnings disclosure, period-end rates are used for currency translation purposes.
The following table provides the foreign exchange rates for the U.S. dollar, which generates the most significant impact of foreign exchange translation, over the past four quarters and two years.
| | | | | | | | | | | | | | | | | | | | |
| Exchange rate | Quarterly results | Full year |
| Q4'25 | Q3'25 | Q2'25 | Q1'25 | 2025 | 2024 |
U.S. Dollar - Average | 1.394 | 1.377 | 1.384 | 1.435 | 1.398 | 1.370 |
U.S. Dollar - Period end | 1.372 | 1.392 | 1.361 | 1.439 | 1.372 | 1.438 |
The relative impacts of foreign exchange translation in any given period are driven by the movement of foreign exchange rates as well as the proportion of earnings generated in our foreign operations. In general, net income benefits from a weakening Canadian dollar and is adversely affected by a strengthening Canadian dollar as net income from the Company's international operations is translated back to Canadian dollars. Conversely, in a period of losses, the weakening of the Canadian dollar has the effect of increasing losses in foreign jurisdictions. We generally express the impacts of foreign exchange translation on net income on a year-over-year basis.
For the full year 2025, foreign exchange translation led to an increase of $50 million in underlying net income and an increase of $56 million in reported net income.
(1)Our effective income tax rate on reported net income is calculated using Total income (loss) before income taxes, as detailed in Note 19 in our
2025 Annual Consolidated Financial Statements. Our effective income tax rate on underlying net income is calculated using pre-tax underlying net income, as detailed in section M - Non-IFRS Financial Measures in this document, and the associated income tax expense.
| | | | | | | | | | | | | | | | | | | | |
| MANAGEMENT'S DISCUSSION & ANALYSIS | | Sun Life Financial Inc. | December 31, 2025 | 11 |
1. Sales and Gross Flows
| | | | | | | | | | | |
| | |
| ($ millions) | | | | 2025 | 2024 |
Asset management gross flows & wealth sales by business segment(1) | | | | | |
Asset Management gross flows | | | | 204,286 | 169,867 |
Canada asset management gross flows & wealth sales | | | | 22,531 | 18,144 |
Asia asset management gross flows & wealth sales | | | | 10,094 | 8,063 |
Total asset management gross flows & wealth sales(1) | | | | 236,911 | 196,074 |
Group - Health & Protection sales by business segment(1) | | | | | |
| Canada | | | | 769 | 666 | |
U.S. | | | | 2,546 | 1,984 | |
Asia(2) | | | | 101 | 87 |
Total group sales(1) | | | | 3,416 | 2,737 |
Individual - Protection sales by business segment(1) | | | | | |
| Canada | | | | 538 | 551 |
| Asia | | | | 3,213 | 2,432 |
Total individual sales(1) | | | | 3,751 | 2,983 |
CSM - Impact of new insurance business ("New business CSM")(1) | | | | 1,727 | 1,473 |
(1)Represents a non-IFRS financial measure. For more details, see section M - Non-IFRS Financial Measures in this document.
(2)In underlying net income by business type, Group businesses in Asia have been included with Individual - Protection. For more information about business types in Sun Life's business groups, see section A - How We Report Our Results in this document.
Total asset management gross flows & wealth sales increased $40.8 billion or 21% year-over-year ($37.0 billion(1) or 19%(1), excluding foreign exchange translation).
•Asset Management gross flows increased $30.6 billion(1) or 18%(1) from prior year, driven by higher gross flows in MFS and SLC Management.
•Canada asset management gross flows & wealth sales increased $4.4 billion or 24%, driven by Group Retirement Services ("GRS") and higher mutual fund sales in Individual Wealth. GRS sales reflect higher defined contribution sales from large case sales, and increased rollover volumes, partially offset by lower defined benefit solution sales reflecting a slower market for pension risk transfer transactions.
•Asia asset management gross flows & wealth sales increased $2.1 billion(1) or 26%(1), driven by higher fixed income fund sales in India.
Total group health & protection sales increased $679 million or 25% from prior year ($668 million(1) or 24%(1), excluding foreign exchange translation).
•Canada group sales increased $103 million or 15%, driven by higher large case sales.
•U.S. group sales increased $551 million(1) or 27%(1), driven by medical stop-loss and large case employee benefits sales in Group Benefits and higher Medicare and Medicaid sales in Dental.
Total individual protection sales increased $768 million or 26% from prior year ($726 million(1) or 24%(1), excluding foreign exchange translation).
•Canada individual sales decreased $13 million or 2%, reflecting a combination of lower participating life sales and strong non-participating life sales.
•Asia individual sales increased $739 million(1) or 30%(1), driven by:
◦Higher sales in Hong Kong from growth across all channels; and
◦Higher sales in India and Indonesia reflecting growth primarily in the bancassurance channel; partially offset by
◦Lower sales in High Net Worth from the broker channel.
New business CSM represents growth derived from sales activity in the period. The impact of new insurance business resulted in a $1,727 million increase in CSM, compared to $1,473 million in the prior year, driven by higher sales and profit margins partially offset by unfavourable business mix in Asia, primarily in Hong Kong.
(1)This change excludes the impacts of foreign exchange translation. For more information about these non-IFRS financial measures, see section
M - Non-IFRS Financial Measures in this document.
| | | | | | | | | | | | | | | | | | | | |
12 | December 31, 2025 | Sun Life Financial Inc. | | MANAGEMENT'S DISCUSSION & ANALYSIS | |
2. Assets Under Management
AUM consists of general funds, the investments for segregated fund holders ("segregated funds") and third-party assets managed by the Company. Third-party AUM is comprised of institutional and managed funds, as well as other AUM related to our joint ventures.
| | | | | | | | | | | | | |
| | | |
| ($ millions) | | | | | | 2025 | 2024 |
Assets under management(1)(2) | | | | | | | |
| General fund assets | | | | | | 231,889 | 221,935 |
| Segregated funds | | | | | | 166,566 | 148,786 |
Third-party assets under management(1) | | | | | | | |
Retail | | | | | | 666,852 | 648,515 |
Institutional, managed funds and other | | | | | | 591,829 | 568,437 |
Total third-party AUM(1) | | | | | | 1,258,681 | 1,216,952 |
Consolidation adjustments(2) | | | | | | (52,272) | (45,057) |
Total assets under management(1)(2) | | | | | | 1,604,864 | 1,542,616 |
(1)Represents a non-IFRS financial measure. See section M - Non-IFRS Financial Measures in this document.
(2)Prior period amounts have been updated.
AUM increased $62.2 billion or 4% from December 31, 2024, primarily driven by:
(i)favourable market movements on the value of segregated, retail, institutional and managed funds of $141.0 billion;
(ii)an increase in AUM of general fund assets of $10.0 billion, primarily driven by net fair value growth from changes in interest rates and credit spreads, and business growth and capital activities, partially offset by unfavourable impacts from foreign exchange translation; and
(iii)an increase of $5.0 billion primarily from business growth; partially offset by
(iv)a decrease of $49.2 billion from foreign exchange translation (excluding the impacts of general fund assets);
(v)net outflows from segregated funds and third-party AUM of $36.9 billion; and
(vi)Client distributions of $7.6 billion.
Segregated fund and third-party AUM net outflows of $36.9 billion for the year were comprised of:
| | | | | | | | | | | | | |
| | | |
| ($ billions) | | | | | | 2025 | 2024 |
Net flows for Segregated fund and Third-party AUM: | | | | | | | |
MFS | | | | | | (58.1) | (79.4) |
| SLC Management | | | | | | 18.2 | 16.6 |
| Canada, Asia and other | | | | | | 3.0 | 2.1 |
Total net flows for Segregated fund and Third-party AUM | | | | | | (36.9) | (60.7) |
Third-Party AUM increased by $41.7 billion or 3% from December 31, 2024, primarily driven by:
(i)favourable market movements of $132.2 billion; and
(ii)an increase of $5.0 billion primarily from business growth; partially offset by
(iii)foreign exchange translation of $50.8 billion;
(iv)net outflows of $37.0 billion; and
(v)Client distributions of $7.6 billion.
| | | | | | | | | | | | | | | | | | | | |
| MANAGEMENT'S DISCUSSION & ANALYSIS | | Sun Life Financial Inc. | December 31, 2025 | 13 |
| | | | | |
| F. Contractual Service Margin | |
Contractual Service Margin represents a source of stored value for future insurance profits and qualifies as available capital for LICAT purposes. CSM is a component of insurance contract liabilities. The following table shows the change in CSM including its recognition into net income in the period, as well as the growth from new insurance sales activity.
| | | | | | | | |
| For the full year ended | For the full year ended |
| ($ millions) | December 31, 2025 | December 31, 2024 |
| Beginning of Period | 13,366 | 11,786 |
Impact of new insurance business(1) | 1,727 | 1,473 |
Expected movements from asset returns & locked-in rates(1) | 774 | 703 |
Insurance experience gains/losses(1) | (88) | (77) |
| CSM recognized for services provided | (1,263) | (1,135) |
Organic CSM Movement(1)(2) | 1,150 | 964 |
Impact of markets & other(1) | 275 | 124 |
Impact of change in assumptions(1) | 49 | 30 |
| Currency impact | (348) | 462 |
| | |
| Total CSM Movement | 1,126 | 1,580 |
Contractual Service Margin, End of Period(3) | 14,492 | 13,366 |
(1)Represents a non-IFRS financial measure. For more details, see section M - Non-IFRS Financial Measures in this document.
(2)Organic CSM movement is a component of both total CSM movement and organic capital generation.
(3)Total company CSM presented above is comprised of CSM on Insurance contracts issued of $14,166 million (December 31, 2024 - $13,028 million), net of CSM Reinsurance contracts held of $(326) million (December 31, 2024 - $(338) million).
Total CSM ended Q4'25 at $14.5 billion, an increase of $1.1 billion or 8% from December 31, 2024.
•Organic CSM movement was driven by the impact of new insurance business, reflecting strong sales and profit margins in Asia, primarily in Hong Kong, and individual protection sales in Canada.
•Unfavourable insurance experience in Canada and the U.S.
•Favourable impact of markets and other driven by interest and equity experience.
•Impact of change in assumptions include the favourable impact of mortality updates in Canada and model refinements across all business groups, partially offset by unfavourable policyholder behaviour and expense updates.
•Unfavourable currency impacts primarily in Asia.
| | | | | | | | | | | | | | | | | | | | |
14 | December 31, 2025 | Sun Life Financial Inc. | | MANAGEMENT'S DISCUSSION & ANALYSIS | |
Assumption Changes and Management Actions by Type
The impact on CSM of ACMA is attributable to insurance contracts and related impacts under the general measurement approach ("GMA") and variable fee approach ("VFA"). For insurance contracts measured under the GMA, the impacts flow through the CSM at locked-in discount rates. For insurance contracts measured under the VFA, the impact flows through the CSM at current discount rates.
The following table sets out the impacts of ACMA on our reported net income and CSM in 2025.
| | | | | | | | | | | |
At and For the Year Ended December 31, 2025 | |
| ($ millions) | Reported net income impacts (After-tax)(1)(2) | Deferred in CSM (Pre-tax)(2)(3) | Comments |
| Mortality/morbidity | 14 | 266 | Updates to reflect mortality and morbidity experience in all jurisdictions. The largest item was a favourable mortality update mainly to GRS and Individual Wealth in Canada. |
| Policyholder behaviour | (13) | (145) | Updates to reflect lapse and policyholder behaviour in all jurisdictions. The largest item was an adverse lapse and policyholder behaviour impact in Individual Insurance in Canada. |
| Expense | (29) | (95) | Updates to expenses in all jurisdictions. |
| Financial | 31 | 7 | Updates to various financial-related assumptions. |
| Modelling enhancement and other | (48) | 16 | Various enhancements and methodology changes. The largest items were the unfavourable impact of a new reinsurance treaty in Individual Insurance in Canada, partially offset by favourable refinements in Hong Kong and High Net Worth in Asia. |
Total impact of change in assumptions | (45) | 49 | |
(1)In this document, the reported net income impact of ACMA is shown in aggregate for Net insurance service result and Net investment result, and excludes amounts attributable to participating policyholders.
(2)CSM is shown on a pre-tax basis as it reflects the changes in our insurance contract liabilities, while reported net income is shown on a post-tax basis to reflect the impact on capital.
(3)Total impact of change in assumptions represents a non-IFRS financial measure for amounts deferred in CSM. For more details, see section
M - Non-IFRS Financial Measures in this document.
| | | | | | | | | | | | | | | | | | | | |
| MANAGEMENT'S DISCUSSION & ANALYSIS | | Sun Life Financial Inc. | December 31, 2025 | 15 |
| | | | | | | | | | | | | |
| | | | | | |
| ($ millions, unless otherwise stated) | | | | | 2025 | | 2024 |
LICAT ratio(1) | | | | | | | |
Sun Life Financial Inc. | | | | | 157% | | 152% |
Sun Life Assurance | | | | | 140% | | 146% |
Capital | | | | | | | |
Subordinated debt | | | | | 8,171 | | 6,179 |
Innovative capital instruments(2) | | | | | 200 | | 200 |
| Equity in the participating account | | | | | 696 | | 496 |
| Non-controlling interests | | | | | 264 | | 76 |
| Preferred shares and other equity instruments | | | | | 2,239 | | 2,239 |
Common shareholders' equity(3) | | | | | 22,293 | | 23,318 |
Contractual Service Margin(4) | | | | | 14,492 | | 13,366 |
Total capital | | | | | 48,355 | | 45,874 |
Financial leverage ratio(4)(5) | | | | | 23.5% | | 20.1% |
| Dividend | | | | | | | |
Underlying dividend payout ratio(5) | | | | | 47% | | 49% |
| Dividends per common share ($) | | | | | 3.520 | | 3.240 |
Book value per common share ($) | | | | | 40.25 | | 40.63 |
(1)Our LICAT ratios are calculated in accordance with the OSFI-mandated guideline, Life Insurance Capital Adequacy Test.
(2)Innovative capital instruments consist of Sun Life ExchangEable Capital Securities ("SLEECS"), For more details, see section J - Capital and Liquidity Management in this document.
(3)Common shareholders’ equity is equal to Total shareholders’ equity less Preferred shares and other equity instruments.
(4)The calculation for the financial leverage ratio includes the CSM balance (net of taxes) in the denominator. The CSM (net of taxes) was $11.3 billion as at December 31, 2025 ( December 31, 2024 - $10.3 billion).
(5)Represents a non-IFRS financial measure. For more details, see section M - Non-IFRS Financial Measures in this document.
1. Life Insurance Capital Adequacy Test
The Office of the Superintendent of Financial Institutions has developed the regulatory capital framework referred to as the Life Insurance Capital Adequacy Test for Canada. LICAT measures the capital adequacy of an insurer using a risk-based approach and includes elements that contribute to financial strength through periods when an insurer is under stress as well as elements that contribute to policyholder and creditor protection wind-up.
SLF Inc. is a non-operating insurance company and is subject to the LICAT guideline. Sun Life Assurance, SLF Inc.'s principal operating life insurance subsidiary, is also subject to the LICAT guideline.
SLF Inc.'s LICAT ratio of 157% as at December 31, 2025 increased five percentage points compared to December 31, 2024, driven by organic capital generation and subordinated debt issuance, partially offset by shareholder dividend payments, share buybacks, M&A activity, and scenario switches.
Sun Life Assurance's LICAT ratio of 140% as at December 31, 2025 decreased six percentage points compared to December 31, 2024, driven by organic capital generation more than offset by dividend payments to SLF Inc., M&A activity, and scenario switches.
The Sun Life Assurance LICAT ratios in both periods are well above OSFI's supervisory ratio of 100% and regulatory minimum ratio of 90%.
| | | | | | | | | | | | | | | | | | | | |
16 | December 31, 2025 | Sun Life Financial Inc. | | MANAGEMENT'S DISCUSSION & ANALYSIS | |
2. Capital
Our total capital consists of subordinated debt and other capital instruments, CSM, equity in the participating account and total shareholders' equity which includes common shareholders' equity, preferred shares and other equity instruments, and non-controlling interests ("NCI"). As at December 31, 2025, our total capital was $48.4 billion, an increase of $2.5 billion compared to December 31, 2024. The increase to total capital included reported net income of $3,472 million, an increase of $1,126 million in CSM, the issuance of $1,000 million principal amount of Series 2025-1 Subordinated Unsecured 4.14% Fixed/Floating Debentures and the issuance of $1,000 million principal amount of Series 2025-2 Subordinated Unsecured 4.56% Fixed/Floating Debentures, which are detailed below, net unrealized gains on FVOCI assets of $255 million, and non-controlling interests of $221 million reflecting our increased ownership interest in Bowtie(1). This was partially offset by the payment of $1,975 million of dividends on common shares of SLF Inc. ("common shares"), a decrease of $1,707 million from the repurchase and cancellation of common shares, which is detailed below, and unfavourable impacts from foreign exchange translation of $899 million included in other comprehensive income (loss) ("OCI").
In 2025, organic capital generation(2) was $2,256 million, which measures the change in capital, net of dividends, above LICAT requirements excluding the impacts of markets and other non-recurring items. Organic capital generation was driven by growth in underlying net income and new business CSM, partially offset by shareholder dividend payments.
Our capital and liquidity positions remain strong with a LICAT ratio of 157% at SLF Inc., a financial leverage ratio of 23.5%(2) and $2.4 billion in cash and other liquid assets(2) as at December 31, 2025 in SLF Inc.(3) (December 31, 2024 - $1.4 billion).
Capital Transactions
On June 30, 2025, 2,664,916 of the 4,982,669 Class A Non-cumulative Floating Rate Preferred Shares Series 9QR (the "Series 9QR Shares") were converted into Class A Non-Cumulative Rate Reset Preferred Shares Series 8R (the "Series 8R Shares") on a one-for-one basis and 1,400 of its 6,217,331 Series 8R Shares were converted into Series 9QR Shares on a one-for-one basis. As a result, as of June 30, 2025, SLF Inc. has 8,880,847 Series 8R Shares and 2,319,153 Series 9QR Shares issued and outstanding.
On September 11, 2025, SLF Inc. issued $1 billion principal amount of Series 2025-1 Subordinated Unsecured 4.14% Fixed/Floating Debentures due 2037 (the "September 2025 Debenture Offering"). On December 3, 2025, SLF Inc. issued $1 billion principal amount of Series 2025-2 Subordinated Unsecured 4.56% Fixed/Floating Debentures due 2040 (the "December 2025 Debenture Offering"). The net proceeds from the September 2025 Debenture Offering and the December 2025 Debenture Offering will be used for general corporate purposes, which may include supporting the acquisition of SLF Inc.'s remaining interests in the SLC Management affiliates BentallGreenOak and Crescent Capital Group LP, investments in subsidiaries, repayment of indebtedness and other strategic investments.
Normal Course Issuer Bids
On August 29, 2024, SLF Inc. commenced a normal course issuer bid, which was in effect until June 6, 2025 (the "2024 NCIB").
On June 4, 2025, SLF Inc. announced that OSFI and the Toronto Stock Exchange (“TSX”) had approved its previously announced early renewal of its normal course issuer bid. As of June 4, 2025, SLF Inc. had purchased on the TSX, other Canadian stock exchanges and/or alternative Canadian trading platforms 14,429,085 of the 15,000,000 common shares that it was authorized to repurchase under the 2024 NCIB. Under SLF Inc.'s renewed normal course issuer bid (the "2025 NCIB"), it is permitted to purchase up to 10,570,915 common shares, being equal to the remaining 570,915 common shares that it had not repurchased under the 2024 NCIB plus an additional 10,000,000 common shares. The 2025 NCIB commenced on June 9, 2025 and will continue until May 21, 2026 or such earlier date as SLF Inc. may determine. Any common shares purchased by SLF Inc. pursuant to the 2025 NCIB will be cancelled or used in connection with certain equity settled incentive arrangements.
Shares purchased and subsequently cancelled under both bids were as follows:
| | | | | | | | | | | | | | | | | | | | |
| Quarterly results | Year-to-date | Aggregate(1) |
| Q4'25 | 2025 |
| Common shares purchased (millions) | Amount ($ millions)(2) | Common shares purchased (millions) | Amount ($ millions)(2) | Common shares purchased (millions) | Amount ($ millions)(2) |
2024 NCIB (ended June 6, 2025) | — | | — | | 10.6 | | 863 | | 14.4 | | 1,172 | |
2025 NCIB | 4.7 | | 392 | | 10.1 | | 844 | | 10.1 | | 844 | |
Total | 4.7 | | 392 | | 20.7 | | 1,707 | | | |
(1)Represents the balance of common shares purchased and subsequently cancelled under the life of the normal course issuer bid to-date.
(2)Excludes the impact of excise tax on net repurchases of equity.
(1)On July 15, 2025, we acquired an additional interest in Bowtie Life Insurance Company Limited ("Bowtie"), which increased our ownership interest, excluding dilution, by approximately 11% and resulted in a total ownership interest of 55.8%. Total consideration was cash of $55 million. For additional information, refer to Note 3 of our 2025 Annual Consolidated Financial Statements.
(2)Represents a non-IFRS financial measure. For more details, see section M - Non-IFRS Financial Measures in this document.
(3)SLF Inc. (the ultimate parent company) and its wholly-owned holding companies.
| | | | | | | | | | | | | | | | | | | | |
| MANAGEMENT'S DISCUSSION & ANALYSIS | | Sun Life Financial Inc. | December 31, 2025 | 17 |
Financial Strength Ratings
Independent rating agencies assign credit ratings to securities issued by companies and assign financial strength ratings to financial institutions such as Sun Life Assurance.
The financial strength ratings assigned by rating agencies are intended to provide an independent view of the creditworthiness and financial strength of a financial institution. Each rating agency has developed its own methodology for the assessment and subsequent rating of life insurance companies.
Rating agencies do not assign a financial strength rating for SLF Inc., however, credit ratings are assigned to the securities issued by SLF Inc. and its subsidiaries and are described in SLF Inc.'s AIF under the heading Security Ratings.
The following table summarizes the financial strength ratings for Sun Life Assurance as at January 31, 2026 and January 31, 2025.
| | | | | | | | | | | | | | |
| A.M. Best | DBRS | Moody's | Standard & Poor's |
| January 31, 2026 | A+ | AA | Aa3 | AA |
| January 31, 2025 | A+ | AA | Aa3 | AA |
Most recent rating agency actions on the financial strength rating of Sun Life Assurance:
•November 19, 2025 - Moody's affirmed the financial strength rating with a stable outlook.
•October 21, 2025 - DBRS affirmed the financial strength rating with a stable outlook.
•April 3, 2025 - A.M. Best affirmed the financial strength rating with a stable outlook.
•March 6, 2025 - Standard and Poor's ("S&P") affirmed the financial strength rating with a stable outlook.
| | | | | | | | | | | | | | | | | | | | |
18 | December 31, 2025 | Sun Life Financial Inc. | | MANAGEMENT'S DISCUSSION & ANALYSIS | |
| | | | | |
| H. Performance by Business Segment | |
Sun Life's business is well-diversified across geographies and business types, supported by our four pillar strategy and diversified offerings of wealth and insurance products.
| | | | | | | | | | | |
| | |
| ($ millions) | | | | 2025 | 2024 |
Underlying net income (loss)(1) | | | | | |
| Asset Management | | | | 1,371 | 1,293 |
| Canada | | | | 1,594 | 1,453 |
| U.S. | | | | 770 | 773 |
| Asia | | | | 836 | 701 |
| Corporate | | | | (370) | (364) |
Total underlying net income (loss)(1) | | | | 4,201 | 3,856 |
| Reported net income (loss) - Common shareholders | | | | | |
| Asset Management | | | | 1,214 | 1,528 |
| Canada | | | | 1,402 | 1,217 |
| U.S. | | | | 520 | 556 |
| Asia | | | | 768 | 429 |
| Corporate | | | | (432) | (681) |
| Total reported net income (loss) - Common shareholders | | | | 3,472 | 3,049 |
(1)Represents a non-IFRS financial measure. For more details, see section M - Non-IFRS Financial Measures in this document.
All factors discussed in this document that impact our underlying net income are also applicable to reported net income.
| | | | | | | | | | | | | | | | | | | | |
| MANAGEMENT'S DISCUSSION & ANALYSIS | | Sun Life Financial Inc. | December 31, 2025 | 19 |
1. Asset Management
| | |
Our Asset Management business group is comprised of MFS and SLC Management. MFS is a premier global asset manager offering a comprehensive selection of financial products and services that deliver superior value, actively managing assets for retail and institutional investors around the world. SLC Management is a global asset manager with capabilities across fixed income and alternative asset classes including public and private fixed income, real estate equity and debt, and infrastructure equity, and manages assets on behalf of institutional investors, and HNW and retail Clients around the world. |
2025 Highlights
| | |
•We ended 2025 with $1,154.0 billion in assets under management(1) consisting of $894.0 billion (US$651.4 billion) in MFS and $260.0 billion in SLC Management. •Total Asset Management net outflows(1) of $39.9 billion reflected net outflows of $58.1 billion (US$41.5 billion) from MFS partially offset by SLC Management net inflows of $18.2 billion. •Effective January 1, 2026, we extended and formalized our asset management pillar in Sun Life Asset Management. In addition to MFS and SLC Management, Sun Life Asset Management includes Sun Life's stake in Aditya Birla Sun Life Asset Management, previously part of the Asia business segment, as well as Sun Life's pension risk transfer business, previously part of the Canada business segment. This new structure will help accelerate growth between our asset management, insurance, and wealth businesses and drive strategic partnerships to the benefit of our Clients. Effective January 1, 2026, Sun Life's asset management financial results will reflect this new structure.
|
| | |
MFS •MFS continued to experience solid fixed income fund performance, generating net inflows(1) of US$5.5 billion for this asset class in the year. •MFS remains the 9th largest fund group(2) for the U.S. retail mutual fund industry based on AUM, despite continued challenging market conditions. •Active exchange traded funds ("ETFs") experience solid momentum in 2025, with US$1.2 billion in net inflows(1) since the launch in late 2024, ending the year with over US$1.4 billion in AUM(1). MFS expanded its ETF platform with an additional three funds launched in the year, including two funds managed using MFS' proprietary Blended Research® approach, continuing to expand the diverse range of investment products offered to Clients. |
| | |
SLC Management •SLC Management was named one of Pensions & Investments(3) 2025 Best Places to Work in Money Management. This represents SLC Management's sixth consecutive year of recognition. •BentallGreenOak ("BGO") launched BGO DataCenters, its European Hyperscale investment and development platform, focused on delivering customized sustainable, hyperscale, and AI-optimized digital infrastructure across Europe, meeting growing demand in one of real estate’s fastest-growing sectors. •Crescent Capital Group ("Crescent") launched GP Financing, which offers sponsors flexible financing solutions to address strategic growth needs, and Bank Capital Solutions, which focuses on credit risk-sharing transactions. These strategies broaden Crescent's private credit offerings. •Crescent was recognized by Private Debt Investor in 2025 as the Lower Mid-Market Lender of the Year in Europe for the publication’s 2024 Annual Awards. This award reflects Crescent’s consistent performance, deep market expertise and commitment to providing flexible financial solutions to lower mid-market companies and their sponsors across Europe. •SLC Management appointed Richard Familetti to President and Chief Investment Officer, SLC Fixed Income. •Advisors Asset Management, Inc. ("AAM") appointed Lindsay DeGrazia as Managing Director, Head of Alternative Investments Distribution, to oversee sales and distribution for private markets investments in U.S. wealth channels. •Sonny Kalsi, President and CEO of SLC Management, ranked among one of the top ten Most Influential figures globally in private equity real estate in the 2025 PERE(4) rankings. BGO also ranked fourth among the world’s top private real estate managers in the 2025(5) rankings. The achievement reflects BGO’s strong fundraising over the last five years despite macroeconomic headwinds. •Crescent closed its third European specialty lending fund in April, raising approximately €3 billion. This fundraise represents a significant increase from its predecessor fund and continues Crescent’s strategy of investing primarily in a diversified portfolio of private secured debt securities issued by European companies. •InfraRed Capital Partners ("InfraRed") announced the formation of a strategic Separately Managed Account ("SMA") with a large European pension services provider. The SMA has been established to provide the company with diversified exposure to social infrastructure investments across Europe. •InfraRed entered into a definitive agreement to acquire a large Canadian telecommunications firms' data centre business to expand its footprint in Canada’s digital infrastructure market, capitalizing on rising demand for secure and reliable data centre services. |
(1)Represents a non-IFRS financial measure. For more details, see section M - Non-IFRS Financial Measures in this document.
(2)ISS Market Intelligence Simfund.
(3)Pensions & Investments, a global news source of money management.
(4)Private Equity Real Estate ("PERE"). 2025 PERE 100 Most Influential; those who had the biggest impact on the world's private real estate capital markets.
(5)2025 PERE 100 ranking of the world’s largest private real estate companies.
| | | | | | | | | | | | | | | | | | | | |
20 | December 31, 2025 | Sun Life Financial Inc. | | MANAGEMENT'S DISCUSSION & ANALYSIS | |
Strategy and Outlook
Our strategy is to provide investment products through MFS and SLC Management that will deliver long-term value to our Clients in active asset management as well as fixed income and alternative asset classes. MFS competes primarily in the global institutional, U.S. retail and select non-U.S. retail markets. SLC Management competes primarily in the global institutional market, offering a broad and deep fixed income and real assets platform through affiliate managers. SLC Management leverages Sun Life’s long-standing expertise in private asset class investments, augmented by the specialized alternative capabilities of SLC Management's affiliate managers, to offer customized investment solutions to investors. In addition, with our majority interest in AAM and partnership with Scotia Global Wealth Management, SLC Management is also delivering solutions to the retail HNW market in North America.
| | |
MFS: Continue to deliver superior investment performance while allocating capital responsibly for our Clients MFS' active management strategy focuses on delivering value to our Clients over the long-term. Our relative performance provides us with a strong competitive position: •MFS is well-positioned to attract flows from all Client sectors that are seeking risk-managed returns over the long-term based on our disciplined, long-term approach. We are engaging Clients to align with MFS to focus on longer investment horizons, to leverage our proven ability to deliver risk-adjusted performance through a market cycle. •To help our Clients maximize the financial return of their portfolio within appropriate risk parameters, we employ an investment approach that focuses on issuers with durable, long-term competitive advantages. This means we consider all factors that we believe will materially impact the economic value of the issuer in our fundamental investment process. •Our strategic focus for long-term success is based on our collaborative and excellence-driven organization. •MFS strives to maintain margins in the top quartile of active managers while maintaining our commitment to provide long-term value to Clients. •Our people are our greatest investment, and we believe in the power of teamwork, which makes sustaining and enhancing inclusivity a top priority. |
| | |
SLC Management: Help investors meet their investment objectives by offering a broad suite of alternative asset classes and fixed income strategies We are well-positioned to take advantage of key trends in our target markets: •Consolidation of investment manager relationships by institutional investors. •Improvement in interest rate environment for risk assets, driven by central banks rate cuts. •Likely bottoming of real estate valuations, spurring increased activity. •Continued growth and broadening of private credit, supported by the long-term shift from public to private markets, and rising demand from insurance companies. •AI and data centre demand driving continued long-term growth in real assets. •Wealth as the next big growth area for alternatives, with AUM projected to triple over the next decade(1).
Our strategy is to continue to deliver superior investment performance, expand and deepen our distribution relationships, and build out our product lineup, while retaining our top talent. We offer our Clients a compelling suite of investment capabilities to meet their needs, including: •Leading public and private fixed income capabilities, spanning both investment grade and alternative credit; •Global real estate expertise across both equity and debt investments; and •Global infrastructure capabilities. |
| | |
Outlook |
MFS We remain cautious on global equity market outlook. While global recession odds appear low due to the significant capital investment underpinning AI, as well as onshoring and electrification, businesses nonetheless face higher input cost pressures against potentially slowing revenues due to rising competitive threats from new industry entrants via AI. At the same time, valuations imply profits will continue to grow. This is a common pattern observed late in market cycles and sets-up for potentially very volatile financial markets when profits disappoint. This could create greater opportunities for active managers to outperform benchmarks. MFS employs an investment philosophy that involves a long-term approach across the complete business cycle. Our scale, proven long-term track record and broad product portfolios, coupled with our investment philosophy, position us well to deliver strong results over a market cycle. Our expense structure leverages significant variable costs, and as a result, a majority of our expense base adjusts with market dynamics. In addition, we will continue to be diligent with discretionary spending while investing in strategic initiatives that help grow the business over the long-term.
SLC Management We expect private markets activity to continue to rebound through 2026. Real estate valuations appear to be at or near bottom, with activity expected to increase. The interest rate environment, primarily in the U.S., has created a more accommodative environment for private markets, supporting an expected rebound in real estate valuations and accelerating M&A activity, which benefits private credit. Regardless of the rate environment, we expect to see continued demand for yield-oriented fixed income and alternative asset classes, which provide portfolio diversification, a potential hedge against inflation, and a reduction in overall risk exposure across investments. We believe that we are well positioned to meet this demand with our platform of world-class investment capabilities, complimentary businesses that drive product and distribution opportunities, and our ability to leverage global resources. Our majority stake in AAM and partnership with Scotia Global Wealth Management provides further momentum to SLC Management to grow and expand our retail HNW business in North America. Certain investment capabilities we use for our Clients are the same capabilities that we use in managing the general account of Sun Life; this facilitates co-investment opportunities that result in an alignment of interest with our Clients and enables SLC Management's speed to market for products. |
(1)Bain & Company – Avoiding Wipeout: How to Ride the Wave of Private Markets (Aug, 2024).
| | | | | | | | | | | | | | | | | | | | |
| MANAGEMENT'S DISCUSSION & ANALYSIS | | Sun Life Financial Inc. | December 31, 2025 | 21 |
Business Types and Business Units
| | | | | | | | | | | |
| Business Type | Business Unit | Description | Market position |
| Asset Management | MFS | • Actively manages assets for retail and institutional investors, including pension plans, sovereign wealth funds, monetary authorities, and endowments and foundations. • Retail products are distributed through financial advisors, brokerages and other professionals. • Institutional products are distributed by an internal sales force, which is aided by a network of independent consultants. | • US$651 billion in AUM • The 9th largest U.S. Retail funds manager(1) |
| SLC Management | • SLC Management delivers public and private credit, fixed income, real estate and infrastructure solutions to Clients through a group of affiliate managers, including: • BentallGreenOak, a global real estate investment manager. • InfraRed Capital Partners, a global infrastructure and real estate investment manager headquartered in London, UK. • Crescent Capital Group, a U.S.-based global alternative credit investment manager. • SLC Fixed Income, a North American institutional asset manager specializing in investment grade public and private fixed income portfolios. • Advisors Asset Management, Inc., a turnkey distribution company for U.S. retail. • Institutional products are distributed by an internal sales force, which is aided by a network of independent consultants. Our majority stake in AAM provides access to U.S. retail distribution and allows SLC Management to meet the growing demand for alternative assets among U.S. HNW investors. SLC Management's strategic partnership with Scotiabank distributes alternative investment capabilities to the Canadian retail market through Scotia Global Wealth Management. | • $260 billion in AUM • BGO ranked 4th among the world’s top private real estate managers(2) |
(1) Based on AUM as at December 31, 2025, ISS Market Intelligence Simfund.
(2) 2025 PERE 100 ranking of the world’s largest private real estate companies.
| | | | | | | | | | | | | | | | | | | | |
22 | December 31, 2025 | Sun Life Financial Inc. | | MANAGEMENT'S DISCUSSION & ANALYSIS | |
Financial and Business Results
| | | | | | | | | | | |
| | |
| Asset Management (C$ millions) | | | | 2025 | 2024 |
Underlying net income(1) | | | | 1,371 | 1,293 |
| Add: Market-related impacts | | | | (47) | (20) |
MFS shares owned by management | | | | 2 | (22) |
Acquisition, integration and restructuring(2)(3) | | | | (72) | 255 |
| Intangible asset amortization | | | | (29) | (24) |
Other | | | | (11) | 46 |
| Reported net income - Common shareholders | | | | 1,214 | 1,528 |
Assets under management (C$ billions)(1) | | | | 1,154.0 | 1,121.3 |
Gross flows (C$ billions)(1) | | | | 204.3 | 169.9 |
Net flows (C$ billions)(1) | | | | (39.9) | (62.8) |
MFS (C$ millions) | | | | | |
Underlying net income(1) | | | | 1,129 | 1,117 |
Add: MFS shares owned by management | | | | 2 | (22) |
Other | | | | (11) | — |
| Reported net income - Common shareholders | | | | 1,120 | 1,095 |
Assets under management (C$ billions)(1) | | | | 894.0 | 871.2 |
Gross flows (C$ billions)(1) | | | | 169.4 | 136.7 |
Net flows (C$ billions)(1) | | | | (58.1) | (79.4) |
| MFS (US$ millions) | | | | | |
Underlying net income(1) | | | | 809 | 817 |
Add: MFS shares owned by management | | | | 1 | (17) |
| Other | | | | (8) | — |
| Reported net income - Common shareholders | | | | 802 | 800 |
Pre-tax net operating margin for MFS(1) | | | | 37.5% | 38.7% |
Average net assets (US$ billions)(1) | | | | 629.9 | 621.6 |
Assets under management (US$ billions)(1)(4) | | | | 651.4 | 605.9 |
Gross flows (US$ billions)(1) | | | | 121.2 | 99.8 |
Net flows (US$ billions)(1) | | | | (41.5) | (57.8) |
| Asset appreciation (depreciation) (US$ billions) | | | | 87.1 | 65.1 |
| SLC Management (C$ millions) | | | | | |
Underlying net income(1) | | | | 242 | 176 |
| Add: Market-related impacts | | | | (47) | (20) |
Acquisition, integration and restructuring(2)(3) | | | | (72) | 255 |
Intangible asset amortization | | | | (29) | (24) |
Other | | | | — | 46 |
Reported net income - Common shareholders | | | | 94 | 433 |
Fee-related earnings(1) | | | | 365 | 285 |
Pre-tax fee-related earnings margin(1)(5) | | | | 27.5% | 23.0% |
Pre-tax net operating margin(1)(5) | | | | 26.9% | 21.1% |
Assets under management (C$ billions)(1) | | | | 260.0 | 250.1 |
Gross flows - AUM (C$ billions)(1) | | | | 34.9 | 33.2 |
Net flows - AUM (C$ billions)(1) | | | | 18.2 | 16.6 |
Fee earning assets under management ("FE AUM") (C$ billions)(1) | | | | 199.7 | 192.7 | |
Gross flows - FE AUM (C$ billions)(1) | | | | 39.3 | 29.4 |
Net flows - FE AUM (C$ billions)(1) | | | | 25.8 | 14.7 |
Assets under administration ("AUA") (C$ billions)(1) | | | | 18.5 | 15.9 |
Capital raising (C$ billions)(1) | | | | 22.3 | 23.9 |
Deployment (C$ billions)(1) | | | | 34.5 | 22.5 |
(1)Represents a non-IFRS financial measure. For more details, see section M - Non-IFRS Financial Measures in this document.
(2)Amounts relate to acquisition costs for our SLC Management affiliates, BentallGreenOak, InfraRed Capital Partners, Crescent Capital Group LP and Advisors Asset Management, Inc, which include the unwinding of the discount for Other financial liabilities of $56 million in 2025 ( 2024 - $76 million).
(3)Reflects an increase of $4 million in estimated future payments for options to purchase the remaining ownership interests of SLC Management affiliates in 2025 (2024 - a decrease of $344 million). For additional information, refer to Note 5 and Note 11 of our 2025 Annual Consolidated Financial Statements.
(4)Monthly information on AUM is provided by MFS in its Corporate Fact Sheet, which can be found at www.mfs.com/CorpFact. The Corporate Fact Sheet also provides MFS' U.S. GAAP assets and liabilities as at December 31, 2025.
(5)Based on a trailing 12-month basis. For more details, see section M - Non-IFRS Financial Measures in this document.
| | | | | | | | | | | | | | | | | | | | |
| MANAGEMENT'S DISCUSSION & ANALYSIS | | Sun Life Financial Inc. | December 31, 2025 | 23 |
Profitability
2025 vs. 2024
Asset Management underlying net income of $1,371 million increased $78 million or 6% driven by:
•MFS up $12 million (down $8 million on a U.S. dollar basis): Higher fee income from higher average net assets ("ANA") and the impacts from favourable foreign exchange translation partially offset by a decrease in net investment income.
•SLC Management up $66 million: Higher fee-related earnings and strong performance of net seed investment income. Fee-related earnings(1) increased 28% driven by strong capital raising, higher property management fees, and higher catch-up fees, partially offset by higher expenses.
Reported net income of $1,214 million decreased $314 million or 21%, reflecting market-related impacts in SLC Management and the prior year impacts from the decrease in SLC Management's estimated acquisition related liabilities(2) and gain on the early termination of a distribution agreement, partially offset by the increase in underlying net income and fair value changes in MFS shares owned by management.
Foreign exchange translation led to an increase of $21 million in underlying net income and an increase of $25 million in reported net income.
Growth
2025 vs. 2024
Asset Management AUM of $1,154.0 billion increased $32.7 billion or 3% from December 31, 2024, driven by:
•Net asset value changes of $80.2 billion; partially offset by
•Net outflows of $39.9 billion; and
•Client distributions of $7.6 billion.
MFS' AUM increased US$45.6 billion or 8% from December 31, 2024, driven by:
•Increase in asset values from higher equity markets of US$87.1 billion, partially offset by net outflows of US$41.5 billion.
SLC Management's AUM increased $9.9 billion or 4% from December 31, 2024, driven by:
•Net inflows of $18.2 billion partially offset by Client distributions of $7.6 billion and asset value changes of $0.7 billion.
•Net inflows were comprised of capital raising and Client contributions, totaling $34.9 billion, partially offset by outflows of
$16.7 billion.
SLC Management's FE AUM increased $7.0 billion or 4% from December 31, 2024, driven by:
•Net inflows of $25.8 billion partially offset by Client distributions of $13.4 billion and asset value changes of $5.5 billion.
•Net inflows were comprised of capital deployment and Client contributions, totaling $39.3 billion, partially offset by outflows of
$13.4 billion.
(1)Represents a non-IFRS financial measure. For more details, see section M - Non-IFRS Financial Measures in this document.
(2)Reflects an increase of $4 million in estimated future payments for options to purchase the remaining ownership interests of SLC Management affiliates in 2025 (2024 - a decrease of $344 million). For additional information, refer to Note 5 and Note 11 of our 2025 Annual Consolidated Financial Statements.
| | | | | | | | | | | | | | | | | | | | |
24 | December 31, 2025 | Sun Life Financial Inc. | | MANAGEMENT'S DISCUSSION & ANALYSIS | |
2. Canada
| | |
Sun Life Canada is a leading provider of protection, health, wealth solutions and asset management, providing products and services that deliver value to approximately 1 in 3 Canadians. We are focused on helping Canadians achieve lifetime financial security and live healthier lives through our continuum of distribution channels including workplace, employment transition and retirement services, retail advisors, and digital platforms. Our advisors form the largest dedicated life, health and investment services network in Canada. We have nearly 2,650 Sun Life career salesforce across the country. |
2025 Highlights
| | |
Expanding our core business through innovation in Capital Accumulation Plans ("CAPs")(1), group benefits, and individual insurance •Delivered strong gross sales in group benefits(2) with 15% growth compared to the prior year. •Strengthened our leading position(3) in GRS market share with a 130% growth in net sales in CAPs compared to the prior year. •Supported more Canadians with their protection needs delivering 10% growth in non-participating individual insurance sales compared to the prior year, improving to first in the market for Critical Illness sales(4). |
| | |
Enhancing our distinctive wealth and asset management platform •Scaled our wealth business increasing AUMA(5) by 12% compared to the prior year, with strong net inflows(6) of $1.4 billion in 2025. •Improved the digital experience for former members of employer-sponsored wealth plans by automating processes to continue retirement wealth support and management after leaving their workplace plan. •Diversified investment product portfolio with the launch of Sun Life Canada’s first ETF series serving Canadians’ growing interest in lower-fee investment options. •Enhanced SLFD(7) advisor capabilities, capacity, and productivity, driving a 56% increase in net wealth sales and 14% increase in assets under administration compared to the prior year. |
| | |
Creating new engines of growth by elevating our health products and serving more Client needs across health, wealth and protection •Enhanced Clients’ digital experience creating the My Sun Life app digital storefront to help Clients discover and access health and wealth products and simplify Client navigation. •Helped Clients and their families make more informed health decisions with the launch of Medical Second Opinion by Dialogue, a digital-first service that offers expert reviews of diagnoses and treatment plans for physical and mental health conditions. •Increased unique users of Sun Life Health products including Lumino Virtual Health Care, Employee Assistance Program, and others by 20% compared to the prior year through improvements in digital experiences and service offerings. |
| | |
Institutionalizing an entrepreneurial, digital-first model propelling our organization to deliver outcomes at pace and design, pilot, and build new digital products and experiences •Implemented 14 value streams to enable our business units and enabling functions to execute with speed and focus, and organize around prioritized Client and business outcomes. •Leveraged AI tools to do more for our Clients including reduced median response times for individual insurance applications for a target segment by close to half (including increasing straight-through underwriting by 50%), increased chatbot containment rate (up 16 percentage points year-over-year) with generative AI tools in the Client Contact Centre, and enhanced advisor productivity using a generative AI-powered Notes Assistant Tool. •Increased the share of new Clients who are digitally registered by 12% compared to the prior year with mobile and web enhancements and onboarding journey refinements. |
| | |
Creating measurable and sustainable value for all stakeholders •Achieved underlying net income of $1,594 million, an increase of 10% compared to the prior year. •Delivered underlying ROE of 27.6%, an improvement of five percentage points compared to the prior year. •Named Life and Health Insurer of the Year at the tenth annual Insurance Business Canada Awards for our commitment to exemplary Client service and standout achievements in Canada. •Strengthened our commitment to Indigenous relations by becoming the first Canadian insurer to be awarded a Bronze certification in the Partnership Accreditation in Indigenous Relations in the Canadian Council for Indigenous Business program. •Recognized by Great Place To Work® Canada with four awards in 2025 (Best WorkplacesTM Canada, Best WorkplacesTM with Most Trusted Executive Teams, Best WorkplacesTM in Financial Services & Insurance, and Best WorkplacesTM for Inclusion. •Brought no-cost access to virtual healthcare, by Dialogue, to more than 10,000 people in underserved communities across Canada through partnerships with Families Canada, United Way Greater Toronto, and Centraide of Greater Montreal. |
(1)Sun Life's capital accumulation plans ("CAPs") are retirement savings programs for businesses to offer their employees, including options like defined contribution plans, group RRSPs, and profit-sharing plans.
(2)"Group benefits" refers to group life and health insurance solutions such as health, dental, vision, and extended healthcare; and/or administrative services for employers.
(3)Fraser Pension Universe report, based on assets for the year ended December 31, 2024.
(4)Life Insurance Marketing and Research Association ("LIMRA"). Market Share as of Q3'25, on a year-to-date basis.
(5)Assets under management and administration (“AUMA”) is a non-IFRS measure that consists of both AUM and assets under administration (“AUA”). For more details, see section M - Non-IFRS Financial Measures in this document.
(6)Represents a non-IFRS financial measure. For more details, see section M - Non-IFRS Financial Measures in this document.
(7)Sun Life Financial Distribution ("SLFD") is our proprietary career advisory network.
| | | | | | | | | | | | | | | | | | | | |
| MANAGEMENT'S DISCUSSION & ANALYSIS | | Sun Life Financial Inc. | December 31, 2025 | 25 |
Strategy and Outlook
Sun Life Canada lives our Purpose to help more Canadians achieve lifetime financial security and live healthier lives. Our ambition is to create measurable and sustainable value for all our stakeholders: Clients, People, Shareholders, and Communities. We will continue to invest in our unique Purpose-driven talent and culture and do more for our Clients to earn the right to serve them and their families for life. Sun Life Canada will maintain the track record of sustained profitable growth and strong return on equity by executing on four strategic priorities:
| | |
Expanding our core business through innovation in CAPs(1), group benefits, and individual insurance •Deliver best-in-class service to our Clients and offer tailored solutions to meet Canadians’ wealth and insurance needs across digital, face-to-face, hybrid-digital, third-party, and employer-sponsored channels. •Innovate insurance to help more Canadians protect themselves and their loved ones. •Support small and medium-sized businesses with more targeted value propositions and go-to-market strategies suited to their needs.
|
| | |
Enhancing our distinctive wealth and asset management platform •Expand our integrated digital and advisor wealth platform to serve growing needs of digitally minded wealth Clients. •Elevate the retirement wealth journey with new and improved offerings, and simplified user navigation. •Meet evolving Client and member needs with new and enhanced wealth products by leveraging our leading asset management capabilities (e.g., Sun Life Granite Index+ Target Date funds(2) and Separately Managed Accounts(3)). •Leverage our differentiated private asset capabilities (SLC Management and MFS) to continue to innovate our wealth product offerings.
|
| | |
Creating new engines of growth by elevating our health products and serving more Client needs across health, wealth and protection •Integrate our health and wellness offerings to provide a more distinctive and valued digital experience for Clients. •Serve more Clients and their health needs by further scaling our health products (e.g., virtual care platform, ePharmacy, chronic disease management programs). •Deepen and strengthen Client relationships by expanding engagement and serving additional needs with integrated solutions across lines of business.
|
| | |
Institutionalizing an entrepreneurial, digital-first model, propelling our organization to deliver outcomes at pace and design, pilot, and build new digital products and experiences •Rapidly deliver new direct-to-consumer digital offerings via our dedicated in-house accelerator program, adopting a test-and-learn, iterative approach for high-potential initiatives; expanding our relationships with Canadians. •Increase operational efficiency by simplifying and digitizing how we work by deploying more AI tools in the Contact Centre, boosting share of time coding with digital and productivity enhancements, and increasing efficiency through AI-written code; enabling our team to dedicate resources to innovate and help drive earnings growth. •Encourage a more integrated, hands-on, and entrepreneurial way of working throughout the organization, driving innovation and further strengthening our competitive position.
|
| | |
Outlook |
Sun Life Canada is operating from a position of strength. We touch approximately one third of Canadians and have a broad reach in workplaces and communities through sponsors and advisors. We have a differentiated offering across wealth, health, and protection and have sustained strong financial growth underpinned by our Purpose-driven culture and exceptional talent. We have a unique opportunity to leverage our strengths and create new pathways to drive sustainable growth and help more Canadians achieve lifetime financial security and live healthier lives.
Health, wealth, and protection will continue to be prominent needs for Canadians – 75% of Canadians cannot access same/next day appointments(4), nearly 60% of Canadians fear they will outlive their retirement savings(5), 21% of Canadians between 18 and 75 years old have an uninsured need(6). We continue to enhance our offerings across these needs, enabled by investments in systems, distribution and digital capabilities. Our approach is digital-first, delivering quickly to strengthen our competitive position, and earning Client loyalty through integrated offerings. We are well positioned to manage through prevailing demographic, healthcare, technological and macroeconomic trends through our diversified Client-centric businesses and prudent financial and risk management.
|
(1)Sun Life's capital accumulation plans ("CAPs") are retirement savings programs for businesses to offer their employees, including options like defined contribution plans, group RRSPs, and profit-sharing plans.
(2)Diversified portfolio of index-based funds plus private market investments, that is designed to adjust asset mix over time as Clients approach a specified retirement date.
(3)Personalized investment portfolios managed by a professional.
(4)Canadian Institute for Health Information, 2025.
(5)The Canada Pension Plan ("CPP") Investments Retirement Survey, 2025.
(6)LIMRA 2023 Canadian Insurance Barometer Study.
| | | | | | | | | | | | | | | | | | | | |
26 | December 31, 2025 | Sun Life Financial Inc. | | MANAGEMENT'S DISCUSSION & ANALYSIS | |
Business Types and Business Units
| | | | | | | | | | | |
| Business Type | Business Unit | Description | Market position |
Asset management & wealth | Group Retirement Services | • Provides record-keeping solutions for capital accumulation plans (such as defined contribution pension plans) and defined benefit solutions in Canada to employers of all sizes. • Leverages our worksite advantage to offer voluntary savings plans, including post-employment plans, to those members exiting their employer-sponsored plans. • Offers planning and asset consolidation capabilities for current and former plan members to benefit from a simplified and seamless experience with a single provider. • Distributes products through sales representatives in collaboration with a multi-channel distribution network of pension consultants and advisors. • Offers an expanding range of innovative derisking solutions for defined benefit pension plans through Defined Benefits Solutions business. Effective January 1, 2026, Defined Benefit Solutions will move from the Canada business group to the Sun Life Asset Management business group. | • 1st in the defined contribution market based on total Capital Accumulation Plan assets for the 23rd consecutive year(1) • 3rd in sales in the defined benefit solutions annuity market(2) |
| Individual Wealth | • Provides advice to individuals to help them and their families achieve lifetime financial security, leveraging a broad suite of wealth and protection-based wealth solutions. • Distributes products via multi-channel distribution model consisting of the SLFD network, third-party channels, including independent brokers and our proprietary broker-dealers, and direct-to-consumer. • Manufactures wealth solutions for retail and institutional Clients. | • 3rd in fixed product sales(2) and 5th place market position by total wealth deposits and premiums(2) |
Group -
Health & Protection | Sun Life Health | • Offers group protection products in Canada, including life, dental, extended health care, disability and critical illness, and administrative services to employers of all sizes. • Provides employer-market health solutions (e.g., virtual primary care) and direct-to-consumer health products (e.g., online pharmacy). • Leverages our worksite advantage to offer voluntary benefits solutions to individual plan members, including post-employment life and health plans. • Distributes products by sales representatives in collaboration with independent advisors, benefits consultants and the SLFD network. | • 2nd in the Canada benefits provider market(3), by BIF(4) |
| Individual - Protection | Individual Insurance | • Offers comprehensive life and health protection products to individuals to help them and their families achieve lifetime financial security, and live healthier lives. • Distributes products via multi-channel distribution model consisting of the SLFD network, third-party channels, including independent brokers and broker-dealers, and direct-to-consumer including Prospr by Sun Life. | • 1st in the individual life and health market, by premiums(2) • 2nd in the individual non-participating life premiums for 2025(2) |
(1)Fraser Pension Universe Report, based on year-ended December 2024.
(2)LIMRA Market Share as of Q3'25, on a year-to-date basis.
(3)Fraser Group Life and Health in Canada Report, based on market share for year-ended December 2024. Group benefits industry market share does not account for Sun Life’s Canada Dental Care Plan business and similar plans not reported by other carriers. Our ambition is to extend our group benefits profit share leadership position in Canada.
(4)Business In-Force ("BIF") refers to total premiums and premium-equivalents (for non-insured plans).
| | | | | | | | | | | | | | | | | | | | |
| MANAGEMENT'S DISCUSSION & ANALYSIS | | Sun Life Financial Inc. | December 31, 2025 | 27 |
Financial and Business Results
| | | | | | | | | | | |
| | |
| ($ millions) | | | | 2025 | 2024 |
Asset management & wealth(1) | | | | 499 | 441 |
Group - Health & Protection(1) | | | | 650 | 591 |
Individual - Protection(1) | | | | 445 | 421 |
Underlying net income(1) | | | | 1,594 | 1,453 |
Add: Market-related impacts | | | | (151) | (177) |
Assumption changes and management actions | | | | — | (34) |
| Acquisition, integration and restructuring | | | | (11) | — |
| Intangible asset amortization | | | | (25) | (25) |
Other | | | | (5) | — |
Reported net income - Common shareholders | | | | 1,402 | 1,217 |
Underlying ROE (%)(1) | | | | 27.6% | 22.4% |
Reported ROE (%)(1) | | | | 24.2% | 18.8% |
Asset management gross flows & wealth sales(1) | | | | 22,531 | 18,144 |
Group - Health & Protection sales(1) | | | | 769 | 666 |
Individual - Protection sales(1) | | | | 538 | 551 |
(1)Represents a non-IFRS financial measure. For more details, see section M - Non-IFRS Financial Measures in this document. For more information about business types in Sun Life's business groups, see section A - How We Report Our Results in this document.
Profitability
2025 vs. 2024
Underlying net income of $1,594 million increased $141 million or 10%, driven by:
•Asset management & wealth up $58 million: Improved credit experience and higher fee income driven by higher AUM, partially offset by lower investment earnings.
•Group - Health & Protection up $59 million: Business growth, favourable mortality experience, and improved credit experience.
•Individual - Protection up $24 million: Higher investment earnings and favourable insurance experience.
•Lower earnings on surplus primarily reflecting lower net interest income from lower surplus asset balances and rates.
Reported net income of $1,402 million increased $185 million or 15% driven by the increase in underlying net income, favourable ACMA impacts, and market-related impacts primarily reflecting favourable interest rate impacts partially offset by unfavourable other market-related impacts.
Growth
2025 vs. 2024
Canada's sales included:
•Asset management gross flows & wealth sales of $22.5 billion were up 24%, driven by GRS and higher mutual fund sales in Individual Wealth. GRS sales reflect higher defined contribution sales from large case sales, and increased rollover volumes, partially offset by lower defined benefit solution sales reflecting a slower market for pension risk transfer transactions.
•Group - Health & Protection sales of $769 million were up 15%, driven by higher large case sales.
•Individual - Protection sales of $538 million were down 2%, reflecting a combination of lower participating life sales and strong non-participating life sales.
AUM for wealth businesses, including GRS, was $214.9 billion as at December 31, 2025, an increase of $18.7 billion or 10%, primarily reflecting market movements.
| | | | | | | | | | | | | | | | | | | | |
28 | December 31, 2025 | Sun Life Financial Inc. | | MANAGEMENT'S DISCUSSION & ANALYSIS | |
3. U.S.
| | |
Sun Life U.S. is one of the largest providers of employee and government benefits in the U.S., serving approximately 48 million Americans. We offer dental and vision, medical stop-loss, supplemental health, disability, and life insurance benefits through employers, industry partners and government programs such as Medicaid, Medicare Advantage, and the Children's Health Insurance Program ("CHIP"). Services include absence management, dental care, and healthcare navigation. In addition, our U.S. business manages an in-force block of approximately 200,000 individual life insurance and annuity policies as well as a closed block of reinsurance. |
2025 Highlights
| | |
Growing our business •Sun Life U.S. Client revenues grew to US$8.5 billion in 2025, driven by the successful execution of our strategy to help Clients access the care and coverage they need. •Sun Life U.S. sales increased by 27% to a record US$1.8 billion, driven by double-digit growth in Health and Risk Solutions, Dental and Employee Benefits. •In Dental, our strong sales pipeline generated 15 new government contract wins during the year. We now provide members access to the dental care and coverage they need across 37 states.
|
| | |
Helping Clients access the care and coverage they need •Expanded our Family Leave Insurance product to 17 new states in 2025, making it easier for small and mid-size employers to help their employees meet family care needs. Sun Life now offers family leave products to employers in 31 states through statutory and voluntary programs that represent approximately 67% of the U.S. population. •Partnered with Wellthy, a personalized care concierge platform, in Employee Benefits to make it easier for life insurance members and their families to navigate the complex challenges associated with end-of-life care and bereavement. The service offered through this partnership will help our members and their families through some of life's hardest experiences. •Launched the Expert Cancer Review service in Health and Risk Solutions, which provides members facing a cancer diagnosis with access to an objective, documented second opinion from an independent oncology specialist through the clinical expertise of Health Navigator, Sun Life’s health care navigation and advocacy service. Second opinions can have significant impact on the patient’s health journey, potentially avoiding misdiagnoses, sparing people from unnecessary treatments, uncovering better-tailored therapies, and reducing medical costs. •Extended our TeamSmile partnership through the end of 2027 including support of US$825,000 to help more underserved children get oral health care and education through TeamSmile's flagship free dental clinics and the Dental Home Project, Powered by DentaQuest. In 2025, TeamSmile served more than 5,600 children across 32 programs in 29 cities, delivering more than US$1.6 million in no-cost care, while also helping connect nearly 2,500 children to a dental home.
|
| | |
Making health and benefits easier through digital solutions •Named one of the first strategic Workday Wellness partners and utilized Workday’s AI platform to show a real-time view of the benefits and wellness programs that employers are offering. The partnership will simplify benefits management, streamline enrollment, enhance leave administration, and reduce administrative burdens. •Made it easier for Clients to do business with us by launching new and enhanced employer portals, including FullscopeRMS’ new Integrated Absence & Short-Term Disability portal Your Benefit Connect. The portal provides a streamlined claims-filing experience for members, and enhanced reporting tools, including self-service options, for FullscopeRMS partners and employers. •Streamlined the Supplemental Health claims process, strengthening straight-through processing and delivering more automated claims integration. These changes improved Client satisfaction(1) by 20 points in 2025 and enabled faster claims payments to members by 55% year-over-year, even as claim volumes rose by more than 70% during the same time period. •Collaborated with Pasito, an AI-powered platform that connects with more than 200 payroll providers to deliver personalized benefits guidance. This helps members choose plans that fit their needs, their budgets and best compliment their health coverage, driving better engagement and member decision making.
|
(1)Client satisfaction scores ("CSAT") are sourced from regular monthly surveys of Clients who have recently used our Supplemental Health products. The CSAT score is the overall satisfaction score where claimants were "very satisfied" with their claims experience as of November 2025.
| | | | | | | | | | | | | | | | | | | | |
| MANAGEMENT'S DISCUSSION & ANALYSIS | | Sun Life Financial Inc. | December 31, 2025 | 29 |
Strategy and Outlook
Our strategy is to be a leader in U.S. health and benefits, helping members access the care and coverage they need. The US$5.6 trillion health and benefits ecosystem(1) is complex. Navigating the ever-changing health ecosystem to get access to care continues to be a challenge for members due to fewer health care professionals, planned reductions in government spending, increased demand as the population ages, and rising health care costs.
Sun Life U.S. is a diversified, higher-growth business with lower capital and strong cash flow generation. We are filling unmet needs and gaps in health insurance, helping members access and navigate care, and improving health outcomes for our members. We have significantly advanced our capabilities with our DentaQuest and PinnacleCare acquisitions, added new capabilities that support the clinical needs of our most medically complex stop-loss members, and expanded our clinical capabilities in the disability business.
We are a differentiated provider whose offerings complement core health insurance offerings from large U.S. health insurers. Our medical stop-loss and dental benefits businesses are leaders in the U.S. market, and our employee benefits business is a top-10 provider. Through our dental business, we are also part of the large government programs market that covers more than 170 million Americans(2). The role we play for our Clients is more important than ever. We will leverage our scale and expertise, be disciplined in pricing and expenses, and continue to leverage technology to enhance Client experiences.
Digital innovation has been key to our success and will drive growth in the future. We have made significant strides, including using application programming interfaces ("APIs") for real-time information and simplifying claims processes. Our digital tools and support services make it easier to do business with us and close coverage gaps. We also continue to leverage our unique partnership capabilities to drive growth by delivering solutions to our more than 100 health plan and insurance company partners to support their members.
We are focused on the following areas and priorities to execute our strategy:
| | |
Helping Clients access the care and coverage they need •Expand and enhance the products and services we offer across our businesses to help members access care and improve health outcomes. •Extend our leadership position and further differentiate our medical stop-loss business by helping members get the care they need while helping employers reduce costs. •Leverage our dental scale and expertise to provide quality oral health care to all, continue to grow our government dental business, and become a leader in commercial dental. •Enhance our employee benefits offerings across disability, absence, life, and supplemental health to provide income protection, fill gaps in coverage and provide access to care. •Provide more Americans with access to paid family and medical leave and help employers comply with complex regulations. •Drive growth in FullscopeRMS by leveraging our expertise, scale, and suite of turnkey solutions for insurance and health plan partners, to improve coverage for their members. |
| | |
Making health and benefits easier through digital solutions •Continue to connect with major platforms in the health and benefits ecosystem, delivering a seamless Client experience. •Drive digital expansion through new capabilities and partnerships to deliver predictive and personalized analytics to help Clients make decisions that are right for them. •Continue to develop digital tools to increase Client interactions and engagement and deliver deeper insights for brokers and employers. •In non-government relationships, leverage AI responsibly to help employers navigate the complex environment, provide simplified and integrated solutions, and help members understand the value of our products and services. |
| | |
Help In-force Management policy-owners achieve lifetime financial security, while effectively managing our operations •Continue to provide excellent service to our individual insurance and annuity policy owners. •Optimize the value of the business by implementing opportunities to improve profitability, including expense efficiencies and alternative investment strategies. •Effectively manage risk and capital through reinsurance and other forms of portfolio restructuring. |
(1)Centers for Medicare & Medicaid Services, Office of the Actuary, National Health Statistics Group, 2025 projections.
(2)Aggregate for Medicaid, Medicare, Affordable Care Act, and TRICARE. Sources: Centers for Medicare & Medicaid Services.
| | | | | | | | | | | | | | | | | | | | |
30 | December 31, 2025 | Sun Life Financial Inc. | | MANAGEMENT'S DISCUSSION & ANALYSIS | |
| | |
Outlook |
The U.S. health and benefits ecosystem is large and growing, with Clients increasingly valuing protection products and health services. These markets remain extremely competitive with rising medical costs and structural changes impacting all health-related insurers. In the Medicaid dental business, higher member utilization and slower than anticipated rate increases are pressuring results, while significant upcoming reductions in government funding and changes in government policy are creating uncertainty in the market. Escalating levels of medical inflation and elevated claims experience is driving higher acuity in medical stop-loss, while concerns rise about potential increases in group disability incidence and reduced recovery rates if the economy worsens.
We are taking actions to enhance results as we continue to navigate these industry-wide headwinds. The majority of our group and dental business is repriced every year. In Dental, we are making progress repricing our Medicaid dental contracts. We continue to win new business and are also investing in opportunities to improve operational performance, increase automation, and accelerate the growth of our commercial business, where we have grown revenues and membership by more than 20% since the DentaQuest acquisition. In Health and Risk Solutions, we continue to leverage our scale and expertise as the largest independent stop-loss provider in the U.S., maintaining industry-leading loss ratios. We remain prudent in our pricing and reserving practices and have leading capabilities including our clinical programs and point solutions for managing health conditions and costs, as well as advanced analytics tools and tailored risk selection processes to ensure we appropriately price for the risk we are taking. In Employee Benefits, we are differentiating by making benefits easier through digital connections into the benefits ecosystem, helping employers manage productivity and delivering a broad portfolio of solutions. We continue to focus on revenue growth, disciplined pricing, continuous improvement of claims management, and prudent expense management.
Our scale and expertise position us well to adapt to this environment and our diversified business is well-positioned for growth. We are committed to growing profitably and developing new approaches to demonstrate value to our members, helping them to live healthier lives. The underlying fundamentals in all our businesses are strong – we are winning new business, increasing productivity and efficiency, and helping our members get the care and coverage they need. Significant enhancements to our products, systems, and digital capabilities over the past several years have contributed to our growth, as have our recent acquisitions and partnerships. We continue to invest strategically in technology to enhance the Client experience and are leveraging advanced analytics to support our underwriting expertise, enhance operational efficiency, and drive strong sales growth and retention.
We continue to work with state and federal officials to increase access to benefits for our Clients. In addition to our focus on paid family and medical leave, which provides employers solutions to help their employees meet family care needs, we have increased our advocacy to maintain and expand dental coverage for beneficiaries of Medicaid and other government programs, and to keep employer-sponsored dental benefits affordable. We continue to monitor possible legislative and regulatory changes to key areas that impact our business, such as Medicaid funding, tax, data security and privacy, the use of AI, minimum loss ratios for employer-sponsored dental insurance plans, state government contractor requirements, and potential changes arising from the new federal administration. |
| | | | | | | | | | | | | | | | | | | | |
| MANAGEMENT'S DISCUSSION & ANALYSIS | | Sun Life Financial Inc. | December 31, 2025 | 31 |
Business Types and Business Units
| | | | | | | | | | | |
Business Type | Business Unit | Description | Market position |
| Group - Health & Protection | Group Benefits | • Employee Benefits provides group insurance products and services, including life, long-term and short-term disability, absence management, and supplemental health insurance such as hospital indemnity, accident and critical illness. Includes our FullscopeRMS business, which provides turnkey risk management solutions for insurers and health plans. • Health and Risk Solutions provides protection against large medical claims for employers who self-insure their employee health plans through medical stop-loss, health care navigation and advisory services, and health services through care partners to help members access care and improve health outcomes. • Products distributed through more than 32,000 independent brokers and benefits consultants, supported by 160 employed sales representatives. • Serves approximately 55,000 employers in small, medium and large workplaces across the U.S. and approximately 18 million members(1). | • Largest independent medical stop-loss provider(2) • Top 10 group life and disability benefits provider, including the leading turnkey disability provider(3) |
Dental | •Provides Medicaid, CHIP, Medicare Advantage, and ACA Exchange products and services to government and health plan sponsors and commercial group dental and vision solutions for employers of all sizes. •Serves approximately 32 million members(4). •Supports preventive dental care through its innovative Preventistry® model, which focuses on early and quality care, access, and measurable outcomes. •More than 70 Advantage Dental+ practices, which are located in underserved communities to help increase access to dental care. •The commercial Sun Life Dental Network® includes more than 145,000 unique providers and offers easy access to care with in-network cost benefits(5). | •One of the largest dental benefits provider in the U.S. based on membership(6) • Largest Medicaid dental benefits provider(7)
|
Individual - Protection | In-force Management | • In-force Management ("IFM") is a run-off block closed to new sales. IFM manages approximately 200,000 policies, including individual life insurance policies, primarily universal life and participating whole life insurance, individual annuity policies that were originally sold in the UK, and a closed block of reinsured policies. | |
(1)Includes members who also have a commercial Sun Life Dental and/or Vision coverage.
(2)Ranking compiled by Sun Life based on data contained in the 2024 Accident and Health Policy Experience Report from the National Association of Insurance Commissioners ("NAIC"). An independent stop-loss carrier is defined as a stop-loss carrier that does not also sell medical claim administration services.
(3)LIMRA 2024 Annual Sales & In-force Reports for Group Life & Disability. Long-term disability results exclude reserve buy outs. Group Term Life, long-term disability and short-term disability results exclude business sold through associations; includes business in-force managed by Sun Life for insurance carrier partners.
(4)Includes members who also have a Sun Life Group coverage.
(5)Sun Life's dental networks include its affiliate, Dental Health Alliance®, L.L.C. (DHA®), and dentists under access arrangements with other dental networks. Nationwide counts are state level totals.
(6)Based on membership as of December 31, 2025, for plans provided or administered by a Sun Life company. Ranking compiled by Sun Life and based on data disclosed by competitors.
(7)Based on membership as of September 2025. Ranking compiled by Sun Life using publicly available data from the September 2025 Medicaid & CHIP Enrollment Data Highlights, state Medicaid agencies and other sources, and information disclosed by competitors.
| | | | | | | | | | | | | | | | | | | | |
32 | December 31, 2025 | Sun Life Financial Inc. | | MANAGEMENT'S DISCUSSION & ANALYSIS | |
Financial and Business Results
| | | | | | | | | | | |
| | |
| (US$ millions) | | | | 2025 | 2024 |
Group - Health & Protection(1) | | | | 424 | 445 |
Individual - Protection(1) | | | | 127 | 121 |
Underlying net income(1) | | | | 551 | 566 |
Add: Market-related impacts | | | | 21 | (84) |
Assumption changes and management actions | | | | (43) | 105 |
Acquisition, integration and restructuring(2) | | | | (60) | (60) |
| Intangible asset amortization | | | | (101) | (64) |
| Other | | | | — | (52) |
Reported net income - Common shareholders | | | | 368 | 411 |
Underlying ROE (%)(1) | | | | 11.3% | 12.0% |
Reported ROE (%)(1) | | | | 7.6% | 8.7% |
After-tax profit margin for Group Benefits (%)(1)(3) | | | | 7.5% | 8.3% |
Group - Health & Protection sales(1) | | | | 1,828 | 1,434 |
(1)Represents a non-IFRS financial measure. For more details, see section M - Non-IFRS Financial Measures in this document. For more information about business types in Sun Life's business groups, see section A - How We Report Our Results in this document.
(2)Includes acquisition, integration and restructuring costs associated with DentaQuest, acquired on June 1, 2022.
(3)Based on underlying net income, on a trailing four-quarter basis. For more details, see section M - Non-IFRS Financial Measures in this document.
Profitability
2025 vs. 2024
Underlying net income of US$551 million decreased US$15 million or 3%, driven by:
•Group - Health & Protection down US$21 million: Lower Group Benefits results partially offset by higher Dental results. Group Benefits declined from higher distribution costs, unfavourable long-term disability experience in employee benefits and reserving updates in medical stop-loss. Dental results were driven by Medicaid repricing, prior year impacts, and higher fee income and management actions.
•Individual - Protection up US$6 million: Higher net investment results.
Reported net income of US$368 million decreased US$43 million or 10%, driven by unfavourable ACMA impacts, an impairment charge of US$45 million on a customer relationship intangible asset from the early termination of a U.S. group dental contract, and the decline in underlying net income, partially offset by favourable market-related impacts and a prior year provision in Dental. Market-related impacts were driven by improved real-estate experience and favourable interest rate impacts, partially offset by unfavourable equity market impacts.
Foreign exchange translation led to an increase of $16 million in underlying net income and an increase of $12 million in reported net income.
Growth
2025 vs. 2024
U.S. group sales of US$1,828 million were up 27%, driven by medical stop-loss and large case employee benefits sales in Group Benefits and higher Medicare and Medicaid sales in Dental.
| | | | | | | | | | | | | | | | | | | | |
| MANAGEMENT'S DISCUSSION & ANALYSIS | | Sun Life Financial Inc. | December 31, 2025 | 33 |
4. Asia
| | |
Our pan Asia businesses provides us with a strong footprint to take advantage of the high growth prospects in the region. We operate in eight Asian markets, delivering value to over 30 million Clients. ASEAN businesses provide asset management and wealth, protection and health solutions through a multi-channel distribution approach in the Philippines, Indonesia, and Vietnam. The Hong Kong business offers individual protection and wealth products through agency, broker and bancassurance distribution channels. Our Joint Ventures in China, India and Malaysia, provide asset management and wealth, protection and health solutions. The High Net Worth business provides individual protection solutions to HNW families and individuals, with operations in Singapore, Bermuda and Dubai. Regional Office represents Asia’s headquarters based in Hong Kong. |
2025 Highlights
| | |
Leverage distribution excellence to diversify our mix, build scale and deliver Client Impact •Strong protection sales momentum with growth of 30%(1) year-over-year and total weighted premium income ("TWPI") of $9.3 billion up 26%(1), over prior year, driven by higher sales in Hong Kong reflecting expanded distribution capabilities, and in India reflecting growth in bancassurance channels. •We continued to grow our distribution in fast-growth markets by launching an expanded 15-year partnership with CIMB Niaga, the second largest private bank in Indonesia, which contributed to Sun Life Indonesia's 51%(1) sales growth in 2025 compared to the prior year. Together, our digital capabilities and strong product offerings will better serve a broader Indonesian customer base. •Sun Life Philippines has been recognized as the top Million Dollar Round Table ("MDRT")(2) company in the country for 2025, with 444 advisors qualifying, affirming our leadership in the Philippine life insurance industry and our commitment to excellence through the Most Respected Advisor program. •In Hong Kong, we launched a market-first indexed universal life insurance product for eligible professional investors. This product addresses the growing market demand for high-end wealth management solutions and demonstrates our continuous innovation to meet our Clients' evolving needs. •We expanded our reach to our HNW Clients by opening an office in the Dubai International Financial Centre. |
| | |
Be a digital leader, enhancing the digital experience to transform the Client and advisor experience, and enable greater efficiency and scalability •We are dedicated to empowering advisors with digital tools and AI-powered insights and support. In Hong Kong, we launched Advisor Workbench, which streamlines multiple applications into a single, efficient platform, including Advisory Buddy, an integrated GenAI chatbot providing instant support to advisors. •We also have made significant investments in digitization and analytics to enhance the Client experience: ◦In India, our joint venture, Aditya Birla Sun Life Insurance Company Limited, achieved 100% digital adoption for new business, enabling a fully digital onboarding process that added over 200,000 Clients(3). ◦In Malaysia, Clients benefitted from a faster onboarding experience, with almost two-thirds of our Clients receiving automated underwriting decisions within two hours. ◦In Indonesia, we introduced automated claims features, delivering a faster and more efficient claims experience for our Clients, with digital submissions rising approximately eight percentage points from the prior year. We also launched Digital Check-In within our Client Service Centres, an online booking service which helps to reduce service centre wait times. |
| | |
Embed long-term, sustainable and resilient thinking into our business to drive value creation, positive impact, and align with our Purpose •We are creating impact-focused solutions that help our Clients build lasting financial security. In Hong Kong, we launched two new solutions to help Clients save for a comfortable retirement: a constituent fund(4) which provides Clients with stable income and capital appreciation over the medium-to-long-term, and RetireFree Immediate Annuity Insurance, a comprehensive lifelong retirement solution, which together with the RetireFree Booster Rider Insurance, offers first-in-market protection benefits and empowers Clients to customize their retirement plans according to their needs. •We are committed to building financial security through financial literacy initiatives across the region. In 2025, we signed a partnership with Aflatoun International to empower underserved communities across Asia with financial knowledge and education. •Our Hoops + Health program, in partnership with Beyond Sport(5), has helped more than 48,000 people since 2023 to get active, build healthy lifestyles, and prevent diabetes. This program underscores Sun Life's commitment to community health and wellness. •In the Philippines, Sun Life Grepa partnered with ASA Philippines(6) to expand access to insurance for underserved communities through a Microinsurance Program serving the foundation’s more than two million female members. In 2025, this program provided financial protection to more than 240,000 low-income individuals, helping to build financial security throughout the community. |
(1)This change excludes the impacts of foreign exchange translation. For more information about these non-IFRS financial measures, see section M - Non-IFRS Financial Measures in this document.
(2)A global independent association of the world's leading life insurance and financial service professionals. Most number of MDRT members in 2025.
(3)Added 294,000 Clients since Q4'24.
(4)Sun Life MPF Income Fund.
(5)Beyond Sport is a global foundation that leverages sport's transformative power to address today's critical social issues. It champions people, programs and communities that use sport to build opportunity and equity, creating a more inclusive and progressive world.
(6)ASA Philippines Foundation, Inc. ("ASA Philippines") is a non-profit, non-stock corporation specializing in microfinance.
| | | | | | | | | | | | | | | | | | | | |
34 | December 31, 2025 | Sun Life Financial Inc. | | MANAGEMENT'S DISCUSSION & ANALYSIS | |
| | |
Risk management capabilities and financial strength •On July 15, 2025, we invested $55 million cash in Bowtie Life Insurance Company Limited ("Bowtie"), which increased our ownership interest, excluding dilution, by approximately 11% and resulted in a total ownership interest of 55.8%. Our previously held interest in Bowtie was remeasured to its fair value, which resulted in a gain of $176 million recognized in reported net income. The investment reinforces Sun Life's long-term partnership with Bowtie, and our shared goal to make health insurance simple, accessible and affordable. Bowtie is Hong Kong's first virtual insurer and the market leader in the direct sales channel(1). |
Strategy and Outlook
To achieve our ambitious growth objectives and driving scale in all our markets, we will continue to capitalize on new opportunities. We are dedicated to building distribution excellence and offering a seamless digital experience for Clients and advisors. We will continue to foster our strong and distinctive culture, while attracting, developing and empowering high-calibre talent. We will embed long-term, sustainable and resilient thinking into our business, as we engage Clients along their journeys towards lifetime financial security and healthier lives. Our areas of focus for Asia are to:
| | |
Strengthen brand and differentiated Client value propositions to build and deepen quality Client, advisor, and employee relationships •Provide simple, relevant and reliable propositions and experiences for our Clients and partners. •Build a distinctive, trusted brand through investing further in high-impact brand campaigns that increase awareness and further builds consideration of Sun Life across Asia. •Provide quality advice and offer relevant financial solutions to enable Clients to plan and protect themselves from adverse financial events and invest for their future. •Embed greater client-centricity to differentiate Sun Life, become a partner in our Clients' life journeys by offering a wider set of wealth and health solutions and deepen the level of engagement across the Client journey. •Build a high-performance mindset and attract, develop and retain top talent. |
| | |
Deliver on bancassurance, sustainably grow agency, embed quality and optimize distribution mix •Build sustainable scale through a diversified mix of high performing, quality-focused channels that enhance Client impact by offering holistic sales advice delivered through our expanding range of life, wealth and health solutions. •Continue to effectively collaborate with existing bancassurance partners to unlock the potential of recent deals, and capture scale by embedding our insurance products into Clients’ bank journeys, integrating digital tools, and engaging with partners. •Scale agency and become the partner of choice for advisors to develop active and sustainable agency talent. |
| | | | | |
Accelerate on digital to transform Client and advisor experience, capture efficiencies, retain and gain Client and scale markets •Deliver digital Client experiences and increase engagement of prospective and existing Clients by being more personal, proactive and predictive to deepen our relationship and improve retention. •Empower advisors, including bancassurance distribution, by building best-in-class digital and data capabilities that provide leads generation, enable more engaging experiences, create Client impact, and enhance prospect conversion, advisor productivity, and recruitment and training. •Accelerate technology foundation modernization and leverage common tools and technology platforms across the region to enhance advisor and Client experience and deliver unit cost reductions. •Deliver digital innovation for our business units that unlocks meaningful growth, efficiencies, scale and distinctiveness. | |
| | |
Outlook |
Our diversified business, with a multi-country presence and multi-channel distribution, positions us well to deepen Client relationships, capture opportunities as they arise, and protects against adverse economic cycles and regulatory changes in any one market. In Hong Kong, recent regulatory developments have increased transparency requirements and influenced product competitiveness across the industry. That said, our disciplined product design and pricing positions us well to continue delivering high quality, Client-focused solutions.
Competition in Hong Kong and the High Net Worth markets continues to intensify, with competitive product offering and new entrants reshaping market dynamics. Despite this, our strengthened distribution, trusted brand, and market-leading HNW capabilities enable us to compete effectively by offering differentiated, high value protection and wealth solutions anchored by strong risk management and a best-in-class service model.
We expect that the region’s economic growth will continue, and rapid wealth creation, coupled with low insurance penetration rates, and an increasing aging population, will support sustained growth across all our markets over the medium-term. In addition, we expect to continue to reach more Clients by expanding our high-quality agency force and diverse network of bancassurance partners and broker partnerships, and enhancing digital tools.
Economic and geopolitical uncertainty, as well as intense competition, movements in interest rates and inflation continue to pose challenges to our businesses; however, our steadfast dedication to our Purpose and Clients, strengthening market positions, key strategic relationships, investments in digital and analytics, and ability to leverage Sun Life's global expertise, position us well for the future. As local governments continue to push responsibility down to their people in both the retirement and health spaces, we are well-equipped to offer current and prospective Clients a diverse range of products and solutions. |
(1)According to Insurance Authority's Provisional Statistics for Long Term Business 2024, in the fourth quarter of 2024, Bowtie Life ranked first in number of new individual non-single premium policies sold through Direct channel in Hong Kong.
| | | | | | | | | | | | | | | | | | | | |
| MANAGEMENT'S DISCUSSION & ANALYSIS | | Sun Life Financial Inc. | December 31, 2025 | 35 |
Business Types and Business Units
| | | | | | | | | | | |
| Business Type | Business Unit
& Market | Description | Market Position |
Asset management & wealth | ASEAN Philippines(1) | • Asset management for individual and institutional Clients through agency, brokerage, bancassurance and digital partners. | • #2 mutual fund operation in the country(2) |
| Hong Kong | • Mandatory Provident Fund ("MPF") and pension administration to individuals and businesses through agency and brokerage distribution. | • 3rd largest provider based on AUM, 3rd based on net inflows(3) |
Joint Ventures China(4) | • Institutional asset management, passive third-party asset management and debt financing business through direct distribution. | • 15th largest mutual fund provider(5) |
Joint Ventures India(6) | • Asset management for both individual and institutional investors through independent financial advisors, banks, and direct distribution channels. | • 6th largest mutual fund operation in the country(7) |
| Individual - Protection | ASEAN Philippines | • Individual and group life and health insurance products to individuals and businesses through a multi-channel distribution network. | • #1 ranked insurance company based on total premium(8) |
| Indonesia | • Individual life and health insurance through agency, telco arrangements and banks, including a bancassurance partnership with CIMB Niaga, Indonesia's 2nd largest privately-owned bank. | • 9th ranked insurance company and 7th in bancassurance sales(9) |
| Vietnam | • Individual insurance and pensions distributed through agency, corporate sales, and digital distribution channels and partnerships, including exclusive bancassurance agreements with TPBank(10) and ACB(10). | • 6th in bancassurance sales, 9th ranked insurance company(11) |
| Hong Kong | • Individual and group life and health insurance through agency, bancassurance agreement with Dah Sing(12) and brokerage distribution, including life insurance solutions for HNW Clients. | • 8th ranked insurance company and 1st in broker sales(13) |
Joint Ventures China(4) | • Individual and group life and health insurance and savings products distributed through agency, brokerage, bancassurance and digital channels. | • 13th ranked life insurance company in China among multinationals(14) |
India(6) | • Individual and group insurance, savings and retirement products through agency, brokerage, bancassurance, and direct-to-consumer channels. | • 7th largest life insurance company in India(15) |
Malaysia(16) | • Individual and group insurance through banks and telco arrangements, including an exclusive bancassurance agreement with CIMB Bank, Malaysia's 2nd largest bank, and a growing agency force. | • 5th in bancassurance sales, 7th overall(17) |
High Net Worth
| • Individual life insurance solutions for HNW Clients with Bermuda, Singapore, Dubai, and broker branches. • Manages a block of International wealth investment products closed to new sales. | • A leader in international HNW life insurance business |
|
| Regional Office | • Asia's headquarters based in Hong Kong. | |
(1)Philippines: Includes a joint venture with the Yuchengco Group - Sun Life Grepa Financial, Inc. ("Sun Life Grepa") (49%).
(2)Philippine Investment Funds Association, based on November 2025 ending AUM.
(3)Mercer MPF Market Shares Report, Q3'25 year-to-date.
(4)China: Joint ventures with the China Everbright Group: Sun Life Everbright Life Insurance Company Limited (24.99%), Sun Life Everbright Asset Management Co., Ltd (24.74%).
(5)2024, based on total revenue amongst insurance asset management companies.
(6)India: Joint venture with Aditya Birla Group - Aditya Birla Sun Life Insurance Company Limited (49%) and Aditya Birla Sun Life Asset Management Company Limited (30% indirect ownership).
(7)Association of Mutual Funds in India, based on average AUM for the quarter ended December 31, 2025.
(8)Insurance Commission of the Philippines, based on Q3'25 year-to-date total premium income for Sun Life of Canada (Philippines).
(9)Indonesia Life Insurance Association industry report, based on Q3'25 year-to-date first year premiums.
(10)Tien Phong Commercial Bank ("TPBank") and Asia Commercial Joint Stock Bank ("ACB").
(11)December 2025 year-to-date annualized first year premiums based on data shared among industry players.
(12)Dah Sing Bank ("Dah Sing").
(13)Insurance Authority of Hong Kong, Provisional Statistics on Hong Kong Long Term Insurance Business, based on Q3'25 year-to-date annualized first year premiums.
(14)China: based on gross premiums for Q3'25 year-to-date (excluding universal life insurance deposits and pension companies) amongst foreign multinationals.
(15)Insurance Regulatory Authority of India, based on November 2025 year-to-date first year premiums among private players.
(16)Malaysia: Joint ventures with Khazanah Nasional Berhad and CIMB Group Holdings Berhad - Sun Life Malaysia Assurance Berhad (49%), Sun Life Malaysia Takaful Berhad (49%).
(17)Life Insurance Association of Malaysia and Insurance Services Malaysia Berhad, based on Q3'25 year-to-date annualized first year premium for conventional and takaful business.
| | | | | | | | | | | | | | | | | | | | |
36 | December 31, 2025 | Sun Life Financial Inc. | | MANAGEMENT'S DISCUSSION & ANALYSIS | |
Financial and Business Results
| | | | | | | | | | | |
| | |
| ($ millions) | | | | 2025 | 2024 |
Asset management & wealth(1) | | | | 106 | 89 |
Individual - Protection(1)(2)(3) | | | | 730 | 612 |
Underlying net income(1) | | | | 836 | 701 |
Add: Market-related impacts | | | | (210) | (76) |
Assumption changes and management actions | | | | 13 | (54) |
Acquisition, integration and restructuring | | | | 145 | 66 |
Intangible asset amortization | | | | (13) | (194) |
Other | | | | (3) | (14) |
Reported net income - Common shareholders | | | | 768 | 429 |
Underlying ROE (%)(1) | | | | 15.1% | 12.7% |
Reported ROE (%)(1) | | | | 13.9% | 7.8% |
Asset management gross flows & wealth sales(1) | | | | 10,094 | 8,063 |
Individual - Protection sales(1) | | | | 3,213 | 2,432 |
Group - Health & Protection sales(1)(2) | | | | 101 | 87 |
New business CSM(1) | | | | 1,194 | 918 |
(1)Represents a non-IFRS financial measure. For more details, see section M - Non-IFRS Financial Measures in this document. For more information about business types in Sun Life's business groups, see section A - How We Report Our Results in this document.
(2)In underlying net income by business type, Group businesses in Asia have been included with Individual - Protection.
(3)Effective Q1'25, Regional office expenses & other was moved to the Individual - Protection business type, reflecting a reporting refinement. Prior period amounts reflect current presentation.
Profitability
2025 vs. 2024
Underlying net income of $836 million increased $135 million or 19%, driven by:
•Asset management & wealth up $17 million: Higher fee income primarily driven by higher AUM.
•Individual - Protection(1) up $118 million: Continued strong sales momentum and in-force business growth across most markets, higher investment earnings and contributions from joint ventures, and favourable mortality experience in High Net Worth, partially offset by unfavourable credit experience, higher expenses primarily reflecting continued investments in the business, and lower earnings on surplus primarily reflecting realized losses.
Reported net income of $768 million increased $339 million or 79%, driven by a gain from increased ownership interest in Bowtie, the increase in underlying net income, favourable ACMA impacts, and the prior year impacts of an impairment charge on an intangible asset related to bancassurance in Vietnam and a Pillar Two global minimum tax adjustment(2), partially offset by unfavourable market-related impacts and a prior year gain on partial sale of ABSLAMC. The market-related impacts were primarily from unfavourable other market-related and equity market impacts, partially offset by improved interest rate impacts and real estate experience.
Foreign exchange translation led to an increase of $13 million in underlying net income and an increase of $14 million in reported net income.
Growth
2025 vs. 2024
Asia's sales included:
•Individual sales of $3.2 billion were up 30%(3), driven by:
◦Higher sales in Hong Kong from growth across all channels; and
◦Higher sales in India and Indonesia reflecting growth primarily in the bancassurance channel; partially offset by
◦Lower sales in High Net Worth from the broker channel.
•Asset management gross flows & wealth sales of $10.1 billion were up 26%(3), driven by higher fixed income fund sales in India.
New business CSM of $1,194 million was up from $918 million in the prior year, driven by higher sales and profit margins partially offset by unfavourable business mix, primarily in Hong Kong.
(1)Effective Q1'25, Regional office expenses & other was moved to the Individual - Protection business type, reflecting a reporting refinement. Prior period amounts reflect current presentation.
(2)For additional information refer to Note 19 of our 2024 Annual Consolidated Financial Statements and section D - Profitability in the 2024 Annual MD&A.
(3)This change excludes the impacts of foreign exchange translation. For more information about these non-IFRS financial measures, see section
M - Non-IFRS Financial Measures in this document.
| | | | | | | | | | | | | | | | | | | | |
| MANAGEMENT'S DISCUSSION & ANALYSIS | | Sun Life Financial Inc. | December 31, 2025 | 37 |
Investment in Bowtie Life Insurance Company Limited
On July 15, 2025, we invested $55 million cash in Bowtie Life Insurance Company Limited ("Bowtie"), which increased our ownership interest, excluding dilution, by approximately 11% and resulted in a total ownership interest of 55.8%. Our previously held interest in Bowtie was remeasured to its fair value, which resulted in a gain of $176 million recognized in reported net income in Q3'25. The investment reinforces Sun Life's long-term partnership with Bowtie, and our shared goal to make health insurance simple, accessible and affordable. Bowtie is Hong Kong's first virtual insurer and the market leader in the direct sales channel(1). For additional information, refer to Note 3 of our 2025 Annual Consolidated Financial Statements.
Growth by Business Market - 2025 vs. 2024
We continued to maintain a strong Client focus, build our agency and strengthen bancassurance channels, leverage a more balanced product portfolio and increase productivity.
ASEAN Markets
•Philippines - Mutual and managed fund AUM was $1.3 billion as at December 31, 2025, a decrease of 3%, measured in local currency, reflecting lower money market fund sales. Individual protection sales increased 7% on a local currency basis, reflecting higher sales in agency and bancassurance channels.
•Agency headcount was approximately 23,100 at the end of 2025, 6% lower than 2024.
•Indonesia - Individual protection sales increased 51% on a local currency basis, reflecting higher sales primarily in the bancassurance channel.
•Agency headcount was approximately 1,500 at the end of 2025, 44% lower than 2024, reflecting our focus to build a high-quality agency.
•Vietnam - Individual protection sales decreased 16% on a local currency basis, reflecting lower sales in bancassurance and agency channels.
•Agency headcount was approximately 1,000 at the end of 2025, 74% lower than 2024, reflecting our focus to build a high-quality agency.
Hong Kong
•AUM in the pension business was $30.4 billion as at December 31, 2025, 19% higher than prior year measured on a local currency basis, reflecting pension inflows and favourable equity markets.
•Individual protection sales increased 46% on a local currency basis, driven by expanded distribution capabilities with strong, diversified growth across broker, agency and bancassurance channels.
•Agency headcount was approximately 3,600 at the end of 2025, 24% higher than 2024.
Joint Ventures
•China - Individual protection sales increased 44% on a local currency basis, reflecting higher sales in the bancassurance and broker channels.
•Agency headcount was approximately 1,300 at the end of 2025, in line with 2024.
•India - Gross sales of equity and fixed income funds increased 42% on a local currency basis. Individual protection sales increased 18% on a local currency basis, driven by growth in the bancassurance and agency channels.
•Agency headcount was approximately 65,200 at the end of 2025, 17% higher than 2024.
•Total AUM as at December 31, 2025 was $70.2 billion, of which $21.1 billion is reported in our AUM based on Sun Life's 30.0% share, 20% higher than 2024, on a local currency basis.
•Malaysia - Individual protection sales decreased 7% on a local currency basis, reflecting lower sales in the agency and bancassurance channels.
•Agency headcount was approximately 1,300 at the end of 2025, in line with 2024.
High Net Worth
•Individual protection sales decreased 14% on a local currency basis, due to higher large case sales in the prior year.
(1)According to Insurance Authority's Provisional Statistics for Long Term Business 2024, in the fourth quarter of 2024, Bowtie Life ranked first in number of new individual non-single premium policies sold through Direct channel in Hong Kong.
| | | | | | | | | | | | | | | | | | | | |
38 | December 31, 2025 | Sun Life Financial Inc. | | MANAGEMENT'S DISCUSSION & ANALYSIS | |
5. Corporate
| | |
Corporate Support operations consist of certain expenses, debt financing, earnings on surplus, and other items. Corporate operations pertain to core enterprise oversight activities such as Finance, Risk and Compliance as well as enterprise enablement capabilities such as Strategy, Marketing and Philanthropy. Corporate Support is included in the 'Corporate expenses and other' business type. |
Financial and Business Results
| | | | | | | | | | | |
| | |
| ($ millions) | | | | 2025 | 2024 |
Corporate expenses & other(1) | | | | (370) | (364) |
Underlying net income (loss)(1) | | | | (370) | (364) |
Add: Market-related impacts | | | | (14) | 16 |
Assumption changes and management actions | | | | — | 4 |
| Acquisition, integration and restructuring | | | | (4) | (102) |
| | | | | |
| Other | | | | (44) | (235) |
Reported net income (loss) - Common shareholders | | | | (432) | (681) |
(1)Represents a non-IFRS financial measure. For more details, see section M - Non-IFRS Financial Measures in this document. For more information about business types in Sun Life's business groups, see section A - How We Report Our Results in this document.
Profitability
2025 vs. 2024
Underlying net loss was $370 million compared to underlying net loss of $364 million in the prior year, primarily reflecting higher financing costs supporting the acquisition of our remaining interests in SLC Management affiliates.
Reported net loss was $432 million compared to reported net loss of $681 million in the prior year, driven by changes in tax-exempt investment income(1) reflecting higher losses in the prior year, and a prior year restructuring charge of $108 million, partially offset by market-related impacts.
Foreign exchange translation had no significant impact to the change in underlying net income and led to an increase of $3 million in reported net income.
(1)Q4'25 results reflect lower than expected tax-exempt investment income of $44 million (Q4'24 - lower than expected tax-exempt investment income of $234 million).
| | | | | | | | | | | | | | | | | | | | |
| MANAGEMENT'S DISCUSSION & ANALYSIS | | Sun Life Financial Inc. | December 31, 2025 | 39 |
The Company strives to ensure that general fund investments are aligned with business objectives including meeting policyholder obligations and maintaining adequate liquidity at all times. Consideration is given to a wide range of factors in our investment process, including ensuring attractive risk and return profiles, appropriate diversification by asset type, credit exposure and sector and financial condition of issuers and borrowers, quality and value of underlying security and macro- and micro-economic developments and trends including prospects for specific industry sectors. The Governance Committee of the Board of Directors ("Governance Committee") approves policies that contain prudent standards and procedures for the investment of our general fund assets. These policies include requirements, restrictions and limitations for interest rate, credit, equity market, real estate market, liquidity, concentration, currency, and derivative risks. Compliance with these policies is monitored on a regular basis and reported annually to the Governance Committee. The Governance Committee of the Board of Directors monitors the Company's Investment Plan and investment performance, oversees practices, procedures and controls related to the management of the general fund investment portfolio, and reviews corporate governance guidelines and processes.
1. Investment Profile
Total general fund invested assets of $199.2 billion as at December 31, 2025, were up $9.4 billion from December 31, 2024. The increase was primarily from net fair value growth from changes in interest rates and credit spreads, and business growth and capital activities, partially offset by unfavourable impacts from foreign exchange translation. Our general fund invested assets are well-diversified across investment types, geographies and sectors with the majority of our portfolio invested in high quality fixed income assets.
The following table sets out the composition of our general fund invested assets(1):
| | | | | | | | | | | | | | |
| December 31, 2025 | December 31, 2024 |
| ($ millions) | Carrying value | % of Total carrying value | Carrying value | % of Total carrying value |
| Cash, cash equivalents and short-term securities | 14,841 | 7% | 13,873 | 7% |
| Debt securities | 85,618 | 43% | 81,955 | 43% |
| Equity securities | 12,250 | 6% | 9,974 | 5% |
| Mortgages and loans | 59,433 | 30% | 57,619 | 31% |
| Derivative assets | 1,534 | 1% | 1,971 | 1% |
Other invested assets | 16,067 | 8% | 15,135 | 8% |
| Investment properties | 9,432 | 5% | 9,290 | 5% |
| Total invested assets | 199,175 | 100% | 189,817 | 100% |
(1)The values and ratios presented are based on the fair value of the respective asset categories. Generally, the carrying values for invested assets are equal to their fair values. For invested assets supporting insurance contracts, in the event of default, if the amounts recovered are insufficient to satisfy the related insurance contract liability cash flows that the assets are intended to support, credit exposure may be greater than the carrying value of the assets.
2. Debt Securities
The debt securities portfolio is actively managed through a regular program of purchases and sales aimed at optimizing yield, quality, and liquidity, while ensuring that it remains well-diversified and duration-matched to insurance contract liabilities. As at December 31, 2025, with the exception of certain countries where we have business operations, including Canada, the United States, the United Kingdom and the Philippines, our exposure to debt securities from any single country did not exceed 1% of total invested assets.
| | | | | | | | | | | | | | | | | | | | |
40 | December 31, 2025 | Sun Life Financial Inc. | | MANAGEMENT'S DISCUSSION & ANALYSIS | |
Debt Securities by Issuer and Industry Sector
| | | | | | | | | | | | | | |
| December 31, 2025 | December 31, 2024 |
| ($ millions) | Total | % of Total | Total | % of Total |
| Debt securities issued or guaranteed by: | | | | |
| Canadian federal government | 7,893 | 9 | % | 7,537 | 9 | % |
| Canadian provincial and municipal government | 16,080 | 19 | % | 15,655 | 20 | % |
| U.S. government and agency | 1,519 | 2 | % | 1,135 | 1 | % |
| Other foreign government | 3,641 | 4 | % | 4,209 | 5 | % |
| Total government issued or guaranteed debt securities | 29,133 | 34 | % | 28,536 | 35 | % |
Corporate debt securities by industry sector(1): | | | | |
| Financials | 12,363 | 14 | % | 11,552 | 14 | % |
| Utilities | 7,673 | 9 | % | 7,622 | 9 | % |
| Industrials | 5,137 | 6 | % | 5,375 | 7 | % |
| Energy | 3,917 | 5 | % | 3,704 | 5 | % |
| Communication services | 2,842 | 3 | % | 3,020 | 4 | % |
Real estate | 2,414 | 3 | % | 2,305 | 3 | % |
| Health care | 2,197 | 3 | % | 2,007 | 2 | % |
| Consumer staples | 1,793 | 2 | % | 1,557 | 2 | % |
| Consumer discretionary | 1,760 | 2 | % | 1,758 | 2 | % |
| Information technology | 1,074 | 1 | % | 1,092 | 1 | % |
| Materials | 1,118 | 1 | % | 1,021 | 1 | % |
| Total corporate debt securities | 42,288 | 49 | % | 41,013 | 50 | % |
| Asset-backed securities | 14,197 | 17 | % | 12,406 | 15 | % |
| Total debt securities | 85,618 | 100 | % | 81,955 | 100 | % |
(1) Our grouping of debt securities by sector is based on the Global Industry Classification Standard and S&P Dow Jones Indices.
Debt Securities by Geography
The carrying value of our debt securities by geographic location is presented in the following table.
| | | | | | | | | | | | | | | | | | | | | | | | | | |
| December 31, 2025 | December 31, 2024 |
| ($ millions) | FVTPL debt
securities | FVOCI debt securities | Total | % of Total | FVTPL debt
securities | FVOCI debt securities | Total | % of Total |
| Debt securities by geography: | | | | | | | | |
| Canada | 35,582 | 3,288 | 38,870 | 45% | 34,472 | 3,614 | 38,086 | 46% |
| United States | 23,389 | 6,060 | 29,449 | 34% | 20,986 | 6,486 | 27,472 | 34% |
| Europe | 4,329 | 1,451 | 5,780 | 7% | 4,145 | 1,664 | 5,809 | 7% |
| Asia | 7,230 | 971 | 8,201 | 10% | 6,891 | 950 | 7,841 | 10% |
| Other | 2,069 | 1,249 | 3,318 | 4% | 1,612 | 1,135 | 2,747 | 3% |
| Total debt securities | 72,599 | 13,019 | 85,618 | 100% | 68,106 | 13,849 | 81,955 | 100% |
Our gross unrealized losses as at December 31, 2025 for FVTPL and FVOCI debt securities were $6,284 million and $241 million, respectively (December 31, 2024 - $6,775 million and $508 million, respectively). The decrease in gross unrealized losses was largely due to the impact from declining interest rates.
Debt Securities by Credit Rating
Debt securities with a credit rating of "A" or higher represented 77% of the total debt securities as at December 31, 2025 (December 31, 2024 - 75%). Debt securities with a credit rating of "BBB" or higher represented 99% of total debt securities as at December 31, 2025 (December 31, 2024 - 99%).
| | | | | | | | | | | | | | | | | | | | |
| MANAGEMENT'S DISCUSSION & ANALYSIS | | Sun Life Financial Inc. | December 31, 2025 | 41 |
The credit risk ratings in the following table were established in accordance with the internal rating process described in this MD&A under the heading K - Risk Management - 9 - Risk Categories - Credit Risk Management Governance and Control.
| | | | | | | | | | | | | | | | | | | | | | | | | | |
| December 31, 2025 | December 31, 2024 |
| ($ millions) | FVTPL debt
securities | FVOCI debt securities | Total | % of Total | FVTPL debt
securities | FVOCI debt securities | Total | % of Total |
| Debt securities by credit rating: | | | | | | | | |
| AAA | 11,143 | 2,928 | 14,071 | 17 | % | 13,381 | 4,410 | 17,791 | 22 | % |
| AA | 15,784 | 2,822 | 18,606 | 22 | % | 10,804 | 1,749 | 12,553 | 15 | % |
| A | 28,564 | 4,309 | 32,873 | 38 | % | 26,910 | 4,520 | 31,430 | 38 | % |
| BBB | 16,596 | 2,590 | 19,186 | 22 | % | 16,392 | 2,988 | 19,380 | 24 | % |
| BB and lower | 512 | 370 | 882 | 1 | % | 619 | 182 | 801 | 1 | % |
| Total debt securities | 72,599 | 13,019 | 85,618 | 100 | % | 68,106 | 13,849 | 81,955 | 100 | % |
3. Equities
The equity portfolio is well-diversified with approximately 64% of the portfolio invested in exchange-traded funds as at December 31, 2025 (December 31, 2024 - 67%). Exchange-traded fund holdings are primarily in the S&P 500 and MSCI Emerging Market ETFs. The carrying value of equities by issuer geography as at December 31, 2025 is set out in the following table.
Equities by Issuer Geography
| | | | | | | | | | | | | | | | | | | | | | | | | | |
| December 31, 2025 | December 31, 2024 |
| ($ millions) | FVTPL equities | FVOCI equities | Total | % of Total | FVTPL equities | FVOCI equities | Total | % of Total |
| Equity securities: | | | | | | | | |
| Canada | 4,649 | — | 4,649 | 38 | % | 3,821 | — | 3,821 | | 38 | % |
| United States | 2,601 | 71 | 2,672 | 22 | % | 2,600 | 74 | 2,674 | | 27 | % |
| Europe | 812 | — | 812 | 7 | % | 373 | — | 373 | | 4 | % |
| Asia | 4,091 | — | 4,091 | 33 | % | 3,079 | — | 3,079 | | 31 | % |
| Other | 26 | — | 26 | — | % | 27 | — | 27 | | — | % |
| Total equity securities | 12,179 | 71 | 12,250 | 100 | % | 9,900 | 74 | 9,974 | 100 | % |
Excluding exchange-traded funds and mutual funds, there were no issuers exceeding 1% of the equity portfolio as at December 31, 2025.
4. Mortgages and Loans
Our mortgage portfolio consisted almost entirely of first mortgages and our loan portfolio consisted of private placement loans.
Mortgages and Loans by Geography
The carrying value of mortgages and loans by geographic location is presented in the following table(1).
| | | | | | | | | | | | | | | | | | | | |
| December 31, 2025 | December 31, 2024 |
| ($ millions) | Mortgages | Loans | Total | Mortgages | Loans | Total |
| Canada | 9,135 | 12,880 | 22,015 | 9,402 | 12,560 | 21,962 |
| United States | 4,335 | 20,044 | 24,379 | 4,828 | 18,856 | 23,684 |
| Europe | 135 | 9,234 | 9,369 | 208 | 8,488 | 8,696 |
| Asia | — | 678 | 678 | — | 680 | 680 |
| Other | — | 2,992 | 2,992 | — | 2,597 | 2,597 |
| Total mortgages and loans | 13,605 | 45,828 | 59,433 | 14,438 | 43,181 | 57,619 |
| % of Total invested assets | 7% | 23% | 30% | 8% | 23% | 31% |
(1)The geographic location for mortgages is based on the location of the property and for loans it is based on the country of the creditor's parent.
As at December 31, 2025, our impaired mortgages and loans, net of allowances for losses, were $24 million (December 31, 2024 - $30 million).
| | | | | | | | | | | | | | | | | | | | |
42 | December 31, 2025 | Sun Life Financial Inc. | | MANAGEMENT'S DISCUSSION & ANALYSIS | |
Mortgage Portfolio
As at December 31, 2025, we held $13.6 billion of mortgages (December 31, 2024 - $14.4 billion). Our mortgage portfolio consists entirely of commercial mortgages, as presented in the following table.
| | | | | | | | | | | | | | | | | | | | |
| December 31, 2025 | December 31, 2024 |
| ($ millions) | Insured | Uninsured | Total | Insured | Uninsured | Total |
| Mortgages: | | | | | | |
| Retail | — | 2,336 | 2,336 | — | 2,567 | 2,567 |
| Office | — | 2,364 | 2,364 | — | 2,633 | 2,633 |
| Multi-family residential | 2,953 | 1,250 | 4,203 | 3,205 | 1,294 | 4,499 |
| Industrial | — | 3,793 | 3,793 | — | 3,683 | 3,683 |
| Other | 408 | 501 | 909 | 425 | 631 | 1,056 |
| Total mortgages | 3,361 | 10,244 | 13,605 | 3,630 | 10,808 | 14,438 |
| % of Total mortgages | 25% | 75% | 100% | 25% | 75% | 100% |
Our mortgage portfolio consists entirely of commercial mortgages, including retail, office, multi-family, and industrial properties. As at December 31, 2025, 31% of our commercial mortgage portfolio consisted of multi-family residential mortgages; there are no single-family residential mortgages. Our uninsured commercial portfolio had a weighted average loan-to-value ratio of approximately 54% as at December 31, 2025 (December 31, 2024 - 54%). While we generally limit the maximum loan-to-value ratio to 75% at issuance, we may invest in mortgages with a higher loan-to-value ratio in Canada if the mortgage is insured by the Canada Mortgage and Housing Corporation ("CMHC"). The estimated weighted average debt service coverage for our uninsured commercial portfolio is 1.78 times. Of the $3.3 billion of multi-family residential mortgages in the Canadian commercial mortgage portfolio, 91% were insured by the CMHC.
The following tables summarize our mortgages by credit quality indicator:
| | | | | | | | | | | | | | |
| ($ millions) | December 31, 2025 | As % of Total
Mortgages | December 31, 2024 | As % of Total
Mortgages |
| Mortgages by credit rating: | | | | |
| Insured | 3,361 | 25 | % | 3,630 | 25 | % |
| | | | |
| AA | 2,254 | 17 | % | 2,229 | 15 | % |
| A | 4,929 | 36 | % | 5,007 | 36 | % |
| BBB | 2,475 | 18 | % | 3,084 | 21 | % |
| BB and lower | 573 | 4 | % | 464 | 3 | % |
| Impaired | 13 | — | % | 24 | — | % |
| Total mortgages | 13,605 | 100 | % | 14,438 | 100 | % |
Loan Portfolio
As at December 31, 2025, we held $45.8 billion of loans (December 31, 2024 - $43.2 billion). Private placement loans provide diversification by type of loan, industry segment and borrower credit quality. The private placement loan portfolio consists of senior secured and unsecured loans to large- and mid-market corporate borrowers, securitized lease/loan obligations secured by a variety of assets, and project finance loans in sectors such as power and infrastructure.
The credit risk ratings in the following table were established in accordance with the internal rating process described in this MD&A under the heading K - Risk Management - 9 - Risk Categories - Credit Risk Management Governance and Control. As at December 31, 2025, 96% of our total loan portfolio is investment grade (December 31, 2024 - 95%).
| | | | | | | | | | | | | | |
| ($ millions) | December 31, 2025 | As % of Total Loans | December 31, 2024 | As % of Total Loans |
| Loans by credit rating: | | | | |
| AAA | 180 | — | % | 165 | — | % |
| AA | 7,051 | 16 | % | 6,328 | 15 | % |
| A | 17,968 | 39 | % | 16,236 | 37 | % |
| BBB | 18,681 | 41 | % | 18,457 | 43 | % |
| BB and lower | 1,425 | 3 | % | 1,600 | 4 | % |
| Impaired | 523 | 1 | % | 395 | 1 | % |
| Total loans | 45,828 | 100 | % | 43,181 | 100 | % |
| | | | | | | | | | | | | | | | | | | | |
| MANAGEMENT'S DISCUSSION & ANALYSIS | | Sun Life Financial Inc. | December 31, 2025 | 43 |
The following tables summarize our loans by sector:
| | | | | | | | | | | | | | |
| ($ millions) | December 31, 2025 | As % of Total Loans | December 31, 2024 | As % of Total Loans |
Loans by Sector: | | | | |
| Corporate issued loans | 38,381 | 84 | % | 35,780 | 83 | % |
| Canadian provincial & municipal government | 4,182 | 9 | % | 4,206 | 10 | % |
| U.S. government & agency | 2,454 | 5 | % | 2,314 | 5 | % |
| Other foreign government | 771 | 2 | % | 826 | 2 | % |
Canadian federal government | 40 | — | % | 55 | — | % |
| Total loans | 45,828 | 100 | % | 43,181 | 100 | % |
5. Derivatives
The fair value of derivative assets held by the Company was $1,534 million, while the fair value of derivative liabilities was $2,065 million as at December 31, 2025 (December 31, 2024 - $1,971 million and $2,077 million, respectively).
We use derivative instruments to manage risks related to interest rate, equity market and currency fluctuations and in replication strategies to reproduce permissible investments. Use of derivatives in these risk mitigation strategies does not mitigate all risk exposure; rather, they are used to keep us within our risk tolerance limits.
In addition to the general policies and monitoring, we use a variety of tools in counterparty risk management. Over-the-counter ("OTC") derivative transactions are typically executed under an International Swaps and Derivatives Association ("ISDA") Master Agreement, together with a Credit Support Annex which establish requirements for collateral.
Derivative Financial Instruments
The values associated with our derivative instruments are presented in the following table. Notional amounts serve as the basis for payments calculated under derivatives contracts and are generally not exchanged.
| | | | | | | | |
| ($ millions) | December 31, 2025 | December 31, 2024 |
| Net fair value asset (liability) | (531) | (106) |
| Total notional amount | 83,571 | | 74,954 | |
Credit equivalent amount(1) | 1,266 | | 1,347 | |
Risk-weighted credit equivalent amount(1) | 27 | | 30 | |
(1)Amounts presented are net of collateral received.
The net fair value of derivatives was a liability of $531 million as at December 31, 2025 (December 31, 2024 - liability of $106 million). The decrease in net fair value was driven by a decrease in interest rate contracts primarily due to upward shift in Canadian yield curves for longer maturing deals.
The total notional amount of our derivatives increased to $83.6 billion as at December 31, 2025 (December 31, 2024 - $75.0 billion). The change in notional amount is mainly attributable to an increase in interest rate contracts used for duration matching and replication of fixed income exposure and additional listed options trading for replication of equity exposure.
Certain of our derivatives are designated in qualifying hedging relationships for accounting purposes, and represented $1.0 billion, or 0.6% of the total notional amount. Derivatives are designated in hedging relationships for accounting purposes to minimize accounting mismatches. These hedging relationships are documented at inception and hedge effectiveness is assessed on a quarterly basis.
Derivatives designated in qualifying hedging relationships for accounting purposes include foreign exchange agreements and equity forwards. We designate certain foreign exchange agreements in cash flow hedging relationships to manage foreign currency fluctuations associated with FVOCI assets. Additionally, we designate certain equity forwards in cash flow hedging relationships for anticipated payments of awards under certain stock-based compensation plans.
Credit Equivalent Amount
As the regulator of the Canadian insurance industry, OSFI provides guidelines to quantify the use of derivatives. The credit equivalent amount ("CEA"), a measure used to approximate the potential credit exposure, is determined as the replacement cost of the derivative contracts with a positive fair value plus an amount representing the potential future credit exposure.
| | | | | | | | | | | | | | | | | | | | |
44 | December 31, 2025 | Sun Life Financial Inc. | | MANAGEMENT'S DISCUSSION & ANALYSIS | |
The risk-weighted credit equivalent amount is a measure used to determine the amount of capital necessary to support derivative transactions for certain Canadian regulatory purposes. It is determined by weighting the credit equivalent amount according to the nature of the derivative and the creditworthiness of the counterparties.
| | | | | | | | | | | | | | |
| December 31, 2025 | December 31, 2024 |
| ($ millions) | Credit equivalent amount ("CEA")(1) | Risk weighted CEA(1) | Credit equivalent amount ("CEA")(1) | Risk weighted CEA(1) |
| Foreign exchange contracts | 1,205 | 26 | 1,271 | 28 |
| Interest rate contracts | 16 | — | 24 | 1 |
| Equity and other contracts | 45 | 1 | 52 | 1 |
| Total | 1,266 | 27 | 1,347 | 30 |
(1) Amounts presented are net of collateral received.
Credit Default Swaps By Underlying Financial Instrument Credit Rating
Credit default swaps ("CDS") are derivative contracts that transfer credit risk related to an underlying referenced financial instrument from one counterparty to another. The purchaser receives protection against the decline in the value of the referenced financial instrument as a result of specified credit events such as default or bankruptcy. The Company sells credit protection through CDS to replicate credit exposure of an underlying reference security and enhance investment returns. The credit risk ratings of the underlying reference securities for single name contracts were established in accordance with the internal rating process described in section K - Risk Management - 9 - Risk Categories - Credit Risk Management Governance and Control.
The following table provides a summary of the credit default swap protection sold by credit rating of the underlying reference security.
| | | | | | | | | | | | | | |
| December 31, 2025 | December 31, 2024 |
| ($ millions) | Notional amount | Fair value | Notional amount | Fair value |
| Single name credit default swap contracts | | | | |
| | | | |
| A | 676 | 21 | 552 | 7 |
| BBB | 570 | 10 | 499 | 13 |
| | | | |
| Total single name credit default swap contracts | 1,246 | 31 | 1,051 | 20 |
| Credit default swap index contracts | 172 | | (3) | | 432 | | (10) | |
| Total credit default swap contracts sold | 1,418 | | 28 | | 1,483 | | 10 | |
Additional detail on our derivative portfolio by derivative type is provided in Note 6.A.v of our 2025 Annual Consolidated Financial Statements.
6. Investment Properties
As at December 31, 2025, we held $9.4 billion of investment properties (December 31, 2024 - $9.3 billion). The increase in our investment property portfolio is predominantly driven by net property purchases in Canada, partially offset by declines in market value and unfavourable impacts from foreign exchange translation.
Investment Properties by Type and Geography
| | | | | | | | | | | | | | | | | | | | | | | |
| December 31, 2025 |
| ($ millions) | Office | Industrial | Retail | Multi-family
residential | Other | Total | % of Total by Geography |
| Canada | 1,432 | 3,503 | 1,023 | 1,684 | 386 | 8,028 | 85% |
| United States | 354 | 897 | 114 | 37 | 2 | 1,404 | 15% |
| Total | 1,786 | 4,400 | 1,137 | 1,721 | 388 | 9,432 | 100% |
| % of Total by Type | 19% | 47% | 12% | 18% | 4% | 100% | |
| | | | | | | |
| December 31, 2024 |
| ($ millions) | Office | Industrial | Retail | Multi-family
residential | Other | Total | % of Total by Geography |
| Canada | 1,476 | 3,496 | 933 | 1,469 | 448 | 7,822 | 84% |
| United States | 347 | 965 | 118 | 36 | 2 | 1,468 | 16% |
| Total | 1,823 | 4,461 | 1,051 | 1,505 | 450 | 9,290 | 100% |
| % of Total by Type | 20% | 48% | 11% | 16% | 5% | 100% | |
7. Loss Allowance and Provision for Credit Losses
The balance of the total loss allowance was $93 million(1) as at December 31, 2025 (December 31, 2024 - $88 million) and the provision for credit losses increased by $12 million(1) for the year ended December 31, 2025 (increased by $4 million for the year ended December 31, 2024).
(1)For additional information, refer to Note 6 of the 2025 Annual Consolidated Financial Statements.
| | | | | | | | | | | | | | | | | | | | |
| MANAGEMENT'S DISCUSSION & ANALYSIS | | Sun Life Financial Inc. | December 31, 2025 | 45 |
| | | | | |
| J. Capital and Liquidity Management |
Capital and liquidity management is core to our business as an insurance company. We ensure adequate capital for the protection of our policyholders, Clients and creditors, while managing capital adequacy and allocation across our businesses for the benefit of our shareholders. In addition, we maintain strong financial flexibility by ensuring that sufficient liquid assets are available to cover our anticipated payment obligations and funding requirements. We invest in various types of assets with a view to matching them with liabilities of various durations.
The regulatory environments in which we operate are expected to evolve as governments and regulators work to develop the appropriate level of financial regulation required to ensure that capital, liquidity and risk management practices are sufficient to withstand severe economic downturns.
1. Capital
Our capital risk policy is designed to ensure that adequate capital is maintained to provide the flexibility necessary to take advantage of growth opportunities, to support the risk associated with our businesses and to optimize return to our shareholders. This policy is also intended to provide an appropriate level of risk management over capital adequacy risk, which is defined as the risk that capital is not or will not be sufficient to withstand adverse economic conditions, to maintain financial strength, or to allow us and our subsidiaries to support ongoing operations and take advantage of opportunities for expansion. SLF Inc. manages its capital in a manner commensurate with its risk profile and control environment. Our capital base is structured to exceed minimum regulatory and internal capital targets and maintain strong credit and financial strength ratings, while maintaining a capital efficient structure. We strive to achieve an optimal capital structure by balancing the use of debt and equity financing. Capital is managed both on a consolidated basis under principles that consider all the risks associated with the business as well as at the business group level under the principles appropriate to the jurisdictions in which each operates. We manage the capital for all of our international subsidiaries on a local statutory basis in a manner commensurate with their individual risk profiles.
The Board of Directors of SLF Inc. is responsible for the annual review and approval of the Company's capital plan and capital risk policy. Management oversight of our capital programs and position is provided by the Company's Executive Risk Committee, the membership of which includes senior management from the financial, actuarial, and risk management functions.
We engage in a capital planning process annually in which capital deployment options, fundraising, and dividend recommendations are presented to the Risk Committee of the Board of Directors. Capital reviews are regularly conducted which consider the potential impacts under various business, interest rate and equity market scenarios. Relevant components of these capital reviews, including dividend recommendations, are presented to the Risk Committee on a quarterly basis. The Board of Directors is responsible for the approval of the dividend recommendations.
The Company's capital base consists mainly of common shareholders' equity. Other sources of capital include preferred shares and other equity instruments, non-controlling interests, equity in the participating account, CSM, subordinated debt issued by SLF Inc. and Sun Life Assurance, and certain other capital securities that qualify as regulatory capital. For Canadian regulatory purposes, our capital also includes innovative capital instruments issued by Sun Life Capital Trust.
The following table summarizes the sources of our capital and our capital position over the past two years. Notes 12, 13, 14 and 20 of our 2025 Annual Consolidated Financial Statements include additional details on our capital.
| | | | | | | | |
| ($ millions) | 2025 | 2024 |
| Subordinated debt | 8,171 | 6,179 |
Innovative capital instruments(1) | 200 | 200 |
| Equity | | |
| Preferred shares and other equity instruments | 2,239 | 2,239 |
Common shareholders' equity(2) | 22,293 | 23,318 |
| Equity in the participating account | 696 | 496 |
| Non-controlling interests' equity | 264 | 76 |
| Total equity | 25,492 | 26,129 |
Contractual Service Margin(3) | 14,492 | 13,366 |
Total capital | 48,355 | 45,874 |
Financial leverage ratio(3)(4) | 23.5 | % | 20.1 | % |
(1)Innovative capital instruments are presented net of associated transaction costs and consist of SLEECS, which were issued by Sun Life Capital Trust. SLEECS qualify as capital for Canadian regulatory purposes. However, under IFRS they are reported as Senior debentures in our Consolidated Financial Statements.
(2)Common shareholders’ equity is equal to Total shareholders’ equity less Preferred shares and other equity instruments.
(3)The calculation for the financial leverage ratio includes the CSM balance (net of taxes) in the denominator. The CSM (net of taxes) was $11.3 billion as at December 31, 2025 (December 31, 2024 - $10.3 billion).
(4)Represents a non-IFRS financial measure. See section M - Non-IFRS Financial Measures in this document.
Our total capital consists of subordinated debt and other capital instruments, CSM, participating policyholders' equity, non-controlling interests and total shareholders' equity, which includes common shareholders' equity, preferred shares and other equity instruments.
Common shareholders' equity was $22.3 billion as at December 31, 2025 (December 31, 2024 - $23.3 billion), a decrease of $1.0 billion in 2025 primarily reflecting common shareholders' net income more than offset by dividends, a decrease from the repurchase and cancellation of common shares, and other comprehensive loss.
| | | | | | | | | | | | | | | | | | | | |
46 | December 31, 2025 | Sun Life Financial Inc. | | MANAGEMENT'S DISCUSSION & ANALYSIS | |
The table below provides the earliest par call and maturity dates for our subordinated debt, innovative capital instruments, preferred shares and other equity instruments outstanding as at December 31, 2025.
| | | | | | | | | | | | | | |
| Description | Interest Rate | Earliest Par Call Date/Redemption Date(1) | Maturity | Principal/ Face Amount ($ millions) |
| Subordinated Debt Issued by Sun Life Assurance | | | | |
| 6.30% Debentures, Series 2 | 6.30% | n/a | 2028 | 150 |
| Subordinated Debt Issued by SLF Inc. | | | | |
Series 2007-1(2) | 5.40% | May 29, 2037 | 2042 | 400 |
| Series 2020-1 | 2.58% | May 10, 2027 | 2032 | 1,000 |
| Series 2020-2 | 2.06% | October 1, 2030 | 2035 | 750 |
| Series 2021-1 | 2.46% | November 18, 2026 | 2031 | 500 |
| Series 2021-2 | 2.80% | November 21, 2028 | 2033 | 1,000 |
| Series 2021-3 | 3.15% | November 18, 2031 | 2036 | 500 |
| Series 2022-1 | 4.78% | August 10, 2029 | 2034 | 650 |
| Series 2023-1 | 5.50% | July 4, 2030 | 2035 | 500 |
Series 2024-1 | 5.12% | May 15, 2031 | 2036 | 750 |
Series 2025-1 | 4.14% | September 13, 2032 | 2037 | 1,000 |
Series 2025-2 | 4.56% | December 3, 2035 | 2040 | 1,000 |
| Trust Units Issued by Sun Life Capital Trust | | | | |
| SLEECS - Series B | 7.093% | June 30, 2032 | Perpetual | 200 |
| Class A Preferred Shares and Other Equity Instruments Issued by SLF Inc. | | | | |
| Series 3 | 4.45% | Any time | Perpetual | 250 |
| Series 4 | 4.45% | Any time | Perpetual | 300 |
| Series 5 | 4.50% | Any time | Perpetual | 250 |
Series 8R(3)(4) | 4.230% | June 30, 2030 | Perpetual | 222 |
Series 9QR(5) | Floating | June 30, 2030(6) | Perpetual | 58 |
Series 10R(3)(6) | 2.967% | September 30, 2026 | Perpetual | 171 |
Series 11QR(7) | Floating | September 30, 2026(8) | Perpetual | 29 |
Series 2021-1 - LRCN(9) | 3.60% | June 30, 2026 | 2081 | 1,000 |
(1)The earliest date on which the Company has the option, but not the obligation, to call securities for redemption at their par value. Redemption of these securities is subject to regulatory approval.
(2)We are monitoring regulatory and market developments in Canada as it relates to legacy subordinated debt securities which reference the Canadian Dollar Offered Rate (“CDOR”) and may, if necessary, at a future date, take appropriate action to reflect the replacement of CDOR.
(3)On the earliest redemption date and every five years thereafter, the dividend rate will reset to an annual rate equal to the 5-year Government of Canada bond yield plus a spread specified for each series. The specified spread for Class A shares is: Series 8R - 1.41% and Series 10R - 2.17%. On the earliest redemption date and every five years thereafter, holders will have the right, at their option, to convert their shares into the series that is one number higher than their existing series.
(4)The dividend rate was reset on June 30, 2020 to a fixed annual dividend rate of 1.825% until the earliest redemption date of June 30, 2025, subsequently on June 30, 2025 the dividend rate was reset to a fixed annual dividend rate of 4.230% until the earliest redemption date of June 30, 2030.
(5)Holders of Series 9QR Shares will be entitled to receive quarterly floating rate non-cumulative dividends at an annual rate equal to the then 3-month Government of Canada treasury bill yield plus 1.41%. Holders of the Series 9QR Shares will have the right, at their option, to convert their Series 9QR Shares into Series 8R Shares on June 30, 2030, and on June 30 every five years thereafter.
(6)The dividend rate was reset on September 30, 2021 to a fixed annual dividend rate of 2.967% until the earliest redemption date September 30, 2026.
(7)Holders of Series 11QR Shares will be entitled to receive quarterly floating rate non-cumulative dividends at an annual rate equal to the then 3-month Government of Canada treasury bill yield plus 2.17%. Holders of the Series 11QR Shares will have the right, at their option, to convert their Series 11QR Shares into Series 10R Shares on September 30, 2026, and on September 30 every five years thereafter.
(8)Redeemable on the redemption date and every five years thereafter, in whole or in part, at par, and on any other date at $25.50 per share.
(9)Series 2021-1 Notes bear interest at a fixed rate of 3.60% payable semi-annually until June 30, 2026. On June 30, 2026, and every five years thereafter until June 30, 2076, the interest rate on the Series 2021-1 Notes will be reset at an interest rate equal to the five-year Government of Canada yield, as defined in the prospectus, plus 2.604%. In case of non-payment of interest on or principal of the Series 2021-1 Notes when due, the recourse of each noteholder will be limited to that holder's proportionate share of the Limited Recourse Trust's assets. For more information about the Limited recourse capital notes ("LRCN"), see Note 14.B of the 2025 Annual Consolidated Financial Statements.
| | | | | | | | | | | | | | | | | | | | |
| MANAGEMENT'S DISCUSSION & ANALYSIS | | Sun Life Financial Inc. | December 31, 2025 | 47 |
The following table shows the number of common shares and stock options outstanding of SLF Inc. for the last two years.
| | | | | | | | |
| Number of Common Shares Outstanding | | |
| (in millions) | 2025 | | 2024 | |
| Balance, beginning of year | 573.9 | 584.6 |
| Stock options exercised | 0.6 | 0.8 |
| Common shares repurchased and cancelled | (20.7) | (11.5) |
| Balance, end of year | 553.8 | 573.9 |
| | |
| Number of Stock Options Outstanding | | |
| (in millions) | 2025 | | 2024 | |
| Balance, beginning of year | 3.1 | 3.4 |
| Options issued | 0.5 | 0.5 |
| Options exercised, forfeited or expired | (0.7) | (0.8) |
| Balance, end of year | 2.9 | 3.1 |
Under our Canadian Dividend Reinvestment and Share Purchase Plan ("DRIP"), Canadian-resident common and preferred shareholders may choose to have their dividends automatically reinvested in common shares of SLF Inc. and may also purchase common shares through our DRIP with cash. For dividend reinvestments, we may, at our option, issue common shares of SLF Inc. from treasury at a discount of up to 5% to the volume-weighted average trading price or direct that common shares be purchased on behalf of participants on the open market through the TSX and alternative Canadian trading platforms (collectively, the "Exchanges") at the market price. Common shares of SLF Inc. acquired by participants through optional cash purchases may also be issued from treasury or purchased through the Exchanges at SLF Inc.'s option, in either case at no discount. Commencing with the dividends payable on March 31, 2016 and until further notice, common shares purchased under the Plan were purchased on the open market. There are no applicable discounts because the common shares are being purchased on the open market and are not being issued from treasury.
SLF Inc. grants stock options to certain employees. These options are granted at the closing price of SLF Inc.'s common shares on the TSX on the grant date.
As at January 30, 2026, SLF Inc. had 553,873,373 common shares, 2,887,502 options to acquire SLF Inc. common shares, and 52,200,000 Class A Shares outstanding.
2. Capital Adequacy
OSFI has indicated that it will review the effectiveness of the LICAT guideline and update it to keep abreast of development in the life insurance industry and evolving risk measurement and management practices.
SLF Inc.
SLF Inc. is a non-operating insurance company and was subject to OSFI's LICAT guideline as at December 31, 2025. In accordance with this guideline, SLF Inc. manages its capital in a manner commensurate with its risk profile and control environment, and SLF Inc.'s regulated subsidiaries comply with the capital adequacy requirements imposed in the jurisdictions in which they operate. SLF Inc.'s consolidated capital position is above its internal target. As at December 31, 2025, SLF Inc.'s LICAT ratio was 157%. For additional information, refer to section
G - Financial Strength in this document.
Sun Life Assurance
Sun Life Assurance, SLF Inc.'s principal operating life insurance subsidiary in Canada, was subject to OSFI's LICAT guideline as at December 31, 2025. With a LICAT ratio of 140% as at December 31, 2025, Sun Life Assurance's capital ratio is well above OSFI's supervisory ratio of 100% and regulatory minimum ratio of 90%.
The LICAT guideline uses a risk-based approach for measuring specific life insurer risks and for aggregating the results to calculate the amount of a life insurer's regulatory required capital to support these risks. Certain of these risk components, along with available capital, are sensitive to changes in equity markets and interest rates as outlined in section K - Risk Management of this document. For additional information, refer to section G - Financial Strength in this document.
| | | | | | | | | | | | | | | | | | | | |
48 | December 31, 2025 | Sun Life Financial Inc. | | MANAGEMENT'S DISCUSSION & ANALYSIS | |
The following table shows the components of SLF Inc.'s LICAT ratio for 2025 and 2024.
SLF Inc. LICAT Ratio
| | | | | | | | |
| ($ millions) | 2025 | 2024 |
| Capital resources | | |
Adjusted retained earnings and contributed surplus (including contractual service margin) | 28,007 | 26,377 |
| Adjusted accumulated other comprehensive income | 1,394 | 2,217 |
| Common and preferred shares | 10,139 | 10,431 |
| Innovative capital instruments and subordinated debt | 8,281 | 6,318 |
Other | 216 | — |
Less: | | |
| Goodwill | 4,953 | 4,788 |
| Non-life investments and other | 10,995 | 11,283 |
| Available capital | 32,089 | 29,272 |
| Surplus allowance and eligible deposits | 6,943 | 6,838 |
Total capital resources | 39,032 | 36,110 |
| Capital requirements | | |
| Credit, market and insurance risks | 27,498 | 26,196 |
| Less: Diversification and other credits | 6,128 | 5,497 |
| Segregated fund guarantee risk | 889 | 706 |
| Operational risk | 2,566 | 2,332 |
| Base solvency buffer | 24,825 | 23,737 |
| LICAT ratio | 157 | % | 152 | % |
Foreign Life Insurance Companies
Foreign subsidiaries and foreign operations of SLF Inc. must comply with local capital or solvency requirements in the jurisdictions in which they operate. Our operations maintained capital levels above the minimum local regulatory requirements during 2025 and 2024. Additional information on capital and regulatory requirements for our foreign subsidiaries and foreign operations is provided in SLF Inc.'s AIF under the heading Regulatory Matters.
As at December 31, 2025, we have two internal reinsurance arrangements with affiliated reinsurance companies, in Delaware and Michigan, relating to our closed block of individual universal life insurance products with no-lapse guarantee benefits issued in the U.S. The Delaware reinsurance structure was established in 2013 and finances excess U.S. statutory reserves for certain universal life policies issued between January 2000 and February 2006. The financing of U.S. statutory reserve requirements in excess of those required under IFRS for the Delaware reinsurance company is supported by a guarantee from SLF Inc. The Michigan reinsurance structure was established in 2007 for certain policies issued between March 2006 and December 2008. The entity was redomesticated from Vermont to Michigan in 2020. Under the Michigan reinsurance structure, the related excess U.S. statutory reserve requirements are similarly supported by a guarantee from SLF Inc.
3. Shareholder Dividends
The declaration, amount and payment of dividends by SLF Inc. is subject to the approval of our Board and is dependent on our results of operations, our reported net income, financial condition, cash requirements and contractual restrictions. Capital management activities, as well as regulatory considerations and macro-economic factors including the economic outlook for the jurisdictions in which we do business, are also considered along with other factors. The Board reviews the level of dividends on a quarterly basis.
A regular and appropriate level of dividend payout and growth provides a stable source of return to common shareholders.
We target an underlying dividend payout ratio of between 40% and 50% based on underlying EPS.
During 2025, our dividend payout ratio to common shareholders based on our underlying EPS basis was 47% and on reported EPS was 57%.
Total common shareholder dividends declared in 2025 were $3.52 per share, compared to $3.24 in 2024.
| | | | | | | | | | | | | | | | | | | | |
| MANAGEMENT'S DISCUSSION & ANALYSIS | | Sun Life Financial Inc. | December 31, 2025 | 49 |
Dividends declared
| | | | | | | | | | | |
| Amount per share | 2025 | 2024 | 2023 |
| Common shares | 3.52 | | 3.24 | 3.00 |
| Class A preferred shares | | | |
| Series 3 | 1.112500 | 1.112500 | 1.112500 |
| Series 4 | 1.112500 | 1.112500 | 1.112500 |
| Series 5 | 1.125000 | 1.125000 | 1.125000 |
Series 8R(1)(2) | 0.756875 | 0.456250 | 0.456250 |
Series 9QR(3) | 1.078260 | 1.550162 | 1.504236 |
Series 10R(1)(4) | 0.741750 | 0.741750 | 0.741750 |
Series 11QR(5) | 1.268258 | 1.740682 | 1.694235 |
(1)On the earliest redemption date and every five years thereafter, the dividend rate will reset to an annual rate equal to the 5-year Government of Canada bond yield plus a spread specified for each series. The specified spread for Class A shares is: Series 8R - 1.41% and Series 10R - 2.17%. On the earliest redemption date and every five years thereafter, holders will have the right, at their option, to convert their shares into the series that is one number higher than their existing series.
(2)The dividend rate was reset on June 30, 2020 to a fixed annual dividend rate of 1.825% until the earliest redemption date of June 30, 2025, subsequently on June 30, 2025 the dividend rate was reset to a fixed annual dividend rate of 4.230% until the earliest redemption date of June 30, 2030.
(3)Holders of Series 9QR Shares will be entitled to receive quarterly floating rate non-cumulative dividends at an annual rate equal to the then 3-month Government of Canada treasury bill yield plus 1.41%. Holders of the Series 9QR Shares will have the right, at their option, to convert their Series 9QR Shares into Series 8R Shares on June 30, 2030, and on June 30 every five years thereafter.
(4)The dividend rate was reset on September 30, 2021 to a fixed annual dividend rate of 2.967% until the earliest redemption date September 30, 2026.
(5)Holders of Series 11QR Shares will be entitled to receive quarterly floating rate non-cumulative dividends at an annual rate equal to the then 3-month Government of Canada treasury bill yield plus 2.17%. Holders of the Series 11QR Shares will have the right, at their option, to convert their Series 11QR Shares into Series 10R Shares on September 30, 2026, and on September 30 every five years thereafter.
4. Principal Sources and Uses of Funds
Our primary source of funds is cash provided by operating activities, including premiums, investment management fees and net investment income. These funds are used primarily to pay policy benefits, dividends to policyholders, claims, commissions, operating expenses, interest expenses and shareholder dividends. Excess cash flows generated from operating activities are generally invested to support future payment requirements. We also raise funds from time to time, through borrowing and issuing of securities, to finance growth, acquisitions or other needs.
As at December 31, 2025, we maintained net cash, cash equivalents and short-term securities totaling $14.8 billion. In addition to providing for near-term funding commitments, cash, cash equivalents and short-term securities include amounts that support short-term payment obligations.
Net cash, cash equivalents and short-term securities increased $1.1 billion. The table below outlines our principal sources and uses of cash.
| | | | | | | | |
| ($ millions) | 2025 | 2024 |
| Net cash and cash equivalents, beginning of period | 9,954 | 11,170 |
| Cash flows provided by (used in): | | |
| Operating activities | 2,799 | 2,532 |
| Investing activities | (320) | (337) |
| Financing activities | (2,636) | (3,882) |
| Changes due to fluctuations in exchange rates | (198) | 471 |
| Increase (decrease) in cash and cash equivalents | (355) | (1,216) |
| Net cash and cash equivalents, end of period | 9,599 | 9,954 |
| Short-term securities, end of period | 5,156 | 3,744 |
| Net cash, cash equivalents and short-term securities, end of period | 14,755 | 13,698 |
| | | | | | | | | | | | | | | | | | | | |
50 | December 31, 2025 | Sun Life Financial Inc. | | MANAGEMENT'S DISCUSSION & ANALYSIS | |
5. Liquidity
We generally maintain an overall asset liquidity profile that exceeds requirements to fund insurance contract liabilities under prescribed adverse liability demand scenarios. To strengthen our liquidity further, we actively manage and monitor our:
•Capital levels
•Asset levels
•Matching position
•Diversification and credit quality of investments
•Cash forecasts and actual amounts against established targets
We are subject to various regulations in the jurisdictions in which we operate. The ability of SLF Inc.'s subsidiaries to pay dividends and transfer funds is regulated in certain jurisdictions and may require local regulatory approvals and the satisfaction of specific conditions in certain circumstances. Through effective cash management and capital planning, SLF Inc. ensures that its subsidiaries, as a whole and on a stand-alone basis, are properly funded and maintain adequate liquidity to meet obligations, both individually and in aggregate.
SLF Inc. (the ultimate parent company) and its wholly-owned holding companies had $2.4 billion in cash and other liquid assets(1) as at December 31, 2025. See section G - Financial Strength and M - Non-IFRS Financial Measures in this document for more information.
We maintain various credit facilities for general corporate purposes, as set out in the table below. Unless otherwise noted, all amounts are in Canadian dollars.
| | | | | | | | | | | | | | | | | | | | | | | | | | | | | | | | |
| ($ millions) | December 31, 2025 | December 31, 2024 |
| Credit Facility | Amount | Utilized | Expiry | Amount | Utilized | Expiry |
| Committed | US | $ | 500 | | US | $ | 11 | | 2028 | US | $ | 500 | | US | $ | 11 | | 2028 |
| Committed | US | $ | 1,700 | | US | $ | 1,272 | | 2026 | US | $ | 1,400 | | US | $ | 1,126 | | 2025 |
| Committed | | $ | — | | | $ | — | | n/a | | $ | 500 | | | $ | 500 | | 2025 |
| Uncommitted | US | $ | 100 | | US | $ | — | | n/a | US | $ | 100 | | US | $ | — | | n/a |
| Uncommitted | | $ | 176 | | | $ | 62 | | n/a | | $ | 179 | | | $ | 103 | | n/a |
| Uncommitted | US | $ | 25 | | US | $ | — | | n/a | US | $ | 25 | | US | $ | 1 | | n/a |
The agreements relating to our committed credit facilities contain typical covenants for investment grade companies regarding solvency, credit ratings and financial strength, all of which were met as at December 31, 2025. These covenants include, but are not limited to, the maintenance of total equity by SLF Inc. of at least $12 billion, tested as of the last day of each fiscal quarter. SLF Inc.'s total equity was $25.5 billion as at December 31, 2025.
Our failure to comply with the covenants under the committed credit facility would, subject to grace periods in the case of certain covenants, result in an event of default. This could require us to repay any outstanding borrowings or to cash collateralize letters of credit under the facility. A failure by SLF Inc. (or any of its subsidiaries) to pay an obligation due for an amount exceeding $250 million would also result in an event of default under the committed credit facility described above.
Based on our historical cash flows and liquidity management processes, we believe that the cash flows from our operating activities will continue to provide sufficient liquidity for us to satisfy debt service obligations and to pay other expenses as they fall due.
(1)This is a non-IFRS financial measure. See section M - Non-IFRS Financial Measures in this document.
| | | | | | | | | | | | | | | | | | | | |
| MANAGEMENT'S DISCUSSION & ANALYSIS | | Sun Life Financial Inc. | December 31, 2025 | 51 |
1. Risk Management Framework
The Company has an established Risk Management Framework ("Risk Framework") approved by the Board that sets out the components of our risk programs and explains how they operate together in conducting business activities. The risks that arise when providing products and services to Clients, which are in line with our Purpose to help our Clients achieve lifetime financial security and live healthier lives, are managed within these protocols and programs. Effective risk management is critical to the overall profitability, competitive market positioning, organizational resilience and long-term financial viability of the Company. While all risks cannot necessarily be eliminated or known with certainty, the Risk Framework seeks to ensure that risks to a business undertaking are appropriately managed to achieve the Company's business objectives over time and are not expected to exceed the pre-established boundaries for risk taking. The Risk Framework, corporate strategy and business objectives are all aligned to each other, and the risk management protocols and programs are embedded within every business segment.
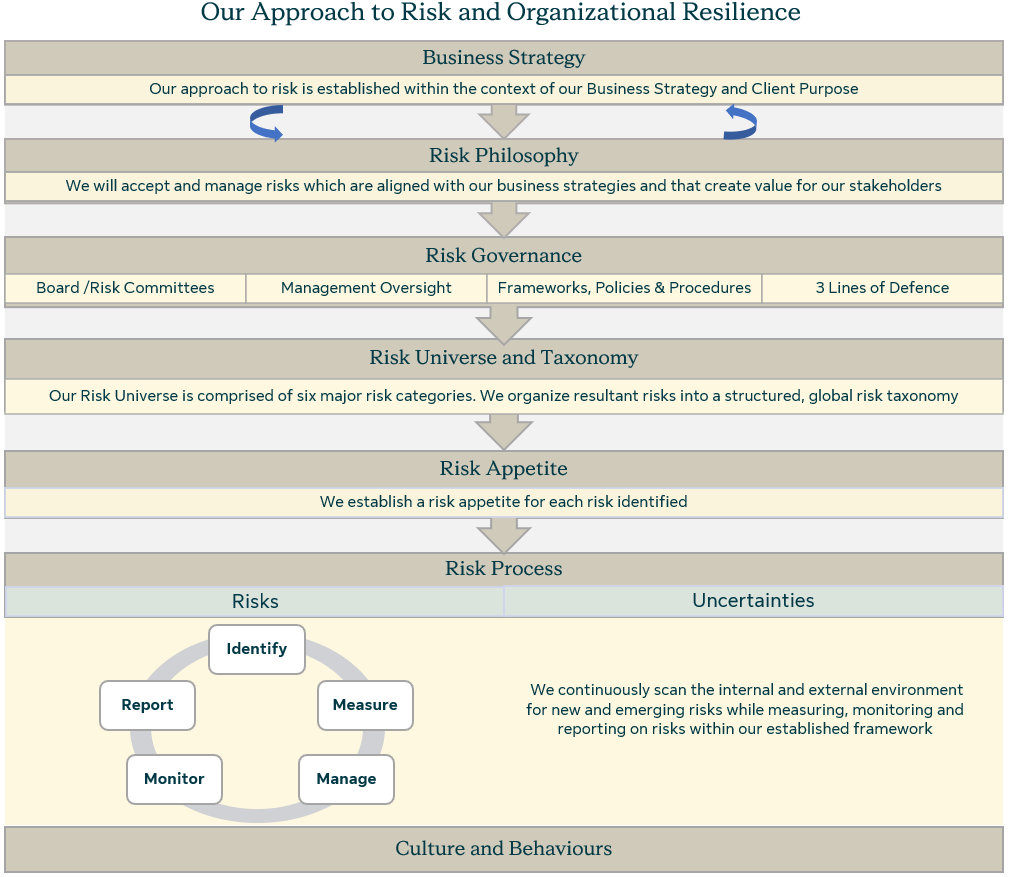
| | | | | | | | | | | | | | | | | | | | |
52 | December 31, 2025 | Sun Life Financial Inc. | | MANAGEMENT'S DISCUSSION & ANALYSIS | |
2. Risk Governance and Accountabilities
Our Risk Framework sets out lines of responsibility and authority for risk-taking, governance and control. These governance requirements are summarized below.
Board of Directors
The Board and its committees are responsible for ensuring the oversight and governance of all risks across the Enterprise and have primary responsibility for ensuring risk management frameworks, policies, programs and practices are in place. By approving our Risk Management Framework, Risk Appetite Policy, Capital Risk Policy, Capital and Liquidity Management Framework, and Change Management Policy and providing ongoing oversight of the risk management programs, the Board ensures that key risks are appropriately identified and managed. Business, strategic and long-term risks are overseen through review and approval of the Business and Strategic Plans. The Board provides oversight on key themes, issues and risks (including climate) arising in connection with the design or implementation of these plans.
The Risk Committee is a standing committee of the Board whose primary functions are to assist the Board with oversight of current and emerging risks enterprise-wide, and of the Risk Management function to ensure that management has in place programs, policies, processes and controls designed to identify and effectively manage the significant risks to which the Company is exposed and has sufficient capital to underpin those risks. It reviews and approves all risk management frameworks and policies and reviews compliance with those frameworks and policies. In addition, where the Board has delegated risk oversight to other committees of the Board ("Board Committees"), the Risk Committee provides the Board with an integrated view of oversight of risk management across all Board committees. The Risk Committee regularly monitors the Company's risk profile to ensure it is within the agreed risk appetite and that the Company's capital position exceeds regulatory capital requirements, and monitors and recommends to the Board for approval, the specific risk limits allocated to the businesses and the annual Capital Plan. The Risk Committee also oversees risk management activities of our subsidiaries and joint ventures under the Company's management control and risks posed to the Company through its other joint ventures.
The Governance Committee of the Board is responsible for assisting the Board in overseeing (i) the development of effective corporate governance guidelines and processes, including those addressing the effectiveness of the Board and its committees and director succession planning and recruitment; (ii) the Company's Investment Plan and investment performance, including investment practices, procedures and controls related to the management of the general fund investment portfolio; (iii) sustainability matters including the Company's Sustainability Policy, Sustainability Strategy (including the development of a Climate Transition Plan) and OSFI B-15 Climate Risk Management Report; and (iv) compliance and compliance management programs, including compliance with legal and regulatory requirements, the identification and management of compliance risk, and the development of policies and processes to sustain ethical behaviour. The Committee also serves as the conduct review committee of Sun Life and the conduct review committee for certain
| | | | | | | | | | | | | | | | | | | | |
| MANAGEMENT'S DISCUSSION & ANALYSIS | | Sun Life Financial Inc. | December 31, 2025 | 53 |
subsidiaries of Sun Life that are federally regulated financial institutions ("FRFIs") in accordance with applicable provisions of the Insurance Companies Act (Canada) and Trust and Loan Companies Act (Canada).
The Audit Committee of the Board is responsible for assisting the Board in overseeing the integrity of financial statements and related information provided to shareholders and other stakeholders, compliance with financial regulatory requirements, adequacy and effectiveness of the internal controls implemented and maintained by management, and assessing the qualifications, independence, and performance of the external auditor. The Committee also acts as the audit committee for certain subsidiaries of Sun Life that are FRFIs in accordance with the applicable provisions of the Insurance Companies Act (Canada) and the Trust and Loan Companies Act (Canada).
The Management Resources Committee of the Board is responsible for assisting the Board with oversight of succession planning for senior executive positions and programs to effectively attract, retain, develop and reward employees. It provides guidance to management on advancing the talent agenda to achieve strategic objectives and foster the Company's culture. The Committee reviews incentive designs and governance of material incentive programs against alignment with business objectives and avoiding excessive risk taking. It reviews the implications of key enterprise risks, including people and culture risks pertaining to compensation design and human resources practices. In addition, the Committee reviews compensation matters, including the remuneration of executives who have a material impact on the risk exposure of the Company.
Senior Management Committees
The Executive Risk Committee ("ERC") provides executive management oversight of the Company's enterprise risk management activities. This includes the review and articulation of the risk appetite, overseeing that the risk profile is within the agreed risk appetite, and overseeing that there are policies, processes and controls in place to identify and effectively manage the significant risks, in accordance with the risk appetite and overall objective of promoting a balanced business and product model that will achieve agreed upon risk-adjusted returns and allocate capital accordingly.
The Investment & Credit Risk Committee is responsible for reviewing critical matters related to the on-going management of the Company's General Fund. Accordingly, the Committee is responsible for overseeing, monitoring and reviewing current and potential credit and investment risk exposures, other credit and investment risk management issues and future credit and investment risk management strategies.
The Corporate Asset Liability Management Committee is responsible for providing oversight and input on the Asset Liability Management framework, policies, guidelines, limits, measurement and performance assessment applicable to the management of market and liquidity risks, as well as providing oversight of asset liability management and hedging strategy changes.
The Operational Risk & Compliance Committee is responsible for providing oversight of the Company's operational and compliance risk management practices, current and emerging operational risk exposures, and the processes to ensure ongoing identification of major operational and compliance risks facing the Company.
The Insurance Risk Committee is responsible for providing oversight and direction on insurance risk exposures facing the Company and to ensure that effective insurance risk management practices and controls are in place. This includes reviewing the current and emerging insurance risk profile; engaging in review of topical insurance, reinsurance, underwriting, claims and medical risk issues; and reviewing and recommending changes to the insurance risk appetite measurement methodology.
Accountabilities
Primary accountability for risk management is delegated by the Board of Directors to our Chief Executive Officer ("CEO"). The CEO further delegates responsibilities throughout the Company through management authorities and responsibilities. The CEO delegates accountability for the various classes of risk management to our executive officers, who are accountable for ensuring that the management of risk in the scope of their business accountability is in accordance with the Board approved Risk Framework, Risk Appetite Policy and risk management frameworks and policies.
3. Risk Universe
As a large financial services organization operating in a complex industry, the Company encounters a variety of risks. We face risks in formulating our business strategy and business objectives, in carrying on our business activities in the pursuit of our strategy and objectives, and from external factors. The Risk Framework structures key and emerging risks into a robust, global risk taxonomy comprised of six categories: business and strategic, credit, market, liquidity, insurance and operational risks. The Risk Framework sets out the core processes used to identify, measure, manage, monitor and report risks. The Risk Framework sets out both qualitative and quantitative measures and processes to control the risk the Company will bear in respect of each of these categories of risk and in aggregate.
4. Risk Appetite
Our Risk Appetite Policy defines, within Risk Capacity, the type and maximum comfortable amount of risk we are willing to assume in pursuit of our business objectives, and is approved by the Board. It is forward-looking and our Strategic Plan, Capital Plan, Business Plan and objectives are established within its boundaries.
The Company's risk appetite seeks to balance the various needs, expectations, risk and reward perspectives and investment horizons of all stakeholders.
Our risk appetite is the primary mechanism for operationalizing our risk philosophy and the boundaries of permissible risk-taking across the enterprise. Our risk appetite supports the objective of maintaining sufficient capital, managing earnings volatility, managing operational risk and managing liquidity. To accomplish this, our risk appetite includes a wide array of qualitative and quantitative standards that reflect the Company's overall risk management principles and values.
| | | | | | | | | | | | | | | | | | | | |
54 | December 31, 2025 | Sun Life Financial Inc. | | MANAGEMENT'S DISCUSSION & ANALYSIS | |
We are generally comfortable accepting diversifiable risks where we are capable of using risk pooling to create liability portfolios with relatively low volatility. We take risk where we have internal expertise such as actuarial, underwriting, claims management, investment, risk management and distribution or where reinsurance partners are able to supplement our internal expertise. We prefer risks that arise across various dimensions, including products, geographies (intra-national and international), distribution channels and asset classes in order to maximize diversification benefits.
Our Risk Appetite Policy sets out multiple constraints which define the aggregate level of risk that the Company is willing to accept. We translate our risk appetite constraints into specific risk limits by risk class and business segment. Our risk profile is measured, managed and monitored regularly to ensure that we operate within our risk appetite. Our risk appetite limits are revised periodically to reflect the risks and opportunities inherent in our evolving business strategies and operating environment.
5. Risk Management Policies
In order to support the effective communication, implementation and governance of our Risk Framework, we have codified our processes and operational requirements into a comprehensive series of underlying risk management frameworks, policies and operating guidelines. These frameworks, policies and guidelines promote the application of a consistent approach to managing risk exposures across our global business platform. The Board and Board Committees regularly review and approve significant changes to risk management frameworks and policies and regularly review management's reporting and attestation on compliance with these frameworks and policies.
6. Risk Management Process
All business segments employ a common approach to identify, measure, manage, monitor and report risks. The risk management process as set out in our Risk Framework is described below:
Risk Identification
Business segments have accountability for identifying and managing risks facing their business. We have a process to identify and monitor key and emerging risks that may have a material impact on our finances, operations or reputation. We evaluate potential correlations and inter-connections between various risk events and categories, and monitor key and emerging risks, emerging regulatory and rating agency requirements, or industry developments and various research reports.
Risk Measurement
Risk measurement involves determining and evaluating potential risk exposures and includes a number of techniques, including:
•Monitoring key risk indicators
•Probability-severity assessments
•Stress testing (including sensitivity and scenario analysis)
•Reverse stress testing
•Stochastic modelling
Risk measures are expressed in quantitative and qualitative terms.
A robust stress testing program forms an essential component of the Company's risk management program used to measure, monitor, understand and mitigate the Company's risk exposures and to ensure ongoing capital adequacy under plausible stress events. Stress testing is performed on key metrics such as earnings, regulatory capital ratios and liquidity to identify and monitor potential vulnerabilities to key risk drivers and ensure that the Company is operating within its risk appetite.
We develop and test a range of scenarios based on our internal assessment and regulatory guidance. Emerging risks are one of the inputs to determine stress test scenarios.
•Sensitivity testing is conducted on a regular basis and measures the earnings and regulatory capital and liquidity impacts from changes in underlying risk factors, assuming that there are no changes to any of the other risk factors. Sensitivity testing is performed for individual risks and for consolidated risk exposures at different levels of stress and at various levels of aggregation.
•Scenario testing involves changes to a number of risk factors to assess the impact of and interaction between these risk factors. These scenarios include integrated scenario testing, reverse scenario testing and key assumption sensitivity testing.
•Financial Condition Testing ("FCT"), as prescribed by the Canadian Institute of Actuaries, is used to satisfy requirements under the Canadian insurance Company Act, and OSFI regulations. Through stress testing selected adverse scenarios, the main objectives of FCT are to identify possible threats to our financial condition and determine the corrective management actions to mitigate those threats.
Risk Management
Risk management decisions are formed by evaluating whether the assessed risk for a business activity aligns with our risk appetite and meets the objective of risk-adjusted returns.
Risk Monitoring
Monitoring processes include oversight by the Board, which is exercised through Board Committees and Senior Management committees described in the Risk Governance and Accountabilities section in this document.
Risk Reporting
At least on a quarterly basis, the Senior Management committees, Board Committees and the Board review reports that summarize our risk profile against the Board approved risk appetite, including the exposures across our principal risks, any changes in risk trends, forward-looking view of risks and emerging risks. These committees also review the effectiveness of the risk management strategies presented in the reports. On a regular basis, the Board and the Board Committees review and approve any significant changes to risk management frameworks and policies for the management of risk and review compliance with these frameworks and policies.
| | | | | | | | | | | | | | | | | | | | |
| MANAGEMENT'S DISCUSSION & ANALYSIS | | Sun Life Financial Inc. | December 31, 2025 | 55 |
7. Three Lines of Defence
The Company’s risk governance allocates accountability and functional responsibilities through the adoptions of the Three Lines of Defence (“LOD”) model to ensure appropriate oversight. This segregation of responsibility helps to establish a robust control framework that promotes transparent and independent challenge of all risk-taking activities, and that encourages all functions to engage in self-critical examination to foster continuous improvement of the management of risk in our business.
The first LOD is represented by the business segment management who own the risks that are intrinsic to the business and have the primary responsibility to identify, measure, manage, monitor and report these risks. Some of the first LOD risk related responsibilities include:
•Identification of key and emerging risks;
•Manage, measure, monitor and report on risk within their business operations;
•Accountability for the risks taken to achieve business results and the resulting impact of those risks; and
•Operating within risk appetite and according to risk management frameworks and policies;
•Cultivating a strong risk culture.
The second LOD includes the Chief Risk Officer ("CRO") and heads of the oversight functions who are responsible for providing independent oversight of our Enterprise-wide risk management programs. The CRO is responsible for developing our Risk Framework and Risk Appetite Policy, and for overseeing the development and implementation of risk management strategies aimed at optimizing the risk-return profile of the Company. The CRO is supported by a network of business segment risk officers. The functional heads support the CRO in the implementation and communication of our Risk Framework and Risk Appetite Policy. Some of the key second LOD risk related responsibilities include:
•Establishment of the risk management framework and policies;
•Providing oversight and effective independent challenge of first LOD; and
•Independent reporting to Senior Management committees and the Board of Directors on the level of risk against risk appetite.
The third LOD responsibilities are distinct from first and second LOD responsibilities. The Internal Audit function is the third LOD and is responsible for providing independent assurance to Senior Management and the Board and/or Board Committees on the design and operational effectiveness of the risk management practices and internal controls carried out by first and second LOD. Internal Audit provides a quarterly opinion on the effectiveness of internal controls, risk management and governance processes to the Audit Committee of the Board. In addition, the Risk Committee may engage third-party independent reviews to supplement the third LOD review of the effectiveness of the Company's risk management programs.
8. Culture and Managing Risk
We have built a strong Purpose-driven culture reflected in our core values; caring, authentic, bold, inspiring and impactful. These values set the tone and guide our high business standards, integrity and ethical behaviour, respect, and commitment to doing the right thing for our Clients.
The Board establishes the "tone from the top" and is accountable to ensure that the CEO and Senior Management create and sustain high standards of integrity throughout the organization. We work together through our focus on sustainability to maximize our positive impact and ensure the resiliency of our organization, in support of our Purpose of helping our Clients to achieve lifetime financial security and to live healthier lives.
A key premise of our Culture Management Framework is that everyone has an important role to play in preserving and enhancing our culture, which includes managing the Company’s risks. In order to support employees in fulfilling their role in managing the Company's risks, we have taken action to ensure our risk protocols and procedures are well defined and embedded in our day-to-day business activities, assess that appropriate resources and training are provided, establish and communicate a common risk philosophy and a high bar for integrity and conduct, and encourage every Employee to openly identify risk exposures and communicate escalating risk concerns. The following elements support our culture:
•Setting core values to guide decision making and behaviour;
•Establishing tone from the top and middle;
•Encouraging transparency in risk-taking;
•Performing effective challenge in conducting business decisions;
•Aligning incentives and risk management practices;
•Effectively communicating culture expectations;
•Establishing clear accountabilities; and
•Promoting ongoing resiliency
Risk Management is embedded in the enterprise's culture, which encourages ownership and responsibility for risk management at all levels. Our compensation programs are aligned to the organization's risk management practices through our governance structure for the approval of incentive compensation plans, design of incentive compensation plans and processes used to support the alignment of compensation and risk management. We continuously reinforce and embed the accountability for risk management through communication and training on risk management at various forums and across various levels through training on the Code of Conduct annually, reinforcing accountability through performance reviews and compensation, continually monitoring processes and outcomes that drive expected behaviours, and through clearly defining roles, responsibilities and expectations in the risk management frameworks and policies.
| | | | | | | | | | | | | | | | | | | | |
56 | December 31, 2025 | Sun Life Financial Inc. | | MANAGEMENT'S DISCUSSION & ANALYSIS | |
The Company's risk philosophy includes the following core principles:
Strategic Alignment
Our corporate strategy and business objectives are required to be established within the boundaries and prescriptions set out in the Risk Framework and the Risk Appetite Policy. This requires us to consider whether a business activity, intended to achieve the business and financial objectives, will result in a risk profile that we are willing to accept and which we are prepared to manage. We have established a range of explicit risk appetite constraints that we apply to all acceptable risks. Business and strategic risk is managed through our strategic and business planning process and through controls over the implementation of these Strategic and Business Plans. Risks associated with activities outside our risk appetite or outside the acceptable defined risks are avoided.
Capital and Liquidity Management
Maintaining adequate capital and liquidity is essential to the continued operations of the Company and Subsidiaries. We assess and forecast capital adequacy on an on-going basis to operate in a safe and sound manner and to maintain adequate capital in relation to the risks associated with our business activities and strategy. Capital adequacy is assessed across all our businesses using the annual strategy and business planning processes and the annual ORSA process and is monitored on a regular basis. The level of capital adequacy risk accepted by the Company and Subsidiaries is required to be prudent and consistent with the principles, frameworks and policies outlined in the Risk Management Framework and Risk Appetite Policy. Capital adequacy risk is mitigated through adherence to risk management frameworks, policies and processes.
Maintaining adequate liquidity is critical to the protection of our policyholders, Clients and creditors and to maintaining ratings and access to capital markets.
Client and Other Stakeholder Interests
Our Risk Appetite Policy considers the interests of a large number of key stakeholders, including Clients, shareholders, debt-holders, employees, regulators, distributors, rating agencies and other capital markets participants. The policy prescribes how to balance the needs, expectations, risk and reward perspectives, and investment horizons of these different stakeholders. The Business Plans and business strategies are independently tested validated to ensure that they operate within the boundaries and requirements set out in the Risk Framework and the Risk Appetite Policy, and the results of this testing validation are reported to the Board.
Effective risk management requires that objectives and incentives be aligned to ensure management's decisions are consistent with the Company's risk philosophy and risk appetite. Compensation programs for employees are approved by the Board and the Board Committees and are aligned with the Company's risk philosophy, values, business and risk management strategies, and the long-term interests of stakeholders. In establishing annual performance objectives, we consider risk management goals to ensure that business decisions are consistent with the desired risk and return profile of the Company.
Capability Alignment
We seek out profitable risk-taking opportunities in those areas where we have established risk management skills and capabilities. Conversely, we endeavour to avoid or transfer risks that are beyond our risk-taking capability. Our ability to measure and evaluate risks, the quality of our risk governance and control environment, the depth and quality of our risk responses and the robustness of our pricing strategies are particularly important capabilities that we assess.
Portfolio Perspective
In evaluating a particular risk, consideration is given to a portfolio perspective of risk and return including the explicit recognition of the impacts of diversification and concentration and how different risks interact with each other. This perspective is extended to the development of risk mitigation and pricing strategies, recognizing that often the most cost-effective way of managing risk involves utilizing available relationships already inherent in our businesses.
Risk-Adjusted Returns
Financial return metrics used to assess business activities are developed in consideration of the constraints set out in the Risk Appetite Policy, and reflect the expected costs of mitigation and the cost of risk capital required to support the risk-taking activity.
Understanding and Managing Uncertainties
While many risks are relatively well understood and measurable, there are risks that do not lend themselves to traditional metrics. We refer to these as “uncertainties”. These include geopolitical and environmental risks which are difficult to quantify and can have widespread contagion effects. It is important for the organization to not just analyze risks in silos but anticipate and prepare for uncertain events given the potential spillover of impacts onto other related risks. Rigorous and thoughtful table-top exercises should be convened as appropriate to understand the potential impacts and ramifications of plausible risk uncertainties and implement resiliency strategies.
Organizational Resilience
With various external challenges and increasing threats, it is key for the organization to maintain and enhance resiliency as a best practice. The capability to adapt in ever-changing conditions and a commitment to taking a resilient approach, are crucial in managing key vulnerabilities and delivering objectives in the face of business disruptions.
Culture
Culture is a pervasive, interconnected set of declared norms and expectations, beliefs, assumptions, and formal controls that shape decision making and behaviour. An organization's culture impacts its ability to create value and to protect value. Our culture encourages behaviour aligned with our goals for long-term value creation.
| | | | | | | | | | | | | | | | | | | | |
| MANAGEMENT'S DISCUSSION & ANALYSIS | | Sun Life Financial Inc. | December 31, 2025 | 57 |
Our culture and values set the tone for how we act, interact and make decisions, underpinning appropriate behaviours, guiding interactions with Clients, and impacting how Employees experience the organization. Our culture has significant potential to impact our risk profile. Maintaining the right balance of risk-taking and risk control activities is a key organizational capability and fundamental to our long-term sustainable success.
Long-Term, Sustainable and Resilient
Our risk philosophy addresses the Company’s material economic, environmental and social impacts, and the opportunities and risks they present in delivering long-term value to the key stakeholders for the Company. Frameworks, policies, processes, and controls are in place to identify and effectively manage risks to which we are exposed while operating within the Risk Management Framework and Risk Appetite Policy.
9. Risk Categories
The text and tables in the following section of this MD&A include our disclosure on credit, market and liquidity risks in accordance with IFRS 7 Financial Instruments - Disclosures ("IFRS 7") and IFRS 17 Insurance Contracts, as well as a discussion on how we measure risk and our objectives, policies and methodologies for managing these risks. Disclosures in accordance with IFRS 7 and IFRS 17 are identified by a vertical line in the left margin of the page. The fact that certain text and tables are identified with a vertical line does not imply that these disclosures are of any greater importance than any other text or tables, and the Risk Management disclosure should be read in its entirely.
The disclosures in the Risk Management section of this document should be considered carefully together with other information in this MD&A and in the 2025 AIF, our Consolidated Financial Statements and other reports and materials that we file with securities regulators.
In this section, segregated funds include segregated fund guarantees, variable annuities and investment products, and includes Run-off reinsurance in U.S. IFM.
Our Risk Framework groups all risks into six major risk categories: market, insurance, credit, business and strategic, operational and liquidity risks.
| | | | | |
| i. Market Risk Risk Description We are exposed to market risk, which is defined as the risk that the value or future cash flows of insurance and investment contract liabilities or financial assets will fluctuate because of changes or volatility in market prices. Market risk includes equity, interest rate and spread, real estate, foreign currency, and inflation risks.
Market Risk Management Governance and Control We employ a wide range of market risk management practices and controls as outlined below: •Market risk governance practices are in place, including independent monitoring and review and reporting to senior management and the Risk Committee. •Income and regulatory capital sensitivities are monitored, managed, and reported against pre-established risk appetite limits. •Comprehensive asset-liability management and hedging policies, programs and practices are in place. •Regulatory solvency requirements include risk-based capital requirements and are monitored regularly. •Product Design and Pricing Policy requires a detailed risk assessment and pricing provisions for material risks. •Stress-testing techniques, such as FCT, are used to measure the effects of large and sustained adverse market movements. •Insurance contract liabilities are established in accordance with IFRS. •Internal capital targets are established at an enterprise level to cover all risks and are above minimum regulatory and supervisory levels. Actual capital levels are monitored to ensure they exceed internal targets.
Specific market risks and our risk management strategies are discussed below in further detail. |
| | | | | |
| Equity Risk Equity risk is the potential for financial loss arising from declines or volatility in public or private equity market prices. We are exposed to equity risk from a number of sources.
We generate revenue in our asset management businesses and from certain protection and wealth contracts where fees are levied on account balances that are affected directly by equity market levels. Accordingly, we have further exposure to equity risk as adverse fluctuations in the market value of such assets will result in corresponding adverse impacts on revenue, income, the contractual service margin, and capital. In addition, declining and volatile equity markets may have a negative impact on sales and redemptions (surrenders) in these businesses, and this may result in further adverse impacts on net income, the contractual service margin, and capital. |
| | | | | | | | | | | | | | | | | | | | |
58 | December 31, 2025 | Sun Life Financial Inc. | | MANAGEMENT'S DISCUSSION & ANALYSIS | |
| | | | | |
| A portion of our exposure to equity risk arises in connection with benefit guarantees on segregated fund products, some participating insurance contracts, some adjustable insurance contracts, and some universal life contracts. These benefit guarantees may be triggered upon death, maturity, withdrawal or annuitization. The cost of providing these guarantees is uncertain and depends upon a number of factors, including general capital market conditions, our hedging strategies, policyholder behaviour and mortality experience, each of which may result in negative impacts on net income, the contractual service margin, and capital.
We also have direct exposure to equity markets from the investments supporting other general account liabilities, surplus, and employee benefit plans. These exposures fall within our risk-taking philosophy and appetite, and are therefore generally not hedged.
|
| Interest Rate and Spread Risk Interest rate and spread risk includes the potential for financial loss arising from changes in the value of insurance and investment contract liabilities and financial assets due to changes or volatility in interest rates or spreads. In practice, when asset cash flows and the policy obligations they support are not matched, this may result in the need to either sell assets to meet policy payments and expenses or reinvest excess asset cash flows in unfavourable interest rate or spread environments. This risk is managed in our asset-liability management program. Details of the asset-liability management program are discussed under the heading "Market Risk Management Strategies" in section K - Risk Management in this document.
Our primary exposure to interest rate and spread risk arises from insurance and investment contracts that contain guarantees in the form of minimum crediting rates, maximum premium rates, settlement options, guaranteed annuitization options and minimum benefits. If investment returns fall below guaranteed levels, we may be required to increase liabilities or capital in respect of these contracts. The guarantees attached to these products may be applicable to both past premiums collected and future premiums not yet received. Segregated fund contracts provide benefit guarantees that are linked to underlying fund performance and may be triggered upon death, maturity, withdrawal or annuitization. Exposure to guarantees is managed within our risk appetite limits through our asset-liability management program, which may include the use of hedging strategies utilizing interest rate derivatives such as interest rate floors, swaps, forwards, futures and swaptions. The impact of these guarantees on net income, contractual service margin, and capital are included in the disclosed market risk sensitivities.
Significant changes or volatility in interest rates or spreads could have a negative impact on sales of certain protection and wealth products, and adversely impact the expected pattern of redemptions (surrenders) on existing policies. •Increases in interest rates or widening spreads may increase the risk that policyholders will surrender their contracts, potentially forcing us to liquidate assets at a loss. While we have established hedging programs in place and our protection and wealth products often contain surrender mitigation features, these may not be sufficient to fully offset the adverse impact of changes in interest rates or spreads. •Declines in interest rates or narrowing spreads can result in compression of the net spread between interest earned on investments and interest credited to policyholders, increased asset calls, mortgage and structured security prepayments, and net reinvestment of positive cash flows at lower yields, and therefore can adversely impact our profitability and financial position. •Negative interest rates may additionally result in losses on our cash and short-term deposits and low or negative returns on our fixed income assets impacting our profitability. •A sustained low interest rate environment may additionally adversely impact our net income, CSM, capital, and our ability to implement our business strategy and plans. This may be realized through lower sales, less profitable new business, changes in the pattern of redemptions on existing policies, among other impacts.
We also have direct exposure to interest rates and spreads from investments supporting other general account liabilities, surplus and employee benefit plans. Higher interest rates or wider spreads will reduce the value of our existing assets. Conversely, lower interest rates or a narrowing of spreads will result in reduced investment income on new fixed income asset purchases. These exposures fall within our risk-taking philosophy and appetite and are therefore generally not hedged.
Real Estate Risk Real estate risk is the potential for financial loss arising from fluctuations in the value of, or future cash flows from, our investments in real estate. We are exposed to real estate risk and may experience financial losses resulting from the direct ownership of real estate investments or indirectly through fixed income investments secured by real estate property, leasehold interests, ground rents, and purchase and leaseback transactions.
Real estate price risk may arise from external market conditions, inadequate property analysis, inadequate insurance coverage, inappropriate real estate appraisals, or from environmental risk exposures.
We hold real estate investments that support general account liabilities and surplus, and fluctuations in value will affect our net income, CSM, and capital. A material and sustained increase in interest rates may lead to deterioration in real estate values. |
| | | | | | | | | | | | | | | | | | | | |
| MANAGEMENT'S DISCUSSION & ANALYSIS | | Sun Life Financial Inc. | December 31, 2025 | 59 |
| | | | | |
| Foreign Currency Risk Foreign currency risk is the result of mismatches in the currency of our assets and liabilities (inclusive of capital), and cash flows. This risk may arise from a variety of sources such as foreign currency transactions and services, foreign currency hedging, investments denominated in foreign currencies, investments in foreign subsidiaries and net income from foreign operations. Changes or volatility in foreign exchange rates, including a change to currencies that are fixed in value to another currency, could adversely affect our net income, contractual service margin and capital.
As an international provider of financial services, we operate in a number of countries, with revenues and expenses denominated in several local currencies. In each country in which we operate, we generally maintain the currency profile of assets to match the currency of liabilities and required capital. This approach provides an operational hedge against disruptions in local operations caused by currency fluctuations. Foreign currency derivative contracts such as currency swaps and forwards are used as a risk management tool to manage the currency exposure in accordance with our Asset Liability Management Policy. As at December 31, 2025 and December 31, 2024, the Company did not have a material foreign currency risk mismatch exposure.
Changes in exchange rates can affect our net income and surplus when financial results in functional currencies are translated into Canadian dollars. Net income earned outside of Canada is generally not currency hedged and a weakening in the local currency of our foreign operations relative to the Canadian dollar can have a negative impact on our net income reported in Canadian currency. A strengthening in the local currency of our foreign operations relative to the Canadian dollar would have the opposite effect. Regulatory capital ratios could also be impacted by changes in exchange rates. |
| | | | | |
| Inflation Risk Inflation risk is the potential for financial loss arising from changes in inflation rates. This risk results from insurance contract liabilities that are linked to market measures of inflation such as the Consumer Price Index. The primary sources for this risk exposure are from certain group and retail annuity contracts and group long term disability contracts. In these contracts, the annuity and disability benefit payments may be linked to an indexing formula containing an inflation price index. Benefit payments linked to inflation indices may also include various caps, floors and averaging mechanisms that vary across product designs.
Exposure to inflation risk is managed within our asset-liability management program, primarily by investing in inflation linked assets to match liability exposures.
|
The impact of inflation on general account expenses is discussed under the heading "Expense Risk" in section K - Risk Management in this document.
| | | | | |
| Market Risk Sensitivities |
| We utilize a variety of methods and measures to quantify our market risk exposures. These include duration management, key rate duration techniques, convexity measures, cash flow gap analysis, scenario testing, and sensitivity testing of earnings and regulatory capital ratios versus risk appetite limits.
The measurement of liabilities and assets are affected by the level of equity market performance, interest rates, credit and swap spreads and other market risk variables. The following sections set out the estimated immediate impact on, or sensitivity of, our net income(1), contractual service margin, OCI and SLF Inc.'s LICAT ratio to certain instantaneous changes in market variables as at December 31, 2025 and December 31, 2024.
The estimated sensitivities in the tables below reflect the impact of market movements on insurance and investment contracts, assets backing insurance contracts, assets backing investment contracts, assets backing the surplus segment, and seed investments in our asset management subsidiaries.
Net income sensitivities to equity and real estate market movements are driven primarily by changes in the value of investments backing general account liabilities and surplus. Net income sensitivities to interest rates and spreads are driven by the net impact on liabilities and the assets backing them. Lower interest rates or a narrowing of spreads will typically result in increased liabilities for insurance contracts, offset by increased values of the assets backing general account liabilities. Higher interest rates or a widening of spreads will typically result in decreased liabilities for insurance contracts, offset by decreased values of the assets backing general account liabilities. Further detail on the impact of changes or volatility in market prices on assets and liabilities is provided under the headings "Equity Risk", "Interest Rate and Spread Risk", "Real Estate Risk", and "Foreign Currency Risk" above.
OCI sensitivities are impacted by changes in the market value of assets classified as FVOCI. The market value of FVOCI fixed income assets, which are held primarily backing surplus, investment contracts and CSM liabilities, increases with lower interest rates or a narrowing of spreads, and decreases with higher interest rates or widening of spreads.
As these market risk sensitivities reflect an instantaneous impact on net income, CSM, OCI and SLF Inc.'s LICAT ratio, they do not include impacts over time such as the effect on fee income in our asset management businesses.
Refer to Additional Cautionary Language and Key Assumptions Related to Sensitivities in this section for important additional information regarding these estimates. |
| | | | | | | | | | | | | | | | | |
| | |
| (1)Net income in section K - Risk Management in this document refers to common shareholders' net income. |
| | | | | | | | | | | | | | | | | | | | |
60 | December 31, 2025 | Sun Life Financial Inc. | | MANAGEMENT'S DISCUSSION & ANALYSIS | |
Private and Public Equity Market Sensitivities
The following table sets out the estimated immediate impact on, or sensitivity of, our net income, CSM, OCI and SLF Inc.'s LICAT ratio to certain instantaneous changes in public or private equity market prices as at December 31, 2025 and December 31, 2024. The sensitivities shown outline the impact of the same percentage increase or decrease applied to each of private equity and public equity.
| | | | | | | | | | | | | | | | | | | | | | | | | | | | | | |
| ($ millions, unless otherwise noted) | | | | | | As at December 31, 2025 | |
| Change in Private and Public Equity Markets(1)(2)(3) | | 25% decrease | 10% decrease | 10% increase | 25% increase | |
| Potential impact on net income (after-tax) | | | | | | | | | |
| Private Equity | | (325) | | (125) | | 125 | | 325 | |
| Public Equity | | (225) | | (100) | | 100 | | 250 | |
| Potential impact on CSM (pre-tax) | | (900) | | (350) | | 325 | | | 825 | | |
| Potential impact on OCI(4) | | — | | | — | | | — | | | — | | |
| Potential impact on LICAT ratio(5) | 1.0% point decrease | 0.5% point decrease | 0.5% point increase | 0.5% point increase | |
| | | | | | | | | |
| ($ millions, unless otherwise noted) | | | | | | As at December 31, 2024 | |
| Change in Private and Public Equity Markets(1)(2)(3) | | 25% decrease | 10% decrease | 10% increase | 25% increase | |
| Potential impact on net income (after-tax) | | (550) | | (225) | | 225 | | 575 | |
| Potential impact on CSM (pre-tax) | | (775) | | (300) | | 275 | | 650 | |
| Potential impact on OCI(4) | | — | | | — | | | — | | | — | | |
| Potential impact on LICAT ratio(5) | 2.0% point decrease | 0.5% point decrease | 0.5% point increase | 1.0% point increase | |
|
(1)Represents the respective change across all equity exposures as at December 31, 2025 and December 31, 2024. Due to the impact of active management, basis risk, and other factors, realized sensitivities may differ meaningfully from expectations. Sensitivities include the impact of re-balancing equity hedges for hedging programs at 2% intervals (for 10% changes in equity markets) and at 5% intervals (for 25% changes in equity markets). (2)The market risk sensitivities include the estimated impact of our hedging programs in effect as at December 31, 2025 and December 31, 2024, and include new business added and product changes implemented prior to such dates. (3)Net income, CSM, and OCI sensitivities have been rounded in increments of $25 million. The sensitivities exclude the market impacts on the income from our joint ventures in China and India. | |
| (4) The market risk OCI sensitivities exclude the impact of changes in the defined benefit obligations and plan assets. (5)The LICAT sensitivities illustrate the impact on SLF Inc. as at December 31, 2025 and December 31, 2024. LICAT ratios are rounded in increments of 0.5%. | |
| | | | | | | | | | | | | | | | | | | | |
| MANAGEMENT'S DISCUSSION & ANALYSIS | | Sun Life Financial Inc. | December 31, 2025 | 61 |
Interest Rate Sensitivities
| | | | | | | | | | | | | | | | | | | | | | | | | | | | | |
| The following table sets out the estimated immediate impact on, or sensitivity of, our net income, CSM, OCI and SLF Inc.'s LICAT ratio to certain instantaneous changes in interest rates as at December 31, 2025 and December 31, 2024. |
| | | | | | | | | |
| ($ millions, unless otherwise noted) | As at December 31, 2025 | As at December 31, 2024 |
| Change in Interest Rates(1)(2)(3) | 50 basis point decrease | 50 basis point increase | 50 basis point decrease | 50 basis point increase |
| Potential impact on net income (after-tax) | | — | | (25) | | (50) | | 25 |
| Potential impact on CSM (pre-tax) | | 175 | | (200) | | 150 | | (150) |
| Potential impact on OCI(4) | | 200 | | (200) | | 200 | | (200) |
| Potential impact on LICAT ratio(5) | 3.0% point increase | 3.0% point decrease | 2.5% point increase | 2.0% point decrease |
|
(1)Interest rate sensitivities assume a parallel shift in assumed interest rates across the entire yield curve as at December 31, 2025 and December 31, 2024 with no change to the ultimate risk-free rate. Variations in realized yields based on factors such as different terms to maturity and geographies may result in realized sensitivities being significantly different from those illustrated above. Sensitivities include the impact of re-balancing interest rate hedges for hedging programs at 10 basis point intervals (for 50 basis point changes in interest rates). (2)The market risk sensitivities include the estimated impact of our hedging programs in effect as at December 31, 2025 and December 31, 2024, and include new business added and product changes implemented prior to such dates. (3)Net income, CSM, and OCI sensitivities have been rounded in increments of $25 million. The sensitivities exclude the market impacts on the income from our joint ventures in China and India. (4)The market risk OCI sensitivities exclude the impact of changes in the defined benefit obligations and plan assets. |
| (5) The LICAT sensitivities illustrate the impact on SLF Inc. as at December 31, 2025 and December 31, 2024. The sensitivities reflect the worst scenario as at December 31, 2025 and assume that a scenario switch does not occur in the quarter. LICAT ratios are rounded in increments of 0.5%. |
| | | | | | | | | |
| The above sensitivities were determined using a 50 basis point change in interest rates and 10% and 25% changes in our equity markets because we believe that these market shocks were reasonably possible as at December 31, 2025. Significant changes in market variables may result in non-proportional impacts on our sensitivities. |
Potential Impact of Change in Ultimate Risk-Free Rate
Interest rate sensitivities do not include any impact from changes to the ultimate risk-free rate. Our estimated sensitivity to a 10 basis point decrease in the ultimate risk-free rate assumed in our insurance contract liabilities is a decrease in reported net income of approximately
$50 million after-tax, and a decrease in CSM of approximately $25 million.
| | | | | | | | | | | | | | | | | | | | | | | | | | | | | |
| Credit Spread and Swap Spread Sensitivities | | | | | | | | |
| The following tables set out the estimated immediate impact on, or sensitivity of, our net income, CSM, OCI and SLF Inc.'s LICAT ratio to certain instantaneous changes in credit spreads and our net income, CSM, and OCI to certain changes in swap spreads as at December 31, 2025 and December 31, 2024. | | | | | | | | |
| | | | | | | | | |
| | | | | | | | | | | | | | | | | | | | | | | | | | | | | |
| ($ millions, unless otherwise noted) | As at December 31, 2025 | As at December 31, 2024 |
| Change in Credit Spreads(1)(2) | 50 basis point decrease | 50 basis point increase | 50 basis point decrease | 50 basis point increase |
| Potential impact on net income (after-tax) | | 125 | | (25) | | 75 | | (50) |
| Potential impact on CSM (pre-tax) | | 100 | | (125) | | 125 | | (125) |
| Potential impact on OCI(3) | | 200 | | (175) | | 200 | | (200) |
| Potential impact on LICAT ratio(4) | 2.5% point increase | 2.5% point decrease | 2.0% point increase | 2.0% point decrease |
|
(1)The credit spread sensitivities assume a parallel shift in the indicated spreads across the entire term structure with no change to the ultimate liquidity premium. The sensitivities reflect a floor of zero on credit spreads where the spreads are not currently negative. Variations in realized spread changes based on different terms to maturity, geographies, asset classes and derivative types, underlying interest rate movements, and ratings may result in realized sensitivities being significantly different from those provided above. (2)Net income, CSM, and OCI sensitivities have been rounded in increments of $25 million. The sensitivities exclude the market impacts on the income from our joint ventures in China and India. (3)The market risk OCI sensitivities exclude the impact of changes in the defined benefit obligations and plan assets. |
| (4)The LICAT sensitivities illustrate the impact on SLF Inc. as at December 31, 2025 and December 31, 2024. The sensitivities reflect the worst scenario as at December 31, 2025 and assume that a scenario switch does not occur in the quarter. LICAT ratios are rounded in increments of 0.5%. |
| | | | | | | | | | | | | | | | | | | | |
62 | December 31, 2025 | Sun Life Financial Inc. | | MANAGEMENT'S DISCUSSION & ANALYSIS | |
| | | | | | | | | | | | | | | | | | | | | | | | | | | | | |
| ($ millions, unless otherwise noted) | As at December 31, 2025 | As at December 31, 2024 |
| Change in Swap Spreads(1)(2) | 20 basis point decrease | 20 basis point increase | 20 basis point decrease | 20 basis point increase |
| Potential impact on net income (after-tax) | | — | | — | | | (25) | | 25 | |
| | | | | | | | | |
| | | | | | | | | |
|
(1)The swap spread sensitivities assume a parallel shift in the indicated spreads across the entire term structure. Variations in realized spread changes based on different terms to maturity, geographies, asset classes and derivative types, underlying interest rate movements, and ratings may result in realized sensitivities being significantly different from those provided above. (2)Net income, CSM, and OCI sensitivities have been rounded in increments of $25 million. The sensitivities exclude the market impacts on the income from our joint ventures in China and India. |
Real Estate Sensitivities
The following table sets out the estimated immediate impact on, or sensitivity of, our net income, OCI and CSM to certain instantaneous changes in the value of our real estate investments as at December 31, 2025 and December 31, 2024.
| | | | | | | | | | | | | | | | | | | | | | | | | | | | | |
| ($ millions, unless otherwise noted) | | As at December 31, 2025 | | As at December 31, 2024 |
| Change in Real Estate Values (1) | 10% decrease | 10% increase | 10% decrease | 10% increase |
| Potential impact on net income (after-tax) | | (475) | | 475 | | (450) | | 450 |
| Potential impact on CSM (pre-tax) | | (100) | | 100 | | (100) | | 100 |
| | | | | | | | | |
|
(1)Net income, CSM, and OCI sensitivities have been rounded in increments of $25 million. The sensitivities exclude the market impacts on the income from our joint ventures in China and India. |
Foreign Currency Sensitivities
We generally match the currency of our assets with the currency of the insurance and investment contract liabilities they support. As at December 31, 2025 and December 31, 2024, the Company did not have a material foreign currency risk mismatch exposure and the majority of the exposure results from income translation impacts.
The following table sets out the estimated impact on net income of a 10% change in the value of the Canadian dollar relative to other key operating currencies for the years of 2025 and 2024.
| | | | | | | | | | | | | | | | | | | | | | | | | | |
| ($ millions, unless otherwise noted) | | As at December 31, 2025 | | As at December 31, 2024 |
Change in CAD relative to USD and HKD (1) | 10% strengthening | 10% weakening | 10% strengthening | 10% weakening |
Estimated impact on net income (after-tax) | | (225) | | 225 | | (250) | | 250 |
(1)Net income sensitivities have been rounded in increments of $25 million.
LICAT Interest Rate Scenario Switch
The LICAT interest rate risk is assessed under four different interest rate scenarios, and the scenario leading to the highest capital requirement is chosen as the worst scenario for each geographic region as defined by the LICAT guideline. Changes and interaction between the level and term movements in interest rates and spreads can shift the interest rate scenario applied in the LICAT calculation causing a discontinuity where capital requirements change materially. In 2020, OSFI updated the LICAT guideline for interest rate risk requirements for participating businesses to be smoothed over six quarters. As a result, the actual impact to the LICAT ratio from participating businesses in any quarter will reflect the scenarios from current quarter as well as the prior five quarters, with any switching between scenarios having the effect of offsetting the previous impacts over time. It should be noted that switching of the scenario can also change the direction of our sensitivities.
For SLF Inc., assuming no further scenario switches, no additional LICAT ratio impact is expected over the next five quarters on a rounded basis.
For Sun Life Assurance, assuming no further scenario switches, there is an additional one percentage point increase to the LICAT ratio impact expected over the next five quarters on a rounded basis.
Market Risk Management Strategies
Market risk is managed at all stages during the product life cycle including product design and development, ongoing review and positioning of our suite of products, and ongoing asset-liability management and hedge re-balancing. Our market risk management strategies are developed based on policies and operating guidelines at the enterprise level, business segment level and product level. Liabilities having a similar risk profile are grouped together and a customized investment and hedging strategy is developed and implemented to optimize return within our risk appetite limits.
We have implemented asset-liability management and hedging programs involving regular monitoring and adjustment of market risk exposures using assets, derivative instruments and repurchase agreements to maintain market risk exposures within our risk appetite. The general availability and cost of these hedging instruments may be adversely impacted by a number of factors including changes in interest rates, increased volatility in capital markets, and changes in the general market and regulatory environment within which these hedging programs operate. In particular, regulations for derivatives could impose additional costs and could affect our hedging strategy.
| | | | | | | | | | | | | | | | | | | | |
| MANAGEMENT'S DISCUSSION & ANALYSIS | | Sun Life Financial Inc. | December 31, 2025 | 63 |
Our hedging programs may themselves expose us to other risks, including basis risk, volatility risk, increased levels of derivative counterparty credit risk, liquidity risk, model risk and other operational risks. These factors may adversely impact the net effectiveness, costs, and financial viability of maintaining these hedging programs and therefore adversely impact our profitability and financial position. While our hedging programs are intended to mitigate these effects (e.g., hedge counterparty credit risk is managed by maintaining broad diversification, dealing primarily with highly-rated counterparties, and transacting through OTC contracts cleared through central clearing houses, exchange-traded contracts or bilateral OTC contracts negotiated directly between counterparties that include credit support annexes), residual risks and potential reported earnings and capital volatility remain.
In general, market risk exposure is mitigated by the assets supporting our products. This includes holdings of fixed income assets such as bonds, mortgages and loans. Derivative instruments may supplement these assets to reduce the risk from interest rate mismatches and mitigate the market risk associated with liability features and optionality.
General Account Protection and Wealth Products
Most of our expected net income sensitivity to changes in interest rates and equity markets is derived from our general account protection and wealth products and we have implemented market risk management strategies to mitigate a portion of the related market risk.
Individual protection products include universal life and other long-term life and health insurance products. Major sources of market risk exposure for individual protection products include the reinvestment risk related to future premiums on regular premium policies, asset reinvestment risk on both regular premium and single premium policies and the guaranteed cost of insurance. Interest rate risk for individual protection products is typically managed on a duration matched basis, within tolerance ranges set out in the applicable investment policy or guidelines. Targets and limits are established so that the level of residual exposure is commensurate with our risk appetite. Exposures are monitored frequently, and assets are re-balanced as necessary to maintain compliance within prescribed tolerances using a combination of assets and derivative instruments. A portion of the liabilities are backed with equities and real estate. For participating insurance products and other protection products with adjustable features, the investment strategy objective is to provide a total rate of return given a constant risk profile over the long term.
Fixed annuity products generally provide the policyholder with a guaranteed investment return or crediting rate. Interest rate risk for these products is typically managed on a duration matched basis, within tolerance ranges set out in the applicable investment guidelines. Targets and limits are established so that the level of residual exposure is commensurate with our risk appetite. Exposures are monitored frequently, and assets are re-balanced as necessary to maintain compliance within prescribed tolerances using a combination of fixed income assets and derivative instruments.
Certain protection and wealth products contain minimum interest rate guarantees. Market risk management strategies are implemented to limit potential financial loss due to reductions in asset earned rates relative to contract guarantees. These typically involve the use of hedging strategies utilizing interest rate derivatives such as interest rate floors, swaps and swaptions.
Indexed universal life products contain features that credit policyholders the return of underlying equity indices, subject to defined caps, floors and participation rates. Hedging strategies utilizing equity derivatives are implemented to replicate the policyholder returns and to limit the potential risk of equity guarantees to within our risk appetite tolerances.
Certain protection and wealth products contain features which allow the policyholders to surrender their policy at book value. Market risk management strategies are implemented to limit the potential financial loss due to changes in interest rate levels and policyholder behaviour. These typically involve the use of dynamic hedging strategies and the purchase of interest rate swaptions.
Certain products have guaranteed minimum annuitization rates. Market risk management strategies are implemented to limit the potential financial loss and typically involve the use of fixed income assets, interest rate swaps, and swaptions.
Segregated Funds Products
Certain segregated fund products provide benefit guarantees, which are linked to underlying fund performance and may be triggered upon death, maturity, withdrawal or annuitization. The cost of providing these guarantees is uncertain and depends upon a number of factors including general capital market conditions, our hedging activities, policyholder behaviour and mortality experience, each of which may result in negative impacts on net income, the contractual service margin and capital.
Our hedging programs use derivative instruments and fixed income assets to mitigate the interest rate, equity market, and foreign currency exposure of our segregated fund contracts. Materially all of our segregated fund contracts, as measured by fund values, are included in a hedging program. While materially all contracts are included in the hedging program, not all of our market risk exposure related to these contracts is hedged. For those segregated fund contracts included in the hedging program, we generally hedge the value of expected future net claims costs and associated risk adjustments for non-financial risk.
Our hedging strategy is applied both at the line of business or product level and at the total company level using a combination of hedging techniques such as re-balancing of short-dated interest rate and equity derivative contracts and longer-dated put options. We actively monitor our overall market exposure and may implement tactical hedge overlay strategies in order to align sensitivities with risk management objectives.
The impact of segregated fund guarantees and associated hedging programs on net income, contractual service margin and capital are included in the disclosed market risk sensitivities.
| | | | | | | | | | | | | | | | | | | | |
64 | December 31, 2025 | Sun Life Financial Inc. | | MANAGEMENT'S DISCUSSION & ANALYSIS | |
Market Risk Management Applications for Derivative Usage
The primary uses of derivatives are set out in the table below as at December 31, 2025.
| | | | | | | | |
| Products/Application | Uses of Derivative | Derivatives Used |
General asset-liability management - interest rate risk exposure for most protection and wealth products | To manage the sensitivity of the duration gap between assets and liabilities to interest rate changes | Interest rate swaps, futures, swaptions, floors and bond forwards |
Guarantees on protection and wealth contracts - minimum interest rate guarantees, guaranteed surrender values and guaranteed annuitization options | To limit potential financial losses from significant reductions in asset earned rates relative to contract guarantees | Interest rate swaps, futures, swaptions, floors and bond forwards |
Segregated fund guarantees & indexed universal life | To manage the exposure of product guarantees sensitive to movement in equity market and interest rate levels and currency fluctuations | Put options, call options, futures and swaps on equity indices, interest rate swaps, futures, bond forwards and foreign exchange forwards |
| Currency exposure in relation to asset-liability management | To reduce the sensitivity to currency fluctuations by matching the value and cash flows of specific assets denominated in one currency with the value and cash flows of the corresponding liabilities denominated in another currency | Currency swaps and forwards |
| Credit exposure | To replicate credit exposures and enhance investment returns | Credit default swaps |
| | | | | | | | | | | | | | |
| Additional Cautionary Language and Key Assumptions Related to Sensitivities Our market risk sensitivities are measures of our estimated change in net income OCI, CSM and LICAT ratio for changes in market risk variables described above, based on market risk variables and business in force as at the reporting date. These sensitivities are calculated independently for each risk factor, generally assuming that all other risk variables stay constant. The sensitivities do not take into account indirect effects such as potential impacts on goodwill impairment or valuation allowances on deferred tax assets. |
We have provided measures of our net income sensitivity to instantaneous changes in equity markets, interest rates, credit spreads, swap spreads, real estate price levels, and capital sensitivities to changes in equity price levels, interest rates and credit spreads. The LICAT ratio and CSM sensitivities are non-IFRS financial measures, and for additional information, see section M - Non-IFRS Financial Measures in this document. The cautionary language which appears in this section is applicable to all net income, CSM, OCI and LICAT ratio sensitivities.
| | | | | | | | | | | | | | |
| Actual results can differ materially from these estimates for a variety of reasons, including differences in the pattern or distribution of the market shocks, the interaction between these risk factors, model error, or changes in other assumptions such as business mix, effective tax rates, policyholder behaviour, currency exchange rates and other market variables relative to those underlying the calculation of these sensitivities. The extent to which actual results may differ from the indicative ranges will generally increase with larger movements in risk variables. Our sensitivities as at December 31, 2024 have been included for comparative purposes only. |
| |
| Sensitivities to interest rates and spreads assume a parallel shift in assumed interest rates across the entire yield curve or a parallel shift in the indicated spreads across the entire term structure, with no change to the ultimate risk-free rate or ultimate liquidity premium. Realized sensitivities may be significantly different from those illustrated based on factors such as different terms to maturity, geographies, asset classes and derivative types, and ratings. |
| | | | |
| The sensitivities reflect the composition of our assets and liabilities as at December 31, 2025 and December 31, 2024, respectively. Changes in these positions due to new sales or maturities, asset purchases/sales, or other management actions could result in material changes to these reported sensitivities. In particular, these sensitivities reflect the expected impact of hedging activities based on the hedging programs in place as at the respective calculation dates. The actual impact of hedging activity can differ materially from that assumed in the estimated sensitivities due to ongoing hedge re-balancing activities, changes in the scale or scope of hedging activities, changes in the cost or general availability of hedging instruments, basis risk (i.e., the risk that hedges do not exactly replicate the underlying portfolio experience), model risk, and other operational risks in the ongoing management of the hedge programs or the potential failure of hedge counterparties to perform in accordance with expectations. |
| | | | |
| The sensitivities are based on methods and assumptions in effect as at December 31, 2025 and December 31, 2024, as applicable. Changes in the regulatory environment, assumptions or methods used to measure assets and liabilities after those dates could result in material changes to the estimated sensitivities. Changes in market risk variables in excess of the changes illustrated may result in other than proportionate impacts. |
| | | | |
| The sensitivities reflect the CSM as at December 31, 2025 and December 31, 2024. For insurance contracts measured using the VFA, where the change in the effect of the time value of money and financial risk not arising from the underlying items adjusts the CSM, changes in the CSM balance will affect the sensitivity of income to changes in market risk variables. |
Our LICAT sensitivities may be non-linear and can change due to the interrelationship between market rates and spreads, actuarial
assumptions and our LICAT calculations.
| | | | | | | | | | | | | | | | | | | | |
| MANAGEMENT'S DISCUSSION & ANALYSIS | | Sun Life Financial Inc. | December 31, 2025 | 65 |
| | | | | | | | | | | | | | |
| For the reasons outlined above, our sensitivities should only be viewed as indicative estimates of the underlying sensitivities of each factor under these specialized assumptions, and should not be viewed as predictors of our future income, OCI, CSM or capital. Given the nature of these calculations, we cannot provide assurance that actual impacts will be consistent with the estimates provided. |
Information related to market risk sensitivities should be read in conjunction with the information contained in section N - Accounting and Control Matters - 1 - Critical Accounting Policies and Estimates in this document. Additional information on market risk can be found in Note 6 of the 2025 Annual Consolidated Financial Statements.
ii. Insurance Risk
| | | | | | | | | | | | | | |
| Risk Description Insurance risk is the uncertainty of product performance due to actual experience emerging differently than expected in the areas of mortality, morbidity and longevity. In addition, policyholder behaviour, product design and pricing, expense and reinsurance risks impact multiple risk categories, including insurance risk.
Insurance Risk Management Governance and Control We employ a wide range of insurance risk management practices and controls, as outlined below: •Insurance risk governance practices are in place, including independent monitoring and review and reporting to senior management and the Risk Committee. •Income and regulatory capital sensitivities are monitored, managed and reported against pre-established risk appetite limits for policyholder behaviour, mortality, morbidity and longevity risks. •Comprehensive Insurance Risk Policy, guidelines and practices are in place. •The global underwriting manual aligns underwriting practices with our corporate risk management standards and ensures a consistent approach in insurance underwriting. •Board-approved maximum retention limits are in place. Amounts issued in excess of these limits are reinsured. •Detailed procedures, including criteria for approval of risks and for claims adjudication are established and monitored for each business segment. •Underwriting and risk selection standards and procedures are established and overseen by the corporate underwriting and claims risk management function. •Diversification and risk pooling is managed by aggregation of exposures across product lines, geography and distribution channels. •Reinsurance is used to limit losses, minimize exposure to significant risks and to provide additional capacity for growth. •The Insurance Risk Policy and Investment & Credit Risk Policy establish acceptance criteria and protocols to monitor the level of reinsurance ceded to any single reinsurer or group of reinsurers. •Reinsurance counterparty risk is monitored, including annual reporting of reinsurance exposure to the Risk Committee. •Various limits, restrictions and fee structures are introduced into plan designs in order to establish a more homogeneous policy risk profile and limit potential for anti-selection. •Regulatory solvency requirements include risk-based capital requirements and are monitored regularly. •The Product Design and Pricing Policy requires detailed risk assessment and pricing provision for material risks. •Company specific and industry level experience studies and drivers of earnings analysis are monitored and factored into valuation, renewal and new business pricing processes. •Stress-testing techniques, such as FCT, are used to measure the effects of large and sustained adverse movements in insurance risk factors. •Insurance contract liabilities are established in accordance with IFRS. •Internal capital targets are established at an enterprise level to cover all risks and are above minimum regulatory and supervisory levels.
The concentration for insurance risks is monitored geographically and its adverse effect is mitigated through a diversified product portfolio, product design, underwriting standards and practices, utilizing reinsurance as well as the Company's global operation. Specific to the reinsurance risk, the concentration is measured by aggregating the exposure to each reinsurance counterparty across all Business Groups to ensure it does not exceed a predefined risk level.
Specific insurance risks and our risk management strategies are discussed below in further detail. |
Policyholder Behaviour Risk
| | | | | | | | | | | | | | |
| Many of our products include some form of embedded policyholder option. We can incur losses due to adverse policyholder behaviour relative to the assumptions used in the pricing and valuation of products regarding lapse of policies or exercise of other embedded policy options.
Uncertainty in policyholder behaviour can arise from several sources including: •Unexpected events in the policyholder's life circumstances; •The general level of economic activity (whether higher or lower than expected); •Changes in the financial and capital markets; •Changes in pricing and availability of current products; •The introduction of new products, changes in underwriting technology and standards; •Changes in our financial strength or reputation.
Uncertainty in future cash flows affected by policyholder behaviour can be further exacerbated by unexpected behaviour during times of economic turbulence or at key option exercise points in the life of an insurance contract. |
| | | | | | | | | | | | | | | | | | | | |
66 | December 31, 2025 | Sun Life Financial Inc. | | MANAGEMENT'S DISCUSSION & ANALYSIS | |
| | | | | | | | | | | | | | |
| Various types of provisions are built into many of our products to reduce the impact of uncertain policyholder behaviour. These provisions include: •Surrender charges that adjust the payout to the policyholder by taking into account prevailing market conditions. •Limits on the amount that policyholders can surrender or borrow. •Restrictions on the timing of policyholders' ability to exercise certain options. •Restrictions on both the types of funds policyholders can select and the frequency with which they can change funds.
Policyholder behaviour risk is also mitigated through reinsurance on some insurance contracts.
Internal experience studies are used to monitor, review and update policyholder behaviour assumptions as needed, which could result in updates to policy liabilities. |
Mortality and Morbidity Risk
| | | | | | | | | | | | | | |
| Mortality and morbidity risk is the risk that future experience could be unfavourable relative to the assumptions used in the pricing and valuation of products.
Mortality and morbidity risk could adversely affect many of our products which introduces the potential for adverse financial results. These risks can arise in the normal course of business through random fluctuation in realized experience, through catastrophes, as a result of a pandemic, or in association with other risk factors such as product development and pricing risk. Adverse mortality and morbidity experience could also occur through systemic anti-selection, which could arise due to poor plan design, or underwriting process failure or the development of investor-owned and secondary markets for life insurance policies. Adverse morbidity experience could also occur through external events such as increases in disability claims during economic slowdowns, increases in high medical treatment costs and growth in utilization of specialty drugs.
Mortality and morbidity concentration risk is the risk of a catastrophic event that could occur in geographic locations where there is significant insurance coverage, such as natural environmental disasters (for example, earthquakes), human-made disasters (for example, acts of terrorism, military actions, and inadvertent introduction of toxic elements into the environment) as well as epidemics.
Concentration risk exposure is monitored on group policies in a single location. We do not have a high degree of concentration risk to single individuals or groups due to our well-diversified geographic and business mix. The largest portion of mortality risk within the Company is in North America. Individual and group insurance policies are underwritten prior to initial issue and renewals, based on risk selection, plan design, and rating techniques.
Current legislation in Canada restricts insurers from requiring policyholders to take or release the results of genetic tests. If policyholders have access to the results of genetic tests and we do not, this creates asymmetry of information between policyholders and insurers, which could adversely impact mortality and morbidity experience and policyholder behaviour. This asymmetry of information may increase as genetic testing advances and becomes more accessible, giving rise to better diagnoses of conditions where treatments are expensive or non-existent. The asymmetry of information may lead to increased anti-selection in new business underwriting. There may also be an impact on policy lapse rates where adverse genetic testing results may motivate policyholders to retain their policies resulting in higher claims payouts than assumed in the pricing and valuation of products, as well as increased insurance rates which may result in loss of new and existing policyholders.
Detailed uniform underwriting procedures have been established to determine the insurability of applicants and to manage exposure to large claims. These underwriting requirements are regularly scrutinized against industry guidelines and oversight is provided through a corporate underwriting and claim management function. We are committed to paying claims fairly and promptly in accordance with the terms of our policies. Our claims management process is designed to ensure thorough evaluation of claims.
The Insurance Risk Policy, which is approved by the Risk Committee, sets out limits on the maximum amount of insurance risk per life that may be retained. Retention limits per life vary by geographic region and amounts in excess of the Board-approved maximum retention limits are reinsured to ensure there is no exposure to unreasonable concentration of risk. •On a single life or joint-first-to-die basis our retention limit is $40 million in Canada and US$40 million outside of Canada. •For survivorship life insurance, our maximum global retention limit is $50 million in Canada and US$50 million outside of Canada. •In certain markets and jurisdictions, retention levels below the maximum are applied.
Reinsurance is utilized for numerous products in most business segments, and placement is done on an automatic basis for defined insurance portfolios and on a facultative basis for individual risks with certain characteristics. |
| | | | | | | | | | | | | | | | | | | | |
| MANAGEMENT'S DISCUSSION & ANALYSIS | | Sun Life Financial Inc. | December 31, 2025 | 67 |
Longevity Risk
| | | | | | | | | | | | | | |
| Longevity risk is the potential for losses arising from adverse changes in mortality improvement rates relative to the assumptions used in the pricing and valuation of products. This risk can manifest itself slowly over time as socioeconomic conditions improve and medical advances continue. It could also manifest itself more quickly, for example, due to medical breakthroughs that significantly extend life expectancy.
Longevity risk affects contracts where benefits or costs are based upon the likelihood of survival and higher than expected improvements in insured life expectancy could therefore increase the ultimate cost of these benefits (for example, annuities, pensions, pure endowments, some segregated funds, and specific types of health contracts), thereby requiring strengthening of policyholder liabilities and resulting in reductions in net income and capital.
To improve management of longevity risk, we monitor research in the fields that could result in a change in expected mortality improvement. Stress-testing techniques are used to measure and monitor the impact of extreme mortality improvement on the aggregate portfolio of protection and wealth products. |
Product Design and Pricing Risk
| | | | | | | | | | | | | | |
| Product design and pricing risk is the risk a product does not perform as expected, causing adverse financial consequences. This risk may arise from deviations in realized experience versus assumptions used in the pricing of products. Risk factors include uncertainty concerning: •Future investment yields •Policyholder behaviour •Mortality and morbidity experience •Sales levels •Mix of business •Expenses •Taxes
Although some of our products permit us to increase premiums or adjust other charges and credits during the life of the policy or contract, the terms of these policies or contracts may not allow for sufficient adjustments to maintain expected profitability. This could have an adverse effect on our profitability and capital position.
Products that offer complex features, options or guarantees require increasingly complex pricing models, methods or assumptions, leading to additional levels of uncertainty. •The risk of mis-pricing increases with the number and inherent uncertainty of assumptions needed to model a product. •Past experience data supplemented with future trend assumptions may be poor predictors of future experience. •Lack of experience data on new products or new Client segments increases the risk that future actual experience unfolds differently from expected assumptions. •External environmental factors may introduce new risk factors, which were unanticipated during product design, and have an adverse result on the financial performance of the product. •Policyholder behaviour in the future may vary from that assumed at the time the product is designed, thereby adversely affecting the product's financial performance.
Our Product Design and Pricing Policy, approved by the Risk Committee, establishes the framework governing our product design and pricing practices and is designed to align our product offerings with our strategic objectives and risk-taking philosophy. Consistent with this policy, product development, design and pricing processes have been implemented throughout the Company. New products follow a stage-gate process with defined management approvals based on the significance of the initiative. Each initiative is subject to a risk assessment process to identify key risks and risk mitigation requirements and is reviewed by multiple stakeholders. Additional governance and control procedures are listed below: •Pricing models, methods, and assumptions are subject to periodic peer reviews. •Experience studies, drivers of earnings analysis, and product dashboards are used to monitor actual experience against those assumed in pricing and valuation. •On experience rated, participating, and adjustable products, emerging experience is reflected through changes in policyholder dividend scales as well as other policy adjustment mechanisms such as premium and benefit levels. •Limits and restrictions may be introduced into the design of products to mitigate adverse policyholder behaviour or apply upper thresholds on certain benefits. |
| | | | | | | | | | | | | | | | | | | | |
68 | December 31, 2025 | Sun Life Financial Inc. | | MANAGEMENT'S DISCUSSION & ANALYSIS | |
Expense Risk
| | | | | | | | | | | | | | |
| Expense risk is the risk that future expenses are higher than the assumptions used in the pricing and valuation of products. This risk can arise from: •General economic conditions; •Unexpected increases in inflation; •Slower than anticipated growth; •Changes in availability of current products; or •Reduction in productivity leading to increases in unit expenses.
Expense risk occurs in products where we cannot or will not pass increased costs onto the policyholder and will manifest itself in the form of a liability increase or a reduction in expected future profits.
From time to time, certain products or business segments may be closed for new sales (for example, individual protection business in the U.S.). Our ability to effectively manage the run-off of business in these products or business segments introduces additional risks, such as policyholder behaviour and expense risk, that may have an adverse effect on our operations, profitability and financial position.
We closely monitor expenses through an annual budgeting process and ongoing monitoring of any expense gaps between unit expenses assumed in pricing and actual expenses. |
Reinsurance Risk
| | | | | | | | | | | | | | |
| We purchase reinsurance for certain risks underwritten by our various insurance businesses. Reinsurance risk is the risk of financial loss due to adverse developments in reinsurance markets (for example, discontinuance or diminution of reinsurance capacity, or an increase in the cost of reinsurance), insolvency of a reinsurer or inadequate reinsurance coverage. While reinsurance arrangements provide for the recovery of claims arising from the liabilities ceded, we retain primary responsibility to the policyholders.
Rates for our in-force reinsurance treaties can be either guaranteed or adjustable for the life of the ceded policy. Changes in reinsurance market conditions, including actions taken by reinsurers to increase rates on existing and new coverage and our ability to obtain appropriate reinsurance, may adversely impact the availability or cost of maintaining existing or securing new reinsurance capacity, with adverse impacts on our business strategies, profitability and financial position. There is a possibility of rate increases or renegotiation of some of the legacy reinsurance contracts by our reinsurers, as the global reinsurance industry continues to review and optimize their business models. In addition, changes to the regulatory treatment of reinsurance arrangements could have an adverse impact on our capital position. |
| | | | | | | | | | | | | | |
| We have an Insurance Risk Policy approved by the Risk Committee and an Investment & Credit Risk Policy approved by the Governance Committee, which set acceptance criteria and processes to monitor and manage the level of reinsurance ceded to any single reinsurer. These policies are regularly reviewed and approved by the relevant Board Committee to ensure the alignment with our risk appetite levels and reinsurance risk guidelines.
The policies set the acceptance criteria which verify if a reinsurer qualifies as a suitable reinsurance counterparty, having the capability, expertise, governance practices and financial capacity to assume the risks being considered. In addition, a periodic due diligence is performed on the existing reinsurance counterparties, including an internal credit assessment for reinsurance counterparties with whom we have material exposure.
The exposure to each reinsurance counterparty is monitored closely to ensure that no single reinsurance counterparty represents an undue level of credit risk and does not exceed the predefined limits. In order to diversify our reinsurance risk, there is generally more than one reinsurance counterparty supporting a reinsurance pool. A summary of the reinsurance counterparty credit risk exposures is reported annually to the Risk Committee.
To further increase the reinsurance risk control, our reinsurance agreements include provisions to allow actions to be taken, such as recapture of ceded risk (at a potential cost to the Company), in the event that the reinsurance counterparty loses its legal ability to carry on business through insolvency or regulatory action.
In case of unfavourable developments in the reinsurance markets, we also have an option to discontinue or implement changes to the new sales of our products to better manage the associated risks. |
Additional information on insurance risk can be found in Note 7 of our 2025 Annual Consolidated Financial Statements.
iii. Credit Risk
Risk Description
| | | | | | | | | | | | | | |
| Credit risk is the possibility of loss from amounts owed by our borrowers or financial counterparties. We are subject to credit risk in connection with issuers of securities held in our investment portfolio, debtors, structured securities, reinsurers, counterparties (including derivative, repurchase agreement and securities lending counterparties), other financial institutions and other entities. Losses may occur when a counterparty fails to make timely payments pursuant to the terms of the underlying contractual arrangement or when the counterparty's credit rating or risk profile otherwise deteriorates. Credit risk can also arise in connection with deterioration in the value of, or ability to realize, any underlying security that may be used as collateral for the debt obligation. Credit risk can occur as a result of broad economic conditions, challenges within specific sectors of the economy, from issues affecting individual companies or loss given default expectations. Events that result in defaults, impairments or downgrades of the securities in our investment portfolio would cause the Company to record realized or unrealized losses and may cause an increase in our provisions for asset default, adversely impacting earnings. |
| | | | | | | | | | | | | | | | | | | | |
| MANAGEMENT'S DISCUSSION & ANALYSIS | | Sun Life Financial Inc. | December 31, 2025 | 69 |
Credit Risk Management Governance and Control
| | | | | | | | | | | | | | |
| We employ a wide range of credit risk management practices and controls, as outlined below: •Credit risk governance practices are in place, including independent monitoring and review and reporting to senior management and the risk committees. •Risk appetite limits have been established for credit risk. •Income and regulatory capital sensitivities are monitored, managed and reported against pre-established risk limits. •Comprehensive Investment and Credit Risk Management Policy, guidelines and practices are in place. •Specific investment diversification requirements are in place, such as defined investment limits for asset class, geography, and industry. •Risk-based credit portfolio, counterparty, and sector exposure limits have been established. •Mandatory use of credit quality ratings for portfolio investments has been established and is reviewed regularly. These internal rating decisions for new fixed income investments and ongoing review of existing rating decisions are independently adjudicated by Corporate Risk Management. •Develop and maintain hedging programs that may employ the use of derivatives. Market conditions determine the availability and cost of the derivative protection. •Comprehensive due diligence processes and ongoing credit analyses are conducted. •Regulatory solvency requirements include risk-based capital requirements and are monitored regularly. •Comprehensive compliance monitoring practices and procedures including reporting against pre-established investment limits are in place. •Purchase reinsurance for certain risks underwritten by our various insurance businesses. Reinsurance does not relieve us from our direct liability to policyholders and accordingly, we bear credit risk with respect to our reinsurers. Reinsurance exposures are monitored to ensure that no single reinsurer represents an undue level of credit risk. •Stress-testing techniques, such as FCT, are used to measure the effects of large and sustained adverse credit developments. •Insurance contract liabilities are established in accordance with IFRS. •Internal capital targets are established at an enterprise level to cover all risks and are above minimum regulatory and supervisory levels. Actual capital levels are monitored to ensure they exceed internal targets. |
Our core principles of credit risk management include asset diversification, fundamental research and analysis of cash flows, proactive and continuous risk monitoring, active management and relative value assessment, all with the objective of optimizing risk-adjusted returns, with due consideration for the impacts of capital and taxation.
| | | | | | | | | | | | | | | | | |
| We rate fixed income investments primarily through the use of internally developed scorecards and rating methodologies, which combine an estimated probability of default and loss given default to determine an expected loss and credit risk rating. This rating is expressed using a 22-point scale that is generally consistent with those used by external rating agencies, and is based on detailed examination of the borrower's, or issuer's, credit quality and the characteristics of the specific instrument. The probability of default assessment is based on borrower-level or issuer-level analysis, which encompasses an assessment of industry risk, business strategy, competitiveness, strength of management and other financial information. The loss given default assessment is based on instrument-level analysis, which considers the impact of guarantees, covenants, liquidity and other structural features. These scorecards provide input to stochastic value-at-risk models and are used to stress test the portfolio, which provide insight into the distribution and characteristics of credit risk within our portfolios. In accordance with our policies and under normal circumstances, our ratings cannot be higher than the highest rating provided by certain Nationally Recognized Statistical Rating Organizations ("NRSROs"). Certain assets, including those in our sovereign debt, are assigned a rating based on ratings provided by NRSROs using a priority sequence order of Standard & Poor's, Moody's, Fitch and DBRS Limited. |
Additional information on credit risk can be found in Note 6 of our 2025 Annual Consolidated Financial Statements.
iv. Business and Strategic Risk
Risk Description
Business and strategic risk is the risk of loss from the inability to adequately identify, plan or implement an appropriate strategy to achieve strategic and business objectives or adapt to changes in Client behaviour, the external business, economic, geopolitical, regulatory or environmental (including climate) and social landscape or when assumptions made in strategy are not realized as expected.
Business and Strategic Risk Management Governance and Control
We employ a wide range of business and strategic risk management practices and controls, as outlined below:
•Business and strategic risk governance practices are in place, including independent monitoring, review and reporting to Senior Management, the Board and the Board Committees.
•Business and strategic risk is managed through our strategic and business planning process and controls over the implementation of these plans. These plans are reviewed and key themes, issues and emerging risks are discussed by our Executive Team and by the Board and/or Board Committees.
•Our Business and Strategic Plans are subject to approval by the Board, which also receives regular reviews of implementation progress against key Business Plan objectives.
•Comprehensive policies including the Risk Framework, Risk Appetite Policy, Product Design and Pricing Policy, Mergers and Acquisition Policy, Change Management Risk - Strategic Execution Policy, Capital and Liquidity Management Framework and Capital Risk Policy are in place.
•Our corporate strategy and business objectives are established within the boundaries set out in the Risk Framework and the Risk Appetite Policy. Our business strategies and plans are designed to align with our risk appetite, our capital position and our financial performance objectives.
•Our risk appetite is periodically assessed, taking into consideration the economic and regulatory environments in which we operate.
•Merger, acquisition, strategic investments and divestiture transactions are governed by a Board-approved Merger and Acquisition Risk Management Policy and significant transactions require the approval of the Board.
•Stress-testing techniques, such as FCT, are used to measure the effects of large and sustained adverse scenarios.
| | | | | | | | | | | | | | | | | | | | |
70 | December 31, 2025 | Sun Life Financial Inc. | | MANAGEMENT'S DISCUSSION & ANALYSIS | |
•Key and emerging risks are identified, monitored and reported, including emerging regulatory changes that may have a material impact on our finances, operations or reputation.
•Internal capital targets are established at an enterprise level to cover all risks and are above minimum regulatory and supervisory levels. Actual capital levels are monitored to ensure they exceed internal targets. In the event of capital breaches, a clearly defined escalation process is in place.
We regularly review and adapt our business strategies and plans to take account of changes in the external business, economic, geopolitical and regulatory environments in which we operate. Our business strategies and plans are designed to align with our risk appetite, our capital position and our financial performance objectives. We periodically reassess our risk appetite taking into consideration the economic, regulatory and competitive environment in which we operate.
Specific business and strategic risks are discussed below in further detail.
Geopolitical Risk
Geopolitical risk is the wide array of risks associated with political, economic, or social conflict or tensions across borders (generally between nation states) as well as events or trends with global or international dimensions that increase risks for the operations of companies. We operate in various geographies and our business and financial operations are susceptible to regional and global economic, geopolitical and regulatory changes. Geopolitical risk may lead to increased volatility in the global economic outlook, capital and energy markets; difficulty in conducting business in certain geographies; an increased threat of targeted cyber-attacks; and potential reputational risk. The shifting international order and increasing geopolitical instability alongside ongoing US-Canada trade tensions and related tariffs continue to generate uncertainty for the Canadian and US economies, potentially impacting markets, GDP growth, foreign exchange rates, inflation and employment with associated implications for Clients and investments.
Economic Risk
We may be affected by economic and capital markets conditions and economic shocks around the globe as a result of increasingly connected global markets. Factors such as changes in interest rates, foreign exchange rates, market volatility, housing prices, consumer spending, saving and debt, business investment and inflation around the globe can affect the business and economic environments in which we operate.
Economic risk can also intersect with other risk considerations such as environmental and social risks. The impact of these factors include the possibility of continued low growth, sustained too low or too high interest rates, increases in inflation, increased volatility in interest rates and equity markets, and a continuation of relatively low yet volatile credit spreads. The impact on the economic environment from any of these events may not be consistent with our assumptions and expectations, which may adversely impact our financial results and the ability to implement our business strategy. Market-related impacts from the economic environment, legal, regulatory or policy changes or other governmental actions could continue to place pressure on our earnings, regulatory capital requirements, profitability, liquidity and our ability to implement our business strategies and plans. Low interest rates and increased volatility create a number of challenges for us including increased hedge costs, lower investment yields, adverse policyholder behaviour and lower levels of new business profitability. Other impacts of macro-economic uncertainty and volatility may lead to other financial and non-financial impacts including goodwill impairment, decline in our share price and impact on our credit and financial strength ratings.
Execution Risk
Our business strategies, plans and financial performance are dependent on the successful execution of organizational and strategic initiatives designed to support the growth of our business. Our ability to effectively manage and prioritize the execution of these initiatives, identify and adapt rapidly to new opportunities, and refine our strategies in response to changing economic, regulatory and competitive environment directly affects our ability to execute our strategies. Identifying and implementing the right set of initiatives is critical to achieving our Business Plan targets.
Successful execution of our business strategies and plans impacts a number of factors, including:
•Our ability to generate sufficient earnings to maintain an adequate level of capital;
•Our ability to generate sustained investment performance;
•Our ability to meet regulatory requirements;
•Our ability to manage our risk exposures effectively;
•Our ability to attract and retain Clients and distributors;
•Our ability to have the right set of diverse products and business mix, and
•Our ability to reduce operating expenses while maintaining our ability to hire, retain and motivate key personnel.
There is no certainty that we will be successful in implementing our business strategies or that these strategies will achieve our objectives. If our business strategies are not successful or are not executed effectively, it could lead to cost structure challenges and we may not be able to achieve our growth objectives or react to market opportunities, which may have an adverse impact on our business and financial results.
Distribution Risk
We distribute our products through a variety of distribution channels, including direct sales agents, managing general agents, independent general agents, financial intermediaries, broker-dealers, banks, pension and benefits consultants and other third-party marketing organizations. Competition for these intermediaries and agents is based on products, compensation, support services and financial position.
We face the risk that our key distribution partners may undergo consolidation, change in ownership structure or change their distribution model which could materially impact sales and our growth targets. New distribution channels could emerge that may impact the effectiveness of our current distribution strategy. Distribution channels are growing rapidly in some businesses in certain countries, which may heighten the risks of market conduct and channel conflicts or overlaps. Distribution risk may also be influenced where our distribution or product strategy and related services or technology are not in line with our strategic objectives or in consideration of the changes in Client behaviour or our regulatory environment.
| | | | | | | | | | | | | | | | | | | | |
| MANAGEMENT'S DISCUSSION & ANALYSIS | | Sun Life Financial Inc. | December 31, 2025 | 71 |
The capability to reach and retain Clients through use of digital technology and data analytics is becoming increasingly important in the insurance industry. While use of digital-based distribution channels may help us achieve or expand scale, these channels expose us to regulatory compliance and information security related risks.
Failure to achieve planned distribution scale could materially impact our financial and strategic objectives. This includes the inability to attract and retain intermediaries and agents at a cost that is financially feasible to the Company, or to develop online sales and Client support capabilities and technologies. In addition, the lack of a well-diversified distribution model in the jurisdictions in which we do business may cause over-reliance on agency channel or key partners.
Risks Relating to Mergers, Acquisitions, Divestitures and Strategic Investments
We regularly explore opportunities to selectively acquire other businesses or to divest ourselves of all or part of certain businesses, in support of our growth and strategic objectives.
Any transaction carries risks associated with economic, operational, strategic, financial, tax, legal, regulatory, compliance, environmental, social, and other factors, which could adversely impact our ability to achieve our financial and strategic objectives. These may include the risks that:
•We may be unable to make an appropriate acquisition in a desired market or business line;
•We may be unable to realize the financial and strategic benefits of the transactions, including any anticipated cost savings following an acquisition, due to competitive factors, regulatory requirements or other reasons;
•The capital utilized to finance any transaction may limit our ability to deploy further capital to pursue other opportunities and initiatives;
•We may fail to, or are unable to, uncover all material liabilities and/or subsequent asset impairments, despite having conducted extensive due diligence, and;
•The customary indemnifications provided by the seller to the purchaser may not be collectible or sufficient to fully offset losses arising from the acquired business, and the credit risk of the seller that the purchaser may be exposed to if an indemnification provision is triggered.
Our ability to realize the contemplated economic, financial, and strategic benefit of any transaction is contingent on several factors, including:
•The effective separation and/or integration of the transferred businesses, restructure and/or reorganization of related businesses, and retention of key personnel to effectively execute these transactions, and;
•The successful integration of the acquired businesses with our existing operation, and harmonization of any differences in organizational culture, which may require the dedication of significant management resources and distract management’s attention from our day-to-day business.
To mitigate these risks, we have established procedures to govern the evaluation, execution and integration of mergers and acquisitions transactions. Regular updates on execution and integration risks relating to these transactions are provided to the Board, its Committees and senior management teams, as appropriate, along with any mitigants developed to address such risks.
Competitive Environment
Competition from insurance companies, banks, asset managers, mutual fund companies, financial planners and other service providers (including new entrants and non-traditional financial services companies) is intense, and could adversely affect our business in certain countries.
The trend towards global consolidation of the financial services industry has resulted in competitors with significant market share and established distribution relationships and brands. These larger companies have the ability to heavily invest in fundamental activities for sustained profitable growth and superior Client service such as brand equity, product development, technology, risk management, and distribution capability.
The businesses in which we engage are highly competitive and our ability to sell our products is dependent on many factors, including scale, price and yields offered, distribution channels, digital capabilities, financial strength ratings, range of product lines and product and service quality, brand strength, investment performance, historical dividend levels and the ability to provide value added services to distributors and Clients. In certain markets, some of our competitors may be superior to us on one or more of these factors. Our competitors have significant potential to disrupt our business through targeted strategies to reduce our market share which may include targeting our key people or bancassurance partners and other distributors or aggressively pricing their products. Our ability to achieve our Business Plans and strategies depends significantly upon our capacity to anticipate and respond quickly to these competitive pressures.
Technology is driving rapid change in the financial services sector and is enabling new entrants to compete or offer services to our competitors to enhance their ability to compete in certain segments of the insurance, wealth and asset management markets. The emergence of new technologies such as robotic process automation, AI, blockchain and advanced analytics may have an impact on the financial services sector and how companies interact with their stakeholders. Our current competitors or new entrants may use these or other new technologies to provide services in various areas such as customized pricing, proactive outreach to Clients and targeted marketing in order to strengthen their Client relationships and influence Client behaviour. The risk of disruption from changing technology and innovation may impact our distribution models as new and low cost digital-based business models emerge in connection with the distribution of financial services and products, such as insurtechs and robo-advisors. These risks are evolving rapidly with an increasing number of digital users and are difficult to anticipate and respond to proactively, and may adversely impact our profitability and financial position.
Competitors may offer a greater selection of or lower cost products, which may require us to adapt at a more rapid pace, create margin pressure in some of our businesses and impact our profitability and market share. In the asset management sector, there has been a trend among investors towards lower-fee passive investment products such as index- and other types of exchange-traded funds, which may impact our ability to attract and retain Clients in our actively managed products. Product development and product life cycles have shortened in many product segments, leading to more intense competition with respect to product features. This increases product development and administrative costs and reduces the time frame over which capital expenditures can be recovered. Regulatory and compliance costs also generally rise with increases in the range and complexity of our product portfolio.
| | | | | | | | | | | | | | | | | | | | |
72 | December 31, 2025 | Sun Life Financial Inc. | | MANAGEMENT'S DISCUSSION & ANALYSIS | |
Many of our insurance products, particularly those offered by the group segment, are renewed annually. Given this relatively high frequency of renewal activity, this business may be particularly exposed to adverse persistency through competitive market pressures.
Different accounting bases of reporting and regulatory capital requirements across multiple jurisdictions may cause us to be at a disadvantage compared to some of our competitors due to differences in reported earnings and due to these reporting and regulatory capital requirements.
Investment Performance
Investment performance risk is the possibility that we fail to achieve the desired return objectives on our investment portfolio, or that our asset management businesses fail to design or execute investment strategies in order to achieve competitive returns on the products and managed accounts offered by these businesses. Failure to achieve investment objectives may adversely affect our revenue and profitability through slower growth prospects and adverse impacts on policyholder or Client behaviour.
For our insurance businesses, the performance of our investment portfolio depends in part upon the level of and changes in interest rates, spreads, credit experience, equity prices, real estate values, the performance of the economy in general, the performance of the specific obligors included in these portfolios and other factors that are beyond our control. These changes can affect our net investment income substantially in any period.
In our asset management businesses, portfolio management risk is the risk that an investment strategy is not executed in a prudent manner, such that the mandate significantly fails to fulfill its investment objective and materially falls short of its target returns and relevant benchmark rates of return.
•Not properly executing the investment strategy could cause potential legal or regulatory concern and reputational harm, and we could lose existing and potential Clients.
•We may also see adversely affected sales, increased outflows or reduced level of assets under management, which could lead to a decline in the fee margin and financial losses.
Changes in Legal and Regulatory Environment
Most of our businesses are subject to extensive regulation and supervision. Changes to legislation, regulations or government policies, or the manner in which they are interpreted or enforced, may require that we make significant changes to our strategy and may result in increased implementation costs and diversion of resources to manage the change. These changes could impact financial reporting, accounting processes, capital requirements, the regulatory framework for our products and services, the regulation of selling practices, sales intermediaries and product offerings, solvency requirements, executive compensation, and corporate governance practices and could impose restrictions on our foreign operations (such as limits on foreign ownership of local companies). All of these changes could have an adverse effect on our business and operations. Our failure to comply with existing and evolving regulatory requirements could also result in regulatory sanctions and could affect our relationships with regulatory authorities and our ability to execute our business strategies and plans.
Currently there are a number of regulatory developments in Canada and globally which could impact our business and the way we are regulated or supervised in various jurisdictions, which include the following:
•In Canada, there is a continued focus on enhancing the affordability of and accessibility to prescription drugs, including pressure on the federal government from political parties, some provincial governments, the media and advocacy groups to implement forms of nationalized pharmacare programs. These programs, if expanded, could impact our business in several ways, including premium income, our ability to offer coverage, the price and level of coverage of other benefits we offer or are able to offer through our Canadian group benefits business, which in turn could impact plan renewals and retention of group Clients, plan member interaction and the value of other coverage offered by that business.
•Insurance and securities regulators continue to focus on agent and advisor regulation and oversight including client fairness, advisor conduct and licensing and related practices, assessing product fees, compensation practices, sales practices and conflicts of interest. Regulators are also imposing higher standards that relate to interacting with clients in order to increase disclosure obligations related to fees; impose prohibitions or restrictions on the payment of certain types of commissions and service fees to agents, advisors and third-party distributors; resulting in changes to product features and sales and market practices by agents, advisors, product manufacturers and distributors. Examples of these changes include the Client Focused Reforms released by the Canadian Securities Administrators which fully came into effect on December 31, 2021, and the final rule amendments published by the Canadian Securities Administrators and the Canadian Council of Insurance Regulators in April 2023, and coming into effect on January 1, 2026 to enhance total cost reporting for investment funds and segregated funds.
•In the U.S., significant changes to the federal regulatory and policy environment are in progress, affecting taxation, healthcare, technology, trade, and environmental, social and governance ("ESG"), among other things, and the state landscape remains similarly dynamic. These changes could directly or indirectly impact our business.
•Multiple countries where we do business have applied a number of targeted sanctions, tariffs and trade restrictions on one another in recent years and there may be heightened risks and uncertainties to our business in the impacted jurisdictions as a result of these developments.
•Regulators are increasing their focus on operational risks and resilience. New laws, regulations, guidelines, directives and expectations continue to emerge that will require the Company to enhance its operational risk management and resilience, including its technology and information security programs, upgrade its third-party risk management and data governance and privacy programs. The continued emergence of these legal and regulatory requirements will also increase the Company's regulatory reporting obligations and have an impact on the costs and resources associated with these activities.
•The ESG-related regulatory environment continues to evolve rapidly, with regulators taking divergent approaches to regulation, which could lead to business and strategic risks. We continue to evolve our risk management practices and disclosures to implement existing regulatory requirements. Across the jurisdictions in which we operate, we continue to monitor the development of new regulatory requirements governing the analysis and reporting of ESG risks. In Canada, OSFI Guideline B-15 - Climate Risk Management came into force in fiscal year-end 2024 and sets out OSFI’s expectations related to the management and disclosure of climate-related risks by FRFIs. In May 2025, Sun Life published its inaugural OSFI B-15 Climate Risk Management Report and has established implementation plans for compliance with subsequent phases of the guideline, including additional disclosure expectations for fiscal year-end 2025. In the U.S., we continue to monitor the fragmented ESG-related regulatory landscape. Federal climate disclosure rules have stalled, while state governments and regulators are taking divergent approaches and conflicting actions as they continue to focus on the ESG
| | | | | | | | | | | | | | | | | | | | |
| MANAGEMENT'S DISCUSSION & ANALYSIS | | Sun Life Financial Inc. | December 31, 2025 | 73 |
practices of financial institutions, asset managers, and large U.S. entities conducting business in their states reflecting the differing views surrounding ESG matters in the U.S. In addition, we are monitoring the development and enforcement of anti-greenwashing laws and regulations in the jurisdictions in which we operate.
See the heading Regulatory Matters in the AIF for a description of our regulatory environment in Canada, the U.S., Asia and Bermuda and other examples of changes in regulation that may affect our business and operations.
Environmental and Social Risk
Our financial performance, operations, and reputation may be adversely affected if we do not adequately prepare for the direct or indirect impacts of environmental and social risks. Environmental and social risks include but are not limited to environmental damage on properties occupied, owned or managed by us; physical and transition risks; as well as public health and inequality risks. These risks may impact our direct operations, investing activities or other areas of our value chain.
Environmental and social risks can arise as a direct result of the increased frequency and severity of environmental disasters, extreme weather events, related emerging regulatory and public policy developments, and their impacts on our operations, invested assets, suppliers, Clients and reputation. They can also arise indirectly through heightened stakeholder expectations around environmental and social performance, resource constraints, costs associated with mitigation and adaptation, and Clients and suppliers negatively impacted by the aforementioned. Environmental and social risks are considered in our risk assessment processes.
As an owner/lessor of and investor in real estate, we may be impacted where environmental events damage or disrupt our underlying properties. Our businesses and the properties underlying our investments are subject to environmental laws and regulations in the jurisdictions in which we operate. Consequently, we may experience environmental impacts or liabilities that could adversely affect the value of those businesses and properties, their ability to generate income, and costs related to any compliance requirements or remediation. Through other invested assets, such as loans, bonds or equity investments, we could be subject to these impacts and negative consequences from environmental issues arising at the level of the issuer and/or specific asset. Our reputation and operations may be adversely affected if we or our tenants, borrowers, or other associated parties violate environmental regulations or best practices.
Environmental risks could also harm the financial position of our reinsurers and insurers of property which we own, lease, have invested in, or manage. In turn, this may increase the risk of default on recoveries from these reinsurers and insurers, may increase the cost of reinsuring our business or the cost of insurance, and may result in reinsurance or insurance coverage being unavailable.
Significant environmental changes and disasters may also reduce the overall level of economic activity in affected areas which could hurt our businesses, the value of our investments, our ability to offer products and services, or service our existing Clients. As noted above under Insurance Risk - Mortality and Morbidity Risk, environmental risks have implications in areas such as the concentration risk presented by environmental disasters. As these events increase, they may impact our mortality and morbidity experience and our pricing and modelling assumptions.
If our Clients, shareholder groups, or other key stakeholders deem that our environmental and social practices are inadequate or inappropriate, our business could be negatively affected. Failure to comply with an existing or potential Client's environmental or social policies (or not meeting their minimum requirements) could disqualify us from the opportunity to bid on, earn, or retain business. We may also experience reduced access to capital markets if certain indices find that our practices fall short of their criteria and we are removed as an index constituent.
v. Operational Risk
Risk Description
Operational risk is the risk of loss (financial and non-financial) resulting from inadequate or failed internal processes, people and systems or from external events. Operational risk is present in all of our business activities and encompasses a broad range of risks as described below. Operational risk is embedded in the practices utilized to manage other risks and, therefore, if not managed effectively, operational risk can impact our ability to manage other key risks.
Operational Risk Management Governance and Control
We employ a wide range of operational risk management practices and controls, as outlined below:
•Operational risk governance practices are in place, including independent monitoring and review and reporting to senior management and the Board Committees.
•Risk appetite limits have been established in Operational Risk.
•Comprehensive Operational Risk Management Framework, Policies, guidelines and practices are in place.
•Our governance practices, corporate values, Code of Conduct and Company-wide approach to managing risk set the foundation for mitigating operational risks.
•Our Code of Conduct sets the tone for our high standards of ethical behaviour, and we regularly review and update the Code of Conduct to ensure that it continues to meet the expectations of regulators and other stakeholders. All our directors and employees must reconfirm annually their understanding of and commitment to comply with the Code of Conduct.
•We have established appropriate internal controls and systems for talent acquisition, rewards and development programs that attract, build and retain top talent and create strong succession plans as well as compensation programs, and we provide ongoing training to our people.
•We conduct regular monitoring of employee engagement to ensure we create and maintain a work environment where all employees are welcome and able to contribute effectively.
•Stress-testing techniques, such as FCT, are used to measure the effects of large and sustained adverse scenarios.
•We mitigate a portion of our operational risk exposure through our corporate insurance program by purchasing insurance coverage that seeks to provide insurance against unexpected material losses resulting from events such as criminal activity, property loss or damage and liability exposures, or that satisfies legal requirements and contractual obligations.
| | | | | | | | | | | | | | | | | | | | |
74 | December 31, 2025 | Sun Life Financial Inc. | | MANAGEMENT'S DISCUSSION & ANALYSIS | |
•Internal capital targets are established at an enterprise level to cover all risks and are above minimum regulatory and supervisory levels. Actual capital levels are monitored to ensure they exceed internal targets.
Specific operational risks and our risk management strategies are discussed below in further detail.
Information Security and Privacy Risks
Information and technology are used in almost all aspects of our business and operations. As part of our Client strategy, we continue to enhance the digital side of our business to support and enable new business models and processes, that are more personal, proactive and predictive.
Our business and the successful implementation of our digital strategy are dependent on various factors including maintaining a secure environment for information belonging to our Clients, employees and other parties that interact with us. This requires the effective and secure use, management and oversight of information and physical assets. We engage with various stakeholders and leverage emerging technologies, including digital, mobile applications, cloud computing, AI and robotic process automation. These technologies are used to collect, process and maintain information relating to business transactions and financial reporting, as well as the personal information of our Clients and employees. We also obtain services from a wide range of third-party service providers and have outsourced some business and information technology functions in various jurisdictions.
There continues to be an increasing number of information security compromises and privacy breaches across industry sectors, governments and individuals. The increasing scope and complexity of malicious activity poses a significant risk to our systems and these risks may be exacerbated by the breadth of our operations, our geographic footprint and the complexity of our technology systems. A serious security or privacy breach of either an internal or third-party service provider’s computer system that contains sensitive business, Client and/or employee information may result in business interruption, theft or misuse of confidential information, regulatory penalties and scrutiny, litigation, reputational damage and may have an adverse impact on current and future business opportunities with our Clients, employees and business relationships. We continue to actively monitor for increases in malicious activity due to escalating geopolitical tensions across the globe.
In particular, privacy breaches could occur and may result in unauthorized access, use or disclosure of personal information. Many jurisdictions in which we do business are developing and implementing cyber security reporting requirements and more stringent consumer privacy legislation, often with greater enforcement powers for regulators and higher fines and penalties for organizations.
We continue investing in people, processes, and technology to strengthen our abilities to respond to the evolving threat landscape. Our well-established security controls and processes are intent on protecting our information and computer systems and the information entrusted to us by our Clients and employees. Examples of our established controls and processes include:
•Our Information Security framework is overseen by the Chief Information Security Officer, supported by senior leadership and by our Operational Risk Management Framework.
•Our Information Security framework and governance controls (policies, procedures, training) are aligned with recognized industry standards and are compliant with applicable laws and regulations. The security framework also includes technology and process safeguards and regularly promotes secure behavioural practices.
•As part of our layered security approach, we deliver general security awareness training sessions to all employees every year that is reinforced with regular awareness resources and activities.
•Our Chief Privacy Officer oversees the global privacy program and sets direction for privacy compliance across the enterprise. Our global privacy program monitors adherence to our global privacy commitments, local laws and local privacy policies.
•Over 30 Privacy Officers across the enterprise monitor emerging privacy legislation, help our businesses make privacy-related decisions and provide guidance on handling personal information.
•We deliver general privacy training annually to all employees supported by targeted training as needed, and provide regular monitoring and reporting.
•Our protection strategy leverages information security risk assessments and privacy impact assessments to evaluate potential risks.
•We carry cyber risk insurance to help mitigate the impact of security and privacy incidents.
The threat environment is rapidly and constantly changing, and there remains a possibility that our processes and controls could be unsuccessful in detecting or preventing a security breach. We remain vulnerable, and work with third parties who may also be vulnerable, to computer viruses and other types of malicious software, cyber-attacks and hacking attempts from unauthorized persons, the physical theft of computer systems, internal programming or human errors, fraud, or other disruptive problems or events. There is also a risk that certain internal controls fail, which could also exacerbate the consequences from such events.
Human Resources Risk
Our ability to achieve business objectives can be adversely affected if we are unable to attract, retain or effectively deploy resources with the in-depth knowledge and necessary skills required, or are unable to design compensation and talent programs that effectively drive employee behaviour and shape corporate culture. Failure to manage Human Resources risk can also lead to direct financial and reputational loss including losses arising from activity that is inconsistent with Human Rights or employment laws or health and safety regulations.
To mitigate this risk, we have comprehensive Human Resource policies, practices and programs in place to ensure compliance with employment legislation, minimize the risk of employee misconduct, and proactively develop employee skills, capabilities and behaviours to meet future business needs.
Regulatory Compliance, Legal and Conduct Risk
We are subject to extensive regulatory oversight by financial services regulators in the jurisdictions in which we conduct business. Failure to comply with applicable laws or to conduct our business consistent with changing regulatory or public expectations could adversely impact our reputation and may lead to regulatory investigations, examinations, proceedings, settlements, penalties, fines, restrictions on our business, litigation or an inability to carry out our business strategy.
| | | | | | | | | | | | | | | | | | | | |
| MANAGEMENT'S DISCUSSION & ANALYSIS | | Sun Life Financial Inc. | December 31, 2025 | 75 |
As a business with external Clients and stakeholders, we face many operational risks, including, legal, fraud, privacy, financial crimes, conduct, and firm administration. Examples of how these operational risks may affect our business are outlined below:
a.Legal Risk: during the normal course of operating our business, we are subject to the risk of adverse litigation including class action lawsuits. Such litigation could result in reputational damage and financial loss.
b.Fraud Risk: both internal and external fraud are possibilities within our business, such as the submission of fraudulent claims. Such actions could result in reputational damage, financial loss and lawsuits.
c.Privacy Risk: any breach of personal information could have ramifications for our business and may lead to lawsuits and reputational damage.
d.Financial Crimes Risk: non-compliance with regulatory requirements and the failure to manage the risk around Money-Laundering, Terrorist Financing, Sanctions, Bribery and Corruption can lead to financial loss, reputational damage, and business sanctions.
e.Conduct Risk: the risk of unfair treatment of Clients as a result of inadequate or failed processes or inappropriate behaviours, offerings, or interactions by the Enterprise, its Employees, Agents, Distributors, or other third parties which could lead to reputational damage, business sanctions and financial loss. This includes risk arising from non-compliance with Regulatory Requirements, how we design, develop, market, distribute, sell and service our products to our Clients, and how we address or attend to Client queries.
f.Firm Administration Regulatory Risk: the risk arising from the administration of the firm that is not compliant with applicable laws and regulations, which may result in reputational damage, business sanctions and financial loss.
As an international organization, we are subject to anti-bribery and anti-corruption laws, and regulations in the jurisdictions in which we operate in, each of which include significant civil and criminal penalties if breached. Our policies, including our Code of Conduct, require strict adherence to these laws. We, or our joint ventures, Distributors or other third-parties acting on our behalf, may from time to time interact with government officials, which presents a heightened risk of censure under anti-bribery and anti-corruption laws if our or our business partners' due diligence or other procedures when interacting with government officials are deemed inadequate.
Financial services regulators and other government agencies in jurisdictions we operate regularly make inquiries, conduct investigations and administer examinations with respect to compliance with applicable laws and regulations. As well, regulators and governmental authorities, industry groups and rating agencies have developed initiatives regarding market conduct. Financial services regulators and other governmental authorities in many of the countries in which we operate have raised issues and commenced regulatory inquiries, investigations and proceedings with respect to current and past business practices in the financial services industry and have given greater emphasis to the investigation of those practices. Current and future regulatory investigations, examinations, proceedings, and civil actions arising out of such matters could adversely affect our reputation, and may result in settlements, penalties, fines, restrictions on our business, litigation or an inability to carry out our business strategy or may cause us to make changes to our business and compliance practices, policies and procedures, which in turn could impact our profitability and future financial results and increase our litigation risk.
Under the Insurance Companies Act and the Supervisory Information (Insurance) Regulations (Canada) and pursuant to similar restrictions in other jurisdictions, we are prohibited from directly or indirectly disclosing any supervisory information relating to SLF Inc., Sun Life Assurance and their affiliates.
Our Chief Compliance Officer oversees our comprehensive Enterprise-wide compliance framework, which is aligned with guidance from OSFI and other regulators. This framework promotes proactive, risk-based management of compliance and regulatory risk, and includes Enterprise and business segment policies and operating guidelines, programs to promote awareness of laws and regulations that impact us, ongoing monitoring of emerging legal issues and regulatory changes and training programs.
•The employee training programs include anti-money laundering and anti-terrorist financing, sanctions, anti-bribery and corruption, fraud, privacy and information security risk management.
•Effective governance, oversight and implementation is a coordinated effort between first and second lines of defence functions. Second line oversight and effective challenge relies on a network of compliance officers.
•The Chief Compliance Officer reports regularly to the Board and Board Committees on the health of the compliance program, key compliance risks, emerging regulatory trends, escalation of significant issues and key risk indicators.
Information Technology Risk
The use of technology and computer systems is essential in supporting and maintaining business operations. We use technology to support virtually all aspects of our business and operations. The rapidly changing business environment increases the risk of our technology strategy not being agile enough to adapt to new business demands in a timely manner leading to financial losses, increased costs and the inability to meet Client needs.
Initiatives supporting our business strategy rely on developing innovative and timely information technology solutions and resilient technology supporting our critical operations. Although every reasonable precaution is taken to ensure information technology systems remain available, stable, and current, it is not possible to fully eliminate all risk. Some changes and upgrades are extremely complex and there is a chance that an undetected technical flaw may exist, which, when implemented, stops or disrupts critical information technology systems or business applications.
Third-Party Risk
We engage in a variety of third-party relationships, including with distributors, independent contractors, outsourcing service providers and suppliers. Our profitability or reputation could be impacted if these third parties are unable to meet their ongoing service commitments or fail to perform to expected standards.
An interruption in our relationship with certain third parties or other parties engaged by such third parties, the impairment of their reputation or creditworthiness, their failure to provide contracted services in the manner agreed or in accordance with applicable laws and regulations,
or the ability to timely and cost effectively transition to alternate third parties in the event of a disruption could materially and adversely affect our business objectives or expose us to regulatory fines and/or reputational harm.
To manage these risks, we have established Company-wide policies and guidelines which are consistent with OSFI's and other local regulatory requirements, and which set out our requirements to identify, assess, manage, monitor and report on third-party risks. Our program includes third-party risk assessments and a risk-based approach to conducting due diligence. The key elements and risks associated with the third
| | | | | | | | | | | | | | | | | | | | |
76 | December 31, 2025 | Sun Life Financial Inc. | | MANAGEMENT'S DISCUSSION & ANALYSIS | |
party are documented in the form of a written agreement, and the company monitors performance of its third parties in a manner that is commensurate to the size, risk, scope and complexity of the third-party relationship.
Business Disruption Risk
To conduct operations, our businesses are dependent on the availability of a range of resources including trained employees, physical locations, access to technology and third parties.
A sustained failure of one or more of our key business processes or systems could materially and adversely impact our business, operations, employees and ability to deliver to our Clients. These failures can result from disruption of our processes and systems due to a range of risks including utility outages, fires, floods, severe storms, cyber-attacks, terrorism and other human-made attacks, natural disasters and other events. We have experienced increased incidents and impacts of disruption due to weather events such as tropical storms and flooding in the geographies in which we operate, as well as earthquakes, and pandemic risks.
Business disruptions can also occur due to changes in environmental risk. The related impacts have been highlighted above under the heading Environmental and Social Risk. Also, because some of our business processes are performed by third parties and some of our systems interface with, or are dependent on, third-party systems, we could experience service interruptions if these third-party operations or systems are degraded and/or fail.
To mitigate the risk of disruption, we have implemented a business continuity management program and are building an operational resiliency program to regularly test and facilitate the recovery of critical business operations. This program encompasses business continuity, crisis management, disaster recovery planning, operational resilience and includes periodic testing of these plans.
Our policy, guidelines and operating procedures establish consistent processes to manage the impact to key business functions and operations and to support effective and efficient resumption should a major disruption occur. In addition to regular updates and testing of business continuity plans for critical business operations, we conduct mandatory business continuity awareness training for all employees annually and have off-site backup facilities and failover capability designed to minimize downtime and accelerate recovery time in the event of a major disruption.
Model Risk
We use complex models to support many business functions including product development and pricing, capital management, valuation, financial reporting, planning, hedging, asset-liability management, risk management and advanced analytics (such as AI, predictive modelling and decision making algorithms). Model risk is the risk of loss, either in the form of financial loss, inappropriate or poor business decisions, damage to reputation, or other adverse impact, arising from inaccurate model outputs or incorrect use or interpretation of model outputs.
Model risk can arise from many sources including:
•inappropriate methodologies,
•assumptions or parameters,
•incorrect use of source data,
•inaccurate or untimely source data,
•incorrect application or operator errors,
•increasing product complexity, and
•regulatory expectations.
If the models' methodologies and assumptions are not appropriately set or well controlled, or data or implementation errors occur in the models, this could result in a negative impact on our results and financial position.
Many of our methods and models for managing risk and exposures are based upon the use of observed historical precedents for financial market behaviour, credit experience and insurance risks. As a result, these methods may not fully predict future risk exposures, which can be significantly greater than our historical measures indicate. Other risk management methods depend upon the evaluation of information regarding markets, Clients, catastrophic occurrence or other matters that are publicly available or otherwise accessible to us. However, this information may not always be accurate, complete, up-to-date, properly evaluated or necessarily indicative of ultimate realized experience. As we review and update our models, changes might be made to valuation methods and assumptions, which may impact our results.
To manage model risk, we have established robust, Company-wide model risk management procedures over the models' life cycle with respect to building, using, changing and retiring models. The policy and operating guidelines set out minimum, risk-based requirements to ensure that models are effectively controlled, maintained and appropriately understood by users.
Information Management Risk
As an international provider of financial services, we deal with extensive information across a number of countries.
Information management risk is the:
a.inability to capture, manage, retain and appropriately dispose of business records,
b.the inability to provide data that is valid, complete, accurate, consistent, unique, or timely to support business decisions, and
c.the inability to manage data location and cross-border access appropriately.
Failure to manage these risks could have financial or reputational impacts, and may lead to regulatory proceedings, penalties, and litigation. To manage and monitor information management risk, we have a data governance framework, which includes a records management program, data quality best practices, and data residency controls.
We continue to evolve our risk management best practices to manage risks associated with GenAI as we identify use cases and run experiments designed to identify opportunities.
| | | | | | | | | | | | | | | | | | | | |
| MANAGEMENT'S DISCUSSION & ANALYSIS | | Sun Life Financial Inc. | December 31, 2025 | 77 |
vi. Liquidity Risk
Risk Description
| | | | | |
| Liquidity risk is the possibility that we will not be able to fund all cash outflow commitments and collateral requirements as they fall due. This includes the risk of being forced to sell assets at depressed prices resulting in realized losses on sale. This risk also includes restrictions on our ability to efficiently allocate capital among our subsidiaries due to various market and regulatory constraints on the movement of funds. Our funding obligations arise in connection with the payment of policyholder benefits, expenses, reinsurance settlements, asset purchases, investment commitments, interest on debt, and dividends on common and preferred shares. Sources of available cash flow include general fund premiums and deposits, investment related inflows (such as maturities, principal repayments, investment income and proceeds of asset sales), proceeds generated from financing activities, and dividends and interest payments from subsidiaries. We have various financing transactions and derivative contracts under which we may be required to pledge collateral or to make payments to our counterparties for the decline in market value of specified assets. The amount of collateral or payments required may increase under certain circumstances (such as changes to interest rates, credit spreads, equity markets or foreign exchange rates), which could adversely affect our liquidity. |
Under stress conditions, increases in funding obligations can occur in conjunction with reductions in cost effective sources of available cash inflow. In particular, adverse stress scenarios could involve increases in policyholder cash surrenders and terminations and decreases in the amounts of premiums and deposits being generated by existing and new Clients. Adverse capital market conditions may also be associated with a reduction in available market liquidity and clearing prices for expected asset sales, and reductions in the level of cash inflows (dividends, interest payments and expected maturities) on continuing portfolio investments. These developments could have an adverse effect on our financial position and results of operations.
We engage in various transactions including repurchase agreements and other capital markets transactions to meet short-term cash requirements. The cost and our ability to execute these transactions may be negatively impacted by illiquid or volatile markets. Disruption in the financial markets may limit our access to capital in the event we are required to seek additional liquidity to operate our businesses. This will result in increased costs to raise capital coupled with less desirable terms or maturities which would decrease future profitability and financial flexibility.
SLF Inc. is a holding company for its insurance, wealth and asset management subsidiaries and does not have significant operations of its own. Dividends and interest payments from its subsidiaries are its principal sources of cash. If the cash received from its subsidiaries is insufficient, then it may be required to raise debt or equity externally or sell some of its assets. We are subject to various regulations in the jurisdictions in which we operate. The ability of SLF Inc.'s subsidiaries to pay dividends and transfer funds is regulated in certain jurisdictions and may require local regulatory approvals and the satisfaction of specific conditions in certain circumstances. Through effective cash management and capital planning, SLF Inc. ensures that its subsidiaries, as a whole and on a stand-alone basis, are properly funded and maintain adequate liquidity to meet obligations, both individually and in aggregate.
In addition, rating agencies publish credit ratings of securities issued by SLF Inc. and its subsidiaries, which have an impact on the interest rates paid by those companies on borrowed funds. A material downgrade in the issuer credit ratings could limit our access to capital or increase the cost of borrowing and may have an adverse effect on our financial condition.
We have established financing arrangements that support NAIC statutory reserves for universal life policies issued by Sun Life Assurance in the U.S. Our ability to support these reserves with these financing structures can be negatively impacted by market conditions and regulatory changes. Further, these financings, in all or in part, are treated as operating leverage by the rating agencies. If, due to a change in rating agency methodology or position, the rating agencies cease to treat these financings as operating leverage, without providing any grandfathering provisions, there may be an adverse impact on our credit and financial strength ratings.
| | | | | |
| Liquidity Risk Management Governance and Control We generally maintain a conservative liquidity position and employ a wide range of liquidity risk management practices and controls, which are described below: •Liquidity risk governance practices are in place, including independent monitoring and review and reporting to senior management and the Risk Committee. •Liquidity is managed in accordance with our Asset Liability Management Policy and operating guidelines. •Liquidity contingency plans are maintained for the management of liquidity in a liquidity event. •Stress testing is performed by comparing liquidity coverage risk metrics under a one-month stress scenario to our policy thresholds. These liquidity coverage risk metrics are measured and managed at the enterprise and legal entity levels. •Stress testing of our collateral is performed by comparing collateral coverage ratios to our policy thresholds. •Cash Management and asset-liability management programs support our ability to maintain our financial position by ensuring that sufficient cash flow and liquid assets are available to cover potential funding requirements. We invest in various types of assets with a view of matching them to our liabilities of various durations. •Internal capital targets are established at an enterprise level to cover all risks and are above minimum regulatory and supervisory levels. Actual capital levels are monitored to ensure they exceed internal targets. •We actively manage and monitor our capital and asset levels, and the diversification and credit quality of our investments. •Various credit facilities for general corporate purposes are maintained.
Based on our historical cash flows and liquidity management processes, we believe that the cash flows from our operating activities will continue to provide sufficient liquidity for us to satisfy Client obligations, service debt obligations and to pay other expenses as they fall due. |
| | | | | | | | | | | | | | | | | | | | |
78 | December 31, 2025 | Sun Life Financial Inc. | | MANAGEMENT'S DISCUSSION & ANALYSIS | |
Maturity Analysis for Insurance Contracts
| | | | | | | | | | | | | | |
| The following tables present the undiscounted estimated future cash flows of insurance contract and reinsurance contract held assets and liabilities on our Consolidated Statements of Financial Position. These cash flows include estimates related to the timing and payment of death and disability claims, policy surrenders, policy maturities, annuity payments, minimum guarantees on segregated fund products, policyholder dividends, amounts on deposit, commissions and premium taxes offset by contractual future premiums and fees on in-force contracts. These estimated cash flows are based on the best estimated assumptions used in the determination of insurance contract and reinsurance contract held assets and liabilities. Due to the use of assumptions, actual cash flows will differ from these estimates. Amounts payable on demand, which includes amounts on deposit, dividends on deposit, outstanding claims and policyholder account values, are included in the within 1 year time band. Amounts in this table include the liability for incurred claims and liability for remaining coverage for contracts measured using the premium allocation approach ("PAA"). The amounts included in the table differ from the carrying value of the portfolio mainly due to discounting and risk adjustments.
|
| | | | | | | | | | | | | | | | | | | | | | | | | | | | | | | | | | | | | | | | | | | | | | | | |
| As at | Within 1 year | 1 to
2 years | 2 to
3 years | 3 to
4 years | 4 to
5 years | Over 5 years | Total | |
| December 31, 2025 ($ millions) | | | | | | | | | | | | | | | |
| Insurance contracts: | | | | | | | | | | | | | | | |
| Insurance contract assets | | $ | (382) | | | $ | (306) | | | $ | (288) | | | $ | (267) | | | $ | (252) | | | $ | (7,302) | | | $ | (8,797) | | |
| Insurance contract liabilities(1) | | 10,183 | | | 2,973 | | | 3,516 | | | 4,501 | | | 5,563 | | | 939,926 | | | 966,662 | | |
| Net insurance contract liabilities | | $ | 9,801 | | | $ | 2,667 | | | $ | 3,228 | | | $ | 4,234 | | | $ | 5,311 | | | $ | 932,624 | | | $ | 957,865 | | |
| Reinsurance contract held: | | | | | | | | | | | | | | | |
| Reinsurance contract held assets(1) | | $ | (837) | | | $ | (298) | | | $ | (308) | | | $ | (319) | | | $ | (338) | | | $ | (11,753) | | | $ | (13,853) | | |
| Reinsurance contract held liabilities | | 211 | | | 189 | | | 189 | | | 188 | | | 188 | | | 5,198 | | | 6,163 | | |
| Net reinsurance contract held assets | | $ | (626) | | | $ | (109) | | | $ | (119) | | | $ | (131) | | | $ | (150) | | | $ | (6,555) | | | $ | (7,690) | | |
| | | | | | | | | | | | | | | | |
| December 31, 2024 ($ millions) | Within 1 year | 1 to
2 years | 2 to
3 years | 3 to
4 years | 4 to
5 years | Over 5
years | Total | |
| Insurance contracts: | | | | | | | | | | | | | | | |
| Insurance contract assets | | $ | (633) | | | $ | (332) | | | $ | (272) | | | $ | (263) | | | $ | (241) | | | $ | (3,935) | | | $ | (5,676) | | |
| Insurance contract liabilities(1) | | 11,269 | | | 3,254 | | | 3,363 | | | 4,059 | | | 5,211 | | | 729,030 | | | 756,186 | | |
| Net insurance contract liabilities | | $ | 10,636 | | | $ | 2,922 | | | $ | 3,091 | | | $ | 3,796 | | | $ | 4,970 | | | $ | 725,095 | | | $ | 750,510 | | |
| Reinsurance contract held: | | | | | | | | | | | | | | | |
| Reinsurance contract held assets(1) | | $ | (847) | | | $ | (652) | | | $ | (685) | | | $ | (707) | | | $ | (728) | | | $ | (9,405) | | | $ | (13,024) | | |
| Reinsurance contract held liabilities | | 110 | | | 99 | | | 101 | | | 104 | | | 107 | | | 4,769 | | | 5,290 | | |
| Net reinsurance contract held assets | | $ | (737) | | | $ | (553) | | | $ | (584) | | | $ | (603) | | | $ | (621) | | | $ | (4,636) | | | $ | (7,734) | | |
(1) Includes amounts payable on demand of $5,386 million (2024 - $5,177 million), and $(26) million (2024 - $(29) million) for Insurance contract liabilities and Reinsurance contract held assets, respectively.
| | | | | | | | | | | | | | | | | | | | |
| MANAGEMENT'S DISCUSSION & ANALYSIS | | Sun Life Financial Inc. | December 31, 2025 | 79 |
Maturity Analysis - Other Financial Liabilities
| | | | | | | | | | | | | | | | | | | | | | | | | | | | | | | | | | | |
| The following table summarizes the contractual maturities of our significant financial liabilities and contractual commitments other than insurance contracts as at December 31, 2025 and 2024: |
| |
| Financial Liabilities and Contractual Obligations |
| December 31, 2025 ($ millions) | Within 1 year | 1 to
3 years | 3 to
5 years | Over 5
years | Total |
| Investment contract liabilities(1) | | $ | 6,387 | | | $ | 2,229 | | | $ | 1,548 | | | $ | 1,678 | | | $ | 11,842 | |
| Senior debentures and unsecured financing(2) | | 1,760 | | | 28 | | | 28 | | | 505 | | | 2,321 | |
| Subordinated debt(2) | | 312 | | | 769 | | | 606 | | | 9,762 | | | 11,449 | |
| Bond repurchase agreements | | 2,861 | | | — | | | — | | | — | | | 2,861 | |
| Accounts payable and accrued expenses | | 9,723 | | | — | | | — | | | — | | | 9,723 | |
| Lease liabilities(3) | | 167 | | | 294 | | | 236 | | | 393 | | | 1,090 | |
| Secured borrowings from mortgage securitization | | 425 | | | 560 | | | 390 | | | 145 | | | 1,520 | |
| Borrowed funds(2) | | 41 | | | 164 | | | 189 | | | 29 | | | 423 | |
| Credit facilities | | 1,748 | | | — | | | — | | | — | | | 1,748 | |
| Total liabilities | | $ | 23,424 | | | $ | 4,044 | | | $ | 2,997 | | | $ | 12,512 | | | $ | 42,977 | |
| Contractual commitments:(4) | | | | | | | | | | |
| Contractual loans, equities and mortgages | | $ | 2,043 | | | $ | 1,320 | | | $ | 647 | | | $ | 2,209 | | | $ | 6,219 | |
| Total contractual commitments | | $ | 2,043 | | | $ | 1,320 | | | $ | 647 | | | $ | 2,209 | | | $ | 6,219 | |
| | | | | | | | | | | |
| December 31, 2024 ($ millions) | Within 1 year | 1 to
3 years | 3 to
5 years | Over 5
years | Total |
| Investment contract liabilities(1) | | $ | 6,157 | | | $ | 2,351 | | | $ | 1,413 | | | $ | 1,692 | | | $ | 11,613 | |
| Senior debentures and unsecured financing(2) | | 2,133 | | | 28 | | | 28 | | | 519 | | | 2,708 | |
| Subordinated debt(2) | | 225 | | | 451 | | | 585 | | | 7,248 | | | 8,509 | |
| Bond repurchase agreements | | 2,840 | | | — | | | — | | | — | | | 2,840 | |
| Accounts payable and accrued expenses | | 10,085 | | | — | | | — | | | — | | | 10,085 | |
| Lease liabilities(3) | | 166 | | | 262 | | | 207 | | | 421 | | | 1,056 | |
| Secured borrowings from mortgage securitization | | 461 | | | 758 | | | 382 | | | 380 | | | 1,981 | |
| Borrowed funds(2) | | 23 | | | 107 | | | 244 | | | 31 | | | 405 | |
| Credit facilities | | 2,126 | | | — | | | — | | | — | | | 2,126 | |
| Total liabilities | | $ | 24,216 | | | $ | 3,957 | | | $ | 2,859 | | | $ | 10,291 | | | $ | 41,323 | |
| Contractual commitments:(4) | | | | | | | | | | |
| Contractual loans, equities and mortgages | | $ | 1,242 | | | $ | 985 | | | $ | 576 | | | $ | 2,054 | | | $ | 4,857 | |
| Total contractual commitments | | $ | 1,242 | | | $ | 985 | | | $ | 576 | | | $ | 2,054 | | | $ | 4,857 | |
| | | | | | | | | | | |
| (1) These amounts represent the undiscounted estimated cash flows of investment contract liabilities on our Consolidated Statements of Financial Position. |
| (2) Payments due based on maturity dates and include expected interest payments. Actual redemption of certain securities may occur sooner as some include an option for the issuer to call the security at par at an earlier date. |
| (3) Liabilities associated with the lease commitments are included on the Consolidated Statements of Financial Position. |
| (4) Contractual commitments are not reported on our Consolidated Statements of Financial Position. Additional information on these commitments is included in Note 22 of our 2025 Annual Consolidated Financial Statements. |
Additional information on liquidity risk can be found in Note 6 of our 2025 Annual Consolidated Financial Statements.
| | | | | | | | | | | | | | | | | | | | |
80 | December 31, 2025 | Sun Life Financial Inc. | | MANAGEMENT'S DISCUSSION & ANALYSIS | |
vii. Other Risks
International Operations
The future success of our businesses in our international operations depends in large part on our ability to grow and compete in the markets where we operate. Challenges in these markets pose strategic and execution risk including our ability to attract and retain qualified employees and executives with local experience and critical skills, geopolitical, legal, economic, competition or other risks, risks associated with joint venture operations, developing and executing our risk management practices, and our ability to attract, retain, expand and diversify distribution channels.
If we are unable to attract, retain and engage qualified employees and executives with relevant experience and critical business skills, our ability to grow our business in our international operations as quickly as planned may be limited. Competition for qualified employees and distribution partners in our international operations, in particular the Asian markets, continues to be strong and could adversely impact our ability to attract and retain talent.
Our international operations may face geopolitical, legal and regulatory, economic, competitive, operational or other risks that we may not face in our domestic operations. Examples of this type of risk are the risk of changes in regulation, geopolitical risks due to changes in government, discriminatory regulation, political instability, nationalization or expropriation of assets, changes to the maximum level of non-domestic ownership, price controls and exchange controls or other restrictions that could prevent us from transferring funds from these operations out of the countries in which they operate or converting local currencies we hold into Canadian dollars or other currencies.
Capital markets in certain international markets may not have the same depth, liquidity or range of investment options generally available in other markets in which we operate. In particular, the more limited availability of long-duration assets exposes our Asian operations to higher asset-liability management costs and potential risk.
We have entered into joint venture arrangements in certain markets in Asia, where we may have a lesser degree of control over these businesses that may expose us to additional operational, financial, compliance and legal risks. We may be dependent on our joint venture counterparty for capital, product distribution, local market knowledge, or other resources. Our ability to exercise management control or influence over these joint ventures and the success of our investments in them will depend on the cooperation between the joint venture participants and the terms of the joint venture agreements, which allocate control among the joint venture participants. If we are unable to effectively manage these joint ventures, or any joint venture counterparty fails to meet its obligations under the joint venture arrangement, encounters financial difficulty, elects to alter, modify or terminate the relationship, or a joint venture does not comply with local legislation or regulations, we may be unable to achieve our objectives and our results of operations and brand may be negatively impacted.
Capital Adequacy
Capital adequacy risk is the risk that our capital position is not or will not be sufficient to withstand adverse economic conditions, to maintain our financial strength, to allow us and our subsidiaries to support ongoing operations and to take advantage of opportunities for expansion, and to support the risk taking activity in pursuit of our business objectives.
The strength of our capital position depends in part upon the level of and changes in interest rates and equity prices, credit experience, mortality and morbidity experience, currency rate fluctuations and our overall profitability.
Various factors may negatively impact our capital ratios, and may impair our financial position and our ability to execute our business strategies and plans, such as:
•Declining equity markets
•Downgrades in ratings
•Changes in interest rates
•Changes in credit spreads on corporate bonds and asset backed securities
•Lower earnings
•Inability to access capital markets on a timely basis
In addition, regulatory changes being considered by other regulators world-wide may adversely impact the capital of SLF Inc. and its insurance subsidiaries.
Credit and Financial Strength Ratings
Financial strength ratings represent the opinions of rating agencies regarding an insurance company's ability to meet its policy obligations. Credit ratings indicate the opinions of rating agencies regarding an issuer's ability to meet the terms of debt, preferred share and Tier 1 hybrid capital obligations in a timely manner, and are important factors in a company’s overall funding profile and ability to access external capital. A downgrade by a rating agency in the credit ratings of securities issued by SLF Inc. and its subsidiaries or the financial strength ratings of SLF Inc.'s insurance company subsidiaries could adversely affect our financial condition and results of operations.
The financial strength rating of an insurance company is a key competitive factor in marketing its products and in attracting and retaining agents and distributors. If our credit or financial strength ratings are downgraded, our financial condition, competitive position and results of operations could be negatively impacted in many ways, including:
•Reducing new sales of insurance products, annuities and investment products;
•Requiring us to reduce prices for products and services to remain competitive;
•Higher level of surrenders and withdrawals;
•Higher reinsurance costs;
•Increasing our cost of capital and limiting our access to the capital markets, thus reducing our financial flexibility;
•Reducing our ability to enter into normal course derivative or hedging transactions and increasing the costs associated with such transactions; and
•Adversely affecting our relationships with our advisors and third-party distributors of our products.
| | | | | | | | | | | | | | | | | | | | |
| MANAGEMENT'S DISCUSSION & ANALYSIS | | Sun Life Financial Inc. | December 31, 2025 | 81 |
In addition, downgrades in our credit or financial strength ratings below thresholds specified in certain of our derivative agreements, reinsurance agreements and other agreements could result in the counterparties to those agreements having the right to terminate those agreements or to require that we provide support for those agreements in the form of collateral or letters of credit.
Changes in methodologies and criteria used by rating agencies could also result in downgrades that do not reflect changes in the general economic conditions or our financial condition.
Additional information concerning our ratings is provided in the AIF under the heading Security Ratings.
Tax Matters
The validity and measurement of tax benefits associated with various tax positions taken or expected to be taken in our tax filings are a matter of tax law and are subject to interpretation. Tax laws are complex and their interpretation requires significant judgment. The provision for income taxes reflects management’s interpretation of the relevant tax laws and its best estimate of income tax implications of the transactions and events during the period. There can be a risk that tax authorities could differ in their interpretation of the relevant laws and could assert that tax positions taken by the company give rise to a need for reassessment, including reassessment under specific or general anti-avoidance rules or transfer pricing provisions.
The assessment of additional taxes, interest and penalties or damage to the Company’s reputation could be materially adverse to our future results of operations and financial position.
Under the liability method of accounting for income taxes, deferred tax assets are recognized for the carryforward of unused tax losses and tax credits, as well as amounts that have already been recorded in the financial statements, but will not result in deductible amounts in determining taxable income until future periods. Deferred tax assets are recognized only to the extent of the probability that taxable profit will be available against which the future tax deductions and unused tax losses can be utilized.
At the end of each reporting period, we must assess the value of our deferred tax assets. The determination of our deferred tax assets is dependent upon projections of future taxable profits. Our projections require significant judgments and estimates about future events, including global economic conditions and the future profitability of our businesses. If the profitability of our businesses is lower than our projections or if our outlook diminishes significantly, we may be required to reduce the value of our deferred tax assets. Any change to our deferred tax assets could have a material adverse impact on our future results of operations and financial position.
We are also subject to changing income tax regulations. We currently have an effective income tax rate that is lower than the Canadian statutory income tax rate for corporations. The Company reflects favourable tax impacts in its financial statements from certain tax benefits, including but not limited to tax-exempt or low-taxed investment income, dividends received deductions, tax credits (from certain investments or from taxes paid on foreign source income), and favourable tax rates in certain jurisdictions in which we operate. In addition, many of our life insurance products benefit Clients with preferred tax treatment under various tax regimes. For example life insurance policies and annuity contracts in the U.S. and Canada allow for the deferral or elimination of taxation on earnings (inside buildup) accrued under the policy. There is a risk that tax legislation, administrative guidance or legislative developments could lessen or eliminate some of the benefits currently available to the Company or its policyholders. This risk could result in lower product sales or increased lapses of policies, and could have a material adverse effect on our future results of operations and financial position.
From time to time, governments in countries in which we operate enact changes to statutory corporate income tax rates. A change in income tax rate requires us to review and re-measure our deferred tax assets and liabilities as of the date of substantive enactment. As of December 31, 2025, the Company reported a $3,502 million net deferred tax asset in its Consolidated Statements of Financial Position, primarily in Canada. Any future tax rate reductions in jurisdictions where we carry a net deferred tax asset could result in a reduction in the carrying value of the deferred tax asset and a corresponding income tax expense at the time of substantive enactment of a rate reduction.
GMT rules apply to Sun Life effective January 1, 2024. Canadian GMT legislation requires the ultimate parent entity of a group to pay top-up tax, on a jurisdiction-by-jurisdiction basis, on profits of its subsidiaries that are taxed below 15%. Some jurisdictions have enacted a QDMTT which requires the GMT top-up tax to be paid locally rather than to the ultimate parent entity's jurisdiction. In response to the GMT rules, Bermuda enacted a CIT regime, including a corporate income tax rate of 15%, which applies to Sun Life effective January 1, 2025. The Bermuda CIT is not a QDMTT for the purposes of GMT. Top-up tax may still be payable by the ultimate parent entity under the IIR, depending on the effective tax rate in Bermuda. Other Sun Life subsidiaries that are currently subject to a statutory tax rate or to a tax regime that could result in taxing profits at a rate below 15% include those in Hong Kong and Ireland, which have both enacted a QDMTT.
| | | | | |
| L. Additional Financial Disclosure | |
1. Selected Annual Information
| | | | | | | | | | | |
| ($ millions, after-tax, unless otherwise stated) | 2025 | 2024 | 2023 |
Total revenue (pre-tax) | 41,900 | 38,633 | 40,774 |
| Common shareholders' net income (loss) | 3,472 | 3,049 | 3,086 |
| Reported basic earnings per share ($) | 6.17 | 5.27 | 5.27 |
| Reported earnings per share (diluted) ($) | 6.15 | 5.26 | 5.26 |
| Total assets | 398,455 | 370,721 | 333,241 |
| | | | | | | | | | | | | | | | | | | | |
82 | December 31, 2025 | Sun Life Financial Inc. | | MANAGEMENT'S DISCUSSION & ANALYSIS | |
2. Items related to Statement of Operations
i. Business Group Summary Statements of Operations
| | | | | | | | | | | | | | | | | | | | | | | |
| | 2025 | 2024 |
| ($ millions) | Canada | U.S. | Asset
Management | Asia | Corporate | Total | Total |
| Insurance revenue | 9,220 | 12,936 | — | 1,826 | — | 23,982 | 22,637 |
| Investment income (loss) | 3,237 | 1,642 | 239 | 3,670 | 71 | 8,859 | 7,415 |
| Fee income | 1,954 | 534 | 6,624 | 353 | (406) | 9,059 | 8,581 |
| Revenue | 14,411 | 15,112 | 6,863 | 5,849 | (335) | 41,900 | 38,633 |
| Insurance service expenses | 7,410 | 12,020 | — | 984 | — | 20,414 | 19,631 |
| Reinsurance contract held net (income) expense | 163 | (115) | — | 46 | — | 94 | (85) |
| Insurance finance (income) expenses from insurance contracts issued | 2,159 | 1,399 | — | 3,229 | — | 6,787 | 5,139 |
| Reinsurance finance (income) expenses | 17 | (105) | — | 19 | — | (69) | (51) |
| (Decrease) increase in investment contract liabilities | 320 | — | — | 3 | — | 323 | 393 |
| Other income | — | — | — | — | — | — | (163) |
| Interest expenses | 172 | 129 | 138 | 87 | — | 526 | 664 |
| Operating expenses and commissions | 2,137 | 1,123 | 5,038 | 591 | 138 | 9,027 | 8,766 |
| Total expenses | 12,378 | 14,451 | 5,176 | 4,959 | 138 | 37,102 | 34,294 |
| Income tax expense (benefit) | 513 | 116 | 428 | 79 | (120) | 1,016 | 1,040 |
| Dividends on preferred shares and distributions on other equity instruments | — | — | — | — | 79 | 79 | 80 |
| Non-controlling interests and participating policyholders' income in net income of subsidiaries | 118 | 25 | 45 | 43 | — | 231 | 170 |
| Reported net income (loss) - Common shareholders | 1,402 | 520 | 1,214 | 768 | (432) | 3,472 | 3,049 |
2025 vs. 2024
Canada
Canada's revenue decreased $1.2 billion in 2025, reflecting lower net investment income primarily from fair value changes of invested assets partially offset by higher insurance revenue.
U.S.
U.S.'s revenue increased $2.0 billion in 2025, driven by higher net investment income primarily from fair value changes of invested assets and higher insurance revenue.
Asset Management
Asset Management's revenue increased $0.2 billion in 2025, driven by higher fee income in SLC Management and MFS.
Asia
Asia's revenue increased $2.3 billion in 2025, driven by higher net investment income primarily from fair value changes of invested assets and higher insurance revenue.
Corporate
Corporate's loss of $0.3 billion in 2025 was in line with the prior year.
ii. Revenue
Revenues are primarily derived from life and health insurance, investment management and annuities, and mutual funds, as well as Corporate investments and earnings on capital not attributed to a strategic business segment. Total revenue is comprised of: (i) insurance revenue; (ii) net investment income; and (iii) fee income. Total revenue excludes investment result for insurance contracts for account of segregated fund holders.
Insurance revenue is comprised of the portion of premiums that cover expected claims and directly attributable expenses in the period, as well as the release of risk adjustment and the amortization of CSM for the period. Insurance revenue excludes the portion of premiums that cover repayment of investment components.
Net investment income is comprised of interest income, dividends, realized and unrealized gains and losses, and other investment income earned on general fund assets. Net investment income, such as net rental income, fair value changes, and foreign exchange gains (losses) are also earned from non-financial instruments. Net investment income can experience volatility arising from the quarterly fluctuation in the value of FVTPL assets and foreign currency changes on assets and liabilities, which may in turn affect the comparability of revenue from
| | | | | | | | | | | | | | | | | | | | |
| MANAGEMENT'S DISCUSSION & ANALYSIS | | Sun Life Financial Inc. | December 31, 2025 | 83 |
period to period. The change in fair value of FVTPL assets is driven largely by market-related factors such as interest rates, credit spreads and equity returns. The debt and equity securities that support insurance contract liabilities are generally designated or classified as FVTPL and changes in fair values of these assets are recorded in net investment income in our Consolidated Statements of Operations. Changes in the fair values of the FVTPL assets supporting insurance contract liabilities are largely offset by a corresponding change in the liabilities excluding those for account of segregated fund holders.
Fee income includes distribution fees, fund management and other asset-based fees, primarily earned in the Asset Management segment. Fee income also includes administrative service and other fees primarily earned in the Canada and U.S. segments. Premium and deposit equivalents from administrative services only ("ASO"), as well as deposits received by the Company on investment contracts such as segregated funds, mutual funds and managed funds are not included in revenue; however, the Company does receive fee income from these contracts, which is included in revenue. Fee income and ASO premium and deposit equivalents are an important part of our business and as a result, revenue does not fully represent sales and other activity taking place during the respective periods.
| | | | | | | | | | | |
| | |
| ($ millions) | | | | 2025 | 2024 |
| Insurance revenue | | | | | |
| Annuities | | | | 2,542 | 2,395 |
| Life insurance | | | | 5,839 | 5,620 |
| Health insurance | | | | 15,601 | 14,622 |
| Total insurance revenue | | | | 23,982 | 22,637 |
| Net Investment income (loss) | | | | 8,859 | 7,415 |
| Fee income | | | | 9,059 | 8,581 |
| Total revenue | | | | 41,900 | 38,633 |
2025 vs. 2024
Total revenue increased by $3.3 billion, driven by higher net investment income primarily from fair value changes of invested assets and higher insurance revenue. Foreign exchange translation increased revenue by $0.5 billion. By business group, revenue was driven by higher net investment income primarily in Asia and the U.S., partially offset by lower net investment income in Canada, and higher insurance revenue primarily in the U.S., Canada, and Asia.
Insurance revenue increased $1.3 billion, primarily driven by higher insurance revenue in the U.S, Canada, and Asia.
Net investment income increased $1.4 billion primarily from fair value changes of invested assets reflecting the impact of interest rates, credit spreads, and equity markets.
Fee income increased $0.5 billion driven by higher fee income in SLC Management, MFS, and in our other asset management and wealth businesses.
iii. Expenses
| | | | | | | | |
| ($ millions) | 2025 | 2024 |
| Expenses | | |
| Insurance service expenses | 20,414 | | 19,631 | |
Reinsurance contract held net (income) expense | 94 | | (85) | |
Insurance finance (income) expenses from insurance contracts issued | 6,787 | | 5,139 | |
Reinsurance finance (income) expenses | (69) | | (51) | |
(Decrease) increase in investment contract liabilities | 323 | | 393 | |
Other income | — | | (163) | |
| Interest expenses | 526 | | 664 | |
| Operating expenses and commissions | 9,027 | | 8,766 | |
| Total expenses | 37,102 | | 34,294 | |
Total expenses of $37.1 billion increased $2.8 billion in 2025 compared to the prior year, primarily driven by higher insurance finance expenses from insurance contracts issued and higher insurance service expenses.
Insurance service expenses of $20.4 billion increased $0.8 billion in 2025 compared to the prior year, primarily driven by increases in the U.S. and Canada.
Reinsurance contract held net expense of $0.1 billion compared to $0.1 billion net income in the prior year, primarily driven by Canada.
Insurance finance expenses from insurance contracts issued of $6.8 billion increased $1.6 billion in 2025 compared to the prior year, primarily driven by Asia and the U.S., partially offset by insurance finance income from insurance contracts issued in Canada.
Other income of $nil in 2025 compared to prior year other income of $163 million. Prior year other income primarily relates to the early termination of a distribution agreement in Asset Management.
Interest expenses of $0.5 billion decreased $0.1 billion in 2025 compared to the prior year, primarily driven by Canada and Asset Management.
| | | | | | | | | | | | | | | | | | | | |
84 | December 31, 2025 | Sun Life Financial Inc. | | MANAGEMENT'S DISCUSSION & ANALYSIS | |
Operating expenses and commissions of $9.0 billion increased $0.3 billion in 2025 compared to the prior year, primarily driven by higher expenses in Asset Management partially offset by lower expenses in Corporate, and $122 million of unfavourable foreign exchange translation. For additional information, see Note 17 of our 2025 Annual Consolidated Financial Statements.
iv. Taxes
Income Taxes
In 2025, we had an income tax expense of $1,016 million on reported net income before taxes of $4,798 million, which resulted in an effective income tax rate of 21.2% (2024 - $1,040 million, $4,339 million, and 24.0%, respectively).
On an underlying basis(1), in 2025, we had an income tax expense of $1,051 million on our underlying net income before taxes of $5,394 million, representing an effective income tax rate of 19.5% which is within our expected range of 16% to 22% (2024 - $834 million, $4,831 million, and 17.3%, respectively).
See section D - Profitability - 5 - Income taxes in this document for additional information on our effective tax rates.
3. Items related to Statements of Financial Position
i. Changes in items related to the Statement of Financial Position
Total general fund assets were $231.9 billion as at December 31, 2025 (December 31, 2024 - $221.9 billion), primarily driven by net fair value growth from changes in interest rates and credit spreads, and business growth and capital activities, partially offset by unfavourable impacts from foreign exchange translation.
The net liabilities balance for insurance contracts issued(2) was $155.6 billion as at December 31, 2025 (December 31, 2024 - $146.9 billion), primarily driven by cash flows and insurance finance income and expenses from insurance contracts issued, partially offset by foreign currency translation and insurance service result.
Total shareholders' equity, including preferred shares and other equity instruments, is $24.5 billion as at December 31, 2025
(December 31, 2024 - $25.6 billion). The change in total shareholders' equity included:
(i)common share dividend payments of $1,975 million;
(ii)a decrease of $1,707 million from the repurchase and cancellation of common shares; and
(iii)unfavourable impacts from foreign exchange translation of $899 million included in OCI; partially offset by
(iv)total shareholders' net income of $3,551 million, before preferred share dividends of $79 million; and
(v)net unrealized gains on FVOCI assets of $255 million.
As at January 30, 2026, SLF Inc. had 553,873,373 common shares, 2,887,502 options to acquire SLF Inc. common shares, and 52,200,000 Class A Shares outstanding.
ii. Off-Balance Sheet Arrangements
In the normal course of business, we are engaged in a variety of financial arrangements. The principal purposes of these arrangements are to earn management fees and additional spread on a matched book of business and to reduce financing costs.
While most of these activities are reflected on our balance sheet with respect to assets and liabilities, certain of them are either not recorded on our balance sheet or are recorded on our balance sheet in amounts that differ from the full contract or notional amounts. The types of off-balance sheet activities we undertake primarily include asset securitizations and securities lending. For more information, see Note 5 in our 2025 Annual Consolidated Financial Statements.
iii. Goodwill and Intangibles Impairment
The Company completed its annual goodwill and indefinite life intangible asset impairment testing in the fourth quarter of 2025. Impairment charges on intangible assets of $88 million were recognized in 2025 (2024 - $201 million), primarily reflecting a customer relationship intangible asset related to the early termination of a U.S. group dental contract. The prior year impact reflects an intangible asset related to bancassurance in Vietnam resulting from changes in regulatory and macro-economic factors.
iv. Commitments, Guarantees, Contingencies and Reinsurance Matters
In the normal course of business, we enter into leasing agreements, outsourcing arrangements and agreements involving indemnities to third parties. We are also engaged in arbitration proceedings from time to time with certain companies that have contracts to provide reinsurance to the Company. Information regarding our commitments, guarantees and contingencies are summarized in Note 22 of our 2025 Annual Consolidated Financial Statements. A table summarizing our significant financial liabilities and contractual obligations can be found in this MD&A in the section K - Risk Management - 9 - Risk Categories - vi - Liquidity Risk.
(1)Our effective income tax rate on underlying net income is calculated using underlying net income and income tax expense associated with underlying net income, which excludes amounts attributable to participating policyholders.
(2)For more information about the changes in the net insurance contract liabilities, refer to Note 10 of the 2025 Annual Consolidated Financial Statements.
| | | | | | | | | | | | | | | | | | | | |
| MANAGEMENT'S DISCUSSION & ANALYSIS | | Sun Life Financial Inc. | December 31, 2025 | 85 |
4. Fourth Quarter 2025 Profitability
The following table reconciles our Common shareholders' net income ("reported net income") and underlying net income in the fourth quarter of 2025 and 2024. All factors discussed in this document that impact underlying net income are also applicable to reported net income. Certain adjustments and notable items also impact the CSM, such as mortality experience and assumption changes; see section
F - Contractual Service Margin in this document for more information.
| | | | | | | | | |
| |
| ($ millions, after-tax) | Q4'25 | | Q4'24 |
Underlying net income (loss) by business type(1): | | | |
Asset management & wealth | 534 | | 486 |
| Group - Health & Protection | 308 | | 266 |
Individual - Protection(2) | 362 | | 310 |
Corporate expenses & other(2) | (110) | | (97) |
Underlying net income(1) | 1,094 | | 965 |
Add: Market-related impacts | (179) | | (179) |
Assumption changes and management actions | (31) | | 11 |
Other adjustments | (162) | | (560) |
| Reported net income - Common shareholders | 722 | | 237 |
Underlying ROE(1) | 19.1% | | 16.5% |
Reported ROE(1) | 12.6% | | 4.0% |
Notable items attributable to reported and underlying net income(1): | | | |
| Mortality | 55 | | 10 |
| Morbidity | 17 | | (22) |
Lapse and other policyholder behaviour | 1 | | — |
| Expenses | (42) | | (10) |
Net Credit(3) | 14 | | (6) |
Other(4) | 24 | | 16 |
(1)Represents a non-IFRS financial measure. For more details, see section M - Non-IFRS Financial Measures in this document. For more information about business types in Sun Life's business groups, see section A - How We Report Our Results in this document.
(2)Effective Q1'25, Regional Office in Asia was moved from the Corporate expenses & other business type to the Individual - Protection business type, reflecting a reporting refinement. Prior period amounts reflect current presentation
(3)Credit includes rating changes on assets measured at FVTPL, and the ECL impact for assets measured at FVOCI. Effective Q1'25, the release of credit risk adjustments, which are reported in Expected Investment Earnings in the Driver of Earnings analysis, are included in this balance. Prior period amounts reflect current presentation.
(4)Other notable items are recorded in Net Insurance Service Result and Net Investment Result in the Drivers of Earnings analysis. For more details, see section M - Non-IFRS Financial Measures in this document.
Quarterly Comparison - Q4'25 vs. Q4'24
Underlying net income(1) of $1,094 million increased $129 million or 13%, driven by:
•Asset management & wealth(1) up $48 million: Improved credit experience and fee income in Canada wealth, higher fee income, net of expenses, in MFS, and higher fee-related earnings, offset by lower net seed investment income, in SLC Management.
•Group - Health & Protection(1) up $42 million: Improved U.S. medical stop-loss morbidity experience and business growth in Canada, partially offset by higher distribution costs in U.S. Group Benefits.
•Individual - Protection(1)(2) up $52 million: Business growth, favourable mortality experience and higher investment earnings in Asia, and favourable mortality experience in the U.S., partially offset by lower contributions from joint ventures in Asia.
•Corporate expenses & other(1)(2) $(13) million increase in net loss reflecting higher financing costs supporting the acquisition of our remaining interests in SLC Management affiliates.
Reported net income of $722 million increased $485 million or 205%, driven by:
•Changes in tax-exempt investment income primarily in Corporate(3) reflecting higher losses in the prior year;
•The increase in underlying net income; and
•The prior year impacts from an impairment charge of $186 million on an intangible asset related to bancassurance in Vietnam and a provision in U.S. Dental; partially offset by
•Unfavourable ACMA impacts.
•Market-related impacts were in line with the prior year as favourable equity market impacts and improved real estate experience were offset by unfavourable other market-related and interest rate impacts.
Foreign exchange translation led to a decrease of $3 million in underlying net income and had no significant impact to the change in reported net income.
(1)Refer to section D - Profitability in this document for more information on notable items attributable to reported and underlying net income items and section M - Non-IFRS Financial Measures in this document for a reconciliation between reported net income and underlying net income. For more information about the business types in Sun Life's operating segments/business groups, see section A - How We Report Our Results in this document.
(2)Effective Q1'25, Regional Office in Asia was moved from the Corporate expenses & other business type to the Individual - Protection business type, reflecting a reporting refinement. Prior period amounts reflect current presentation.
(3)Q4'25 results reflect lower than expected tax-exempt investment income of $49 million (Q4'24 - lower than expected tax-exempt investment income of $234 million).
| | | | | | | | | | | | | | | | | | | | |
86 | December 31, 2025 | Sun Life Financial Inc. | | MANAGEMENT'S DISCUSSION & ANALYSIS | |
The Q4'25 effective income tax rate(1) on underlying net income and reported net income was 21.3% and 28.1% respectively.
Performance by Business Group - Fourth Quarter
We manage our operations and report our financial results in five business segments. The following section describes the operations and financial performance of Asset Management, Canada, U.S., Asia and Corporate.
The following table sets out the differences between our underlying net income (loss) and reported net income (loss) by business group.
| | | | | | | | | | | | | | | | | | | | |
| Q4'25 |
| ($ millions) | Asset
Management | Canada | U.S. | Asia | Corporate | Total |
| Underlying net income (loss) | 370 | 417 | 210 | 207 | (110) | 1,094 |
| Add: Market-related impacts (pre-tax) | (22) | (108) | (21) | (46) | (13) | (210) |
| ACMA (pre-tax) | — | (8) | (6) | (21) | — | (35) |
| Other adjustments (pre-tax) | (49) | (9) | (69) | (17) | (5) | (149) |
Tax expense (benefit) | 19 | 15 | 19 | 8 | (39) | 22 |
| Reported net income (loss) - Common shareholders | 318 | 307 | 133 | 131 | (167) | 722 |
| |
| | | | | | |
| | | | | | |
| | | | | | |
| | | | | | |
| | | | | | |
| | | | | | |
| Q4'24 |
| Underlying net income (loss) | 360 | 366 | 161 | 175 | (97) | 965 |
Add: Market-related impacts (pre-tax) | (18) | (142) | (74) | 27 | (14) | (221) |
| ACMA (pre-tax) | — | (1) | (1) | 15 | — | 13 |
| Other adjustments (pre-tax) | (34) | (8) | (143) | (193) | — | (378) |
Tax expense (benefit) | 18 | 38 | 50 | (13) | (235) | (142) |
| Reported net income (loss) - Common shareholders | 326 | 253 | (7) | 11 | (346) | 237 |
Quarterly Comparison - Q4'25 vs. Q4'24
Asset Management
Asset Management underlying net income of $370 million increased $10 million or 3% driven by:
•MFS up $11 million (up $8 million on a U.S. dollar basis): Higher fee income from higher ANA partially offset by higher expenses. Pre-tax net operating profit margin(2) was 40.0% for Q4'25, compared to 40.5% in the prior year.
•SLC Management down $1 million: Higher fee-related earnings offset by lower net seed investment income. Fee-related earnings(2) increased 25% driven by capital raising and higher property management fees. Fee-related earnings margin(2) was 27.5% for Q4'25, compared to 23.0% in the prior year.
Reported net income of $318 million decreased $8 million or 2%.
Foreign exchange translation led to a decrease of $1 million in underlying net income and reported net income, respectively.
Canada
Underlying net income of $417 million increased $51 million or 14%, driven by:
•Asset management & wealth up $41 million: Improved credit experience and higher fee income from higher AUM.
•Group - Health & Protection up $2 million: Business growth and favourable mortality experience mostly offset by less favourable morbidity experience.
•Individual - Protection up $8 million: Favourable insurance experience.
Reported net income of $307 million increased $54 million or 21%, driven by the increase in underlying net income and market-related impacts primarily reflecting improved interest rate impacts partially offset by unfavourable other market-related impacts.
(1)Our effective income tax rate on reported net income is calculated using Total income (loss) before income taxes, as detailed in Note 19 in our 2025 Annual Consolidated Financial Statements. Our effective income tax rate on underlying net income is calculated using pre-tax underlying net income, as detailed in section M - Non-IFRS Financial Measures in this document, and the associated income tax expense.
(2)Represents a non-IFRS financial measure. For more details, see section M - Non-IFRS Financial Measures in this document.
| | | | | | | | | | | | | | | | | | | | |
| MANAGEMENT'S DISCUSSION & ANALYSIS | | Sun Life Financial Inc. | December 31, 2025 | 87 |
U.S.
Underlying net income of US$150 million increased US$35 million or 30%, driven by:
•Group - Health & Protection up US$27 million: Higher Group Benefits results primarily reflecting improved medical stop-loss morbidity experience, partially offset by higher distribution costs.
•Individual - Protection up US$8 million: Favourable mortality experience.
Reported net income was US$93 million compared to reported net loss of US$1 million in prior year, driven by the increase in underlying net income, market-related impacts primarily reflecting improved interest rate impacts, and a prior year provision in Dental, partially offset by DentaQuest acquisition, integration and restructuring costs.
Foreign exchange translation had no significant impact to the change in underlying net income and reported net income, respectively.
Asia
Underlying net income of $207 million increased $32 million or 18%, driven by:
•Asset management & wealth down $3 million: Lower fee income related to the transitioning of the administration business to the centralized eMPF platform in Hong Kong.
•Individual - Protection(1) up $35 million: Continued strong sales momentum and in-force business growth across most markets, favourable mortality experience in High Net Worth, higher investment earnings, and lower expenses, partially offset by lower contributions from joint ventures and unfavourable credit experience.
Reported net income of $131 million increased $120 million, driven by the increase in underlying net income and a prior year impairment charge on an intangible asset related to bancassurance in Vietnam, partially offset by unfavourable market-related and ACMA impacts. The market-related impacts were primarily from unfavourable interest rate and other market-related impacts, partially offset by improved equity market impacts.
Foreign exchange translation led to a decrease of $2 million in underlying net income and a decrease of $1 million in reported net income.
Corporate
Underlying net loss was $110 million, compared to underlying net loss of $97 million in the prior year, reflecting higher financing costs supporting the acquisition of our remaining interests in SLC Management affiliates.
Reported net loss was $167 million compared to reported net loss of $346 million in the prior year, driven by changes in tax-exempt investment income(2) reflecting higher losses in the prior year, partially offset by the change in underlying net loss.
Foreign exchange translation had no significant impact to the change in underlying net income and led to an increase of $3 million in reported net income.
5. Fourth Quarter 2025 Growth
Revenue of $8.9 billion increased $1.4 billion compared to the same period in 2024, primarily reflecting fair value changes in invested assets driven by changes in interest rates. Foreign exchange translation decreased revenue by $24 million.
(1)Effective Q1'25, Regional Office in Asia was moved from the Corporate expenses & other business type to the Individual - Protection business type, reflecting a reporting refinement. Prior period amounts reflect current presentation.
(2)Q4'25 results reflect lower than expected tax-exempt investment income of $44 million (Q4'24 - lower than expected tax-exempt investment income of $234 million).
| | | | | | | | | | | | | | | | | | | | |
88 | December 31, 2025 | Sun Life Financial Inc. | | MANAGEMENT'S DISCUSSION & ANALYSIS | |
6. Quarterly Financial Results
The following table provides a summary of our results for the eight most recently completed quarters. A more complete discussion of our historical quarterly results can be found in our Interim and Annual MD&A for the relevant periods.
| | | | | | | | | | | | | | | | | | | | | | | | | | |
| Quarterly results |
| ($ millions, unless otherwise noted) | Q4'25 | Q3'25 | Q2'25 | Q1'25 | Q4'24 | Q3'24 | Q2'24 | Q1'24 |
| Total revenue | 8,929 | 12,421 | 9,199 | 11,351 | 7,509 | 15,333 | 8,916 | 6,875 |
| Common shareholders' net income (loss) |
Underlying net income(1) | 1,094 | 1,047 | 1,015 | 1,045 | 965 | 1,016 | 1,000 | 875 |
Add: Market-related impacts | (179) | (14) | (166) | (22) | (179) | 29 | (153) | (70) |
Assumption changes and management actions | (31) | (13) | 3 | (4) | 11 | 36 | 16 | (7) |
Other adjustments | (162) | 86 | (136) | (91) | (560) | 267 | (217) | 20 |
Reported net income - Common shareholder | 722 | 1,106 | 716 | 928 | 237 | 1,348 | 646 | 818 |
| Diluted EPS ($) |
Underlying(1) | 1.96 | 1.86 | 1.79 | 1.82 | 1.68 | 1.76 | 1.72 | 1.50 |
Reported | 1.29 | 1.97 | 1.26 | 1.62 | 0.41 | 2.33 | 1.11 | 1.40 |
| Basic reported EPS ($) |
| Reported | 1.30 | 1.97 | 1.27 | 1.62 | 0.41 | 2.33 | 1.11 | 1.40 |
Underlying net income (loss) by segment(1) |
| Asset Management | 370 | 350 | 300 | 351 | 360 | 344 | 307 | 282 |
| Canada | 417 | 422 | 379 | 376 | 366 | 375 | 402 | 310 |
| U.S. | 210 | 147 | 195 | 218 | 161 | 219 | 204 | 189 |
| Asia | 207 | 226 | 206 | 197 | 175 | 170 | 179 | 177 |
| Corporate | (110) | (98) | (65) | (97) | (97) | (92) | (92) | (83) |
Total underlying net income (loss)(1) | 1,094 | 1,047 | 1,015 | 1,045 | 965 | 1,016 | 1,000 | 875 |
Add: Market-related impacts (pre-tax) | (210) | (26) | (187) | (28) | (221) | (12) | (169) | (26) |
Assumption changes and management actions (pre-tax) | (35) | (18) | 4 | (5) | 13 | 63 | 18 | (8) |
Other adjustments (pre-tax) | (149) | 67 | (181) | (113) | (378) | 246 | (254) | 41 |
| Tax expense (benefit) on above items | 22 | 36 | 65 | 29 | (142) | 35 | 51 | (64) |
Reported net income (loss) by segment - Common shareholders |
Asset Management | 318 | 316 | 254 | 326 | 326 | 644 | 274 | 284 |
Canada | 307 | 414 | 330 | 351 | 253 | 382 | 292 | 290 |
U.S. | 133 | 98 | 103 | 186 | (7) | 339 | 127 | 97 |
Asia | 131 | 373 | 98 | 166 | 11 | 32 | 151 | 235 |
Corporate | (167) | (95) | (69) | (101) | (346) | (49) | (198) | (88) |
Total reported net income (loss) - Common shareholders | 722 | 1,106 | 716 | 928 | 237 | 1,348 | 646 | 818 |
(1)Represents a non-IFRS financial measure. For more details, see section M - Non-IFRS Financial Measures in this document.
Third Quarter 2025
Underlying net income of $1,047 million increased $31 million or 3%, driven by:
•Asset management & wealth up $26 million: Improved credit experience and higher fee income from higher AUM in Canada, and higher net seed investment income in SLC Management.
•Group - Health & Protection down $61 million: Unfavourable insurance experience across Group Benefits and Dental in the U.S., partially offset by business growth and favourable insurance experience in Canada.
•Individual - Protection up $72 million: Business growth and favourable mortality experience in Asia, higher contributions from our India joint venture, and higher investment earnings in Canada.
•Corporate expenses & other $(6) million increase in net loss reflecting timing of strategic investment spend.
Reported net income of $1,106 million decreased $242 million or 18% from prior year, driven by the prior year decrease in SLC Management's estimated acquisition-related liabilities, unfavourable ACMA impacts and market-related impacts reflecting unfavourable other market-related impacts, primarily from Asia, and real estate experience, partially offset by favourable interest rate impacts, partially offset by a gain from increased ownership interest in Bowtie and the increase in underlying net income.
| | | | | | | | | | | | | | | | | | | | |
| MANAGEMENT'S DISCUSSION & ANALYSIS | | Sun Life Financial Inc. | December 31, 2025 | 89 |
Second Quarter 2025
Underlying net income of $1,015 million increased $15 million or 2%, driven by:
•Asset management & wealth was in line with the prior year as higher fee-related earnings in SLC Management reflecting strong capital raising, and higher fee income in Asia from higher AUM, was offset by lower fee income in MFS from lower ANA, and lower investment contributions from lower yields.
•Group - Health & Protection up $21 million: Improved U.S. Dental results primarily reflecting Medicaid repricing, higher fee income and management actions, and favourable mortality experience in Canada.
•Individual - Protection down $33 million: Higher expenses in Asia primarily reflecting continued investments in the business, and unfavourable mortality experience in Canada and the U.S., partially offset by business growth in Asia.
•Corporate expenses & other $27 million decrease in net loss primarily driven by timing of strategic investment spend, and lower incentive compensation.
Reported net income of $716 million increased $70 million or 11% from prior year, driven by a prior year restructuring charge of $108 million in Corporate and the increase in underlying net income partially offset by an impairment charge of $61 million on a customer relationship intangible asset from the early termination of a U.S. group dental contract and unfavourable other market-related impacts driven across Asia and Canada, partially offset by favourable interest rate impacts primarily from non-parallel curve changes in Canada, and improved real estate experience.
First Quarter 2025
Underlying net income of $1,045 million increased $170 million or 19% from prior year, driven by:
•Asset management & wealth up $79 million: Higher fee-related earnings from catch-up fees and strong performance of net seed investment income in SLC Management, and higher fee income in Canada and Asia.
•Group - Health & Protection up $50 million: Business growth and favourable protection experience in Canada primarily from morbidity and mortality experience, and higher U.S. Dental results, partially offset by moderately unfavourable morbidity experience in U.S. medical stop-loss.
•Individual - Protection up $55 million: Business growth and higher contributions from joint ventures in Asia, and improved protection experience in Canada largely from mortality experience.
•Corporate expenses & other $(14) million increase in net loss primarily reflecting lower investment income from surplus assets.
Reported net income of $928 million increased $110 million or 13% from prior year, driven by the increase in underlying net income, market-related impacts primarily reflecting improved real estate experience and favourable interest rate impacts partially offset by unfavourable equity market impacts, and fair value changes in MFS shares owned by management, partially offset by prior year gains on partial sale of ABSLAMC and the early termination of a distribution agreement in Asset Management.
Fourth Quarter 2024
Underlying net income of $965 million decreased $18 million or 2%, driven by:
•Asset management & wealth up $47 million: Higher fee income in Asset Management, Canada, and Asia, partially offset by lower net investment results in Canada.
•Group - Health & Protection down $99 million: Unfavourable morbidity experience in U.S. medical stop-loss and less favourable morbidity experience in Canada, partially offset by business growth in Canada.
•Individual - Protection up $55 million: Improved protection experience in Asia and Canada and higher contributions from joint ventures in Asia.
•Corporate expenses & other $(21) million increase in net loss primarily reflecting higher expenses largely from continued investments in our Asia businesses and incentive compensation in Asia.
Reported net income of $237 million decreased $512 million or 68%, driven by lower tax-exempt investment income of $234 million in Corporate, an impairment charge of $186 million on an intangible asset related to bancassurance in Vietnam reflecting updates resulting from changes in regulatory and macro-economic factors, and a non-recurring provision in U.S. Dental, partially offset by market-related impacts primarily reflecting improved real estate experience.
Third Quarter 2024
Underlying net income of $1,016 million increased $86 million or 9%, driven by:
•Asset management & wealth up $17 million: Higher fee income in Asset Management, Asia, and Canada, partially offset by unfavourable credit experience in Canada.
•Group - Health & Protection up $60 million: Strong business growth in U.S. Group Benefits and Canada, higher fee-based income in Canada, and improved group life mortality experience in the U.S., partially offset by lower U.S. Dental results.
•Individual - Protection up $9 million: Business growth in Asia and Canada partially offset by unfavourable mortality experience in Asia.
•Corporate expenses & other were in line with prior year.
Reported net income of $1,348 million increased $477 million or 55%, driven by a decrease in SLC Management's estimated acquisition-related liabilities and the increase in underlying net income. Favourable equity market impacts and improved real estate experience were offset by interest rate impacts.
| | | | | | | | | | | | | | | | | | | | |
90 | December 31, 2025 | Sun Life Financial Inc. | | MANAGEMENT'S DISCUSSION & ANALYSIS | |
Second Quarter 2024
Underlying net income of $1,000 million increased $80 million or 9%, driven by:
•Asset management & wealth up $36 million: Higher fee income in Asset Management, Canada, and Asia, partially offset by higher expenses in Asset Management.
•Group - Health & Protection down $55 million: Lower results in U.S. Dental primarily reflecting the impact of Medicaid redeterminations and related claims following the end of the Public Health Emergency, less favourable morbidity experience in Canada, and unfavourable morbidity experience in U.S. medical stop-loss, partially offset by strong business growth in U.S. Group Benefits and Canada.
•Individual - Protection up $82 million: Business growth in Asia and Canada, and favourable mortality experience in Canada and the U.S.
•Corporate expenses & other $17 million decrease in net loss driven by lower operating expenses and financing costs.
Reported net income of $646 million decreased $14 million or 2%. Financial discipline remains core to our Client Impact Strategy and business. In Q2'24, we recorded a restructuring charge of $138 million (post-tax $108 million) reflecting actions taken to improve productivity and drive earnings growth at the higher-end of our Medium-Term Financial Objectives. We expect these actions to result in annual savings of approximately $200 million (pre-tax) by 2026. The restructuring charge is offset by the increase in underlying net income; and market-related impacts primarily reflecting interest rates and real estate investments.
First Quarter 2024
Underlying net income of $875 million decreased $20 million from prior year, driven by:
•Asset management & wealth down $3 million: Higher fee income offset by higher expenses in Asset Management, as well as lower net seed investment income in SLC Management.
•Group - Health & Protection down $23 million: Less favourable morbidity experience in U.S. medical stop-loss and lower results in U.S. Dental primarily reflecting the impact of Medicaid redeterminations following the end of the Public Health Emergency, partially offset by strong revenue growth in U.S. Group Benefits, and business growth and improved disability experience in Canada.
•Individual - Protection down $13 million: Lower earnings due to the sale of Sun Life UK partially offset by business growth in Asia.
•Corporate expenses & other $19 million decrease in net loss driven by lower financing costs.
Reported net income of $818 million increased $12 million from prior year, driven by the gains on partial sale of ABSLAMC and the early termination of a distribution agreement in Asset Management, largely offset by the prior year gain on sale of the sponsored markets business in Canada, fair value changes in MFS shares owned by management, and the decrease in underlying net income. Unfavourable real estate experience was mostly offset by favourable interest rate impacts.
| | | | | | | | | | | | | | | | | | | | |
| MANAGEMENT'S DISCUSSION & ANALYSIS | | Sun Life Financial Inc. | December 31, 2025 | 91 |
| | | | | |
| M. Non-IFRS Financial Measures |
1. Common Shareholders' View of Reported Net Income
The following table provides the reconciliation of the Drivers of Earnings ("DOE") analysis to the Statement of Operations total net income. The DOE analysis provides additional detail on the sources of earnings, primarily for protection and health businesses, and explains the actual results compared to the longer term expectations. The underlying DOE and reported DOE are both presented on a common shareholders' basis by removing the allocations to participating policyholders.
| | | | | | | | | | | | | | | | | | | | |
| |
| ($ millions) | 2025 |
| Statement of Operations | Underlying DOE(1) | Non-underlying adjustments(1) | Common Shareholders' Reported DOE(2)(3) | Adjustment for: | Reported
(per IFRS) |
Par(2) | Net(3) |
| Net insurance service result | 3,253 | | (28) | 3,225 | | 313 | | (64) | 3,474 | |
| Net investment result | 1,715 | | (224) | 1,491 | | 20 | | 307 | 1,818 | |
Assumption changes and management actions(3) | | (54) | | (54) | | — | | 54 | |
| Fee Income: | | | | | | |
| Asset Management | 1,906 | | (232) | 1,674 | | | (1,674) | |
| Other fee income | 422 | | — | | 422 | | (22) | 8,659 | | 9,059 | |
| Fee income | | | | | | 9,059 | |
| Other expenses | (1,902) | (374) | | (2,276) | — | | (7,277) | (9,553) |
| Income before taxes | 5,394 | | (912) | 4,482 | | 311 | | 5 | | 4,798 | |
| Income tax (expense) benefit | (1,051) | 152 | | (899) | (117) | — | (1,016) |
| Total net income | 4,343 | | (760) | 3,583 | | 194 | | 5 | | 3,782 | |
Allocated to Participating and NCI(4) | (63) | 31 | | (32) | (194) | (5) | (231) |
Dividends and Distributions(5) | (79) | | (79) | — | | — | | (79) |
Underlying net income(1) | 4,201 | | | | | | |
| Reported net income - Common shareholders | | (729) | 3,472 | | — | | — | | 3,472 | |
| | | | | | | | | | | | | | | | | | | | |
| |
| ($ millions) | 2024 |
| Statement of Operations | Underlying DOE(1) | Non-underlying adjustments(1) | Common Shareholders' Reported DOE(2)(3) | Adjustment for: | Reported
(per IFRS) |
Par(2) | Net(3) |
| Net insurance service result | 2,996 | | — | 2,996 | | 243 | (148) | 3,091 | |
| Net investment result | 1,677 | | (310) | 1,367 | | (97) | | 664 | 1,934 | |
Assumption changes and management actions(3) | | 86 | 86 | — | | (86) | |
| Fee income: | | | | | | |
| Asset Management | 1,762 | | 250 | 2,012 | | | (2,012) | |
| Other fee income | 321 | | — | | 321 | | (18) | 8,278 | | 8,581 | |
| Fee income | | | | | | 8,581 | |
| Other expenses | (1,925) | (701) | (2,626) | — | | (6,641) | (9,267) |
| Income before taxes | 4,831 | | (675) | 4,156 | | 128 | | 55 | 4,339 | |
| Income tax (expense) benefit | (834) | (120) | (954) | (86) | — | (1,040) |
| Total net income | 3,997 | | (795) | 3,202 | | 42 | | 55 | | 3,299 | |
Allocated to Participating and NCI(4) | (61) | (12) | | (73) | (42) | (55) | (170) |
Dividends and Distributions(5) | (80) | — | | (80) | — | | — | | (80) |
Underlying net income(1) | 3,856 | | | | | | |
| Reported net income - Common shareholders | | (807) | 3,049 | | — | | — | | 3,049 | |
(1)For a breakdown of non-underlying adjustments made to arrive at underlying net income as well as the underlying DOE analysis, see the heading "Underlying Net Income and Underlying EPS" below.
(2)Removes the components attributable to the participating policyholders.
(3)Certain amounts within the DOE are presented on a net basis to reflect how the business is managed, compared to a gross basis in the Consolidated Financial Statements. For more details, refer to "Drivers of Earnings" in section 3 - Additional Non-IFRS Financial Measures below. Further, in this document, the reported net income impact of ACMA excludes amounts attributable to participating policyholders and includes non-liability impacts. In contrast, Note 10.B.v of the 2025 Annual Consolidated Financial Statements shows the pre-tax net income impacts of method and assumption changes, and CSM Impacts include amounts attributable to participating policyholders.
(4)Allocated to equity in the participating account and attributable to NCI.
(5)Dividends on preferred shares and distributions on other equity instruments.
| | | | | | | | | | | | | | | | | | | | |
92 | December 31, 2025 | Sun Life Financial Inc. | | MANAGEMENT'S DISCUSSION & ANALYSIS | |
2. Underlying Net Income and Underlying EPS
Underlying net income is a non-IFRS financial measure that assists in understanding Sun Life's business performance by making certain adjustments to IFRS income. Underlying net income, along with common shareholders’ net income (Reported net income), is used as a basis for management planning, and is also a key measure in our employee incentive compensation programs. This measure reflects management's view of the underlying business performance of the company and long-term earnings potential. For example, due to the longer term nature of our individual protection businesses, market movements related to interest rates, equity markets and investment properties can have a significant impact on reported net income in the reporting period. However, these impacts are not necessarily realized, and may never be realized, if markets move in the opposite direction in subsequent periods or in the case of interest rates, the fixed income investment is held to maturity.
Underlying net income removes the impact of the following items from reported net income:
•Market-related impacts reflecting the after-tax difference in actual versus expected market movements, including:
i)Net interest impact from risk-free rate, credit spread, swap spread movements, and other impacts, reflecting accounting mismatches between assets and liabilities:
a.Differences arising from fair value changes(1) of fixed income assets (including derivatives) measured at FVTPL supporting insurance contracts, compared to fair value changes of the liabilities(2);
b.Fair value changes of fixed income assets (including derivatives) measured at FVTPL supporting our investment contract liability and surplus portfolios(3); and
c.Tax-exempt investment(4) income above or below expected long-term tax savings relating to our Canadian multi-national insurance operations.
ii)Non-fixed income investments where the weighted average expected return is approximately 2% per quarter, including:
a.Equity investments (including derivatives) supporting insurance contracts and surplus portfolios; and
b.Investment properties supporting insurance contracts and surplus portfolios.
•ACMA – captures the impact of method and assumption changes, and management actions on insurance and reinsurance contracts.
•Other adjustments:
i)MFS shares owned by management – this adjustment removes the change in fair value and other activity related to MFS common shares owned by management.
ii)Acquisition, integration, and restructuring – expense and income related to acquisition or disposal of a business. Also includes expenses related to restructuring activities.
iii)Intangible asset amortization – removes the amortization expense associated with finite life intangible assets arising from acquisitions or business combinations excluding amortization of software and distribution agreements.
iv)Other – represents items that are unusual or exceptional in nature which management believes are not representative of the long-term performance of the Company.
Underlying EPS (diluted). This measure is used in comparing the profitability across multiple periods and is calculated by dividing underlying net income by weighted average common shares outstanding for diluted EPS, excluding the dilutive impact of convertible instruments. For additional information about the underlying net income, see above. For additional information about the composition of the EPS, please refer to Note 25 of our 2025 Annual Consolidated Financial Statements. For additional information about the SLEECS, please refer to Note 12 of our 2025 Annual Consolidated Financial Statements.
(1)For fixed income assets, Underlying Net Income includes credit experience from rating changes on assets measured at FVTPL, and the ECL impact for assets measured at FVOCI.
(2)Underlying net income is based on observable discount curves and exchange rates at the beginning of the period.
(3)Underlying net income for earnings on surplus includes realized gains (losses) on fixed income assets classified as FVOCI.
(4)Q4'25 and Q4'24 balances are isolated in Other within Other adjustments.
| | | | | | | | | | | | | | | | | | | | |
| MANAGEMENT'S DISCUSSION & ANALYSIS | | Sun Life Financial Inc. | December 31, 2025 | 93 |
The following table sets out the post-tax amounts that were excluded from our underlying net income (loss) and underlying EPS and provides a reconciliation to our reported net income and EPS based on IFRS.
| | | | | | | | | | | |
| | |
Reconciliations of Select Net Income Measures | | | | | |
| ($ millions, after-tax) | | | | 2025 | 2024 |
| Underlying net income | | | | 4,201 | 3,856 |
Market-related impacts | | | | | |
| Equity market impacts | | | | (14) | 25 |
Interest rate impacts(1) | | | | (148) | (60) |
Impacts of changes in the fair value of investment properties (real estate experience) | | | | (219) | (338) |
| Add: Market-related impacts | | | | (381) | (373) |
Add: Assumption changes and management actions | | | | (45) | 56 |
| Other adjustments | | | | | |
MFS shares owned by management | | | | 2 | (22) |
Acquisition, integration and restructuring(2)(3)(4)(5)(6)(7) | | | | (27) | 140 |
Intangible asset amortization(8)(9) | | | | (215) | (332) |
Other(10)(11)(12)(13)(14) | | | | (63) | (276) |
| Add: Total of other adjustments | | | | (303) | (490) |
| Reported net income - Common shareholders | | | | 3,472 | 3,049 |
| Underlying EPS (diluted) ($) | | | | 7.45 | 6.66 |
| Add: Market-related impacts ($) | | | | (0.68) | (0.65) |
| Assumption changes and management actions ($) | | | | (0.08) | 0.10 |
MFS shares owned by management ($) | | | | — | (0.04) |
| Acquisition, integration and restructuring ($) | | | | (0.05) | 0.24 |
| Intangible asset amortization ($) | | | | (0.38) | (0.57) |
| Other ($) | | | | (0.12) | (0.48) |
| Impact of convertible securities on diluted EPS ($) | | | | 0.01 | — |
| Reported EPS (diluted) ($) | | | | 6.15 | 5.26 |
(1)Our results are sensitive to long term interest rates given the nature of our business and to non-parallel yield curve movements (for example flattening, inversion, steepening, etc.).
(2)Amounts relate to acquisition costs for our SLC Management affiliates, BentallGreenOak, InfraRed Capital Partners, Crescent Capital Group LP and Advisors Asset Management, Inc, which include the unwinding of the discount for Other financial liabilities of $56 million in 2025 ( 2024- $76 million).
(3)Reflects an increase of $4 million in estimated future payments for options to purchase the remaining ownership interests of SLC Management affiliates in 2025 (2024 - a decrease of $344 million). For additional information, refer to Note 5 and Note 11 of our 2025 Annual Consolidated Financial Statements.
(4)Includes acquisition, integration and restructuring costs associated with DentaQuest, acquired on June 1, 2022.
(5)To meet regulatory obligations, in Q1'24, we sold 6.3% of our ownership interest in ABSLAMC, generating a gain of $84 million. As a result of the transaction, our ownership interest in ABSLAMC was reduced from 36.5% to 30.2% for gross proceeds of $136 million. Subsequently in Q2'24, we sold an additional 0.2% of our ownership interest.
(6)Q2'24 includes a restructuring charge of $108 million in the Corporate business group.
(7)On July 15, 2025, we acquired an additional interest in Bowtie Life Insurance Company Limited ("Bowtie"), which increased our ownership interest, excluding dilution, by approximately 11% and resulted in a total ownership interest of 55.8%. Total consideration was cash of $55 million. Our previously held interest in Bowtie was remeasured to its fair value, which resulted in a gain of $176 million recognized in reported net income in Q3'25 ("gain from increased ownership interest in Bowtie"). For additional information, refer to Note 3 of our 2025 Annual Consolidated Financial Statements.
(8)Includes an impairment charge of $186 million on an intangible asset related to bancassurance in Vietnam reflecting updates resulting from changes in regulatory and macro-economic factors in Q4'24.
(9)Includes an impairment charge of $61 million on a customer relationship intangible asset from the early termination of a U.S. group dental contract in Q2'25.
(10)Includes the early termination of a distribution agreement in Asset Management in Q1'24.
(11)Includes a Pillar Two global minimum tax adjustment in Q2'24. For additional information, refer to Note 19 of our 2024 Annual Consolidated Financial Statements and section D - Profitability in the 2024 Annual MD&A.
(12)Includes a non-recurring provision in U.S. Dental in Q4'24.
(13)Includes lower than expected tax-exempt investment income of $49 million in Q4'25 (Q4'24 - lower than expected tax-exempt investment income of $234 million).
(14)Includes a tax impact in MFS in Q4'25 from changes to U.S. tax legislation. For more details, see section D - Profitability in this document.
| | | | | | | | | | | | | | | | | | | | |
94 | December 31, 2025 | Sun Life Financial Inc. | | MANAGEMENT'S DISCUSSION & ANALYSIS | |
The following table shows the pre-tax amount of underlying net income adjustments:
| | | | | | | | | | | |
| | |
| ($ millions) | | | | 2025 | 2024 |
| Underlying net income (after-tax) | | | | 4,201 | 3,856 |
| Underlying net income adjustments (pre-tax): | | | | | |
Add: Market-related impacts | | | | (451) | (428) |
Assumption changes and management actions(1) | | | | (54) | 86 |
| Other adjustments | | | | (376) | (345) |
| Total underlying net income adjustments (pre-tax) | | | | (881) | (687) |
| Add: Taxes related to underlying net income adjustments | | | | 152 | (120) |
| Reported net income - Common shareholders (after-tax) | | | | 3,472 | 3,049 |
(1)In this document, the reported net income impact of ACMA excludes amounts attributable to participating policyholders and includes non-liability impacts. In contrast, Note 10.B.v of the 2025 Annual Consolidated Financial Statements shows the pre-tax net income impacts of method and assumption changes, and CSM Impacts include amounts attributable to participating policyholders.
Taxes related to underlying net income adjustments may vary from the expected effective tax rate range reflecting the mix of business based on the Company's international operations and other tax-related adjustments.
3. Additional Non-IFRS Financial Measures
Management also uses the following non-IFRS financial measures:
After-tax profit margin for U.S. Group Benefits. This ratio expresses U.S. Group Benefits underlying net income as a percentage of net premiums. It assists in explaining our results from period to period and measures profitability. This ratio is calculated by dividing underlying net income (loss) by net premiums for the trailing four quarters. There is no directly comparable IFRS measure.
Assets under administration ("AUA"). AUA represents Client assets for which Sun Life provides administrative services. In Canada, AUA includes mutual fund dealers' assets in Individual Wealth and administrative services assets in Group Retirement Services. In Asia, AUA includes administrative services assets in China and Hong Kong. In SLC Management, AUA includes assets distributed mostly by SLC Management's affiliate, Advisors Asset Management Inc. There is no directly comparable measure under IFRS.
Assets under management. AUM is a non-IFRS financial measure that indicates the size of our Company's assets across asset management, wealth, and insurance. There is no standardized financial measure under IFRS. In addition to the most directly comparable IFRS measures, which are the balance of General funds and Segregated funds on our Statements of Financial Position, AUM also includes Third-party AUM and Consolidation adjustments. "Consolidation adjustments" is presented separately as consolidation adjustments apply to all components of total AUM.
AUM not yet earning fees. This measure represents the committed uninvested capital portion of total AUM not currently earning management fees. The amount depends on the specific terms and conditions of each fund. There is no directly comparable IFRS measure.
Capital raising. This measure consists of increases in SLC Management's commitments from fund raising activities for all real estate, infrastructure and alternative credit Clients excluding leverage. Investment-grade fixed income capital raising consists of sales made to new Clients. There is no directly comparable IFRS measure.
Cash and other liquid assets. This measure is comprised of cash, cash equivalents, short-term investments, and publicly traded securities, net of loans related to acquisitions and short-term loans that are held at SLF Inc. (the ultimate parent company), and its wholly owned holding companies. This measure is a key consideration of available funds for capital re-deployment to support business growth.
| | | | | | | | |
| ($ millions) | As at December 31, 2025 | As at December 31, 2024 |
| Cash and other liquid assets (held at SLF Inc. and its wholly owned holding companies): | | |
| Cash, cash equivalents & short-term securities | 1,859 | 479 |
Debt securities(1) | 537 | 780 |
Equity securities(2) | — | 112 |
| Sub-total | 2,396 | 1,371 |
Less: Loans related to acquisitions and short-term loans(3) (held at SLF Inc. and its wholly owned holding companies) | — | (17) |
| Cash and other liquid assets (held at SLF Inc. and its wholly owned holding companies) | 2,396 | 1,354 |
(1)Includes publicly traded bonds.
(2)Includes exchange traded fund ("ETF") Investments.
(3)Includes drawdowns from credit facilities to manage timing of cash flows.
Constant currency. We remove the impacts of foreign exchange translation from certain IFRS and non-IFRS measures to assist in comparing our results from period to period. The impacts of foreign exchange translation is approximated by using the foreign exchange rates in effect during the comparative period, using the average or period end foreign exchange rates, as appropriate.
| | | | | | | | | | | | | | | | | | | | |
| MANAGEMENT'S DISCUSSION & ANALYSIS | | Sun Life Financial Inc. | December 31, 2025 | 95 |
CSM Movement Analysis includes certain non-IFRS financial measures, detailed below, and also presents certain measures on a net basis to reflect how the business is managed, compared to a gross basis in the Consolidated Financial Statements. Examples include i) The impacts of insurance contracts issued is presented net of reinsurance; ii) Impact of new business is presented net of acquisition expense gain/loss; and iii) Certain methodology changes are presented as an impact of change in assumptions, whereas the Consolidated Financial Statement presentation is a contract modification.
•Organic CSM Movement is comprised of the Impact of new insurance business, Expected movements from asset returns & locked-in rates, Insurance experience gains/losses, and CSM recognized for services provided.
•Impact of new insurance business on CSM, also referred to as "new business CSM", represents growth from sales activity in the period, including individual protection sales (excluding joint ventures), and defined benefit solutions and segregated fund wealth sales in Canada. New business CSM is presented net of acquisition expense gain/loss.
•Expected movements from asset returns & locked-in rates applies to variable fee approach ("VFA") and general measurement approach ("GMA") contracts. For VFA contracts, this component of the CSM movement analysis is comprised of two factors: (i) the expected return on underlying assets and (ii) the measurement of financial guarantees. The difference between actual and expected results are reported as the impact of markets. For GMA contracts, this component of the CSM includes the accretion of the CSM balance at locked-in rates, which refer to the term structure associated with locked-in discount rates, set when the insurance contract was sold or on transition to IFRS 17. Average locked-in rates increase with the passage of time on in-force business and new business added at current rates.
•Impact of markets & other includes the difference between actual and expected movement for VFA contracts for: (i) the return on underlying assets and (ii) the measurement of financial guarantees. Also includes other amounts excluded from Organic CSM Movement.
•Insurance experience gains/losses represents the current period impacts of insurance experience, resulting in a change in future cash flows that adjust CSM.
•Impact of change in assumptions represents the future period impacts of changes in fulfilment cash flows that adjust CSM.
•CSM market sensitivities. CSM market sensitivities are non-IFRS financial measures for which there are no directly comparable measures under IFRS so it is not possible to provide a reconciliation of these amounts to the most directly comparable IFRS measures.
Deployment. This measure represents the amount of capital that has been invested in the period, including leverage where applicable. Deployment also includes capital committed in infrastructure deals to be invested in specific assets. There is no directly comparable IFRS measure.
Drivers of Earnings. The Drivers of Earnings ("DOE") analysis provides additional detail on the sources of earnings, primarily for protection and health businesses, and explains the actual results compared to the longer term expectations. The DOE is presented on a reported and underlying common shareholders' basis. Within the net insurance service result, the underlying DOE provides detail on expected insurance earnings, impact of new insurance business and experience gains (losses). Within the net investment result, the underlying DOE provides detail on expected investment earnings, credit experience, earnings on surplus, and joint ventures & other. For more information, refer to the headings "Underlying net income and Underlying EPS", "Earnings on surplus", "Notable items attributable to reported and underlying net income", in this document.
Certain amounts in the DOE are presented on a net basis to reflect how the business is managed, compared to a gross basis in the Consolidated Financial Statements. Examples include: i) Net investment result and Other expenses of the Asset Management operating segment are combined with Fee Income to report the net contribution to earnings; ii) Income for fee-based businesses is reported net of the associated expenses; iii) Carried interest in SLC Management within Fee Income excludes the carried interest that Sun Life does not participate in economically, and nets the non-controlling interest portion of the carried interest against fee income and expenses of consolidated funds; iv) Net investment results include assets returns net of the crediting rate for investment contract liabilities and the unwinding of and changes in the discount rate for insurance contract liabilities; v) Earnings on surplus reflects net spread earned from investment strategies; and vi) Earnings attributable to the participating account are excluded.
Earnings on Surplus. This component of the Drivers of Earnings represents the net income earned on a company’s surplus funds. Earnings on Surplus is comprised of realized gains on fair value through other comprehensive income assets, as well as net investment returns on surplus, such as investment income, gains (losses) on seed investments and investment properties mark-to-market, and also includes impacts from derivatives, currency and other items.
Experience-related items attributable to reported net income and underlying net income. These notable items attributable to reported net income and underlying net income are components of the Drivers of Earnings represents gains and losses that are due to differences between the actual results during the reporting period and management’s estimate of the expected longer-term returns on assets and liabilities (i.e. expected insurance earnings and expected investment earnings) at the start of the reporting period.
Fee earning AUM. FE AUM consists of assets managed by SLC Management, which are beneficially owned by Clients, on which we earn management fees for providing investment management, property management or advisory-related services. There is no directly comparable IFRS measure.
Fee-related earnings and Operating income. Fee-related earnings represent profitability of SLC Management's fee-related portfolios, and is calculated as Fee-related revenue less Fee-related expenses. Operating income represents profit realized from our business operations, and is calculated as the sum of Fee-related earnings, Investment income (loss) and performance fees, and Interest and other. Fee-related revenue represents all fee income, with the exception of performance fees, generated from third-party investors. Fee-related expenses represent all expenses directly related to generating fee revenue from third-party investors. Investment income (loss) and performance fees represent total income or loss from our seed investments, net of the related expenses. Interest and other represents performance fee compensation, our net interest income or expense and income from managing the General Account assets.
| | | | | | | | | | | | | | | | | | | | |
96 | December 31, 2025 | Sun Life Financial Inc. | | MANAGEMENT'S DISCUSSION & ANALYSIS | |
Fee-related earnings and Operating income are non-IFRS financial measures within SLC Management's Supplemental Income Statement, which enhances the comparability of SLC Management's results with publicly traded alternative asset managers. For more details, see our Supplementary Financial Information package for the quarter.
The following table provides a reconciliation from Fee-related earnings and Operating income to SLC Management's Fee income and Total expenses based on IFRS.
| | | | | | | | | | | |
SLC Management | | | | | |
| | |
| ($ millions) | | | | 2025 | 2024 |
Fee income (per IFRS) | | | | 1,894 | 1,938 |
Less: Non-fee-related revenue adjustments(1)(2) | | | | 565 | 700 |
| Fee-related revenue | | | | 1,329 | 1,238 |
| Total expenses (per IFRS) | | | | 1,853 | 1,480 |
Less: Non-fee-related expense adjustments(2)(3) | | | | 889 | 527 |
| Fee-related expenses | | | | 964 | 953 |
| Fee-related earnings | | | | 365 | 285 |
Add: Investment income (loss) and performance fees(4) | | | | 228 | 112 |
Add: Interest and other(5) | | | | (174) | (112) |
| Operating income | | | | 419 | 285 |
(1)Includes Interest and other - fee income, Investment income (loss) and performance fees - fee income, and Other - fee income.
(2)Excludes the income and related expenses for certain property management agreements to provide more accurate metrics on our fee-related business.
(3)Includes Interest and other, Placement fees - other, Amortization of intangibles, Acquisition, integration and restructuring, and Other - expenses.
(4)Investment income (loss) and performance fee in SLC Management's Supplemental Income Statement relates to the underlying results of our seed investments. As such, we have excluded non-underlying market-related impacts as well as the gains or losses of certain non-seed hedges that are reported under Net investment income (loss) under IFRS. The reconciliation is as follows (amounts have been adjusted for rounding): | | | | | | | | | | | |
| | |
| ($ millions) | | | | 2025 | 2024 |
| Net investment income (loss) (per IFRS) | | | | 130 | 138 |
| Less: Market-related impacts and Other - Investment income (loss) | | | | 9 | 50 |
| Add: Investment income (loss) and performance fees - fee income | | | | 107 | 24 |
| Investment income (loss) and performance fees | | | | 228 | 112 |
(5)Includes Interest and other reported under Fee income under IFRS, net of Interest and other reported under Total expenses under IFRS.
Financial leverage ratio. This ratio is an indicator of the Company's balance sheet strength measured by its proportion of capital qualifying debt in accordance with OSFI guidelines. This is calculated as the ratio of total debt plus preferred shares to total capital including the contractual service margin net of taxes, where debt consists of all capital-qualifying debt securities. Capital-qualifying debt securities consist of subordinated debt and innovative capital instruments. The CSM is included net of taxes because debts are repaid and serviced from available after-tax funds.
Impacts of foreign exchange translation. To assist in comparing our results from period-to-period, the favourable or unfavourable impacts of foreign exchange translation are approximated using the foreign exchange rates, in effect during the comparative period, for several IFRS and Non-IFRS financial measures using the average or period end foreign exchange rates, as appropriate. Items impacting a reporting period, such as Revenue, Expenses, and Reported net income (loss) in our Consolidated Statements of Operations, as well as underlying net income (loss), and sales, are translated into Canadian dollars using average exchange rates for the appropriate daily, monthly, or quarterly period. For Assets and Liabilities in our Consolidated Statements of Financial Position, as well as the AUM and certain components of the Drivers of Earnings disclosure, period-end rates are used for currency translation purposes.
LICAT market sensitivities. LICAT market sensitivities are non-IFRS financial measures for which there are no directly comparable measures under IFRS so it is not possible to provide a reconciliation of these amounts to the most directly comparable IFRS measures.
Organic capital generation. This supplementary financial measure provides a view of the Company’s ability to generate excess capital under the normal course of business, excluding non-recurring items; where excess capital is defined as LICAT Available Capital and Surplus Allowance above LICAT Base Solvency Buffer at target ratio, as defined and calculated under OSFI-mandated guideline. This amount is determined as follows: underlying net income and organic CSM movement net of shareholder dividends and change in base solvency buffer for new business and aging of in-force. This amount excludes non-recurring impacts to available capital or base solvency buffer from markets, assumption changes, management actions, and other non-underlying items.
Pre-tax fee related earnings margin. This ratio is a measure of SLC Management's profitability in relation to funds that earn recurring fee revenues, while excluding investment income and performance fees. The ratio is calculated by dividing fee-related earnings by fee-related revenues and is based on the last twelve months. There is no directly comparable IFRS measure.
Pre-tax net operating margin. This ratio is a measure of the profitability and there is no directly comparable IFRS measure. For MFS, this ratio is calculated by excluding MFS shares owned by management and certain commission expenses that are offsetting. These commission expenses are excluded in order to neutralize the impact these items have on the pre-tax net operating margin and have no impact on the profitability of MFS. For SLC Management, the ratio is calculated by dividing the total operating income by fee-related revenue plus investment Income (loss) and performance fees, and is based on the last twelve months.
| | | | | | | | | | | | | | | | | | | | |
| MANAGEMENT'S DISCUSSION & ANALYSIS | | Sun Life Financial Inc. | December 31, 2025 | 97 |
The following table provides a reconciliation to calculate MFS' pre-tax net operating margin:
| | | | | | | | | | | |
| MFS | | | | | |
| | |
| (US$ millions) | | | | 2025 | 2024 |
Revenue | | | | | |
| Fee income (per IFRS) | | | | 3,385 | 3,370 |
| Less: Commissions | | | | 386 | 399 |
Less: Other(1) | | | | (57) | (57) |
| Adjusted revenue | | | | 3,056 | 3,028 |
| Expenses | | | | | |
| Expenses (per IFRS) | | | | 2,370 | 2,391 |
| Net investment (income)/loss (per IFRS) | | | | (69) | (95) |
Less: MFS shares owned by management (net of NCI)(2) | | | | 33 | 57 |
Compensation-related equity plan adjustments | | | | 30 | 36 |
Commissions | | | | 386 | 399 |
Other(1) | | | | (58) | (51) |
| Adjusted expenses | | | | 1,910 | 1,855 |
| Pre-tax net operating margin | | | | 37.5% | 38.7% |
(1)Other includes accounting basis differences, such as sub-advisory expenses and product allowances.
(2)Excluding non-controlling interest. For more information on MFS shares owned by management, see the heading Underlying Net Income and Underlying EPS.
Return on equity. IFRS does not prescribe the calculation of ROE and therefore a comparable measure under IFRS is not available. To determine reported ROE and underlying ROE, respectively, reported net income (loss) and underlying net income (loss) is divided by the total weighted average common shareholders’ equity for the period. The ROE provides an indication of the overall profitability of the Company. The quarterly ROE is annualized.
Sales and flows. Asset Management gross flows includes funds from retail and institutional Clients; SLC Management gross flows include capital raising, such as uncalled capital commitments and fund leverage. Asset Management net flows consist of gross flows less gross outflows; SLC Management's net flows do not include Client distributions from the sale of underlying assets in closed-end funds. In Canada and in Asia, net sales consist of asset management gross flows & wealth sales less redemptions. In Canada, asset management gross flows & wealth sales consist of sales in Group Retirement Services (excluding retained sales) and Individual Wealth; group - health & protection sales consist of workplace benefits sold by Sun Life Health; and individual - protection sales refer to individual insurance sales. In the U.S., group - health & protection sales consist of sales by Group Benefits and Dental. In Asia, asset management gross flows & wealth sales consist of Hong Kong asset management gross flows & wealth sales, Philippines mutual fund sales, asset management gross flows & wealth sales by our India and China joint ventures and associates, and Aditya Birla Sun Life AMC Limited's equity and fixed income mutual fund sales based on our proportionate equity interest, including sales as reported by our bank distribution partners; individual - protection sales consist of the individual insurance sales, by our subsidiaries and joint ventures and associates, based on our proportionate equity interest, in the Philippines, Indonesia, India, China, Malaysia, Vietnam, Hong Kong and High Net Worth. Asia also has group - health & protection sales in the Philippines, Hong Kong and our joint ventures. To provide greater comparability across reporting periods, we exclude the impacts of foreign exchange translation from sales and gross flows. There is no directly comparable IFRS measure.
Third-party AUM. Third-party AUM is composed of retail, institutional, and other third-party assets, which includes general fund and segregated fund assets managed by our joint ventures. In Asset Management, third-party AUM includes Client assets for retail and institutional Clients, as well as capital raising, such as uncalled commitments and fund leverage in SLC Management. In Canada, third-party AUM includes Client assets in retail mutual fund products of Sun Life Global Investments. In Asia, third-party AUM includes Client assets in Hong Kong managed fund products, International asset management & wealth products, Philippines mutual and managed fund products, Aditya Birla Sun Life AMC Limited equity and fixed income mutual fund products, Sun Life Everbright Asset Management products and our joint ventures’ general fund and segregated fund assets based on our proportionate equity interest. There is no directly comparable IFRS financial measure.
Total weighted premium income ("TWPI"). This measure consists of 100% renewal premiums, 100% of first year premiums, and 10% of single premiums. In contrast to sales, which only includes premiums from new business, TWPI includes renewal premiums, reflecting the strength of the in-force block and providing a better understanding of both new and existing business. There is no directly comparable IFRS measure.
Underlying dividend payout ratio. This is the ratio of dividends paid per share to diluted underlying EPS for the period. The ratio is utilized during the medium-term capital budgeting process to inform our planned capital initiatives. We target an underlying dividend payout ratio of between 40% and 50% based on underlying EPS. For more information, see section J - Capital and Liquidity Management in this document.
Underlying effective tax rate. This measure is calculated using the pre-tax underlying net income and the income tax expense associated with it. Our statutory tax rate is normally reduced by various tax benefits, such as lower taxes on income subject to tax in foreign jurisdictions, a range of tax-exempt investment income, and other sustainable tax benefits. Our effective tax rate helps in the analysis of the income tax impacts in the period.
| | | | | | | | | | | | | | | | | | | | |
98 | December 31, 2025 | Sun Life Financial Inc. | | MANAGEMENT'S DISCUSSION & ANALYSIS | |
4. Reconciliations of Select Non-IFRS Financial Measures
Underlying Net Income to Reported Net Income Reconciliation - Pre-tax by Business Group
| | | | | | | | | | | | | | | | | | | | |
| Q4'25 |
| ($ millions) | Asset
Management | Canada | U.S. | Asia | Corporate | Total |
| Underlying net income (loss) | 370 | 417 | 210 | 207 | (110) | 1,094 |
| Add: Market-related impacts (pre-tax) | (22) | (108) | (21) | (46) | (13) | (210) |
Assumption changes and management actions (pre-tax) | — | (8) | (6) | (21) | — | (35) |
| Other adjustments (pre-tax) | (49) | (9) | (69) | (17) | (5) | (149) |
Tax expense (benefit) | 19 | 15 | 19 | 8 | (39) | 22 |
| Reported net income (loss) - Common shareholders | 318 | 307 | 133 | 131 | (167) | 722 |
| |
| | | | | | |
| | | | | | |
| | | | | | |
| | | | | | |
| | | | | | |
| | | | | | |
| Q4'24 |
| Underlying net income (loss) | 360 | 366 | 161 | 175 | (97) | 965 |
Add: Market-related impacts (pre-tax) | (18) | (142) | (74) | 27 | (14) | (221) |
Assumption changes and management actions (pre-tax) | — | (1) | (1) | 15 | — | 13 |
| Other adjustments (pre-tax) | (34) | (8) | (143) | (193) | — | (378) |
Tax expense (benefit) | 18 | 38 | 50 | (13) | (235) | (142) |
| Reported net income (loss) - Common shareholders | 326 | 253 | (7) | 11 | (346) | 237 |
| | | | | | | | | | | | | | | | | | | | |
| Year-to-date |
| 2025 |
| ($ millions) | Asset
Management | Canada | U.S. | Asia | Corporate | Total |
| Underlying net income (loss) | 1,371 | 1,594 | 770 | 836 | (370) | 4,201 |
| Add: Market-related impacts (pre-tax) | (65) | (173) | 44 | (238) | (19) | (451) |
Assumption changes and management actions (pre-tax) | — | — | (67) | 13 | — | (54) |
| Other adjustments (pre-tax) | (136) | (48) | (311) | 124 | (5) | (376) |
Tax expense (benefit) | 44 | 29 | 84 | 33 | (38) | 152 |
| Reported net income (loss) - Common shareholders | 1,214 | 1,402 | 520 | 768 | (432) | 3,472 |
| 2024 |
| Underlying net income (loss) | 1,293 | 1,453 | 773 | 701 | (364) | 3,856 |
Add: Market-related impacts (pre-tax) | (25) | (211) | (148) | (47) | 3 | (428) |
Assumption changes and management actions (pre-tax) | — | (47) | 181 | (52) | 4 | 86 |
| Other adjustments (pre-tax) | 263 | (33) | (323) | (114) | (138) | (345) |
Tax expense (benefit) | (3) | 55 | 73 | (59) | (186) | (120) |
| Reported net income (loss) - Common shareholders | 1,528 | 1,217 | 556 | 429 | (681) | 3,049 |
| | | | | | | | | | | | | | | | | | | | |
| MANAGEMENT'S DISCUSSION & ANALYSIS | | Sun Life Financial Inc. | December 31, 2025 | 99 |
Underlying Net Income to Reported Net Income Reconciliation - Pre-tax by Business Unit - Asset Management
| | | | | | | | | | | | | | | | |
| Q4'25 | | Q4'24 |
| ($ millions) | MFS | SLC
Management | | | MFS | SLC
Management |
| Underlying net income (loss) | 312 | 58 | | | 301 | 59 |
| Add: Market-related impacts (pre-tax) | — | (22) | | | — | (18) |
Other adjustments (pre-tax) | 5 | (54) | | | 4 | (38) |
Tax expense (benefit) | (15) | 34 | | | (4) | 22 |
| Reported net income (loss) - Common shareholders | 302 | 16 | | | 301 | 25 |
| | | | | | | | | | | | | | |
| |
| 2025 | 2024 |
| ($ millions) | MFS | SLC
Management | MFS | SLC
Management |
| Underlying net income (loss) | 1,129 | 242 | 1,117 | 176 |
| Add: Market-related impacts (pre-tax) | — | (65) | — | (25) |
Other adjustments (pre-tax) | 17 | (153) | (4) | 267 |
| Tax expense (benefit) | (26) | 70 | (18) | 15 |
| Reported net income (loss) - Common shareholders | 1,120 | 94 | 1,095 | 433 |
Underlying Net Income to Reported Net Income Reconciliation - Pre-tax in U.S. dollars
| | | | | | | | | | | | | | | | |
| Q4'25 | | Q4'24 |
| (US$ millions) | U.S. | MFS | | | U.S. | MFS |
| Underlying net income (loss) | 150 | 224 | | | 115 | 216 |
Add: Market-related impacts (pre-tax) | (19) | — | | | (52) | — |
Assumption changes and management actions (pre-tax) | (4) | — | | | — | — |
| Other adjustments (pre-tax) | (49) | 3 | | | (103) | 3 |
Tax expense (benefit) | 15 | (11) | | | 39 | (3) |
| Reported net income (loss) - Common shareholders | 93 | 216 | | | (1) | 216 |
| | | | | | | | | | | | | | |
| |
| 2025 | 2024 |
| (US$ millions) | U.S. | MFS | U.S. | MFS |
| Underlying net income (loss) | 551 | 809 | 566 | 817 |
Add: Market-related impacts (pre-tax) | 26 | — | (112) | — |
Assumption changes and management actions (pre-tax) | (49) | — | 136 | — |
| Other adjustments (pre-tax) | (219) | 12 | (235) | (4) |
Tax expense (benefit) | 59 | (19) | 56 | (13) |
| Reported net income (loss) - Common shareholders | 368 | 802 | 411 | 800 |
Underlying Net Income to Reported Net Income Reconciliation - U.S. Group Benefits - Pre-tax in U.S. dollars
The following table sets out the amounts that were excluded from our reported net income (loss) for U.S. Group Benefits, which is used to calculate the trailing four-quarter after-tax profit margin for U.S. Group Benefits.
| | | | | | | | | | | | | | | | | | | | | | | | | | |
| (US$ millions) | Q4'25 | Q3'25 | Q2'25 | Q1'25 | Q4'24 | Q3'24 | Q2'24 | Q1'24 |
Underlying net income (loss) for U.S. Group Benefits | 92 | 71 | 121 | 105 | 62 | 118 | 124 | 118 |
Add: Market-related impacts (pre-tax) | — | 5 | (1) | 8 | (18) | 17 | (11) | (8) |
Assumption changes and management actions (pre-tax) | — | 1 | — | — | — | 8 | — | — |
| Other adjustments (pre-tax) | (4) | (4) | (4) | (4) | (5) | (5) | (6) | (7) |
Tax expense (benefit) | 1 | — | 1 | (1) | 5 | (4) | 3 | 3 |
Reported net income (loss) - Common shareholders | 89 | 73 | 117 | 108 | 44 | 134 | 110 | 106 |
| | | | | | | | | | | | | | | | | | | | |
100 | December 31, 2025 | Sun Life Financial Inc. | | MANAGEMENT'S DISCUSSION & ANALYSIS | |
| | | | | |
| N. Accounting and Control Matters |
We have adopted amended IFRS standards in the current year, which had no material impact on our Consolidated Financial Statements. For additional information, refer to Note 2 in our 2025 Annual Consolidated Financial Statements.
1. Critical Accounting Policies and Estimates
Our material accounting and actuarial policies are described in Notes 1, 5-7 and 10 of our 2025 Annual Consolidated Financial Statements. Management must make judgments involving assumptions and estimates, some of which may relate to matters that are inherently uncertain, under these policies. The estimates described below are considered particularly significant to understanding our financial performance. As part of our financial control and reporting, judgments involving assumptions and estimates are reviewed by the independent auditor and by other independent advisors on a periodic basis. Accounting policies requiring estimates are applied consistently in the determination of our financial results.
1.A Insurance Contracts Summary and Methods and Assumptions
Summary
We sell a variety of insurance contracts that include all forms of life, health and critical illness insurance sold to individuals and groups, annuities, and segregated fund products with guarantees. We hold reinsurance contracts that transfer mortality and other risks following internal guidelines.
Insurance contracts with direct participation features are products where investments are managed on behalf of policyholders, and investment returns less a variable fee are passed through to policyholders with the insurance benefits they receive. Insurance contracts with direct participation features are measured using the VFA, and include segregated funds, unit-linked contracts, variable universal life contracts, and most participating insurance contracts. Reinsurance contracts (both issued and held) cannot be measured using the VFA.
Insurance contracts without direct participation features are eligible to use the PAA if the coverage period is one year or less, or if the result of applying the PAA is not expected to be materially different result than applying the GMA in each reporting period over the life of the contract. Insurance contracts eligible to use the PAA include most group life and health contracts and the associated reinsurance contracts held.
Other insurance contracts are measured using the GMA. This includes most individual life and health insurance contracts and annuities and the associated reinsurance contracts held.
The Consolidated Statements of Financial Position present insurance contracts issued and reinsurance contracts held as both assets and liabilities, depending on whether the portfolio is in an asset or liability position.
For more information about insurance contracts issued and reinsurance contracts held, and Insurance contract liabilities for account of segregated fund holders, see Note 1, Note 10 and Note 21 of our 2025 Annual Consolidated Financial Statements.
Methods and Assumptions
General
A group of insurance contracts is measured as the total of FCF, which is the present value of future cash flows plus the risk adjustment for non-financial risk, and, for groups measured using the GMA or VFA, the CSM. In measuring the present value of future cash flows, assumptions must be made about mortality and morbidity rates, lapse and other policyholder behaviour ("policyholder behaviour"), expenses and other factors over the life of our products, and the prevailing market view of the cost of financial risk in our products. Many of these assumptions relate to events that are anticipated to occur many years in the future. Assumptions require significant judgment and regular review and, where appropriate, revision.
The RA is the compensation we require for the uncertainty related to non-financial risk in the estimates of future cash flows. This compensation is measured by discounting cash flows from applying margins to the non-financial assumptions used in the estimate of future cash flows.
The CSM represents the unearned profit that will be recognized as insurance contract services are provided.
The methods and assumptions used in the measurement of insurance contracts are reviewed regularly and are subject to external actuarial peer review.
Present Value of Future Cash Flows
Assumptions for non-financial risk variables in the present value of future cash flows are intended to be current, neutral estimates of the expected outcome, as guided by both IFRS and accepted actuarial practice in Canada. The choice of assumptions takes into account current circumstances, past experience data from our own experience or from the industry, the relationship of past to expected future experience, anti-selection, the relationship among assumptions (including those for financial risk variables), and other relevant factors.
Assumptions for financial risk variables in the present value of future cash flows are based on current observable market prices, adjusted to account for differences between the financial risk embedded in our products and those in the corresponding observed market instrument. Where no relevant market instrument is available, we use the best information available as guided by both IFRS and accepted actuarial practice in Canada.
| | | | | | | | | | | | | | | | | | | | |
| MANAGEMENT'S DISCUSSION & ANALYSIS | | Sun Life Financial Inc. | December 31, 2025 | 101 |
Mortality
Mortality refers to the rates at which death occurs for defined groups of people. Mortality assumptions are generally based on the past five to ten years of experience. Our experience is combined with industry experience or experience from reinsurers where our own experience is insufficient to be statistically valid. Assumed mortality rates for life insurance and annuity contracts include assumptions about future mortality improvement based on recent trends in population mortality and our outlook for future trends.
Morbidity
Morbidity refers to the rate of being unhealthy or disabled and the rates of recovery therefrom. Most of our disability insurance is marketed on a group basis. We offer critical illness policies on an individual basis in Canada and Asia, long-term care on an individual basis in Canada, and medical stop-loss insurance is offered on a group basis in the U.S. In Canada, group morbidity assumptions are based on our five-year average experience, modified to reflect any emerging trend in recovery rates. For Canadian long-term care and critical illness insurance in Canada and Asia, assumptions are developed in collaboration with our reinsurers and are largely based on their experience. In the U.S., our experience is used for both medical stop-loss and disability assumptions, with some consideration of industry or reinsurer experience.
Policyholder Behaviour
Lapse or surrender
Policyholders may allow their policies to lapse prior to the end of the contractual coverage period by choosing not to continue to pay premiums or by surrendering their policy for the cash surrender value. Assumptions for lapse or surrender experience on life insurance are generally based on our five-year average experience. Lapse or surrender rates vary by plan, age at issue, method of premium payment, policy duration and financial risk variables.
Premium payment patterns
For universal life contracts, it is necessary to set assumptions about premium payment patterns. Studies prepared by industry or the actuarial profession are used for products where our experience is insufficient to be statistically valid. Premium payment patterns usually vary by plan, age at issue, method of premium payment, policy duration and financial risk variables.
Expense
Future expenses directly attributable to the fulfilment of our insurance contracts include the costs of premium collection, claims adjudication and processing, actuarial calculations, preparation and mailing of policy statements, and related overhead. Future expense assumptions are mainly based on our recent experience using an internal expense allocation methodology. Inflationary increases assumed in future expenses are based on long-term expectations.
Acquisition expenses directly attributable to portfolios of insurance contracts include the costs of selling, underwriting and issuing insurance contracts. For new insurance contracts measured using the GMA or VFA, actual or estimated directly attributable acquisition expenses are recognized in the initial measurement of the contract. If estimates are used, the difference between estimated and actual acquisition expenses adjusts the CSM when the group of insurance contracts is closed to new contracts.
Current Discount Rates
Current discount rates are used to discount estimates of future cash flows in determining the present value of future cash flows. Current discount rates reflect the time value of money, the characteristics of the cash flows, and the liquidity characteristics of the insurance contracts.
Current discount rates for cash flows that do not vary based on returns on underlying items
Cash flows that do not vary at all based on the returns on any underlying items are discounted at rates that reflect the timing and currency of cash flows and the liquidity characteristics of the insurance contracts.
The timing of cash flows is reflected by constructing a discount curve, so that each cash flow is discounted consistent with the timing of the cash flow. In constructing the discount curve, a portion is based on market information (the observable period) and beyond that period, the discount rates are estimated (the unobservable period). The observable period, which varies by currency, is the time period where information on risk-free interest rates is deep and liquid. In the unobservable period, risk-free rates are interpolated between the last observable point and an ultimate risk-free rate at year 70. The ultimate risk-free rate is estimated using historical averages as guided by both IFRS and accepted actuarial practice in Canada.
The currency of cash flows is reflected by using different discount curves for different currencies.
Liquidity is reflected by adding a liquidity premium to risk-free discount rates that is consistent with the liquidity characteristics of the insurance contracts. The liquidity premium in the observable period is based on the liquidity premium on assets with similar liquidity characteristics, which is estimated from the spread inherent in current market yields less a deduction for expected and unexpected credit losses. The deduction for expected and unexpected credit losses is estimated using historical rating agency data and current market conditions, and varies by asset type, quality, and duration. The liquidity premium in the unobservable period is interpolated between the last observable liquidity premium and an ultimate liquidity premium (at year 70) specific to liquid or illiquid contracts as guided by both IFRS and accepted actuarial practice in Canada. See Note 10.A in the 2025 Annual Consolidated Financial Statements for further details, which provides a weighted average summary of the discount curves used to present value cash flows for all major products that do not vary based on the returns on underlying items.
Current discount rates for cash flows that vary with returns on underlying items
Discount rates for cash flows that vary directly with returns on underlying items reflect that variability. For the portion of cash flows that is a pass through of returns on underlying items to policyholders, the discount rate is such that the present value of cash flows equals the portion of the underlying items that is passed through to policyholders. For cash flows that vary, but not directly, with underlying items (e.g., financial guarantees), scenario testing may be necessary. If so, discount rates used in the scenario projections are scenario-specific and based on the projected risk-free rates in the scenario plus liquidity premiums consistent with the liquidity characteristics of the contracts being measured.
| | | | | | | | | | | | | | | | | | | | |
102 | December 31, 2025 | Sun Life Financial Inc. | | MANAGEMENT'S DISCUSSION & ANALYSIS | |
Scenario Testing
Scenario testing may be required when the relationship between cash flows and financial risk variables is non-linear, or where there are complex interdependencies among cash flows. In scenario testing of financial risk variables, future cash flows are projected for each scenario path and discounted at the scenario-specific discount rates, resulting in a present value of future cash flows for each scenario. The provision for the projected cash flows is the average of the scenario-specific values. Assumptions for non-financial risk variables are the best estimate assumptions consistent with the scenario.
Scenarios are consistent with the current market environment. Our Economic Scenario Generator calibration process produces integrated stochastic scenarios of financial risk variables (e.g., risk-free interest rates, bond fund returns, equity returns) with parameters calibrated to replicate observable market prices of financial instruments available in the market. Adjustments are made when the insurance contracts being measured are illiquid but the financial instruments to which the scenarios are calibrated to are liquid.
Risk Adjustment for Non-Financial Risk
The RA for insurance contracts issued is the compensation we require for bearing uncertainty about the amount and timing of the cash flows that arises from non-financial risk. This amount is measured as the present value of the difference between estimated future cash flows with a margin applied to non-financial assumptions and estimated future cash flows without this adjustment. Margins generally range from 5% to 20% depending on the uncertainty in the determination of the assumption. The level of uncertainty, and hence the margin chosen, varies by assumption and by line of business and other factors. Considerations that would generally lead to a choice of margin at the higher end of the range are as follows:
•The statistical credibility of our experience is too low to be the primary source of data for choosing the assumption;
•Future experience is difficult to estimate;
•The cohort of risks lacks homogeneity;
•Operational risks adversely impact the ability to estimate the assumption; or
•Past experience may not be representative of future experience and the experience may deteriorate.
Margins are generally stable over time and are revised only to reflect changes in the level of uncertainty in the assumptions. Our margins tend to be at mid-range.
The RA for reinsurance contracts held represents the amount of risk transferred to the reinsurer. This is measured as the difference between the RA on the underlying insurance contracts without reinsurance and what the RA on the underlying insurance contracts would be with reinsurance. The RA for reinsurance contracts held increases the asset or reduces the liability for reinsurance contracts held.
The RA for insurance contracts corresponds to a confidence level of approximately 85-90% overall.
Contractual Service Margin
The initial and subsequent measurement of CSM is described in Note 1 in our 2025 Annual Consolidated Financial Statements. Additional detail about certain components of the measurement of CSM is provided below.
Interest accretion
For insurance contracts measured using the GMA, locked-in discount rates are used to accrete interest on the CSM. The locked-in discount rate for a group of insurance contracts is the weighted average of the current discount rates at initial recognition of the contracts in the group.
For insurance contracts measured using the VFA, there is no accretion of interest. Rather, the CSM is adjusted by the change in our share of the fair value of underlying items.
Changes in FCF relating to future service
For insurance contracts measured using the GMA, locked-in discount rates are used to measure changes in FCF relating to future service. Changes in FCF relating to future service reflect changes in non-financial assumptions but not changes in assumptions related to financial risk.
For insurance contracts measured using the VFA, current discount rates are used to measure the change in FCF relating to future service. Changes in FCF relating to future service reflect both changes in non-financial assumptions and changes in assumptions related to financial risk.
Changes in FCF relating to future service include (Liability for Remaining Coverage only):
•All changes related to investment component payments (including current period payments);
•Changes arising from changes in assumptions used to derive the present value of future cash flows - limited to non-financial assumptions for insurance contracts measured using the GMA;
•Changes in future cash flows arising from claims in the current period; and
•For insurance contracts measured using the GMA, changes related to discretionary cash flows on some universal life and adjustable products. Discretionary cash flows are cash flows outside the guaranteed payments to the policyholder, and are described as a spread on earned rates (in the case of some universal life contracts) and in the policy on criteria for changes to adjustable policies for adjustable policies.
CSM recognized for services provided
The amount of CSM recognized as insurance revenue in each period to reflect the insurance contract services provided for a group of contracts in the period is determined by:
•Identifying the total coverage units in the group (for services in current and future periods) – based on the quantity of insurance contract services;
•Allocating the CSM at the end of the period equally to each coverage unit in the current period and expected to be provided in the future (i.e., coverage units "unitize" the services provided); then
| | | | | | | | | | | | | | | | | | | | |
| MANAGEMENT'S DISCUSSION & ANALYSIS | | Sun Life Financial Inc. | December 31, 2025 | 103 |
•Recognizing in insurance revenue the amount allocated to coverage units provided in the period.
Total coverage units for services expected to be provided in future periods is the present value of projected coverage units. The present value is measured using locked-in discount rates for groups measured using the GMA and current discount rates for groups measured using the VFA.
The coverage unit for a group is based on the nature of the insurance contract services provided. Insurance contract services comprise services for providing insurance coverage and, for some contracts, investment-return or investment-related services. It does not include services related to performing functions such as claims adjudication. Where more than one type of service is provided to insurance contracts in a group, the coverage unit reflects the primary service provided.
For insurance contracts measured using the VFA, coverage units are based on the policyholder's account value or the policyholders' share of the fair value of underlying items. For insurance contracts measured using the GMA, coverage units are based on the expected claim amount (excluding any investment component) for life and health insurance contracts, and the payment due in a period for annuity contracts.
For reinsurance contracts held, the amount of CSM recognized reflects the services received in the period.
Sensitivities to Insurance Methods and Assumptions
In addition to the insurance risks factors and risk management governance and controls described in section K - Risk Management in this document and the Risk Factors section of the 2025 AIF, we also note that on adoption of IFRS 17 and 9, the tables below include sensitivities of contractual service margins to insurance and other non-financial assumption risks.
The following table sets out the estimated immediate impact on, or sensitivity of, the CSM and net income to certain instantaneous changes in the insurance and other non-financial assumptions used in the calculation of our insurance contract liabilities, based on a starting point and business mix as at December 31, 2025 and December 31, 2024. These sensitivities are calculated independently for each risk factor, generally assuming that all other risk variables stay constant. The estimates are illustrative and different starting points for best estimate assumptions, CSM balances and business mix will result in different estimated sensitivities. These sensitivities represent our estimate of changes in best estimate assumptions that are reasonably likely based on our and/or the industry's historical experience and industry standards and best practices as at December 31, 2025 and December 31, 2024.
The impact on CSM is attributable to insurance contracts measured under the GMA and VFA. For insurance contracts measured under the GMA, the impact flows through the CSM at locked-in discount rates. For insurance contracts measured under the VFA, the impact flows through the CSM at current discount rates.
The impact on net income is attributable to any portion of the sensitivities for insurance contracts measured under the GMA and VFA that cannot be absorbed by CSM, the full impact for insurance contracts measured under the PAA, and the difference in impact between locked-in and current discount rates for insurance contracts measured under the GMA. If current discount rates are higher than locked-in rates, this generally results in a favourable impact to net income from contracts measured under the GMA.
| | | | | | | | | | | | | | |
| ($ millions) | As at December 31, 2025 | As at December 31, 2024 |
Sensitivity(1) | Potential impact on CSM (pre-tax) | Potential impact on net income/equity (after-tax) | Potential impact on
CSM (pre-tax) | Potential impact on net income/equity (after-tax) |
| Policyholder Behaviour (10% increase/decrease, where adverse) | (800) | (25) | (800) | (25) |
| Life Mortality rates (2% increase) | — | (75) | 25 | (75) |
| Annuity Mortality rates (2% decrease) | (175) | 25 | (175) | — |
| Morbidity rates (5% incidence increase and 5% termination decrease) | (150) | (200) | (125) | (225) |
| Expenses (5% increase) | (150) | (25) | (150) | (25) |
(1) Sensitivities to insurance assumptions refer to insurance contracts issued net of reinsurance contracts held. Net income and CSM sensitivities have been rounded in increments of $25 million. The sensitivities exclude the impacts on the income from our joint ventures and associates in China and India, which we account for on an equity basis.
Fair Value of Assets and Liabilities
Debt securities, equity securities, most mortgages and loans and certain other invested assets are measured FVTPL or FVOCI and are recorded at fair value in our Consolidated Statements of Financial Position. Changes in fair value of assets measured FVTPL, and realized gains and losses on sale of FVTPL assets are recognized in income. Changes in fair value of FVOCI assets are recorded in OCI. For foreign currency translation, exchange differences calculated on the amortized cost of FVOCI assets are recognized in income and other changes in the carrying amount are recognized in OCI. Net impairment losses and realized gains and losses on sale of FVOCI assets (except for FVOCI equity securities as they remain in OCI) are reclassified from OCI to income.
The fair value of government and corporate debt securities is primarily determined using unadjusted quoted prices in active markets for identical or similar securities, where available. When quoted prices in active markets are not available, fair value is determined using market standard valuation methodologies, which include a discounted cash flow method, consensus pricing from various broker dealers that are typically the market makers, or other similar techniques. The assumptions and valuation inputs in applying these market standard valuation methodologies are determined primarily using observable market inputs, which include, but are not limited to, benchmark yields, reported trades of identical or similar instruments, broker-dealer quotes, issuer spreads, bid prices, and reference data including market research publications. In limited circumstances, non-binding broker quotes are used.
| | | | | | | | | | | | | | | | | | | | |
104 | December 31, 2025 | Sun Life Financial Inc. | | MANAGEMENT'S DISCUSSION & ANALYSIS | |
The fair value of asset-backed securities is primarily determined using unadjusted quoted prices in active markets for identical or similar securities, where available, or valuation methodologies and valuation inputs similar to those used for government and corporate debt securities. Additional valuation inputs include structural characteristics of the securities, and the underlying collateral performance, such as prepayment speeds and delinquencies. Expected prepayment speeds are based primarily on those previously experienced in the market at projected future interest rate levels. In limited circumstances where there is a lack of sufficient observable market data to value the securities, non-binding broker quotes are used.
The fair value of equity securities is determined using unadjusted quoted prices in active markets for identical securities or similar securities, where available. When quoted prices in active markets are not available, fair value is determined using equity valuation models, which include a discounted cash flow method and other techniques that involve benchmark comparison. Valuation inputs primarily include projected future operating cash flows and earnings, dividends, market discount rates, and earnings multiples of comparable companies. Where equity securities are less frequently traded, the most recent exchange-quoted pricing is used to determine fair value.
The fair value of mortgages and loans is determined by discounting the expected future contractual cash flows using a current market interest rate applicable to financial instruments with a similar yield, credit quality, and maturity characteristics. Valuation inputs typically include benchmark yields and risk-adjusted spreads from current internal lending activities or loan issuances. Valuation inputs also include external lending activities or loan issuances from both public and private markets, enhancing the market observability of inputs. The risk-adjusted spreads are determined based on the borrower’s credit and liquidity, as well as term and other loan-specific features.
The fair value of other financial liabilities is determined using the discounted cash flow methodology at the incremental borrowing rate or the effective interest rate, where available. Other financial liabilities categorized as Level 3 represent the present value of the estimated price we would pay to acquire any remaining outstanding shares upon exercise of a put option and any mandatory income distributions. The fair value of the liabilities is based on the average earnings before income tax, depreciation and amortization ("EBITDA") for the preceding years before the options’ exercise dates and EBITDA multiples in accordance with the put agreements as well as the expected amount of any mandatory income distributions. A change in EBITDA would impact the fair value of other financial liabilities and our net income (loss).
Derivative financial instruments are recorded at fair value with changes in fair value recorded in income unless the derivative is part of a qualifying hedging relationship for accounting purposes. The fair value of derivative financial instruments depends upon derivative types. The fair value of exchange-traded futures and options is determined using unadjusted quoted prices in active markets, where available, while the fair value of OTC derivatives is determined using pricing models, such as a discounted cash flow method or other market standard valuation techniques, with primarily observable market inputs.
Valuation inputs used to price OTC derivatives may include swap interest rate curves, foreign exchange spot and forward rates, index prices, the value of underlying securities, projected dividends, volatility surfaces, and in limited circumstances, counterparty quotes. The fair value of OTC derivative instruments also includes credit valuation adjustments to reflect the credit risk of both the derivative counterparty and ourselves as well as the impact of contractual factors designed to reduce our credit exposure, such as collateral and legal rights of offset under master netting agreements. Inputs into determining the appropriate credit valuation adjustments are typically obtained from publicly available information and include credit default swap spreads when available, credit spreads derived from specific bond yields, or published cumulative default experience data adjusted for current trends when credit default swap spreads are not available.
The fair value of other financial invested assets consists primarily of limited partnership investments which is based on net asset value ("NAV") provided by management of the limited partnership investments. Based on the unobservable nature of these NAVs, we do not assess whether applying reasonably possible alternative assumptions would have an impact on the fair value of the limited partnership investments.
Investment properties are recorded at fair value with changes in fair value recorded in income. The fair value of investment properties is generally determined using property valuation models that are based on expected capitalization rates and models that discount expected future net cash flows at current market interest rates reflective of the characteristics, location, and market of each property. Expected future net cash flows include contractual and projected cash flows and forecasted operating expenses, and take into account interest, rental and occupancy rates derived from market surveys. The estimates of future cash inflows, in addition to expected rental income from current leases, include projected income from future leases based on significant assumptions that are consistent with current market conditions. The future rental rates are estimated based on the location, type and quality of the properties, and take into account market data and projections at the valuation date. The fair values are typically compared to market-based information for reasonability, including recent transactions involving comparable assets. The methodologies and inputs used in these models are in accordance with real estate industry valuation standards. Valuations are prepared externally or internally by professionally accredited real estate appraisers.
Cash, cash equivalents and short-term securities are accounted for at FVTPL due to their short-term nature or because they are frequently repriced to current market rates.
Investments for accounts of segregated fund holders are recorded at fair value with changes in fair value recorded in net realized and unrealized gains (losses) within the segregated fund and are not recorded in our Consolidated Statements of Operations. The fair value of investments for account of segregated fund holders is determined using unadjusted quoted prices in active markets or independent valuation information provided by investment managers. The fair value of direct investments within investments for accounts of segregated fund holders, such as short-term securities and government and corporate debt securities, is determined according to valuation methodologies and inputs described above in the respective asset type sections. The fair value of the secured borrowings from mortgage securitization is based on the methodologies and assumptions as described above for asset-backed securities.
The fair value of investment contracts is measured through the use of prospective discounted cash flow method. For unit-linked contracts, the fair value is equal to the current unit fund value, plus additional non-unit liability amounts on a fair value basis if required. For non-unit-linked contracts, the fair value is equal to the present value of contractual cash flow. The fair value of the investment contract liabilities approximate their carrying values due to the nature of the contracts.
The fair values of these obligations are based on the fair value of the underlying securities, which can include debt or equity securities. The method used to determine fair value is based on the quoted market prices where available in an active market.
| | | | | | | | | | | | | | | | | | | | |
| MANAGEMENT'S DISCUSSION & ANALYSIS | | Sun Life Financial Inc. | December 31, 2025 | 105 |
The fair value of underlying assets within our CLOs is determined primarily using observable market inputs, such as quoted prices for similar assets in active markets and other observable market data.
The fair value of underlying liabilities within our CLOs is determined by discounting expected future contractual cash flows using a current market interest rate applicable to financial instruments with a similar yield, credit quality, maturity characteristics, and structural credit protections. The valuation technique maximizes the use of observable inputs that incorporates comparable securities’ prices and other market intelligence.
The methodologies and assumptions for determining the fair values of investment contract liabilities are included in Note 10.A of the 2025 Annual Consolidated Financial Statements.
We categorize our assets and liabilities carried at fair value, based on the priority of the inputs to the valuation techniques used to measure fair value, into a three-level fair value hierarchy as follows:
Level 1: Fair value is based on the unadjusted quoted prices for identical assets or liabilities in an active market. The types of assets and liabilities classified as Level 1 generally include cash and cash equivalents, certain U.S. government and agency securities, exchange-traded equity securities, and certain segregated and mutual fund units held for account of segregated fund holders.
Level 2: Fair value is based on quoted prices for similar assets or liabilities traded in active markets, or prices from valuation techniques that use significant observable inputs, or inputs that are derived principally from or corroborated with observable market data through correlation or other means. The types of assets and liabilities classified as Level 2 generally include Canadian federal, provincial and municipal government, other foreign government and corporate debt securities, certain asset-backed securities, OTC derivatives, and certain segregated and mutual fund units held for account of segregated fund holders.
Level 3: Fair value is based on valuation techniques that require one or more significant inputs that are not based on observable market inputs. These unobservable inputs reflect our expectations about the assumptions market participants would use in pricing the asset or liability. The types of assets and liabilities classified as Level 3 generally include certain corporate bonds, certain other invested assets, and investment properties.
As pricing inputs become more or less observable, assets are transferred between levels in the hierarchy. Total gains and losses in income and OCI are calculated assuming transfers into or out of Level 3 occur at the beginning of the period. For a financial instrument that transfers into Level 3 during the reporting period, the entire change in fair value for the period is included in the Level 3 reconciliation schedule in Note 5 of our 2025 Annual Consolidated Financial Statements. For transfers out of Level 3 during the reporting period, the change in fair value for the period is excluded from the Level 3 reconciliation schedule in Note 5 of our 2025 Annual Consolidated Financial Statements. Transfers into Level 3 occur when the inputs used to price the financial instrument lack observable market data and as a result, no longer meet the Level 1 or 2 criteria at the reporting date. Transfers out of Level 3 occur when the pricing inputs become more transparent and satisfy the Level 1 or 2 criteria at the reporting date.
Transfers into and out of Level 3 for financial assets were $343 million and $2,579 million for the year ended December 31, 2025, respectively, (December 31, 2024 - $624 million and $1,058 million, respectively). The total amount of the net realized/unrealized gains (losses) related to financial instruments transferred out of Level 3 during the period, which were excluded from the Level 3 reconciliation, was a gain of $7 million as at December 31, 2025 (December 31, 2024 - gain of $2 million).
Additional information on the fair value measurement of investments can be found in Note 5 of our 2025 Annual Consolidated Financial Statements.
Goodwill
Goodwill represents the excess of the cost of an acquisition over the fair value of the net identifiable tangible and intangible assets of the acquired businesses. Goodwill is carried at original cost less any impairment subsequently incurred. Goodwill is assessed for impairment annually or more frequently if events or circumstances occur that may result in the recoverable amount of a cash generating unit ("CGU") or a group of CGUs falling below its carrying value. A CGU is the smallest identifiable group of assets that generates cash inflows that are largely independent of cash inflows from other groups of assets. The goodwill balances are allocated to either individual or groups of CGUs that are expected to benefit from the synergies of the business combination. Goodwill impairment is quantified by comparing a CGU's or a group of CGUs' carrying value to its recoverable amount, which is the higher of fair value less costs of disposal and value in use. Impairment losses are recognized immediately and cannot be reversed in future periods.
There were no impairment charges on goodwill recognized in 2025. We had a carrying value of $9,530 million in goodwill as at December 31, 2025. Additional information on goodwill can be found in Note 1 and Note 9 of our 2025 Annual Consolidated Financial Statements.
Intangible Assets
Intangible assets consist of finite life and indefinite life intangible assets. Finite life intangible assets are amortized on a straight-line basis or using a units-of-production method, over the useful economic lives: i) Distribution, sales potential of field force, client relationships and asset administration contracts - 3 to 40 years ii) and internally generated software - 3 to 10 years. Amortization is charged through operating expenses. The useful lives of finite life intangible assets are reviewed annually, and the amortization is adjusted as necessary. Indefinite life intangibles are not amortized, and are assessed for impairment annually or more frequently if events or changes in circumstances indicate that the asset may be impaired. Impairment is assessed by comparing the carrying values of the indefinite life intangible assets to their recoverable amounts. The recoverable amount is the higher of an asset's fair value less costs of disposal and its value in use. If the carrying values of the indefinite life intangibles exceed their recoverable amounts, these assets are considered impaired, and a charge for impairment is recognized in our Consolidated Statements of Operations. The recoverable amount of intangible assets is determined using various valuation models, which require management to make certain judgments and assumptions that could affect the estimates of the recoverable amount. Impairment charges on intangible assets of $88 million were recognized in 2025 (2024 - $201 million) primarily reflecting a customer relationship intangible asset related to the early termination of a U.S. group dental contract. The prior year impact reflects an intangible asset related to bancassurance in Vietnam resulting from changes in regulatory and macro-economic factors.
| | | | | | | | | | | | | | | | | | | | |
106 | December 31, 2025 | Sun Life Financial Inc. | | MANAGEMENT'S DISCUSSION & ANALYSIS | |
As at December 31, 2025, our finite life intangible assets had a net carrying value of $3.9 billion, which reflected the value of the field force, asset administration contracts, and Client relationships acquired as part of the AAM, BGO, Crescent, Clarica, Dialogue, DentaQuest, U.S. employee benefits, and Bowtie business acquisitions, the ACB, Dah Sing and CIMB Niaga bancassurance partnerships, as well as software costs. Our indefinite life intangible assets had a net carrying value of $1.2 billion as at December 31, 2025. The value of the indefinite life intangible assets reflected fund management contracts of MFS, BGO, InfraRed, Crescent and AAM. Additional information on intangible assets can be found in Note 9 of our 2025 Annual Consolidated Financial Statements.
Income Taxes
Income tax assets and liabilities for the current and prior periods are measured at the amount expected to be recovered from or paid to the taxation authorities. Deferred income tax is provided using the liability method. Our provision for income taxes is calculated based on the tax rates and tax laws that have been enacted or substantially enacted by the end of the reporting period.
As a multinational organization, we are subject to taxation in numerous jurisdictions. We seek to operate in a tax efficient manner while ensuring that we are in compliance with all laws and regulations. The determination of the required provision for current and deferred income taxes requires that we interpret tax legislation in the jurisdictions in which we operate and that we make assumptions about the expected timing of realization of deferred income tax assets and liabilities. Tax laws are complex and their interpretation requires significant judgment. The provision for income taxes reflects management's interpretation of the relevant tax laws and its best estimate of the income tax implications of the transactions and events during the period. We believe that our provisions for uncertain tax positions appropriately reflect the risk of tax positions that are under audit, dispute or appeal with tax authorities, or which are otherwise considered to involve uncertainty. The adequacy of our tax provision is reviewed at the end of each reporting period. To the extent that our interpretations differ from those of tax authorities or the timing of realization is not as expected, the provision for income taxes may increase or decrease in future periods to reflect actual experience. The amount of any increase or decrease cannot be reasonably estimated.
Deferred income tax assets are recognized for all deductible temporary differences, carry forward of unused tax losses and unused tax credits to the extent that it is probable that taxable profit will be available against which the temporary differences, unused tax losses and unused tax credits can be utilized. At each reporting period, we assess all available evidence, both positive and negative, to determine the amount of deferred income tax assets to be recorded. If it is probable that the benefit of tax losses and tax deductions will not be realized, a deferred income tax asset is not recognized. The assessment requires significant estimates and judgment about future events based on the information available at the reporting date.
From time to time, local governments, in countries in which we operate, enact changes to statutory corporate income tax rates. These changes require us to review and re-measure our deferred tax assets and liabilities as of the date of enactment. As at December 31, 2025, our net deferred tax asset in the Consolidated Statements of Financial Position was $3,502 million, primarily in Canada. Any future tax rate reductions in jurisdictions where we carry a net deferred tax asset, could result in a reduction in the carrying value of the deferred tax asset and a corresponding income tax expense at the time of substantial enactment of a rate reduction.
The Pillar Two Global Minimum Tax ("GMT") rules applied to us effective January 1, 2024. The Canadian GMT legislation requires the ultimate parent entity of a group to pay top-up tax, on a jurisdiction-by-jurisdiction basis, on profits of its subsidiaries that are taxed below 15%. Some jurisdictions have enacted a Qualifying Domestic Minimum Top-Up Tax ("QDMTT") which requires the GMT top-up tax to be paid in the local jurisdiction rather than to the ultimate parent entity's jurisdiction. In response to the GMT rules, Bermuda has enacted a Corporate Income Tax ("CIT") regime, including a corporate income tax rate of 15%, which applies to us effective January 1, 2025. The Bermuda CIT is not a QDMTT for the purposes of GMT. Top-up tax may still be payable by the ultimate parent entity under the Income Inclusion Rule, depending on the effective tax rate in Bermuda. Our other subsidiaries that are currently subject to a statutory tax rate or to a tax regime that could result in taxing profits at a rate below 15% include those in Hong Kong and Ireland, which have both enacted a QDMTT. The Pillar Two legislation increased the effective tax rate on underlying net income by approximately one to two percentage points in 2025. For additional information, refer to Note 19 of our 2025 Consolidated Financial Statements.
Pension Plans and Other Post-Retirement Benefits
The Company sponsors defined benefit pension plans and defined contribution plans for eligible employees. All of our significant defined benefit plans worldwide are closed to new entrants with new hires participating in defined contribution plans. Our defined benefit pension plans offer benefits based on length of service and final average earnings and certain plans offer some indexation of benefits. We maintain certain supplementary non-contributory defined benefit pension arrangements for eligible employees, which are primarily for benefits which are in excess of local tax limits. In addition to these plans, in some countries the Company sponsors certain post-retirement benefit plans (for medical, dental and/or life insurance benefits) for eligible qualifying employees and their dependents who meet certain requirements.
In Canada, since January 1, 2009, all new employees participate in a defined contribution plan, while existing employees continue to accrue future benefits in the prior plan which provides a defined benefit plan and an optional contributory defined contribution plan.
With the closure of the Canadian defined benefit plans to new entrants, the volatility associated with future service accruals for active members has been limited and will decline over time. As at December 31, 2025, there are no active employees accruing future service benefits in the U.S. defined benefit plans.
The major risks remaining in relation to past service obligations are increases in liabilities due to a decline in discount rates, greater life expectancy than assumed and adverse asset returns. We have significantly de-risked the investments of our material defined benefit pension plans Company-wide by systematically shifting the pension asset mix towards liability matching investments. The target for our significant plans is to minimize volatility in funded status arising from changes in discount rates and exposure to equity markets.
Due to the long-term nature of these defined benefit plans, the calculation of benefit expenses and accrued benefit obligations depends on various assumptions, including discount rates, rates of compensation increases, health care cost trend rates, retirement ages, mortality rates and termination rates. Based upon consultation with external pension actuaries, management determines the assumptions used for these plans on an annual basis. The discount rate used for our significant defined benefit plans is determined with reference to market yields of
| | | | | | | | | | | | | | | | | | | | |
| MANAGEMENT'S DISCUSSION & ANALYSIS | | Sun Life Financial Inc. | December 31, 2025 | 107 |
high-quality corporate bonds that are denominated in the same currency in which the benefits will be paid, and that have terms to maturity approximating the terms of obligations.
Actual experience may differ from that assumed, which would impact the valuation of defined benefit plans and the level of benefit expenses recognized in future years. Details of our pension and post-retirement benefit plans and the key assumptions used for the valuation these plans are included in Note 24 of our 2025 Annual Consolidated Financial Statements.
2. Changes in Accounting Policies
We have included in this section a summary of changes in accounting policies. Where there are references to Notes, these are part of our 2025 Annual Consolidated Financial Statements.
2.A New and Amended International Financial Reporting Standards to be Adopted in 2026 or Later
In April 2024, the IASB issued IFRS 18 Presentation and Disclosure in Financial Statements ("IFRS 18") which replaces IAS 1 Presentation of Financial Statements. IFRS 18 introduces new requirements on presentation within the statement of profit or loss, disclosure of management-defined performance measures, and principles for aggregation and disaggregation of financial information in the financial statements and the notes. IFRS 18 will be effective for annual reporting periods beginning on or after January 1, 2027. IFRS 18 is to be applied retrospectively. We are currently assessing the impact that IFRS 18 will have on our Consolidated Financial Statements.
In May 2024, the IASB issued Amendments to the Classification and Measurement of Financial Instruments (Amendments to IFRS 9 and IFRS 7 Financial Instruments: Disclosures). The amendments clarify the timing for derecognizing financial liabilities and introduce an accounting policy choice to derecognize financial liabilities settled using electronic payment systems before the settlement date if certain conditions are met. We have chosen to apply this early derecognition for electronic payments. The amendments also clarify the assessment of contractual cash flow characteristic of financial assets that include environmental, social and corporate governance linked features and other similar contingent features not directly related to changes in basic lending risks; and introduced additional related disclosure requirements for financial instruments with such contingent features. The amendments will be effective for annual reporting periods beginning on or after January 1, 2026. The amendments are to be applied retrospectively with no restatement of comparative periods required. We do not expect the adoption of these amendments to have a material impact on our Consolidated Financial Statements.
2.B Other Changes in Accounting Policy
We have changed our accounting policy for certain joint ventures to disaggregate insurance finance income or expenses between net income (loss) and OCI. For these joint ventures, insurance finance income or expenses on our insurance contract liabilities were previously recorded through net income (loss), while the corresponding invested assets have historically been recorded at FVOCI. The invested assets and insurance contract liabilities are managed together and presenting insurance finance income or expenses through OCI reduces accounting mismatch. We account for these joint ventures using the equity method of accounting, whereby we recognize our share of net income (loss) in Net investment income (loss) in our Consolidated Statements of Operations and our share of OCI in our Consolidated Statements of Comprehensive Income (Loss). The impact of this change is not material to our share of net income (loss) or OCI in any individual prior period. We have processed an adjustment to increase opening Retained earnings by $213 and decrease Accumulated other comprehensive income by $213 retroactively to January 1, 2024.
3. Disclosure Controls and Procedures
The Company has established disclosure controls and procedures that are designed to provide reasonable assurance that all relevant information is gathered and reported to senior management, including the Company's President and CEO, Executive Vice-President and Chief Financial Officer ("CFO"), and Executive Vice-President, Chief Legal Officer and Public Affairs, on a timely basis so that appropriate decisions can be made regarding public disclosure.
An evaluation of the effectiveness of our disclosure controls and procedures, as defined under rules adopted by the Canadian securities regulatory authorities and the SEC, as at December 31, 2025, was carried out under the supervision of and with the participation of the Company's management, including the CEO and the CFO. Based on our evaluation, the CEO and the CFO concluded that the design and operation of these disclosure controls and procedures were effective as at December 31, 2025.
Management's Report on Internal Control over Financial Reporting
Management is responsible for establishing and maintaining adequate internal control over financial reporting to provide reasonable assurance regarding the reliability of our financial reporting and the preparation of our financial statements in accordance with IFRS.
Due to its inherent limitations, internal control over financial reporting may not prevent or detect misstatements on a timely basis. Projections of any evaluation of the effectiveness of internal control over financial reporting to future periods are subject to the risk that the controls may become inadequate because of changes in conditions, or that the degree of compliance with the policies or procedures may deteriorate. We conducted an assessment of the effectiveness of our internal control over financial reporting, as of December 31, 2025, based on the framework and criteria established in Internal Control-Integrated Framework (2013), issued by the Committee of Sponsoring Organizations of the Treadway Commission. Based on that assessment, we have concluded that our internal control over financial reporting was effective as of December 31, 2025. Excluded from our evaluation were internal controls over financial reporting at Bowtie, for which control was acquired on July 15, 2025. Bowtie constitutes less than 1% of our Annual Consolidated Financial Statements across all major financial metrics, including total assets, total equity, insurance revenue and total net income, as of and for the year ended December 31, 2025.
Our internal control over financial reporting, as of December 31, 2025, has been audited by the Company's external auditor, Deloitte LLP, Independent Registered Public Accounting Firm, who also audited our Annual Consolidated Financial Statements for the year ended
| | | | | | | | | | | | | | | | | | | | |
108 | December 31, 2025 | Sun Life Financial Inc. | | MANAGEMENT'S DISCUSSION & ANALYSIS | |
December 31, 2025. As stated in the Report of Independent Registered Public Accounting Firm, they have expressed an unqualified opinion on our internal control over financial reporting as of December 31, 2025.
Changes in Internal Control over Financial Reporting
No changes were made in our internal control over financial reporting for the period which began on January 1, 2025 and ended December 31, 2025 that have materially affected or are reasonably likely to materially affect our internal control over financial reporting.
| | | | | |
| O. Legal and Regulatory Proceedings | |
Information concerning legal and regulatory matters is provided in our Annual Consolidated Financial Statements and the AIF, in each case for the year ended December 31, 2025.
| | | | | |
| P. Forward-looking Statements | |
From time to time, the Company makes written or oral forward-looking statements within the meaning of certain securities laws, including the “safe harbour” provisions of the United States Private Securities Litigation Reform Act of 1995 and applicable Canadian securities legislation. Forward-looking statements contained in this document include statements (i) relating to our strategies, plans, targets, goals and priorities; (ii) relating to our growth initiatives and other business objectives; (iii) relating to the expected closing in late 2026 of the increase to our existing ownership interest in our Malaysia joint ventures; (iv) relating to expected annual savings resulting from the actions taken to improve financial discipline and productivity reflected in the restructuring charge recorded in Q2'24; (v) relating to the expected impact of certain proposed tax changes in the 2025 Canadian Federal Budget on our consolidated financial statements; (vi) relating to the expected impact of certain tax provisions in the 2025 Budget Reconciliation Act on our consolidated financial statements; (vii) relating to the expected use of net proceeds from the September 2025 Debenture Offering and the December 2025 Debenture Offering; (viii) relating to the expected impact of the new structure of our asset management pillar; (ix) relating to the expected impact of the Amendments to IFRS 9 and IFRS 7 on our consolidated financial statements; (x) set out in this document under the heading K - Risk Management - Market Risk Sensitivities - Interest Rate Sensitivities; (xi) relating to expected changes in our LICAT ratio; (xii) that are predictive in nature or that depend upon or refer to future events or conditions; and (xiii) that include words such as “achieve”, “aim”, “ambition”, “anticipate”, “aspiration”, “assumption”, “believe”, “could”, “estimate”, “expect”, “goal”, “initiatives”, “intend”, “may”, “objective”, “outlook”, “plan”, “project”, “seek”, “should”, “strategy”, “strive”, “target”, “will”, and similar expressions. Forward-looking statements include the information concerning our possible or assumed future results of operations. These statements represent our current expectations, estimates, and projections regarding future events and are not historical facts, and remain subject to change.
Forward-looking statements are not a guarantee of future performance and involve risks and uncertainties that are difficult to predict. Future results and shareholder value may differ materially from those expressed in these forward-looking statements due to, among other factors, the matters set out in this document under the headings D - Profitability - 5 - Income taxes, G - Financial Strength and K - Risk Management and in SLF Inc.’s 2025 AIF under the heading Risk Factors, and the factors detailed in SLF Inc.’s other filings with Canadian and U.S. securities regulators, which are available for review at www.sedarplus.ca and www.sec.gov, respectively.
Medium-Term Financial Objectives
The Company's medium-term financial objectives set out in section B - Overview - 2 - Financial Objectives are forward-looking non-IFRS financial measures and do not constitute guidance. Although considered reasonable by the Company, actual results could differ materially depending on our success in achieving growth initiatives and business objectives and based on certain key assumptions, which may prove to be inaccurate, including: (i) no significant changes in the level of interest rates; (ii) average total return on real estate and equity investments of approximately 8% per annum; (iii) credit experience in line with expectations; (iv) no significant changes in the level of our regulatory capital requirements; (v) no significant changes to our effective tax rate; (vi) no significant increase in the number of shares outstanding; (vii) no material changes to our hedging program; (viii) hedging costs that are consistent with our expectations; (ix) no material assumption changes; and (x) no material accounting standard changes. In addition, our medium-term financial objectives do not reflect the indirect effects of interest rate and equity market movements including the potential impacts on goodwill or the current valuation allowance on deferred tax assets as well as other items that may be non-operational in nature.
Our underlying ROE is dependent upon capital levels and options for deployment of excess capital. Our target dividend payout ratio of 40%-50% of our underlying net income assumes that economic conditions and our results will enable us to maintain our payout ratio in the target range, while maintaining a strong capital position. The declaration, amount and payment of dividends is subject to the approval of SLF Inc.'s Board of Directors and our compliance with the capital requirements in the Insurance Companies Act (Canada). Additional information on dividends is provided in the section J - Capital and Liquidity Management - 3 - Shareholder Dividends in this MD&A.
Risk Factors
Important risk factors that could cause our assumptions and estimates, and expectations and projections to be inaccurate and our actual results or events to differ materially from those expressed in or implied by the forward-looking statements contained in this document, are set out below. The realization of our forward-looking statements essentially depends on our business performance which, in turn, is subject to many risks. Factors that could cause actual results to differ materially from expectations include, but are not limited to: market risks - related to the performance of equity markets; changes or volatility in interest rates or credit spreads or swap spreads; real estate investments; fluctuations in foreign currency exchange rates; and inflation; insurance risks - related to mortality experience, morbidity experience and longevity; policyholder behaviour; product design and pricing; the impact of higher-than-expected future expenses; and the availability, cost and effectiveness of reinsurance; credit risks - related to issuers of securities held in our investment portfolio, debtors, structured securities, reinsurers, counterparties, other financial institutions and other entities; business and strategic risks - related to global economic and geopolitical conditions; the design and implementation of business strategies; changes in distribution channels or Client behaviour including risks relating to market conduct by intermediaries and agents; the impact of competition; the performance of our investments and investment portfolios managed for Clients such as segregated and mutual funds; shifts in investing trends and Client preference towards products that differ from our investment products and strategies; changes in the legal or regulatory environment, including capital
| | | | | | | | | | | | | | | | | | | | |
| MANAGEMENT'S DISCUSSION & ANALYSIS | | Sun Life Financial Inc. | December 31, 2025 | 109 |
requirements and tax laws; environmental and social issues and their related laws and regulations; operational risks - related to breaches or failure of information system security and privacy, including cyber-attacks; our ability to attract and retain employees; legal, regulatory compliance and market conduct, including the impact of regulatory inquiries and investigations; the execution and integration of mergers, acquisitions, strategic investments and divestitures; our information technology infrastructure; a failure of information systems and Internet-enabled technology; dependence on third-party relationships, including outsourcing arrangements; business continuity; model errors; information management; liquidity risks - the possibility that we will not be able to fund all cash outflow commitments as they fall due; and other risks - changes to accounting standards in the jurisdictions in which we operate; risks associated with our international operations, including our joint ventures; market conditions that affect our capital position or ability to raise capital; downgrades in financial strength or credit ratings; and tax matters, including estimates and judgements used in calculating taxes.
The Company does not undertake any obligation to update or revise its forward-looking statements to reflect events or circumstances after the date of this document or to reflect the occurrence of unanticipated events, except as required by law.
| | | | | | | | | | | | | | | | | | | | |
110 | December 31, 2025 | Sun Life Financial Inc. | | MANAGEMENT'S DISCUSSION & ANALYSIS | |